PRB 2017-2018 Biennial Report
414
Texas Pension Review Board 2017 – 2018 Biennial Report
-
Upload
khangminh22 -
Category
Documents
-
view
0 -
download
0
Transcript of PRB 2017-2018 Biennial Report

Texas Pension Review Board 2017 – 2018 Biennial Report

Texas Pension Review Board
2017-2018
Biennial Report
Josh B. McGee, Chair Term Expiration: January 31, 2021 Hometown: Houston
Keith Brainard, Vice Chair Term Expiration: January 31, 2019 Hometown: Georgetown
Andrew W. Cable Term Expiration: January 31, 2019 Hometown: Wimberley
Marcia Dush Term Expiration: January 31, 2019 Hometown: Austin
Stephanie Leibe Term Expiration: January 31, 2021 Hometown: Austin
Rossy Fariña Strauss Term Expiration: January 31, 2023 Hometown: Austin
Ernest Richards Term Expiration: January 31, 2021 Hometown: Irving
Anumeha Kumar Executive Director


Texas Pension Review Board
2017-2018 Biennial Report
TABLE OF CONTENTS
EXECUTIVE SUMMARY ............................................................................................................................. 1
PENSION REVIEW BOARD OVERVIEW ........................................................................................................ 3
MISSION STATEMENT ........................................................................................................................... 3
STATUTORY FUNCTIONS ....................................................................................................................... 3
BOARD COMPOSITION .......................................................................................................................... 3
ORGANIZATIONAL STRUCTURE ............................................................................................................. 3
MAJOR ACCOMPLISHMENTS & ACTIVITIES ................................................................................................ 5
PUBLIC RETIREMENT SYSTEM REVIEWS AND ANALYSIS .......................................................................... 5
BOARD POLICY UPDATES ...................................................................................................................... 7
REPORTING REQUIREMENTS ................................................................................................................. 8
DATA/REPORTING .............................................................................................................................. 10
PRB MINIMUM EDUCATIONAL TRAINING (MET) PROGRAM .................................................................. 11
TECHNICAL ASSISTANCE ...................................................................................................................... 12
SPECIFIC ASSISTANCE FOR TLFFRA SYSTEMS ......................................................................................... 14
85TH LEGISLATURE .............................................................................................................................. 14
APPENDICES ........................................................................................................................................... 16
APPENDIX A1 – INTENSIVE ACTUARIAL REVIEW – GALVESTON EMPLOYEES RETIREMENT PLAN FOR POLICE ....................... I
APPENDIX A2 – INTENSIVE ACTUARIAL REVIEW – GREENVILLE FIREMEN'S RELIEF AND RETIREMENT FUND ....................... II
APPENDIX A3 – INTENSIVE ACTUARIAL REVIEW – BEAUMONT FIREMEN'S RELIEF AND RETIREMENT FUND ...................... III
APPENDIX A4 – INTENSIVE ACTUARIAL REVIEW – MARSHALL FIREMEN'S RELIEF AND RETIREMENT FUND ....................... IV
APPENDIX A5 - INTENSIVE ACTUARIAL REVIEW – LONGVIEW FIREMEN'S RELIEF AND RETIREMENT FUND ......................... V
APPENDIX A6 - INTENSIVE ACTUARIAL REVIEW – ORANGE FIREMEN'S RELIEF AND RETIREMENT FUND .......................... VI
APPENDIX A7 - INTENSIVE ACTUARIAL REVIEW – IRVING FIREMEN'S RELIEF AND RETIREMENT FUND ............................ VII
APPENDIX A8 – PROGRESS UPDATES PROVIDED BY SYSTEMS SINCE INTENSIVE REVIEW PUBLICATION ......................... VIII
APPENDIX B – INTERIM STUDY - ASSET POOLING FOR SMALL PENSION SYSTEMS ...................................................... IX
APPENDIX C1 – PRB PENSION FUNDING GUIDELINES ........................................................................................ X
APPENDIX C2 – PRB PRINCIPLES FOR RETIREMENT PLAN DESIGN ........................................................................ XI
APPENDIX D1 – FSRP STATUS REPORT ........................................................................................................ XII
APPENDIX D2 – SUMMARY OF FUNDING SOUNDNESS RESTORATION PLANS SUBMITTED DURING 2017-2018 BIENNIUM XIII
APPENDIX D3 – FSRP FLOW CHART ........................................................................................................... XIV
APPENDIX E1 – MET ACCREDITED SPONSOR LIST ........................................................................................... XV
APPENDIX E2 – PUBLIC RETIREMENT SYSTEM COMPLIANCE WITH MINIMUM EDUCATIONAL TRAINING REQUIREMENTS ... XVI
APPENDIX F – 85TH REGULAR LEGISLATIVE SESSION REPORT ............................................................................ XVII
APPENDIX G1 – APRIL 4, 2018 PRESENTATION TO THE SENATE COMMITTEE ON STATE AFFAIRS .............................. XVIII
APPENDIX G2 – MAY 10, 2018 PRESENTATION TO THE HOUSE PENSIONS COMMITTEE ........................................... XIX
APPENDIX G3 – OCTOBER 12, 2018 PRESENTATION TO THE HOUSE PENSIONS COMMITTEE ...................................... XX
Texas Pension Review Board
2017-2018 Biennial Report
1
EXECUTIVE SUMMARY
The Texas Pension Review Board (the “Board” or the “PRB”) was established in 1979 as an oversight
agency for Texas public retirement systems. Pursuant to Texas Government Code, Section 801.203, the
PRB is pleased to summarize its work and findings for 2017-2018 in the following Biennial Report.
The mission of the PRB is to provide the State of Texas with the necessary information and
recommendations to help ensure that Texas public retirement systems are properly managed and
actuarially sound. The PRB provides consistent, long-term oversight to help ensure that retirement
systems remain adequately funded into the future.
In February 2018, S&P Global cited PRB oversight as an opportunity for the State in facing pension-
related risks. S&P noted that they “view the transparency provided by the PRB as elevating emerging
national themes and standard practices to elected officials, plans, and the public, which is positive for
plan disclosure and management. Furthermore, the annual filing requirements raise awareness and
could allow the PRB to recommend stopgap measures before a plan deteriorates to levels seen in New
Jersey or Illinois.”1
While the majority of Texas’ public retirement systems remain well-funded, significant fiscal challenges
face some Texas pension plans. In 2018, the PRB completed seven intensive actuarial reviews of systems
showing serious funding challenges. The reviews highlighted risks that could threaten long-term funding
stability and provided recommendations to put the systems on a path to solid financial footing. Those
systems were invited, along with their associated governmental entities, to PRB meetings to discuss the
issues raised in the intensive reviews. The PRB continues to provide technical assistance to those
systems and other systems upon request.
Additionally, the first funding soundness restoration plans (FSRPs), which are required of retirement
systems and their sponsors after several valuations showing amortization periods over 40 years, were
due on November 1, 2016. Since then, the PRB has developed an internal process for FSRP review. At
each PRB meeting, staff provides updates to the Board on newly added plans since the prior meeting
and provides a summary of the FSRPs received from plans. The PRB has received and reviewed FSRPs
from 15 systems since the requirement went into effect.
Over the past two years, the PRB has completed the update of the newly-named PRB Pension Funding
Guidelines (formerly Guidelines for Actuarial Soundness) and has developed and adopted the PRB
Principles of Retirement Plan Design. The updated Pension Funding Guidelines lowered the
recommended amortization period to no more than 30 years, with a preferred target range of 10-25
years, among other changes.
1 "Everything's Bigger in Texas, Including Potential Pressure to Fund Pension Benefits," S&P Global Market
Intelligence, February 8, 2018.

Texas Pension Review Board
2017-2018 Biennial Report
2
The PRB conducted research on two topics during the Interim: asset pooling for small pension systems
and funding policies for fixed-rate pension plans. To study the possible benefits of asset pooling, the PRB
analyzed investment return data from Texas public retirement systems and researched national and
international models of systems or organizations that pool assets for investment purposes. As a result of
this initial study, the PRB found potential benefits from pooling assets for investment purposes and
recommended further analysis on how asset pooling could be implemented among Texas systems. For
the funding policy study, the PRB compared Texas public retirement system funding levels and
contribution structures and performed extensive research on funding policies in Texas and nationwide.
The final study will be presented to the Board for adoption in January.
The 85th Legislature appropriated funds for the PRB to develop an online dashboard to provide
lawmakers, taxpayers, pension systems and other stakeholders with an interactive, user-friendly
database of public pension information. Since September of 2017, the agency has worked to develop
the dashboard which includes key actuarial and financial indicators of retirement system health over
time, as well as demographic, benefit and governance information.
The PRB provides education to trustees and system administrators of Texas public retirement systems
and tracks compliance through the Minimum Educational Training (MET) Program. The PRB staff
obtained copyright protection on its seven online courses in 2018, which system trustees and
administrators continue to utilize in great numbers. Since the online courses were published in late
2016, there have been 1,587 course completions. The agency also presented at educational conferences
to discuss the current pension underfunding challenges facing many Texas public retirement systems
and the Board’s oversight role and current activities.
Additionally, the agency’s TLFFRA specialist has been working closely with TLFFRA systems to provide
technical assistance and training. The PRB published its biennial Texas Local Firefighters Retirement Act
(TLFFRA) Pension Report in February of 2018, which utilized data that TLFFRA systems are required to
send to the PRB to provide general and comparative information on all paid/part-paid TLFFRA systems.
During the 85th Legislative Session, the agency conducted a pensions training session for legislative
staff, published the Guide to Public Retirement Systems in Texas as a resource for policymakers, tracked
and provided actuarial impact statements for bills pertaining to Texas public retirement systems, and
testified at House Pensions and Senate State Affairs Committee hearings. During the Interim, the Board
submitted reports to the House Pensions Committee on several occasions, including traveling to Dallas
and Houston to provide information on their municipal systems since the passage of major reform bills.
The PRB also provided testimony during the Interim to the Senate State Affairs Committee regarding
actuarial assumptions.
To date, 7 pension-related bills have been filed since pre-filing began on November 12, 2018. As part of
its mandate, the PRB will continue to work with the Legislature to provide thorough and accurate
actuarial analysis of bills.

Texas Pension Review Board
2017-2018 Biennial Report
3
PENSION REVIEW BOARD OVERVIEW
MISSION STATEMENT
The Pension Review Board (PRB) is mandated to oversee all Texas public retirement systems, both state
and local, in regard to their actuarial soundness and compliance with state law. The mission of the PRB is
to provide the State of Texas with the necessary information and recommendations to help ensure that
its public retirement systems, whose combined assets total in the multi-billions, are actuarially sound;
benefits are equitable; the systems are properly managed; tax expenditures for employee benefits are
kept to a minimum while still providing for those employees; and to expand the knowledge and
education of administrators, trustees, and members of Texas public retirement systems.
STATUTORY FUNCTIONS
The PRB was established in 1979 as an oversight agency for Texas public retirement systems. The
general duties of the PRB outlined in Chapter 801 of the Government Code are to (1) conduct a
continuing review of all public retirement systems, including compiling and comparing information
about benefits, creditable service, financing and administration of systems; (2) conduct intensive studies
of potential or existing problems that threaten the actuarial soundness of public retirement systems; (3)
administer the Minimum Educational Training Program (MET) for public pension trustees and
administrators, providing qualified training content on fundamental public pension topics; (4) provide
information and technical assistance on pension planning to public retirement systems on request; (5)
recommend policies, practices, and legislation to public retirement systems and appropriate
governmental entities; and (6) prepare actuarial impact studies on proposed legislation. The Board can
furnish other appropriate services such as actuarial studies or other requirements of systems and can
establish appropriate fees for these activities and services.
BOARD COMPOSITION
The Board is composed of seven members appointed by the Governor with the advice and consent of
the Senate. The PRB is composed of members with the following qualifications or experience: three
persons who have experience in the fields of securities investment, pension administration, or pension
law and are not members or retirees of a public retirement system; one active public retirement system
member; one retired public retirement system member; one person who has experience in the field of
governmental finance; and one actuary.
Since the publication of the 2015-2016 Biennial Report, the following changes have occurred in the
Board’s composition. On May 8, 2018, Governor Greg Abbott appointed Ms. Marcia Dush, replacing Mr.
Robert May as Board Actuary. Also, on July 9, 2018, Governor Abbott appointed Ms. Rossy Fariña
Strauss to replace J. Robert Massengale whose term expired.
ORGANIZATIONAL STRUCTURE
Currently, the PRB has 10 employees including the executive director and two vacant positions. The
agency is authorized for 14 total full time equivalents (FTEs), but due to budgetary limitations operates

Texas Pension Review Board
2017-2018 Biennial Report
4
at 12. Through its small staff size and limited resources, the PRB provides highly technical analysis of
public pensions that corresponds to demographic shifts and changes in the complexity of pension fund
investments. As issues related to public pensions grow more complex, the PRB staff strives to provide
even higher quality service to the public, the Legislature, the Governor, public retirement systems, and
their administrators, trustees, and members.
The executive director, selected by the Board, manages the day-to-day operations of the agency and
provides oversight for all programs and activities. The agency is organized based on two main work
areas: operational and analytical.
Operational
Administrative and Accounting Division
The administrative and accounting division handles all matters related to accounting and human
resources including management of appropriated funds, purchasing and property control, personnel
files, and coordinating board member travel. The division is also responsible for document management,
records retention, stakeholder outreach, organizing board and committee meetings, and providing all
necessary administrative support for the agency.
Analytical
Actuarial Services Division
The actuarial division provides actuarial expertise to the agency, public retirement systems, the
Legislature, and the public. The division is responsible for evaluating compliance with the PRB’s
Guidelines for Actuarial Soundness and providing in-depth review of system actuarial reports including
valuations, overseeing the intensive actuarial review of public retirement systems, and providing
actuarial reviews during legislative sessions.
Research and Analysis Division
This division is responsible for reviewing public retirement system’s financial condition, conducting
research on pension-related topics, and developing agency policies. Responsibilities include examining
retirement system reports, performing financial analysis, and providing technical assistance to
retirement systems. The division is also responsible for ensuring retirement systems’ compliance with
state reporting requirements, tracking federal and state laws impacting Texas public retirement systems,
and developing agency reports to the Legislature and other state agencies.
Training and Accreditation Division
This division is responsible for the agency’s educational programs, including administering the agency’s
Minimum Educational Training (MET) Program for trustees and system administrators. The division
develops the PRB’s own training, including online offerings, accredits other training provides, and tracks
reporting compliance with the MET requirements.

Texas Pension Review Board
2017-2018 Biennial Report
5
MAJOR ACCOMPLISHMENTS & ACTIVITIES
PUBLIC RETIREMENT SYSTEM REVIEWS AND ANALYSIS
Public Retirement System Intensive Reviews
Following its mandate to conduct intensive studies of potential or existing problems that threaten the
actuarial soundness of public retirement systems, the PRB conducted seven intensive actuarial reviews
during the 2017-2018 Biennium. The intensive reviews analyzed particular risks facing the following
public retirement systems.
January 2018 April 2018 October 2018
Galveston Employees’ Retirement Plan for Police
(see Appendix A1)
Greenville Firemen’s Relief and Retirement Fund (see Appendix A2)
Beaumont Firemen’s Relief and Retirement Fund (see Appendix A3)
Marshall Firemen’s Relief and Retirement Fund (see Appendix A4)
Longview Firemen’s Relief and Retirement Fund (see Appendix A5)
Orange Firemen’s Relief and Retirement Fund (see Appendix A6)
Irving Firemen’s Relief and Retirement Fund (see Appendix A7)
The process for performing the reviews began with the Board publishing criteria for selecting systems
for review. Staff then conducted in-depth analysis of the actuarial condition of the systems, including
projections of future funded status under various investment return scenarios. Among other risks, the
reviews highlighted specific risks such as asset-liability mismatch concerns related to two systems’
deferred or post-retirement option programs (DROP/PROP) and investment expenses that greatly
exceeded peer systems. The process provided multiple opportunities for input from both the system
and sponsor, including inviting initial input into the review, written responses from the system and
sponsoring city for inclusion in the final published report as well as inviting both parties to attend the
PRB’s Actuarial Committee meeting to discuss the review’s findings and answer questions. Appendix A8
provides a summary of the various systems' progress after the review publication.
Key recommendations made through the intensive reviews included the following:
Adopt a funding policy that requires payment of an actuarially determined contribution, or at minimum,
that fully funds the plan over a finite period of 30 years or less
Adopt a formal risk/cost-sharing framework with “guardrails” or trigger mechanisms that reduce
uncertainty and guide stakeholders in how benefit and contribution levels will be modified under different
economic conditions

Texas Pension Review Board
2017-2018 Biennial Report
6
Closely monitor investment performance including expenses and evaluate asset allocation decisions
Conduct an in-depth asset-liability study of potential risks associated with existing asset mix and liabilities
they support. Perform scenario testing of large DROP/PROP withdrawals coupled with potential adverse
investment experience
Regularly review actuarial assumptions against experience, making necessary changes
Interim Studies
Government Code Section 801.203 requires the PRB to submit a biennial report to the Legislature and
Governor of the agency’s work and findings of the Board, “including drafts or recommendations of any
legislation relating to public retirement systems that the board finds advisable.” At its November 16,
2017 meeting, the Board directed staff to perform the following two interim studies for the 2017-2018
biennium.
Asset Pooling for Small Pension Systems
Many public retirement systems across the country face ongoing challenges as unfunded liabilities
continue to grow in an overall low interest rate environment. Smaller systems face additional challenges
to meet or exceed their assumed rates of return over extended periods of time. Recognizing this, the
Board directed staff to study the possible benefits for smaller pension systems of pooling trust funds for
investment purposes as an interim study topic.
To study the possible benefits of pooling assets, the PRB analyzed investment return and fee data
reported by retirement plans for fiscal years 2007 to 2016. The data analyzed included all Texas
actuarially funded defined benefit plans that reported to the PRB during that period, except for the 4
largest statewide plans. Staff also identified two primary structures of pooled pension trusts: an
Investment Management only model (IM) and an Investment Management and Administration (IMA)
model. Under both models, the participating systems transfer all or a portion of their assets into the
group investment trust, while maintaining the existing governance structures, including contribution,
benefit, actuarial and asset allocation decision-making.
To objectively analyze the benefits of the IM and IMA structures, the PRB modeled the potential impact
on small plans. Modeling suggested asset pooling could have resulted in an additional 29% increase
($32M) in total assets for small plans between 2007 and 2016.
The study constituted a first step towards developing potential recommendations in this area. The
evidence suggested smaller pension plans in Texas could benefit in several ways from pooling assets for
investment purposes as well as pooling administrative functions. Further in-depth study of possible
governance structures to provide asset pooling services including associated legal requirements is
necessary and should include engaging small pension plans to provide input and explore viable options.
Funding Policies for Fixed-Rate Pension Plans
Since the 2008 market downturn, the unfunded liabilities of many public retirement systems both across
the country and in Texas have been on the rise. In 2012, the Governmental Accounting Standards Board

Texas Pension Review Board
2017-2018 Biennial Report
7
(GASB) issued statements 67 and 68, which required plan sponsors to report pension liabilities on their
balance sheets. This change in conjunction with the rising unfunded liabilities has brought increased
scrutiny from credit rating agencies, with pension debt and related costs now impacting bond ratings
more directly.
Today, more volatile markets, dampened future market projections, and lower mortality rates are
placing continuing pressure on retirement systems’ ability to meet their actuarial assumptions. Given
these pressures, strong funding policies are a necessity for public pensions to help ensure that over time
unfunded liabilities do not continue to grow but rather are reduced or eliminated. In addition, solid
funding policies can help assure rating agencies that pension liabilities are being proactively managed.
Recognizing the many challenges facing Texas plans and in accordance with the PRB’s Pension Funding
Guidelines, Texas Pension Review Board (PRB) at its November 16, 2017 meeting directed staff to
research and identify the role that funding policies could play in helping plans meet their funding
objectives while reassuring credit agencies. In particular, the Board tasked staff with focusing on how
systems with fixed-rate contribution structures- which, unlike actuarially determined contributions, do
not inherently adjust to address negative experience and make up nearly 75% of Texas systems- could
benefit from adopting funding policies. The PRB conducted this interim study as part of the agency’s
mandate to include recommendations of any legislation relating to public retirement systems that the
Board finds advisable through its Biennial Report to the Legislature and Governor.
Staff began by analyzing the contribution structures of Texas plans and comparing their average funded
ratios over time. The average funded ratio of systems with actuarially determined contributions (ADCs)
was higher overall than that of fixed-rate systems, and has reversed its decline after the 2008 financial
crisis, while fixed-rate systems’ average funded ratio has continued a downward trajectory. Staff then
reviewed funding policies from Texas systems as well as systems in other states and evaluated the
benefits of adopting those policies. Finally, staff worked to identify essential components that a sound
funding policy should include as well as various approaches that could be provided as examples for
Texas systems. The final study will be presented to the Board for adoption in January.
BOARD POLICY UPDATES
PRB Pension Funding Guidelines
The PRB Guidelines for Actuarial Soundness (Guidelines) were first adopted by the Board in 1984. The
stated purpose of establishing guidelines was three-fold: to lend consistency to positions advocated in
impact statements, to aid in providing technical assistance to registered plans, and to promote public
disclosure. The PRB revisited the Guidelines in 1996, but took no action until the adoption of the
updated Guidelines in 2011.
At its May 5, 2016, meeting, the Board directed staff and the PRB Actuarial Committee to begin the
process of reviewing and updating the Guidelines. The PRB Actuarial Committee held meetings from
June 2016 through January 2017. Steps taken to update the Guidelines include producing a survey to

Texas Pension Review Board
2017-2018 Biennial Report
8
receive constituents' feelings on various aspects of the Guidelines, discussing survey responses as well as
providing a comment period once the draft was completed.
The PRB solicited public comment on the draft Guidelines on November 22, 2016. The deadline for
commenting was December 7, 2016. The PRB received 16 responses from funds, their actuaries, and
other interested parties. The PRB Actuarial Committee discussed the comments and recommended a
draft to the full Board at the January 26, 2017 PRB meeting. The draft was adopted at the January
meeting, to include a preamble stating the purpose and changing the title of the policy document to PRB
Pension Funding Guidelines, effective June 30, 2017. Based on public comment, a phase-in period of
eight years for reducing amortization periods to 30 years or fewer was added to the document. (See
Appendix C1)
PRB Principles of Retirement Plan Design
At its August 11, 2017 meeting, the PRB established the PRB Advisory Committee on Principles of
Retirement Plan Design to develop a document to guide and inform public retirement systems and their
associated governmental entities on how to structure retirement plans. The Advisory Committee held
three meetings – October 13, 2017, March 1, 2018, and April 24, 2018 – where they discussed a draft
principles document and took public comments and questions on each principle.
On April 2, 2018, the PRB solicited comments on the draft Principles of Retirement Plan Design from
plans, their actuaries, and the public. The agency received 13 comments, which were discussed at the
April 24, 2018 Advisory Committee meeting. The Committee incorporated changes into the document,
agreed on a draft for recommendation to the full Board, and staff posted the committee draft on the
agency’s website. The Board adopted the Principles of Retirement Plan Design at its June 14, 2018
meeting. (See Appendix C2)
REPORTING REQUIREMENTS
Funding Soundness Restoration Plan
To date, 15 systems have submitted funding soundness restoration plans (FSRPs). Of those, two systems
have successfully brought their amortization period below 40 years, ten systems are working towards 40
years, and three systems are developing a revised plan since the initial FSRP was not met. Five systems
are currently required to submit FSRPs, one of which, the Fort Worth Employees Retirement Fund, has
been subject to the FSRP requirement since January 2017 but has not yet submitted an FSRP. The
remaining four are revised FSRPs, which means that in total, nearly half of the 15 systems that have
submitted FSRPs did not make changes sufficient to keep them on track to have below-40 amortization
periods within a decade. Six additional systems will be subject to the FSRP requirement if the next
actuarial valuation shows an amortization period over 40 years. A list of systems' FSRP status can be
found in Appendix D1, and Appendix D2 contains a summary of the FSRPs received in the current
biennium.
Texas Pension Review Board
2017-2018 Biennial Report
9
The FSRP is outlined in Chapters 802.2015 and 802.2016 of the Texas Government Code. The statutes
state that a public retirement system is required to notify its associated governmental entity if it
receives an actuarial valuation indicating the system's actual contributions are insufficient to achieve an
amortization period of 40 years or less. Should the system's amortization period exceed 40 years over
several valuations, the public retirement system and its associated governmental entity are required to
formulate an FSRP. The FSRP must be designed to achieve an amortization period of 40 years or less
within 10 years. The FSRP requirement varies for certain systems, including exemption from the
requirement. A flowchart outlining the requirements may be found in Appendix D3.
Texas public retirement systems that are subject to the FSRP requirement have six months after the
date on which the actuarial valuation that triggers the FSRP formulation requirement is adopted by the
retirement system. The systems and their associated governmental entity must submit the FSRP and any
changes to the plan to the PRB within 31 days after the FSRP is agreed to. Additionally, the PRB must be
notified every two years of any updates to the progress made towards improved actuarial soundness.
Texas Government Code Section 802.2015(d) requires plans to formulate a revised FSRP if the system
conducts an actuarial valuation showing that the system's amortization period exceeds 40 years, and the
previously formulated FSRP has not been adhered to. This means nearly half of the 15 systems that have
submitted FSRPs did not make changes sufficient to keep them on track to have below-40 amortization
periods within a decade.
Reporting Requirements Added During the 85th Legislature
Houston Systems - Risk Sharing Valuation Study
Senate Bill 2190 reformed the three Houston pension systems: Houston Firefighters Relief & Retirement
Fund, Houston Police Officers Pension System, and Houston Municipal Employees Pension System. The
bill added a requirement of the systems to jointly submit a risk sharing valuation study (RSVS) to the PRB
for a determination that the pension systems and City are in compliance with the statute. The PRB has
reviewed two RSVSs for the three plans since 2017, and the systems were found to be compliant with
statute.
Dallas Police and Fire Pension System
Another major pension bill, House Bill 3158, overhauled the Dallas Police and Fire Pension System
(DPFPS). Through that legislation, the PRB was given the following new responsibilities:
Prohibitions on DROP distribution – the DPFPS board was required to send information to the
PRB to determine whether DPFPS had violated the prohibition of certain distributions by August
31, 2017. The PRB staff reviewed the information and found there were no violations and sent
correspondence to the City and System regarding the determination.
DPFPS actuarial audit – the PRB has begun to research criteria for selecting an independent
actuary to perform an analysis based on the January 1, 2024 actuarial valuation prepared by the
pension system.

Texas Pension Review Board
2017-2018 Biennial Report
10
DPFPS funding plan – the system is required to adopt a funding plan in compliance with the
funding and amortization period applicable requirement, as well as takes into consideration the
independent actuary's recommendations. DPFPS is required to submit the actuarial audit and a
summary of any rules adopted regarding the plan to the PRB. Not later than December 1, 2024,
the PRB will submit a summary of these to the Legislature.
DPFPS Alternative Benefit Plan – the plan may only be established by the City if the system's
actuary determines that its implementation would allow the system to continue to comply with
funding and amortization period requirements of Chapter 802 and if the PRB conducts a review
of and validates this determination. The PRB will develop a review and validation process for
determination.
DPFPS rules increasing benefits – any rules to increase benefits must be reviewed by the PRB,
and the PRB must find that the implementation of the rule complies with the amortization
periods prescribed by the statute.
DATA/REPORTING
Online Dashboard
The 85th Legislature appropriated funds for the PRB to develop an online dashboard to provide
lawmakers, taxpayers, pension systems, and other stakeholders with a searchable, user-friendly
database of public pension information. Over the 2017-2018 biennium, the agency has worked to
develop the dashboard which includes key actuarial and financial indicators of retirement system health
over time, as well as demographic, benefit and governance information. The dashboard also offers the
ability to compare those factors across multiple plans of similar size or type. After final testing, the
dashboard will be made public in January 2019. Once the dashboard is live, the agency plans to add
additional features including adding standardized links for raw data download and Minimum
Educational Training compliance data.
In addition, the PRB provides the Comptroller’s Office with the most recent financial and actuarial data
received from Texas public retirement systems for the Public Pension Search Tool portal. The PRB sends
the updated data to the Comptroller’s Office every 4 months and sent the latest update in August 2018.
Agency Website
Since the PRB website redesign in 2016, PRB staff has strived to display to stakeholders in the most
straightforward manner the most recent and relevant information produced by and related to the PRB.
The agency does this by adding new reports, presentations, agendas, meeting packets and recordings to
the “Recently Added” section on the homepage of its website. When meetings are held in the Capitol
Annex, the homepage is updated to include a link to the meeting live stream broadcast.
The PRB places a high priority on enhancing its educational outreach through the use of its website to
offer pension-related resources for PRB constituents, including public pension trustees, administrators,
Texas Pension Review Board
2017-2018 Biennial Report
11
plan members, government officials, and taxpayers. Currently, information on the PRB website includes:
board policies; information on board meetings including archived meeting videos, agendas, minutes and
meeting packets; statutes and rules; Minimum Educational Training Program online courses; various
agency publications and reports including total net assets, non-compliant plans and actuarial valuation
reports (published in an accessible spreadsheet format); PRB research papers; and other resources. The
agency utilizes the website as a tool to educate systems and to foster transparency through the
publication of Board meeting packets, minutes, and recordings.
Guide to Public Retirement Systems in Texas
Every odd-numbered year, usually in January or February, the PRB publishes the Guide to Public
Retirement Systems in Texas. This publication is timed to coincide with the beginning of each legislative
session. Due to expected policy interest concerning public retirement systems, the PRB included
information in the Guide to Public Retirement Systems in Texas to provide lawmakers with as much
relevant and current information on the state’s retirement systems as possible. The Guide was divided
into three major sections. The first section contains summaries of the statewide and municipal
retirement systems governed by state statute. The second section provided trends and key financial,
actuarial, benefit, and governance data for retirement systems. The third section provided a summary of
significant pension-related legislation passed in prior legislative sessions, benefit information for the
pay-as-you-go volunteer firefighter and defined contribution retirement systems, a glossary of pension
terminology, and a directory of all systems registered with the PRB. The February 2017 Guide to Public
Retirement Systems in Texas can be found on the agency’s website. The agency is currently working on
publishing the 2019 Guide for the 86th Legislature.
PRB MINIMUM EDUCATIONAL TRAINING (MET) PROGRAM
Section 801.211 of the Government Code directs the PRB to develop and administer an educational
training program for trustees and administrators of Texas public retirement systems. The PRB began the
Minimum Educational Training (MET) Program on January 1, 2015. Program efforts include completing
the online courses, reviewing sponsor and individual course applications, a survey of sponsor course
evaluations, and MET online courses copyright.
Online Courses
The PRB has researched, written, designed, and published 7 online courses to assist trustees and system
administrators to obtain required training. Each course covers one of the following core content areas:
Fiduciary Matters, Governance, Actuarial Matters, Investments, Risk Management, Ethics and Benefits
Administration. The online courses are available free of charge on the PRB website. As of November 16,
2018 there have been 1,587 course completions. On February 13, 2018 the PRB secured copyright
protection on all seven courses, valid through 2112.
Texas Pension Review Board
2017-2018 Biennial Report
12
Sponsor Accreditation
As of November 16, 2018, the PRB has accredited 17 MET sponsors, as well as 35 individual courses
offered by non-accredited sponsors. Frequent providers of training activities, including public retirement
systems conducting in-house training, may apply to become sponsors accredited by the PRB to conduct
trainings for MET credit hours. Those sponsors who become accredited do not need to obtain approval
for each course offered; sponsors may be accredited to offer Core instruction, Continuing Education, or
both. A retirement system or training organization offering infrequent training activities, and/or which
does not wish to become an accredited sponsor, may apply for approval of individual courses. A list of
accredited sponsors can be found in Appendix E1.
During the March 1, 2018 PRB meeting, the Board requested performance evaluation information from
Minimum Educational Training (MET) accredited sponsors. To provide this information, the PRB staff
requested that sponsors submit course evaluation survey responses from their last two MET training
activities. The PRB received 179 individual course evaluation surveys and 2 sponsors provided already
compiled data. A total of 12 sponsors submitted survey data. The overall satisfaction for all PRB
accredited sponsors was 99%.
MET Compliance and Reporting
The PRB has completed several reporting cycles for MET compliance. At each reporting deadline,
systems report to the PRB the training completed by their trustees and administrator during the
previous time period. The information submitted to the PRB has been compiled to create the Public
Retirement System Compliance with Minimum Educational Training Requirements report. (See Appendix
E2) The report in Appendix E2 contains data from the most recently completed training cycle reported
to the PRB for Texas public retirement system trustees and system administrators.
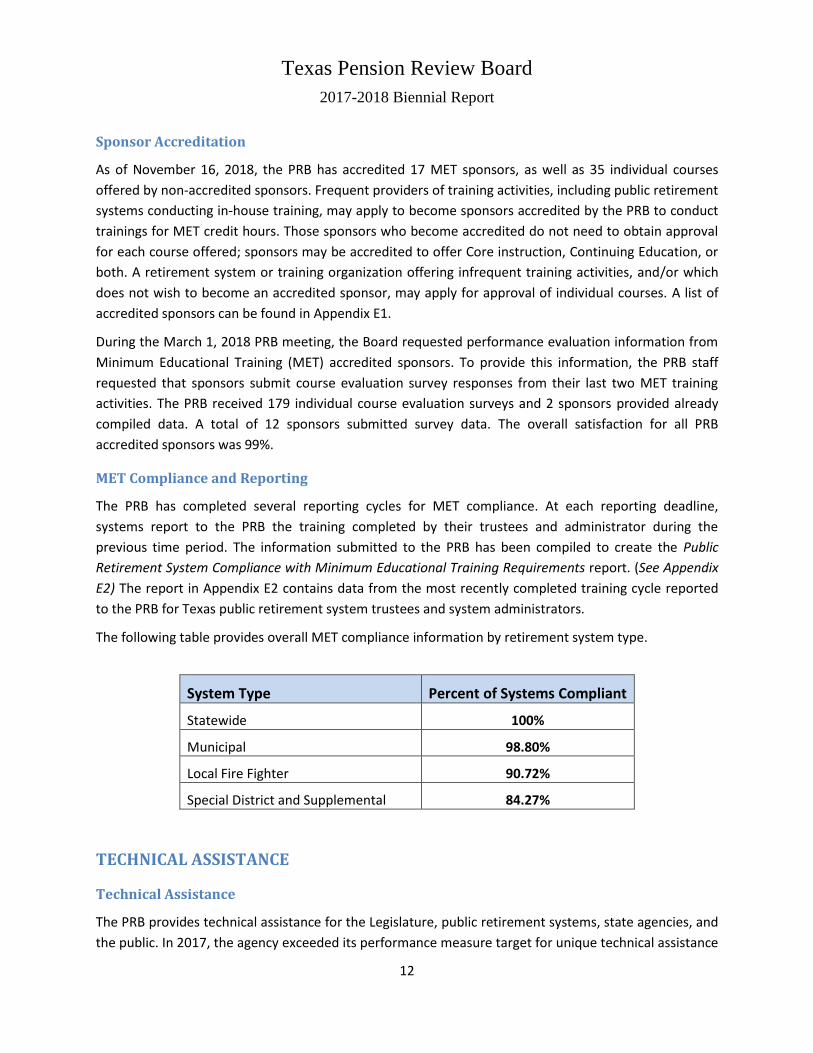
The following table provides overall MET compliance information by retirement system type.
System Type Percent of Systems Compliant
Statewide 100%
Municipal 98.80%
Local Fire Fighter 90.72%
Special District and Supplemental 84.27%
TECHNICAL ASSISTANCE
Technical Assistance
The PRB provides technical assistance for the Legislature, public retirement systems, state agencies, and
the public. In 2017, the agency exceeded its performance measure target for unique technical assistance

Texas Pension Review Board
2017-2018 Biennial Report
13
reports produced by staff, with 184% of the target attained. The performance measure target was raised
for 2018, and the agency reached 92.67% of the target. The increase in technical assistance is not only
because of the establishment of the Minimum Educational Training Program, but also due to systems
requesting a large amount of comprehensive historical data to aid in making proposals and/or decisions
regarding plan design changes. The PRB worked with systems to provide the most up-to-date and
accurate data for statewide, municipal and other local pension systems in Texas, which involved
preparing several large datasets. The PRB staff also completed numerous research requests from
legislative offices, and recently, the PRB has received large data requests from national organizations.
PRB staff has worked diligently to assist those parties in a timely manner.
Complaints
The PRB makes great effort to promptly respond to complaints regarding any registered Texas public
retirement system. Staff researches the complaint by contacting the person who filed the complaint as
well as representatives of the retirement system that is the subject of the complaint. The individuals
contacted are given the opportunity to provide information regarding the complaint, and may be asked
for additional information. After the research has been completed, the staff composes a document in
which the facts of the issue are stated, as provided by the parties involved. The final complaint
document includes the agency’s research and suggestions that may be useful in preventing a recurrence
of the problem. The conclusion of the document states whether policies and procedures of the
retirement system were followed correctly. In the last biennium, the PRB has worked on three
complaints concerning various systems.
News Clips
As part of the educational outreach program, the PRB provides electronic weekly news clips service to
its constituents. In 2018 the PRB news clips were redesigned, and the content was streamlined to
concentrate on the following topics relevant to subscribers: Texas pension plans, Texas economic
indicators, and national pensions, investments, and legal.
Educational Services Survey and Customer Service Survey
Educational Services Survey
In September 2017, the PRB developed a survey to assess constituents' satisfaction with PRB
educational services, and to capture a performance measure. The survey was e-mailed to 732
retirement system trustees and administrators, government contacts, legislative staff, and news clips
subscribers, and was posted on the PRB website. The agency received 76 responses to the survey.
Overall, the respondents were 92.73% satisfied with the MET online courses; 97.78% satisfied with in-
person PRB educational presentations at conferences; 97.92% satisfied with information presented by
PRB staff during legislative session; 95.56% satisfied with the weekly news clips; and 95.52% satisfied
with educational services overall.

Texas Pension Review Board
2017-2018 Biennial Report
14
Customer Service Survey
In accordance with the requirements of the strategic planning process, the PRB conducted its customer
service survey in April through May 2018. The survey included 10 questions regarding topic areas on
staff, timeliness, website, communication/printed information, education/mission/transparency, and
general/overall. A majority of respondents expressed satisfaction with each topic area, and each area
also received various feedback and recommendations for improvement.
SPECIFIC ASSISTANCE FOR TLFFRA SYSTEMS
The agency’s TLFFRA specialist is the agency's point person on TLFFRA issues and continues to work
closely with TLFFRA systems to provide a substantial amount of technical assistance and information on
various issues, including service verification, questions relating to the TLFFRA statute, and assisting the
systems with reporting requirements. The PRB provided materials and taught a course at the 2017
Annual TLFFRA Conference in The Woodlands.
The Texas Local Fire Fighters Retirement Act Pension Report (TLFFRA Report) provides general and
comparative pension-related data for paid and part-paid retirement plans organized under the TLFFRA
statute. TLFFRA plans are statutorily required to report financial, actuarial, benefit, investment and
contact information to the PRB. Based on the information received by the PRB, the report is organized
into four sections: Financial, Actuarial, Benefits, and Directory. The Board approved the report at its
March 1, 2018 meeting, and the report was published online and sent to TLFFRA systems in early March.
85th LEGISLATURE
Public Pension Legislation of the 85th Legislature
The 85th Session of the Texas Legislature convened in January of 2017 and adjourned on May 29, 2017.
During the session, the PRB tracked 91 bills and companion bills pertaining to Texas public retirement
systems. The PRB issued 68 actuarial impact statements to the Legislative Budget Board regarding the
actuarial effect of these bills and substitutes on public retirement systems. The agency closely
monitored these pension bills and published a weekly tracking report to provide information on the
status of those bills for its constituents. Major pension-related legislation passed during the regular
session can be found in Appendix F.
Presentations to the Legislature & Interim Hearings
On February 27, 2017, the PRB provided invited testimony before the House Committee on Pensions.
The presentation covered information about the agency and its duties, the general landscape of Texas
public retirement systems, and the pension challenges in Texas, such as issues facing the Dallas Police
and Fire Pension System. The agency also testified as a resource witness and provided technical
assistance to various legislative offices on pension-related bills during session.
On April 4, 2018, the PRB presented a report to the Senate Committee on State Affairs concerning the
charge to: “Examine and assess public pension systems in Texas. Specifically, review and assess (1) the

Texas Pension Review Board
2017-2018 Biennial Report
15
different types of retirement plans; (2) the actuarial assumptions used by retirement systems to value
their liabilities and the consequences of amending those assumptions; (3) retirement systems'
investment practices and performances; and (4) the adequacy of financial disclosures including asset
returns and fees." The PRB’s report on this charge focused on the Texas public retirement systems'
assumed rates of return. (See Appendix G1)
On May 10, 2018, the PRB presented a report to the House Committee on Pensions in Dallas regarding
Interim Charge #1: “Review the state's oversight of pension systems and study the effectiveness of
corrective mechanisms, including the Funding Soundness Restoration Plan and Pension Review Board
Funding Guidelines. Make recommendations to enhance state oversight and to maintain or achieve
soundness among local pension systems" and Interim Charge #4: "Monitor the agencies and programs
under the Committee's jurisdiction and oversee the implementation of relevant legislation passed by the
85th Legislature." The PRB’s report provided information on the PRB's intensive actuarial review process,
a general update on the Texas public pension outlook, including funding trends, assets and liabilities,
investment return assumption trends, and a funding soundness restoration plan update. The agency
also provided a summary of the legislation passed during the 85th Legislature concerning the Dallas
Police and Fire Pension System, including a summary of the provisions, the impact of the legislation on
system funding levels, and the PRB duties associated with the legislation. (See Appendix G2)
On October 12, 2018, the PRB presented to the House Committee on Pensions in Houston concerning
Interim Charge #1: “Review the state's oversight of pension systems and study the effectiveness of
corrective mechanisms, including the Funding Soundness Restoration Plan and Pension Review Board
Funding Guidelines. Make recommendations to enhance state oversight and to maintain or achieve
soundness among local pension systems" and Interim Charge #4: "Monitor the agencies and programs
under the Committee's jurisdiction and oversee the implementation of relevant legislation passed by the
85th Legislature." The PRB’s report provided information on the PRB's intensive actuarial review process,
a general update on the Texas public pension outlook, including funding trends, assets and liabilities,
investment return assumption trends, and funding soundness restoration plan update. The agency also
provided a summary of the legislation passed during the 85th Legislature concerning the Houston
Firefighter's Relief & Retirement Fund, Houston Police Officers Pension System, and Houston Municipal
Employees Pension System; including a summary of the provisions within the bill, a description of the
elements within the corridor mechanism created by the bill, the impact of the legislation on system
funding levels, and the PRB duties associated with the legislation. (See Appendix G3)
2017 Legislative Session Training
In January 2017, the agency conducted a training session at the Texas Capitol for staff of the Legislature,
Legislative Budget Board, Governor’s Office, public retirement systems, and other interested parties.
The training session covered basic actuarial methods, pension plan financing, and the actuarial impact
statement process for pension-related bills. The staff also provided numerous public pension training
sessions to legislative offices.

Texas Pension Review Board
2017-2018 Biennial Report
16
APPENDICES

Texas Pension Review Board
2017-2018 Biennial Report
I
APPENDIX A1 – INTENSIVE ACTUARIAL REVIEW – GALVESTON
EMPLOYEES RETIREMENT PLAN FOR POLICE

Intensive Actuarial Review: Galveston Employees' Retirement Plan for Police
January 2018

Pension Review Board System Actuarial Review: Galveston Employees' Retirement Plan for Police
Table of Contents Executive Summary ....................................................................................................................................... 1
Background ................................................................................................................................................... 3
Plan Summary ........................................................................................................................................... 3
Benefits ..................................................................................................................................................... 3
Contributions ............................................................................................................................................ 3
Membership .............................................................................................................................................. 3
Board Structure ......................................................................................................................................... 4
Contribution and Benefit Decision-Making .............................................................................................. 4
Funding Soundness Restoration Plan (FSRP) ............................................................................................ 4
Key Metrics ............................................................................................................................................... 4
Historical Trends ........................................................................................................................................... 7
Assets and Liabilities ................................................................................................................................. 7
Investment Assumption and Returns ....................................................................................................... 9
Contributions .......................................................................................................................................... 10
Asset Allocation....................................................................................................................................... 11
Payroll Growth ........................................................................................................................................ 12
Cash flow ................................................................................................................................................. 12
Demographics ......................................................................................................................................... 13
Risk Analysis ................................................................................................................................................ 14
Investment Risk ....................................................................................................................................... 15
Funding Risk ............................................................................................................................................ 16
Assumption Risk ...................................................................................................................................... 18
Governance Risk...................................................................................................................................... 19
Conclusions ................................................................................................................................................. 20
Funding and Governance Risk ................................................................................................................. 20
Assumption Risk ...................................................................................................................................... 21
Investment Risk ....................................................................................................................................... 21
Appendix A – Peer Comparison Tables .......................................................................................................... I
Appendix B – Comments from Galveston Employees' Retirement Plan for Police ...................................... II
Appendix C – Comments form the City of Galveston .................................................................................. III

Pension Review Board System Actuarial Review: Galveston Employees' Retirement Plan for Police
1
Executive Summary This intensive actuarial review of Galveston Employees’ Retirement Plan for Police (“Galveston Police” or “the
Plan”) is intended to assist the Plan’s board of trustees and the City of Galveston (“the City”) in assessing the Plan’s
ability to meet its long-term pension obligation. Overall, the review shows that the Plan is facing significant
financial stress and is taking considerable risks in its approach to funding the Plan. The review also highlights that
Galveston Police and the City have waited too long to address these challenges, which has exacerbated the
situation due to the compound nature of pension liabilities. The Pension Review Board (PRB) encourages the Plan
and the City to review the findings and conclusions of this report carefully and jointly adopt a forward-looking
funding plan to guide the Plan towards a path of long-term sustainability. The PRB can provide technical assistance
in formulating such a plan.
The funded status of Galveston Police has been declining since 2000. Numerous factors have contributed to this
deterioration, including inadequate contributions, insufficient investment returns, increased benefit payments,
and a low active-to-annuitant ratio in the face of a large unfunded liability. Galveston Police and the City have
made incremental plan changes, including contribution increases since 2006 in response to deteriorating
conditions, but these changes have not been enough to put the Plan on a solid path to sustainability.
Currently, Galveston Police’s ability to meet its long-term obligations, measured by a number of indicators in
addition to amortization period, may be threatened and warrants closer scrutiny. A few of the key indicators
include:
• Galveston Police’s funded ratio (assets on hand to cover liabilities) fell from 99% in 2000 to less than 42%
in 2017, which is one of the lowest funded ratios in the state.
• Galveston Police’s actuarial accrued liability increased by nearly 103% between the end of 2000 and 2017.
Conversely, the Plan’s actuarial value of assets declined by nearly 14% over that same period.
• The single largest increase in unfunded liability over the past 10 years was due to investment returns
lower than the assumed rate of return.
• Galveston Police’s investment return assumption of 8.00% is one of the highest in the state. The Plan has
not achieved an 8.00% return on assets over a consecutive 10-year period in any of the 10 periods ending
December 31, 2007 through December 31, 2016. The Plan’s board has lowered the return assumption to
7.50% beginning with the 1/1/2018 actuarial valuation, but the Plan’s actual returns have not met this
revised assumption over the same period.
• Galveston Police’s non-investment cash flow, which shows how much the Plan is receiving through
contributions in relation to its outflows— benefit payments, withdrawals and expenses— is one of the
lowest in the state at -9.79%. If this trend continues, the Plan could face the potential risk of needing to
liquidate a portion of existing assets to pay current benefits and/or expenses.
• At 48.7 years, Galveston Police currently has one of the highest amortization periods (the number of years
required to pay off any unfunded liability) of all 94 defined benefit pension plans in Texas.1
• According to its actuarial valuations, Galveston Police has not received the reported actuarially
determined contribution (ADC) every year since 2002 with the exceptions of 2006 and 2008.2
• Current members are contributing to not only pay for their own benefit accruals; they are also paying for
past benefit accruals of police officers hired before them, contrary to pension funding best practices.
1 PRB’s Pension Funding Guidelines recommend a maximum effective amortization period of 30 years, with 10-25 a more preferable target range. 2 For a pension plan that receives a fixed contribution rate such as Galveston Police, the ADC is the contribution needed to fund the benefits accrued in the current year and maintain an amortization period that does not exceed 30 years, as required to be reported under Texas Government Code §802.101(a).

Pension Review Board System Actuarial Review: Galveston Employees' Retirement Plan for Police
2
• As of 2017, the present value of benefits payable to inactive members (retirees and beneficiaries) were
only 58% funded, and the liability associated with active members was completely unfunded. While not all
inactive benefits are payable immediately, the intent of pre-funding a defined benefit plan is to pay the
cost of the benefit as it is earned such that an individual’s benefits are fully funded when they retire.
The review measures Galveston Police based on four main risk factors—investment, funding, assumption, and
governance risk — and reveal a significant amount of risk being taken in each of these areas, increasing the
probability of a continued period of severe financial stress for the Plan. This also raises the likelihood of
deteriorating funding conditions in the coming years, further imperiling the Plan’s ability to pay promised
benefits. Key findings related to these risks include:
• The likelihood of Galveston Police not meeting or exceeding the 8.00% expected return on assets is
significantly greater than the odds that they will do so for the near future. The PRB estimated the Plan
would be more than two times as likely to earn less than or equal to a 7.00% return versus greater than or
equal to a 9.00% return over the next 30-year period.
• The Plan, along with many public pension plans, could suffer from large losses in a down market year,
given its overall portfolio risk.
• Several of the Plan’s economic assumptions, including the expected return on assets, may cause liabilities
to be understated. While the Plan’s actual cost will always be the benefits actually paid, if the liabilities
are understated, the contributions necessary to fund the actual costs could be larger than anticipated and
could exacerbate the Plan’s already precarious actuarial condition.
• The Plan’s contributions are calculated as a percent of active members’ pay and are back-loaded based on
the expected growth in total payroll. If payroll does not increase at this rate, actual contributions will not
meet those expected in the Plan’s actuarial valuations. Given the Plan’s inactive and active liabilities are
not fully funded; contributions below expected levels will have serious consequences on the Plan’s long-
term solvency.
• Galveston Police’s fixed-rate contribution structure may provide budgetary stability for the employer in
the short term, but does not include any inherent mechanisms for reacting to changes in a plan’s financial
condition.
• Even though required by state law to jointly formulate a funding soundness restoration plan (FSRP),
Galveston Police and the City have yet to work together to make difficult decisions on additional needed
changes to benefit or contribution levels. Currently, the Plan and the City have not agreed upon an
interpretation of the statutory contribution provision, which can be an important first step towards a
collaborative approach.
Finally, the review draws conclusions regarding how these risks might be mitigated and the Plan’s overall ability to
meet its long-term obligations improved. Conclusions include the following:
• Galveston Police, in conjunction with the City, should consider utilizing the FSRP requirement to develop a
long-term funding policy for the Plan.
• Galveston Police’s board of trustees should work with their actuary to ensure actuarial assumptions are
neither too aggressive nor too conservative.
• Galveston Police’s board of trustees should closely monitor investment managers’ performance against
appropriate benchmarks, and should revisit investment manager selection periodically to ensure
managers are providing the highest possible value at the lowest possible cost. Asset allocation should also
be assessed from a risk perspective to evaluate how the Plan would weather a market correction.

Pension Review Board System Actuarial Review: Galveston Employees' Retirement Plan for Police
3
Background
Plan Summary
The Galveston Employees’ Retirement Plan for Police (“Galveston Police” or “the Plan”) was initially
created in 1980 by city ordinance. In 1997, the 75th Legislature enacted Article 6243p, Vernon’s Texas
Civil Statutes (“governing statute”), establishing the Plan independently in state statute. The Plan covers
all police officers employed full-time by the City of Galveston (“the City”). Galveston Police is entirely
locally funded.
Benefits
Eligible Members (Group B)* Member as of 6/30/2008 with less than 15 Years of Credited
Service (YCS) as of 1/1/2006 or hired on or after 7/1/2008
Unreduced Retirement Eligibility
50/20 or age 65
Reduced Early Retirement Eligibility
45/20
Vesting
5 YCS if hired before 4/15/2017;
5-year graded vesting beginning with 50% at 5 YCS up to 100% at 10 YCS if hired on or after 4/15/2017
Benefit Formula YCS x 2.11% x Final Average Salary (FAS) (max 30 YCS)
Final Average Salary (FAS) Final 60 months
Automatic COLA No
Retirement Benefit Options None
Social Security Yes *As of 1/1/2017, there were 4 active Group A members remaining, members as of 6/30/2008 with at
least 15 YCS as of 1/1/2006, whose benefit formula and retirement eligibility differ from the benefits
outlined here.
Contributions
Active members of the Plan contribute 12.00% of pay and the City contributes 12.83%. The Plan’s
governing statute states that the City, acting under the advice of the Plan’s actuary, shall contribute an
amount equal to the normal cost and any interest on the unfunded actuarially accrued liability (UAAL) at
the rate of interest assumed in the actuarial valuation. The City shall also contribute a sufficient amount
to pay the costs of administration of the Plan. The City should ensure that its contributions meet the
statutory requirements.
Membership
Total Active Members
Terminated Vested
Total Annuitants
Total Members
Active-to-Annuitant
Ratio
145 16 144 305 1.01
*Data from the Plan’s 12/31/2016 financial audit

Pension Review Board System Actuarial Review: Galveston Employees' Retirement Plan for Police
4
Board Structure
Active Members 1 - President of municipal police association, or next-highest ranked member if President is not a plan member. Term equal to President’s term of office. 3 – Members of the Plan; elected by plan members. Three-year term.
Sponsor Government 1 – Municipal finance staff employee; designated by and serving at the pleasure of the city manager. No term Specified.
Taxpayer, Not Affiliated with Plan/Sponsor Govt.
1 – Legally qualified voter; designated by the mayor. Two-year term. 1 – Legally qualified voter; designated by city council. Two-year term.
Contribution and Benefit Decision-Making
Under the Plan’s governing statute, the board may modify the following plan provisions with the
approval of at least four board members:
• benefit changes to the Plan as long as any increase in benefit is approved by a majority vote of
plan members;
• future membership qualifications and eligibility requirements for pension or benefits; and
• member contributions, with any increase being subject to a majority vote of plan members. If
the Plan’s actuary certifies that an increase is necessary to maintain an actuarially sound plan,
member approval can be foregone.
Funding Soundness Restoration Plan (FSRP)
Texas Government Code §802.2015 requires the governing body of a public retirement system and its
governmental sponsor formulate an FSRP if the system’s actuarial valuation shows its amortization
period exceeds 40 years for three consecutive annual actuarial valuations, or two consecutive actuarial
valuations if the system conducts valuations less frequently.
The Plan was required to submit an FSRP in 2016, because the actuarial valuations prepared as of
January 1, 2014, January 1, 2015, and January 1, 2016 reported amortization periods greater than 40
years. The FSRP consisted of an increase in the City’s contribution from 12.00% to 12.83% and the
following change to the vesting schedule for members hired on or after April 15, 2017: 0% vesting up to
5 years; 50% vesting after 5 years increasing 10% each subsequent year reaching full vesting after 10
years. These changes were expected to be sufficient to reduce the amortization period to approximately
40 years.
Key Metrics
Government Code Section 801.202(2) requires the PRB to conduct intensive studies of potential or
existing problems that threaten the actuarial soundness of or inhibit an equitable distribution of
benefits in one or more public retirement systems. The PRB identified the following key metrics, in
addition to amortization period, to determine and prioritize retirement systems for intensive actuarial
review. The PRB selected Galveston Police for review based on the 2017 actuarial valuation data shown
below. Unless otherwise noted, the following metrics were calculated as of January 1, 2017.

Pension Review Board System Actuarial Review: Galveston Employees' Retirement Plan for Police
5
Amort. Period
Funded Ratio
UAAL as % of Payroll
Assumed Rate of Return
Payroll Growth
Rate
Actual Cont. as %
of ADC
DROP as % of
FNP
Non-Investment Cash Flow as %
of FNP
48.7 42.10% 278.91% 8.00% 3.50% 81.41% N/A -9.79%
*Contribution and Cash flow data from the Plan’s 12/31/2016 financial audit
Metric Amortization period (48.7 years)
What it measures
Approximately how long it would take to fully fund the unfunded actuarial accrued liability (UAAL) based on the current funding policy.
Why it is important
Given the Plan’s current assumptions, an amortization period greater than 18 years indicates that contributions to the Plan in the coming year are less than the interest accumulated for that same period, and therefore the total UAAL is expected to grow over the near term. In addition, for a plan that contributes on a fixed-rate basis such as Galveston Police, the higher the amortization period, the more sensitive it is to small changes in the UAAL.
Peer Comparison
Galveston Police currently has one of the highest amortization periods of all defined benefit pension plans in Texas.
Metric Funded ratio (42.10%)
What it measures
The percent of a fund’s actuarially accrued liabilities covered by its actuarial value of assets.
Why it is important
The lower the funded ratio, the fewer assets a fund has to pay its current and future benefit payments. Further, the present value of benefits payable to members who are no longer working (i.e. retirees and their beneficiaries) is not fully funded. Only 58% of the inactive liability is funded on an actuarial basis, leaving over $15 million in inactive liability. All of the nearly $14 million of active liability was completely unfunded as of January 1, 2017 and therefore is dependent on future contributions and investment returns.
Peer Comparison
Galveston Police’s 42.10% funded ratio is one of the lowest in the state.
Metric UAAL as a percent of payroll (278.91%)
What it measures
The size of a plan’s unfunded liability compared to the annual payroll of the active members.
Why it is important
Provides a way to compare plans of various sizes and expresses the outstanding “pension debt” relative to current personnel costs.
Peer Comparison
The Plan’s UAAL as a percent of payroll is one of the highest among plans in its peer group of similar asset size on a market value basis, including the civilian and fire plans sponsored by the City, and is also one of the highest in the state.

Pension Review Board System Actuarial Review: Galveston Employees' Retirement Plan for Police
6
Metric Assumed rate of return (8.00%)
What it measures
The estimated annual rate of return on the Plan’s assets.
Why it is important
If actual future returns are lower than the assumed rate of return, future contributions will need to increase significantly, especially for a poorly funded plan. Galveston Police’s assumed rate of return is 8.00%, while its actual ten-year net investment rate of return for the period ending 12/31/2016 was only 3.64%.
Peer Comparison
Galveston Police’s 8.00% assumed rate of return is one of the highest in the state and is above the national average of 7.52% (reported by NASRA’s Public Pension Plan Investment Return Assumptions brief updated February 2017).
Metric Payroll growth rate (3.50%)
What it measures
The estimated annual growth in the total payroll of active members contributing to the Plan.
Why it is important
Contributions are calculated as a percent of active members’ pay and are back-loaded based on the expected growth in total payroll. If payroll does not increase at this rate, actual contributions will not meet those expected in the Plan’s actuarial valuations. Given the Plan’s inactive and active liabilities are not fully funded, contributions below expected levels will have serious consequences on the Plan’s long-term solvency.
Peer Comparison
The Plan’s payroll growth rate of 3.50% is the median payroll growth rate for Texas defined benefit plans.
Metric Actual contributions as a percent of actuarially determined contributions (81.41%)
What it measures
Whether the current employer contributions have met a theoretical minimum threshold.1
Why it is important
The employer is currently contributing less than 82% of the amount needed to fund the Plan on a rolling 30-year amortization period. The PRB’s 2014 Study of the Financial Health of Texas Public Retirement Systems found that plans that have consistently received adequate funding are in a better position to meet their long-term obligations.
Peer Comparison
This is one of the largest shortfall percentages in the state and the third largest in its peer group.
Pension Review Board System Actuarial Review: Galveston Employees' Retirement Plan for Police
7
Metric Non-investment cash flow as a percent of fiduciary net position (-9.79%)
What it measures
Non-investment cash flow shows how much the Plan is receiving through contributions in relation to its outflows: benefit payments, withdrawals and expenses.
Why it is important
Viewing this metric as a percent of total net assets (or fiduciary net position (FNP)), in conjunction with the funded ratio and recognition of the relative maturity of the Plan, provides information about the stability of a plan’s funding arrangement.
Peer Comparison
Galveston Police’s non-investment cash flow as a percent of FNP is one of the lowest in the state. If this trend continues, the Plan could face the potential risk of needing to liquidate a portion of existing assets to pay current benefits and/or expenses.
Historical Trends To conduct an intensive review of risks associated with the long-term funding of a pension plan, it is
important to analyze trends in multiple metrics. A plan with an asset level lower than its accrued liability
has insufficient funds to cover benefits. A plan can experience an increase in unfunded liability due to
various factors, including insufficient investment returns, inadequate contributions and inaccurate or
overly aggressive assumptions. Hence, a single metric cannot effectively capture the different drivers
contributing to the increase of a plan’s unfunded pension obligation. This section analyzes historical
trends in various metrics identified by the PRB and makes comparisons to understand the sources of
growth in unfunded liability for Galveston Police.
Galveston Police’s funded status has been steadily declining since 2000. Numerous factors have
contributed to this deterioration, including inadequate contributions, insufficient investment returns,
increased benefit payments, and a low active-to-annuitant ratio in the face of a large unfunded liability.
The following sections discuss these and other factors in detail.
Assets and Liabilities
For a plan’s funding level to improve, its assets should grow faster than liabilities, which can be achieved
by contribution increases, benefit reductions, and/or consistently high investment returns over a long
period of time.
Galveston Police’s actuarial accrued liability (AAL) increased by nearly 103% between 2000 and 2017.
Conversely, the Plan’s actuarial value of assets (AVA) declined by nearly 14% over the same period. The
Plan was nearly 99% funded in 2000 but fell to just above 42% in 2017, which is the third lowest of all
defined benefit pension plans in Texas. The Plan has been under 50% funded since 2009.
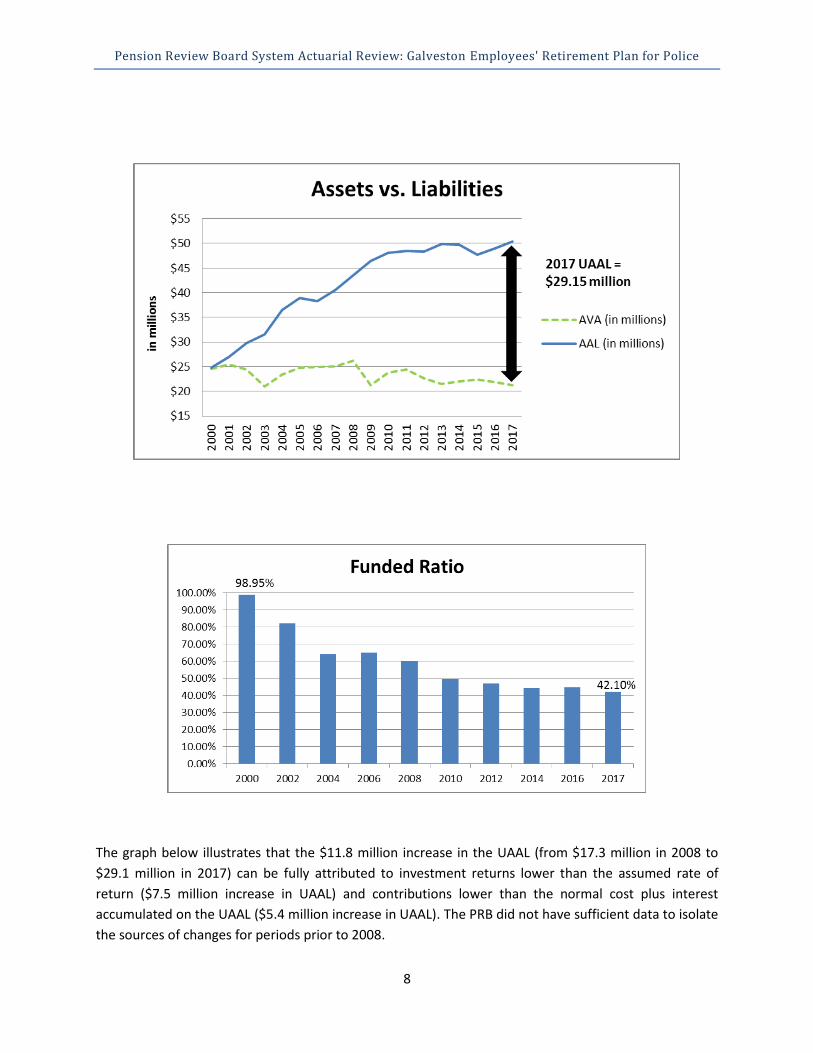
Pension Review Board System Actuarial Review: Galveston Employees' Retirement Plan for Police
8
The graph below illustrates that the $11.8 million increase in the UAAL (from $17.3 million in 2008 to
$29.1 million in 2017) can be fully attributed to investment returns lower than the assumed rate of
return ($7.5 million increase in UAAL) and contributions lower than the normal cost plus interest
accumulated on the UAAL ($5.4 million increase in UAAL). The PRB did not have sufficient data to isolate
the sources of changes for periods prior to 2008.

Pension Review Board System Actuarial Review: Galveston Employees' Retirement Plan for Police
9
Investment Assumption and Returns
As illustrated in the Assets and Liabilities section, actual investment returns lower than the assumed
return increased the Plan’s UAAL by more than $7.5 million between 2008 and 2017. The Plan currently
assumes an 8.00% interest rate. Prior to 2015, the Plan assumed a 7.50% rate of return (net of all
expenses), but in 2015 restated the rate to 8.00% (net of investment expenses only). The assumed rate
of return of 8.00% still exceeds the 2017 national average of 7.52% (reported by NASRA) and most of its
peer systems in Texas. In addition, the Plan has not achieved an 8% return on assets over a consecutive
10-year period in any of the 10 periods ending December 31, 2007 through December 31, 2016 as
shown in the graph below.

Pension Review Board System Actuarial Review: Galveston Employees' Retirement Plan for Police
10
The 10-year net return on investments in 2016 was 3.64%, which is almost 440 basis points below its
assumed interest rate. While most plans have been experiencing a difficult 10-year period since the
2008-2009 market downturn, the Plan’s returns further lag behind the 10-year average returns reported
by its peer group (Texas defined benefit plans with asset size closest to the Plan’s, including the civilian
and fire plans sponsored by the City) over the same period, which is roughly 4.12%. PRB’s AV
Supplemental Report dated November 17, 2017 showed that out of 84 Texas plans that reported a 10-
year net investment return, Galveston Police stood at 72nd.
The Plan has submitted a revised 2017 actuarial valuation, which includes recommendations to decrease
the Plan’s assumed investment return to 7.50%. These proposed changes were approved by the Plan’s
board at its May 12, 2017 meeting and will be effective for the 2018 actuarial valuation.
Contributions
Most Texas plans use a fixed percent of pay funding approach. Under a fixed-rate funding structure, no
formal amortization policy (i.e. the expected time to fully fund the Plan) exists; therefore, the Plan’s
actuary estimates the amortization period at each valuation date based on the current financial
condition of the Plan and the current contribution rates. This fixed-rate funding structure provides
contribution stability for the plan sponsor in the short term, but does not include any inherent
mechanisms for reacting to changes in a plan’s financial condition.
As of January 2017, active members of the Plan contribute 12.00% of pay and the City contributes
12.83% of pay. Only 10.06% of the members’ contribution is necessary to fund their current and future
benefit accruals (normal cost), which means new officers hired tomorrow are not only paying for 100%
of their own benefit, they are also paying for benefits of other officers hired before they started. The
City’s contribution rate reflects an increase from 12.00% in 2016. Despite the increase in the
contribution rate in 2016, the Plan’s UAAL increased by $2.07 million. This increase in the UAAL was
caused by total contributions that were not sufficient to cover both the new benefits being accrued
(normal cost) and the interest accumulated on the unfunded benefits already earned (interest
accumulated on the UAAL), or to start reducing the total UAAL. This result, a payment that is not
expected to cover the interest that accrues during the year, is known as negative amortization.
The Conference of Consulting Actuaries' Public Plans Community White Paper Actuarial Funding Policies
and Practices for Public Pension Plans suggests that an “amortization policy should reflect explicit
consideration of the level and duration of negative amortization,” and identifies a “rolling/open
amortization of [the] entire UAAL as a single combined layer … where the amortization period entails
negative amortization,” as an unacceptable practice. 2
According to its actuarial valuations, Galveston Police has not received the reported actuarially
determined contribution (ADC) every year since 2002, with the exceptions of 2006 and 2008. Even with
contribution increases in 2006, 2008, and 2017, employer contributions have averaged less than 80% of
the Plan’s ADC since 2002. Furthermore, the reported ADC rate is calculated utilizing an “open
amortization of [the] entire UAAL as a single combined layer.” For the fiscal year ending December 31,
2017, the expected contributions are less than 81.5% of the reported ADC. This shortfall of $306,173 is

Pension Review Board System Actuarial Review: Galveston Employees' Retirement Plan for Police
11
equal to 0.67% of the City’s total General Fund expenditures for the fiscal year ending December 31,
2016 and is greater than most other plans of similar asset size. Additionally, the City faces a contribution
shortfall for the Galveston Firefighter’s Relief & Retirement Fund of $632,629, which is 1.38% of the
City’s total General Fund expenditure.
Contribution Levels vs. Actuarially Determined Contribution Date (1/1) 2008 2009 2010 2011 2012 2013 2014 2015 2016 2017 Employee Contribution
12.00% 12.00% 12.00% 12.00% 12.00% 12.00% 12.00% 12.00% 12.00% 12.00%
Employer Contribution
12.00% 12.00% 12.00% 12.00% 12.00% 12.00% 12.00% 12.00% 12.00% 12.83%
30 Year ADC 8.99% 14.35% 12.58% 14.56% 16.14% 16.30% 15.36% 14.71% 14.60% 15.76%
% of ADC funded 133.45% 83.63% 95.38% 82.40% 74.35% 73.64% 78.11% 81.60% 82.21% 81.41%
Covered Payroll (in millions)
$9.96 $9.08 $9.99 $8.57 $8.23 $9.02 $9.31 $9.38 $10.14 $10.45
Contribution Shortfall (in millions)
- $0.21 $0.06 $0.22 $0.34 $0.39 $0.31 $0.25 $0.26 $0.31
Under the Plan’s 2017 assumptions (8.00% discount rate and 3.50% payroll growth rate), negative
amortization occurs when the amortization period is more than approximately 18 years. This increases
to 19 when reflecting the reduction in discount rate to 7.50% for 2018. While the Plan does not have an
explicit amortization policy, continuing a fixed 12.83% employer contribution without any other changes
to the Plan would result in an implicit amortization policy that entails negative amortization (i.e.
intentionally increases the total UAAL) for the next 30 years.
As mentioned before, the Plan’s governing statute states the City, acting under the advice of the actuary
for the Plan, is required to contribute an amount equal to at least the normal cost plus interest on the
UAAL at the rate of interest assumed in the valuation, as well as a sufficient amount to pay the cost of
administration of the Plan. The Plan, based on its interpretation of the contribution provision contained
in the governing statute, revised the 2017 actuarial valuation to recalculate the contribution rate for the
City. As noted earlier, the current 12.00% member contribution is larger than the members’ future
benefit accruals, therefore, the employer normal cost is 0.00% and the revised actuarial valuation
assumes the City will only contribute the interest on the UAAL plus expenses. The City’s revised
statutory 2017 contribution rate recommended by the Plan’s actuary increased to 23.26%, and the
estimated amortization period decreased by three years to 45.7. The City has not agreed to the updated
contribution rate proposed in the revised 2017 actuarial valuation but should ensure that its
contributions meet the statutory requirements.
Asset Allocation
The investment policy is not clear on target asset allocation for the various asset classes and only
provides minimum and maximum allocations allowed. Current target allocation rates are based on
comments provided from the Plan, which assume a target of 70.00% in equities and 30.00% in fixed
income.

Pension Review Board System Actuarial Review: Galveston Employees' Retirement Plan for Police
12
Asset Allocation Asset Class Equities Fixed Income Cash Receivables
Current Allocation 71.06% 26.85% 1.09% 1.00% Target Allocation 70.00% 30.00% 0.00% 0.00%
*Current allocation as of 12/31/2016 financial audit
Payroll Growth
Galveston Police lowered the annualized payroll growth assumption from 4.00% to 3.50% as of January
1, 2017. The Plan’s total payroll growth has averaged 1.6% between 2000 and 2017.
While this assumption under the current fixed-rate funding policy does not directly affect actual
contributions, the calculation of the amortization period is highly sensitive to it, especially when a plan’s
amortization period is over 40 years.
Sensitivity to Changes in Payroll Growth Assumption
Assumed Payroll Growth Amortization Period
3.50% 49
3.00% 75 *Based on 2017 UAAL and city contribution rate of 12.83%
Cash flow
Galveston Police has one of the lowest non-investment cash flows in the state. In 2016 the Plan’s non-
investment cash flow dipped to -9.79%, a large drop from before the market downturn in 2008 (-2.81%).
The drop to -5.70% in 2009 was largely caused by a decrease in total contributions from $2.6 million in
2008 to $2.2 million in 2009. Total contributions have grown since 2009 ($2.5 million in 2016), but the
continued growth in yearly benefit disbursements and administrative expenses is still outpacing the
funds received by the Plan through contributions.
A negative non-investment cash flow is not abnormal for mature defined benefit pension plans.
However, a cash flow percentage this low is likely to be a drag on potential investment returns because
a plan must either invest in a higher proportion of income-producing investments, which traditionally
provide lower returns, or must liquidate existing assets to pay out current benefits and/or expenses.
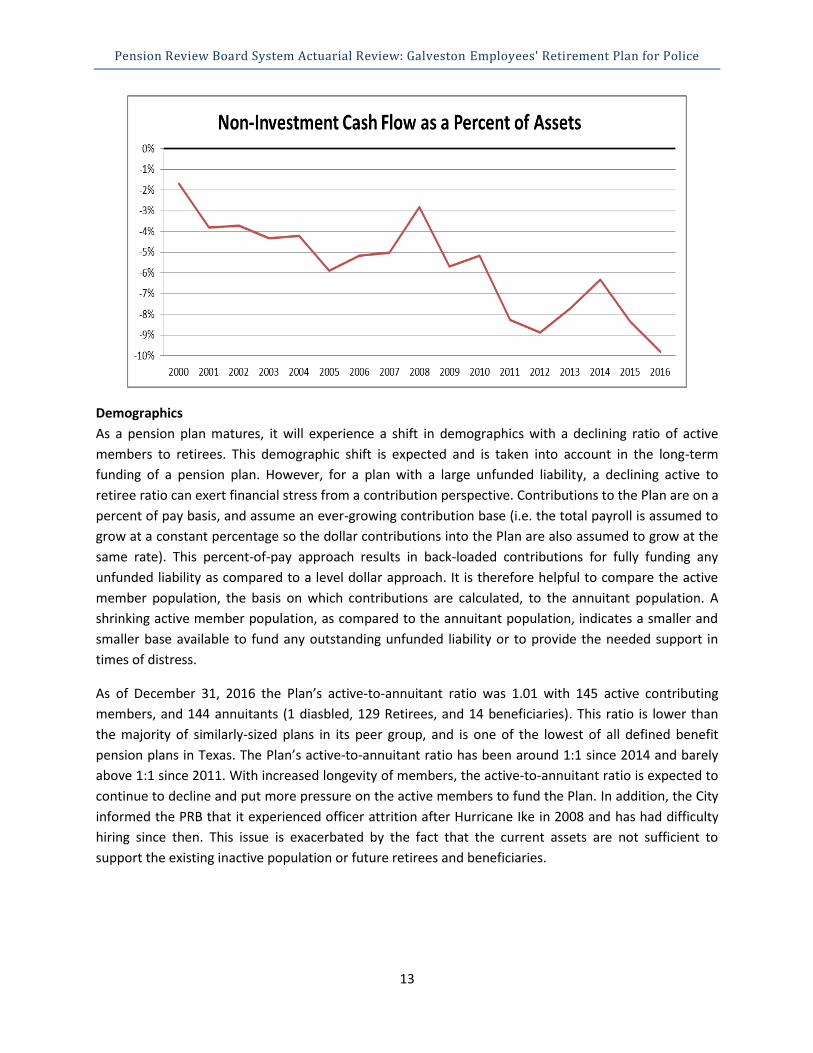
Pension Review Board System Actuarial Review: Galveston Employees' Retirement Plan for Police
13
Demographics
As a pension plan matures, it will experience a shift in demographics with a declining ratio of active
members to retirees. This demographic shift is expected and is taken into account in the long-term
funding of a pension plan. However, for a plan with a large unfunded liability, a declining active to
retiree ratio can exert financial stress from a contribution perspective. Contributions to the Plan are on a
percent of pay basis, and assume an ever-growing contribution base (i.e. the total payroll is assumed to
grow at a constant percentage so the dollar contributions into the Plan are also assumed to grow at the
same rate). This percent-of-pay approach results in back-loaded contributions for fully funding any
unfunded liability as compared to a level dollar approach. It is therefore helpful to compare the active
member population, the basis on which contributions are calculated, to the annuitant population. A
shrinking active member population, as compared to the annuitant population, indicates a smaller and
smaller base available to fund any outstanding unfunded liability or to provide the needed support in
times of distress.
As of December 31, 2016 the Plan’s active-to-annuitant ratio was 1.01 with 145 active contributing
members, and 144 annuitants (1 diasbled, 129 Retirees, and 14 beneficiaries). This ratio is lower than
the majority of similarly-sized plans in its peer group, and is one of the lowest of all defined benefit
pension plans in Texas. The Plan’s active-to-annuitant ratio has been around 1:1 since 2014 and barely
above 1:1 since 2011. With increased longevity of members, the active-to-annuitant ratio is expected to
continue to decline and put more pressure on the active members to fund the Plan. In addition, the City
informed the PRB that it experienced officer attrition after Hurricane Ike in 2008 and has had difficulty
hiring since then. This issue is exacerbated by the fact that the current assets are not sufficient to
support the existing inactive population or future retirees and beneficiaries.

Pension Review Board System Actuarial Review: Galveston Employees' Retirement Plan for Police
14
Risk Analysis
The various risks faced by a pension fund all boil down to one relatively simple question, “Will there be
enough money to pay benefits when due?” This section discusses four main risk factors facing the Plan:
investment, funding, assumption, and governance risks. Measuring Galveston Police based on these
factors reveals a significant amount of risk being taken in each of these areas, increasing the probability
of a continued period of severe financial stress for the Plan. This also raises the likelihood of
deteriorating funding conditions in the coming years, further imperiling the Plan’s ability to pay
promised benefits.

Pension Review Board System Actuarial Review: Galveston Employees' Retirement Plan for Police
15
Investment Risk
Investment risk is the risk that actual future returns will be different from expected. Generally, some risk
always exists associated with actual returns deviating significantly below or above the expected return
on assets over the long term. However, the likelihood of Galveston Police not meeting or exceeding the
8.00% expected return on assets is significantly greater than the odds that they will do so for the near
future.
The graph below projects the funded ratio for the next 30 years, assuming the member contribution
rate remains 12.00% and the City contributes a fixed 12.83%, under the following four different actual
investment return scenarios: the expected return on assets (EROA) or 8.00% for 2017 and 7.50% for all
subsequent years; the EROA +1%; the EROA -1%; and the “tread-water” rate of return on assets, or rate
of return on assets necessary to have the same funded ratio at the end of the 30-year period. The tread-
water return on assets is 7.37%, meaning if the average return over the next 30 years is lower than the
assumed return by just 63 basis points in 2017 and 13 basis points for all future years, the Plan would
find itself in essentially the same funded position in 30 years.
3
In addition, as was illustrated in the Historical Trends section, the Plan has not achieved an 8.00%
annualized return (or even a 7.50% return) over a consecutive 10-year period in any of the 10 periods
ending December 31, 2007 through December 31, 2016. The impact of consistently earning less than the
EROA but even as high as 7.00% over the next 30 years results in the funded status sinking to 30%. The
graph also illustrates that better than average returns alone are not sufficient to fix the funded status of
the Plan. Achieving an annualized 9.00% return over the next 30 years results in a funded ratio of only
65%. Based on the current asset allocation, the Plan’s assumed rate of return, and expected capital
market assumptions published by organizations such as JP Morgan and Horizon Actuarial Services, the

Pension Review Board System Actuarial Review: Galveston Employees' Retirement Plan for Police
16
PRB estimates the probability of earning less than or equal to a 7.00% annual return is approximately
twice as likely as achieving a 9.00% or greater annual return over the next 30-year period.
The Plan’s current asset allocation is not significantly different from other public pension plans.
However, to maintain an expected return on assets of 8.00%, public pension plans have generally taken
on significantly more risk than in the past. Public pension portfolios with an 8.00% expected return have
increased risk by more than three-fold between 1995 and 2016.4 Generally, this is a result of shifting
investments from more stable fixed income securities (with significantly lower returns in 2016 than in
1995) into equities and equity-like products. Galveston Police, however, has consistently held a
significant portion of its assets in equities, with nearly 2/3 of total assets invested in equities in 1995.
Taking on this level of investment risk over the long-term has not necessarily produced a better result in
this case.
The approval by the board to reduce the assumed rate of return on investments to 7.50% for the 2018
valuation is a step in the right direction, but may not be sufficient.
Funding Risk
Funding or contribution risk is the risk that actual future contributions are less than expected future
contributions. For purposes of this section, funding risk will also refer to the risk that future
contributions are less than “needed” to maintain a financially stable pension fund.
There are two primary issues with fixed-rate, percent of pay plans that may result in long-term
problems:
1) Contributions to percent of pay plans are inherently back-loaded because the expected
contributions to a percent of pay plan grow on a nominal basis at the assumed rate of total
payroll growth.
2) Fixed-rate plans provide budgetary stability for the employer in the short term, but do not
include any inherent mechanisms for reacting to changes in a plan’s financial condition.
Based on the Plan’s current contribution rates and actuarial assumptions, the total UAAL is expected to
increase for the next 30 years before it starts to decrease. The implication is that someone who is hired
by the Police Department or someone who moves to the City 15 to 20 years in the future will still be
paying for services received in the past. This raises the concern of intergenerational equity. Moreover, if
actual investment returns and/or payroll growth are lower than expected, the UAAL will only continue
to increase more.
As was noted in the Historical Trends section, current member contributions exceed their normal cost
(or the annual benefit accrual) based on the Plan’s current actuarial assumptions. Given the inactive
liability is not fully funded, the excess contribution is not being used to build up a reserve to address
future adverse deviations, but to fund the benefits of current retirees.
To address these concerns, a plan can adopt a funding policy where member contributions are no more
than the annual normal cost and employer contributions are designed with a target to fund actuarial
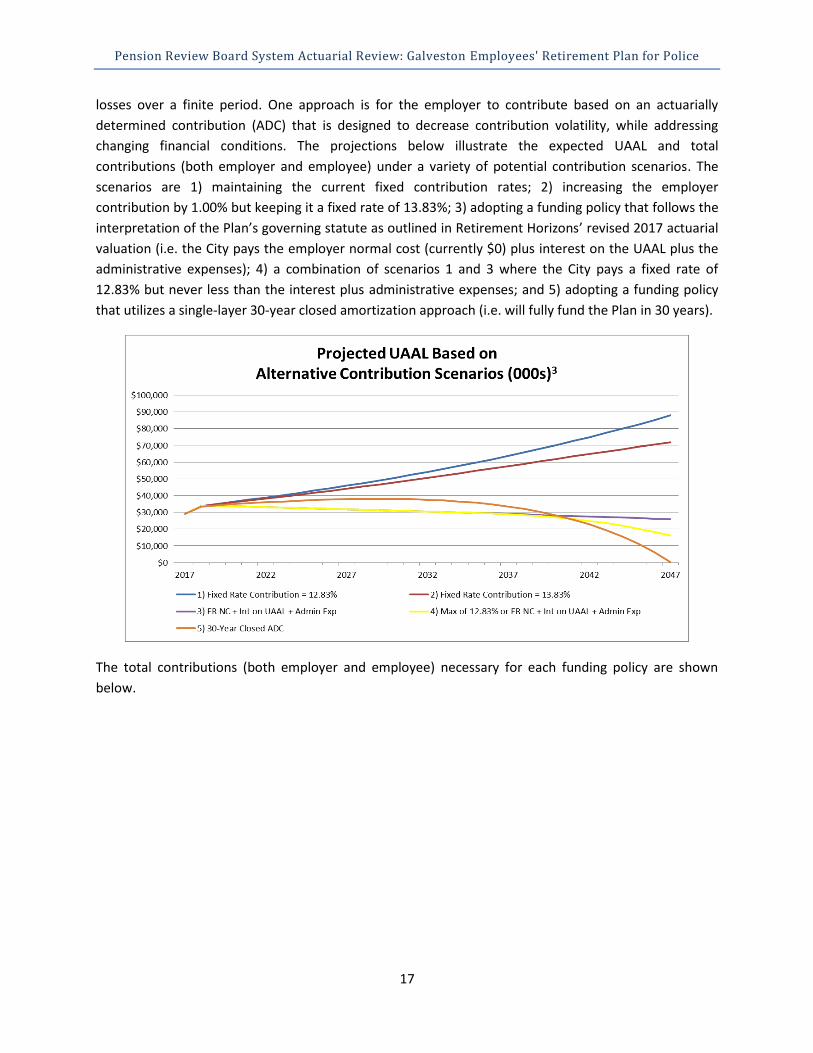
Pension Review Board System Actuarial Review: Galveston Employees' Retirement Plan for Police
17
losses over a finite period. One approach is for the employer to contribute based on an actuarially
determined contribution (ADC) that is designed to decrease contribution volatility, while addressing
changing financial conditions. The projections below illustrate the expected UAAL and total
contributions (both employer and employee) under a variety of potential contribution scenarios. The
scenarios are 1) maintaining the current fixed contribution rates; 2) increasing the employer
contribution by 1.00% but keeping it a fixed rate of 13.83%; 3) adopting a funding policy that follows the
interpretation of the Plan’s governing statute as outlined in Retirement Horizons’ revised 2017 actuarial
valuation (i.e. the City pays the employer normal cost (currently $0) plus interest on the UAAL plus the
administrative expenses); 4) a combination of scenarios 1 and 3 where the City pays a fixed rate of
12.83% but never less than the interest plus administrative expenses; and 5) adopting a funding policy
that utilizes a single-layer 30-year closed amortization approach (i.e. will fully fund the Plan in 30 years).
The total contributions (both employer and employee) necessary for each funding policy are shown
below.

Pension Review Board System Actuarial Review: Galveston Employees' Retirement Plan for Police
18
Assumption Risk
Actuarial valuations and projections are by their nature simplifications of an extremely complex reality.
As G.E.P. Box is famously quoted, “All models are wrong, but some are useful.” The actuarial valuation,
like a map of the world, is not 100% accurate but is instead a useful tool to help guide decision making
on the most effective way to get from point A to point B. For that reason, it is best not to rely too much
on a single snapshot of any given metric, but rather examine the progression of multiple metrics over
time. An important part of that process involves selecting the economic and demographic assumptions
about future plan experience.
Actuarial Standards of Practice (ASOPs) 27, Selection of Economic Assumptions for Measuring Pension
Obligations, and 35, Selection of Demographic and Other Noneconomic Assumptions for Measuring
Pension Obligations, provide a framework for the selection of assumptions. They state that each
assumption selected by an actuary must be “reasonable,” where reasonable is defined as being
appropriate for the purpose, reflects the actuary’s professional judgement, takes into account historical
and current data, as well as future expectations, and has no significant bias. The ASOPs also recognize
that “different actuaries will apply different professional judgement” such that a “range of reasonable
assumptions may develop.”
As was noted previously, for the Plan, the single largest increase in UAAL over the past 10 years was due
to investment returns lower than the assumed rate of return, and the potential for this trend to
continue is one of the largest concerns moving forward. In addition, the amortization period calculation
for a fixed-rate plan is highly sensitive to the selection of an assumed rate of payroll growth. The
development of both of these assumptions relies first on the selection of the inflation assumption. While
there are approaches to selecting the investment return assumption other than the traditional “building
block” approach, the Governmental Accounting Standards Board’s reporting requirements implicitly
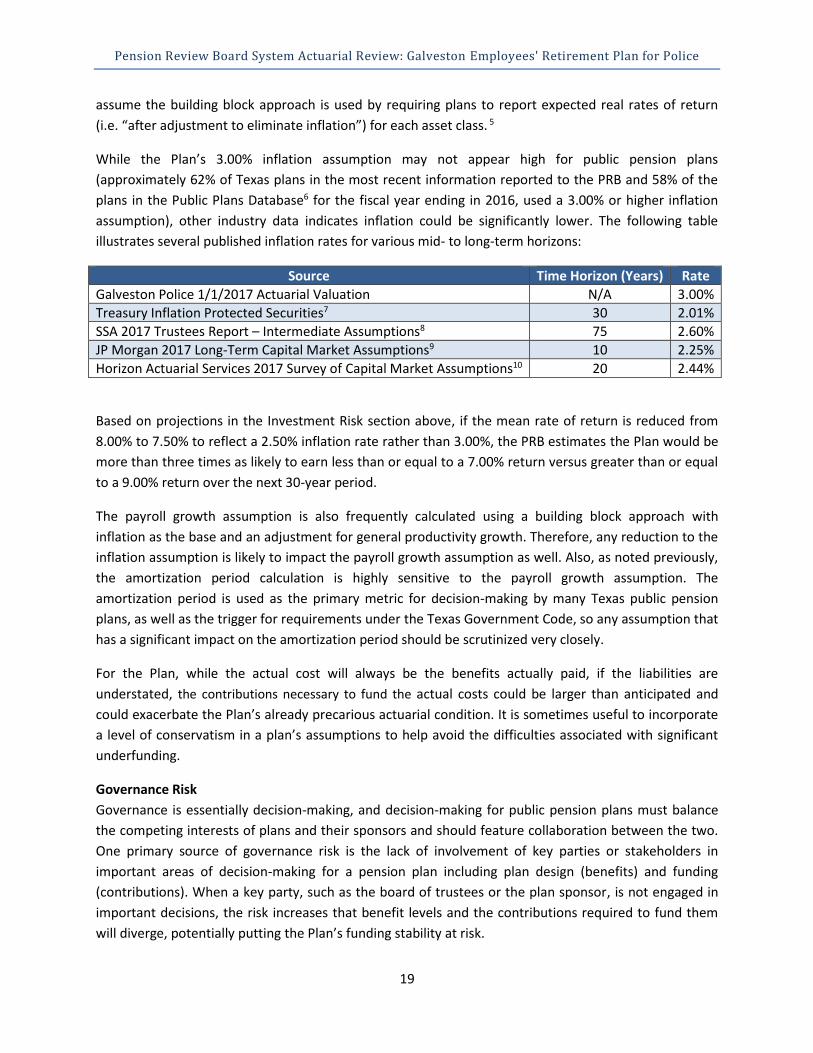
Pension Review Board System Actuarial Review: Galveston Employees' Retirement Plan for Police
19
assume the building block approach is used by requiring plans to report expected real rates of return
(i.e. “after adjustment to eliminate inflation”) for each asset class. 5
While the Plan’s 3.00% inflation assumption may not appear high for public pension plans
(approximately 62% of Texas plans in the most recent information reported to the PRB and 58% of the
plans in the Public Plans Database6 for the fiscal year ending in 2016, used a 3.00% or higher inflation
assumption), other industry data indicates inflation could be significantly lower. The following table
illustrates several published inflation rates for various mid- to long-term horizons:
Source Time Horizon (Years) Rate
Galveston Police 1/1/2017 Actuarial Valuation N/A 3.00%
Treasury Inflation Protected Securities7 30 2.01%
SSA 2017 Trustees Report – Intermediate Assumptions8 75 2.60%
JP Morgan 2017 Long-Term Capital Market Assumptions9 10 2.25%
Horizon Actuarial Services 2017 Survey of Capital Market Assumptions10 20 2.44%
Based on projections in the Investment Risk section above, if the mean rate of return is reduced from
8.00% to 7.50% to reflect a 2.50% inflation rate rather than 3.00%, the PRB estimates the Plan would be
more than three times as likely to earn less than or equal to a 7.00% return versus greater than or equal
to a 9.00% return over the next 30-year period.
The payroll growth assumption is also frequently calculated using a building block approach with
inflation as the base and an adjustment for general productivity growth. Therefore, any reduction to the
inflation assumption is likely to impact the payroll growth assumption as well. Also, as noted previously,
the amortization period calculation is highly sensitive to the payroll growth assumption. The
amortization period is used as the primary metric for decision-making by many Texas public pension
plans, as well as the trigger for requirements under the Texas Government Code, so any assumption that
has a significant impact on the amortization period should be scrutinized very closely.
For the Plan, while the actual cost will always be the benefits actually paid, if the liabilities are
understated, the contributions necessary to fund the actual costs could be larger than anticipated and
could exacerbate the Plan’s already precarious actuarial condition. It is sometimes useful to incorporate
a level of conservatism in a plan’s assumptions to help avoid the difficulties associated with significant
underfunding.
Governance Risk
Governance is essentially decision-making, and decision-making for public pension plans must balance
the competing interests of plans and their sponsors and should feature collaboration between the two.
One primary source of governance risk is the lack of involvement of key parties or stakeholders in
important areas of decision-making for a pension plan including plan design (benefits) and funding
(contributions). When a key party, such as the board of trustees or the plan sponsor, is not engaged in
important decisions, the risk increases that benefit levels and the contributions required to fund them
will diverge, potentially putting the Plan’s funding stability at risk.
Pension Review Board System Actuarial Review: Galveston Employees' Retirement Plan for Police
20
For example, under the Plan’s governing statute, the board has power to make decisions to modify plan
benefits with the approval of at least four board members as long as any benefit increase is also
approved by a majority vote of plan members. Although jointly responsible for funding the retirement
plan along with plan members, the sponsoring city may have limited involvement in benefit decision-
making, a structure which generates the risk that benefit levels adopted could be unsustainable. While
Galveston Police has not made any benefit increases and instead has made a minor benefit reduction for
future employees, this potential risk remains in the future, given the statutory structure.
Benefit increases are not the only potential risk related to a potential lack of sponsor involvement under
the Plan’s governing law; unwillingness to reduce benefits prospectively when necessary to address
funding challenges can be an obstacle to getting things back on track. It should be noted that even plans
with very engaged boards and sponsors can be susceptible to increasing benefits to unsustainable levels
in good times or failing to lower them when necessary in bad times. Governance risk related to an
imbalance in decision-making can only exacerbate these risks. Governance risk must also be managed
on the contribution side, with both parties working together to provide sufficient contributions and to
avoid lowering contributions in good times.
State law recognizes these risks and imposes cooperation between the system and sponsoring
governmental entity by requiring retirement systems having trouble meeting their long-term obligations
to work with their sponsors to develop a restoration plan for addressing those issues.11 This framework
helps ensure that both the system and its sponsoring employer are involved in pension plan reform
decisions, but it comes at a point when actuarial health is already threatened. Through the FSRP
process, the City made a contribution increase and Galveston Police made a change to plan vesting in
response to deteriorating conditions, but these changes have not been enough to put the Plan on a solid
path to sustainability.
Conclusions
Funding and Governance Risk
When retirement systems and their sponsors wait too long to address them, the funding challenges
compounding over time can reach a point where small, incremental improvements such as those made
for Galveston Police simply do not have enough effect to achieve sustainability. Even though required by
state law to jointly formulate an FSRP, Galveston Police and the City have yet to make difficult decisions
on needed changes to benefit or contribution levels. If necessary changes are ultimately made, they will
certainly right the ship, but they will be made under less than ideal conditions.
Thus, another model is called for. Plans and their sponsors can develop policies that proactively manage
risk in the future by laying out a formal risk-sharing plan in advance. To proactively manage governance
and funding risk, retirement plans and their sponsors should work together to adopt written policies far
in advance, before they incur adverse experience, that can guide them through both good and bad years
and to shield against the risk of either party’s exclusion or disengagement from decision-making.
Funding and benefit policies can be adopted that provide a framework for how benefit and contribution
levels may be modified under different conditions. An advantage of such policies is that changes to plan

Pension Review Board System Actuarial Review: Galveston Employees' Retirement Plan for Police
21
benefits and costs are known and understood by all parties in advance, rather than negotiated under
difficult circumstances.
A strong funding policy that ensures a healthy amortization period is maintained by requiring payment
of an actuarially determined contribution is encouraged. Numerous actuarial methods can be utilized to
help mitigate contribution volatility, including directly smoothing contribution rates or adding
“guardrails” that require the stakeholders to come back to the table if the contribution rate falls outside
a specified range. If funding according to an actuarially determined contribution is not adopted, a
funding and benefit policy should, at a minimum, codify how adverse experience will be addressed and
how future changes will be made.
For example, a funding policy might state that future benefit enhancements, cost of living adjustments,
and/or contribution rate reductions can only be considered or made if the system’s funded ratio
remains greater than a particular threshold. A funding policy can also state that if the funded ratio falls
below a certain threshold, the stakeholders would be required to come back to the table to make
necessary contribution and benefit adjustments. Galveston Police in conjunction with the City can
consider utilizing the FSRP requirement to develop a long-term funding policy for the Plan.
Assumption Risk
Public retirement systems must monitor actuarial assumptions continually through their actuarial
valuations and make appropriate adjustments to mitigate bias in the assumptions that result in
consistent actuarial gains or losses. Actuarial gains and losses occur when the Plan’s actual experience
does not match expected experience. Over time, without required changes, pension funds such as
Galveston Police whose assumptions consistently diverge from actual experience in the same direction
(i.e. consistently seeing actuarial gains or consistently seeing actuarial losses) can exacerbate the issue
of intergenerational inequity, causing one group of members and taxpayers to over- or under-pay.
Boards of trustees should work with their actuaries to ensure assumptions are neither too aggressive
nor too conservative, while striving to maintain (or achieve) sound fiscal health to secure existing
accrued benefits. PRB’s Pension Funding Guidelines recommend systems to monitor, review, and report
the impact of actual plan experience on actuarial assumptions at least once every five years.
Investment Risk
Whatever the investment return assumption used, investment returns should be closely monitored, and
investment managers’ performance should be assessed regularly and compared to appropriate asset
class benchmarks. Benchmarks should be reviewed to see if they have been met or exceeded, and
should be viewed in light of the risk taken to achieve those returns. Best practices also include revisiting
investment manager selection periodically, with boards of trustees evaluating managers’ performance,
fees, and whether their current managers are providing the highest possible value at the lowest possible
cost. The asset allocation should also be assessed from a risk perspective to provide insight into whether
the Plan could weather a market correction.
.

Pension Review Board System Actuarial Review: Galveston Employees' Retirement Plan for Police
22
1 The theoretical minimum threshold, or actuarially determined contribution (ADC), is a target or recommended contribution “to the plan as determined by the actuary using a contribution allocation procedure,” as defined in Actuarial Standards of Practice No 4. If contributions to the plan are made as a fixed rate based on statutory or contractual requirements, the ADC for this purpose is the contribution needed to fund the benefits accrued in the current year and maintain an amortization period that does not exceed 30 years, as required to be reported under Texas Government Code §802.101(a).
2 https://www.ccactuaries.org/Portals/0/pdf/CCA_PPC_White_Paper_on_Public_Pension_Funding_Policy.pdf
3 1/1/2017 assets and liabilities reflect the actuarial accrued liabilities, actuarial value of assets, plan provisions, and actuarial assumptions and methods as reported in the 1/1/2017 Actuarial Valuation prepared by Retirement Horizons, Inc. (RHI). Projected liabilities and assets beginning 1/1/2018 reflect the same plan provisions and actuarial assumptions and methods except for a reduction in discount rate to 7.50% and an update to the mortality assumption to the RP-2014 Blue Collar Mortality tables adjusted backward to 2006 with Scale MP-2014 and projected with Scale MP-2016, to reflect changes adopted for the 1/1/2018 actuarial valuation. RHI estimates these changes will increase total normal cost to 11.09% and actuarial accrued liability by 4.8%. Total projected benefit payments were provided by RHI taking into account the updated assumptions.
4 http://www.rockinst.org/pdf/government_finance/2017-02-01-Risk_Taking_Appropriateness.pdf
5 Governmental Accounting Standards Board Statement No. 67, Financial Reporting for Pension Plans, p. 30.
6 http://publicplansdata.org/
7 https://fred.stlouisfed.org/
8 https://www.ssa.gov/oact/TR/2017/2017_Long-Range_Economic_Assumptions.pdf
9 https://am.jpmorgan.com/us/institutional/our-thinking/ltcma-2017
10 http://www.horizonactuarial.com/blog/2017-survey-of-capital-market-assumptions
11 Texas Government Code 802.2015 and 802.2016 require public retirement systems whose amortization period exceeds 40 years for 2 or 3 consecutive actuarial valuations to develop, with their sponsor, a funding soundness restoration plan designed to bring their amortization period within 40 years over 10 or fewer years.

I
Appendix A – Peer Comparison Tables

Galveston Police - Peer Comparison Tables
Peer Group Plans MVA Assumed Interest
Payroll Growth
10-year return (Net)
Active/ Annuitants
UAAL % of
Payroll Average Benefit
30-year Shortfall % of GFE
30-year Shortfall % of ADC NPL
Total Expenses
Expenses as %
of Assets
Big Spring Fire $ 11,157,022 8.00% 5.00% 4.26%
1.27 248.61% $ 37,713 N/A N/A $ 9,713,127 $ 100,927 0.90%
Greenville Fire $ 12,728,162 8.00% 4.00% 4.23%
0.79 387.00% $ 24,101 0.97% 22.04% $16,709,548 $ 125,356 0.98%
Waxahachie Fire $ 14,201,159 7.00% 4.00% 4.90%
1.77 164.84% $ 43,297 N/A N/A $ 7,039,421 $ 164,077 1.16%
Lufkin Fire $ 14,264,481 7.50% 3.00% 3.30%
1.23 371.24% $ 35,666 0.29% 7.99% $20,444,874 $ 124,925 0.88%
Denison Fire $ 15,214,736 7.75% 4.00% 3.87%
1.04 182.33% $ 25,498 N/A N/A $ 7,048,420 $ 107,168 0.70%
Texas City Fire $ 15,837,081 7.75% 3.00% 3.56%
1.27 289.35% $ 35,686 N/A N/A $17,061,992 $ 182,033 1.15%
Galveston Police $ 19,784,817 8.00% 3.50% 3.64%
1.01 278.19% $ 27,018 0.67% 18.59% $30,568,642 $ 204,875 1.04%
Conroe Fire $ 20,275,833 7.75% 4.00% 2.84%
3.83 167.60% $ 40,585 0.16%* 7.86% $19,202,262 $ 196,542 0.97%
Cleburne Fire $ 21,323,149 7.25% 3.25% 5.64% 1.89 277.79% $ 36,625 N/A N/A $ 12,363,227 $ 127,066 0.60%
Harlingen Fire $ 27,704,447 8.00% 3.50% 5.46%
1.43 246.71% $ 25,706 1.35% 38.07% $38,003,230 $ 168,246 0.61%
Texarkana Fire $ 31,777,180 7.75% 3.25% 5.27%
1.15 118.93% $ 26,740 N/A N/A $ 7,275,575 $ 267,783 0.84%
Killeen Fire $ 35,342,830 7.75% 3.25% 4.01%
3.35 114.49% $ 26,930 N/A N/A $21,110,703 $ 144,782 0.41%
Galveston Fire $ 40,155,474 7.75% 3.00% 3.74%
1.26 257.06% $ 28,238 1.38% 36.33% $25,178,930 $ 266,065 0.66%
Galveston Employee
$ 45,640,194 7.25% 3.00% 4.62%
1.53 56.65% $ 7,683 N/A N/A $15,449,446 $ 285,202 0.62%
Peer Group Plans* Sponsor GF Expend EOY GF Bal General
Obligation Debt UAAL
Expected Employer
Contributions ADC 30-year Shortfall
30-year Shortfall % of ADC
30-year Shortfall
% of GFE
Lufkin Fire Lufkin $32,591,960 $10,480,400 $56,600,000 $17,317,158 $1,100,728 $1,196,291 $95,563 7.99% 0.29%
Galveston Police Galveston $45,814,068 $20,659,210 $28,005,000 $27,075,738 $1,340,681 $1,646,853 $306,172 18.59% 0.67%
Conroe Fire** Conroe $64,298,794 $28,651,695 $40,365,000 $13,667,395 $1,223,183 $1,327,561 $104,378 7.86% 0.16%
Harlingen Fire Harlingen $38,946,292 $16,715,032 $28,875,000 $16,187,406 $852,970 $1,377,219 $524,249 38.07% 1.35%
Galveston Fire Galveston $45,814,068 $20,659,210 $28,005,000 $20,353,268 $1,108,487 $1,741,116 $632,629 36.33% 1.38%
*Only includes plans with 30-year contribution shortfalls
**Based on a 25-year amortization period shortfall, not a 30-year

II
Appendix B – Comments from Galveston Employees'
Retirement Plan for Police
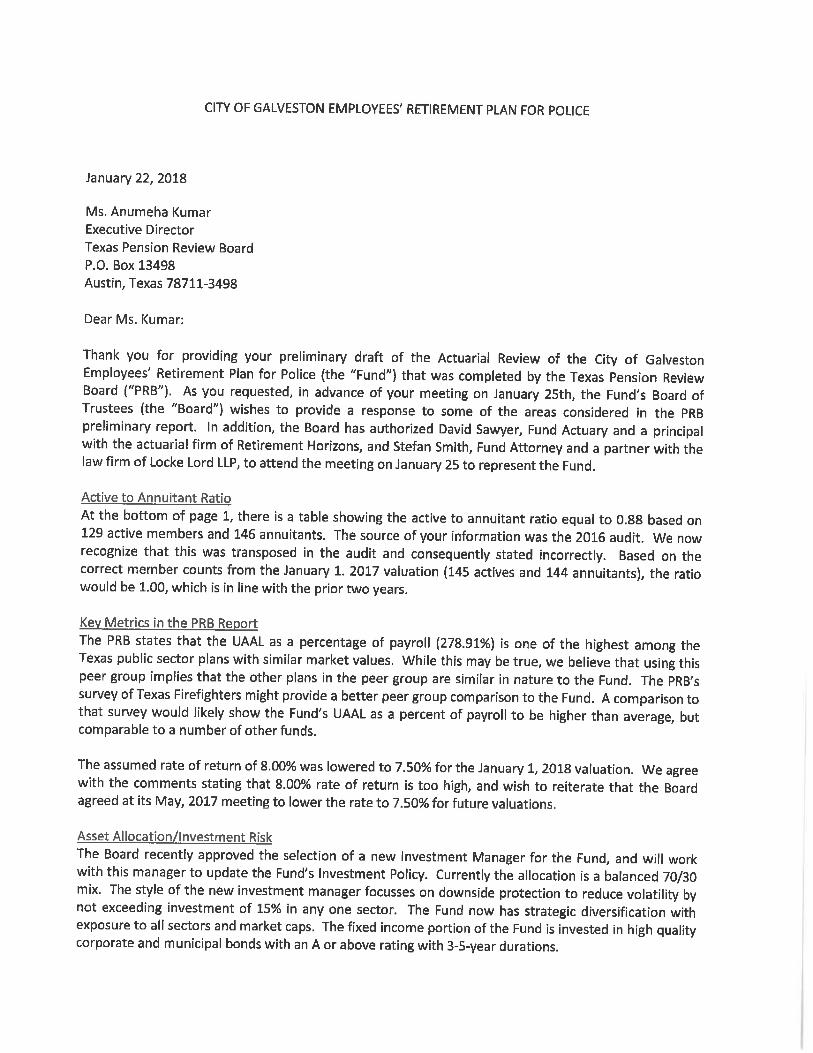


III
Appendix C – Comments from the City of Galveston


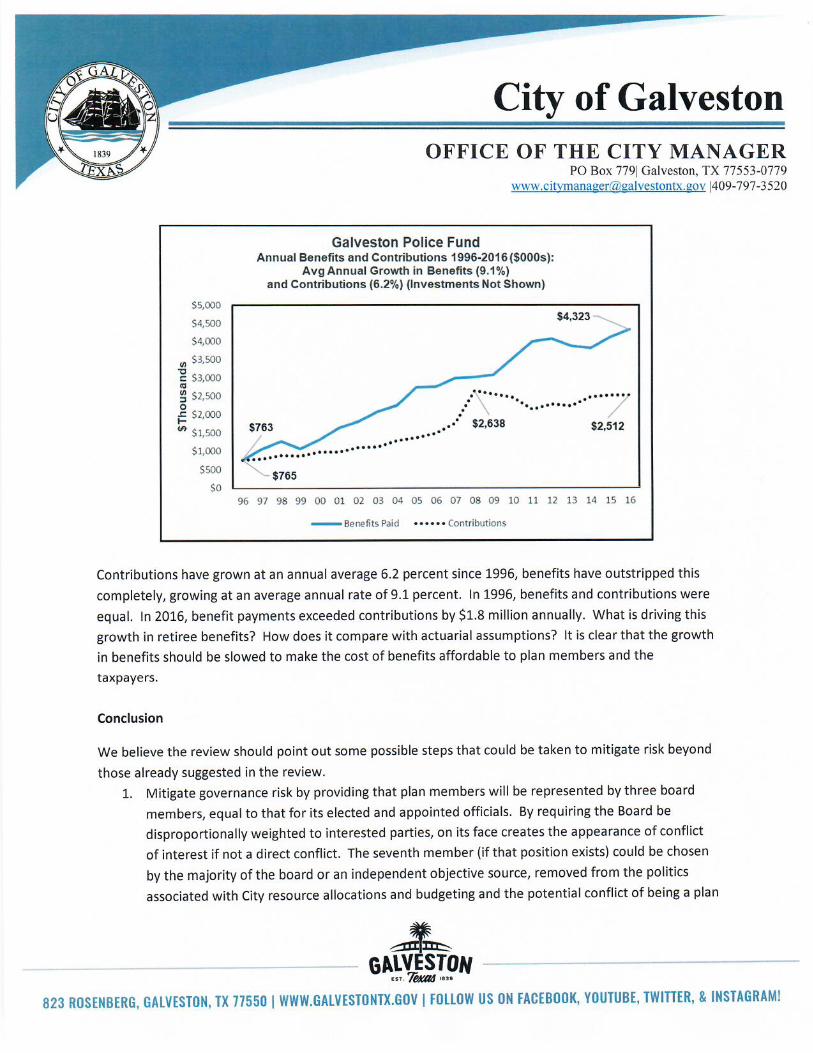

Texas Pension Review Board
2017-2018 Biennial Report
II
APPENDIX A2 – INTENSIVE ACTUARIAL REVIEW – GREENVILLE
FIREMEN'S RELIEF AND RETIREMENT FUND

Intensive Actuarial Review: Greenville Firemen’s Relief and Retirement Fund
January 2018

Intensive Actuarial Review: Greenville Firemen’s Relief and Retirement Fund
Table of Contents Executive Summary ....................................................................................................................................... 1
Background ................................................................................................................................................... 4
Plan Summary ........................................................................................................................................... 4
Benefits ..................................................................................................................................................... 4
Contributions ............................................................................................................................................ 4
Membership .............................................................................................................................................. 4
TLFFRA Board Structure ............................................................................................................................ 4
Contribution and Benefit Decision-Making .............................................................................................. 4
Funding Soundness Restoration Plan (FSRP) ............................................................................................ 5
Key Metrics ............................................................................................................................................... 5
Historical Trends ........................................................................................................................................... 8
Assets and Liabilities ................................................................................................................................. 8
Investment Assumption and Returns ....................................................................................................... 9
Contributions .......................................................................................................................................... 10
Asset Allocation....................................................................................................................................... 11
Payroll Growth ........................................................................................................................................ 11
Cash Flow ................................................................................................................................................ 12
Demographics ......................................................................................................................................... 12
Retroactive DROP .................................................................................................................................... 14
Risk Analysis ................................................................................................................................................ 14
Investment Risk ....................................................................................................................................... 15
Funding Risk ............................................................................................................................................ 16
Assumption Risk ...................................................................................................................................... 18
Governance Risk...................................................................................................................................... 19
Conclusions ................................................................................................................................................. 20
Funding and Governance Risk ................................................................................................................. 20
Assumption Risk ...................................................................................................................................... 21
Investment Risk ....................................................................................................................................... 21
Appendix A – Peer Comparison Tables .......................................................................................................... I
Appendix B – Comments from the City of Greenville ................................................................................... II
Appendix C – Comments from Greenville Firemen's Relief and Retirement Fund...................................... III

Intensive Actuarial Review: Greenville Firemen’s Relief and Retirement Fund
1
Executive Summary
This intensive actuarial review of Greenville Firemen’s Relief and Retirement Fund (“Greenville Fire” or “the
Fund) is intended to assist the Fund’s board of trustees and the City of Greenville (the City) in assessing the
Fund’s ability to meet its long-term pension obligation. Overall, the review shows that the Fund is facing
significant financial stress and is taking considerable risks in its approach to funding the plan. The review also
highlights that Greenville Fire and the City have waited too long to address these challenges, which has
exacerbated the situation due to the compound nature of pension liabilities.
Since the start of this review in October 2017, City has agreed to increase its contribution rate by 2%
beginning in October 2018. The Fund’s actuary estimates that this increase in contribution would lower the
Fund’s amortization period to 38 years as of the 12/31/2016. The PRB’s Actuarial Committee expressed
ongoing concern regarding the likelihood of the Fund meeting the assumptions used to fund the plan. The
Pension Review Board (PRB) encourages the Fund and the City to review the findings and conclusions of this
report carefully and jointly adopt a forward-looking funding plan to guide the Fund towards a path of long-
term sustainability. The PRB can provide technical assistance in formulating such a plan.
The health of Greenville Fire has been deteriorating since the early 2000s. Numerous factors have
contributed to this deterioration, including inadequate contributions, insufficient investment returns,
increased benefit payments, and a low active-to-annuitant ratio in the face of a large unfunded liability.
Greenville Fire and the City have made incremental contribution increases since 2006 in response to
deteriorating conditions, but these changes have not been enough to put the plan on a solid path to
sustainability.
Currently, Greenville Fire’s ability to meet its long-term obligations, measured by a number of indicators in
addition to amortization period, may be threatened and warrants closer scrutiny. A few of the key indicators
include:
At 55 years, Greenville Fire currently has one of the highest amortization periods (the number of
years required to pay off any unfunded liability) of all 94 defined benefit pension plans in Texas.1
Greenville Fire’s funded ratio (assets on hand to cover liabilities) fell from 77% in 2000 to less than
48% in 2016, which is one of the lowest funded ratios in the state.
Greenville Fire’s actuarial accrued liability increased by nearly 90% between the end of 2000 and
2016. Conversely, the Fund’s actuarial value of assets grew by less than 18% over that same period,
resulting in the unfunded liability more than quadrupling.
The single largest increase in unfunded liability over the past 15 years was due to investment returns
lower than the assumed rate of return.
While Greenville Fire lowered its assumed rate of return from 8.25% to 8.00% in 2016, 8.00% is one
of the highest return assumptions currently used by plans in Texas. The Fund has not achieved an
8.00% return on assets over a consecutive 10-year period in any of the 13 periods ending December
31, 2004 through December 31, 2016.
According to its actuarial valuations, Greenville Fire has underpaid its reported actuarially
determined contribution (ADC) every year since 2004.2
1 PRB’s Pension Funding Guidelines recommend a maximum effective amortization period of 30 years, with 10-25 a more
preferable target range.
Intensive Actuarial Review: Greenville Firemen’s Relief and Retirement Fund
2
Greenville Fire’s unfunded liability as a percent of payroll, which measures pension debt relative to
overall personnel costs and provides information on the employer’s fiscal burden, is the highest
among TLFFRA firefighter plans of similar asset size at 387.00%.
As of 2016, the present value of benefits payable to inactive members (retirees and beneficiaries) were only
74% funded and the liability associated with active members was completely unfunded. While not all inactive
benefits are payable immediately, the intent of pre-funding a defined benefit plan is to pay the cost of the
benefit as it is earned such that an individual’s benefits are fully funded when they retire. The review
measures Greenville Fire based on four main risk factors—investment, funding, assumption, and governance
risk— and reveal a significant amount of risk being taken in each of these areas, increasing the probability of
a continued period of severe financial stress for the Fund. This also raises the likelihood of deteriorating
funding conditions in the coming years, further imperiling the Fund’s ability to pay promised benefits. Key
findings related to these risks include:
The likelihood of Greenville Fire not meeting or exceeding the 8.00% expected return on assets is
significantly greater than the odds that they will do so for the near future. The PRB estimated the
Fund would be more than twice as likely to earn less than or equal to a 7.00% return versus greater
than or equal to a 9.00% return over the next 30-year period.
The Fund, along with many public pension plans, could suffer from large losses in a down market
year, given its overall portfolio risk.
Several of the Fund’s economic and demographic assumptions, including the expected return on
assets, may cause liabilities to be understated. While the Fund’s actual cost will always be the
benefits actually paid, if the liabilities are understated, the contributions necessary to fund the actual
costs could be larger than anticipated and could exacerbate the Fund’s already precarious actuarial
condition. The Fund’s contributions are calculated as a percent of active members’ pay and are back-
loaded based on the expected growth in total payroll. If payroll does not increase at this rate, actual
contributions will not meet those expected in the Fund’s actuarial valuations. Given the plan’s
inactive and active liabilities are not fully funded; contributions below expected levels will have
serious consequences on the Fund’s long-term solvency.
Greenville Fire’s fixed-rate contribution structure may provide budgetary stability for the employer
in the short term, but does not include any inherent mechanisms for reacting to changes in a plan’s
financial condition.
As required by state law to jointly formulate a funding soundness restoration plan, the City has
agreed to increase its contribution rate to 19.30% beginning in October 2018; however, Greenville
Fire and the City have yet to make difficult decisions on additional needed changes to benefit or
contribution levels to address potential investment and funding risks in the future.
Finally, the review draws conclusions regarding how these risks might be mitigated and the Fund’s overall
ability to meet its long-term obligations improved. Conclusions include the following:
Greenville Fire, in conjunction with the City, should consider utilizing the funding soundness
restoration plan (FSRP) requirement to develop a long-term funding policy for the Fund.
2 For a pension plan that receives a fixed contribution rate such as Greenville Fire, the ADC is the contribution needed to fund
the benefits accrued in the current year and maintain an amortization period that does not exceed 30 years, as required to be reported under Texas Government Code §802.101(a).

Intensive Actuarial Review: Greenville Firemen’s Relief and Retirement Fund
3
Greenville Fire’s board of trustees should work with their actuary to ensure actuarial assumptions
are neither too aggressive nor too conservative.
Greenville Fire’s board of trustees should closely monitor investment managers’ performance against
appropriate benchmarks, and should revisit investment manager selection periodically to ensure
managers are providing the highest possible value at the lowest possible cost. Asset allocation
should also be assessed from a risk perspective to evaluate how the fund would weather a market
correction.
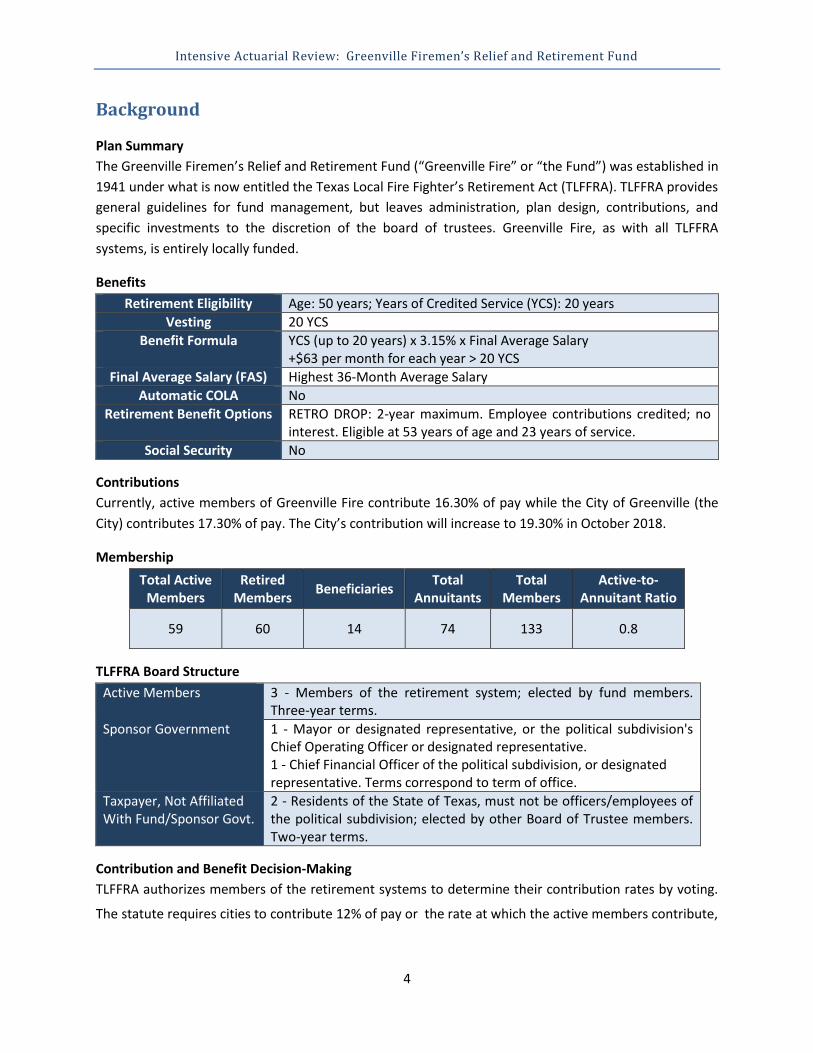
Intensive Actuarial Review: Greenville Firemen’s Relief and Retirement Fund
4
Background
Plan Summary
The Greenville Firemen’s Relief and Retirement Fund (“Greenville Fire” or “the Fund”) was established in
1941 under what is now entitled the Texas Local Fire Fighter’s Retirement Act (TLFFRA). TLFFRA provides
general guidelines for fund management, but leaves administration, plan design, contributions, and
specific investments to the discretion of the board of trustees. Greenville Fire, as with all TLFFRA
systems, is entirely locally funded.
Benefits
Retirement Eligibility Age: 50 years; Years of Credited Service (YCS): 20 years
Vesting 20 YCS
Benefit Formula YCS (up to 20 years) x 3.15% x Final Average Salary +$63 per month for each year > 20 YCS
Final Average Salary (FAS) Highest 36-Month Average Salary
Automatic COLA No
Retirement Benefit Options RETRO DROP: 2-year maximum. Employee contributions credited; no interest. Eligible at 53 years of age and 23 years of service.
Social Security No
Contributions
Currently, active members of Greenville Fire contribute 16.30% of pay while the City of Greenville (the
City) contributes 17.30% of pay. The City’s contribution will increase to 19.30% in October 2018.
Membership
Total Active Members
Retired Members
Beneficiaries Total
Annuitants Total
Members Active-to-
Annuitant Ratio
59 60 14 74 133 0.8
TLFFRA Board Structure
Active Members 3 - Members of the retirement system; elected by fund members. Three-year terms.
Sponsor Government 1 - Mayor or designated representative, or the political subdivision's Chief Operating Officer or designated representative. 1 - Chief Financial Officer of the political subdivision, or designated representative. Terms correspond to term of office.
Taxpayer, Not Affiliated With Fund/Sponsor Govt.
2 - Residents of the State of Texas, must not be officers/employees of the political subdivision; elected by other Board of Trustee members. Two-year terms.
Contribution and Benefit Decision-Making
TLFFRA authorizes members of the retirement systems to determine their contribution rates by voting.
The statute requires cities to contribute 12% of pay or the rate at which the active members contribute,
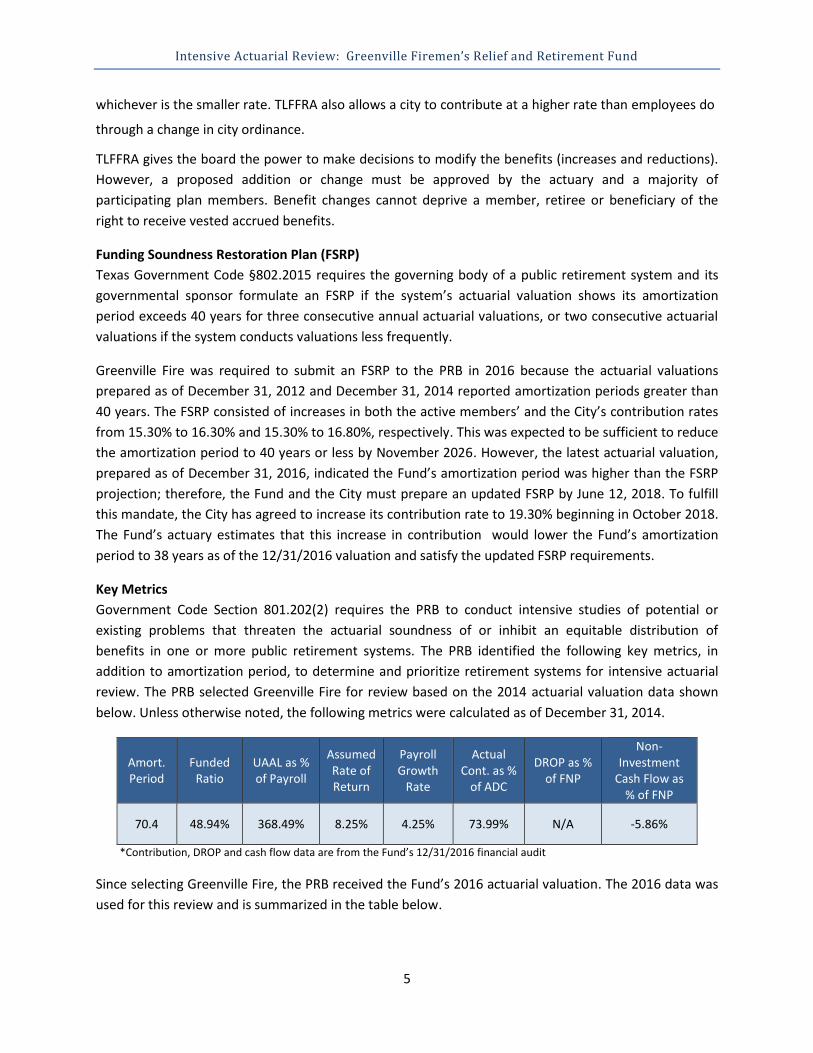
Intensive Actuarial Review: Greenville Firemen’s Relief and Retirement Fund
5
whichever is the smaller rate. TLFFRA also allows a city to contribute at a higher rate than employees do
through a change in city ordinance.
TLFFRA gives the board the power to make decisions to modify the benefits (increases and reductions).
However, a proposed addition or change must be approved by the actuary and a majority of
participating plan members. Benefit changes cannot deprive a member, retiree or beneficiary of the
right to receive vested accrued benefits.
Funding Soundness Restoration Plan (FSRP)
Texas Government Code §802.2015 requires the governing body of a public retirement system and its
governmental sponsor formulate an FSRP if the system’s actuarial valuation shows its amortization
period exceeds 40 years for three consecutive annual actuarial valuations, or two consecutive actuarial
valuations if the system conducts valuations less frequently.
Greenville Fire was required to submit an FSRP to the PRB in 2016 because the actuarial valuations
prepared as of December 31, 2012 and December 31, 2014 reported amortization periods greater than
40 years. The FSRP consisted of increases in both the active members’ and the City’s contribution rates
from 15.30% to 16.30% and 15.30% to 16.80%, respectively. This was expected to be sufficient to reduce
the amortization period to 40 years or less by November 2026. However, the latest actuarial valuation,
prepared as of December 31, 2016, indicated the Fund’s amortization period was higher than the FSRP
projection; therefore, the Fund and the City must prepare an updated FSRP by June 12, 2018. To fulfill
this mandate, the City has agreed to increase its contribution rate to 19.30% beginning in October 2018.
The Fund’s actuary estimates that this increase in contribution would lower the Fund’s amortization
period to 38 years as of the 12/31/2016 valuation and satisfy the updated FSRP requirements.
Key Metrics
Government Code Section 801.202(2) requires the PRB to conduct intensive studies of potential or
existing problems that threaten the actuarial soundness of or inhibit an equitable distribution of
benefits in one or more public retirement systems. The PRB identified the following key metrics, in
addition to amortization period, to determine and prioritize retirement systems for intensive actuarial
review. The PRB selected Greenville Fire for review based on the 2014 actuarial valuation data shown
below. Unless otherwise noted, the following metrics were calculated as of December 31, 2014.
Amort. Period
Funded Ratio
UAAL as % of Payroll
Assumed Rate of Return
Payroll Growth
Rate
Actual Cont. as %
of ADC
DROP as % of FNP
Non-Investment
Cash Flow as % of FNP
70.4 48.94% 368.49% 8.25% 4.25% 73.99% N/A -5.86%
*Contribution, DROP and cash flow data are from the Fund’s 12/31/2016 financial audit
Since selecting Greenville Fire, the PRB received the Fund’s 2016 actuarial valuation. The 2016 data was
used for this review and is summarized in the table below.

Intensive Actuarial Review: Greenville Firemen’s Relief and Retirement Fund
6
Amort. Period
Funded Ratio
UAAL as % of Payroll
Assumed Rate of Return
Payroll Growth
Rate
Actual Cont. as %
of ADC
DROP as % of FNP
Non-Investment
Cash Flow as % of FNP
55.0 47.69% 387.00% 8.00% 4.00% 73.99% N/A -5.86%
*Contribution, DROP and cash flow data are from the Fund’s 12/31/2016 financial audit
Metric Amortization period (55 years)
What it measures
Approximately how long it would take to fully fund the unfunded actuarial accrued liability (UAAL) based on the current funding policy.
Why it is important
Given the Fund’s current assumptions, an amortization period above 17 indicates the contributions to the fund in the coming year are less than the interest accumulated for that same period and therefore the total UAAL is expected to grow over the near term. In addition, for a plan that contributes on a fixed-rate basis such as Greenville Fire, the higher the amortization period, the more sensitive it is to small changes in the UAAL.
Peer Comparison
Greenville Fire currently has one of the highest amortization periods of all defined benefit pension plans in Texas.
Metric
Funded ratio (47.69%)
What it measures
The percent of a fund’s actuarially accrued liabilities covered by its actuarial value of assets.
Why it is important
The lower the funded ratio, the fewer assets a fund has to pay its current and future benefit payments. Also, the present value of benefits payable to members who are no longer working (i.e. retirees and their beneficiaries) are not fully funded. Only 74% of the inactive liability is funded on an actuarial basis, leaving almost $5 million in inactive liability. All of the more than $10 million of active liability was completely unfunded as of December 31, 2016 and therefore is dependent on future contributions and investment returns.
Peer Comparison
Greenville Fire’s funded ratio is one of the lowest in the state.
Metric UAAL as a percent of payroll (387.00%)
What it measures
The size of a plan’s unfunded liability compared to the annual payroll of its active members.
Why it is important
Provides a way to compare plans of various sizes and expresses the outstanding “pension debt” relative to current personnel costs.
Peer comparison
The Fund’s UAAL as a percent of payroll is the highest among TLFFRA plans of similar asset size and one of the highest in the state.
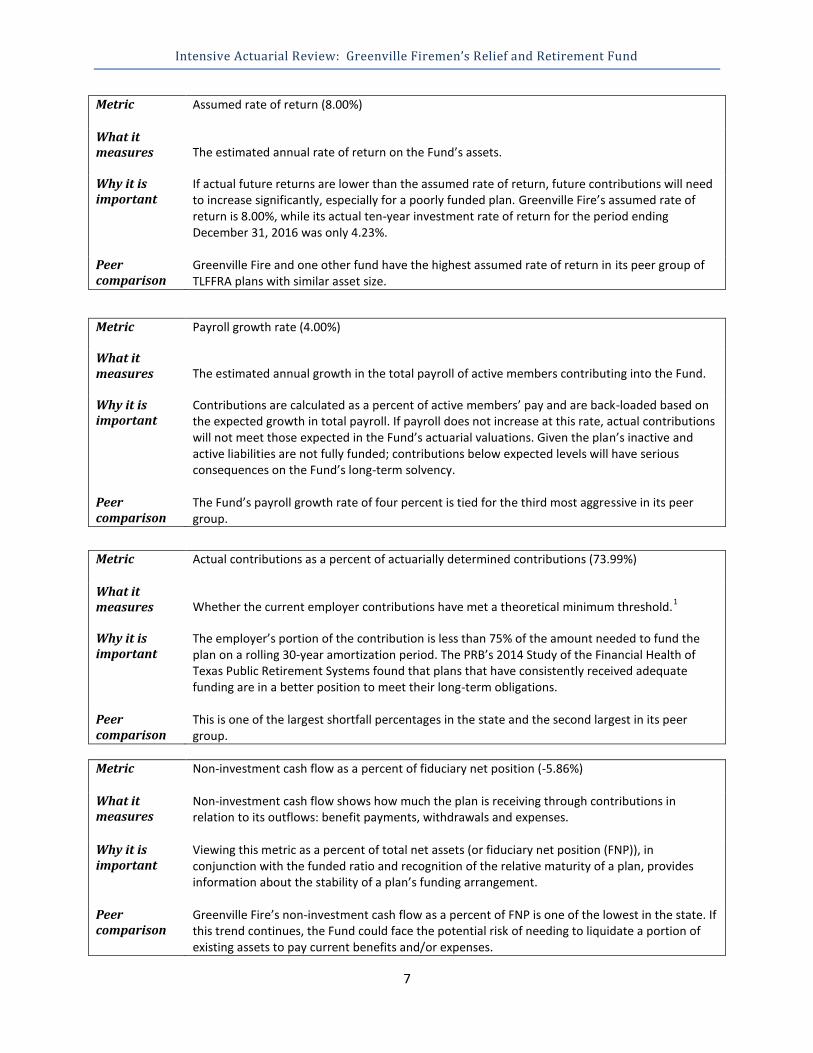
Intensive Actuarial Review: Greenville Firemen’s Relief and Retirement Fund
7
Metric Assumed rate of return (8.00%)
What it measures
The estimated annual rate of return on the Fund’s assets.
Why it is important
If actual future returns are lower than the assumed rate of return, future contributions will need to increase significantly, especially for a poorly funded plan. Greenville Fire’s assumed rate of return is 8.00%, while its actual ten-year investment rate of return for the period ending December 31, 2016 was only 4.23%.
Peer comparison
Greenville Fire and one other fund have the highest assumed rate of return in its peer group of TLFFRA plans with similar asset size.
Metric
Payroll growth rate (4.00%)
What it measures
The estimated annual growth in the total payroll of active members contributing into the Fund.
Why it is important
Contributions are calculated as a percent of active members’ pay and are back-loaded based on the expected growth in total payroll. If payroll does not increase at this rate, actual contributions will not meet those expected in the Fund’s actuarial valuations. Given the plan’s inactive and active liabilities are not fully funded; contributions below expected levels will have serious consequences on the Fund’s long-term solvency.
Peer comparison
The Fund’s payroll growth rate of four percent is tied for the third most aggressive in its peer group.
Metric Actual contributions as a percent of actuarially determined contributions (73.99%)
What it measures
Whether the current employer contributions have met a theoretical minimum threshold.1
Why it is important
The employer’s portion of the contribution is less than 75% of the amount needed to fund the plan on a rolling 30-year amortization period. The PRB’s 2014 Study of the Financial Health of Texas Public Retirement Systems found that plans that have consistently received adequate funding are in a better position to meet their long-term obligations.
Peer comparison
This is one of the largest shortfall percentages in the state and the second largest in its peer group.
Metric Non-investment cash flow as a percent of fiduciary net position (-5.86%)
What it measures
Non-investment cash flow shows how much the plan is receiving through contributions in relation to its outflows: benefit payments, withdrawals and expenses.
Why it is important
Viewing this metric as a percent of total net assets (or fiduciary net position (FNP)), in conjunction with the funded ratio and recognition of the relative maturity of a plan, provides information about the stability of a plan’s funding arrangement.
Peer comparison
Greenville Fire’s non-investment cash flow as a percent of FNP is one of the lowest in the state. If this trend continues, the Fund could face the potential risk of needing to liquidate a portion of existing assets to pay current benefits and/or expenses.

Intensive Actuarial Review: Greenville Firemen’s Relief and Retirement Fund
8
Historical Trends
To conduct an intensive review of risks associated with the long-term funding of a pension plan, it is
important to analyze trends in multiple metrics. A plan with an asset level lower than its accrued liability
has insufficient funds to cover benefits. A plan can experience an increase in unfunded liability due to
various factors, including insufficient investment returns, inadequate contributions and inaccurate or
overly aggressive assumptions. Hence, a single metric cannot effectively capture the different drivers
contributing to the increase of a plan’s unfunded pension obligation. This section analyzes historical
trends in various metrics identified by the PRB and makes comparisons to understand the sources of
growth in unfunded liability for Greenville Fire.
The health of Greenville Fire has been deteriorating since the early 2000s. Numerous factors have
contributed to this deterioration, including inadequate contributions, insufficient investment returns,
increased benefit payments, and a low active-to-annuitant ratio in the face of a large unfunded liability.
The following sections discuss these and other factors in detail.
Assets and Liabilities
For a plan’s funding level to improve, its assets should grow faster than liabilities, which can be achieved
by contribution increases, benefit reductions, and/or consistently high investment returns over a long
period of time.
Greenville Fire’s actuarial accrued liability (AAL) increased by nearly 90% between the end of 2000 and
2016. Conversely, the Fund’s actuarial value of assets (AVA) grew by less than 18% over that same
period resulting in the unfunded actuarial accrued liability (UAAL) more than quadrupling. The funded
ratio (AVA/AAL) also fell from 77% in 2000 to less than 48% in 2016.
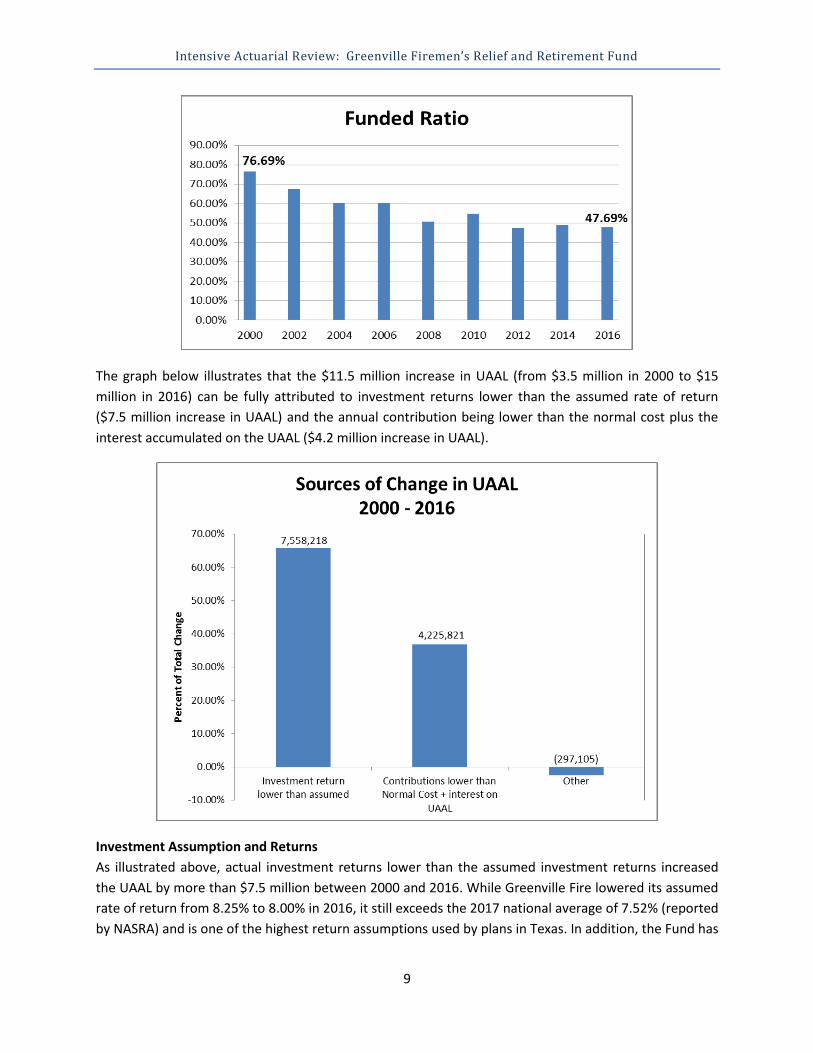
Intensive Actuarial Review: Greenville Firemen’s Relief and Retirement Fund
9
The graph below illustrates that the $11.5 million increase in UAAL (from $3.5 million in 2000 to $15
million in 2016) can be fully attributed to investment returns lower than the assumed rate of return
($7.5 million increase in UAAL) and the annual contribution being lower than the normal cost plus the
interest accumulated on the UAAL ($4.2 million increase in UAAL).
Investment Assumption and Returns
As illustrated above, actual investment returns lower than the assumed investment returns increased
the UAAL by more than $7.5 million between 2000 and 2016. While Greenville Fire lowered its assumed
rate of return from 8.25% to 8.00% in 2016, it still exceeds the 2017 national average of 7.52% (reported
by NASRA) and is one of the highest return assumptions used by plans in Texas. In addition, the Fund has

Intensive Actuarial Review: Greenville Firemen’s Relief and Retirement Fund
10
not achieved an 8.00% return on assets over a consecutive 10-year period in any of the 13 periods
ending December 31, 2004 through December 31, 2016 as shown in the graph below.
Contributions
Most Texas plans use a fixed percent of pay funding approach. This is especially true for plans governed
by the TLFRRA statute. Under a fixed-rate funding structure, no formal amortization policy (i.e. the
expected time to fully fund the plan) exists; therefore, the plan’s actuary estimates the amortization
period at each valuation date based on the current financial condition of the plan and the current
contribution rates. This fixed-rate funding structure provides contribution stability for the plan sponsor
in the short term, but does not include any inherent mechanisms for reacting to changes in a plan’s
financial condition.
As of October 2017, active members of the Fund contributed 16.30% and the City contributed 17.30% of
pay. This reflects multiple increases in both the active members’ and the City’s contribution rates over
the past 15 years. Despite the increases in contribution rates, during this period, the Fund’s UAAL
increased by $4.2 million. This increase in the UAAL was caused by total contributions that were not
sufficient to cover both the new benefits being accrued (normal cost) and the interest accumulated on
the unfunded benefits already earned (interest accumulated on the UAAL), or to start reducing the total
UAAL. This result, a payment that is not expected to cover the interest that accrues during the year, is
known as negative amortization.
The Conference of Consulting Actuaries' Public Plans Community White Paper Actuarial Funding Policies
and Practices for Public Pension Plans suggests that an “amortization policy should reflect explicit
consideration of the level and duration of negative amortization,” and identifies a “rolling/open
amortization of [the] entire UAAL as a single combined layer … where the amortization period entails
negative amortization” as an unacceptable practice. 2

Intensive Actuarial Review: Greenville Firemen’s Relief and Retirement Fund
11
According to its actuarial valuations, Greenville Fire has not received the reported actuarially
determined contribution (ADC) every year since 2004. Even with contribution increases in 2006, 2014,
and 2016, employer contributions have averaged less than 80% of the Fund’s ADC over that period.
Furthermore, the reported ADC rate is calculated utilizing an “open amortization of [the] entire UAAL as
a single combined layer”. For the fiscal year ending December 31, 2017, the expected contributions are
less than 78 percent of the reported ADC. This shortfall of $184,379 is equal to 0.97% of the City’s total
General Fund expenditures for the fiscal year ending December 31, 2016 and is greater than most other
TLFFRA plans of similar size. The City has agreed to increase its contribution rate to 19.30% beginning in
October 2018; however, this is still less than the most recently calculated ADC.
Contribution Levels vs. Actuarially Determined Contribution Date (12/31) 2000 2002 2004 2006 2008 2010 2012 2014 2016
Employee Contribution 13.20% 13.20% 13.20% 15.30% 15.30% 15.30% 15.30% 15.30% 16.30%
Employer Contribution 13.20% 13.20% 13.20% 15.30% 15.30% 15.30% 15.30% 16.30% 16.80%
30-Year ADC* N/A 13.12% 16.08% 17.58% 19.55% 18.57% 22.66% 22.20% 21.55%
% of ADC funded > 100.00% 100.61% 82.09% 87.03% 78.26% 82.39% 67.52% 73.42% 77.96%
Covered Payroll $1,992,655 $2,350,430 $2,486,757 $2,554,102 $3,170,813 $3,414,694 $3,576,528 $3,805,174 $3,881,665
Contribution Shortfall - - $71,619 $58,234 $134,760 $111,660 $263,232 $224,505 $184,379
*The ADC rate referenced a 40-year amortization period through 2006, after which it changed to 30 years.
Under the Fund’s assumptions both before 2016 (8.25% discount rate and 4.25% payroll growth rate)
and as of the end of 2016 (8.00% discount rate and 4.00% payroll growth rate), negative amortization
occurs when the amortization period is more than approximately 16 or 17 years. While the plan does
not have an explicit amortization policy, the effect of its current funding structure results in an implicit
amortization policy that includes negative amortization (i.e. intentionally increases the total UAAL even
under the best of scenarios) for the next 30 or more years.
Asset Allocation
As shown in the chart below, the Fund’s actual asset allocation is fairly close to its target allocations in
all but one asset class, alternatives. However, the PRB’s asset classification breaks out real estate as a
separate asset class, which the Fund may consider to be an alternative investment.
Asset Allocation
Asset Class Equities Fixed Income Alternatives Real Estate Cash
Current Allocation 54.2% 31.2% 4.1% 5.5% 5.0%
Target Allocation 50% 30% 20% - -
*Current allocation as of 12/31/2016 financial audit
Payroll Growth
Greenville Fire lowered its annualized payroll growth assumption from 4.25% to 4.00% as of December
31, 2016. Even with this decrease, the Fund still has one of the highest payroll growth rate assumptions
when compared to other TLFRRA plans of similar size. Although the Fund’s overall actual payroll growth
average exceeded that target from 2000 to 2014, it has decreased in recent years to around 3.00%.

Intensive Actuarial Review: Greenville Firemen’s Relief and Retirement Fund
12
While this assumption under a fixed-rate funding policy does not directly affect actual contributions, the
calculation of the amortization period is highly sensitive to it, especially when a plan’s amortization
period is as high as the Fund’s.
Sensitivity to Changes in Payroll Growth Assumption
Assumed Payroll Growth Amortization Period
4.00% 50
3.50% 76 *Based on UAAL as of December 31, 2016 and an employer contribution of 17.30%
It should be noted that the Fund’s actuary has been recommending lowering the payroll growth rate and
the discount rate since 2012.
Cash Flow
Greenville Fire’s non-investment cash flow dipped from -3.9% in 2011 to -9.5% in 2012 and has averaged
around -6.0% thereafter. A negative non-investment cash flow is not abnormal for mature defined
benefit pension plans. However, a cash flow percentage this low is likely to be a drag on potential
investment returns because a fund must either invest in a higher proportion of income-producing
investments, which traditionally provide lower returns, or must liquidate existing assets to pay out
current benefits and/or expenses.
Demographics
As a pension plan matures, it will experience a shift in demographics with a declining ratio of active
members to retirees. This demographic shift is expected and is taken into account in the long-term
funding of a pension plan. However, for a plan with a large unfunded liability, a declining active to
retiree ratio can exert financial stress from a contribution perspective. Contributions to the Fund are on
a percent of pay basis, and assume an ever-growing contribution base (i.e. the total payroll is assumed
to grow at a constant percentage so the dollar contributions into the plan are also assumed to grow at
the same rate). This percent-of-pay approach results in back-loaded contributions for fully funding any

Intensive Actuarial Review: Greenville Firemen’s Relief and Retirement Fund
13
unfunded liability as compared to a level dollar approach. It is therefore helpful to compare the active
member population, the basis on which contributions are calculated, to the annuitant population. A
shrinking active member population, as compared to the annuitant population, indicates a smaller and
smaller base available to fund any outstanding unfunded liability or to provide the needed support in
times of distress.
Since 2012, the Fund’s active-to-annuitant ratio has been hovering around 0.80, or four active members
for every five retirees. This ratio is lower than all but one similarly-sized TLFFRA system, and is one of the
lowest of all defined benefit public pension plans in Texas. With increased longevity of members, this
ratio is expected to continue to decline and put more pressure on the active members to fund the plan.
In addition, the fact that the current assets are not sufficient to support the existing inactive population,
much less future retirees and beneficiaries, exacerbates this issue.

Intensive Actuarial Review: Greenville Firemen’s Relief and Retirement Fund
14
Retroactive DROP
Greenville Fire has a Retroactive Deferred Retirement Option Program (RETRO DROP) provision that
allows members to retroactively end their years of service up to two years before their actual
retirement date and receive a lump sum payment equal to the total retirement benefits the member
would have received plus the amount of contributions, with no interest, the member made into the
Fund over that time.
However, due to the Fund’s relatively small size and poor funded status, it could experience liquidity
issues that significantly impact investment returns if several of these RETRO DROP lump-sum payouts
occur in a short period. For example in 2012, there were five retirements from the Fund, compared with
an average of just one per year over the four previous years. That year, the Fund experienced a large
increase in benefit payments and a dip in non-investment cash flow to -9.5%.
Risk Analysis
The various risks faced by a pension fund all boil down to one relatively simple question, “Will there be
enough money to pay benefits when due?” This section discusses four main risk factors facing the Fund:
investment, funding, assumption, and governance risks. Measuring Greenville Fire based on these
factors reveals a significant amount of risk being taken in each of these areas, increasing the probability
of a continued period of severe financial stress for the Fund. This also raises the likelihood of
deteriorating funding conditions in the coming years, further imperiling the Fund’s ability to pay
promised benefits.

Intensive Actuarial Review: Greenville Firemen’s Relief and Retirement Fund
15
Investment Risk
Investment risk is the risk that actual future returns will be different from expected. Generally, some risk
always exists associated with actual returns deviating significantly below or above the expected return
on assets over the long term. However, the likelihood of Greenville Fire not meeting or exceeding the
8.00% expected return on assets is significantly greater than the odds that they will do so for the near
future.
The graph below projects the funded ratio for the next 30 years under the following four different actual
investment return scenarios: the expected return on assets (EROA) or 8.00%; the EROA +1%; the EROA -
1%; and the “tread-water” rate of return on assets, or rate of return on assets necessary to have the
same funded ratio at the end of the 30-year period. As illustrated below, the tread-water return on
assets is 7.93%, only slightly below the EROA. Given no changes in plan benefits or contribution rates,
the Fund barely passes 60% funded status in 30 years even if all assumptions are met, including if the
Fund meets the EROA.
3
In addition, as was illustrated in the Historical Trends section, the Fund has not achieved an 8.00%
annualized return over a consecutive 10-year period in any of the 13 periods ending December 31, 2004
through December 31, 2016. The impact of consistently earning less than the EROA but even as high as
7.00% over on the current asset allocation, the Fund’s 8.00% assumed rate of return, and expected
capital market assumptions published by organizations such as JP Morgan and Horizon Actuarial

Intensive Actuarial Review: Greenville Firemen’s Relief and Retirement Fund
16
Services, the PRB estimates the probability of earning less than or equal to a 7.00% annual return is
approximately twice as likely as achieving a 9.00% or greater annual return over the next 30-year period.
The Fund’s current asset allocation is not significantly different from other public pension plans.
However, to maintain an expected return on assets of 8.00%, public pension plans have generally taken
on significantly more risk than in the past. Public pension portfolios with an 8.00% expected return have
increased risk by more than 3-fold between 1995 and 2016.4 Generally, this is a result of shifting
investments from more stable fixed income securities (with significantly lower returns in 2016 than in
1995) into equities and equity-like products. The Fund has followed a similar trend holding closer to a
40% equity/60% fixed income asset allocation in 1995 and over time shifting to a 60% equity/40% fixed
income split at the end of 2016. This results in a higher likelihood of large losses in any given year. Thus,
even if an 8.00% return assumption in any given year is reasonable, one year with large losses reduces
the actual long-term expected return, which is what we see in the 10-year returns graphed above.
Funding Risk
Funding or contribution risk is the risk that actual future contributions will be less than expected future
contributions. For purposes of this section, funding risk will also refer to the risk that future
contributions are less than “needed” to maintain a financially stable pension fund.
There are two primary issues with fixed-rate, percent of pay plans that may result in long-term
problems:
1) Contributions to percent of pay plans are inherently back-loaded because the expected
contributions to a percent of pay plan grow on a nominal basis at the assumed rate of total
payroll growth.
2) Fixed rate plans provide budgetary stability for the employer in the short term, but do not
include any inherent mechanisms for reacting to changes in a plan’s financial condition.
Based on the Fund’s current contribution rates, including the planned contribution rate increase in
October 2018, on an open group projection basis the total UAAL is expected to increase for the next 30
years before it starts to decrease. The implication is that someone who is hired by the Fire Department
or someone who moves to the City 30 to 50 years in the future will still be paying for services received in
the past. This raises the concern of intergenerational equity. Moreover, if actual investment returns
and/or payroll growth are lower than expected, the UAAL will only continue to increase more.
To address these concerns, a plan can adopt a funding policy with a target to fully fund the plan. One
approach is for the employer to contribute based on an actuarially determined contribution (ADC) that
is designed to decrease contribution volatility, while addressing changing financial conditions. The
impact on the UAAL of adopting a simple funding policy designed to fully fund the plan in 30 years is
shown below. The projected UAAL is shown for each of the scenarios: maintaining the current fixed rate
contribution schedule (17.30% increasing to 19.30% in October 2018); increasing the employer
contribution by 1.00% above the current plan; adopting a funding policy that pays the rolling 30-year
actuarially determined contribution; and adopting a funding policy that utilizes a single layer 30-year
closed amortization approach (i.e. will fully fund the plan in 30 years).

Intensive Actuarial Review: Greenville Firemen’s Relief and Retirement Fund
17
The total contributions (both employer and employee) necessary for each funding policy are shown
below.

Intensive Actuarial Review: Greenville Firemen’s Relief and Retirement Fund
18
Assumption Risk
Actuarial valuations and projections are by their nature simplifications of an extremely complex reality.
As G.E.P. Box is famously quoted, “All models are wrong, but some are useful.” The actuarial valuation,
like a map of the world, is not 100% accurate but is instead a useful tool to help guide decision making
on the most effective way to get from point A to point B. For that reason, it is best not to rely too much
on a single snapshot of any given metric, but rather examine the progression of multiple metrics over
time. An important part of that process involves selecting the economic and demographic assumptions
about future plan experience.
Actuarial Standards of Practice (ASOPs) 27, Selection of Economic Assumptions for Measuring Pension
Obligations, and 35, Selection of Demographic and Other Noneconomic Assumptions for Measuring
Pension Obligations, provide a framework for the selection of assumptions. They state that each
assumption selected by an actuary must be “reasonable,” where reasonable is defined as being
appropriate for the purpose, reflects the actuary’s professional judgement, takes into account historical
and current data, as well as future expectations, and has no significant bias. The ASOPs also recognize
that “different actuaries will apply different professional judgement” such that a “range of reasonable
assumptions may develop.”
As was noted previously, for the Fund, the single largest increase in UAAL over the past 15 years was
due to investment returns lower than the assumed rate of return, and the potential for this trend to
continue is one of the largest concerns moving forward. In addition, the amortization period calculation
is highly sensitive to the selection of an assumed rate of payroll growth. The development of both of
these assumptions relies first on the selection of the inflation assumption. While there are approaches
to selecting the investment return assumption other than the traditional “building block” approach, the
Governmental Accounting Standards Board’s reporting requirements implicitly assume the building
block approach is used by requiring plans to report expected real rates of return (i.e. “after adjustment
to eliminate inflation”) for each asset class.5
While the Fund’s 3.00% inflation assumption may not appear high for public pension plans
(approximately 62% of Texas plans in the most recent information reported to the PRB and 58% of the
plans in the Public Plans Database for the fiscal year ending in 2016 used a 3.00% or higher inflation
assumption), other industry data indicates inflation could be significantly lower. The following table
illustrates several published inflation rates for various mid- to long-term horizons:
Source Time Horizon (Years) Rate
Greenville Fire 12/31/2016 Actuarial Valuation N/A 3.00%
Treasury Inflation Protected Securities6 30 2.01%
SSA 2017 Trustees Report – Intermediate Assumptions7 75 2.60%
JP Morgan 2017 Long-Term Capital Market Assumptions8 10 2.25%
Horizon Actuarial Services 2017 Survey of Capital Market Assumptions9 20 2.44%
Based on projections in the Investment Risk section above, if the mean rate of return is reduced from
8.00% to 7.50% to reflect a 2.50% inflation rate rather than 3.00%, the PRB estimates the Fund would be

Intensive Actuarial Review: Greenville Firemen’s Relief and Retirement Fund
19
more than three times as likely to earn less than or equal to a 7.00% return versus greater than or equal
to a 9.00% return over the next 30-year period.
The payroll growth assumption is also frequently calculated using a building block approach with
inflation as the base and an adjustment for general productivity growth. Therefore, any reduction to the
inflation assumption is likely to impact the payroll growth assumption as well. Also, as noted previously,
the amortization period calculation is highly sensitive to the payroll growth assumption. The
amortization period is used as the primary metric for decision-making by many Texas public pension
plans, as well as the trigger for requirements under the Texas Government Code, so any assumption that
has a significant impact on the amortization period should be scrutinized very closely.
The inflation, payroll growth and investment return assumptions are all economic assumptions that
have a significant impact on valuation of the liabilities and the anticipated cost of the plan. The
demographic assumption with the largest impact is the mortality table.
Greenville Fire currently uses the RP-2000 Mortality Table, projected to 2024 with Scale AA. In
December 2014, the Organization for Economic Co-operation and Development (OECD) published
Mortality Assumptions and Longevity Risk: Implications for Pension Funds and Annuity Providers, in
which they examined “the mortality tables commonly used by pension funds and annuity providers
against several well-known mortality projection models with the purpose of assessing the potential
shortfall in provisions.”10 Specifically, the OECD examined the RP-2000 Mortality Table as well as
projected mortality improvements using Scale AA. The OECD concluded that scale AA does not
“sufficiently reflect the fact that mortality improvements have been increasing”, and the use of the RP-
2000 Mortality Table with a fully generational projection utilizing Scale AA is likely to result in a shortfall
of around 4-5%. While this impact is more pronounced for women and white-collar workers, it illustrates
the importance of continually monitoring, and regularly updating, all assumptions.
For the Fund, while the actual cost will always be the benefits actually paid, if the liabilities are
understated, the contributions necessary to fund the actual costs could be larger than anticipated and
could exacerbate the Fund’s already precarious actuarial condition. It is sometimes useful to incorporate
a level of conservatism in a plan’s assumptions to help avoid the difficulties associated with significant
underfunding.
Governance Risk
Governance is essentially decision-making, and decision-making for public pension plans must balance
the competing interests of plans and their sponsors and should feature collaboration between the two.
One primary source of governance risk is the lack of involvement of key parties or stakeholders in
important areas of decision-making for a pension plan including plan design (benefits) and funding
(contributions). When a key party, such as the board of trustees or the plan sponsor, is not engaged in
important decisions, the risk increases that benefit levels and the contributions required to fund them
will diverge, potentially putting the plan’s funding stability at risk.
For example, TLFFRA allows boards of trustees to make prospective benefit modifications, both
increases and reductions. These changes must be approved by an actuary and a majority of participating
Intensive Actuarial Review: Greenville Firemen’s Relief and Retirement Fund
20
members and may not deprive an eligible participant of vested accrued benefits. Although jointly
responsible for funding the retirement plan along with plan members, the sponsoring city may have
limited involvement in benefit decision-making, a structure which generates the risk that benefit levels
adopted could be unsustainable. While Greenville Fire has not increased benefits to speak of in recent
years, this potential risk remains in the future, given the statutory structure.
Benefit increases are not the only potential risk related to a potential lack of sponsor involvement under
TLFFRA; unwillingness to reduce benefits prospectively when necessary to address funding challenges
can be an obstacle to getting things back on track. It should be noted that even plans with very engaged
boards and sponsors can be susceptible to increasing benefits to unsustainable levels in good times or
failing to lower them when necessary in bad times. Governance risk related to an imbalance in decision-
making can only exacerbate these risks. Governance risk must also be managed on the contribution side,
with both parties working together to provide sufficient contributions and to avoid lowering
contributions in good times.
State law recognizes these risks and imposes cooperation between the system and sponsoring
governmental entity by requiring retirement systems having trouble meeting their long-term obligations
to work with their sponsors to develop a restoration plan for addressing those issues.11 This framework
helps ensure that both the system and its sponsoring employer are involved in pension plan reform
decisions, but it comes at a point when actuarial health is already threatened. Prior to and throughout
the funding soundness restoration plan process, Greenville Fire and the City have made incremental
contribution increases since 2006 in response to deteriorating conditions, but these changes have not
been enough to put the plan on a solid path to sustainability.
Conclusions
Funding and Governance Risk
When retirement systems and their sponsors wait too long to address them, the funding challenges
compounding over time can reach a point where small, incremental improvements such as those made
for Greenville Fire simply do not have enough effect to achieve sustainability. As required by state law to
jointly formulate a funding soundness restoration plan, the City increased its contribution rate to 19.30%
beginning in October 2018; however, Greenville Fire and the City have yet to make difficult decisions on
additional needed changes to benefit or contribution levels to address potential investment and funding
risks in the future. If necessary changes are ultimately made, they will certainly right the ship, but they
will be made under less than ideal conditions.
Thus, another model is called for. Plans and their sponsors can develop policies that proactively manage
risk in the future by laying out a formal risk-sharing plan in advance. To proactively manage governance
and funding risk, retirement plans and their sponsors should work together to adopt written policies far
in advance, before they incur adverse experience, that can guide them through both good and bad years
and shield against the risk of either party’s exclusion or disengagement from decision-making. Funding
and benefit policies can be adopted that provide a framework for how benefit and contribution levels
may be modified under different conditions. An advantage of such policies is that changes to plan
Intensive Actuarial Review: Greenville Firemen’s Relief and Retirement Fund
21
benefits and costs are known and understood by all parties in advance, rather than negotiated under
difficult circumstances.
A strong funding policy that ensures a healthy amortization period is maintained by requiring payment
of an actuarially determined contribution is encouraged. Numerous actuarial methods can be utilized to
help mitigate contribution volatility, including directly smoothing contribution rates or adding
“guardrails” that require the stakeholders to come back to the table if the contribution rate falls outside
a specified range. If funding according to an actuarially determined contribution is not adopted, a
funding and benefit policy should, at a minimum, codify how adverse experience will be addressed and
how future changes will be made.
For example, a funding policy might state that future benefit enhancements, cost of living adjustments,
and/or contribution rate reductions can only be considered or made if the system’s funded ratio
remains greater than a particular threshold. A funding policy can also state that if the funded ratio falls
below a certain threshold, the stakeholders would be required to come back to the table to make
necessary contribution and benefit adjustments. Greenville Fire in conjunction with the City can
consider utilizing the FSRP requirement to develop a long-term funding policy for the Plan.
Assumption Risk
Public retirement systems must monitor actuarial assumptions continually through their actuarial
valuations and make appropriate adjustments to mitigate bias in the assumptions that result in
consistent actuarial gains or losses. Actuarial gains and losses occur when the plan’s actual experience
does not match expected experience. Over time, without required changes, pension funds such as
Greenville Fire whose assumptions consistently diverge from actual experience in the same direction
(i.e. consistently seeing actuarial gains or consistently seeing actuarial losses) can exacerbate the issue
of intergenerational inequity, causing one group of members and taxpayers to over- or under-pay.
Boards of trustees should work with their actuaries to ensure assumptions are neither too aggressive
nor too conservative, while striving to maintain (or achieve) sound fiscal health to secure existing
accrued benefits. PRB’s Pension Funding Guidelines recommend systems to monitor, review, and report
the impact of actual plan experience on actuarial assumptions at least once every five years.
Investment Risk
Whatever the investment return assumption used, investment returns should be closely monitored, and
investment managers’ performance should be assessed regularly and compared to appropriate asset
class benchmarks. Benchmarks should be reviewed to see if they have been met or exceeded, and
should be viewed in light of the risk taken to achieve those returns. Best practices also include revisiting
investment manager selection periodically, with boards of trustees evaluating managers’ performance,
fees, and whether their current managers are providing the highest possible value at the lowest possible
cost. The asset allocation should also be assessed from a risk perspective to provide insight into how the
fund would weather a market correction.
.
Intensive Actuarial Review: Greenville Firemen’s Relief and Retirement Fund
22
1 The theoretical minimum threshold, or actuarially determined contribution (ADC), is a target or recommended
contribution “to the plan as determined by the actuary using a contribution allocation procedure,” as defined in Actuarial Standards of Practice No 4. If contributions to the plan are made as a fixed rate based on statutory or contractual requirements, the ADC for this purpose is the contribution needed to fund the benefits accrued in the current year and maintain an amortization period that does not exceed 30 years, as required to be reported under Texas Government Code §802.101(a).
2 https://www.ccactuaries.org/Portals/0/pdf/CCA_PPC_White_Paper_on_Public_Pension_Funding_Policy.pdf
3 Unless otherwise specified, employer contributions are assumed to increase to 17.30% as of January 1, 2018 and
19.30% as of October 1, 2018. Total benefit payments are assumed to grow at 3.50%, as provided by John M. Crider, Jr. Consulting Actuary. All other current and projected assets and liabilities reflect the actuarial accrued liabilities, actuarial value of assets, plan provisions, and actuarial assumptions and methods as reported in the 12/31/2016 Actuarial Valuation prepared by John M. Crider, Jr. Consulting Actuary.
4 http://www.rockinst.org/pdf/government_finance/2017-02-01-Risk_Taking_Appropriateness.pdf
5 Governmental Accounting Standards Board Statement No. 67, Financial Reporting for Pension Plans, p. 30.
6 https://fred.stlouisfed.org/
7 https://www.ssa.gov/oact/TR/2017/2017_Long-Range_Economic_Assumptions.pdf
8 https://am.jpmorgan.com/us/institutional/our-thinking/ltcma-2017
9 http://www.horizonactuarial.com/blog/2017-survey-of-capital-market-assumptions
10 http://www.oecd-ilibrary.org/finance-and-investment/mortality-assumptions-and-longevity-
risk_9789264222748-en
11 Texas Government Code 802.2015 and 802.2016 require public retirement systems whose amortization period
exceeds 40 years for 2 or 3 consecutive actuarial valuations to develop, with their sponsor, a funding soundness restoration plan designed to bring their amortization period within 40 years over 10 or fewer years.

I
Appendix A – Peer Comparison Tables

Greenville Fire - Peer Comparison Tables
Peer Group Plans* MVA Assumed Interest
Payroll Growth
10-year Return (Net)
Active/ Annuitants
UAAL % of
Payroll Average Benefit
30-Y Shortfall % of GFE
30-Y Shortfall % of ADC NPL
Total Expenses
Expenses as %
of Assets
Orange Fire $ 8,154,674 7.75% 4.00% 3.72% 0.88 336.03% $ 25,230 0.71% 27.27% $ 8,946,685 $ 112,378 1.38%
Sweetwater Fire $ 8,264,183 8.00% 4.50% 4.38% 1.04 246.28% $ 28,599 0.67% 19.03% $ 4,965,694 $ 104,278 1.26%
Corsicana Fire $ 8,344,317 7.00% 3.00% 3.40% 1.70 211.44% $ 30,864 N/A N/A $ 8,837,348 $ 114,627 1.37%
Weslaco Fire $ 9,186,148 7.25% 3.25% 2.71% 2.21 111.07% $ 18,578 N/A N/A $ 4,588,953 $ 97,998 1.07%
University Park Fire $ 9,515,461 8.00% 4.00% 3.29% 0.76 358.48% $ 26,628 0.42% 16.16% $ 13,199,959 $ 89,676 0.94%
Big Spring Fire $ 11,157,022 8.00% 5.00% 4.26% 1.27 248.61% $ 37,713 N/A N/A $ 9,713,127 $ 100,927 0.90%
Greenville Fire $ 12,728,162 8.00% 4.00% 4.23% 0.79 387.00% $ 24,101 0.97% 22.04% $ 16,709,548 $ 125,356 0.98%
Waxahachie Fire $ 14,201,159 7.00% 4.00% 4.90% 1.77 164.84% $ 43,297 N/A N/A $ 7,039,421 $ 164,077 1.16%
Lufkin Fire $ 14,264,481 7.50% 3.00% 3.30% 1.23 371.24% $ 35,666 0.29% 7.99% $ 20,444,874 $ 124,925 0.88%
Denison Fire $ 15,214,736 7.75% 4.00% 3.87% 1.04 182.33% $ 25,498 N/A N/A $ 7,048,420 $ 107,168 0.70%
Texas City Fire $ 15,837,081 7.75% 3.00% 3.56% 1.27 289.35% $ 35,686 N/A N/A $ 17,061,992 $ 182,033 1.26%
Conroe Fire $ 20,275,833 7.75% 4.00% 2.84% 3.83 167.60% $ 40,585 0.16%** 7.86% $ 19,202,262 $ 196,542 0.97%
Cleburne Fire $ 21,323,149 7.25% 3.25% 5.64% 1.89 277.79% $ 36,625 N/A N/A $ 12,363,227 $ 127,066 0.60%
*The Woodlands Fire and Travis County ESD Fire were not included due to their lack of actuarial experience. **Based on a 25-year amortization period shortfall, not a 30-year.
Peer Group Plans* Sponsor GF Expend EOY GF Bal
General Obligation Debt UAAL
Expected Employer
Contributions ADC 30-year
Shortfall
30-year Shortfall % of ADC
30-year Shortfall % of GFE
Orange Fire Orange $17,985,946 $8,272,029 $6,445,000 $8,199,175 $341,606 $469,709 $128,103 27.27% 0.71%
Sweetwater Fire Sweetwater $8,345,574 $4,729,719 $0 $3,674,028 $238,689 $294,781 $56,092 19.03% 0.67%
University Park Fire University Park $24,901,680 $28,793,761 $0 $11,158,279 $545,968 $651,177 $105,209 16.16% 0.42%
Greenville Fire Greenville $19,089,359 $6,271,335 $41,071,000 $15,021,872 $652,120 $836,499 $184,379 22.04% 0.97%
Lufkin Fire Lufkin $32,591,960 $10,480,400 $56,600,000 $17,317,158 $1,100,728 $1,196,291 $95,563 7.99% 0.29%
Conroe Fire** Conroe $64,298,794 $28,651,695 $40,365,000 $13,667,395 $1,223,183 $1,327,561 $104,378 7.86% 0.16% *Only includes plans with 30-year contribution shortfalls **Based on a 25-year amortization period shortfall, not a 30-year.

II
Appendix B – Comments from the City of Greenville


III
Appendix C – Comments from Greenville Firemen's Relief and
Retirement Fund
John M. Crider, Jr. Consulting Actuary
1701 Gateway Boulevard, Suite 461 Richardson, Texas 75080-3627
P.O. Box 832066 Telephone (972) 690-5390 Richardson, Texas 75083-2066 Fax (972) 690-5398
January 21, 2018
Via E-mail Actuarial Committee Texas Pension Review Board P.O. Box 13498 Austin, Texas 78711-3498
Re: Actuarial Review: Greenville Firemen’s Relief and Retirement Fund Dear Actuarial Committee Members: The City of Greenville and members of the Greenville Firemen’s Relief and Retirement Fund have raised their contribution rates to the fund. At the same time, the actuarial assumptions used in the valuation have been made more conservative. Taking into account the pending two percent of pay increase in the City of Greenville contribution rate, the fund’s amortization period stands at 37.7 years. Projections have also been made which adjust the amortization period for transition from the contribution rate used in the valuation to the ultimate contribution rate, 19.3 percent of pay. Those projections indicate that the amortization will first fall below 30 years as of December 31, 2024. The projected amortization period as of June 30, 2025, is 29.457 years. June 30, 2025, is the deadline set in Pension Review Board Pension Funding Guidelines for reaching a 30-year amortization period. It is hoped that Actuarial Committee and the Pension Review Board (PRB) will recognize the cooperation which the City, the fund, and the actuary have demonstrated in connection with the Actuarial Review. The fund’s valuation reports and accounting disclosures have been provided to the PRB for many years. The most recent actuarial valuation and accounting disclosure reports were provided to the PRB upon completion. In connection with the Actuarial Review, a table of Pension Review Board Metrics from the last two valuations was prepared and forwarded to the PRB on December 12, 2017. At the PRB’s request, a 40-year cash flow projection was developed and sent to the PRB on December 20, 2017. The letter which Mayor David L. Dreiling sent to the PRB on January 19, 2018, traced the amortization period of the fund and the contribution rates under the plan since the completion of the December 31, 2012 actuarial valuation. Mayor Dreiling’s letter also included a schematic diagram which shows the effect of the two-percent-of-pay contribution increase which the City of Greenville will place in its budget for the upcoming fiscal year. (It should be noted that the City of Greenville also increased it contribution rate by one-half of one percent of pay effective October 1, 2017.) In addition, a graph, which plots the projected decreases in the fund’s amortization period over the next eight years, was attached to Mayor Dreiling’s letter.

Actuarial Committee January 21, 2018 Page Two The City of Greenville, the Board of Trustees of the Greenville Firemen’s Relief and Retirement Fund, and the actuary believe that the City’s and the fund’s efforts should be acknowledged by the Pension Review Board. Recognizing Greenville’s efforts will encourage other funds—funds with even higher amortization periods and funds with infinite amortization periods—to undertake the efforts and sacrifices necessary in order to make their funds stronger and to bring their plans into compliance with Pension Review Board Pension Funding Guidelines. Actuary’s Comments Concerning Specific Issues Discussed in the Draft Actuarial Review The draft Actuarial Review contains a number of comments about the Greenville Firemen’s Relief and Retirement Fund. Below are the actuary’s observations concerning some of those comments. Not all points of disagreement have been addressed. The observations are limited to the most important differences of opinion. The page numbers listed come from the draft Actuarial Review. The following comments address specific Metrics: Amortization Period, Page Three The Actuarial Review lists the amortization period as given prior to the City’s one-half of one percent of pay contribution increase in October 2017 and without the City’s two percent of pay increase which will become effective in October 2018. Taking those increases into account the amortization period is 37.7 years. The figures in the graph included with Mayor Dreiling’s January 19th letter show amortization periods which have been adjusted for the fact that the final contribution rate of 19.30 percent of pay will not be in force until October 2018. The PRB draft Review states, “Greenville Fire currently has one of the highest amortization periods of all defined benefit pension plans in Texas.” The Board Packet prepared for the Pension Review Board’s January 26, 2017 meeting contained a table on page 60 of the Acrobat copy. There were six plans with amortization periods higher that the 70.4-year period of the Greenville fund. Five of those plans had infinite amortization periods. Taking into account the 37.7-year amortization period which will result from the increases in City of Greenville contribution rate, the are 20 defined benefit plans on the table with amortization periods greater than that of the Greenville fund. Under the new contribution rate, the plan satisfies PRB Pension Funding Guidelines.

Actuarial Committee January 21, 2018 Page Three Funded Ratio, Page Three Of the six plans with higher amortization periods than the Greenville fund, mentioned above, all have funded ratios higher than the 47.7% listed for the Greenville fund. There is little correlation between amortization period and funded ratio. The Pension Review Board’s use of amortization period as the primary measure of plan soundness is a wise and sound choice. Assumed Rate of Return (8.00%), Page Four The Pension Review Board’s 2017 Guide to Public Retirement Systems in Texas contains a table on Page 39 which lists the assumed rates of return for Texas Public Plans. The most commonly-used assumed rate of return was 8.00 percent, which was employed by 27 percent of plans. The Greenville fund lowered its assumed rate of return in connection with the most recent valuation. As the amortization period decreases, it will be possible to make this assumption more conservative. Exhibit 2 of the fund’s Governmental Standards Board (GASB) Statement No. 68 disclosures, sent to the PRB in December, shows the development of the expected rate of return using the building block rate of return method. Exhibit 2 indicates that there is approximately a one-half of one percent margin in the fund’s assumed rate of return. The draft Review states, “Greenville Fire’s assumed rate of return is 8.00%, while its actual ten-year rate of return for the period ending December 31, 2016 was only 4.23%.” Included with this letter are two graphs which show one-year, five-year, ten-year, and twenty-two year rates of return for Texas Local Fire Fighters’ Retirement Act (TLFFRA) funds. The first graph is for the Greenville Firemen’s Relief and Retirement Fund. The second graph shows averages for the TLFFRA funds which, like the Greenville fund, close their years on December 31st. The Greenville fund’s December 31, 2016 ten-year average is shown as 4.23%, as stated in the draft Actuarial Review. The average for all calendar year TLFFRA funds, however, is only 4.07%. Thus, Greenville fund’s rate is above the TLFFRA average. Low ten-year average rates of return have been experienced nationwide due to the substandard rates of return produced by the financial markets as a result of the 2008 financial crisis and the low returns for 2014, 2015, and 2016. Other periods show higher average rates. Of the 20 rates of return listed on the graphs, only three bars show the Greenville fund’s rate as being less than the TLFFRA average. The 2015 one-year rate is only four one hundredths of a percent lower than the TLFFRA average. The Greenville fund changed investment managers in 2007. The fund’s investment performance improved after the change. One of the sources of the fund’s high amortization periods has been the investment returns under the prior manager. The two recent increases in contribution rate are working to compensate for the fund’s low returns prior to the manager change.

Actuarial Committee January 21, 2018 Page Four Payroll Growth Rate (4.00%), Page Four The PRB draft Review states, “The Fund’s payroll growth rate of four percent is tied for the third most aggressive in its peer group.” The Actuarial Standards of Practice (ASOPs) call for assumptions to be based on a fund’s experience and to fall within a reasonable range. Use of peer groups is not a recognized practice under the ASOPs. Exhibit 8 of the December 31, 2016 valuation report shows the fund’s experience with respect to payroll growth rate starting with the December 31, 2008 valuation. Payroll growth reached 9.00 percent in 2010 and has decreased since that time. Experience has shown that payroll growth rates change in cycles. The Greenville fund has had a study of fund experience, including payroll growth rate, as a part of nearly every valuation. If future experience studies do not show a return to the assumed rate of payroll growth, the rate will be lowered. Actual Contributions as a Percent of Actuarially Determined Contributions, Page Four The PRB draft Review states, “This is one of the largest shortfalls percentages in the State and the second largest in its peer group.” With the 2.50 percent of pay increase in the City of Greenville contribution rate since the most recent valuation, the difference between the rate needed to produce a rolling 30-year amortization period and the actual contribution rate has decreased from 4.75 percent to 2.25 percent. As noted in Mayor Dreiling’s letter and on page one of this letter, the fund’s amortization period is projected to decrease to 30 years by December of 2024. With a thirty-year amortization period, the difference between the 30-year rate and the actual rate will be zero. Non-investment Cash Flow, Page Four The PRB draft Review states, “Greenville Fire’s non-investment cash flow as a percentage of FNP (“Fiduciary Net Position”, or fair value of assets) is one of the lowest in the State. If this trend continues, the Fund could face the potential risk of needing to liquidate a portion of existing assets to pay current benefits and/or expenses.” Like the majority of TLFFRA funds, the Greenville Firemen’s Relief and Retirement Fund was created in the Fall of 1941. Actuarially speaking, it is a “mature plan,” meaning that both the active and nonactive membership are approximately stationary populations. Line 5 of Exhibit 3 of the December 31, 2016 valuation report shows the year-end market value of plan assets for 2012 through 2016. The value of assets has increased each year except for 2015. As the draft Review points out, the fund’s ten-year average rate of return was 4.23 percent. (This period includes both the 2008 financial crisis and the three, low-return years 2014, 2015, and 2016.) However, the fund’s assets increased by $351,908 over that period. Furthermore, the fund’s DROP provision is a reverse DROP and is limited to two years. Line 28 of Exhibit 3 of the fund’s December 31, 2016 GASB Statement No. 68 disclosures shows that there have been zero outstanding DROP distributions for the last three years.

Actuarial Committee January 21, 2018 Page Five The Greenville fund has shown no signs of a cash flow problem. The fund’s investment manager serves a number of TLFFRA funds and is experienced in managing the cash flows and investment portfolios for fire fighter plans. The increases in City contribution rate since September 30, 2016, have further diminished the fund’s cash flow risk. Historical Trends Assets and Liabilities On page five, the draft Review states that the unfunded actuarial accrued liability has more than quadrupled since 2000. No comparison with other funds is given. The period from 2000 to the end of 2016 includes the 2000-to-2002 financial downturn, the 2008 financial crisis, and the three low-return years of 2014, 2015, and 2016. Over the same period, the fund has also strengthen its methods and assumptions by changing from the aggregate to the individual entry age cost method, twice adopted a new mortality table, as well as lowered its assumed rate of return and payroll growth assumptions. Under the fund’s new contribution rate, the unfunded actuarial accrued liability (UAAL) is projected to be less than 30 years prior to June 30, 2025. The UAAL is projected to be zero in 38 years. Investment Assumption and Returns As noted on page three, above, the Greenville fund’s assumed rate of return is still the most widely used rate of return, according to the Pension Review Board’s February 2017 Guide to Public Retirement Systems in Texas. The Greenville fund monitors its investment experience annually and reports its investment experience to the PRB on Form PRB-1000. The fund will lower its assumed rate of return if experience studies indicate such a change is necessary. Contributions, Payroll Growth, and Cash Flow These items are discussed on pages two through four, above. Demographics, Retro Drop, Payroll Growth, and Risk Analysis and Assumption Risk These items are discussed on pages two through four, above. In addition, with respect to risk analysis, it should be noted that nearly all Greenville Firemen’s Relief and Retirement Fund valuation reports contain experience studies of rate of return, age at retirement, individual salary increases, and aggregate pay increases. These meet the requirements of Section 802.1014(b-1) of the Texas Government Code and PRB Pension Funding Guidelines.
Actuarial Committee January 21, 2018 Page Six I will attend the Actuarial Committee meeting on Thursday, January 25th in order to go over this response and to answer questions about the actuarial status of the Greenville fund. If Committee members or Pension Review Board staff members have questions in the mean time, please feel free to contact me.
Sincerely,
John M. Crider, Jr., ASA, MAA, EA
Attachments cc: Board of Trustees Greenville Firemen’s Relief and Retirement Fund
Mr. Kenneth Herbold, FSA Actuary State Pension Review Board Mr. Joey Evans Program Specialist State Pension Review Board
GreenvilleFf\2017GreenvillePrb_PrbActuarialReview\ActuarialCommittee20180121.doc

Greenville Firemen's Relief and Retirement FundInvestment Experience through 2016Average Annual Rates of Return - Plan Years Ending December 31st
-7-
12.08%
3.15%
5.72% 6.68%
15.85%
12.07%
5.90%
7.14%
4.89%
8.76%
5.82%
7.03%
-2.65%
5.75% 5.00%
6.54% 7.16% 7.28%
4.23%
6.57%
12/31/2012 12/31/2013 12/31/2014 12/31/2015 12/31/2016-4.0%
0.0%
4.0%
8.0%
12.0%
16.0%
20.0%
Rat
e of
Ret
urn
Average ofOne-yearRates ofReturnAverage ofFive-yearRates ofReturnAverage ofTen-yearRates ofReturnAverage ofReturn RatesSince 1995
John M. Crider, Jr. - Consulting Actuary

Rates of Return of Texas Local Fire Fighters’ Retirement Act FundsA Survey of Investment Experience through 2016Average Annual Rates of Return - Plan Years Ending December 31st
-8-
10.94%
2.26%
6.39% 6.58%
15.09%
10.96%
6.09% 7.00%
4.32%
8.09%
5.56%
6.86%
-2.61%
5.21% 4.61%
6.39% 6.26% 6.62%
4.07%
6.48%
12/31/2012 12/31/2013 12/31/2014 12/31/2015 12/31/2016-4.0%
0.0%
4.0%
8.0%
12.0%
16.0%
20.0%
Rat
e of
Ret
urn
Average ofOne-yearRates ofReturnAverage ofFive-yearRates ofReturnAverage ofTen-yearRates ofReturnAverage ofReturn RatesSince 1995
John M. Crider, Jr. - Consulting Actuary

This Page Intentionally Left Blank
1
Ashley Rendon
From: Himes, Craig <[email protected]>Sent: Sunday, January 21, 2018 8:55 PMTo: AnumehaSubject: Greenville Firemen's Relief and Retirement FundAttachments: 20180121ActuarialCommittee.pdf
Follow Up Flag: Flag for follow upFlag Status: Completed
1/21/18 Anu, As Chairman of the Greenville Firemen's Relief and Retirement Fund I agree with the responses of Mr. Crider and Mayor Dreiling regarding the upcoming review. I am forwarding Mr. Crider's response to make sure you received it. This is a list of individuals that will be attending the PRB meeting on 1/25/18 to answer any questions the PRB might have. We look forward to seeing you Thursday and thank you for all of your help. As always feel free to contact me if you have any questions. Craig Himes (903) 259‐4564 Chairman Bryan Ausmus Vice Chairman Mayor Dreiling Greenville Mayor John Crider Actuary Derek Sheets ( Newest member of our Pension Board will be attending to observe ) Secretary Thanks, Craig Himes Greenville Fire ‐ Rescue C‐ Shift/ Station 3/ Captain Office 903‐457‐2952 Cell 903‐259‐4564 [email protected] This message contains confidential information and is intended only for the individual named. If you are not the named addressee you should not disseminate, distribute or copy this e-mail. Please notify the sender immediately by e-mail if you have received this e-mail by mistake and delete this e-mail from your system. E-

Texas Pension Review Board
2017-2018 Biennial Report
III
APPENDIX A3 – INTENSIVE ACTUARIAL REVIEW – BEAUMONT
FIREMEN'S RELIEF AND RETIREMENT FUND

Intensive Actuarial Review: Beaumont Firemen’s Relief and Retirement Fund
April 2018

Intensive Actuarial Review: Beaumont Firemen’s Relief and Retirement Fund
Table of Contents Executive Summary ............................................................................................................................................... 1
Introduction ...................................................................................................................................................... 1
Overview ........................................................................................................................................................... 1
Conclusion ........................................................................................................................................................ 1
Background ........................................................................................................................................................... 2
Risk Analysis .......................................................................................................................................................... 3
Asset-Liability Mismatch Risk ........................................................................................................................... 3
Background ................................................................................................................................................... 3
Risks Associated with Beaumont Fire’s PROP .............................................................................................. 4
Conclusion/Recommendation ...................................................................................................................... 5
Governance Risk ............................................................................................................................................... 5
Background ................................................................................................................................................... 6
Governance Risk Case Study: Beaumont Fire’s DROP/PROP ........................................................................ 6
Funding Soundness Restoration Plan ........................................................................................................... 7
Conclusion/Recommendation ...................................................................................................................... 8
Funding Risk ...................................................................................................................................................... 8
Background ................................................................................................................................................... 8
Fixed-Rate Funding Model and Contribution Insufficiency Risk ................................................................... 8
Investment Experience Compared with Investment Return Assumption .................................................. 10
Conclusion/Recommendation .................................................................................................................... 11
Appendix ............................................................................................................................................................. 12
Key Metrics ..................................................................................................................................................... 13
Plan Summary ................................................................................................................................................. 15
Benefits ....................................................................................................................................................... 15
Contributions .............................................................................................................................................. 16
Membership ............................................................................................................................................... 16
TLFFRA Board Structure .............................................................................................................................. 16
Contribution and Benefit Decision-Making ................................................................................................ 16
Historical Trends ............................................................................................................................................. 16
Assets and Liabilities ................................................................................................................................... 17
Investment Assumption and Returns ......................................................................................................... 18
Asset Allocation .......................................................................................................................................... 18
Cash flow .................................................................................................................................................... 18
Retroactive DROP and PROP ...................................................................................................................... 19
Peer Group Key Metric Comparison ............................................................................................................... 20
Peer Group Sponsor Funding Comparison ..................................................................................................... 21
Peer Group Expense Comparison ................................................................................................................... 22
Comments from Beaumont Firemen's Relief and Retirement Fund……………………………………………………………….23

Intensive Actuarial Review: Beaumont Firemen’s Relief and Retirement Fund
1
Executive Summary
Introduction
This intensive actuarial review of Beaumont Firemen’s Relief and Retirement Fund (“Beaumont Fire” or
“the Fund”) is intended to assist the Fund’s board of trustees and the City of Beaumont (“the City”) in
assessing the Fund’s ability to meet its long-term pension obligation. Overall, the review shows the Fund
is taking considerable risks in its approach to funding the system, as well as with respect to its asset-
liability profile. The Pension Review Board encourages the Fund and the City to review the findings and
conclusions of this report carefully and jointly adopt a forward-looking plan to address these risks and
guide the Fund towards a path of long-term sustainability. The Pension Review Board can provide
technical assistance in formulating such a plan.
Overview
Beaumont Fire faces significant risk associated with its post-retirement option plan (PROP) because it
offers: a guaranteed 6.00% annual rate of return, which is calculated as 2.0% less than the actuarial
investment return assumption; a virtually unlimited amount of time to accrue this guaranteed return; and
the ability to withdraw these funds with little to no restriction. In an era of extremely low interest rates,
offering a guaranteed 6% rate of return on accounts that can be withdrawn on short notice is virtually
unheard of and presents great risk. It is impossible for the Fund to back these liabilities with assets with a
similar investment horizon while providing a similar return. The Fund’s PROP balance has grown from less
than 3% of total plan assets in 2007 to nearly 1/3 of total assets in 2016.
The expansion of Beaumont Fire’s DROP/PROP over time, particularly in more recent years as interest
rates plummeted worldwide, provides some insight into the risks associated with the Fund’s decision-
making processes. The Fund did not have the benefit of written funding or benefit policies to guide its
consideration of DROP/PROP enhancements over time and may have benefitted from more formal
involvement of the City.
In addition, the Fund’s amortization period spiked from 39 years as of December 31, 2014 to 104 years as
of December 31, 2016. This jump in expected funding period highlights certain funding risks associated
with contributions that are a fixed rate of pay set through statute or negotiation, including the lack of any
built-in mechanisms to adjust to changes in a plan’s financial condition.
Conclusion
To address the immediate risks posed by the PROP, the board should consider performing an in-depth
asset-liability study to better understand the potential risks associated with its existing asset mix and the
liabilities they support and seriously consider the risk a guaranteed rate of return places on all the Fund’s
stakeholders while considering the impact changes could have on PROP participant behavior.
To address the funding and governance risks, the Fund and the City should develop written funding,
benefit, and investment policies that are linked to provide a formal risk-/cost-sharing arrangement. A
strong funding policy that requires payment of an actuarially determined contribution (ADC) is
encouraged. In addition to helping maintain a sound plan funding level, putting such forward-looking
policies into place can help reduce uncertainty for stakeholders who would know, in advance, how
adverse experience will be managed.
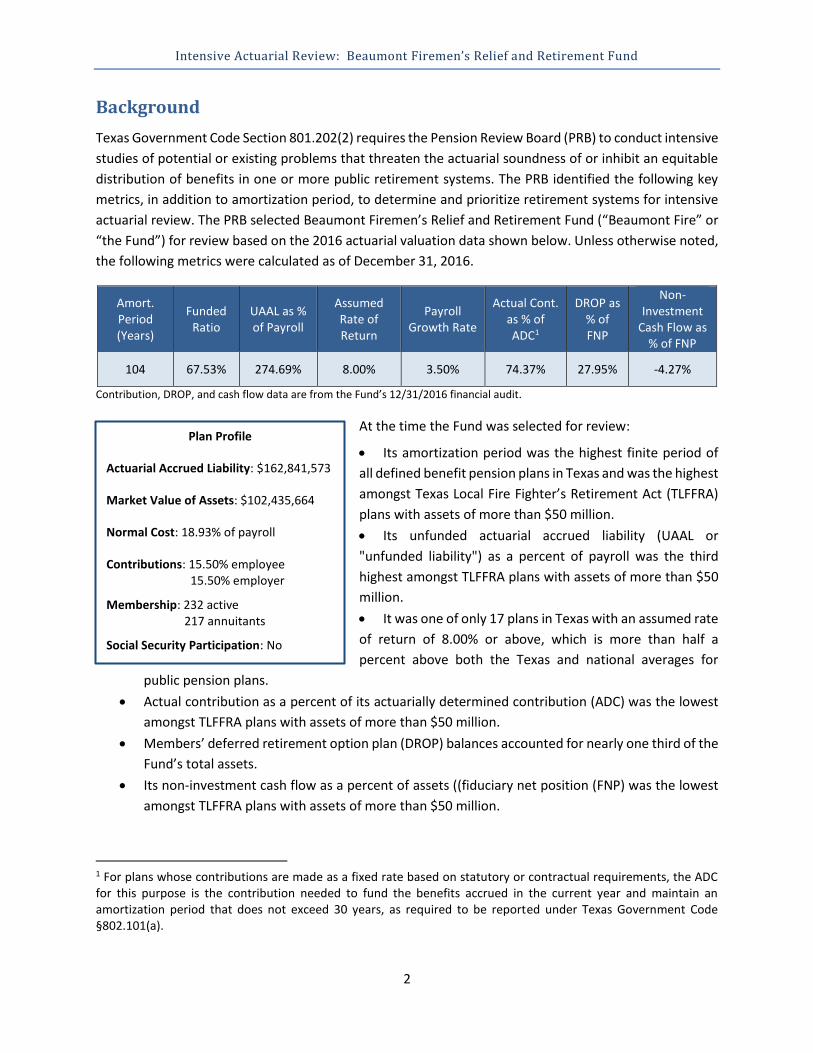
Intensive Actuarial Review: Beaumont Firemen’s Relief and Retirement Fund
2
Background
Texas Government Code Section 801.202(2) requires the Pension Review Board (PRB) to conduct intensive
studies of potential or existing problems that threaten the actuarial soundness of or inhibit an equitable
distribution of benefits in one or more public retirement systems. The PRB identified the following key
metrics, in addition to amortization period, to determine and prioritize retirement systems for intensive
actuarial review. The PRB selected Beaumont Firemen’s Relief and Retirement Fund (“Beaumont Fire” or
“the Fund”) for review based on the 2016 actuarial valuation data shown below. Unless otherwise noted,
the following metrics were calculated as of December 31, 2016.
Amort. Period (Years)
Funded Ratio
UAAL as % of Payroll
Assumed Rate of Return
Payroll Growth Rate
Actual Cont. as % of ADC1
DROP as % of FNP
Non-Investment
Cash Flow as % of FNP
104 67.53% 274.69% 8.00% 3.50% 74.37% 27.95% -4.27%
Contribution, DROP, and cash flow data are from the Fund’s 12/31/2016 financial audit.
At the time the Fund was selected for review:
• Its amortization period was the highest finite period of
all defined benefit pension plans in Texas and was the highest
amongst Texas Local Fire Fighter’s Retirement Act (TLFFRA)
plans with assets of more than $50 million.
• Its unfunded actuarial accrued liability (UAAL or
"unfunded liability") as a percent of payroll was the third
highest amongst TLFFRA plans with assets of more than $50
million.
• It was one of only 17 plans in Texas with an assumed rate
of return of 8.00% or above, which is more than half a
percent above both the Texas and national averages for
public pension plans.
• Actual contribution as a percent of its actuarially determined contribution (ADC) was the lowest
amongst TLFFRA plans with assets of more than $50 million.
• Members’ deferred retirement option plan (DROP) balances accounted for nearly one third of the
Fund’s total assets.
• Its non-investment cash flow as a percent of assets ((fiduciary net position (FNP) was the lowest
amongst TLFFRA plans with assets of more than $50 million.
1 For plans whose contributions are made as a fixed rate based on statutory or contractual requirements, the ADC for this purpose is the contribution needed to fund the benefits accrued in the current year and maintain an amortization period that does not exceed 30 years, as required to be reported under Texas Government Code §802.101(a).
Plan Profile
Actuarial Accrued Liability: $162,841,573
Market Value of Assets: $102,435,664
Normal Cost: 18.93% of payroll
Contributions: 15.50% employee 15.50% employer
Membership: 232 active 217 annuitants
Social Security Participation: No

Intensive Actuarial Review: Beaumont Firemen’s Relief and Retirement Fund
3
Risk Analysis
The various risks faced by a pension fund all boil down to one
relatively simple question, “Will there be enough money to pay
benefits when due?” This section discusses three main risk factors
facing the Fund: asset-liability mismatch, governance, and funding
risks. Measuring Beaumont Fire based on these factors reveals a
significant amount of risk being taken in each of these areas,
increasing the probability of a continued period of severe financial
stress for the Fund. This also raises the likelihood of deteriorating
funding conditions in the coming years, further imperiling the Fund’s
ability to pay promised benefits.
Asset-Liability Mismatch Risk
Beaumont Fire faces significant asset-liability mismatch risk
associated with its post-retirement option plan (PROP) because it
offers:
• a guaranteed 6.00% annual rate of return;2
• a virtually unlimited amount of time to accrue this
guaranteed return; and
• the ability to withdraw these funds with little to no
restriction.
Background
Most of the benefits expected to be distributed from a public defined
benefit pension plan are not expected to be paid in the short, or even
medium, term. Thus, many believe investments such as equities that
are more likely to provide a higher return over a longer time horizon
provide a superior risk-return profile to support these long-term
liabilities. This has led public pension plans to allocate a large
proportion of assets to riskier and longer-term investments.
Beaumont Fire is no exception. However, Beaumont Fire has unique
plan design features that present additional risks which must be
examined when considering the reasonableness of this common
asset allocation.
The Fund offers two versions of its retroactive deferred retirement option plan (Retro DROP) based on
achieving various age and service requirements. The Retro DROP benefits can simply be viewed as an
additional benefit payment option like any other option but allowing a portion of the total benefit to be
taken as a lump sum in exchange for a smaller annuity. Actuarially, these distributions are reasonably
2 The annual rate of return is defined as 2.0% less than the actuarial investment return assumption.
Regular/Forward DROP -
Active employee retires on
paper and continues
working. DROP account is
credited with monthly
pension benefit plus
contributions and interest.
Back/Retro DROP - At
retirement the employee
can elect to retire on paper
as of a previous date and
receive the monthly
pension benefits that would
have been paid had the
employee truly retired at
the elected date plus
contributions.
PROP - After retirement a
retiree can elect to credit
their DROP account balance
and/or their pension
benefit into a PROP account
with interest.
*DROP features vary.
Deferred Retirement Option Plan Examples*

Intensive Actuarial Review: Beaumont Firemen’s Relief and Retirement Fund
4
predictable given sufficient plan experience, and do not include accumulated interest but only provide
the hypothetical “missed” distributions plus a return of employee contributions. Therefore, the Retro
DROP does not appear to present significant risk to the Fund.
In contrast, the plan feature that presents unique challenges for Beaumont Fire is its PROP. The PROP
allows the DROP lump sum distributions to remain in the plan, as well as allows any retiree the option to
redirect annuity distributions back to the plan. The PROP account earns a guaranteed 6.00% annual rate
of return and can be withdrawn in virtually any manner and at any time. The only limit to this option is
that distributions must begin in accordance with Internal Revenue Service Required Minimum Distribution
rules3.
Risks Associated with Beaumont Fire’s PROP
In an era of extremely low interest rates, offering a guaranteed 6% rate of return on accounts that can be
withdrawn on short notice is virtually unheard of and presents great risk. It is impossible for the Fund to
back these liabilities with assets with a similar investment horizon while providing a similar return. In fact,
the Fund has struggled to earn a 6% annual rate of return on its entire portfolio, much less its short-term
assets. In the past 10 years, Beaumont Fire has surpassed a 6% return five times, but three times saw
negative returns resulting in an average annual return of less than 4% for this period.
A major concern is the lack of a trigger mechanism to lower or cease the guaranteed interest rate for years
with sub-par returns. Participants are incentivized by the nature of this program to treat it like a risk-free
savings account – one that earns roughly 6 times more than even the best savings accounts on the market,
while the active plan members and taxpayers absorb all the risk. The combined effect of the 6%
guaranteed return on PROP accounts, the average actual return on assets lower than the interest rate
paid, and the option for all participants to place their entire retirement benefit in the PROP for up to 20
years explains why the Fund’s PROP balance has grown from less than 3% of total plan assets in 2007 to
nearly 1/3 of total assets in 2016.
3 The PROP balance must remain with the fund for 90 days before members may elect PROP distributions. Should the PROP participant fail to file a PROP Benefit Distribution Form before age 70 ½, distributions will automatically be in the form of annual payments over three years and will begin at age 70 ½.

Intensive Actuarial Review: Beaumont Firemen’s Relief and Retirement Fund
5
Beaumont Fire has amended the plan design to decrease the guaranteed PROP return for a calendar year
following a year in which actual returns are lower than 6%, but only for members hired on or after January
1, 2017. Thus, this specific amendment will not impact the Fund for decades. The PROP account balance
for Beaumont Fire is currently just below 28% of its net plan assets based on market value (fiduciary net
position (FNP)) and can only be expected to continue to increase exponentially absent any intervention
from the Fund’s board.
While it makes economic sense for members to continue to participate in the PROP as it currently exists,
any attempt to modify future interest accruals may change this calculation, potentially causing the Fund
significant issues. Currently, less than 3% of the Fund’s net assets are in short-term investments, leaving
the Fund at risk of needing to sell off assets, potentially with less than ideal market timing, if a larger than
expected number of PROP members decide to withdraw their funds.
Conclusion/Recommendation
The Fund's board should consider performing an in-depth asset-liability study to better understand the
potential risks associated with its existing asset mix and the liabilities they support. This should include
scenario testing large PROP withdrawals coupled with potential adverse investment experience. In
addition, the board should seriously consider the risk a guaranteed rate of return places on all the Fund’s
stakeholders while considering the impact changes could have on PROP participant behavior.
Governance Risk
The expansion of Beaumont Fire’s DROP/PROP over time, particularly in more recent years as interest
rates plummeted, provides some insight into risks associated with the Fund’s decision-making processes.
The Fund did not have the benefit of written funding or benefit policies to guide its consideration of
DROP/PROP enhancements over time and may have benefitted from more formal involvement of the City.

Intensive Actuarial Review: Beaumont Firemen’s Relief and Retirement Fund
6
Background
Governance is essentially decision-making, and decision-making for public pension plans must balance the
competing interests of plans and their sponsors and should feature collaboration between the two. The
primary source of governance risk is the potential lack of involvement of key parties or stakeholders
(members, the sponsor government, and taxpayers) in important areas of decision-making for a pension
plan including plan design (benefits) and funding (contributions). When a key party is not engaged in
important decisions, the risk increases that benefit levels and the contributions required to fund them will
diverge, potentially putting the Fund’s funding stability at risk.
For example, TLFFRA allows boards of trustees to make prospective benefit modifications, both increases
and reductions. These changes must be approved by an actuary and a majority of participating members
and may not deprive an eligible participant of vested accrued benefits. Although jointly responsible for
funding the retirement plan along with plan members, the sponsoring city may have limited involvement
in benefit decision-making, a structure which generates the risk that benefit levels adopted could be
unsustainable.
Benefit increases are not the only potential risk related to a potential lack of sponsor involvement under
TLFFRA; unwillingness to reduce benefits prospectively when necessary to address funding challenges can
be an obstacle to getting things back on track. It should be noted that even plans with very engaged boards
and sponsors can be susceptible to increasing benefits to unsustainable levels in good times or failing to
lower them when necessary in bad times. Governance risk related to an imbalance in decision-making can
only exacerbate these risks. The history of the Fund’s DROP/PROP accounts illustrates this point.
Governance Risk Case Study: Beaumont Fire’s DROP/PROP
In 1993, a provision for a simple 2-year forward DROP account was added to the Fund. By 2006, the
provision was changed to a Retro DROP only, and expanded to allow up to 7 years of participation. In
2006, the PROP provision was also introduced, allowing DROP participants to keep their lump sum DROP
distributions in the Fund and accrue interest at a guaranteed 6% per year, which is calculated as 2.0% less
than the actuarial investment return assumption. Up until this point, the Fund remained reasonably well-
funded with a funded ratio hovering just under 80% and an amortization period in the 20s, within the
PRB's then-preferred 15-25-year range per the Guidelines for Actuarial Soundness, and the DROP
provisions did not appear to pose significant risks.

Intensive Actuarial Review: Beaumont Firemen’s Relief and Retirement Fund
7
However, in 2006 savings accounts returned a little more than 1% per year, 10-year Treasury bonds
returned less than 5% per year, and the Fund’s average return over the 10-year period ending December
31, 2005 was just scarcely over 7%. In 2010, the PROP option was expanded to include all retirement
benefits rather than just the Retro DROP balance even though interest rates had continued to decline and
the Fund’s average return over the 10-year period ending December 31, 2009 was just 2.79% with just 4
of those years returning more than 6% and 4 resulting in negative returns. As noted above, the Fund has
taken recent measures to lower future interest accruals on the PROP accounts, but it will take a minimum
of 20 years for this change to have any impact on actual plan benefits. Waiting this long to address the
PROP account’s significant and growing risks points to a lack of proactive decision-making by key
stakeholders.
Funding Soundness Restoration Plan
State law recognizes the potential risks of underfunding and a lack of engagement by some key
stakeholders and imposes cooperation between the system and sponsoring governmental entity by
requiring retirement systems having trouble meeting their long-term obligations work with their sponsors
to develop a restoration plan for addressing those issues.4 This framework helps ensure that both the
system and its sponsoring employer are involved in retirement system reform decisions, but it comes at
a point when actuarial health is already threatened. Beaumont Fire has not yet become subject to the
statutory requirement to develop a funding soundness restoration plan, but since their last actuarial
valuation showed an amortization period of greater than 40 years, it will become subject if the December
31, 2018 valuation does not show an amortization period of 40 years or fewer.
4 Texas Government Code 802.2015 and 802.2016 require public retirement systems whose amortization period exceeds 40 years for 2 or 3 consecutive actuarial valuations to develop, with their sponsor, a funding soundness restoration plan designed to bring their amortization period within 40 years over 10 or fewer years.
Funded ratio ≈ 80%, amortization period ≈ 20 years, no apparent risks Plan’s avg return over 10-yr period ending
12/31/2005 ≈ 7%
Interest rates continue to
decline, plan’s avg return over 10-yr
period ending 12/31/2009 =
2.79%
1993 1995 1997 1999 2006 2010 Forward DROP provision added to the Fund, 2-year max
Retro DROP option added, 2-year max
Retro DROP and Forward DROP increased to 3-year max
Forward DROP closed, Retro DROP increased to 5-year max
Retro DROP - 7-year max option added in addition to 5-year; PROP option added - participants may keep lump sum distributions in the Fund with guaranteed 6% interest per year
PROP expanded to include all retirement benefits, rather than just Retro DROP balance

Intensive Actuarial Review: Beaumont Firemen’s Relief and Retirement Fund
8
Conclusion/Recommendation
It is imperative to the long-term health of the Fund that all stakeholders are involved in plan decisions in
good times as well as bad. One step to help address these issues is for the Fund and the City to develop
written funding, benefit, and investment policies which are linked to provide a formal risk-/cost-sharing
arrangement. For example, a funding policy might state that future benefit enhancements, cost of living
adjustments, and/or contribution rate reductions can only be considered or made if the Fund's funded
ratio remains greater than a threshold. A funding policy can also state that if the funded ratio falls below
a certain threshold, the stakeholders would be required to come back to the table to make necessary
contribution and benefit adjustments.
In addition to helping maintain a sound plan funding level, putting such trigger mechanisms into place can
help reduce uncertainty for stakeholders who would know, in advance, how adverse experience will be
managed. If Beaumont Fire together with the City had adopted such a forward-looking policy in the past,
its DROP/PROP may not have grown to represent the level of risk for the Fund that it does today.
Funding Risk
Beaumont Fire’s recent investment experience, with actual returns far below the assumed rate of return,
coupled with the Fund’s fixed-rate funding structure which does not adjust to cover those actuarial losses
presents serious funding risks that must be mitigated for the Fund to meet its long-term obligations.
Background
Beaumont Fire experienced a significant spike in its amortization period from 39 years as of December 31,
2014 to 104 years as of December 31, 2016. This increase was largely driven by significant asset losses in
2015, and since they are not yet fully recognized in the actuarial value of assets, will continue to hold
down the funded ratio and maintain an extremely high amortization period as they are recognized in 2017
and 2018. Without significant offsetting asset gains and/or immediate changes to contributions or
benefits, the Fund is likely to become subject to the Funding Soundness Restoration Plan statutory
requirement following its next actuarial valuation, as mentioned above.
Fixed-Rate Funding Model and Contribution Insufficiency Risk
This jump in expected funding period highlights certain risks associated with contributions that are a fixed
rate of pay set through statute or negotiation:
1) Contributions to percent-of-pay plans are inherently back-loaded because the expected
contributions to a percent-of-pay plan grow on a nominal basis at the assumed rate of total payroll
growth.
2) Fixed contributions (whether as a rate of pay or a specific dollar amount) provide budgetary
stability for the employer in the short term, but do not include any inherent mechanisms for
reacting to changes in a plan’s financial condition.
As of October 1, 2017, active members of the Fund contribute 15.50% of pay and the City also contributes
15.50% of pay. The City’s and member’s contribution rates reflect an increase from 15.00% in 2014.
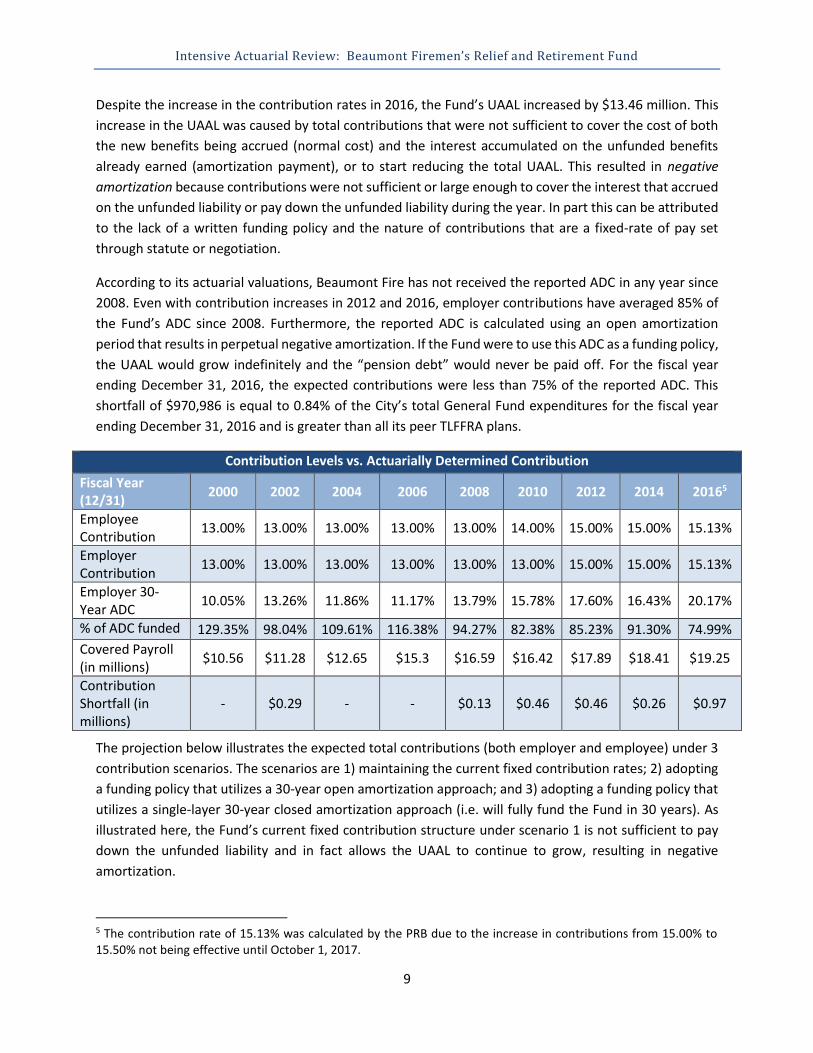
Intensive Actuarial Review: Beaumont Firemen’s Relief and Retirement Fund
9
Despite the increase in the contribution rates in 2016, the Fund’s UAAL increased by $13.46 million. This
increase in the UAAL was caused by total contributions that were not sufficient to cover the cost of both
the new benefits being accrued (normal cost) and the interest accumulated on the unfunded benefits
already earned (amortization payment), or to start reducing the total UAAL. This resulted in negative
amortization because contributions were not sufficient or large enough to cover the interest that accrued
on the unfunded liability or pay down the unfunded liability during the year. In part this can be attributed
to the lack of a written funding policy and the nature of contributions that are a fixed-rate of pay set
through statute or negotiation.
According to its actuarial valuations, Beaumont Fire has not received the reported ADC in any year since
2008. Even with contribution increases in 2012 and 2016, employer contributions have averaged 85% of
the Fund’s ADC since 2008. Furthermore, the reported ADC is calculated using an open amortization
period that results in perpetual negative amortization. If the Fund were to use this ADC as a funding policy,
the UAAL would grow indefinitely and the “pension debt” would never be paid off. For the fiscal year
ending December 31, 2016, the expected contributions were less than 75% of the reported ADC. This
shortfall of $970,986 is equal to 0.84% of the City’s total General Fund expenditures for the fiscal year
ending December 31, 2016 and is greater than all its peer TLFFRA plans.
Contribution Levels vs. Actuarially Determined Contribution
Fiscal Year (12/31)
2000 2002 2004 2006 2008 2010 2012 2014 20165
Employee Contribution
13.00% 13.00% 13.00% 13.00% 13.00% 14.00% 15.00% 15.00% 15.13%
Employer Contribution
13.00% 13.00% 13.00% 13.00% 13.00% 13.00% 15.00% 15.00% 15.13%
Employer 30-Year ADC
10.05% 13.26% 11.86% 11.17% 13.79% 15.78% 17.60% 16.43% 20.17%
% of ADC funded 129.35% 98.04% 109.61% 116.38% 94.27% 82.38% 85.23% 91.30% 74.99%
Covered Payroll (in millions)
$10.56 $11.28 $12.65 $15.3 $16.59 $16.42 $17.89 $18.41 $19.25
Contribution Shortfall (in millions)
- $0.29 - - $0.13 $0.46 $0.46 $0.26 $0.97
The projection below illustrates the expected total contributions (both employer and employee) under 3
contribution scenarios. The scenarios are 1) maintaining the current fixed contribution rates; 2) adopting
a funding policy that utilizes a 30-year open amortization approach; and 3) adopting a funding policy that
utilizes a single-layer 30-year closed amortization approach (i.e. will fully fund the Fund in 30 years). As
illustrated here, the Fund’s current fixed contribution structure under scenario 1 is not sufficient to pay
down the unfunded liability and in fact allows the UAAL to continue to grow, resulting in negative
amortization.
5 The contribution rate of 15.13% was calculated by the PRB due to the increase in contributions from 15.00% to 15.50% not being effective until October 1, 2017.

Intensive Actuarial Review: Beaumont Firemen’s Relief and Retirement Fund
10
Investment Experience Compared with Investment Return Assumption
Actual investment returns lower than the assumed return has been a large contributor to the Fund’s
increasing UAAL. The Fund currently assumes an 8.00% interest rate, which exceeds the 2017 national
average of 7.52% (reported by NASRA) and most of its peer systems in Texas. As illustrated below, the
Fund has not achieved an 8.00% annualized return over a consecutive 10-year period in any of the 10
periods ending December 31, 2007 through December 31, 2016.
The graph below projects the funded ratio for the next 30 years, assuming the member and the city
contribution rates remain at a fixed 15.50% each and the investments return 7.00%, 8.00% or 9.00%. The
impact of consistently earning less than the expected return on assets (EROA) but even as high as 7.00%

Intensive Actuarial Review: Beaumont Firemen’s Relief and Retirement Fund
11
over the next 30 years, results in the funded status sinking to 45%. Earning 9.00% over the next 30 years
would put Beaumont Fire at 99% funded. However, based on the current asset allocation, the PRB
estimates the probability of earning less than or equal to a 7.00% annualized return is approximately twice
as likely as achieving a 9.00% or greater annualized return over the next 30-year period.
6
Conclusion/Recommendation
The investment return assumption is the sole assumption that allocates expected costs between
contributions and investment income and the assumed payroll growth rate drives the determination of
whether the existing contribution rate is sufficient to meet those needs. Funding risk arises when these
assumptions understate the contributions needed in the short and medium term, forcing future members
and tax-payers to bear the burden of increased contributions and/or lower benefits.
To address these concerns, a strong funding policy that requires payment of an ADC is encouraged.
Numerous actuarial methods can be utilized to help mitigate contribution volatility, including directly
smoothing contribution rates or adding “guardrails” that require the stakeholders to come back to the
table if the contribution rate falls outside a specified range. If funding according to an ADC is not adopted,
a funding policy that fully funds the Fund over a finite period, such as 30 years, is recommended.
6 Total payroll and projected benefit payments are assumed to grow at 3.50%. All other current and projected assets and liabilities reflect the actuarial accrued liabilities, actuarial value of assets, plan provisions, and actuarial assumptions and methods as reported in the 12/31/2016 Actuarial Valuation prepared by Foster & Foster Actuaries and Consultants.

Intensive Actuarial Review: Beaumont Firemen’s Relief and Retirement Fund
12
Appendix

Intensive Actuarial Review: Beaumont Firemen’s Relief and Retirement Fund
13
Key Metrics
Metric Amortization period (104 years)
What it measures
Approximately how long it would take to fully fund the unfunded actuarial accrued liability (UAAL) based on the current funding policy.
Why it is important
Given the Fund’s current assumptions, an amortization period above 18 years indicates the contributions to the Fund in the coming year are less than the interest accumulated for that same period and therefore the total UAAL is expected to grow over the near term. In addition, for a plan that contributes on a fixed-rate basis such as Beaumont Fire, the higher the amortization period, the more sensitive it is to small changes in the UAAL.
Peer Comparison
Beaumont Fire currently has one of the highest amortization periods of all defined benefit pension plans in Texas and ranks highest amongst its peer TLFFRA plans (TLFFRA plans with the 11 highest market value of assets).
Metric
Funded ratio (67.53%)
What it measures
The percent of a fund’s actuarially accrued liabilities covered by its actuarial value of assets.
Why it is important
The lower the funded ratio, the fewer assets a fund must pay its current and future benefit payments.
Peer Comparison
Beaumont Fire’s funded ratio is below the State’s average of 72.53%
Metric UAAL as a percent of payroll (274.69%)
What it measures
The size of a plan’s unfunded liability compared to the annual payroll of its active members.
Why it is important
Provides a way to compare plans of various sizes and expresses the outstanding “pension debt” relative to current personnel costs.
Peer comparison
The Fund’s UAAL as a percent of payroll is the third highest amongst the 11 largest TLFFRA funds.
Metric Assumed rate of return (8.00%)
What it measures
The estimated annual rate of return on the Fund’s assets.
Why it is important
If actual future returns are lower than the assumed rate of return, future contributions will need to increase significantly, especially for a poorly funded plan. Beaumont Fire’s assumed rate of return is 8.00%, while its actual ten-year investment rate of return for the period ending December 31, 2016 was only 3.77%.
Peer comparison
Beaumont Fire is one of five funds with an assumed rate of return in its peer group with an assumed rate of return at 8.00% or above.

Intensive Actuarial Review: Beaumont Firemen’s Relief and Retirement Fund
14
Metric
Payroll growth rate (3.50%)
What it measures
The estimated annual growth in the total payroll of active members contributing into the Fund.
Why it is important
Contributions are calculated as a percent of active members’ pay and are back-loaded based on the expected growth in total payroll. If payroll does not increase at this rate, actual contributions will not meet those expected in the Fund’s actuarial valuations. Given the Fund’s inactive and active liabilities are not fully funded; contributions below expected levels will have serious consequences on the Fund’s long-term solvency.
Peer comparison
The Fund’s payroll growth rate of 3.50% percent is average for their peer group.
Metric Actual contributions as a percent of actuarially determined contributions (74.37%)
What it measures
Whether the current employer contributions have met a theoretical minimum threshold.7
Why it is important
The employer’s portion of the contribution is less than 75% of the amount needed to fund the Fund on a rolling 30-year amortization period. The PRB’s 2014 Study of the Financial Health of Texas Public Retirement Systems found that plans that have consistently received adequate funding are in a better position to meet their long-term obligations.
Peer comparison
This is one of the largest shortfall percentages in the state and the largest in its peer group.
Metric DROP/PROP as a percent of fiduciary net position (27.95%)
What it measures
The amount of the Fund’s assets that are designated for lump-sum payouts to retired members as a percent of its total assets.
Why it is important
Viewing this metric as a percent of total net assets (or fiduciary net position (FNP)) shows how large a decrease in the Fund’s assets could be if most or all DROP participants decided to take their balances out in a short amount of time.
Peer comparison
This is the fifth largest percentage in the state and the second largest in its peer group.
7 The theoretical minimum threshold, or actuarially determined contribution (ADC), is a target or recommended contribution “to the plan as determined by the actuary using a contribution allocation procedure,” as defined in Actuarial Standards of Practice No 4. If contributions to the plan are made as a fixed rate based on statutory or contractual requirements, the ADC for this purpose is the contribution needed to fund the benefits accrued in the current year and maintain an amortization period that does not exceed 30 years, as required to be reported under Texas Government Code §802.101(a).

Intensive Actuarial Review: Beaumont Firemen’s Relief and Retirement Fund
15
Metric Non-investment cash flow as a percent of fiduciary net position (-4.27%)
What it measures
Non-investment cash flow shows how much the Fund is receiving through contributions in relation to its outflows: benefit payments, withdrawals and expenses.
Why it is important
Viewing this metric as a percent of total net assets (or fiduciary net position (FNP)), in conjunction with the funded ratio and recognition of the relative maturity of a plan, provides information about the stability of a plan’s funding arrangement.
Peer comparison
Beaumont Fire’s non-investment cash flow as a percent of FNP is the lowest in its peer group. If this trend continues, the Fund could face the potential risk of needing to liquidate a portion of existing assets to pay current benefits and/or expenses.
Plan Summary
The Beaumont Firemen’s Relief and Retirement Fund (“Beaumont Fire” or “the Fund”) was established in
1937 under what is now entitled the Texas Local Fire Fighter’s Retirement Act (TLFFRA). TLFFRA provides
general guidelines for fund management, but leaves administration, plan design, contributions, and
specific investments to the discretion of the board of trustees. Beaumont Fire, as with all TLFFRA systems,
is entirely locally-funded.
Benefits
Retirement Eligibility Age: 50 years; Years of Credited Service (YCS): 20 years
Vesting Fully vested after 20 YCS
Benefit Formula 63.15% x Final Average Salary + $123 per month for each year of service in excess of 20
Final Average Salary (FAS) Highest 36-Month Average Salary
COLA None
Retirement Benefit Options 5 –Year Retro DROP: Attainment of age 50 and 20 YCS, not to exceed 60 months 7 – Year Retro DROP: Attainment of age 55 and 25 YCS, not to exceed 84 months Post Retirement Option Plan (PROP): For Retro DROP balances on or after January 1, 2006 and for all monthly benefits on or after March 1, 2010. Members can elect to defer receipt of their monthly benefit into a PROP account earning interest at a rate 2% below the actuarial assumed rate of return. For firefighters hired on or after January 1, 2017, interest will be credited at an annual rate equal to:
• 6% if the actual investment return for the previous calendar year is 6% or greater
• 4% if the actual investment return is greater than 2% but less than 6%
• 2% if actual investment return is 2% or less. Members can keep their benefit in the PROP until age 70-1/2 when the PROP will then be distributed in annual payments over three years.
Social Security No

Intensive Actuarial Review: Beaumont Firemen’s Relief and Retirement Fund
16
Contributions
As of October 1, 2017, active members of Beaumont Fire contribute 15.50% of pay while the City of
Beaumont (the City) also contributes 15.50% of pay.
Membership
Total Active Members
Retired Members
Terminated Total
Members Active-to-
Annuitant Ratio
232 217 1 450 1.07
TLFFRA Board Structure
Active Members 3 - Members of the retirement system; elected by fund members. Three-year terms.
Sponsor Government 1 - Mayor or designated representative, or the political subdivision's Chief Operating Officer or designated representative. 1 - Chief Financial Officer of the political subdivision, or designated representative. Terms correspond to term of office.
Taxpayer, Not Affiliated With Fund/Sponsor Govt.
2 - Residents of the State of Texas, must not be officers/employees of the political subdivision; elected by other Board of Trustee members. Two-year terms.
Contribution and Benefit Decision-Making
TLFFRA authorizes members of the retirement systems to determine their contribution rates by voting.
The statute requires cities to make contributions at the same rate paid by employees or 12%, whichever
is smaller. TLFFRA also allows a city to contribute at a higher rate than employees do through a change in
city ordinance.
TLFFRA gives the board the power to make decisions to modify the benefits (increases and reductions).
However, a proposed addition or change must be approved by the actuary and a majority of participating
plan members. Benefit changes cannot deprive a member, retiree or beneficiary of the right to receive
vested accrued benefits.
Historical Trends
To conduct an intensive review of risks associated with the long-term funding of a pension Fund, it is
important to analyze trends in multiple metrics. A plan with an asset level lower than its accrued liability
has insufficient funds to cover benefits. A plan can experience an increase in unfunded liability due to
various factors, including insufficient investment returns, inadequate contributions and inaccurate or
overly aggressive assumptions. Hence, a single metric cannot effectively capture the different drivers
contributing to the increase of a plan’s unfunded pension obligation. This section analyzes historical
trends in various metrics identified by the PRB and makes comparisons to understand the sources of
growth in unfunded liability for Beaumont Fire.
Beaumont Fire’s funded status has been steadily declining since 2000. Numerous factors have contributed
to this deterioration, including inadequate contributions, investment returns being lower than the chosen
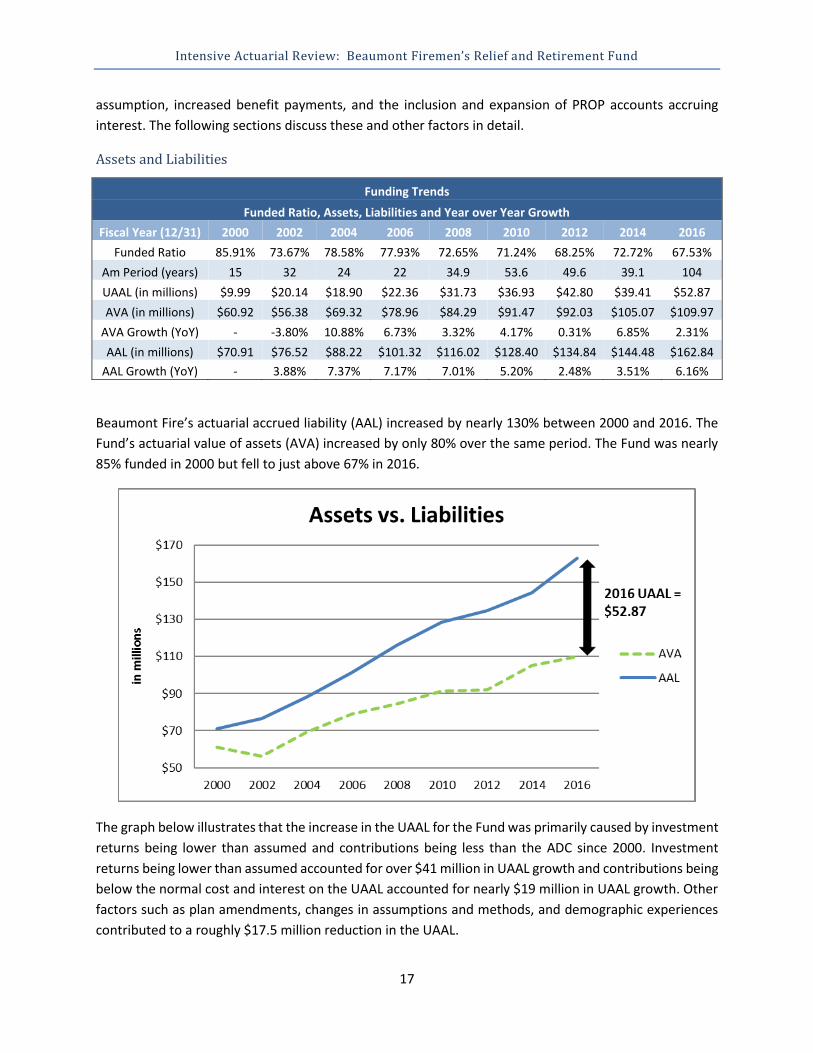
Intensive Actuarial Review: Beaumont Firemen’s Relief and Retirement Fund
17
assumption, increased benefit payments, and the inclusion and expansion of PROP accounts accruing
interest. The following sections discuss these and other factors in detail.
Assets and Liabilities
Funding Trends
Funded Ratio, Assets, Liabilities and Year over Year Growth
Fiscal Year (12/31) 2000 2002 2004 2006 2008 2010 2012 2014 2016
Funded Ratio 85.91% 73.67% 78.58% 77.93% 72.65% 71.24% 68.25% 72.72% 67.53%
Am Period (years) 15 32 24 22 34.9 53.6 49.6 39.1 104
UAAL (in millions) $9.99 $20.14 $18.90 $22.36 $31.73 $36.93 $42.80 $39.41 $52.87
AVA (in millions) $60.92 $56.38 $69.32 $78.96 $84.29 $91.47 $92.03 $105.07 $109.97
AVA Growth (YoY) - -3.80% 10.88% 6.73% 3.32% 4.17% 0.31% 6.85% 2.31%
AAL (in millions) $70.91 $76.52 $88.22 $101.32 $116.02 $128.40 $134.84 $144.48 $162.84
AAL Growth (YoY) - 3.88% 7.37% 7.17% 7.01% 5.20% 2.48% 3.51% 6.16%
Beaumont Fire’s actuarial accrued liability (AAL) increased by nearly 130% between 2000 and 2016. The
Fund’s actuarial value of assets (AVA) increased by only 80% over the same period. The Fund was nearly
85% funded in 2000 but fell to just above 67% in 2016.
The graph below illustrates that the increase in the UAAL for the Fund was primarily caused by investment
returns being lower than assumed and contributions being less than the ADC since 2000. Investment
returns being lower than assumed accounted for over $41 million in UAAL growth and contributions being
below the normal cost and interest on the UAAL accounted for nearly $19 million in UAAL growth. Other
factors such as plan amendments, changes in assumptions and methods, and demographic experiences
contributed to a roughly $17.5 million reduction in the UAAL.

Intensive Actuarial Review: Beaumont Firemen’s Relief and Retirement Fund
18
8
Investment Assumption and Returns
The 10-year net return on investments in 2016 was 3.77%, which is more than 420 basis points below its
assumed interest rate. While most plans have been experiencing a difficult 10-year period since the 2008-
2009 market downturn, Beaumont Fire's returns are the lowest 10-year average returns reported by its
peer group (the 11 largest TLFFRA plans in Texas) over the same period, which is roughly 5.14%. PRB’s AV
Supplemental Report dated March 1, 2017 showed that out of 91 Texas Funds that reported a 10-year net
investment return, Beaumont Fire stood at 69th.
Asset Allocation
As shown in the chart below, the Fund’s actual asset allocation is close to its target allocation and within
the ranges of the Fund's Investment Policy Statement.
Asset Allocation
Asset Class Equities Fixed Income Alternatives Real Estate Other
Current Allocation 63.03% 22.58% 6.26% 5.31% 2.82%
Target Allocation 62.50% 25.00% 7.50% 5.00% 0.00%
Cash flow
Beaumont Fire has the lowest non-investment cash flow among its peers. In 2016 the Fund’s non-
investment cash flow dipped to -4.27%, a large drop from before the market downturn in 2008 (-0.58%).
The large dips in 2002 and 2007 were due to a decrease in total contributions received and large increases
8 The gains in the “Other” category consist of plan amendments, changes in assumptions and methods, and demographic experience. The PRB does not have sufficient detail to outline the exact split between the remaining items.
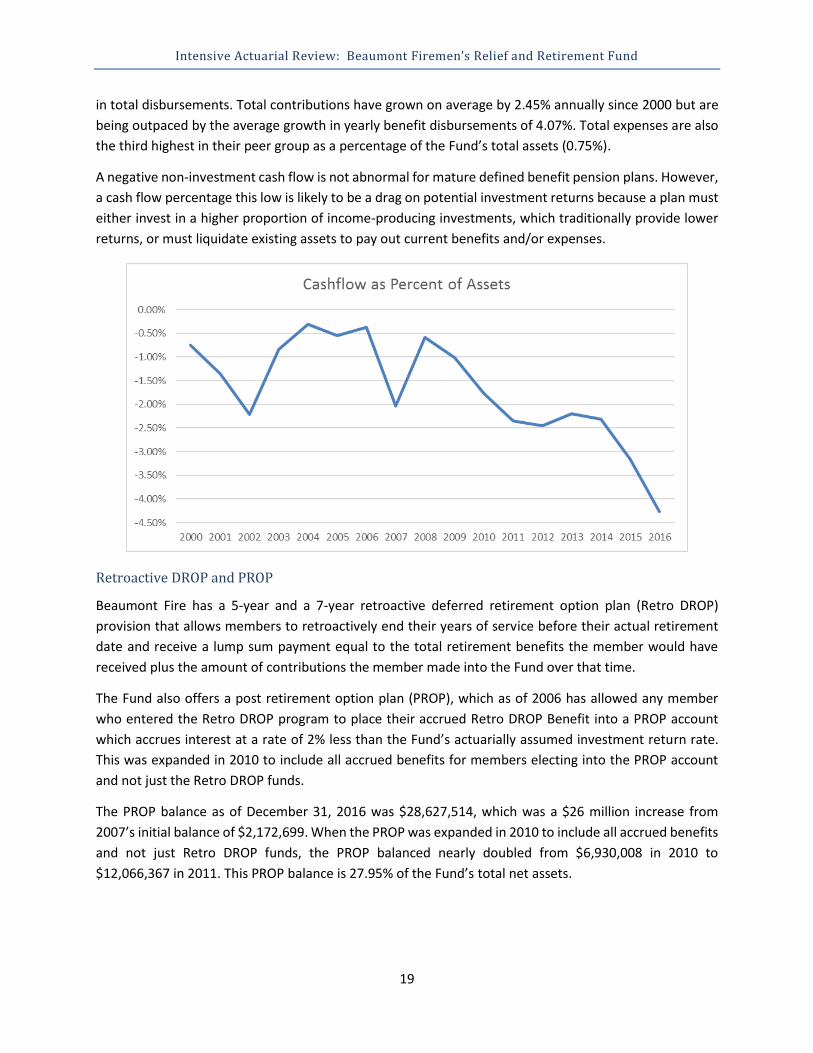
Intensive Actuarial Review: Beaumont Firemen’s Relief and Retirement Fund
19
in total disbursements. Total contributions have grown on average by 2.45% annually since 2000 but are
being outpaced by the average growth in yearly benefit disbursements of 4.07%. Total expenses are also
the third highest in their peer group as a percentage of the Fund’s total assets (0.75%).
A negative non-investment cash flow is not abnormal for mature defined benefit pension plans. However,
a cash flow percentage this low is likely to be a drag on potential investment returns because a plan must
either invest in a higher proportion of income-producing investments, which traditionally provide lower
returns, or must liquidate existing assets to pay out current benefits and/or expenses.
Retroactive DROP and PROP
Beaumont Fire has a 5-year and a 7-year retroactive deferred retirement option plan (Retro DROP)
provision that allows members to retroactively end their years of service before their actual retirement
date and receive a lump sum payment equal to the total retirement benefits the member would have
received plus the amount of contributions the member made into the Fund over that time.
The Fund also offers a post retirement option plan (PROP), which as of 2006 has allowed any member
who entered the Retro DROP program to place their accrued Retro DROP Benefit into a PROP account
which accrues interest at a rate of 2% less than the Fund’s actuarially assumed investment return rate.
This was expanded in 2010 to include all accrued benefits for members electing into the PROP account
and not just the Retro DROP funds.
The PROP balance as of December 31, 2016 was $28,627,514, which was a $26 million increase from
2007’s initial balance of $2,172,699. When the PROP was expanded in 2010 to include all accrued benefits
and not just Retro DROP funds, the PROP balanced nearly doubled from $6,930,008 in 2010 to
$12,066,367 in 2011. This PROP balance is 27.95% of the Fund’s total net assets.

Intensive Actuarial Review: Beaumont Firemen’s Relief and Retirement Fund
20
Peer Group Key Metric Comparison
Funding Val Metrics Fiscal Year End Metrics
Peer Group Plans MVA Am Period
Date Am
Period Funded
Ratio UAAL as % of Payroll
Assumed Interest
Payroll Growth FYE
Actual Cont. as % of ADC
DROP as % of FNP
Non-Investment
Cash Flow as % of FNP
Lubbock Fire Pension Fund $ 176,016,821 12/31/2016 33.5 72.63% 240.47% 7.75% 4.00% 12/31/2016 100.00% N/A -3.63%
Irving Firemen's Relief & Retirement Fund
$ 174,037,587 12/31/2015 33.0 74.92% 228.54% 8.25% 4.25% 12/31/2016 82.33% 29.63% -1.24%
Amarillo Firemen's Relief & Retirement Fund
$ 144,657,881 12/31/2015 34.5 81.82% 172.47% 8.00% 4.00% 12/31/2016 93.92% N/A -3.76%
Corpus Christi Fire Fighters' Retirement System
$ 133,901,631 12/31/2016 23.1 62.14% 265.57% 7.75% 3.50% 12/31/2016 100.00% N/A -3.04%
Laredo Firefighters Retirement System
$ 126,305,204 9/30/2016 28.0 59.28% 263.00% 7.90% 3.25% 9/30/2016 100.17% N/A 1.58%
Beaumont Firemen's Relief & Retirement Fund
$ 102,435,664 12/31/2016 104.0 67.53% 274.69% 8.00% 3.50% 12/31/2016 74.37% 27.95% -4.27%
Midland Firemen's Relief & Retirement Fund
$ 80,942,385 12/31/2015 44.7 65.78% 264.77% 8.00% 4.50% 12/31/2016 89.77% 0.32% -2.44%
Denton Firemen's Relief & Retirement Fund
$ 67,976,717 12/31/2015 31.6 80.82% 115.26% 6.75% 3.00% 12/31/2016 94.99% N/A 0.42%
Tyler Firemen's Relief & Retirement Fund
$ 59,949,406 12/31/2015 21.6 75.87% 178.30% 7.65% 3.50% 12/31/2016 106.92% N/A -4.21%
San Angelo Firemen's Relief & Retirement Fund
$ 58,272,932 12/31/2015 38.5 65.65% 280.71% 7.90% 3.50% 12/31/2016 85.40% N/A -4.19%
Abilene Firemen's Relief & Retirement Fund
$ 52,343,510 10/1/2015 31.5 56.60% 316.19% 8.00% 4.00% 9/30/2016 97.77% N/A -3.35%

Intensive Actuarial Review: Beaumont Firemen’s Relief and Retirement Fund
21
Peer Group Sponsor Funding Comparison
Peer Group Plans GF Expend EOY GF Bal UAAL Expected Employer
Contributions ADC 30-yr Shortfall 30-Y SF % of
ADC 30-Y SF % of
GFE
Lubbock Fire Pension Fund $ 162,139,351 $ 35,673,526 $ 73,353,115 $ 6,652,807 $ 6,878,532 $ 225,725 3.28% 0.14%
Irving Firemen's Relief & Retirement Fund
$ 216,852,808 $ 57,666,475 $ 61,873,333 $ 4,534,842 $ 5,146,707 $ 611,865 11.89% 0.28%
Amarillo Firemen's Relief & Retirement Fund
$ 157,909,148 $ 48,079,850 $ 33,128,756 $ 3,759,167 $ 3,884,024 $ 124,857 3.21% 0.08%
Corpus Christi Fire Fighters' Retirement System
$ 218,749,071 $ 41,873,537 $ 85,995,868 $ 6,728,823 $ 6,728,823 $ - 0.00% 0.00%
Laredo Firefighters Retirement System
$ 173,176,192 $ 42,167,732 $ 87,733,185 $ 7,047,691 $ 7,861,156 $ 813,465 10.35% 0.47%
Beaumont Firemen's Relief & Retirement Fund
$ 115,988,300 $ 26,709,699 $ 52,869,076 $ 2,911,034 $ 3,882,020 $ 970,986 25.01% 0.84%
Midland Firemen's Relief & Retirement Fund
$ 116,701,277 $ 62,991,568 $ 44,243,979 $ 3,795,617 $ 4,176,888 $ 381,271 9.13% 0.33%
Denton Firemen's Relief & Retirement Fund
$ 97,686,459 $ 28,169,848 $ 17,249,607 $ 2,319,631 $ 2,743,151 $ 423,520 15.44% 0.43%
Tyler Firemen's Relief & Retirement Fund
$ 66,287,413 $ 14,908,722 $ 20,639,623 $ 2,257,337 $ 2,257,337 $ - 0.00% 0.00%
San Angelo Firemen's Relief & Retirement Fund
$ 72,209,393 $ 38,842,353 $ 32,163,039 $ 2,314,444 $ 2,714,316 $ 399,872 14.73% 0.55%
Abilene Firemen's Relief & Retirement Fund
$ 81,777,971 $ 26,458,762 $ 43,412,430 $ 2,642,987 $ 2,703,398 $ 60,411 2.23% 0.07%

Intensive Actuarial Review: Beaumont Firemen’s Relief and Retirement Fund
22
Peer Group Expense Comparison
Peer Group Plans
10 yr. return (Net)
Active/ Annuitants
Average Benefit NPL
Admin Expenses
Investment Expenses
Other Expenses
Total Expenses
Exp as % of Assets
Lubbock Fire Pension Fund 4.39%
1.39 $ 54,610 $ 90,715,999 $ 322,882 $ 651,091 $ - $ 973,973 0.55%
Irving Firemen's Relief & Retirement Fund
5.28% 2 $ 50,297 $ 76,692,304 $ 76,887 $ 1,391,083 $ 35,044 $ 1,503,014 0.81%
Amarillo Firemen's Relief & Retirement Fund
6.80%
1.26 $ 53,329 $ 37,044,636 $ 80,849 $ 388,013 $ - $ 468,862 0.31%
Corpus Christi Fire Fighters' Retirement System
5.53%
1.35 $ 44,113 $ 91,671,329 $ 257,440 $ 456,800 $ - $ 714,240 0.53%
Laredo Firefighters Retirement System
4.33%
2.24 $ 55,268 $ 93,600,365 $ 209,946 $ 340,343 $ - $ 550,289 0.44%
Beaumont Firemen's Relief & Retirement Fund
3.77%
1.07 $ 41,483 $ 91,716,980 $ 479,503 $ 292,841 $ - $ 772,344 0.75%
Midland Firemen's Relief & Retirement Fund
3.88%
1.28 $ 42,246 $ 57,751,765 $ 139,980 $ 631,166 $ 111,641 $ 882,787 1.07%
Denton Firemen's Relief & Retirement Fund
6.52%
2.15 $ 50,235 $ 19,593,428 $ 94,175 $ 80,181 $ - $ 174,356 0.23%
Tyler Firemen's Relief & Retirement Fund
4.77%
1.55 $ 59,999 $ 25,419,271 $ 54,206 $ 128,637 $ - $ 182,843 0.29%
San Angelo Firemen's Relief & Retirement Fund
6.34%
1.20 $ 41,084 $ 41,242,389 $ 55,543 $ 239,681 $ 19,648 $ 314,872 0.52%
Abilene Firemen's Relief & Retirement Fund
4.96%
0.99 $ 33,920 $ 49,270,713 $ 40,529 $ 196,829 $ - $ 237,358 0.43%

Intensive Actuarial Review: Beaumont Firemen’s Relief and Retirement Fund
23
Comments from Beaumont Firemen’s Relief and Retirement Fund


Texas Pension Review Board
2017-2018 Biennial Report
IV
APPENDIX A4 – INTENSIVE ACTUARIAL REVIEW – MARSHALL
FIREMEN'S RELIEF AND RETIREMENT FUND

Intensive Actuarial Review: Marshall Firemen’s Relief and Retirement Fund
April 2018

Intensive Actuarial Review: Marshall Firemen’s Relief and Retirement Fund
Table of Contents Executive Summary ....................................................................................................................................... 1
Introduction .............................................................................................................................................. 1
Overview ................................................................................................................................................... 1
Conclusion ................................................................................................................................................. 1
Background ................................................................................................................................................... 2
Risk Analysis .................................................................................................................................................. 3
Funding Risk .............................................................................................................................................. 3
Background ........................................................................................................................................... 3
Fixed-Rate Funding Model and Contribution Insufficiency Risk ........................................................... 3
Benefit Adjustments ............................................................................................................................. 5
Investment Experience Compared with Investment Return Assumption ............................................ 5
Conclusion/Recommendations ............................................................................................................. 7
Governance Risk ........................................................................................................................................ 8
Background ........................................................................................................................................... 8
Funding Soundness Restoration Plan ................................................................................................... 9
Conclusion/Recommendation .............................................................................................................. 9
Appendix ..................................................................................................................................................... 11
Key Metrics ............................................................................................................................................. 12
Plan Summary ......................................................................................................................................... 14
Benefits ............................................................................................................................................... 14
Contributions ...................................................................................................................................... 14
Membership ........................................................................................................................................ 14
TLFFRA Board Structure ...................................................................................................................... 15
Contribution and Benefit Decision-Making ........................................................................................ 15
Funding Soundness Restoration Plan ................................................................................................. 15
Historical Trends ..................................................................................................................................... 16
Assets and Liabilities ........................................................................................................................... 16
Investment Assumption and Returns ................................................................................................. 17
Asset Allocation .................................................................................................................................. 18
Payroll Growth .................................................................................................................................... 18
Cash Flow ............................................................................................................................................ 18
DROP ................................................................................................................................................... 19
Peer Group Key Metric Comparison ....................................................................................................... 20
Peer Group Sponsor Funding Comparison .............................................................................................. 21
Peer Group Expense Comparison ........................................................................................................... 22
Comments from Marshall Firemen’s Relief and Retirement Fund ............................................................. 23

Intensive Actuarial Review: Marshall Firemen’s Relief and Retirement Fund
1
Executive Summary
Introduction
This intensive actuarial review of Marshall Firemen’s Relief and Retirement Fund (“Marshall Fire” or “the
Fund”) is intended to assist the Fund’s board of trustees and the City of Marshall (“the City”) in assessing
the Fund’s ability to meet its long-term pension obligation. Overall, the review shows the Fund is facing
significant financial stress and is taking considerable risks in its approach to funding. The Pension Review
Board encourages the Fund and the City to review the findings and conclusions of this report carefully
and jointly adopt a forward-looking plan to address these risks and guide the Fund towards a path of
long-term sustainability. The Pension Review Board can provide technical assistance in formulating such
a plan.
Overview
Marshall Fire’s unfunded actuarially accrued liability (UAAL or "unfunded liability") increased from $4.5
million in 2002 to $10.6 million by the end of 2016, and the Fund has routinely maintained an asset-to-
liability ratio less than 50%. This chronic underfunding can be primarily attributed to actual investment
returns consistently being lower than the assumed investment return and regularly contributing less
than the annual benefit accrual plus growth of existing unfunded benefits. At current contribution rates
and benefit levels, the unfunded liability can be expected to continue to grow and the funded status to
continue to languish. Constantly underfunding a plan places the benefits of both retirees and active
members at significant risk and/or places the burden of paying for services already rendered on future
generations of taxpayers and employees through the reduction of future benefits or an increase in
contributions. Marshall Fire and the City have made incremental contribution increases since 2006, but
these changes have not been enough to put the fund on a solid path to sustainability. Marshall Fire and
the City have yet to make difficult decisions on additional needed changes to benefit or contribution
levels.
Conclusion
Marshall Fire should consider the following actions to help ensure financial stability and mitigate the
risks that lead to underfunding: ensuring contributions are adequate to fully fund Marshall Fire over a
reasonable period; developing formal policies to guide decision-makers under different economic
conditions; reviewing actuarial assumptions against actual experience and making necessary changes;
and monitoring investment performance and evaluating asset allocation decisions on a forward-looking
basis.
In addition, plans and their sponsors can develop policies that proactively manage risk in the future by
laying out a formal risk-sharing plan. Funding and benefit policies can be adopted that provide a
framework for how benefit and contribution levels may be modified under different conditions. An
advantage of such policies is that changes to plan benefits and costs are known and understood by all
parties in advance, rather than negotiated under difficult circumstances. Marshall Fire in conjunction
with the City should utilize the funding soundness restoration plan requirement to develop such a long-
term funding policy.

Intensive Actuarial Review: Marshall Firemen’s Relief and Retirement Fund
2
Background
Texas Government Code Section 801.202(2) requires the Pension Review Board (PRB) to conduct
intensive studies of potential or existing problems that threaten the actuarial soundness of or inhibit an
equitable distribution of benefits in one or more public retirement systems. The PRB identified the
following key metrics, in addition to amortization period, to determine and prioritize retirement systems
for intensive actuarial review. The PRB selected Marshall Firemen’s Relief and Retirement Fund
(“Marshall Fire” or “the Fund”) for review based on the 2016 actuarial valuation data shown below.
Unless otherwise noted, the following metrics were reported or calculated as of December 31, 2016.
Amort. Period (Years)
Funded Ratio
UAAL as % of Payroll
Assumed Rate of Return
Payroll Growth
Rate
Actual Cont. as % of ADC1
DROP as % of FNP
Non-Investment Cash Flow as
% of FNP
56.4 42.02 398.51% 7.75% 4.00% 78.11% 3.99% -5.50%
Contribution, DROP and cash flow data are from the Fund’s 12/31/2016 financial audit.
At the time the Fund was selected for review:
• Its funded ratio was the second lowest of all
defined benefit pension plans in Texas.
• Its amortization period was the fifth highest finite
period of all defined benefit pension plans in Texas.
• Its unfunded actuarial accrued liability (UAAL or
"unfunded liability") as a percent of payroll was the
second highest among Texas Local Fire Fighter Retirement
Act (TLFFRA) plans with assets of less than $12 million and
the fifth highest of all defined benefit pension plans in
Texas.
• Actual contribution as a percent of its actuarially
determined contribution (ADC) was the second lowest
among TLFFRA plans with assets of less than $12 million.
• Its non-investment cash flow as a percent of assets was the 12th lowest of all defined benefit
pension plans in Texas.
• Its assumed rate of return was 7.75%, but the Fund reported to the PRB in February 2018 that it
has since been lowered to 7.50%.
1 For plans whose contributions are made as a fixed rate based on statutory or contractual requirements, the ADC for this purpose is the contribution needed to fund the benefits accrued in the current year and maintain an amortization period that does not exceed 30 years, as required to be reported under Texas Government Code §802.101(a).
Plan Profile
Actuarial Accrued Liability: $18,353,876
Market Value of Assets: $7,712,228
Normal Cost: 16.39% of payroll
Contributions: 14.0% employee 19.05% employer
Membership: 49 active 47 annuitants
Social Security Participation: No

Intensive Actuarial Review: Marshall Firemen’s Relief and Retirement Fund
3
Risk Analysis
The various risks faced by a pension fund all boil down to one relatively simple question, “Will there be
enough money to pay benefits when due?” This section discusses two main risk factors facing the Fund:
governance and funding risks. Measuring Marshall Fire based on these factors reveals a significant
amount of risk being taken in each of these areas, increasing the probability of a continued period of
severe financial stress for the Fund. This also raises the likelihood of deteriorating funding conditions in
the coming years, further imperiling the Fund’s ability to pay promised benefits.
Funding Risk
Marshall Fire’s significant growth in unfunded liability, which increased from $4.5 million in 2002 to
$10.6 million by the end of 2016, can be attributed to many factors including: actual returns consistently
lower than the assumed investment return; contributions consistently lower than the annual benefit
accrual plus growth of existing unfunded benefits; and adjustments to the fund’s assumptions.
Background
According to Marshall Fire’s December 31, 2016 actuarial valuation, it was 42% funded on an actuarial
basis, and according to reports filed with the PRB, it has not had a funded ratio above 55% for at least
the past 15 years.
For a plan’s funding level to improve, its assets should grow faster than liabilities, which can be achieved
by three key levers: contribution increases, benefit reductions to lower cost, and/or consistently high
investment returns over a long period of time.
Fixed-Rate Funding Model and Contribution Insufficiency Risk
Most Texas plans use a fixed percent of pay funding approach. This is especially true for plans governed
by the TLFFRA statute. Under a fixed-rate funding structure, no formal amortization policy (i.e. the
expected time to fully fund the plan) exists; therefore, the plan’s actuary estimates the amortization
0.00%
10.00%
20.00%
30.00%
40.00%
50.00%
60.00%
2002 2004 2006 2008 2010 2012 2014 2016
Funded Ratio
45.73%42.02%

Intensive Actuarial Review: Marshall Firemen’s Relief and Retirement Fund
4
period at each valuation date based on the current financial condition of the plan and the current
contribution rates.
The nature of a fixed-rate, percent-of-pay contribution policy may exacerbate this risk over the long-
term because:
1) Contributions to percent-of-pay plans are inherently back-loaded because the expected
contributions to a percent-of-pay plan grow on a nominal basis at the assumed rate of total
payroll growth.
2) Fixed-rate plans provide budgetary stability for the employer in the short term, but do not
include any inherent mechanisms for reacting to changes in a plan’s financial condition.
Currently, active members of the Fund contribute 14.00% and the City contributes 19.05% of pay. This
reflects an increase in the active members’ and multiple increases in the City’s contribution rate over
the past 15 years. Despite these increases, during this period the Fund’s unfunded liability increased by
$6.1 million. This increase in the UAAL was caused by total contributions that were not sufficient to
cover the cost of both the new benefits being accrued (normal cost) and the interest accumulated on
the unfunded benefits already earned (amortization payment), or to start reducing the total UAAL. This
resulted in negative amortization because contributions were not sufficient or large enough to cover the
interest that accrues on the unfunded liability or pay down the unfunded liability during the year. In
part, this can be attributed to the lack of a written funding policy and the nature of contributions that
are a fixed-rate of pay set through statute or negotiation.
According to its actuarial valuations, Marshall Fire has not received the reported ADC in any year since
2002, with the exceptions of 2006 and 2010. Even with contribution increases in 2006, 2010, and 2012,
employer contributions have averaged less than 90% of the Fund’s ADC over that period. Furthermore,
the reported ADC is calculated using an open amortization period that results in perpetual negative
amortization. If the fund were to use this ADC as a funding policy, the UAAL would grow indefinitely and
the “pension debt” would never be paid off.
For the fiscal year ending December 31, 2016, the expected contributions were about 78% of the
reported ADC. This shortfall of $142,596 is equal to 0.70% of the City’s total General Fund expenditures
for the fiscal year ending December 31, 2016 and is the highest among TLFFRA plans of similar size.
Contribution Levels vs. Actuarially Determined Contribution
Date (12/31) 2002 2004 2006 2008 2010 2012 2014 2016
Employee Contribution 12.00% 12.00% 14.00% 14.00% 14.00% 14.00% 14.00% 14.00%
Employer Contribution 14.00% 14.00% 16.00% 16.00% 18.69% 19.05% 19.05% 19.05%
Employer 30-Year ADC 18.27% 16.20% 13.69% 20.91% 18.30% 21.51% 22.50% 24.39%
% of ADC funded 76.63% 86.42% 116.87% 76.52% 102.13% 88.56% 84.67% 78.11% Covered Payroll (in thousands) $1,581 $1,617 $1,916 $2,064 $2,218 $2,399 $2,466 $2,670 Contribution Shortfall (in thousands) $68 $36 - $101 - $59 $85 $143
The projection below illustrates the expected total contributions (both employer and employee) under 3
contribution scenarios. The scenarios are 1) maintaining the current fixed contribution rates; 2) adopting
a funding policy that utilizes a 30-year open amortization approach; and 3) adopting a funding policy

Intensive Actuarial Review: Marshall Firemen’s Relief and Retirement Fund
5
that utilizes a single-layer 30-year closed amortization approach (i.e. will fully fund the plan in 30 years).
As illustrated here, the Fund’s current fixed contribution structure under Scenario 1 is not sufficient to
pay down the unfunded liability and in fact allows the UAAL to continue to grow, resulting in negative
amortization.
2
Benefit Adjustments
Benefit changes can be utilized as another lever by public pension plans to reduce cost and address a
prolonged, low funding level. Marshall Fire has not made any benefit changes for current or future
members of the fund to address its chronic funding shortfall. To the contrary, in 2007 the Fund gave a
one-time 3% cost of living adjustment to retirees and 2% to beneficiaries, which may have contributed
to the increase in the unfunded liability in the 2007–2008 period.
Investment Experience Compared with Investment Return Assumption
For Marshall Fire, actual investment returns lower than the assumed investment return increased the
UAAL by more than $2.1 million between 2006 and 2016. As illustrated below, the Fund has not
achieved a 7.75% annualized return over a consecutive 10-year period in any of the 12 periods ending
December 31, 2005 through December 31, 2016.
2 The updated assumed rate of return of 7.50% was used for this projection. All other current and projected assets and liabilities reflect the actuarial accrued liabilities, actuarial value of assets, plan provisions, and actuarial assumptions and methods as reported in the 12/31/2016 Actuarial Valuation prepared by Retirement Horizons Incorporated.
0.00%
5.00%
10.00%
15.00%
20.00%
25.00%
30.00%
35.00%
40.00%
45.00%
2016 2021 2026 2031 2036 2041 2046
Projected Total Contribution (% of Pay)Under Alternative Scenarios2
Fixed Rate Contribution = 33.05% 30 Year Open ADC 30 Year Closed ADC

Intensive Actuarial Review: Marshall Firemen’s Relief and Retirement Fund
6
The graph below projects the funded ratio for the next 30 years, assuming the member and the City
contribution rates remain at a fixed 14.00% and 19.05% respectively, and the investments return 6.50%,
7.50%, or 8.50%. The impact of consistently earning less than the expected return on assets (EROA) but
even as high as 6.50% over the next 30 years, results in the funded status sinking to 31%. Earning 8.50%
over the next 30 years would put Marshall Fire at 82% funded. However, based on the current asset
allocation, the PRB estimates the probability of earning less than or equal to a 6.50% annualized return
is approximately twice as likely as achieving an 8.50% or greater annualized return over the next 30-year
period.
8.00%7.75%
0.00%
1.00%
2.00%
3.00%
4.00%
5.00%
6.00%
7.00%
8.00%
9.00%
2005 2006 2007 2008 2009 2010 2011 2012 2013 2014 2015 2016
Actual 10-Year Annualized Returns vs. Assumed Returns
10-Yr Compound Ann Return Assumed Investment Return

Intensive Actuarial Review: Marshall Firemen’s Relief and Retirement Fund
7
3
Conclusion/Recommendations
Pre-funding a defined benefit plan, i.e. setting aside assets now for benefits that will be paid in the
future, is necessary to help balance the three primary policy goals of benefit security, equity between
generations of taxpayers and employees, and a stable contribution from year to year. Consistently
underfunding a plan places the benefits of both retirees and active members at significant risk and/or
places the burden of paying for services already rendered on future generations of taxpayers and
employees through the reduction of future benefits or an increase in contributions.
In the absence of a formal, written funding and risk-sharing policy, the result is a de facto risk-sharing
arrangement that is simply a reaction to events, often well after the plan finds itself with financial
difficulties. Plans and their sponsors can take many actions to ensure financial stability and mitigate the
risks that lead to underfunding. These steps include ensuring contributions are adequate to fully fund
the plan over a reasonable period; developing formal policies to guide decision-makers under different
economic conditions; reviewing actuarial assumptions against actual experience and making necessary
changes; and monitoring investment performance and evaluating asset allocation decisions on a
forward-looking basis.
Adequate Funding. To address these concerns, a strong funding policy that requires payment of an ADC
is encouraged. Numerous actuarial methods can be utilized to help mitigate contribution volatility,
including directly smoothing contribution rates or adding “guardrails” that require the stakeholders to
come back to the table if the contribution rate falls outside a specified range. If funding according to an
3 The updated assumed rate of return is 7.50% was used for this projection. All other current and projected assets and liabilities reflect the actuarial accrued liabilities, actuarial value of assets, plan provisions, and actuarial assumptions and methods as reported in the 12/31/2016 Actuarial Valuation prepared by Retirement Horizons Incorporated.
0.00%
20.00%
40.00%
60.00%
80.00%
100.00%
2016 2021 2026 2031 2036 2041 2046
Funded Ratio Projections Based onAlternative Investment Return Scenarios3
6.50% Return Scenario 7.50% Return Scenario 8.50% Return Scenario

Intensive Actuarial Review: Marshall Firemen’s Relief and Retirement Fund
8
ADC is not adopted, a funding policy that fully funds the plan over a finite period, such as 30 years, is
recommended.
Actuarial Assumptions. Public pension plans must monitor actuarial assumptions continually through
their actuarial valuations and make appropriate adjustments to mitigate bias in the assumptions that
result in consistent actuarial gains or losses. Actuarial gains and losses occur when the plan’s actual
experience does not match expected experience. Over time, without required changes, pension funds
such as Marshall Fire whose assumptions consistently diverge from actual experience in the same
direction (i.e. consistently seeing actuarial gains or consistently seeing actuarial losses) can exacerbate
the issue of intergenerational inequity, causing one group of members and taxpayers to over- or under-
pay. Boards of trustees should work with their actuaries and other consultants to ensure assumptions
are neither too aggressive nor too conservative, while striving to maintain (or achieve) sound fiscal
health to secure existing accrued benefits. PRB’s Pension Funding Guidelines recommend systems to
monitor, review, and report the impact of actual plan experience on actuarial assumptions at least once
every five years.
Investment Performance. Whatever the investment return assumption used, investment returns should
be closely monitored, and investment managers’ performance should be assessed regularly and
compared to appropriate asset class benchmarks. Benchmarks should be reviewed to see if they have
been met or exceeded, and should be viewed considering the risk taken to achieve those returns. Best
practices also include revisiting investment manager selection periodically, with boards of trustees
evaluating managers’ performance, fees, and whether their current managers are providing the highest
possible value at the lowest possible cost. The asset allocation should also be assessed from a risk
perspective to provide insight into how the fund would weather a market correction.
Governance Risk
When public pension plans and their sponsors wait too long to address them, the funding challenges
compounding over time can reach a point where small, incremental improvement, such as the
contribution increases made for Marshall Fire, are not sufficient to make consistent, long-term
improvements to the overall health of the plan. Marshall Fire and the City have yet to make difficult
decisions on additional needed changes to benefit or contribution levels. If necessary changes are
ultimately made, they may right the ship, but they will potentially be made under less than ideal
conditions.
Background
Governance is essentially decision-making, and decision-making for public pension plans must balance
the competing interests of plans and their sponsors and should feature collaboration between the two.
The primary source of governance risk is the potential lack of involvement of key parties or stakeholders
(members, the sponsor government, and taxpayers) in important areas of decision-making for a pension
plan including plan design (benefits) and funding (contributions). When a key party is not engaged in
important decisions, the risk increases that benefit levels and the contributions required to fund them
will diverge, potentially putting the plan’s funding stability at risk.
Intensive Actuarial Review: Marshall Firemen’s Relief and Retirement Fund
9
For example, TLFFRA allows boards of trustees to make prospective benefit modifications, both
increases and reductions. These changes must be approved by an actuary and a majority of participating
members, and may not deprive an eligible participant of vested accrued benefits. Although jointly
responsible for funding the retirement plan along with plan members, the sponsoring city may have
limited involvement in benefit decision-making, a structure which generates the risk that benefit levels
adopted could be unsustainable.
Benefit increases are not the only potential risk related to a potential lack of sponsor involvement under
TLFFRA; unwillingness to reduce benefits prospectively when necessary to address funding challenges
can be an obstacle to getting things back on track. It should be noted that even plans with very engaged
boards and sponsors can be susceptible to increasing benefits to unsustainable levels in good times or
failing to lower them when necessary in bad times. Governance risk related to an imbalance in decision-
making can only exacerbate these risks. Given the Fund’s historically poor funding levels of under 55%
for the last 15 years, the absence of benefit modification or member contribution increase discussions
by Marshall Fire illustrates this point.
Funding Soundness Restoration Plan
State law recognizes the potential risks of underfunding and a lack of engagement by some key
stakeholders and imposes cooperation between the system and sponsoring governmental entity by
requiring retirement systems having trouble meeting their long-term obligations work with their
sponsors to develop a restoration plan for addressing those issues.4 This framework helps ensure that
both the system and its sponsoring employer are involved in pension plan reform decisions, but it comes
at a point when actuarial health is already threatened. Marshall Fire submitted an FSRP for review on
April 19, 2018. The FSRP proposed some eligibility changes for members hired after December 31, 2018
and additional employer contributions that have not been considered in the analysis contained in this
report. The benefit changes have since been approved, but the increase in employer contributions is still
pending approval by the City. The changes outlined in the FSRP will project an amortization period of
36.5 years in 2026; however, that calculation is contingent upon the City increasing its contribution, nor
does it consider already approved assumption changes (i.e. a reduction in the assumed return on
investments) that will likely result in the plan being out of compliance when it completes its December
31, 2018 actuarial valuation.
Conclusion/Recommendation
Plans and their sponsors can develop policies that proactively manage risk in the future by laying out a
formal risk-sharing plan. To proactively manage governance and funding risk, retirement plans and their
sponsors should work together to adopt written policies far in advance, that can guide them through
both good and bad years and shield against the risk of either party’s exclusion or disengagement from
decision-making. Funding and benefit policies can be adopted that provide a framework for how benefit
4 Texas Government Code 802.2015 and 802.2016 require public retirement systems whose amortization period exceeds 40 years for 2 or 3 consecutive actuarial valuations to develop, with their sponsor, a funding soundness restoration plan designed to bring their amortization period within 40 years over 10 or fewer years.
Intensive Actuarial Review: Marshall Firemen’s Relief and Retirement Fund
10
and contribution levels may be modified under different conditions. An advantage of such policies is that
changes to plan benefits and costs are known and understood by all parties in advance, rather than
negotiated under difficult circumstances.
For example, a funding policy might state that future benefit enhancements, cost of living adjustments,
and/or contribution rate reductions can only be considered or made if the plan's funded ratio remains
greater than a chosen threshold. A funding policy can also state that if the funded ratio falls below a
certain threshold, the stakeholders are required to come back to the table to make necessary
contribution and benefit adjustments. Marshall Fire in conjunction with the City should utilize the
funding soundness restoration plan requirement to develop such a long-term funding policy.

Intensive Actuarial Review: Marshall Firemen’s Relief and Retirement Fund
11
Appendix

Intensive Actuarial Review: Marshall Firemen’s Relief and Retirement Fund
12
Key Metrics
Metric Amortization period (56 years)
What it measures
Approximately how long it would take to fully fund the unfunded actuarial accrued liability (UAAL or "unfunded liability") based on the current funding policy.
Why it is important
Given the Fund’s current assumptions, an amortization period above 17 indicates the contributions to the fund in the coming year are less than the interest accumulated for that same period and therefore the total UAAL is expected to grow over the near term. In addition, for a plan that contributes on a fixed-rate basis such as Marshall Fire, the higher the amortization period, the more sensitive it is to small changes in the UAAL.
Peer Comparison
Marshall Fire currently has the fifth highest finite amortization period of all defined benefit pension plans in Texas.
Metric
Funded ratio (42.02%)
What it measures
The percent of a fund’s actuarially accrued liabilities covered by its actuarial value of assets.
Why it is important
The lower the funded ratio, the fewer assets a fund has to pay its current and future benefit payments.
Peer Comparison
Marshall Fire’s funded ratio is the second lowest of all defined benefit pension plans in Texas.
Metric UAAL as a percent of payroll (398.51%)
What it measures
The size of a plan’s unfunded liability compared to the annual payroll of its active members.
Why it is important
Provides a way to compare plans of various sizes and expresses the outstanding “pension debt” relative to current personnel costs.
Peer comparison
The Fund’s UAAL as a percent of payroll is the second highest among TLFFRA plans with assets of less than $12 million and the fifth highest of all defined benefit pension plans in Texas.
Metric Assumed rate of return (7.75%)
What it measures
The estimated annual rate of return on the Fund’s assets.
Why it is important
If actual future returns are lower than the assumed rate of return, future contributions will need to increase significantly, especially for a poorly funded plan. Marshall Fire’s assumed rate of return was 7.75%, while its actual ten-year investment rate of return for the period ending December 31, 2016 was only 4.67%.
Peer comparison
Marshall Fire has the second highest assumed rate of return in its peer group of TLFFRA plans with assets of less than $12 million.

Intensive Actuarial Review: Marshall Firemen’s Relief and Retirement Fund
13
Metric
Payroll growth rate (4.00%)
What it measures
The estimated annual growth in the total payroll of active members contributing into the Fund.
Why it is important
Contributions are calculated as a percent of active members’ pay and are back-loaded based on the expected growth in total payroll. If payroll does not increase at this rate, actual contributions will not meet those expected in the Fund’s actuarial valuations. Given the fund’s inactive and active liabilities are not fully funded; contributions below expected levels will have serious consequences on the Fund’s long-term solvency.
Peer comparison
The Fund’s payroll growth rate of four percent is tied for the third most aggressive in its peer group of TLFFRA plans with assets of less than $12 million.
Metric Actual contributions as a percent of actuarially determined contribution (78.11%)
What it measures
Whether the current employer contributions have met a theoretical minimum threshold.5
Why it is important
The employer’s portion of the contribution is less than 80% of the amount needed to fund Marshall Fire on a rolling 30-year amortization period. The PRB’s 2014 Study of the Financial Health of Texas Public Retirement Systems found that plans that have consistently received adequate funding are in a better position to meet their long-term obligations.
Peer comparison
This is second largest shortfall percentage in its peer group of TLFFRA plans with assets of less than $12 million.
Metric DROP as a percent of fiduciary net position (3.99%)
What it measures
The amount of the Fund’s assets that are designated for lump-sum payouts to retired members as a percent of its total assets.
Why it is important
Viewing this metric as a percent of total net assets (or fiduciary net position (FNP)) shows how large a decrease in the Fund’s assets could be if most or all DROP participants decided to take their balances out in a short amount of time. As of December 31, 2016, Marshall Fire’s DROP balance was $307,546 and represented 3.99% of the fund’s Fiduciary Net Position (FNP).
5
5 The theoretical minimum threshold, or actuarially determined contribution (ADC), is a target or recommended contribution “to the plan as determined by the actuary using a contribution allocation procedure,” as defined in Actuarial Standards of Practice No 4. If contributions to the plan are made as a fixed rate based on statutory or contractual requirements, the ADC for this purpose is the contribution needed to fund the benefits accrued in the current year and maintain an amortization period that does not exceed 30 years, as required to be reported under Texas Government Code §802.101(a).

Intensive Actuarial Review: Marshall Firemen’s Relief and Retirement Fund
14
Metric Non-investment cash flow as a percent of fiduciary net position (-5.50%)
What it measures
Non-investment cash flow shows how much the plan is receiving through contributions in relation to its outflows: benefit payments, withdrawals and expenses.
Why it is important
Viewing this metric as a percent of total net assets (or fiduciary net position (FNP)), in conjunction with the funded ratio and recognition of the relative maturity of a plan, provides information about the stability of a plan’s funding arrangement.
Peer comparison
Marshall Fire’s non-investment cash flow as a percent of FNP is the 12th lowest of all defined benefit pension plans in Texas. If this trend continues, the Fund could face the potential risk of needing to liquidate a portion of existing assets to pay current benefits and/or expenses.
Plan Summary
The Marshall Firemen’s Relief and Retirement Fund (“Marshall Fire” or “the Fund”) was established in
1992 under the Texas Local Fire Fighter’s Retirement Act (TLFFRA). TLFFRA provides general guidelines
for fund management, but leaves administration, plan design, contributions, and specific investments to
the discretion of the board of trustees. Marshall Fire, as with all TLFFRA systems, is entirely locally-
funded.
Benefits
Retirement Eligibility Age: 50 years; Years of Service: 10 years
Vesting 10 Years of Service
Benefit Formula Years of Service (up to 20 years) x 3.125% x Final Average Salary +$65 per month for each year > 20 Years of Service
Final Average Salary (FAS) Final 78 biweekly average salary
COLA None
Retirement Benefit Options Forward DROP: 3-year maximum. Employee contributions credited; no interest. Eligible at 50 years of age and 20 years of service.
Social Security No
Contributions
Currently, active members of Marshall Fire contribute 14.00% of pay while the City of Marshall (the City)
contributes 19.05% of pay.
Membership
Total Active Members
Retired Members
Beneficiaries Total
Annuitants Total
Members Active-to-
Annuitant Ratio
49 29 8 37 90 1.32

Intensive Actuarial Review: Marshall Firemen’s Relief and Retirement Fund
15
TLFFRA Board Structure
Active Members 3 - Members of the retirement system; elected by fund members. Three-year terms.
Sponsor Government 1 - Mayor or designated representative, or the political subdivision's Chief Operating Officer or designated representative. 1 - Chief Financial Officer of the political subdivision, or designated representative. Terms correspond to term of office.
Taxpayer, Not Affiliated With Fund/Sponsor Govt.
2 - Residents of the State of Texas, must not be officers/employees of the political subdivision; elected by other Board of Trustee members. Two-year terms.
Contribution and Benefit Decision-Making
TLFFRA authorizes members of the retirement systems to determine their contribution rates by voting.
The statute requires cities to contribute the lesser of 12% of pay or the rate at which the active
members contribute. TLFFRA also allows a city to contribute at a higher rate than employees through a
change in city ordinance.
TLFFRA gives the board the power to make decisions to modify the benefits (increases and reductions).
However, a proposed addition or change must be approved by the actuary and a majority of
participating plan members. Benefit changes cannot deprive a member, retiree or beneficiary of the
right to receive vested accrued benefits.
Funding Soundness Restoration Plan
Texas Government Code §802.2015 requires the governing body of a public retirement system and its
governmental sponsor formulate a funding soundness restoration plan if the system’s actuarial
valuation shows its amortization period exceeds 40 years for three consecutive annual actuarial
valuations, or two consecutive actuarial valuations if the system conducts valuations less frequently.
Marshall Fire meets the requirement because the actuarial valuations prepared as of December 31,
2014 and December 31, 2016 reported amortization periods greater than 40 years. Marshall Fire
submitted an FSRP for review on April 19, 2018. The FSRP proposed some eligibility changes for
members hired after December 31, 2018 and additional employer contributions that have not been
considered in the analysis contained in this report. The benefit changes have since been approved, but
the increase in employer contributions are still pending approval by the City. The changes outlined in the
FSRP will project an amortization period of 36.5 years in 2026, however, that calculation is contingent
upon the City increasing its contribution, nor does it consider already approved assumption changes (i.e.
a reduction in the assume return on investments) that will likely result in the plan being out of
compliance when the plan completes its December 31, 2018 actuarial valuation.

Intensive Actuarial Review: Marshall Firemen’s Relief and Retirement Fund
16
Historical Trends
To conduct an intensive review of risks associated with the long-term funding of a pension plan, it is
important to analyze trends in multiple metrics. A plan with an asset level lower than its accrued liability
has insufficient funds to cover benefits. A plan can experience an increase in unfunded liability due to
various factors, including insufficient investment returns, inadequate contributions and inaccurate or
overly aggressive assumptions. Hence, a single metric cannot effectively capture the different drivers
contributing to the increase of a plan’s unfunded pension obligation. This section analyzes historical
trends in various metrics identified by the PRB and makes comparisons to understand the sources of
growth in unfunded liability for Marshall Fire.
The health of Marshall Fire has been deteriorating since the early 2000s. Numerous factors have
contributed to this deterioration, including inadequate contributions, investment returns lower than the
assumed return, and increased benefit payments. The following sections discuss these and other factors
in detail.
Assets and Liabilities
Funding Trends
Funded Ratio, Assets, Liabilities and Year over Year Growth
Date (12/31) 2002 2004 2006 2008 2010 2012 2014 2016
Funded Ratio 45.73% 54.02% 53.93% 37.14% 46.95% 44.18% 46.39% 42.02%
Am Period (years) 55.9 38.3 23.3 51.1 23.5 38.6 43.2 56.4
UAAL (in millions) $4.54 $4.26 $5.08 $8.12 $7.52 $8.83 $9.25 $10.64
AVA (in millions) $3.82 $5.01 $5.95 $4.80 $6.65 $6.99 $8.00 $7.71
AVA Growth (YoY) - 14.50% 8.96% -10.19% 17.76% 2.50% 7.00% -1.84%
AAL (in millions) $8.36 $9.27 $11.03 $12.92 $14.17 $15.82 $17.25 $18.35
AAL Growth (YoY) - 5.35% 9.05% 8.23% 4.74% 5.66% 4.42% 3.14%
Marshall Fire’s actuarial accrued liability (AAL) increased by 119.62% between 2002 and 2016.
Conversely, the Fund’s actuarial value of assets (AVA) only grew by 101.80% over that same period,
resulting in an increase of the UAAL of 134.63%. The funded ratio (AVA/AAL) also fell from 45.73% in
2002 to 42.02% in 2016.

Intensive Actuarial Review: Marshall Firemen’s Relief and Retirement Fund
17
The graph below illustrates that the $5.6 million increase in UAAL (from $5.1 million in 2006 to $10.6
million in 2016) is primarily a result of investment returns lower than the assumed rate of return ($2.1
million increase in UAAL), the annual contribution lower than the normal cost plus the interest
accumulated on the UAAL ($1.6 million increase in UAAL), and changes to actuarial methods and
assumptions ($1.1 million increase in UAAL).
Investment Assumption and Returns
As illustrated above, actual investment returns lower than the assumed investment return increased the
UAAL by more than $2.1 million between 2006 and 2016. While Marshall Fire lowered its assumed rate
of return from 8.00% to 7.75% in 2012, it still exceeds the 2017 national average of 7.52% (reported by
$2.00
$4.00
$6.00
$8.00
$10.00
$12.00
$14.00
$16.00
$18.00
$20.00
2002 2004 2006 2008 2010 2012 2014 2016
in m
illi
on
s
Assets vs. Liabilities
AAL (in millions)
AVA (in millions)
2016 UAAL$10.64 Million
2002 UAAL$4.54 Million
0.00%
5.00%
10.00%
15.00%
20.00%
25.00%
30.00%
35.00%
40.00%
45.00%
Investment return
lower than
assumed
Contribution lower
than normal cost +
interest on UAAL
Actuarial
experience
worse/(better)
than assumed
Changes to
assumptions &
methods
Other
Sources of Change in UAAL 2006-2016
$2,075,741
$1,571,233
$600,553
$1,149,816
$163,878
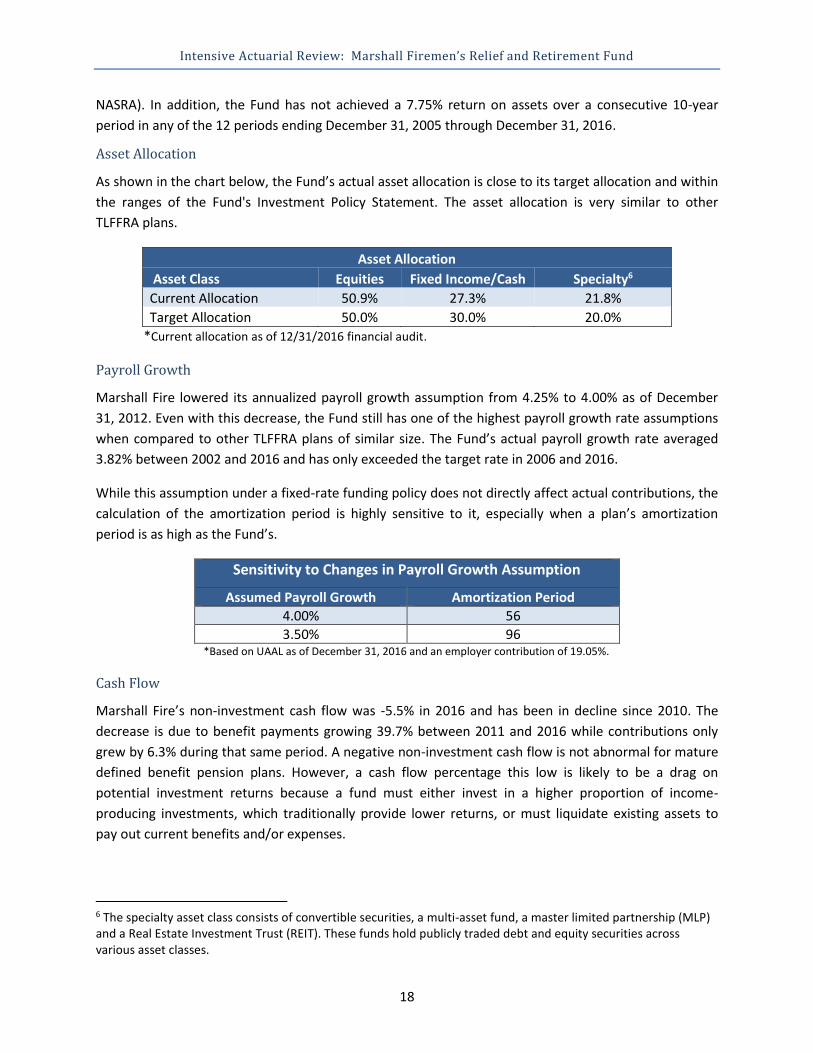
Intensive Actuarial Review: Marshall Firemen’s Relief and Retirement Fund
18
NASRA). In addition, the Fund has not achieved a 7.75% return on assets over a consecutive 10-year
period in any of the 12 periods ending December 31, 2005 through December 31, 2016.
Asset Allocation
As shown in the chart below, the Fund’s actual asset allocation is close to its target allocation and within
the ranges of the Fund's Investment Policy Statement. The asset allocation is very similar to other
TLFFRA plans.
Asset Allocation
Asset Class Equities Fixed Income/Cash Specialty6
Current Allocation 50.9% 27.3% 21.8%
Target Allocation 50.0% 30.0% 20.0%
*Current allocation as of 12/31/2016 financial audit.
Payroll Growth
Marshall Fire lowered its annualized payroll growth assumption from 4.25% to 4.00% as of December
31, 2012. Even with this decrease, the Fund still has one of the highest payroll growth rate assumptions
when compared to other TLFFRA plans of similar size. The Fund’s actual payroll growth rate averaged
3.82% between 2002 and 2016 and has only exceeded the target rate in 2006 and 2016.
While this assumption under a fixed-rate funding policy does not directly affect actual contributions, the
calculation of the amortization period is highly sensitive to it, especially when a plan’s amortization
period is as high as the Fund’s.
Sensitivity to Changes in Payroll Growth Assumption
Assumed Payroll Growth Amortization Period
4.00% 56
3.50% 96 *Based on UAAL as of December 31, 2016 and an employer contribution of 19.05%.
Cash Flow
Marshall Fire’s non-investment cash flow was -5.5% in 2016 and has been in decline since 2010. The
decrease is due to benefit payments growing 39.7% between 2011 and 2016 while contributions only
grew by 6.3% during that same period. A negative non-investment cash flow is not abnormal for mature
defined benefit pension plans. However, a cash flow percentage this low is likely to be a drag on
potential investment returns because a fund must either invest in a higher proportion of income-
producing investments, which traditionally provide lower returns, or must liquidate existing assets to
pay out current benefits and/or expenses.
6 The specialty asset class consists of convertible securities, a multi-asset fund, a master limited partnership (MLP) and a Real Estate Investment Trust (REIT). These funds hold publicly traded debt and equity securities across various asset classes.

Intensive Actuarial Review: Marshall Firemen’s Relief and Retirement Fund
19
DROP
In 2012, Marshall Fire implemented a deferred retirement option plan (DROP) that allows eligible
members to continue to work, but their monthly retirement benefit is calculated as of the date of DROP
election and is deferred until formal retirement. The City and the member will continue to make
contributions to the Fund during this period. Upon formal retirement, the member will begin to receive
their monthly retirement benefit and is then eligible to receive a lump sum payment equal to the total
retirement benefit amount the member would have received plus the amount of contributions, with no
interest, that the member made into the Fund over the 3-year period of DROP participation.
As of December 31, 2016, Marshall Fire’s DROP balance was $307,546 and represented 3.99% of the
fund’s fiduciary net position (FNP). The DROP allows members to participate for a maximum of 3 years
and does not credit interest.
-6%
-4%
-2%
0%
2%
2000 2001 2002 2003 2004 2005 2006 2007 2008 2009 2010 2011 2012 2013 2014 2015 2016
Non-Investment Cash Flow as a Percent of Assets

Intensive Actuarial Review: Marshall Firemen’s Relief and Retirement Fund
20
Peer Group Key Metric Comparison
Funding Val Metrics Fiscal Year End Metrics
Peer Group Plans MVA Am Period
Date Amortization
Period Funded
Ratio UAAL as % of Payroll
Assumed Interest
Payroll Growth FYE
Actual Cont as % of ADC
DROP as % of FNP
Non-Investment Cash Flow as % of
FNP
Big Spring Firemen's Relief & Retirement Fund
$ 11,157,022 1/1/2015 28.7 54.82% 248.61% 8.00% 5.00% 12/31/2016 110.08% 0.00% -9.54%
Weslaco Firemen's Relief & Retirement Fund
$ 9,186,148 9/30/2016 14.1 68.53% 111.07% 7.25% 3.25% 9/30/2016 145.69% N/A 1.33%
Corsicana Firemen's Relief & Retirement Fund
$ 8,344,317 12/31/2016 28.9 53.14% 211.44% 7.00% 3.00% 12/31/2016 100.01% N/A -1.97%
Sweetwater Firemen's Relief & Retirement Fund
$ 8,264,183 12/31/2014 58.8 69.01% 246.28% 8.00% 4.50% 12/31/2016 83.61% N/A -4.60%
Orange Firemen's Relief & Retirement Fund
$ 8,154,674 12/31/2016 69.3 49.86% 336.03%
7.75% 4.00% 12/31/2016 70.49% N/A -7.91%
Marshall Firemen's Relief & Retirement Fund
$ 7,712,228 12/31/2016 56.4 42.02% 398.51% 7.75% 4.00% 12/31/2016 84.67% 3.99% -5.50%
Paris Firefighters' Relief & Retirement Fund
$ 5,461,762 12/31/2014 26.1 42.74% 311.01% 8.00% 4.50% 12/31/2016 100.00% N/A -10.31%
Plainview Firemen's Relief & Retirement Fund
$ 5,296,898 12/31/2015 31.6 37.33% 453.72%
7.75% 3.50% 12/31/2016 87.77% N/A -2.63%
Atlanta Firemen's Relief & Retirement Fund
$ 3,614,929 12/31/2014 36.2 81.87% 130.44% 7.50% 3.00% 12/31/2016 107.62% N/A -1.55%
Brownwood Firemen's Relief & Retirement Fund
$ 3,397,474 12/31/2015 36.1 44.63% 257.78%
7.40% 3.40% 12/31/2016 93.90% N/A 0.32%
San Benito Firemen Relief & Retirement Fund
$ 3,301,643 12/31/2015 21.7 60.52% 156.71%
7.50% 4.00% 9/30/2015 0.00% N/A 0.15%

Intensive Actuarial Review: Marshall Firemen’s Relief and Retirement Fund
21
Peer Group Sponsor Funding Comparison
Peer Group Plans GF Expend EOY GF Bal UAAL
Expected Employer
Contributions ADC 30-yr Shortfall
30-Y SF %
of ADC
30-Y SF %
of GFE
Sweetwater Firemen's Relief & Retirement Fund
$ 8,733,810 $ 3,929,907 $ 3,674,028 $ 238,689 $ 294,781 $ 56,092 19.03% 0.67%
Orange Firemen's Relief & Retirement Fund
$ 17,985,946 $ 8,272,029 $ 8,199,175 $ 341,606 $ 469,709 $ 128,103 27.27% 0.71%
Marshall Firemen's Relief & Retirement Fund
$ 20,353,433 $ 6,537,285 $ 10,641,648 $ 508,698 $ 651,293 $ 142,595 21.89% 0.70%
Plainview Firemen's Relief & Retirement Fund
$ 12,768,715 $ 15,844,471 $ 9,781,866 $ 532,083 $ 606,247 $ 74,164 12.23% 0.58%
Brownwood Firemen's Relief & Retirement Fund
$ 19,316,832 $ 3,038,924 $ 4,563,878 $ 354,088 $ 377,104 $ 23,016 6.10% 0.12%

Intensive Actuarial Review: Marshall Firemen’s Relief and Retirement Fund
22
Peer Group Expense Comparison
Peer Group Plans
10 yr return (Net)
Active/ Annuitants
Average Benefit NPL
Admin Expenses
Investment Expenses
Other Expenses
Total Expenses
Exp as % of Assets
Big Spring Firemen's Relief & Retirement Fund
4.26% 1.27 $ 37,713 $ 9,713,127 $ 100,927 $ - $ - $ 100,927 0.90%
Weslaco Firemen's Relief & Retirement Fund
2.71% 2.21 $ 18,578 $ 4,588,953 $ 45,252 $ 52,746 $ - $ 97,998 1.07%
Corsicana Firemen's Relief & Retirement Fund
3.40% 1.81 $ 31,722 $ 8,837,348 $ 22,168 $ 92,459 $ - $ 114,627 1.37%
Sweetwater Firemen's Relief & Retirement Fund
4.38% 1.04 $ 30,612 $ 4,965,694 $ 41,956 $ 62,322 $ - $ 104,278 1.26%
Orange Firemen's Relief & Retirement Fund
3.72% 0.88 $ 26,036 $ 8,946,685 $ 18,742 $ 93,636 $ - $ 112,378 1.38%
Marshall Firemen's Relief & Retirement Fund
4.67% 1.32 $ 30,632 $ 10,956,850 $ 4,077 $ 45,898 $ - $ 49,975 0.65%
Paris Firefighters' Relief & Retirement Fund
2.16% 1.17 $ 24,491 $ 9,642,566 $ 37,674 $ 32,730 $ - $ 70,404 1.29%
Plainview Firemen's Relief & Retirement Fund
1.95% 1.03 $ 24,050 $ 10,746,840 $ 12,557 $ 49,439 $ 811 $ 62,807 1.19%
Atlanta Firemen's Relief & Retirement Fund
4.84% 1.25 $ 9,039 $ 1,129,175 $ 23,941 $ 25,495 $ - $ 49,436 1.37%
Brownwood Firemen's Relief & Retirement Fund
3.52% 1.28 $ 16,378 $ 5,056,328 $ 35,414 $ 41,080 $ - $ 76,494 2.25%
San Benito Firemen Relief & Retirement Fund
0.94% 2.50 $ 23,082 $ 2,154,088 $ 15,722 $ 38,370 $ - $ 54,092 1.64%

Intensive Actuarial Review: Marshall Firemen’s Relief and Retirement Fund
23
Comments from Marshall Firemen’s Relief and Retirement Fund

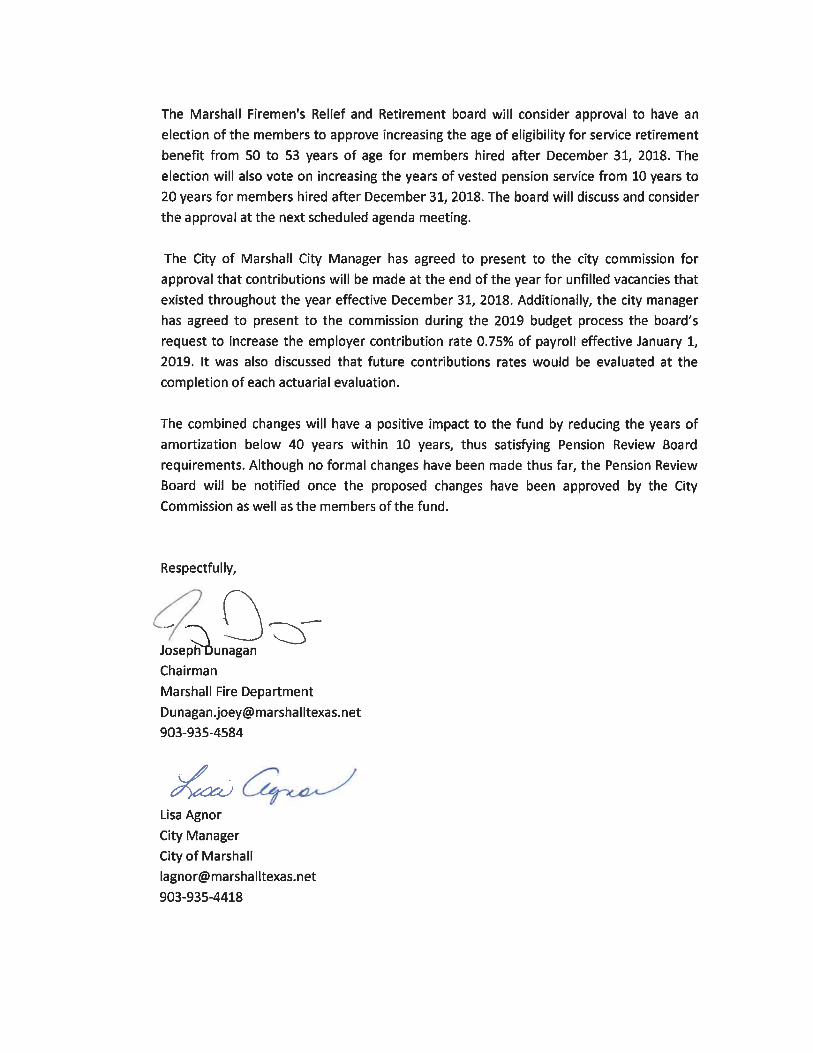

Texas Pension Review Board
2017-2018 Biennial Report
V
APPENDIX A5 - INTENSIVE ACTUARIAL REVIEW – LONGVIEW
FIREMEN'S RELIEF AND RETIREMENT FUND
Intensive Actuarial Review: Longview Firemen’s Relief and Retirement Fund
October 2018

Intensive Actuarial Review: Longview Firemen's Relief & Retirement Fund
Table of Contents Executive Summary ....................................................................................................................................... 1
Background ................................................................................................................................................... 2
Risk Analysis .................................................................................................................................................. 3
Funding Risk .............................................................................................................................................. 3
Liability Experience Compared with Assumptions ................................................................................ 4
Investment Experience and Asset Allocation ........................................................................................ 5
Fixed-Rate Funding Model and Contribution Insufficiency Risk ........................................................... 7
Conclusion/Recommendations ............................................................................................................. 8
Governance Risk...................................................................................................................................... 10
Conclusion/Recommendation ............................................................................................................ 11
Appendix ..................................................................................................................................................... 12
Key Metrics ............................................................................................................................................. 13
Plan Summary ......................................................................................................................................... 16
Benefits ............................................................................................................................................... 16
Contributions ...................................................................................................................................... 16
Membership ........................................................................................................................................ 16
TLFFRA Board Structure ...................................................................................................................... 17
Contribution and Benefit Decision-Making ........................................................................................ 17
Historical Trends ..................................................................................................................................... 17
Assets and Liabilities ........................................................................................................................... 18
Cash flow ............................................................................................................................................. 20
Peer Group Key Metric Comparison ....................................................................................................... 21
Peer Group Sponsor Funding Comparison .............................................................................................. 22
Peer Group Expense Comparison ........................................................................................................... 23
Comments from Longview Firemen’s Relief and Retirement Fund ........................................................ 24

Intensive Actuarial Review: Longview Firemen's Relief & Retirement Fund
1
Executive Summary
Introduction
This intensive actuarial review of Longview Firemen’s Relief and Retirement Fund (“Longview Fire” or
“the Fund”) is intended to assist the Fund’s board of trustees and the City of Longview (“the City”) in
assessing the Fund’s ability to meet its long-term pension obligation.
Longview Fire has been working with the City since 2012 on a four-step plan to increase both the city
and member contributions to improve the Fund. Currently, active members of the Fund contribute
either 15.00% or 17.00% of pay depending on their hire date. The City currently contributes 18.00% and
effective October 2018, the City will contribute 19.00% of pay. The Fund has also made several benefit
reductions for current and future members. These changes have helped to improve the amortization
period to 40.2 years as of the 2017 valuation, compared to 50.7 years at the end of 2016.
Despite these changes, the review shows that at the current contribution rates and benefit levels, the
unfunded liability can be expected to continue to grow and the funded status to continue to languish.
The Pension Review Board (PRB) encourages the Fund and the City to review the findings and
conclusions of this report carefully and jointly adopt a forward-looking plan to address these risks and
guide the Fund towards a path of long-term sustainability. The PRB can provide technical assistance in
formulating such a plan.
Overview
Longview Fire’s unfunded actuarially accrued liability (UAAL or "unfunded liability") increased from
$16.9 million at the end of 2005 to over $50 million by the end of 2017. This chronic underfunding can
be primarily attributed to actual returns consistently lower than the investment return assumption;
repeated liability losses due to adverse experience compared to the Fund’s other assumptions; and
contributions consistently lower than the annual benefit accrual plus growth of existing unfunded
benefits. The Fund is facing substantial financial stress and is taking risks in its approach to funding.
Conclusion
Longview Fire should consider the following additional actions to help ensure financial stability and
mitigate the risks that lead to underfunding: working with its actuaries and other consultants to ensure
assumptions are neither too aggressive nor too conservative; evaluating asset allocation decisions and
appropriate risk levels on a forward-looking basis; developing a more robust investment policy; and
ensuring contributions are adequate to fully fund Longview Fire over a reasonable period.
To address the funding and governance risks, the Fund and the City should develop written funding,
benefit, and investment policies that are linked to provide a formal risk-/cost-sharing arrangement. A
strong funding policy that requires payment of an actuarially determined contribution (ADC) is
encouraged. In addition to helping maintain a sound funding level, putting such forward-looking policies
into place can help reduce uncertainty for stakeholders who would know, in advance, how future
adverse experience will be managed.

Intensive Actuarial Review: Longview Firemen's Relief & Retirement Fund
2
Background
Texas Government Code Section 801.202(2) requires the PRB to conduct intensive studies of potential or
existing problems that threaten the actuarial soundness of or inhibit an equitable distribution of
benefits in one or more public retirement systems. The PRB identified a set of key metrics, in addition to
amortization period, to determine and prioritize retirement systems for intensive actuarial review as
included page 13 of the Appendix. After evaluating these metrics, the PRB selected Longview Firemen’s
Relief and Retirement Fund (“Longview Fire” or “the Fund”) for review. The following data points were
calculated as of the Fund’s December 31, 2016 actuarial valuation and financial audit available to the
PRB at the time the Fund was selected for review in April 2018:
• Its funded ratio of 45.53% was second lowest
among its TLFFRA peer plans and one of the lowest in the
state of Texas.
• The 50.7-year amortization period on its unfunded
actuarial accrued liability was the third highest among its
peers and the sixth highest finite period in the state.
• Its assumed rate of return on assets of 8.00% was
tied for the highest within its peer group and among the
highest in the state.
• Its 383.31% UAAL as a percent of payroll was the
second highest in its peer group and sixth highest in the
state.
• Actual contribution as a percent of its Actuarially Determined Contribution (ADC) of 70.47%
was the lowest among its TLFFRA peer plans.
Since selecting Longview Fire, the PRB received the Fund’s 2017 actuarial valuation in July 2018. The
2017 data was used for the entirety of this review and is summarized in the table below.
Amort. Period (Years)
Funded Ratio
UAAL as % of Payroll
Assumed Rate of Return
Payroll Growth
Rate
Actual Cont. as %
of ADC1
DROP as % of FNP
Non-Investment
Cash Flow as % of FNP
40.2 46.05% 389.47% 8.00% 3.00% 81.06% 0.00% -5.56%
*Contribution, DROP and cash flow data are from the Fund’s 12/31/2017 financial audit.
1 For plans whose contributions are made as a fixed rate based on statutory or contractual requirements, the ADC for this purpose is the contribution needed to fund the benefits accrued in the current year and maintain an amortization period that does not exceed 30 years, as required to be reported under Texas Government Code §802.101(a).
Plan Profile (as of 12/31/2017)
Actuarial Accrued Liability: $93,381,961
Market Value of Assets: $43,004,267
Normal Cost: 15.14% of payroll
Contributions: 16.84% employee 18.25% employer
Membership: 175 active 147 annuitants
Social Security Participation: No

Intensive Actuarial Review: Longview Firemen's Relief & Retirement Fund
3
Risk Analysis
A pension fund faces multiple risks, which can be boiled down to one primary concern of whether there
will be enough money to pay benefits when they are due. Since 2012, Longview Fire has made benefit
changes for future members, and both the City and members have made contribution increases.
However, actual experience consistently not meeting assumptions and a fixed rate contribution
structure pose a relatively high level of risk to the Fund. These risks increase the probability of a
continued period of substantial financial stress for the Fund and could raise the likelihood of
deteriorating funding conditions in the coming years.
Funding Risk
Longview Fire’s December 31, 2017 actuarial valuation shows that the Fund is approximately 46%
funded on an actuarial basis, and according to reports filed with the PRB, it has not had a funded ratio
above 60% since 2007.
78.14%
46.05%
0.00%
10.00%
20.00%
30.00%
40.00%
50.00%
60.00%
70.00%
80.00%
90.00%
2001 2003 2005 2007 2009 2011 2013 2014 2015 2016 2017
Funded Ratio

Intensive Actuarial Review: Longview Firemen's Relief & Retirement Fund
4
Longview Fire’s significant growth in unfunded liability, which increased from $16.9 million at the end of
2005 to over $50 million by the end of 2017, can be attributed to 3 key issues: actual returns
consistently lower than the assumed investment return; contributions consistently lower than the
annual benefit accrual plus growth of existing unfunded benefits; and repeated liability losses due to
adverse experience compared to the fund’s assumptions.
Liability Experience Compared with Assumptions
In all but one of the past 12 actuarial valuations, Longview Fire’s liability increased more than expected,
resulting in an increase in the unfunded liability (UAAL) of $16.5M for the 2006-2017 period. This
$16.5M liability increase resulted from experience not meeting assumptions in areas other than
investment returns, which caused a separate, additional $16.2M liability increase (discussed in the
following section).
Of the $16.5 million loss, more than $10 million occurred between 2006 and 2009, and the losses that
occurred over the past 5 years resulted in less than a 2% loss on the total actuarial accrued liability in a
given year, as shown in the following graph.

Intensive Actuarial Review: Longview Firemen's Relief & Retirement Fund
5
It is rare for plan experience to exactly match assumptions in any given year and a 1-2% gain or loss in a
single year is by no means alarming or even unusual. Generally, a plan should expect to have gains in
some years (i.e. the liability increases less than expected) and losses in others (i.e. the liability increases
more than expected), such that the difference between the assumptions and reality are close to zero
over time. However, consistent losses (or gains), even when seemingly insignificant if viewed in
isolation, are not expected and the impact can be compounded over time. For example, the 1-2%
individual losses over the past 5 valuations have accumulated to an approximate 5% loss on the total
AAL and accounts for nearly 40% of the increase in the UAAL over the same period.
In 2016, the Fund’s actuary performed an experience study, which compared the plan’s actual
experience against what was assumed would occur for the period of January 1, 2009 through December
31, 2015. Following the study, several assumptions were changed. The Fund should continue to closely
monitor its assumptions. If future valuations show that Longview Fire continues to experience these
types of losses, valuable insight may be gained by further investigation of the causes of both the
consistent demographic losses and the unusually large loss between 2006 and 2009. While Longview
Fire is not required by state law to have an audit of the Fund’s actuarial reports, engaging an outside,
independent actuary to perform such an audit is one approach the board could consider to gain
additional insight.
Investment Experience and Asset Allocation
Longview Fire’s actual investment return has been consistently lower than the assumed investment
return, increasing the UAAL by more than $16.2 million between 2006 and 2017. As illustrated in the
following graph, the Fund has not achieved an 8% annualized return (the Fund’s current assumed rate of
return) over a consecutive 10-year period in any of the 13 periods ending December 31, 2005 through
December 31, 2017.

Intensive Actuarial Review: Longview Firemen's Relief & Retirement Fund
6
To assess the reasonableness of the assumed investment return, generally accepted practice involves
calculating an expected rate of return based on a plan’s current, and future expected, asset allocation
utilizing a range of forward-looking capital market projections, as illustrated in the graph below. This
graph indicates that the expected rate of return produced by the capital market assumptions provided
by the plan’s investment consultant, RHI, exceeds those calculated using published capital market
assumptions from recognized sources for the same time horizon.
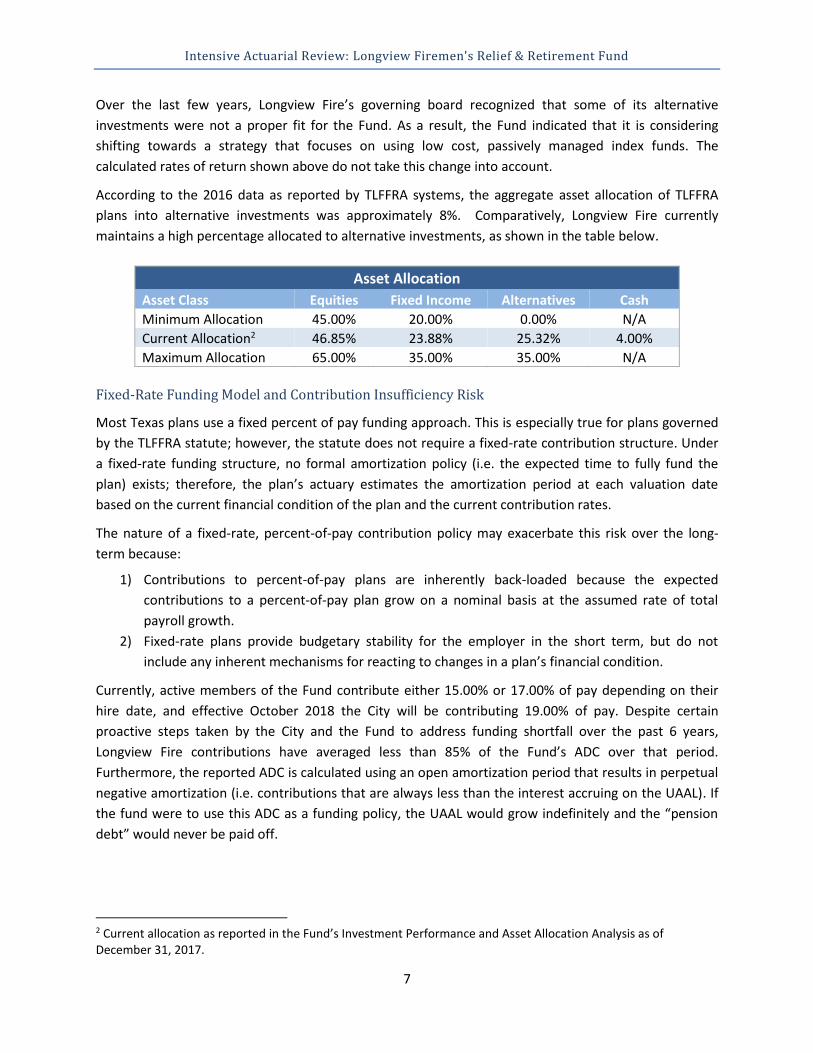
Intensive Actuarial Review: Longview Firemen's Relief & Retirement Fund
7
Over the last few years, Longview Fire’s governing board recognized that some of its alternative
investments were not a proper fit for the Fund. As a result, the Fund indicated that it is considering
shifting towards a strategy that focuses on using low cost, passively managed index funds. The
calculated rates of return shown above do not take this change into account.
According to the 2016 data as reported by TLFFRA systems, the aggregate asset allocation of TLFFRA
plans into alternative investments was approximately 8%. Comparatively, Longview Fire currently
maintains a high percentage allocated to alternative investments, as shown in the table below.
Fixed-Rate Funding Model and Contribution Insufficiency Risk
Most Texas plans use a fixed percent of pay funding approach. This is especially true for plans governed
by the TLFFRA statute; however, the statute does not require a fixed-rate contribution structure. Under
a fixed-rate funding structure, no formal amortization policy (i.e. the expected time to fully fund the
plan) exists; therefore, the plan’s actuary estimates the amortization period at each valuation date
based on the current financial condition of the plan and the current contribution rates.
The nature of a fixed-rate, percent-of-pay contribution policy may exacerbate this risk over the long-
term because:
1) Contributions to percent-of-pay plans are inherently back-loaded because the expected
contributions to a percent-of-pay plan grow on a nominal basis at the assumed rate of total
payroll growth.
2) Fixed-rate plans provide budgetary stability for the employer in the short term, but do not
include any inherent mechanisms for reacting to changes in a plan’s financial condition.
Currently, active members of the Fund contribute either 15.00% or 17.00% of pay depending on their
hire date, and effective October 2018 the City will be contributing 19.00% of pay. Despite certain
proactive steps taken by the City and the Fund to address funding shortfall over the past 6 years,
Longview Fire contributions have averaged less than 85% of the Fund’s ADC over that period.
Furthermore, the reported ADC is calculated using an open amortization period that results in perpetual
negative amortization (i.e. contributions that are always less than the interest accruing on the UAAL). If
the fund were to use this ADC as a funding policy, the UAAL would grow indefinitely and the “pension
debt” would never be paid off.
2 Current allocation as reported in the Fund’s Investment Performance and Asset Allocation Analysis as of December 31, 2017.
Asset Allocation
Asset Class Equities Fixed Income Alternatives Cash
Minimum Allocation 45.00% 20.00% 0.00% N/A
Current Allocation2 46.85% 23.88% 25.32% 4.00%
Maximum Allocation 65.00% 35.00% 35.00% N/A
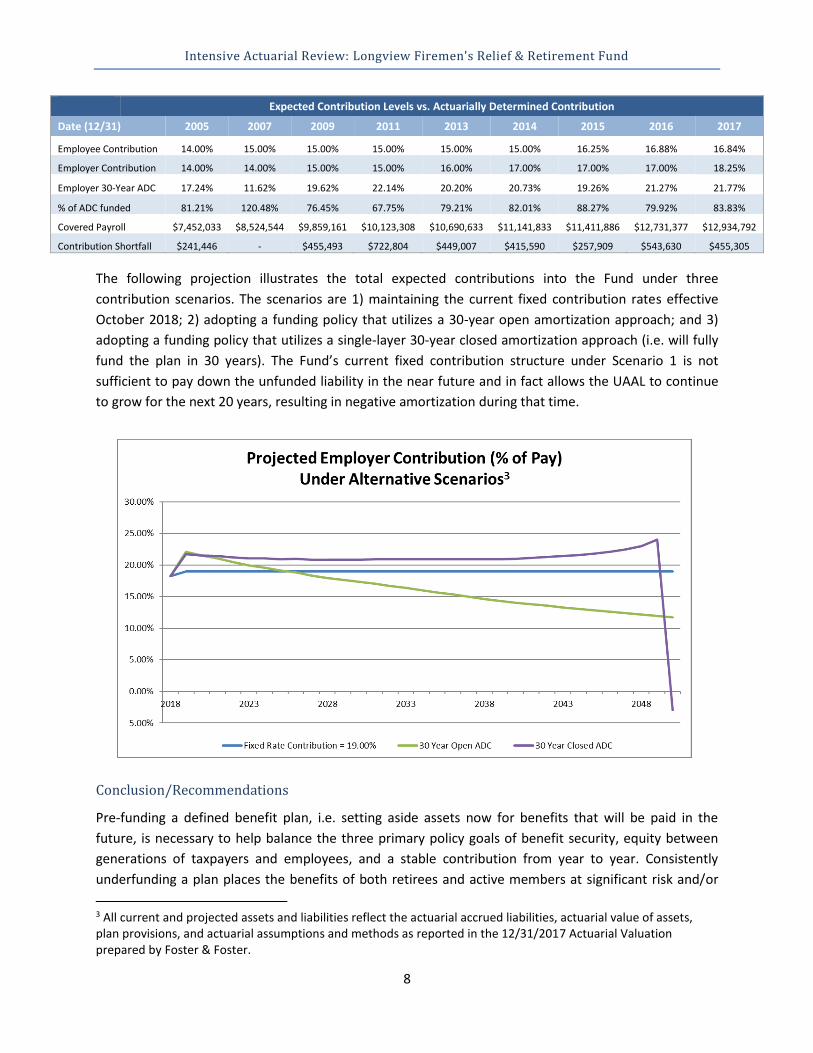
Intensive Actuarial Review: Longview Firemen's Relief & Retirement Fund
8
Expected Contribution Levels vs. Actuarially Determined Contribution
Date (12/31) 2005 2007 2009 2011 2013 2014 2015 2016 2017
Employee Contribution 14.00% 15.00% 15.00% 15.00% 15.00% 15.00% 16.25% 16.88% 16.84%
Employer Contribution 14.00% 14.00% 15.00% 15.00% 16.00% 17.00% 17.00% 17.00% 18.25%
Employer 30-Year ADC 17.24% 11.62% 19.62% 22.14% 20.20% 20.73% 19.26% 21.27% 21.77%
% of ADC funded 81.21% 120.48% 76.45% 67.75% 79.21% 82.01% 88.27% 79.92% 83.83%
Covered Payroll $7,452,033 $8,524,544 $9,859,161 $10,123,308 $10,690,633 $11,141,833 $11,411,886 $12,731,377 $12,934,792
Contribution Shortfall $241,446 - $455,493 $722,804 $449,007 $415,590 $257,909 $543,630 $455,305
The following projection illustrates the total expected contributions into the Fund under three
contribution scenarios. The scenarios are 1) maintaining the current fixed contribution rates effective
October 2018; 2) adopting a funding policy that utilizes a 30-year open amortization approach; and 3)
adopting a funding policy that utilizes a single-layer 30-year closed amortization approach (i.e. will fully
fund the plan in 30 years). The Fund’s current fixed contribution structure under Scenario 1 is not
sufficient to pay down the unfunded liability in the near future and in fact allows the UAAL to continue
to grow for the next 20 years, resulting in negative amortization during that time.
3
Conclusion/Recommendations
Pre-funding a defined benefit plan, i.e. setting aside assets now for benefits that will be paid in the
future, is necessary to help balance the three primary policy goals of benefit security, equity between
generations of taxpayers and employees, and a stable contribution from year to year. Consistently
underfunding a plan places the benefits of both retirees and active members at significant risk and/or
3 All current and projected assets and liabilities reflect the actuarial accrued liabilities, actuarial value of assets, plan provisions, and actuarial assumptions and methods as reported in the 12/31/2017 Actuarial Valuation prepared by Foster & Foster.

Intensive Actuarial Review: Longview Firemen's Relief & Retirement Fund
9
places the burden of paying for services already rendered on future generations of taxpayers and
employees through the reduction of future benefits or an increase in contributions.
In the absence of a formal, written funding and risk-sharing policy, the result is a de facto risk-sharing
arrangement that is simply a reaction to events, often well after the plan finds itself with financial
difficulties. Plans and their sponsors can take many actions to ensure financial stability and mitigate the
risks that lead to underfunding. These steps include ensuring contributions are adequate to fully fund
the plan over a reasonable period; developing formal policies to guide decision-makers under different
economic conditions; reviewing actuarial assumptions against actual experience and making necessary
changes; and monitoring investment performance and evaluating asset allocation decisions on a
forward-looking basis.
Actuarial Assumptions. Longview Fire’s liability has increased more than expected in all but one of the
past 12 actuarial valuations. When pension funds are consistently overestimating their assumptions,
they underestimate the funding issues they are facing. Public pension plans must monitor actuarial
assumptions continually through their actuarial valuations and make appropriate adjustments to
mitigate bias in the assumptions that result in consistent actuarial gains or losses. Actuarial gains and
losses occur when the plan’s actual experience does not match expected experience.
Over time, without required changes, pension funds such as Longview Fire, whose assumptions
consistently diverge from actual experience in the same direction (i.e. consistently seeing actuarial gains
or consistently seeing actuarial losses) can exacerbate the issue of intergenerational inequity, causing
one group of members and taxpayers to over- or under-pay. Boards of trustees should continue to work
with their actuaries and other consultants to ensure assumptions are neither too aggressive nor too
conservative, while striving to maintain (or achieve) sound fiscal health to secure existing accrued
benefits. PRB’s Pension Funding Guidelines recommend that systems monitor, review, and report the
impact of actual plan experience on actuarial assumptions at least once every five years.
In addition, if the Fund continues to experience liability losses, while not required by state law, an
actuarial audit of the Fund’s actuarial valuations, studies and reports performed by an independent
actuary is one approach the board could consider to gain additional insight into this concern.
Investment Performance. The Fund continues to maintain a relatively risky target asset allocation,
compared to other TLFFRA systems. Evidence suggests that to maintain an 8.00% expected return,
public pension portfolios have increased risk by more than three-fold between 1995 and 2016.4 It is
important that asset allocation decisions are made based on the associated riskiness of the investments
and a determination of whether individual investments are appropriate by themselves, as well as within
the context of the total risk the Fund is accepting.
According to ASOP 27 and generally accepted actuarial standards of practice, investment allocation
decisions should never be made with a goal of achieving a specific assumed rate of return. The assumed
rate of return should only be calculated once an appropriate allocation and associated level of risk is
determined. The Fund is encouraged to develop an investment policy statement that considers the
4 https://www.pacificresearch.org/wp-content/uploads/2017/06/2017-02-01-Risk_Taking_Appropriateness.pdf

Intensive Actuarial Review: Longview Firemen's Relief & Retirement Fund
10
plan’s general funding policy; follows industry best practices, including outlining general objectives that
consider appropriate risk levels; and establishes policies and procedures for evaluating the impact of
changes to the funding policy and the Fund not achieving its investment objectives.
Adequate Funding. The Plan and City took proactive steps beginning in 2012 to both increase
contribution rates in recent years and lower future benefit accruals. While the actions taken are
commendable and in compliance with TLFFRA statute’s minimum contribution requirement, the current
contribution structure still has not been enough to meet the Plan’s ADC rate. To address this concern, a
strong funding policy that requires payment of an ADC is encouraged. Numerous actuarial methods can
be utilized to help mitigate contribution volatility, including directly smoothing contribution rates or
adding “guardrails” that require the stakeholders to come back to the table if the contribution rate falls
outside a specified range. If funding according to an ADC is not adopted, a funding policy that fully funds
the plan over a finite period, such as 30 years, is recommended.
Governance Risk
When public pension plans and their sponsors wait too long to address them, the funding challenges
compounding over time can reach a point where incremental improvement, such as the contribution
increases made for Longview Fire, are not sufficient to make consistent, long-term improvements to the
overall health of the plan. Longview Fire and the City of Longview have yet to make difficult decisions on
additional needed changes to its actuarial assumptions and funding policy. Although a series of
contribution increases have been implemented, these haven’t been enough to place the Fund on a path
to sound financial footing. If necessary changes are ultimately made, they may right the ship, but they
will potentially be made under less than ideal conditions.
Governance is essentially decision-making, and decision-making for public pension plans must balance
the competing interests of plans and their sponsors and should feature collaboration between the two.
Overall, Longview Fire’s governance has been proactive regarding its benefit and contribution structure.
Starting in 2012, The Fund and the City developed a four-step plan to tackle funding issues without
being statutorily subject to any such requirement. The plan included increasing the City’s contribution
rate from 15% of payroll in 2012 to 19% as of October 2018 and adding a new tier with a lower benefit
design for future members in January 2016. The board has also been proactive in making investment
management changes after a period of inadequate results. However, even with these contribution
increases, the unfunded liability is expected to continue to grow, requiring additional changes in the
future.
In the area of investment governance, Longview Fire amended its investment policy statement in May
2017. The Fund removed a number of important elements from its previous IPS that are best practices
according to the Government Finance Officers Association (GFOA). The TLFFRA statute requires boards
of trustees to give special consideration to the preferred investment practices of the GFOA. The GFOA
recommends that investment policy statements include detailed policies in areas such as roles and
responsibilities, risk tolerances, liquidity, and manager performance evaluation, among others.5 The
5 http://www.gfoa.org/investment-policies-defined-benefit-plans http://www.gfoa.org/investment-policy

Intensive Actuarial Review: Longview Firemen's Relief & Retirement Fund
11
purpose for having a detailed written policy is to help guide board members in their decision-making
and ensure both current and future boards follow similar objectives within the same framework.
Conclusion/Recommendation
The PRB encourages Longview Fire and the City of Longview to develop policies that proactively manage
risk. This includes following best practices in investment policy statements as well as laying out a formal
risk-sharing plan. To proactively manage governance and funding risk, retirement plans and their
sponsors should work together to adopt written policies far in advance, that can guide them through
both good and bad years and shield against the risk of either party’s exclusion or disengagement from
decision-making. Funding and benefit policies can be adopted that provide a framework for how benefit
and contribution levels may be modified under different conditions. An advantage of such policies is that
changes to plan benefits and costs are known and understood by all parties in advance, rather than
negotiated under difficult circumstances.
For example, a benefit policy can outline the primary objectives the employer wishes to achieve, which
can be as detailed as a specified replacement ratio, or as general as offering competitive benefits at a
reasonable cost, as well as identifying policies and procedures designed to determine if the objectives
are being met and how they can be reviewed at reasonable intervals. A benefit policy can also outline
potential benefit enhancements or reductions based on the funding goals as outlined in the funding
policy. The funding policy might incorporate objectives associated with benefit security, contribution
stability and intergenerational equity and outline how those objectives will be met through contribution
changes, as well as referencing potential changes outlined in the benefit policy. The coordinated policies
might limit future benefit enhancements, cost of living adjustments, and/or contribution rate reductions
such that they can only be considered or made if the Fund's funded ratio remains greater than a chosen
threshold. In addition, if the funded ratio falls below a certain threshold, the stakeholders may be
required to come back to the table to make necessary contribution and benefit adjustments.
Finally, the board is encouraged to reassess its investment policy statement to balance its desire to
streamline the policy with the guidance provided by the GFOA. Doing so would help ensure that current
and future boards maintain thorough policies that clearly delineate roles and responsibilities, risk
tolerances, liquidity needs, and a detailed process for evaluating manager performance against
appropriate benchmarks.

Intensive Actuarial Review: Longview Firemen's Relief & Retirement Fund
12
Appendix

Intensive Actuarial Review: Longview Firemen's Relief & Retirement Fund
13
Key Metrics
Amort. Period (Years)
Funded Ratio
UAAL as % of Payroll
Assumed Rate of Return
Payroll Growth
Rate
Actual Cont. as %
of ADC6
DROP as % of FNP
Non-Investment
Cash Flow as % of FNP
50.7 45.53% 383.31% 8.00% 3.00% 70.47% 0.55% -5.93%
*Contribution, DROP and cash flow data are from the Fund’s 12/31/2016 financial audit.
Metric Amortization period (50.7 years)
What it measures
Approximately how long it would take to fully fund the unfunded actuarial accrued liability (UAAL) based on the current funding policy.
Why it is important
Given the Plan’s current assumptions, an amortization period greater than 17 years indicates that contributions to the Plan in the coming year are less than the interest accumulated for that same period, and therefore the total UAAL is expected to grow over the near term. In addition, for a plan that contributes on a fixed-rate basis such as Longview Fire, the higher the amortization period, the more sensitive it is to small changes in the UAAL.
Peer comparison
Longview Fire’s amortization period is the third highest among its peers, the sixth highest finite period in the state and is greater than the maximum PRB pension funding guideline of 30 years.
Metric Funded ratio (45.53%)
What it measures
The percent of a fund’s actuarially accrued liabilities covered by its actuarial value of assets.
Why it is important
The lower the funded ratio, the fewer assets a fund has to pay its current and future benefit payments.
Peer comparison
Longview Fire’s 45.53% funded ratio is the second lowest among its TLFFRA peer plans, and one of the lowest in the state of Texas.
6 For plans whose contributions are made as a fixed rate based on statutory or contractual requirements, the ADC for this purpose is the contribution needed to fund the benefits accrued in the current year and maintain an amortization period that does not exceed 30 years, as required to be reported under Texas Government Code §802.101(a). For Longview Fire, the recommended contribution rate comes from the actuarial valuation with a valuation date that is on or before the first day of the fiscal year shown (12/31/2015 AV in this case). The expected employee contribution was 16.25% in this case to reflect the increase in the contribution from 16% to 17% effective October 1, 2016. The employer contribution rate is calculated as the actual $ contribution during the fiscal year shown as reported in the Fund's 2016 CAFR ($2,105,902) divided by the covered payroll reported for the same period.
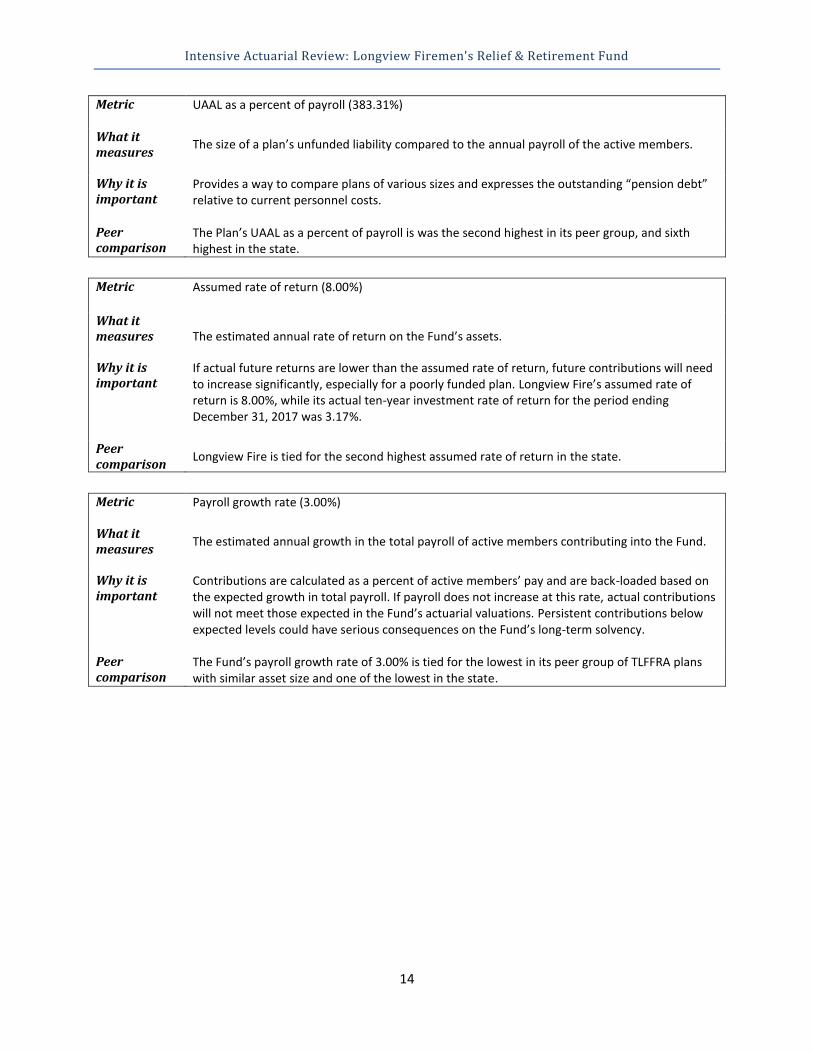
Intensive Actuarial Review: Longview Firemen's Relief & Retirement Fund
14
Metric UAAL as a percent of payroll (383.31%)
What it measures
The size of a plan’s unfunded liability compared to the annual payroll of the active members.
Why it is important
Provides a way to compare plans of various sizes and expresses the outstanding “pension debt” relative to current personnel costs.
Peer comparison
The Plan’s UAAL as a percent of payroll is was the second highest in its peer group, and sixth highest in the state.
Metric Assumed rate of return (8.00%)
What it measures
The estimated annual rate of return on the Fund’s assets.
Why it is important
If actual future returns are lower than the assumed rate of return, future contributions will need to increase significantly, especially for a poorly funded plan. Longview Fire’s assumed rate of return is 8.00%, while its actual ten-year investment rate of return for the period ending December 31, 2017 was 3.17%.
Peer comparison
Longview Fire is tied for the second highest assumed rate of return in the state.
Metric Payroll growth rate (3.00%) What it measures
The estimated annual growth in the total payroll of active members contributing into the Fund.
Why it is important
Contributions are calculated as a percent of active members’ pay and are back-loaded based on the expected growth in total payroll. If payroll does not increase at this rate, actual contributions will not meet those expected in the Fund’s actuarial valuations. Persistent contributions below expected levels could have serious consequences on the Fund’s long-term solvency.
Peer comparison
The Fund’s payroll growth rate of 3.00% is tied for the lowest in its peer group of TLFFRA plans with similar asset size and one of the lowest in the state.

Intensive Actuarial Review: Longview Firemen's Relief & Retirement Fund
15
Metric Actual contributions as a percent of actuarially determined contributions (70.47%)
What it measures
Whether the current employer contributions have met a theoretical minimum threshold.7
Why it is important
The employer’s portion of the contribution is less than 65% of the amount needed to fund the plan on a rolling 30-year amortization period. The PRB’s 2014 Study of the Financial Health of Texas Public Retirement Systems found that plans that have consistently received adequate funding are in a better position to meet their long-term obligations.
Peer comparison
This is the largest shortfall percentage in its peer group.
Metric DROP balance as a percent of fiduciary net position (0.55%)
What it measures
The amount of the Fund’s assets that are designated for lump-sum payouts to retired members as a percent of its total assets.
Why it is important
Viewing this metric as a percent of total net assets (or fiduciary net position (FNP)) shows how large a decrease in the Fund’s assets could be if most or all DROP participants decided to take their balances out in a short amount of time.
Peer comparison
Longview Fire’s DROP balance as a percent of FNP is the lowest among its peer group and one of the lowest in the state.
Metric Non-investment cash flow as a percent of fiduciary net position (-5.93%)
What it measures
Non-investment cash flow shows how much the plan is receiving through contributions in relation to its outflows: benefit payments, withdrawals and expenses.
Why it is important
Viewing this metric as a percent of total net assets (or fiduciary net position (FNP)), in conjunction with the funded ratio and recognition of the relative maturity of the plan, provides information about the stability of a plan’s funding arrangement.
Peer comparison
Longview Fire’s non-investment cash flow as a percent of FNP is the second lowest in its peer group and one of the lowest in the state.
7 The theoretical minimum threshold, or actuarially determined contribution (ADC), is a target or recommended contribution “to the plan as determined by the actuary using a contribution allocation procedure,” as defined in Actuarial Standards of Practice No 4. If contributions to the plan are made as a fixed rate based on statutory or contractual requirements, the ADC for this purpose is the contribution needed to fund the benefits accrued in the current year and maintain an amortization period that does not exceed 30 years, as required to be reported under Texas Government Code §802.101(a).

Intensive Actuarial Review: Longview Firemen's Relief & Retirement Fund
16
Plan Summary
The Longview Firemen’s Relief and Retirement Fund (“Longview Fire” or “the Fund”) was established in
1937 under the Texas Local Fire Fighter’s Retirement Act (TLFFRA). TLFFRA provides general guidelines
for fund management, but leaves administration, plan design, contributions, and specific investments to
the discretion of the board of trustees. Longview Fire, as with all TLFFRA systems, is entirely locally-
funded.
Benefits
Tiers Tier 1 – Hired before 1/1/2016 Tier 2 – Hired on or after 1/1/2016
Retirement Eligibility Tier 1 – Age: 50 years; Years of Credited Service (YCS): 20 years Tier 2 – Age: 55 years; YCS: 20 years
Vesting Fully vested after 20 YCS
Benefit Formula Tier 1 – 80% x Final Average Salary + $80 per month for each year of service in excess of 20 years. Tier 2 – YCS x 3.0% x Final Average Salary (max 75% FAS) + $80 per month for each year of service in excess of 25 years.
Final Average Salary (FAS) Hired before 1/23/1993 – Highest consecutive 36 months Hired on or after 1/23/1993 – Highest consecutive 60 months
COLA None
Retirement Benefit Options 3-year Retro DROPs: Eligible once a member has satisfied Service Retirement requirements, not to exceed 36 months Retro DROP accumulation includes the sum of the monthly service retirement benefit the member would have received if had retired on the DROP determination date plus an amount equal to the member contributions to the fund while a DROP participant. No interest is credited on Retro DROP. DROP balance is distributed as a lump sum
Social Security No
Contributions
As of October 1, 2017, active members of Longview Fire hired before 1/1/2016 contribute 17.00% of pay
and those hired on or after 1/1/2016 contribute 15.00% of pay, while the City of Longview (the City)
contributes 18.00% of pay. City contributions will increase to 19% of pay as of October 1, 2018.
Membership
Total Active Members
Retired Members
Beneficiaries Total
Annuitants Terminated
Total Members
Active-to- Annuitant
Ratio
175 121 26 147 1 323 1.19

Intensive Actuarial Review: Longview Firemen's Relief & Retirement Fund
17
TLFFRA Board Structure
Active Members 3 - Members of the retirement system; elected by fund members. Three-year terms.
Sponsor Government 1 - Mayor or designated representative, or the political subdivision's Chief Operating Officer or designated representative. 1 - Chief Financial Officer of the political subdivision, or designated representative. Terms correspond to term of office.
Taxpayer, Not Affiliated With Fund/Sponsor Govt.
2 - Residents of the State of Texas, must not be officers/employees of the political subdivision; elected by other Board of Trustee members. Two-year terms.
Contribution and Benefit Decision-Making
TLFFRA authorizes members of the retirement systems to determine their contribution rates by voting.
The statute requires cities to make contributions at the same rate paid by employees or 12%, whichever
is smaller. TLFFRA also allows a city to contribute at a higher rate than employees do through a change
in city ordinance.
TLFFRA gives the board the power to make decisions to modify the benefits (increases and reductions).
However, a proposed addition or change must be approved by the actuary and a majority of
participating plan members. Benefit changes cannot deprive a member, retiree or beneficiary of the
right to receive vested accrued benefits.
Historical Trends
To conduct an intensive review of risks associated with the long-term funding of a pension Fund, it is
important to analyze trends in multiple metrics. A Fund with an asset level lower than its accrued
liability has insufficient funds to cover benefits. A Fund can experience an increase in unfunded liability
due to various factors, including insufficient investment returns, inadequate contributions and
inaccurate or overly aggressive assumptions. Hence, a single metric cannot effectively capture the
different drivers contributing to the increase of a Fund’s unfunded pension obligation. This section
analyzes historical trends in various metrics identified by the PRB and makes comparisons to understand
the sources of growth in unfunded liability for Longview Fire.
Longview Fire’s funded status has been trending downward since 2001. Numerous factors have
contributed to this deterioration, including inadequate contributions, investment returns lower than the
chosen assumption, and the lack of adjustments to the Fund’s assumptions. The following sections
discuss these and other factors in detail.

Intensive Actuarial Review: Longview Firemen's Relief & Retirement Fund
18
Assets and Liabilities
Funding Trends
Funded Ratio, Assets, Liabilities and Year over Year Growth
Fiscal Year 2001 2003 2005 2007 2009 2011 2013 2015 2016 2017
Funded Ratio 78.14% 69.45% 67.43% 73.71% 54.35% 52.02% 56.22% 47.34% 45.53% 46.05%
Am Period (years) 71.6 Infinite Infinite 20.1 88.6 Infinite 63.3 37.9 50.7 40.2
UAAL (in millions) $8.82 $13.81 $16.88 $15.92 $32.07 $36.51 $36.08 $46.34 $48.80 $50.38
AVA (in millions) $31.54 $31.40 $34.95 $44.64 $38.18 $39.58 $46.33 $41.66 $40.80 $43.00
AVA Growth (YoY) - -0.22% 5.50% 13.01% -7.52% 1.81% 8.19% -7.88% -2.07% 5.41%
AAL (in millions) $40.36 $45.22 $51.83 $60.56 $70.25 $76.09 $82.40 $88.00 $89.60 $93.38
AAL Growth (YoY) - 5.84% 7.07% 8.09% 7.70% 4.07% 4.07% 4.55% 1.81% 4.22%
Longview Fire’s actuarial accrued liability (AAL) increased by over 130% between 2001 and 2017. The
Fund’s actuarial value of assets (AVA) increased by less than 40% over the same period. The Fund was
nearly 80% funded in 2001 and has been less than 50% funded since 2015.

Intensive Actuarial Review: Longview Firemen's Relief & Retirement Fund
19
Valuation Date
Investment return lower/ (higher) than
assumed
Contribution lower/
(higher) than normal cost +
interest on UAAL
Liability experience
worse/ (better) than
assumed Benefit
Changes
Changes to assumptions & methods Other
Total Change in
UAAL UAAL
12/31/2005 - - - - - - - 16,881,969
12/31/2007 (3,398,794) (332,557) 5,717,469 (1,452,589) (1,492,464) 100 (958,835) 15,923,134
12/31/2009 10,799,265 (779,960) 6,128,602 - - - 16,147,907 32,071,041
12/31/2011 3,200,126 1,808,310 (571,983) - - - 4,436,453 36,507,494
12/31/2013 (3,296,512) 2,375,547 1,095,174 (606,080) - - (431,871) 36,075,623
12/31/2014 3,057,982 661,829 695,866 (1,541,398) - - 2,874,279 38,949,902
12/31/2015 5,486,836 827,824 1,025,392 52,328 - - 7,392,380 46,342,282
12/31/2016 2,025,189 1,237,921 698,365 - (1,502,900) - 2,458,575 48,800,857
12/31/2017 (1,669,889) 1,523,872 1,722,854 - - - 1,576,837 50,377,694
2006-2017 16,204,203 7,322,786 16,511,739 (3,547,739) (2,995,364) 100 33,495,725
% of Total 48.38% 21.86% 49.30% -10.59% -8.94% 0.00% 100.00%
2012-2017 5,603,606 6,626,993 5,237,651 (2,095,150) (1,502,900) - 13,870,200
% of Total 40.40% 47.78% 37.76% -15.11% -10.84% 0.00% 100.00%
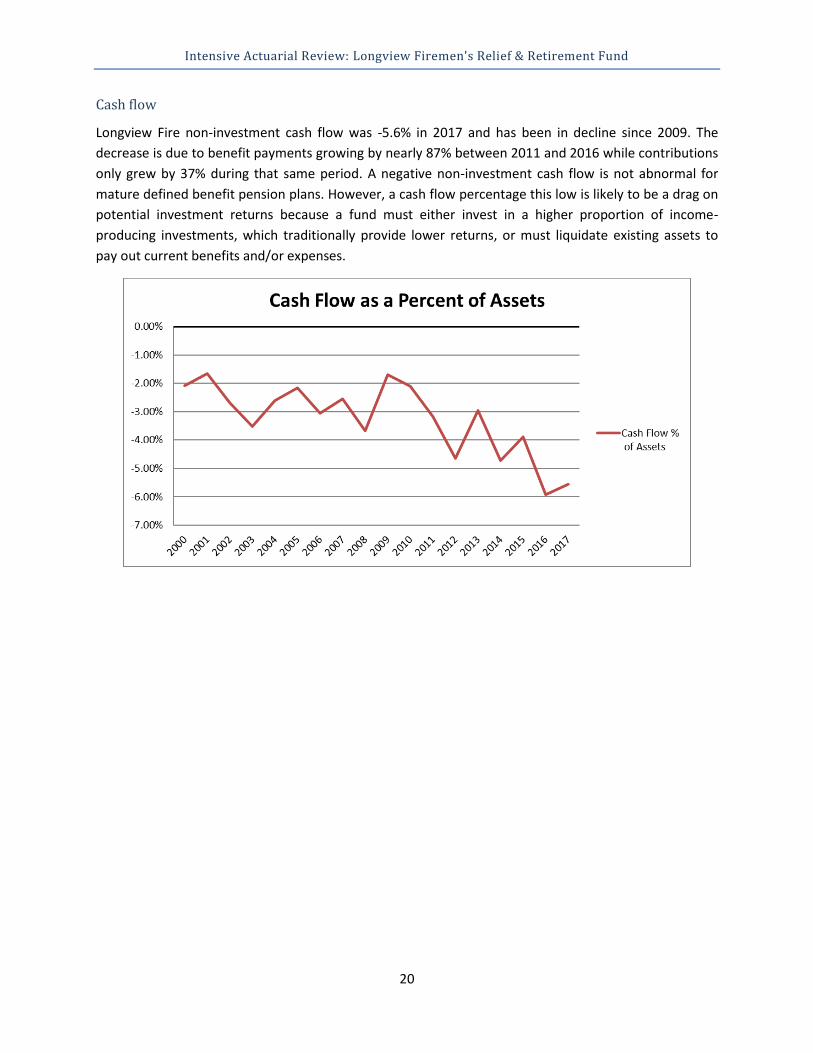
Intensive Actuarial Review: Longview Firemen's Relief & Retirement Fund
20
Cash flow
Longview Fire non-investment cash flow was -5.6% in 2017 and has been in decline since 2009. The
decrease is due to benefit payments growing by nearly 87% between 2011 and 2016 while contributions
only grew by 37% during that same period. A negative non-investment cash flow is not abnormal for
mature defined benefit pension plans. However, a cash flow percentage this low is likely to be a drag on
potential investment returns because a fund must either invest in a higher proportion of income-
producing investments, which traditionally provide lower returns, or must liquidate existing assets to
pay out current benefits and/or expenses.

Intensive Actuarial Review: Longview Firemen's Relief & Retirement Fund
21
Peer Group Key Metric Comparison
Funding Val Metrics Fiscal Year End Metrics
Peer Group Plans MVA Am Period
Date Am
Period Funded
Ratio UAAL as % of Payroll
Assumed Interest
Payroll Growth FYE
Actual Cont. as %
of ADC
DROP as % of FNP
Non-Investment
Cash Flow as % of FNP
Abilene Firemen's Relief & Retirement Fund
$52,343,510 10/1/2015 31.5 56.60% 316.19% 8.00% 4.00% 9/30/2016 97.77% N/A -3.35%
Wichita Falls Firemen's Relief & Retirement Fund
$46,915,744 1/1/2017 49.4 62.48% 265.13% 8.00% 4.50% 12/31/2016 71.51% N/A -4.80%
Odessa Firemen's Relief & Retirement Fund
$45,718,416 1/1/2017 46.5 45.12% 511.52% 7.75% 3.50% 12/31/2017 81.31% 4.54% -11.16%
McAllen Firemen's Relief & Retirement Fund
$44,759,055 10/1/2016 41.4 69.11% 187.25% 7.75% 4.00% 9/30/2016 103.85% N/A -3.15%
Port Arthur Firemen's Relief & Retirement Fund
$43,469,930 12/31/2015 18.3 77.97% 160.73% 8.00% 4.00% 12/31/2016 100.39% N/A -5.15%
Longview Firemen's Relief & Retirement Fund
$40,798,027 12/31/2016 50.7 45.53% 383.31% 8.00% 3.00% 12/31/2016 70.47% 0.55% -5.93%
Galveston Firefighter's Relief & Retirement Fund
$40,155,474 12/31/2016 Infinite 68.04% 257.06% 7.75% 3.00% 12/31/2016 79.37% N/A -3.04%
Temple Firemen's Relief & Retirement Fund
$39,838,918 9/30/2016 28.4 75.12% 164.97% 7.75% 3.75% 9/30/2017 95.24% N/A -2.89%
Killeen Firemen's Relief & Retirement Fund
$35,342,830 9/30/2016 22.8 69.74% 114.49% 7.75% 3.25% 9/30/2016 100.97% N/A 3.14%
Harlingen Firemen's Relief & Retirement Fund
$31,224,379 9/30/2017 59.1 66.06% 248.99% 7.75% 3.50% 9/30/2016 115.85% 1.12% -3.78%
Texarkana Firemen's Relief & Retirement Fund
$31,019,529 12/31/2015 16.3 87.37% 118.93% 7.75% 3.25% 12/31/2016 100.00% N/A -4.55%

Intensive Actuarial Review: Longview Firemen's Relief & Retirement Fund
22
Peer Group Sponsor Funding Comparison
* 2017 sponsor data was unavailable for Port Arthur at the time of this review. Data in this table for Port Arthur is from 12/31/2016.
Peer Group Plans Sponsor GF Expend EOY GF Bal UAAL
Expected Employer
Contributions ADC 30-yr
Shortfall 30-Y SF %
of ADC 30-Y SF %
of GFE
Abilene Firemen's Relief & Retirement Fund
Abilene $83,561,890 $24,912,196 $43,412,430 $2,642,987 $2,703,398 $60,411 2.23% 0.07%
Wichita Falls Firemen's Relief & Retirement Fund
Wichita Falls $73,605,525 $14,329,468 $29,905,176 $1,353,554 $1,735,933 $382,379 22.03% 0.52%
Odessa Firemen's Relief & Retirement Fund
Odessa $79,627,501 $48,378,438 $60,600,337 $2,373,699 $2,987,300 $613,601 20.54% 0.77%
McAllen Firemen's Relief & Retirement Fund
McAllen $106,200,111 $46,387,548 $21,571,433 $1,497,603 $1,668,099 $170,496 10.22% 0.16%
Port Arthur Firemen's Relief & Retirement Fund
Port Arthur* $58,765,367 $67,804,846 $12,792,922 $1,103,170 $1,103,170 $- 0.00% 0.00%
Longview Firemen's Relief & Retirement Fund
Longview $60,227,994 $15,557,734 $48,800,857 $2,360,600 $2,815,904 $455,305 16.17% 0.76%
Galveston Firefighter's Relief & Retirement Fund
Galveston $48,539,395 $17,786,895 $20,353,268 $2,849,458 $4,475,684 $1,626,226 36.33% 3.35%
Temple Firemen's Relief & Retirement Fund
Temple $68,789,608 $28,482,112 $14,003,032 $1,293,576 $1,355,539 $61,963 4.57% 0.09%
Killeen Firemen's Relief & Retirement Fund
Killeen $76,816,134 $20,151,484 $16,234,675 $1,843,473 $1,921,466 $77,993 4.06% 0.10%
Harlingen Firemen's Relief & Retirement Fund
Harlingen $40,931,266 $18,512,353 $16,040,541 $966,349 $1,179,590 $213,241 18.08% 0.52%
Texarkana Firemen's Relief & Retirement Fund
Texarkana $32,041,046 $14,114,855 $4,786,718 $784,848 $784,848 $- 0.00% 0.00%

Intensive Actuarial Review: Longview Firemen's Relief & Retirement Fund
23
Peer Group Expense Comparison
Peer Group Plans
10 yr. return (Net)
Active/ Annuitants
Average Benefit NPL
Admin Expenses
Investment Expenses
Other Expenses
Total Expenses
Exp as % of Assets
Abilene Firemen's Relief & Retirement Fund
4.40% 0.94 $36,556 $50,512,956 $29,699 $194,616 $- $224,315 0.39%
Wichita Falls Firemen's Relief & Retirement Fund
5.18% 1.15 $29,292 $46,175,637 $115,843 $227,282 $- $343,125 0.73%
Odessa Firemen's Relief & Retirement Fund
2.58% 0.91 $52,055 $92,884,709 $204,605 $218,069 $- $422,674 0.92%
McAllen Firemen's Relief & Retirement Fund
4.17% 1.62 $37,994 $27,828,153 $56,906 $296,057 $- $352,963 0.79%
Port Arthur Firemen's Relief & Retirement Fund
5.15% 1.30 $54,098 $15,326,469 $36,358 $45,688 $- $82,046 0.19%
Longview Firemen's Relief & Retirement Fund
3.22% 1.24 $41,493 $55,681,251 $116,238 $225,267 $- $341,505 0.83%
Galveston Firefighter's Relief & Retirement Fund
3.74% 1.35 $35,879 $25,178,930 $103,459 $162,606 $- $266,065 0.66%
Temple Firemen's Relief & Retirement Fund
4.17% 1.39 $40,920 $16,001,777 $101,321 $69,570 $- $170,891 0.40%
Killeen Firemen's Relief & Retirement Fund
4.01% 3.67 $30,021 $21,110,703 $94,483 $50,299 $- $144,782 0.41%
Harlingen Firemen's Relief & Retirement Fund
5.06% 1.43 $25,706 $38,003,230 $24,755 $143,491 $- $168,246 0.59%
Texarkana Firemen's Relief & Retirement Fund
5.27% 1.15 $30,731 $7,275,575 $85,879 $181,904 $- $267,783 0.84%
Intensive Actuarial Review: Longview Firemen's Relief & Retirement Fund
24
Comments from Longview Firemen’s Relief and Retirement Fund

Longview Fire Relief & Retirement Fund 411 N. Fredonia Suite 110, Longview, Texas 75601
www.longviewfirepension.com
Kolby Beckham Chairman
Cell (903) 738-7545
Station #3 (903) 291-5203
September 6, 2018 Pension Review Board RE: 2018 Intensive Actuarial Review
On August 30th 2018 the Longview Firemen’s Relief & Retirement Fund received the draft copy of your Intensive Actuarial Review. Please see our formal response below. First off it was a disappointment to see that the PRB report chose to exclude the 2017 Plan information on the first page. Instead, the PRB chose to use the information that better fit the negative narrative of this report. It was included throughout this report, so updating that page would have been easily accomplished. What updating those numbers would have done to the bullet points on page 1;
● 40.2 amortization period would have changed the amount from third highest among its peers to 6th out of the group of ten.
● 255.6 UAAL would have taken us from second highest in the peer group to 5th out of the group of 10.
Page 3 There is an implication of some sort of fraud or deception from our last Actuarial Assumption review. All assumptions were discussed and some aspects of them were put on the table for changing over the next several years. Our discussion was to work towards a 7.75% Assumed Rate of Return. If you looked at at some of the areas we could have made changes that were well justified, we chose to take the more conservative route. Specifically at the advice of our Actuary, we chose to keep our Payroll growth assumption at 3%, despite actual experience for the 5 year period being 4.32% and 5.1% over the last 14 years. Page 4 There is a comment that our poor returns were primarily from “illiquid alternative investments, primarily private equity”. I am not sure what the basis of this information is, but it is incorrect. We have a diverse assortment of alternatives with none of them being in direct private equity. We have exposure to distressed debt, Capital Ventures, etc. these funds were not underperforming their benchmarks, but rather in their drawdown period (see page 5of the attached document). The nature of these investments is to have the majority of returns back loaded in the 7-10 years horizon. It is not reasonable to calculate the final ROI at this time. We have reached the positive slope of the J curve on our alternative funds, and have started to receive distributions on a more regular basis (see page 4 of the attached document). I am not sure why the PRB would think we would sell these investments in some secondary market for a loss to lower our allocation. Our plan is to lower that allocation to 10% as they mature. Moreover, we replaced our investment consultant. This, along with the positive impact of the alternative returns, has made a drastic improvement in our fund’s performance. You can see on Page 1-2 of the attached document the fund’s investment returns vs the peer group. The investment changes have brought us from the 98th percentile 7 years ago, to the 1st percentile YTD.

Longview Fire Relief & Retirement Fund 411 N. Fredonia Suite 110, Longview, Texas 75601
www.longviewfirepension.com
Page 5 I am proud of the hard work of both the City and Members to make many changes to strengthen the fund. There has been an improvement from an amortization of infinity to 40.2 years. The next increase of contributions in October 2018 along with the gradual effect of the new Tier 2 plan will continue to have a positive impact on the plan.
Page 8 There is a reference that TLFFRA somehow excludes the city from participating in the benefit modifications of the fund. Since 1938 TLFFRA has always placed all stakeholders at the table of the decisions. Boards are comprised of 3 Active members, 2 City personnel and 2 Citizen board members (taxpayers). The report eludes that the firefighters can somehow make changes without the key stakeholders’ approval. That assertion is neither factual nor conceptually sound.
Page 8-9 As explained in the conference call last month. The previous Investment Policy Statement (IPS) that was replaced with a much more simplified IPS was a unanimous decision of the board. We found that the previous version that is listed as “Preferred” led to a constant update issue. When you change your IPS every time you change an allocation, you end up with the cart leading the horse. The IPS should drive the investment decisions not vice versa. That is why we changed to a more manageable IPS.
Sincerely,
Kolby Beckham Chairman

Longview Firefighters' Relief
and Retirement FundPRB Actuarial Review
For the Period Ending June 30, 2018
Robert Harrell, Incorporated 8310 Capital of Texas Highway, North
Suite 320
Austin, TX 78731
Ph 512-795-9100
Fax 512-795-0633
www.harrell.com
R e g i s t e r e d I n v e s t m e n t A d v i s e r

0.00%
2.00%
4.00%
6.00%
8.00%
10.00%
12.00%
7 yr 6yr 5yr 4yr 3yr 2yr 1Yr
Median Balanced Peers
Longview Fire
Total Fund Benchmark
Longview Firemen's Relief and Retirement Fund Total Investment Returns
as of June 30, 2018

Longview Firemen's Relief and Retirement Fund
Manager vs Lipper Mixed-Asset Target Alloc Moderate Funds: Return RankJanuary 2011 - June 2018 (not annualized if less than 1 year)
Retu
rn R
ank
100%
75%
Median
25%
0%
YTD 1 year 2 years 3 years 4 years 5 years 6 years 7 years
Longview Total Fund
Longview Total Fund Benchmark
5th to 25th Percentile
25th Percentile to Median
Median to 75th Percentile
75th to 95th Percentile
Manager vs Lipper Mixed-Asset Target Alloc Moderate Funds: Return RankJanuary 2011 - June 2018 (not annualized if less than 1 year)
Longview Total Fund
Longview Total Fund Benchmark
YTD
576 mng
1 year
556 mng
2 years
535 mng
3 years
502 mng
4 years
483 mng
5 years
457 mng
6 years
441 mng
7 years
402 mng
0.93% 3.66% 10.79% 75.36% 94.89% 90.81% 87.56% 98.01%
37.72% 50.51% 46.09% 51.30% 46.30% 54.21% 55.92% 58.88%
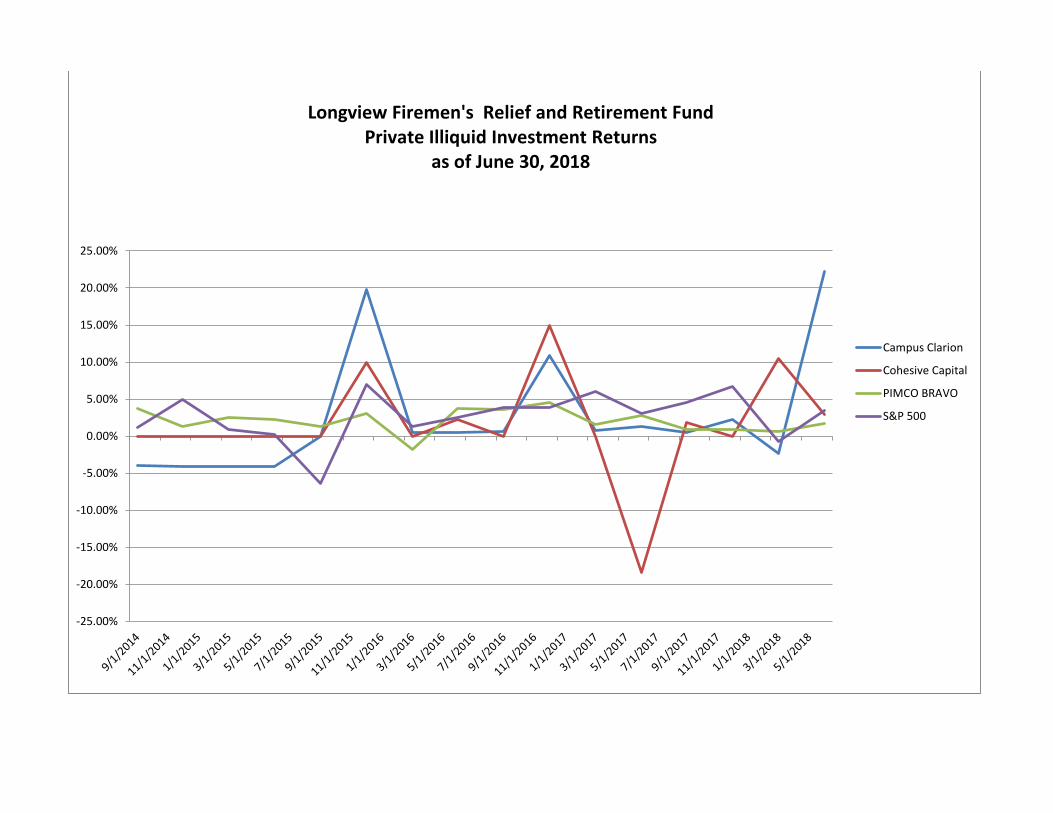
-25.00%
-20.00%
-15.00%
-10.00%
-5.00%
0.00%
5.00%
10.00%
15.00%
20.00%
25.00%
Campus Clarion
Cohesive Capital
PIMCO BRAVO
S&P 500
Longview Firemen's Relief and Retirement Fund Private Illiquid Investment Returns
as of June 30, 2018

Longview Firemen's Relief and Retirement Fund - Illiquid Investments
DrawdownJuly 2014 - June 2018
-20%
-18%
-16%
-14%
-12%
-10%
-8%
-6%
-4%
-2%
0%
Q2 2014 Q4 2014 Q2 2015 Q4 2015 Q2 2016 Q4 2016 Q2 2017 Q4 2017 Q2 2018
Campus ClarionCohesive CapitalPIMCO BRAVO Fund

Longview Firemen's Relief and Retirement Fund - Illiquid Investments
Risk / Return TableAnnualized Summary Statistics: July 2014 - June 2018
Campus Clarion
Cohesive Capital
PIMCO BRAVO Fund
Return(%)
Std Dev(%)
Downside Risk(%)
Betavs.
Market
Alphavs. Market
(%)
R-Squaredvs. Market
(%)
R-Squaredvs. Style
(%)
SharpeRatio
Tracking Errorvs. Market
(%)Observs.
9.39 16.16 7.51 0.9132 0.52 14.13 19.42 0.5512 14.9828 16
5.00 14.21 10.22 0.1359 4.53 0.40 7.64 0.3180 15.2985 16
8.40 3.13 2.28 0.0649 7.72 1.90 3.03 2.5271 6.9510 16
S&P 500 10.79 6.65 5.16 1.0000 0.00 100.00 99.33 1.5487 0.0000 16

0.00%
1.00%
2.00%
3.00%
4.00%
5.00%
6.00%
7.00%
8.00%
9.00%
10.00%
RHI10 Years
Horizon Actuarial34 Firm Composite
10 Years
JP Morgan10-15 Years
SSGA10 Years
BNY Mellon10 Years
Longview Firemen's Relief & Retirement FundExpected Rate of Return Summary
Average Arithmetic Real Rate of Return Inflation
12/31/2017 Assumed Real Rate of Return 12/31/2017 Assumed Nominal Rate of Return

Texas Pension Review Board
2017-2018 Biennial Report
VI
APPENDIX A6 - INTENSIVE ACTUARIAL REVIEW – ORANGE
FIREMEN'S RELIEF AND RETIREMENT FUND

Intensive Actuarial Review: Orange Firemen’s Relief and Retirement Fund
October 2018

Intensive Actuarial Review: Orange Firemen’s Relief and Retirement Fund
Table of Contents Executive Summary .......................................................................................................................................................................... 1
Introduction ................................................................................................................................................................................. 1
Overview ...................................................................................................................................................................................... 1
Conclusion .................................................................................................................................................................................... 1
Background ....................................................................................................................................................................................... 2
Risk Analysis ...................................................................................................................................................................................... 3
Funding Risk ................................................................................................................................................................................. 3
Background ............................................................................................................................................................................. 3
Investment Expenses and Performance .................................................................................................................................. 4
Investment Experience Compared with Investment Return Assumption ............................................................................... 6
Fixed-Rate Funding Model and Payroll Growth Rate .............................................................................................................. 7
Conclusion/Recommendations ............................................................................................................................................... 9
Governance Risk ........................................................................................................................................................................ 11
Funding Decision-making ...................................................................................................................................................... 11
Funding Soundness Restoration Plan .................................................................................................................................... 11
Investment Decision-making ................................................................................................................................................. 12
Conclusion/Recommendation ............................................................................................................................................... 12
Appendix ......................................................................................................................................................................................... 14
Key Metrics ................................................................................................................................................................................ 15
Plan Summary ............................................................................................................................................................................ 17
Benefits ................................................................................................................................................................................. 17
Contributions ........................................................................................................................................................................ 17
Membership .......................................................................................................................................................................... 17
TLFFRA Board Structure ........................................................................................................................................................ 18
Contribution and Benefit Decision-Making ........................................................................................................................... 18
Historical Trends ........................................................................................................................................................................ 18
Assets and Liabilities ............................................................................................................................................................. 19
Investment Assumption and Returns .................................................................................................................................... 20
Asset Allocation ..................................................................................................................................................................... 20
Cash flow ............................................................................................................................................................................... 20
Peer Group Key Metric Comparison .......................................................................................................................................... 22
Peer Group Sponsor Funding Comparison ................................................................................................................................. 23
Peer Group Expense Comparison .............................................................................................................................................. 24
Comments from Orange Firemen’s Relief and Retirement Fund ............................................................................................... 25

Intensive Actuarial Review: Orange Firemen’s Relief and Retirement Fund
1
Executive Summary
Introduction
This intensive actuarial review of Orange Firemen’s Relief and Retirement Fund (“Orange Fire” or “the
Fund”) is intended to assist the Fund’s board of trustees and the City of Orange (“the City”) in assessing
the Fund’s ability to meet its long-term pension obligation. Overall, the review shows the Fund is taking
considerable risks in its approach to funding the system. The Pension Review Board (PRB) encourages
the Fund and the City to review the findings and conclusions of this report carefully and jointly adopt a
forward-looking plan to address these risks and guide the Fund towards a path of long-term
sustainability. The PRB can provide technical assistance in formulating such a plan.
Overview
Orange Fire’s unfunded actuarially accrued liability (UAAL or "unfunded liability") increased from $1.4
million in 2000 to $8.2 million by the beginning of 2017, and the Fund has routinely maintained funded
ratio less than 75%. This chronic underfunding can be primarily attributed to actual investment returns
consistently being lower than the assumed investment return and regularly contributing less than the
annual benefit accrual plus growth of existing unfunded benefits. The Fund's reported investment
expenses are among the highest in Texas and at current contribution rates and benefit levels, the
unfunded liability can be expected to continue to grow and the funded status to continue to languish.
Constantly underfunding a plan places the benefits of both retirees and active members at significant
risk and/or places the burden of paying for services already rendered on future generations of taxpayers
and employees through the reduction of future benefits or an increase in contributions. Orange Fire and
the City have made recent contribution increases, but these changes have not been enough to put the
Fund on a solid path to sustainability. Orange Fire and the City have yet to make difficult decisions on
additional needed changes to benefit or contribution levels.
Conclusion
Orange Fire should consider the following actions to help ensure financial stability and mitigate the risks
that lead to underfunding: continually monitoring investment managers’ performance against their
benchmarks; evaluating asset allocation decisions and appropriate risk levels on a forward-looking basis;
conducting a peer group study on investment expenses to get a more accurate picture of investment
expenses paid and comparing those against their peers; reviewing actuarial assumptions against actual
experience and making necessary changes; and ensuring contributions are adequate to fully fund
Orange Fire over a reasonable period.
To address the funding and governance risks, the Fund and the City should develop written funding,
benefit, and investment policies that are linked to provide a formal risk-/cost-sharing arrangement. A
strong funding policy that requires payment of an actuarially determined contribution (ADC) is
encouraged. In addition to helping maintain a sound plan funding level, putting such forward-looking
policies into place can help reduce uncertainty for stakeholders who would know, in advance, how
adverse experience will be managed.

Intensive Actuarial Review: Orange Firemen’s Relief and Retirement Fund
2
Background
Texas Government Code Section 801.202(2) requires the Pension Review Board (PRB) to conduct
intensive studies of potential or existing problems that threaten the actuarial soundness of or inhibit an
equitable distribution of benefits in one or more public retirement systems. The PRB identified the
following key metrics, in addition to amortization period, to determine and prioritize retirement systems
for intensive actuarial review. The PRB selected Orange Firemen’s Relief and Retirement Fund (“Orange
Fire” or “the Fund”) for review based on the 2017 actuarial valuation data shown below. Unless
otherwise noted, the following metrics were calculated as of January 1, 2017.
Amort. Period (Years)
Funded Ratio
UAAL as % of Payroll
Assumed Rate of Return
Payroll Growth Rate
Actual Cont. as % of ADC1
Non-Investment
Cash Flow as % of FNP
69.3 49.86% 336.03% 7.75% 4.00% 70.49% -7.91%
Contribution and cash flow data are from the Fund’s 12/31/2016 financial audit.
At the time the Fund was selected for review:
• Its amortization period was the second highest
finite period of all defined benefit pension plans in Texas.
• Its funded ratio was the 13th lowest of all defined
benefit pension plans in Texas.
• Only 17 plans in Texas used an assumed rate of
return above 7.75%, which is above both the Texas and
national averages for public pension plans.
• Actual contribution as a percent of actuarially
determined contribution (ADC) was the eighth lowest
among Texas defined benefit plans and the lowest in its
peer group (TLFFRA plans with assets of less than $15
million).
• Investment expense as a percentage of plan net assets was one of the highest amongst all
defined benefit plans in Texas.
• Its non-investment cash flow as a percent of assets (fiduciary net position (FNP)) was the eighth
lowest among Texas defined benefit plans.
1 For plans whose contributions are a fixed rate, based on statutory or contractual requirements, the ADC for this purpose is the contribution needed to fund the benefits accrued in the current year and maintain an amortization period that does not exceed 30 years, as required to be reported under Texas Government Code §802.101(a).
Plan Profile
Actuarial Accrued Liability: $16,353,849
Market Value of Assets: $8,154,674
Normal Cost: 12.76% of payroll
Contributions: 12.50% employee 14.50% employer
Membership: 37 active 42 annuitants
Social Security Participation: No

Intensive Actuarial Review: Orange Firemen’s Relief and Retirement Fund
3
Risk Analysis
A pension fund faces multiple risks, which can be boiled down to one primary concern of whether there
will be enough money to pay benefits when they are due. This section discusses potential funding and
governance risks facing the fund. The risk being taken in each of these areas increases the probability of
a continued period of severe financial stress for the Fund. This also raises the likelihood of deteriorating
funding conditions in the coming years, further imperiling the Fund’s ability to pay promised benefits.
Funding Risk
Orange Fire’s significant growth in unfunded liability (UAAL), which increased from $1.4 million in 2000
to $8.2 million in 2017, can be attributed primarily to actual returns consistently lower than the
assumed investment return and contributions consistently lower than the annual benefit accrual plus
growth of existing unfunded benefits.
2
Background
According to Orange Fire’s January 1, 2017 actuarial valuation, the Fund was 50% funded on an actuarial
basis, and according to reports filed with the PRB, it has not had a funded ratio above 70% since the
2006 valuation.
2 Other includes demographic experience, benefit changes, and changes to assumptions and methods.

Intensive Actuarial Review: Orange Firemen’s Relief and Retirement Fund
4
For a plan’s funding level to improve, its assets must grow faster than the liabilities, which can be
achieved by three key levers: contributions greater than the normal cost plus interest on the UAAL,
benefit reductions to lower liabilities, and/or investment returns consistently higher than the assumed
rate of return.
Investment Expenses and Performance
The Fund is currently spending a larger percentage of assets on investment related expenses than any
other plan in the state with total fees estimated at 1.15%. According to the information provided by the
Fund, investment returns have underperformed the Fund’s benchmark on a net of fees basis in all but
the most recent year. As shown in the chart below, Orange Fire has had a 5.67% net return since 2004,
which is 58 basis points lower than its benchmark of 6.25%.3
3 Data is from 2nd Quarter Performance Report for the City of Orange Fireman’s Retirement & Relief Fund, Graystone Consulting, July 19, 2018.

Intensive Actuarial Review: Orange Firemen’s Relief and Retirement Fund
5
According to a study conducted by Morningstar in 2015, investment fees were a major predictor of
future fund performance4. The study concluded that funds with the lowest fees during the 2010 - 2015
period outperformed funds with higher fees across all asset classes. Reducing total expenses alone is not
likely to be sufficient for Orange Fire to consistently meet or exceed its assumed rate of return, but is an
important area the board should focus on in its fiduciary duty to improve investment performance and
efficiently manage the Fund’s investment program. For example, based on current projections, a
reduction in expenses of just 25 basis points could potentially save the Fund more than $2.5 million in
investment expenses over the next 30 years.
The chart below shows Orange Fire’s investment expenses as a percent of total net assets compared to
the TLFFRA plans closest to Orange Fire in asset size.
Peer Group Plans Effective Date Total Net Assets
Investment Expenses
Inv Exp as % of Assets
10-Year Net Return
Orange Fire 12/31/2016 $8,154,674 $93,636 1.15% 3.72%
Corsicana Fire 12/31/2016 $8,344,317 $92,459 1.11% 3.40%
Waxahachie Fire 9/30/2016 $14,201,159 $142,317 1.00% 4.90%
Plainview Fire 12/31/2016 $5,427,943 $49,439 0.91% 1.95%
Sweetwater Fire 12/31/2017 $8,547,174 $66,056 0.77% 4.91%
Greenville Fire 12/31/2016 $12,728,162 $90,884 0.71% 4.23%
Paris Fire 12/31/2016 $4,764,272 $32,730 0.69% 2.16%
Atlanta Fire 12/31/2016 $3,744,867 $25,495 0.68% 4.84%
Marshall Fire 12/31/2016 $7,712,228 $45,898 0.60% 4.67%
Weslaco Fire 9/30/2017 $10,429,381 $61,218 0.59% 2.59%
4 https://corporate1.morningstar.com/ResearchArticle.aspx?documentId=752589

Intensive Actuarial Review: Orange Firemen’s Relief and Retirement Fund
6
Based on the audited financial statements provided by the systems to the PRB, Orange Fire pays a larger
percentage of their total net assets toward reported investment expenses than their peers. However,
due to inconsistencies in reporting of investment expenses between various investment vehicles and
investment managers and potential differences in expense classification between auditors, the PRB
recognizes that this data may not be an entirely accurate depiction of true investment related expenses
paid.
Investment Experience Compared with Investment Return Assumption
Orange Fire’s actual investment return has consistently been lower than the assumed investment
return, increasing the unfunded liability by more than $4.5 million between 2000 and 2017. As
illustrated below, the Fund has not achieved a 7.75% (the Fund’s current assumed rate of return)
annualized return over a consecutive 10-year period in any of the 13 periods ending December 31, 2005
through December 31, 2017.
The graph below projects the funded ratio for the next 30 years, assuming the member and the City
contribution rates remain at a fixed 12.50% and 14.50% respectively, and the investments return 6.75%,
7.75%, or 8.75%. The impact of consistently earning less than the expected return on assets (EROA) but
even as high as 6.75% over the next 30 years, results in the funded status sinking to 29%.
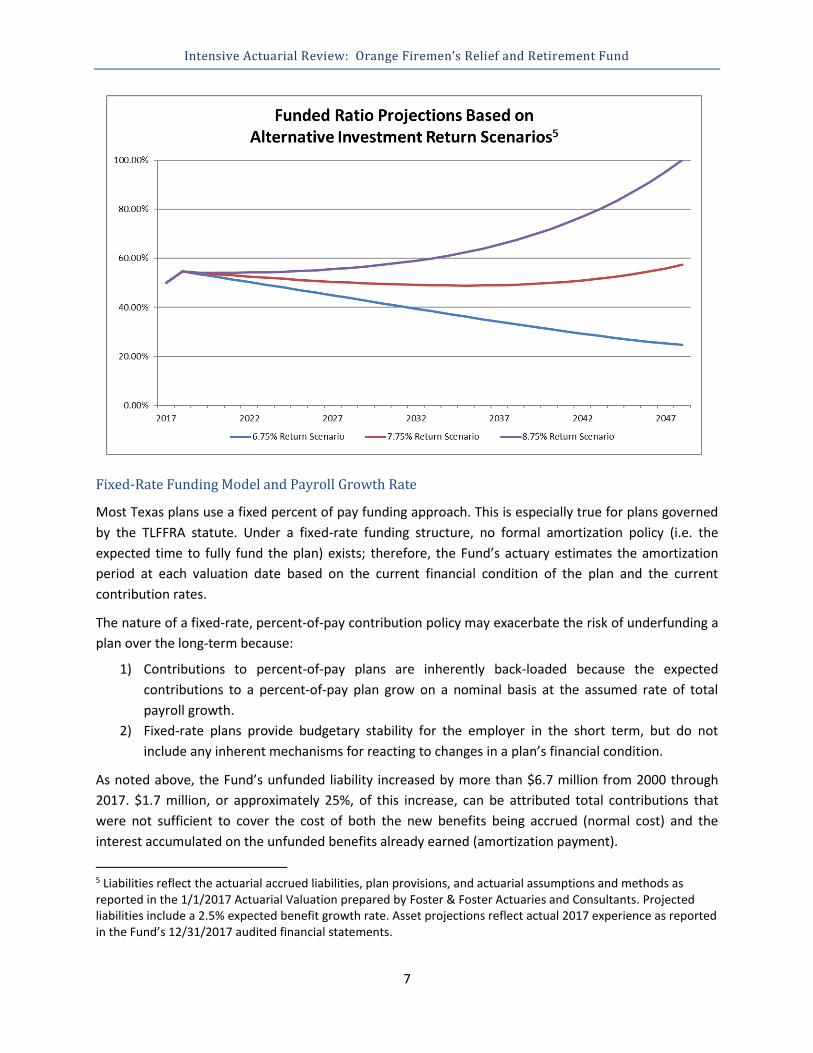
Intensive Actuarial Review: Orange Firemen’s Relief and Retirement Fund
7
5
Fixed-Rate Funding Model and Payroll Growth Rate
Most Texas plans use a fixed percent of pay funding approach. This is especially true for plans governed
by the TLFFRA statute. Under a fixed-rate funding structure, no formal amortization policy (i.e. the
expected time to fully fund the plan) exists; therefore, the Fund’s actuary estimates the amortization
period at each valuation date based on the current financial condition of the plan and the current
contribution rates.
The nature of a fixed-rate, percent-of-pay contribution policy may exacerbate the risk of underfunding a
plan over the long-term because:
1) Contributions to percent-of-pay plans are inherently back-loaded because the expected
contributions to a percent-of-pay plan grow on a nominal basis at the assumed rate of total
payroll growth.
2) Fixed-rate plans provide budgetary stability for the employer in the short term, but do not
include any inherent mechanisms for reacting to changes in a plan’s financial condition.
As noted above, the Fund’s unfunded liability increased by more than $6.7 million from 2000 through
2017. $1.7 million, or approximately 25%, of this increase, can be attributed total contributions that
were not sufficient to cover the cost of both the new benefits being accrued (normal cost) and the
interest accumulated on the unfunded benefits already earned (amortization payment).
5 Liabilities reflect the actuarial accrued liabilities, plan provisions, and actuarial assumptions and methods as reported in the 1/1/2017 Actuarial Valuation prepared by Foster & Foster Actuaries and Consultants. Projected liabilities include a 2.5% expected benefit growth rate. Asset projections reflect actual 2017 experience as reported in the Fund’s 12/31/2017 audited financial statements.

Intensive Actuarial Review: Orange Firemen’s Relief and Retirement Fund
8
According to its actuarial valuations, Orange Fire has not received the reported ADC in any year since
2006. Even with contribution increases in 2008 and 2015, employer contributions have averaged less
than 85% of the Fund’s ADC over that period. Furthermore, the reported ADC is calculated using an
open amortization period that results in perpetual negative amortization. If the fund were to use this
ADC as a funding policy, the UAAL would grow indefinitely and the “pension debt” would never be paid
off.
For the fiscal year beginning January 1, 2017, the expected contributions were about 73% of the
reported ADC. This shortfall of $128,102 is equal to 0.71% of the City’s total General Fund expenditures
for the fiscal year ending December 31, 2016 and is the second highest among TLFFRA plans of similar
size.
Expected Contribution Levels vs. Actuarially Determined Contribution
Date (1/1) 2000 2002 2004 2006 2008 2010 2012 2015 2017
Employee Contribution 9.00% 9.00% 9.00% 9.00% 11.00% 11.00% 11.00% 12.00% 12.00%
Employer Contribution 9.00% 11.00% 14.00% 14.00% 14.00% 14.00% 14.00% 14.00% 14.00%
Employer 30-Year ADC 8.86% 11.53% 13.25% 13.43% 14.01% 14.95% 19.61% 18.66% 19.25%
% of ADC funded 101.58% 95.40% 105.66% 104.24% 99.93% 93.65% 71.39% 75.03% 72.73% Covered Payroll (in thousands) $1,587 $1,647 $1,673 $1,717 $2,000 $1,907 $1,996 $2,292 $2,440 Contribution Shortfall (in thousands) - $8.72 - - $0.2 $18.12 $111.98 $106.81 $128.1
Both active members and the City increased their contribution rate by 0.25% of payroll in November
2017 and will increase it another 0.25% effective October 1, 2018 to a total of 12.50% and 14.50%,
respectively, which was agreed to as part of the latest Funding Soundness Restoration Plan (FSRP). This
increase plus positive asset experience during 2017 was enough to satisfy the FSRP requirements, but it
still falls 4.25% of pay short of meeting the 2017 recommended ADC.
In addition, the FSRP relies on a payroll growth assumption of 4.00%, which is tied for the fifth highest
rate in the state. This assumes future payroll growth will be 150% more than the 2.75% per year actual
payroll growth rate the Fund experienced from 2000 to 2017. In addition, the population of Orange,
Texas has been shrinking since the 1960s from a high around 35,000 to a current population of under
20,000 and is still recovering from the damage wrought by Hurricane Harvey.6,7 In order to sustain a
payroll growth rate well in excess of expected inflation and both national and Texas wage growth
projections, a sustained population boom would be necessary.
As an example of the impact of this key economic assumption, if the assumed rate for the 2017
valuation was just 3.0%, the Fund would be at an infinite amortization period and would not be
compliant with the recently submitted FSRP. Regardless of the impact on the Fund’s FRSP, the risk
associated with backloading the contributions but not achieving the assumed rate of payroll growth, and
6 http://www.orangetexas.net/about-orange/orange-history/ 7 http://www.orangetexas.net/about-orange/city-of-orange-demographics/

Intensive Actuarial Review: Orange Firemen’s Relief and Retirement Fund
9
therefore not receiving the expected contributions is significant, as can be seen in the following graph
which shows the impact of various scenarios of lower actual payroll growth rates.
Conclusions/Recommendations
Pre-funding a defined benefit plan, i.e. setting aside assets now for benefits that will be paid in the
future, is necessary to help balance the three primary policy goals of benefit security, equity between
generations of taxpayers and employees, and a stable contribution from year to year. Consistently
underfunding a plan places the benefits of both retirees and active members at significant risk and/or
places the burden of paying for services already rendered on future generations of taxpayers and
employees through the reduction of future benefits or an increase in contributions.
In the absence of a formal, written funding and risk-sharing policy, the result is a de facto risk-sharing
arrangement that is simply a reaction to events, often well after the plan finds itself with financial
difficulties. Plans and their sponsors can take many actions to ensure financial stability and mitigate the
risks that lead to underfunding. These steps include ensuring contributions are adequate to fully fund
the plan over a reasonable period; developing formal policies to guide decision-makers under different
economic conditions; reviewing actuarial assumptions against actual experience and making necessary
changes; and monitoring investment performance and evaluating asset allocation decisions on a
forward-looking basis.
Investment Performance. Whatever the investment return assumption used, investment returns should
be closely monitored, and investment managers’ performance should be assessed regularly and
compared to appropriate asset class benchmarks. Orange Fire currently has one of the highest ratios of
investment expenses to market value of assets of any defined benefit plan in Texas. The Fund should
give serious consideration to its investment management strategy, specifically to the expenses it pays
Intensive Actuarial Review: Orange Firemen’s Relief and Retirement Fund
10
and if it is receiving a reasonable benefit for these costs. Lowering these expenses should be an effective
means to improve net investment performance. Given the limitations of the data reported to the PRB,
conducting a peer group study of investment expenses could serve as a useful exercise to determine if
actual expenses are in line with other institutional investors of similar size.
In addition, benchmarks should be reviewed to see if they have been met or exceeded and should be
viewed considering the risk taken to achieve those returns. Best practices also include revisiting advisor
selection periodically, with boards of trustees evaluating performance, fees, and whether their current
advisors are providing the highest possible value at the lowest possible cost. The asset allocation should
also be assessed from a risk perspective to provide insight into how the fund would weather a market
correction.
Actuarial Assumptions. Neither the payroll growth assumption nor the investment return assumption is
being consistently met when gauging actual plan experience. When pension funds are consistently
overestimating their assumptions, they underestimate the funding issues they are facing. In the case of
payroll growth, if Orange Fire had been assuming a growth rate or 2.75% (their average payroll growth
since 2000) their amortization period would be infinite rather than the 69 years reported in the 2017
valuation. Public pension plans must monitor actuarial assumptions continually through their actuarial
valuations and make appropriate adjustments to mitigate bias in the assumptions that result in
consistent actuarial gains or losses.
Actuarial gains and losses occur when the plan’s actual experience does not match expected experience.
Over time, without required changes, pension funds such as Orange Fire whose assumptions
consistently diverge from actual experience in the same direction (i.e. consistently seeing actuarial gains
or consistently seeing actuarial losses) can exacerbate the issue of intergenerational inequity, causing
one group of members and taxpayers to over- or under-pay. Boards of trustees should work with their
actuaries and other consultants to ensure assumptions are neither too aggressive nor too conservative,
while striving to maintain (or achieve) sound fiscal health to secure existing accrued benefits. PRB’s
Pension Funding Guidelines recommend systems to monitor, review, and report the impact of actual
plan experience on actuarial assumptions at least once every five years.
Adequate Funding. The Fund has been increasing both the member and city contribution rates in recent
years and it is the PRB’s understanding that discussions to increase contributions even further is still
being discussed. While we commend the actions taken by the Fund’s board and members, the current
contribution structure still has not been enough to meet the Fund’s ADC rate. To address these
concerns, a strong funding policy that requires payment of an ADC is encouraged. Numerous actuarial
methods can be utilized to help mitigate contribution volatility, including directly smoothing
contribution rates or adding “guardrails” that require the stakeholders to come back to the table if the
contribution rate falls outside a specified range. If funding according to an ADC is not adopted, a funding
policy that fully funds the Fund over a finite period, such as 30 years, is recommended.
Intensive Actuarial Review: Orange Firemen’s Relief and Retirement Fund
11
Governance Risk
When public pension plans and their sponsors wait too long to address them, the funding challenges
compounding over time can reach a point where small, incremental improvement, such as the
contribution increases made for Orange Fire, are not sufficient to make consistent, long-term
improvements to the overall health of the Fund. Orange Fire and the City have yet to make difficult
decisions on additional needed changes to benefit or contribution levels. If necessary changes are
ultimately made, they may right the ship, but they will potentially be made under less than ideal
conditions.
Funding Decision-making
Governance is essentially decision-making, and decision-making for public pension plans must balance
the competing interests of plans and their sponsors and should feature collaboration between the two.
The primary source of governance risk is the potential lack of involvement of key parties or stakeholders
(members, the sponsor government, and taxpayers) in important areas of decision-making for a pension
plan including plan design (benefits) and funding (contributions). When a key party is not engaged in
important decisions, the risk increases that benefit levels and the contributions required to fund them
will diverge, potentially putting the plan’s funding stability at risk.
For example, TLFFRA allows boards of trustees to make prospective benefit modifications, both
increases and reductions. These changes must be approved by an actuary and a majority of participating
members and may not deprive an eligible participant of vested accrued benefits. Although jointly
responsible for funding the retirement plan along with plan members, the sponsoring city may have
limited involvement in benefit decision-making, a structure which generates the risk that benefit levels
adopted could be unsustainable.
Benefit increases are not the only potential risk related to a potential lack of sponsor involvement under
TLFFRA; unwillingness to reduce benefits prospectively when necessary to address funding challenges
can be an obstacle to getting things back on track. It should be noted that even plans with very engaged
boards and sponsors can be susceptible to increasing benefits to unsustainable levels in good times or
failing to lower them when necessary in bad times. Governance risk related to an imbalance in decision-
making can only exacerbate these risks. Given the Fund’s historically poor funding levels of under 75%
for the last 15 years, the absence of benefit modification by Orange Fire illustrates this point.
Funding Soundness Restoration Plan
State law recognizes the potential risks of underfunding and a lack of engagement by some key
stakeholders and imposes cooperation between the system and sponsoring governmental entity by
requiring retirement systems having trouble meeting their long-term obligations work with their
sponsors to develop a restoration plan for addressing those issues.8 This framework helps ensure that
8 Texas Government Code 802.2015 and 802.2016 require public retirement systems whose amortization period exceeds 40 years for 2 or 3 consecutive actuarial valuations to develop, with their sponsor, a funding soundness restoration plan designed to bring their amortization period within 40 years over 10 or fewer years.

Intensive Actuarial Review: Orange Firemen’s Relief and Retirement Fund
12
both the system and its sponsoring employer are involved in pension plan reform decisions, but it comes
at a point when actuarial health is already threatened. Orange Fire submitted an FSRP for review on
November 8, 2016. The FSRP stated after the 1/1/2015 valuation member contributions had increased
from 11.00% to 12.00% The changes outlined in the FSRP recalculated an amortization period of 47.4
years for 2015; however, the 1/1/2017 valuation showed the amortization period had increased to 69.3
years.
Because of the increase in the amortization period, Orange Fire submitted a second FSRP on February
15, 2018. This FSRP instituted further contribution increases bringing the contribution rates for
members and the city to 12.50% and 14.50% respectively, by October 2018. Additionally, the board
proposed a benefit change to amend the normal form of annuity payment from a 66 2/3% joint
annuitant form of payment for married members to a life annuity for all members regardless of marital
status, which is expected to decrease the amortization period by approximately 7 years. Plan members
ultimately voted down this proposal in July, however the Fund’s board has moved to carry out a new
vote with the following options: (A) amend the normal form of annuity payments at the time of
retirement as recommended by the Fund’s actuary; (B) increase the members’ contribution rate by 2%
over a four-year period beginning on 10/1/2019; or (C) opt out of both (A) and (B) (no action). It is
possible the new vote could be completed before mid-September.
Investment Decision-making
For Orange Fire, another area of governance risk relates to management and oversight of the Fund’s
investment program by the board. Orange Fire has adopted an investment policy statement (IPS) that
clearly identifies the overall investment objectives of the Fund and the expectations of investment
managers to meet these objectives, as outlined below.
1. Achieve a total return, net of fees, in excess of the assumed rate of return
2. Outperform the annualized return of the Fund’s composite policy benchmark
3. Achieve a real return of 4.5% over the CPI
The policy also outlines steps the board can take if at least two of these three objectives are not being
met. These include re-evaluating the goals, modifying the asset allocation, and/or revisiting investment
manager selection. Given the many years of protracted underperformance of the Fund’s assets and not
meeting the stated IPS objectives, the following elements of the Fund’s investment program should all
be reviewed: the Fund’s risk tolerance, asset allocation, and investment manager performance. Along
with reviewing these factors, the board should re-examine whether the current goals are obtainable and
take appropriate actions to improve the overall investment performance of the Fund.
Conclusions/Recommendations
Plans and their sponsors can develop policies that proactively manage risk in the future by laying out a
formal risk-sharing plan. To proactively manage governance and funding risk, retirement plans and their
sponsors should work together to adopt written policies far in advance, that can guide them through
both good and bad years and shield against the risk of either party’s exclusion or disengagement from
decision-making. Funding and benefit policies can be adopted that provide a framework for how benefit

Intensive Actuarial Review: Orange Firemen’s Relief and Retirement Fund
13
and contribution levels may be modified under different conditions. An advantage of such policies is that
changes to plan benefits and costs are known and understood by all parties in advance, rather than
negotiated under difficult circumstances.
For example, a benefit policy can outline the primary objectives the employer wishes to achieve, which
can be as detailed as a specified replacement ratio, or as general as offering competitive benefits at a
reasonable cost, as well as identifying policies and procedures designed to determine if the objectives
are being met and how they can be reviewed at reasonable intervals. In addition, outlining potential
benefit enhancements or reductions based on the funding goals outlined in the funding policy.
The funding policy might incorporate objectives associated with benefit security, contribution stability
and intergenerational equity and outline how those objectives will be met through the use contribution
changes, as well as referencing potential changes outlined in the benefit policy. For example, the
coordinated policies might limit future benefit enhancements, cost of living adjustments, and/or
contribution rate reductions such that they can only be considered or made if the Fund's funded ratio
remains greater than a chosen threshold. In addition, if the funded ratio falls below a certain threshold,
the stakeholders are required to come back to the table to make necessary contribution and benefit
adjustments.
Orange Fire in conjunction with the City should utilize the funding soundness restoration plan
requirement to develop such long-term policies. This will likely require some difficult decisions to get the
Fund set on the proper path, but the longer these decisions are delayed, and a reasonable cost-sharing
structure is not implemented, the more difficult the decisions become.
In the area of investment governance, the board should work closely with its advisors to manage the
Fund’s investment program and ensure that the IPS is being fully utilized. Manager performance should
be continuously monitored, and appropriate action should be taken in accordance with the steps laid
out in the IPS.

Intensive Actuarial Review: Orange Firemen’s Relief and Retirement Fund
14
Appendix

Intensive Actuarial Review: Orange Firemen’s Relief and Retirement Fund
15
Key Metrics
Metric Amortization period (69.3 years)
What it measures
Approximately how long it would take to fully fund the unfunded actuarial accrued liability (UAAL) based on the current funding policy.
Why it is important
Given the Fund’s current assumptions, an amortization period above 17 years indicates the contributions to the Fund in the coming year are less than the interest accumulated for that same period and therefore the total UAAL is expected to grow over the near term. In addition, for a plan that contributes on a fixed-rate basis such as Orange Fire, the higher the amortization period, the more sensitive it is to small changes in the UAAL.
Peer comparison
Orange Fire currently has one of the highest amortization periods of all defined benefit pension plans in Texas and ranks highest amongst its peer TLFFRA plans (TLFFRA plans with a market value of assets below $15 million).
Metric
Funded ratio (49.86%)
What it measures
The percent of a fund’s actuarially accrued liabilities covered by its actuarial value of assets.
Why it is important
The lower the funded ratio, the fewer assets a fund must pay its current and future benefit payments.
Peer comparison
Orange Fire’s funded ratio is below the State’s average of 72.53% and is one of the lowest in the state.
Metric UAAL as a percent of payroll (336.03%)
What it measures
The size of a plan’s unfunded liability compared to the annual payroll of its active members.
Why it is important
Provides a way to compare plans of various sizes and expresses the outstanding “pension debt” relative to current personnel costs.
Peer comparison
The Fund’s UAAL as a percent of payroll is one of the highest amongst TLFFRA funds.

Intensive Actuarial Review: Orange Firemen’s Relief and Retirement Fund
16
Metric Assumed rate of return (7.75%)
What it measures
The estimated annual rate of return on the Fund’s assets.
Why it is important
If actual future returns are lower than the assumed rate of return, future contributions will need to increase significantly, especially for a poorly funded plan. Orange Fire’s assumed rate of return is 7.75%, while its actual ten-year investment rate of return for the period ending December 31, 2016 was only 3.72%.
Peer comparison
Orange Fire is tied for the fourth highest Assumed rate of return in its peer group.
Metric
Payroll growth rate (4.00%)
What it measures
The estimated annual growth in the total payroll of active members contributing into the Fund.
Why it is important
Contributions are calculated as a percent of active members’ pay and are back-loaded based on the expected growth in total payroll. If payroll does not increase at this rate, actual contributions will not meet those expected in the Fund’s actuarial valuations. Given the Fund’s inactive and active liabilities are not fully funded; contributions below expected levels will have serious consequences on the Fund’s long-term solvency.
Peer comparison
The Fund’s payroll growth rate of 4.00% percent is tied for the second highest in its peer group.
Metric
Actual contributions as a percent of actuarially determined contributions (70.49%)
What it measures
Whether the current employer contributions have met a theoretical minimum threshold.9
Why it is important
The employer’s portion of the contribution is less than 71% of the amount needed to fund the Fund on a rolling 30-year amortization period. The PRB’s 2014 Study of the Financial Health of Texas Public Retirement Systems found that plans that have consistently received adequate funding are in a better position to meet their long-term obligations.
Peer comparison
This is one of the largest shortfall percentages in the state and the largest in its peer group.
9 The theoretical minimum threshold, or actuarially determined contribution (ADC), is a target or recommended contribution “to the Fund as determined by the actuary using a contribution allocation procedure,” as defined in Actuarial Standards of Practice No 4. If contributions to the Fund are made as a fixed rate based on statutory or contractual requirements, the ADC for this purpose is the contribution needed to fund the benefits accrued in the current year and maintain an amortization period that does not exceed 30 years, as required to be reported under Texas Government Code §802.101(a).

Intensive Actuarial Review: Orange Firemen’s Relief and Retirement Fund
17
Metric
Non-investment cash flow as a percent of fiduciary net position (-7.91%)
What it measures
Non-investment cash flow shows how much the Fund is receiving through contributions in relation to its outflows: benefit payments, withdrawals and expenses.
Why it is important
Viewing this metric as a percent of total net assets (or fiduciary net position (FNP)), in conjunction with the funded ratio and recognition of the relative maturity of a plan, provides information about the stability of a plan’s funding arrangement.
Peer comparison
Orange Fire’s non-investment cash flow as a percent of FNP is the third lowest in its peer group. If this trend continues, the Fund could face the potential risk of needing to liquidate a portion of existing assets to pay current benefits and/or expenses.
Plan Summary
The Orange Firemen’s Relief and Retirement Fund (“Orange Fire” or “the Fund”) is established in the
Texas Local Fire Fighter’s Retirement Act (TLFFRA). TLFFRA provides general guidelines for fund
management, but leaves administration, plan design, contributions, and specific investments to the
discretion of the board of trustees. Orange Fire, as with all TLFFRA systems, is entirely locally-funded.
Benefits
Retirement Eligibility Age: 50 years; Years of Credited Service (YCS): 20 years
Vesting Fully vested after 20 YCS
Benefit Formula Years of Service (up to 20 years) x 2.6% x Final Average Salary +$91 per month for each year > 20 Years of Service
Final Average Salary (FAS) Highest 60-Month Average Salary
COLA None
Retirement Benefit Options Forward DROP: 3-year maximum. Employee contributions credited; no interest. Eligible at 53 years of age and 23 years of service.
Social Security Yes – Social Security Leveling Option
Contributions
As of October 1, 2018, active members of Orange Fire contribute 12.50% of pay while the City of Orange
contributes 14.50% of pay.
Membership
Total Active Members
Retired Members
Terminated Total
Members Active-to-
Annuitant Ratio
37 42 1 80 0.88

Intensive Actuarial Review: Orange Firemen’s Relief and Retirement Fund
18
TLFFRA Board Structure
Active Members 3 - Members of the retirement system; elected by fund members. Three-year terms.
Sponsor Government 1 - Mayor or designated representative, or the political subdivision's Chief Operating Officer or designated representative. 1 - Chief Financial Officer of the political subdivision, or designated representative. Terms correspond to term of office.
Taxpayer, Not Affiliated With Fund/Sponsor Govt.
2 - Residents of the State of Texas, must not be officers/employees of the political subdivision; elected by other Board of Trustee members. Two-year terms.
Contribution and Benefit Decision-Making
TLFFRA authorizes members of the retirement systems to determine their contribution rates by voting.
The statute requires cities to make contributions at the same rate paid by employees or 12 percent,
whichever is smaller. TLFFRA also allows a city to contribute at a higher rate than employees do through
a change in city ordinance.
TLFFRA gives the board the power to make decisions to modify the benefits (increases and reductions).
However, a proposed addition or change must be approved by the actuary and a majority of
participating plan members. Benefit changes cannot deprive a member, retiree or beneficiary of the
right to receive vested accrued benefits.
Expense Breakdown
Fiscal Year ending 12/31/2016
Fiduciary Net Position (FNP) $8,154,598
Investment Expenses $93,636
Investment Expenses % of FNP 1.15%
Administrative Expenses $18,742
Administrative Expenses % of FNP 0.23%
Historical Trends
To conduct an intensive review of risks associated with the long-term funding of a pension Fund, it is
important to analyze trends in multiple metrics. A plan with an asset level lower than its accrued liability
has insufficient funds to cover benefits. A plan can experience an increase in unfunded liability due to
various factors, including insufficient investment returns, inadequate contributions and inaccurate or
overly aggressive assumptions. Hence, a single metric cannot effectively capture the different drivers
contributing to the increase of a plan’s unfunded pension obligation. This section analyzes historical
trends in various metrics identified by the PRB and makes comparisons to understand the sources of
growth in unfunded liability for Orange Fire.
Orange Fire’s funded status has been steadily declining since 2000. Numerous factors have contributed
to this deterioration, including inadequate contributions, investment returns being lower than the
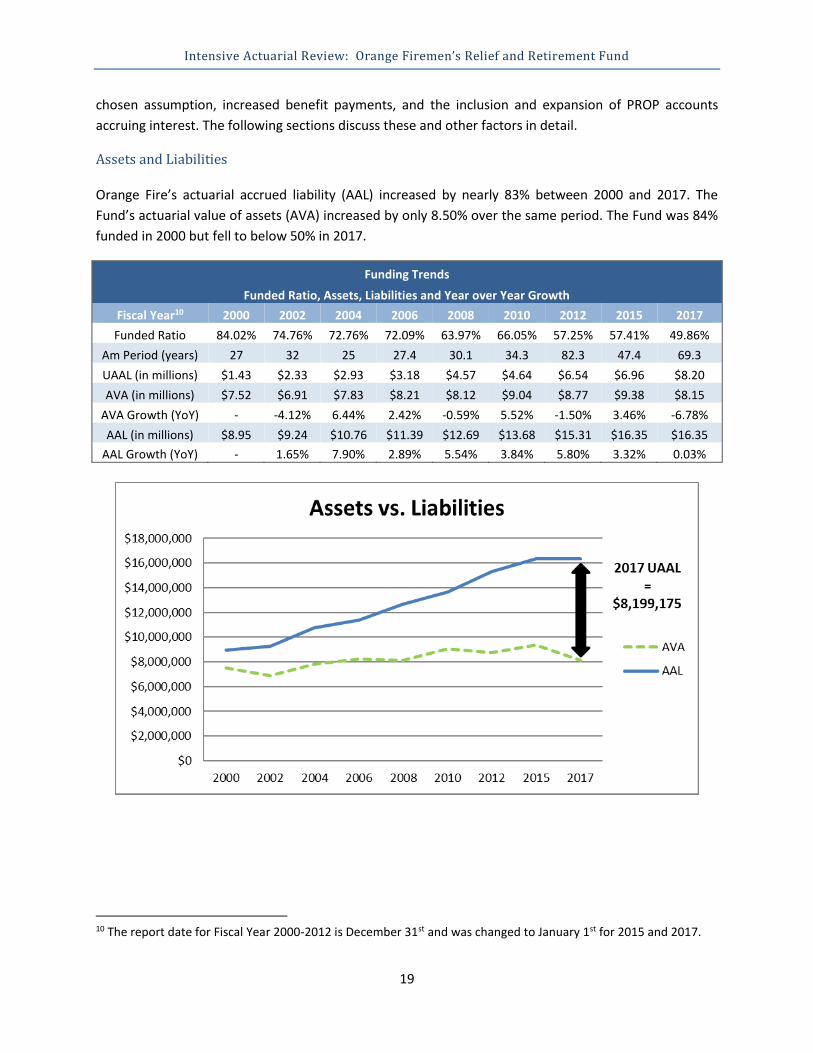
Intensive Actuarial Review: Orange Firemen’s Relief and Retirement Fund
19
chosen assumption, increased benefit payments, and the inclusion and expansion of PROP accounts
accruing interest. The following sections discuss these and other factors in detail.
Assets and Liabilities
Orange Fire’s actuarial accrued liability (AAL) increased by nearly 83% between 2000 and 2017. The
Fund’s actuarial value of assets (AVA) increased by only 8.50% over the same period. The Fund was 84%
funded in 2000 but fell to below 50% in 2017.
Funding Trends
Funded Ratio, Assets, Liabilities and Year over Year Growth
Fiscal Year10 2000 2002 2004 2006 2008 2010 2012 2015 2017
Funded Ratio 84.02% 74.76% 72.76% 72.09% 63.97% 66.05% 57.25% 57.41% 49.86%
Am Period (years) 27 32 25 27.4 30.1 34.3 82.3 47.4 69.3
UAAL (in millions) $1.43 $2.33 $2.93 $3.18 $4.57 $4.64 $6.54 $6.96 $8.20
AVA (in millions) $7.52 $6.91 $7.83 $8.21 $8.12 $9.04 $8.77 $9.38 $8.15
AVA Growth (YoY) - -4.12% 6.44% 2.42% -0.59% 5.52% -1.50% 3.46% -6.78%
AAL (in millions) $8.95 $9.24 $10.76 $11.39 $12.69 $13.68 $15.31 $16.35 $16.35
AAL Growth (YoY) - 1.65% 7.90% 2.89% 5.54% 3.84% 5.80% 3.32% 0.03%
10 The report date for Fiscal Year 2000-2012 is December 31st and was changed to January 1st for 2015 and 2017.

Intensive Actuarial Review: Orange Firemen’s Relief and Retirement Fund
20
Investment Assumption and Returns
The 10-year net return on investments in 2016 was 3.72%, which is more than 400 basis points below its
assumed interest rate. PRB’s AV Supplemental Report dated June 14, 2018 showed that out of 91 Texas
Funds that reported a 10-year net investment return, Orange Fire stood at 71st.
Rates of Return (as of 12/31/2016)
Time Period 1-year 3-year 10-year Since 1995
Gross Return 5.85% 2.67% 4.83% 7.18%
Net Return 4.65% 1.54% 3.72% 6.25%
Asset Allocation
As shown in the chart below, the Fund’s actual asset allocation is close to its target allocation and within
the ranges of the Fund's Investment Policy Statement.
Asset Allocation (as of 12/31/2016)
Asset Class Equities Fixed Income Cash Other11
Current Allocation 55.25% 39.64% 5.03% 0.09%
Target Allocation 65.00% 35.00% - -
Cash flow
Orange Fire has the third lowest non-investment cash flow among its peers. In 2016 the Fund’s non-
investment cash flow was -7.91%. The large dips in 2002 and 2006 were due to large increases in total
disbursements. Total contributions have grown on average by 2.29% annually since 2000 but are being
outpaced by the average growth in yearly benefit disbursements of 3.38%. Total expenses are growing
at an average rate of 4.44%
A negative non-investment cash flow is not abnormal for mature defined benefit pension plans.
However, a cash flow percentage this low is likely to be a drag on potential investment returns because
a plan must either invest in a higher proportion of income-producing investments, which traditionally
provide lower returns, or must liquidate existing assets to pay out current benefits and/or expenses.
11 Other is “accrued Interest and dividends”

Intensive Actuarial Review: Orange Firemen’s Relief and Retirement Fund
21

Intensive Actuarial Review: Orange Firemen’s Relief and Retirement Fund
22
Peer Group Key Metric Comparison
Funding Val Metrics Fiscal Year End Metrics
Peer Group Plans MVA Am Period
Date Am Period Funded
Ratio UAAL as % of Payroll
Assumed Interest
Payroll Growth FYE
Actual Cont. as % of ADC
DROP as % of FNP
Non-Investment
Cash Flow as % of FNP
Waxahachie Firemen's Relief & Retirement Fund
$ 14,201,159 10/1/2016 25.4 66.86% 164.84% 7.00% 4.00% 9/30/2016 102.75% N/A -3.16%
Greenville Firemen's Relief & Retirement Fund
$ 12,728,162 12/31/2016 38.0 47.69% 387.00% 8.00% 4.00% 12/31/2016 73.99% N/A -5.86%
Big Spring Firemen's Relief & Retirement Fund
$ 10,399,250 1/1/2017 36.2 54.86% 241.05% 8.00% 5.00% 12/31/2016 110.08% 0.00% -9.54%
Weslaco Firemen's Relief & Retirement Fund
$ 9,186,148 9/30/2016 14.1 68.53% 111.07% 7.25% 3.25% 9/30/2017 154.51% N/A 2.92%
Corsicana Firemen's Relief & Retirement Fund
$ 8,344,317 12/31/2016 28.9 53.14% 211.44% 7.00% 3.00% 12/31/2016 100.01% N/A -1.97%
Orange Firemen's Relief & Retirement Fund
$ 8,154,674 1/1/2017 69.3 49.86% 336.03% 7.75% 4.00% 12/31/2016 70.49% N/A -7.91%
Sweetwater Firemen's Relief & Retirement Fund
$ 7,826,879 12/31/2016 27.5 69.99% 229.12% 8.00% 4.00% 12/31/2017 154.44% N/A -4.07%
Marshall Firemen's Relief & Retirement Fund
$ 7,712,228 12/31/2016 56.4 42.02% 398.51% 7.75% 4.00% 12/31/2016 84.67% 3.99% -5.50%
Plainview Firemen's Relief & Retirement Fund
$ 5,296,898 12/31/2015 31.6 37.33% 453.72% 7.75% 3.50% 12/31/2016 87.77% N/A -2.63%
Paris Firefighters' Relief & Retirement Fund
$ 4,764,272 12/31/2016 41.9 35.64% 373.32% 7.50% 3.50% 12/31/2016 100.00% N/A -10.31%
Atlanta Firemen's Relief & Retirement Fund
$ 3,744,867 12/31/2016 28.4 82.13% 136.63% 7.40% 3.00% 12/31/2016 107.62% N/A -1.55%

Intensive Actuarial Review: Orange Firemen’s Relief and Retirement Fund
23
Peer Group Sponsor Funding Comparison
Peer Group Plans GF Expend EOY GF Bal UAAL Expected Employer
Contributions ADC 30-yr Shortfall 30-Y SF % of
ADC 30-Y SF % of
GFE
Waxahachie Firemen's Relief & Retirement Fund
$ 30,570,845 $ 14,660,133 $ 7,039,421 $ 663,197 $ 621,346 No Shortfall N/A N/A
Greenville Firemen's Relief & Retirement Fund
$ 19,089,359 $ 6,271,335 $ 15,021,872 $ 652,120 $ 836,499 $ 184,379 22.04% 0.97%
Big Spring Firemen's Relief & Retirement Fund
$ 18,328,572 $ 6,549,205 $ 9,078,736 $ 489,614 $ 538,952 $ 49,338 9.15% 0.27%
Weslaco Firemen's Relief & Retirement Fund
$ 25,524,743 $ 7,529,804 $ 4,334,628 $ 468,327 $ 310,657 No Shortfall N/A N/A
Corsicana Firemen's Relief & Retirement Fund
$ 16,163,690 $ 4,689,025 $ 8,135,345 $ 538,651 $ 538,651 No Shortfall N/A N/A
Orange Firemen's Relief & Retirement Fund
$ 17,985,946 $ 8,272,029 $ 8,199,175 $ 341,606 $ 469,709 $ 128,102 27.27% 0.71%
Sweetwater Firemen's Relief & Retirement Fund
$ 8,733,810 $ 3,929,907 $ 3,617,210 $ 284,174 $ 284,174 No Shortfall N/A N/A
Marshall Firemen's Relief & Retirement Fund
$ 20,353,433 $ 6,537,285 $ 10,641,648 $ 508,698 $ 651,293 $ 142,595 21.89% 0.70%
Plainview Firemen's Relief & Retirement Fund
$ 12,768,715 $ 15,844,471 $ 9,781,866 $ 532,083 $ 606,247 $ 74,164 12.23% 0.58%
Paris Firefighters' Relief & Retirement Fund
$ 25,422,079 $ 10,839,700 $ 9,625,814 $ 309,414 $ 385,995 $ 76,581 19.84% 0.30%
Atlanta Firemen's Relief & Retirement Fund
$ 3,568,284 $ 1,676,529 $ 860,536 $ 81,878 $ 81,878 No Shortfall N/A N/A
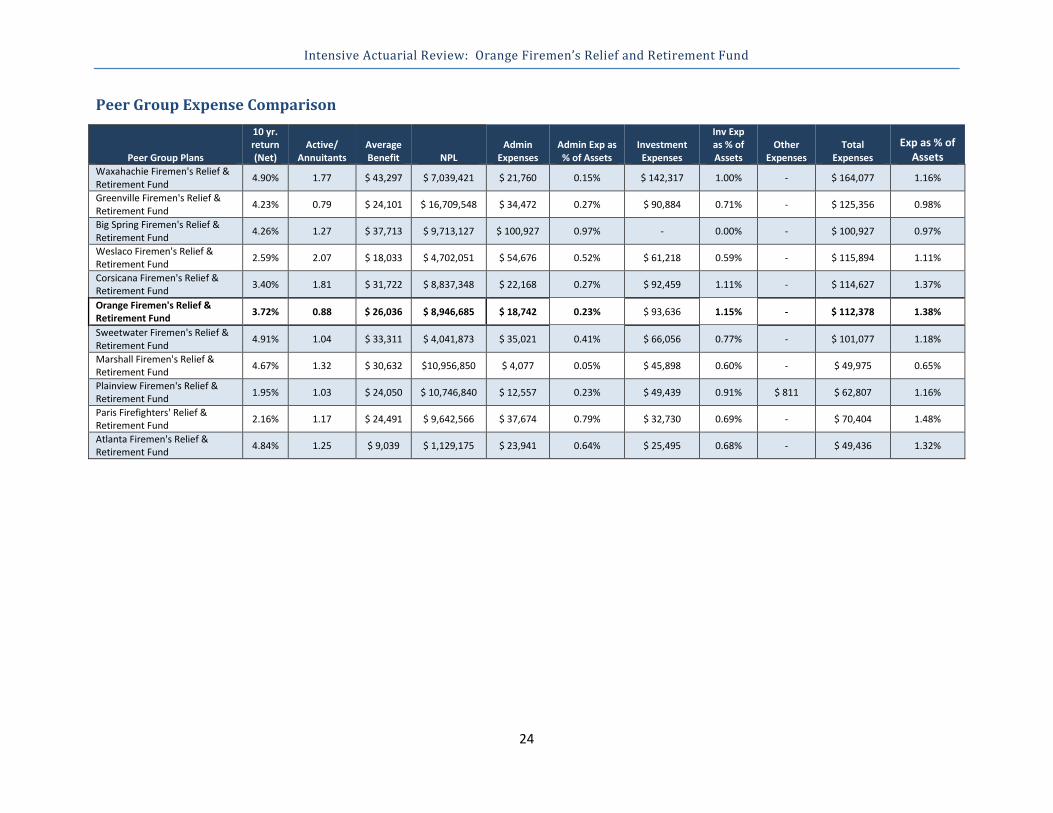
Intensive Actuarial Review: Orange Firemen’s Relief and Retirement Fund
24
Peer Group Expense Comparison
Peer Group Plans
10 yr. return (Net)
Active/ Annuitants
Average Benefit NPL
Admin Expenses
Admin Exp as % of Assets
Investment Expenses
Inv Exp as % of Assets
Other Expenses
Total Expenses
Exp as % of Assets
Waxahachie Firemen's Relief & Retirement Fund
4.90% 1.77 $ 43,297 $ 7,039,421 $ 21,760 0.15% $ 142,317 1.00% - $ 164,077 1.16%
Greenville Firemen's Relief & Retirement Fund
4.23% 0.79 $ 24,101 $ 16,709,548 $ 34,472 0.27% $ 90,884 0.71% - $ 125,356 0.98%
Big Spring Firemen's Relief & Retirement Fund
4.26% 1.27 $ 37,713 $ 9,713,127 $ 100,927 0.97% - 0.00% - $ 100,927 0.97%
Weslaco Firemen's Relief & Retirement Fund
2.59% 2.07 $ 18,033 $ 4,702,051 $ 54,676 0.52% $ 61,218 0.59% - $ 115,894 1.11%
Corsicana Firemen's Relief & Retirement Fund
3.40% 1.81 $ 31,722 $ 8,837,348 $ 22,168 0.27% $ 92,459 1.11% - $ 114,627 1.37%
Orange Firemen's Relief & Retirement Fund
3.72% 0.88 $ 26,036 $ 8,946,685 $ 18,742 0.23% $ 93,636 1.15% - $ 112,378 1.38%
Sweetwater Firemen's Relief & Retirement Fund
4.91% 1.04 $ 33,311 $ 4,041,873 $ 35,021 0.41% $ 66,056 0.77% - $ 101,077 1.18%
Marshall Firemen's Relief & Retirement Fund
4.67% 1.32 $ 30,632 $10,956,850 $ 4,077 0.05% $ 45,898 0.60% - $ 49,975 0.65%
Plainview Firemen's Relief & Retirement Fund
1.95% 1.03 $ 24,050 $ 10,746,840 $ 12,557 0.23% $ 49,439 0.91% $ 811 $ 62,807 1.16%
Paris Firefighters' Relief & Retirement Fund
2.16% 1.17 $ 24,491 $ 9,642,566 $ 37,674 0.79% $ 32,730 0.69% - $ 70,404 1.48%
Atlanta Firemen's Relief & Retirement Fund
4.84% 1.25 $ 9,039 $ 1,129,175 $ 23,941 0.64% $ 25,495 0.68% - $ 49,436 1.32%

Intensive Actuarial Review: Orange Firemen’s Relief and Retirement Fund
25
Comments from Orange Firemen’s Relief and Retirement Fund and City
of Orange


Texas Pension Review Board
2017-2018 Biennial Report
VII
APPENDIX A7 - INTENSIVE ACTUARIAL REVIEW – IRVING FIREMEN'S
RELIEF AND RETIREMENT FUND

Intensive Actuarial Review: Irving Firemen’s Relief and Retirement Fund
October 2018

Intensive Actuarial Review: Irving Firemen's Relief & Retirement Fund
Table of Contents Executive Summary ....................................................................................................................................... 1
Background ................................................................................................................................................... 2
Risk Analysis .................................................................................................................................................. 2
Asset-Liability Mismatch Risk .................................................................................................................... 3
Background ........................................................................................................................................... 3
Risks Associated with Irving Fire’s DROP .............................................................................................. 4
Conclusions/Recommendations ........................................................................................................ 6
Governance Risk........................................................................................................................................ 6
Background ........................................................................................................................................... 6
Governance Risk Case Study: Irving Fire’s DROP .................................................................................. 7
Funding Soundness Restoration Plan ................................................................................................... 8
Conclusions/Recommendations ........................................................................................................... 8
Funding Risk .............................................................................................................................................. 9
Background ........................................................................................................................................... 9
Investment Experience Compared with Investment Return Assumption .......................................... 10
Contribution Insufficiency Risk ........................................................................................................... 11
Conclusions/Recommendations ......................................................................................................... 12
Appendix ..................................................................................................................................................... 14
Key Metrics ............................................................................................................................................. 15
Plan Summary ......................................................................................................................................... 18
Benefits ............................................................................................................................................... 18
Contributions ...................................................................................................................................... 18
Membership ........................................................................................................................................ 18
TLFFRA Board Structure ...................................................................................................................... 19
Contribution and Benefit Decision-Making ........................................................................................ 19
Historical Trends ..................................................................................................................................... 19
Assets and Liabilities ........................................................................................................................... 20
Investment Assumption and Returns ................................................................................................. 20
Cash flow ............................................................................................................................................. 21
Forward and Retroactive DROP .......................................................................................................... 21
Peer Group Key Metric Comparison ....................................................................................................... 23
Peer Group Sponsor Funding Comparison .............................................................................................. 24
Peer Group Expense Comparison ........................................................................................................... 24

Intensive Actuarial Review: Irving Firemen's Relief & Retirement Fund
1
Executive Summary
Introduction
This intensive actuarial review of Irving Firemen’s Relief and Retirement Fund (“Irving Fire” or “the
Fund”) is intended to assist the Fund’s board of trustees and the City of Irving (“the City”) in assessing
the Fund’s ability to meet its long-term pension obligation. Overall, the review shows the Fund is facing
significant financial stress and is taking considerable risks in its approach to funding. The Pension Review
Board (PRB) encourages the Fund and the City to review the findings and conclusions of this report
carefully and jointly adopt a forward-looking plan to address these risks and guide the Fund towards a
path of long-term sustainability. The PRB can provide technical assistance in formulating such a plan.
Overview
Irving Fire faces significant risk associated with its deferred retirement option plan (DROP) because it
offers: a guaranteed 6.25% annual rate of return, which is calculated as 2.0% less than the actuarial
investment return assumption; a virtually unlimited amount of time to accrue this guaranteed return;
and the ability to withdraw these funds with little to no restriction. In an era of extremely low interest
rates, offering a guaranteed 6.25% rate of return on accounts that can be withdrawn on short notice is
virtually unheard of and presents great risk. It is impossible for the Fund to back these liabilities with
assets with a similar investment horizon while providing a similar return. The Fund’s DROP balance has
grown rapidly in the last few years, from just over 15% of total plan assets in 2014 to nearly 30% of total
assets in 2016.
The recent change in Irving Fire’s investment return assumption will lower the guaranteed rate of return
to 5.50% for future DROP participants. However, this will have little, if any, effect on Irving Fire’s DROP
program for the next nine years, as those who are already eligible for the DROP are locked in at the
guaranteed interest rate based on the Fund’s previous 8.25% investment return rate.
Conclusion
To address the immediate risks posed by the DROP, the board should consider performing an in-depth
asset-liability study to better understand the potential risks associated with its existing asset mix and the
liabilities they support and seriously consider the risk a guaranteed rate of return places on all the
Fund’s stakeholders while bearing in mind the impact changes could have on DROP participant behavior.
To address the funding and governance risks, the Fund and the City should develop written funding,
benefit, and investment policies that are linked to provide a formal risk-/cost-sharing arrangement. A
strong funding policy that requires payment of an actuarially determined contribution (ADC) is
encouraged. In addition to helping maintain a sound plan funding level, putting such forward-looking
policies into place can help reduce uncertainty for stakeholders who would know, in advance, how
adverse experience will be managed.

Intensive Actuarial Review: Irving Firemen's Relief & Retirement Fund
2
Background Texas Government Code Section 801.202(2) requires the Pension Review Board (PRB) to conduct
intensive studies of potential or existing problems that threaten the actuarial soundness of or inhibit an
equitable distribution of benefits in one or more public retirement systems.
Irving Fire’s intensive review was initially scheduled to begin in April 2018. The City requested a delay
and, after careful consideration of the exceptional circumstances surrounding the request, the PRB
agreed. The agency informed the Fund and City in late July that the Fund would be reviewed with a
publication date in October 2018.
The PRB identified the following key metrics, in addition to amortization period, to determine and
prioritize retirement systems for intensive actuarial review. The PRB selected Irving Firemen’s Relief and
Retirement Fund (“Irving Fire” or “the Fund”) for review based on the data shown below. Unless
otherwise noted, the following metrics were calculated as of the Fund’s December 31, 2015 actuarial
valuation.
Amort. Period (Years)
Funded Ratio
UAAL as % of Payroll
Assumed Rate of Return
Payroll Growth
Rate
Actual Cont. as %
of ADC1
DROP as % of FNP
Non-Investment
Cash Flow as % of FNP
33.0 74.92% 228.54% 8.25% 4.25% 82.33% 29.63% -1.24%
*Contribution, DROP and cash flow data are from the Fund’s 12/31/2016 financial audit.
At the time the Fund was selected for review:
• Its assumed rate of return on assets of 8.25% was
the highest of all defined benefit pension plans in Texas and
above the national averages for public pension plans.
• Its payroll growth rate of 4.25% was the most
aggressive in its peer group of TLFFRA plans with assets over
$100 million and one of the highest among Texas defined
benefit plans.
• Actual contribution as a percent of its Actuarially
Determined Contribution (ADC) was the second lowest
amongst its peer group.
• Members’ deferred retirement option plan (DROP)
balances accounted for nearly one-third of the plan’s total net assets.
Since selecting Irving Fire, the PRB received the Fund’s December 31, 2017 actuarial valuation. The
board lowered several key assumptions in the 2017 valuation, which combined with other factors
1 For plans whose contributions are made as a fixed rate based on statutory or contractual requirements, the ADC for this purpose is the contribution needed to fund the benefits accrued in the current year and maintain an amortization period that does not exceed 30 years, as required to be reported under Texas Government Code §802.101(a).
Plan Profile
Actuarial Accrued Liability: $246,655,353
Market Value of Assets: $174,037,587
Normal Cost: 18.53% of payroll
Contributions: 13.00% employee 16.75% employer
Membership: 360 active 180 annuitants
Social Security Participation: No

Intensive Actuarial Review: Irving Firemen's Relief & Retirement Fund
3
Regular/Forward DROP -
Active employee retires on
paper and continues
working. DROP account is
credited with monthly
pension benefit plus
contributions and interest.
Back/Retro DROP - At
retirement the employee
can elect to retire on paper
as of a previous date and
receive the monthly
pension benefits that would
have been paid had the
employee truly retired at
the elected date plus
contributions.
*DROP features vary.
Deferred Retirement Option Program Examples*
increased the Fund’s amortization period to infinity. This data has been incorporated into this review
and is summarized in the table below.
Amort. Period (Years)
Funded Ratio
UAAL as % of Payroll
Assumed Rate of Return
Payroll Growth
Rate
Actual Cont. as %
of ADC2
DROP as % of FNP
Non-Investment
Cash Flow as % of FNP
Infinite 71.61% 252.13% 7.50% 3.50% 82.33% 29.63% -1.24%
*Contribution, DROP and cash flow data are from the Fund’s 12/31/2016 financial audit.
Risk Analysis A pension fund faces multiple risks, which can be boiled down to
one primary concern of whether there will be enough money to pay
benefits when they are due. This section discusses three main risk
factors facing the Fund: asset-liability mismatch, governance, and
funding risks. Measuring Irving Fire based on these factors reveals a
significant amount of risk being taken in each of these areas,
increasing the probability of a continued period of severe financial
stress for the Fund. This also raises the likelihood of deteriorating
funding conditions in the coming years, further imperiling the
Fund’s ability to pay promised benefits.
Asset-Liability Mismatch Risk Irving Fire faces significant asset-liability mismatch risk associated
with its Deferred Retirement Option Plan (DROP) because it offers:
• a guaranteed 6.25% annual rate of return; 3
• a virtually unlimited amount of time to accrue this
guaranteed return; and
• the ability to withdraw these funds with little to no
restriction.
Background
Most of the benefits expected to be distributed from a public
defined benefit pension plan are not expected to be paid in the
2 For plans whose contributions are made as a fixed rate based on statutory or contractual requirements, the ADC for this purpose is the contribution needed to fund the benefits accrued in the current year and maintain an amortization period that does not exceed 30 years, as required to be reported under Texas Government Code §802.101(a).
3 The annual rate of return is defined as 2.0% less than the actuarial investment return assumption. Irving Fire has recently lowered its investment return assumption to 7.50%, however, the effect on the guaranteed rate of return on the DROP balance won’t begin to be realized by the Fund for several years.

Intensive Actuarial Review: Irving Firemen's Relief & Retirement Fund
4
short, or even medium, term. Thus, many believe investments such as equities are more likely to
achieve higher returns over a long time horizon and therefore provide a superior risk-return profile to
support these long-term liabilities. This has led public pension plans to allocate a large proportion of
assets to riskier and potentially less liquid investments. Irving Fire is no exception. However, Irving Fire
has unique plan design features that present additional risks which must be examined when considering
the reasonableness of this common asset allocation.
During the recent past, the Fund has offered two versions of its DROP, a Forward DROP and a Retro
DROP. Both DROPs have a maximum length of nine years. The election into the plan’s Forward DROP
was ended in January 2012, while the Retro DROP continues to be offered to retiring members.
Significant concerns with both versions of Irving Fire’s DROP are that DROP balances are allowed to be
left in the plan, earning a guaranteed 6.25% annual rate of return and can be withdrawn with virtually
no restrictions at any time. The only limit to the DROP provision as specified in the plan document is that
distributions must begin in accordance with Internal Revenue Service Required Minimum Distribution
rules.
While the Fund lowered its investment return assumption from 8.25% to 7.50% in its December 31,
2017 actuarial valuation, Irving Fire members eligible to participate in the DROP before the assumption
was changed will still earn a guaranteed 6.25% annual rate of return on their DROP balance. Because of
the length of the Retro DROP, it will take nearly a decade before the Fund is able to begin crediting new
DROP accounts at the lower interest rate of 5.50%. Hence, the following analysis of Irving Fire’s DROP
focuses on the rate credited to current DROP accounts and those due to be opened in the near future.
Risks Associated with Irving Fire’s DROP
In an era of extremely low interest rates, offering a guaranteed 6.25% annual rate of return on accounts
that can be left in the plan for years after retirement and withdrawn on short notice is virtually unheard
of and presents great risk. It is impossible for the Fund to back these liabilities with assets that have a
similar investment horizon and provide a similar return. In fact, the Fund has struggled to consistently
earn a 6.25% annual rate of return on its entire portfolio for an extended period of time. For example,
even though Irving Fire has surpassed a 6.25% return seven times in the past 11 years, it experienced
negative returns in three other periods during the same time span, resulting in an average annual return
of 5.88% for the ten-year period ending December 31, 2017.

Intensive Actuarial Review: Irving Firemen's Relief & Retirement Fund
5
A major concern is the lack of a trigger mechanism to lower or cease the guaranteed interest rate for
years with sub-par returns. Participants are incentivized by the nature of this program to treat it like a
risk-free savings account – one that earns roughly 6 times more than even the best savings accounts on
the market, while the active plan members and taxpayers absorb all the risk. The combined effect of the
6.25% guaranteed return on DROP accounts, the average actual return on assets lower than the interest
rate paid, and the option for all participants to leave their DROP balances in the Fund for up to 20 years
explains why the Fund’s DROP balance has grown to nearly 1/3 of the total assets as of the end of 2016.
DROP Balance4
Fiscal Year 2014 2015 2016
DROP Balance $27,110,677 $47,152,159 $55,284,178
Fiduciary Net Position (FNP) $178,839,832 $174,037,587 $186,556,007
DROP Balance as % of FNP 15.16% 27.09% 29.63%
Irving Fire amended its plan design in 2012 by ending the ability for members to participate in the
Forward DROP. However, because of the way the Retro DROP is designed, crediting interest on monthly
benefits and member contributions for up to nine years in the past, this only serves to hide the actual
DROP balance until after members have retired. As demonstrated in the table above, the Fund’s DROP
balance has more than doubled since 2014. Even with its ballooning DROP balance, Irving Fire has yet to
make any significant changes to lower the cost of its DROP.
While it makes economic sense for members to continue to participate in the DROP as it currently exists,
any attempt to modify future interest accruals may change this calculation, potentially causing the Fund
4 The table does not include the 2017 DROP balance since the Fund has yet to submit its 2017 Annual Financial Report which would provide this information.

Intensive Actuarial Review: Irving Firemen's Relief & Retirement Fund
6
significant issues. Currently, roughly 3% of the Fund’s net assets are in short-term investments, leaving
the Fund at risk of needing to sell off assets, potentially with less than ideal market timing, if a larger
than expected number of DROP members decide to withdraw their funds.
Conclusions/Recommendations
The Fund’s board should consider performing an in-depth asset-liability study to better understand the
potential risks associated with its existing asset mix and the liabilities they support. This should include
scenario testing large DROP withdrawals coupled with potential adverse investment experience. In
addition, the board should seriously consider the risk a guaranteed rate of return places on all the
Fund’s stakeholders while considering the impact changes could have on DROP participant behavior.
Governance Risk
The expansion of Irving Fire’s DROP over time, particularly the continuation of the guaranteed 6.25%
return in more recent years as interest rates plummeted, provides some insight into risks associated
with the Fund’s decision-making processes. The Fund did not have the benefit of written funding or
benefit policies to guide its consideration of DROP enhancements over time and may have benefitted
from more formal involvement of the City.
Background
Governance is essentially decision-making, and decision-making for public pension plans must balance
the competing interests of plans and their sponsors and should feature collaboration between the two.
However, even plans with very engaged boards and sponsors can be susceptible to increasing benefits
to unsustainable levels in good times or failing to lower them when necessary in bad times.
Unwillingness to reduce benefits prospectively when necessary to address funding challenges can be an
obstacle to getting things back on track. In the case of Irving Fire, while the members elected to end the
Forward DROP as of January 2012, the changes to the DROP provision, as discussed below, have caused
the Fund’s DROP balance to increase to a degree that makes the continuation of the Fund’s 9-year Retro
DROP with 6.25% guaranteed annual interest likely untenable in the long term.
Furthermore, in certain situations even actuarial assumptions are at risk of being susceptible to this type
of imbalance in decision-making. When plans choose to tie a benefit to an assumption, making the
already difficult choice of changing those assumptions becomes even more complicated. Irving Fire had
maintained a return assumption of 8.25% even after experiencing nearly two decades of its long-term
average returns not meeting that goal. Studies show that instead of lowering the return assumption,
public plans have taken on more risk (even if the asset allocation remains relatively constant) in hopes of
achieving higher returns.5 The Fund’s current asset allocation is shown below.
5 https://www.pacificresearch.org/wp-content/uploads/2017/06/2017-02-01-Risk_Taking_Appropriateness.pdf

Intensive Actuarial Review: Irving Firemen's Relief & Retirement Fund
7
Asset Allocation
Asset Class Equities Fixed Income Alternatives Real Estate Other
Current Allocation 54.30% 19.24% 19.34% 3.41% 3.71%
Target Allocation 59.00% 11.00% 18.50% 11.50% 0.00%
Governance Risk Case Study: Irving Fire’s DROP
Irving Fire made a series benefit increases in the late 1990s, primarily pertaining to its DROP. Between
1997 and 2000 members elected to increase the modest, interest-free, 2-year Retro DROP to four years
with an interest rate of 2% less than the assumed interest rate used in actuarial valuations. As
mentioned earlier, this has been equal to a guaranteed 6.25% annual return on each DROP participant’s
DROP account balance every year since. Around the same time, members also added a 5-year Forward
DROP with the same credited interest rate. Up until this point, the plan remained reasonably well-
funded with a funded ratio hovering just under 80% and an amortization period in the 20s.
In 2000, members again elected to increase the maximum period of the Retro DROP this time from four
to nine years and increased the Forward DROP length to nine years as well. At the time, Irving Fire had
experienced four out of five previous years of greater than 9% rate of return on its investments, so the
6.25% annual interest rate on DROP balances was looked at as a net positive. In the following 16 years,
however, the Fund reported negative returns in five years and has not reported a 10-year return on
investments that meets or exceeds its assumed interest rate. Although the Fund has lowered its
investment return assumption in its 2017 valuation, it has yet to take any significant measures to lower
future interest accruals on the DROP accounts since the new DROP balance interest rate of 5.50% does
not affect anyone currently eligible for the DROP. As mentioned before, due to the length of the Retro
DROP, it will take several years before the Fund is able to begin crediting new DROP accounts at the
lower interest rate. Furthermore, the new DROP interest rate is only slightly less than the Fund’s current
Funded ratio ≈ 80%, amortization period < 30 years
Plan’s avg return over 10-yr period
ending 12/31/2011 ≈ 4.7%
Funded ratio ≈ 67%, amortization period =
infinite
1995 1999 2000 2001 2012 Retro DROP provision added to the Fund, 2-year max with no interest
Forward DROP option added, 5-year max; Retro DROP increased to 4-year max; DROP interest added = 2% less than assumed interest rate
Forward and Retro DROP maximum length increased to 9 years
No DROP adjustments during this timeframe.
Forward DROP closed, Retro DROP to remain at 9 years max with guaranteed annual interest of 6.25%

Intensive Actuarial Review: Irving Firemen's Relief & Retirement Fund
8
10-year return on investment of 5.88%. Failing to address the DROP account’s significant and growing
risks points to a lack of proactive decision-making by key stakeholders.
Funding Soundness Restoration Plan
State law recognizes the potential risks of underfunding and a lack of engagement by some key
stakeholders and imposes cooperation between the system and sponsoring governmental entity by
requiring retirement systems having trouble meeting their long-term obligations work with their
sponsors to develop a restoration plan for addressing those issues.6 This framework helps ensure that
both the system and its sponsoring employer are involved in retirement system reform decisions, but it
comes at a point when actuarial health is already threatened. Irving Fire was required to submit an FSRP
to the PRB in 2016 because the actuarial valuations prepared as of January 1, 2012 and January 1, 2014
reported amortization periods greater than 40 years. The FSRP was developed based on the following:
an increase in the number of active members by recognizing 42 new firefighters hired during 2016 and
an increase of the City’s contribution rate from 15% of payroll to 16.75%. These changes helped lower
the Fund’s amortization period to 33 years as of December 31, 2015; however, since that FSRP was
adopted, the plan’s December 31, 2017 actuarial valuation reported an infinite amortization period.
Irving Fire is again required to submit a revised FSRP by April 2019 with additional changes to bring the
Fund back in compliance with state law.
Conclusions/Recommendations
It is imperative to the long-term health of the Fund that all stakeholders are involved in plan decisions in
good times as well as bad. One step to help address these issues is for the plan and the City to develop
written funding, benefit, and investment policies which are linked to provide a formal risk-/cost-sharing
arrangement. Policies can be adopted that provide a framework for how benefit and contribution levels
may be modified under different conditions. An advantage of such policies is that changes to plan
benefits and costs are known and understood by all parties in advance, rather than negotiated under
difficult circumstances.
For example, a benefit policy can outline the primary objectives the employer wishes to achieve, which
can be as detailed as a specified replacement ratio, or as general as offering competitive benefits at a
reasonable cost, as well as identifying policies and procedures designed to determine if the objectives
are being met and how they can be reviewed at reasonable intervals. A benefit policy can also outline
potential benefit enhancements or reductions based on the funding goals as outlined in the funding
policy. The funding policy might incorporate objectives associated with benefit security, contribution
stability and intergenerational equity and outline how those objectives will be met through contribution
changes, as well as referencing potential changes outlined in the benefit policy. The coordinated policies
might limit future benefit enhancements, cost of living adjustments, and/or contribution rate reductions
such that they can only be considered or made if the plan's funded ratio remains greater than a chosen
6 Texas Government Code 802.2015 and 802.2016 require public retirement systems whose amortization period exceeds 40 years for 2 or 3 consecutive actuarial valuations to develop, with their sponsor, a funding soundness restoration plan designed to bring their amortization period within 40 years over 10 or fewer years.

Intensive Actuarial Review: Irving Firemen's Relief & Retirement Fund
9
threshold. In addition, if the funded ratio falls below a certain threshold, the stakeholders may be
required to come back to the table to make necessary contribution and benefit adjustments.
In addition to helping maintain a sound plan funding level, putting such trigger mechanisms into place
can help reduce uncertainty for stakeholders who would know, in advance, how adverse experience will
be managed. If Irving Fire together with the City had adopted such a forward-looking policy in the past,
its DROP may not have grown to represent the level of risk for the Fund that it does today.
Funding Risk
Irving Fire’s recent investment experience, with actual returns far below the assumed rate of return,
coupled with the Fund’s fixed rate funding structure which does not adjust to cover those actuarial
losses presents serious funding risks that must be mitigated for the Fund to meet its long-term
obligations.
Background
Irving Fire’s significant growth in unfunded liability (UAAL), which increased from just over $32 million at
the beginning of 2008 to more than $82 million at the end of 2017, can be primarily attributed to actual
returns consistently lower than the assumed investment return, contributions consistently lower than
the annual benefit accrual plus growth of existing unfunded benefits, and partially to the recent changes
in the actuarial assumptions in the Fund’s latest actuarial valuation. The Fund has made significant
increases in both the member and city contribution rates over the last few years. However, with current
amortization period at infinite, it is likely that the Fund will need to make even more increases to
contribution rates and/or benefit reductions to bring down the amortization period to an acceptable
level.
$27,485,655
$16,756,360
$(5,588,182)
$11,279,461
-20.00%
-10.00%
0.00%
10.00%
20.00%
30.00%
40.00%
50.00%
60.00%
70.00%
Investment returnlower than assumed
Contributions lowerthan normal cost +interest on UAAL
Liability experienceworse (better) than
assumed
Changes toAssumptions and
Methods
Pe
rce
nt
of
Tota
l Ch
ange
Sources of Change in UAAL 2008 - 2017
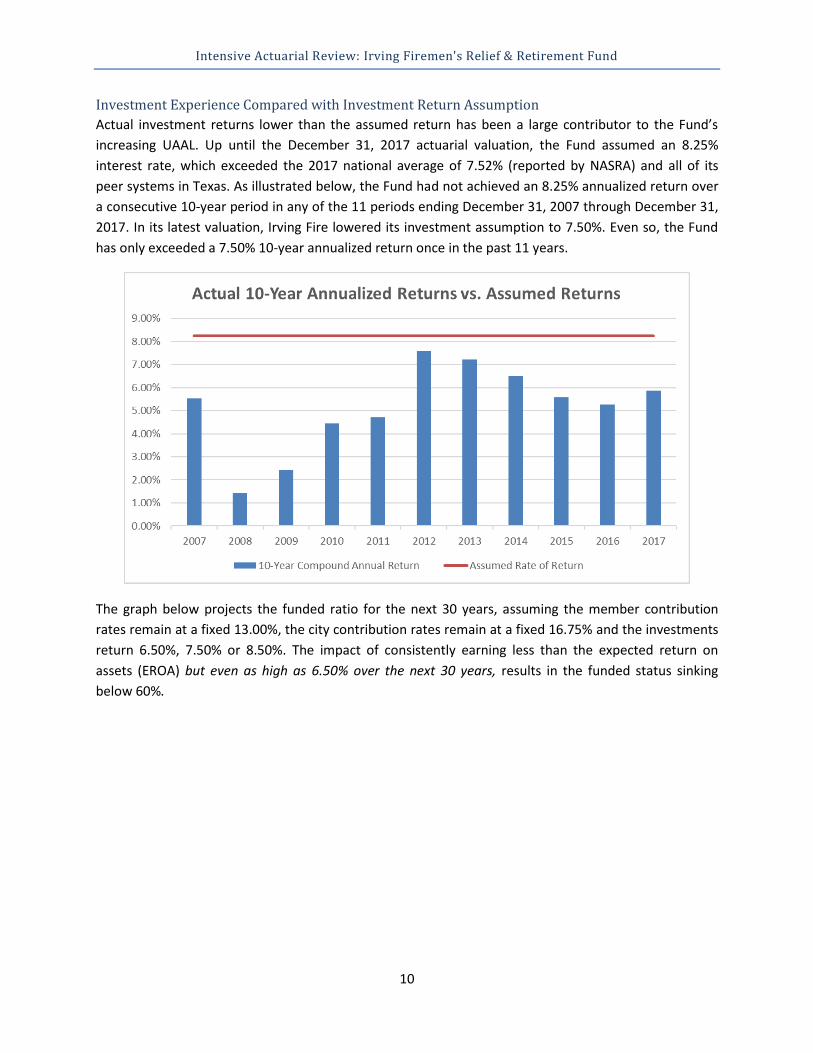
Intensive Actuarial Review: Irving Firemen's Relief & Retirement Fund
10
Investment Experience Compared with Investment Return Assumption
Actual investment returns lower than the assumed return has been a large contributor to the Fund’s
increasing UAAL. Up until the December 31, 2017 actuarial valuation, the Fund assumed an 8.25%
interest rate, which exceeded the 2017 national average of 7.52% (reported by NASRA) and all of its
peer systems in Texas. As illustrated below, the Fund had not achieved an 8.25% annualized return over
a consecutive 10-year period in any of the 11 periods ending December 31, 2007 through December 31,
2017. In its latest valuation, Irving Fire lowered its investment assumption to 7.50%. Even so, the Fund
has only exceeded a 7.50% 10-year annualized return once in the past 11 years.
The graph below projects the funded ratio for the next 30 years, assuming the member contribution
rates remain at a fixed 13.00%, the city contribution rates remain at a fixed 16.75% and the investments
return 6.50%, 7.50% or 8.50%. The impact of consistently earning less than the expected return on
assets (EROA) but even as high as 6.50% over the next 30 years, results in the funded status sinking
below 60%.

Intensive Actuarial Review: Irving Firemen's Relief & Retirement Fund
11
7
Contribution Insufficiency Risk
For most of Irving Fire’s recent history, the City’s contribution rate was tied to the rate it contributed for
its police and other municipal employees who are members of the Texas Municipal Retirement System
(TMRS). The problem with this contribution arrangement is that TMRS operates a completely different
and much larger trust fund whose members receive different benefits than Irving Fire’s members. Due
to this arrangement, the Fund was unable to successfully weather negative plan experience throughout
the past decade, ultimately leading it to report amortization periods of infinite and 97 years in its 2012
and 2014 valuations, respectively. After adoption of its 2014 valuation, the City’s contribution into the
Fund was changed to a higher, fixed-rate moving forward.
Several issues exist with fixed-rate contributions that may result in long-term problems:
1) Contributions to percent-of-pay plans are inherently back-loaded because the expected
contributions to a percent-of-pay plan grow on a nominal basis at the assumed rate of total
payroll growth.
2) Fixed contributions (whether as a rate of pay or a specific dollar amount) provide budgetary
stability for the employer in the short term, but do not include any inherent mechanisms for
reacting to changes in a plan’s financial condition.
Despite the recent employee contribution rate increase to 13.00% in January 2018, the plan is only
receiving approximately 76% of the most recently reported 30-year open amortization ADC.
7 All current and projected assets and liabilities reflect the actuarial accrued liabilities, actuarial value of assets, plan provisions, and actuarial assumptions and methods as reported in the 12/31/2017 Actuarial Valuation prepared by John M. Crider, Jr. Consulting Actuary.

Intensive Actuarial Review: Irving Firemen's Relief & Retirement Fund
12
Expected Contribution Levels vs. Actuarially Determined Contribution
Fiscal Year 2000 2002 2004 2006 2008 2010 2012 2014 2016 2018
Employee Contribution
10.00% 10.00% 10.00% 10.00% 10.00% 10.00% 12.00% 12.00% 12.00% 13.00%
Employer Contribution
12.00% 13.02% 13.53% 14.42% 15.04% 15.50% 12.00% 15.65% 16.75% 16.75%
Employer 30-Year ADC
12.00% 13.02% 14.87% 15.33% 15.93% 19.04% 23.27% 19.88% 19.01% 22.02%
% of ADC funded 100.00% 100.00% 90.99% 94.06% 94.41% 81.41% 51.57% 78.72% 88.11% 76.07%
Covered Payroll (in millions)
$14.06 $17.62 $18.17 $18.38 $19.51 $22.90 $20.64 $25.48 $27.07 $32.62
Contribution Shortfall (in millions)
- - $0.24 $0.17 $0.17 $0.81 $2.33 $1.01 $0.61 $1.72
Conclusions/Recommendations
The investment return assumption is the sole assumption that allocates expected costs between
contributions and investment income and the assumed payroll growth rate drives the determination of
whether the existing contribution rate is sufficient to meet those needs. Funding risk arises when these
assumptions understate the contributions needed in the short and medium term, forcing future
members and tax-payers to bear the burden of increased contributions and/or lower benefits.
Pre-funding a defined benefit plan, i.e. setting aside assets now for benefits that will be paid in the
future, is necessary to help balance the three primary policy goals of benefit security, equity between
generations of taxpayers and employees, and a stable contribution from year to year. Consistently
underfunding a plan places the benefits of both retirees and active members at significant risk and/or
places the burden of paying for services already rendered on future generations of taxpayers and
employees through the reduction of future benefits or an increase in contributions.
In the absence of a formal, written funding and risk-sharing policy, the result is a de facto risk-sharing
arrangement that is simply a reaction to events, often well after the plan finds itself with financial
difficulties. Plans and their sponsors can take many actions to ensure financial stability and mitigate the
risks that lead to underfunding. These steps include ensuring contributions are adequate to fully fund
the plan over a reasonable period; developing formal policies to guide decision-makers under different
economic conditions; reviewing actuarial assumptions against actual experience and making necessary
changes; and monitoring investment performance and evaluating asset allocation decisions on a
forward-looking basis.
Adequate Funding. To address these concerns, a strong funding policy that requires payment of an ADC
is encouraged. Numerous actuarial methods can be utilized to help mitigate contribution volatility,
including directly smoothing contribution rates or adding “guardrails” that require the stakeholders to
come back to the table if the contribution rate falls outside a specified range. If funding according to an
ADC is not adopted, a funding policy that fully funds the plan over a finite period, such as 30 years, is
recommended.

Intensive Actuarial Review: Irving Firemen's Relief & Retirement Fund
13
Investment Performance. Whatever the investment return assumption used, investment returns should
be closely monitored, and investment managers’ performance should be assessed regularly and
compared to appropriate asset class benchmarks. Benchmarks should be reviewed to see if they have
been met or exceeded and should be viewed considering the risk taken to achieve those returns. Best
practices also include revisiting investment manager selection periodically, with boards of trustees
evaluating managers’ performance, fees, and whether their current managers are providing the highest
possible value at the lowest possible cost. The asset allocation should also be assessed from a risk
perspective to provide insight into how the fund would weather a market correction.
Actuarial Assumptions. Public pension plans must monitor actuarial assumptions continually through
their actuarial valuations and make appropriate adjustments to mitigate bias in the assumptions that
result in consistent actuarial gains or losses. Actuarial gains and losses occur when the plan’s actual
experience does not match expected experience. Over time, without required changes, pension funds
such as Irving Fire whose assumptions consistently diverge from actual experience in the same direction
(i.e. consistently seeing actuarial gains or consistently seeing actuarial losses) can exacerbate the issue
of intergenerational inequity, causing one group of members and taxpayers to over- or under-pay. While
the board of trustees has lowered several key assumptions in the latest valuation, they should continue
to work with their actuaries and other consultants to ensure assumptions are neither too aggressive nor
too conservative, while striving to maintain (or achieve) sound fiscal health to secure existing accrued
benefits. PRB’s Pension Funding Guidelines recommend systems to monitor, review, and report the
impact of actual plan experience on actuarial assumptions at least once every five years.

Intensive Actuarial Review: Irving Firemen's Relief & Retirement Fund
14
Appendix

Intensive Actuarial Review: Irving Firemen's Relief & Retirement Fund
15
Key Metrics8
Metric Amortization period (33.0 years)
What it measures
Approximately how long it would take to fully fund the unfunded actuarial accrued liability (UAAL) based on the current funding policy.
Why it is important
Given the Plan’s current assumptions, an amortization period greater than 17 years indicates that contributions to the Plan in the coming year are less than the interest accumulated for that same period, and therefore the total UAAL is expected to grow over the near term. In addition, for a plan that contributes on a fixed-rate basis such as Irving Fire, the higher the amortization period, the more sensitive it is to small changes in the UAAL.
Peer Comparison
Irving Fire’s amortization period is in the highest 1/3 of all Texas retirement plans and is greater than the maximum PRB pension funding guideline of 30 years.
Metric Funded ratio (74.92%)
What it measures
The percent of a fund’s actuarially accrued liabilities covered by its actuarial value of assets.
Why it is important
The lower the funded ratio, the fewer assets a fund has to pay its current and future benefit payments.
Peer Comparison
Irving Fire’s 74.92% funded ratio is the second highest in its peer group of TLFFRA plans with similar asset size and in the top 40% of plans in the state.
Metric UAAL as a percent of payroll (228.54%)
What it measures
The size of a plan’s unfunded liability compared to the annual payroll of the active members.
Why it is important
Provides a way to compare plans of various sizes and expresses the outstanding “pension debt” relative to current personnel costs.
Peer Comparison
The Plan’s UAAL as a percent of payroll is the second lowest among its peer group and in the bottom 40% of plans in the state.
8 The key metrics listed in this section are from the Fund’s 2015 Actuarial Valuation and 2016 Annual Financial Report available to the PRB at the time it was selected for review in April 2018.

Intensive Actuarial Review: Irving Firemen's Relief & Retirement Fund
16
Metric Assumed rate of return (8.25%)
What it measures
The estimated annual rate of return on the Fund’s assets.
Why it is important
If actual future returns are lower than the assumed rate of return, future contributions will need to increase significantly, especially for a poorly funded plan. Irving Fire’s assumed rate of return is 8.25%, while its actual ten-year investment rate of return for the period ending December 31, 2016 was only 5.28%.
Peer comparison
Irving Fire has the highest assumed rate of return in the state.
Metric
Payroll growth rate (4.25%)
What it measures
The estimated annual growth in the total payroll of active members contributing into the Fund.
Why it is important
Contributions are calculated as a percent of active members’ pay and are back-loaded based on the expected growth in total payroll. If payroll does not increase at this rate, actual contributions will not meet those expected in the Fund’s actuarial valuations. Persistent contributions below expected levels could have serious consequences on the Fund’s long-term solvency.
Peer comparison
The Fund’s payroll growth rate of 4.25% is the most aggressive in its peer group of TLFFRA plans with similar asset size and one of the highest in the state.
Metric Actual contributions as a percent of actuarially determined contributions (82.33%)
What it measures
Whether the current employer contributions have met a theoretical minimum threshold.9
Why it is important
The employer’s portion of the contribution is less than 85% of the amount needed to fund the plan on a rolling 30-year amortization period. The PRB’s 2014 Study of the Financial Health of Texas Public Retirement Systems found that plans that have consistently received adequate funding are in a better position to meet their long-term obligations.
Peer comparison
This is the second largest shortfall percentage in its peer group.
9 The theoretical minimum threshold, or actuarially determined contribution (ADC), is a target or recommended contribution “to the plan as determined by the actuary using a contribution allocation procedure,” as defined in Actuarial Standards of Practice No 4. If contributions to the plan are made as a fixed rate based on statutory or contractual requirements, the ADC for this purpose is the contribution needed to fund the benefits accrued in the current year and maintain an amortization period that does not exceed 30 years, as required to be reported under Texas Government Code §802.101(a).

Intensive Actuarial Review: Irving Firemen's Relief & Retirement Fund
17
Metric DROP balance as a percent of fiduciary net position (29.63%)
What it measures
The amount of the Fund’s assets that are designated for lump-sum payouts to retired members as a percent of its total assets.
Why it is important
Viewing this metric as a percent of total net assets (or fiduciary net position (FNP)) shows how large a decrease in the Fund’s assets could be if most or all DROP participants decided to take their balances out in a short amount of time.
Peer comparison
Irving Fire’s DROP balance as a percent of FNP is the highest among its peer group and third highest in the state.
Metric Non-investment cash flow as a percent of fiduciary net position (-1.24%)
What it measures
Non-investment cash flow shows how much the plan is receiving through contributions in relation to its outflows: benefit payments, withdrawals and expenses.
Why it is important
Viewing this metric as a percent of total net assets (or fiduciary net position (FNP)), in conjunction with the funded ratio and recognition of the relative maturity of the plan, provides information about the stability of a plan’s funding arrangement.
Peer Comparison
Irving Fire’s non-investment cash flow as a percent of FNP is the second highest in its peer group and in the highest 1/3 of all plans in the state.
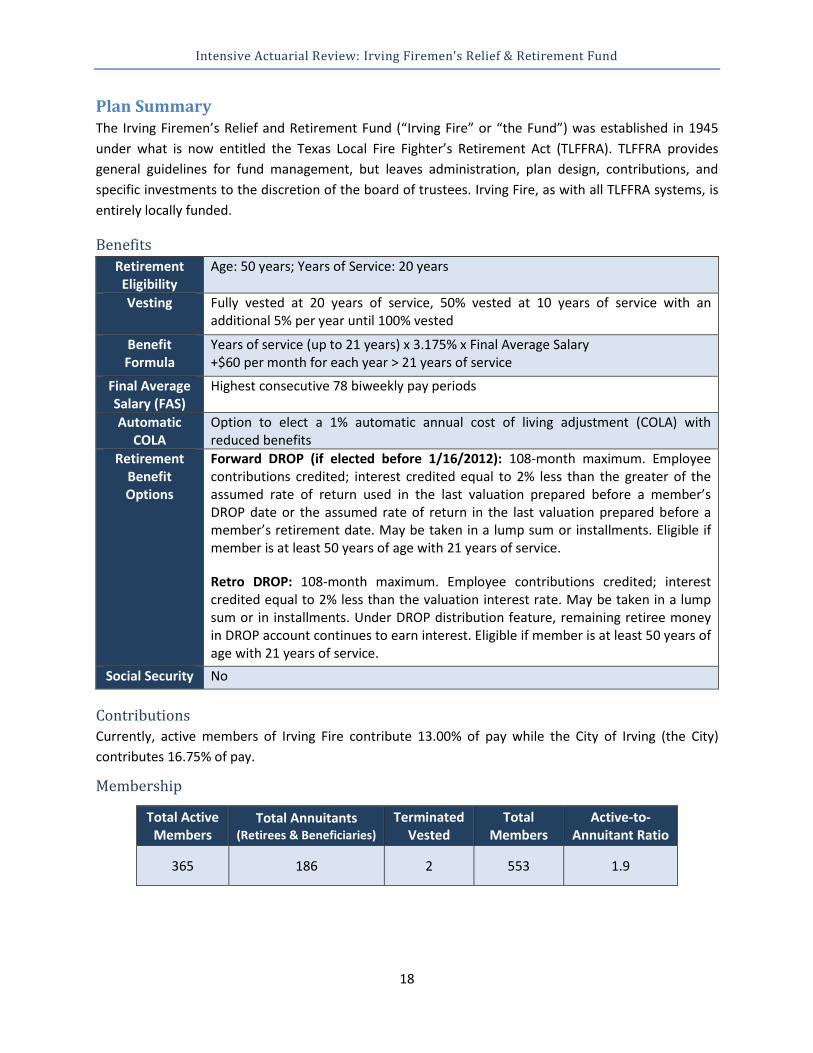
Intensive Actuarial Review: Irving Firemen's Relief & Retirement Fund
18
Plan Summary The Irving Firemen’s Relief and Retirement Fund (“Irving Fire” or “the Fund”) was established in 1945
under what is now entitled the Texas Local Fire Fighter’s Retirement Act (TLFFRA). TLFFRA provides
general guidelines for fund management, but leaves administration, plan design, contributions, and
specific investments to the discretion of the board of trustees. Irving Fire, as with all TLFFRA systems, is
entirely locally funded.
Benefits
Retirement Eligibility
Age: 50 years; Years of Service: 20 years
Vesting Fully vested at 20 years of service, 50% vested at 10 years of service with an additional 5% per year until 100% vested
Benefit Formula
Years of service (up to 21 years) x 3.175% x Final Average Salary +$60 per month for each year > 21 years of service
Final Average Salary (FAS)
Highest consecutive 78 biweekly pay periods
Automatic COLA
Option to elect a 1% automatic annual cost of living adjustment (COLA) with reduced benefits
Retirement Benefit Options
Forward DROP (if elected before 1/16/2012): 108-month maximum. Employee contributions credited; interest credited equal to 2% less than the greater of the assumed rate of return used in the last valuation prepared before a member’s DROP date or the assumed rate of return in the last valuation prepared before a member’s retirement date. May be taken in a lump sum or installments. Eligible if member is at least 50 years of age with 21 years of service.
Retro DROP: 108-month maximum. Employee contributions credited; interest credited equal to 2% less than the valuation interest rate. May be taken in a lump sum or in installments. Under DROP distribution feature, remaining retiree money in DROP account continues to earn interest. Eligible if member is at least 50 years of age with 21 years of service.
Social Security No
Contributions
Currently, active members of Irving Fire contribute 13.00% of pay while the City of Irving (the City)
contributes 16.75% of pay.
Membership
Total Active Members
Total Annuitants (Retirees & Beneficiaries)
Terminated Vested
Total Members
Active-to- Annuitant Ratio
365 186 2 553 1.9

Intensive Actuarial Review: Irving Firemen's Relief & Retirement Fund
19
TLFFRA Board Structure
Active Members 3 - Members of the retirement system; elected by fund members. Three-year terms.
Sponsor Government 1 - Mayor or designated representative, or the political subdivision's Chief Operating Officer or designated representative. 1 - Chief Financial Officer of the political subdivision, or designated representative. Terms correspond to term of office.
Taxpayer, Not Affiliated With Fund/Sponsor Govt.
2 - Residents of the State of Texas, must not be officers/employees of the political subdivision; elected by other Board of Trustee members. Two-year terms.
Contribution and Benefit Decision-Making
TLFFRA authorizes members of the retirement systems to determine their contribution rates by voting.
The statute requires to make contributions at the same rate paid by employees or 12%, whichever is
smaller. TLFFRA also allows a city to contribute at a higher rate than employees do through a change in
city ordinance.
TLFFRA gives the board the power to make decisions to modify the benefits (increases and reductions).
However, a proposed addition or change must be approved by the actuary and a majority of
participating plan members. Benefit changes cannot deprive a member, retiree or beneficiary of the
right to receive vested accrued benefits.
Historical Trends
To conduct an intensive review of risks associated with the long-term funding of a pension Fund, it is
important to analyze trends in multiple metrics. A Fund with an asset level lower than its accrued
liability has insufficient funds to cover benefits. A Fund can experience an increase in unfunded liability
due to various factors, including insufficient investment returns, inadequate contributions and
inaccurate or overly aggressive assumptions. Hence, a single metric cannot effectively capture the
different drivers contributing to the increase of a Fund’s unfunded pension obligation. This section
analyzes historical trends in various metrics identified by the PRB and makes comparisons to understand
the sources of growth in unfunded liability for Irving Fire.
Irving Fire’s funded status has been steadily declining since 2000. Numerous factors have contributed to
this deterioration, including inadequate contributions, investment returns lower than the chosen
assumption, and increased benefit payments due to the expansion of interest-accruing DROP accounts.
The following sections discuss these and other factors in detail.

Intensive Actuarial Review: Irving Firemen's Relief & Retirement Fund
20
Assets and Liabilities
Funding Trends
Funded Ratio, Assets, Liabilities and Year over Year Growth
Fiscal Year* 2000 2002 2004 2006 2008 2010 2012 2014 2016 2018
Funded Ratio 85.75% 78.43% 71.19% 73.85% 78.31% 70.98% 67.40% 73.10% 74.92% 71.61%
Am Period (years) 29.1 30.9 65.0 52.4 36.2 65.9 Infinite 63.4 33.0 Infinite
UAAL (in millions) $11.06 $20.06 $30.84 $32.73 $32.33 $51.13 $65.25 $57.50 $61.87 $82.26
AVA (in millions) $66.56 $72.94 $76.21 $92.45 $116.69 $125.07 $134.89 $156.22 $184.78 $207.49
AVA Growth (YoY) - 4.69% 2.21% 10.14% 12.35% 3.53% 3.85% 7.62% 8.76% 5.97%
AAL (in millions) $77.63 $93.01 $107.04 $125.18 $149.02 $176.20 $200.14 $213.73 $246.66 $289.75
AAL Growth (YoY) - 9.46% 7.28% 8.14% 9.11% 8.74% 6.58% 3.34% 7.43% 8.39%
* The dates of the valuations referenced in this table are either 1/1 of the year stated or 12/31 of the prior year.
Irving Fire’s actuarial accrued liability (AAL) increased by nearly 275% between 2000 and 2018. The
Fund’s actuarial value of assets (AVA) increased by just over than 210% over the same period. The Fund
was nearly 86% funded in 2000 and fell to below 72% in 2018.
Investment Assumption and Returns
The 10-year net return on investments in 2017 was 5.88%, which was more than 150 basis points below
its new assumed interest rate of 7.50%. Most retirement funds have been experiencing a difficult 10-
year period since the 2008-2009 market downturn, but the Fund’s aggressive 8.25% rate of return
assumption for most of this period (the highest in the state) means that Irving Fire should have
outperformed most other funds. However, Irving Fire’s 10-year return is only the 30th highest of Texas’
93 defined benefit pension plans.

Intensive Actuarial Review: Irving Firemen's Relief & Retirement Fund
21
Cash flow
Irving Fire has one of the highest non-investment cash flows among its peer group. However, in 2016
the Fund’s non-investment cash flow was the lowest in its recent history and has been trending
negatively since 2000. Total contributions have grown on average by 4.95% annually since 2000 but are
being outpaced by the average growth in yearly benefit disbursements of 9.44%. Total expenses are also
the highest in their peer group as a percent of the Fund’s total assets (0.81%)
A negative non-investment cash flow is not abnormal for mature defined benefit pension Funds.
However, the Fund’s cash flow has been negative since 2010 and with potential large benefit payouts on
the horizon due to the Fund’s large DROP balance, it is likely to decrease further in the near future. A
low cash flow percentage is likely to be a drag on potential investment returns because a Fund must
either invest in a higher proportion of income-producing investments, which traditionally provide lower
returns, or must liquidate existing assets to pay out current benefits and/or expenses.
10
Forward and Retroactive DROP
Irving Fire currently has a 9-year Retroactive Deferred Retirement Option Program (Retro DROP)
provision and before 2012 offered a 9-year Forward DROP provision. Both of these provisions allow
members to end their years of service before their actual retirement date and receive a lump sum
payment equal to the total retirement benefits the member would have received plus the amount of
contributions the member made into the Fund over that time. The Retro DROP allows members to make
the election of this provision at their retirement date and apply the program retroactively rather than
having to make the decision years before retirement as the Forward DROP does.
10 The table does not include 2017 cash flow data since the Fund has yet to submit its 2017 Annual Financial Report which would provide this information.

Intensive Actuarial Review: Irving Firemen's Relief & Retirement Fund
22
Both of these DROP provisions give members the added benefit of accruing annual compounded
interest on their DROP balance at a rate of 2% less than the Fund’s actuarially assumed investment
return rate during the time in the DROP and afterwards. Members may leave most of their balance in
the fund, accruing interest, as DROP disbursements are only subject to a minimum threshold set by the
Internal Revenue Service.
Based on the data available to the PRB, DROP balance reported as of 12/31/2016 was $55,284,178
which was more than a $28 million increase from 2014’s balance of $27,110,667. The 2016 DROP
balance is 29.63% of the Fund’s Total Net Assets. The PRB has yet to receive the Fund’s 12/31/2017
Annual Financial Report that would include its 2017 DROP balance.
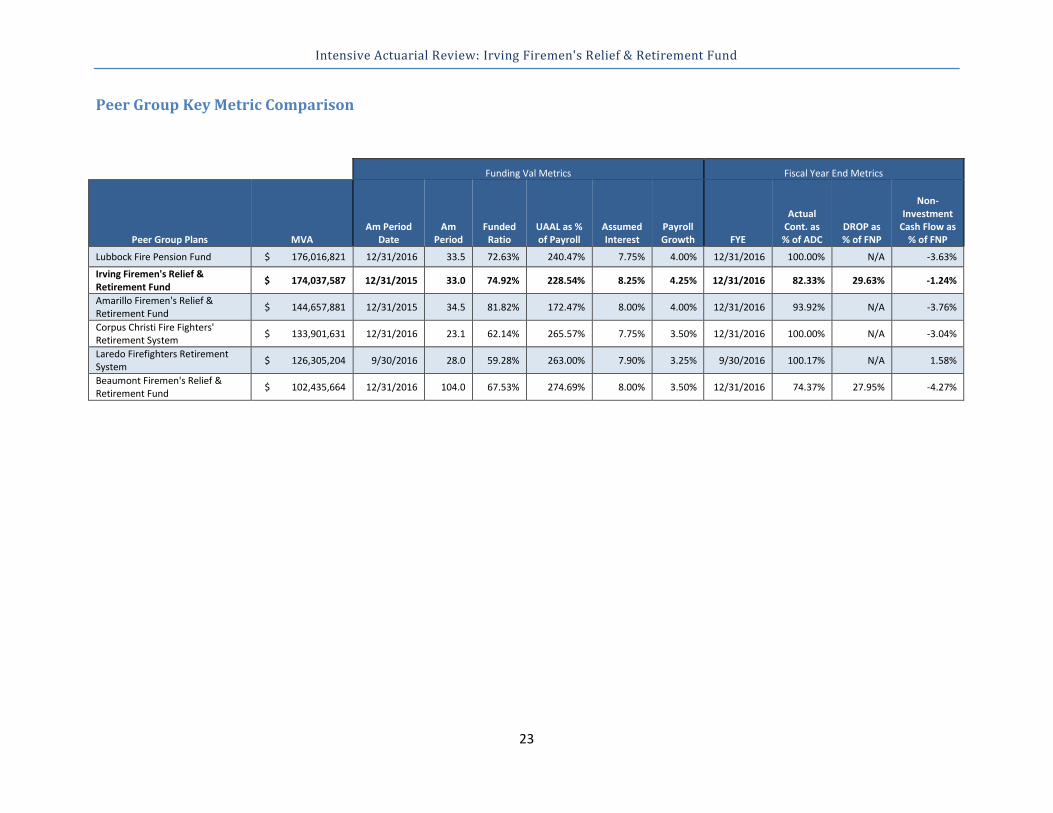
Intensive Actuarial Review: Irving Firemen's Relief & Retirement Fund
23
Peer Group Key Metric Comparison
Funding Val Metrics Fiscal Year End Metrics
Peer Group Plans MVA Am Period
Date Am
Period Funded
Ratio UAAL as % of Payroll
Assumed Interest
Payroll Growth FYE
Actual Cont. as % of ADC
DROP as % of FNP
Non-Investment
Cash Flow as % of FNP
Lubbock Fire Pension Fund $ 176,016,821 12/31/2016 33.5 72.63% 240.47% 7.75% 4.00% 12/31/2016 100.00% N/A -3.63%
Irving Firemen's Relief & Retirement Fund
$ 174,037,587 12/31/2015 33.0 74.92% 228.54% 8.25% 4.25% 12/31/2016 82.33% 29.63% -1.24%
Amarillo Firemen's Relief & Retirement Fund
$ 144,657,881 12/31/2015 34.5 81.82% 172.47% 8.00% 4.00% 12/31/2016 93.92% N/A -3.76%
Corpus Christi Fire Fighters' Retirement System
$ 133,901,631 12/31/2016 23.1 62.14% 265.57% 7.75% 3.50% 12/31/2016 100.00% N/A -3.04%
Laredo Firefighters Retirement System
$ 126,305,204 9/30/2016 28.0 59.28% 263.00% 7.90% 3.25% 9/30/2016 100.17% N/A 1.58%
Beaumont Firemen's Relief & Retirement Fund
$ 102,435,664 12/31/2016 104.0 67.53% 274.69% 8.00% 3.50% 12/31/2016 74.37% 27.95% -4.27%

Intensive Actuarial Review: Irving Firemen's Relief & Retirement Fund
24
Peer Group Sponsor Funding Comparison
Peer Group Expense Comparison
Peer Group Plans
10-yr return (Net)
Active/ Annuitants
Average Benefit NPL
Admin Expenses
Investment Expenses Other Expenses
Total Expenses
Exp as % of Assets
Lubbock Fire Pension Fund 4.39% 1.39 $ 54,610 $ 90,715,999 $ 322,882 $ 651,091 $ - $ 973,973 0.55%
Irving Firemen's Relief & Retirement Fund
5.28% 2.00 $ 50,297 $ 76,692,304 $ 76,887 $ 1,391,083 $ 35,044 $ 1,503,014 0.81%
Amarillo Firemen's Relief & Retirement Fund
6.80% 1.26 $ 53,329 $ 37,044,636 $ 80,849 $ 388,013 $ - $ 468,862 0.31%
Corpus Christi Fire Fighters' Retirement System
5.53% 1.35 $ 44,113 $ 91,671,329 $ 257,440 $ 456,800 $ - $ 714,240 0.53%
Laredo Firefighters Retirement System
4.33% 2.24 $ 55,268 $ 93,600,365 $ 209,946 $ 340,343 $ - $ 550,289 0.44%
Beaumont Firemen's Relief & Retirement Fund
3.77% 1.07 $ 41,483 $ 91,716,980 $ 479,503 $ 292,841 $ - $ 772,344 0.75%
Peer Group Plans GF Expend EOY GF Bal UAAL Expected Employer
Contributions ADC 30-yr Shortfall 30-yr SF % of
ADC 30-Y SF % of
GFE
Lubbock Fire Pension Fund $ 162,139,351 $ 35,673,526 $ 73,353,115 $ 6,652,807 $ 6,878,532 $ 225,725 3.28% 0.14%
Irving Firemen's Relief & Retirement Fund
$ 216,852,808 $ 57,666,475 $ 61,873,333 $ 4,534,842 $ 5,146,707 $ 611,865 11.89% 0.28%
Amarillo Firemen's Relief & Retirement Fund
$ 157,909,148 $ 48,079,850 $ 33,128,756 $ 3,759,167 $ 3,884,024 $ 124,857 3.21% 0.08%
Corpus Christi Fire Fighters' Retirement System
$ 218,749,071 $ 41,873,537 $ 85,995,868 $ 6,728,823 $ 6,728,823 $ - 0.00% 0.00%
Laredo Firefighters Retirement System
$ 173,176,192 $ 42,167,732 $ 87,733,185 $ 7,047,691 $ 7,861,156 $ 813,465 10.35% 0.47%
Beaumont Firemen's Relief & Retirement Fund
$ 115,988,300 $ 26,709,699 $ 52,869,076 $ 2,911,034 $ 3,882,020 $ 970,986 25.01% 0.84%

Intensive Actuarial Review: Irving Firemen's Relief & Retirement Fund
25
Comments from Irving Firemen’s Relief and Retirement Fund and the
City of Irving
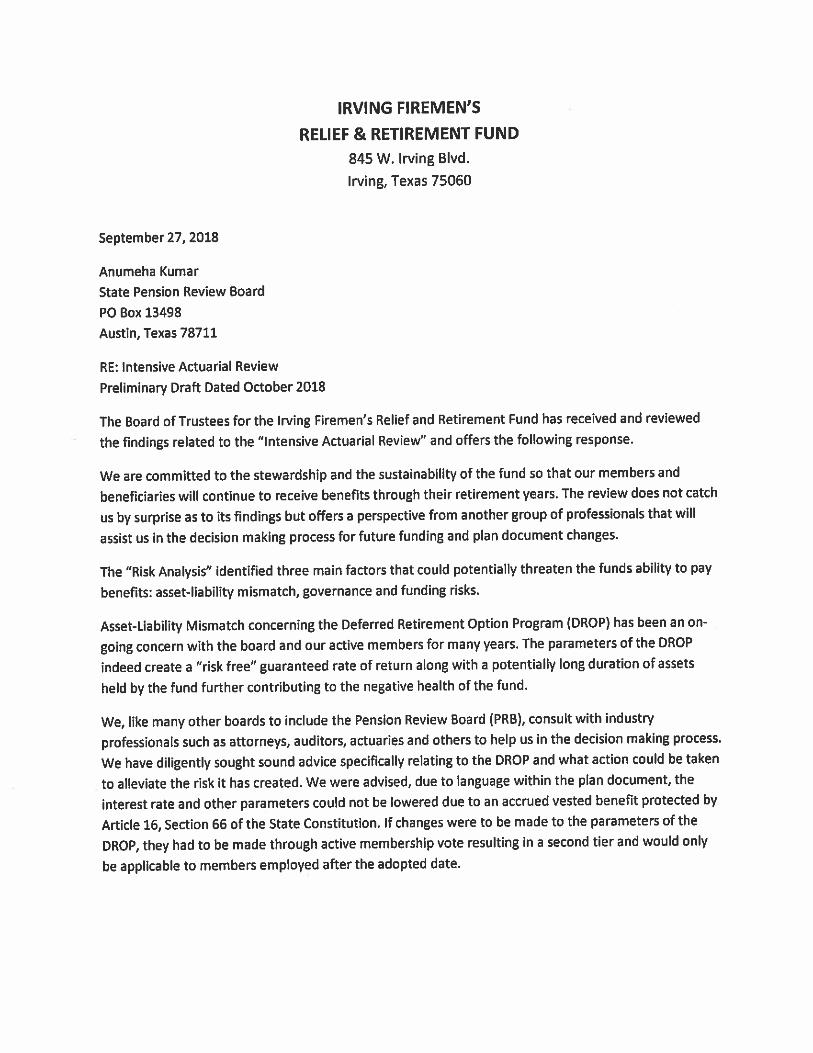
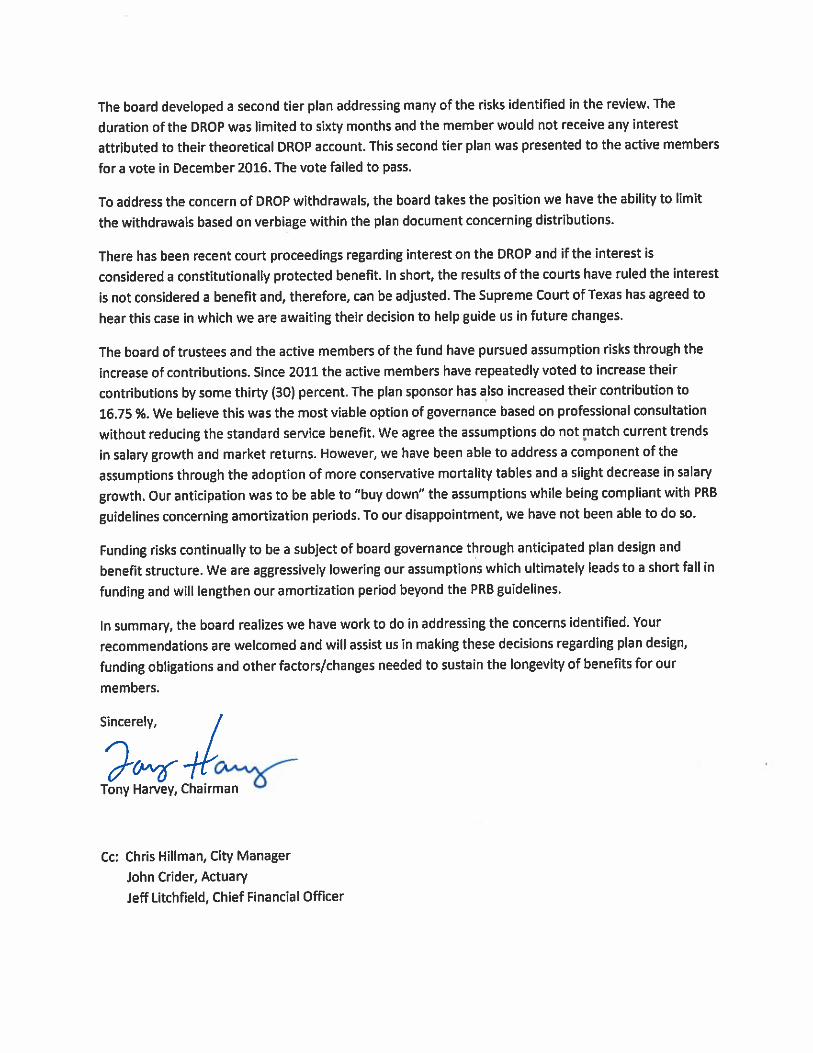
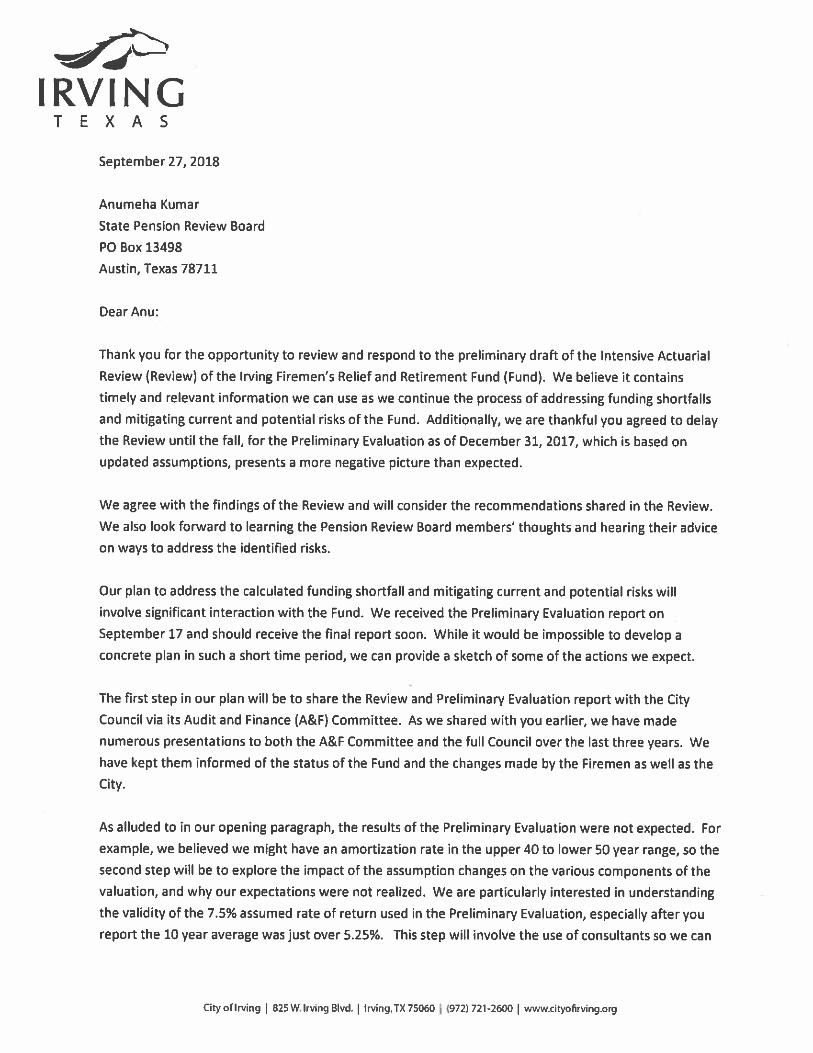


Texas Pension Review Board
2017-2018 Biennial Report
VIII
APPENDIX A8 – PROGRESS UPDATES PROVIDED BY SYSTEMS SINCE
INTENSIVE REVIEW PUBLICATION

Progress Updates Provided by Systems Since Intensive Review Publication
Intensive Review
Date Retirement System Updates
January Greenville Firemen’s Relief and Retirement Fund In October, the Fund informed the PRB that an RFP had been issued
for actuarial services.
January Galveston Employees’ Retirement Plan for Police
At the September 13 PRB Actuarial Committee meeting, both the City and the Plan provided the PRB with preliminary proposals for a funding policy that would include paying an actuarially determined contribution with a closed 30-year amortization period.
April Marshall Firemen’s Relief and Retirement Fund
Retirement eligibility age moved from 50 to 53
10-year vesting eliminated
.75% City contribution increase effective 1/01/2019
City approved that contributions will be made to the fund at the end of the year for vacancies that exist throughout the year effective 12/31/2018.
April Beaumont Firemen’s Relief and Retirement Fund No changes reported to PRB.
October Orange Firemen’s Relief and Retirement Fund
Plan agreed to consult peer pension systems for possible guidelines or examples of governance policies to help develop a governance policy between the Fund and the City.
Plan agreed to request the actuary to explain benefit reduction proposals to the fund members.
Plan adopted a motion to craft a request for proposal (RFP) for investment consultant services.
October Longview Firemen’s Relief and Retirement Fund Removed deployment pay from benefit calculation and contributions.
October Irving Firemen’s Relief and Retirement Fund No changes reported to PRB

Texas Pension Review Board
2017-2018 Biennial Report
IX
APPENDIX B – INTERIM STUDY - ASSET POOLING FOR SMALL
PENSION SYSTEMS
Interim Study:
Asset Pooling for Small Pension Systems
October 2018

Table of Contents Executive Summary ....................................................................................................................................... 1
Background ................................................................................................................................................... 2
I. Potential Benefits of Pooling Pension Assets ............................................................................................. 2
Economies of Scale ................................................................................................................................... 2
Diversification ........................................................................................................................................... 3
II. Research and Analysis ............................................................................................................................... 3
Methodology ............................................................................................................................................. 3
Results ....................................................................................................................................................... 5
III. Possible Asset Pooling Models ................................................................................................................. 6
Investment Management Only ................................................................................................................. 6
Massachusetts ...................................................................................................................................... 6
Alberta and Ontario .............................................................................................................................. 7
Investment Management and Administration ......................................................................................... 7
Texas Hospital Association Master Trust .............................................................................................. 7
Agent Multiple-Employer Plans ................................................................................................................ 7
Potential Impact ........................................................................................................................................ 8
IV. Recommendations ................................................................................................................................... 8
Appendix ....................................................................................................................................................... 9
Data and Methodology ............................................................................................................................. 9
Results ..................................................................................................................................................... 14
Investment Returns ............................................................................................................................. 14
Expenses.............................................................................................................................................. 16
Statistical Analysis ................................................................................................................................... 17
Potential Impact Modeling ..................................................................................................................... 21

1
Executive Summary
Many public retirement systems across the country face ongoing challenges as unfunded liabilities
continue to grow in an overall low interest rate environment. Smaller systems face additional challenges
to meet or exceed their assumed rates of return over extended periods of time. Recognizing this, at its
November 16, 2017 meeting, the PRB directed staff to study the possible benefits for smaller pension
systems of pooling trust funds for investment purposes as part of the agency’s mandate to include
recommendations relating to public retirement systems that the board finds advisable through its Biennial
Report to the Legislature and Governor.
To study the possible benefits of pooling assets, the PRB analyzed investment return and fee data reported
by retirement plans for fiscal years 2007 to 2016. The data analyzed included all Texas actuarially funded
defined benefit plans that reported to the PRB during that period, except for the 4 largest statewide plans.
Staff also identified two primary structures of pooled pension trusts: an Investment Management only
model (IM) and an Investment Management and Administration (IMA) model. Under both models, the
participating systems transfer all or a portion of their assets into the group investment trust, while
maintaining the existing governance structures, including contribution, benefit, actuarial and asset
allocation decision-making.
To objectively analyze the benefits of the IM and IMA structures, the PRB modeled the potential impact
on small plans. Modeling suggested asset pooling could have resulted in an additional 29% increase
($32M) in total assets for small plans between 2007 and 2016.
This study constitutes a first step towards developing potential recommendations in this area. The
evidence suggests smaller pension plans in Texas could benefit in several ways from pooling assets for
investment purposes as well as pooling administrative functions. Further in-depth study of possible
governance structures to provide asset pooling services including associated legal requirements is
necessary and should include engaging small pension plans to provide input and explore viable options.

2
Background
The Pension Review Board (PRB) is mandated to oversee all Texas public retirement systems, both state
and local, in regard to their actuarial soundness and compliance with state law. Its mission is to provide
the state of Texas with the necessary information and recommendations to ensure that its public
retirement systems, whose combined assets total in the multi-billions, are financially sound, benefits are
equitable, the systems are properly managed, tax expenditures for employee benefits are kept to a
minimum while still providing for those employees, and to expand the knowledge and education of
administrators, trustees, and members of Texas public pension funds.
Texas is home to many public-sector pension funds sponsored by various political subdivisions with wide-
ranging asset values. There are currently close to 350 public retirement systems registered with the PRB.
This includes pre-funded defined benefit plans, defined contribution plans, and pay-as-you-go volunteer
firefighter plans. The PRB’s primary focus is overseeing the approximately 100 pre-funded defined benefit
plans covering more than 2.5 million active and retired members; with asset values that range from as
low as $3 million to as large as $150 billion.
At its November 16, 2017 meeting, the Board directed staff to study the possible benefits for smaller
pension systems of pooling trust funds for investment purposes. The Board charged staff with conducting
this interim study to develop potential legislative recommendations for inclusion in agency’s 2018 Biennial
Report to the Legislature and Governor.
This interim study is organized as follows. Section I discusses the potential benefits of pooling assets.
Section II analyzes data to assess whether smaller Texas pension funds would likely be able to achieve
these benefits. Section III reviews examples of asset pooling and models the potential impact of these on
small plans, and Section IV provides recommendations. For the purposes of this study, “small plan” was
defined as all plans that fell within the bottom quintile (i.e. smallest 20%) of all Texas plans, when sorted
by asset size. For the 2016 Fiscal Year End, this includes all plans with less than $12.5 million in assets.
I. Potential Benefits of Pooling Pension Assets
Pooling assets of smaller pension plans into a single, larger group investment trust may provide increased
performance for participating pension plans for several reasons. Larger retirement systems are able to
take advantage of economies of scale to reduce investment and administrative expenses and improve
diversification through cost effective access to desired asset classes.1
Economies of Scale Higher investment management fees have been shown to be correlated with poorer investment
performance, so much so that Morningstar has called expense ratios the “most proven predictor of future
1 Dyck, Alexander, and Lukasz Pomorski. “Is Bigger Better? Size and Performance in Pension Plan Management.” SSRN Electronic Journal, Feb. 2011, p. 3., doi:10.2139/ssrn.1690724.

3
fund returns.”2,3 Larger investment funds typically have lower investment management fees because they
have improved bargaining power or are able to hire internal investment managers at a lower cost than
external investment managers.4,5 Further, many administrative costs are fixed and/or decrease on a per-
participant basis as total participants increase. 6 Therefore, pooling small pension plan assets for
investment purposes, as well as pooling administrative tasks, could increase efficiency and reduce costs,
resulting in an overall improvement in investment performance.
Diversification Investment management costs for certain asset classes, including alternative investments, are usually
much higher than traditional asset classes. Private equity and real estate, in particular, are directly
affected by scale and negotiating power, and large plans have opportunities for co-investment that may
require sophisticated contracts.7 Smaller pension plans pay comparatively high costs for a small allocation
or may be unable to access these asset classes at all. Pooling assets allows small pension plans a cost-
effective manner to invest in asset classes, and increase portfolio diversification, that frequently is not
available to smaller plans.
II. Research and Analysis
Methodology To study the possible benefits for smaller Texas pension systems of pooling trust funds for investment
purposes, the PRB analyzed investment return and fee data submitted by public retirement systems for
fiscal years 2007 to 2016.8 The data tested includes all actuarially funded defined benefit pension plans
that reported to the PRB during that period, except for the 4 largest plans, Teacher Retirement System of
Texas (TRS), Employees Retirement System of Texas (ERS), Texas Municipal Retirement System (TMRS),
Texas County and District Retirement System (TCDRS).9 These large, statewide plans were excluded from
the analysis because the smallest of these is 6 times larger than the next largest plan and instead were
included as a separate group in the graphs and tables for comparison only. Data for individual pension
2 Aubry, Jean-Pierre, and Caroline V. Crawford. “How Do Fees Affect Plans' Ability to Beat Their Benchmarks?” State and Local Pension Plans, vol. 61, Aug. 2018. p. 3. 3 Kinnel, Russel. “Predictive Power of Fees.” Morningstar Manager Research, May 2016. p. 1. 4 James, Estelle et al. “Administrative Costs and the Organization of Individual Retirement Account Systems: A Comparative Perspective.” The World Bank Policy Research Dissemination Center, Feb. 2001. p. 9. 5 Dyck, Alexander, and Lukasz Pomorski. “Is Bigger Better? Size and Performance in Pension Plan Management.” SSRN Electronic Journal, Feb. 2011, p. 4., doi:10.2139/ssrn.1690724. 6Bikker, Jacob A., and Jan De Dreu. “Operating Costs of Pension Funds: the Impact of Scale, Governance, and Plan Design.” Journal of Pension Economics and Finance, vol. 8, no. 01, Feb. 2009, p. 68., doi:10.1017/s1474747207002995. 7 Dyck, Alexander, and Lukasz Pomorski. “Is Bigger Better? Size and Performance in Pension Plan Management.” SSRN Electronic Journal, Feb. 2011, p. 4., doi:10.2139/ssrn.1690724. 8 Data collected by the PRB is as reported by the plans and may contain errors, omissions or misclassifications. 9 The Law Enforcement & Custodial Officer Supplemental Retirement Fund and the Judicial Retirement System of Texas Plan Two are included as part of ERS for this purpose.

4
plans that are managed as a single trust (e.g. El Paso Firemen’s Pension Fund, El Paso Police Pension Fund,
and El Paso Firemen and Policemen’s Pension Staff Plan and Trust) were combined into a single entity.
The remaining data for each year was sorted by asset size and split into quintiles, with Quintile 1
containing the smallest plans, and Quintile 5 the largest (see the “Texas Public Pension Plans by Asset
Size” table in the appendix for additional detail). The total assets of Quintile 1 plans ($107.9M as of FYE
2016) generally fell near the bottom of the range for Quintile 4. Because Quintile 4 (as of FYE 2016) ranged
from $80M to $400M, plans in Quintile 3 ($32.5M to $77M as of FYE 2016) were used to represent large
plans in this study.
Investment return performance was evaluated on an absolute basis using annual returns net of
investment fees; on a relative basis using excess annual net returns above the assumed rate of return;
and on a risk-adjusted basis using 5-year and 10-year Sharpe ratios. 10 , 11 In addition, differences in
investment and administrative expense ratios were evaluated.
10 While assumed rate of return is not a common benchmark for evaluating relative performance, it provided a simple approach to measure a plan’s ability to achieve its broad investment goals. 11 Sharpe ratios are a common and widely used measure of risk-adjusted return which attempts to capture the amount of excess return achieved above the risk-free rate per unit of total risk as measured by standard deviation.

5
Results Overall, the data show that larger pension plans performed better than smaller plans on both an absolute
basis and relative to their investment return targets.
Average annual net returns generally increased as asset size increased. Further, smaller plans not only
had lower average assumed rates of return (AROR), but they also performed worse relative to their
assumed rates of return (excess return). Over the period we considered, no quintile had average returns
in excess of their assumed rates of return, so excess returns are negative for all quintiles.
The chart below shows that the 10-year and the 5-year Sharpe ratios were generally larger as plan size
increased (indicating improved performance), although this result was clearer for 5-year ratios.

6
As illustrated in the chart below, the larger pension plans had significantly lower investment and
administrative fees. Investment and administrative fees saw the largest decline from Quintile 1 to Quintile
2 as well as a significant decline from Quintiles 4 and 5 to the Statewide plans.
III. Possible Asset Pooling Models
Staff identified two primary models of pooled pension trusts: an Investment Management only model
(IM) and an Investment Management and Administration (IMA) model. Under both models, the
participating systems transfer all or a portion of their assets into the group investment trust, while
maintaining the existing governance structures, including contribution, benefit, actuarial and asset
allocation decision-making. An additional model, the Multiple-Employer Plan (MEP), also pools plan
assets, but goes far beyond the scope of this study.
Investment Management Only The investment management (IM) only model provides investment management services to member
systems as a group trust. Some trusts require participating members to invest all assets with the trust,
while others allow only a portion of the assets be invested. Some models manage members’ assets
through model portfolios based on predetermined risk/return levels, while others replicate members’
asset allocations.
Massachusetts
The Massachusetts Pension Reserves Investment Management Board (PRIM) is charged with the general
supervision of the Pension Reserves Investment Trust Fund (PRIT). The PRIT fund is a pooled investment

7
trust fund established in 1983 to invest the assets of state and local retirement systems. The State
Teachers’ Retirement System, the State Employees’ Retirement System, the State Boston/Teachers’
Retirement System, and the State Retiree Benefits Trust Fund are mandated by statute to invest all their
assets in the PRIT. Local retirement systems may invest in the PRIT fund as participating members or
purchasing members. Participating members are required to transfer all assets to PRIM for a mandatory
five-year period, while purchasing members can elect to invest just a portion of their assets with no
minimum dollar amount or investment period.
Alberta and Ontario
The Alberta Investment Management Corporation (AIMCO) and the Investment Management Corporation
of Ontario (IMCO) are Canadian Crown corporations (state-owned, nonprofit enterprises) of their
respective provinces which provide investment management services to public sector clients. AIMCO
provides services to endowment funds, pension plans, short-term government funds and special purpose
government funds, while IMCO was created specifically to facilitate pooled asset management for Ontario
public-sector institutions including public pension plans and other non-pension investment funds. The
clients of both AIMCO and IMCO retain fiduciary duty and control over asset allocation decisions as well
as full control of existing plans.
Investment Management and Administration The Investment Management and Administration (IMA) model expands upon the IM model by adding
various administrative functions to the list of services offered to the participating members. The services
range from benefit administration to actuarial services.
Texas Hospital Association Master Trust
The Texas Hospital Association (THA) provides a variety of benefits and services to its members, including
investment management, investment consulting, actuarial, audit, legal and benefit administration
services to qualified defined benefit and defined contribution plans in the health care sector. Participating
members include private, not-for-profit and public hospitals. For a defined benefit plan to be considered
for inclusion in the program, it must meet minimum actuarial and legal requirements. Once accepted,
plans are required to invest all assets with the trust as well as utilize THA’s benefit administration services.
Investing only a portion of a plan’s assets or the use of alternative benefit administration services is
generally not allowed. Defined benefit plans may select between four different pre-determined asset
allocation models based on the employer’s risk preferences. The models are a mix of equity and fixed
income investments which are managed by the Trust’s board of trustees with the assistance of
independent investment advisors. Participating plans retain full control of existing benefit provisions.
Agent Multiple-Employer Plans An agent multiple-employer plan goes far beyond the IMA model, and therefore was not examined in this
study. In this structure, the plan generally sets parameters for benefits and contributions and makes
investment decisions on behalf of its participating employers.
Texas is home to two agent-multiple employer plans, the Texas Municipal Retirement System and the
Texas County and District Retirement System, which pool assets of multiple municipalities and/or districts

8
for investment purposes. member municipalities/districts may voluntarily join the systems, and those that
participate have their own retirement plans within the general framework of their respective governing
statutes. Plan provisions may vary depending upon the options selected by each individual employer.
Potential Impact To objectively analyze the benefits of the IM and IMA structures, the PRB modeled the potential impact,
by calculating the additional investment earnings systems in Quintile 1 could have earned if they achieved
the same average returns as the systems in Quintile 3, as well as the potential savings in investment and
administrative expenses if the average expenses paid by systems in Quintile 1 were the same as those
paid by the systems in Quintile 3. It is estimated that the systems would have accrued an additional $21.5
million in investment earnings plus saved approximately $5 million in investment fees, totaling $26.5
million in additional assets as of the end of the 2016 FY under the IM model. Under the IMA model, an
additional $5 million in administrative fees could have been saved, totaling $32 million for the 10-year
period ending in 2016. This represents an increase from $108 million to $140 million in aggregate assets,
or a 29% increase.
IV. Recommendations
This study constitutes a first step towards developing potential recommendations in this area. The
evidence suggests smaller pension plans in Texas could benefit in several ways from pooling assets for
investment purposes as well as pooling administrative functions. Further in-depth study of possible

9
governance structures to provide asset pooling services including associated legal requirements is
necessary and should include engaging small pension plans to provide input and explore viable options.
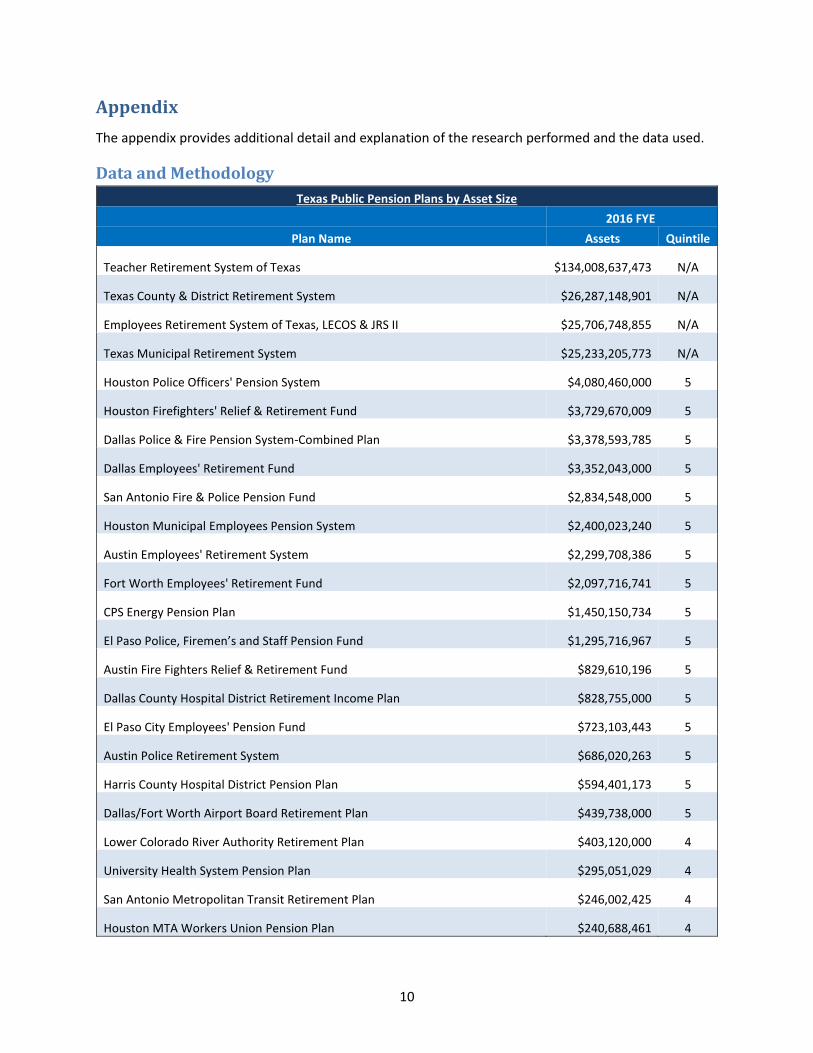
10
Appendix
The appendix provides additional detail and explanation of the research performed and the data used.
Data and Methodology
Texas Public Pension Plans by Asset Size
2016 FYE
Plan Name Assets Quintile
Teacher Retirement System of Texas $134,008,637,473 N/A
Texas County & District Retirement System $26,287,148,901 N/A
Employees Retirement System of Texas, LECOS & JRS II $25,706,748,855 N/A
Texas Municipal Retirement System $25,233,205,773 N/A
Houston Police Officers' Pension System $4,080,460,000 5
Houston Firefighters' Relief & Retirement Fund $3,729,670,009 5
Dallas Police & Fire Pension System-Combined Plan $3,378,593,785 5
Dallas Employees' Retirement Fund $3,352,043,000 5
San Antonio Fire & Police Pension Fund $2,834,548,000 5
Houston Municipal Employees Pension System $2,400,023,240 5
Austin Employees' Retirement System $2,299,708,386 5
Fort Worth Employees' Retirement Fund $2,097,716,741 5
CPS Energy Pension Plan $1,450,150,734 5
El Paso Police, Firemen’s and Staff Pension Fund $1,295,716,967 5
Austin Fire Fighters Relief & Retirement Fund $829,610,196 5
Dallas County Hospital District Retirement Income Plan $828,755,000 5
El Paso City Employees' Pension Fund $723,103,443 5
Austin Police Retirement System $686,020,263 5
Harris County Hospital District Pension Plan $594,401,173 5
Dallas/Fort Worth Airport Board Retirement Plan $439,738,000 5
Lower Colorado River Authority Retirement Plan $403,120,000 4
University Health System Pension Plan $295,051,029 4
San Antonio Metropolitan Transit Retirement Plan $246,002,425 4
Houston MTA Workers Union Pension Plan $240,688,461 4
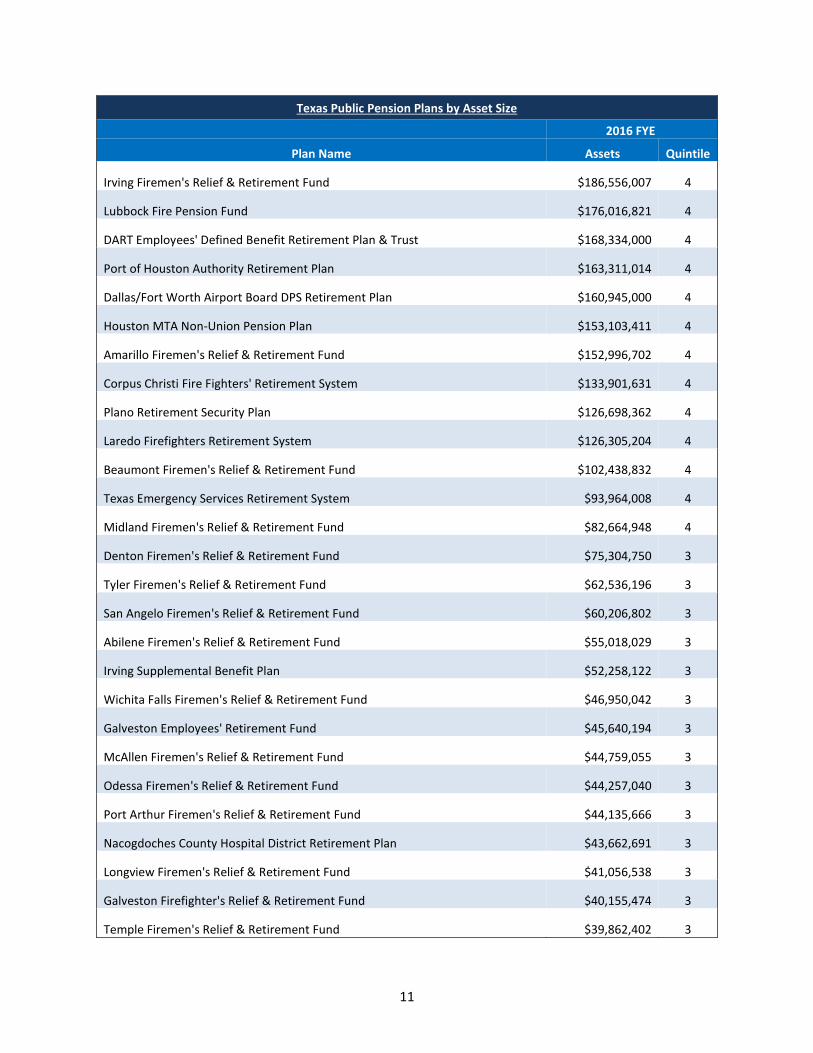
11
Texas Public Pension Plans by Asset Size
2016 FYE
Plan Name Assets Quintile
Irving Firemen's Relief & Retirement Fund $186,556,007 4
Lubbock Fire Pension Fund $176,016,821 4
DART Employees' Defined Benefit Retirement Plan & Trust $168,334,000 4
Port of Houston Authority Retirement Plan $163,311,014 4
Dallas/Fort Worth Airport Board DPS Retirement Plan $160,945,000 4
Houston MTA Non-Union Pension Plan $153,103,411 4
Amarillo Firemen's Relief & Retirement Fund $152,996,702 4
Corpus Christi Fire Fighters' Retirement System $133,901,631 4
Plano Retirement Security Plan $126,698,362 4
Laredo Firefighters Retirement System $126,305,204 4
Beaumont Firemen's Relief & Retirement Fund $102,438,832 4
Texas Emergency Services Retirement System $93,964,008 4
Midland Firemen's Relief & Retirement Fund $82,664,948 4
Denton Firemen's Relief & Retirement Fund $75,304,750 3
Tyler Firemen's Relief & Retirement Fund $62,536,196 3
San Angelo Firemen's Relief & Retirement Fund $60,206,802 3
Abilene Firemen's Relief & Retirement Fund $55,018,029 3
Irving Supplemental Benefit Plan $52,258,122 3
Wichita Falls Firemen's Relief & Retirement Fund $46,950,042 3
Galveston Employees' Retirement Fund $45,640,194 3
McAllen Firemen's Relief & Retirement Fund $44,759,055 3
Odessa Firemen's Relief & Retirement Fund $44,257,040 3
Port Arthur Firemen's Relief & Retirement Fund $44,135,666 3
Nacogdoches County Hospital District Retirement Plan $43,662,691 3
Longview Firemen's Relief & Retirement Fund $41,056,538 3
Galveston Firefighter's Relief & Retirement Fund $40,155,474 3
Temple Firemen's Relief & Retirement Fund $39,862,402 3

12
Texas Public Pension Plans by Asset Size
2016 FYE
Plan Name Assets Quintile
Killeen Firemen's Relief & Retirement Fund $35,342,830 3
Corpus Christi Regional Transportation Authority $32,583,077 3
Texarkana Firemen's Relief & Retirement Fund $31,777,180 2
Capital MTA Retirement Plan for Bargaining Unit Employees $29,535,196 2
Harlingen Firemen's Relief & Retirement Fund $28,747,083 2
Guadalupe-Blanco River Authority $26,632,375 2
The Woodlands Firefighters' Retirement System $26,188,804 2
Capital MTA Retirement Plan for Administrative Employees $23,811,865 2
Conroe Fire Fighters' Retirement Fund $22,529,049 2
Cleburne Firemen's Relief & Retirement Fund $21,323,149 2
Northwest Texas Healthcare System Retirement Plan $19,960,895 2
Galveston Employees' Retirement Plan for Police $19,784,817 2
Brazos River Authority Retirement Plan $18,726,771 2
Denison Firemen's Relief & Retirement Fund $15,721,368 2
Travis County ESD #6 Firefighter's Relief & Retirement Fund $15,043,500 2
Texas City Firemen's Relief & Retirement Fund $14,412,584 2
Lufkin Firemen's Relief & Retirement Fund $14,335,797 2
Waxahachie Firemen's Relief & Retirement Fund $14,201,159 2
Greenville Firemen's Relief & Retirement Fund $12,728,162 2
Galveston Wharves Pension Plan $11,895,228 1
Big Spring Firemen's Relief & Retirement Fund $10,387,399 1
Colorado River Municipal Water District Defined Benefit Retirement Plan & Trust $9,660,662 1
University Park Firemen's Relief & Retirement Fund $9,448,371 1
Weslaco Firemen's Relief & Retirement Fund $9,186,148 1
Corsicana Firemen's Relief & Retirement Fund $8,344,317 1
Orange Firemen's Relief & Retirement Fund $8,154,598 1
Sweetwater Firemen's Relief & Retirement Fund $7,826,879 1

13
Texas Public Pension Plans by Asset Size
2016 FYE
Plan Name Assets Quintile
Marshall Firemen's Relief & Retirement Fund $7,712,228 1
Plainview Firemen's Relief & Retirement Fund $5,427,943 1
Paris Firefighters' Relief & Retirement Fund $4,764,272 1
Atlanta Firemen's Relief & Retirement Fund $3,744,867 1
Brownwood Firemen's Relief & Retirement Fund $3,617,575 1
San Benito Firemen Relief & Retirement Fund $2,987,515 1
Arlington Employees Deferred Income Plan $2,727,969 1
Refugio County Memorial Hospital District Retirement Plan $2,051,124 1
Total assets are all the assets available to a fund and may include, investments, cash, receivables, and
capital assets. Investment return data was provided on a total fund level and is net of investment fees.
Sharpe ratios were calculated based on annual data for investment returns, T-bill returns and standard
deviation.
Expense data was calculated as a percentage of assets based on fees reported for investment and
administrative expenses. Investment expenses primarily consist of investment management fees,
investment consultant fees, and custodial and brokerage fees. Administrative expenses are fees related
to operating the pension plan and may include professional consultants and benefits administration. The
data is self-reported and, in some instances, contain inconsistencies in classification of fees across
different pension plans with investment expenses, such as investment consultant fees, being reported as
administrative expenses. Further, where pension funds utilize employees of the sponsoring entity to help
perform administrative functions for the plan, administrative costs may not be fully recognized by the
plan.12
For each year, the pension plans were grouped into quintiles by total assets and averages were calculated
for each metric, excluding Sharpe ratios, which were calculated at the end of 2016 on a 5-year and 10-
year basis. The metrics were then analyzed across quintiles for differences in performance based on asset
size.
Summary statistics for each metric are included to provide information about the observations in each
data set and include; mean, median, standard deviation and minimum and maximum values.
12 Bikker, Jacob A., and Jan De Dreu. “Operating Costs of Pension Funds: the Impact of Scale, Governance, and Plan Design.” Journal of Pension Economics and Finance, vol. 8, no. 01, Feb. 2009, doi:10.1017/s1474747207002995.
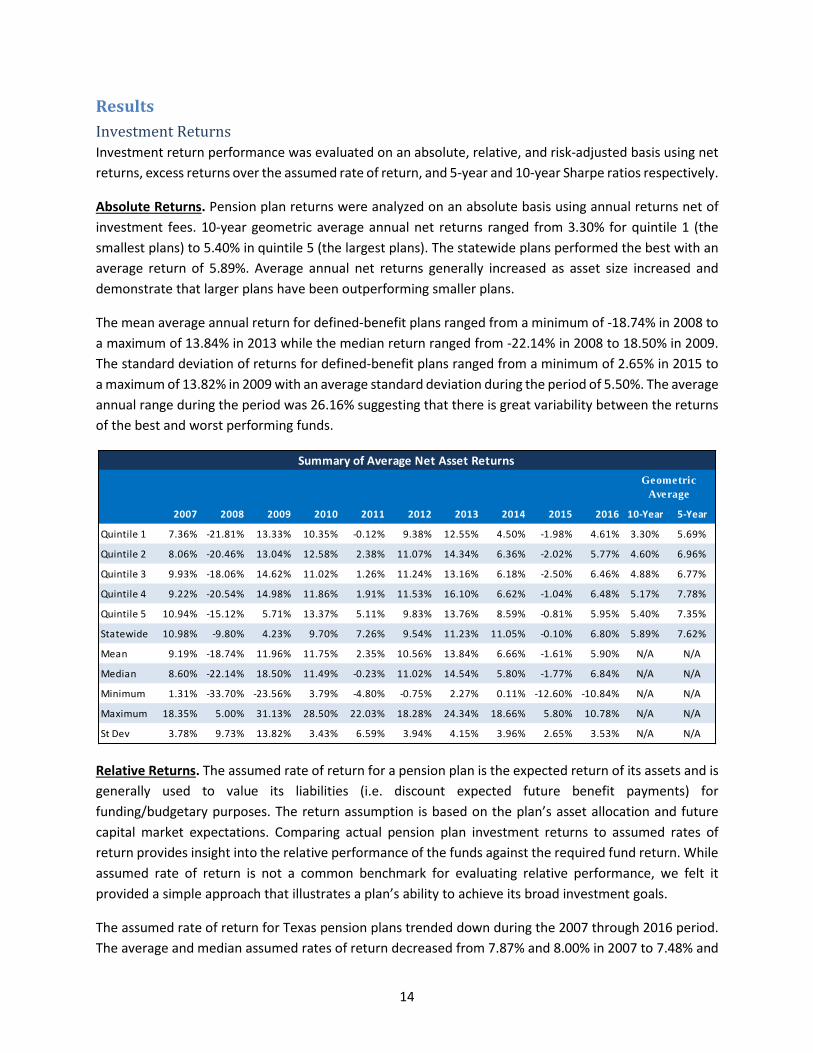
14
Results
Investment Returns
Investment return performance was evaluated on an absolute, relative, and risk-adjusted basis using net
returns, excess returns over the assumed rate of return, and 5-year and 10-year Sharpe ratios respectively.
Absolute Returns. Pension plan returns were analyzed on an absolute basis using annual returns net of
investment fees. 10-year geometric average annual net returns ranged from 3.30% for quintile 1 (the
smallest plans) to 5.40% in quintile 5 (the largest plans). The statewide plans performed the best with an
average return of 5.89%. Average annual net returns generally increased as asset size increased and
demonstrate that larger plans have been outperforming smaller plans.
The mean average annual return for defined-benefit plans ranged from a minimum of -18.74% in 2008 to
a maximum of 13.84% in 2013 while the median return ranged from -22.14% in 2008 to 18.50% in 2009.
The standard deviation of returns for defined-benefit plans ranged from a minimum of 2.65% in 2015 to
a maximum of 13.82% in 2009 with an average standard deviation during the period of 5.50%. The average
annual range during the period was 26.16% suggesting that there is great variability between the returns
of the best and worst performing funds.
Relative Returns. The assumed rate of return for a pension plan is the expected return of its assets and is
generally used to value its liabilities (i.e. discount expected future benefit payments) for
funding/budgetary purposes. The return assumption is based on the plan’s asset allocation and future
capital market expectations. Comparing actual pension plan investment returns to assumed rates of
return provides insight into the relative performance of the funds against the required fund return. While
assumed rate of return is not a common benchmark for evaluating relative performance, we felt it
provided a simple approach that illustrates a plan’s ability to achieve its broad investment goals.
The assumed rate of return for Texas pension plans trended down during the 2007 through 2016 period.
The average and median assumed rates of return decreased from 7.87% and 8.00% in 2007 to 7.48% and
2007 2008 2009 2010 2011 2012 2013 2014 2015 2016 10-Year 5-Year
Quintile 1 7.36% -21.81% 13.33% 10.35% -0.12% 9.38% 12.55% 4.50% -1.98% 4.61% 3.30% 5.69%
Quintile 2 8.06% -20.46% 13.04% 12.58% 2.38% 11.07% 14.34% 6.36% -2.02% 5.77% 4.60% 6.96%
Quintile 3 9.93% -18.06% 14.62% 11.02% 1.26% 11.24% 13.16% 6.18% -2.50% 6.46% 4.88% 6.77%
Quintile 4 9.22% -20.54% 14.98% 11.86% 1.91% 11.53% 16.10% 6.62% -1.04% 6.48% 5.17% 7.78%
Quintile 5 10.94% -15.12% 5.71% 13.37% 5.11% 9.83% 13.76% 8.59% -0.81% 5.95% 5.40% 7.35%
Statewide 10.98% -9.80% 4.23% 9.70% 7.26% 9.54% 11.23% 11.05% -0.10% 6.80% 5.89% 7.62%
Mean 9.19% -18.74% 11.96% 11.75% 2.35% 10.56% 13.84% 6.66% -1.61% 5.90% N/A N/A
Median 8.60% -22.14% 18.50% 11.49% -0.23% 11.02% 14.54% 5.80% -1.77% 6.84% N/A N/A
Minimum 1.31% -33.70% -23.56% 3.79% -4.80% -0.75% 2.27% 0.11% -12.60% -10.84% N/A N/A
Maximum 18.35% 5.00% 31.13% 28.50% 22.03% 18.28% 24.34% 18.66% 5.80% 10.78% N/A N/A
St Dev 3.78% 9.73% 13.82% 3.43% 6.59% 3.94% 4.15% 3.96% 2.65% 3.53% N/A N/A
Summary of Average Net Asset Returns
Geometric
Average
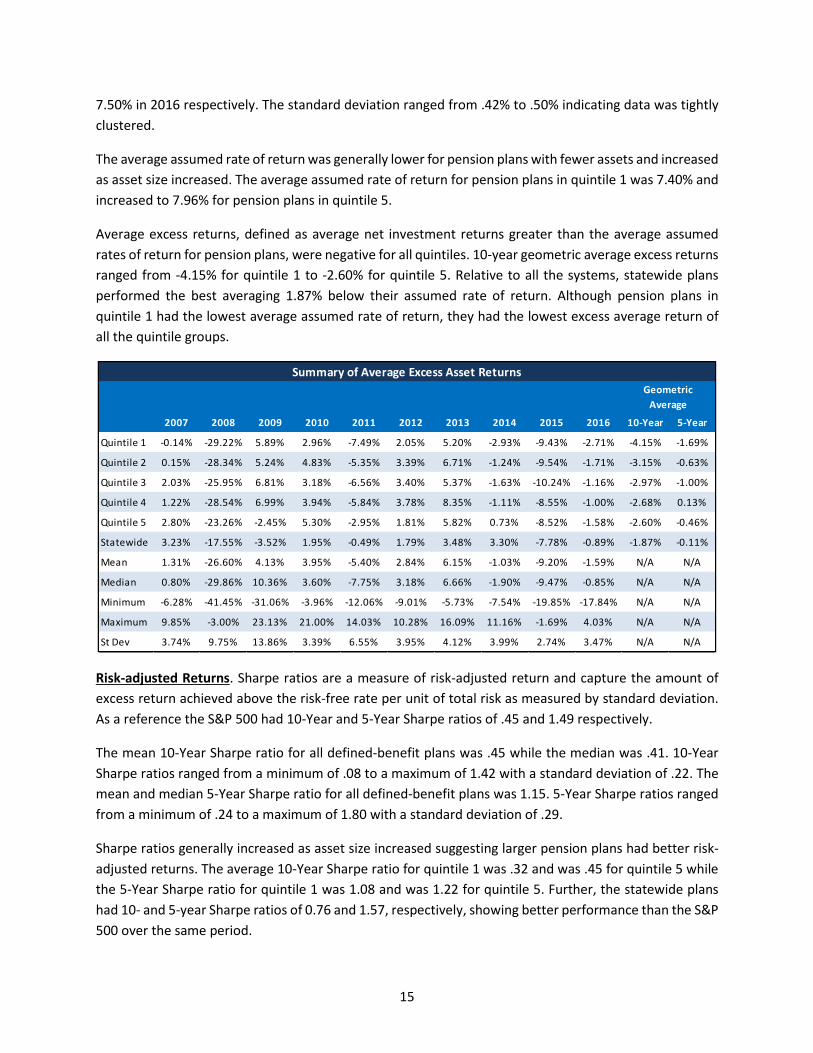
15
7.50% in 2016 respectively. The standard deviation ranged from .42% to .50% indicating data was tightly
clustered.
The average assumed rate of return was generally lower for pension plans with fewer assets and increased
as asset size increased. The average assumed rate of return for pension plans in quintile 1 was 7.40% and
increased to 7.96% for pension plans in quintile 5.
Average excess returns, defined as average net investment returns greater than the average assumed
rates of return for pension plans, were negative for all quintiles. 10-year geometric average excess returns
ranged from -4.15% for quintile 1 to -2.60% for quintile 5. Relative to all the systems, statewide plans
performed the best averaging 1.87% below their assumed rate of return. Although pension plans in
quintile 1 had the lowest average assumed rate of return, they had the lowest excess average return of
all the quintile groups.
Risk-adjusted Returns. Sharpe ratios are a measure of risk-adjusted return and capture the amount of
excess return achieved above the risk-free rate per unit of total risk as measured by standard deviation.
As a reference the S&P 500 had 10-Year and 5-Year Sharpe ratios of .45 and 1.49 respectively.
The mean 10-Year Sharpe ratio for all defined-benefit plans was .45 while the median was .41. 10-Year
Sharpe ratios ranged from a minimum of .08 to a maximum of 1.42 with a standard deviation of .22. The
mean and median 5-Year Sharpe ratio for all defined-benefit plans was 1.15. 5-Year Sharpe ratios ranged
from a minimum of .24 to a maximum of 1.80 with a standard deviation of .29.
Sharpe ratios generally increased as asset size increased suggesting larger pension plans had better risk-
adjusted returns. The average 10-Year Sharpe ratio for quintile 1 was .32 and was .45 for quintile 5 while
the 5-Year Sharpe ratio for quintile 1 was 1.08 and was 1.22 for quintile 5. Further, the statewide plans
had 10- and 5-year Sharpe ratios of 0.76 and 1.57, respectively, showing better performance than the S&P
500 over the same period.
2007 2008 2009 2010 2011 2012 2013 2014 2015 2016 10-Year 5-Year
Quintile 1 -0.14% -29.22% 5.89% 2.96% -7.49% 2.05% 5.20% -2.93% -9.43% -2.71% -4.15% -1.69%
Quintile 2 0.15% -28.34% 5.24% 4.83% -5.35% 3.39% 6.71% -1.24% -9.54% -1.71% -3.15% -0.63%
Quintile 3 2.03% -25.95% 6.81% 3.18% -6.56% 3.40% 5.37% -1.63% -10.24% -1.16% -2.97% -1.00%
Quintile 4 1.22% -28.54% 6.99% 3.94% -5.84% 3.78% 8.35% -1.11% -8.55% -1.00% -2.68% 0.13%
Quintile 5 2.80% -23.26% -2.45% 5.30% -2.95% 1.81% 5.82% 0.73% -8.52% -1.58% -2.60% -0.46%
Statewide 3.23% -17.55% -3.52% 1.95% -0.49% 1.79% 3.48% 3.30% -7.78% -0.89% -1.87% -0.11%
Mean 1.31% -26.60% 4.13% 3.95% -5.40% 2.84% 6.15% -1.03% -9.20% -1.59% N/A N/A
Median 0.80% -29.86% 10.36% 3.60% -7.75% 3.18% 6.66% -1.90% -9.47% -0.85% N/A N/A
Minimum -6.28% -41.45% -31.06% -3.96% -12.06% -9.01% -5.73% -7.54% -19.85% -17.84% N/A N/A
Maximum 9.85% -3.00% 23.13% 21.00% 14.03% 10.28% 16.09% 11.16% -1.69% 4.03% N/A N/A
St Dev 3.74% 9.75% 13.86% 3.39% 6.55% 3.95% 4.12% 3.99% 2.74% 3.47% N/A N/A
Summary of Average Excess Asset Returns
Geometric
Average

16
Expenses
Pension plans pay various expenses to operate a pension fund, including investment and administrative
expenses. Investment and administrative expenses reduce pension plan returns as they are paid from
investment earnings and plan assets. Higher expenses generally lead to a decrease in performance. The
results of the study seem to indicate that pension plans exhibit economies of scale as average fees as a
percent of assets appear to be inversely correlated with asset size.
The 10-year average investment fee for defined-benefit pension plans was 1.00% for pension plans in
quintile 1 and .45% for pension plans in quintile 5. The average administrative fee was .81% for pension
plans in quintile 1 and was .15% for pension plans in quintile 5. Average investment fees for quintile 1
were 1.5 to 2.5 times the size of the other quintile groups while average administrative fees were 2 to 5
times as large as the other quintile groups.
The average investment fee for defined-benefit plans ranged from a minimum of .48% in 2016 to a
maximum of .69% in 2008 while the median investment fee ranged from .40% in 2016 to .62% in 2008.
The standard deviation of investment fees for defined-benefit plans ranged from a minimum of .28% in
2014 to a maximum of .44% in 2008.
The average administrative fee for defined-benefit plans ranged from a minimum of .25% in 2014 to a
maximum of .57% in 2008 while the median investment fee ranged from .17% in 2014 to .26% in 2011.
The standard deviation of investment fees for defined-benefit plans ranged from a minimum of .24% in
2007 to a maximum of 1.83% in 2008.

17
2007 2008 2009 2010 2011 2012 2013 2014 2015 2016 10-Year 5-Year
Quintile 1 1.12% 1.23% 1.04% 1.04% 1.09% 0.92% 0.92% 0.91% 0.90% 0.82% 1.00% 0.89%
Quintile 2 0.68% 0.78% 0.59% 0.69% 0.64% 0.72% 0.57% 0.59% 0.57% 0.54% 0.64% 0.60%
Quintile 3 0.50% 0.68% 0.45% 0.51% 0.46% 0.44% 0.42% 0.45% 0.46% 0.34% 0.47% 0.42%
Quintile 4 0.34% 0.43% 0.33% 0.32% 0.38% 0.39% 0.39% 0.44% 0.44% 0.41% 0.39% 0.41%
Quintile 5 0.48% 0.64% 0.41% 0.45% 0.44% 0.45% 0.41% 0.41% 0.42% 0.40% 0.45% 0.42%
Statewide 0.23% 0.16% 0.12% 0.14% 0.17% 0.15% 0.15% 0.12% 0.15% 0.17% 0.16% 0.15%
Mean 0.55% 0.69% 0.51% 0.51% 0.53% 0.52% 0.50% 0.51% 0.52% 0.48% N/A N/A
Median 0.50% 0.62% 0.43% 0.44% 0.47% 0.46% 0.41% 0.47% 0.48% 0.40% N/A N/A
Minimum 0.00% 0.01% 0.02% 0.02% 0.00% 0.03% 0.03% 0.03% 0.11% 0.10% N/A N/A
Maximum 1.66% 1.91% 2.35% 1.63% 1.63% 1.39% 1.37% 1.18% 1.21% 1.28% N/A N/A
St Dev 0.36% 0.44% 0.40% 0.34% 0.36% 0.30% 0.29% 0.28% 0.29% 0.28% N/A N/A
Summary of Average Investment Fees
Arithmetic
Average
2007 2008 2009 2010 2011 2012 2013 2014 2015 2016 10-Year 5-Year
Quintile 1 0.53% 1.97% 0.68% 1.00% 1.09% 0.63% 0.45% 0.50% 0.64% 0.59% 0.81% 0.56%
Quintile 2 0.30% 0.46% 0.49% 0.37% 0.45% 0.32% 0.37% 0.32% 0.33% 0.32% 0.37% 0.33%
Quintile 3 0.24% 0.25% 0.21% 0.21% 0.26% 0.29% 0.27% 0.23% 0.21% 0.24% 0.24% 0.25%
Quintile 4 0.26% 0.38% 0.26% 0.27% 0.29% 0.18% 0.17% 0.13% 0.16% 0.17% 0.23% 0.16%
Quintile 5 0.14% 0.18% 0.16% 0.15% 0.15% 0.15% 0.14% 0.13% 0.15% 0.16% 0.15% 0.15%
Statewide 0.05% 0.06% 0.06% 0.06% 0.07% 0.06% 0.06% 0.06% 0.07% 0.06% 0.06% 0.06%
Mean 0.27% 0.57% 0.33% 0.37% 0.42% 0.30% 0.26% 0.25% 0.28% 0.28% N/A N/A
Median 0.19% 0.23% 0.24% 0.19% 0.26% 0.19% 0.18% 0.17% 0.19% 0.19% N/A N/A
Minimum 0.02% 0.01% 0.02% 0.02% 0.02% 0.02% 0.02% 0.02% 0.02% 0.03% N/A N/A
Maximum 1.17% 16.65% 2.44% 3.44% 6.42% 1.66% 1.90% 1.74% 2.80% 2.08% N/A N/A
St Dev 0.24% 1.83% 0.37% 0.52% 0.74% 0.31% 0.29% 0.25% 0.36% 0.29% N/A N/A
Summary of Average Administrative Fees
Arithmetic
Average

18
Statistical Analysis Many statistical techniques and financial theories rely on the assumption that returns are normally
distributed to simplify analysis. Studies have shown that asset returns do not follow a normal distribution
as they have excess kurtosis, i.e. fatter tails or more results at the extreme ends of the distribution,
therefore this study assumes that asset returns are log-normally distributed in order to address this
concern.
The combined total assets for the plans in Quintile 1 fell within the lower end of the range of plans in
Quintile 4. However, due to the large range of Quintile 4 ($80mm to $400mm), Quintile 3 was chosen as
a more appropriate representation for comparing expected returns and expenses.
Except where specifically noted below, this study relies on the Welch t-Test for two samples assuming
equal variances to test for statistical significance and the central limit theorem for samples of n > 30 to
approximate a normal distribution. The null hypothesis is that the difference between the means of the
underlying distribution equals zero while the alternative hypothesis is that the difference does not equal
zero.
The t-Test for net investment returns failed to reject the null hypothesis at the 95% confidence level.
However, sample size is likely driving this result. The sample size required to achieve 95% confidence,
given the sample statistics cited above, is roughly 1,050 total observations (or 525 per sample), while our
sample only includes 322 observations. So while the differences in average returns are arguably large in
practical terms (i.e., greater than 100 basis points), we simply do not have a large enough sample for
statistical significance.
Similarly, the t-Test for excess returns above the assumed rate of return failed to reject the null hypothesis
at the 95% confidence level. Again, this could be caused by the small sample size. The sample size required
for 95% confidence is roughly 2,100 total observations (or 1,050 per sample).
Average Annual Return 2007-2016 Average Excess Return 2007-2016
Q3 Q1 Q3 Q1
Mean 4.64% 3.30% Mean (3.16%) (4.19%)
Variance 1.18% 1.28% Variance 1.41% 1.52%
Observations 163 159 Observations 163 159
Pooled Variance 1.23% Pooled Variance 1.46%
df 320 df 320
t Stat 1.09 t Stat 0.77
P(T<=t) two-tail 0.28 P(T<=t) two-tail 0.44

19
Numerous papers have shown that Sharpe ratios are not normally distributed,13,14 and have discussed
several different approaches to performing hypothesis testing on the difference between two Sharpe
ratios that produce robust results but are generally beyond the scope of this analysis. For simplicity, this
study relies on the Mann–Whitney U test which is distribution free so does not rely on the assumption
that the underlying values are normally distributed. The Mann-Whitney U test for the 5-Year Sharpe Ratio
failed to reject the null hypothesis at the 95% confidence level, however, the 10-Year Sharpe Ratios are
shown to be statistically different.
5-Year Sharpe Ratio 10-Year Sharpe Ratio
Q3 Q1 Q3 Q1
Median 1.05 1.11 Median 0.42 0.32
Observations 16 15 Observations 16 14
Sum of Ranks 248 248 Sum of Ranks 313 152
Mann-Whitney U 128 128 Mann-Whitney U 201 40
z 0.32 z -2.99
P(Z<=z) two-tail 0.75 P(Z<=z) two-tail 0.00
The t-Tests for both investment and administrative fees indicates the differences in fees between Quintile
3 and Quintile 1 are statistically significant.
Average Investment Fees 2007-2016 Average Administrative Fees 2007-2016
Q3 Q1 Q3 Q1
Mean 0.47% 0.99% Mean 0.24% 0.79%
Variance 0.00% 0.00% Variance 0.00% 0.02%
Observations 152 102 Observations 162 142
Pooled Variance 0.00% Pooled Variance 0.01%
df 252 df 302
t Stat -14.04 t Stat -4.51
P(T<=t) two-tail 0.00 P(T<=t) two-tail 0.00
13 Opdyke, John Douglas. “Comparing Sharpe Ratios: So Where Are the p-Values?” Journal of Asset Management, vol. 8, no. 5, Dec. 2007, pp. 308–336., doi:10.1057/palgrave.jam.2250084. 14 Riondato, Matteo. “‘Sharpe Ratio: Estimation, Confidence Intervals, and Hypothesis Testing.” Two Sigma Technical Report 2018-001, 14 June 2018.

20
The statistical analysis demonstrates that some of the metrics of pension performance examined as part
of the study are not random and pooling assets could provide significant benefits to pension plans.
Although net investment returns and excess returns over the assumed rate of return did not show any
statistical significance, 10-Year Sharpe ratios suggest that larger pension plans had better risk-adjusted
returns as compared to smaller pension plans during the period. Additionally, the differences between
investment and administrative fees were significant.
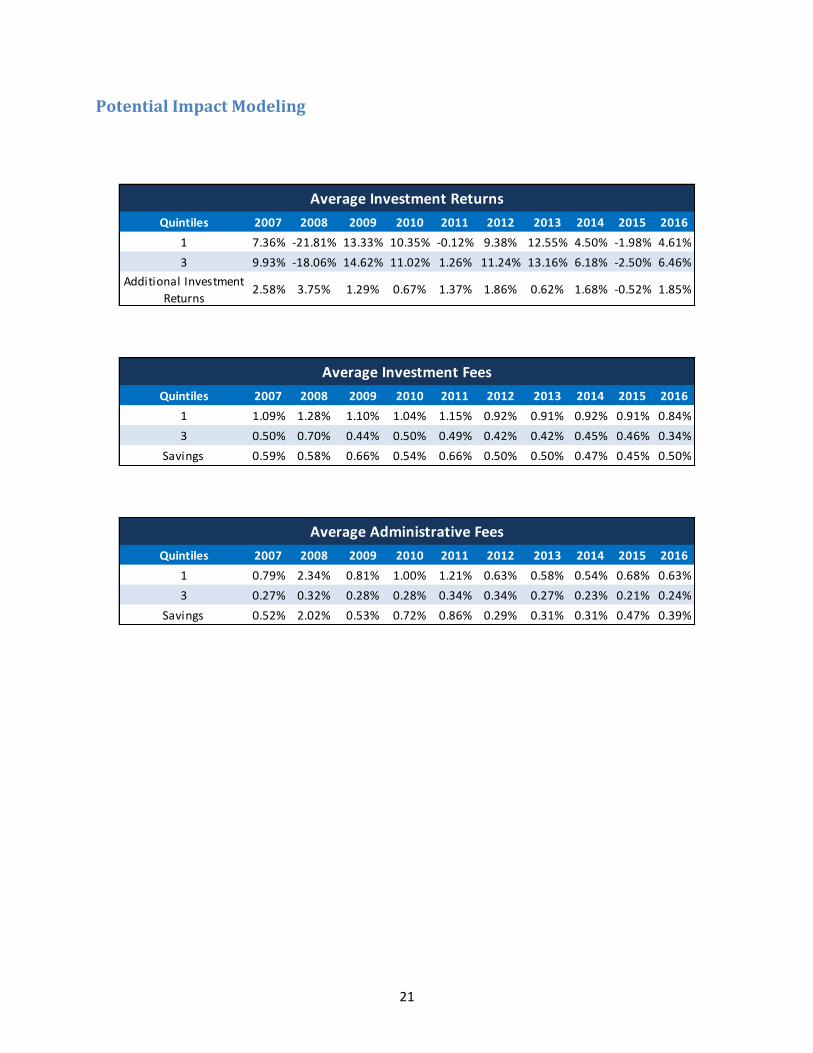
21
Potential Impact Modeling
Quintiles 2007 2008 2009 2010 2011 2012 2013 2014 2015 2016
1 7.36% -21.81% 13.33% 10.35% -0.12% 9.38% 12.55% 4.50% -1.98% 4.61%
3 9.93% -18.06% 14.62% 11.02% 1.26% 11.24% 13.16% 6.18% -2.50% 6.46%
Additional Investment
Returns2.58% 3.75% 1.29% 0.67% 1.37% 1.86% 0.62% 1.68% -0.52% 1.85%
Average Investment Returns
Quintiles 2007 2008 2009 2010 2011 2012 2013 2014 2015 2016
1 1.09% 1.28% 1.10% 1.04% 1.15% 0.92% 0.91% 0.92% 0.91% 0.84%
3 0.50% 0.70% 0.44% 0.50% 0.49% 0.42% 0.42% 0.45% 0.46% 0.34%
Savings 0.59% 0.58% 0.66% 0.54% 0.66% 0.50% 0.50% 0.47% 0.45% 0.50%
Average Investment Fees
Quintiles 2007 2008 2009 2010 2011 2012 2013 2014 2015 2016
1 0.79% 2.34% 0.81% 1.00% 1.21% 0.63% 0.58% 0.54% 0.68% 0.63%
3 0.27% 0.32% 0.28% 0.28% 0.34% 0.34% 0.27% 0.23% 0.21% 0.24%
Savings 0.52% 2.02% 0.53% 0.72% 0.86% 0.29% 0.31% 0.31% 0.47% 0.39%
Average Administrative Fees

Texas Pension Review Board
2017-2018 Biennial Report
X
APPENDIX C1 – PRB PENSION FUNDING GUIDELINES
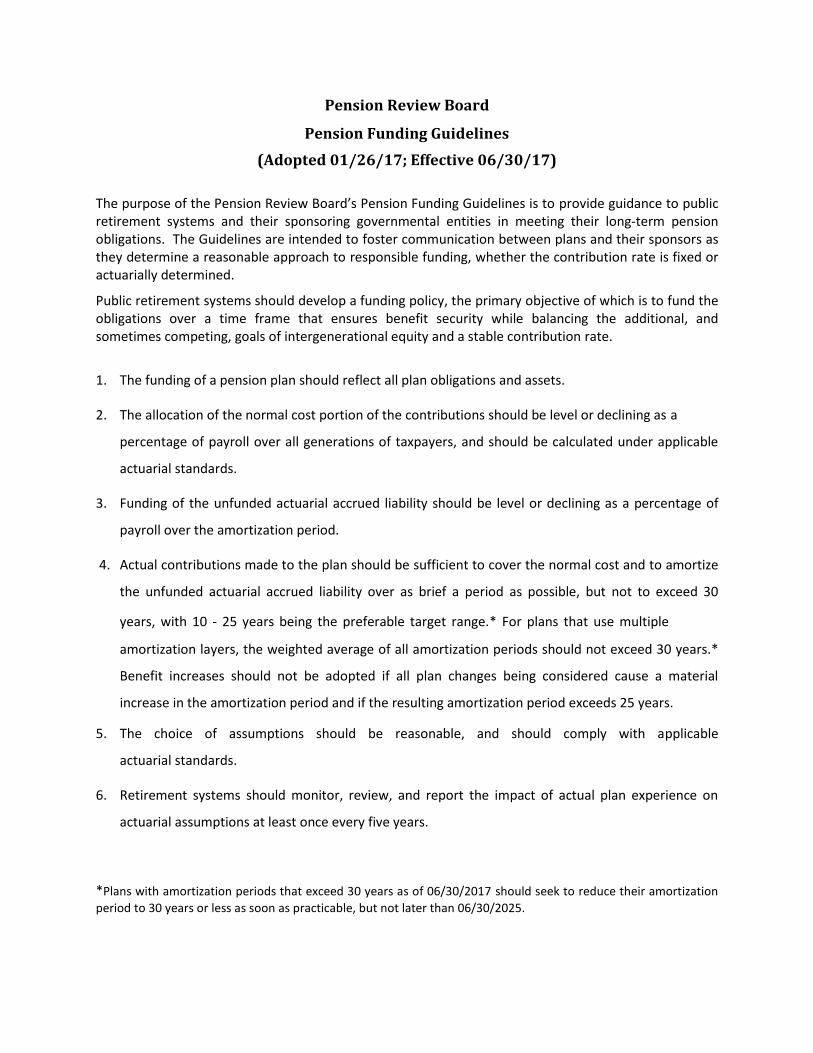
Pension Review Board
Pension Funding Guidelines
(Adopted 01/26/17; Effective 06/30/17)
The purpose of the Pension Review Board’s Pension Funding Guidelines is to provide guidance to public retirement systems and their sponsoring governmental entities in meeting their long-term pension obligations. The Guidelines are intended to foster communication between plans and their sponsors as they determine a reasonable approach to responsible funding, whether the contribution rate is fixed or actuarially determined.
Public retirement systems should develop a funding policy, the primary objective of which is to fund the obligations over a time frame that ensures benefit security while balancing the additional, and sometimes competing, goals of intergenerational equity and a stable contribution rate.
1. The funding of a pension plan should reflect all plan obligations and assets.
2. The allocation of the normal cost portion of the contributions should be level or declining as a
percentage of payroll over all generations of taxpayers, and should be calculated under applicable
actuarial standards.
3. Funding of the unfunded actuarial accrued liability should be level or declining as a percentage of
payroll over the amortization period.
4. Actual contributions made to the plan should be sufficient to cover the normal cost and to amortize
the unfunded actuarial accrued liability over as brief a period as possible, but not to exceed 30
years, with 10 - 25 years being the preferable target range.* For plans that use multiple
amortization layers, the weighted average of all amortization periods should not exceed 30 years.*
Benefit increases should not be adopted if all plan changes being considered cause a material
increase in the amortization period and if the resulting amortization period exceeds 25 years.
5. The choice of assumptions should be reasonable, and should comply with applicable
actuarial standards.
6. Retirement systems should monitor, review, and report the impact of actual plan experience on
actuarial assumptions at least once every five years.
*Plans with amortization periods that exceed 30 years as of 06/30/2017 should seek to reduce their amortization
period to 30 years or less as soon as practicable, but not later than 06/30/2025.

Texas Pension Review Board
2017-2018 Biennial Report
XI
APPENDIX C2 – PRB PRINCIPLES FOR RETIREMENT PLAN DESIGN

1
PRB Principles of Retirement Plan Design
(Adopted June 14, 2018)
The Pension Review Board (PRB) recognizes that offering a sustainable, secure retirement benefit is vital
to achieving the objectives of multiple public-sector stakeholders including employers, employees,
retirees, beneficiaries, and taxpayers, and that benefits should be protected through sound plan design
and adequate funding. Therefore, the PRB intends for these Principles to guide and inform public
retirement systems and their associated governmental entities on how to structure retirement plans.
Because:
• state and local government is a major employer in Texas;
• the state and its many political subdivisions–counties, cities, school districts, special districts, and
others–rely on employees to deliver essential public services, including teaching at public schools;
protecting public health and safety; planning, building, and maintaining transportation, utility and
other infrastructure, parks and recreational facilities; protecting vulnerable individuals, including
children, the elderly, and those with developmental disabilities; and protecting the state’s natural
resources;
• employee compensation is a vital component in the ability of the state and its political subdivisions
to attract qualified workers to perform public services and to keep those workers employed as long
as they continue to add value to their employer and to the public;
• a retirement benefit is a critical element of employee compensation, serving as an important tool in
the ability of employers to recruit and retain qualified and experienced employees; and
• the design and prudent financial management of the retirement benefit provided to public
employees can significantly affect the ability of employers to attract and retain employees and
maintain budgetary stability while providing essential public services;
The PRB supports the following Principles of Retirement Plan Design for public retirement systems in
Texas:
1. Public employers should offer a retirement benefit, and participation in the employer-sponsored
primary retirement plan should be mandatory.
2. Contributions to retirement plans should be consistent with the PRB Pension Funding Guidelines.
3. Employers and employees should share the cost of the benefit.
4. Retirement plan vesting should occur over a short period, preferably five years or less.
5. Benefits should be designed to place employees on the path to financial security in retirement in
consideration of participation or nonparticipation in Social Security.
6. A primary retirement plan should require annuitization of a substantial portion of retirement benefits.
7. In the absence of an immediate and heavy financial need, a retirement benefit should be used only
for retirement.

PRB Principles of Retirement Plan Design
2
8. Retirement benefits should be protected against the erosion of the benefit’s value due to inflation;
such benefits should not exceed actual inflation and should be funded in accordance with the Pension
Review Board's Pension Funding Guidelines.
9. Employers should provide death and disability benefits.
10. Employers are encouraged to offer plans that are supplemental to the primary retirement plan.
11. Retirement plan governance should represent the interests of all stakeholders, respect fiduciary
standards, and be transparent and publicly accountable.
12. Retirement plan assets should be pooled and professionally invested according to prudent investor
standards, giving careful consideration to cost.

Texas Pension Review Board
2017-2018 Biennial Report
XIV
APPENDIX D1 – FSRP STATUS REPORT

1
Systems Immediately Subject to and At Risk of FSRP Formulation Requirement
The FSRP requirement is triggered for retirement systems that have had amortization periods over 40 years for three consecutive annual actuarial valuations, or two consecutive actuarial valuations if the systems conduct the valuations every two or three years.
The at-risk systems' most recent actuarial valuation shows an amortization period that exceeds 40 years but does not yet trigger the FSRP requirement.
Systems Immediately Subject to FSRP Formulation Requirement
Plan Name Am
Period Date of AV Am
Period Date of AV Am
Period Date of AV FSRP
Due Date
Fort Worth Employees' Retirement Fund 72.5 12/31/2015 Infinite 12/31/2016 Infinite 12/31/2017 1/15/20171
University Park Firemen’s Relief & Retirement Fund – REVISED FSRP
2
81.3 12/31/2012 53.7 1/1/2015 Infinite 12/31/2016 10/22/2018
Harlingen Firemen’s Relief & Retirement Fund – REVISED FSRP
2
66.6 12/31/2013 Infinite 12/31/2015 59.1 9/30/2017 10/29/20183
Wichita Falls Firemen's Relief & Retirement Fund – REVISED FSRP
2
43.7 1/1/2016 49.4 1/1/2017 Infinite 1/1/2018 2/10/2019
Irving Firemen's Relief & Retirement Fund – REVISED FSRP
2
63.44 1/1/2014 46.5 12/31/2015 Infinite 12/31/2017 4/17/2019
Systems at Risk of FSRP- Not Yet Subject to FSRP Requirement
Amarillo Firemen’s Relief & Retirement Fund 28.8 1/1/2014 34.5 12/31/2015 43.5 12/31/2017 N/A
Beaumont Firemen's Relief & Retirement Fund 49.6 12/31/2012 39.1 12/31/2014 104.0 12/31/2016 N/A
Cleburne Firemen’s Relief & Retirement Fund 34.1 12/31/2012 27.3 12/31/2014 49.6 12/31/2016 N/A
Longview Firemen's Relief & Retirement Fund 37.9 12/31/2015 50.7 12/31/2016 40.2 12/31/2017 N/A
McAllen Firemen's Relief & Retirement Fund 43.9 9/30/2012 29.0 10/1/2014 41.4 10/1/2016 N/A
Paris Firefighters' Relief & Retirement Fund 29.2 1/1/2013 26.1 12/31/2014 41.9 12/31/2016 N/A
1 The City and the Fund are currently considering proposed changes to address the funding shortfall and achieve compliance with the FSRP requirement.
2 Texas Government Code Section 802.2015(d) requires plans to formulate a revised FSRP if the system conducts an actuarial valuation showing that the system's amortization
period exceeds 40 years, and the previously formulated FSRP has not been adhered to. 3 The PRB has been informed that the Fund and City are working on developing a revised FSRP and are expected to provide an update in January of 2019.
4 The amortization period was calculated by the PRB in consultation with the plan actuary.

2
Progress Report on Previously Submitted FSRPs
The following plans have previously formulated an FSRP. The table below outlines their progress towards the FSRP requirement.
Systems Still Working Towards Meeting the 40-Year Amortization Period Requirement
Plan Name
FSRP Trigger Current Progress1
Goal Year2
Update Required3
Am Period Date
Am Period Date
Midland Firemen’s Relief & Retirement Fund 59.1 1/1/2014 44.7 12/31/2015 2026 1/2019
Dallas Employees’ Retirement Fund Infinite 12/31/2015 47.0 12/31/2017 2026 7/2019
Dallas Police & Fire Pension System - Combined Plan 44.0 1/1/2017 N/A N/A 2027 9/2019
Galveston Employees' Retirement Plan for Police 55.1 1/1/2014 48.7 1/1/2017 2026 12/2019
Greenville Firemen's Relief & Retirement Fund – REVISED FSRP 55.0 12/31/2016 38.04
12/31/2016 2026 1/2020
Orange Firemen's Relief & Retirement Fund – REVISED FSRP 69.3 1/1/2017 47.0 1/1/2017 2026 2/2020
Marshall Firemen’s Relief & Retirement Fund 56.4 12/31/2016 46.55 12/31/2016 2026 3/2020
Odessa Firemen's Relief & Retirement Fund Infinite 1/1/2016 47.1 1/1/2018 2026 4/2020
Galveston Firefighter's Relief & Retirement Fund – REVISED FSRP
Infinite 12/31/2016 25.34 12/31/2016 2026 5/2020
1 Based on the most recent valuation or FSRP.
2 The year in which a plan must reach an amortization period of 40 years or less.
3 Reflects the statutory 2-year FSRP progress update requirement. The PRB considers a Fund’s most recent actuarial valuation or revised FSRP as an update that fulfills the
requirement. 4
The amortization period reflects estimates of actions that occurred after the valuation date. Plans will be removed from the list if a subsequent valuation reflects an amortization period of 40 years or less. 5 This calculation does not consider recent assumption changes that may increase the amortization period to be reported in the next actuarial valuation.

3
Progress Report on Previously Submitted FSRPs (continued)
The following plans have previously formulated an FSRP. The table below outlines their progress towards the FSRP requirement.
Systems No Longer Subject to FSRP Formulation Requirement
Systems that Have Submitted Post-FSRP Actuarial Valuations Showing Amortization Period Below 40 Years
Plan Name
FSRP Trigger Current Progress1
Goal Year2
Update Required
Am Period Date
Am Period Date
Lufkin Firemen’s Relief and Retirement Fund 40.6 12/31/2014 33.13 12/31/2016 2026 N/A
Sweetwater Firemen’s Relief and Retirement Fund 58.8 12/31/2014 27.5 12/31/2016 2026 N/A
1 Based on the most recent valuation.
2 The year in which a plan is expected to reach an amortization period of 40 years or less.
3 This valuation reflects a 10-year reduction in the amortization period associated with a change in actuarial consulting firms. The new actuary and the PRB were unable to determine the reason for the reduction without more detailed information and discussion with the prior actuarial firm.

Texas Pension Review Board
2017-2018 Biennial Report
XIII
APPENDIX D2 – SUMMARY OF FUNDING SOUNDNESS
RESTORATION PLANS SUBMITTED DURING 2017-2018 BIENNIUM

Summary of FSRPs Submitted During 2017-2018 Biennium
Changes
Employee
Contributions
Employer
Contributions Other Comments
Dallas Employees’ Retirement Fund 12/31/2015 Infinite N/A N/A For members hired after 12/31/2016:
- Decreased normal retirement benefit multiplier, increased
retirement age & increased final average salary period
- Increased age/service needed early retirement eligibility (Rule
of 80 with full actuarial reduction)
- Removed unreduced pension benefit under a joint and one-
half survivor option
- Removed $125 monthly health supplement
- COLA is capped at a maximum of 3%
The system sent the PRB an AV with projections based on
the changes made through city referendum.
Dallas Police & Fire Pension System -
Combined Plan
1/1/2016 Infinite Old: 8.50%
New: 13.50%
Old: 27.50%
New: 34.50% +
$13 million
annually with a
floor until 2024
- Ended DROP interest & COLA credit, instated maximum DROP
period of 10 years, & annuitized DROP balances as of 9/1/2017
- Decreased normal retirement benefit multiplier, increased
retirement age & increased final average salary period for
service after 9/1/2017
- Increased age of early retirement & decreased benefit
multiplier for service after 9/1/2017
- Ended supplemental retirement benefit for retirees not
receiving it before 9/1/2017
- Decreased vesting period of members hired on or after
3/1/2011
- Decreased maximum benefit from 96% to 90% of
computational pay for members hired before 3/1/2011
- Suspended COLA until plan is at least 70% funded
All changes listed are from H.B. 3158 signed by the
Governor on May 31, 2017.
The bill went into effect on September 1, 2017.
Galveston Firefighter's Relief &
Retirement Fund - REVISED FSRP2
12/31/2016 Infinite Old: 16.00%
New:
3/1/18: 17.00%
10/1/18: 18.00%
Old: 14.00%
New: 17.00% + $1
million one-time
lump sum
Discontinued automatic COLA for firefighters not yet retired;
effective March 1, 2018.
Greenville Firemen's Relief &
Retirement Fund - REVISED FSRP2
12/31/2016 55.0 N/A Old: 17.30%
New: 19.30%
N/A The City provided a letter with analysis from its actuary to
show the impact of the increase in city contributions.
Marshall Firemen's Relief &
Retirement Fund3
12/31/2016 56.4 N/A Old: 19.05%
New: 19.80%
For members hired after 12/31/2018:
- Increased retirement age from 50 to 53
- Increased vesting period from 10 to 20 years
The City’s contribution rate increase is assumed to be
effective 1/1/2019, but has not yet been approved. The
FSRP also assumes city contributions will be made as of
12/31/2018 for unfilled vacancies that existed throughout
the year.
Orange Firemen's Relief &
Retirement Fund - REVISED FSRP2
1/1/2017 69.3 Old: 12.00%
New: 12.50%
Old: 14.00%
New: 14.50%
N/A In addition to the FSRP employee contribution increase, the
FSRP's amortization period calculation recognized the 2017
actual return of 17.88%.
1 Actuarial valuation that triggered the funding soundness restoration plan requirement.
AV Effective
Date1Amortization
PeriodRetirement System
2 Texas Government Code Section 802.2015(d) requires plans to formulate a revised FSRP if the system conducts an actuarial valuation showing that the system's amortization period exceeds 40 years, and the previously formulated FSRP has not been
adhered to.3 The FSRP does not consider already approved assumption changes that will likely result in the plan being out of compliance with the FSRP when the plan completes its December 31, 2018 actuarial valuation. The PRB has recommended that the system
and sponsoring governmental entity consider taking potential corrective actions now, rather than waiting for the results of the upcoming valuation.

Texas Pension Review Board
2017-2018 Biennial Report
XII
APPENDIX D3 – FSRP FLOW CHART
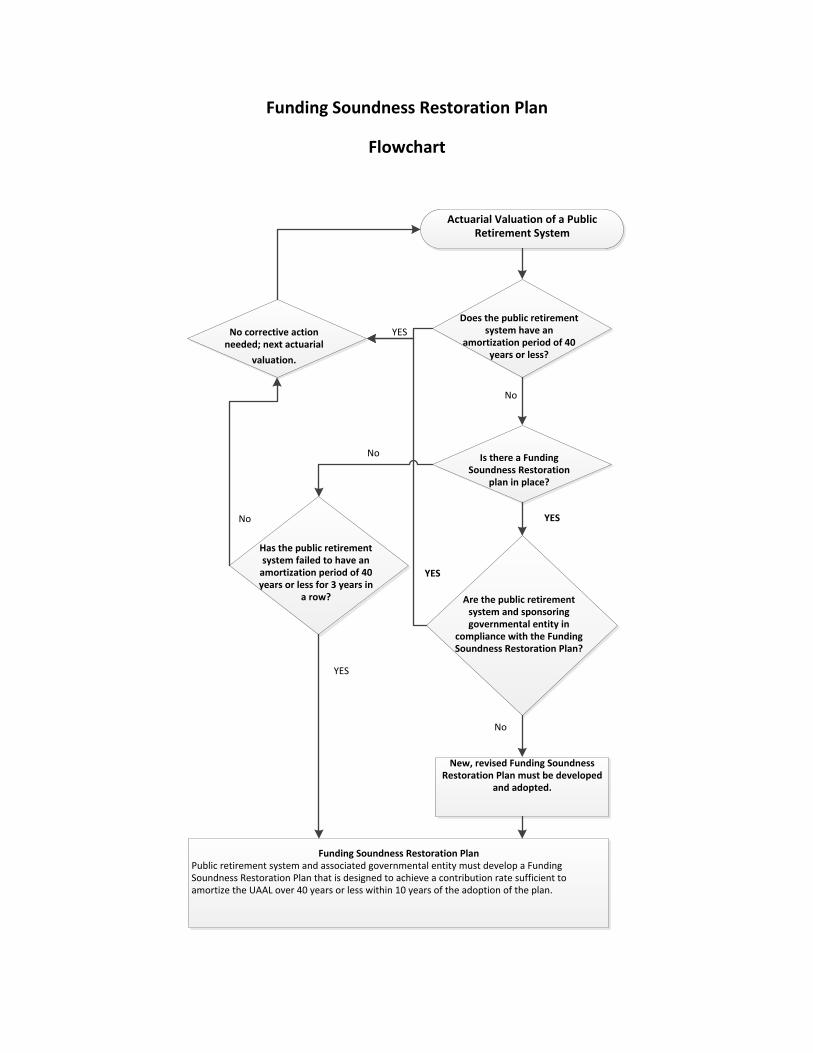
Funding Soundness Restoration Plan
Flowchart
Actuarial Valuation of a Public Retirement System
Does the public retirement system have an
amortization period of 40 years or less?
No
YES
Is there a Funding Soundness Restoration
plan in place?
No corrective action needed; next actuarial
valuation.
Has the public retirement system failed to have an
amortization period of 40 years or less for 3 years in
a row? Are the public retirement system and sponsoring governmental entity in
compliance with the Funding Soundness Restoration Plan?
No
YESNo
New, revised Funding Soundness Restoration Plan must be developed
and adopted.
YES
YES
Funding Soundness Restoration PlanPublic retirement system and associated governmental entity must develop a Funding Soundness Restoration Plan that is designed to achieve a contribution rate sufficient to amortize the UAAL over 40 years or less within 10 years of the adoption of the plan.
No

Texas Pension Review Board
2017-2018 Biennial Report
XV
APPENDIX E1 – MET ACCREDITED SPONSOR LIST

1
PRB Minimum Educational Training Program Accredited Sponsors
Alternative Investments Forum (AIF) (CE Only)
www.aifglobal.org
The “Callan College” (CE Only) www.callan.com/callan-college-intro/
Cantor Fitzgerald (CE Only) www.cantor.com
CFA Societies of Texas (CE Only)
www.cfasociety.org/texas/Pages/default.aspx
Chartered Alternative Investment Analyst (CAIA) Association (CE Only)
https://fundamentals.caia.org/#/login
City of Austin Employees’ Retirement System (Core & CE) www.coaers.org
Dallas Police & Fire Pension System (Core & CE)
www.dpfp.org
El Paso City Employees’ Pension Fund (Core & CE) www.eppension.org
Employees Retirement System of Texas (CE Only) www.ers.state.tx.us
Fort Worth Employees’ Retirement Fund (CE Only) www.fwretirement.org

2
National Conference of Public Employee Retirement Systems (NCPERS) (CE Only) www.ncpers.org
Pension Review Board (Core & CE) www.softchalkcloud.com/lesson/serve/Ud8eHX7nOQpv5Y/html
Robbins Geller Rudman & Dowd LLP (CE Only)
www.rgrdlaw.com
Teacher Retirement System of Texas (CE Only) www.trs.state.tx.us
Texas Association of Public Employees Retirement Systems (TEXpers) (Core & CE) www.texpers.org
Texas County and District Retirement System (Core & CE) www.tcdrs.org
Texas Local Fire Fighters Retirement Act (TLFFRA) Educational Foundation (Core & CE) www.tlffra.org
Texas Municipal Retirement System (Core & CE) www.tmrs.org
Texas Pension Review Board
2017-2018 Biennial Report
XVI
APPENDIX E2 – PUBLIC RETIREMENT SYSTEM COMPLIANCE WITH
MINIMUM EDUCATIONAL TRAINING REQUIREMENTS

Public Retirement System Compliance With Minimum Educational Training Requirements
Texas Pension Review Board
Abilene Firemen's Relief & Retirement Fund 100% Compliant
Name Trustee Type Compliance
Baker Bryant Active Compliant
Weldon Hurt Mayor Designee Compliant
Will McBride Active Compliant
Mike Rains CFO Compliant
Jack Rich Citizen Compliant
Mike Whalen Citizen Compliant
System Administrator: Rodney Goodman Compliant
Amarillo Firemen's Relief & Retirement Fund 100% Compliant
Name Trustee Type Compliance
Michelle Bonner CFO Compliant
Dean Frigo Citizen Compliant
Brandon Mason Active CompliantJoseph Peterson Mayor Designee In Progress
Tony Robinson Active Compliant
Rodney Ruthart Citizen In Progress
Arick Wray Active In Progress
System Administrator: Laura Storrs Compliant
Arlington Employees Deferred Income Plan 100% Compliant
Name Trustee Type ComplianceDon Crowson Active Compliant
Mike Finley Active Compliant
Pete Jamieson Retired Compliant
Gilbert Perales Active Compliant
Walter Pishkur Active Compliant
Lemuel Randolph Active Compliant
Kari Zika Active Compliant
System Administrator: Exempt
This report contains METcompliance information reported to the PRB for Texas public retirement
system trustees' and system administrators' most recently completed training cycle.
Compliant: has successfully completed previous training cycle
Not Compliant: has been not compliant in one or more previous training cycles
In Progress: working toward completion of first training cycle
Exempt: systems that have met the criteria for their system administrators to be exempt from MET requirements
1

Public Retirement System Compliance With Minimum Educational Training Requirements
Texas Pension Review Board
Atlanta Firemen's Relief & Retirement Fund 85.7% Compliant
Name Trustee Type Compliance
Daniel Camp Active Compliant
Ricky Draper Active Compliant
Alton Endsley Citizen Compliant
Mark Hill Active Compliant
Danica Porter CFO Not Compliant
Travis Ransom Mayor Compliant
Randy Sanders Citizen Compliant
System Administrator: Exempt
Austin Employees' Retirement System 100% Compliant
Name Trustee Type Compliance
Stephanie Beach Citizen (appointed by City Council) Compliant
Michael Benson Active Elected Member Compliant
Eyna Canales-Zarate Retired Compliant
Amy Hunter Active Compliant
Yuejiao Liu Active Compliant
Frank Merriman Citizen (appointed by City Council) Compliant
Chris Noak Active Elected Member Compliant
Leslie Pool City Council Member Compliant
Anthony Ross Sr. Retiree Elected Compliant
J. Randall Spencer Citizen Board Appointed Compliant
Ed Van Eenoo City Manager Designee Compliant
System Administrator: Chris Hanson Compliant
Austin Fire Fighters Relief & Retirement Fund 100% Compliant
Name Trustee Type Compliance
Steve Adler Mayor Compliant
Jeremy Burke Fund Member Compliant
Keith Johnson Fund Member Compliant
Dimitri Nichols Fund Member Compliant
Belinda Weaver Secretary-Treasurer In Progress
System Administrator: William Stefka Compliant
2
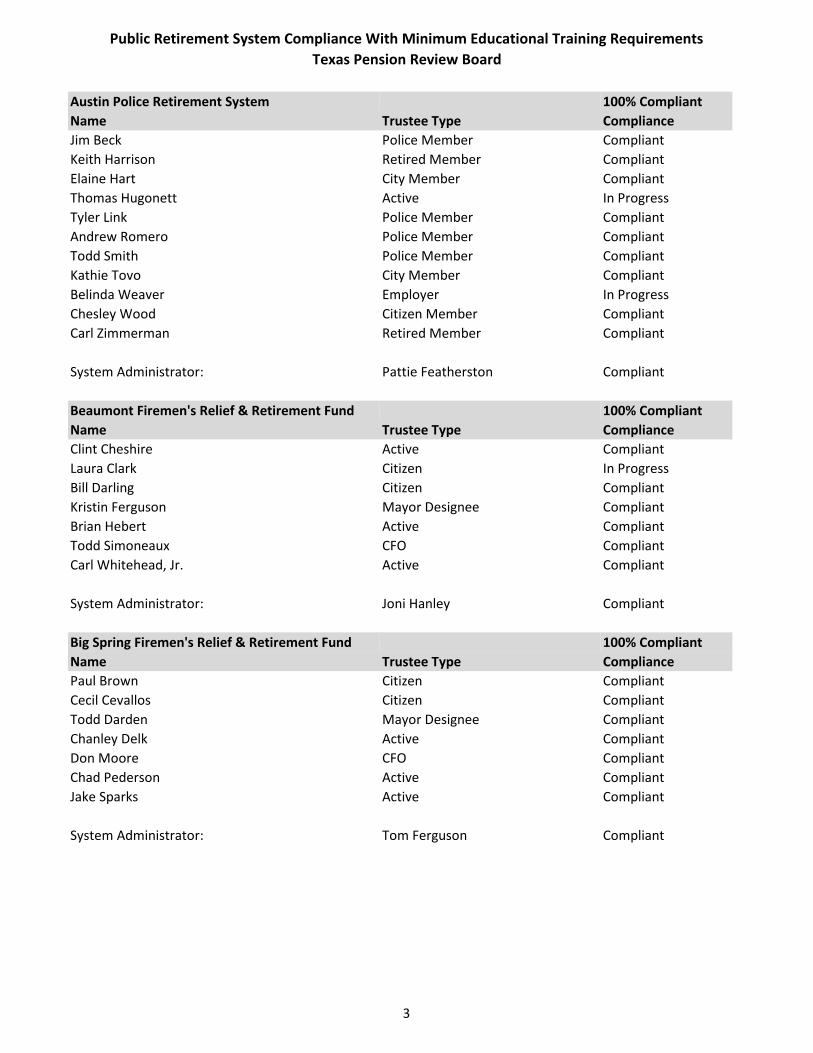
Public Retirement System Compliance With Minimum Educational Training Requirements
Texas Pension Review Board
Austin Police Retirement System 100% Compliant
Name Trustee Type Compliance
Jim Beck Police Member Compliant
Keith Harrison Retired Member Compliant
Elaine Hart City Member Compliant
Thomas Hugonett Active In Progress
Tyler Link Police Member Compliant
Andrew Romero Police Member Compliant
Todd Smith Police Member Compliant
Kathie Tovo City Member Compliant
Belinda Weaver Employer In Progress
Chesley Wood Citizen Member Compliant
Carl Zimmerman Retired Member Compliant
System Administrator: Pattie Featherston Compliant
Beaumont Firemen's Relief & Retirement Fund 100% Compliant
Name Trustee Type Compliance
Clint Cheshire Active Compliant
Laura Clark Citizen In Progress
Bill Darling Citizen Compliant
Kristin Ferguson Mayor Designee Compliant
Brian Hebert Active Compliant
Todd Simoneaux CFO Compliant
Carl Whitehead, Jr. Active Compliant
System Administrator: Joni Hanley Compliant
Big Spring Firemen's Relief & Retirement Fund 100% Compliant
Name Trustee Type Compliance
Paul Brown Citizen Compliant
Cecil Cevallos Citizen Compliant
Todd Darden Mayor Designee Compliant
Chanley Delk Active Compliant
Don Moore CFO Compliant
Chad Pederson Active Compliant
Jake Sparks Active Compliant
System Administrator: Tom Ferguson Compliant
3

Public Retirement System Compliance With Minimum Educational Training Requirements
Texas Pension Review Board
Brazos River Authority Retirement Plan 100% Compliant
Name Trustee Type Compliance
Peter Bennis BRA Board Member Compliant
Jim Forte Active Compliant
John Luton BRA Board Member Compliant
Michael McClendon Active In Progress
Jeff Tallas BRA Board Member Compliant
Ford Taylor BRA Board Member Compliant
Matt Wheelis Active Compliant
System Administrator: David Thompson Compliant
Brownwood Firemen's Relief & Retirement Fund 85.7% Compliant
Name Trustee Type Compliance
Mark Bessent Citizen Compliant
William Campbell Active Compliant
Jody Horton Active Compliant
Walter Middleton CFO Compliant
Pierre Osbourne Mayor Designee Not Compliant
Carey Stewart Citizen Compliant
Joe Stieber Active Compliant
System Administrator: Exempt
Capital MTA Retirement Plan for Administrative Employees 20% Compliant
Name Trustee Type Compliance
Gerardo Castillo Active Not Compliant
John Hodges Retired Compliant
Lea Sandoz Active Not Compliant
Donna Simmons Active Not Compliant
Elaine Timbes Active Not Compliant
System Administrator: Exempt
Capital MTA Retirement Plan for Bargaining Unit Employees 83.3% Compliant
Name Trustee Type Compliance
Kerri Butcher Sponsor - Employer Compliant
Michael "Kevin" Conlan Sponsor - Employer Compliant
Brent Payne Retiree - Bargaining Unit Compliant
Lawrence Prosser Active - Bargaining Unit Compliant
Donna Simmons Employer Not Compliant
Greg Talley Active-Bargaining Unit In Progress
System Administrator: Exempt
4

Public Retirement System Compliance With Minimum Educational Training Requirements
Texas Pension Review Board
Cleburne Firemen's Relief & Retirement Fund 100% Compliant
Name Trustee Type Compliance
John Harrell Active Compliant
Sean Herren Active In Progress
Terry Leake CFO Compliant
Steve Polasek Mayor Designee Compliant
Jake Simms Citizen Compliant
Roger Trussell Citizen Compliant
Kris Watson Active Compliant
System Administrator: Exempt
100% Compliant
Name Trustee Type Compliance
Mireya Castilaw Active Compliant
John Grant Active Compliant
Dan Hollman Employer Compliant
Jeff Knowles Employer Compliant
Karla Oliva Active Compliant
Clif Talbot Employer Compliant
John Womack Active Compliant
System Administrator: Exempt
Conroe Fire Fighters' Retirement Fund 71.4% Compliant
Name Trustee Type Compliance
Steve Cottar Active Compliant
Joe Craig Active Not Compliant
Tom Garvey Active Compliant
Russell Moss Citizen Not Compliant
Steve Williams CFO Compliant
Marcus Winberry Mayor Designee Compliant
Cary Wortham Citizen Compliant
System Administrator: Exempt
100% Compliant
Name Trustee Type Compliance
Darron Bergstrom Citizen Compliant
Michael Gilley Active Compliant
Javier Jasso Active Compliant
Laurelyn Pohlmeier Citizen Compliant
Constance Sanchez CFO Compliant
Penn Thomas Mayor Designee Compliant
Matthew Wood Active Compliant
System Administrator: Gracie Flores Compliant
Colorado River Municipal Water District Defined Benefit Retirement Plan & Trust
Corpus Christi Fire Fighters' Retirement System
5

Public Retirement System Compliance With Minimum Educational Training Requirements
Texas Pension Review Board
54.5% Compliant
Name Trustee Type Compliance
Anne Bauman Active In Progress
George Clower Citizen Not Compliant
Patricia Dominguez Active Compliant
Scott Harris Citizen Not Compliant
Dan Leyendecker Active Compliant
Glenn Martin Citizen Not Compliant
Edward Martinez Citizen Not Compliant
Tom Niskala Retired Not Compliant
Michael Reeves Citizen Compliant
Philip Skrobarczyk Active Compliant
Matthew Woolbright Active In Progress
System Administrator: Exempt
Corsicana Firemen's Relief & Retirement Fund 62.5% Compliant
Name Trustee Type Compliance
Don Denbow Mayor Not Compliant
Travis Ellington Active Not Compliant
Brandy Harrison Citizen Not Compliant
Johnny Pattison Active Compliant
Kevin Putman Active Compliant
Freddy Thomas CFO In Progress
Bobby Willingham Citizen Compliant
System Administrator: Melissa O'Sullivan Compliant
CPS Energy Pension Plan 100% Compliant
Name Trustee Type Compliance
Paul Barham Active Compliant
Linda Dzierzanowski Active Compliant
Bill Gunst Retired Compliant
Rodney Jones Active Compliant
David Jungman Active Compliant
Richard Medina Active Compliant
Paul White Active Compliant
System Administrator: Lois Emerson Compliant
Corpus Christi Regional Transportation Authority
6

Public Retirement System Compliance With Minimum Educational Training Requirements
Texas Pension Review Board
53.8% Compliant
Name Trustee Type Compliance
Bryan Fant Citizen Compliant
Paula Dobbs-Wiggins Citizen Compliant
Marvin Earle Citizen Not Compliant
Scherry Johnson Citizen Compliant
Robert Martinez Citizen Compliant
Winfred Parnell Citizen Compliant
Natalie Sorrell Citizen Not Compliant
Jeff Tillotson Citizen Compliant
Jesse Vallejo Citizen Not Compliant
Gonzalo Venegas Citizen Not Compliant
Michael Williams Citizen Not Compliant
Don O'Bannon Citizen Compliant
System Administrator: J.D. Davis Not Compliant
Dallas Employees' Retirement Fund 100% Compliant
Name Trustee Type Compliance
Randy Bowman Citizen Compliant
Carla Brewer Active Compliant
John Jenkins Active Compliant
Craig Kinton Active Compliant
Lee Kleinman Citizen Compliant
Dr. John Peavy III Citizen Compliant
Tina Richardson Active Compliant
System Administrator: Cheryl Alston Compliant
Dallas Police & Fire Pension System-Combined Plan 83.3% Compliant
Name Trustee Type Compliance
Blaine Dickens Non-Member-Elected Compliant
Samuel Friar Fire-Elected Compliant
Gilbert Garcia Non-Member-Elected Compliant
Tina Hernandez-Patterson Non-Member-Elected Compliant
Nicholas Merrick Citizen Mayor-Appointed Compliant
Ray Nixon Citizen Mayor-Appointed Compliant
William Quinn Citizen Mayor-Appointed Compliant
Fredrick Rowe Citizen Mayor-Appointed Compliant
Joseph Schutz Police-Elected Compliant
Robert Walters Citizen Mayor-Appointed Not Compliant
Kneeland Youngblood Citizen Mayor-Appointed Compliant
System Administrator: Kelly Gottschalk Compliant
Dallas County Hospital District Retirement Income Plan
7

Public Retirement System Compliance With Minimum Educational Training Requirements
Texas Pension Review Board
83.3% Compliant
Name Trustee Type Compliance
Lillie Biggins Active Compliant
Henry Borbolla III Active Not Compliant
Sam Coats Active Compliant
Bridget Lopez Active Not Compliant
William Meadows Active Compliant
Regina Montoya Active Compliant
Betsy Price Active Compliant
Curtis Ransom Active Compliant
Michael Rawlings Active Compliant
Amir Rupani Active Compliant
Bernice Washington Active Compliant
System Administrator: Michael Phemister Compliant
100% Compliant
Name Trustee Type Compliance
Larry Knott Active-Elected Compliant
David Leininger
Employer- Chairman of the Board
Appointment Compliant
Reginald Moore Active-Elected Compliant
Jesse Oliver
Employer- Appointed by the
President Compliant
William Velasco Chairman of the Board Appointee Compliant
System Administrator: Blake Horton Compliant
Denison Firemen's Relief & Retirement Fund 87.5% Compliant
Name Trustee Type Compliance
Keith Bates Active Compliant
Eric Batey Citizen Not Compliant
Seth Foltermann Active Compliant
Jared Johnson Mayor Compliant
Lee Thornton Citizen Compliant
Renee Waggoner CFO Compliant
John Weda Active Compliant
System Administrator: Raj Allada Compliant
Dallas/Fort Worth Airport Board DPS Retirement Plan
DART Employees' Defined Benefit Retirement Plan & Trust
8

Public Retirement System Compliance With Minimum Educational Training Requirements
Texas Pension Review Board
Denton Firemen's Relief & Retirement Fund 100% Compliant
Name Trustee Type Compliance
Donald Manes Active Compliant
Derek Oswald Active Compliant
Charlie Parker Citizen Compliant
Tony Puente CFO In Progress
David Reeder Active Compliant
Richard Smith Citizen Compliant
System Administrator: Gary Calmes Compliant
El Paso City Employees' Pension Fund 100% Compliant
Name Trustee Type Compliance
Nicholas Costanzo Retired Compliant
Mario Hernandez Active Employee Compliant
Cassandra Hernandez City Representative Compliant
Sam Morgan City Representative Compliant
Presi Ortega Citizen Compliant
Rene Pena Citizen Compliant
Karl Rimkus Active Participant Compliant
Robert Studer Active Compliant
Diana Nunez Active Participant Compliant
System Administrator: Robert Ash Compliant
El Paso Firemen & Policemen’s Pension Fund 100% Compliant
Name Trustee Type Compliance
Gary Borsch Citizen Compliant
Ricci Carson Active Fire Compliant
Jerry Armendariz Active Police Compliant
Leila Melendez Citizen Compliant
Presi Ortega Mayoral Appointee Compliant
John Schneider Active Police Compliant
Sean Shelton Active Police Compliant
Paul Thompson Active Fire Compliant
Robert Tollen Mayoral Appointee Compliant
Jerry Villanueva Active Fire Compliant
System Administrator: Tyler Grossman Compliant
9

Public Retirement System Compliance With Minimum Educational Training Requirements
Texas Pension Review Board
Employees Retirement System of Texas 100% Compliant
Name Trustee Type Compliance
Ilesa Daniels Elected Member Compliant
Doug Danzeiser Appointed by ERS Board Compliant
Cydney Donnell Appointed by Governor Compliant
Craig Hester Appointed by Chief Justice Compliant
Catherine Melvin Elected Member Compliant
Jeanie Wyatt Appointed by Speaker Compliant
System Administrator: Porter Wilson Compliant
Fort Worth Employees' Retirement Fund 100% Compliant
Name Trustee Type Compliance
Marsha Anderson Retired General Employee Compliant
Aaron Bovos CFO Compliant
Loriane Coleman Active Municipal Compliant
Todd Cox Active Fire Compliant
Jarod Cox Council Appointee Compliant
Kevin Foster Retired Police Compliant
Thomas Lewis Retired Fire Compliant
Steve Litke Appointed Citizen In Progress
Jesus Payan Council Appointee Compliant
Richard Van Houten Active Police Compliant
Andrea Wright Active Municipal In Progress
System Administrator: Joelle Mevi Compliant
Galveston Employees' Retirement Fund 100% Compliant
Name Trustee Type Compliance
Brandon Cook Active Compliant
Don Davison Citizen Compliant
Mike Loftin Active Compliant
Janice Norman Active Compliant
James Patterson Citizen Compliant
Robert Simmons Active In Progress
System Administrator: Jacque Vasquez Compliant
10

Public Retirement System Compliance With Minimum Educational Training Requirements
Texas Pension Review Board
100% Compliant
Name Trustee Type Compliance
Thayer Evans Citizen Compliant
Geoffrey Gainer Active Compliant
Richard Moore Citizen In Progress
Mike Loftin Council Appointment Compliant
Andre Mitchell Active Compliant
Jeff Murdock Active In Progress
Matthew Whiting Active Compliant
System Administrator: Jacque Vasquez Compliant
85.7% Compliant
Name Trustee Type Compliance
Mike Dean Mayor Designee Not Compliant
Travis Hill Active Compliant
Mike Loftin CFO Compliant
Charlie Olsen Active Compliant
John Ovalle Citizen Compliant
Gary Staudt Active Compliant
System Administrator: Rebecca Johnson Compliant
Galveston Wharves Pension Plan 40% Compliant
Name Trustee Type Compliance
Elizabeth Beeton Active Not Compliant
Richard DeVries Active Not Compliant
Jason Levy Active Not Compliant
Mark Murchison CFO Compliant
E.L."Ted" O'Rourke Active Compliant
John Perterlin Active Not Compliant
Albert Shannon Active Compliant
Peter Simons Active Compliant
Todd Sullivan Active Not Compliant
James Yarbourgh Active Not Compliant
System Administrator: Exempt
Galveston Employees' Retirement Plan for Police
Galveston Firefighter's Relief & Retirement Fund
11

Public Retirement System Compliance With Minimum Educational Training Requirements
Texas Pension Review Board
85.7% Compliant
Name Trustee Type Compliance
Bryan Ausmus Active Not Compliant
David Dreiling Mayor Compliant
Craig Himes Active Compliant
Derek Sheets Active Compliant
Greg Parsons Citizen Compliant
Summer Spurlock CFO Compliant
Howard Winans Citizen Compliant
System Administrator: Exempt
Guadalupe-Blanco River Authority 100% Compliant
Name Trustee Type Compliance
Darel Ball Active Compliant
William Carbonara Employer Compliant
Oscar Fogle Employer Compliant
Charles Hickman Active Compliant
Susan Hubbert Active Compliant
Thomas Mathews Employer Compliant
Kenneth Motl Employer Compliant
Lauren Willis Active Compliant
System Administrator: Randy Staats Compliant
100% Compliant
Name Trustee Type Compliance
Mario Alvarado Active Compliant
Michael Browning Citizen Compliant
Owen Flinn Citizen Compliant
Gabriel Gonzalez Mayor Designee Compliant
Cirilo Rodriguez Jr. Active Compliant
Juan Sauceda Active Compliant
Elvia Trevino CFO Compliant
System Administrator: Nanette Fox Compliant
Harris County Hospital District Pension Plan 75% Compliant
Name Trustee Type Compliance
Donald Butts Compliant
Anne Clutterbuck Active Compliant
Lawrence Finder Active Compliant
Elvin Franklin Jr. Retired Compliant
Kimberly Monday Active Not Compliant
Daisy Stiner Active Not Compliant
Carolyn Truesdell Retired Compliant
System Administrator: Michael Norby Compliant
Greenville Firemen's Relief & Retirement Fund
Harlingen Firemen's Relief & Retirement Fund
12

Public Retirement System Compliance With Minimum Educational Training Requirements
Texas Pension Review Board
100% Compliant
Name Trustee Type Compliance
Brett Besselman Active Compliant
Garry Blackmon, Sr Active Member Compliant
Juliet Higgins Active Member Compliant
Albertino "AL" May Citizen Member Compliant
Arif Rasheed City Treasurer Designee Compliant
Lisa Slagle Citizen Member In Progress
Stephen Whitehead Active Member Compliant
Ernest Wotring Mayor's Representative Compliant
System Administrator: Ralph Marsh Compliant
Houston MTA Non-Union Pension Plan 100% Compliant
Name Trustee Type Compliance
Sean Cagan Active Compliant
Thomas Jasien Active Compliant
Heidi Davis Citizen Compliant
Rey Reza Citizen Compliant
Debbie Sechler Active Compliant
Jason Simpson Citizen Compliant
Arthur Smiley III Active Compliant
Marcus Smith Citizen Compliant
System Administrator: Daniel Weber Compliant
Houston MTA Workers Union Pension Plan 100% Compliant
Name Trustee Type Compliance
John Bland Retired Compliant
Aurturo Jackson Employer Compliant
Horace Marves Active Compliant
Debbie Sechler Employer Compliant
System Administrator: Daniel Weber Compliant
Houston Firefighters' Relief & Retirement Fund
13

Public Retirement System Compliance With Minimum Educational Training Requirements
Texas Pension Review Board
100% Compliant
Name Trustee Type Compliance
Denise Castillo-Rhodes City Council Appointee Compliant
Barbara Chelette Board Appointee Compliant
David Donnelly Mayoral Appointee Compliant
Edward Hamb II Controller Appointee Compliant
Sherry Mose Active Compliant
Roderick Newman Retired Compliant
Asha Patnaik Active Compliant
Adrian Patterson City Council Appointee Compliant
Lenard Polk Active Compliant
Roy Sanchez Active Compliant
Lonnie Vara Retired Compliant
System Administrator: David Long Compliant
Houston Police Officers' Pension System 100% Compliant
Name Trustee Type Compliance
Terry Bratton Retired Compliant
J. Larry Doss Retired Compliant
Kelly Dowe City Treasurer Compliant
George Guerrero Active Compliant
Michael Newsome Active Compliant
Dwayne Ready Active Compliant
Don Sanders Mayor's Representative Compliant
System Administrator: John Lawson Compliant
Irving Firemen's Relief & Retirement Fund 100% Compliant
Name Trustee Type Compliance
Jason Darrow Active Compliant
Colvin Gibson Citizen Compliant
Tony Harvey Active Compliant
Micah Johnson Active Compliant
Jeff Litchfield CFO Compliant
Jill McAdams Mayor Designee Compliant
Cynthia Thatcher Citizen Compliant
System Administrator: Edith Auston Compliant
Houston Municipal Employees Pension System
14
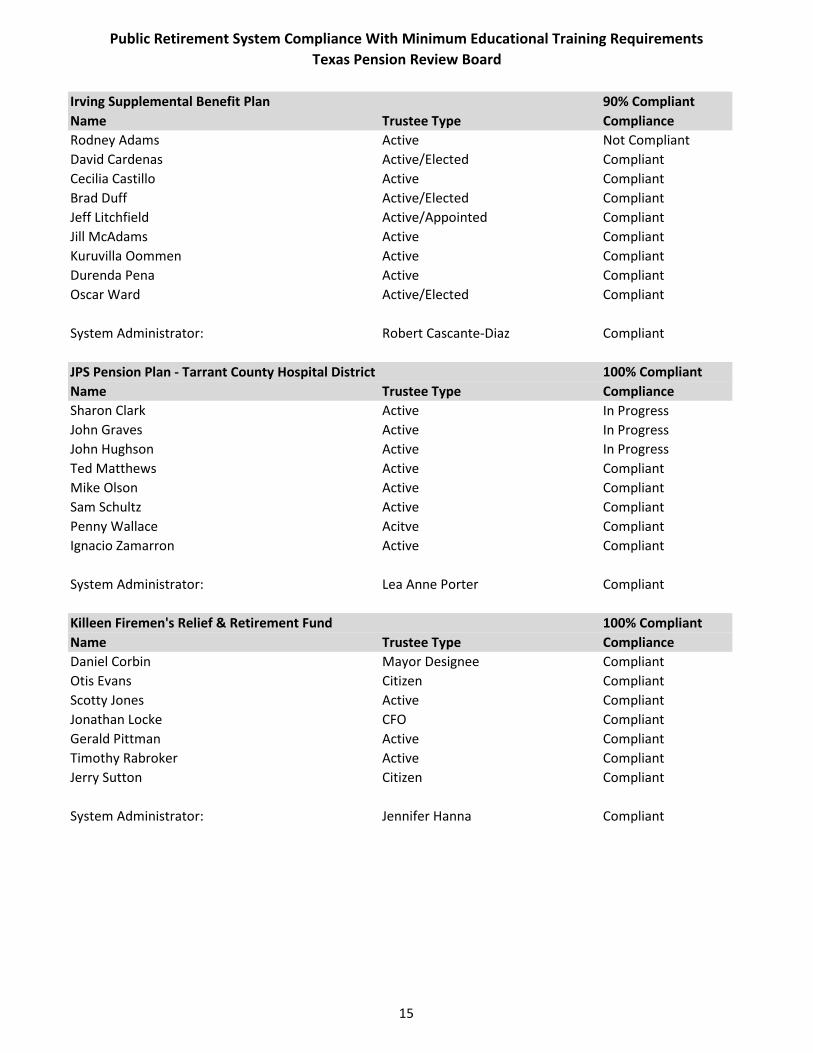
Public Retirement System Compliance With Minimum Educational Training Requirements
Texas Pension Review Board
Irving Supplemental Benefit Plan 90% Compliant
Name Trustee Type Compliance
Rodney Adams Active Not Compliant
David Cardenas Active/Elected Compliant
Cecilia Castillo Active Compliant
Brad Duff Active/Elected Compliant
Jeff Litchfield Active/Appointed Compliant
Jill McAdams Active Compliant
Kuruvilla Oommen Active Compliant
Durenda Pena Active Compliant
Oscar Ward Active/Elected Compliant
System Administrator: Robert Cascante-Diaz Compliant
JPS Pension Plan - Tarrant County Hospital District 100% Compliant
Name Trustee Type Compliance
Sharon Clark Active In Progress
John Graves Active In Progress
John Hughson Active In Progress
Ted Matthews Active Compliant
Mike Olson Active Compliant
Sam Schultz Active Compliant
Penny Wallace Acitve Compliant
Ignacio Zamarron Active Compliant
System Administrator: Lea Anne Porter Compliant
Killeen Firemen's Relief & Retirement Fund 100% Compliant
Name Trustee Type Compliance
Daniel Corbin Mayor Designee Compliant
Otis Evans Citizen Compliant
Scotty Jones Active Compliant
Jonathan Locke CFO Compliant
Gerald Pittman Active Compliant
Timothy Rabroker Active Compliant
Jerry Sutton Citizen Compliant
System Administrator: Jennifer Hanna Compliant
15

Public Retirement System Compliance With Minimum Educational Training Requirements
Texas Pension Review Board
Laredo Firefighters Retirement System 100% Compliant
Name Trustee Type Compliance
Fernando Alarcon Jr Citizen Compliant
Alberto Chapa Active Compliant
David Esparza Active Compliant
Jesus Esparza CFO Compliant
John Hourigan Active In Progress
Pete Saenz Mayor Compliant
Louis Vaillancourt Citizen Compliant
System Administrator: Jaime Jasso Compliant
Longview Firemen's Relief & Retirement Fund 100% Compliant
Name Trustee Type Compliance
Kolby Beckham Active Compliant
Angela Coen CFO Compliant
Jason Dodson Citizen Compliant
Kristen Ishihara Mayor Designee Compliant
Brian Jones Active Compliant
Maria Mills Citizen Compliant
Andy Parker Active Compliant
System Administrator: Pam Randolph Compliant
87.5% Compliant
Name Trustee Type Compliance
Raymond Gill Jr Board of Director Appointee Compliant
Charles Johnson Board of Director Appointee Compliant
Dale Jurecka Employee Representative Compliant
Stephen Kellicker Employee Representative Compliant
Steve Mailten Employee Representative Compliant
David Smith Chief Financial Officer In Progress
Jim Travis GM Executive Appointee Compliant
System Administrator: Laura Flores Not Compliant
Lubbock Fire Pension Fund 100% Compliant
Name Trustee Type Compliance
Steve Exter Mayor Designee Compliant
Kevin Ivy Active Compliant
Blu Kostelich CFO Compliant
Randy Lammons Active Compliant
Alva Littlejohn Citizen Compliant
Cory McLaurin Active In Progress
Dub Wade Citizen Compliant
System Administrator: Krista Bailey Compliant
Lower Colorado River Authority Retirement Plan
16
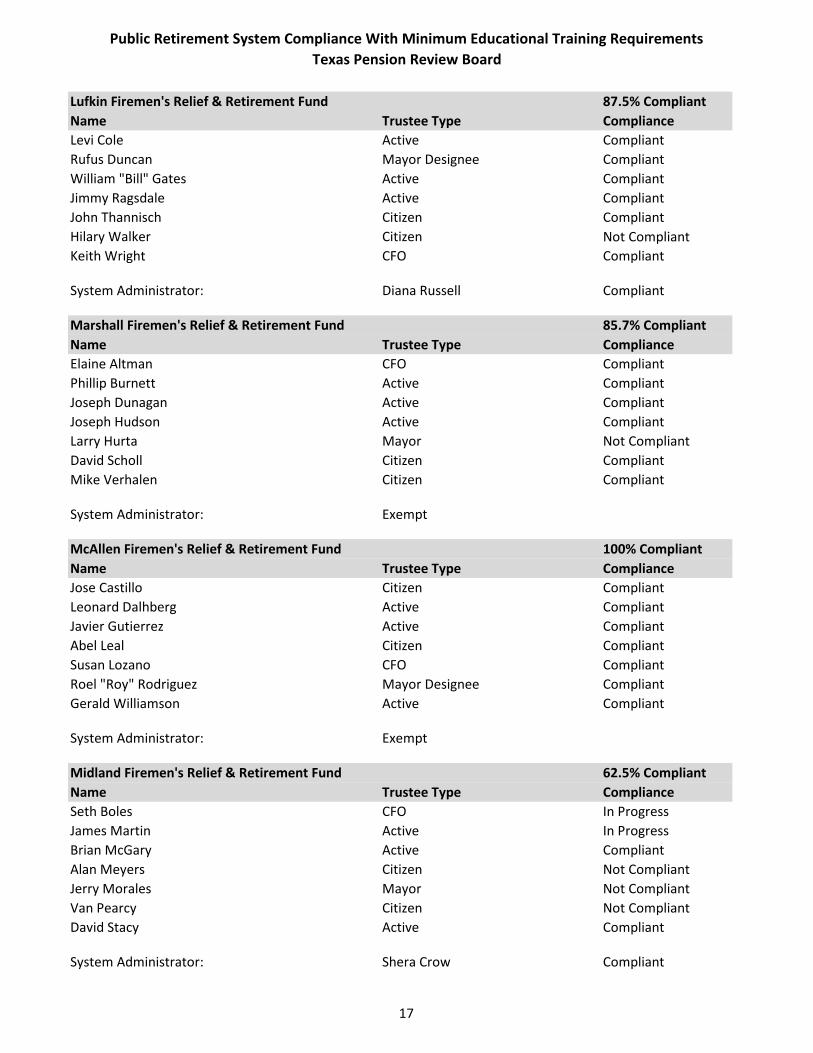
Public Retirement System Compliance With Minimum Educational Training Requirements
Texas Pension Review Board
Lufkin Firemen's Relief & Retirement Fund 87.5% Compliant
Name Trustee Type Compliance
Levi Cole Active Compliant
Rufus Duncan Mayor Designee Compliant
William "Bill" Gates Active Compliant
Jimmy Ragsdale Active Compliant
John Thannisch Citizen Compliant
Hilary Walker Citizen Not Compliant
Keith Wright CFO Compliant
System Administrator: Diana Russell Compliant
Marshall Firemen's Relief & Retirement Fund 85.7% Compliant
Name Trustee Type Compliance
Elaine Altman CFO Compliant
Phillip Burnett Active Compliant
Joseph Dunagan Active Compliant
Joseph Hudson Active Compliant
Larry Hurta Mayor Not Compliant
David Scholl Citizen Compliant
Mike Verhalen Citizen Compliant
System Administrator: Exempt
McAllen Firemen's Relief & Retirement Fund 100% Compliant
Name Trustee Type Compliance
Jose Castillo Citizen Compliant
Leonard Dalhberg Active Compliant
Javier Gutierrez Active Compliant
Abel Leal Citizen Compliant
Susan Lozano CFO Compliant
Roel "Roy" Rodriguez Mayor Designee Compliant
Gerald Williamson Active Compliant
System Administrator: Exempt
Midland Firemen's Relief & Retirement Fund 62.5% Compliant
Name Trustee Type Compliance
Seth Boles CFO In Progress
James Martin Active In Progress
Brian McGary Active Compliant
Alan Meyers Citizen Not Compliant
Jerry Morales Mayor Not Compliant
Van Pearcy Citizen Not Compliant
David Stacy Active Compliant
System Administrator: Shera Crow Compliant
17

Public Retirement System Compliance With Minimum Educational Training Requirements
Texas Pension Review Board
Nacogdoches County Hospital District Retirement
Plan No Current PRB-150 On File
100% Compliant
Name Trustee Type Compliance
Guy Sconzo Retirement Committee Compliant
System Administrator: Exempt
100% Compliant
Name Trustee Type Compliance
Mitchell Normand HR Director Compliant
System Administrator: Michelle Bonner Compliant
Odessa Firemen's Relief & Retirement Fund 100% Compliant
Name Trustee Type Compliance
Michael Gardner Mayor Designee Compliant
Terri Gayhart Employer In Progress
Travis Jones Active Compliant
James "Jay" Kirk Citizen Compliant
Ben Marts Active Compliant
Kathy McIntyre Citizen Compliant
Brad Reese Active Compliant
System Administrator: Jill Jones Compliant
Orange Firemen's Relief & Retirement Fund 87.5% Compliant
Name Trustee Type Compliance
John Bilbo Active Compliant
Jody Cowart Active Compliant
Sherry Jackson Mayor Designee Compliant
Jason Maddox Active Compliant
Kenneth Parsons Citizen Not Compliant
Walter Riedel Citizen Compliant
Cheryl Zeto CFO Compliant
System Administrator: Carol Wetherington Compliant
Northeast Medical Center Hospital Retirement Plan
Northwest Texas Healthcare System Retirement Plan
18

Public Retirement System Compliance With Minimum Educational Training Requirements
Texas Pension Review Board
Paris Firefighters' Relief & Retirement Fund 100% Compliant
Name Trustee Type Compliance
Gene Anderson CFO Compliant
Sandy Collard Mayor Designee Compliant
Kenny Dority Citizen In Progress
Jerry Horton Active In Progress
Thomas McMonigle Vice Chair In Progress
Bob Rast Chair In Progress
Casey Ressler Citizen In Progress
System Administrator: Exempt
85.7% Compliant
Name Trustee Type Compliance
Sarianne Beversdorf CFO Compliant
Wendall Dunlap Mayor Not Compliant
Michael Frizzell Active Compliant
Bobby Gipson Active Compliant
Steve Martinez Citizen Compliant
Thomas Ramirez Active Compliant
Kevin Whisenant Citizen Compliant
System Administrator: Exempt
Plano Retirement Security Plan 83.3% Compliant
Name Trustee Type Compliance
Myra Conklin Active Compliant
Bob Gehbauer Active Compliant
Karen Rhodes Active Not Compliant
Greg Rushin Active Compliant
Sean Sullivan Citizen Compliant
System Administrator: Fannie Layer Compliant
100% Compliant
Name Trustee Type Compliance
Bernard Brown Citizen Compliant
Dall Kole Active In Progress
Mercer Nessour Active Compliant
Paul Washburn Active Compliant
System Administrator: Debra Jones Compliant
Plainview Firemen's Relief & Retirement Fund
Port Arthur Firemen's Relief & Retirement Fund
19

Public Retirement System Compliance With Minimum Educational Training Requirements
Texas Pension Review Board
Port of Houston Authority Retirement Plan 100% Compliant
Name Trustee Type Compliance
Theldon Branch III Active Compliant
Dean Corgey Active Compliant
Stephen DonCarlos Active Compliant
Clyde Fitzgerald Active Compliant
John Kennedy Active Compliant
Janiece Longoria Active Compliant
Roy Mease Active Compliant
System Administrator: Ramon Yi Compliant
0% Compliant
Name Trustee Type Compliance
Sandra Ermis Active Not Compliant
System Administrator: Exempt
100% Compliant
Name Trustee Type Compliance
Ariel Chavez Active In Progress
Deborah Duke Active In Progress
Steve Fitzgibbons Active In Progress
Tony Rodriguez Active In Progress
Beatrice Rosenbaum Active In Progress
System Administrator: Donna Eymard In Progress
87.5% Compliant
Name Trustee Type Compliance
Michael Anderson Active Compliant
Steve Cecil Citizen Compliant
Tina Dierschke CFO Compliant
Brian Dunn Mayor Designee Compliant
Ana Henderson Citizen Not Compliant
Leslie Williams Active Compliant
Cory Word Active Compliant
System Administrator: Ron Partusch Compliant
San Angelo Firemen's Relief & Retirement Fund
Refugio County Memorial Hospital District Retirement Plan
Retirement Plan for Employees of Brownsville Navigation District
20

Public Retirement System Compliance With Minimum Educational Training Requirements
Texas Pension Review Board
San Antonio Fire & Police Pension Fund 100% Compliant
Name Trustee Type Compliance
James Foster Active Police Compliant
Harry Griffin Retired Police Compliant
Dean Pearson Active Fire Compliant
Clayton Perry City Council- Sponsor Compliant
Larry Reed Retired Fire Compliant
William Shaw City Council- Sponsor In Progress
Jim Smith Active Police Compliant
JT Trevino Active Fire Compliant
Reed Williams City Council, Sponsor Compliant
System Administrator: Warren Schott Compliant
91.7% Compliant
Name Trustee Type Compliance
Steve Allison Active Compliant
Hope Andrade Active Compliant
Lester Bryant Active Compliant
Rebecca Cedillo Active Compliant
Robert "Bob" Comeaux Active Compliant
Richard Gambatta Active Compliant
Steven Hussain Active Compliant
A David Marne Active Compliant
Carl "Tex" Morgan Active Compliant
Bobby Perez Active Not Compliant
Patricia Rodriguez Active Compliant
System Administrator: Cathy Schnitzer Compliant
San Benito Firemen Relief & Retirement Fund 100% Compliant
Name Trustee Type Compliance
Boris Esparza Active Compliant
Adan Gonzalez Active Compliant
Ida Martinez Citizen Compliant
Belen Pena CFO Compliant
Rafael Perez Active Compliant
Caleb Silva Citizen Compliant
System Administrator: Ana Tinsley Compliant
San Antonio Metropolitan Transit Retirement Plan
21

Public Retirement System Compliance With Minimum Educational Training Requirements
Texas Pension Review Board
87.5% Compliant
Name Trustee Type Compliance
Chris Kiser Citizen Not Compliant
Grant Madden Mayor Designee Compliant
Brad Payne Active Compliant
Preston Peacock Active Compliant
Russell Reeves Active Compliant
Gail Rose Citizen Compliant
Patty Torres CFO Compliant
System Administrator: Debra Jones Compliant
Teacher Retirement System of Texas 100% Compliant
Name Trustee Type Compliance
Joe Colonnetta Appointed by the Governor Compliant
David Corpus
Nominated by the State Board of
Education Compliant
John Elliott Appointed by the Governor Compliant
Dr. Greg Gibson Active Member Compliant
Jarvis Hollingsworth Direct Appointee Compliant
Christopher Moss
Nominated by the State Board of
Education Compliant
James Nance Retiree Compliant
Dolores Ramirez Active Public Education Position Compliant
Nanette Sissney Active Public Education Position Compliant
System Administrator: Brian Guthrie Compliant
Temple Firemen's Relief & Retirement Fund 100% Compliant
Name Trustee Type Compliance
Bryan Daniel CFO Compliant
Jason Haltom Active Compliant
Scott Hoelscher Active Compliant
Patrick Kelly Citizen Compliant
Daniel Meyer Active Compliant
Randy Ramsey Mayor Designee Compliant
Blake Stapp Citizen Compliant
System Administrator: Jake Herndon Compliant
Sweetwater Firemen's Relief & Retirement Fund
22

Public Retirement System Compliance With Minimum Educational Training Requirements
Texas Pension Review Board
100% Compliant
Name Trustee Type Compliance
David Cook Citizen Compliant
Scott Daniel Active Compliant
Paul Lauck Active Compliant
Tim Martin Active Compliant
Kristin Peeples CFO Compliant
Clay Roberts Citizen Compliant
Rick Wisdom Mayor Designee Compliant
System Administrator: Debra Jones Compliant
100% Compliant
Name Trustee Type Compliance
Matt Doyle Mayor Compliant
Jennifer Price CFO Compliant
Brian Ringleben Citizen Compliant
Jesse Rubio Active Compliant
Michael Rusnak Active Compliant
Bob Senter Citizen Compliant
Joe Tumbleson Active Compliant
System Administrator: Exempt
Texas County & District Retirement System 100% Compliant
Name Trustee Type Compliance
Chuck Cazalas Retired Compliant
Chris Davis Active Compliant
Robert Eckels Retired Compliant
Mary Garcia Active Compliant
Deborah Hunt Active Compliant
Bridget McDowell Active Compliant
Bill Metzger Active Compliant
Kristeen Roe Active Compliant
Robert "Bob" Willis Active Compliant
System Administrator: Amy Bishop Compliant
Texarkana Firemen's Relief & Retirement Fund
Texas City Firemen's Relief & Retirement Fund
23

Public Retirement System Compliance With Minimum Educational Training Requirements
Texas Pension Review Board
Texas Emergency Services Retirement System 100% Compliant
Name Trustee Type Compliance
Andrew "Taylor" Allen Investment Professional Compliant
Courtney Bechtol Investment Advisor Compliant
Dan Key Retired Compliant
Ronald Larson Secretary Compliant
Virginia "Jenny" Moore Active Compliant
Pilar Rodriguez Trustee Compliant
Don Shipman Actuary Professional Compliant
Frank Torres Active Compliant
Stephen Williams City Manager Compliant
System Administrator: Kevin Deiters Compliant
Texas Municipal Retirement System 100% Compliant
Name Trustee Type Compliance
Jesus Garza Active In Progress
Jim Jeffers Active Compliant
David Landis Active Compliant
Julie Oakley Active Compliant
Jim Parrish Active Compliant
Bill Phililbert Active Compliant
System Administrator: David Gavia Compliant
100% Compliant
Name Trustee Type Compliance
Doug Adams Active Compliant
Anthony Fasone Citizen Compliant
Jeff Johnston Active Compliant
Andrew Pitre Citizen Compliant
Erik Secrest Active Compliant
Monique Sharp Mayor Designee Compliant
Susan Welbes CFO Compliant
System Administrator: Jennifer Hanna Compliant
The Woodlands Firefighters' Retirement System
24

Public Retirement System Compliance With Minimum Educational Training Requirements
Texas Pension Review Board
75% Compliant
Name Trustee Type Compliance
Paula Barr Mayor Designee Not Compliant
Jim DeWitt CFO Compliant
Scott Falltrick Active Compliant
Brad King Active Compliant
Graham Taylor Active Not Compliant
Jeff Timlin Citizen Compliant
Rick White Citizen Compliant
System Administrator: Ana Tinsley Compliant
Tyler Firemen's Relief & Retirement Fund 100% Compliant
Name Trustee Type Compliance
Leesa Hedge Citizen Compliant
Steve Kean Mayor Designee Compliant
Darren McCawley Active Compliant
James Mullicane Active Compliant
Steve Roosth Citizen Compliant
Keidric Trimble CFO Compliant
Kenny Vent Active Compliant
System Administrator: Paula Henderson Compliant
University Health System Pension Plan 44.4% Compliant
Name Trustee Type Compliance
Robert Engberg Board of Manager Volunteer Not Compliant
Kevin Harris Citizen Not Compliant
Christopher Hurley Active Compliant
Steven Klaffke Citizen Compliant
Carlos Resendez Citizen Not Compliant
Theresa Scepanski Active Compliant
Ira Smith Board of Manager Volunteer Compliant
David Wallace Citizen Not Compliant
System Administrator: George Hernandez Jr Not Compliant
Travis County ESD #6 Firefighter's Relief & Retirement Fund
25
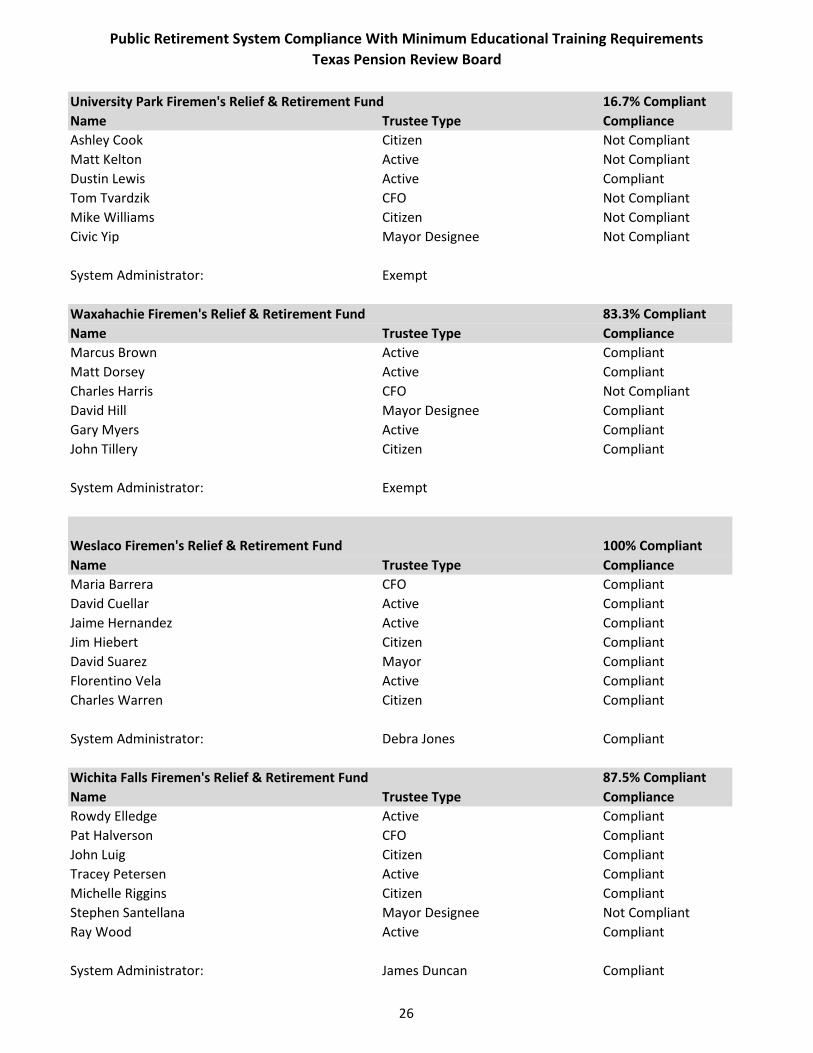
Public Retirement System Compliance With Minimum Educational Training Requirements
Texas Pension Review Board
16.7% Compliant
Name Trustee Type Compliance
Ashley Cook Citizen Not Compliant
Matt Kelton Active Not Compliant
Dustin Lewis Active Compliant
Tom Tvardzik CFO Not Compliant
Mike Williams Citizen Not Compliant
Civic Yip Mayor Designee Not Compliant
System Administrator: Exempt
83.3% Compliant
Name Trustee Type Compliance
Marcus Brown Active Compliant
Matt Dorsey Active Compliant
Charles Harris CFO Not Compliant
David Hill Mayor Designee Compliant
Gary Myers Active Compliant
John Tillery Citizen Compliant
System Administrator: Exempt
Weslaco Firemen's Relief & Retirement Fund 100% Compliant
Name Trustee Type Compliance
Maria Barrera CFO Compliant
David Cuellar Active Compliant
Jaime Hernandez Active Compliant
Jim Hiebert Citizen Compliant
David Suarez Mayor Compliant
Florentino Vela Active Compliant
Charles Warren Citizen Compliant
System Administrator: Debra Jones Compliant
87.5% Compliant
Name Trustee Type Compliance
Rowdy Elledge Active Compliant
Pat Halverson CFO Compliant
John Luig Citizen Compliant
Tracey Petersen Active Compliant
Michelle Riggins Citizen Compliant
Stephen Santellana Mayor Designee Not Compliant
Ray Wood Active Compliant
System Administrator: James Duncan Compliant
Waxahachie Firemen's Relief & Retirement Fund
Wichita Falls Firemen's Relief & Retirement Fund
University Park Firemen's Relief & Retirement Fund
26

Texas Pension Review Board
2017-2018 Biennial Report
XVII
APPENDIX F – 85TH REGULAR LEGISLATIVE SESSION REPORT

Pension Review Board August 2017
1
85th Regular Legislative Session
Pension Legislation Passed
Local Systems
Dallas Police and Fire Pension System
HB 3158 – Flynn, West
The bill was signed by the Governor on May 31, 2017. Article 1 of the bill becomes effective
September 1, 2017, unless the board of trustees of the system violates the DROP distribution
prohibitions section, then Article 1 has no effect.
HB 3158 amends and adds sections to Title 109, Revised Civil Statutes Article 6243a-1 to
increase both employee and City contributions, modify future benefit accruals, provide a
retroactive multiplier increase for certain members, modify Deferred Retirement Option Plan
(DROP) participation and cost of living adjustment, make changes to the board’s composition
and governance structure, and require the creation of an investment advisory committee.
Board Composition
The bill changes the board composition by establishing new requirements for trustee positions.
Six of the board trustees will be selected by the mayor in consultation with city council, three
will be selected by the pension system through a nominations committee, and two will be
current or former police officers or fire fighters nominated and elected by members of the
pension system under rules adopted by the board. The board may not take any action until at
least ten initial trustees have been appointed.
Board Governance
The bill clarifies that the executive director is a fiduciary of the pension system if acting in their
own discretion, whereas currently the statute states that the “administrator” of the plan is not a
fiduciary. If the executive director is acting at the discretion of the board and not exercising their
own discretion, the executive director does not owe a fiduciary duty.
Two-thirds vote: The bill requires at least a two-thirds vote of the full board (8 out of 11
trustees) for creating an alternative benefit plan, reducing the city contribution rate,
increasing the member contribution rate, lowering benefits or otherwise reducing
amounts payable to, or accrued for, the benefit of any member, or any rules requiring
the equitable return of funds paid to or credited to the benefit of a member or
pensioner.
At least twice each year, the board shall have a meeting to receive public input regarding the
pension system and to inform the public about the health and performance of the pension

Pension Review Board 85th Regular Legislative Session August 2017 Pension Legislation Passed
2
system. The PRB is entitled to all documents and other information provided by DPFPS to the
public, which would then be subject to an independent review by the PRB. Any employee or
other agent acting on behalf of DPFPS or the city must certify to the PRB that any information
provided is accurate and based on realistic assumptions.
The bill also requires the board to adopt a code of ethics, which must be filed with the PRB upon
adoption or amendment. The bill also requires the board members to take pension-related
training from a manual created by the DPFPS executive director.
City and Member Contributions
City - The bill increases City contributions from 27.5% to 34.5%. The contribution policy
for the City is a fixed percentage of pay plus a flat dollar contribution per year through
the end of 2024. However, the fixed percentage contribution will be subject to a
minimum dollar floor in each year through 2024.
Any change to the contributions required to be made to the pension system by the City
may only be made by the legislature, by a majority vote of the voters of the City, or by
written agreement with at least a 2/3 vote of all trustees on the board, and the City,
provided that a change may not increase the period required to amortize the UAAL of
the fund. Any reduction in City contributions requires the approval of at least a 2/3 vote
of all trustees of the board.
Member – The bill increases employee contributions from 8.5% to 13.5%. Any increase
in member contribution rate requires approval of at least 2/3 vote of all the trustees on
the board.
Actuarial Analysis and Legislative Recommendations
Prior to July 1, 2024, the PRB will select an actuary without conflicts to be hired by the DPFP
board to perform an analysis based on the January 1, 2024 actuarial valuation prepared by the
pension system. The analysis will include a conclusion by the actuary on whether the plan meets
the current PRB pension funding guidelines, and the actuary will recommend changes to
benefits, member or city contributions to be submitted to the board by October 1, 2024.
The DPFPS board will adopt a plan that complies with funding and amortization period
requirements applicable to the pension system under Chapter 802 of the Texas Government
Code and takes into consideration the independent actuary's recommendations.
The DPFPS board will provide a copy of the analysis and a summary of any rules adopted by the
DPFPS board under this section to the PRB. Not later than December 1, 2024, the PRB will
submit a report to the legislature regarding actions taken under this section. The report must
include a copy of the analysis prepared by the independent actuary and a summary of rules
adopted by the DPFPS board under this section. The legislature must approve the changes for
them to become part of the statute.

Pension Review Board 85th Regular Legislative Session August 2017 Pension Legislation Passed
3
Benefit Changes
The bill makes several changes to member benefits, including (for Normal Service Retirement):
Changing the multiplier for all members to 2.5% for future service;
Increasing the normal retirement age to 58 years for all members, and decreasing the
vesting requirement to 5 years from 10 years for Tier 3 members;
Lowering the maximum retirement annuity from 96% to 90% of final average salary; and
Changing the calculation of final average salary prospectively from the highest 36 month
period for Tiers 1 and 2 to highest 60 month period for service after September 1, 2017.
For a comprehensive list of changes, please see Appendix A.
Rulemaking to Change Benefits
The DPFPS board shall conduct an evaluation to study the impact on the pension system of
establishing one or more alternative benefit plans, including a defined contribution plan or a
hybrid plan for newly hired employees and for members who voluntarily elect to transfer to an
alternative benefit plan. This evaluation must be completed by January 1, 2018.
Based on the evaluation, if the DPFPS board considers adopting a rule to establish any plan, it
would be subject to the following:
may not cause the amortization period of the system to exceed 35 years; and
require the approval of 2/3 vote of all trustees on the board.
Additionally, any rule considered to increase benefits (obtained with 2/3 vote of all board
members) can only be made if the increase will not cause the amortization period of the UAAL
to exceed 25 years, after taking into account the impact of the increase. Any rules under this
section must be reviewed by the PRB and the PRB must find that the implementation of the rule
complies with the amortization periods prescribed by the specific subdivisions of the section.
Investment Advisory Committee
The bill requires the board to establish an investment advisory committee. The committee will
be composed of a majority of outside investment professionals, as well as sitting board
members. The committee will review investment-related matters and make recommendations
to the board.
Board Approval of Certain Alternative Investments
Any person with delegated authority to invest or reinvest pension system assets under this
article may not invest pension system assets in a single alternative investment unless the DPFPS
board votes to approve the investment by at least a two-thirds vote. The bill defines "alternative
investment" as an investment in an asset other than a traditional asset. The term includes an

Pension Review Board 85th Regular Legislative Session August 2017 Pension Legislation Passed
4
investment in private equity funds, private real estate transactions, hedge funds, and
infrastructure.
Equitable Adjustments to Benefits
The bill allows the DPFPS board by at least a 2/3 vote of all trustees to consider and adopt rules
requiring the equitable return of funds paid or credited to the benefit of a member or a
pensioner before 9/1/17, including the return of excessive interest credited to a member’s
DROP account and excessive adjustments made as disability or COLA benefits. The bill also
outlines the adjudication process for any judicial challenges to the equitable return of funds as
required by the board.
DROP Payment Options
A member who terminated service on or before 9/1/2017, or who terminates from active
service shall have their DROP account annuitized over their life expectancy as of the date of the
annuitization using mortality tables recommended by the system's actuary. Upon election by
the member, the account will be payable either monthly or annually.
The DPFPS board may adopt a shorter period for annuitizing DROP balances under this section if
the system's actuary determines doing so will not cause the system's amortization period to
exceed 25 years. The annuitization of an account under this section must reflect accrual of
interest on the amount in the DROP account as of 9/1/17. The interest rate applied must be a
rate as reasonably equivalent as practicable to the interest rate on a note issued by the U.S.
Department of the Treasury or other federal treasury note with a duration that is reasonably
comparable to the annuitization period applied to the account, as determined by the DPFPS
board.
Prohibition on Certain Distributions
Distributions from DROP accounts are immediately prohibited, except in certain cases including
hardships, those in compliance with court order, and minimum annual distributions under
current DPFPS board policy are allowed to continue until August 31, 2017. If any lump sums are
paid in violation of the bill prior to August 31, 2017, changes made under the legislation become
null and void.
The board of trustees shall provide data or other information requested to the PRB in order for
the PRB to determine whether DPFPS has violated the prohibition of certain distributions
provision by August 31, 2017. If the PRB determines that the system is in violation of the statute,
the PRB shall, before August 31, 2017, notify the board of trustees of the system and the mayor
and city council of its determination under this section and publish notice of its determination
on the PRB website and a notice of its determination under this section in the Texas Register.

Pension Review Board 85th Regular Legislative Session August 2017 Pension Legislation Passed
5
Alternative Benefit Plan
The bill adds Section 810.002 to the Government Code to allow the City to establish an
alternative benefit plan by ordinance and determine the benefits, funding source and amount,
and administration of the alternative benefit plan. Also, the bill allows the municipality to
require an employee first hired by the municipality on or after the date the alternative benefit
plan is implemented to participate in the alternative benefit plan instead of participating in
DPFPs. Employee and employer contributions shall be determined by the City.
An alternative benefit plan may only be established by the City if the pension system’s actuary
determines that its implementation would allow the pension system to continue to comply with
funding and amortization period requirements of Chapter 802 and if the PRB conducts a review
of and validates this determination.
Houston Systems – Houston Firefighters' Relief & Retirement Fund (HFRRF), Houston Police Officers'
Pension System (HPOPS), Houston Municipal Employees Pension System (HMEPS)
SB 2190 – Huffman/Flynn
The bill was signed by the Governor on May 31, 2017 and became effective July 1, 2017.
SB 2190 amends and adds sections to Title 109, Revised Civil Statutes Articles 6243e.2(1), 6243g-
4, and 6243h to reduce benefits, increase employee contributions, outline funding policies,
codify certain actuarial assumptions and methods for purposes of valuing benefits, and detail an
approach to making modifications to the assumptions, methods and benefits under certain
economic scenarios with the intent of minimizing the volatility of future contributions
requirements for the affected retirement systems. The bill also requires the city to make
contributions as outlined by the risk sharing sections.
Board Composition/Governance
HPOPS – The bill requires candidates for active or retired board member positions to
receive the majority vote for that position, otherwise a runoff election shall be held.
HMEPS trustees are required to complete minimum educational training requirements
established by the PRB, and the bill allows the appointing entity to remove an appointed
trustee who does not complete the required training. Also, a member may be removed
if he or she attends less than 50% of board meetings.
Benefit Changes
The bill increases employee contributions and introduces a corridor mechanism to determine
employer contributions for each fiscal year. The bill also makes substantive changes to the three
systems' benefit formulas, DROP programs, and death and disability benefits.
For more detail on benefit changes, please refer to Appendix B1-B3.

Pension Review Board 85th Regular Legislative Session August 2017 Pension Legislation Passed
6
Corridor Midpoint
The bill establishes a unique funding policy that establishes a "target" contribution rate (or
corridor midpoint) for the City, develops a minimum and maximum corridor around the City's
target contribution rate (equal to +/- 5% of the projected midpoint), and defines steps that must
be taken should the annual calculated contribution move outside this corridor. Generally, for all
three retirement systems, the retirement system and the city must jointly determine the
expected contribution requirements for the 31-year period beginning with the fiscal year
starting July 1, 2017, consisting of the expected normal cost plus a closed 30-year amortization
of the UAAL as it exists on June 30, 2016.
For HFRRF and HPOPS, the sum of the expected normal cost, amortization payment and
a provision for administrative expenses for each of the next 31 years becomes the
"target" rate or corridor midpoint.
For HMEPS, the corridor midpoint is the sum of the normal cost and a provision for
administrative expenses. The 30-year amortization schedule of the unfunded liability as
of June 30, 2016, known as the legacy liability, is established and treated separately
from the corridor for HMEPS.
Additionally, in future years, a new base would be established to amortize gains and losses. The
losses are amortized over a closed 30-year period, while the gains are amortized over the same
period as the largest outstanding liability loss base, the gain and associated loss base are treated
as a single base for any future actions.
Once the corridor is established in the initial valuation, it will not change.
For more detail on the corridor mechanism, please refer to Appendix C1 and C2.
Preparation of the Risk Sharing Valuation Study (RSVS)
The bill requires the systems' actuary and City actuary to separately prepare a draft of an RSVS,
based on the systems' respective actuarial data. The initial RSVS must use the following
assumptions set in statute to arrive at an estimated city contribution rate:
Assumed rate of return (subject to adjustment) may not exceed 7% per year;
Ultimate entry age normal actuarial cost method;
Assets marked-to-market method applied as of June 30, 2016 (after initial RSVS, this
changes to use 5-year smoothing method over a five-year period applied prospectively
beginning on the year 2017 effective date);
Closed 30-year amortization of legacy liability;
For HMEPS, the City contribution rate is calculated without inclusion of the legacy
liability
Payroll growth rate assumption of 2.75%, not to exceed 3% in future RSVS
The RSVS must be included within an actuarial valuation. Once completed, each actuary shall
exchange their draft RSVS. If the difference between the two estimated city contribution rates
Pension Review Board 85th Regular Legislative Session August 2017 Pension Legislation Passed
7
falls at or below 2%, the system's RSVS and estimated city contribution rate will be used to
determine the contribution rate for the fiscal year. If the difference is greater than 2%, the
actuaries must reconcile the rates until the difference falls below 2%. If it cannot be reconciled,
the arithmetic average will be used.
PRB Review of RSVS
The bill requires the systems and City to jointly submit a copy of the RSVS to the PRB for a
determination that the pension systems and City are in compliance with the articles. The PRB
shall notify the governor, lieutenant governor, the speaker of the house of representatives, and
the legislative committees having principal jurisdiction over legislation governing public
retirement systems if the PRB determines the system or city is not in compliance with the
applicable sections.
City Approval of POBs
The bill amends Chapter 107, Local Government Code to require voter approval for POBs issued
to fund the Houston pension systems.
Delivery of POBs
The bill allows HFRRF, HPOPS and HMEPS to rescind, prospectively, any or all benefit changes
made effective under the bill, and allow HPOPS and HMEPS to reestablish the deadline of the
delivery of the POB proceeds, if the city fails to deliver the proceeds of pension obligation bonds
before March 31, 2018. If HPOPS and HMEPS do not receive the proceeds from the POBs by
December 31, 2017, the initial RSVS shall be reprepared without assuming delivery of POB
proceeds.
Additional Reporting Requirements
The bill adds reporting requirements for the three systems, including the requirement to
conduct actuarial experience studies at least once every four years with the first experience
study for HFRRF no later than September 30, 2020, for HPOPS no later than September 30, 2022
and for HMEPS published no later than September 30, 2021.
The systems must also contract with an investment consultant to perform an audit on
investments at least once every three years.
Alternative Retirement Plans
The bill allows the three retirement systems' boards and the City to enter into a written
agreement to offer an alternative retirement plan or plans, including a cash balance retirement
plan or plans, if both parties consider it appropriate.
The bill also requires the respective boards to close the existing plan to new entrants and
establish a separate cash balance plan for new hires under the following circumstances:

Pension Review Board 85th Regular Legislative Session August 2017 Pension Legislation Passed
8
1. For HFRRF and HPOPS, if the plan's ratio of assets to liabilities falls below 65% at any
time after June 30, 2021, and
2. For HMEPS, if the plan's ratio of assets to liabilities falls below 60% at any time after
June 30, 2027.
The requirement to establish a separate cash balance plan for new hires will not take effect for
HMEPS if they do not receive the required POB proceeds. The requirement to establish a
separate cash balance plan for new hires will not take effect for HPOPS if they do not receive the
required POB proceeds.
University Park Firemen's Relief & Retirement System
HB 3056 – Meyer/Huffines
The bill was signed by the Governor on June 15, 2107, and becomes effective September 1,
2017.
The bill adds Section 31A to the Texas Local Fire Fighters Relief and Retirement Act (TLFFRA) to
allow the City of University Park to adopt ordinances that would concurrently:
a) exclude fire fighters hired on or after the "closure effective date" under the bill from
participation in the University Park Firemen's Relief and Retirement Fund, and
b) allow those excluded employees to participate in TMRS.
Current employees of the City's fire department who are members of the Retirement Fund
would continue to participate and would retire and receive benefits under the Fund.
The bill requires that within 60 days following the date the City adopts the ordinances, the
ordinances must be approved, via election, by a majority of the participating members of the
Retirement Fund. As soon as practicable following approval, the board of the Retirement Fund
must amend the plan documents and the City must provide a notice of the election results and
copies of the amended plan documents to TMRS. The "closure effective date" is the first day of
the second month after the month TMRS receives the notice.
All actions required by the bill must occur before October 1, 2018; otherwise, any ordinances
adopted by the City to enact such changes expire on October 1, 2018. The bill also amends the
definition of "Department" in the Texas Government Code Section 851.001(7) of the TMRS Act
to include employees of the City excluded from the Retirement Fund and allowed in TMRS in
accordance with the amended Section 31A of TLFFRA.
Statewide Systems
HB 89 – King, Phil/Creighton
The bill was signed by the Governor on May 2, 2017; and becomes effective September 1,
2017.

Pension Review Board 85th Regular Legislative Session August 2017 Pension Legislation Passed
9
HB 89 adds Chapter 808 to the Texas Government Code to prohibit certain state governmental
entities from investing in companies engaged in a boycott of a person or entity doing business in
Israel or in an Israeli-controlled territory. State public retirement systems that qualify under the
bill include the Employees Retirement System, Teacher Retirement System of Texas, the Texas
Municipal Retirement System, Texas County and District Retirement System, and the Texas
Emergency Services Retirement System. The provisions of the bill could potentially impact the
investment decisions made by these governmental entities, and could cause the entities to sell
certain current investment holdings.
SB 253 – Taylor, Van/Davis, Sarah
The bill was signed by the Governor and became effective May 23, 2017.
The bill transfers and consolidates the investment prohibitions and divestment provisions of
Government Code Chapters 806 and 807 into a new Chapter 2270 of the Government Code. The
bill also adds provisions to prohibit certain governmental entities defined as investing entities
under the bill from investing in companies with business ties to designated foreign terrorist
organizations. State public retirement systems that qualify under the bill include the Employees
Retirement System of Texas and the Teacher Retirement System of Texas. The provisions of the
bill could potentially impact the investment decisions made by these investing entities, and
could cause the entities to sell certain current investment holdings.
Additionally, the bill transfers the duties of the PRB to prepare, maintain, and administer the
Texas Prohibition on Investment in Iran Scrutinized Companies List to the Office of the
Comptroller. The bill repeals Chapter 807, Government Code.
SB 500 – Taylor, Van/Geren
The bill was signed by the Governor and became effective immediately June 6, 2017. The bill adds Section 810.002 of the Texas Government Code, which makes certain elected officials who are convicted of a qualified felony related to the member’s performance of public service, ineligible for retirement annuity. A qualifying felony is defined as any felony involving bribery; embezzlement, extortion, or other theft of public money; perjury; coercion of public servant or voter; tampering with governmental record; misuse of official information; conspiracy or the attempt to commit any of these crimes; or abuse of official capacity. The provisions of this bill apply to qualified offenses committed on or after the effective date of the bill.
Employees Retirement System of Texas (ERS)
SB 301 – Watson/Flynn
The bill was signed by the Governor on June 9, 2017, and becomes effective September 1,
2017.

Pension Review Board 85th Regular Legislative Session August 2017 Pension Legislation Passed
10
SB 301 is the Sunset bill for the Employees Retirement System of Texas (ERS). The legislation
focuses primarily on strengthening board oversight of alternative investments, improving
transparency of alternative investments, and ensuring the Group Benefit Program is managed
effectively to meet the needs of members and the state. The bill requires the ERS board of
trustees to approve any individual alternative investment over $100 million and allows the
board of trustees to discuss the investment in closed session or by teleconference. A vote on the
alternative investment, however, must be taken in public.
The bill also directs the agency to develop a consistent method to collect or calculate profit-
sharing data for alternative investments, which are defined in the bill as a private equity fund,
private real estate fund, hedge fund, infrastructure fund, or another asset as defined by rule by
the board of trustees. ERS will be required to conduct its experience study and adopt actuarial
assumptions once every four years, instead of its previous requirement of every five years.
The bill improves the insurance appeal process for state employees and other ERS members by
allowing members to participate more directly in the appeal process and providing a precedent
manual to help guide agency appeal decisions. In addition, the bill applies Sunset's standard
across-the-board good government recommendations and sets the next Sunset review for ERS
at 2029.
Teacher Retirement System of Texas (TRS)
SB 1663 – Huffman/Flynn
The bill was signed by the Governor June 15, 2017. Chapter 825.212, as amended by the bill,
became effective immediately. The remainder of the bill becomes effective September 1,
2017.
The bill amends the Insurance Code and various sections of the Government Code to make
clarifications and updates to the Teacher Retirement System of Texas (TRS) statute. The bill
clarifies that certain student employment is not eligible for TRS service credit. The bill also
makes administrative changes, which include the protection of key employees' personal
information from public disclosure and prohibiting TRS employees from receiving "double"
benefits while working outside the country.
The bill provides that a retiree working during the first 12 months following retirement as an
independent contractor, volunteer, or who waives compensation is considered an employee of
the public school or higher education employer. The bill also allows the TRS board to go into
executive session to discuss particular investment strategies; allows TRS to charge late fees not
to exceed $1,000 for each business day and $25,000 per reporting period if employer reports
are filed after statutory deadlines; and allows TRS to send information to members
electronically. The bill removes auxiliary personnel positions from the TRS Retiree Advisory
Committee and removes the prohibition on members who do not complete a purchase of
Pension Review Board 85th Regular Legislative Session August 2017 Pension Legislation Passed
11
service credit using an installment payment method from using the method for the next three
years.
SB 1664 – Huffman/Flynn
The bill was signed by the Governor on June 15, 2017, and becomes effective September 1,
2017.
The bill amends the Education Code and Government Code to make clarifications, updates and
corrections to the TRS statute. The bill clarifies sections in the Government Code to correctly cite
the IRS Code, and updates TRS plan terms to allow rollover by TRS to a 401(a) plan. The bill
makes statutory corrections to include the removal of a previous error that included a
requirement for school districts to provide health care comparability reports to TRS. The bill also
makes administrative changes, including granting additional time for TRS members to purchase
service credit at retirement, as well as granting members additional time for purchasing sick or
personal leave credit.
SB 1665 – Huffman/Flynn
The bill was signed by the Governor and became effective immediately on June 15, 2017.
SB 1665 amends the Government Code to include in the definition of "securities" any derivative
instrument, and any other instrument commonly used by institutional investors to manage
institutional investment portfolios.
The bill allows the board to delegate discretionary investment authority to external managers to
invest and not manage more than 30 percent of the total assets held in trust by the system.
The bill repeals the temporary provision authorizing the board to buy and sell certain
investment instruments for the purpose of efficiently managing and reducing the risk of the
overall investment portfolio. The bill also extends the exemption of a contract under certain
provisions relating to the investment of TRS assets from statutory provisions relating to the
resolution of certain contract claims against the state to all contracts under provisions relating
to the investment of TRS assets.
Optional Retirement Program (ORP)
SB 1954 – Hughes/Lozano
The bill was signed by the Governor on May 26, 2017 and becomes effective September 1,
2017.
SB 1954 amends the Government Code to allow a person more time to decide to participate in
ORP if they are notified later than the day they become eligible.

Pension Review Board 85th Regular Legislative Session August 2017 Pension Legislation Passed
12
The bill adds a section to the Government Code to establish procedures for correcting reporting
errors. The bill states that an employer submits a member contribution to TRS on behalf of a
person in error if the person previously elected to participate in the optional TRS retirement
program, participated in the program for at least one year, and is or was employed by a public
institution of higher education in a position normally covered by TRS and is or was at the time of
that employment not eligible for membership in TRS. The bill requires a person's participation in
ORP to be immediately restored if an employer commits such an error and the person on whose
behalf the member contribution is erroneously made is a participant in the optional retirement
program and requires funds to be deposited in the person's participant account in the program
or otherwise remitted to the person in accordance with the bill's provisions and as soon as
practicable.
Retirement Systems – General
SB 1735 – Hughes/Springer
The bill became effective June 12, 2017.
SB 1735 is a repeal of several pension-related statutes that no longer apply to any existing
persons, programs, or funds. The bill amends current law relating to the repeal of certain
obsolete laws governing state pensions and other similar benefits.

Pension Review Board August 11, 2017
13
Appendix A –
HB 3158
Summary of Plan Changes for DPFPS
Normal Retirement Benefit
Eligibility
Current Tier 3: Age 55 and 10 Years of Service
HB 3158 Tier 3: Age 58 and 5 Years of Service
Amount
Current Tiers 1 & 2: 3.0% x Years of Service x Final Average Salary, no more than 96% x Final
Average Salary or less than $2,200 per month (minimum is prorated for periods of
service less than 20)
Tier 3: [Years of Service (up to 20) x 2.0% +Years of Service (>20, <=25) x 2.5% +
Years of Service (>25) x 3.0%] x Final Average Salary, not less than $110 x Years of
Service (up to 20)
HB3158 Tiers 1 & 2: [3.0% x Years of Service (prior to September 1, 2017) + Percent Multiplier
(in table below) x Years of Service (after September 1, 2017)] x Final Average Salary,
max is the greater of i. 90% or ii. the vested accrued benefit as of August 31, 2017
Age at Percent
Retirement Multiplier
57 2.40%
56 2.30%
55 2.20%
54 2.10%
53 and younger 2.00%
Tier 3: Years of Service x 2.5% x Final Average Salary, max 90%
Final Average Salary
Current Tiers 1 & 2: Highest 36 month period
HB 3158 Tiers 1 & 2: Highest 36 month period for service prior to September 1, 2017 and highest
60 month period for service after September 1, 2017
Early Retirement Benefit
Eligibility
Current Tiers 1 & 2: Age 45 and 5 Years of Service or 20 Years of Service
Tier 3: N/A

Pension Review Board August 11, 2017
14
HB 3158 Tiers 1 & 2: Age 45 and 5 Years of Service, if 45 years or older as of September 1, 2017,
age 53 and 5 Years of Service otherwise, or 20 Years of Service
Tier 3: Age 53 and 5 Years of Service or 20 Years of Service
Amount
Current Tiers 1 & 2 with 20 Years of Service – replace 3% multiplier with the following based on
age at retirement:
Age at
Retirement Multiplier
48 & 49 2.75%
47 2.50%
46 2.25%
45 or younger 2.00%
Tiers 1 & 2 with less than 20 Years of Service: Reduction equal to 2/3 of 1% per month
retirement date precedes age 50.
HB 3158 Tiers 1 & 2 with 20 Years of Service accrued as of September 1, 2017 – replace 3%
multiplier with the following based on age at retirement:
Age at
Retirement Multiplier
48 & 49 2.75%
47 2.50%
46 2.25%
45 and younger 2.00%
All others with 20 Years of Service – replace 2.5% multiplier with the following based on
age at retirement:
Age at
Retirement Multiplier
57 2.40%
56 2.30%
55 2.20%
54 2.10%
53 and younger 2.00%

Pension Review Board August 11, 2017
15
With less than 20 Years of Service: Reduction equal to 2/3 of 1% per month retirement
date precedes age 45 if 45 years or older as of September 1, 2017, age 53 otherwise.
Unreduced at any retirement age if a member’s pension is equal to 90% of Final Average Salary.
Supplemental Retirement Benefit
Current The greater of $75 per month or 3% of their Normal or Early Retirement Benefit, payable
beginning at age 55
HB 3158 Payable only to those receiving the supplement as of September 1, 2017
Vesting
Current Tier 3: 10 Year Cliff
HB 3158 Tier 3: 5 Year Cliff
Cost of Living Adjustment
Current Tier 1: 4.0% simple
HB 3158 Ad-hoc, which may only be paid if the plan is at least 70% funded after taking into
account the COLA equal to a simple crediting rate on October 1 equal to 100% of the
average annual rate of actual investment return for the five-year period ending on the
preceding December 31 minus 5%, and not to exceed 4%, beginning at the earlier of age
62 or 3 years after retirement.
Deferred Retirement Option Plan
Active
Current Interest credited is 6% effective October 1, 2016 dropping to 5% effective October 1,
2017 and variable based on the plans funded ratio thereafter.
Funded Ratio Crediting Rate
>=95% 7.0%
90%-94% 6.5%
85%-89% 6.0%
65%-84% 5.0%
60%-64% 4.0%
55%-59% 3.0%
<55% 0.0%
COLA credited to account
No maximum participation period
May elect a lump sum distribution or leave up to 100% of account balance in plan at
separation of service and continue to accrue interest credit

Pension Review Board August 11, 2017
16
HB 3158 No interest credited to account
No COLA credited to account
10 year maximum participation period
DROP balance distributed over the life expectancy at separation of service,
DROP account balance as of September 1, 2017 will be annuitized using a rate on a
United States Treasury or other federal treasury note with a reasonable duration, as
determined by the Board.
Contributions
Employee
Current 8.5% for non-DROP active participants & 4.0% for DROP active participants
HB 3158 13.5% as of the effective date
Employer
Current 27.5% of total pay
HB 3158 A + B, as described below
A. 34.5% of computation pay
The employer contribution above will be no less than
i. $5,173,000 for each of the pay periods beginning in 2017;
ii. $5,344,000 for each of the pay periods beginning in 2018;
iii. $5,571,000 for each of the pay periods beginning in 2019;
iv. $5,724,000 for each of the pay periods beginning in 2020;
v. $5,882,000 for each of the pay periods beginning in 2021;
vi. $6,043,000 for each of the pay periods beginning in 2022;
vii. $5,812,000 for each of the pay periods beginning in 2023;
viii. $6,024,000 for each of the pay periods beginning in 2024; and
ix. $0 thereafter
B. 1/26th of $13 million per pay period for each pay period beginning after September 1,
2017 and before December 31, 2024
The contributions outlined above will remain in force as long as the system has a UAAL. If the plan is
fully funded, contributions would be split equally between the city and members.

Pension Review Board August 11, 2017
17
Appendix B1
SB 2190
Summary of Plan Benefit Changes for HFRRF
Employee Contributions Old 9.00%
SB 2190
10.50%
Final Average Salary Old Highest 78 pay periods of salary
SB 2190
Hired before the effective date: Highest 78 pay periods of salary, excluding overtime
for salary paid after the effective date
Hired on or after the effective date: Final 78 pay periods of salary, excluding
overtime
Retirement Benefit Eligibility
Old 20 Years of Service
SB 2190
Hired before effective date: 20 Years of Service
Hired on or after effective date: Rule of 70
Amount
Old Final Average Salary x [Years of Service (20 max) x 2.5% +Years of Service (>20) x
3.0%; 80% max]
SB 2190
Hired before effective date:
Member's accrued benefit as of the effective date + Final Average Salary x [Years of
Service after effective date (20 max) x 2.75% per year +Years of Service after
effective date (>20) x 2.0%]
Hired on or after effective date:
Final Average Salary x [Years of Service (20 max) x 2.25% + Years of Service (>20)
x 2,0%; 80% max]
Termination Benefit Old Terminate with at least 10 years of service but less than 20 years of service, choice
of:
Refund of employee contributions with 5% interest; or
Final Average Salary x 1.7% x Years of Service, payable at age 50
SB 2190
Members hired before the effective date will not receive interest on employee
contributions made after the effective date
Members hired after the effective date receive a refund of employee contributions
without interest only

Pension Review Board August 11, 2017
18
Cost of Living Adjustment (COLA) Old 3.0% compounded, beginning at age 48
SB 2190
Crediting rate of 100% of the 5 year smoothed return minus 4.75%, not less than 0%
or greater than 4%, beginning at age 55 with a 3 year freeze on COLAs for members
under 70 years of age.
Deferred Retirement Option Plan (DROP) Old Eligibility is 20 Years of Service
Interest credited is 100% of the 5 year average investment return, not less than 5.0%
or greater than 10.0%
COLA credited to account
Member contributions credited to account for 10 years
Participation limited to 13 years
Retirement annuity is increased upon exit by 2% per year of DROP participation up
to a maximum of 20%
SB 2190
Eligibility is 20 Years of Service and must be hired prior to effective date
Interest credited is 65% of the 5 year compounded average investment return, no less
than 2.5%
COLA and member contributions not credited to account after effective date
Member's unused leave pay will be contributed and credited to member's DROP
account
Participation limited to 13 years
Retirement annuity is increased upon exit by 2% per year of DROP participation up
to a maximum of 20% as long as accrued at least 20 years of service as of the
effective date
Post Retirement Option Plan (PROP) Old Up to 100% of DROP account, $5,000 Lump Sum payment, and/or a portion of
monthly annuity may be deposited and earn the same interest credit as DROP
accounts
SB 2190
No new funds may be added to PROP accounts

Pension Review Board August 11, 2017
19
Appendix B2
SB 2190
Summary of Plan Benefit Changes for HPOPS
Employee Contributions Old If sworn prior to October 9, 2004 9.00%
If sworn after October 9, 2004 10.20%
SB 2190
All 10.50%
Retirement Benefit Eligibility (if sworn after October 9, 2004)
Old Age 55 with 10 Years of Service
SB 2190
Rule of 70
Termination Benefit (if sworn after October 9, 2004)
Eligibility
Old None
SB 2190
10 Years of Service
Amount
Old None, refund of employee contributions (without interest) only
SB 2190
Monthly annuity payable at age 60 equal to Years of Service x 2.25% x Final
Average Salary or refund of employee contributions (without interest)
Cost of Living Adjustment (COLA) Old Crediting rate of 80% increase in CPI-U, not less than 2,4% or greater than 8.0%
SB 2190
Crediting rate of 100% of the 5 year smoothed return minus 5.00%, not less than 0%
or greater than 4%
Must be 70 years of age or older as of April 1 for fiscal years ending June 30, 2018,
2019 and 2020 and 55 years of age or older for fiscal years end on or after June 30,
2021
Deferred Retirement Option Plan (DROP) (if sworn prior to October 9, 2004)
Old Eligibility is 20 Years of Service
Interest credited is 100% of the 5 year average investment return, not less than 3.0%
or greater than 7.0%
COLA credited to account
8.75% of member contributions are credited to account
No maximum participation period

Pension Review Board August 11, 2017
20
Retirement annuity is recalculated upon exit as the greater of annuity credited to
DROP immediately prior to DROP exit (i.e. including COLA) or using service at
DROP entry and Final Average salary at DROP exit
SB 2190 No entry after June 30, 2027
Interest credited is 65% of the 5 year compounded average investment return, no less
than 2.5%
COLAs occurring after effective date not credited to account
Member contributions not credited to account
Participation limited to 20 years
No recalculation of annuity at DROP exit
Post Retirement Option Plan (PROP) (if sworn prior to October 9, 2004)
Old Up to 100% of DROP account, $5,000 Lump Sum payment, and/or a portion of
monthly annuity may be deposited and earn the same interest credit as DROP
accounts
SB 2190
No new funds may be added to PROP accounts

Pension Review Board August 11, 2017
21
Appendix B3
SB 2190
Summary of Plan Benefit Changes for HMEPS
Employee Contributions Old Group A: 5.00%
Group B: 0.00%
Group D: 0.00%
SB 2190
Group A: 7.00% for FYE 2018; 8.00% thereafter
Group B: 2.00% for FYE 2018; 4.00% thereafter
Group D: 3.00% (2.00% for service benefit; 1.00% for cash balance benefit)
Post-Retirement Survivor Benefit (Groups A &B)
SB 2190 Group D: Cash Balance Benefit equal to 1.00% employee contributions credited with
the DROP interest crediting rate.
Post-Retirement Survivor Benefit (Groups A &B)
Old 100% Joint & Survivor, no actuarial reduction
SB 2190 80% Joint & Survivor, no actuarial reduction
Cost of Living Adjustment (COLA) Old Group A/B: 3.0% not compounded, if hired before 2005; 2.0% not compounded, if
hired after 2004.
Group D: 0%
SB 2190
50% of the rolling 5 year net investment return minus 2.00% less than the assumed
rate of return (currently 5.00%), not less than 0.00% or greater than 2.00%
Deferred Retirement Option Plan (DROP) (Groups A & B)
Old Interest credited is 50% of the prior year investment return, not less than 2.5% or
greater than 7.5%
COLA credited to account
SB 2190 Interest credited is 50% of the rolling 5 year net investment return, not less than
2.5% or greater than 7.5%
COLA credited on or after 62 years of age

Pension Review Board August 11, 2017
22
Appendix C1
SB 2190
HFRRF – Municipal Contribution Rate When Estimated Municipal Contribution Rate Lower than Corridor Midpoint, Authorization for Certain Adjustments (Sec 13E)
If funded ratio is less than 90%
Municipal Contribution Rate = Corridor Midpoint
If funded ratio is equal to or greater than 90%
If municipal contribution rate is equal to or greater than the minimum contribution rate
Estimated contribution rate = Municipal Contribution Rate _______________________________________________________________ If municipal contribution rate is less than the minimum contribution rate for corresponding fiscal year
Municipal Contribution Rate = Minimum Contribution Rate Achieved in accordance with subsection c.
SUBSECTION c (Adjustments):
First, adjust AVA to = MVA, if making adjustment causes municipal contribution rate to increase
Second, under written agreement (not later than April 30 before the first day of the next fiscal year), reduce assumed rate of return
Third, under written agreement (not later than April 30), prospectively restore all or part of any benefit reductions or reduce increased employee contributions, in each case made after the year 2017 effective date
Fourth, accelerate the payoff year of the existing liability loss layers, including the legacy liability, by accelerating the oldest liability loss layers first, to an amortization period that is not less than 10 years from the first day of the fiscal year beginning 12 months after the date of the risk sharing valuation study in which the liability loss layer is first recognized.
If funded ratio is equal to or greater than 100%
All existing liability layers, including the legacy liability, are considered fully amortized and paid
The applicable fiscal year is the payoff year for the legacy liability
For each fiscal year subsequent, the corridor midpoint shall be determined as provided by Section 13C(g) of the article
If funded ratio is greater than 100%
In a written agreement between the municipality and the fund, the fund may reduce member contributions or increase pension benefits if, as a result of the action:
the funded ratio is not less than 100 percent, and
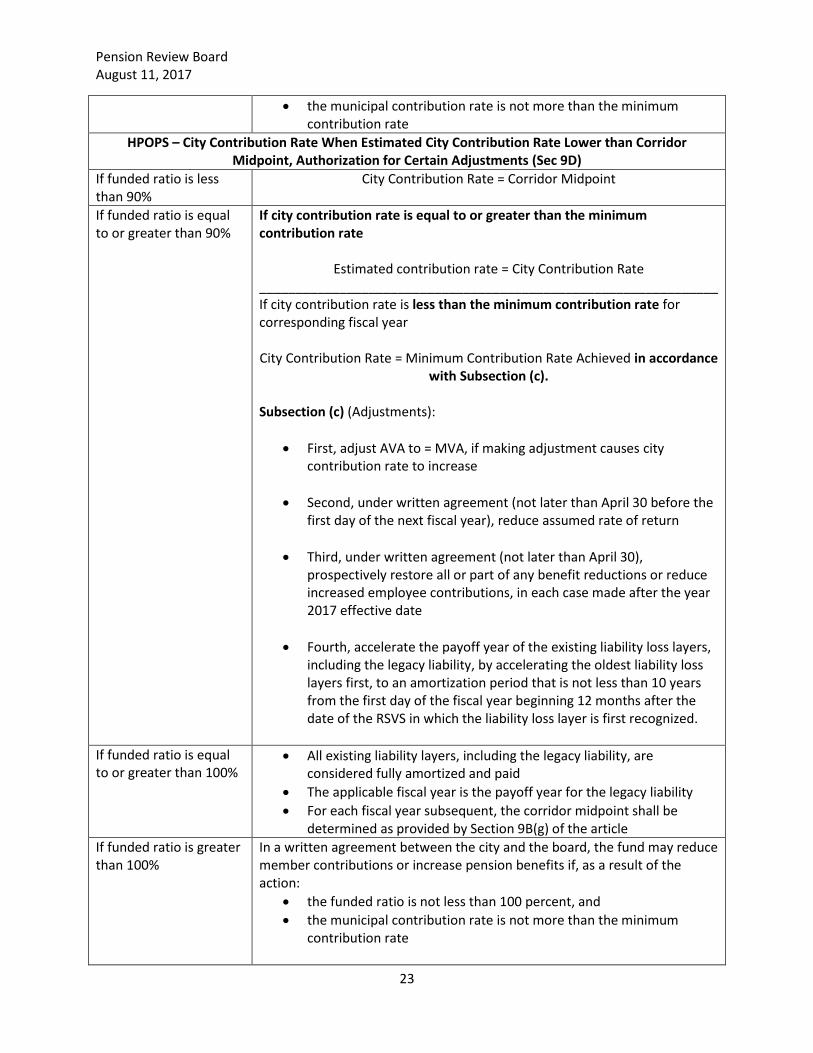
Pension Review Board August 11, 2017
23
the municipal contribution rate is not more than the minimum contribution rate
HPOPS – City Contribution Rate When Estimated City Contribution Rate Lower than Corridor Midpoint, Authorization for Certain Adjustments (Sec 9D)
If funded ratio is less than 90%
City Contribution Rate = Corridor Midpoint
If funded ratio is equal to or greater than 90%
If city contribution rate is equal to or greater than the minimum contribution rate
Estimated contribution rate = City Contribution Rate _______________________________________________________________ If city contribution rate is less than the minimum contribution rate for corresponding fiscal year City Contribution Rate = Minimum Contribution Rate Achieved in accordance
with Subsection (c). Subsection (c) (Adjustments):
First, adjust AVA to = MVA, if making adjustment causes city contribution rate to increase
Second, under written agreement (not later than April 30 before the first day of the next fiscal year), reduce assumed rate of return
Third, under written agreement (not later than April 30), prospectively restore all or part of any benefit reductions or reduce increased employee contributions, in each case made after the year 2017 effective date
Fourth, accelerate the payoff year of the existing liability loss layers, including the legacy liability, by accelerating the oldest liability loss layers first, to an amortization period that is not less than 10 years from the first day of the fiscal year beginning 12 months after the date of the RSVS in which the liability loss layer is first recognized.
If funded ratio is equal to or greater than 100%
All existing liability layers, including the legacy liability, are considered fully amortized and paid
The applicable fiscal year is the payoff year for the legacy liability
For each fiscal year subsequent, the corridor midpoint shall be determined as provided by Section 9B(g) of the article
If funded ratio is greater than 100%
In a written agreement between the city and the board, the fund may reduce member contributions or increase pension benefits if, as a result of the action:
the funded ratio is not less than 100 percent, and
the municipal contribution rate is not more than the minimum contribution rate

Pension Review Board August 11, 2017
24
HMEPS – City Contribution Rate When Estimated City Contribution Rate Lower than Corridor Midpoint, Authorization for Certain Adjustments (Sec 8E)
If funded ratio is less than 90%
City Contribution Rate = Corridor Midpoint
If funded ratio is equal to or greater than 90%
If city contribution rate is equal to or greater than the minimum contribution rate
Estimated Contribution Rate = City Contribution Rate _______________________________________________________________ If city contribution rate is less than the minimum contribution rate for corresponding fiscal year City Contribution Rate = Minimum Contribution Rate achieved in accordance with
subsection c. Subsection (c) (Adjustments):
First, adjust AVA to = MVA, if making adjustment causes city contribution rate to increase
Second, under written agreement (not later than April 30), prospectively restore all or part of any benefit reductions or reduce increased employee contributions, in each case made after the year 2017 effective date
Third, accelerate the payoff year of the legacy liability by offsetting the remaining legacy liability by the amount of the new liability loss layer, provided that during the accelerated period the city will continue to pay the city contribution amount as scheduled in the initial RSVS
Fourth, accelerate the payoff year of existing liability loss layers, excluding the legacy liability, by accelerating the oldest liability loss layers first, to an amortization period not less than 20 years from the first day of the fiscal year beginning 12 months after the date of the RSVS in which the liability loss layer is first recognized
Fifth, under a written agreement (not later than the 30th day before the first day of the next fiscal year), the city and pension board may agree to reduce the assumed rate of return
If funded ratio is equal to or greater than 100%
All existing liability layers, including the legacy liability, are considered fully amortized and paid
The city contribution amount may no longer be included in the city contribution under 8A
The city and the pension system may mutually agree to change assumptions in a written agreement
If funded ratio is greater than 100%
In a written agreement between the city and the board, the fund may reduce member contributions or increase pension benefits if, as a result of the action:
the funded ratio is not less than 100 percent, and
the city contribution rate is not more than the minimum contribution rate
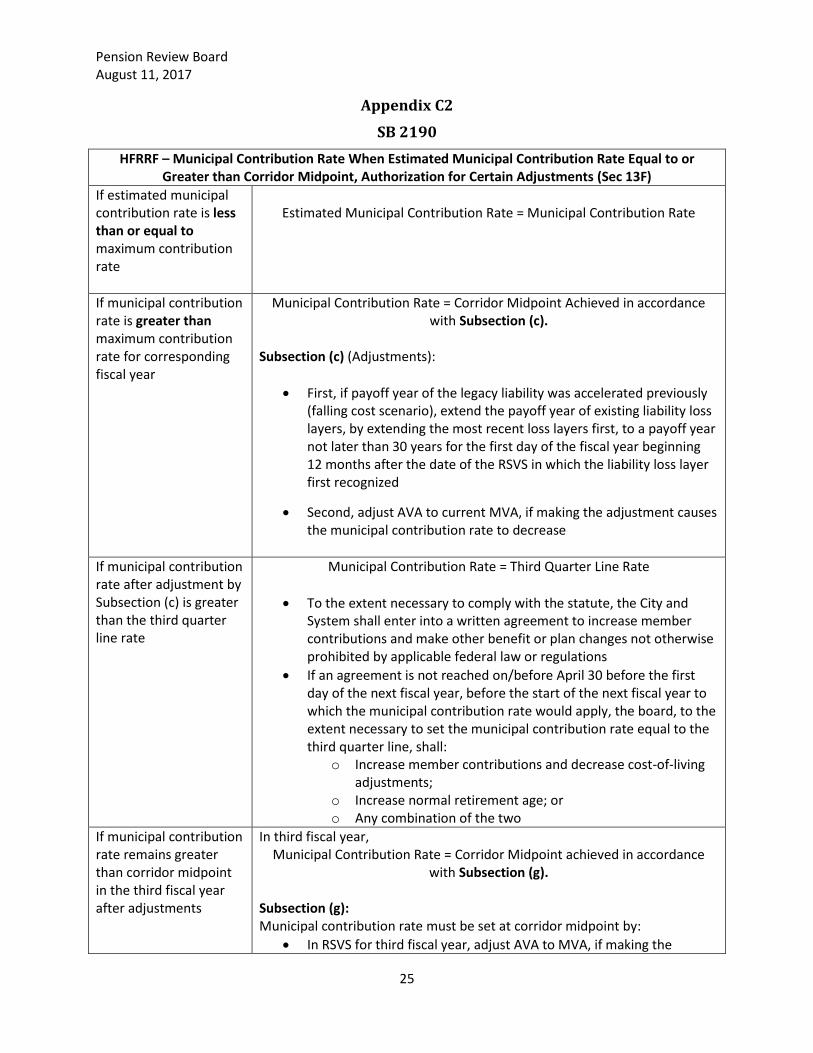
Pension Review Board August 11, 2017
25
Appendix C2
SB 2190
HFRRF – Municipal Contribution Rate When Estimated Municipal Contribution Rate Equal to or Greater than Corridor Midpoint, Authorization for Certain Adjustments (Sec 13F)
If estimated municipal contribution rate is less than or equal to maximum contribution rate
Estimated Municipal Contribution Rate = Municipal Contribution Rate
If municipal contribution rate is greater than maximum contribution rate for corresponding fiscal year
Municipal Contribution Rate = Corridor Midpoint Achieved in accordance with Subsection (c).
Subsection (c) (Adjustments):
First, if payoff year of the legacy liability was accelerated previously (falling cost scenario), extend the payoff year of existing liability loss layers, by extending the most recent loss layers first, to a payoff year not later than 30 years for the first day of the fiscal year beginning 12 months after the date of the RSVS in which the liability loss layer first recognized
Second, adjust AVA to current MVA, if making the adjustment causes the municipal contribution rate to decrease
If municipal contribution rate after adjustment by Subsection (c) is greater than the third quarter line rate
Municipal Contribution Rate = Third Quarter Line Rate
To the extent necessary to comply with the statute, the City and System shall enter into a written agreement to increase member contributions and make other benefit or plan changes not otherwise prohibited by applicable federal law or regulations
If an agreement is not reached on/before April 30 before the first day of the next fiscal year, before the start of the next fiscal year to which the municipal contribution rate would apply, the board, to the extent necessary to set the municipal contribution rate equal to the third quarter line, shall:
o Increase member contributions and decrease cost-of-living adjustments;
o Increase normal retirement age; or o Any combination of the two
If municipal contribution rate remains greater than corridor midpoint in the third fiscal year after adjustments
In third fiscal year, Municipal Contribution Rate = Corridor Midpoint achieved in accordance
with Subsection (g). Subsection (g): Municipal contribution rate must be set at corridor midpoint by:
In RSVS for third fiscal year, adjust AVA to MVA, if making the

Pension Review Board August 11, 2017
26
adjustment causes the municipal contribution rate to decrease
Under written agreement between City and board: o Increase member contributions o Make any other benefit or plan changes not otherwise
prohibited by applicable federal law or regulations
If an agreement is not reached on/before April 30 before the first day of the next fiscal year, before the start of the next fiscal year, the board, to the extent necessary to set the municipal contribution rate equal to the corridor midpoint, shall:
o Increase member contributions and decrease cost-of-living adjustments;
o Increase normal retirement age; or o Any combination of the two
HPOPS – City Contribution Rate When Estimated City Contribution Rate Equal to or Greater Than Corridor Midpoint, Authorization for Certain Adjustments (Sec 9F)
If estimated City contribution rate is less than or equal to maximum contribution rate
Estimated City Contribution Rate = City Contribution Rate
If City contribution rate is greater than maximum contribution rate for corresponding fiscal year
City Contribution Rate = Corridor Midpoint achieved in accordance with Subsection (c).
Subsection (c) (Adjustments):
First, if payoff year of the legacy liability was accelerated previously (falling cost scenario), extend the payoff year of existing liability loss layers, by extending the most recent loss layers first, to a payoff year not later than 30 years for the first day of the fiscal year beginning 12 months after the date of the RSVS in which the liability loss layer first recognized
Second, adjust AVA to current MVA, if making the adjustment causes the city contribution rate to decrease
If city contribution rate after adjustment by Subsection (c) is greater than the third quarter line rate
City Contribution Rate = Third Quarter Line Rate
To the extent necessary to comply with the statute, the City and board shall enter into a written agreement to increase member contributions and make other benefit or plan changes not otherwise prohibited by applicable federal law or regulations
If an agreement is not reached on/before April 30 before the first day of the next fiscal year, before the start of the next fiscal year to which the city contribution rate would apply, the board, to the extent necessary to set the city contribution rate equal to the third

Pension Review Board August 11, 2017
27
quarter line, shall: o Increase member contributions and decrease cost-of-living
adjustments; o Increase normal retirement age; or o Any combination of the two
If city contribution rate remains greater than corridor midpoint in the third fiscal year after adjustments
In third fiscal year, City Contribution Rate = Corridor Midpoint achieved in accordance with
Subsection (g). Subsection (g): City contribution rate must be set at corridor midpoint by:
In RSVS for third fiscal year, adjust AVA to MVA, if making the adjustment causes the city contribution rate to decrease
Under written agreement between City and board: o Increase member contributions o Make any other benefit or plan changes not otherwise
prohibited by applicable federal law or regulations
If an agreement is not reached on/before April 30 before the first day of the next fiscal year, before the start of the next fiscal year, the board, to the extent necessary to set the city contribution rate equal to the corridor midpoint, shall:
o Increase member contributions and decrease cost-of-living adjustments;
o Increase normal retirement age; or o Any combination of the two
HMEPS – City Contribution Rate When Estimated City Contribution Rate Equal to or Greater Than Corridor Midpoint, Authorization for Certain Adjustments (Sec 8F)
If estimated City contribution rate is less than or equal to maximum contribution rate
Estimated City Contribution Rate = City Contribution Rate
If City contribution rate is greater than maximum contribution rate for corresponding fiscal year
City Contribution Rate = Corridor Midpoint achieved in accordance with Subsection (c).
Subsection (c) (Adjustments):
First, adjust AVA to current MVA, if making the adjustment causes the city contribution rate to decrease
Second, if payoff year of the legacy liability was accelerated previously (falling cost scenario),
o extend the payoff year of the legacy liability by the amount of the new liability gain layer to a maximum amount
o during extended period, the city shall continue to pay the city contribution amount for the extended period

Pension Review Board August 11, 2017
28
Third, if the payoff year of a liability loss layer other than legacy liability was previously accelerated(falling cost scenario), extend the payoff year of existing liability loss layers, excluding legacy liability, by extending the most recent loss layers first, to a payoff year not later than 30 years from the first day of the fiscal year beginning 12 months after the date of the RSVS in which the liability loss layer first recognized
If city contribution rate after adjustment by Subsection (c) is greater than the third quarter line rate
City Contribution Rate = Third Quarter Line Rate
To the extent necessary to comply with the statute, the City and board shall enter into a written agreement to increase member contributions and make other benefit or plan changes not otherwise prohibited by applicable federal law or regulations
Gains resulting from adjustments made as the result of a written agreement may not be used as a direct offset against the city contribution amount in any fiscal year
If an agreement is not reached on/before the 30th day before the first day of the next fiscal year, before the start of the next fiscal year to which the city contribution rate would apply, the board, to the extent necessary to set the city contribution rate equal to the third quarter line, shall:
o Increase member contributions and decrease cost-of-living adjustments;
o Increase normal retirement age
If city contribution rate remains greater than corridor midpoint in the third fiscal year after adjustments
In third fiscal year, City Contribution Rate = Corridor Midpoint achieved in accordance with
Subsection (h). Subsection (h): City contribution rate must be set at corridor midpoint by:
In RSVS for third fiscal year, adjust AVA to MVA, if making the adjustment causes the city contribution rate to decrease
Under written agreement between City and board: o Increase member contributions o Make any other benefit or plan changes not otherwise
prohibited by applicable federal law or regulations
If an agreement is not reached on/before the 30th day before the first day of the next fiscal year, before the start of the next fiscal year, the board, to the extent necessary to set the city contribution rate equal to the corridor midpoint, shall:
o Increase member contributions o decrease cost-of-living adjustments

Texas Pension Review Board
2017-2018 Biennial Report
XVIII
APPENDIX G1 – APRIL 4, 2018 PRESENTATION TO THE SENATE
COMMITTEE ON STATE AFFAIRS

Texas Pension Review BoardSenate Committee on State Affairs
April 4, 2018

• Oversees all Texas public retirement systems, both state and local, in regard to their actuarial soundness and compliance with state law.
• Service population consists of the members, administrators and trustees of 340 individual public retirement plans, state and local government officials, and the public.
• Current PRB activities:• intensive actuarial reviews of certain retirement systems facing
significant funding shortfall• interim studies to develop legislative recommendations on the
following topics: Funding Policies for Fixed Rate Pension Plans and Pooling of Assets for Smaller Plans
• online pension dashboard to provide accessible current, historical, and comparative data on Texas defined benefit plans
PRB Overview
2

PUBLIC PENSION PLAN
TYPES IN TEXAS
3

• A defined benefit (DB) plan promises the participant a specified benefit at retirement, which is not tied to actual investment performance. For public sector plans, generally, both the employee and employer contribute to the plan, and plan assets are pooled and invested by the plan.
• For participants in a defined contribution (DC) plan, the contribution amount is defined, but the benefit at retirement is variable as a result of investment returns and based on the ending account balance.
• Hybrid plans utilize both DB and DC components. In Texas, cash balance plans utilize “notional accounts” that receive contributions and interest credits. Benefits are valued and funded like a DB plan.
4
Public Pension Plan Types

• 340 Public Retirement Systems in Texas: 99 actuarially funded DB plans (including 2 hybrid plans); 160 defined contribution and 81pay-as-you-go volunteer firefighter plans.
• The two hybrid/cash-balance plans are Texas Municipal Retirement System (TMRS) and Texas County and District Retirement System
(TCDRS). Currently, 872 municipalities are participating in TMRS, and 738 counties and districts are participating in TCDRS.
• DC plans are primarily offered as supplemental plans by school districts, housing authorities, municipal districts, COGs, and MHMR facilities. Plan types include 401(a), 401(k), 403(b), and 457(b) plans.
5
Landscape of Texas Public Pensions by Plan Type

ACTUARIAL ASSUMPTIONS AND PLAN LIABILITIES
6

• Funding a defined benefit (DB) plan requires assumptions to be made about future events. Actuarial assumptions (along with current plan participant data and the benefit formula) are used to estimate future benefit obligations/the cost of the plan.
• Assumptions do not drive costs, actual plan experience does.
• Actuarial assumptions can be split into two broad categories: economic and demographic.
• Key economic assumptions: investment return, inflation, salary increases, payroll growth.
Actuarial Assumptions
7

Actuarial Standard of Practice #27
1. Appropriate for the purpose of the measurement
2. Reflects actuary’s professional judgement
3. Takes into account relevant historical and current economic data (the actuary should not give undue weight to recent experience)
4. Reflects the actuary’s estimate of future experience
5. It has no significant bias (i.e., it is not significantly optimistic or pessimistic)
ASOP Standards: Reasonable Economic Assumptions
8

Plan actuary develops a recommendation for pension board consideration
➢Plan actuary considers the following:• plan’s investment policy statement
• capital market assumptions to estimate future expected returns
• current and historical plan experience
• investment and administrative expenses
• cash flow timing
Process for Developing Investment Return Assumption
9

Process for Developing Investment Return Assumption
Example
Assumed Net Real Rate of Return
= 4.5%
Assumed Inflation Rate
= 2.5%
Investment Return
Assumption= 7%
➢ A common approach is the building block method:
• expected price inflation
• real rate of return for each asset class
10
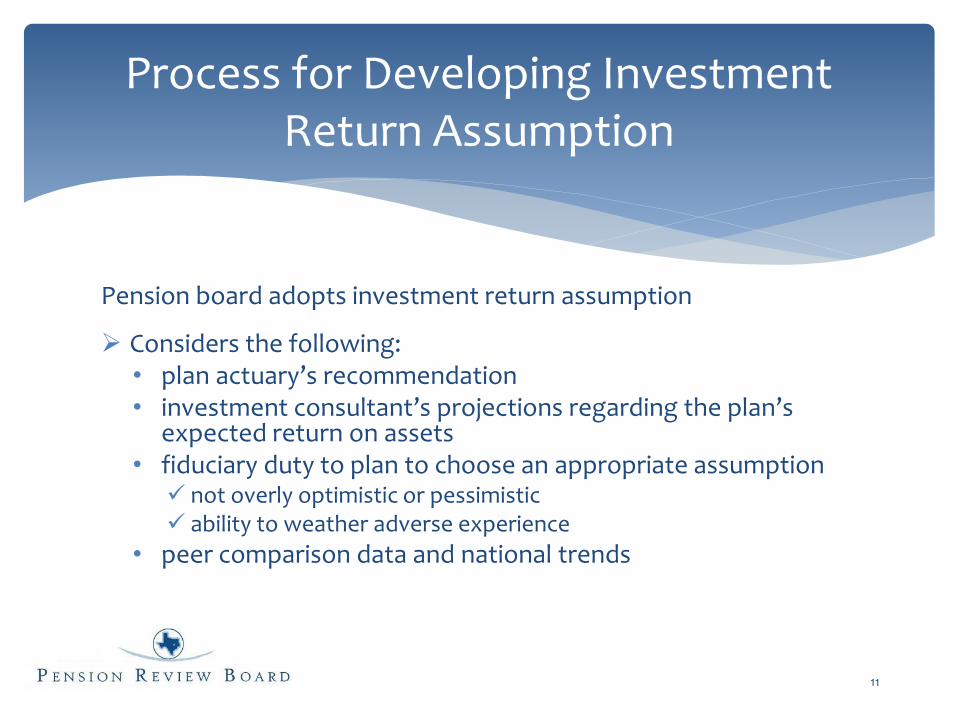
Pension board adopts investment return assumption
➢ Considers the following:• plan actuary’s recommendation• investment consultant’s projections regarding the plan’s
expected return on assets• fiduciary duty to plan to choose an appropriate assumption
✓ not overly optimistic or pessimistic✓ ability to weather adverse experience
• peer comparison data and national trends
Process for Developing Investment Return Assumption
11

• Short-term fluctuations should not overly influence the expected long-term investment return assumption; however order matters. Lower returns in the near term will result in lower total assets even if actual long-term average returns are closer to the return assumption.
• Plans should regularly review their investment return and inflation assumptions to ensure those assumptions align with the systems’ investment strategy, asset allocation, risk tolerance, and expected future returns on assets.
12
Process for Developing Investment Return Assumption

Impact of Investment Return Assumption
Investment Return Assumption = 8%
Expected Investment
Income
Required Contributions
Investment Return Assumption = 6%
Required Contributions
Expected Investment
Income
13

• Has a direct, inverse correlation with the liability and expected contribution requirements of a plan.
• A higher return assumption leads to a lower liability calculation and vice versa. Therefore, reducing the return assumption leads to an increase in the unfunded liability of a plan.
• Lowering the return assumption results in higher contribution requirement.
• If a retirement plan receives the increased contribution, its actuarial soundness should not be affected in the long term.
Impact of Investment Return Assumption
14

Investment Return Assumption Trends
• The average investment return assumption for Texas public retirement systems is currently 7.46%. The national average is 7.36% (NASRA, Feb. 2018).
• In response to projected market conditions and actual plan experience, retirement systems across the country including Texas have reduced their return assumptions in recent years, and we expect this trend to continue.
15
Texas Plans’ Investment Return Assumptions
Current AV Effective Date
Prior AV Effective Date
> 8.00% 1 3
8.00% 16 22> 7.50%, < 8.00% 26 22
7.50% 16 17> 7.00%, < 7.50% 13 7
7.00% 10 14< 7.00% 11 6
Total Plans Registered 93 91

Average Actual Investment Returns
Average Returns by Plan Type
Plan Type 1-Year Net 3-Year Net 10-Year Net
Statewide 9.10% 5.70% 5.52%
Municipal 8.26% 3.50% 4.66%
Local Fire Fighter 6.46% 2.96% 4.18%
Special District/
Supplemental 6.70% 4.39% 4.90%
Total 7.04% 4.39% 4.90%
According to the most recent fiscal year-end Investment Returns and Assumptions Report.
16

Blue Ribbon Panel on Public Pension Plan Funding, Society of Actuaries. https://www.soa.org/blueribbonpanel/
ASOP 27, Selection of Economic Assumptions for Measuring Pension Obligations, Actuarial Standards Board. http://www.actuarialstandardsboard.org/wp-content/uploads/2014/02/asop027_172.pdf
Pension Plan Valuation: Views on Using Multiple Measures to Offer a More Complete Financial Picture, Government Accountability Office. http://www.gao.gov/products/GAO-14-264
Measuring Pension Obligations: Discount Rates Serve Various Purposes, American Academy of Actuaries. https://www.actuary.org/files/IB_Measuring-Pension-Obligations_Nov-21-2013.pdf
Public Pension Plan Investment Return Assumptions, NASRA. http://www.nasra.org/files/Issue%20Briefs/NASRAInvReturnAssumptBrief.pdf
2014 Study of the Financial Health of Texas Public Retirement Systems, PRB. http://www.prb.state.tx.us/files/reports/Financial_Health_Study_Final.pdf
Additional Resources
17

• PRB Online Courses: Actuarial Matters, Benefits Administration, Investments, Governance, Fiduciary Matters, Ethics, Risk Management
• Available at: http://www.prb.state.tx.us/resource-center/trustees-administrators/educational-training-program/
• Login: enter office and name. No password required.
www.prb.state.tx.us
512-463-1736
18
Educational Resources
Texas Pension Review Board
2017-2018 Biennial Report
XIX
APPENDIX G2 – MAY 10, 2018 PRESENTATION TO THE HOUSE
PENSIONS COMMITTEE

Texas Pension Review Board
House Pensions Committee May 10, 2018

PRB Mission and Current Activities
PRB mission: to provide the State of Texas with the necessary information and recommendations to help ensure that Texas public retirement systems are properly managed and actuarially sound
Service population consists of the members, administrators and trustees of 342 individual public retirement plans, state and local government officials, and the public
Current PRB activities to help improve actuarial soundness of plans:
online pension dashboard to provide accessible current, historical, and comparative data on Texas defined benefit plans
interim studies to develop legislative recommendations on the following topics: Funding Policies for Fixed Rate Pension Plans and Pooling of Assets for Smaller Plans (for publication in Nov. 2018 Biennial Report)
intensive actuarial reviews of certain retirement systems facing potential risks that threaten long-term stability
2

Intensive Actuarial Review Process
PRB statutory duty to conduct intensive studies of potential or existing
problems threatening the actuarial soundness of public retirement systems (Gov’t Code 801.202(2))
Adopted criteria for selecting systems for review
Established a review process which includes:
drafts sent to the system and its sponsor with invitation for written response
written responses included in final report
request for system and sponsor to attend committee meeting to discuss review
Conducted in-depth reviews focusing on assessment of major risks
Intensive review results (and updates) will be provided to the legislature in PRB Biennial Report (Nov. 2018)
3

Intensive Actuarial Reviews to date
Beaumont Firemen’s Relief & Retirement Fund, Galveston Employees Retirement Plan for Police, Greenville Firemen’s Relief & Retirement Fund, Marshall Firemen’s Relief & Retirement Fund
Recommendations: Adopt a funding policy that requires payment of an actuarially determined
contribution, or at minimum, that fully funds the plan over a finite period of 30 years or less
Adopt a formal risk/cost-sharing framework with “guardrails” or trigger mechanisms that reduce uncertainty and guide stakeholders in how benefit and contribution levels will be modified under different economic conditions
Closely monitor investment performance and evaluate asset allocation decisions
Conduct an in-depth asset-liability study of potential risks associated with existing asset mix and liabilities they support. Perform scenario testing of large PROP withdrawals coupled with potential adverse investment experience
Regularly review actuarial assumptions against experience, making necessary changes
4

PRB Pension Funding Guidelines (effective 6/30/17)
1. The funding of a pension plan should reflect all plan obligations and assets.
2. The allocation of the normal cost portion of the contributions should be level or declining as a percentage of payroll over all generations of taxpayers, and should be calculated under applicable actuarial standards.
3. Funding of the unfunded actuarial accrued liability should be level or declining as a percentage of payroll over the amortization period.
4. Actual contributions made to the plan should be sufficient to cover the normal cost and to amortize the unfunded actuarial accrued liability over as brief a period as possible, but not to exceed 30 years, with 10-25 years being a more preferable target range.* For plans that use multiple amortization layers, the weighted average of all amortization period should not exceed 30 years.* Benefit increases should not be adopted if all plan changes being considered cause a material increase in the amortization period and if the resulting amortization period exceeds 25 years.
5. The choice of assumptions should be reasonable, and should comply with applicable actuarial standards.
6. Retirement systems should monitor, review, and report the impact of actual plan experience on actuarial assumptions at least once every five years.
*Plans with amortization periods that exceed 30 years as of 6/30/2017 should seek to reduce their amortization period to 30 years or less as soon as practicable, but not later than 6/30/2025.
5

Assets - Liabilities Trends
Chart utilizes information received by the PRB current through the dates listed.
6
In the last seven years, the difference between the AVA and AAL has steadily increased, from $41 billion in 2011 to over $69 billion as of March 2018. The average funded ratio was highest in 2011, and has slowly decreased through 2018.
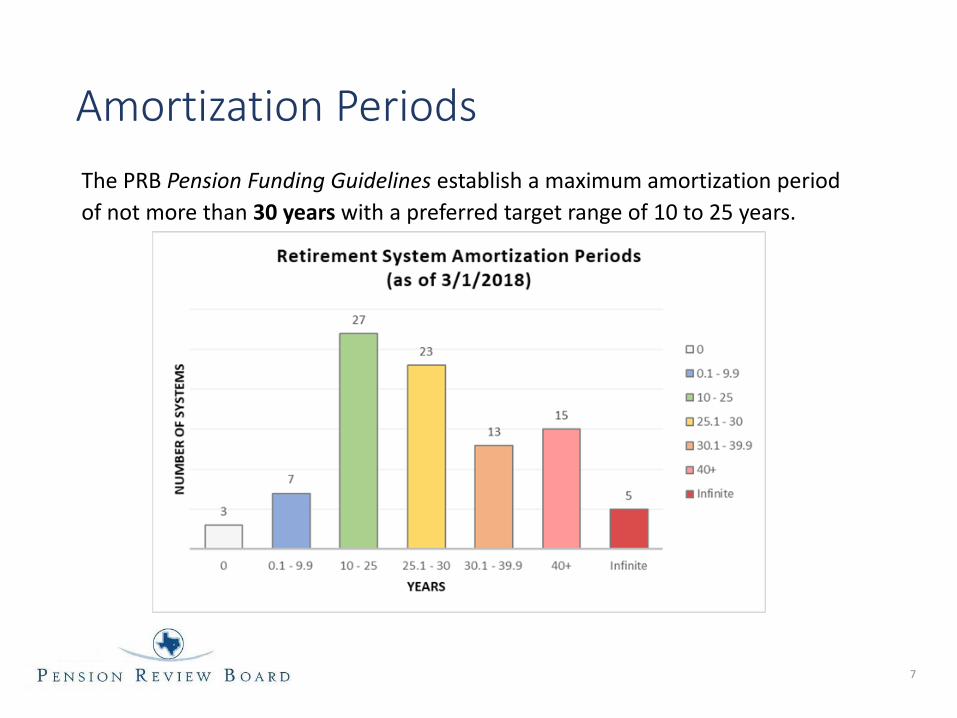
The PRB Pension Funding Guidelines establish a maximum amortization period
of not more than 30 years with a preferred target range of 10 to 25 years.
Amortization Periods
7

Actuarial Assumptions Investment Return Assumption Trends The average investment return assumption for Texas systems is currently
7.46%. The national average is 7.36% (NASRA, February 2018).
In response to projected market conditions and actual plan experience, retirement systems across the country, including Texas, have reduced return assumptions in recent years. This trend expected to continue.
8
6
14
7
17
22 22
3
11 10
13
16
26
16
1
<7.00% 7.00% >7.00%,<7.50%
7.50% >7.50%,<8.00%
8.00% >8.00%
Texas Plans' Investment Return Assumptions as of 3/1/2018
Prior AV Effective Date
Current AV Effective Date
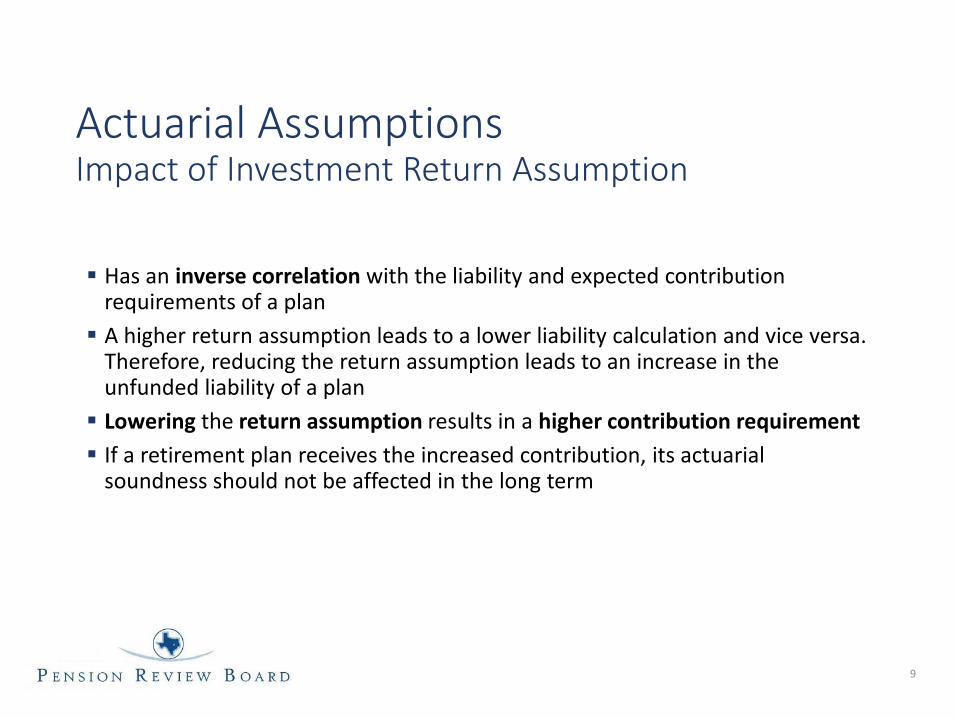
Actuarial Assumptions Impact of Investment Return Assumption
Has an inverse correlation with the liability and expected contribution requirements of a plan
A higher return assumption leads to a lower liability calculation and vice versa. Therefore, reducing the return assumption leads to an increase in the unfunded liability of a plan
Lowering the return assumption results in a higher contribution requirement
If a retirement plan receives the increased contribution, its actuarial soundness should not be affected in the long term
9

Average Actual Investment Returns
Average Returns by Plan Type
Plan Type 1-Year Net 3-Year Net 10-Year Net Long-Term Net*
Statewide 10.62% 5.21% 5.56% 8.04%
Municipal 9.04% 3.63% 4.57% 8.10%
Local Fire Fighter 6.76% 3.08% 4.17% 6.30%
Special District/Supplemental 6.29% 4.18% 4.91% 6.44%
All 7.33% 3.66% 4.56% 6.85%
According to the most recent fiscal year-end Investment Returns and Assumptions Report. *Long-term return is 30 years or longest term available between 11-30 years that plans reported to the PRB.
10

Funding Soundness Restoration Plan Update
14 systems have submitted FSRPs. Of those, two systems have achieved their goal and are below 40 years. The remaining 12 are working towards 40 years
One system is subject to the requirement but has not yet submitted its FSRP
Four systems will be subject to the FSRP requirement if their next valuation shows an amortization period greater than 40 years
11
H.B. 3310 by Paul/Taylor (84thR)
If a retirement system receives several consecutive valuations showing its amortization period exceeds 40 years, the system’s board and sponsoring entity must jointly formulate an FSRP and submit the plan to the PRB within 6 months following the trigger of the requirement.
The FSRP must reduce the amortization period to 40 within 10 years. Systems must report updates to PRB at least every two years.

House Bill 3158 – Highlights
12
Dallas Police and Fire Pension System
Increased both employee and City contributions: Employee – from 8.5% for non-DROP active participants and 4.0% for DROP active participants
to 13.5% for all participants City – from 27.5% of total pay to 34.5% of computation pay with a floor for 7 years, plus $13m
per year until 2024
Modified DROP. No interest or COLAs while in Active DROP; upon retirement, interest earned based on a Treasury-based interest rate; DROP distributed as annuity based on the member’s life expectancy; DROP participation limited to 10 years (effective 1/1/18)
Reduced benefits. Lowered benefit multiplier and raised normal retirement age for all members. Ad hoc COLA for retired members only if funded ratio above 70% based on actual return; minimum 0%, maximum 4%
Changed board composition. Six of the trustees are selected by the mayor and five are selected by the pension system. All members of the board must be experts in finance, accounting, business, investment, budgeting, real estate, or actuarial science
Governance changes. Two-thirds vote of the full board required for major actions of the board, for example, implementing any rule change concerning board governance or creating an alternative benefit plan
Established investment advisory committee. Committee reviews investment-related matters and makes recommendations to the board. Two-thirds vote by the board required to approve each alternative investment
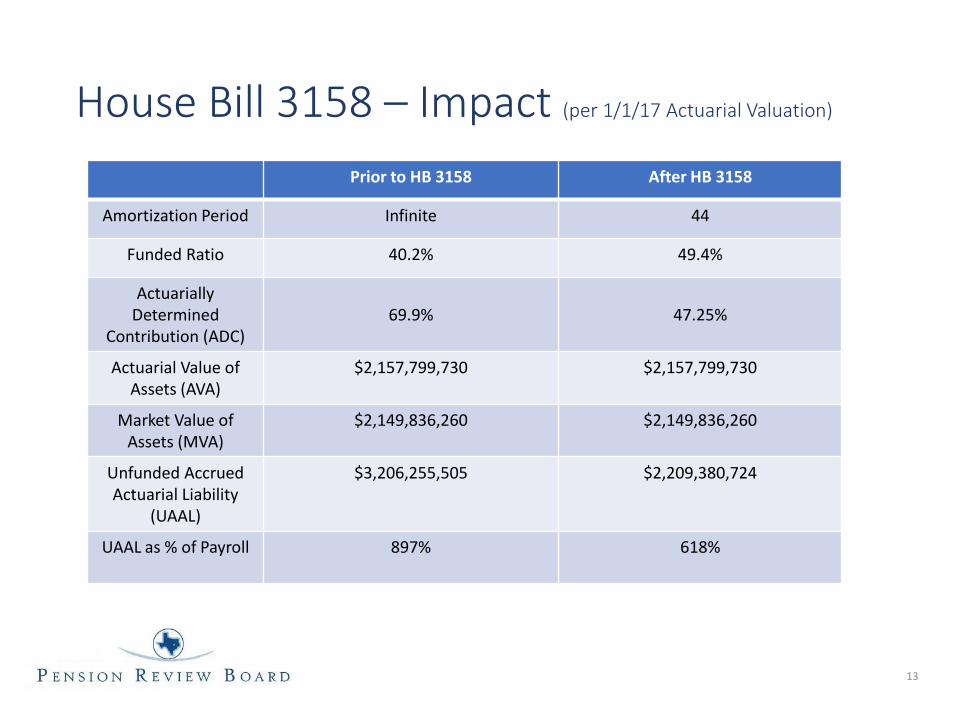
House Bill 3158 – Impact (per 1/1/17 Actuarial Valuation)
13
Prior to HB 3158 After HB 3158
Amortization Period Infinite 44
Funded Ratio 40.2% 49.4%
Actuarially Determined
Contribution (ADC)
69.9%
47.25%
Actuarial Value of Assets (AVA)
$2,157,799,730 $2,157,799,730
Market Value of Assets (MVA)
$2,149,836,260 $2,149,836,260
Unfunded Accrued Actuarial Liability
(UAAL)
$3,206,255,505 $2,209,380,724
UAAL as % of Payroll
897% 618%

House Bill 3158 – PRB Duties 2017
Authorized DROP distributions: PRB determined DPFPS did not make unauthorized distributions before Aug. 31, 2017, per the bill requirements. Sent letters to DPFPS and the City regarding the determination
2024
Independent actuarial analysis: HB 3158 requires the PRB to select an independent actuary to perform an analysis based on the system’s Jan. 1, 2024 actuarial valuation. PRB is developing criteria to make this selection
Funding plan: Based on the independent actuarial analysis and applicable funding and amortization period requirements, DPFPS shall adopt a funding plan by rule. PRB shall report to the legislature on the actuarial analysis and rules adopted by the system
Ongoing
Benefit increases: A DPFPS rule that proposes a benefit increase must be reviewed by the PRB for compliance with amortization period requirements (must not exceed 25 years after the change). PRB is developing a procedure for rule review
Alternative benefit plans: A DPFPS rule that proposes to establish a defined contribution or hybrid plan (for new hires or on a voluntary transfer basis) must be reviewed by the PRB for compliance with amortization period requirements (must not exceed 35 years after the change). PRB is developing a procedure for rule review
14

Minimum Educational Training Program
PRB Online Courses: Actuarial Matters, Benefits Administration, Investments, Governance, Fiduciary Matters, Ethics, Risk Management
Available at: http://www.prb.state.tx.us/resource-center/trustees-administrators/educational-training-program/
Login: enter office and name. No password required
www.prb.state.tx.us
512-463-1736
15

Texas Pension Review Board
2017-2018 Biennial Report
XX
APPENDIX G3 – OCTOBER 12, 2018 PRESENTATION TO THE HOUSE
PENSIONS COMMITTEE

Texas Pension Review Board
House Pensions CommitteeOctober 12, 2018

PRB Mission and Current Activities
▪ PRB mission: to provide the State of Texas with the necessary information and recommendations to help ensure that Texas public retirement systems are properly managed and actuarially sound
▪ Service population consists of the members, administrators and trustees of 346 individual public retirement plans, state and local government officials, and the public
▪ Current PRB activities to help improve actuarial soundness of plans:
online pension dashboard to provide accessible current, historical, and comparative data on Texas defined benefit plans
interim studies to develop legislative recommendations on two topics: Funding Policies for Fixed-Rate Pension Plans and Asset Pooling for Smaller Pension Plans
intensive actuarial reviews of certain retirement systems facing potential risks that threaten long-term funding stability
2

Intensive Actuarial Review Process
▪ PRB statutory duty to conduct intensive studies of potential or existing problems threatening the actuarial soundness of public retirement systems (Gov’t Code 801.202(2))
▪ Adopted criteria for selecting systems for review
▪ Established a review process which includes:
drafts sent to the system and its sponsor with invitation for written response
written responses included in final report
request for system and sponsor to attend committee meeting to discuss review
▪ Conducted 7 in-depth reviews focusing on assessment of major risks
▪ Intensive review results (and updates) will be provided to the Legislature in PRB Biennial Report in Nov. 2018
3

2018 Intensive Actuarial Reviews
▪ Recommendations:
Adopt a funding policy that requires payment of an actuarially determined contribution, or
at minimum, that fully funds the plan over a finite period of 30 years or less
Adopt a formal risk/cost-sharing framework with “guardrails” or trigger mechanisms that
reduce uncertainty and guide stakeholders in how benefit and contribution levels will be
modified under different economic conditions
Closely monitor investment performance including expenses and evaluate asset allocation
decisions
Conduct an in-depth asset-liability study of potential risks associated with existing asset mix
and liabilities they support. Perform scenario testing of large DROP/PROP withdrawals
coupled with potential adverse investment experience
Regularly review actuarial assumptions against experience, making necessary changes
4
January April October
Galveston Police Greenville Fire
Beaumont FireMarshall Fire
Longview FireOrange FireIrving Fire

PRB Pension Funding Guidelines (effective 6/30/17)
1. The funding of a pension plan should reflect all plan obligations and assets.
2. The allocation of the normal cost portion of the contributions should be level or declining as a percentage of payroll over all generations of taxpayers, and should be calculated under applicable actuarial standards.
3. Funding of the unfunded actuarial accrued liability should be level or declining as a percentage of payroll over the amortization period.
4. Actual contributions made to the plan should be sufficient to cover the normal cost and to amortize the unfunded actuarial accrued liability over as brief a period as possible, but not to exceed 30 years, with 10-25 years being a more preferable target range.* For plans that use multiple amortization layers, the weighted average of all amortization period should not exceed 30 years.* Benefit increases should not be adopted if all plan changes being considered cause a material increase in the amortization period and if the resulting amortization period exceeds 25 years.
5. The choice of assumptions should be reasonable, and should comply with applicable actuarial standards.
6. Retirement systems should monitor, review, and report the impact of actual plan experience on actuarial assumptions at least once every five years.
*Plans with amortization periods that exceed 30 years as of 6/30/2017 should seek to reduce their amortization period to 30 years orless as soon as practicable, but not later than 6/30/2025.
5
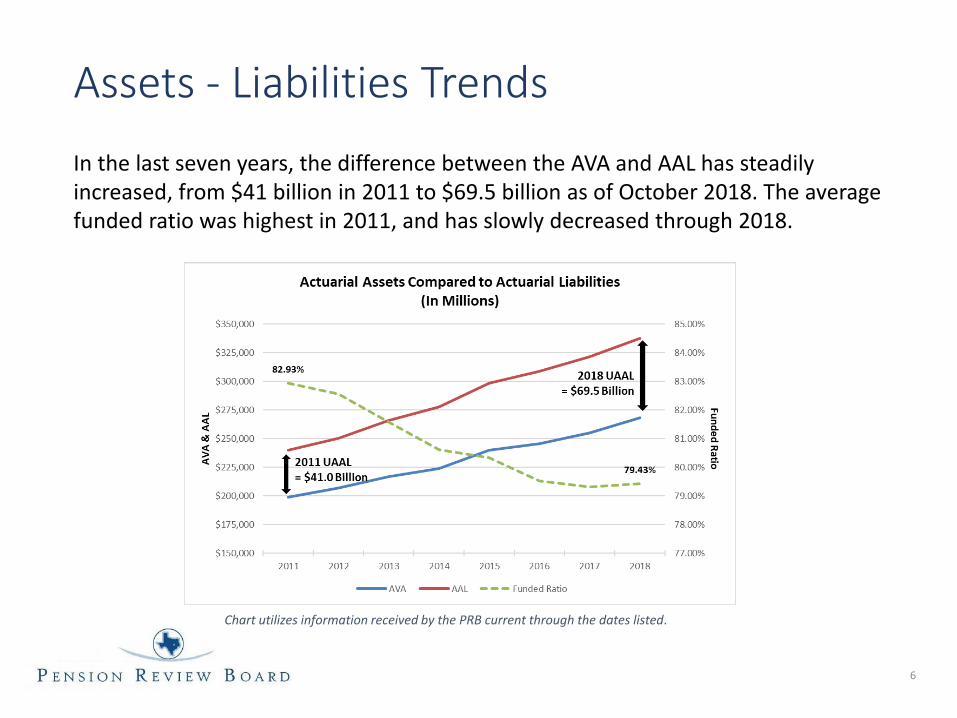
Assets - Liabilities Trends
Chart utilizes information received by the PRB current through the dates listed.
6
In the last seven years, the difference between the AVA and AAL has steadily increased, from $41 billion in 2011 to $69.5 billion as of October 2018. The average funded ratio was highest in 2011, and has slowly decreased through 2018.

The PRB Pension Funding Guidelines establish a maximum amortization period
of not more than 30 years with a preferred target range of 10 to 25 years.
Amortization Periods
7

Actuarial AssumptionsInvestment Return Assumption Trends
▪ The average investment return assumption for Texas systems is currently 7.40%. The national average is 7.36% (NASRA, February 2018).
▪ In response to projected market conditions and actual plan experience, retirement systems across the country, including Texas, have reduced return assumptions in recent years. This trend is expected to continue.
8
7
12
8
19
23 22
2
12 12
1719
28
11
0
<7.00% 7.00% >7.00%,<7.50%
7.50% >7.50%,<8.00%
8.00% >8.00%
Texas Plans' Investment Return Assumptionsas of October 2018
Prior AV Effective Date
Current AV Effective Date
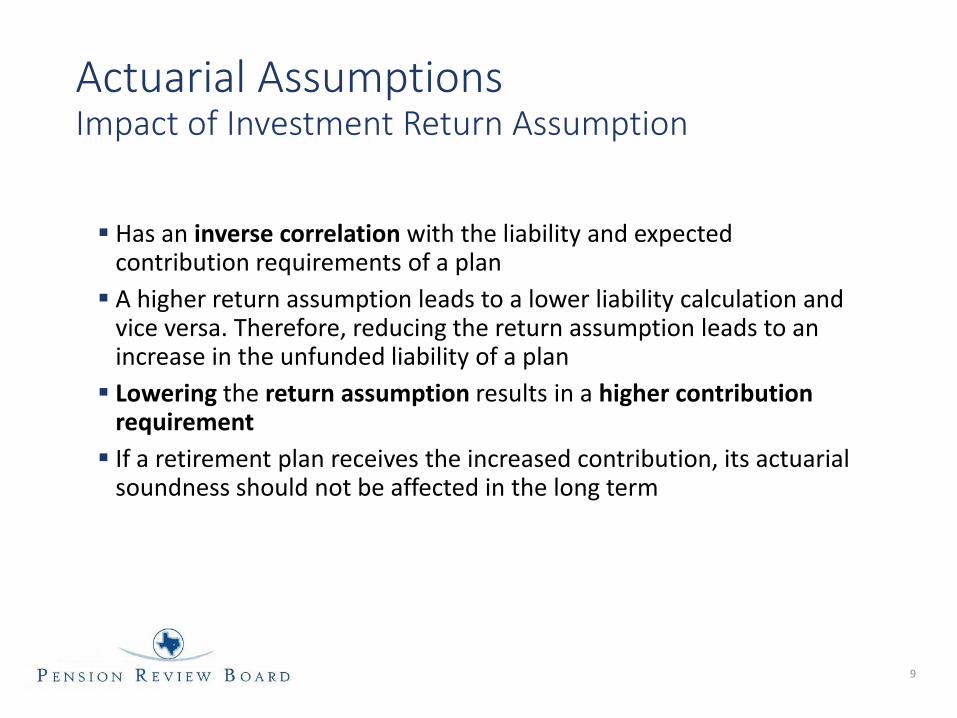
Actuarial AssumptionsImpact of Investment Return Assumption
▪ Has an inverse correlation with the liability and expected contribution requirements of a plan
▪ A higher return assumption leads to a lower liability calculation and vice versa. Therefore, reducing the return assumption leads to an increase in the unfunded liability of a plan
▪ Lowering the return assumption results in a higher contribution requirement
▪ If a retirement plan receives the increased contribution, its actuarial soundness should not be affected in the long term
9
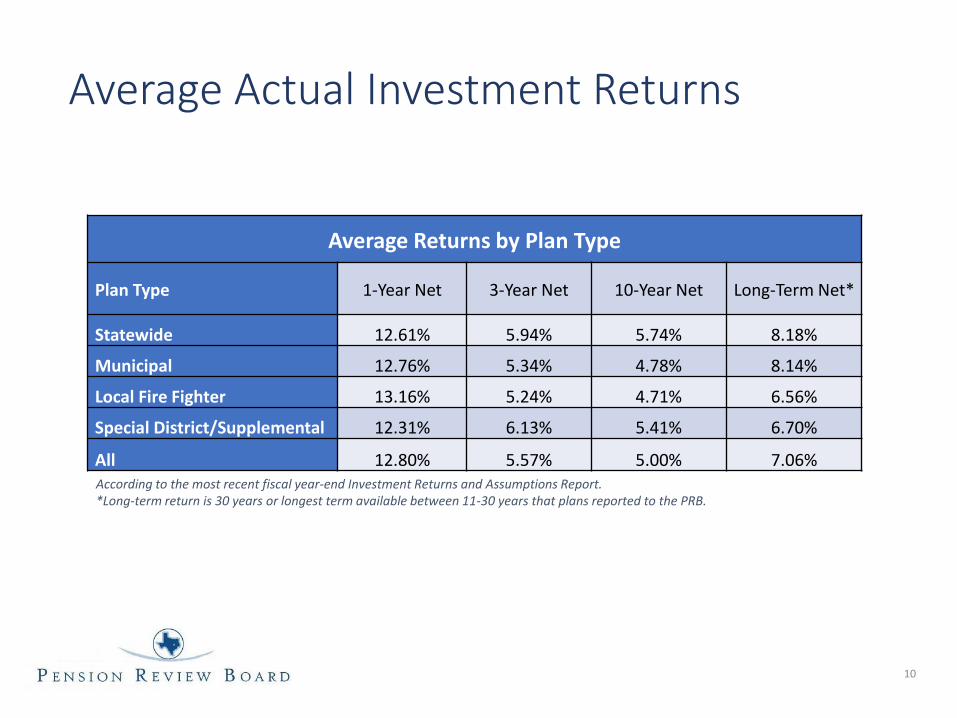
Average Actual Investment Returns
According to the most recent fiscal year-end Investment Returns and Assumptions Report. *Long-term return is 30 years or longest term available between 11-30 years that plans reported to the PRB.
10
Average Returns by Plan Type
Plan Type 1-Year Net 3-Year Net 10-Year Net Long-Term Net*
Statewide 12.61% 5.94% 5.74% 8.18%
Municipal 12.76% 5.34% 4.78% 8.14%
Local Fire Fighter 13.16% 5.24% 4.71% 6.56%
Special District/Supplemental 12.31% 6.13% 5.41% 6.70%
All 12.80% 5.57% 5.00% 7.06%

Funding Soundness Restoration Plan
11
H.B. 3310 by Paul/Taylor (84thR)
▪If a retirement system receives several consecutive valuations showing its amortization period exceeds40 years, the system’s board and sponsoring entity must jointly formulate an FSRP and submit the planto the PRB within 6 months following the trigger of the requirement.
▪The FSRP must reduce the amortization period to 40 within 10 years. Systems must report updates toPRB at least every two years.
▪ 15 systems have submitted FSRPs. Of those, two systems have achieved their goal and are below 40 years
▪ Three of the 15 systems with submitted FSRPs are in the process of developing a revised FSRP as these systems did not meet their initial FSRP. The remaining 10 are currently working towards 40 years
▪ One system is subject to the requirement but has not yet submitted its FSRP
▪ Six systems will be subject to the FSRP requirement if their next valuation shows an amortization period greater than 40 years
Minimum Educational Training Program
▪ PRB Online Courses: Actuarial Matters, Benefits Administration, Investments, Governance, Fiduciary Matters, Ethics, Risk Management
▪ Available at: http://www.prb.state.tx.us/resource-center/trustees-administrators/educational-training-program/
▪ Login: enter office and name. No password required
www.prb.state.tx.us
512-463-1736
12

Houston Systems (SB 2190) – Highlights
13
Houston Firefighters’ Houston Police Officers Houston Municipal Employees
▪Increased employee contributions from 9% to 10.5% and introduced a corridor mechanism to determine employer contributions.
▪Made prospective changes to benefit formula for current members, created a second tier for new hires that modified the following: final average salary calculation, retirement eligibility, benefit calculation, and termination benefit.
▪Three-year COLA freeze for members under 70 years of age, then COLA modified to be based on 5 year smoothed return minus 4.75%, min 0% max 4%, beginning at 55.
▪Modified DROP. Interest credit modified, no COLAs or member contributions credited to DROP. No DROP for new hires.
▪No new funds may be added to PROP accounts.
▪Increased employee contributions from 9% and 10.2% to 10.5% for all members and introduced a corridor mechanism to determine employer contributions.
▪Changed retirement eligibility to Rule of 70 for members sworn in after 10/9/04.
▪COLA modified to be the 5 year smoothed return minus 5%, min 0% max 4%. Also, three-year COLA freeze for members under 70 years of age.
▪Modified DROP. No DROP entry after June 30, 2027. No COLAs credited to accounts after 7/1/2017, interest credit is 65% of the 5-year compounded average investment return, min 2.5%. DROP participation limited to 20 years, no recalculation of annuity at DROP exit.
▪No new funds may be added to PROP accounts.
▪ Increased employee contributions (below) and introduced a corridor mechanism to determine employer contributions .
▪Group A: From 5% to 7% for FYE 2018; 8% thereafter
Group B: From 0% to 2% for FYE 2018; 4% thereafter
Group D: From 0% to 3% (2% service benefit; 1% for cash balance benefit
▪Created cash balance benefit for Group D participants equal to 1% employee contributions credited with DROP interest crediting rate.
▪ COLA equal to 50% of the rolling 5 year net investment return minus 2.00% less than the assumed rate of return (currently 5.00%), not less than 0.00% or greater than 2.00%.
▪ Modified DROP (Groups A and B). Interest is based on rolling 5 year net investment return; COLAs credited on or after 62 years of age.

Houston Systems (SB 2190) – Corridor
▪ The bill established a unique funding policy that establishes a "target" contribution rate (or corridor
midpoint) for the City, developed a minimum and maximum corridor around the City's target contribution
rate (equal to +/- 5% of the projected midpoint), and defined steps to be taken should the annual
calculated contribution move outside the corridor.
▪ The corridor was established in the initial risk sharing valuation study (RSVS), and will not change.
▪ Separate annual RSVSs are prepared by the systems and City to establish the contribution rates.
▪ If the City and the systems’ estimated contribution rates differ by more than 2%, their actuaries must
reconcile the rates until the difference falls below 2%. If it cannot be reconciled, the arithmetic average will
be used. If there is no difference, the systems’ contribution rates will be used.
PRB Review of RSVS
▪ After completion of the annual RSVS, the system and City jointly submit a copy to the PRB for a
determination that the RSVSs comply with statute. If not, the PRB shall notify the governor, lieutenant
governor, the speaker of the house of representatives, and legislative committees with principal
jurisdiction over pension issues.
14

Houston Systems (SB 2190) – Additional Items
Additional Reporting Requirements
▪ The bill requires the three systems to conduct actuarial experience studies at least every 4 years, with the first study adopted as follows:
HFRRF by September 30, 2020
HPOPS by September 30, 2022
HMEPS by September 30, 2021.
▪ The systems must perform an audit of investments at least once every 3 years.
Alternative Retirement Plans
▪ The three retirement systems' boards and the City may enter into a written agreement to offer an alternative retirement plan or plans, including a cash balance retirement plan, if both parties consider it appropriate.
▪ The respective boards are required to close the existing plan to new entrants and establish a separate cash balance plan for new hires under the following circumstances:
For HFRRF and HPOPS, if the plan's funded ratio falls below 65% at any time after June 30, 2021
For HMEPS, if the plan's funded ratio falls below 60% at any time after June 30, 2027
15

Houston Systems (SB 2190) – ImpactHouston Firefighters’
16
HFRRF Prior to SB 2190* After SB 2190* 2017 RSVS
Discount Rate 7.00% 7.00% 7.00%
Accrued Actuarial Liability (AAL)
$5,189,396,000 $4,551,412,000 $4,827,721,000
Actuarial Value of Assets (AVA)
$4,089,047,000 $3,729,670,000 $3,883,807,000
Unfunded Accrued Actuarial Liability (UAAL)
(AAL - AVA)
$1,100,349,000 $821,742,000 $943,914,000
Funded Ratio 78.80% 81.95% 80.45%
Total Employer Contribution
52.20% 30.60% 32.99%
*Prepared by Conduent at the Request of HFRRF
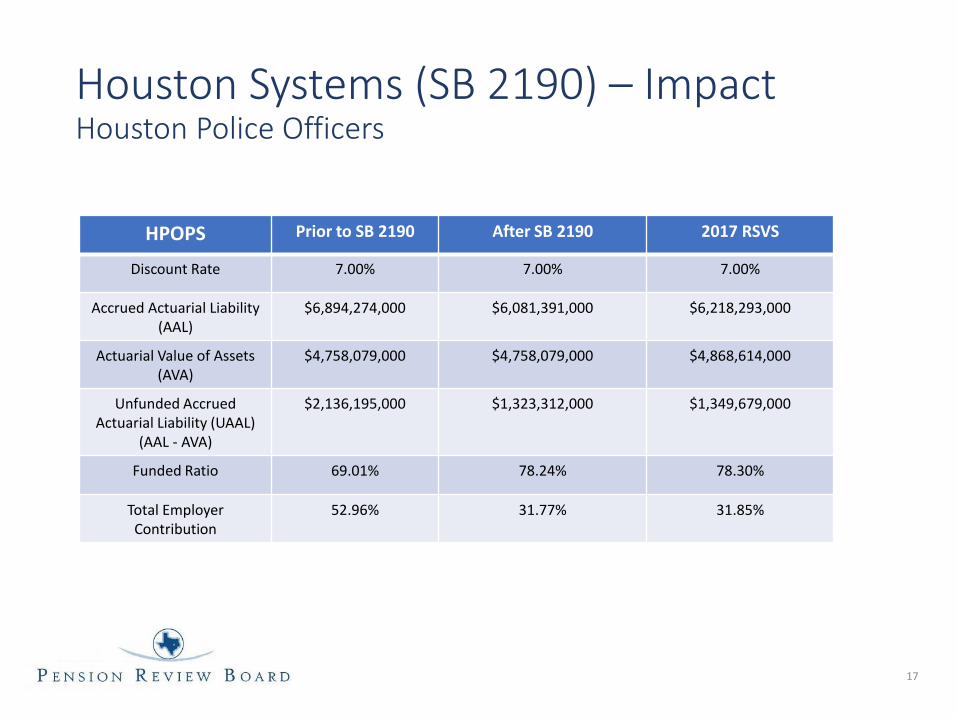
Houston Systems (SB 2190) – ImpactHouston Police Officers
17
HPOPS Prior to SB 2190 After SB 2190 2017 RSVS
Discount Rate 7.00% 7.00% 7.00%
Accrued Actuarial Liability (AAL)
$6,894,274,000 $6,081,391,000 $6,218,293,000
Actuarial Value of Assets (AVA)
$4,758,079,000 $4,758,079,000 $4,868,614,000
Unfunded Accrued Actuarial Liability (UAAL)
(AAL - AVA)
$2,136,195,000 $1,323,312,000 $1,349,679,000
Funded Ratio 69.01% 78.24% 78.30%
Total Employer Contribution
52.96% 31.77% 31.85%

Houston Systems (SB 2190) – ImpactHouston Municipal Employees
18
HMEPS Prior to SB 2190 After SB 2190 2017 RSVS
Discount Rate 7.00% 7.00% 7.00%
Accrued Actuarial Liability (AAL)
$5,509,951,000 $4,734,999,000 $4,866,031,000
Actuarial Value of Assets (AVA)
$2,400,023,000 $2,625,896,000 $2,742,539,000
Unfunded Accrued Actuarial Liability (UAAL)
(AAL-AVA)
$3,109,928,000 $2,109,103,000 $2,123,492,000
Funded Ratio 43.56% 55.46% 56.36%
Total Employer Contribution
39.22% 27.84% 29.00%