THIRD BIENNIAL UPDATE REPORT OF MONTENEGRO
143
1 THIRD BIENNIAL UPDATE REPORT OF MONTENEGRO TO THE UNITED NATIONS FRAMEWORK CONVENTION ON CLIMATE CHANGE Podgorica, 2021.
-
Upload
khangminh22 -
Category
Documents
-
view
3 -
download
0
Transcript of THIRD BIENNIAL UPDATE REPORT OF MONTENEGRO

1
THIRD BIENNIAL UPDATE REPORT OF MONTENEGRO TO THE UNITED NATIONS FRAMEWORK CONVENTION ON CLIMATE CHANGE
Podgorica, 2021.

2
Foreword
Climate change and its negative impacts are affecting all countries around the world, including Montenegro. As a small developing country and due to its geographical, geological and socio-economic position, Montenegro is extremely vulnerable to the impact of climate change.
Understanding how our climate is changing, and the potential impact, is of key importance for directing future activities that we need to implement to further reduce greenhouse gas emissions.
Montenegro is actively pursuing climate change policy both nationally and internationally, as one of the 197 state parties to the United Nations Framework Convention on Climate Change, to which it has been a party since 2006. Our national greenhouse gas emissions account for only 0.009% of the global emissions, but we remain strongly committed to managing our development potentials in a responsible and sustainable manner and with the smallest impact on the environment and climate change. By ratifying the Paris Agreement on 11 October 2017, we confirmed our readiness to actively participate in all the international processes related to a reduction of the harmful effects of climate change. The adoption of the National Strategy in the field of climate change by 2030 and of the Law on Protection against Adverse Impacts of Climate Change is a confirmation of our further commitment in the fight against the negative impacts of climate change. The Ministry of Ecology, Spatial Planning and Urbanism completed the process of revising the Nationally Determined Contribution (NDC), which set a new goal for reducing greenhouse gas emissions by 35% by 2030 compared to 1990. Montenegro has also initiated development of the National Adaptation Plan (NAP), in order to identify medium- and long-term needs for adaptation to climate change and to establish a coordination system for implementation of climate change adaptation measures. The Ministry of Ecology, Spatial Planning and Urbanism, together with the Ministry of Capital Investments, has continued to work on the National Energy and Climate Plan (NECP), a draft of which is nearly complete. The plan will enable the implementation of necessary measures to meet the strategic goals by 2030. Transition to a low-carbon economy by 2050 is still our goal. The Third Biennial Climate Change Report (TBUR) has additionally strengthened national capacities, partnerships and cooperation with related sectors. It has improved general knowledge, increased the participation of all relevant stakeholders, and increased awareness of climate change and its impacts. Montenegro will continue to make efforts to remain ambitious as regards the fight against climate change, so as to ensure prosperity for present and future generations. We will continue to develop our responses to the climate change policy and review our progress towards the goals, in line with Montenegro’s commitments under the United Nations Framework Convention on Climate Change and the Paris Agreement. On behalf of the Ministry of Ecology, Spatial Planning and Urbanism, I would like to express my sincere gratitude to all key stakeholders, national experts and all individuals involved in the process of preparing this important document, for their commitment and dedication. As the Minister of Ecology, Spatial Planning and Urbanism, I am honoured to deliver the Third Biennial Update Report of Montenegro on Climate Change (TBUR).
Ratko Mitrović Minister of Ecology, Spatial Planning and Urbanism
3
Acknowledgement
UNDP partners with people at all levels of society to help build nations that can withstand crisis, and drive
and sustain the kind of growth that improves the quality of life for everyone. On the ground in some 170
countries and territories, we offer a global perspective and local insight to help improve lives and build
resilient nations.
Short extracts from this publication may be reproduced unaltered without authorization, on the condition
that the source is indicated.
The Third Biennial Update Reports is the product of cooperation between the Ministry of Ecology, Spatial
Planning and Urbanism and UNDP, with financial support from the GEF.
4
Contributors
EDITOR
Anna Sikharulidze – consultant, UNDP
EXECUTIVE SUMMARY
Anna Sikharulidze – consultant, UNDP
NATIONAL CIRCUMSTANCES
Snežana Dragojević – project manager, UNDP
Olgica Apostolova – consultant for gender and climate change, UNDP
Sanja Elezović – consultant for gender and climate change, UNDP
GHG INVENTORY
Irena Tadić – Environment Protection Agency – Montenegro
Duško Mrdak – Environment Protection Agency – Montenegro
Vesna Novaković – Environment Protection Agency – Montenegro
With the support of the expert team from the Austrian Environment Protection Agency
MITIGATION
Nebojša Jablan – Consultant, UNDP
MONITORING, REPORTING AND VERIFICATION
Justin Goodwin – “Aether”, UK
TECHNOLOGICAL, CAPACITY BUILDING AND FINANCIAL NEED AND SUPPORT RECEIVED
Jovana Drobnjak – consultant, UNDP
PROJECT COORDINATOR
Snežana Dragojević – UNDP

5
Table of Contents Foreword ........................................................................................................................................................... 2
Acknowledgement ............................................................................................................................................. 3
Contributors ...................................................................................................................................................... 4
Abbreviations .................................................................................................................................................... 8
Executive summary ......................................................................................................................................... 11
Context ....................................................................................................................................................... 11
National circumstances and institutional arrangements ........................................................................... 11
Update to the National GHG Inventory ...................................................................................................... 12
Mitigation actions and their effects ........................................................................................................... 13
Domestic MRV ............................................................................................................................................ 13
Information on support received; constraints and gaps, and related financial, technical, and capacity
needs .......................................................................................................................................................... 14
Other relevant information ........................................................................................................................ 15
Introduction ..................................................................................................................................................... 16
National circumstances and institutional arrangements ................................................................................ 17
General information ................................................................................................................................... 17
Demographic and population trends ......................................................................................................... 17
Economy and development priorities ........................................................................................................ 23
Economic sectors ........................................................................................................................................ 24
Institutional framework for climate change .............................................................................................. 31
National GHG Inventory .................................................................................................................................. 34
Overview of Montenegro’s GHG Inventory................................................................................................ 34
GHG inventory system ................................................................................................................................ 35
Key categories ............................................................................................................................................ 35
National GHG emissions and trends ........................................................................................................... 36
Emissions by sector .................................................................................................................................... 41
Uncertainty assessment ............................................................................................................................. 64
Mitigation actions and their effects ................................................................................................................ 65
National policy context .............................................................................................................................. 65
Identification of policies and measures and methodological approach .................................................... 67
Results of mitigation analysis ..................................................................................................................... 71
Detailed description of scenarios ............................................................................................................... 72
Gaps and planned improvements .............................................................................................................. 75
Domestic MRV ................................................................................................................................................. 77
Relevant MRV legislation ........................................................................................................................... 77
Montenegro’s MRV system overview ........................................................................................................ 79

6
Constraints and gaps and support needed and received ................................................................................ 89
Progress in reducing gaps and constraints during the reporting period.................................................... 89
Key challenges ............................................................................................................................................ 89
Support needed for implementation of actions in the field of climate change in Montenegro ............... 90
Overview of support received to implement actions in the field of climate change in Montenegro........ 91
Recommendations to improve the access to sources of financing in the field of climate change and
overall capacity building ............................................................................................................................. 91
Technology needs assessment and technology support received ............................................................. 92
Gender equality and climate change............................................................................................................... 93
References ..................................................................................................................................................... 100
Annexes ......................................................................................................................................................... 101
Annex 1: Detailed description of the policies and measures ................................................................... 101
Annex 2: The Action Plan for WEM and WAM Scenarios ......................................................................... 126
Annex 3: Roadmap and MRV system improvement plan ........................................................................ 129
Figures Figure 1. Migration balance rates by municipality for 2020 ........................................................................... 18
Figure 2. Land use by category in Montenegro ............................................................................................... 20
Figure 3: Distribution of high and coppice forests .......................................................................................... 22
Figure 4. Number of arrivals and overnight stays in the period 2016–2020 .................................................. 28
Figure 5. Total GHG emissions and removals, 1990–2019 .............................................................................. 37
Figure 6. GHG emissions by sector, 1990–2019 .............................................................................................. 38
Figure 7. Share of GHG emissions from sectors within total CO2eq emissions, 1990–2019 (%) .................... 38
Figure 8. Total CO2 emissions by sector, 1990–2019 (Gg) ............................................................................... 39
Figure 9. Total CH4 emissions by sector, 1990–2019 ...................................................................................... 40
Figure 10. Total N2O emissions by sector, 1990–2019 .................................................................................... 40
Figure 11. Total PFC emissions from the industrial sector, 1990–2019 .......................................................... 40
Figure 12. Total SF6 emissions from the industrial sector, 1990–2019 ........................................................... 41
Figure 13. Total HFC emissions, 1990–2019 .................................................................................................... 41
Figure 14. GHG Emissions from energy subsectors, 1990–2019 ..................................................................... 42
Figure 15. Total GHG emissions from the transport sector, 1990–2019 ........................................................ 47
Figure 16. CO2 emissions calculated by sectoral and reference approaches .................................................. 48
Figure 17. Total GHG emissions from the industry sector, 1990–2019 .......................................................... 52
Figure 18. Shares of land use in 2019 based on CLC ....................................................................................... 55
Figure 19. GHG Emissions and removals, expressed as CO2eq from the agriculture and land use subsectors,
1990–2019 (Gg) ............................................................................................................................................... 59
Figure 20. Total GHG emissions under all three scenarios (in Gg CO2eq) ....................................................... 72
Figure 21. Emission reductions by sector – WEM scenario ............................................................................. 73
Figure 22. Total GHG emissions by sector – WEM scenario ............................................................................ 73
Figure 23. Emission reductions by sector – WAM scenario ............................................................................ 74
Figure 24. Total GHG emissions by sector – WAM scenario ........................................................................... 75
Figure 25: Proposed Institutional Arrangements for the MRV System in Montenegro .................................. 80

7
Tables Table 1. Protected areas in Montenegro ........................................................................................................ 20
Table 2. Gross domestic product (2019–2020) .............................................................................................. 23
Table 3. Planned and realized production for 2019 and 2020, and plan for 2021 .......................................... 24
Table 4. Agriculture land by categories in 2020 (ha) ....................................................................................... 26
Table 5. Institutions responsible for climate change management in Montenegro ....................................... 32
Table 6. GWPs provided by the IPCC Fourth Assessment Report. .................................................................. 34
Table 7. Key categories of Montenegro’s GHG Inventory ............................................................................... 35
Table 8. Total GHG emissions by sectors for 1990–2019 ................................................................................ 36
Table 9. GHG removals 1990–2019 ................................................................................................................. 37
Table 10. Total GHG emissions by GHG, 1990–2019 ....................................................................................... 38
Table 11. Total GHG emissions from the energy sector and energy subsectors, 1990–2019 (Gg CO2eq) ...... 43
Table 12. CO2 emissions from the energy sector and energy subsectors, 1990–2019 (Gg) ........................... 44
Table 13. CH4 emissions from the energy sector and energy subsectors, 1990–2019 (Gg) ........................... 45
Table 14. N2O emissions from the energy sector and energy subsectors, 1990–2019 (Gg) ........................... 46
Table 15. Emissions from international bunkers, 1990–2019 (Gg CO2 eq) ..................................................... 47
Table 16. CO2 emissions calculated by sectoral and reference approaches ................................................... 48
Table 17. Total GHG emissions from industrial subsectors, 1990–2019 (Gg CO2eq) ...................................... 49
Table 18. CO2 emissions from industrial subsectors, 1990–2019 (Gg) ........................................................... 52
Table 19. CH4 emissions from industrial subsectors, 1990–2019 (Gg) ............................................................ 54
Table 20. Sources and sinks of GHG emissions, expressed as CO2eq from the AFOLU sector, 1990–2019 (Gg)
......................................................................................................................................................................... 56
Table 21. CO2 emissions from the subsectors of AFOLU, 1990–2019 (Gg) ..................................................... 59
Table 22. CH4 emissions from the subsectors of agriculture and the land use sector, 1990–2019 (Gg) ........ 60
Table 23. N2O from agriculture and land use subsectors, 1990–2019 (Gg) .................................................... 61
Table 24. Total GHG emissions from Sector 5 Waste, 1990–2019 (Gg CO2eq) ............................................... 63
Table 25. Overview of all policies and measures, per sector and scenario, with descriptions of individual
policies and measures ..................................................................................................................................... 68
Table 26. Assumptions for GDP growth (%) .................................................................................................... 71
Table 27: Matrix of current MRV system status .............................................................................................. 81
Table 28. Overview of received support in the field of climate change in the period 2019–2021 ................. 91
Table 29. Roadmap for the improvement of Montenegro’s MRV system .................................................... 129
Table 30. Improvement plan for Montenegro’s MRV system ....................................................................... 133
8
Abbreviations
2006 IPCC Guidelines 2006 IPCC Guidelines for National Greenhouse Gas Inventories AD activity data AFOLU Agriculture, Forestry and Other Land Use BTR Biennial Transparency Report BUR Biennial Update Report CBIT Capacity-Building Initiative for Transparency CLC Corine Land Cover COVID-19 2019 coronavirus disease DCC Division for Climate Change EF emission factor EPA Environmental Protection Agency EPCG Electric Power Utility of Montenegro ETF enhanced transparency framework ETS Emissions Trading System EU European Union FAO Food and Agriculture Organization GCF Green Climate Fund GDP gross domestic product GEF Global Environment Fund GHG greenhouse gas GWP global warming potential ICA international consultation and analysis INDC Intended Nationally Determined Contribution IPA Instrument for Pre-Accession Assistance IPCC Intergovernmental Panel on Climate Change IPPU Industrial Processes and Product Use KAP Podgorica Aluminium Plant LPG liquified petroleum gas LULUCF Land Use, Land Use Change, and Forestry MAFWM Ministry of Agriculture, Forestry, and Water Management MCI Ministry of Capital Investments MED Ministry of Economic Development MESPU Ministry of Ecology, Spatial Planning and Urbanism MFSW Ministry of Finance and Social Welfare MONSTAT Statistical Office of Montenegro MRV measurement, reporting and verification MSW municipal solid waste NAP national climate change adaptation plan NC National Communication NCCS National Climate Change Strategy NDC Nationally Determined Contribution NECP Integrated National Energy and Climate Plan NEEAP National Energy Efficiency Action Plan NGO non-governmental organization NIR National Inventory Report Non-Annex I Party Party not included in Annex I to the Convention PPCA Powering Past Coal Alliance SDG Sustainable Development Goal TPP thermoelectric power plant

9
TTE team of technical experts QA quality assurance QC quality control UNDP United Nations Development Programme UNFCCC United Nations Framework Convention on Climate Change WAM “with additional measures” WEM “with existing measures” WOM “without measures”

10
Chemical formulae
C carbon
CH4 methane
CO carbon monoxide
CO2 carbon dioxide
CO2 eq carbon dioxide equivalents
HFC hydrofluorocarbon
NF3 nitrogen trifluoride
N2O nitrous oxide
NOX nitrogen oxides
PFC perfluorocarbon
SF6 sulphur hexafluoride
SOx sulphur oxides
SO2 sulphur dioxide
NMVOC non-methane volatile organic compound
Units
cm centimetre (10-2 metres)
Gg = kt gigagram (109 grams)
GWh gigawatt-hours (109 watt-hours)
ha hectare
kg kilogram (103 grams)
km kilometre (103 metres)
kt kiloton (109 grams)
ktoe kiloton of oil equivalent
l litre
m metre
s second
t ton (106 grams)

11
Executive summary
Context Montenegro, as a non-Annex I Party to the UNFCCC, is mandated by paragraph 41 (f) of Decision 2/CP.17 to
submit its BUR every two years. Montenegro has submitted two BURs, in 2016 and 2019, and successfully
underwent the mandatory ICA process. This report is Montenegro’s third BUR. The report is prepared
according to the MRV arrangements under the Convention, with the vision for preparation for the transition
to the ETF under the Paris Agreement.
National circumstances and institutional arrangements Montenegro is located in the south-eastern part of Europe and according to its latitude belongs to the
southernmost part of Europe, the Mediterranean. It is located at the junction of two significant geographical
units – the Dinarides and the central Mediterranean.
Montenegro has a parliamentary political system. The capital of Montenegro is Podgorica, which is also the
largest city. The summary of key national indicators is given in Table ES1.
Table ES1. Summary of national circumstances of Montenegro
Topic Description
Territory Surface area: 13,812 km2, divided into 24 political-territorial units.
Population In 2020: 621,306. Growth rate: −0.02%.
Climate Mediterranean with warm and somewhat dry summers, and mild and rather humid winters.
Water resources Average annual runoff: 624 m3/s (i.e. a volume of 19.67 billion m3).
Average specific runoff: 43 litres/s/km. Of its total runoff, about 95% is from inland water and the remaining 5% is from transit water.
Land use Of the total territory of Montenegro:
• Forests: 64%
• Arable: 14%
• Pastures: 9% Protected areas: 185,269.69 ha.
Economic indicators GDP:
• 2020: €4,186 million
• 2019: €4,951 million GDP per capita:
• 2020: €6,737
• 2019: €7,959
NDC goal To decrease GHG emissions by 35% by 2030, in comparison to 1990.
The MESPU is the main national entity responsible for national environmental and climate change policy and
the National Focal Point to the UNFCCC.
The CCD at the MESPU is responsible for submitting national reports (NCs and BURs) to the UNFCCC. Up to
the end of 2021, development of the NCs/BURs was fully supported by UNDP, which hired and coordinated
the experts, through GEF-funded projects. As of 2022, the MESPU will be fully in charge of the development
of NCs and BTRs, while UNDP will have an oversight role.

12
Update to the National GHG Inventory For the third BUR the National GHG Inventory covers the period 1990–2019. The National GHG Inventory
was conducted using the methodological guidance in the 2006 IPCC Guidelines for National GHG Inventories.
The GHG Inventory incorporates anthropogenic emissions by sources and removals by sinks of CO2, CH4, N2O,
PFCs, HFCs and SF6 in the energy, IPPU, AFOLU and waste sectors.
Montenegro’s total GHG emissions in 2019 equalled 3,623.25 Gg CO2eq and are 3.2% more than the 2018
levels. The net GHG emissions in 2019 were 1,119.31 Gg CO2eq – 13.0% less than the 2018 levels. The energy
sector has consistently been the most significant emission source, followed by the IPPU and agricultural
sectors and a small share of the waste sector. The deviation observed for 1995 was a result of a decline in
industrial production as well as of the disconnection of the thermoelectric power plant from the national
energy system. The share of emissions from the energy sector ranges from 38.2% in 1995 to 74.6% in 2019.
The share of emissions from sector industrial processes and product use ranges from 10.4% in 2019 to 33.7%
in 2000. GHG emissions from the agricultural sector range from 7.5% in 2019 to 29.2% in 1995, while the
waste sector has the smallest share of total emissions, ranging from 7.5% in 2019 to 11.9% in 1995.
Table ES2: Trends of GHG emission by sector
Year Net emissions (Gg CO2 eq) Total emissions
without sinks
(Gg CO2 eq)
Energy
IPPU
AFOLU
Waste
Total
1990 2,748.26 1,704.68 −968.35 217.97 3,702.56 5,292.40
1991 2,624.50 2,206.15 −1,314.96 222.37 3,738.05 5,673.14
1992 1,859.10 1,422.12 −953.02 226.66 2,554.85 4,087.16
1993 1,567.50 543.76 −1,668.57 230.89 673.57 2,898.37
1994 1,390.88 135.53 −1,180.70 235.05 580.76 2,328.42
1995 771.55 418.51 −1,036.90 239.70 392.86 2,018.49
1996 1,818.33 1,002.21 −1,247.61 244.78 1,817.71 3,649.67
1997 1,708.46 1,533.24 −2,016.17 250.20 1,475.73 4,061.63
1998 2,092.57 1,167.70 −2,116.18 255.15 1,399.24 4,078.73
1999 2,264.10 1,222.78 −2,056.81 260.06 1,690.13 4,313.01
2000 2,285.04 1,579.41 −1,516.49 264.92 2,612.87 4,681.58
2001 1,924.95 1,659.46 −2,049.17 268.97 1,804.21 4,393.71
2002 2,503.63 1,612.45 −2,213.80 272.54 2,174.82 4,940.36
2003 2,456.86 1,380.59 −2,100.98 275.26 2,011.73 4,656.91
2004 2,480.59 1,272.88 −2,279.56 276.99 1,750.90 4,414.78
2005 2,272.63 1,167.11 −2,079.33 277.85 1,638.26 4,099.20
2006 2,469.45 1,291.38 −1,740.48 278.05 2,298.40 4,410.83
2007 2,324.32 1,414.15 −1,529.91 279.40 2,487.95 4,364.29
2008 2,911.28 1,565.61 −1,954.80 279.25 2,801.34 5,094.81
2009 1,934.38 603.63 −2,506.03 276.94 308.91 3,136.85
2010 2,690.59 795.64 −2,214.54 275.77 1,547.47 4,071.72
2011 2,816.92 752.29 −429.55 275.34 3,415.00 4,131.71
2012 2,680.96 539.12 −1,788.35 270.75 1,702.48 3,774.16
2013 2,477.19 401.61 −2,126.30 269.64 1,022.14 3,441.41
2014 2,347.67 395.06 −2,205.03 270.24 807.94 3,314.35
2015 2,551.11 385.96 −2,072.72 269.34 1,133.68 3,507.82
2016 2,388.97 376.18 −2,073.98 269.60 960.77 3,330.64
2017 2,525.25 391.83 −1,523.83 260.33 1,653.58 3,462.82
2018 2,796.59 393.52 −2,177.53 274.68 1,287.25 3,743.49
2019 2,701.70 376.89 −2,232.37 273.08 1,119.31 3,623.25
CO2 is the most dominant direct greenhouse gas on a gas-by-gas basis and is followed by CH4, N2O, HFCs,
PFCs and SF6. At 2,670.01 Gg, CO2 constituted 73.7% of the overall national greenhouse emissions in 2019.
The rest of the emissions was CH4 (16.7%), N2O (1.7%), and other GHGs make up the remaining difference.

13
Montenegro performed trend and level assessments on the GHG emission results to identify key categories.
The level and trend assessments together, with and without Land Use, Land Use Change, and Forestry
(LULUCF) produced 25 key category sources and removals.
Mitigation actions and their effects The revised NDC, adopted by the Government of Montenegro and submitted to the UNFCCC Secretariat in
June 2021, represents the country’s increased political commitment to cut GHG emissions. In line with the
revised NDC, Montenegro has set the new target of reducing its GHG emissions by 35% by 2030, compared
to 1990 (excluding LULUCF), i.e. reducing its GHG emissions by 2,117 Gg CO2eq by 2030. Several strategic and
planning documents have been adopted to enable Montenegro achieve its climate and EU accession targets.
Having examined all the national strategic and planning documents, 25 mitigation policies and measures
were identified: 17 in the energy sector; four in the sector of industry and product use; two in the agricultural
sector; and two in the waste sector. These policies and measures were then analysed using three scenarios
and related projections: 1) WOM; 2) WEM; and 3) the more ambitious mitigation scenario – WAM, for the
period 2022–2030. The development of all three scenarios was guided by the same principle, reflecting
different levels of ambition concerning mitigation and the different paces of the energy transition.
The energy sector analysis employed the software tool developed by Aether UK Ltd for the purposes of the
TNC; IPCC software was used for the non-energy sectors.
The main results of the performed analysis are summarized below:
• Under the WOM scenario, total GHG emissions from all sectors are expected to drop by 22.91% by
2030 compared to 1990. In addition to that, the fastest-growing sector in terms of emissions is the
waste sector, with a 137% rise by 2030 against the levels from 1990.
• Under the WEM and WAM scenarios, total GHG emissions in 2030 will drop by 15.70% and 28.69%,
respectively, against the WOM scenario.
• Under the WEM and WAM scenarios, total GHG emissions by 2030 will drop by 35.02% and 45.03%,
respectively, compared to the base year of 1990.
• Under the WEM scenario, future GHG emissions peak in 2025, at 3,511 Gg CO2eq; under the WAM
scenario, they peak in 2024, at 3,463 Gg CO2eq.
• The WEM scenario envisages a 7.01% drop in the GHG emissions from the energy sector compared
to the level in 1990, and a 6.88% rise in the waste sector, also compared to 1990; the emissions from
the IPPU and agriculture sectors will drop by 76.24% and 63.31%, respectively, compared to 1990.
• The energy sector still predominates in both mitigation scenarios, with the respective shares of
75.11% (WEM) and 72.28% (WAM) out of total emissions in 2030. Still, set against the reference
WOM scenario, the GHG emissions from energy under the WEM scenario are 36.68% lower, while
the GHG emissions under the WAM scenario are 48.46% lower in 2030. For this reason, most of the
proposed mitigation policies and measures relate to the energy sector.
Montenegro has not been involved in any project supported by international market mechanisms.
Domestic MRV The focal point for national and international climate change is the Directorate for International Cooperation,
EU Integration and Climate Change within the MESPU. Within the Directorate, the DCC is responsible for
coordinating and managing Montenegro’s MRV system.
The development of Montenegro’s MRV system into a fully functional tool to support the country with
national-level climate-related decision making and an array of reporting, is analysed in the third BUR. The
analysis and proposed MRV system cover all the important areas, such as: steering committee and national
council; GHG inventory preparation; mitigation actions; projections; support and climate finance; and

14
adaptation. The developed roadmap for improvement of Montenegro’s MRV system incorporates the
development of systems for the tracking of climate mitigation and adaptation action, its support and finance
and its wider impacts on sector-based national strategies and SDGs. The roadmap is geared towards
supporting the development of the MRV system in time for the production of key international outputs
(which attract development funds and require the development and updating of data curated by the MRV
system). These output milestones provide a useful focus for the development of the MRV system.
Furthermore, Montenegro is developing an online MRV management portal. This portal will provide a
management overview for the MRV system and consist of components that structure data, support good-
practice activities and reinforce institutional memory. The portal will provide a coordination platform for
managing information on stakeholders, engagement activities, datasets, QA/QC activities, climate actions
and vulnerabilities, impacts, wider benefits, document storage and improvements to the MRV system. As a
result, the portal will improve communications between stakeholder organizations and allow the MESPU to
better link data to policies. The portal will be an important aspect of the MRV system and will help to produce
transparent outputs such as NDCs, BURs, NCs and NAPs.
Information on support received; constraints and gaps, and related financial, technical, and capacity needs The reporting period was marked by the outbreak of the COVID-19 pandemic, which led to a serious and still-
ongoing health and economic crisis in Montenegro. The new reality has brought disruptions in all spheres of
social life. However, even in such challenging conditions, the implementation of international and national
commitments in the field of climate change has continued, as evidenced by the number of initiated and
adopted strategically important documents (revised NDC, NECP, NAP).
Owing primarily to the support from international institutions, the greatest progress has been made in
enhancing the capacity needed to design long-term policies in the field of climate change, enhancing the
capacity needed to access funding sources at the national and local levels, as well as in continuing to enhance
the capacity for the preparation of GHG inventories in the competent institution.
The key challenges are still in the area of the permanent need to build and enhance the capacity to plan and
implement climate policy, which must be increasingly integrated into all relevant national policies and
strategies. This refers to all key aspects in the field of climate change, such as: a Greenhouse Gas Inventory
and reporting capacities, climate change mitigation and adaptation policies and the establishment of a
functioning MRV system, including the MRV system for market mechanisms that contribute to GHG emission
reduction, i.e. for the ETS system which has been partially established in Montenegro. Also, Montenegro
continues to rely on the technical assistance for modelling greenhouse gas emissions, as well as for modelling
climate change impact at the national and local levels. As these activities require special expertise and skills,
and in the absence of a national education programme and training in this area, the national institutions are
expected to continue to rely on technical assistance from international institutions.
The estimated financial needs to achieve the national goal of reducing GHG emissions set in the Revised NDC
for the period until 2030 is €2,655.31 million. The total value of projects proposed as priority activities for
Montenegro’s cooperation with the GCF for the period 2021–2023 amounts to US$176 million, where the
GCF is expected to provide support amounting to US$75.4 million, while the rest is projected co-financing.
Finally, the funds required to reach environmental standards that would ensure accession to the European
Union are estimated at €482,996,838. Specifically, for the field of climate change, the estimated funds
amount to €87,348,790, of which donors are expected to provide €2,145,000 as their support.
During the reporting period (2019–2021), Montenegro received US$3,492,767 for the implementation of
climate change projects. Of this amount, US$352,000 was received from the GEF to support the preparation
of the Third BUR.

15
Montenegro adopted its “Technology Needs Assessment for Climate Change Mitigation and Adaptation
National Strategy and Action Plan” in 2012 and has not conducted a more recent assessment of its climate
technology needs. Montenegro so far has not actively participated in, or benefited from, the available
support offered by the UNFCCC Technology Mechanism.
Other relevant information Montenegro achieved significant progress in intersecting gender and climate change in the gender equality
policy framework, more specifically the National Gender Equality Strategy 2021–2025 with the Action Plan
2021–2022 of Montenegro. This Strategy intersects gender and climate change only in the health sector,
while the other climate-related sectors are missing.
In 2021, as a part of the preparations for the Third BUR, UNDP in cooperation with the MESPU developed
two assessments which reflect the main characteristics and capacities of state and non-state actors to
participate in the creation, implementation and monitoring of climate change policies and action through
intersecting gender and climate change. The first assessment – Gender Analysis – concentrated on assessing
the capacities of the national institutions dealing with climate change to integrate gender equality
considerations within climate change policies. The second assessment – Gender Capacity Assessment of Civil
Society – was primarily focused on environmental/climate change NGOs on one side, and NGOs working on
the protection and empowerment of women and marginalized groups on the other.
As a result of these, assessment recommendations have been produced for developing a systematic
approach of intersecting gender and climate change at the policy level, through ensuring inter-institutional
cooperation, by the provision of training tools for strengthening the capacities of the institutions in the
direction of implementing concrete gender-responsive climate actions and gender-responsive climate
financing. Another set of recommendations was produced for local NGOs to improve their capacities in
raising public awareness and mobilizing the participation of local women, men and vulnerable groups in
adaptation and mitigation policies.

16
Introduction Montenegro became a party to the UNFCCC as a non-Annex-I Party in October 2006, acceded to the Kyoto
Protocol on 27 June 2007 and ratified the Paris Agreement on 20 December 2017. Montenegro submitted its
INDC in December 2017 and its revised NDC in June 2021.
Montenegro has submitted three NCs to the UNFCCC, in 2010, 2015 and 2020 respectively. The Fourth NC is
planned to be submitted in 2025. In addition, Montenegro has submitted two BURs, in 2016 and 2019.
Montenegro’s Second BUR was analysed by a team of technical experts during 27–31 May 2019. After the
publication of its summary report, Montenegro participated in the ninth workshop for the facilitative sharing
of views, convened virtually on 24–27 November 2020.
This report represents Montenegro’s Third BUR submitted in accordance with Decision 2/CP.17. The report
has been prepared according to the guidance provided in:
• UNFCCC Guidelines for the preparation of National Communications from parties not included in
Annex I to the Convention. Decision 17/CP.8 (FCCC/CP/2002/7/Add.2);
• UNFCCC Biennial Update Reporting guidelines for parties not included in Annex I to the Convention
(Decision 2/CP.17, FCCC/CP/2011/9/Add.1, Annex III).
The current BUR has been prepared also in the light of the ‘Modalities, procedures and guidelines for the
transparency framework for action and support referred to in Article 13 of the Paris Agreement’ which will
be in place from 2024 onwards.

17
National circumstances and institutional arrangements
General information Montenegro is located in the south-eastern part of Europe and, on the basis of its latitude, belongs to the
southernmost part of Europe, the Mediterranean – one of the most beautiful parts of Europe and the
world. It is located at the junction of two significant geographical units – the Dinarides and the central
Mediterranean.
The area of Montenegro is very complex in terms of its landscape and has many natural contrasts. The
distance between the southernmost and northernmost points of the mainland of Montenegro is 192 km,
as the crow flies, and the distance between the westernmost and the easternmost points is 163 km. The
surface area of Montenegro is 13,812 km2.
Montenegro has a parliamentary political system. Administratively, it is divided into 24 political-territorial
units – municipalities – which perform the function of local governance. The capital of Montenegro is
Podgorica, which is also the largest city (with 186,000 inhabitants), while the city of Nikšić is the second-
largest (with 72,450 inhabitants).
Demographic and population trends According to the 2011 census, the population of Montenegro was 620,029, which gives a population
density of 44.9 inhabitants per square km. The annual population growth is negative when compared to
the 2003 population census; statistics show a negative growth rate of about 0.02%. Of the total
population, 306,236 are male and 313,793 are female.
The most recent statistics show that in mid-2020 there were 621,306 inhabitants in Montenegro,
composed of the following:
• Children (0–17 years) make up 21.6% (134,363) of the total population;
• People aged 15–64 make up 66.3% (412,085) of the total population;
• People aged 65 or over make up 15.8% (97,985 people) of the total population.
• Life expectancy at birth in 2020 was 75.9 years.1
There are about 1,256 settlements in the country, of which 40 settlements are of a city type, where about
62% of the population lives, while the rest of the population live in rural settlements. Out of the total
number of females, 65.5% live in urban areas, while for males this percentage is 63.2%.
In 2020, the migration rate was 8.0%, continuing the upward trend in population movements. Migration
is mainly related to the movement of the population from rural to urban settlements, and the negative
consequences are twofold: on one hand there is increasing pressure on resources in urban regions, and
on the other hand rural areas are being left without a population, especially in the mountainous parts –
pastures are overgrown, land is left uncultivated, and is overgrown with weeds and forest vegetation. This
further leads to a decrease in investment in uninhabited areas and lower development of these parts of
Montenegro.
Figure 1 shows the migration balance by municipality in 2020. Eleven municipalities in Montenegro
recorded a growth in population, while the highest decline was recorded in Bijelo Polje. The coastal area
is the densest and most developed part of Montenegro. According to the 2011 census, there were 148,683
inhabitants, which is 3.7% more than in 2003.
1 Source: MONSTAT, demographic projections.

18
FIGURE 1. MIGRATION BALANCE RATES BY MUNICIPALITY FOR 20202
Climate profile Montenegro is located in the central part of a moderately warm zone in the northern hemisphere
(latitudes 41° 52’ to 43° 32’ N and longitudes 18° 26’ to 19° 22’ E). Owing to its latitude, i.e. its proximity
to the Adriatic and Mediterranean Seas, it has a Mediterranean climate with warm and somewhat dry
summers, and mild and rather humid winters. The weather and climate in Montenegro are greatly
influenced by the Genoese Cyclone, the Adriatic Cyclone, the Icelandic Depression, the Black Sea
Depression, the Azores Anticyclone, the Siberian Anticyclone, the Central European Anticyclone, the cold
frontal system from the north – the Arctic Cold Front, and the warm, tropical front from the south.
Additionally, large bodies of water, its altitude and the position of its coastal mountains, along with the
relief of its terrain, affect both its local and regional climates; thus within a small area there are large
differences between the climates in the coastal and high mountain regions.
The dominant climate types in Montenegro are:
• Maritime
• Continental
• Mountainous
The large water surface, the height and direction of the coastal mountains, and the relief of the land locally
and regionally affect its climate, creating, in a small area, large differences between the climate of the
coastal region and the climate of the highland region, with numerous transitional forms of the local
climate.
The mean annual air temperature ranges from 4.6°C in the area of Žabljak at an altitude of 1,450m, to
15.8°C on the coast. The average annual rainfall ranges from 800 mm in the far north to about 5,000 mm
in the far southwest.
During the year, there are between 115 and 130 days of rainfall on average and 172 days of rainfall in the
northern regions of Montenegro. The rainiest month on the coast is November, and the driest is July.
Snow cover forms at altitudes above 400 m, and with a depth of more than 50 cm it lasts on average from
2 Source: MONSTAT, 2021.
1000
800
600
400
200
0
-200
-400
-600

19
10 days (in Kolašin) to 76 days (in Žabljak). In mountainous areas, snow falls much more frequently in the
spring than in the autumn.
Water resources Surface water
The surface area of Montenegro is 13,812 km2 and, if its corresponding part of the Adriatic Sea (2,540 km)
is also taken into account, it totals 16,352 km2. Water from the territory of Montenegro drains into two
basins: the Adriatic Sea and the Black Sea.
The total surface area of the Black Sea Basin is 7,545 km2 or 54.6% of Montenegro’s territory. This part of
Montenegro drains through the River Ibar and further on to the Western Morava River towards the
Danube, as well as through the Rivers Tara, Piva, Lim, and Ćehotina towards the Rivers Drina and Danube.
The Montenegrin part of the Adriatic Sea basin is about 6,560 km2 in area, or 45.4% of the territory. The
biggest watercourses of this basin are the Rivers Zeta and Morača – which become the River Morača after
the confluence of these two rivers in Podgorica – and the River Bojana, which forms the border with
Albania.
In Montenegro, there are significant differences in the distribution and abundance of water resources
ranging from arid karst areas to areas rich in both surface and ground water. Generally speaking, with an
average annual runoff of 624 m3/s (i.e. a volume of 19.67 billion m3), the territory of Montenegro is
considered to be an area that is rich in water. The average specific runoff is about 43 litres/s/km. Of this
total runoff, about 95% is from inland water, whilst the remaining 5% is from transit water.
The rivers drain into two basins: the Black Sea and the Adriatic Sea. The major rivers of the Black Sea Basin
are the Lim (the longest river, 220 km long), the Tara (146 km), the Ćehotina (125 km) and the River Piva
(78 km). The rivers that run into the Adriatic Sea basin are the Morača (99 km), the Zeta (65 km) and the
Bojana (40 km). The water balance of the Adriatic Sea basin without the River Bojana is 256 m3/s in total
and together with the River Bojana is 670 m3/s in total. The water balance of the Black Sea basin is 242
m3/s in total.
Natural lakes are also an important water resource. The most significant of these are Lake Biograd (area
of 0.23 km2), Lake Plav (1.99 km2), Black Lake (0.52 km2), Lake Šas (3.6 km2) and Lake Skadar. The surface
area of Lake Skadar, depending on its water level, varies from about 360 to over 500 km2, while the volume
of the lake ranges from 1.7 to 4.0 km3. The largest artificial reservoir is Lake Piva with a total accumulation
capacity of 880 million m3. Other significant accumulations include Lakes Slano, Krupac and Vrtac (225
million m3) and Otilovići (18 million m3). Wetlands can generally be found in the areas around the lakes
and to a lesser extent in coastal areas. The most important wetland area is located in the vicinity of Lake
Skadar and is listed as an internationally important area (based on the Ramsar Convention).
Ground water
Ground water in Montenegro is present in rocks of different ages, from the Palaeozoic Era to the
Quaternary Period. It is a very important resource that represents the only practical source of water for
the population. In addition to supplying water to the population, ground water is also used in industry, as
well as in agriculture. Seventy-five sources are used to provide public water supplies to 40 urban
settlements; 21 of these are municipal centres and there are also a large number of suburbs. Of the total
number of sources, ground water from karst aquifers is abstracted from 64 of them and ground water
from inter-granular aquifers is abstracted from 11 sources.
Land use According to data from the Corine Land Cover database as well as the MONSTAT Statistical Yearbook, 64%
of the total territory of Montenegro is covered by forests, 14% is arable land and 9% is pastures.

20
Agricultural land in Montenegro covers an area of 309,241 hectares and represents 22.4% of the territory
(95.2% is family farms and 4.8% is registered agricultural businesses) and is very fragmented.
More than 90% of the surface area in Montenegro is more than 200 metres above sea level, 45% is less
than 1,000 metres above sea level, and mountainous areas above 1,500 metres above sea level cover
about 15% of the state’s territory. The geological structure of Montenegro is characterized by rocks of
different ages. Limestone, dolomite and igneous rocks account for almost two-thirds of its surface are.
The hydrogeological characteristics are determined by the geological structure of the terrain. Due to the
composition of the rocks, precipitation quickly penetrates into the ground, feeding both confined and
unconfined karst aquifers that discharge into the zones of erosion bases, the sea, Lake Skadar, and along
the rim of the Zeta-Bjelopavlići plain, Nikšić Field, and the area adjacent to the watercourse beds.
Figure 2 shows the share of different types of land use in Montenegro.
FIGURE 2. LAND USE BY CATEGORY IN MONTENEGRO3
In Montenegro, 185,269.69 ha, or 13.41% of the territory on land is located in protected areas (Table 1).
The national parks: Durmitor, Lake Skadar, Lovćen, Biogradska gora and Prokletije occupy a total of
100,427 ha (7.27%), while nature reserves cover 79,583.10 ha, or 5.76% of the territory.
TABLE 1. PROTECTED AREAS IN MONTENEGRO4
Type of protected area Number Area on land/% of
Montenegro
Strict nature reserve 3 420.00 ha
0.030 %
National park 5 100,427.00 ha
7.271 %
Special nature reserve 1 150.00 ha
0.011 %
3 Source: MONSTAT, 2021.
4 Source: http://prirodainfo.me/Izvjestaji/PoVrstiZasticenogPodrucja.

21
Nature reserve 6 79,583.10 ha
5.762 %
Natural monument 56 4493.54 ha
0.325 %
Region of exceptional value 2 196.05 ha
0.014 %
Total 73 185,269.69 ha
13.414 %
Forests Data from the National Forest Inventory prepared in 2010 shows that forests cover 60% of the territory
of Montenegro, while forest soil covers an additional 9.7%, which represents a significant part of the
country’s territory.
Montenegro is among the top-three most forested countries in Europe, falling close behind Finland (86%)
and Sweden (67%). The forest cover is far above the average European (46%) and world (30%) levels of
forest cover. The high percentage of forest cover represents a big advantage in terms of environmental
protection and improvement, and is also positive in terms of adapting ecosystems to meet future changes.
Orographic features and the refugial character of many habitats have made the abundance and diversity
of wildlife (flora and fauna) a quality specific to Montenegro. The floristic diversity comprises 3,250 plant
species and the index (S/A-species/area) of 0.837 makes Montenegro one of the most important
biodiversity centres in Europe. The refugial character of habitats predominates; however, there is also
evidence that species of flora and fauna that are endemic in Europe, Alpine, and in other Mediterranean
regions are also present here.
Major diversity in terms of dendroflora is illustrated by the fact that the National Forest Inventory
registered 68 species of trees (57 broadleaf and 11 coniferous species). Woody species form pure and
mixed forests and cover 59.9% (832,900 ha), while forest land covers an additional 135,800 ha or 9.8%,
which represents 69.7% of the territory of Montenegro. When comparing the data from the National
Forest Inventory (NFI) with the data from the Spatial Plan of Montenegro to 2020, which states that
forests and forest land cover an area of 738,000 ha or 53.4%, an increase of 16.3% is evident.
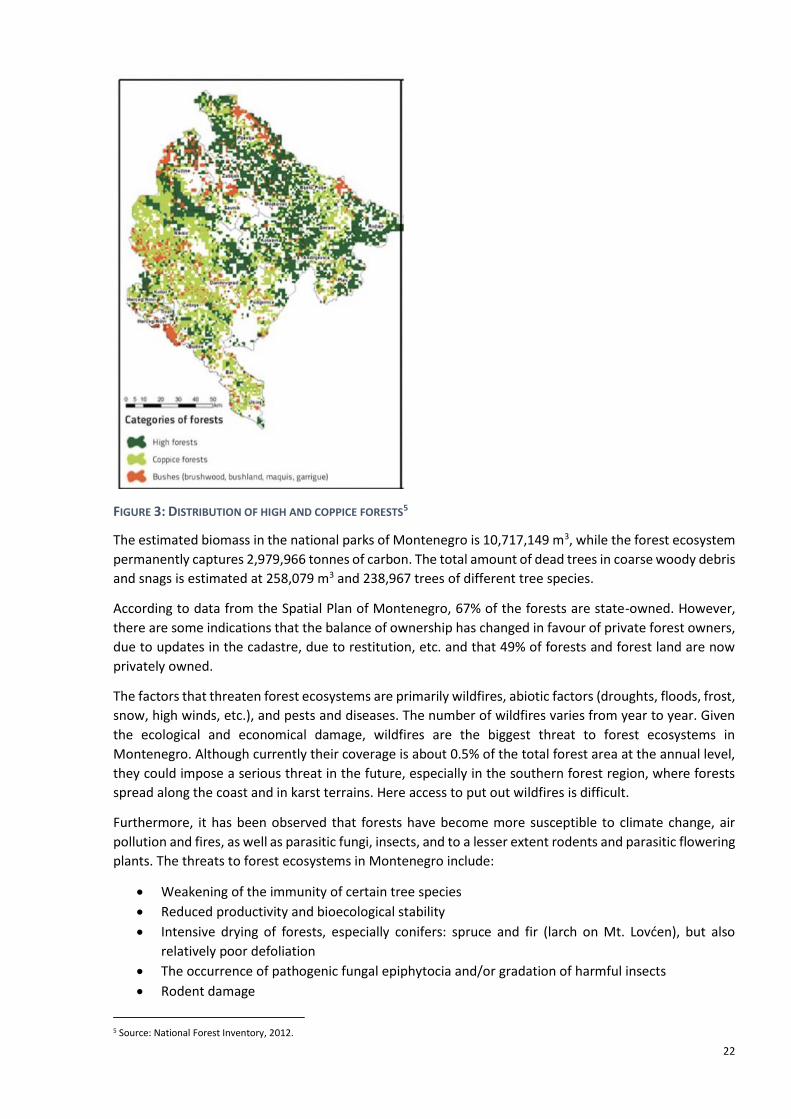
Dominant species in the forest include beech, spruce, fir and black pine. Figure 3 shows the distribution
of high forests and coppice forests.
Most of the high-forest areas are in the northern part of Montenegro. Coppice forests are a characteristic
of the central and coastal parts of the country, while on the coast there are substantial areas of forest
underbrush and small areas occupied by wild scrubland and degraded forest formations (Figure 3). High
forests cover 61%, shoots cover 12%, shrubs 13%, and forest land 14% of the total forest area. In the
national parks (Lake Skadar, Lovćen, Biogradska Gora, Prokletije and Durmitor), forests (37,125 ha) and
forest land (2,825 ha) cover 40.5% of the area. Compared to the total area under forests in Montenegro,
this is 53.7% of forests and 14.6% of forest land in the Emerald Network zone. In national parks, 66% of
the area under forests is high forest (24,475 ha). Conifer forests cover 20.4% (7,575 ha), shrubs 13.6%
(5,050 ha), while artificially raised communities cover 25 ha. The dominant share of self-renewing stands
indicates a still high level of bioecological stability and productivity, especially in the national parks of
Biogradska Gora, Prokletije, and Durmitor, in which forest ecosystems were one of the basic motives for
declaring and establishing their status as national parks. The percentage of the area where young trees
are registered can be considered favourable in relation to the total forest structure.
22
FIGURE 3: DISTRIBUTION OF HIGH AND COPPICE FORESTS5
The estimated biomass in the national parks of Montenegro is 10,717,149 m3, while the forest ecosystem
permanently captures 2,979,966 tonnes of carbon. The total amount of dead trees in coarse woody debris
and snags is estimated at 258,079 m3 and 238,967 trees of different tree species.
According to data from the Spatial Plan of Montenegro, 67% of the forests are state-owned. However,
there are some indications that the balance of ownership has changed in favour of private forest owners,
due to updates in the cadastre, due to restitution, etc. and that 49% of forests and forest land are now
privately owned.
The factors that threaten forest ecosystems are primarily wildfires, abiotic factors (droughts, floods, frost,
snow, high winds, etc.), and pests and diseases. The number of wildfires varies from year to year. Given
the ecological and economical damage, wildfires are the biggest threat to forest ecosystems in
Montenegro. Although currently their coverage is about 0.5% of the total forest area at the annual level,
they could impose a serious threat in the future, especially in the southern forest region, where forests
spread along the coast and in karst terrains. Here access to put out wildfires is difficult.
Furthermore, it has been observed that forests have become more susceptible to climate change, air
pollution and fires, as well as parasitic fungi, insects, and to a lesser extent rodents and parasitic flowering
plants. The threats to forest ecosystems in Montenegro include:
• Weakening of the immunity of certain tree species
• Reduced productivity and bioecological stability
• Intensive drying of forests, especially conifers: spruce and fir (larch on Mt. Lovćen), but also
relatively poor defoliation
• The occurrence of pathogenic fungal epiphytocia and/or gradation of harmful insects
• Rodent damage
5 Source: National Forest Inventory, 2012.
23
• The appearance of mistletoe
• The occurrence of forest fires
• Snowstorms, windbreaks and frost
• The impact of air pollution
• Illegal logging
According to available detailed information from Montenegro’s national forest monitoring data, which is
obtained from 49 locations and covers the entire territory of Montenegro, the average health and
condition of forests is satisfactory. In most of the locations, the recorded degree of defoliation is within
expected limits (0–25%). Of all the inspected trees (1,176 trees), 43% fell into the category of no
defoliation (0–10% no defoliation), 37% showed signs of slight defoliation (10–25% slight (warning)
defoliation), and major changes in defoliation were only recorded in 20% of trees (25–60% medium
defoliation). Common insects and fungi causing tree degeneration were identified during tree inspections.
Some of these phenomena are a direct consequence of climate change, i.e. increased air temperature,
altered precipitation, more frequent droughts, storms and generally extreme weather events. Climate
change, as one of the major drivers of ecological change in forests, creates the need to review the current
forest management methods and reassess the plant and breeding methods used.
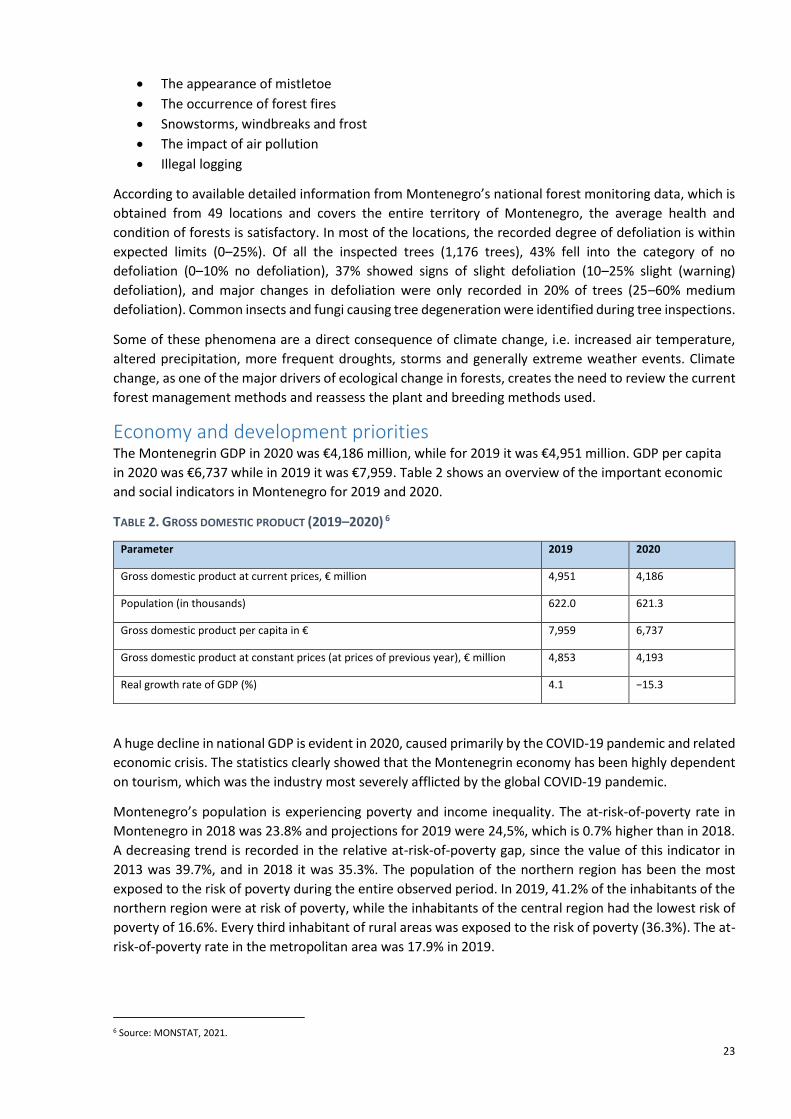
Economy and development priorities The Montenegrin GDP in 2020 was €4,186 million, while for 2019 it was €4,951 million. GDP per capita
in 2020 was €6,737 while in 2019 it was €7,959. Table 2 shows an overview of the important economic
and social indicators in Montenegro for 2019 and 2020.
TABLE 2. GROSS DOMESTIC PRODUCT (2019–2020) 6
Parameter 2019 2020
Gross domestic product at current prices, € million 4,951 4,186
Population (in thousands) 622.0 621.3
Gross domestic product per capita in € 7,959 6,737
Gross domestic product at constant prices (at prices of previous year), € million 4,853 4,193
Real growth rate of GDP (%) 4.1 −15.3
A huge decline in national GDP is evident in 2020, caused primarily by the COVID-19 pandemic and related
economic crisis. The statistics clearly showed that the Montenegrin economy has been highly dependent
on tourism, which was the industry most severely afflicted by the global COVID-19 pandemic.
Montenegro’s population is experiencing poverty and income inequality. The at-risk-of-poverty rate in
Montenegro in 2018 was 23.8% and projections for 2019 were 24,5%, which is 0.7% higher than in 2018.
A decreasing trend is recorded in the relative at-risk-of-poverty gap, since the value of this indicator in
2013 was 39.7%, and in 2018 it was 35.3%. The population of the northern region has been the most
exposed to the risk of poverty during the entire observed period. In 2019, 41.2% of the inhabitants of the
northern region were at risk of poverty, while the inhabitants of the central region had the lowest risk of
poverty of 16.6%. Every third inhabitant of rural areas was exposed to the risk of poverty (36.3%). The at-
risk-of-poverty rate in the metropolitan area was 17.9% in 2019.
6 Source: MONSTAT, 2021.

24
Economic sectors Energy generation and consumption Activities related to electricity and heat production account for the largest share of total emissions from
the energy sector.
According to the planned electricity balance for 2021, realized electricity production in 2020 was 5.64%
lower than the realized production in 2019, while the needs for electricity were 0.98% higher, which
resulted in a larger deficit in 2020 (Table 3) of about 325 GWh, while in 2019 it amounted to 166 GWh. In
2021, production is planned at 3,481.24 GWh, which is about 9% more than the realized production in
2020.
The planned gross consumption is 3,544.50 GWh, which is 1.96% lower than planned, or about 1% lower
than the realization for 2020. The planned deficit, the difference between production and consumption,
for 2021 is 63.62 GWh. The total production of electricity in Montenegro in 2021 is planned at 3,481.24
GWh, which is more than the estimated realization in 2020 by 9.09%. An overview of planned and realized
electricity production by power plants for 2019, the plan and estimated realization for 2020, as well as
the plan for 2021 with adequate comparisons, are given in Table 3.
TABLE 3. PLANNED AND REALIZED PRODUCTION FOR 2019 AND 2020, AND PLAN FOR 2021
Energy balance
2019 2020 2021
Planned Realized Ratio Planed Realized*
Ratio Planned
GWh % GWh % GWh
1. Total production 3,384.53 3,382.49 99.94 3,427.57 3,191.25 93.11 3,481.24
Hydroelectric
power plants
1,752.71 1,697.40 96.84 1,795.14 1,375.89 76.65 1,840.69
Wind power plants 312.82 293.94 93.96 312.82 322.55 103.11 320.60
Solar power plants 2.00 1.05 52.38 2.61 2.82 108.16 2.95
Thermoelectric
power plant
1,317.00 1,390.11 105.55 1,317.00 1,490.00 113.14 1,317.00
2. Difference
(production−
needs)
−166.02 −100.34 −187.93 −325.03 −63.26
3. Direct buyers 696.00 634.99 91.23 686.00 638.03 93.01 646.45
4. Distributive
buyers
2,340.55 2,341.31 100.03 2,405.00 2,392.00 99.46 2,392.00
5. Distribution
losses
334.00 356.06 106.60 329.80 327.14 99.19 312.36
6. Transmission
losses
180.00 150.47 83.59 194.50 159.11 81.72 193.70
7. Needs (3+4+5+6) 3,550.55 3,482.83 98.10 3,615.50 3,516.28 97.26 3,544.50
* data shows realization in the period Jan–Sep and plan for the period Oct–Dec
The estimated electricity production from renewables in 2020 is lower by 19.0% than in 2019, mostly due
to the poor hydrological situation and lower production at large hydroelectric power plants. For other
renewable sources, there was an increase in production, for small hydroelectric power plants 29.6% and
for solar power plants 103.88% due to the commissioning of new facilities, and for wind farms 9.9% due
to the commissioning of the full capacity of the Možura Wind Power Plant. The thermoelectric power

25
plant had production that was 7.2% higher. In 2021, it is planned that more than half of the electricity, i.e.
52.9%, will be produced from hydroelectric power plants, 37.8% from thermoelectric power plants, 9.2%
from wind power plants and 0.08% from solar power plants.
Industry and mining The Industrial Policy of Montenegro 2019–2023 is a strategic document for the development of the
competitiveness of the Montenegrin economy with a focus on the industrial sector. The Industrial Policy
recognizes that the real drivers of change and development are companies that, with adequate support,
should maximize their potential for growth, development and competitiveness. The Industry Policy of
Montenegro 2019–2023 represents a continuation of the activities implemented under the Industrial
Policy to 2020, adopted in June 2016.
Until 2023, industrial policy also recognizes the circular economy as one of the important directions for
future development. According to the Strategy, in 2015 the European Commission adopted an action plan
to help accelerate Europe’s transition to a circular economy, to strengthen global competitiveness, to
promote sustainable economic growth and to create jobs. The Action Plan sets out 54 measures to “round
out” the product lifecycle: from production and consumption to waste management and the secondary
raw materials market.
Managing the lifecycle of natural resources, from extraction, through design and production, to what is
considered waste, is essential for green growth and is part of developing a cost-effective, resource-
efficient, circular economy where nothing is lost. Smarter design that allows products to be modified,
reused, re-manufactured and recycled should become the norm.
Montenegro, which is significantly tourism-oriented, and has been declared an ecological state, must pay
special attention to the valorization of green growth and the circular economy, integrating the
demographic, social, natural and economic aspects of economic development, as stated in the National
Development Strategy of Montenegro to 2030, which has taken the universal UN Sustainable
Development Goals into the national context.
Industrial production in Montenegro in Q2 2021 compared with Q2 2020 increased by 8.7%. At the sector
level, compared to Q2 2020, mining and quarrying decreased by 53.7%, manufacturing increased by 13.1%
and electricity, gas, steam and air conditioning supply increased by 32.0%.
Industrial production in Montenegro in Q2 2021 compared with Q1 2021 decreased by 33.9%. At the
sector level, compared to Q1 2021, mining and quarrying decreased by 61.3%, manufacturing increased
by 26.1% and electricity, gas, steam and air conditioning supply decreased by 67.7%.
According to MONSTAT, in 2020 the production of the following products increased compared with the production from 2019:
- Aluminium ores and concentrates from 774,725 t to 889,057 t, i.e. 15.8%;
- Cigarettes containing tobacco from 462 t to 684 t, i.e. 48.0%;
- Pre-coated aggregates from 64,658 t to 191,122 t, i.e. 195.6%;
- Unwrought non-alloy aluminium from 36,522 t to 37,208 t, i.e. 1.9%.
In 2020 there was a decrease of production among the following products when compared with
production from 2019:
- Coniferous wood; sawn or chipped lengthwise from 128,329 m³ to 107,100 m³, i.e. −16.5%;
- Ready-mixed concrete from 838,984 t to 70, 539 t, i.e. −16.2%.
- Ball bearings from 816 t to 612 t, i.e. −25.0%.
- Steel castings for machinery and mechanical appliances from 14,905 t to 12,746 t i.e.
−14.5%.

26
Within the framework of the Industrial Policy, a Strengths, Weaknesses, Opportunities and Threats
(SWOT) analysis of the potential for industrial development was also carried out. The analysis showed
that are the main weaknesses include the use of energy-intensive and often outdated technology and
equipment. This results in industrial production characterized by a high share of products of lower
processing stages and high import dependency. There is lack of interaction between the industry sectors
and scientific research institutions and other sectors of the economy.
To address these weaknesses, it is necessary to develop products and services with greater added value,
fostering innovation and introducing new technologies through collaboration with the scientific research
community and digital transformation. In addition, the gradual introduction of the principles of circular
and low-carbon economies can make a significant contribution towards further developing a more
resource-efficient economy and good environmental management.
Agriculture Agriculture continues to be an important strategic sector within Montenegro’s economic development
and has many economic activities that are linked to it, particularly in rural parts of the country. In 2019,
the agriculture, forestry and fishing sector constituted 6.4% of GDP, while in 2020 this share was 7.6%.
Used agricultural land in 2020 amounted to 257,949.8 ha, which compared to 2019 represents an increase
of 0.2%. The total used agricultural land is dominated by areas of perennial meadows and pastures with
a share of 94.3%, while arable land is represented by 2.7%, permanent crops by 2.2% and back gardens
by 0.8%. Compared to 2019, the area of perennial meadows and pastures increased by 0.2%, permanent
crops by 0.2%, back gardens by 1.4%, while the area of arable land decreased by 2.1%.
The total production of potatoes in 2020 amounted to 39,301.9 t, which is 10.8% more than in 2019. The
following crops also increased their production: wheat (by 4.3%), beans (by 16.1%), cabbage (by 11.9%),
cucumbers (by 11.3%) and bell peppers (by 4.5%). Compared to 2019, the total production increased for
the following: plums (by 16.8%), apples (by 15.7%), pears (by 16.7%), peaches (by 21.0%), while
production decreased for olives (by 4.2%) and mandarins (by 6.9%). The total grape production in 2020
increased by 3.9% compared to the previous year. Table 4 shows the area of agricultural land by category
in 2020.
TABLE 4. AGRICULTURE LAND BY CATEGORIES IN 2020 (HA)7
Type of land 2019 (ha) 2020 (ha) Indices 2020/2019
Used agriculture land 257,469.6 257,949.8 100.2
Arable land 7,204.6 7,055.3 97.9
Grains 2,429.8 2,299.1 94.6
Potato 1,625.3 1,709.5 105.2
Vegetables, watermelons and melons
1,310.6 1,258.1 96.0
Fodder plants 1,587.6 1,554.2 97.9
Other plants on arable land and fallow land
251.3 234,4 93.3
Back gardens 2,009.8 2,038.8 101.4
Orchards 787.3 748.3 95.0
Vineyards 111.5 113.8 102.1
Potatoes 542.6 546.8 100.8
7 Source: MONSTAT, July 2021, Crop Production

27
Type of land 2019 (ha) 2020 (ha) Indices 2020/2019
Used agriculture land 257,469.6 257,949.8 100.2
Vegetables 568.4 629.9 110.8
Permanent crops 5,537.7 5,551.3 100.2
Orchards 2,587.9 2,594.8 100.3
Orchards – extensive 1,214.6 1,204.1 99.1
Orchards – plants 1,373.3 1,390.7 101.3
Vineyards – plants 2,880.0 2,888.0 100.3
Nurseries 69.8 68.5 98.1
Perennial meadows and pastures 242,717.5 243,304.4 100.2
Tourism In Montenegro, tourism is one of the most important business activities, one which has the potential for
economic growth and development. Tourism is of great importance taking into consideration all of its
direct and indirect multiplicative effects. It is one of the major revenue sources in Montenegro and
Montenegro’s economic development is based primarily on the further development of this branch of the
economy.
The tourist sector, in general, directly and indirectly affects the growth of gross domestic product, which
is also the case in Montenegro. In the period 2010–2016, the share of the tourist sector within GDP in
Montenegro recorded a constant growth trend. When it comes to generating new jobs, analyses indicate
that the tourist sector will directly or indirectly enable the creation of 40,000 jobs, which will represent
20.4% of the total number of employees in Montenegro (WTTC, 2017).
The importance of tourism for the Montenegrin economy can be seen from the Report of the World
Tourism and Travel Council (WTTC), which analyses and ranks the impact of tourism on GDP, employment,
exports and investment, and covers 184 countries. In the mentioned report, Montenegro is recognized as
one of the fastest-growing tourist destinations in the world. The authors of the report estimate that the
total contribution of tourism to Montenegro’s GDP in 2017 was 23.7%, with a growth forecast of 8.9% in
2018 and a tendency towards generating 27.9% of GDP in 2028.
Before the COVID-19 pandemic, according to the 2019 report of the European Travel Commission
(European Tourism in 2019: Trend & Prospects Q2 2019), Montenegro was recognized as the fastest-
growing destination out of the 33 European countries that are members of this international organization.
Montenegro was visited by 2.64 million tourists in 2019, which is 21% more than in 2018, and the income
from tourism was €1.14 billion, which is €100 million more than in 2018 (former Ministry of Sustainable
Development and Tourism, February 2019).
However, the situation in 2020 was completely different. As can be assumed, there were almost no
tourism-related activities in Montenegro in 2020, due to the global COVID-19 pandemic.
Thus, the Montenegrin economy is experiencing a significant decline due to the severe decline in the
tourist sector. In Montenegro, in 2020, there were 83.2% fewer tourist arrivals compared to 2019, while
the number of realized overnight stays decreased by 82.1%. Of the total number of overnight stays, 86.1%
were realized by foreigners, and 13.9% overnight stays were realized by domestic tourists.
Figure 4 shows the clear decline in number of arrivals and overnight stays in 2020, in comparison to the
previous years.

28
2016 2017 2018 2019 2020
FIGURE 4. NUMBER OF ARRIVALS AND OVERNIGHT STAYS IN THE PERIOD 2016–2020 8
Transport The National Climate Change Strategy (NCCS) identifies transport as a priority sector for climate change
actions and outlines a number of measures and targets related specifically to increasing the use of public
transport and the promotion of more energy-efficient vehicles and electric vehicles for public and
individual transportation. The strategy also stresses the need to increase the resilience of the transport
sector to predicted climate impacts due to its vulnerability and the key role it plays in the country’s
economic and social development.
Based on the Action Plan for the Application of Renewable Energy Sources and Energy Efficiency Measures
in the Transport Sector,9 the transport sector in Montenegro is based on oil products (petrol, diesel fuel,
and LPG) for road traffic and electricity for rail traffic, while road traffic makes up the most significant
share. According to the structure of fuels used to power registered vehicles in the last five years, the
highest-represented vehicles run on diesel and motor gasoline. The use of biofuels and other alternative
fuels (except LPG) is not represented. The implementation of energy efficiency measures in the transport
sector is still at its very beginning.
According to the data presented recently by the online portal “Vijesti”, every fourth vehicle on the streets
in Montenegro is more than two decades old; the average vehicle age in the northern municipalities is six
years more than in Podgorica and on the coast. The average age of a registered vehicle in the European
Union is 11 years, and in Montenegro 16 years. According to MONSTAT, a total of 249,000 vehicles were
registered in Montenegro in 2019, of which 63,000 were 20 years or older, which is more than a quarter
(25.3 percent) of the total number, while 58,000 of vehicles under the age of 10 years were registered,
which is 23.3 percent. There are 11,000 vehicles older than 30 years on Montenegrin roads, which is 4.4
percent of the total number.
The Strategy for the Development of Transport of Montenegro for the Period 2019–2035 was adopted in
July 2019. For the purpose of drafting the Strategy, a regional traffic model for Montenegro was
developed to estimate traffic flows under different scenarios. A significant increase in road traffic is
expected in the future, which will have an impact on the efficiency of the state network and planned
highways.
8 Source: MONSTAT, June 2021.
9 EU-funded project implemented by European Profile and Eptisa.
14,455,920
2,000,009 2,587,255
444,065
2,204,856
1,813,817
11,250,005 11,953,316
12,930,334
2,645,217

29
Waste management Insufficient capacity for safe waste disposal, slow progress regarding waste recycling and poor public
awareness regarding reducing the amount of waste produced and conscientious waste disposal are still
issues that hinder efficient waste management in Montenegro. Currently, there are two regional sanitary
landfills in Montenegro and these are: (i) in Podgorica – the Livade landfill (to meet the needs of the
Capital City of Podgorica, the Municipality of Danilovgrad and the Historical Capital of Cetinje); and (ii) in
Bar (to meet the needs of the Municipalities of Bar and Ulcinj, and also most recently the Municipalities
of Budva, Kotor, and Tivat).
The regional sanitary landfill site, Možura, in Bar, was opened in June 2012. The strategic National Waste
Management Plan outlines the construction of an additional five regional centres for waste processing.
Apart from the Primary Recycling Centres in Podgorica and Herceg Novi, where some types of waste are
selected and prepared for transportation for further processing purposes, and a small plant in Kotor (for
the needs of the Municipalities of Kotor and Tivat), there are currently no recycling facilities in
Montenegro. Nor are there any composting plants in Montenegro.
According to the study developed by Andreas von Schoenberg Consulting – Factsheet: Waste
Management in Montenegro,10 340,823 t of MSW was generated in 2019, equivalent to 548 kg per
inhabitant. Of this amount 308,104 t (90%) was collected by municipalities, the rest disposed of or
recycled locally. Within the overall MSW generation figure, households accounted for 76% of the total,
and commercial, industrial and public-sector premises accounted for 24%. The relatively high municipal
waste generation and collection figures provided by the MONSTAT are partly based on estimates by
municipalities that may be overestimated or underestimated due to inadequate weighing and registration
procedures.
Regionally around 30% of the total MSW is generated in Podgorica and around 10% each in Bar, Budva
and Nikšić. Significant quantities are also generated in the coastal municipalities of Herceg Novi, Kotor
and Ulcinj, as well as in the northern municipality of Bijelo Polje.
Industrial and mining waste totalled 753,239 t in 2019 and the waste in construction sector totalled
140,902 t. Large industrial waste producers are: Daido Metal in Kotor; MB Team and Trebjesa Brewery,
both in Nikšić; the container terminal in Bar; and the lignite power station in Pljevlja. In addition, around
3,500 t of medical waste is produced each year in Montenegro.
Although a number of separate collection systems for recyclables have been introduced, overall less than
2.5% of MSW is recycled, while 97.5% is landfilled. However, Montenegro has undertaken to recycle 50%
of paper, plastic, metal and glass waste under Chapter 27 of the EU accession rules. In order to meet the
criteria of the accession rules, Montenegro also intends to recycle at least 70% of non-hazardous
construction waste.
Montenegro’s waste policy is shaped by a number of overarching goals: reducing municipal waste
generation and landfilling and accelerating the expansion of the separate collection and recycling of
recyclable materials. The Revised National Waste Management Plan of Montenegro 2015–2020 lists a
number of measures aimed at achieving these goals, for example, the introduction of economic
instruments with incentives and penalties to promote waste separation and recovery, the construction of
recycling centres and sorting plants, the introduction of a collection system for packaging waste, the
elimination of illegal dumping of waste and the rehabilitation of old landfills. Measures designed to lead
to an increase in the willingness of the population to participate in separate collection systems are to be
intensified.
10 CMS Pitch, https://www.retech-germany.net/fileadmin/retech/05_mediathek/laenderinformationen/Montenegro__Fact_Sheet_final.pdf,
accessed in October 2021.

30
Policy framework for climate change Montenegro became a non-Annex-I party to the UNFCCC in 2006. Following this, the country adopted the
Law on Ratification of the Paris Agreement in October 2017, confirming its INDC that had been submitted
to the UNFCCC in September 2015, with a goal of a 30% GHG emission reduction by 2030. Montenegro is
a candidate country for EU accession, and as such it has undertaken to transpose the EU climate and
energy package into its domestic legislation. Moreover, it is also a party to the treaty establishing the
Energy Community, undertaking to rapidly endorse EU rules on the monitoring, reporting and
inventorying of GHGs and the actions undertaken to address climate change, and to develop an integrated
NECP in line with the Energy Community’s proposal.11
In June 2021, the Government of Montenegro adopted a revised NDC, increasing its ambition to decrease
GHG emissions by 35% by 2030, in comparison to the base year of 1990.
The NCCS to 2030 is the key policy instrument for the management of climate change in Montenegro and
establishes the commitment of the government to act against climate change in an integrated and
multisector manner, complying with the international commitments assumed by the country in front of
the UNFCCC. The strategy sets out a vision to 2030 to enable Montenegro to adapt to adverse effects and
promote low-carbon sustainable development. The NCCS has a strong focus on harmonization with the
EU’s climate change legislative framework.
The NCCS provides the necessary guidelines for climate mitigation and adaptation actions. The objectives
of the strategy are also accompanied by different means of implementation: institutional strengthening
and governance, education and training of actors, research on climate change and technological
development, and financing.
In order to give continuity and legitimacy to the efforts being developed within the framework of the
NCCS and to ensure long-term commitments, a binding framework must be in place through legislative
instruments. For this purpose, Montenegro adopted the Law on Protection against Adverse Impacts of
Climate Change in December 2019. The objective of the Law is the protection against the adverse effects
of climate change, a reduction of greenhouse gas emissions, and protection of the ozone layer. The
Government of Montenegro issued the new Decree on Issued Activities for GHG Emissions on 6 February
2020, and this entered into force on 21 February 2020. This has brought Montenegro even closer to the
EU climate change acquis. Adoption of the regulation was also one of the preconditions for negotiations
under Chapter 27 – Environment and Climate Change, in the EU accession process.
The regulation establishes a regulatory framework to limit greenhouse gas emissions from industrial and
energy plants in the country. In addition, it determines the operators participating in emission trading and
determines the total amount and minimum price (€24 per t CO2) of the emission credits auctioned, the
formation of a stabilization reserve, the method of recording the allocated emission credits, their transfer
and use, as well as the purpose of funds raised through the auction of emission credits. The funds will be
transferred to the Eco Fund, established in 2018, and used for environmental measures, support for
renewable energy and financing for innovation.
Having in mind the new EU climate law,12 setting new targets within the EU, Montenegro will, within the
EU access process, amend its climate change law in order to transpose the EU climate acquis into national
legislation.
Montenegro also adopted the Law on Industrial Emissions in March 2019 in line with EU Directive
2010/75/EU on industrial emissions (IED), which is the main EU instrument regulating the emissions of
11 Recommendation of the Ministerial Council of the Energy Community 2018/01/MC-EnG on preparing for the development of integrated
national energy and climate plans by the Contracting Parties of the Energy Community.
12 European Climate Law (europa.eu), https://ec.europa.eu/clima/eu-action/european-green-deal/european-climate-law_en – accessed in
November 2021.

31
pollutants from industrial plants. It has been fully transposed into Montenegrin legislation, thanks to the
adopted Law on Industrial Emissions, which was preceded by an analysis of compliance with national
legislation.
Additional climate-related national policies and strategies in Montenegro include:
The National Strategy for Sustainable Development to 2030 was prepared in 2016. Based on the
principles outlined above, the strategy defines objectives that can be grouped into several priority areas
such as: (1) better management of water resources and demand; (2) improved rational use of energy,
increased use from renewable sources, and mitigation of adaptation to climate change; (3) sustainable
mobility through appropriate transport measures; (4) sustainable tourism as a leading economic sector;
(5) sustainable agriculture and rural development; (6) sustainable urban development; and (7) sustainable
management of marine, coastal, and marina resources.
The National Strategy with Action Plan for Transposition Implementation and Enforcement of the EU
Acquis on the Environment and Climate Change 2016–2020, which is a critical aspect of establishing the
necessary actions to meet the EU’s climate change requirements and the costs of full alignment with the
EU’s environmental and climate change requirements. It also provides a baseline against which the
government determines its progress.
The National Forest Strategy recognizes that forests can contribute to combating, mitigating and adapting
to climate change, as they absorb about 4.6 million tonnes of CO2 per year from the atmosphere. The
strategy recognizes climate change as an important factor affecting national forest protection measures.
Accordingly, the analysis estimates that climate change poses the greatest threat to Montenegrin forests
that can increase the risk of droughts, fires and biodiversity pests. The Forest Strategy recognizes an
increase in such threats in the coming period and provides: guidelines and actions to protect forests from
extreme droughts and fires; forest management plans; and management programmes to increase the
resilience of forest ecosystems.
The Smart Specialization Strategy (2019–2023) is a national innovation strategy that sets development
priorities, aiming to build a competitive advantage by connecting its own strengths in research and
innovation with the needs of the economy, responding coherently to growing opportunities and market
development, thus avoiding overlapping and fragmenting policies.
The strategy’s priorities are:
• Energy and a sustainable environment
• Sustainable agriculture and food value chain
• Sustainable and health tourism
• ICT (information and communication technologies).
Institutional framework for climate change The general election held in August 2020 and the subsequent establishment of a new government in
December 2020 brought significant political changes within the country.
The MESPU is the main national entity responsible for national environmental and climate change policy
and the National Focal Point to the UNFCCC.
Montenegro also has a high-level multi-institutional council, chaired by the President of Montenegro,
which focuses on sustainable development. The council was established by the government in 2008,
marking a positive development in inter-institutional coordination and cooperation. The council’s 2013
reform strengthened its mandate in the field of climate change, as a strategic priority of the government
towards the creation of a low-carbon society. In 2016 this became the National Council for Sustainable
Development, Climate Change and Coastal Area Management. The Council is currently under

32
reconstruction. It is expected that the Secretariat of the Council will be established within the Prime
Minister’s Office. New definition of the structure and the mandate, together with its supporting working
groups, is currently under development.
Table 5 summarizes the key institutions and their responsibilities in climate change management in
Montenegro. Additional details on the responsibilities for establishment of the domestic MRV system are
included in the chapter on MRV.
TABLE 5. INSTITUTIONS RESPONSIBLE FOR CLIMATE CHANGE MANAGEMENT IN MONTENEGRO
Organization Acronym Responsibilities
Ministry of Ecology, Spatial Planning
and Urbanism – Climate Change
Division within the Directorate for
International Cooperation, EU
Integrations and Climate Change
MESPU
CCD
In charge of climate policy adoption, implementation and monitoring.
The Climate Change Division is a focal point for the UNFCCC, GEF and
Adaptation Fund. It also deals with waste, and environment
protection, as a part of its remit.
Environmental Protection Agency EPA Works under the MESPU and is mandated to regularly update GHG
emission inventory.
Institute of Hydrometeorology and
Seismology IHMS
The Institute of Hydrometeorology and Seismology is a state
administration body, with numerous competencies in the field of
meteorology, climatology, hydrology, hydrography, oceanography
and seismology. The Institute takes care of the establishment,
development, and work of the meteorological and hydrological
observation and forecasting stations on the entire territory of
Montenegro.
The Institute is also the contact institution for the Intergovernmental
Panel on Climate Change (IPCC) and World Meteorological
Organization (WMO).
Environmental Protection Fund Eco Fund
This was established by the Decision of the Government of
Montenegro (22 November 2018) on the basis of Article 76 of the
Law on the Environment with the aim of providing funds for financing
environmental protection and respect for the basic right of citizens to
a clean and healthy environment.
Ministry of Capital Investments
MoCI
In charge of energy and transport. Additional possibilities in CC
mitigation also exist.
Ministry of Economic Development MED In charge of industrial policies, economic recovery programmes,
green economy development direction, as well tourism.
Ministry of Agriculture, Forestry and
Waters MAFW
In charge of agricultural and forestry policy. Additional possibilities in
CC mitigation also exist.
Ministry of Internal Affairs (Directorate
for Emergencies) MIA
Important role in CC policy making, especially related to DRR and
adaptation to climate change.
National Council for Sustainable
Development, Climate Change and
Integral Coastal Zone Management
NCSDCCICM
Responsible for monitoring development and implementing national
sustainable development and CC policies. Also involved in planning,
alignment of development policies for sustainable development and
CC requirements, and the implementation of EU sustainable
development frameworks under the Energy and Climate Package.
Mitigation and Adaptation Working
Group
MAWG
Offers support and guidance for the national climate policy to
implement mitigation, i.e. emissions reduction, and adaptation
measures to adverse CC impacts. The working group is an inter-
governmental body composed of the representatives of all relevant
authorities, civil society, business alliances, and academia.

33
The CCD at the MESPU is responsible for submitting national reports (NCs and BURs) to the UNFCCC. Up
to the end of 2021, development of the NCs/BURs was fully supported by UNDP, which hired and
coordinated the experts, through the GEF-funded projects. As of 2022, the MESPU will be fully in charge
of development of NCs and BTRs, while UNDP will have an oversight role.

34
National GHG Inventory Overview of Montenegro’s GHG Inventory The National Greenhouse Gas Inventory of Montenegro covers the years 1990–2019 and is described in
the stand-alone document NIR 2021, which has been prepared for the first time. The GHG Inventory
included in the previous BUR and submitted in May 2019, covered the years 1990–2015, whereas the GHG
inventory including the Third NC, submitted in October 2020, covered the years 1990–2017.
Emissions have been estimated for:
• All sectors of the GHG emission inventory
o IPCC sector 1 Energy
o IPCC sector 2 Industrial Processes and Product Use (IPPU)
o IPCC sector 3 AFOLU
o IPCC sector 4 Waste
• The following GHGs according to the 2006 IPCC Guidelines
o carbon dioxide (CO2)
o methane (CH4)
o nitrous oxide (N2O)
o hydrofluorocarbons (HFCs)
o perfluorocarbons (PFCs)
o sulphur hexafluoride (SF6)
Montenegro’s GHG emission inventory for the years 1990–2019 was prepared using the 2006 IPCC
Guidelines for National Greenhouse Gas Inventories (2006 IPCC Guidelines). Emissions of carbon
monoxide (CO), nitrogen oxides (NOx), non-methane volatile organic compounds (NMVOCs) and sulphur
oxides (SOx) are estimated in the national air pollutants inventory according to the EMEP/EEA Air
Pollutant Emission Inventory Guidebook 2019 and are submitted under the UNECE Convention on Long-
Range Transboundary Air Pollution (CLRTAP).
All sources and sinks included in the IPCC 2006 Guidelines are addressed. No additional sources and sinks
specific to Montenegro have been identified. The sources and sinks not considered in the inventory but
included in the IPCC 2006 Guidelines are clearly indicated in the NIR and the reasons for such exclusion
are explained using the notation keys.
The geographical coverage is complete. There is no part of the Montenegro’s territory not covered by the
inventory.
Recalculations of previously submitted inventory data have been performed to ensure the time series
consistency of inventory. Recalculations and planned improvements are described for individual
categories in the NIR 2021 and summarized in Chapter 9.
The aggregated greenhouse gases (GHG in CO2 equivalents) are prepared using the GWPs provided by the
IPCC Fourth Assessment Report13 based on the effects of GHGs over a 100-year time horizon.
TABLE 6. GWPS PROVIDED BY THE IPCC FOURTH ASSESSMENT REPORT.
Gas name Chemical formula/
abbreviation
GWP based on the effects of GHGs over a 100-year time horizon
Carbon dioxide CO2 1
13 IPCC. (2007). Climate Change 2007 – The Physical Science Basis Contribution of Working Group I to the Fourth Assessment Report of the IPCC.
(Table TS.2). Available (12 May 2019) at: https://www.ipcc.ch/site/assets/uploads/2018/05/ar4_wg1_full_report-1.pdf

35
Gas name Chemical formula/
abbreviation
GWP based on the effects of GHGs over a 100-year time horizon
Methane CH4 25
Nitrous oxide N2O 298
Sulphur hexafluoride SF6 23,800
Hydrofluorocarbons HFC HFC23 – 14,800; HFC125 – 3,500; HFC134 – 1,430; HFC134a – 4,470;
HFC152a – 124; HFC227ea – 3,220; HFC236fa – 9,810; HFC4310mee – 1,640;
CF4 – 7,390; C2F6 – 12,200
Perfluorocarbons PFC
Nitrogen trifluoride NFH3 17,200
GHG inventory system According to the Law on Air Protection (Official Gazette of Montenegro 25/10 and 43/15), the EPA is the
Single National Entity responsible for the preparation of emission inventories. The EPA operates under
the MESPU and has the overall responsibility and submits the NIR to the UNFCCC, and the UNECE
Convention on Long-Range Transboundary Air Pollution.
Within the EPA, experts from different departments contribute, whereby experts from the Department
for Nature Protection and the Department for Monitoring, Analysis and Reporting compile and report the
inventory data and reports. Data needed for the preparation of the inventory is provided by industrial
operators, MONSTAT and various ministries.
The EPA has signed a Memorandum of Understanding on mutual cooperation data with the MONSTAT.
The institutional arrangements for the inventory system currently used in Montenegro are presented in
detail in Section 1.2 of the NIR 2021.
The QC/QA activities and the archiving system is described in Section 1.6 of the NIR. The results from
internal/external audits, expert peer reviews and UNFCCC ICA process are merged in the improvement
plan. This plan lists the relevant sector, recommendations for improvement (reference and citation),
priorities, responsibilities, deadlines and confirmation of implementation. The individual sector-level
chapters of NIR 2021 lists the QA/QC actions implemented for individual categories.
Key categories The identification of key categories has been prepared in accordance with 2006 IPCC Guidelines. The
identification of key categories was based on level and trend assessments which were performed with
and without LULUCF.
Table 7 shows the identified key categories and the methods by which they were identified. The
performed analysis on key categories is described in more detail in Section 1.5 of NIR 2021.
TABLE 7. KEY CATEGORIES OF MONTENEGRO’S GHG INVENTORY
IPCC Code IPCC Category GHG Method of identification
4.A LULUCF – Total forest land CO2 Level (incl. LULUCF)
1.A.1.a Energy industries – Main activity electricity and heat production
CO2 Level (incl. LULUCF); level (excl. LULUCF)
1.A.3.b.iii Road transport – Heavy-duty trucks and buses CO2 Level (incl. LULUCF); level (excl. LULUCF)
2.F Product uses as substitutes for ozone-depleting substances (ODS)
HFC Level (incl. LULUCF); level (excl. LULUCF)
5.A Solid waste disposal CH4 Level (incl. LULUCF); level (excl. LULUCF)
1.A.3.b.i Road transport – Cars CO2 Level (incl. LULUCF); level (excl. LULUCF)
3.A.1.a Enteric fermentation – Cattle CH4 Level (incl. LULUCF); level (excl. LULUCF)
4.G LULUCF – Harvested wood products CO2 Level (incl. LULUCF)

36
IPCC Code IPCC Category GHG Method of identification
1.A.3.a.ii Domestic aviation CO2 Level (incl. LULUCF); level (excl. LULUCF)
2.C.3 Aluminium production CO2 Level (incl. LULUCF); level (excl. LULUCF)
4.E LULUCF – settlements CO2 Level (incl. LULUCF)
5.D Wastewater treatment and discharge CH4 Level (incl. LULUCF); level (excl. LULUCF)
1.B.1 Fugitive emissions – solid fuels CH4 Level (incl. LULUCF); level (excl. LULUCF)
1.A.2.j Manufacturing industries and construction – wood and wood products
CO2 Level (incl. LULUCF); level (excl. LULUCF)
1.A.4.b Other sectors – residential CH4 Level (incl. LULUCF); level (excl. LULUCF)
1.A.2.i Manufacturing industries and construction – mining (excluding fuels) and quarrying
CO2 Level (incl. LULUCF); level (excl. LULUCF)
2.C.3 Aluminium production PFC Trend (incl. LULUCF); trend (excl. LULUCF)
1.A.2.b Manufacturing industries and construction – non-ferrous metals
CO2 Trend (incl. LULUCF); trend (excl. LULUCF)
1.A.2.a Manufacturing industries and construction – iron and steel
CO2 Trend (incl. LULUCF)
1.A.2.e Manufacturing industries and construction – food processing, beverages and tobacco
CO2 Level (excl. LULUCF)
1.A.2.m Manufacturing industries and construction – other
CO2 Level (excl. LULUCF)
3.B.2.a Manure management – cattle CH4 Level (excl. LULUCF)
2.C.3 Aluminium production PFC Level (excl. LULUCF)
1.A.4.a Other sectors – commercial/institutional CO2 Level (excl. LULUCF)
2.D.1 Lubricant use CO2 Level (excl. LULUCF)
National GHG emissions and trends Table 8 and Table 9 show total GHG emissions and removals, expressed as CO2eq for the period 1990–
2019. The total net emissions in 2019 equalled 1,119.31 Gg CO2eq.
Total net emissions range from 308.91Gg CO2eq in 1995 and 320.17 in 2009, when the Thermoelectric
Power Plant in Pljevlja was out of service and/or under construction the whole year, to 3,738.05 Gg in
1991, when maximum use of the industrial and energy facilities that existed at that time was recorded,
with a special emphasis on energy production and production of aluminium.
Total GHG emissions (excluding removals) shown as CO2eq range from 5,292.40 Gg in 1990 to 3,623.25
Gg in 2019.
TABLE 8. TOTAL GHG EMISSIONS BY SECTORS FOR 1990–2019
Year Net emissions (Gg CO2 eq) Total emissions
without sinks
(Gg CO2 eq)
Energy
IPPU
AFOLU
Waste
Total
1990 2,748.26 1,704.68 −968.35 217.97 3,702.56 5,292.40
1991 2,624.50 2,206.15 −1,314.96 222.37 3,738.05 5,673.14
1992 1,859.10 1,422.12 −953.02 226.66 2,554.85 4,087.16
1993 1,567.50 543.76 −1,668.57 230.89 673.57 2,898.37
1994 1,390.88 135.53 −1,180.70 235.05 580.76 2,328.42
1995 771.55 418.51 −1,036.90 239.70 392.86 2,018.49
1996 1,818.33 1,002.21 −1,247.61 244.78 1,817.71 3,649.67
1997 1,708.46 1,533.24 −2,016.17 250.20 1,475.73 4,061.63
1998 2,092.57 1,167.70 −2,116.18 255.15 1,399.24 4,078.73
1999 2,264.10 1,222.78 −2,056.81 260.06 1,690.13 4,313.01
2000 2,285.04 1,579.41 −1,516.49 264.92 2,612.87 4,681.58
2001 1,924.95 1,659.46 −2,049.17 268.97 1,804.21 4,393.71
2002 2,503.63 1,612.45 −2,213.80 272.54 2,174.82 4,940.36
2003 2,456.86 1,380.59 −2,100.98 275.26 2,011.73 4,656.91
2004 2,480.59 1,272.88 −2,279.56 276.99 1,750.90 4,414.78
2005 2,272.63 1,167.11 −2,079.33 277.85 1,638.26 4,099.20
2006 2,469.45 1,291.38 −1,740.48 278.05 2,298.40 4,410.83

37
Year Net emissions (Gg CO2 eq) Total emissions
without sinks
(Gg CO2 eq)
Energy
IPPU
AFOLU
Waste
Total
2007 2,324.32 1,414.15 −1,529.91 279.40 2,487.95 4,364.29
2008 2,911.28 1,565.61 −1,954.80 279.25 2,801.34 5,094.81
2009 1,934.38 603.63 −2,506.03 276.94 308.91 3,136.85
2010 2,690.59 795.64 −2,214.54 275.77 1,547.47 4,071.72
2011 2,816.92 752.29 −429.55 275.34 3,415.00 4,131.71
2012 2,680.96 539.12 −1,788.35 270.75 1,702.48 3,774.16
2013 2,477.19 401.61 −2,126.30 269.64 1,022.14 3,441.41
2014 2,347.67 395.06 −2,205.03 270.24 807.94 3,314.35
2015 2,551.11 385.96 −2,072.72 269.34 1,133.68 3,507.82
2016 2,388.97 376.18 −2,073.98 269.60 960.77 3,330.64
2017 2,525.25 391.83 −1,523.83 260.33 1,653.58 3,462.82
2018 2,796.59 393.52 −2,177.53 274.68 1,287.25 3,743.49
2019 2,701.70 376.89 −2,232.37 273.08 1,119.31 3,623.25
TABLE 9. GHG REMOVALS 1990–2019
Year 1990 1991 1992 1993 1994 1995 1996 1997 1998 1999
Removals (Gg CO2eq)
−1,589.84 −1,935.08 −1,532.30 −2,224.80 −1,747.66 −1,625.64 −1,831.95 −2,585.90 −2,679.50 −2,622.87
Year 2000 2001 2002 2003 2004 2005 2006 2007 2008 2009
Removals (Gg CO2eq)
−2,068.71 −2,589.50 −2,765.54 −2,645.18 −2,663.88 −2,460.94 −2,112.43 −1,876.34 −2,293.47 −2,827.94
Year 2010 2011 2012 2013 2014 2015 2016 2017 2018 2019
Removals (Gg CO2eq)
−2,524.25 −716.71 −2,071.68 −2,419.27 −2,506.41 −2,374.14 −2,369.87 −1,809.24 −2,456.24 −2,503.93
Figure 5 shows the emissions and removals, whereas Figure 6 shows the total CO2eq emissions by
sectors for the period 1990–2019.
FIGURE 5. TOTAL GHG EMISSIONS AND REMOVALS, 1990–2019
-4,000
-3,000
-2,000
-1,000
0
1,000
2,000
3,000
4,000
5,000
6,000
7,000
19
90
19
91
19
92
19
93
19
94
19
95
19
96
19
97
19
98
19
99
20
00
20
01
20
02
20
03
20
04
20
05
20
06
20
07
20
08
20
09
20
10
20
11
20
12
20
13
20
14
20
15
20
16
20
17
20
18
20
19
Gg
CO
2eq
Total emissions with sinks Total emissions without sinks Sinks

38
FIGURE 6. GHG EMISSIONS BY SECTOR, 1990–2019
As shown in Figure 6, the energy and industrial processes sectors account for the largest share within total
emissions for the observed period. Consequently, depending on energy consumption, as well as the level
of industrial production, estimated emissions decreased and increased during the observed period.
FIGURE 7. SHARE OF GHG EMISSIONS FROM SECTORS WITHIN TOTAL CO2EQ EMISSIONS, 1990–2019 (%)
As shown in Figure 7, the energy sector accounts for the largest share in total GHG emissions, followed by
industry and agriculture sectors and a small share of the waste sector. The deviation observed for 1995
was a result of a decline in industrial production as well as of the disconnection of the thermoelectric
power plant from the national energy system. The share of emissions from the energy sector ranges from
38.2% in 1995 to 74.6% in 2019. The share of emissions from IPPU ranges from 10.4% in 2019 to 33.7% in
2000. CO2eq emissions from the agricultural sector range from 13.10 % in 2019 to 43.90% in 1995, while
the waste sector has the smallest share in total emissions, ranging from 3.70% in 1990 to 9.40% in 1995.
Table 10 shows the GHG emissions by gas. As seen, CO2 maintains the largest shares of emissions
throughout the whole time series.
TABLE 10. TOTAL GHG EMISSIONS BY GHG, 1990–2019
Year CO2
(Gg CO2eq)
CH4
(Gg CO2eq)
N2O
(Gg CO2eq)
HFC
(Gg CO2eq)
PFC
(Gg CO2eq)
SF6
(Gg CO2eq)
Total
(Gg CO2eq)
1990 2,833.89 900.73 66.35 0.00 1490.64 0.78 5,292.40
1991 2,719.27 888.57 65.47 1.33 1997.72 0.78 5,673.14
0
1,000
2,000
3,000
4,000
5,000
6,000
19
90
19
91
19
92
19
93
19
94
19
95
19
96
19
97
19
98
19
99
20
00
20
01
20
02
20
03
20
04
20
05
20
06
20
07
20
08
20
09
20
10
20
11
20
12
20
13
20
14
20
15
20
16
20
17
20
18
20
19
Gg
CO
2eq
Energy IPPU Agriculture Waste
51.93%
38.2%48.8%
54.3%66.1%
72.7% 74.6%
32.2%
20.7%
33.7%31.4%
19.5% 11.0% 10.4%
11.7%
29.2%
11.8% 8.2% 7.6% 8.6% 7.5%
4.1%11.9%
5.7% 6.1% 6.8% 7.7% 7.5%
0%
10%
20%
30%
40%
50%
60%
70%
80%
90%
100%
19
90
19
95
20
00
20
05
20
10
20
15
20
19
Energy IPPU Agriculture Waste

39
1992 1,914.80 866.17 56.78 3.79 1244.84 0.78 4,087.16
1993 1,525.57 856.87 53.44 7.22 454.50 0.78 2,898.37
1994 1,323.88 849.44 51.56 11.48 91.29 0.78 2,328.42
1995 731.59 869.06 55.55 16.46 345.05 0.78 2,018.49
1996 1,813.43 874.58 57.95 22.06 880.87 0.78 3,649.67
1997 1,764.45 854.13 57.88 28.19 1356.19 0.78 4,061.63
1998 2,143.17 849.91 60.42 34.79 989.61 0.84 4,078.73
1999 2,312.32 860.45 62.56 41.79 1035.04 0.84 4,313.01
2000 2,356.92 850.13 62.75 49.15 1361.71 0.92 4,681.58
2001 2,037.75 831.07 59.62 56.82 1407.51 0.92 4,393.71
2002 2,580.91 886.99 63.99 64.78 1342.74 0.97 4,940.36
2003 2,555.86 862.38 63.90 72.98 1100.65 1.15 4,656.91
2004 2,586.88 712.56 58.42 81.40 974.19 1.33 4,414.78
2005 2,378.54 702.41 57.13 90.37 869.31 1.43 4,099.20
2006 2,576.58 698.53 59.60 106.22 968.42 1.49 4,410.83
2007 2,440.50 670.03 58.44 121.52 1072.31 1.49 4,364.29
2008 2,998.09 671.93 61.67 136.45 1225.15 1.52 5,094.81
2009 1,949.08 640.15 57.69 148.53 339.87 1.54 3,136.85
2010 2,704.46 647.71 61.05 159.77 497.18 1.55 4,071.72
2011 2,846.58 628.53 61.67 170.28 423.06 1.60 4,131.71
2012 2,675.46 620.57 60.80 192.12 223.21 2.00 3,774.16
2013 2,440.37 617.80 61.21 204.47 115.39 2.19 3,441.41
2014 2,325.36 628.65 54.52 217.00 86.61 2.23 3,314.35
2015 2,518.96 633.50 60.58 220.62 71.93 2.23 3,507.82
2016 2,352.87 628.63 61.46 239.57 45.58 2.52 3,330.64
2017 2,490.91 614.10 60.24 249.44 45.13 2.99 3,462.82
2018 2,763.37 620.25 62.08 257.02 37.32 3.44 3,743.49
2019 2,670.01 605.78 61.63 248.35 34.03 3.44 3,623.25
Figure 8 shows total CO2 emissions. Over the observed period, the energy sector had the largest share
(90–98%) of total CO2 emissions, the IPPU sector contributed 2–10%, while the agricultural sector
contributed only 0.01–0.07% to the total emissions.
FIGURE 8. TOTAL CO2 EMISSIONS BY SECTOR, 1990–2019 (GG)
Figure 9 shows the total CH4 emissions. Over the observed period, the agricultural sector had the largest
share of total CH4 emissions (66-50%), the energy sector participated with 8–17%, while the waste sector
contributed 23–43% to the total CH4 emissions.
0
500
1,000
1,500
2,000
2,500
3,000
3,500
19
90
19
91
19
92
19
93
19
94
19
95
19
96
19
97
19
98
19
99
20
00
20
01
20
02
20
03
20
04
20
05
20
06
20
07
20
08
20
09
20
10
20
11
20
12
20
13
20
14
20
15
20
16
20
17
20
18
20
19
CO
2e
mis
sio
ns
in G
g
Energy IPPU Agriculture Waste

40
FIGURE 9. TOTAL CH4 EMISSIONS BY SECTOR, 1990–2019
Figure 10 shows the total N2O emissions. Over the observed period, the energy sector had the largest
share of total N2O emissions (60–64%), the agricultural sector participated with 21–36%, while the waste
sector contributed 7–15% to the total N2O emissions.
FIGURE 10. TOTAL N2O EMISSIONS BY SECTOR, 1990–2019
Figure 11 shows PFC emissions (CF4, C2F6) from the industry sector, i.e. from the aluminium production
– the electrolysis plant, which were estimated based on the available data for the observed period.
FIGURE 11. TOTAL PFC EMISSIONS FROM THE INDUSTRIAL SECTOR, 1990–2019
0
5
10
15
20
25
30
35
40
19
90
19
91
19
92
19
93
19
94
19
95
19
96
19
97
19
98
19
99
20
00
20
01
20
02
20
03
20
04
20
05
20
06
20
07
20
08
20
09
20
10
20
11
20
12
20
13
20
14
20
15
20
16
20
17
20
18
20
19
CH
4e
mis
sio
ns
in G
g
Energy IPPU Agriculture Waste
0.00
0.05
0.10
0.15
0.20
0.25
0.30
0.35
0.40
19
90
19
91
19
92
19
93
19
94
19
95
19
96
19
97
19
98
19
99
20
00
20
01
20
02
20
03
20
04
20
05
20
06
20
07
20
08
20
09
20
10
20
11
20
12
20
13
20
14
20
15
20
16
20
17
20
18
20
19
N2O
em
issi
on
s in
Gg
Energy IPPU Agriculture Waste
0
500
1000
1500
2000
2500
19
90
19
91
19
92
19
93
19
94
19
95
19
96
19
97
19
98
19
99
20
00
20
01
20
02
20
03
20
04
20
05
20
06
20
07
20
08
20
09
20
10
20
11
20
12
20
13
20
14
20
15
20
16
20
17
20
18
20
19
Gg
CO
2eq

41
Figure 12 shows the SF6 emissions from subsector 2.G – Other production and use of products, i.e. from
activity 2.G.1 – Electrical equipment, which were estimated based on the available data for the observed
period.
FIGURE 12. TOTAL SF6 EMISSIONS FROM THE INDUSTRIAL SECTOR, 1990–2019
Figure 13 shows the total HFC emissions, which are emitted from subsector 2.F – Use of alternative
substances, more specifically from activity 2.F.1 – Refrigerators and air conditioners.
FIGURE 13. TOTAL HFC EMISSIONS, 1990–2019
Emissions by sector Energy The energy sector is the primary source of anthropogenic GHG emissions. In Montenegro, the energy
sector accounted for 72.7% of total GHG emissions in 2015, 66.1% in 2010, and 74.6% in 2019. For the
period 1990–2019, the largest share of emissions from the energy sector was recorded in 2008 (2,911.28
Gg CO2eq), which is a consequence of maximum capacities being used in TPP Pljevlja and the operation of
all three boilers for technological steam production within the power plant of the Aluminium Plant in
Podgorica (KAP).
The energy sector includes all activities related to the combustion of fuels (solid, liquid, gaseous and
biofuels) in stationary and mobile sources, as well as fugitive emissions from fuels. Fugitive emissions
occur during the production, transmission, processing, storage and distribution of fossil fuels.
0
0.5
1
1.5
2
2.5
3
3.5
41
99
0
19
91
19
92
19
93
19
94
19
95
19
96
19
97
19
98
19
99
20
00
20
01
20
02
20
03
20
04
20
05
20
06
20
07
20
08
20
09
20
10
20
11
20
12
20
13
20
14
20
15
20
16
20
17
20
18
20
19
Gg
CO
2e
q
0
50
100
150
200
250
300
19
90
19
91
19
92
19
93
19
94
19
95
19
96
19
97
19
98
19
99
20
00
20
01
20
02
20
03
20
04
20
05
20
06
20
07
20
08
20
09
20
10
20
11
20
12
20
13
20
14
20
15
20
16
20
17
20
18
20
19
Gg
CO
2e
q

42
Data sources Data on fuel consumption, import and distribution in Montenegro was provided by MONSTAT, in line with
the requirements for the preparation of this report, as well as the methodology for the preparation of
national energy balances. The data that is processed and systematized within the energy balances serves
as a basis to estimate GHG emissions from the energy sector. For inventory development purposes, as
well as within its regular activities, MONSTAT has updated the effectuated energy balances for 2018 and
2019.
For most of the liquid fuels distributed and consumed in Montenegro, MONSTAT provided information
on lower calorific values that are close to the default values from the 2006 IPCC Guidelines. A country-
specific calorific value was used for lignite, which is based on measurements and which is in line with the
2006 IPCC Guidelines.
For inventory verification, the records of fossil fuel consumption in large industrial facilities made available
to the EPA were used.
Methodology The estimation of the direct GHG emissions from the energy sector was carried out according to
methodology provided by the 2006 IPCC Guidelines. In accordance with the available national data (lower
calorific values and specific fossil carbon emissions), a Tier-1 approach was used to estimate emissions
from solid and liquid fuels in energy production (1.A.1, 1.A.2, and 1.A.4), Tier 1 was used to estimate
emissions from the transport sector (1.A.3) and Tier 1 was used to estimate fugitive emissions (1.B.1).
Emission trends The total GHG emissions from the energy sector by subsector, for the period 1990–2019, expressed as
CO2eq, are shown in Figure 14. The estimated emissions from different energy subsectors over the
reporting period are shown in Table 11, Table 12, Table 13 and Table 14.
FIGURE 14. GHG EMISSIONS FROM ENERGY SUBSECTORS, 1990–2019
Activities related to power and heat generation account for the largest share within the total energy sector
emissions. The recorded drop in emissions from 1992 to 1995 and in 2009 was a result of reduced output
from the TPP in Pljevlja, reduced production at the power plant of the KAP, as well as an overall economic
downturn in the country.
Emissions from the transport subsector recorded a slow but steady increasing trend in the mentioned
period, commensurate with the increase in the number of motor vehicles in the country. The need to align
planned and effectuated energy balances with internationally accepted methodology and the
0
500
1,000
1,500
2,000
2,500
3,000
3,500
1990
1991
1992
1993
1994
1995
1996
1997
1998
1999
2000
2001
2002
2003
2004
2005
2006
2007
2008
2009
2010
2011
2012
2013
2014
2015
2016
2017
2018
2019
GH
G e
mis
sio
n in
Gg
CO
2eq
1.A.1 – Electricity and heat generation 1.A.2 – Production and construction
1.A.3 – Transport 1.A.4 – Other sectors
1.B.1 – Fugitive emissions from solid fuels

43
requirements for reporting to EUROSTAT (the Statistical Office of the European Union) and the
International Energy Agency (IEA) encouraged MONSTAT to create a new reporting format. The most
prominent difference relates to biomass consumption. The consumption of firewood and woodchips,
pellets, charcoal and other primary solid biomass types was analysed here. It is also noteworthy that the
definition “jet kerosene” was introduced into aviation fuel, whereas until 2013 the term “jet fuel” had
been used.
TABLE 11. TOTAL GHG EMISSIONS FROM THE ENERGY SECTOR AND ENERGY SUBSECTORS, 1990–2019 (GG CO2EQ)
GHG EMISSIONS (Gg CO2eq)
Category 1990 1991 1992 1993 1994 1995 1996
1 – Energy 2,748.26 2,624.50 1,859.10 1,567.50 1,390.88 771.55 1,818.33
1.A – Fuel combustion 2,701.34 2,585.09 1,812.91 1,518.58 1,346.31 733.13 1,776.14
1.A.1 – Electricity and heat generation 1,761.87 1,462.53 1,132.27 971.78 807.81 165.59 1,136.67
1.A.2 – Industry and construction 387.77 528.07 305.00 220.45 215.74 210.96 238.35
1.A.3 – Transport 355.53 407.83 250.29 193.00 215.34 231.33 285.60
1.A.4 – Other sectors 196.17 186.66 125.35 133.35 107.42 125.25 115.52
1.B – Fugitive emissions from fuels 46.92 39.41 46.19 48.91 44.56 38.42 42.19
1.B.1 – Solid fuels 46.92 39.41 46.19 48.91 44.56 38.42 42.19
GHG EMISSIONS (Gg CO2eq)
Category 1997 1998 1999 2000 2001 2002 2003
1 – Energy 1,708.46 2,092.57 2,264.10 2,285.04 1,924.95 2,503.63 2,456.86
1.A – Fuel combustion 1,673.61 2,057.92 2,228.69 2,250.96 1,895.82 2,446.62 2,421.63
1.A.1 – Electricity and heat generation 1,087.34 1,370.31 1,437.80 1,411.15 1,116.26 1,656.63 1,583.00
1.A.2 – Industry and construction 141.55 111.79 112.00 168.02 191.26 253.88 284.40
1.A.3 – Transport 301.40 425.88 528.20 524.57 454.41 358.89 374.91
1.A.4 – Other sectors 143.32 149.94 150.68 147.22 133.90 177.22 179.32
1.B – Fugitive emissions from fuels 34.84 34.64 35.41 34.08 29.13 57.01 35.23
1.B.1 – Solid fuels 34.84 34.64 35.41 34.08 29.13 57.01 35.23
GHG EMISSIONS (Gg CO2eq)
Category 2004 2005 2006 2007 2008 2009 2010
1 – Energy 2,480.59 2,272.63 2,469.45 2,324.32 2,911.28 1,934.38 2,690.59
1.A – Fuel combustion 2,444.19 2,241.49 2,433.31 2,295.88 2,873.40 1,913.54 2,648.39
1.A.1 – Electricity and heat generation 1,555.70 1,127.11 1,283.27 928.79 1,448.12 758.37 1,615.16
1.A.2 – Industry and construction 267.34 549.48 544.53 609.59 585.31 231.79 180.51
1.A.3 – Transport 448.27 407.64 442.29 543.39 621.64 721.22 635.09
1.A.4 – Other sectors 172.88 157.26 163.22 214.10 218.32 202.17 217.63
1.B – Fugitive emissions from fuels 36.40 31.14 36.14 28.45 37.89 20.84 42.20
1.B.1 – Solid fuels 36.40 31.14 36.14 28.45 37.89 20.84 42.20
GHG EMISSIONS (Gg CO2eq)
Category 2011 2012 2013 2014 2015 2016 2017
1 – Energy 2,816.92 2,680.96 2,477.19 2,347.67 2,551.11 2,388.97 2,525.25
1.A – Fuel combustion 2,774.72 2,638.00 2,440.35 2,311.63 2,506.74 2,343.17 2,475.38
1.A.1 – Electricity and heat generation 1,742.23 1,710.25 1,519.92 1,522.14 1,654.08 1,378.14 1,428.09
1.A.2 – Industry and construction 147.03 103.23 134.52 160.53 159.39 160.72 186.45
1.A.3 – Transport 682.85 661.43 638.40 533.02 591.21 696.71 761.76
1.A.4 – Other sectors 202.61 163.08 147.51 95.94 102.07 107.59 99.09
1.B – Fugitive emissions from fuels 42.20 42.96 36.84 36.04 44.36 45.80 49.87
1.B.1 – Solid fuels 42.20 42.96 36.84 36.04 44.36 45.80 49.87
GHG EMISSIONS (Gg CO2eq)
Category 2018 2019
1 – Energy 2,796.59 2,701.70
1.A – Fuel combustion 2,743.57 2,652.76
1.A.1 – Electricity and heat generation 1,642.42 1,480.67
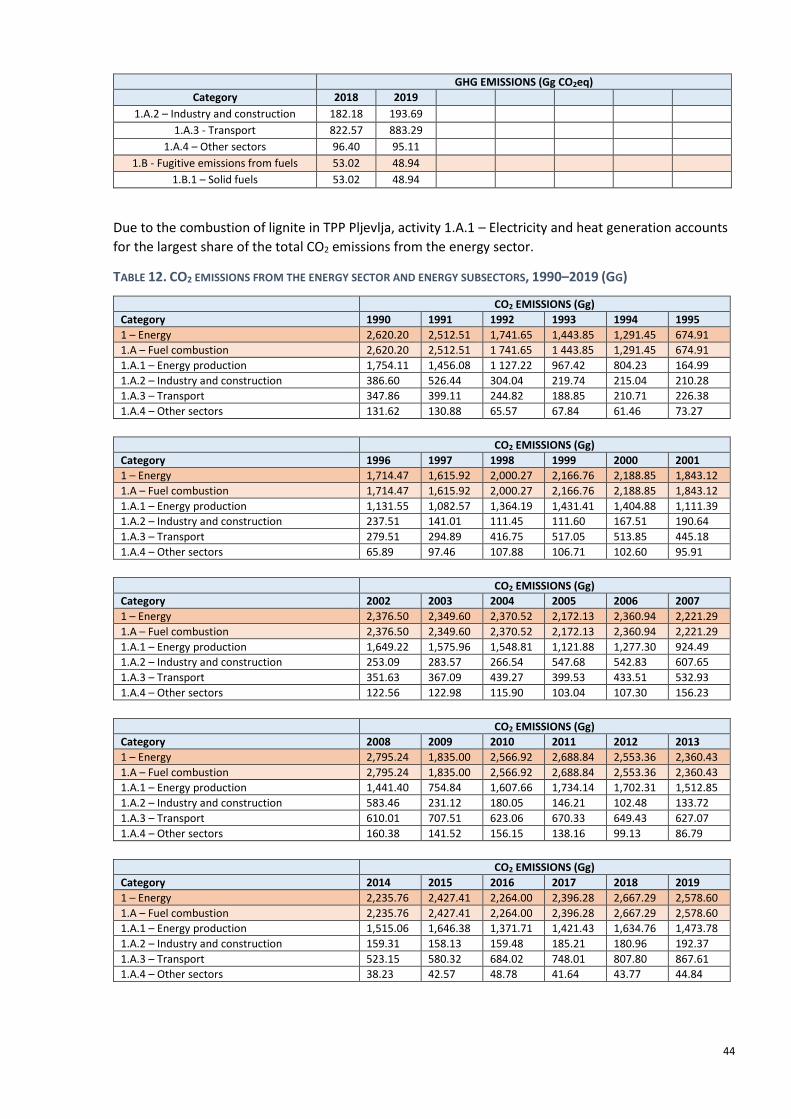
44
GHG EMISSIONS (Gg CO2eq)
Category 2018 2019
1.A.2 – Industry and construction 182.18 193.69
1.A.3 - Transport 822.57 883.29
1.A.4 – Other sectors 96.40 95.11
1.B - Fugitive emissions from fuels 53.02 48.94
1.B.1 – Solid fuels 53.02 48.94
Due to the combustion of lignite in TPP Pljevlja, activity 1.A.1 – Electricity and heat generation accounts
for the largest share of the total CO2 emissions from the energy sector.
TABLE 12. CO2 EMISSIONS FROM THE ENERGY SECTOR AND ENERGY SUBSECTORS, 1990–2019 (GG)
CO2 EMISSIONS (Gg)
Category 1990 1991 1992 1993 1994 1995
1 – Energy 2,620.20 2,512.51 1,741.65 1,443.85 1,291.45 674.91
1.A – Fuel combustion 2,620.20 2,512.51 1 741.65 1 443.85 1,291.45 674.91
1.A.1 – Energy production 1,754.11 1,456.08 1 127.22 967.42 804.23 164.99
1.A.2 – Industry and construction 386.60 526.44 304.04 219.74 215.04 210.28
1.A.3 – Transport 347.86 399.11 244.82 188.85 210.71 226.38
1.A.4 – Other sectors 131.62 130.88 65.57 67.84 61.46 73.27
CO2 EMISSIONS (Gg)
Category 1996 1997 1998 1999 2000 2001
1 – Energy 1,714.47 1,615.92 2,000.27 2,166.76 2,188.85 1,843.12
1.A – Fuel combustion 1,714.47 1,615.92 2,000.27 2,166.76 2,188.85 1,843.12
1.A.1 – Energy production 1,131.55 1,082.57 1,364.19 1,431.41 1,404.88 1,111.39
1.A.2 – Industry and construction 237.51 141.01 111.45 111.60 167.51 190.64
1.A.3 – Transport 279.51 294.89 416.75 517.05 513.85 445.18
1.A.4 – Other sectors 65.89 97.46 107.88 106.71 102.60 95.91
CO2 EMISSIONS (Gg)
Category 2002 2003 2004 2005 2006 2007
1 – Energy 2,376.50 2,349.60 2,370.52 2,172.13 2,360.94 2,221.29
1.A – Fuel combustion 2,376.50 2,349.60 2,370.52 2,172.13 2,360.94 2,221.29
1.A.1 – Energy production 1,649.22 1,575.96 1,548.81 1,121.88 1,277.30 924.49
1.A.2 – Industry and construction 253.09 283.57 266.54 547.68 542.83 607.65
1.A.3 – Transport 351.63 367.09 439.27 399.53 433.51 532.93
1.A.4 – Other sectors 122.56 122.98 115.90 103.04 107.30 156.23
CO2 EMISSIONS (Gg)
Category 2008 2009 2010 2011 2012 2013
1 – Energy 2,795.24 1,835.00 2,566.92 2,688.84 2,553.36 2,360.43
1.A – Fuel combustion 2,795.24 1,835.00 2,566.92 2,688.84 2,553.36 2,360.43
1.A.1 – Energy production 1,441.40 754.84 1,607.66 1,734.14 1,702.31 1,512.85
1.A.2 – Industry and construction 583.46 231.12 180.05 146.21 102.48 133.72
1.A.3 – Transport 610.01 707.51 623.06 670.33 649.43 627.07
1.A.4 – Other sectors 160.38 141.52 156.15 138.16 99.13 86.79
CO2 EMISSIONS (Gg)
Category 2014 2015 2016 2017 2018 2019
1 – Energy 2,235.76 2,427.41 2,264.00 2,396.28 2,667.29 2,578.60
1.A – Fuel combustion 2,235.76 2,427.41 2,264.00 2,396.28 2,667.29 2,578.60
1.A.1 – Energy production 1,515.06 1,646.38 1,371.71 1,421.43 1,634.76 1,473.78
1.A.2 – Industry and construction 159.31 158.13 159.48 185.21 180.96 192.37
1.A.3 – Transport 523.15 580.32 684.02 748.01 807.80 867.61
1.A.4 – Other sectors 38.23 42.57 48.78 41.64 43.77 44.84

45
By comparing CH4 emissions with CO2 emissions, we can conclude that the level of methane emissions
from the energy sector is rather low and relates to combustion in other energy activities (1.A.4) and
fugitive fuel emissions (1.B), including fugitive emissions from the coal mine in Pljevlja. After comparing
the 1990–2010 and 2011–2019 series, it can be seen that there has been an increase in CH4 emissions
over the last nine years (2010–2019). The analysis of energy balances shows that the observed increase
in emissions was caused by biomass consumption since 2011.
TABLE 13. CH4 EMISSIONS FROM THE ENERGY SECTOR AND ENERGY SUBSECTORS, 1990–2019 (GG)
CH4 EMISSIONS (Gg)
Category 1990 1991 1992 1993 1994 1995 1996
1 – Energy 4.24 3.65 4.01 4.29 3.45 3.40 3.50
1.A – Fuel combustion 2.36 2.08 2.16 2.33 1.66 1.87 1.81
1.A.1 – Electricity and heat generation 0.03 0.02 0.02 0.01 0.01 0.01 0.01
1.A.2 – Industry and construction 0.01 0.02 0.01 0.01 0.01 0.01 0.01
1.A.3 – Transport 0.11 0.12 0.08 0.06 0.06 0.07 0.08
1.A.4 – Other sectors 2.21 1.91 2.06 2.25 1.58 1.78 1.71
1.B – Fugitive emissions from fuel 1.88 1.58 1.85 1.96 1.78 1.54 1.69
1.B.1 – Solid fuels 1.88 1.58 1.85 1.96 1.78 1.54 1.69
CH4 EMISSIONS (Gg)
Category 1997 1998 1999 2000 2001 2002 2003
1 – Energy 3.08 2.98 3.10 3.05 2.60 4.28 3.48
1.A – Fuel combustion 1.69 1.59 1.69 1.69 1.44 2.00 2.07
1.A.1 – Electricity and heat generation 0.02 0.02 0.02 0.02 0.02 0.02 0.02
1.A.2 – Industry and construction 0.01 0.00 0.01 0.01 0.01 0.01 0.01
1.A.3 – Transport 0.09 0.13 0.15 0.13 0.11 0.09 0.10
1.A.4 – Other sectors 1.58 1.44 1.51 1.53 1.30 1.88 1.94
1.B – Fugitive emissions from fuel 1.39 1.39 1.42 1.36 1.17 2.28 1.41
1.B.1 – Solid fuels 1.39 1.39 1.42 1.36 1.17 2.28 1.41
CH4 EMISSIONS (Gg)
Category 2004 2005 2006 2007 2008 2009 2010
1 – Energy 3.55 3.24 3.51 3.26 3.64 3.07 3.94
1.A – Fuel combustion 2.10 1.99 2.06 2.12 2.13 2.23 2.26
1.A.1 – Electricity and heat generation 0.02 0.01 0.01 0.01 0.01 0.01 0.02
1.A.2 – Industry and construction 0.01 0.02 0.02 0.02 0.02 0.01 0.01
1.A.3 – Transport 0.10 0.10 0.11 0.11 0.11 0.14 0.12
1.A.4 – Other sectors 1.96 1.86 1.92 1.98 1.98 2.08 2.11
1.B – Fugitive emissions from fuel 1.46 1.25 1.45 1.14 1.52 0.83 1.69
1.B.1 – Solid fuels 1.46 1.25 1.45 1.14 1.52 0.83 1.69
CH4 EMISSIONS (Gg)
Category 2011 2012 2013 2014 2015 2016 2017
1 – Energy 4.03 4.05 3.66 3.55 3.95 4.00 4.11
1.A – Fuel combustion 2.34 2.33 2.19 2.11 2.18 2.16 2.12
1.A.1 – Electricity and heat generation 0.02 0.02 0.01 0.02 0.02 0.01 0.01
1.A.2 – Industry and construction 0.01 0.01 0.01 0.02 0.02 0.02 0.02
1.A.3 – Transport 0.10 0.10 0.07 0.09 0.10 0.10 0.11
1.A.4 – Other sectors 2.21 2.20 2.09 1.99 2.05 2.03 1.98
1.B – Fugitive emissions from fuel 1.69 1.72 1.47 1.44 1.77 1.83 1.99
1.B.1 – Solid fuels 1.69 1.72 1.47 1.44 1.77 1.83 1.99
CH4 EMISSIONS (Gg)
Category 2018 2019
1 – Energy 4.08 3.84
1.A – Fuel combustion 1.96 1.88
1.A.1 – Electricity and heat generation 0.02 0.01
1.A.2 – Industry and construction 0.02 0.02
1.A.3 – Transport 0.11 0.12

46
1.A.4 – Other sectors 1.81 1.73
1.B – Fugitive emissions from fuel 2.12 1.96
1.B.1 – Solid fuels 2.12 1.96
A low level of N2O emissions from the energy sector is recorded during the reporting period, with the
largest share from 1A4 – Other sectors, specifically fuel combustion, with a negligible share from the
transport sector.
TABLE 14. N2O EMISSIONS FROM THE ENERGY SECTOR AND ENERGY SUBSECTORS, 1990–2019 (GG)
N2O EMISSIONS (Gg)
Category 1990 1991 1992 1993 1994 1995 1996
1 – Energy 0.07 0.07 0.06 0.05 0.04 0.04 0.05
1.A – Fuel combustion 0.07 0.07 0.06 0.05 0.04 0.04 0.05
1.A.1 – Electricity and heat generation 0.02 0.02 0.02 0.01 0.01 0.00 0.02
1.A.2 – Industry and construction 0.00 0.00 0.00 0.00 0.00 0.00 0.00
1.A.3 – Transport 0.02 0.02 0.01 0.01 0.01 0.01 0.01
1.A.4 – Other sectors 0.03 0.03 0.03 0.03 0.02 0.02 0.02
N2O EMISSIONS (Gg)
Category 1997 1998 1999 2000 2001 2002 2003
1 – Energy 0.05 0.06 0.07 0.07 0.06 0.07 0.07
1.A – Fuel combustion 0.05 0.06 0.07 0.07 0.06 0.07 0.07
1.A.1 – Electricity and heat generation 0.01 0.02 0.02 0.02 0.01 0.02 0.02
1.A.2 – Industry and construction 0.00 0.00 0.00 0.00 0.00 0.00 0.00
1.A.3 – Transport 0.01 0.02 0.03 0.03 0.02 0.02 0.02
1.A.4 – Other sectors 0.02 0.02 0.02 0.02 0.02 0.03 0.03
N2O EMISSIONS (Gg)
Category 2004 2005 2006 2007 2008 2009 2010
1 – Energy 0.07 0.07 0.07 0.07 0.08 0.08 0.08
1.A – Fuel combustion 0.07 0.07 0.07 0.07 0.08 0.08 0.08
1.A.1 – Electricity and heat generation 0.02 0.02 0.02 0.01 0.02 0.01 0.02
1.A.2 – Industry and construction 0.00 0.00 0.00 0.00 0.00 0.00 0.00
1.A.3 – Transport 0.02 0.02 0.02 0.03 0.03 0.03 0.03
1.A.4 – Other sectors 0.03 0.03 0.03 0.03 0.03 0.03 0.03
N2O EMISSIONS (Gg)
Category 2011 2012 2013 2014 2015 2016 2017
1 – Energy 0.09 0.09 0.08 0.08 0.08 0.08 0.09
1.A – Fuel combustion 0.09 0.09 0.08 0.08 0.08 0.08 0.09
1.A.1 – Electricity and heat generation 0.03 0.03 0.02 0.02 0.02 0.02 0.02
1.A.2 – Industry and construction 0.00 0.00 0.00 0.00 0.00 0.00 0.00
1.A.3 – Transport 0.03 0.03 0.03 0.03 0.03 0.03 0.04
1.A.4 – Other sectors 0.03 0.03 0.03 0.03 0.03 0.03 0.03
N2O EMISSIONS (Gg)
Category 2018 2019
1 – Energy 0.09 0.09
1.A – Fuel combustion 0.09 0.09
1.A.1 – Electricity and heat generation 0.02 0.02
1.A.2 – Industry and construction 0.00 0.00
1.A.3 – Transport 0.04 0.04
1.A.4 – Other sectors 0.02 0.02
With the exception of the 1990s crisis period, emissions from the transport sector recorded an increase
over the observed period in line with the increase in the number of vehicles used in road transport.
Road transport makes up the largest share of total emissions from transport, given the fact that there is

47
almost no intra-state air traffic, non-scheduled nautical transport and low GHG emissions from rail
transport, which was refocused from diesel to electric locomotives during 2011.
FIGURE 15. TOTAL GHG EMISSIONS FROM THE TRANSPORT SECTOR, 1990–2019
International bunkers Table 15 shows the emissions from international bunkers, which have not been included in the national
totals.
TABLE 15. EMISSIONS FROM INTERNATIONAL BUNKERS, 1990–2019 (GG CO2 EQ)
Year 1990 1991 1992 1993 1994 1995 1996 1997 1998 1999 2000
International navigation
NE NE NE NE NE NE NE NE NE NE NE
International aviation 30.91 34.06 4.76 2.38 2.38 2.38 2.38 2.38 11.89 30.91 30.91
Year 2001 2002 2003 2004 2005 2006 2007 2008 2009 2010 2011
International navigation
NE NE NE NE NE NE NE NE NE NE NE
International aviation 38.04 40.36 32.68 7.14 29.51 32.25 10.67 18.00 13.25 32.07 17.01
Year 2012 2013 2014 2015 2016 2017 2018 2019
International navigation
NE NE NE NE NE NE NE NE
International aviation 3.22 6.12 27.39 29.14 28.40 26.57 34.42 59.48
Reference approach The CO2 emissions from the energy sector were estimated using the reference approach as well. Figure
16 and Table 16 show the CO2 emissions from the energy sector calculated by both approaches.
0
200
400
600
800
1,000
1990
1991
1992
1993
1994
1995
1996
1997
1998
1999
2000
2001
2002
2003
2004
2005
2006
2007
2008
2009
2010
2011
2012
2013
2014
2015
2016
2017
2018
2019
GH
G G
g C
O2
eq
1.A.3.b – Road transport 1.A.3.c – Rail transport
1.A.3.d ii – Domestic water borne navigation 1.A.3.a.i – Domestic aviation

48
FIGURE 16. CO2 EMISSIONS CALCULATED BY SECTORAL AND REFERENCE APPROACHES
TABLE 16. CO2 EMISSIONS CALCULATED BY SECTORAL AND REFERENCE APPROACHES
Year Reference approach Sectoral approach Difference Difference
(Gg CO2) (Gg CO2) (Gg CO2) %
1990 2,701.19 2,701.34 −0.15 0.0%
1991 2,863.40 2,585.09 278.31 9.7%
1992 2,035.57 1,812.91 222.66 10.9%
1993 1,762.35 1,518.58 243.76 13.8%
1994 1,563.30 1,346.31 216.99 13.9%
1995 785.33 733.13 52.20 6.6%
1996 2,006.37 1,776.14 230.24 11.5%
1997 2,005.74 1,673.61 332.12 16.6%
1998 2,473.11 2,057.92 415.18 16.8%
1999 2,569.92 2,228.69 341.24 13.3%
2000 2,751.76 2,250.96 500.80 18.2%
2001 2,225.67 1,895.82 329.84 14.8%
2002 2,913.80 2,446.62 467.18 16.0%
2003 2,739.57 2,421.63 317.94 11.6%
2004 2,776.04 2,444.19 331.85 12.0%
2005 2,026.62 2,241.49 −214.87 −10.6%
2006 2,397.72 2,433.31 −35.59 −1.5%
2007 2,051.82 2,295.88 −244.06 −11.9%
2008 2,905.35 2,873.40 31.96 1.1%
2009 1,886.66 1,913.54 −26.88 −1.4%
2010 2,846.20 2,648.39 197.81 6.9%
2011 2,997.75 2,774.72 223.03 7.4%
2012 2,961.68 2,638.00 323.68 10.9%
2013 2,682.51 2,440.35 242.16 9.0%
2014 2,592.45 2,311.63 280.82 10.8%
2015 2,694.83 2,506.74 188.09 7.0%
2016 2,490.39 2,343.17 147.22 5.9%
2017 2,558.41 2,475.38 83.03 3.2%
2018 2,688.32 2,743.57 −55.24 −2.1%
2019 2,690.25 2,652.76 37.49 1.4%
0
500
1,000
1,500
2,000
2,500
3,000
3,500
1990
1992
1994
1996
1998
2000
2002
2004
2006
2008
2010
2012
2014
2016
2018
CO
2em
issi
on
s in
Gg
Reference
Approach
- Total
Sectoral
approach
- Total

49
The differences are explained by the following factors:
• Exclusion of fuels for non-energy use: bitumen, lubricants, other oil products
• Use of country-specific (plant-specific) NCV for lignite in the sectoral approach
• Liquid fuels: residual fuel oil (residual + heavy fuel) and other oil products
• Liquid fuels: the energy balance is mass-balanced but not carbon-balanced
• Transformation and distribution losses are not considered in the sectoral approach
IPPU The mining and metals industry are the main industrial production branches in Montenegro. Aluminium
and steel production are the most prominent branches in the metals industry sector. Other industrial
capacities include the production of: food, beverages, tobacco, textiles, lime, leather products, paper,
medications, and rubber and plastic products.
Montenegro’s economic development until 1991 was characterized by intensive industrial production, so
the share of GHG emissions from industry within the total emissions in the early 1990s was about 32.2%.
There was a continuous decline in industrial production after this period and in 2015 the share of
emissions was 11.0%, and only 10.4% in 2019.
Data sources Data related to the industrial production was provided by: MONSTAT; the Electric Power Industry of
Montenegro; the Electricity Transmission System of Montenegro; the Agency for Nature and
Environmental Protection; Podgorica Aluminium Plant; Nikšić Steel Factory; and Pljevlja Coal Mine.
Official MONSTAT statistics were used to estimate emissions from this sector, while industrial producers’
records were used to verify the inventory.
Methodology The estimation of direct GHG emissions from the industrial sector was carried out in accordance with the
2006 IPCC Guidelines.
Emission trends The estimated total GHG emissions from industrial subsectors for the observed period are shown in Table
17 and Figure 17. In all industrial subsectors, the level of GHG emissions strictly follows the level of
production volume during the period 1990–2019, as well as technological improvements in the
electrolysis plant of the KAP.
TABLE 17. TOTAL GHG EMISSIONS FROM INDUSTRIAL SUBSECTORS, 1990–2019 (GG CO2EQ)
GHG emissions (Gg CO2 eq)
Category 1990 1991 1992 1993 1994 1995 1996 1997
2 – IPPU 1,704.68 2,206.15 1,422.12 543.76 135.53 418.51 1,002.21 1,533.24
2.A – Minerals industry 24.75 23.25 16.50 9.75 3.00 5.25 6.00 6.00
2.A.2 – Lime production 24.75 23.25 16.50 9.75 3.00 5.25 6.00 6.00
2.C – Metals industry 1,675.97 2,177.20 1,398.96 524.72 118.66 393.88 970.82 1,495.77
2.C.1 – Production of iron and steel
16.66 15.76 11.46 9.25 8.97 7.11 8.22 10.62
2.C.3 – Production of aluminium
1,659.30 2,161.45 1,387.50 515.46 109.68 386.77 962.60 1,485.15
2.D – Non-energy fuel consumption and use of solvents
3.07 3.48 2.00 1.24 1.53 2.06 2.48 2.42
2.D.1 – Use of lubricants 3.07 3.48 2.00 1.24 1.53 2.06 2.48 2.42

50
GHG emissions (Gg CO2 eq)
Category 1990 1991 1992 1993 1994 1995 1996 1997
2.F – Use of substances to replace ozone-depleting substances
NO 1.33 3.79 7.22 11.48 16.46 22.06 28.19
2.F.1 – Refrigerators and air conditioners
NO 1.33 3.79 7.22 11.48 16.46 22.06 28.19
2.G – Production and use of other products
0.78 0.78 0.78 0.78 0.78 0.78 0.78 0.78
2.G.1 – Electrical equipment 0.78 0.78 0.78 0.78 0.78 0.78 0.78 0.78
2.H – Other 0.11 0.10 0.08 0.06 0.07 0.08 0.08 0.08
2.H.2 – Food and beverages industry
0.11 0.10 0.08 0.06 0.07 0.08 0.08 0.08
GHG emissions (Gg CO2 eq)
Category 1998 1999 2000 2001 2002 2003 2004 2005
2 – IPPU 1,167.70 1,222.78 1,579.41 1,659.46 1,612.45 1,380.59 1,272.88 1,167.11
2.A – Minerals industry 6.00 6.00 5.33 9.74 8.34 6.10 7.94 4.51
2.A.2 – Lime production 6.00 6.00 5.33 9.74 8.34 6.10 7.94 4.51
2.C – Metals industry 1,123.45 1,171.57 1,521.35 1,589.32 1,535.75 1,297.72 1,179.51 1,070.13
2.C.1 – Production of iron and steel
11.35 7.06 6.80 8.81 6.65 4.74 12.05 8.21
2.C.3 – Production of aluminium
1,112.10 1,164.51 1,514.55 1,580.51 1,529.11 1,292.99 1,167.46 1,061.92
2.D – Non-energy fuel consumption and use of solvents
2.54 2.48 2.54 2.54 2.54 2.54 2.59 0.58
2.D.1 – Use of lubricants 2.54 2.48 2.54 2.54 2.54 2.54 2.59 0.58
2.F – Use of substances to replace ozone-depleting substances
34.79 41.79 49.15 56.82 64.78 72.98 81.40 90.37
2.F.1 – Refrigerators and air conditioners
34.79 41.79 49.15 56.82 64.78 72.98 81.40 90.37
2.G – Production and use of other products
0.84 0.84 0.92 0.92 0.97 1.15 1.33 1.43
2.G.1 – Electrical equipment 0.84 0.84 0.92 0.92 0.97 1.15 1.33 1.43
2.H – Other 0.09 0.10 0.11 0.12 0.07 0.10 0.10 0.10
2.H.2 – Food and beverages industry
0.09 0.10 0.11 0.12 0.07 0.10 0.10 0.10
GHG emissions (Gg CO2 eq)
Category 2006 2007 2008 2009 2010 2011 2012 2013
2 – IPPU 1,291.38 1,414.15 1,565.61 603.63 795.64 752.29 539.12 401.61
2.A – Minerals industry 6.09 5.32 7.38 3.37 0.63 2.59 NO NO
2.A.2 – Lime production 6.09 5.32 7.38 3.37 0.63 2.59 NO NO
2.C – Metals industry 1,176.24 1,285.04 1,419.49 449.58 633.15 577.15 344.32 194.29
2.C.1 – Production of iron and steel
12.95 13.96 16.19 8.30 3.87 4.91 2.10 1.58
2.C.3 – Production of aluminium
1,163.29 1,271.08 1,403.30 441.28 629.27 572.25 342.22 192.70
2.D – Non-energy fuel consumption and use of solvents
1.24 0.68 0.66 0.52 0.45 0.59 0.59 0.59
2.D.1 – Use of lubricants 1.24 0.68 0.66 0.52 0.45 0.59 0.59 0.59
2.F – Use of substances to replace ozone-depleting substances
106.22 121.52 136.45 148.53 159.77 170.28 192.12 204.47
2.F.1 – Refrigerators and air conditioners
106.22 121.52 136.45 148.53 159.77 170.28 192.12 204.47

51
GHG emissions (Gg CO2 eq)
Category 2006 2007 2008 2009 2010 2011 2012 2013
2.G – Production and use of other products
1.49 1.49 1.52 1.54 1.55 1.60 2.00 2.19
2.G.1 – Electrical equipment 1.49 1.49 1.52 1.54 1.55 1.60 2.00 2.19
2.H – Other 0.11 0.11 0.11 0.10 0.09 0.08 0.08 0.08
2.H.2 – Food and beverages industry
0.11 0.11 0.11 0.10 0.09 0.08 0.08 0.08
GHG emissions (Gg CO2 eq)
Category 2014 2015 2016 2017 2018 2019
2 – IPPU 395.06 385.96 376.18 391.83 393.52 376.89
2.A – Minerals industry NO NO NO NO NO NO
2.A.2 – Lime production NO NO NO NO NO NO
2.C – Metals industry 156.18 142.87 112.50 113.50 105.20 95.90
2.C.1 – Production of iron and steel
1.15 2.94 3.62 3.63 3.63 3.39
2.C.3 – Production of aluminium
155.03 139.93 108.87 109.87 101.58 92.51
2.D – Non-energy fuel consumption and use of solvents
19.57 20.16 21.52 25.82 27.77 29.13
2.D.1 – Use of lubricants 19.57 20.16 21.52 25.82 27.77 29.13
2.F – Use of substances to replace ozone-depleting substances
217.00 220.62 239.57 249.44 257.02 248.35
2.F.1 – Refrigerators and air conditioners
217.00 220.62 239.57 249.44 257.02 248.35
2.G – Production and use of other products
2.23 2.23 2.52 2.99 3.44 3.44
2.G.1 – Electrical equipment 2.23 2.23 2.52 2.99 3.44 3.44
2.H – Other 0.08 0.08 0.08 0.08 0.08 0.08
2.H.2 – Food and beverages industry
0.08 0.08 0.08 0.08 0.08 0.08
The share of GHG emissions from aluminium production out of total emissions from the industry was
9.20% in 2019. Starting from 2009, due to a significant reduction in the volume of aluminium output, but
also due to technological improvements in the electrolysis plant, PFC emissions have dropped and
consequently the dominant share of the aluminium industry within total industrial emissions has also
dropped. With the increase in the number of refrigeration units, especially air conditioners in households,
the PFC emissions from these activities have been increasing. However, the value of this emission is low
compared to the total value of emissions from all sectors.
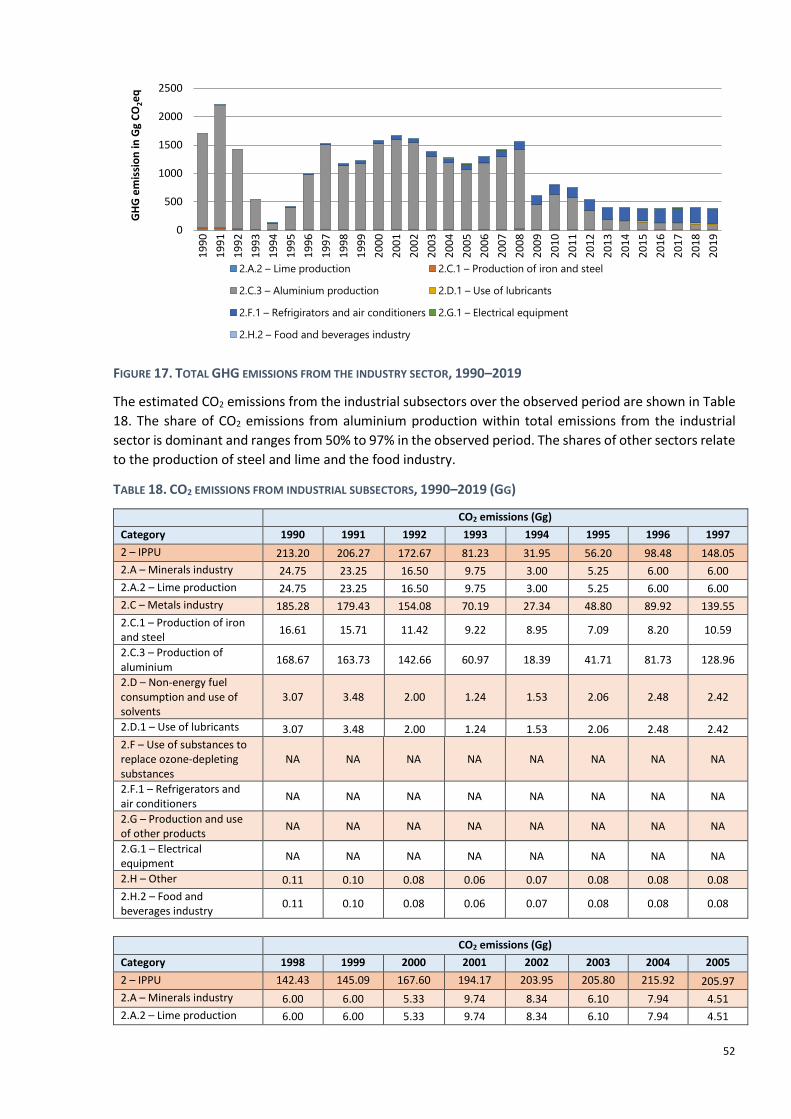
52
FIGURE 17. TOTAL GHG EMISSIONS FROM THE INDUSTRY SECTOR, 1990–2019
The estimated CO2 emissions from the industrial subsectors over the observed period are shown in Table
18. The share of CO2 emissions from aluminium production within total emissions from the industrial
sector is dominant and ranges from 50% to 97% in the observed period. The shares of other sectors relate
to the production of steel and lime and the food industry.
TABLE 18. CO2 EMISSIONS FROM INDUSTRIAL SUBSECTORS, 1990–2019 (GG)
CO2 emissions (Gg)
Category 1990 1991 1992 1993 1994 1995 1996 1997
2 – IPPU 213.20 206.27 172.67 81.23 31.95 56.20 98.48 148.05
2.A – Minerals industry 24.75 23.25 16.50 9.75 3.00 5.25 6.00 6.00
2.A.2 – Lime production 24.75 23.25 16.50 9.75 3.00 5.25 6.00 6.00
2.C – Metals industry 185.28 179.43 154.08 70.19 27.34 48.80 89.92 139.55
2.C.1 – Production of iron and steel
16.61 15.71 11.42 9.22 8.95 7.09 8.20 10.59
2.C.3 – Production of aluminium
168.67 163.73 142.66 60.97 18.39 41.71 81.73 128.96
2.D – Non-energy fuel consumption and use of solvents
3.07 3.48 2.00 1.24 1.53 2.06 2.48 2.42
2.D.1 – Use of lubricants 3.07 3.48 2.00 1.24 1.53 2.06 2.48 2.42
2.F – Use of substances to replace ozone-depleting substances
NA NA NA NA NA NA NA NA
2.F.1 – Refrigerators and air conditioners
NA NA NA NA NA NA NA NA
2.G – Production and use of other products
NA NA NA NA NA NA NA NA
2.G.1 – Electrical equipment
NA NA NA NA NA NA NA NA
2.H – Other 0.11 0.10 0.08 0.06 0.07 0.08 0.08 0.08
2.H.2 – Food and beverages industry
0.11 0.10 0.08 0.06 0.07 0.08 0.08 0.08
CO2 emissions (Gg)
Category 1998 1999 2000 2001 2002 2003 2004 2005
2 – IPPU 142.43 145.09 167.60 194.17 203.95 205.80 215.92 205.97
2.A – Minerals industry 6.00 6.00 5.33 9.74 8.34 6.10 7.94 4.51
2.A.2 – Lime production 6.00 6.00 5.33 9.74 8.34 6.10 7.94 4.51
0
500
1000
1500
2000
2500
19
90
19
91
19
92
19
93
19
94
19
95
19
96
19
97
19
98
19
99
20
00
20
01
20
02
20
03
20
04
20
05
20
06
20
07
20
08
20
09
20
10
20
11
20
12
20
13
20
14
20
15
20
16
20
17
20
18
20
19
GH
G e
mis
sio
n in
Gg
CO
2eq
2.A.2 – Lime production 2.C.1 – Production of iron and steel
2.C.3 – Aluminium production 2.D.1 – Use of lubricants
2.F.1 – Refrigirators and air conditioners 2.G.1 – Electrical equipment
2.H.2 – Food and beverages industry
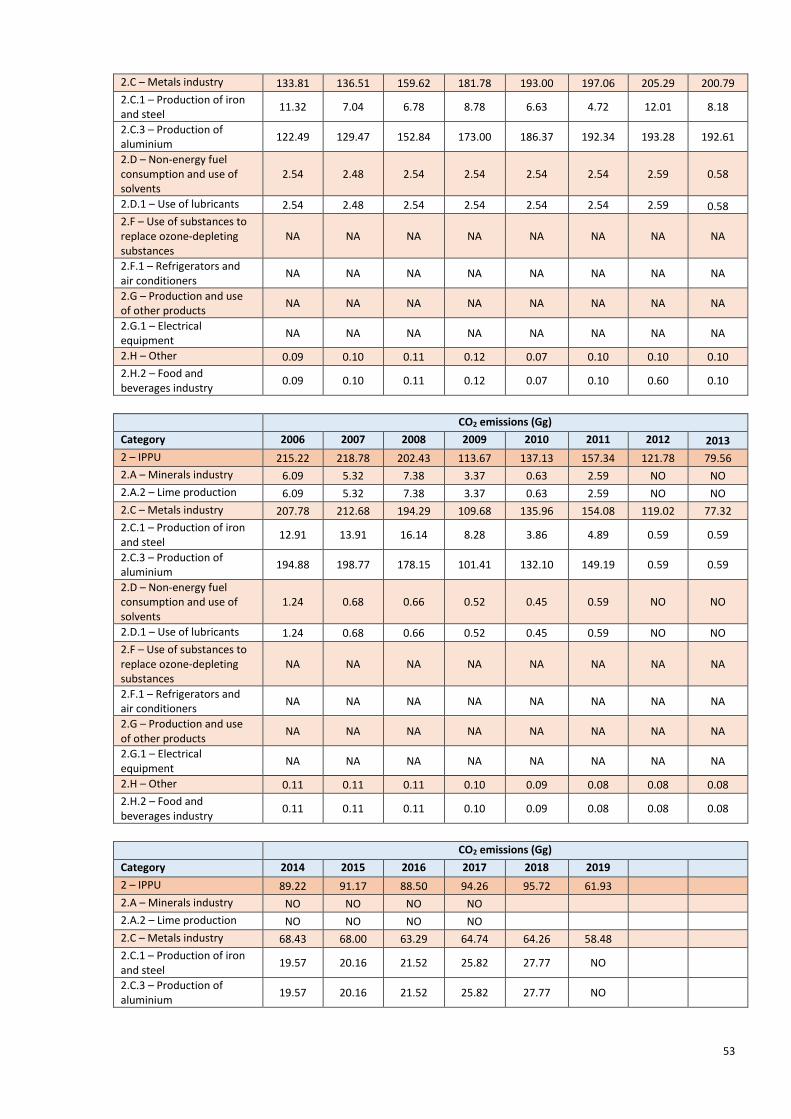
53
2.C – Metals industry 133.81 136.51 159.62 181.78 193.00 197.06 205.29 200.79
2.C.1 – Production of iron and steel
11.32 7.04 6.78 8.78 6.63 4.72 12.01 8.18
2.C.3 – Production of aluminium
122.49 129.47 152.84 173.00 186.37 192.34 193.28 192.61
2.D – Non-energy fuel consumption and use of solvents
2.54 2.48 2.54 2.54 2.54 2.54 2.59 0.58
2.D.1 – Use of lubricants 2.54 2.48 2.54 2.54 2.54 2.54 2.59 0.58
2.F – Use of substances to replace ozone-depleting substances
NA NA NA NA NA NA NA NA
2.F.1 – Refrigerators and air conditioners
NA NA NA NA NA NA NA NA
2.G – Production and use of other products
NA NA NA NA NA NA NA NA
2.G.1 – Electrical equipment
NA NA NA NA NA NA NA NA
2.H – Other 0.09 0.10 0.11 0.12 0.07 0.10 0.10 0.10
2.H.2 – Food and beverages industry
0.09 0.10 0.11 0.12 0.07 0.10 0.60 0.10
CO2 emissions (Gg)
Category 2006 2007 2008 2009 2010 2011 2012 2013
2 – IPPU 215.22 218.78 202.43 113.67 137.13 157.34 121.78 79.56
2.A – Minerals industry 6.09 5.32 7.38 3.37 0.63 2.59 NO NO
2.A.2 – Lime production 6.09 5.32 7.38 3.37 0.63 2.59 NO NO
2.C – Metals industry 207.78 212.68 194.29 109.68 135.96 154.08 119.02 77.32
2.C.1 – Production of iron and steel
12.91 13.91 16.14 8.28 3.86 4.89 0.59 0.59
2.C.3 – Production of aluminium
194.88 198.77 178.15 101.41 132.10 149.19 0.59 0.59
2.D – Non-energy fuel consumption and use of solvents
1.24 0.68 0.66 0.52 0.45 0.59 NO NO
2.D.1 – Use of lubricants 1.24 0.68 0.66 0.52 0.45 0.59 NO NO
2.F – Use of substances to replace ozone-depleting substances
NA NA NA NA NA NA NA NA
2.F.1 – Refrigerators and air conditioners
NA NA NA NA NA NA NA NA
2.G – Production and use of other products
NA NA NA NA NA NA NA NA
2.G.1 – Electrical equipment
NA NA NA NA NA NA NA NA
2.H – Other 0.11 0.11 0.11 0.10 0.09 0.08 0.08 0.08
2.H.2 – Food and beverages industry
0.11 0.11 0.11 0.10 0.09 0.08 0.08 0.08
CO2 emissions (Gg)
Category 2014 2015 2016 2017 2018 2019
2 – IPPU 89.22 91.17 88.50 94.26 95.72 61.93
2.A – Minerals industry NO NO NO NO
2.A.2 – Lime production NO NO NO NO
2.C – Metals industry 68.43 68.00 63.29 64.74 64.26 58.48
2.C.1 – Production of iron and steel
19.57 20.16 21.52 25.82 27.77 NO
2.C.3 – Production of aluminium
19.57 20.16 21.52 25.82 27.77 NO

54
2.D – Non-energy fuel consumption and use of solvents
NA NA NA NA NA NA
2.D.1 – Use of lubricants NA NA NA NA NA NA
2.F – Use of substances to replace ozone-depleting substances
NA NA NA NA NA NA
2.F.1 – Refrigerators and air conditioners
NA NA NA NA NA NA
2.G – Production and use of other products
NA NA NA NA NA NA
2.G.1 – Electrical equipment
NA NA NA NA NA NA
2.H – Other 0.08 0.08 0.08 0.08 0.08 0.08
2.H.2 – Food and beverages industry
0.08 0.08 0.08 0.08 0.08 0.08
The estimated CH4 emissions from the industrial subsectors for the observed period are shown in Table
19. The total estimated methane emissions from this sector originate from the iron and steel industry.
TABLE 19. CH4 EMISSIONS FROM INDUSTRIAL SUBSECTORS, 1990–2019 (GG)
CH4 emissions (Gg)
Category 1990 1991 1992 1993 1994 1995 1996 1997
2 – IPPU 0.002 0.002 0.001 0.001 0.001 0.001 0.001 0.001
2.C – Metals industry 0.002 0.002 0.001 0.001 0.001 0.001 0.001 0.001
2.C.1 – Production of iron and steel
0.002 0.002 0.001 0.001 0.001 0.001 0.001 0.001
CH4 emissions (Gg)
Category 1998 1999 2000 2001 2002 2003 2004 2005
2 – IPPU 0.001 0.001 0.001 0.001 0.001 0.001 0.002 0.001
2.C – Metals industry 0.001 0.001 0.001 0.001 0.001 0.001 0.002 0.001
2.C.1 – Production of iron and steel
0.001 0.001 0.001 0.001 0.001 0.001 0.002 0.001
CH4 emissions (Gg)
Category 2006 2007 2008 2009 2010 2011 2012 2013
2 – IPPU 0.001 0.002 0.002 0.002 0.001 0.000 0.0003 0.0002
2.C – Metals industry 0.001 0.002 0.002 0.002 0.001 0.000 0.0003 0.0002
2.C.1 – Production of iron and steel
0.001 0.002 0.002 0.002 0.001 0.000 0.0003 0.0002
CH4 emissions (Gg)
Category 2014 2015 2016 2017 2018 2019
2 – IPPU 0.0001 0.0004 0.0005 0.0005 0.0005 0.0004
2.C – Metals industry 0.0001 0.0004 0.0005 0.0005 0.0005 0.0004
2.C.1 – Production of iron and steel
0.0001 0.0004 0.0005 0.0005 0.0005 0.0004
There are no emissions of N2O occurring from IPPU. The PFC, HFC and SF6 emissions shown in Table 10
are all emitted from the IPPU sector, the source of PFC emissions is 2.C.3 – Production of aluminium; for
SF6 emissions: 2.G.1 – Electrical equipment; and for HFCs: 2.F – Use of alternative substances, more
particularly the activity 2.F.1 – Refrigerators and air conditioners.
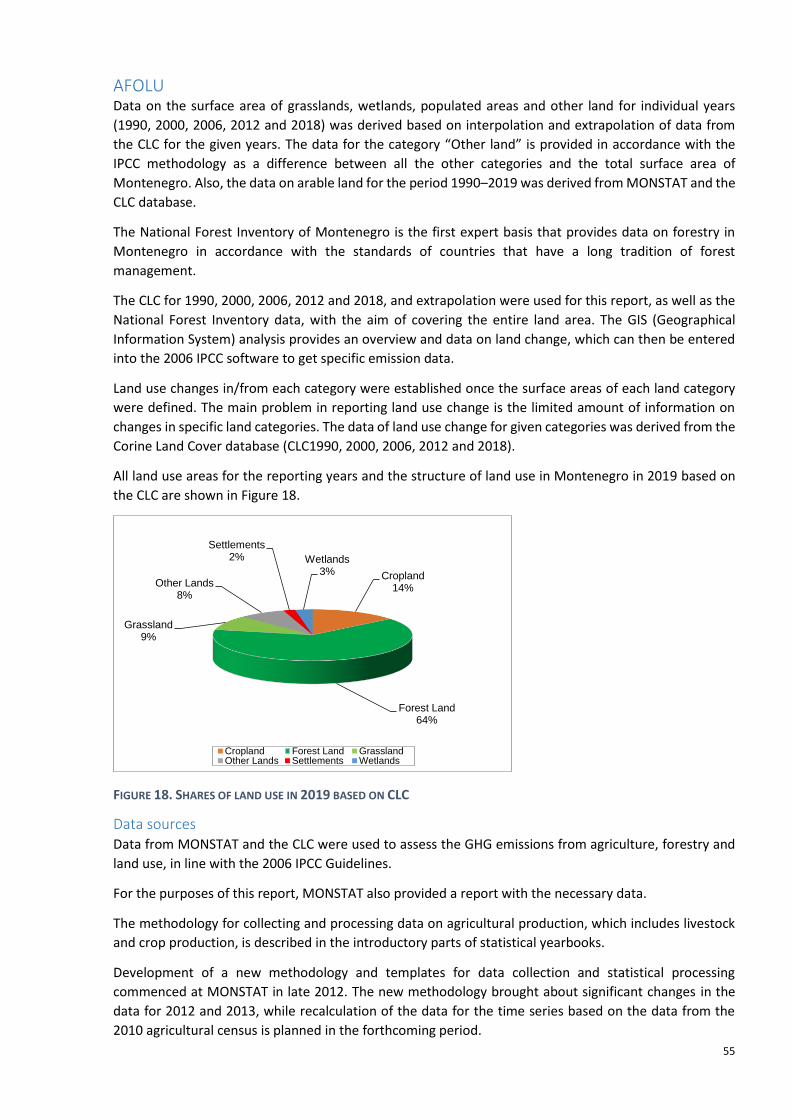
55
AFOLU Data on the surface area of grasslands, wetlands, populated areas and other land for individual years
(1990, 2000, 2006, 2012 and 2018) was derived based on interpolation and extrapolation of data from
the CLC for the given years. The data for the category “Other land” is provided in accordance with the
IPCC methodology as a difference between all the other categories and the total surface area of
Montenegro. Also, the data on arable land for the period 1990–2019 was derived from MONSTAT and the
CLC database.
The National Forest Inventory of Montenegro is the first expert basis that provides data on forestry in
Montenegro in accordance with the standards of countries that have a long tradition of forest
management.
The CLC for 1990, 2000, 2006, 2012 and 2018, and extrapolation were used for this report, as well as the
National Forest Inventory data, with the aim of covering the entire land area. The GIS (Geographical
Information System) analysis provides an overview and data on land change, which can then be entered
into the 2006 IPCC software to get specific emission data.
Land use changes in/from each category were established once the surface areas of each land category
were defined. The main problem in reporting land use change is the limited amount of information on
changes in specific land categories. The data of land use change for given categories was derived from the
Corine Land Cover database (CLC1990, 2000, 2006, 2012 and 2018).
All land use areas for the reporting years and the structure of land use in Montenegro in 2019 based on
the CLC are shown in Figure 18.
FIGURE 18. SHARES OF LAND USE IN 2019 BASED ON CLC
Data sources Data from MONSTAT and the CLC were used to assess the GHG emissions from agriculture, forestry and
land use, in line with the 2006 IPCC Guidelines.
For the purposes of this report, MONSTAT also provided a report with the necessary data.
The methodology for collecting and processing data on agricultural production, which includes livestock
and crop production, is described in the introductory parts of statistical yearbooks.
Development of a new methodology and templates for data collection and statistical processing
commenced at MONSTAT in late 2012. The new methodology brought about significant changes in the
data for 2012 and 2013, while recalculation of the data for the time series based on the data from the
2010 agricultural census is planned in the forthcoming period.
Cropland14%
Forest Land64%
Grassland9%
Other Lands8%
Settlements2% Wetlands
3%
Cropland Forest Land GrasslandOther Lands Settlements Wetlands

56
Data from statistical yearbooks (MONSTAT), records of the Forest Administration of Montenegro, data
from the National Forest Inventory of Montenegro (2013), as well as data from the “Analysis and
projections, using a regional climate model of the impact of climate change on future distribution and
growth of the main tree species in Montenegro” (UNDP, 2013) were used to estimate sinks.
The method used in forestry statistics since the early 1960s was based on reports submitted by Regional
Units of the Forest Administration. The development of administrative data sources has created the
conditions for the application of statistical methods of data processing. Therefore, in order to harmonize
forestry statistics, the Statistical Office recalculated the data for the period 2010-2019. The revised data
meet the needs of national and much of the international reporting.
The data is presented in more detail in NIR 2021. Data on animal populations are divided into
subcategories (MONSTAT data has been used since 2009, while extrapolation was performed for earlier
series). Inputs categorized like this are useful for applying the Tier-2 emission estimation approach
because they are convenient if a higher methodology is used.
Methodology The estimation of GHG emissions from the AFOLU sector was carried out according to methodology of the
2006 IPCC Guidelines. Details for each category are described in NIR 2021.
Emission trends Total emissions with sinks from the land use sector range from −1,589.84 Gg CO2eq in 1990 to
−2,503.93Gg CO2eq in 2019 (Table 20).
In the total emissions from AFOLU, the largest share comes from enteric fermentation and ranges from
75–78%, while manure management accounts for 20% of the total emissions from the sector of
agriculture. However, as far as AFOLU is concerned, the most important are the sinks in the forestry sub-
sector, which depend primarily on the area covered by forest, wood mass in those areas and damage
caused by fires. Sinks range from −2,891.74 Gg CO2 in 2009 to −678.81 Gg CO2 in 2011. The second most
important sink is from wood production (HWP) in 2019, which contributed to the net removal of 142.43
Gg CO2eq, and since 1990 the sinks have increased more than threefold.
Significant difference between CO2eq sources and sinks in the land category is a consequence of new
updated data (deforestation, forests affected by wildfires and firewood) from the expert document “Third
National Communication” (MONSTAT, 2019, phases 1, 2 and 3) for the subcategory “Forest land”.
GHG emissions from the agricultural sector in almost all segments decreased during the reporting period
(1990–2019), due to reduced crop and livestock production (by about 60%) and a drop in the total animal
population.
The EU methodology for statistical data processing was applied during the 2010 agricultural census, while
the Statistical Office – MONSTAT undertook to recalculate the entire historical series. Recalculated
statistical data, as well as data on land conversion, was not available for the 1990–2013 GHG inventory
(Second Biennial Climate Change Update Report of Montenegro).
Table 20 shows the sources and sinks of GHG emissions from the agriculture and land use sector,
expressed as CO2eq.
TABLE 20. SOURCES AND SINKS OF GHG EMISSIONS, EXPRESSED AS CO2EQ FROM THE AFOLU SECTOR, 1990–2019
(GG)
GHG emissions (Gg CO2 eq)
1990 1991 1992 1993 1994 1995 1996
AFOLU −968.35 −1,314.96 −953.021 −1,668.57 −1,180.7 −1,036.9 −1,247.61
3 Agriculture 621.50 620.12 579.28 556.23 566.97 588.73 584.35
3.A.1 Enteric fermentation 483.90 482.47 453.10 436.16 444.24 457.87 456.34

57
3.B.2 Manure management 122.91 122.60 115.18 110.85 112.85 116.15 115.80
3.D.a Direct N2O emissions from managed soils
14.13 14.50 10.45 8.68 9.31 14.15 11.66
3.F Field burning of agricultural residues
0.07 0.07 0.07 0.06 0.07 0.08 0.07
4 Land use, land use change and forestry
−1,589.84 −1,935.08 −1,532.30 −2,224.80 −1,747.66 −1,625.64 −1,831.95
4.A Total forest land −1,575.29 −1,941.73 −1,555.78 −2,262.12 −1,787.11 −1,659.21 −1,874.22
4.B Cropland 0.04 0.04 0.04 0.04 0.04 0.04 0.04
4.C Grassland 0.00 0.00 0.00 0.00 0.00 0.00 0.00
4.D Wetlands 0.00 0.00 0.00 0.00 0.00 0.00 0.00
4.E Settlements 20.84 20.84 20.84 20.84 20.84 20.84 20.84
4.F Other land 7.87 7.87 7.87 7.87 7.87 7.87 7.87
4.G Harvested wood products
−43.31 −22.10 −5.28 8.57 10.70 4.82 13.52
GHG emissions (Gg CO2 eq)
1997 1998 1999 2000 2001 2002 2003
AFOLU −2,016.17 −2,116.18 −2,056.81 −1,516.49 −2,049.17 −2,213.8 −2,100.98
3 Agriculture 569.73 563.31 566.06 552.22 540.33 551.74 544.20
3.A.1 Enteric fermentation 443.86 439.22 441.70 430.92 421.42 430.48 423.75
3.B.2 Manure management 112.55 110.84 111.14 108.12 105.76 108.11 107.34
3.D.a Direct N2O emissions from managed soils
12.76 12.70 12.68 12.66 12.60 12.61 12.60
3.F Field burning of agricultural residues
0.09 0.08 0.07 0.05 0.08 0.08 0.06
3.G Liming 0.06 0.06 0.05 0.05 0.05 0.05 0.05
3.H Urea application 0.42 0.42 0.42 0.42 0.41 0.41 0.41
4 Land use, land use change and forestry
−2,585.90 −2,679.50 −2,622.87 −2,068.71 −2,589.50 −2,765.54 −2,645.18
4.A Total forest land −2,638.99 −2,732.21 −2,672.35 −2,106.62 −2,636.50 −2,801.59 −2,665.64
4.B Cropland 0.04 0.04 0.04 0.04 0.04 0.04 0.04
4.C Grassland 0.00 0.00 0.00 0.00 0.00 0.00 0.00
4.D Wetlands 0.00 0.00 0.00 0.00 0.00 0.00 0.00
4.E Settlements 20.84 20.84 20.84 20.84 20.84 20.84 20.84
4.F Other land 7.87 7.87 7.87 7.87 7.87 7.87 7.87
4.G Harvested wood products
24.34 23.97 20.73 9.16 18.25 7.30 −8.29
GHG emissions (Gg CO2 eq)
2004 2005 2006 2007 2008 2009 2010
AFOLU −2,279.56 −2,079.33 −1,740.48 −1,529.91 −1,954.8 −2,,506.03 −2214.54
3 Agriculture 384.32 381.61 371.95 346.42 338.67 321.91 309.72
3.A.1 Enteric fermentation 296.32 294.33 285.40 266.70 260.82 247.97 237.11
3.B.2 Manure management 75.09 74.38 72.53 67.46 65.93 63.13 60.55
3.D.a Direct N2O emissions from managed soils
12.38 12.38 13.52 11.83 11.48 10.37 11.62
3.F Field burning of agricultural residues
0.09 0.09 0.08 0.01 0.02 0.02 0.02
3.G Liming 0.05 0.05 0.05 0.05 0.05 0.05 0.05
3.H Urea application 0.39 0.38 0.37 0.37 0.37 0.37 0.36
4 Land use, land use change and forestry
−2,663.88 −2,460.94 −2,112.43 −1,876.34 −2,293.47 −2,827.94 −2,524.25
4.A Total forest land −2,665.72 −2,484.11 −2,175.87 −1,948.28 −2,346.63 −2,891.74 −2,588.33
4.B Cropland 0.04 0.04 0.04 0.59 0.64 0.70 0.76
4.C Grassland 0.00 0.00 0.00 0.37 0.35 0.33 0.31
4.D Wetlands 0.00 0.00 0.00 0.00 0.00 0.00 0.00
4.E Settlements 20.84 20.84 20.84 35.10 35.77 36.43 37.10
4.F Other land 7.87 7.87 7.87 1.92 1.92 1.92 1.92
4.G Harvested wood products
−26.91 −5.58 34.69 33.97 14.48 24.41 23.98

58
GHG emissions (Gg CO2 eq) 2011 2012 2013 2014 2015 2016 2017
AFOLU −429.55 −1,788.35 −2,126.3 −2,205.03 −2,072.72 −2,073.98 −1,523.83
3 Agriculture 287.16 283.32 292.97 301.38 301.42 295.89 285.40
3.A.1 Enteric fermentation 218.83 215.30 222.77 233.60 229.78 222.08 217.55
3.B.2 Manure management 57.20 56.47 57.92 60.57 59.93 61.91 57.32
3.D.a Direct N2O emissions from managed soils
10.71 11.22 11.87 6.80 11.29 11.48 10.13
3.F Field burning of agricultural residues
0.03 0.02 0.03 0.03 0.03 0.03 0.03
3.G Liming 0.05 0.04 0.06 0.06 0.04 0.03 0.03
3.H Urea application 0.35 0.28 0.31 0.31 0.34 0.34 0.34
4 Land use, land use change and forestry
−716.71 −2,071.68 −2,419.27 −2,506.41 −2,374.14 −2,369.87 −1,809.24
4.A Total forest land −678.81 −2,089.16 −2,428.57 −2,485.77 −2,324.17 −2,321.73 −1,721.35
4.B Cropland 0.82 0.88 0.52 0.54 0.57 0.59 0.61
4.C Grassland 0.29 0.27 −0.44 −0.53 −0.62 −0.72 −0.81
4.D Wetlands 0.00 0.00 0.00 0.00 0.00 0.00 0.00
4.E Settlements 37.77 38.44 53.15 54.26 55.37 56.49 57.60
4.F Other land 1.92 1.92
4.G Harvested wood products
−78.70 −24.02 −43.94 −74.92 −105.29 −104.50 −145.28
GHG emissions (Gg CO2 eq)
2018 2019
AFOLU −2,177.53 −2,232.37
3 Agriculture 278.70 271.57
3.A.1 Enteric fermentation 211.49 205.90
3.B.2 Manure management 55.72 54.19
3.D.a Direct N2O emissions from managed soils
11.11 11.09
3.F Field burning of agricultural residues
0.03 0.03
3.G Liming 0.03 0.03
3.H Urea application 0.32 0.32
4 Land use, land-use change and forestry
−2,456.24 −2,503.93
4.A Total forest land −2,372.25 −2,423.78
4.B Cropland 0.64 0.66
4.C Grassland −0.90 −0.99
4.D Wetlands 0.00 0.00
4.E Settlements 58.71 59.82
4.F Other land
4.G Harvested wood products
−142.43 −139.64

59
FIGURE 19. GHG EMISSIONS AND REMOVALS, EXPRESSED AS CO2EQ FROM THE AGRICULTURE AND LAND USE
SUBSECTORS, 1990–2019 (GG)
TABLE 21. CO2 EMISSIONS FROM THE SUBSECTORS OF AFOLU, 1990–2019 (GG)
Year 3 3.G 4 Land use, land use
change and forestry
4.A Total forest land
4.E Settlements
4.F Other land
4.G Harvested
wood products
Agriculture
Other – Urea
application
1990 0.49 0.49 −1,593.96 −1,578.07 19.54 7.87 −43.31
1991 0.49 0.49 −1,937.75 −1,943.06 19.54 7.87 −22.10
1992 0.48 0.48 −1,538.72 −1,560.85 19.54 7.87 −5.28
1993 0.48 0.48 −2,230.84 −2,266.82 19.54 7.87 8.57
1994 0.49 0.49 −1,751.18 −1,789.29 19.54 7.87 10.70
1995 0.48 0.48 −1,631.82 −1,664.05 19.54 7.87 4.82
1996 0.48 0.48 −1,838.67 −1,879.6 19.54 7.87 13.52
1997 0.48 0.48 −2,588.7 −2,640.46 19.54 7.87 24.34
1998 0.47 0.47 −2,686.89 −2,738.27 19.54 7.87 23.97
1999 0.47 0.47 −2,624.7 −2,672.84 19.54 7.87 20.73
2000 0.47 0.47 −2,099.01 −2,135.58 19.54 7.87 9.16
2001 0.46 0.46 −2,592.68 −2,638.34 19.54 7.87 18.25
2002 0.46 0.46 −2,768.42 −2,803.13 19.54 7.87 7.30
2003 0.45 0.45 −2,661.95 −2,681.06 19.54 7.87 −8.29
2004 0.44 0.44 −2,670.53 −2,671.03 19.54 7.87 −26.91
2005 0.43 0.43 −2,462.68 −2,484.51 19.54 7.87 −5.58
2006 0.42 0.42 −2,114.58 −2,176.68 19.54 7.87 34.69
2007 0.42 0.42 −1,948.44 −2,018.97 33.73 1.92 33.97
-3500
-3000
-2500
-2000
-1500
-1000
-500
0
500
1000
19
90
19
91
19
92
19
93
19
94
19
95
19
96
19
97
19
98
19
99
20
00
20
01
20
02
20
03
20
04
20
05
20
06
20
07
20
08
20
09
20
10
20
11
20
12
20
13
20
14
20
15
20
16
20
17
20
18
20
19
Gg
CO
2eq
3.A.1 – Enteric fermentation 3.B.2 – Manure management
3.D.a – Direct N2O emissions from managed soils 3.F – Field burning of agricultural residues
3.G – Liming 3.H - Urea application
4.A – Total forest land 4.G – Harvested wood products
4.B – Cropland 4.C – Grassland
4.D – Wetlands 4.E – Settlements
4.F – Other land
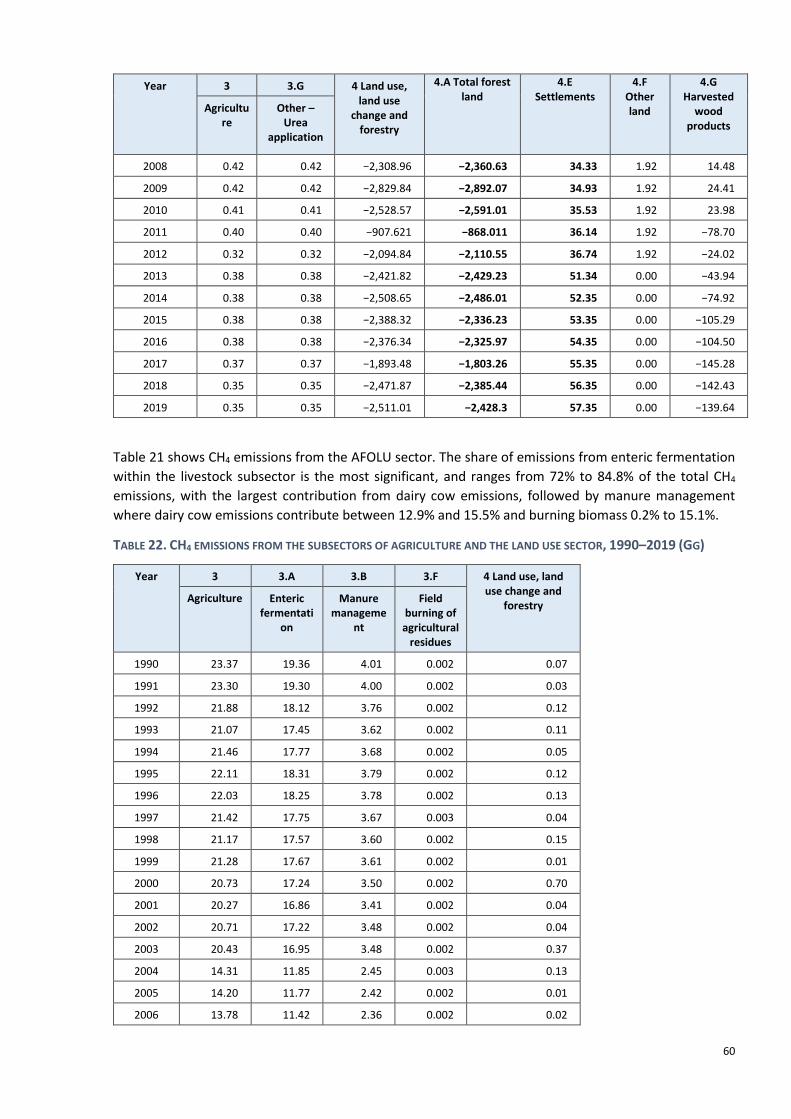
60
Year 3 3.G 4 Land use, land use
change and forestry
4.A Total forest land
4.E Settlements
4.F Other land
4.G Harvested
wood products
Agriculture
Other – Urea
application
2008 0.42 0.42 −2,308.96 −2,360.63 34.33 1.92 14.48
2009 0.42 0.42 −2,829.84 −2,892.07 34.93 1.92 24.41
2010 0.41 0.41 −2,528.57 −2,591.01 35.53 1.92 23.98
2011 0.40 0.40 −907.621 −868.011 36.14 1.92 −78.70
2012 0.32 0.32 −2,094.84 −2,110.55 36.74 1.92 −24.02
2013 0.38 0.38 −2,421.82 −2,429.23 51.34 0.00 −43.94
2014 0.38 0.38 −2,508.65 −2,486.01 52.35 0.00 −74.92
2015 0.38 0.38 −2,388.32 −2,336.23 53.35 0.00 −105.29
2016 0.38 0.38 −2,376.34 −2,325.97 54.35 0.00 −104.50
2017 0.37 0.37 −1,893.48 −1,803.26 55.35 0.00 −145.28
2018 0.35 0.35 −2,471.87 −2,385.44 56.35 0.00 −142.43
2019 0.35 0.35 −2,511.01 −2,428.3 57.35 0.00 −139.64
Table 21 shows CH4 emissions from the AFOLU sector. The share of emissions from enteric fermentation
within the livestock subsector is the most significant, and ranges from 72% to 84.8% of the total CH4
emissions, with the largest contribution from dairy cow emissions, followed by manure management
where dairy cow emissions contribute between 12.9% and 15.5% and burning biomass 0.2% to 15.1%.
TABLE 22. CH4 EMISSIONS FROM THE SUBSECTORS OF AGRICULTURE AND THE LAND USE SECTOR, 1990–2019 (GG)
Year 3 3.A 3.B 3.F 4 Land use, land use change and
forestry Agriculture Enteric
fermentation
Manure manageme
nt
Field burning of
agricultural residues
1990 23.37 19.36 4.01 0.002 0.07
1991 23.30 19.30 4.00 0.002 0.03
1992 21.88 18.12 3.76 0.002 0.12
1993 21.07 17.45 3.62 0.002 0.11
1994 21.46 17.77 3.68 0.002 0.05
1995 22.11 18.31 3.79 0.002 0.12
1996 22.03 18.25 3.78 0.002 0.13
1997 21.42 17.75 3.67 0.003 0.04
1998 21.17 17.57 3.60 0.002 0.15
1999 21.28 17.67 3.61 0.002 0.01
2000 20.73 17.24 3.50 0.002 0.70
2001 20.27 16.86 3.41 0.002 0.04
2002 20.71 17.22 3.48 0.002 0.04
2003 20.43 16.95 3.48 0.002 0.37
2004 14.31 11.85 2.45 0.003 0.13
2005 14.20 11.77 2.42 0.002 0.01
2006 13.78 11.42 2.36 0.002 0.02
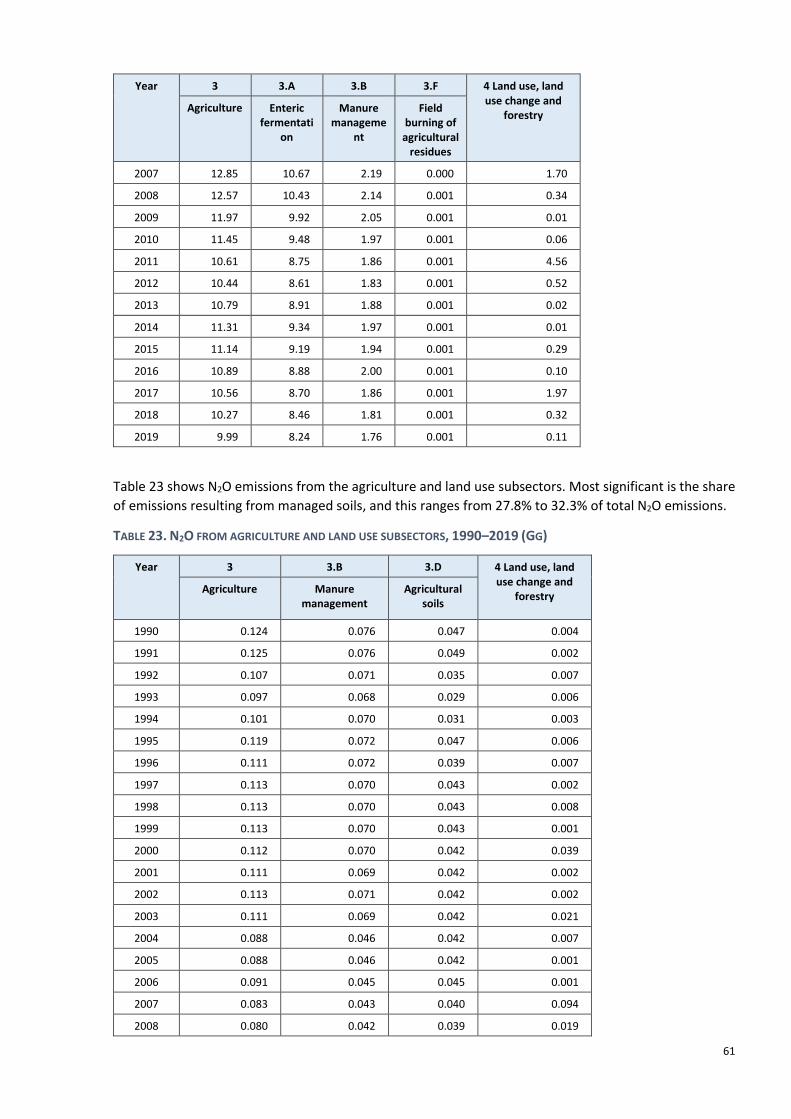
61
Year 3 3.A 3.B 3.F 4 Land use, land use change and
forestry Agriculture Enteric
fermentation
Manure manageme
nt
Field burning of
agricultural residues
2007 12.85 10.67 2.19 0.000 1.70
2008 12.57 10.43 2.14 0.001 0.34
2009 11.97 9.92 2.05 0.001 0.01
2010 11.45 9.48 1.97 0.001 0.06
2011 10.61 8.75 1.86 0.001 4.56
2012 10.44 8.61 1.83 0.001 0.52
2013 10.79 8.91 1.88 0.001 0.02
2014 11.31 9.34 1.97 0.001 0.01
2015 11.14 9.19 1.94 0.001 0.29
2016 10.89 8.88 2.00 0.001 0.10
2017 10.56 8.70 1.86 0.001 1.97
2018 10.27 8.46 1.81 0.001 0.32
2019 9.99 8.24 1.76 0.001 0.11
Table 23 shows N2O emissions from the agriculture and land use subsectors. Most significant is the share
of emissions resulting from managed soils, and this ranges from 27.8% to 32.3% of total N2O emissions.
TABLE 23. N2O FROM AGRICULTURE AND LAND USE SUBSECTORS, 1990–2019 (GG)
Year 3 3.B 3.D 4 Land use, land use change and
forestry Agriculture Manure
management Agricultural
soils
1990 0.124 0.076 0.047 0.004
1991 0.125 0.076 0.049 0.002
1992 0.107 0.071 0.035 0.007
1993 0.097 0.068 0.029 0.006
1994 0.101 0.070 0.031 0.003
1995 0.119 0.072 0.047 0.006
1996 0.111 0.072 0.039 0.007
1997 0.113 0.070 0.043 0.002
1998 0.113 0.070 0.043 0.008
1999 0.113 0.070 0.043 0.001
2000 0.112 0.070 0.042 0.039
2001 0.111 0.069 0.042 0.002
2002 0.113 0.071 0.042 0.002
2003 0.111 0.069 0.042 0.021
2004 0.088 0.046 0.042 0.007
2005 0.088 0.046 0.042 0.001
2006 0.091 0.045 0.045 0.001
2007 0.083 0.043 0.040 0.094
2008 0.080 0.042 0.039 0.019

62
Year 3 3.B 3.D 4 Land use, land use change and
forestry Agriculture Manure
management Agricultural
soils
2009 0.075 0.040 0.035 0.000
2010 0.077 0.038 0.039 0.004
2011 0.072 0.036 0.036 0.252
2012 0.074 0.036 0.038 0.029
2013 0.077 0.037 0.040 0.001
2014 0.061 0.038 0.023 0.000
2015 0.076 0.038 0.038 0.016
2016 0.078 0.040 0.039 0.006
2017 0.071 0.037 0.034 0.109
2018 0.073 0.035 0.037 0.018
2019 0.072 0.034 0.037 0.006
Waste GHG emissions from the waste sector result from the disposal and treatment of solid municipal waste,
wastewater management and waste incineration.
The categories “Solid waste disposal” and “Wastewater management” are included in the GHG Inventory
for waste. Methane (CH4) emissions resulting from the disposal and treatment of solid municipal waste
and the emissions of nitrogen suboxide (N2O) from wastewater management have been estimated.
In Montenegro, there are no activities that fall under the categories “Biological treatment of solid waste”
and “Waste incineration and open burning of waste”.
Data sources Recalculated statistical data (MONSTAT) was used to estimate emissions from the waste sector. The data
was produced based on new demographic data, data on generated quantities of municipal waste, and its
composition.
Methodology The methodology used to calculate CH4 emissions according to the 2006 IPCC Guidelines is the First-Order
Decay (FOD) kinetic model that incorporates a time factor into the calculation, allowing for the monitoring
of emissions over a long period of time, during which organic carbon decomposes within waste. The
proposed Tier-2 methodology was used because national data on the quantities of waste produced and
disposed of and the waste composition was included in the calculation, while all other model parameters
are default, in line with the 2006 IPCC Guidelines, Volume 5, Chapter 3, Figure 3.
CH4 emissions from household wastewater (especially in rural areas where septic tanks are used) are
calculated using the IPCC Tier-1 methodology recommended by the 2006 IPCC Guidelines.
Indirect N2O emissions from wastewater management are calculated using the IPCC Tier-1 methodology
recommended by the 2006 IPCC Guidelines.
Emission trends Annual GHG emissions from the activities under the waste sector, expressed as Gg CO2eq, for the period
1990–2019 are shown in Table 24.

63
Emissions from the category “Solid waste disposal” account for 87–90%, while emissions from the
category “Wastewater management” account for 10–13% of the total GHG (Gg CO2eq) emissions from
the waste sector.
CH4 emissions range from 94% to 95%, while N2O emissions range from 5% to 6% of total emissions from
the waste sector.
TABLE 24. TOTAL GHG EMISSIONS FROM SECTOR 5 WASTE, 1990–2019 (GG CO2EQ)
Year 5.A Solid waste disposal CH4 (Gg CO2eq)
5.D Wastewater management CH4 + N2O (Gg CO2eq)
5 Waste – TOTAL (Gg CO2eq)
1990 150.49 67.47 217.97
1991 154.52 67.85 222.37
1992 158.51 68.15 226.66
1993 162.44 68.44 230.89
1994 166.31 68.74 235.05
1995 170.66 69.04 239.70
1996 175.44 69.33 244.78
1997 180.56 69.63 250.20
1998 185.67 69.49 255.15
1999 190.72 69.34 260.06
2000 195.73 69.18 264.92
2001 199.74 69.23 268.97
2002 202.81 69.73 272.54
2003 205.04 70.22 275.26
2004 206.42 70.57 276.99
2005 206.96 70.89 277.85
2006 206.86 71.20 278.05
2007 207.66 71.73 279.40
2008 207.04 72.21 279.25
2009 204.94 71.99 276.94
2010 203.80 71.97 275.77
2011 203.62 71.73 275.34
2012 199.79 70.96 270.75
2013 198.28 71.36 269.64
2014 199.37 70.87 270.24
2015 198.98 70.36 269.34
2016 199.78 69.82 269.60
2017 191.06 69.27 260.33
2018 205.98 68.70 274.68
2019 204.56 68.52 273.08

64
Uncertainty assessment The sectoral subsections in the NIR give the assessment of uncertainty levels for individual categories. An
overall assessment of the uncertainty of the inventory has not been performed due to limited resources.
In NIR 2021 Chapter 9.2.1: Planned improvements – General, the preparation of the quantitative
uncertainty analysis is listed as: improvement with high priority.
The assessment of uncertainties for individual categories, which are provided in each sector’s chapter, is
mainly based on default values taken from the 2006 IPCC Guidelines. Within the next inventory cycle, the
assessment of uncertainties for individual categories will be reviewed and updated together with national
experts (data providers) and inventory experts, and an overall uncertainty assessment of the GHG
inventory will be performed.
65
Mitigation actions and their effects National policy context The Paris Agreement and NDCs Montenegro enacted the Law ratifying the Paris Agreement on 11 October 2017, thus confirming its
commitment to addressing the global problem of climate change. To achieve the common ambition set
by the Paris Agreement, the NDCs, which are submitted every five years, should be progressively more
ambitious.
Montenegro submitted its INDC in September 2015 as part of its National Climate Change Strategy by
2030 and envisaged as its target for 2030 a 30% reduction relative to the total GHG emissions in 1990
excluding LULUCF.
The revised NDC, adopted by the Government of Montenegro and submitted to the UNFCCC Secretariat
in June 2021, represents the country’s increased political commitment to cut GHG emissions. In line with
the revised NDC, Montenegro has set a new target of reducing its GHG emissions by 35% by 2030,
compared to 1990 (excluding LULUCF), i.e. reducing its GHG emissions by 2,117 kilotons of CO2eq by 2030.
The target proposed in the revised NDC is based on the existing national measures which are likely to be
implemented to meet the objective. The target recognizes the need for long-term low-carbon
development to support the Paris Agreement and to align with the ambition from the Green Agenda for
the Western Balkans in line with the Sofia Declaration. The EU has designed the €9 billion Economic and
Investment Plan to accompany the Green Agenda. Montenegro has been recommended to begin work on
the development of a Long-Term Low-Carbon Development Strategy and to assess how and when it can
become climate-neutral.
The revised NDC document provides a clear overview of the activities, policies and measures in the main
sectors to be implemented during the period 2021–2030 aimed primarily at reducing the negative impacts
of climate change through integrated actions that identify various measures of adapting to and countering
the impacts of climate change while working towards the reduction of GHG emissions. The policies and
measures listed in the revised NDC come as a result of broad stakeholder consultations and reflect the
priorities identified, first and foremost, by the national institutions in their sector policies and umbrella
strategic papers. Synchronized and continuous actions at all levels, which will involve government
institutions, non-government, expert and scientific institutions and all benevolent individuals, will enable
Montenegro to achieve further reductions in GHG emissions and embark on a shift towards a low-carbon
future, given its specific circumstances (one major stationary source of GHG emissions and a high level of
forest cover).
The revised NDC also describes the relevant policy documents, the country’s vulnerability and the need
for further activities in the field of adaptation. Finally, it includes the description of climate change impacts
and mitigation measures on gender equality and particularly vulnerable groups, and specifies the
indicators and the recommendations for improvements in the field of social equality.
The global crisis caused by the COVID-19 pandemic will continue to impact economic growth and levels
of GHG emissions in the forthcoming years, just as it has in 2020–2021. With regard to GHG emissions,
the crisis is expected to have short-term positive effects. It will be up to the public and private decision
makers whether that will be used as an opportunity to transform national economies and societies to
enable long-term sustainable development towards a decarbonized economy.
The analysis of climate change mitigation included in the Third BUR builds on and extends the analyses
included in two earlier reports, namely the Third NC from 2020 and the Revised NDC. This process runs in
parallel with the development of the NECP, which is under way, and the development of the Strategic

66
Environmental and Social Impact Assessment for the NECP. There are tentative plans for the adoption of
these two strategic documents in late 2022. It should be emphasized that, pursuant to the 2020 Energy
Law, once it is adopted the NECP will become the new National Energy Development Strategy by 2030.
That Strategy will integrate the climate- and environment-related aspects of the energy sector and
propose affordable, reliable and sustainable energy for the future.
Legislation in accordance with EU climate change policy At its session of 13 December 2019, the Parliament of Montenegro adopted the Law on Protection against
Adverse Impacts of Climate Change (Official Gazette of Montenegro, 73/19), which represents the basis
for the establishment of the National Monitoring, Reporting and Verification of Greenhouse Gases
System, the operation of the Emissions Trading System, which will ensure a distribution of efforts across
sectors to reduce emissions outside the Emissions Trading System. Moreover, the law represents the basis
for the enhancement of issues regarding the use of ozone-depleting substances and fluorinated gases.
After the adoption of the Law on Protection against Adverse Impacts of Climate Change, the MESPU
formed a working group for drafting bylaws based on this law. In line with the law, a number of ordinances
have been adopted:
• Rulebook on the manner of preparation and content of the inventory of greenhouse gas emissions
(“Official Gazette of Montenegro” 55/20);
• Rulebook on the manner of determining the mandatory targets for reducing greenhouse gas
emissions (“Official Gazette of Montenegro” 57/20);
• Rulebook on detailed manner and necessary documentation for issuing a permit for import
and/or export of ozone-depleting substances and alternative substances (“Official Gazette of
Montenegro” 69/20);
• Rulebook on the content of the plan for monitoring the emission of greenhouse gases from a plant
(“Official Gazette of Montenegro” 92/20);
• Rulebook on the plan for monitoring greenhouse gas emissions from aircraft (“Official Gazette of
Montenegro” 102/20);
• Rulebook on the detailed content of labels, guides, posters, displays and promotional literature
and materials on fuel consumption and carbon dioxide emissions from new passenger vehicles
(“Official Gazette of Montenegro” 113/20);
• Rulebook on the form of the permit for the emission of gases with the effect of greenhouses and
the manner of keeping records (“Official Gazette of Montenegro” 13/21);
• Rulebook on the form, content and manner of verification of the report on greenhouse gas
emissions (“Official Gazette of Montenegro” 13/21);
• Rulebook on detailed conditions of access to the carbon dioxide transport network, procedure
and criteria for acceptance of carbon dioxide flows (“Official Gazette of Montenegro” 12/21);
• Rulebook on conditions regarding personnel and equipment for a legal entity that verifies the
report on greenhouse gas emissions (“Official Gazette of Montenegro” 12/21).
National Climate Change Strategy 2030, including the development of a Low-Carbon Development Strategy The Government of Montenegro at its session on 17 September 2015 adopted the National Strategy for
Climate Change until 2030, which contains measures to reduce greenhouse gas emissions and a draft
strategic framework for adaptation to climate change, including assessment of costs and socio-economic
impacts of the implementation of measures envisaged by the strategy, as well as the accompanying action
plan. The strategy examines the possibilities of low-carbon development, i.e. the reduction of GHG
emissions at a time when the signing of an international binding agreement in the field of climate change
67
was expected at the global level. In addition to Montenegro’s INDC being adopted as an integral part of
the Strategy, the document sets out guidelines for the development of a NAP in accordance with the
Adaptation Framework established by the Conference of the Parties to the UNFCCC held in Cancun,
Mexico. In accordance with the process of European integration, the Strategy elaborates in detail the
activities in the process of harmonization of domestic legislation with EU legislation in this area.
The Law on Protection against Adverse Impacts of Climate Change introduces the obligation to develop a
Low-Carbon Development Strategy with an action plan. The development of this strategy has been
delegated as one of the priority activities within the technical support for monitoring and implementation
of policies for environmental protection and climate action, funded by IPA 2016. Due to the COVID-19
situation, the European Union, from the approved IPA programme, has supported Montenegro in the
fight against the spread of the virus and repairing the economic consequences of the epidemic. The
Strategy is now delegated through the IPA III 2021–2025 programme.
NEEAP Montenegro’s obligation under the Energy Community Agreement is to achieve the indicative energy
efficiency target, which is 9% of the average final energy consumption in the country, or about 1% per
year for the period 2010–2018. This trend of the indicative energy efficiency target has continued in the
new NEEAP, which was adopted in July 2019 and covers the period 2019–2021, setting an indicative
annual target for 4.16 ktoe of final energy (or 6.54 ktoe expressed in primary energy equivalent). A
preliminary analysis shows that the energy savings achieved in the period 2010–2018 account for 49.76
ktoe, which represents 84.5% of the achievement of the indicative target.
In order to achieve the indicative target in the coming period, significant financial resources need to be
mobilized. It is also necessary for the energy market to be further liberalized, especially with regard to the
provision of energy services. In this regard, it is essential to further develop public–private partnerships
in the field of energy efficiency.
Identification of policies and measures and methodological approach Having considered all the national strategic and planning documents, 25 mitigation policies and measures
were identified: 17 in the energy sector; four in the sector of industry and product use; two in the
agricultural sector, and 2 in the waste sector. A short overview of these policies and measures is provided
in Table 25. Annex 1: Detailed description of the policies and measures – presents each of the measures
in a tabular format and includes all the required information, implementation progress (timeframe,
expected results and costs, implementing entity), progress indicators and contribution to SDGs.
These policies and measures were then analysed using three scenarios and related projections: 1) WOM;
2) WEM; and 3) the more ambitious mitigation scenario – WAM, for the period 2022–2030. The
development of all three scenarios was guided by the same principle, reflecting different levels of
ambition concerning mitigation and different paces of the energy transition. Annex 2: The Action Plan for
WEM and WAM Scenarios – was developed in line with the scenarios; it identifies the relevant institutions
for the implementation of all 25 policies and measures. Furthermore, the Action Plan includes information
about the type of policy and measure, source of financing, tentative prospective emission reduction,
specific costs (cost of reduced tCO2) and investments required to implement the measures, to the extent
possible, for the purpose of this analysis. The action plan provides a sound basis for the development of
national policies that would enable sustainable low-carbon development. It includes more detailed
information about the scope of policies and measures, their estimated impacts, as well as the
implementation status of the existing measures.

68
The energy sector analysis employed the software tool developed by Aether UK Ltd.14 For the purposes of
the TNC, IPCC software was used for the non-energy sectors.15 Projections of GHG emissions refer to the
period 2022–2030.
Due to the lack of a clear strategic framework and data, this analysis did not cover the forestry sector,
and therefore also carbon sinks; the analysis is presented without that sector.
Montenegro has not been involved in any project supported by international market mechanisms.
TABLE 25. OVERVIEW OF ALL POLICIES AND MEASURES, PER SECTOR AND SCENARIO, WITH DESCRIPTIONS OF INDIVIDUAL
POLICIES AND MEASURES
Number/ID Policy/measure IPCC sector Scenario Brief description
1E Environmental refurbishment of TPP Pljevlja
1A1 Energy industries
WEM, WAM
The environmental refurbishment includes: the construction of desulphurization and denitrification systems, and upgrade of the electro-filtering plant; construction of a wastewater treatment facility, reconstruction of the internal system for transporting by-products, and construction of a heating station as a part of the district heating system.
2E Carbon pricing for TPP Pljevlja
1A1 Energy industries
WEM, WAM
The national GHG emission taxation system, the EU cross-border taxation mechanism for carbon-intensive products that will apply to all non-EU countries from 1 January 2023 until their accession to the EU (CBAM)16 and, lastly, implementation of the most efficient tool of the EU climate policy – the Emissions Trading System – will lead to a reduction of GHGs from TPP Pljevlja upon EU accession.
3E New renewable power plants
1A1 Energy industries
WEM, WAM
Building new renewable electricity sources, in line with the completed tender procedures, contracts signed with investors and EPCG plans
4E District heating in Pljevlja 1A1 Energy industries 1A4 Energy consumption in buildings
WEM, WAM
District heating system in Pljevlja will be developed following the environmental refurbishment of the TPP and will cover the town centre; heat energy will come from a central source and will be supplied via a modern centralized supply system, thus superseding household coal furnaces.
5E Coal phase-out and ending of operations of TPP Pljevlja at the latest by 2035, accompanied by a timely just transition in the Pljevlja coal region
1A1 Energy industries
WAM Montenegro has joined the PPCA and announced coal phase-out at the latest in 2035.
6E Development and implementation of a building energy efficiency regulatory framework
1A4 Other sectors
WEM, WAM
Implementation of the legislation on the minimum requirements for energy efficiency in buildings, energy performance certificates and regular energy audits of the heating and air conditioning systems are already yielding results,
14 https://www.aether-uk.com/. 15 https://www.ipcc-nggip.iges.or.jp/software/index.html.
16 https://www.europarl.europa.eu/legislative-train/theme-a-european-green-deal/file-carbon-border-adjustment-mechanism.

69
reflected in lower energy consumption in these buildings.
7E Increased energy efficiency in public buildings
1A4 Other sectors
WEM, WAM
Improved energy efficiency and comfort conditions in selected public-sector buildings.
8E Financial incentives for citizens/households (to invest in energy efficiency)
1A4 Other sectors
WEM, WAM
Making financial support mechanisms available to households for investing in energy efficiency and renewable energy sources.
9E Energy labelling and eco-design requirements for the products that impact energy generation
1A4 Other sectors
WEM, WAM
Adopted regulation on energy labelling and eco-design requirements for energy-using products, covering most consumer electric devices used in households and the commercial and public sectors.
10E Establishing and implementing energy efficiency criteria in public procurement procedures
1A4 Other sectors
WEM, WAM
Systematic mechanisms for the introduction of energy efficiency criteria in public procurement procedures.
11E Implementing energy efficiency measures in public municipal enterprises, municipal utility companies and services
1A4 Other sectors
WEM, WAM
Improving the conditions, supervision and maintenance, and investing in enhanced energy efficiency in municipal enterprises: • Public lighting • Water supply and sewerage • Other utilities.
12E Development of power transmission and distribution systems
1A1 Energy industries
WEM, WAM
Transmission and distribution operators are required to develop their systems to be able to accommodate the real demands of producers and consumers for power transmission and distribution and thus reduce losses.
13E Refurbishment of small hydroelectric power plants (for increased energy efficiency)
1A1 Energy industries
WEM, WAM
Improved efficiency of the following small HPPs: Rijeka Crnojevića, Podgor, Šavnik, Mušovića Rijeka and Lijeva Rijeka; maximum use of hydroelectric potential, and upgraded automation and remote control.
14E Additional new renewable energy sources
1A1 Energy industries
WAM Additional renewable power plants which are currently not included in the specific plans (no signed contracts or plans to launch tenders). This includes: HPP Morača, SPP Velje Brdo (with a larger capacity than under the WEM scenario), biomass-based heating plants, some of which are co-generational, for the municipalities of Nikšić, Rožaje, Bijelo Polje, Kolašin and Žabljak, and a more ambitious scenario of installing decentralized electricity generation from solar energy on the premises of self-consumers.
15E Electric vehicles – realistic scenario
1A3 Transport
WEM, WAM
Road transport predominates; the share of public transport is very low and almost completely dependent on fossil fuels. For electric vehicles to be in a position to compete in the market with conventional vehicles with internal combustion engines, standards, regulatory framework, energy and environmental protection policies, established practices, products and services, user experiences and needs and charging
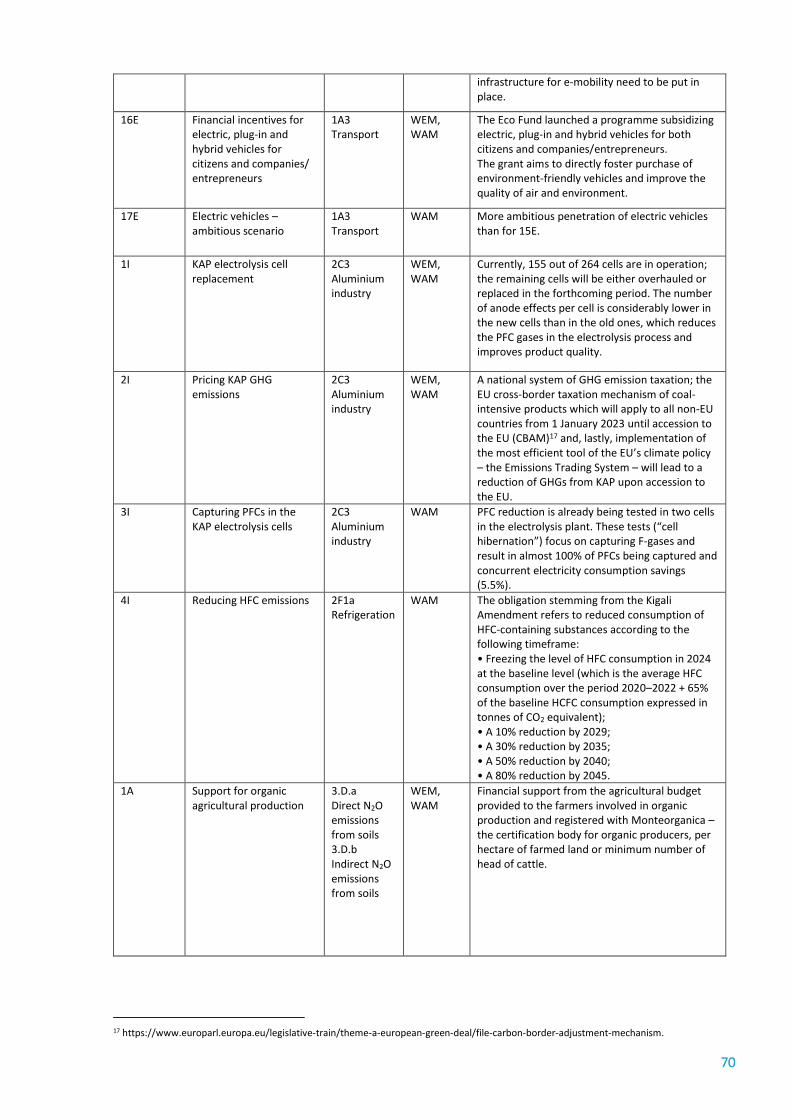
70
infrastructure for e-mobility need to be put in place.
16E Financial incentives for electric, plug-in and hybrid vehicles for citizens and companies/entrepreneurs
1A3 Transport
WEM, WAM
The Eco Fund launched a programme subsidizing electric, plug-in and hybrid vehicles for both citizens and companies/entrepreneurs. The grant aims to directly foster purchase of environment-friendly vehicles and improve the quality of air and environment.
17E Electric vehicles – ambitious scenario
1A3 Transport
WAM More ambitious penetration of electric vehicles than for 15E.
1I KAP electrolysis cell replacement
2C3 Aluminium industry
WEM, WAM
Currently, 155 out of 264 cells are in operation; the remaining cells will be either overhauled or replaced in the forthcoming period. The number of anode effects per cell is considerably lower in the new cells than in the old ones, which reduces the PFC gases in the electrolysis process and improves product quality.
2I Pricing KAP GHG emissions
2C3 Aluminium industry
WEM, WAM
A national system of GHG emission taxation; the EU cross-border taxation mechanism of coal-intensive products which will apply to all non-EU countries from 1 January 2023 until accession to the EU (CBAM)17 and, lastly, implementation of the most efficient tool of the EU’s climate policy – the Emissions Trading System – will lead to a reduction of GHGs from KAP upon accession to the EU.
3I Capturing PFCs in the KAP electrolysis cells
2C3 Aluminium industry
WAM PFC reduction is already being tested in two cells in the electrolysis plant. These tests (“cell hibernation”) focus on capturing F-gases and result in almost 100% of PFCs being captured and concurrent electricity consumption savings (5.5%).
4I Reducing HFC emissions 2F1a Refrigeration
WAM The obligation stemming from the Kigali Amendment refers to reduced consumption of HFC-containing substances according to the following timeframe: • Freezing the level of HFC consumption in 2024 at the baseline level (which is the average HFC consumption over the period 2020–2022 + 65% of the baseline HCFC consumption expressed in tonnes of CO2 equivalent); • A 10% reduction by 2029; • A 30% reduction by 2035; • A 50% reduction by 2040; • A 80% reduction by 2045.
1A Support for organic agricultural production
3.D.a Direct N2O emissions from soils 3.D.b Indirect N2O emissions from soils
WEM, WAM
Financial support from the agricultural budget provided to the farmers involved in organic production and registered with Monteorganica – the certification body for organic producers, per hectare of farmed land or minimum number of head of cattle.
17 https://www.europarl.europa.eu/legislative-train/theme-a-european-green-deal/file-carbon-border-adjustment-mechanism.

71
2A Support for manure management
3.B Manure management
WEM, WAM
Financial support from the agricultural budget provided to cattle breeders for building and/or refurbishing facilities (pools) for manure storage or for purchasing specialized manure tanks to prevent negative impacts on the environment.
1W Reduce the share of bio-waste within municipal waste
5.A Solid waste disposal on land
WEM, WAM
Reduction of landfilled biodegradable waste through increased separate collection of municipal waste, to be achieved by means of having a primary separation system (two containers – for dry and wet fraction), waste collection systems in rural areas, building recycling yards in municipalities, waste collection equipment and awareness-raising activities.
2W Building a system for connecting to the sewerage system and wastewater treatment plants
5.D.1 Domestic wastewater handling
WEM, WAM
Building a system to connect to the sewerage system and wastewater treatment plants has led to a decrease in the quantity of wastewater collected in septic tanks and discharged, without treatment, into the aquatic environment. Montenegro has set the target of having 93% of its population connected to the sewerage system by 2035.
Each of the three scenarios includes the following key assumptions for each sector:
● GDP growth rate
TABLE 26. ASSUMPTIONS FOR GDP GROWTH (%)
Year 2014 2015 2016 2017 2018 2019 2020 2021 2022 2023 2024 2025 2026 2027 2028 2029 2030
National
projections18 1.8 3.4 2.9 4.7 5.1 3.9 −6.8 4.9 4.2 3.4 1.5 1.25 1 0.75 0.75 0.75 0.75
World Bank
projections19
(baseline
scenario)
1.8 3.4 2..9 4.7 5.1 3.6 −5.6 −4.8 2 1.75 1.5 1.25 1 0.75 0.75 0.75 0.75
World Bank
projections
(downside
scenario)
1.8 3.4 2.9 4.7 5.1 3.6 −8.9 −6 2 1.75 1.5 1.25 1 0.75 0.75 0.75 0.75
● Population increase to 712,592 in 2030, or by 15%20 compared to the data from the latest population
census from 2011.
Results of mitigation analysis The main results of the performed analysis are summarized below:
• Under the WOM scenario, the total GHG emissions from all sectors are expected to drop by
22.91% in 2030 compared to 1990. In addition to that, the fastest-growing sector in terms of
emissions is the waste sector, with a 137% rise in 2030 against the levels from 1990.
• Under the WEM and WAM scenarios, total GHG emissions in 2030 will drop by 15.70% and
28.69%, respectively, against the WOM scenario.
18 Macroeconomic and Fiscal Policy Guidelines for the period 2020–2023, Ministry of Finance, July 2020.
19 https://thedocs.worldbank.org/en/doc/820081590708744514-0080022020/original/WBRER1705PovertyBOS.pdf.
20 Source: Demografski trendovi u Crnoj Gori od sredine 20. vijeka i perspektive do 2050. godine (Demographic trends in Montenegro from the
mid-20th century to 2050), Table II-6.
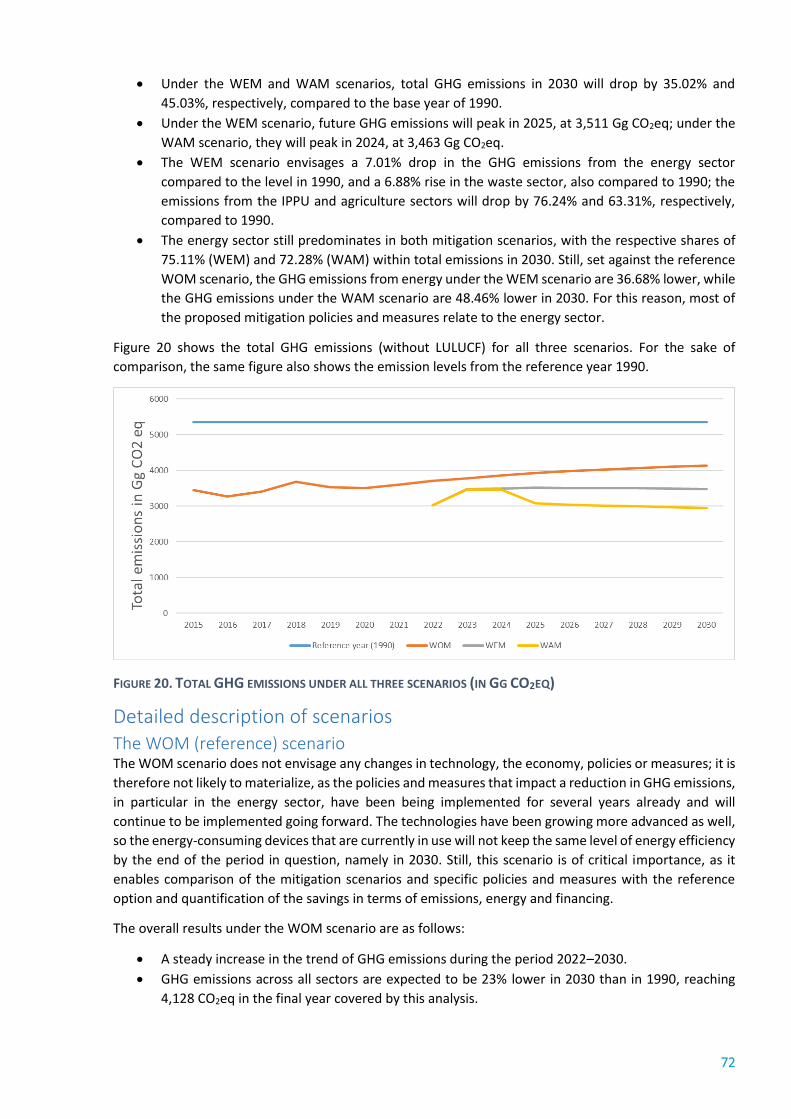
72
• Under the WEM and WAM scenarios, total GHG emissions in 2030 will drop by 35.02% and
45.03%, respectively, compared to the base year of 1990.
• Under the WEM scenario, future GHG emissions will peak in 2025, at 3,511 Gg CO2eq; under the
WAM scenario, they will peak in 2024, at 3,463 Gg CO2eq.
• The WEM scenario envisages a 7.01% drop in the GHG emissions from the energy sector
compared to the level in 1990, and a 6.88% rise in the waste sector, also compared to 1990; the
emissions from the IPPU and agriculture sectors will drop by 76.24% and 63.31%, respectively,
compared to 1990.
• The energy sector still predominates in both mitigation scenarios, with the respective shares of
75.11% (WEM) and 72.28% (WAM) within total emissions in 2030. Still, set against the reference
WOM scenario, the GHG emissions from energy under the WEM scenario are 36.68% lower, while
the GHG emissions under the WAM scenario are 48.46% lower in 2030. For this reason, most of
the proposed mitigation policies and measures relate to the energy sector.
Figure 20 shows the total GHG emissions (without LULUCF) for all three scenarios. For the sake of
comparison, the same figure also shows the emission levels from the reference year 1990.
FIGURE 20. TOTAL GHG EMISSIONS UNDER ALL THREE SCENARIOS (IN GG CO2EQ)
Detailed description of scenarios The WOM (reference) scenario The WOM scenario does not envisage any changes in technology, the economy, policies or measures; it is
therefore not likely to materialize, as the policies and measures that impact a reduction in GHG emissions,
in particular in the energy sector, have been being implemented for several years already and will
continue to be implemented going forward. The technologies have been growing more advanced as well,
so the energy-consuming devices that are currently in use will not keep the same level of energy efficiency
by the end of the period in question, namely in 2030. Still, this scenario is of critical importance, as it
enables comparison of the mitigation scenarios and specific policies and measures with the reference
option and quantification of the savings in terms of emissions, energy and financing.
The overall results under the WOM scenario are as follows:
• A steady increase in the trend of GHG emissions during the period 2022–2030.
• GHG emissions across all sectors are expected to be 23% lower in 2030 than in 1990, reaching
4,128 CO2eq in the final year covered by this analysis.

73
• The share of GHG emissions from the energy sector will increase to 74.49% in 2030 compared to
1990.
• GHG emissions from coal-fired electricity generation will rise by 15% in 2030 compared to 2019.
The WEM scenario The WEM mitigation scenario includes 21 policies and measures that are very likely to get implemented,
as they have already begun or are planned to begin soon, or they have been identified as priority projects
or policies in sector strategies and plans, or stem from the adopted or forthcoming laws.
Figure 21 shows the emission reductions in the energy, IPPU, agriculture and waste sectors as a result of
implementation of theses policies and measures. Figure 22 shows the total GHG emissions by sector.
FIGURE 21. EMISSION REDUCTIONS BY SECTOR – WEM SCENARIO
FIGURE 22. TOTAL GHG EMISSIONS BY SECTOR – WEM SCENARIO
Overall, in the WEM scenario:
• Total GHG emissions will drop by 35% in 2030 compared to 1990.
• The largest amount of emissions remain energy-sector-related, with a 75.11% share in 2030.
0
100
200
300
400
500
600
700
800
2022 2023 2024 2025 2026 2027 2028 2029 2030
(in
Gg
CO
2eq
)
energy IPPU agriculture waste
0
500
1,000
1,500
2,000
2,500
3,000
3,500
4,000
2022 2023 2024 2025 2026 2027 2028 2029 2030
(in
Gg
CO
2eq
)
energy IPPU agriculture waste

74
The following energy sector measures have the highest GHG emission reduction potential: 2E WEM –
Carbon pricing for TPP Pljevlja; 3E WEM – New renewable power plants; and 5E WEM – Development and
implementation of a regulatory framework for energy efficiency in buildings. The measure that has the
most significant potential for reduction of GHG emissions is 2E WEM – Carbon pricing for TPP Pljevlja.
The WEM scenario implementation over the period 2022–2030 requires €2,619 million. Investments in
the energy sector account for approximately 77.7% of that amount. Implementation of mitigation
measures in the energy sector requires an investment of €2,035.40 million over the period 2022–2030.
Because the implementation of 1E WEM – Carbon pricing for TPP Pljevlja does not require direct funding,
implementation of the proposed energy sector measures under the WEM scenario requires average
annual investments of €124.36 million.
The WEM scenario implementation in the IPPU sector over the period 2022–2030 requires an investment
of €26.0 million, averaging €2.88 million per year. The measure with the highest potential for reduction
of GHG emissions in the IPPU sector is 1I WEM – KAP electrolysis cell replacement.
The WEM scenario implementation in the agriculture sector over the period 2022–2030 requires an
investment of €4.0 million, averaging €0.44 million per year. The measure with the most significant
potential for reduction of GHG emissions is 1A WEM – Support for manure management.
The WEM scenario implementation in the wastewater sector over the period 2022–2030 requires an
investment of €553.90 million, averaging €61.5 million per year. The measure with the highest potential
for GHG emissions reduction is 1W WEM – Reducing the share of bio-waste within municipal waste.
The WAM scenario The WAM scenario includes all of the policies and measures from the WEM scenario; however, the more
ambitious mitigation scenario includes four additional policies and measures in the energy and IPPU
sectors. Two of those measures are identical to those in the WEM scenario but involve different
penetration levels, leading to a bigger reduction in GHG emissions. This scenario includes implementation
of the measures proposed for other sectors in the WEM scenario.
Figure 23 shows the emission reductions in the energy, IPPU, agriculture and waste sectors results as a
result of implementation of the policies and measures. Figure 24 shows total GHG emissions by sector.
FIGURE 23. EMISSION REDUCTIONS BY SECTOR – WAM SCENARIO
0
200
400
600
800
1000
1200
1400
2022 2023 2024 2025 2026 2027 2028 2029 2030
(in
Gg
CO
2eq
)
energy IPPU agriculture waste

75
FIGURE 24. TOTAL GHG EMISSIONS BY SECTOR – WAM SCENARIO
Overall, in the WEM scenario:
• Total GHG emissions are reduced by 45.03% in 2030 compared to 1990.
• The largest amount of GHG emissions remains energy-sector related, with a 74% share in 2030.
Implementation of mitigation measures in the energy and IPPU sectors requires an investment of €1,037
million over the period 2022–2030, or on average €115.22 million per year. The measures with the most
potential for reduction of GHG emissions are 5E WAM – Coal phase-out and ending of operations of TPP
Pljevlja at the latest by 2035, accompanied by a timely just transition in the Pljevlja coal region and 3I
WAM – Capturing PFC in the KAP electrolysis cells.
Gaps and planned improvements The biggest challenge in developing this analysis had to do with the following dilemmas concerning the
future operation of TPP Pljevlja:
• Uncertainty around the beginning of the negotiations between the government and the Energy
Community Secretariat concerning the approval for additional operational hours, as the
Secretariat launched an infringement procedure 21 over the TPP continuing operations after
having reached 20,000 operational hours in November 2020 – the number of operational hours
had been approved in line with the Energy Community Agreement, by means of Decision 2016/19
of the Energy Community Ministerial Council, for the period from 1 January 2018 to 31 December
2023;
• Delay in the implementation of the environmental refurbishment: a contract worth €54.45 million
was signed in June 2020, due to the delayed completion of the main design caused by the poor
quality of data and insufficiently clear or problematic solutions from the conceptual design. The
key outstanding issue in the course of development of the main design is the choice of the
technical solution for the DeSOx process system, which in turn has a major impact on the technical
solutions for the rest of the process systems covered by the main design and on the new flue
solution and TPP operation (in terms of the halts required to execute some of the technical
solutions). These issues constitute the technical risks attached to the design that might evolve
into contractual, i.e. financial, risks stemming largely from the suboptimal solutions from the
conceptual design, which in turn determined the tender and contractual requirements from the
21 https://www.energy-community.org/legal/cases/2021/case0321ML.html.
0
500
1000
1500
2000
2500
3000
3500
4000
2022 2023 2024 2025 2026 2027 2028 2029 2030
(in
Gg
CO
2eq
)
energy IPPU agriculture waste

76
contractor. The proposed modifications of technical solutions, in particular those related to the
DeSOx process system and flue reconstruction call for an assessment from the point of the
financial and legal aspects of the contract concluded with the contractor (contracted price
variation) and an assessment of the impact on the EPCG production balance, as they would
require long halts in the TTP’s operation;22
• An ambiguous plan for a Just Energy Transition, which should include a detailed phase-out of coal
from power generation and a plan to build new renewable power producers in order to ensure
the security of supply in circumstances when the TPP has reduced its production and then
eventually terminated its operation. It is important to highlight that Montenegro has joined the
PPCA23 and announced phase-out by 2035; however, the official decision in this regard is still not
in effect.
• Suspended review of the integrated permit and decision on its revocation until the end of the
global COVID-19 pandemic or at least until the completion of the line ministry’s ongoing
negotiations with the Energy Community and European Commission; this would entail a ban on
the operation of the TPP as of 1 June 2021, following its overhaul, which would cause immense
damage, not just to the EPCG, but the entire electric power system, as it would affect the regular
power supply to consumers as an activity in the public interest, overall macroeconomic indicators
and social vulnerability of a large number of those directly or indirectly working in the energy
sector, in particular in the Municipality of Pljevlja.24
The following challenges that also impact the analysis must be noted in addition to the one described
above:
• Lack of strategic and regulatory frameworks for the period beyond 2020, in almost all key sectors;
• Unclear plans for further operation of metals industry plants (KAP and steel works);
• Insufficiently ambitious NDC and delay in the development of the long-term low-carbon
development strategy;
• Categories that have not been estimated in the GHG inventory, hindering relevant emission
projections.
22 https://www.gov.me/dokumenta/f0ae2aae-c0f2-4e5b-bb8c-7ea1af47ed70. 23 https://www.poweringpastcoal.org/.
24 https://www.gov.me/dokumenta/df31bd1b-daca-48cb-a311-e35f19760ba2.

77
Domestic MRV Relevant MRV legislation International legislation Montenegro fulfilled the opening benchmark within Chapter 27 of the EU membership negotiations by
adopting a National Strategy with an Action Plan for Transposition, Implementation and Enforcement of
the EU acquis on the Environment and Climate Change (NEAS), which includes an action plan for the
period 2016–2020. The NEAS was adopted on 28 July 2016. European Union Common Position for Chapter
27 defines a variety of closing benchmarks that must be fulfilled for Montenegro to successfully close
Chapter 27. In February 2021, the Action Plan for the Fulfilment of Closing Benchmarks in Chapter 27 was
finalized.
The European Climate Law entered into force in July 2020, with the implementing decision expected to
come at a later date. The European Climate Law sets out a roadmap for Europe to be the first climate-
neutral continent by 2050. Section 2 of this law sets out “management measures”, stating that monitoring
and reporting requirements must align with the current frameworks already in place.
The Global Climate Summit was held on 12 December 2020, where national governments leaders, the
private sector and civil society were invited to present more ambitious and high-quality climate plans at
the summit.
Regional legislation The 2019 Communication on EU Enlargement Policy confirmed that there is considerable scope for the
Western Balkans to embark on a Green Agenda, and for the region to address environmental issues such
as waste management, air pollution and climate change.
In the joint “Statement on Clean Energy Transition for the Western Balkans” signed in Podgorica on 21
February 2019, the Western Balkans ministers of energy and of the environment confirmed their will to
align as swiftly as possible with the EU’s energy, climate and environmental policies and the long-term
objectives of the Paris Agreement, thus contributing to the wellbeing of citizens and the sustainable
development of the region. This transition should reduce energy imports, develop renewable energy
sources, strengthen regional energy security, unlock greater economic growth and address persistent air
and related health pollution challenges.
The “Western Balkans Strategy” acknowledges the efforts required for individual countries to align
together to tackle environmental issues. The Strategy also prioritizes the expansion of the Energy Union
to include the Western Balkans. During the Western Balkans Sofia Summit, held on 10 November 2020,
the region reached an important milestone by endorsing the Leaders’ Declaration on the Green Agenda
that aligns with the EU Green Deal. This declaration supports and accelerates changes and processes in
the region with the overarching goal of addressing climate change.
Montenegro became a regional partner in the project “Strengthening Responses to Security Risks from
Climate Change in South-Eastern Europe, Eastern Europe, the South Caucasus and Central Asia”. The
project conducted a Regional Consultation Process on Climate Change and Security in South-East Europe
which was concluded in February 2021, and the resulting Regional Assessment of South-East Europe Study
was published in April 2021. Based on the results of this study, the Organization for Security and
Cooperation in Europe (OSCE) and Adelphi will soon initiate the participatory process for developing a
pre-feasibility study on transboundary cooperation measures to tackle one selected challenge in South-
East Europe. Montenegro selected air pollution as the priority regional challenge. For the next phase of
the project, further data will be collected to elaborate upon the pre-feasibility study.

78
Regional cooperation provides the opportunity for tackling common problems and for sharing knowledge
and good practice. The EU has been financing dedicated regional cooperation projects in the area of the
environment and climate for a number of years. The Regional Environmental Network for Accession
(RENA) project contributed to environmental and climate improvements in the Western Balkans and
bringing the region close to EU standards. The Environment and Climate Regional Accession Network
(ECRAN), which provided a link between regional aspects and national priorities in these areas, continued
to strengthen regional cooperation between the candidate countries and potential candidates. The
continuation of ECRAN was achieved through the Regional Implementation of the Paris Agreement Project
(RIPAP) project in 2018 where regional cooperation in the field of climate change was strengthened. This
has been followed by the EU Environment Partnership Programme for Accession and the EU Support for
Climate Action in IPA II beneficiaries “Transition towards a low-emission and climate-resilient economy”
(TRATOLOW), which supports the EU integration of the Western Balkan partners in the field of the
environment and climate. The TRATOLOW project, launched in December 2020, focuses on capacity
building through understanding and implementing action measures to mitigate and adapt to climate
change, its impacts and shared benefits. It will also contribute to the improvement of regional cooperation
through the exchange of information, application of best practices and exchange of relevant experiences.
National legislation In 2017, ‘The Rulebook on the Methodology and Contents of the GHG Inventory’ was adopted by the
MESPU under the Air Protection Law. The Rulebook provides a list of gases and the method for preparing
the GHG emission inventory, information on the manner of providing data, the quality control of the data,
and the deadlines for the preparation of inventories of GHG emissions the accompanying reports. The
Rulebook formed the basis on which the Governance Regulation 1999/2018 was harmonized.
In December 2019, Montenegro adopted the “Law on Protection against Adverse Impacts of Climate
Change”, which mandates the national government to create a national MRV system to coordinate efforts
to mitigate and adapt to the changing climate. Montenegro was the first contracting party to the Energy
Community Treaty to adopt such a document and the first one in the region. Under this law, the MESPU
is charged with delivering the National Climate Change Adaptation Plan and coordinating MRV activities
to track mitigation action. This includes gathering, maintaining and regularly informing decision makers,
the public and the international community on Montenegro’s climate-related issues. This includes annual
reporting on GHG emissions and the loss of removal and climate risks, vulnerabilities and impacts, and its
progress towards addressing the gaps in adaptation and mitigation ambition, actions and support
(including climate finance). Other ministries are responsible for the implementation of specific climate
actions when relevant.
The Law on Protection against Adverse Impacts of Climate Change introduces the obligation to develop a
Low-Carbon Development Strategy with an action plan. The development of this strategy has been
delegated as one of the priority activities within the project “Technical support for monitoring and
implementation of policies for environmental protection and climate action”, funded by IPA 2016. Due to
the COVID-19 situation, delays in the development of the Strategy have occurred. Therefore, the Strategy
is now planned through the IPA III 2021–2025 programme.
The Department for Climate Change within the Directorate for EU Integration, International Cooperation
and Climate Change is preparing a Draft Manual for the Low-Carbon Development Strategy to 2050. This
will provide guidelines for strategy development, including vision, and general and specific objectives, as
well as measures to achieve mandatory greenhouse gas reduction targets across the sectors of
agriculture, waste management, energy, IPPU and LULUCF. It will also cover the institutional and legal
basis for set policies in the field of climate change in Montenegro, mechanisms for public involvement, as
well as cross-sector cooperation. The manual will provide the scope and content of the Low-Carbon
Development Strategy until 2050, development methodology, recommendations regarding the

79
preparation of the necessary expert analyses, as well as a dynamic plan (Activity Schedule), an overview
of the activities that will monitor the development process and the timeframe.
Montenegro’s MRV system overview This section provides an overview of the current arrangements, systems, technical expertise and
coordination in Montenegro, and the extent to which progress has already been made to improve the
existing MRV System. The structure of the MRV system is presented in Figure 25.
The matrix in Table 27 provides an overview of the functional elements and gaps in Montenegro’s MRV
system. The current state of arrangements across mitigation, adaptation, and support/finance are
indicated using a traffic-light system showing the following:
• Green – current arrangements are suitable with little or no improvement required;
• Amber – good progress has been made with current arrangements, but further improvements are
likely required; and
• Red – current arrangements require significant improvements.
Where an attribute has been given an ‘amber’ or ‘red’ rating, suggested improvements have been
provided in the improvement plan (see Annex 3). Annex 3 provides an overview organized and categorized
by the matrix’s main themes and MRV system components.

80
FIGURE 25: PROPOSED INSTITUTIONAL ARRANGEMENTS FOR THE MRV SYSTEM IN MONTENEGRO
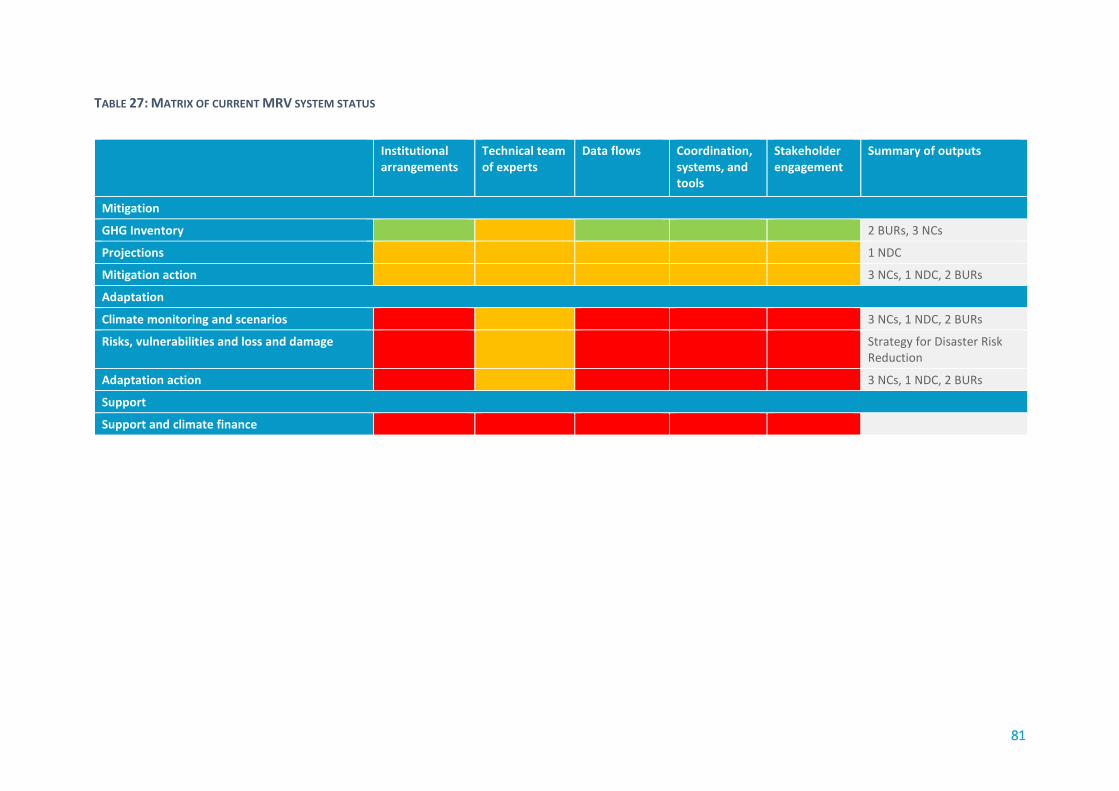
81
TABLE 27: MATRIX OF CURRENT MRV SYSTEM STATUS
Institutional arrangements
Technical team of experts
Data flows
Coordination, systems, and tools
Stakeholder engagement
Summary of outputs
Mitigation
GHG Inventory 2 BURs, 3 NCs
Projections 1 NDC
Mitigation action 3 NCs, 1 NDC, 2 BURs
Adaptation
Climate monitoring and scenarios 3 NCs, 1 NDC, 2 BURs
Risks, vulnerabilities and loss and damage Strategy for Disaster Risk Reduction
Adaptation action 3 NCs, 1 NDC, 2 BURs
Support
Support and climate finance

82
Steering committee and National Council The MRV system steering committee within the National Council’s working group for policies and
measures for adaptation and mitigation of climate change, labelled ‘1)’ in Figure 25 would help the MESPU
to inform high-level decision makers and improve and maintain the MRV system.
Although it has been inactive for approximately a year, the National Council for Sustainable Development,
Climate Change and Integrated Coastal Zone Management,25 hereafter the National Council, provides an
important audience for information on climate change from the MESPU-managed MRV system. Relevant
insights on trends, trajectories, ambition and progress towards targets relating to climate change can be
channelled from the MESPU’s MRV system via the working group on climate adaptation and mitigation to
important public and private decision makers focused on a range of development strategies for the
country. The working group for policies and measures for adaptation and mitigation of climate change
can also, through a technical MRV system subgroup or steering committee, support the continuous
improvement of the MRV system. This subgroup would comprise important data providers, MRV expert
organizations, the MESPU and data users and ensure that the working group for policies and measures
for adaptation and mitigation of climate change is able to provide climate-related evidence and progress
updates to the National Council in a timely manner.
The engagement of the National Council through the working group for policies and measures for
adaptation and mitigation of climate change would also establish high-level public and private support for
the tracking of progress with the NDC. The National Council could be further involved with implementing
climate action finance and help the working group for policies and measures for adaptation and mitigation
of climate change to track related support and finance of climate actions.
The management and coordination of the MRV system The focal point for national and international climate change is the Directorate for International
Cooperation, EU Integration and Climate Change within the MESPU, labelled ‘2)’ in Figure 25. Within the
Directorate, the DCC is responsible for coordinating and managing Montenegro’s MRV system. This
department will manage the production of materials by the MRV system, and its communication
nationally and internationally as needed.
Defined thematic focal points coordinating data gathering, analysis and reporting Data will be collected, compiled and archived across the mitigation areas of the GHG inventory, GHG
projections and actions, as well as the adaptation areas of vulnerabilities, risks, loss and damage, actions,
and climate observations, in addition to information on support and climate finance by a range of expert
organizations. This area is labelled ‘3)’ in Figure 25. The MRV system will require relevant experts and
organizations to gather, compile and manage information in the following thematic areas:
Mitigation: GHG Inventory Institutional roles have been well-defined: the MESPU and DCC act as the national focal point for the GHG
inventory, whilst the EPA has the official authorization to manage the GHG Inventory and acts as the
inventory agency, including the compilation of data provided by the ministries responsible for
implementing sector-based actions. However, resourcing issues exist. There has historically been a
cooperation agreement between the EPA and MONSTAT for the waste sector that supports the inventory
compilation process with data from national statistics, often mediated through UNDP.
25 Please see the country profile for Montenegro on the European Sustainable Development Network at https://www.esdn.eu/country-profiles/
basic-information/
detail?tx_countryprofile_countrycategory%5Baction%5D=showcat&tx_countryprofile_countrycategory%5Bcontroller%5D=Country&tx_country
profile_countrycategory%5Bcountry%5D=30&cHash=3bb0ab17d567da012e93dd8f5cff8a1e.

83
The EPA also coordinates the flow of information between GHG Inventory experts and the MESPU. The
EPA provides expertise to the GHG Inventory for the energy, IPPU, AFOLU and waste sectors. Data
gathering from the relevant ministries is done through MONSTAT before being passed on to the NEPA for
the necessary compilation and analysis. Data for different sectors is gathered from their corresponding
ministries – for example, the MAFWM for the LULUCF sector, and the MCI for the transportation and
energy data – and also directly by specific industrial sectors and energy installations.
Montenegro currently has three active GHG Inventory team members, although this is expected to
increase in the coming years. Data for the GHG Inventory is collected annually in reporting formats
standardized by the Annual Data Collection Plan, for which the EPA is responsible. This plan contains the
categories of sources, activity data, data sources and the competent institution for data submission, and
is developed for each sector. This document is prepared once a year in accordance with Article 5 of the
Ordinance on the manner of preparation and content of the inventory of greenhouse gas emissions.26 The
current data flow for GHG Inventory information was developed through the UNDP project to support
Montenegro’s MRV system. However, resource gaps and risks of expertise loss within national institutions
remain. Montenegro has worked with Aether to develop interactive data visualizations to improve the
visibility of the GHG inventory covering emissions from 1990 to 2015. These visualizations display the
themes and trends in the inventory in an accessible way to engage public and political attention, with the
project completed in 2019.
Mitigation: GHG projections According to the “Law on Protection against Adverse Impacts of Climate Change”, projections are to be
outsourced. No national institution is in charge of, or experienced in, preparing projections. The DCC is to
be responsible for overseeing the outsourced activity and make sure appropriate projections are
provided. They will also act as the go-between with other sector ministries and ensure that projections
are linked to their relevant mitigation actions.
Mitigation: Actions The DCC will coordinate the flow of information provided to the MESPU by other ministries for mitigation
actions for their respective sectors. Where relevant (particularly considering the costs for implementing
actions), the Ministry of Capital Investments (MCI) and the Ministry of Economic Development (MED), and
other relevant institutions will be consulted. Relevant sector experts covering climate actions will also
assess the links between Montenegro’s climate action, sustainable development goals and growth and
development strategies.
The MESPU, in cooperation with UNDP, has prepared a project proposal “Strengthening the Montenegrin
NDC and adaptation actions within transparency” through the CBIT project, funded by GEF. The project
focuses on strengthening the institutional capacity responsible for mitigation and adaptation policies and
measures, but also those that collect data for the GHG inventory and produce National Inventory Reports.
A significant part of the project will also be dedicated to improving transparency and efficiency of data
flow. At the beginning of 2020, a financial analysis was performed, as well as an analysis to assess the
capacity of the MESPU, as part of this project.
In 2019, Montenegro started activities on the development of the NECP, which intensified in 2020. The
MCI, in cooperation with the MESPU, is responsible for the preparation of the NECP. A technical working
group has been established which is responsible for coordinating this process and holding regular
meetings every month. It is planned that the first draft of the NECPs will be finalized by mid-2022, with
the preparation of implementation reports every two years, starting in 2025.
26 “Official Gazette of Montenegro”, 66/17.
84
In 2016, Montenegro adopted the “National Strategy for Sustainable Development” to 2030,27 which
presents the framework for the transposition of the UN’s SDGs and providing indicators to track progress
against over time. Following this, an assessment was carried out in 2020,28 which compared the progress
made thus far against the goals set out in this document. The assessment found that the processes are
well set up and confirmed the strong interlinkages with the EU accession process.
Various other documents have been produced that provide sector-specific mitigation actions, such as the
“National Forestry Strategy 2014–2023”, the “Energy Development Strategy of Montenegro until 2030”,
the “Water Management Strategy of Montenegro” and the “Traffic Development Strategy of Montenegro
for the period 2019–2023”. Montenegro was also the first non-EU country to adopt the Smart
Specialization Strategy in June 2019. The goal of this strategy is to build a sustainable but diverse economy.
Adaptation: Vulnerabilities, risks, losses and damage and actions The MESPU will act as the focal point for MRV of adaptation action and associated information. The DCC
will coordinate the gathering and flow of information provided by experts to the MESPU, along with the
Directorate of Rescue and Protection in the Ministry of Internal Affairs for all disaster-risk-reduction-
related projects and for monitoring loss and damage relating to climate change. However, there is no
established mandate for the management or process for regular data collection for climate trends, risks,
vulnerabilities and adaptation actions. Coordination with other ministries is instead undertaken on an ad-
hoc basis. Additionally, there is limited specialized capacity at the national government level to implement
adaptation projects and monitor success. All of this results in the climate vulnerability scenarios and
adaptation measures not being adequately mainstreamed into policies and plans. The MESPU’s activities
include identifying Montenegro’s primary challenges and viable adaptation actions, which could then be
communicated to the National Council for follow-up by the implementing stakeholders and in preparing
reports. The Directorate of Emergency in the Ministry of Internal Affairs is responsible for compiling a
database of emergency events and coordinating actions under the Sendai Framework for Disaster Risk
Reduction.
In 2021, the project “Enhancing Montenegro’s Capacity to Integrate Climate Change Risks into Planning”29
was initiated through cooperation with UNDP and the GCF. This project’s main focus is on improving the
coordination framework and building the capabilities of those involved in the climate change and climate
change adaptation coordination framework related to Montenegro’s institutional capacity for long-term
adaptation planning. The project also foresees the mandating of the Working Group on Mitigation and
Adaptation to Climate Change. The purpose of this working group is to improve the governing processes
and institutional arrangements for oversight and coordination of adaptation-related issues and set up the
multi-stakeholder coordination mechanism that includes the private sector and women and other
vulnerable groups. Once this stage of the project is complete, the project will focus on improving the
information base by determining climate risks and identifying the appropriate measures such as
programmes or investments.
A project is planned, in conjunction with the Hungarian Ministry of National Development, which aims to
continue on from a current project on “Establishment and development of a climate change strategy in
Montenegro”, which is examining the possibilities and preconditions for creating a geographical
information system for climate adaptation in Montenegro. The current project proposal aims to provide
technical assistance in the establishment and operation of a national geoinformation system for
27 http://www.nssd2030.gov.me/.
28 Djurovic, G., Muhadinovic, M., Djurovic, V. & Bojaj, M. (2018). Agenda 2030: Measuring Progress in the Montenegro’s National Strategy for
Sustainable Development through SDG Indicators. 10.5772/intechopen.75001.
29 https://www.me.undp.org/content/montenegro/en/home/projects/enhancing-montenegros-capacity-to-integrate-climate-change-
risks.html.

85
adaptation. The further project aims to develop a detailed feasibility study, including an assessment and
monitoring plan that supports the implementation of Montenegro’s climate policy and a detailed cost-
benefit analysis. The main aim is the development of a complex system including NAGiS, together with a
monitoring system.
In accordance with Article 9 of the Law on Protection against Adverse Impacts of Climate Change, it is
necessary to develop a Plan for Adaptation to Climate Change. The first meeting of the Steering
Committee for the Development of the National Adaptation Plan was held on 4 May, 2021, and on 5 May
a national workshop was held, bringing together project beneficiaries, ministries and institutions
responsible for ecology, agriculture, forestry and water management, health, the economy and finance,
as well as the Institute of Hydrometeorology and Seismology of Montenegro. During the workshop, it was
agreed that it is necessary to strengthen the institutional framework for coordination by expanding the
technical capacities of those responsible for planning adaptation, improving the information base needed
for effective decision making, and defining a resource mobilization strategy. When the coordination
framework is strengthened, measures will be taken to improve the database, identify climate risks, and
determine appropriate measures – investments, projects and programmes.
Natural Solutions for More Resilient Societies in the Western Balkans (ADAPT) started in cooperation with
the Regional Office for Eastern Europe and Central Asia. ADAPT is a three-year initiative funded by the
Swedish International Development Cooperation Agency (SIDA) and implemented in cooperation with the
IUCN Regional Office for Eastern Europe and Central Asia and the International Union for Conservation of
Nature (IUCN). The common goal is to increase the resilience of ecosystems and human communities to
climate change and disaster risks by applying nature-based solutions. The initiative involves cooperation
with partners at the regional and local levels. The implementation of the project will provide an
opportunity to analyse the management of the national ecosystem and determine biodiversity policies
from the perspective of climate change with specific options and indicators of adaptation, with the project
planned to be finalized by October 2022.
The “Strategy for Disaster Risk Reduction” was recently adopted in 2017, covering the period 2018–2023.
This document provides Montenegro’s strategy for the prevention of new risks and the reduction of
existing ones through the implementation of integrated and comprehensive economic, social, health,
educational and environmental measures. The strategy also covers the prevention and reduction of the
exposure and vulnerability of the society to the risk of disaster, highlighting the need for increased
readiness for reaction and renewal.
Adaption: Climate observations The Institute for Hydrometeorology and Seismology coordinates the flow of information relating to
climate observations and ensures it contributes to the analysis of the challenges that require adaptation
action. The I will be responsible for most of the physical climate data tracking and analysis of climate
scenarios and provide these insights to support the assessment of vulnerabilities by sector experts. The
MESPU should coordinate the gathering of summary information from tIIHS on climate observations and
scenarios to inform stakeholders implementing and monitoring adaptation action.
Support and climate finance The Directorate for International Cooperation, EU Integration and Climate Change (which includes the
DCC) is the holder of the funding from the GEF and UNFCCC, while the GCF is handled by the Department
for Sustainable Development. The MESPU acts as a focal point for tracking information on support and
climate finance. Through the DCC, the MESPU plays an advisory and political role and is responsible for
coordination. However, institutional arrangements for collecting, assessing, managing and reporting on
support and funding for climate action need to be strengthened. Montenegro could also benefit from the

86
establishment of a dedicated team for coordinating support, with the involvement of climate finance
experts, as well as active involvement in this area by the MFSW.
The ”National Programme of Priority Activities in the Field of Climate Change Mitigation and Adaptation
within the Cooperation with the GCF 2021–2023” was finalized in November 2020 and adopted by the
Montenegrin Government on 29 April 2021. During 2019, the Division for Climate Change conducted both
a call and an analysis of candidate project proposals for inclusion in the Programme of Priority Activities
for Montenegro’s Cooperation with the GCF in relation to their compliance with the prescribed criteria.
Out of a total of 10 project ideas, seven projects were approved for inclusion in the programme. Within
the Programme of Priority Activities, a report on the needs, lack of knowledge, and capacities for
improving cooperation with the GCF was prepared.
The DCC will consolidate information on climate finance from individual project files, other databases of
national and international climate finance, and the government’s climate budget analysis. This should be
done by collaborating with the MFSW. They will also aid with coordinating between the relevant
ministries. The areas of engagement include Montenegro’s NDC and coverage of the following sectors:
• Agriculture and Forestry – MONSTAT, MAFWM
• Energy – MONSTAT, MCI, Electricity Transmission System in Montenegro, EPCG
• Waste – MESPU (Directorate for Waste Management), MONSTAT
• Transport – MCI
• Disaster Risk and Reduction – Ministry of Internal Affairs
Information about the priority investments for Montenegro needed to meet its NDC targets for mitigation
has been identified and quantified (in terms of capital expenditure (CAPEX), operating expenses (OPEX)
and cash flow).
Other cross-cutting information Other information will include climate and environmental data, for example, on air quality, meteorological
data and data on flooding and sea levels, and will be provided by tIIHS. Other information, action
information and insights are provided by a range of non-government and private institutions and experts.
These could include the National Council for Sustainable Development, which could have working groups
for assessing the wider impacts of mitigation and adaptation actions, as well as a variety of listed
companies, civil society organizations, ministries and directorates, such as:
• Institute of Marine Biology
• Montenegro Energy Regulatory Agency
• Ministry of Health
• Ministry of Defence
• Institute for Public Health
• Directorate for Energy Efficiency
• International Financial Institutions Advisory Group
• Akuo Energy France
• Ivicom Consulting Austria
• Krnovo Green Energy
• Ministry of Education, Science, Culture and Sports
• Institute of Industrial Organic Chemistry
• International Security and Emergency Management Institute
• The National Institute of Radioelements
• FORS Montenegro – Foundation for the Development of the North of Montenegro.
87
MRV management portal Montenegro is developing an online MRV management portal. This portal will provide a management
overview for the MRV system and will consist of components that structure data, support good-practice
activities and reinforce institutional memory. The portal will provide a coordination platform for managing
information on stakeholders, engagement activities, datasets, QA/QC activities, climate actions and
vulnerabilities, impacts, wider benefits, document storage and improvements to the MRV system. As a
result, the portal will improve communications between stakeholder organizations and allow the MESPU
to better link data to policies. The portal will be an important aspect of the MRV system and will help to
produce transparent outputs such as NDCs, BURs, NCs and NAPs.
The MRV management portal will also maintain an improvement plan that documents and prioritizes
requirements needed to fill gaps in understanding.
Roadmap for development of Montenegro’s MRV system for adaptation, mitigation and support The development of Montenegro’s MRV system into a fully functional tool to support the country with
national-level climate-related decision making and an array of reporting is considered below. The
roadmap presented in Table 29 in Annex 3 is based on the detailed list of proposed improvements
presented in Table 30 in Annex 3.
The development roadmap is broken down into three key areas and incorporates the establishment of
teams of experts, data flows, tools and systems and stakeholder engagements bound together through
governance laws, rulebooks, and terms of reference. The three areas are:
• Cross-cutting development of overarching components required for tracking adaptation and
mitigation actions, their support and finance and their wider impacts.
• Adaptation-specific MRV system development activities
• Mitigation-specific MRV system development activities
As indicated above, the roadmap incorporates the development of systems for tracking climate mitigation
and adaptation action, its support and finance and its wider impacts on sector-level national strategies
and SDGs.
The roadmap is geared towards supporting the development of the MRV system in time for the production
of key international outputs (which attract development funds and require the development and update
of data curated by the MRV system). These output milestones provide a useful focus for the development
of the MRV system. Additional national milestones can also be added, focused around the development
and tracking of key national strategies.
1. 2021 BUR completion – Mitigation actions and GHG inventory development. To be superseded by
2024 BTR.
2. 2022 – Re-establishment of the National Council and initial briefings to the National Council on
Climate action progress by the working group for policies and measures for adaptation and
mitigation of climate change. Briefings/updates could include overviews of the policies and
actions in place and planned, their state of finance, contribution to reaching targets and likelihood
of success
3. 2022, 2023, 2024, etc. – Annual inventory update – Development of the GHG inventory, its
methods, data sources and assumptions, as well as production of GHG trends and trend analysis.
4. 2022, 2023, 2024, etc. – Updating of the Annual Data Collection Plan which is the basic document
for data collection, for which the EPA is responsible

88
5. 2022 Low-Carbon Development Strategy – Focusing on an update of the GHG Inventory,
development of projection scenarios and stakeholder engagement around long-term mitigation
action policies, measures and instruments (to 2050). This could be extended to be an initial EU-
style NECP which formally is required by EU member states by December 2019 and updated in
January 2029 and every 10 years thereafter. The first NECP is to cover the period 2021–2030,
taking into account the longer-term perspective. The subsequent plans are to cover the 10-year
period immediately following the end of the period covered by the previous plan.
6. 2023 EU Climate and Energy Union Articles 18 and 19 reporting on mitigation policies and
measures, projections and adaptation actions30 – Focusing on mitigation actions and projection
scenarios. Note: EU member states will be reporting in March 2023 and thereafter every two
years on the status of implementation of their integrated national energy and climate plans in a
report including the above information. This may be brought in line with the BTR (e.g. late 2024
and every two years after that).
7. 2023 – Additional EU GHG Inventory reporting requirements for LULUCF come into force.31
8. 2023 NAP completion – Adaptation goals and actions need to be identified and tracking indicators
defined. Four priority areas have been identified: health, forestry, agriculture and waste.
9. 2024 Fourth National Communication and BTR – to include all subjects (GHG inventory, mitigation
and adaptation action, climate finance and support and wider impacts of climate action). A project
proposal is currently being prepared by the MESPU in coordination with UNDP.
10. 2025/6 NDC Update – The NDC must be updated approximately every five years.32
A range of support activities and resources are available for the development of the MRV system over this
period including EU funds (supporting development of the Low-Carbon Strategy), the Global
Environmental Fund (GEF) CBIT supporting the development of the MRV system overall, GEF funds for the
development of National Communications, BTRs and NAPs.
30 https://eur-lex.europa.eu/legal-content/en/TXT/?uri=CELEX%3A32018R1999. 31 See Article 18 of https://eur-lex.europa.eu/legal-content/EN/TXT/PDF/?uri=CELEX:32018R0841&from=EN.
32 https://unfccc.int/process-and-meetings/the-paris-agreement/nationally-determined-contributions-ndcs/nationally-determined-
contributions-ndcs.

89
Constraints and gaps and support needed and received
Montenegro has continued the implementation of intensive activities in the field of climate change since
the Third NC (submitted in 2020) and the Second BUR (submitted in 2019). In line with its commitments
from the Paris Agreement, Montenegro completed the update of the NDC, which was adopted in June
2021. In addition, Montenegro has initiated the development of the NECP within its commitments under
the European integration path, the content of which will also strategically define energy and climate policy
until 2030 with a view to 2040. With support from the GCF, Montenegro has also finalized the National
Programme of Priority Activities in the fields of climate change mitigation and adaptation, as a part of its
cooperation with the GCF for the period 2021–2023,33 and has initiated the process of drafting the NAP.
The activities and initiatives listed above contribute to better insight into the missing technological,
financial and capacity-strengthening needs in order to be able to achieve the identified national targets
within the planned scope and deadline. Therefore, summarized and systematized information from the
above-mentioned documents and processes will be presented below, additionally supported by available
studies and knowledge generated during the reporting period.
Progress in reducing gaps and constraints during the reporting period The reporting period was marked by the outbreak of the COVID-19 pandemic, which led to a serious and
still-ongoing health and economic crisis in Montenegro. The new reality has brought disruptions in all
spheres of social life, including the institutions responsible for climate change policy at the national and
local levels, and this has significantly affected the pace of progress and capacity building in this field. Under
the circumstances that require physical distancing and restrictions on movement of people, a completely
new set of challenges, which the relevant institutions and individuals have encountered in performing
their tasks, has emerged. The shift of communication and business operations to the virtual world was
one of the biggest challenges, which required major additional efforts for institutions and their employees
to maintain their usual level of activities and performance, as well as activities to improve them.
Moreover, due to the threat to economic activities and a large decline in GDP, which according to
preliminary quarterly data of the MONSTAT for 2020 shrank by −15.3%34 compared to the previous year,
the priorities of the state authorities changed radically and focused on preserving economic stability.
Under those circumstances, all other activities either continued on a reduced scale or were completely
postponed until a later period after the pandemic has been suppressed. However, even in such
challenging conditions, the implementation of international and national commitments in the field of
climate change has continued, as evidenced by the number of initiated and adopted strategically
important documents (Revised NDC, NECP and NAP).
Owing primarily to the support from international institutions, the biggest progress has been made in
enhancing the capacity needed to design long-term policies in the field of climate change, enhancing the
capacity needed to access funding sources at the national and local levels, as well as in continuing to
enhance the capacity for preparation of GHG inventories in the competent institution.
Key challenges The key challenges are still in the area of permanent need to build and enhance the capacity to plan and
implement climate policy, which must be increasingly integrated into all relevant national policies and
strategies. Since climate change policy is a “moving target”, i.e. characterized by constant changes and
33 Adopted by the Government of Montenegro in May 2021, https://www.gov.me/dokumenta/ef541ca5-6681-4d2f-bc80-a60889bb3051.
34 https://www.monstat.org/cg/novosti.php?id=3622.

90
challenges, consequently the competent institutions at the national and local levels are also continuously
exposed to the requirements for enhancement of their own capacities. Accordingly, the needs of
Montenegrin institutions will move in that direction in the coming period, too. This refers to all key aspects
in the field of climate change, such as the Greenhouse Gas Inventory and reporting capacities, climate
change mitigation and adaptation policies and the establishment of a functioning MRV system, including
the MRV system for market mechanisms that contribute to GHG emission reduction, i.e. for the ETS
system which has been partially established in Montenegro. Also, Montenegro continues to rely on
technical assistance for modelling greenhouse gas emissions, as well as for modelling climate change
impact at the national and local levels. As these activities require special expertise and skills, and in the
absence of a national education programme and training in this area, national institutions are expected
to continue to rely on technical assistance from international institutions. Certainly, the future plans of
the competent institutions must aim for a permanent institutional solution for these activities, which are
crucial for the credible, long-term planning of climate neutrality and resilience to adverse climate impacts.
All the key challenges are additionally worsened by the situation caused by the COVID-19 pandemic, and
despite the mass-immunization campaign, it will continue to be an obstacle to the implementation of
activities and plans of institutions at the national and local levels for the foreseeable future.
Support needed for implementation of actions in the field of climate change in Montenegro As mentioned above, the relevant documents in the field of climate change, prepared in the previous
period, have provided quality insight into the necessary support and lack of financial resources for the
implementation of actions in the field of climate change in Montenegro. This fact certainly represents a
significant improvement, as it indicates that strategic documents are increasingly accompanied by a
quality overview of the financial needs for their full implementation.
The revised NDC includes 18 measures: 12 are about the contribution to the reduction of emissions from
the energy sector, and then there are two from each of the following sectors: transport, industry and
waste. The accompanying “Report for the preparation of an updated NDC” estimated the financial
resources needed to achieve the national goal of reducing GHG emissions for the period until 2030 at
€2,655.31 million.
Moreover, as part of the National Programme of Priority Activities in the Field of Climate Change
Mitigation and Adaptation, within the cooperation with the GCF for the period 2021–2023, seven projects
in the field of climate change mitigation and adaptation have been nominated. Two project proposals
refer to either mitigation or adaptation to climate change, while three project proposals combine these
two areas. The total value of projects proposed as priority activities for cooperation between Montenegro
and the GCF for the period 2021–2023 amounts to US$176 million, where the GCF is expected to provide
support amounting to US$75.4 million, while the rest is projected co-financing.
Finally, within the process of accession to the European Union, the competent institutions prepared an
assessment of the necessary financial resources needed to implement activities that would ensure the
achievement of readiness for full membership of the EU35. This process is complementary to the activities
aimed at fulfilling national and international commitments and goals in the field of climate change in the
period until 2025, which the document refers to. The findings from the mentioned study indicate that the
funds required to reach environmental standards that would ensure accession to the European Union are
35 Action Plan for Meeting the Final Benchmarks from Chapter 27 – Environment and Climate Change: Financial Needs Assessment, Ministry of
Ecology, Spatial Planning and Urbanism, July 2021.

91
estimated at €482,996,838. Specifically for the field of climate change, the estimated funds amount to
€87,348,790, of which donors are expected to provide €2,145,000 as their support.
Overview of support received to implement actions in the field of climate change in Montenegro During the reporting period (2019–2021), Montenegro received an additional US$3,492,767 for the
implementation of climate change projects. A tabular overview of the projects supported by international
development financial institutions and through multilateral and bilateral assistance is given below.
TABLE 28. OVERVIEW OF RECEIVED SUPPORT IN THE FIELD OF CLIMATE CHANGE IN THE PERIOD 2019–2021
# Project Title Implementation
period
Source of financing Amount (US$)
1 Capacity Development for Climate Policy in
the Countries of South-East, Eastern
Europe, the South Caucasus and Central
Asia, Phase III (CDCP III)
2019–2021 Federal Ministry for the
Environment, Nature
Protection and Nuclear
Safety, Republic of
Germany
118,83536
2 Enhancing Montenegro’s Capacity to
Integrate Climate Change Risks into
Planning – NAP
2020–2023 GCF 1,721,932
3 Capacity-Building Initiative for
Transparency (CBIT)
2021–2024 GEF 1,100,000
4 Support for the preparation of the updated
NDC 2
2019–2021 UNDP – Climate Promise 200,000
5 Third BUR of Montenegro on climate
change
2019–2021 GEF 352,000
TOTAL 3,492,767
Recommendations to improve the access to sources of financing in the field of climate change and overall capacity building In order to continue enhancing its overall capacity for climate action, as well as specific capacities for
better access to available sources of funding, Montenegro needs to:
• Prepare a roadmap for implementation of the Revised NDC, which will define the responsibilities,
timeframe, and sources of funding for the implementation of measures;
• Build capacities in competent institutions for direct implementation of the support received
through financial mechanisms of the UNFCCC (GEF and GCF)
• Continue enhancing its capacities for development of the National GHG Inventory and reports
identified in the transparency framework, through an ongoing training and education
programme;
• Establish a functional MRV system for climate change mitigation and adaptation policies,
including an MRV system for market mechanisms that contribute to the reduction of GHG
emissions, i.e. for the ETS system;
• Draft the NECP for the period until 2030, in line with the relevant European legislation;
36 €100,000 (€1 = US$1.19, exchange rate on 4 September 2021).

92
• Draft a long-term strategy for climate-neutral development for the period until 2050;
• Ensure that the Environmental Protection Fund of Montenegro (Eco Fund), as a key financial
institution to support projects in the field of environment and climate change, is operating at full
capacity and that it is fulfilling its mission;
• Valorize the existing coordination mechanisms (National Council for Sustainable Development,
Climate Change, and Integrated Coastal Zone Management, etc.) in order to accomplish cross-
sector cooperation, as well as balanced capacity building in all relevant institutions at the national
and local levels to avoid a bottleneck effect and the slowing down of progress in this field.
Technology needs assessment and technology support received Montenegro adopted its “Technology Needs Assessment for Climate Change Mitigation and Adaptation
National Strategy and Action Plan” in 2012,37 and has not conducted a more recent assessment of its
climate technology needs. However, its technology needs are implicitly contained in the revised NDC and
its planned mitigation and adaptation measures. Most of the measures listed there require investments
in specific technologies in the energy, transport, waste and industry sectors. Half of the planned 12 NDC
measures in the energy sector depend on introducing new or upgrading existing energy generation or
energy efficiency technologies. In the transport sector, the NDC measures envisage a progressive and
steady shift from internal-combustion-engine vehicles towards entirely electric ones. Similarly, the
aluminium industry, being the second largest emitter in the country after TPP Pljevlja, is planning to
introduce more efficient technology into its production process in order to reduce PFC emissions. This
shows that access to state-of-the-art, environmentally sound technologies and technology transfer is
playing a major role in the country’s plans towards a climate-neutral and resilient future. Unfortunately,
Montenegro does not monitor or record the technology support received in a continuous and systematic
way, and therefore does not have historical national data to report. This is obviously another issue to be
addressed in the final design of the national MRV system.
Although such a need clearly exists, Montenegro so far has not actively participated in, or benefited from,
the available support offered by the UNFCCC Technology Mechanism. In the coming period, additional
efforts should be invested by Montenegro’s competent authorities into participation in and use of the
available support from specialized international organizations, especially from the Climate Technology
Centre and Network (CTCN).
37 https://www.gov.me/dokumenta/caefb6fa-762c-4e3b-9b11-7f15a6944254.

93
Gender equality and climate change
In a world of climate change, gender plays an extremely important role, primarily in the (un)equal
opportunities of women and men to mitigate and adapt to negative changes. Climate change and its
negative impacts do not recognize stereotypes and grounds for discrimination (age, gender, ethnicity,
religion and other affiliations) but joint action against them is strongly welcomed. In this regard, action
against climate change is the responsibility of all, and can only be successfully achieved if it includes the
full potential of both men and women as human, scientific, cultural or social factors that will fight against
climate change.
Women and men are affected differently by climate change and are differently prepared to adapt to
climate change. This is due to underlying inequality in socio-economic status, influenced by three factors:
1) The degree of equality of rights of women and men in national legislation; 2) The degree of law
enforcement; and 3) The tradition and customs that define the roles of men and women in society (so-
called “gender roles”).
Fighting climate change is not just an environmental issue – it is a social justice issue too. Climate change
policies integrating social justice are not only a moral imperative of a society – it is also vital to build
climate justice policies by which it is easier to achieve resilience and mitigation targets. Furthermore,
developing justice-related responses to climate change is an opportunity to develop systems and an
infrastructure that will create a more resilient and fairer society as a whole.
Countries can successfully address climate change risks only if they recognize the different perspectives,
impacts and interests of women and men in sector-level policies relevant to climate change (e.g. energy,
transport, agriculture, tourism and forestry). Additionally, so-called “horizontal policies” concerning
human rights and gender equality are of key importance.
Feminization of climate change is related to incumbent inequalities reflected in at least four aspects: the
unequal capacities of women and men to mitigate negative climate impacts; unequal access to resources
for adaptation and mitigation; unequal political involvement and representation of women which can
often harm the decision- and policy-making processes and results in “gender-blind” strategies in sectors
such as energy, transport, agriculture, tourism, water supply, water management, waste management
and disaster risk reduction; and a lack of will to absorb and involve women as drivers of social change,
thus creating policies that actually “leave many women behind”.
In 2021, as a part of the preparations for the Third Biennial Report, the United Nations Development
Programme, in cooperation with the Ministry of Ecology, Spatial Planning and Urbanism of Montenegro
(MESPU) agreed to develop two assessments which will reflect the main characteristics and capacities of
the state and non-state actors to participate in creation, implementation and monitoring of the climate
change policies and action through intersecting gender and climate change. The MESPU and UNDP also
agreed to present the main findings and recommendations of both assessments at various stakeholders’
meetings to ensure better exchange of information and expert inputs for informed climate change
planning and reporting.
The first assessment – Gender Analysis – concentrated on assessing the capacities of the national
institutions dealing with climate change38 to integrate gender equality considerations within climate
38 The Ministry of Ecology, Spatial Planning and Urbanism, but also the Ministry of the Economy, Capital Investments, Agriculture,
Forestry and Waters, as well as relevant national institutions, such as the Environment Protection Agency, the State Statistical
Office, etc.

94
change policies. The assessment covered five main areas: a) policy alignment; b) institutional
coordination; c) capacity building; d) sex-disaggregated data and gender information; and e) dedicated
financial resources and, for each area, specific recommendations on how to intersect gender and climate
change were provided.
The second assessment – Gender Capacity Assessment of Civil Society – was primarily focused on
environmental/climate change NGOs on the one hand, and NGOs working on protection and
empowerment of women and marginalized groups on the other. It was aimed at assessing their capacity
to interlink gender equality within climate action, as well as to encourage them to contribute to
adaptation and mitigation policies.
Intersecting gender and climate change is a cycle including separate tools which are strongly dependent
on each other and if a link in those tools is missing then realistic and effective policies will not be achieved.
Namely, in order to develop intersected gender and climate change policies, there is a need to gather and
analyse sex-disaggregated data which has to be transformed into gender indicators, and an analysis of the
situation should be reflected in the policies encompassing different sectors. Those different sectors are
represented by different institutions which have to cooperate in a predetermined manner in order to
reflect the sector-level and institutional responses in policies. In order to have efficient inter-sector or
inter-institutional cooperation, which will recognize the methods of intersecting gender and climate
change in policies and in the implementation phases, as well as monitoring and evaluation, the
institutional structure has to be informed, sensitized and trained, to have the capacities to be able to
intersect gender and climate change. That means that those institutions will have to be able to identify
the needs for sex-disaggregated data, analyse them, transform them into the gender indicators which will
identify the gender gaps in the policies. Those gaps have to be reflected in the policies by designing gender
responsive measures which have to be monitored and evaluated from a gender perspective.
At the policy and inter-institutional cooperation levels, the process of intersecting gender and climate
change started in 2017 in the framework of Global Support Programme (GSP) for the National
Communications and Biennial Update Reports, funded by the Global Environment Facility (GEF) and jointly
implemented by UNDP and UNEP, by a pilot initiative for the provision of regional and national support
to five Western Balkan countries and Lebanon.
Since then, Montenegro has achieved significant progress in intersecting gender and climate change in
the gender equality policy framework, more specifically the National Gender Equality Strategy 2021–
2025 with the Action Plan 2021–2022 of Montenegro.
This Strategy intersects gender and climate change only in the health sector, while other climate-related
sectors are missing. It is important to consider inclusion and defining measures for other climate-related
sectors as well, such as energy, transport and agriculture. On the other hand, the legal and policy
framework dealing with climate change and those sectors related to climate change has to be revised for
future incorporation of the gender perspective. Climate change policies should be revised and upgraded
by using the Gender Mainstreaming process in terms of creating gender-responsive climate change
policies in compliance with the Gender Equality Law (Article 3), new Gender Equality Strategy (section on
climate change) in terms of including gender-responsive actions (where applicable) and provision of
measures that contribute towards narrowing the gender gap and gender differences while undertaking
adaptation or mitigation measures, and decreasing the gender-based vulnerabilities of the negative
impacts of climate change. This recommendation is in line with the National Gender Equality Strategy
2021–2025 with the Action Plan 2021–2022 of Montenegro. As the General Secretariat of the Government
aims to standardize the way in which public policies are developed in order to be gender-responsive, as
well as to facilitate inter-institutional cooperation in the implementation of public policies, it is necessary
to develop a methodology and a standardized instruction for state bodies. The standardized
95
methodology and instructions should contain instructions on applying the elements of gender
mainstreaming tools, such as the following: gender analysis, gender impact assessment, gender planning,
gender-disaggregated statistics, gender-responsive budgeting, gender-sensitive public procurement,
gender audit, gender-responsive monitoring and evaluation, consultations, capacity building, awareness
raising, gender indicators, etc.
At the same time, this standardized methodology and instructions should contain a template on reporting
on the status of implementation of the gender perspective in the work of each legal entity by applying
and using the Standardized Reporting Format which should contain the following elements:
- Type and list of the activities implemented in accordance with the standardized methodology and
instructions on introducing the gender mainstreaming process, the Gender Equality Law and the Strategy
on Gender Equality;
- Inter-institutional/inter-sector cooperation, as well as cooperation with other actors with the
purpose of introducing a gender perspective into the policies and the work of the state organ;
- Identification of gender components of the current/planned policies/plans/projects of the state
organ through data collection and sex-disaggregation.
In Montenegro, at the moment there are no registered institutional methods and bodies of inter-
institutional cooperation between the two main sets of institutions: the first set including those working
in the field of gender equality, and the second set including those working in the field of climate change
and every sector related to climate change.
Due to the fact that the Montenegro has established a basis for intersecting gender and climate change
which should be revised and upgraded, and has also ratified the international commitments on ensuring
a gender perspective in climate change policy and actions, the country has to develop and establish
mechanisms for inter-institutional cooperation and capacity building. On the other hand, policy
development and improvement go hand-in-hand with strengthened institutional capacities and
knowledge on the respective issue.
The methods are twofold.
The first involves including representatives from gender equality mechanisms in the working groups
dealing with climate change areas, such as the National Council for Sustainable Development Integrated
Coastal Zone Management and Climate Change, and the Mitigation and Adaptation Working Group. It will
secure ad-hoc interventions in the work of these groups for the purpose of integrating a gender
perspective. However, the sustainability and continuity of this method is questionable, and it does not
encompass all the processes and sectors, as well as policy and institutional activities in climate-change-
related sectors. Nonetheless, gender representatives (institutional mechanism) must be included in the
work of these bodies. Due to the fact that the National Council and working groups are currently under
restructuring and their mandates are yet to be defined, it is highly important to assign a gender
representative at least in the Working Group on Mitigation and Adaptation.
On the other hand, establishment of a more sustainable mechanism will provide more comprehensive
intersection of both areas, at both the local and central levels, and will encompass the work of each
institution (related to CC sectors). It will tackle each sector related to CC separately and will also address
the incorporation of climate change more systematically into gender equality policies.
An inter-departmental or inter-sector working group from the relevant ministries and agencies and other
state institutions working in fields relevant to gender (on the one hand) and environmental and climate
change issues (on the other) should be established as an institutional body that will (mainly) monitor the

96
situation with gender equality in each field of society, with the purpose of: promoting the concept of GMS
in the policies of all the public institutions; monitoring and promoting the gender concept in sector
policies; following and monitoring the progress of harmonization of the national legal and policy
framework with international standards.
This group can also develop and work under the Standard Operating Procedures for the intersection of
gender and climate change for national institutions on the tasks listed above, in particular:
- Following and monitoring programmes in the areas, for which they are competent, from a gender
perspective;
- Monitoring the budgets in the annual plans in their areas of competence from the perspective of
GRB;
- Monitoring and analysing strategic documents in the areas of competence from a gender
perspective;
- Providing recommendations for promoting the concept of gender in climate change policies and
intersecting gender and climate change in programmes, policies, strategic and fiscal plans.
Recommendations will be submitted to the decision-making-level structures, working bodies and state
institutions working on UNFCCC requirements. This group should also encompass representatives from
the sectors of academia, CSOs, business and social dialogue.
Regarding the collection of sex-disaggregated data, the State Statistical Office in Montenegro is the main
source of data provision. As argued before, in order to create efficient policies sex-disaggregated data is
essential, and therefore the institutions will have to put effort into collecting them in accordance with the
field of their work, and dividing them according to sex. This collection of data can be defined in the
framework of the Standardized Methodology and Instructions on introducing the gender mainstreaming
process into the development of central and local policy methodologies.
In order to ensure effective intersecting of gender and climate change in the work of each relevant
institution, the capacities of the personnel working in the targeted areas have to be ensured.
As recommended above, different types of stakeholders and actors should receive training, such as:
1. Working groups dealing with UNFCCC obligations and requirements (National Communications);
2. Decision-making level – institutional (ministerial) level: state advisors on gender equality and
state advisors on climate change (and related sectors);
3. Parliamentary level: Commission for Equal Opportunities;
4. Administrative level: administration working in the field of gender equality and climate-change-
related sectors and collecting sex-disaggregated data.
The recommended unified training for gender focal points in line ministries, decision makers and
administrative officers working in climate-related sectors is due to the fact that representatives of both
groups have to gain knowledge and strengthen their capacities on the common topic: intersection of
gender and climate change, by understanding the following:
➢ A gender perspective in climate change: identification and defining the gender-based inequalities
that lead to the feminization of poverty, which furthermore leads towards increased vulnerability,
mitigation and adaptation capacities based on gender;
➢ Gender differences in climate change mitigation and adaptation: different roles, needs,
opportunities of men and women based on gender in different climate change sectors: transport,
agriculture, water and waste management, energy, etc.
97
➢ Introduction to the GMS process in climate change policies, programmes, projects and financial
plans;
➢ International and national legal and policy provisions on gender (on the one hand) and climate
change (on the other), as well as provisions intersecting gender and climate change;
➢ The power of data: sex-disaggregated data and gender indicators in documents related to climate
change (UNFCCC reports).
A mentorship programme on intersecting on gender and climate change should be considered as a
method of systematic inclusion and capacity building, on the one hand, and as a practical method of
developing concrete gender-responsive climate action at both the central and national levels, on the
other.
This mentorship programme will also address the fiscal plans of the institutions, by which, along with
gender-responsive budgeting, will contribute towards inclusion of a gender perspective in climate
financing.
The government and local communities in Montenegro have a duty to promote gender equality and
human rights, including through the implementation of legal and policy commitments regarding gender-
responsive budgeting and climate change. They cannot promote prosperity or inclusive, sustainable
growth if they neglect the rights and needs of half of Montenegro’s population. This is why gender
budgeting should be applied to systems, processes and programmes, which means maintaining
commitments that tangibly promote gender equality in the processes of tackling climate change. Gender
budgeting contributes to good governance. One of the key ways to do this is by increasing participation
in budget processes. With equal involvement of women and men in budget preparation – for example,
through public consultation and the use of gender-disaggregated data – budgets will be more accountable
and transparent, the state and local communities will be more accountable, and Montenegro’s goals for
tackling climate change will be more effectively implemented.
To this end, in Montenegro, there is potential for developing a systematic approach to intersecting
gender and climate change at the policy level, through ensuring inter-institutional cooperation by the
provision of training tools for strengthening the capacities of institutions towards implementing
concrete gender-responsive climate action and gender-responsive climate financing.
When it comes to civil society, it has been recognized that NGOs have an important role as stakeholders
in the formulation, implementation and monitoring of climate action. However, it seems that
Montenegrin NGOs related, on the one hand, to the environment/climate change/sustainable
development and, on the other, gender equality/protection and empowerment of women, vulnerable
and marginalized groups, are still not prepared to take on this role.
Although some environment/climate change/sustainable development NGOs integrate some gender
considerations into their projects, it is obvious that this approach is more donor-driven than based on
their mission. On the other hand, NGOs working on gender equality/protection and empowerment of
women, vulnerable and marginalized groups are even less able to incorporate environment/climate
change considerations into their work.39 When it comes to the organizational culture, it is to be concluded
that most of NGOs embrace gender equality as one of their organizational values.
Both types of NGOs have a high level of expertise in their own areas, but rarely introduce an inter-
disciplinary approach. Some ad-hoc cooperation between different types of organizations occurs, but
there is a lack of genuine understanding how they could benefit from each other’s knowledge and how
39 The cumulative results show that the percentage of NGOs that understand the causes of climate change (33%) is lower than
the total number of responding NGOs working in the field of environment/climate change/sustainable development (45%).
98
they can work together towards the introduction of gender-just climate solutions. Entry points for this
type of synergetic work already exist – participation of NGOs in working groups for negotiations with the
EU, implementation of the Green Agenda, as well as the process of creation, implementation and
monitoring of mitigation and adaptation policies.
Only one third of responders understand the causes and consequences of climate change; on the other
hand, the positive attitude of both types of NGOs towards gender-responsive climate policies and their
readiness to further build capacities to interlink gender and climate change are encouraging.
The capacities of NGOs in raising public awareness, mobilizing participation of local women, men and
vulnerable groups in adaptation and mitigation policies are still insufficient. Only a small percentage of
NGOs have regular communication with citizens.
The following has been proposed as the main recommendations for NGOs:
➢ NGOs should work on the establishment of a network of organizations, experts and activists
working in the area of gender equality, protection and empowerment of women, people of other
gender orientation, vulnerable and marginalized groups, and NGOs working in the area of
environment protection, sustainable development, rural and regional development, etc., in order
to join efforts, knowledge and skills to: a) raise awareness on gender responsiveness to climate
change and just transition; b) empower local women and men, vulnerable and marginalized
groups to actively contribute to mitigation and adaptation policies and plans; c) participate in the
implementation of climate action; and d) monitor gender-responsiveness and implementation of
the principle of just transition.
➢ Events and campaigns stimulating participation of local women and men, and vulnerable and
marginalized groups should be organized by local NGOs to inform people about the consequences
of climate change, but also to help them come up with ideas and solutions for adaptation and
mitigation policies.
➢ NGOs should work on raising their capacities to mobilize local women and men, vulnerable and
marginalized groups, to participate in the climate-related decision-making process. The Handbook
on mechanisms of civic participation in decision making at the local and national levels40 issued in
2020 by the NGO “Centre for the Development of NGOs” can serve as a guidance regarding the
procedures, means and types of participation, etc. However, special guidance and training for
NGOs and local governments for the mobilization of women for civic participation, especially
women from rural areas and marginalized communities in climate-related decision making, needs
to be developed. Some general recommendations can be drawn from the existing handbooks of
UN agencies and programmes, 41 but it is necessary to integrate the local context and
understanding of the culture, customs, way of life and other features and nuances of the
particular community or group. It is necessary for NGOs to raise capacities in the following areas:
communication skills, development of needs assessments, conducting of individual interviews
and focus groups, project writing, development of strategic plans, development of gender
analysis, gender-responsive budgets, indicators, reporting, monitoring and evaluation.
➢ Environment NGOs should work on raising understanding of how to apply the concept of a
Human-Rights-Based Approach to climate change and to understand why intersection and gender
equality are important for climate action (such as, for example, how renewable energy can be a
40 https://crnvo.me/wp-content/uploads/2021/02/Mehanizmi-gradanskog-ucesca-u-procesima-donosenja-odluka-na-lokalnom-i-nacionalnom-
nivou.pdf. 41 https://asiapacific.unwomen.org/en/digital-library/publications/2021/06/training-manual-on-gender-and-climate-resilience;
FAO: Field Level Handbook, http://www.fao.org/3/ak214e/ak214e00.pdf.

99
catalyst for women’s empowerment and gender equality, economic empowerment of women).
They should work on building their capacities to develop gender-responsive projects, containing
gender-relevant goals, activities, indicators and budget. Also, consultations with gender experts
during the project implementation is highly desirable. Gender-responsive monitoring should
become an integral part of the project cycle, and environmental NGOs should closely cooperate
with NGOs working on the protection of women and vulnerable groups in this area. It is necessary
to develop gender-responsive indicators in accordance with good practices and existing UN
handbooks.42
➢ NGOs working on the protection of rights and empowerment of women, vulnerable and
marginalized groups should work on raising understanding and knowledge about the gender
dimension of climate change, as well as about development of gender-responsive project and
monitoring frameworks and indicators.
➢ All NGOs should consult their target groups more often to ensure the inclusiveness and
effectiveness of their projects. It is necessary to assess on a regular basis the needs of people, as
well as their knowledge and understanding of climate change. On the other hand, it is necessary
to work with local women and men, vulnerable and marginalized groups to encourage them to
be active participants in climate action. NGOs should also help in assessing the potentials of local
people to be agents of change and work on strengthening their capacities to benefit from
programmes for adaptation and mitigation, the green economy and a Just Energy Transition.
➢ NGOs should upgrade their communication with the general public through user-friendly
websites, social networks, podcasts and other forms of communication.
The full list of recommendations, not only for NGOs, but also for other civil society organizations, the
donor community, and national and local governments is available at UNDP Montenegro.
42 Broad gender and environment indicators: https://www.empowerforclimate.org/en/resources/m/a/i/mainstreaming-
gender-in-environment-statistics-for-the-sdgs-and-beyond; EmPower indicators on gender and climate change:
https://www.empowerforclimate.org/en/resources/i/n/t/integrating-gender-in-climate-change-and-disaster-related-statistics.

100
References Guidelines
1. Guidelines for the preparation of National Communications from Parties not included in Annex
I to the Convention. Decision 17/CP.8 (FCCC/CP/2002/7/Add.2), available (8 January 2020) at
https://unfccc.int/sites/default/files/17_cp.8.pdf;
2. UNFCCC biennial update reporting guidelines for Parties not included in Annex I to the
Convention (Decision 2/CP.17, FCCC/CP/2011/9/Add.1, Annex III), available at
https://unfccc.int/sites/default/files/resource/docs/2011/cop17/eng/09a01.pdf
3. Modalities, procedures and guidelines for the transparency framework for action and support
referred to in Article 13 of the Paris Agreement, available (8 January 2020) at
https://unfccc.int/sites/default/files/resource/CMA2018_03a02E.pdf
4. IPCC. 2006. 2006 IPCC Guidelines for National Greenhouse Gas Inventories. S Eggleston, L
Buendia, K Miwa, et al. (eds.). Hayama, Japan: Institute for Global Environmental Strategies.
Available at http://www.ipcc-nggip.iges.or.jp/public/2006gl.
5. EMEP/EEA Air Pollutant Emission Inventory Guidebook 2019
Montenegro’s submissions and technical analysis reports
6. First and Second BURs of Montenegro. Available at https://unfccc.int/BURs.
7. First, Second and Third NCs of Montenegro. Available at https://unfccc.int/non-annex-I-NCs.
8. Summary reports on the technical analysis of the Second BUR of Montenegro, contained in the
document. Available at https://unfccc.int/ICA-reports.
9. First and updated NDCs of Montenegro. Available at:
https://www4.unfccc.int/sites/NDCStaging/pages/Party.aspx?party=MNE.
10. NIR of Montenegro (1990–2019)

101
Annexes
Annex 1: Detailed description of the policies and measures All the policies and measures (25) used in the mitigation scenarios (WEM and WAM) are
presented in the table below with the following information:
• Name of the mitigation policy and measure: objective, sector/category, description,
type, scenario, gas, relevant plans, legal and regulatory acts, additional impacts, cost
estimate and source of financing;
• Progress in implementation: progress indicators, steps taken and envisaged,
timeframe, estimated emissions reduction (by 2030), risks, assumptions and
implementing entity;
• Contribution to the achievement of SDGs.
The impacts of the mitigation measures from the WEM and WAM scenarios in terms of GHG
emissions reduction are presented against the WOM scenario.
While the majority of the measures proposed here are implemented country-wide and some
may also have a local context, some measures refer exclusively to specific plants, such as TPP
Pljevlja and KAP. The mitigation measures often have additional impacts and co-benefits, and
in some cases may have the potential to serve as adaptation measures as well.
Number/ID 1E
Name Environmental refurbishment of TPP Pljevlja
Objective Extended plant operation
Sector/category 1A1 Energy industries
Relevant plan, legal and regulatory act
Energy Development Strategy by 2030; Energy Development Strategy Action Plan for the period 2016–2020
Scenario WEM/WAM
Gas CO2
Timeframe 2021–2022
Cost estimate €54.45 m
Source of financing EPCG
Progress indicator(s) Reduction of CO2 emissions/year
Projection/2030 Annual CO2 emissions reduction of 600 Gg over the period 2021–2022
Additional impacts Reduced air, water and soil pollution and industrial hazardous waste (lower emissions of dust, sulphur dioxide and nitrogen oxides; recultivation of ash and slag impoundment); creation of new jobs.
Description The environmental refurbishment of the TPP includes: desulphurization (FGD) and denitrification (SCR) installations; upgrade of the electro-filtering plant; construction of wastewater treatment facility; reconstruction of the internal system for transporting by-products, and construction of a heat station as part of the district heating system. The environmental refurbishment will ensure compliance with the requirements and most rigid environmental parameters as set out in the latest EU Directive 2017/1442 establishing best available techniques (BAT) for large combustion plants, in line with the Law on Industrial Emissions, which transposed the requirements from the EU Industrial Emissions Directive.
Assumptions Financing available;

102
The emission reductions will be achieved when the TPP is stopped for retrofitting activities.
Risks There are no risks for project implementation since the contract with the contractor and supplier has been signed and funds secured; however, there is definitely a major risk of TPP Pljevlja not being competitive in its future operation.
Steps taken Contract signed for the environmental refurbishment of TPP Pljevlja, with the works expected to commence by the end of 2021.
Steps envisaged Commencement of the works
Implementing entity EPCG
Contribution to the achievement of SDGs
3. Health and Wellbeing
9. Industry, Innovation and Infrastructure
11. Sustainable Cities and Communities
13. Climate Protection
15. Life on Land
Number/ID 2E
Name Carbon pricing for TPP Pljevlja
Objective Reduced use and phase-out of coal for power generation
Sector/category 1A1 Energy industries
Relevant plans, legal and regulatory acts
The Decree on the activities or operations emitting greenhouse gases for which the permit for greenhouse gas emissions is issued (February 2020), which is currently undergoing revision; the EU Cross-Border Adaptation Mechanism (CBAM), effective as of early 2023; the EU Emissions Trading System (EU ETS), effective upon accession to the EU.
Scenario WEM/WAM
Gas CO2
Timeframe 2022–2030
Cost estimate Negligible costs of adoption of regulation; high costs for TPP Pljevlja operator (EPCG)
Source of financing Budget, EPCG
Progress indicators Reduction of CO2 emissions/year
Projection/2030 Annual CO2 emissions reduction of 2,124 Gg over the period 2022–2030
Additional impacts Reduced air, water and soil pollution and industrial hazardous waste (lower emissions of dust, sulphur dioxide and nitrogen oxides); financial benefits for investing in renewable energy sources and EE.
Description The Decree on the activities or operations emitting greenhouse gases for which the permit for greenhouse gas emissions is issued limits the emissions from energy and industrial installations by introducing a national Emissions Trading System. The anticipated electricity market prices will give rise to the need for minor annual generation reductions by 2023 due to lower market prices. The TPP operator risks not being competitive in the market due to the increased generation costs driven by high investment costs and extra costs of the reagents, chemicals and water for the operation of the FGD and SCR systems. Furthermore, a significant reduction in generation will follow as of 2023, due to the new EU Cross-Border Adaptation Mechanism (CBAM). The CBAM, also known as the CO2 tax, will cover all imports of goods and services covered by the EU ETS. The CBAM is aligned with the European Green Deal, so the relevant legislative proposal should be developed at the latest by end of 2021. Ultimately, EU accession automatically triggers the entry of Montenegrin installations into the EU ETS. It is important to highlight that the price of the EUA (EU Emissions Allowance) in the EU ETS on 5 June 2021 was €57.87.
Assumptions Regulatory framework developed; Emission reductions were calculated with the assumption that due to high carbon pricing the TPP cannot work at full capacity. Thus it will operate based on market principles and gradually reduce operational hours.

103
Risks No policy implementation risk
Steps taken The Decree on the activities or operations emitting greenhouse gases for which the permit for greenhouse gas emissions is issued has been effective since February 2020. It is currently undergoing revision. In addition, some of the EU regulations concerning the EU ETS have been transposed.
Steps envisaged The EU developing the CBAM legislation by the end of 2021.
Implementing entity Ministry of Ecology, Spatial Planning and Urbanism
Contribution to the achievement of SDGs
3. Health and Wellbeing
9. Industry, Innovation and Infrastructure
11. Sustainable Cities and Communities
13. Climate Protection
15. Life on Land
Number/ID 3E
Name New renewable power plants
Objective New installed capacity for electricity generation, reducing coal-fired generation
Sector/category 1A1 Energy industries
Relevant plans, legal and regulatory acts
Energy Development Strategy by 2030, Action Plan for the period 2016–2020; websites of the Ministry of Capital Investments; EPCG’s and private investors’ business plans; project documents; Policy Guidelines on Integration of Renewable Self-Consumers.
Scenario WEM/WAM
Gas CO2
Timeframe 2022–2030
Cost estimate €740 m
Source of financing Budget, EPCG
Progress indicators Reduction of CO2 emissions/year
Projection/2030 Annual CO2 emissions reduction of 554 Gg over the period 2022–2030
Additional impacts Reduced air, water and soil pollution; new investments; energy mix; lower imports and higher exports of electricity; financial gain from both large-scale investments and the sale of electricity; higher share of renewables within power generation – energy mix; lower grid losses.
Description The following renewable power plants are planned: a) New turbine-generator G8 unit at HPP Perućica (additional 58.5 MW, 50 GWh) b) Refurbishment of HPP Piva (no additional capacity) c) WPP Gvozd (54.6 MW, 150 GWh) d) WPP Brajići (100 MW, 277 GWh) e) SPP Briska gora (250 MW, 450 GWh) f) HPP Komarnica (172 MW, 213 GWh) g) HPP Kruševo (120 MW, 322 GWh) h) SPP Velje Brdo (50 MW, 90 GWh) i) SPP prosumers (10 MW, 18 GWh)
Assumptions Implementation is subject to signed contracts and secured project implementation financing. Emission reduction estimates are calculated assuming that all listed power plants are built.
Risks Risk due to large investments and overall economic downturn caused by the COVID-19 pandemic.
Steps taken HPP Perućica is refurbishing the last two generators; it has continued with the installation of the three remaining transformer blocks. HPP Piva is to overhaul its A3 generator.

104
Construction of WPP Gvozd is planned to start in 2021 and to be complete 18 months after project implementation commencement; preliminary cooperation has been established with the EBRD to secure the funds for project implementation. The government has repealed the conclusions of 1 October 2020 which envisaged expansion of the zone for construction and a capacity increase of SPP Briska Gora from 118 to 262 MW. The timeline for the implementation of the project SPP Briska Gora has been set. The zoning and technical specifications have been obtained for the development of the technical documents for a multi-purpose reservoir, construction of a dam and construction of HPP Komarnica with a power grid connection, within the area covered by the detailed spatial plan for the multi-purpose reservoir on the River Komarnica. The EPCG Investment Plan by 2024 envisages the construction of HPP Komarnica, costing around €300 million, and commencement of construction of HPP Kruševo. The tender for the construction of SPP Velje Brdo is under preparation. The land lease agreement for WPP Brajići has been signed. The Energy Law established the legal framework for the installations of prosumers, who consume the power they produce themselves in households/commercial/public buildings. The government has expressed its intention to provide subsidies to citizens for such installations. The Investment and Development Fund (IDF) and Environmental Protection Fund (Eco Fund)43 are implementing support for green financing in the form of incentives for increased use of clean energy and improved energy efficiency, with the aim of reducing CO2 emissions and energy costs for micro, small and medium-sized enterprises and farmers, through enhanced energy efficiency and security of supply and promotion of the use of renewable energy sources, thus providing a major impetus to low-carbon development and the economic recovery of the country. The business community is expected to show an interest and readiness to take part in this programme and contribute new ideas and solutions through the implementation of the public call for grants. The subsidies are intended for the co-financing of the implementation of projects on the use of renewables implemented by the Eco Fund with UNDP support. The IDF will support the implementation of this project by extending loans to end beneficiaries under its new Programme of Support to Green Businesses – Photovoltaic Panels for Businesses and Farms. Together with the UNDP, the Eco Fund has secured €100,000 to subsidize up to 40% of eligible costs, providing up to €25,000 per beneficiary. The project has a multiplier effect and aims to cut the costs of electricity, boost the productivity of businesses and farmers, and achieve significant reductions in CO2 emissions. Further support to businesses is planned to take the form of similar projects and to expand to citizens. The funds to be approved by the IDF under this credit line will be available to entrepreneurs, farmers and MSMEs and will range from 3,000 to up to €400,000, with a 3% interest rate per annum and a 10-year repayment period, including a one-year grace period. Implementation of this Programme of Support will contribute to market development and increased use of renewable energy sources, as well as a reduction of CO2 emissions generated by MSMEs, entrepreneurs and farms.
Steps envisaged Installation of the eighth generator to increase the installed capacity of HPP Perućica. Construction of power plants as planned and within the agreed timelines.
Implementing entity Ministry of Capital Investments, EPCG, private investors, Eco Fund
Contribution to the achievement of SDGs
3. Health and Wellbeing
9. Industry, Innovation and Infrastructure
11. Sustainable Cities and Communities
13. Climate Protection
15. Life on Land
43 https://www.irfcg.me/me/naslovna/127-saopstenje-za-medije/641-potpisan-protokol-o-saradnji-izmedu-irf-a-i-eko-fonda.html.

105
Number/ID 4E
Name District heating in Pljevlja
Objective New installed capacities for heat energy generation; reduced use of coal in household furnaces for heating purposes
Sector/category 1A1 Energy industries
Relevant plans, legal and regulatory acts
Energy Development Strategy by 2030; Action Plan for the period 2016–2020; Air Quality Plan for Pljevlja Municipality
Scenario WEM/WAM
Gas CO2
Timeframe 2023–2025
Cost estimate €23 m
Source of financing Municipality of Pljevlja, EPCG
Progress indicators Reduction of CO2 emissions/year
Projection/2030 Annual CO2 emissions reduction of 44 Gg over the period 2022–2030
Additional impacts Less air pollution; new investments; reduced environmental impact; new district heating infrastructure.
Description District heating system will be developed in Pljevlja following the environmental refurbishment of TPP Pljevlja. All preparatory works related to connecting to the district heating system will be executed during the upgrade. The heating project will solve the longstanding air pollution problem and other urgent environmental and public health issues in Pljevlja and the surrounding area. The citizens of Pljevlja burn for heating purposes some 80% of the total quantity of coal used in the residential sector in the country. Thus, the air in Pljevlja during the winter season contains high quantities of primarily air pollutants (SO2, NOx, PM2.5, PM10, ash and soot), which are mostly the by-products of lignite combustion in individual, largely inefficient stoves in about 5,000 local households. The chief objective of the project is to provide heat energy for the town of Pljevlja from a central heat source via a modern centralized heat supply system and thus supersede household coal furnaces.
Assumptions Zoning and technical specifications for the heating plant and pipeline obtained. The assumption is that the project will eliminate lignite as fuel for heating in Pljevlja at the latest by 2030. The phasing out of lignite use in the residential sector in the Municipality of Pljevlja will result in a reduction of GHG emissions commensurate with the reductions in the use of lignite during the observed period.
Risks Risk related to the municipality securing the financing/borrowing for implementation; risk related to the decision on coal phase-out.
Steps taken A €2 million grant has been provided by the EPCG.
Steps envisaged Development of the main design; reviews; securing the financing, and construction.
Implementing entity Municipality of Pljevlja, EPCG
Contribution to the achievement of SDGs
3. Health and Wellbeing
9. Industry, Innovation and Infrastructure
11. Sustainable Cities and Communities
13. Climate Protection
15. Life on Land
Number/ID 5E
Name Coal phase-out and ending of operations of TPP Pljevlja no later than by 2035, accompanied by a timely just transition in the Pljevlja Coal Region.
Objective Gradual abolishment of coal for power generation by 2035
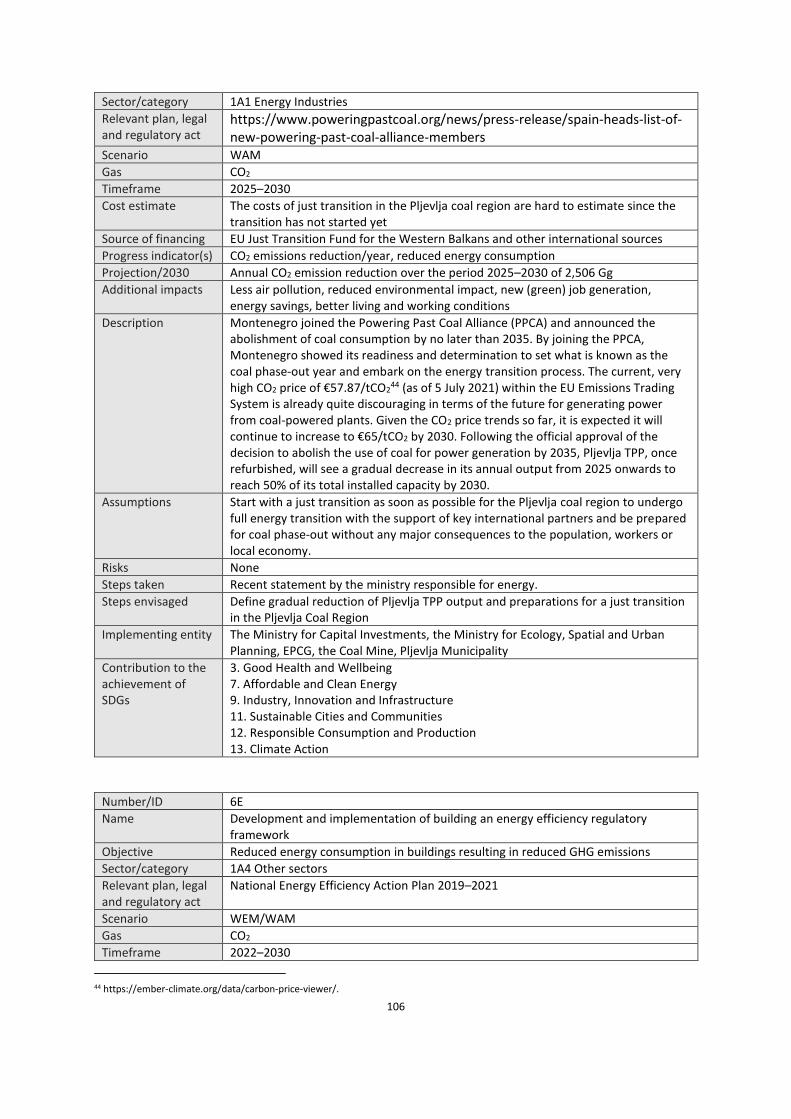
106
Sector/category 1A1 Energy Industries Relevant plan, legal and regulatory act
https://www.poweringpastcoal.org/news/press-release/spain-heads-list-of-new-powering-past-coal-alliance-members
Scenario WAM
Gas CO2
Timeframe 2025–2030
Cost estimate The costs of just transition in the Pljevlja coal region are hard to estimate since the transition has not started yet
Source of financing EU Just Transition Fund for the Western Balkans and other international sources
Progress indicator(s) CO2 emissions reduction/year, reduced energy consumption
Projection/2030 Annual CO2 emission reduction over the period 2025–2030 of 2,506 Gg
Additional impacts Less air pollution, reduced environmental impact, new (green) job generation, energy savings, better living and working conditions
Description Montenegro joined the Powering Past Coal Alliance (PPCA) and announced the abolishment of coal consumption by no later than 2035. By joining the PPCA, Montenegro showed its readiness and determination to set what is known as the coal phase-out year and embark on the energy transition process. The current, very high CO2 price of €57.87/tCO2
44 (as of 5 July 2021) within the EU Emissions Trading System is already quite discouraging in terms of the future for generating power from coal-powered plants. Given the CO2 price trends so far, it is expected it will continue to increase to €65/tCO2 by 2030. Following the official approval of the decision to abolish the use of coal for power generation by 2035, Pljevlja TPP, once refurbished, will see a gradual decrease in its annual output from 2025 onwards to reach 50% of its total installed capacity by 2030.
Assumptions Start with a just transition as soon as possible for the Pljevlja coal region to undergo full energy transition with the support of key international partners and be prepared for coal phase-out without any major consequences to the population, workers or local economy.
Risks None
Steps taken Recent statement by the ministry responsible for energy.
Steps envisaged Define gradual reduction of Pljevlja TPP output and preparations for a just transition in the Pljevlja Coal Region
Implementing entity The Ministry for Capital Investments, the Ministry for Ecology, Spatial and Urban Planning, EPCG, the Coal Mine, Pljevlja Municipality
Contribution to the achievement of SDGs
3. Good Health and Wellbeing 7. Affordable and Clean Energy 9. Industry, Innovation and Infrastructure 11. Sustainable Cities and Communities 12. Responsible Consumption and Production 13. Climate Action
Number/ID 6E
Name Development and implementation of building an energy efficiency regulatory framework
Objective Reduced energy consumption in buildings resulting in reduced GHG emissions
Sector/category 1A4 Other sectors
Relevant plan, legal and regulatory act
National Energy Efficiency Action Plan 2019–2021
Scenario WEM/WAM
Gas CO2
Timeframe 2022–2030
44 https://ember-climate.org/data/carbon-price-viewer/.
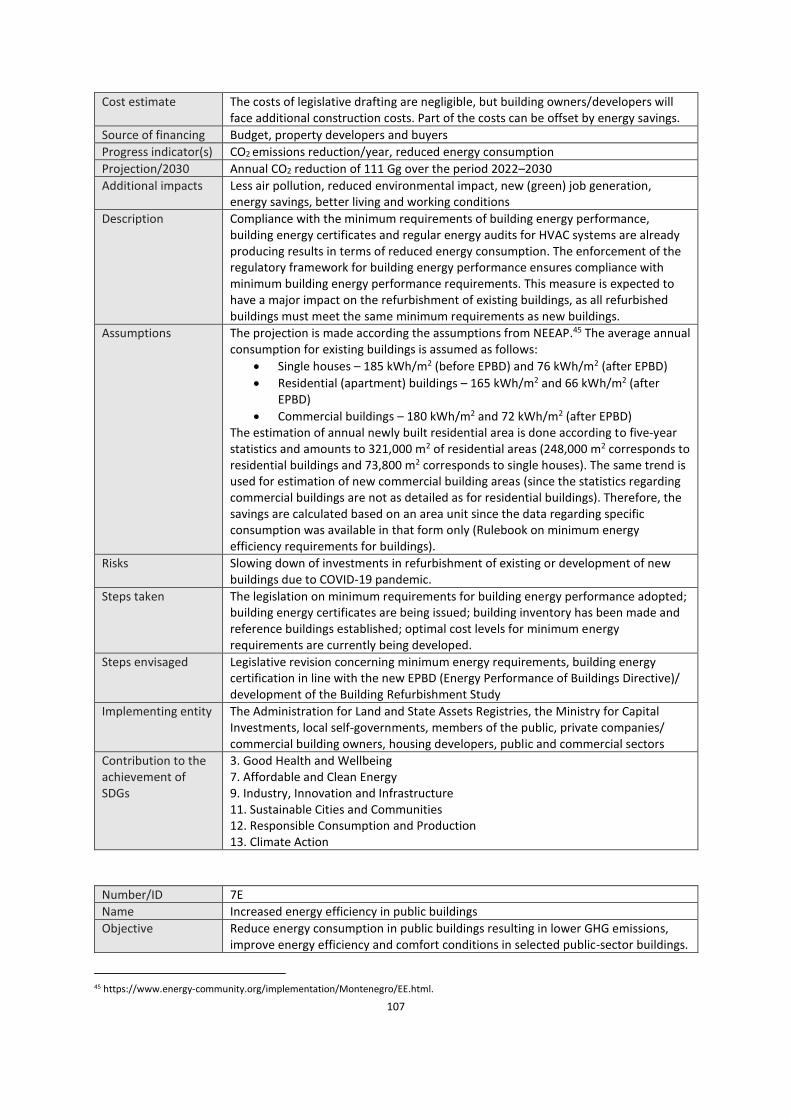
107
Cost estimate The costs of legislative drafting are negligible, but building owners/developers will face additional construction costs. Part of the costs can be offset by energy savings.
Source of financing Budget, property developers and buyers
Progress indicator(s) CO2 emissions reduction/year, reduced energy consumption
Projection/2030 Annual CO2 reduction of 111 Gg over the period 2022–2030
Additional impacts Less air pollution, reduced environmental impact, new (green) job generation, energy savings, better living and working conditions
Description Compliance with the minimum requirements of building energy performance, building energy certificates and regular energy audits for HVAC systems are already producing results in terms of reduced energy consumption. The enforcement of the regulatory framework for building energy performance ensures compliance with minimum building energy performance requirements. This measure is expected to have a major impact on the refurbishment of existing buildings, as all refurbished buildings must meet the same minimum requirements as new buildings.
Assumptions The projection is made according the assumptions from NEEAP.45 The average annual consumption for existing buildings is assumed as follows:
• Single houses – 185 kWh/m2 (before EPBD) and 76 kWh/m2 (after EPBD)
• Residential (apartment) buildings – 165 kWh/m2 and 66 kWh/m2 (after EPBD)
• Commercial buildings – 180 kWh/m2 and 72 kWh/m2 (after EPBD) The estimation of annual newly built residential area is done according to five-year statistics and amounts to 321,000 m2 of residential areas (248,000 m2 corresponds to residential buildings and 73,800 m2 corresponds to single houses). The same trend is used for estimation of new commercial building areas (since the statistics regarding commercial buildings are not as detailed as for residential buildings). Therefore, the savings are calculated based on an area unit since the data regarding specific consumption was available in that form only (Rulebook on minimum energy efficiency requirements for buildings).
Risks Slowing down of investments in refurbishment of existing or development of new buildings due to COVID-19 pandemic.
Steps taken The legislation on minimum requirements for building energy performance adopted; building energy certificates are being issued; building inventory has been made and reference buildings established; optimal cost levels for minimum energy requirements are currently being developed.
Steps envisaged Legislative revision concerning minimum energy requirements, building energy certification in line with the new EPBD (Energy Performance of Buildings Directive)/development of the Building Refurbishment Study
Implementing entity The Administration for Land and State Assets Registries, the Ministry for Capital Investments, local self-governments, members of the public, private companies/commercial building owners, housing developers, public and commercial sectors
Contribution to the achievement of SDGs
3. Good Health and Wellbeing 7. Affordable and Clean Energy 9. Industry, Innovation and Infrastructure 11. Sustainable Cities and Communities 12. Responsible Consumption and Production 13. Climate Action
Number/ID 7E
Name Increased energy efficiency in public buildings
Objective Reduce energy consumption in public buildings resulting in lower GHG emissions, improve energy efficiency and comfort conditions in selected public-sector buildings.
45 https://www.energy-community.org/implementation/Montenegro/EE.html.
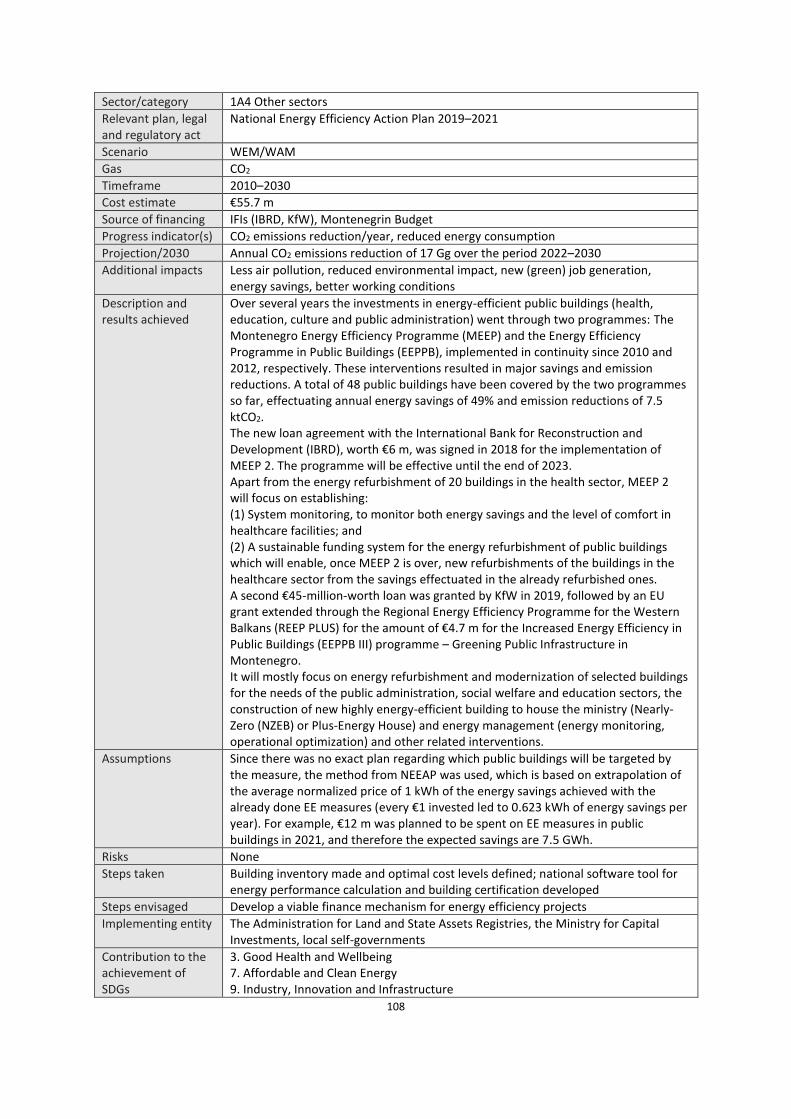
108
Sector/category 1A4 Other sectors
Relevant plan, legal and regulatory act
National Energy Efficiency Action Plan 2019–2021
Scenario WEM/WAM
Gas CO2
Timeframe 2010–2030
Cost estimate €55.7 m
Source of financing IFIs (IBRD, KfW), Montenegrin Budget
Progress indicator(s) CO2 emissions reduction/year, reduced energy consumption
Projection/2030 Annual CO2 emissions reduction of 17 Gg over the period 2022–2030
Additional impacts Less air pollution, reduced environmental impact, new (green) job generation, energy savings, better working conditions
Description and results achieved
Over several years the investments in energy-efficient public buildings (health, education, culture and public administration) went through two programmes: The Montenegro Energy Efficiency Programme (MEEP) and the Energy Efficiency Programme in Public Buildings (EEPPB), implemented in continuity since 2010 and 2012, respectively. These interventions resulted in major savings and emission reductions. A total of 48 public buildings have been covered by the two programmes so far, effectuating annual energy savings of 49% and emission reductions of 7.5 ktCO2. The new loan agreement with the International Bank for Reconstruction and Development (IBRD), worth €6 m, was signed in 2018 for the implementation of MEEP 2. The programme will be effective until the end of 2023. Apart from the energy refurbishment of 20 buildings in the health sector, MEEP 2 will focus on establishing: (1) System monitoring, to monitor both energy savings and the level of comfort in healthcare facilities; and (2) A sustainable funding system for the energy refurbishment of public buildings which will enable, once MEEP 2 is over, new refurbishments of the buildings in the healthcare sector from the savings effectuated in the already refurbished ones. A second €45-million-worth loan was granted by KfW in 2019, followed by an EU grant extended through the Regional Energy Efficiency Programme for the Western Balkans (REEP PLUS) for the amount of €4.7 m for the Increased Energy Efficiency in Public Buildings (EEPPB III) programme – Greening Public Infrastructure in Montenegro. It will mostly focus on energy refurbishment and modernization of selected buildings for the needs of the public administration, social welfare and education sectors, the construction of new highly energy-efficient building to house the ministry (Nearly-Zero (NZEB) or Plus-Energy House) and energy management (energy monitoring, operational optimization) and other related interventions.
Assumptions Since there was no exact plan regarding which public buildings will be targeted by the measure, the method from NEEAP was used, which is based on extrapolation of the average normalized price of 1 kWh of the energy savings achieved with the already done EE measures (every €1 invested led to 0.623 kWh of energy savings per year). For example, €12 m was planned to be spent on EE measures in public buildings in 2021, and therefore the expected savings are 7.5 GWh.
Risks None
Steps taken Building inventory made and optimal cost levels defined; national software tool for energy performance calculation and building certification developed
Steps envisaged Develop a viable finance mechanism for energy efficiency projects
Implementing entity The Administration for Land and State Assets Registries, the Ministry for Capital Investments, local self-governments
Contribution to the achievement of SDGs
3. Good Health and Wellbeing 7. Affordable and Clean Energy 9. Industry, Innovation and Infrastructure

109
11. Sustainable Cities and Communities 12. Responsible Consumption and Production 13. Climate Action
Number/ID 8E
Name Financial incentives for citizens/households (for EE investments)
Objective Make financial support mechanisms available to individuals for investing in energy efficiency and renewable energy sources
Sector/category 1A4 Other sectors
Relevant plan, legal and regulatory act
National Energy Efficiency Action Plan 2019–2021
Scenario WEM/WAM
Gas CO2
Timeframe 2011–2030
Cost estimate €3.9 m
Source of financing IFIs (IBRD, KfW), Montenegrin Budget
Progress indicator(s) CO2 emissions reduction/year, reduced energy consumption
Projection/2030 Annual CO2 emissions reduction of 9 Gg over the period 2022–2030
Additional impacts Less air pollution, reduced environmental impact, new (green) job generation, energy savings, better working conditions
Description and results achieved
In December 2020, the Ministry for Capital Investments completed the Energy Efficient Home programme aimed at reducing heating costs and increasing the level of comfort in households, reducing CO2 emissions, and developing the market for energy-efficient HVAC systems in Montenegro. The programme offers an enticing and sustainable financing mechanism for energy-efficient homes. A total of €200,000 was appropriated from Montenegro’s budget to subsidize interest payments and loan fees for Montenegrin households for: - purchase and instalment of heating systems using modern forms of biomass
(pellet, briquettes); - purchase and instalment of highly energy-efficient heat pumps; - purchase and instalment of multi-split heating/AC systems; - instalment of thermal insulation for residential buildings; - instalment of energy efficient external façade joinery; - purchase and instalment of photovoltaic systems with exchange on the spot. Individuals can apply for interest-free loans up to the amount of €10,000, to be repaid within six years for any of the above energy efficiency measures in their homes. Between October and December 2020 the partner banks granted 240 loans to individuals participating in the programme. By the end of 2020, works were completed at 230 sites. Due to the COVID-19 situation, weather conditions and other circumstances, works were not completed at 10 locations, but will be completed by May 2021. The total investment in energy efficiency measures in 240 homes amounted to €881,880.51, while the interests and fees covered from the budget amounted to €128,565.07. The EPCG is launching the Solari 3000+46 project involving the replacement and gradual disuse of harmful energy sources aimed at CO2 emission reduction. As one of the options for a transition to green (renewable) energy that has no harmful effects, EPCG wishes to offer individual consumers the possibility to generate their own power through installing solar panels at individual residential units. The project, to be implemented together with the Ministry of Ecology, Spatial and Urban Planning,
46 https://www.epcg.com/media-centar/saopstenja-za-javnost/solarni-paneli-na-3000-kutsha-i-400-novih-radnih-mjesta.

110
includes the instalment of solar panels in 3,000 individual residential units suitable for harnessing solar power. The project focuses on renewable power generation allowing individuals to use renewable zero-emission energy under the most advantageous terms.
Assumptions There were several financial incentives for citizens, with the following results:
• MONTESOL – 838 m2 of solar water heater collectors, there is an estimated 640 kWh/m2 of energy savings, they are changing electric boilers (a correction factor of 2.5 for electricity was used)
• ENERGY WOOD – 1,010 projects, average efficiency of the heating system 66% before, and 81.2% after, heated space 185 m2
• SOLAR COTTAGES – 243 small PV systems
• ENERGY-EFFICIENT HOME – 93 projects
• Solar water heater – 600 installations of 4 m2 in 2020
Risks None
Steps taken Funding for continued EE measures in 2021 and 2022 provided by the Government of Slovenia
Steps envisaged Ensure continued funding for the EE measures beyond 2022
Implementing entity The Eco Fund, the Ministry for Capital Investments
Contribution to the achievement of SDGs
3. Good Health and Wellbeing 7. Affordable and Clean Energy 9. Industry, Innovation and Infrastructure 11. Sustainable Cities and Communities 12. Responsible Consumption and Production 13. Climate Action
Number/ID 9E
Name Energy labelling and eco design requirements for energy-related products
Objective Reducing energy consumption by most consumer electric devices and solid fuel-powered heating devices used both in the residential, commercial and public sectors
Sector/category 1A4 Other sectors
Relevant plan, legal and regulatory act
National Energy Efficiency Action Plan 2019–2021, EBRD/REEP PLUS Study to assess readiness for marketing selected products and selection of products for drafting eco-design requirements
Scenario WEM/WAM
Gas CO2
Timeframe 2022–2030
Cost estimate €130 m
Source of financing Legislative costs are negligible, but buyers will incur additional costs when purchasing new devices. Part of the costs can be offset by energy savings.
Progress indicator(s) CO2 emission reduction/year, reduced energy consumption
Projection/2030 Annual CO2 emission reduction of 11 Gg over the period 2022–2030
Additional impacts Less air pollution, reduced environmental impact, new (green) job generation, energy savings, new technologies
Description The energy labelling and eco design requirements reflect the approximation of the EU’s directives/regulations for energy-related products for the Montenegrin context. The energy labelling legal provisions require that economic operators provide customers with information about the energy consumption of the devices. The eco-design requirements set the minimum energy efficiency standards (and in some cases pollution standards) for a number of products, meaning that if they do not meet these standards they cannot be put on the market. These two areas of regulatory intervention choices depending on the energy efficiency of the devices available on the market.
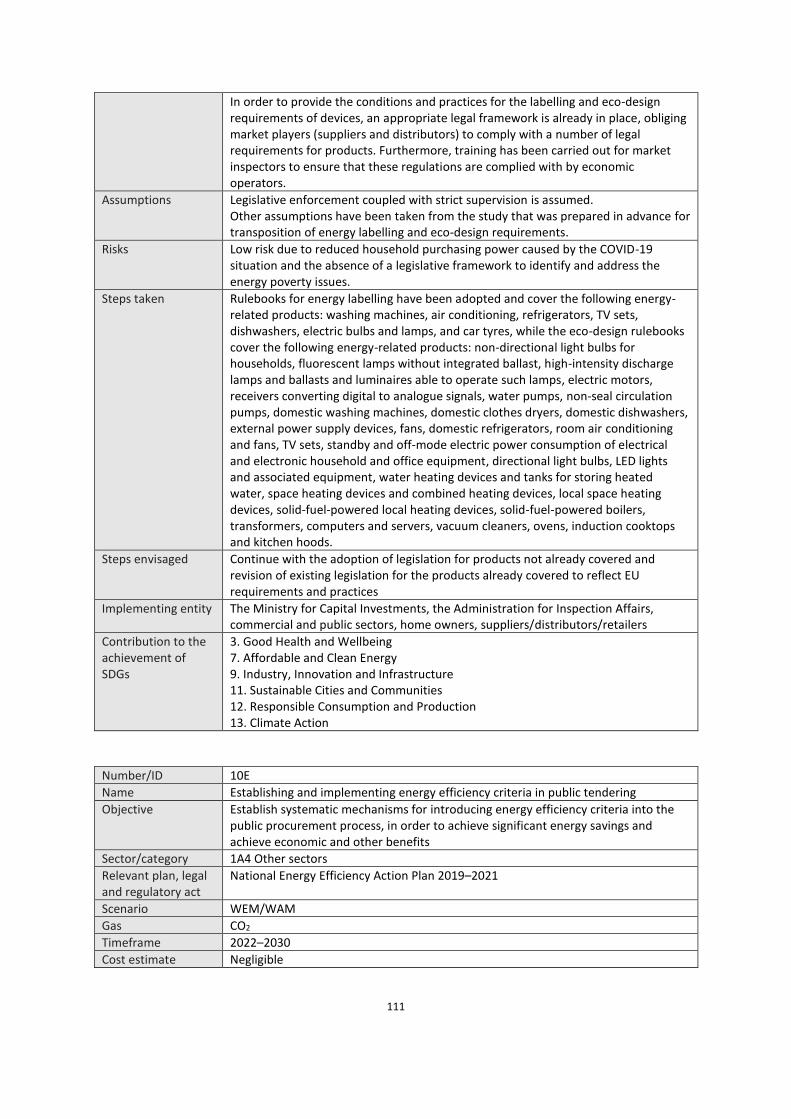
111
In order to provide the conditions and practices for the labelling and eco-design requirements of devices, an appropriate legal framework is already in place, obliging market players (suppliers and distributors) to comply with a number of legal requirements for products. Furthermore, training has been carried out for market inspectors to ensure that these regulations are complied with by economic operators.
Assumptions Legislative enforcement coupled with strict supervision is assumed. Other assumptions have been taken from the study that was prepared in advance for transposition of energy labelling and eco-design requirements.
Risks Low risk due to reduced household purchasing power caused by the COVID-19 situation and the absence of a legislative framework to identify and address the energy poverty issues.
Steps taken Rulebooks for energy labelling have been adopted and cover the following energy-related products: washing machines, air conditioning, refrigerators, TV sets, dishwashers, electric bulbs and lamps, and car tyres, while the eco-design rulebooks cover the following energy-related products: non-directional light bulbs for households, fluorescent lamps without integrated ballast, high-intensity discharge lamps and ballasts and luminaires able to operate such lamps, electric motors, receivers converting digital to analogue signals, water pumps, non-seal circulation pumps, domestic washing machines, domestic clothes dryers, domestic dishwashers, external power supply devices, fans, domestic refrigerators, room air conditioning and fans, TV sets, standby and off-mode electric power consumption of electrical and electronic household and office equipment, directional light bulbs, LED lights and associated equipment, water heating devices and tanks for storing heated water, space heating devices and combined heating devices, local space heating devices, solid-fuel-powered local heating devices, solid-fuel-powered boilers, transformers, computers and servers, vacuum cleaners, ovens, induction cooktops and kitchen hoods.
Steps envisaged Continue with the adoption of legislation for products not already covered and revision of existing legislation for the products already covered to reflect EU requirements and practices
Implementing entity The Ministry for Capital Investments, the Administration for Inspection Affairs, commercial and public sectors, home owners, suppliers/distributors/retailers
Contribution to the achievement of SDGs
3. Good Health and Wellbeing 7. Affordable and Clean Energy 9. Industry, Innovation and Infrastructure 11. Sustainable Cities and Communities 12. Responsible Consumption and Production 13. Climate Action
Number/ID 10E
Name Establishing and implementing energy efficiency criteria in public tendering
Objective Establish systematic mechanisms for introducing energy efficiency criteria into the public procurement process, in order to achieve significant energy savings and achieve economic and other benefits
Sector/category 1A4 Other sectors
Relevant plan, legal and regulatory act
National Energy Efficiency Action Plan 2019–2021
Scenario WEM/WAM
Gas CO2
Timeframe 2022–2030
Cost estimate Negligible
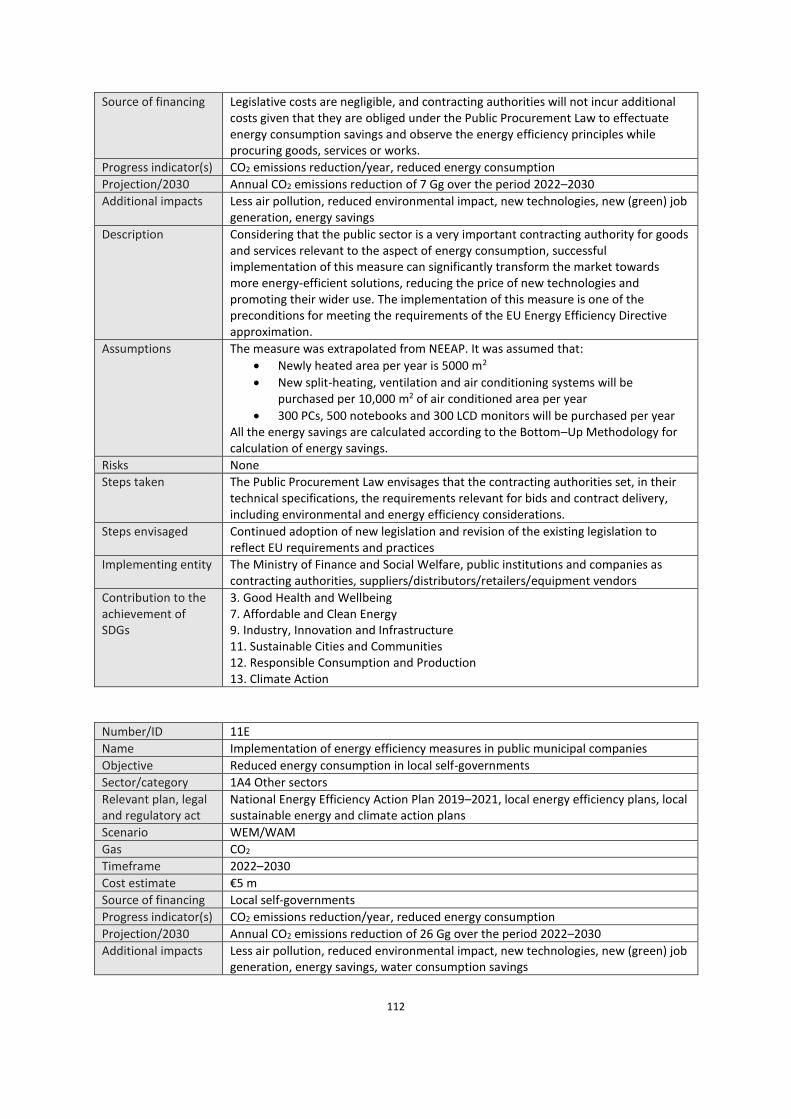
112
Source of financing Legislative costs are negligible, and contracting authorities will not incur additional costs given that they are obliged under the Public Procurement Law to effectuate energy consumption savings and observe the energy efficiency principles while procuring goods, services or works.
Progress indicator(s) CO2 emissions reduction/year, reduced energy consumption
Projection/2030 Annual CO2 emissions reduction of 7 Gg over the period 2022–2030
Additional impacts Less air pollution, reduced environmental impact, new technologies, new (green) job generation, energy savings
Description Considering that the public sector is a very important contracting authority for goods and services relevant to the aspect of energy consumption, successful implementation of this measure can significantly transform the market towards more energy-efficient solutions, reducing the price of new technologies and promoting their wider use. The implementation of this measure is one of the preconditions for meeting the requirements of the EU Energy Efficiency Directive approximation.
Assumptions The measure was extrapolated from NEEAP. It was assumed that:
• Newly heated area per year is 5000 m2
• New split-heating, ventilation and air conditioning systems will be purchased per 10,000 m2 of air conditioned area per year
• 300 PCs, 500 notebooks and 300 LCD monitors will be purchased per year All the energy savings are calculated according to the Bottom–Up Methodology for calculation of energy savings.
Risks None
Steps taken The Public Procurement Law envisages that the contracting authorities set, in their technical specifications, the requirements relevant for bids and contract delivery, including environmental and energy efficiency considerations.
Steps envisaged Continued adoption of new legislation and revision of the existing legislation to reflect EU requirements and practices
Implementing entity The Ministry of Finance and Social Welfare, public institutions and companies as contracting authorities, suppliers/distributors/retailers/equipment vendors
Contribution to the achievement of SDGs
3. Good Health and Wellbeing 7. Affordable and Clean Energy 9. Industry, Innovation and Infrastructure 11. Sustainable Cities and Communities 12. Responsible Consumption and Production 13. Climate Action
Number/ID 11E
Name Implementation of energy efficiency measures in public municipal companies
Objective Reduced energy consumption in local self-governments
Sector/category 1A4 Other sectors
Relevant plan, legal and regulatory act
National Energy Efficiency Action Plan 2019–2021, local energy efficiency plans, local sustainable energy and climate action plans
Scenario WEM/WAM
Gas CO2
Timeframe 2022–2030
Cost estimate €5 m
Source of financing Local self-governments
Progress indicator(s) CO2 emissions reduction/year, reduced energy consumption
Projection/2030 Annual CO2 emissions reduction of 26 Gg over the period 2022–2030
Additional impacts Less air pollution, reduced environmental impact, new technologies, new (green) job generation, energy savings, water consumption savings

113
Description Under the Law on Efficient Energy Use, local self-governments are obliged to develop three-year local Energy Efficiency Programmes to include: - The adaptation and maintenance plans for buildings used by local
administration bodies and public services founded by local self-governments, aimed at making them more energy efficient;
- Plans to make municipal service delivery (public lighting, water supply, waste management, etc.) and transport more energy-efficient;
- Specific energy efficiency measures for buildings listed as cultural property, etc.; - Other energy efficiency measures to be implemented within their territories. This measure accounts for the improvement of condition, monitoring, and maintenance, as well as investments in order to improve energy efficiency related to: • Public lighting; • Water supply and sewerage; • Other utilities.
Assumptions In 2014, public lighting in Montenegro consumed about 45.3 GWh of electricity at about 80,000 lighting sites. By replacing public lighting fixtures, the installed power is usually reduced by 100–150 W per lighting location, which, assuming an annual number of operating hours of 3,800, produces annual final energy savings of 380 kWh per lighting location. In this case, the basic principle will be applied, which is to multiply the electricity savings by a factor of 2.5. According to the plan, by 2018 public lighting was to be improved in 50% of lighting locations. However, as the level of implementation of this measure in the period before 2018 was not at the planned level, it was assumed that it will be achieved by 2020, and the rest of the public lighting will be replaced by 2023.
Risks Low risk concerning investments and funding due to the COVID-19 pandemic
Steps taken Pursuant to their respective Energy Efficiency Programmes, several municipalities have already implemented various energy efficiency measures. Public lighting has been replaced in some municipalities. All local Energy Efficiency Programmes envisage such a measure since it is cost-effective and easy to implement.
Steps envisaged Continued adoption of local Energy Efficiency Programmes and their implementation
Implementing entity The Ministry for Capital Investments, local self-governments
Contribution to the achievement of SDGs
3. Good Health and Wellbeing 7. Affordable and Clean Energy 9. Industry, Innovation and Infrastructure 11. Sustainable Cities and Communities 12. Responsible Consumption and Production 13. Climate Action
Number/ID 12E
Name Development of a transmission and distribution power grid
Objective Decrease of losses in transmission and distribution power grid
Sector/category 1A1 Energy industries
Relevant plan, legal and regulatory act
National Energy Efficiency Action Plan 2019–2021, the Development Plan for the Power Transmission System 2020–2029, the Development Plan for the Power Distribution System 2020–2029.
Scenario WEM/WAM
Gas CO2
Timeframe 2022–2030
Cost estimate €640 m
Source of financing Transmission and distribution operators
Progress indicator(s) CO2 emissions reduction/year, reduced energy consumption
Projection/2030 Annual CO2 emissions reduction of 37 Gg over the period 2022–2030

114
Additional impacts Less GHG emissions, new investments, new (green) job generation, energy savings, greater uptake of renewable energy sources
Description Montenegrin grid operators are obliged to invest in the grid in order to accommodate new consumers and power plants. This will result in reduced grid electricity losses. In their development plans, grid operators set energy efficiency targets, and envisage specific energy efficiency measures and investments in grid infrastructure towards reducing electricity losses. This achieves multiple benefits: energy savings, reduced costs for grid users, power surplus that can be exported, etc.
Assumptions The implementation of grid development plans 2020–2029. The data regarding energy savings is taken from the 10-year grid development plans of transmission and distribution companies. The losses share in the base year was 2.3% for the transmission grid, and 8.64% for the distribution grid, which amounts to 460 GWh. Consumption, i.e. the energy flow through the grid, will rise throughout the planned period, which will lead to a rise in losses, but due to measures from development plan the share of the losses within the energy supplied to users will decrease. It is estimated that the decrease of losses will amount to 158 GWh at the end of planned period.
Risks Low risk concerning investments and funding for grid operators due to the COVID-19 pandemic
Steps taken 2020–2029 Development Plans adopted, investments launched
Steps envisaged Update of 2020–2029 Development Plans to reflect EU requirements and practices
Implementing entity The Ministry for Capital Investments, grid operators
Contribution to the achievement of SDGs
3. Good Health and Wellbeing 7. Affordable and Clean Energy 9. Industry, Innovation and Infrastructure 11. Sustainable Cities and Communities 12. Responsible Consumption and Production 13. Climate Action
Number/ID 13E
Name Refurbishment of small hydroelectric power plants (increased EE)
Objective Increased output from the existing small hydroelectric power plants
Sector/category 1A1 Energy industries
Relevant plan, legal and regulatory act
National Energy Efficiency Action Plan 2019–2021, Energy Strategy by 2030, Action Plan2016–2020, the Energy Community Policy Guidelines on Small Hydropower, the Energy Community Policy Guidelines on Grid Integration of Prosumers
Scenario WEM/WAM
Gas CO2
Timeframe 2022–2023
Cost estimate €3.25 m
Source of financing EPCG
Progress indicator(s) CO2 emissions reduction/year, reduced energy consumption
Projection/2030 Annual CO2 emissions reduction of 2 Gg over the period 2022–2030
Additional impacts Less air pollution, reduced environmental impact, new technologies, reduced electricity import, energy savings, increased generation from renewable sources
Description Given numerous environmental and socio-economic impacts of small hydroelectric power plants, as proven by the existing examples of small hydroelectric plants built over the last 10 years, apart from the need for their thorough refurbishment to increase their operational reliability and energy efficiency, the integral environmental protection principles should be applied in early planning stages to minimize the risks for the environment and for communities.

115
The operating life of all EPCG-owned hydroelectric power plants: Piva HPP and Perućica HPP, and the small HPPs: Rijeka Crnojevića, Podgor, Šavnik, Mušovića Rijeka, and Lijeva Rijeka, is over 50 years. EPCG and the Norwegian company NTE completed the reconstruction and upgrade of small HPP Slap Zete and Glava Zete, investment worth approx. €8 m. In technical terms, the result of the investment was increased output of 30%. The average output before the reconstruction was 14.6 GWh, while now it stands at 20.5 GWh, effectuated through increased efficiency of the turbine assembly and the generators. The reconstruction also involved the introduction of state-of-the-art wastewater treatment technology, towards meeting current environmental requirements. The remaining small HPPs involved have been operating for many years now without new investments. Their total installed capacity is in the range of 2.5 MW and design annual output of 5.5 GWh, characterized by poor utilization of the available hydro resources and in need of replacement and modernization of electro-mechanical plant and equipment. Better hydroelectric power plant efficiency, maximizing the use of hydro resources, and higher levels of automation and remote operation are the project’s general goals, while the specific project outputs include: - Increased operating life; - Ensuring high operational readiness and safety; - Automated controls of generators, devices and the plant overall; - Making remote management from the control centre possible; - Highly reliable power supply; - Reduced operational and maintenance costs;
- - Better safety of the plant and staff.
Assumptions Project funding provided
Risks None
Steps taken The project documentation for the reconstruction of five small HPPs (Rijeka Crnojevića, Podgor, Lijeva Rijeka, Šavnik and Rijeka Mušovića) completed.
Steps envisaged Prepare the technical documentation (main design, as-built design, equipment and plant maintenance design/instruction), construction works, the purchase, assembly, test runs and putting into operation the electrical-mechanical and hydro-mechanical equipment
Implementing entity EPCG
Contribution to the achievement of SDGs
3. Good Health and Wellbeing 7. Affordable and Clean Energy 9. Industry, Innovation and Infrastructure 11. Sustainable Cities and Communities 12. Responsible Consumption and Production 13. Climate Action
Number/ID 14E
Name New renewable power plants
Objective Increase the share of power generated from renewable sources
Sector/category 1A1 Energy industries
Relevant plan, legal and regulatory act
Energy Strategy by 2030; Action Plan 2016–2020
Scenario WAM
Gas CO2
Timeframe 2024–2030
Cost estimate €764 m
Source of financing EPCG
Progress indicator(s) CO2 emissions reduction/year, reduced energy consumption

116
Projection/2030 Annual CO2 emissions reduction of 192 Gg over the period 2022–2030
Additional impacts Less air, water and soil pollution; new investments; energy mix; reduced electricity imports and increased exports; financial gains from both large-scale investments and sale of power; increased share of renewables in the energy mix; reduced grid losses
Description According to the existing technical documentation of EPCG, the hydroelectric power system on the River Morača includes four plants: Andrijevo HP, Raslovići HPP, Milunovići HPP and Zlatica HPP, of a total installed capacity of 238 MW and estimated average annual output of 694 GWh. The estimated construction period for all four HPPs is six years, with total investment of some €540 m. Such large investment costs have prevented project implementation until now. As regards the River Morača HPPs, one tender launched in 2011 was cancelled for lack of bids. In 2019 the Chinese company Norinco approached the government with a technical and commercial offer to build eight cascade hydroelectric power plants on the Morača. The Plan for the Morača Basin envisages the construction of eight plants, five of them on the River Morača, and three on its tributaries. The total installed capacity for all plants is 293.6 MW, and the annual output 894.82 GWh. Environmental organizations have called on the government to abolish the idea of building hydroelectric power plants on the Morača and to exclude them from any further energy plans due to their potential adverse impact on nature and communities. As regards the Velje Brdo SPP, the tendering process and leasing of land for building the solar power plant are currently in the planning stage. The spatial plans envisage the construction of a 50 MW solar power plant at Velje Brdo, but the site has much bigger potential for solar power utilization in the range of 150 to 300 MW. The introduction of biomass-powered (wood chip, pellet and briquette) district heating systems in 10 municipalities in the northern region is planned in line with the findings of a study for using biomass in district heating systems. Based on the previous Feasibility Study, done during Phase 1 for the 10 municipalities, five municipalities were selected for which detailed feasibility studies were prepared. The Feasibility Study for Kolašin identified the option of a co-generation plant of installed capacity of 2.7 MWth (heat power) and 0.6 MWel (electric power), with average annual output of 5.4 GWhth and 4.9 GWhel as the most cost-effective one. In the case of Nikšić, the optimal option is a wood-chip-powered boiler with an installed capacity of 16 MWth and an average annual output of 41 GWhth. The Feasibility Study for Bijelo Polje proposed a cogeneration wood-chip-powered plant of 11 MWth and 5 MWel, with an average annual output of 28 GWhth and 37 GWhel. The Feasibility Study for Rožaje proposed a cogeneration wood-chip-powered plant of 4.1 MWth and 1.5 MWel, with an average annual output of 10.7 GWhth and 11.7 GWhel. In the case of Žabljak, the option identified as optimal involves a wood-chip-powered boiler with an installed capacity of 1.4 MWth and with average annual output of 8.9 GWhth.
Assumptions -
Risks High risk due to large investments and investor reliability, and due to public refusal of Morača HPPs. High risk concerning district heating systems given the need for local investments.
Steps taken The technical documentation for Morača HPPs completed. Feasibility Studies for district heating systems completed.
Steps envisaged -
Implementing entity The Ministry for Capital Investments, private investors, local self-governments
Contribution to the achievement of SDGs
3. Good Health and Wellbeing 7. Affordable and Clean Energy 9. Industry, Innovation and Infrastructure 11. Sustainable Cities and Communities 12. Responsible Consumption and Production 13. Climate Action

117
Number/ID 15E
Name Electric cars – realistic scenario
Objective E-car uptake
Sector/category 1A3 Transport
Relevant plan, legal and regulatory act
Cost-benefit analysis of the e-mobility concept in Montenegro – EIHP case studies (09/2019)
Scenario WEM/WAM
Gas CO2
Timeframe 2025–2030
Cost estimate €379.2 m
Source of financing Central government, local self-governments, commercial sector and individuals
Progress indicator(s) CO2 emissions reduction/year, reduced energy consumption
Projection/2030 Annual CO2 emissions reduction of 49 Gg over the period 2022–2030
Additional impacts Reduced GHG and local pollutant emissions, increased employment, generation of new (green) jobs, lesser dependence on fossil fuel imports, new investments, new infrastructure
Description The transport sector is characterized by a progressive increase in the number of registered vehicles, with parallel aging of the fleet. Road transport is predominant, the share of public transport is very low and almost exclusively fossil-fuel dependent. The current state of the vehicle fleet in the country is well illustrated by the fact that in 2018 there were 240,611 registered vehicles with an average age of 16 years. Urban cores are struggling with congestion, leading to air pollution due to vehicle emissions and noise pollution. With an increasing standard of living and further development of road infrastructure, a significant increase in the number of road vehicles is expected. The more prevalent use of electric vehicles can be a solution to the problem. A precondition for that is the establishment and uptake of e-mobility as a comprehensive socio-technical system. For e-vehicles to be competitive with traditional internal combustion vehicles, a whole range of elements required for e-mobility need to be put in place, such as standards, regulatory frameworks, energy and environment policies, set practices, products and services, user experience and needs, and a charging station infrastructure.
Assumptions The number of e-cars to increase from 1,419, or 0.6% of the total fleet in 2025 to 12,674, or 5.0% of the total fleet in 2030.
Risks Moderate risk due to high costs associated with the purchase of e-vehicles, both for private owners, and the public and commercial sectors
Steps taken Towards developing e-mobility in Montenegro, UNDP in cooperation with the Energy Institute Hrvoje Požar, Zagreb (Croatia) prepared four extensive studies in 2019
Steps envisaged Adopt the legislative and policy frameworks for e-mobility and build charging station infrastructure.
Implementing entity The Ministry for Capital Investments, local self-governments, commercial sector, public sector, private citizens, e-vehicle importers and vendors
Contribution to the achievement of SDGs
3. Good Health and Wellbeing 7. Affordable and Clean Energy 9. Industry, Innovation and Infrastructure 11. Sustainable Cities and Communities 12. Responsible Consumption and Production 13. Climate Action
Number/ID 16E
Name Financial incentives for electric, plug-in and hybrid vehicles for private citizens and businesses/entrepreneurs

118
Objective Purchase of eco-friendly transportation means
Sector/category 1A3 Transport
Relevant plan, legal and regulatory act
Cost-benefit analysis of the e-mobility concept in Montenegro – EIHP case studies (09/2019)
Scenario WEM/WAM
Gas CO2
Timeframe 2022–2030
Cost estimate €0.9 m
Source of financing The Eco Fund/Slovenian Government’s donation/other international donors
Progress indicator(s) CO2 emissions reduction/year, reduced energy consumption
Projection/2030 Annual CO2 emissions reduction of 2 Gg over the period 2022–2030
Additional impacts Reduced GHG and local pollutant emissions, increased employment, generation of new (green) jobs, lesser dependence on fossil fuel imports, new investments, new infrastructure
Description Financial incentives for e-mobility usually include incentives to invest in e-vehicles and/or developing a charging station infrastructure or tax policy measures favouring e-vehicles. In case of passenger vehicles, motor vehicle tax is paid annually according to physical volume of a vehicle. It is payable by corporate and individual owners of registered e-vehicles, and this tax relief is the only currently existing incentive for e-vehicles and e-mobility in Montenegro. The establishment of the Environmental Protection Fund (the Eco Fund) is a major step towards launching incentives for e-mobility. The Eco Fund funding is envisaged to be used, inter alia, to foster cleaner transport and the use of alternative fuels. The Eco Fund’s first financial incentive refers to e-mobility. The Eco Fund lunched a subsidy programme for electric, plug-in and self-charging hybrid vehicles for private and corporate owners. The total value of grants extended for the purchase of electric and hybrid vehicles (M1 category) amounts to €100,000, with €50,000 intended for the purchase of electric vehicles, and the remaining €50,000 for hybrid vehicles. To preserve, ensure sustainable use, protect and upgrade the environment, energy efficiency and the use of renewable sources, it is important to foster the use of green vehicles. Co-financing the purchase of electric and hybrid vehicles has a direct impact on better air quality, reducing GHG emissions from road transport, and decreasing the sources of air pollution. The subsidies provided by the Eco Fund are as follows: - electric vehicles – €5,000; - plug-in vehicles – €2,500; - hybrid vehicles – €2,500. The Eco Fund subsidies are available to private citizens for the purchase of one vehicle only, and in case of legal entities and entrepreneurs for the purchase of maximum two vehicles.
Assumptions It was assumed that electric vehicles will replace diesel-powered vehicles. The number of electric vehicles will rise from 200 in the base year up to 12,674 (medium scenario from the study that deals with electric mobility in Montenegro). The average annual distance travelled by car is estimated as 10,000 km, and the average consumption for diesel vehicles is estimated as 7 l per 100 km, and for electric vehicles 16 kWh per 100 km.
Risks Moderate risk due to high costs associated with the purchase of e-vehicles, both for private owners, and the public and commercial sectors
Steps taken Towards developing e-mobility in Montenegro, UNDP in cooperation with the Energy Institute Hrvoje Požar, Zagreb (Croatia) prepared four extensive studies in 2019
Steps envisaged Adopt the legislative and policy frameworks for e-mobility and build charging station infrastructure.
Implementing entity The Ministry for Capital Investments, local self-governments, commercial sector, public sector, private citizens, e-vehicle importers and vendors

119
Contribution to the achievement of SDGs
3. Good Health and Wellbeing 7. Affordable and Clean Energy 9. Industry, Innovation and Infrastructure 11. Sustainable Cities and Communities 12. Responsible Consumption and Production 13. Climate Action
Number/ID 17E
Name Electric cars – ambitious scenario
Objective E-car uptake
Sector/category 1A3 Transport
Relevant plan, legal and regulatory act
Cost-benefit analysis of the e-mobility concept in Montenegro – EIHP case studies (09/2019)
Scenario WAM
Gas CO2
Timeframe 2025–2030
Cost estimate €241 m
Source of financing Central government, local self-governments, commercial sector and members of the public
Progress indicator(s) CO2 emissions reduction/year, reduced energy consumption
Projection/2030 Annual CO2 emissions reduction of 42 Gg over the period 2025–2030
Additional impacts Reduced GHG and local pollutant emissions, increased employment, generation of new (green) jobs, lesser dependence on fossil fuel imports, new investments, new infrastructure
Description The transport sector is characterized by a progressive increase in the number of registered vehicles, with parallel aging of the fleet. Road transport is predominant, the share of public transport is very low and almost exclusively fossil-fuel dependent. The current state of the vehicle fleet in the country is well illustrated by the fact that in 2018 there were 240,611 registered vehicles with an average age of 16 years. Urban cores are struggling with congestion, leading to air pollution due to vehicle emissions and noise pollution. With an increasing standard of living and further development of the road infrastructure, a significant increase in the number of road vehicles is expected. The more prevalent use of electric vehicles can be a solution to the problem. A precondition for that is the establishment and uptake of e-mobility as a comprehensive socio-technical system. For e-vehicles to be competitive with the traditional internal combustion vehicles, a whole range of elements required for e-mobility need to be put in place, such as standards, regulatory frameworks, energy and environment policies, set practices, products and services, user experience and needs, and charging station infrastructure.
Assumptions The number of e-cars to increase from 1,419, or 0.6% of the total fleet in 2025 to 12,674, or 5.0% of the total fleet in 2030.
Risks Moderate risk due to high costs associated with the purchase of e-vehicles, both for private owners, and the public and commercial sectors
Steps taken Towards developing e-mobility in Montenegro, UNDP in cooperation with the Energy Institute Hrvoje Požar, Zagreb (Croatia) prepared four extensive studies in 2019
Steps envisaged Adopt the legislative and policy frameworks for e-mobility and build a charging station infrastructure.
Implementing entity The Ministry for Capital Investments, local self-governments, commercial sector, public sector, private citizens, e-vehicle importers and vendors
Contribution to the achievement of SDGs
3. Good Health and Wellbeing 7. Affordable and Clean Energy 9. Industry, Innovation and Infrastructure 11. Sustainable Cities and Communities

120
12. Responsible Consumption and Production 13. Climate Action
Number/ID 1I
Name KAP: electrolysis cells replacement and overhaul
Objective Reduce the anode effect duration to reduce industrial GHG emissions, modernization of production
Sector/category 2C Metals industry
Relevant plan, legal and regulatory act
KAP Investment Plan
Scenario WEM/WAM
Gas PFC
Timeframe 2022–2025
Cost estimate €26 m
Source of financing KAP
Progress indicator(s) PFC emission reduction/year
Projection/2030 Annual PFC emission reduction of 494 Gg over the period 2022–2025
Additional impacts New investments, better product quality
Description In the KAP electrolysis plant, currently 153 out of the 264 cells are in operation, with six of them being of ADG type (with punching and spot dosing of alumina and AlF3) with spot dosing of alumina leading to reduced F-gas emissions, while the remaining cells have to be either overhauled or replaced by 2024, when the electrolysis plant will achieve full capacity of liquid metal production (65,000 t), while the current production stands at 38,000 t. The KAP Development Plan considers technological improvements on electrolysis cells with a view to increasing output and providing better quality product. Starting from 2019, only two energy sources: electricity and liquefied natural gas (LNG) are used in the facility’s technological processes.
Assumptions Funding provided
Risks Moderate due to high investment costs
Steps taken 153 cells replaced or overhauled
Steps envisaged The replacement or overhaul of the remaining cells envisaged
Implementing entity KAP
Contribution to the achievement of SDGs
9. Industry, Innovation and Infrastructure 12. Responsible Consumption and Production 13. Climate Action
Number/ID 2I
Name GHG emission price for KAP
Objective Reduce industrial GHG emissions
Sector/category 2C Metals industry
Relevant plan, legal and regulatory act
The Decree on activities resulting in GHG emissions and requiring GHG permits in force since February 2020, currently being updated, the EU Carbon Border Adjustment Mechanism (CBAM), in force from the beginning of 2023, and the EU Emissions Trading System (EU ETS), in force from the day of the EU accession
Scenario WEM/WAM
Gas PFC, CO2
Timeframe 2022–2030
Cost estimate Negligible costs associated with legislative developments, major costs for the KAP operator
Source of financing Budget, KAP
Progress indicator(s) PFC/CO2 emission reduction/year
Projection/2030 Annual CO2 emissions reduction of 18 Gg over the period 2022–2030

121
Additional impacts Less air pollution, financial benefits for investing in renewables and energy efficiency
Description The Decree on activities resulting in GHG emissions and requiring GHG permits limits the industrial and power facilities emissions by introducing a national emissions trading system. Moreover, GHG emitters will face further burdens from 2023 onwards due to the new EU Carbon Border Adjustment Mechanism (CBAM). CBAM, also known as the carbon tax, will cover all product and commodity imports covered by the EU Emissions Trading System (EU ETS). The CBAM is in line with the European Green Deal, thus, the CBAM legislative proposal needs to be drafted by the end of 2021. Finally, with EU accession, Montenegrin installations will automatically enter the EU ETS. It is noteworthy that on 5 July 2021, the EUA (European Emission Allowance) amounted to €57.87.
Assumptions 5.5% less electricity consumption per cell has been assumed, in line with the cell replacement timeline/dynamics.
Risks No risk for policy implementation
Steps taken The Decree on activities resulting in GHG emissions and requiring GHG permits in force since February 2020, currently being updated. Additionally, parts of the EU Directive concerning the EU ETS have already been transposed into the domestic legislation
Steps envisaged Drafting the CBAM legislation by the EU by the end of 2021
Implementing entity The Ministry for Ecology, Spatial and Urban Planning
Contribution to the achievement of SDGs
3. Good Health and Wellbeing
9. Industry, Innovation and Infrastructure
13. Climate Action
15. Life on Earth
Number/ID 3I
Name PFC gas capturing at the KAP Electrolysis Plant
Objective Production modernization
Sector/category 2C Metals industry
Relevant plan, legal and regulatory act
KAP Investment Plan
Scenario WAM
Gas CO2, PFC
Timeframe 2022–2030
Cost estimate €32 m
Source of financing KAP
Progress indicator(s) PFC emission reduction/year, reduced energy consumption
Projection/2030 Annual CO2 emissions reduction of 255 Gg over the period 2022–2030
Additional impacts New investments, better product quality
Description New PFC gas capturing technology (mini-capturing) is being applied to two cells during the testing phase. Such testing (also known as cell hibernation) is focused on F-gas capturing and results in almost 100% of PFCs captured and at the same time electricity consumption savings (5.5%). According to the installation business plan, they have envisaged investing in PFC capturing technology in all cells (approximately 33 cells per year), starting in 2022. In such a case, by 2030 all the cells will be covered, so zero PFCs will be emitted at the electrolysis plant.
Assumptions Funding provided
Risks High risk due to major investments required, further slowed down by the COVID-19 pandemic
Steps taken The pilot project involving two cells completed
Steps envisaged Scale-up to all cells
Implementing entity KAP
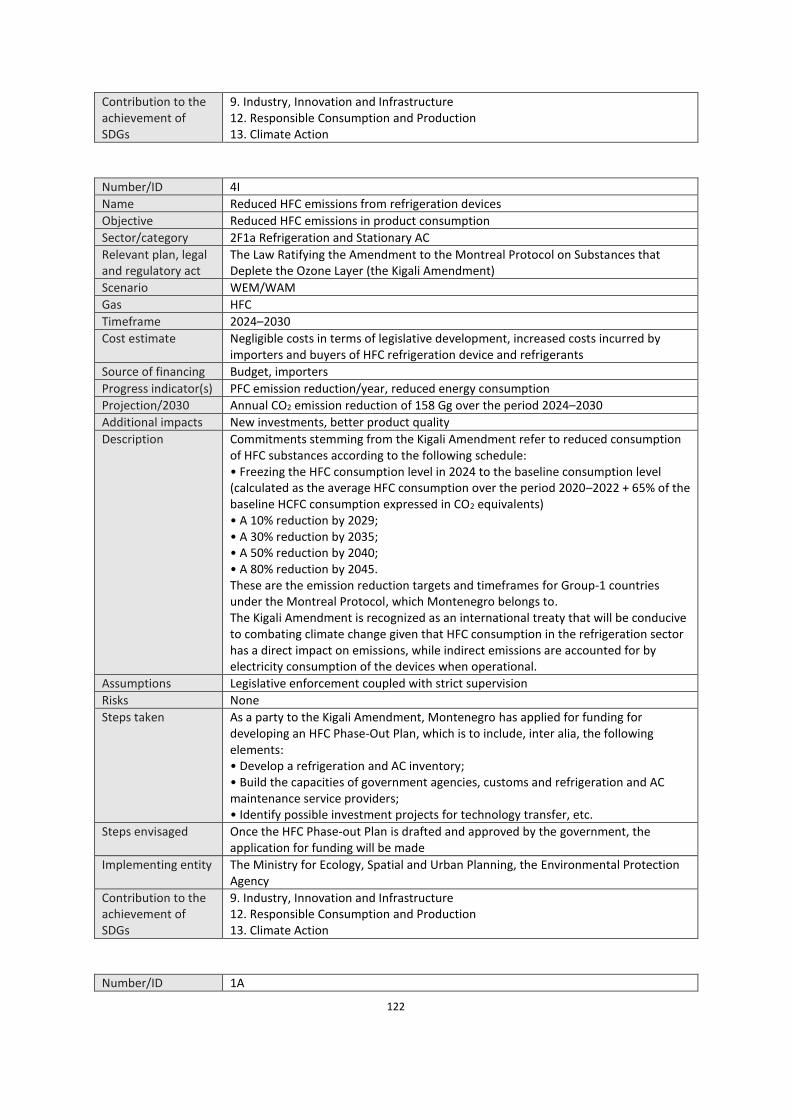
122
Contribution to the achievement of SDGs
9. Industry, Innovation and Infrastructure 12. Responsible Consumption and Production 13. Climate Action
Number/ID 4I
Name Reduced HFC emissions from refrigeration devices
Objective Reduced HFC emissions in product consumption
Sector/category 2F1a Refrigeration and Stationary AC
Relevant plan, legal and regulatory act
The Law Ratifying the Amendment to the Montreal Protocol on Substances that Deplete the Ozone Layer (the Kigali Amendment)
Scenario WEM/WAM
Gas HFC
Timeframe 2024–2030
Cost estimate Negligible costs in terms of legislative development, increased costs incurred by importers and buyers of HFC refrigeration device and refrigerants
Source of financing Budget, importers
Progress indicator(s) PFC emission reduction/year, reduced energy consumption
Projection/2030 Annual CO2 emission reduction of 158 Gg over the period 2024–2030
Additional impacts New investments, better product quality
Description Commitments stemming from the Kigali Amendment refer to reduced consumption of HFC substances according to the following schedule: • Freezing the HFC consumption level in 2024 to the baseline consumption level (calculated as the average HFC consumption over the period 2020–2022 + 65% of the baseline HCFC consumption expressed in CO2 equivalents) • A 10% reduction by 2029; • A 30% reduction by 2035; • A 50% reduction by 2040; • A 80% reduction by 2045. These are the emission reduction targets and timeframes for Group-1 countries under the Montreal Protocol, which Montenegro belongs to. The Kigali Amendment is recognized as an international treaty that will be conducive to combating climate change given that HFC consumption in the refrigeration sector has a direct impact on emissions, while indirect emissions are accounted for by electricity consumption of the devices when operational.
Assumptions Legislative enforcement coupled with strict supervision
Risks None
Steps taken As a party to the Kigali Amendment, Montenegro has applied for funding for developing an HFC Phase-Out Plan, which is to include, inter alia, the following elements: • Develop a refrigeration and AC inventory; • Build the capacities of government agencies, customs and refrigeration and AC maintenance service providers; • Identify possible investment projects for technology transfer, etc.
Steps envisaged Once the HFC Phase-out Plan is drafted and approved by the government, the application for funding will be made
Implementing entity The Ministry for Ecology, Spatial and Urban Planning, the Environmental Protection Agency
Contribution to the achievement of SDGs
9. Industry, Innovation and Infrastructure 12. Responsible Consumption and Production 13. Climate Action
Number/ID 1A
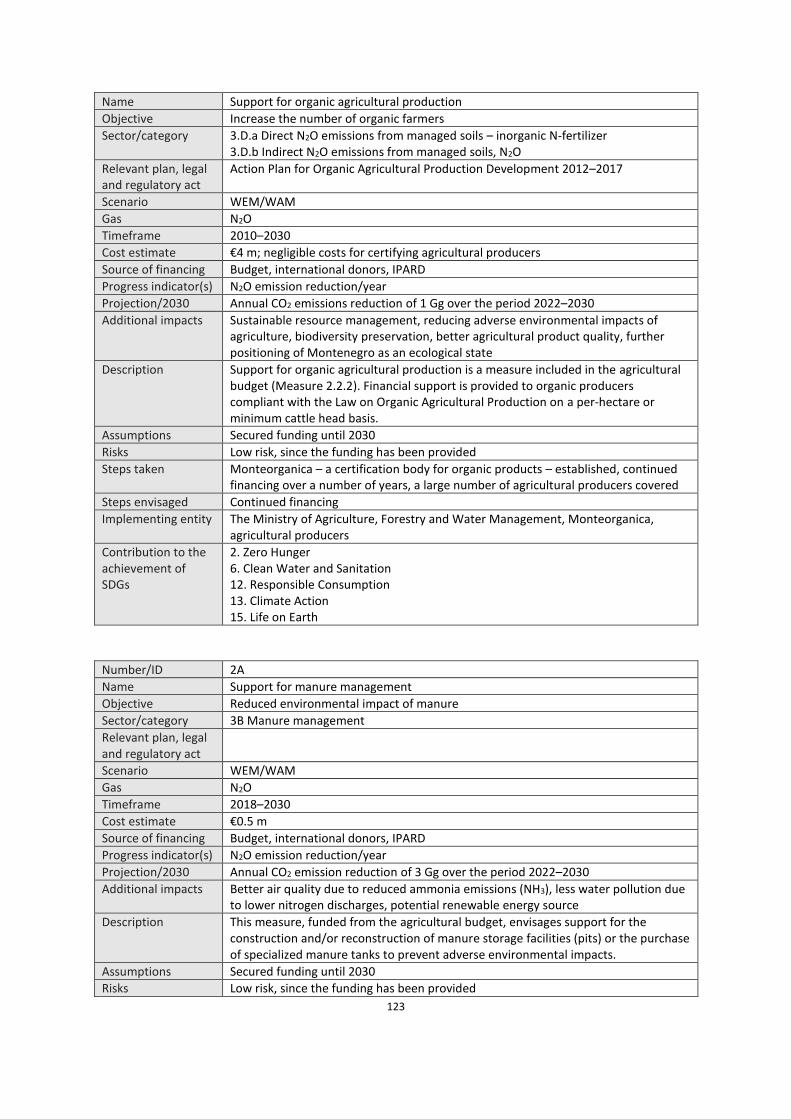
123
Name Support for organic agricultural production
Objective Increase the number of organic farmers
Sector/category 3.D.a Direct N2O emissions from managed soils – inorganic N-fertilizer 3.D.b Indirect N2O emissions from managed soils, N2O
Relevant plan, legal and regulatory act
Action Plan for Organic Agricultural Production Development 2012–2017
Scenario WEM/WAM
Gas N2O
Timeframe 2010–2030
Cost estimate €4 m; negligible costs for certifying agricultural producers
Source of financing Budget, international donors, IPARD
Progress indicator(s) N2O emission reduction/year
Projection/2030 Annual CO2 emissions reduction of 1 Gg over the period 2022–2030
Additional impacts Sustainable resource management, reducing adverse environmental impacts of agriculture, biodiversity preservation, better agricultural product quality, further positioning of Montenegro as an ecological state
Description Support for organic agricultural production is a measure included in the agricultural budget (Measure 2.2.2). Financial support is provided to organic producers compliant with the Law on Organic Agricultural Production on a per-hectare or minimum cattle head basis.
Assumptions Secured funding until 2030
Risks Low risk, since the funding has been provided
Steps taken Monteorganica – a certification body for organic products – established, continued financing over a number of years, a large number of agricultural producers covered
Steps envisaged Continued financing
Implementing entity The Ministry of Agriculture, Forestry and Water Management, Monteorganica, agricultural producers
Contribution to the achievement of SDGs
2. Zero Hunger 6. Clean Water and Sanitation 12. Responsible Consumption 13. Climate Action 15. Life on Earth
Number/ID 2A
Name Support for manure management
Objective Reduced environmental impact of manure
Sector/category 3B Manure management
Relevant plan, legal and regulatory act
Scenario WEM/WAM
Gas N2O
Timeframe 2018–2030
Cost estimate €0.5 m
Source of financing Budget, international donors, IPARD
Progress indicator(s) N2O emission reduction/year
Projection/2030 Annual CO2 emission reduction of 3 Gg over the period 2022–2030
Additional impacts Better air quality due to reduced ammonia emissions (NH3), less water pollution due to lower nitrogen discharges, potential renewable energy source
Description This measure, funded from the agricultural budget, envisages support for the construction and/or reconstruction of manure storage facilities (pits) or the purchase of specialized manure tanks to prevent adverse environmental impacts.
Assumptions Secured funding until 2030
Risks Low risk, since the funding has been provided
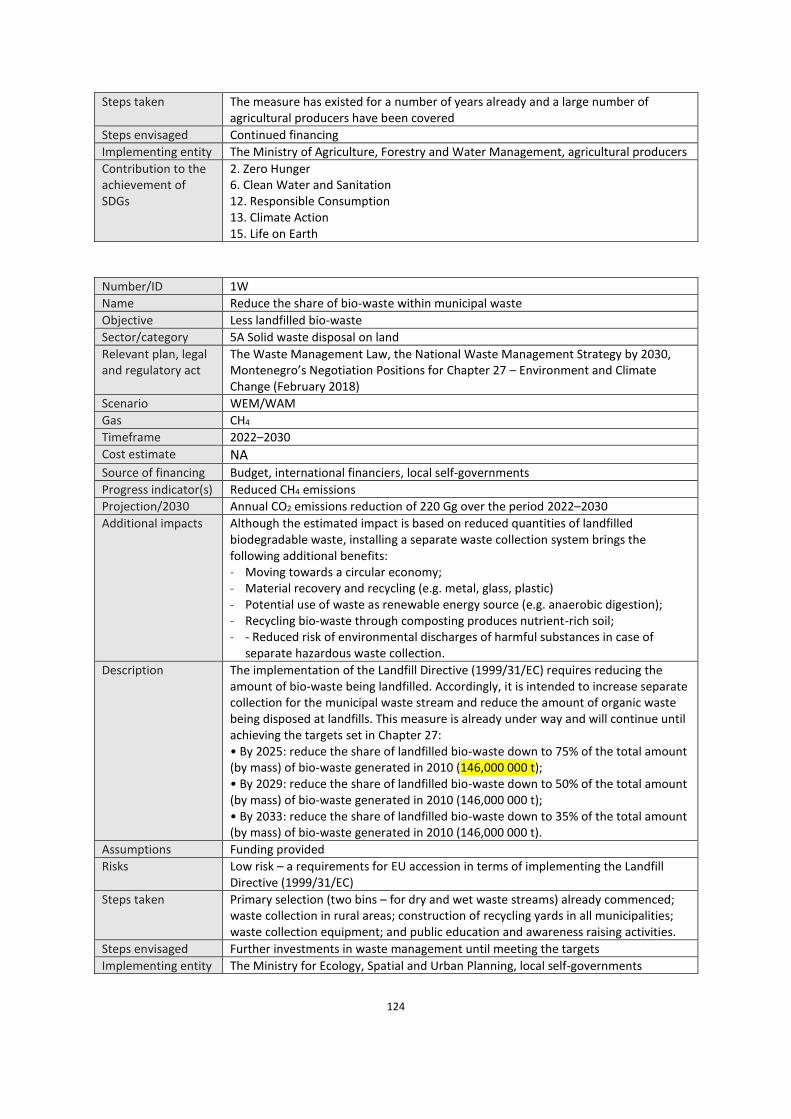
124
Steps taken The measure has existed for a number of years already and a large number of agricultural producers have been covered
Steps envisaged Continued financing
Implementing entity The Ministry of Agriculture, Forestry and Water Management, agricultural producers
Contribution to the achievement of SDGs
2. Zero Hunger 6. Clean Water and Sanitation 12. Responsible Consumption 13. Climate Action 15. Life on Earth
Number/ID 1W
Name Reduce the share of bio-waste within municipal waste
Objective Less landfilled bio-waste
Sector/category 5A Solid waste disposal on land
Relevant plan, legal and regulatory act
The Waste Management Law, the National Waste Management Strategy by 2030, Montenegro’s Negotiation Positions for Chapter 27 – Environment and Climate Change (February 2018)
Scenario WEM/WAM
Gas CH4
Timeframe 2022–2030
Cost estimate NA
Source of financing Budget, international financiers, local self-governments
Progress indicator(s) Reduced CH4 emissions
Projection/2030 Annual CO2 emissions reduction of 220 Gg over the period 2022–2030
Additional impacts Although the estimated impact is based on reduced quantities of landfilled biodegradable waste, installing a separate waste collection system brings the following additional benefits: - Moving towards a circular economy; - Material recovery and recycling (e.g. metal, glass, plastic) - Potential use of waste as renewable energy source (e.g. anaerobic digestion); - Recycling bio-waste through composting produces nutrient-rich soil; - - Reduced risk of environmental discharges of harmful substances in case of
separate hazardous waste collection.
Description The implementation of the Landfill Directive (1999/31/EC) requires reducing the amount of bio-waste being landfilled. Accordingly, it is intended to increase separate collection for the municipal waste stream and reduce the amount of organic waste being disposed at landfills. This measure is already under way and will continue until achieving the targets set in Chapter 27: • By 2025: reduce the share of landfilled bio-waste down to 75% of the total amount (by mass) of bio-waste generated in 2010 (146,000 000 t); • By 2029: reduce the share of landfilled bio-waste down to 50% of the total amount (by mass) of bio-waste generated in 2010 (146,000 000 t); • By 2033: reduce the share of landfilled bio-waste down to 35% of the total amount (by mass) of bio-waste generated in 2010 (146,000 000 t).
Assumptions Funding provided
Risks Low risk – a requirements for EU accession in terms of implementing the Landfill Directive (1999/31/EC)
Steps taken Primary selection (two bins – for dry and wet waste streams) already commenced; waste collection in rural areas; construction of recycling yards in all municipalities; waste collection equipment; and public education and awareness raising activities.
Steps envisaged Further investments in waste management until meeting the targets
Implementing entity The Ministry for Ecology, Spatial and Urban Planning, local self-governments

125
Contribution to the achievement of SDGs
11. Sustainable Cities and Communities 13. Climate Action 14. Life Below Water 15. Life on Earth
Number/ID 2W
Name Construction of systems to connect to main sewerage systems and waste water treatment plants
Objective Increased coverage by sewerage systems
Sector/category 5D1 Domestic wastewater handling
Relevant plan, legal and regulatory act
Municipal Waste Water Management Plan 2020–2035
Scenario WEM/WAM
Gas CH4
Timeframe 2022–2030
Cost estimate €553.9 m
Source of financing Budget, international financiers, local self-governments
Progress indicator(s) Reduced CH4 emissions
Projection/2030 Annual CO2 emissions reduction of 92 Gg over the period 2022–2030
Additional impacts Less pollution of the aquatic environment (reduced eutrophication), better sanitation (less harmful substances, less water-borne diseases, unpleasant smells)
Description Over the recent years the construction of systems to connect to main sewerage and wastewater treatment plants resulted in less waste water being collected in septic tanks or discharged untreated in the aquatic environment. Under Chapter 27 (February 2018), Montenegro set the target of covering 93% of population with sewerage systems by 2035, except conglomerations of under 2,000 PE which are not bound by the Urban Waste Water Treatment Directive. The remaining percentage of the population that cannot be connected to sewerage networks due to technical reasons will be handled according to the requirements for individual systems set in the Urban Waste Water Treatment Directive. Following this approach, by 2035 waste water handling will be arranged in compliance with the UWWTD in all agglomerations.
Assumptions Funding secured.
Risks The risk is assessed as low, because improvements have already been made over the last several years or are under way. The implementation of the Urban Waste Water Treatment Directive (UWWTD) is a requirement in the EU accession process.
Steps taken The construction of systems to connect to main sewerage and wastewater treatment plants has been completed or is underway in many municipalities
Steps envisaged Continue with the construction of systems to connect to main sewerage and wastewater treatment plants until reaching the target
Implementing entity The Ministry for Ecology, Spatial and Urban Planning, local self-governments
Contribution to the achievement of SDGs
3. Good Health and Wellbeing 6. Clean Water and Sanitation 13. Climate Action 14. Life Below Water

126
Annex 2: The Action Plan for WEM and WAM Scenarios
Policy/measure Scenario
Type of
measure Timeframe Status Budget
Indicative GHG emission reduction
(GgCO2eq)
Implementing body
No. Name
1E Environmental refurbishment of TPP Pljevlja
WEM/WAM Technical 2021–2022 Under way €5,445 m 600 EPCG
2E Carbon pricing for TPP Pljevlja WEM/WAM Regulatory 2022–2030 Under way - 2,124 The Ministry for Ecology, Spatial and Urban Planning
3E New renewable power plants WEM/WAM Technical 2022–2030 Under way €740 m 554 The Ministry for Capital Investments, EPCG, private investors, the Eco Fund
4E District heating in Pljevlja WEM/WAM Technical 2023–2025 Planned €23 m 44 Pljevlja Municipality, EPCG
5E Coal phase-out and ending of operations of TPP Pljevlja no later than by 2035, accompanied by timely just transition in the Pljevlja Coal Region
WAM Regulatory 2025–2030 Planned - 2,506 The Ministry for Capital Investments, the Ministry for Ecology, Spatial and Urban Planning, EPCG, the Coal Mine
6E Development and implementation of building energy efficiency regulatory framework
WEM/WAM Regulatory 2022–2030 Under way - 111 The Land and State Assets Registry Administration, the Ministry for Capital Investments, local self-governments, members of the public, private companies – commercial building owners, housing developers, public and commercial sectors
7E Increased energy efficiency in public buildings
WEM/WAM Financial 2022–2030 Under way €55.7 m 17 The Land and State Assets Registry Administration, The Ministry for Capital Investments, local self-governments
8E Financial incentives for citizens/households (for EE investments)
WEM/WAM Financial 2022–2030 Under way €3.9 m 9 The Eco Fund, The Ministry for Capital Investments
9E Energy labelling and eco-design requirements for energy-related products
WEM/WAM Regulatory 2022–2030 Under way €130 m 11 The Ministry for Capital Investments, the Administration for Inspection Affairs, commercial and public sectors, home owners, suppliers/distributors/retailers
10E Establishing and implementing energy efficiency criteria in public tendering
WEM/WAM Regulatory 2022–2030 Under way - 7 The Ministry of Finance and Social Welfare, public agencies and companies as contracting authorities, suppliers/distributors/retailers
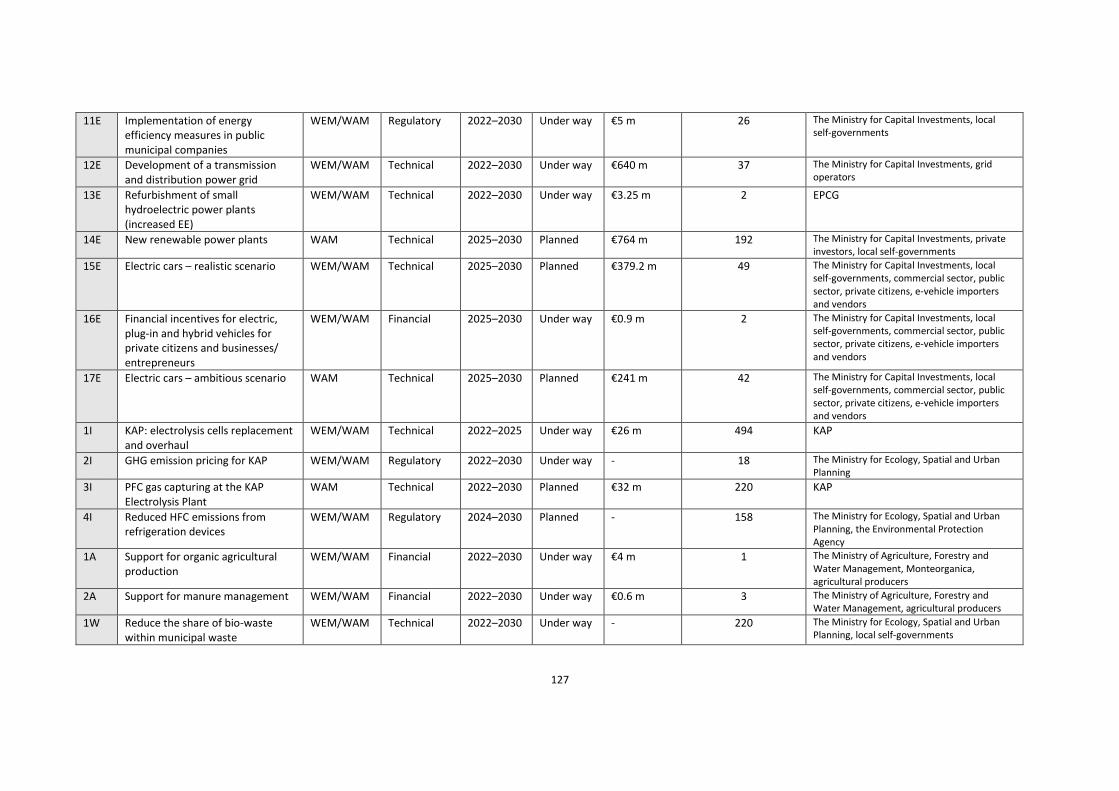
127
11E Implementation of energy efficiency measures in public municipal companies
WEM/WAM Regulatory 2022–2030 Under way €5 m 26 The Ministry for Capital Investments, local self-governments
12E Development of a transmission and distribution power grid
WEM/WAM Technical 2022–2030 Under way €640 m 37 The Ministry for Capital Investments, grid operators
13E Refurbishment of small hydroelectric power plants (increased EE)
WEM/WAM Technical 2022–2030 Under way €3.25 m 2 EPCG
14E New renewable power plants WAM Technical 2025–2030 Planned €764 m 192 The Ministry for Capital Investments, private investors, local self-governments
15E Electric cars – realistic scenario WEM/WAM Technical 2025–2030 Planned €379.2 m 49 The Ministry for Capital Investments, local self-governments, commercial sector, public sector, private citizens, e-vehicle importers and vendors
16E Financial incentives for electric, plug-in and hybrid vehicles for private citizens and businesses/entrepreneurs
WEM/WAM Financial 2025–2030 Under way €0.9 m 2 The Ministry for Capital Investments, local self-governments, commercial sector, public sector, private citizens, e-vehicle importers and vendors
17E Electric cars – ambitious scenario WAM Technical 2025–2030 Planned €241 m 42 The Ministry for Capital Investments, local self-governments, commercial sector, public sector, private citizens, e-vehicle importers and vendors
1I KAP: electrolysis cells replacement and overhaul
WEM/WAM Technical 2022–2025 Under way €26 m 494 KAP
2I GHG emission pricing for KAP WEM/WAM Regulatory 2022–2030 Under way - 18 The Ministry for Ecology, Spatial and Urban Planning
3I PFC gas capturing at the KAP Electrolysis Plant
WAM Technical 2022–2030 Planned €32 m 220 KAP
4I Reduced HFC emissions from refrigeration devices
WEM/WAM Regulatory 2024–2030 Planned - 158 The Ministry for Ecology, Spatial and Urban Planning, the Environmental Protection Agency
1A Support for organic agricultural production
WEM/WAM Financial 2022–2030 Under way €4 m 1 The Ministry of Agriculture, Forestry and Water Management, Monteorganica, agricultural producers
2A Support for manure management WEM/WAM Financial 2022–2030 Under way €0.6 m 3 The Ministry of Agriculture, Forestry and Water Management, agricultural producers
1W Reduce the share of bio-waste within municipal waste
WEM/WAM Technical 2022–2030 Under way - 220 The Ministry for Ecology, Spatial and Urban Planning, local self-governments

128
2W Construction of systems to connect to main sewerage systems and wastewater treatment plants
WEM/WAM Technical 2022–2030 Under way €553.9 m 92 The Ministry for Ecology, Spatial and Urban Planning, local self-governments

129
Annex 3: Roadmap and MRV system improvement plan TABLE 29. ROADMAP FOR THE IMPROVEMENT OF MONTENEGRO’S MRV SYSTEM
Area
Imp
rove
me
nt
ID
Improvement title
1 –
20
21
BU
R
2 –
20
22
Nat
ion
al C
ou
nci
l
3 –
20
22
An
nu
al G
HG
Inve
nto
ry
4 –
20
22
An
nu
al D
ata
Co
llect
ion
Pla
n
5 –
20
22
Lo
w-C
arb
on
De
velo
pm
en
t St
rate
gy
6 –
20
23
LU
LUC
F re
po
rtin
g
7 –
20
23
EU
Clim
ate
an
d
Ene
rgy
Un
ion
re
po
rtin
g
8 –
20
23
NA
P
9 –
20
24
NC
an
d B
TR
10
– 2
02
5/6
ND
C u
pd
ate
1 Cross-cutting
CC1.1 Mandate for National Council, working group on climate adaptation and mitigation and MRV system steering committee
CC1.2 Update of the existing rulebook for Climate Change MRV systems
CC1.3 Integrate commitments of REGULATION (EU) 2018/1999 Governance of the Energy Union and Climate Action regulation into the MRV system
CC1.4 Prepare for implementation of LULUCF regulation
CC1.5 Appoint representatives responsible for updating the MRV portal
CC2.1 Establish a National Support and Climate Finance Tracking Team
CC3.1 Develop an Annual Data Collection Plan for the MRV system
CC4.1 Establish formal QA/QC objectives and a quality system for the MRV system
CC4.2 Support the development and mainstreaming of climate considerations into sector-level strategies
CC4.3 Develop an NDC Implementation Roadmap
CC4.3.1 Additional improvements to tracking climate action
CC4.4 Map investment needs for actions versus funding sources

130
Area
Imp
rove
me
nt
ID
Improvement title
1 –
20
21
BU
R
2 –
20
22
Nat
ion
al C
ou
nci
l
3 –
20
22
An
nu
al G
HG
Inve
nto
ry
4 –
20
22
An
nu
al D
ata
Co
llect
ion
Pla
n
5 –
20
22
Lo
w-C
arb
on
De
velo
pm
en
t St
rate
gy
6 –
20
23
LU
LUC
F re
po
rtin
g
7 –
20
23
EU
Clim
ate
an
d
Ene
rgy
Un
ion
re
po
rtin
g
8 –
20
23
NA
P
9 –
20
24
NC
an
d B
TR
10
– 2
02
5/6
ND
C u
pd
ate
CC5.1 Progress tracking updates for the National Council and other national decision makers
2 Adaptation tracking
A1.1 Evaluate implementation of the ‘Law on the Protection against Adverse Impacts of Climate Change’
A1.2 Improve adaptation institutional arrangements
A2.1 Expert development, training and mentoring for MRV coordinator for adaptation
A3.1 Set up adaptation data-supply agreements
A4.1 Develop an adaptation tracking MRV work plan
A4.2 Develop and maintain a list of National Adaptation actions for the NAP, NDC, NC, BTR and other publications.
A5.1 Engage with public on climate change adaptation and resilience issues
3 Mitigation tracking
M1.1 A sustainable and continuously improving GHG inventory
M1.2 A sustainable and continuously improving approach to tracking and quantifying action and modelling GHG projection scenarios
M2.1 Increase GHG Inventory Team
M2.2 Establish a team of experts and or ToRs for experts on mitigation actions (PAMs) and projection scenarios.

131
Area
Imp
rove
me
nt
ID
Improvement title
1 –
20
21
BU
R
2 –
20
22
Nat
ion
al C
ou
nci
l
3 –
20
22
An
nu
al G
HG
Inve
nto
ry
4 –
20
22
An
nu
al D
ata
Co
llect
ion
Pla
n
5 –
20
22
Lo
w-C
arb
on
De
velo
pm
en
t St
rate
gy
6 –
20
23
LU
LUC
F re
po
rtin
g
7 –
20
23
EU
Clim
ate
an
d
Ene
rgy
Un
ion
re
po
rtin
g
8 –
20
23
NA
P
9 –
20
24
NC
an
d B
TR
10
– 2
02
5/6
ND
C u
pd
ate
M3.1 Set up mitigation data-supply agreements
M3.1.1 GHG Inventory data flows
M4.1 Develop mitigation tracking MRV improvement plan
M4.1.1 Maintain a GHG compilation improvement plan as part of the overall MRV system improvement plan.
M4.1.2 GHG Inventory calculation systems
M4.1.3 Improve GHG key category assessment and uncertainties
M4.1.4 Move to higher tiers for GHG Inventory sectors
M4.1.5 GHG Inventory NIR improvement
M4.1.6 GHG Inventory reporting tools (CRF)
M4.1.7 GHG Inventory quality systems
M4.1.8 Integrating LRTAP and GHG inventories
M4.2 Develop and maintain a list of mitigation actions and indicators for the NDC, LTS, NC, BTR and other publications
M4.6 Establish a process and modelling tools for updated GHG projections scenario
M4.7 Support for development of Low-Carbon Development Strategy 2050
M4.8 Prepare for 1st Biennial Transparency Report

132
Area
Imp
rove
me
nt
ID
Improvement title
1 –
20
21
BU
R
2 –
20
22
Nat
ion
al C
ou
nci
l
3 –
20
22
An
nu
al G
HG
Inve
nto
ry
4 –
20
22
An
nu
al D
ata
Co
llect
ion
Pla
n
5 –
20
22
Lo
w-C
arb
on
De
velo
pm
en
t St
rate
gy
6 –
20
23
LU
LUC
F re
po
rtin
g
7 –
20
23
EU
Clim
ate
an
d
Ene
rgy
Un
ion
re
po
rtin
g
8 –
20
23
NA
P
9 –
20
24
NC
an
d B
TR
10
– 2
02
5/6
ND
C u
pd
ate
M4.9 Peer review of the BUR GHG inventory, projections and mitigation actions
M5.2 GHG inventory, projections and mitigation action stakeholder engagement

133
TABLE 30. IMPROVEMENT PLAN FOR MONTENEGRO’S MRV SYSTEM
Improvement Description MRV area MRV component Output milestone
A1.1 Evaluate implementation of the ‘Law on the Protection against Adverse Impacts of Climate Change’
Complete an assessment of the implementation of the legislation for the MRV system and integrate relevant references into the rulebook and other ToRs for the management of and contribution to the MRV system.
Adaptation action; Mitigation action; Projections; GHG inventory; Climate monitoring and scenarios; Risks, vulnerabilities, and loss and damage
Institutional arrangements
2023 NAP completion
A1.2 Improve adaptation institutional arrangements
Establish a long-term mandate for different contributing organizations in the gathering and management of information on climate trends, risks, vulnerabilities and adaptation actions. In addition, mandate organizations and government departments to engage in the analysis and tracking of vulnerabilities, risks and adaptation actions.
Adaptation action; Climate monitoring and scenarios; Risks, vulnerabilities and loss and damage
Institutional arrangements
2023 NAP completion
A2.1 Expert development, training and mentoring for MRV coordinator for adaptation
Training for key representatives in MSDT DCC and other institutions to enhance knowledge and capacities. Better understand adaptation processes. Improved coordination of vulnerability assessments. Awareness of measures. Multi-sector approach to adaptation. Particular interest in forestry. EU and UNFCCC negotiation processes related to adaptation and loss and damage. Support in engaging with GCF readiness activities. Design and tracking of the implementation of adaptation policies. Evaluation of the NAP. Engagement and training programmes should be developed that cover vulnerability, risk, loss and damage assessment and in tracking/making link to and understanding the implications of climate data and climate scenarios. Recruited experts should be trained and resources made available.
Adaptation action; Climate monitoring and scenarios; Risks, vulnerabilities and loss and damage
Technical team of experts; stakeholder engagement
2023 NAP completion
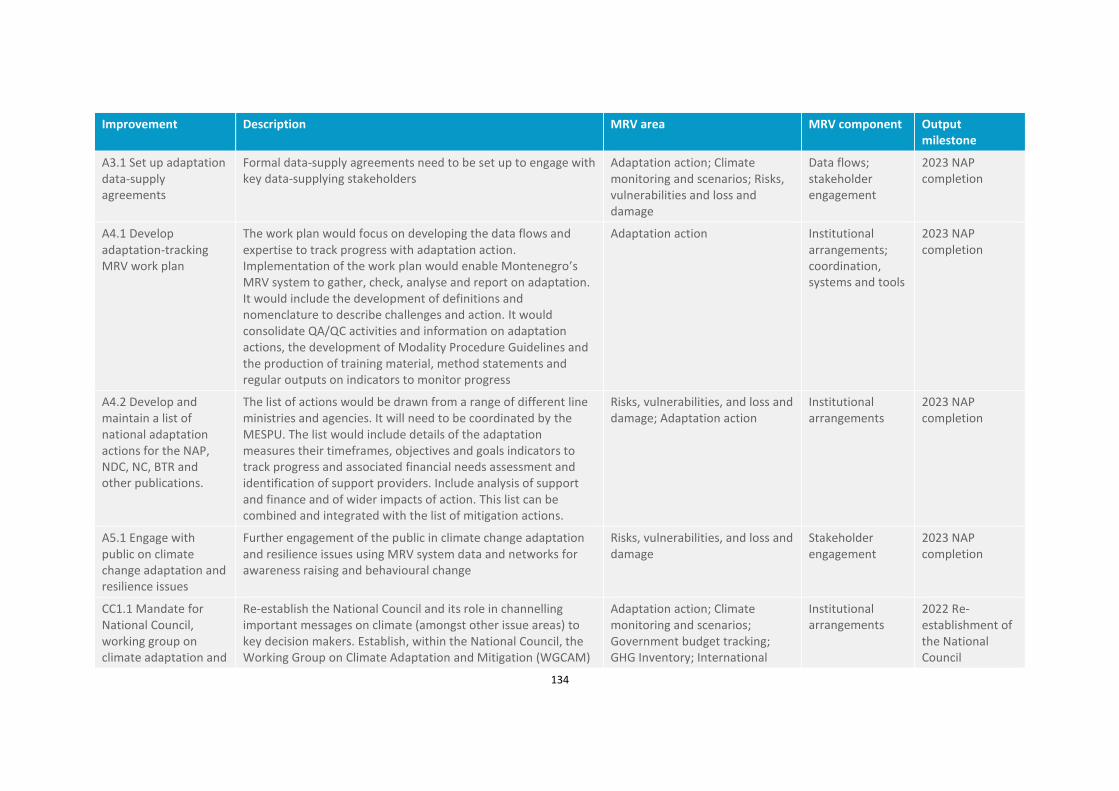
134
Improvement Description MRV area MRV component Output milestone
A3.1 Set up adaptation data-supply agreements
Formal data-supply agreements need to be set up to engage with key data-supplying stakeholders
Adaptation action; Climate monitoring and scenarios; Risks, vulnerabilities and loss and damage
Data flows; stakeholder engagement
2023 NAP completion
A4.1 Develop adaptation-tracking MRV work plan
The work plan would focus on developing the data flows and expertise to track progress with adaptation action. Implementation of the work plan would enable Montenegro’s MRV system to gather, check, analyse and report on adaptation. It would include the development of definitions and nomenclature to describe challenges and action. It would consolidate QA/QC activities and information on adaptation actions, the development of Modality Procedure Guidelines and the production of training material, method statements and regular outputs on indicators to monitor progress
Adaptation action Institutional arrangements; coordination, systems and tools
2023 NAP completion
A4.2 Develop and maintain a list of national adaptation actions for the NAP, NDC, NC, BTR and other publications.
The list of actions would be drawn from a range of different line ministries and agencies. It will need to be coordinated by the MESPU. The list would include details of the adaptation measures their timeframes, objectives and goals indicators to track progress and associated financial needs assessment and identification of support providers. Include analysis of support and finance and of wider impacts of action. This list can be combined and integrated with the list of mitigation actions.
Risks, vulnerabilities, and loss and damage; Adaptation action
Institutional arrangements
2023 NAP completion
A5.1 Engage with public on climate change adaptation and resilience issues
Further engagement of the public in climate change adaptation and resilience issues using MRV system data and networks for awareness raising and behavioural change
Risks, vulnerabilities, and loss and damage
Stakeholder engagement
2023 NAP completion
CC1.1 Mandate for National Council, working group on climate adaptation and
Re-establish the National Council and its role in channelling important messages on climate (amongst other issue areas) to key decision makers. Establish, within the National Council, the Working Group on Climate Adaptation and Mitigation (WGCAM)
Adaptation action; Climate monitoring and scenarios; Government budget tracking; GHG Inventory; International
Institutional arrangements
2022 Re-establishment of the National Council
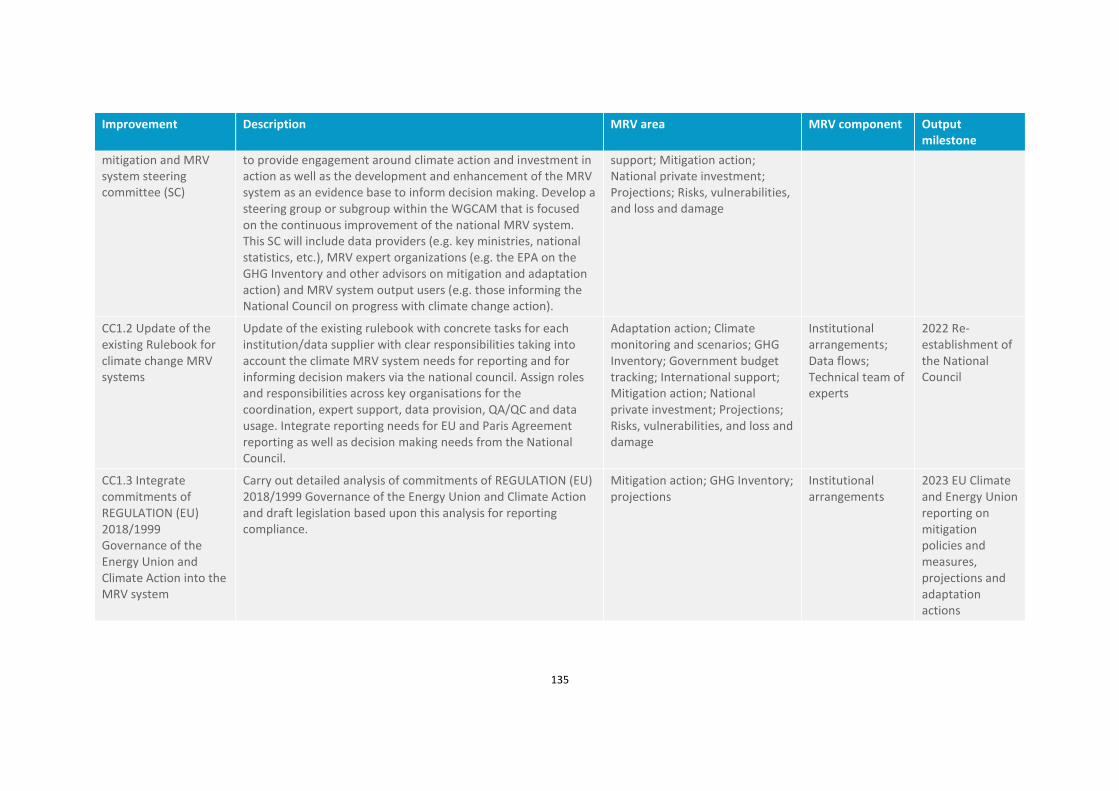
135
Improvement Description MRV area MRV component Output milestone
mitigation and MRV system steering committee (SC)
to provide engagement around climate action and investment in action as well as the development and enhancement of the MRV system as an evidence base to inform decision making. Develop a steering group or subgroup within the WGCAM that is focused on the continuous improvement of the national MRV system. This SC will include data providers (e.g. key ministries, national statistics, etc.), MRV expert organizations (e.g. the EPA on the GHG Inventory and other advisors on mitigation and adaptation action) and MRV system output users (e.g. those informing the National Council on progress with climate change action).
support; Mitigation action; National private investment; Projections; Risks, vulnerabilities, and loss and damage
CC1.2 Update of the existing Rulebook for climate change MRV systems
Update of the existing rulebook with concrete tasks for each institution/data supplier with clear responsibilities taking into account the climate MRV system needs for reporting and for informing decision makers via the national council. Assign roles and responsibilities across key organisations for the coordination, expert support, data provision, QA/QC and data usage. Integrate reporting needs for EU and Paris Agreement reporting as well as decision making needs from the National Council.
Adaptation action; Climate monitoring and scenarios; GHG Inventory; Government budget tracking; International support; Mitigation action; National private investment; Projections; Risks, vulnerabilities, and loss and damage
Institutional arrangements; Data flows; Technical team of experts
2022 Re-establishment of the National Council
CC1.3 Integrate commitments of REGULATION (EU) 2018/1999 Governance of the Energy Union and Climate Action into the MRV system
Carry out detailed analysis of commitments of REGULATION (EU) 2018/1999 Governance of the Energy Union and Climate Action and draft legislation based upon this analysis for reporting compliance.
Mitigation action; GHG Inventory; projections
Institutional arrangements
2023 EU Climate and Energy Union reporting on mitigation policies and measures, projections and adaptation actions

136
Improvement Description MRV area MRV component Output milestone
CC1.4 Prepare for implementation of LULUCF regulation
Prepare for implementation of LULUCF regulation, establish forest reference levels to achieve long-term emission reduction targets.
Climate monitoring and scenarios; Projections
Institutional arrangements
2023 Additional EU GHG Inventory reporting requirements for LULUCF come into force
CC1.5 Appoint representatives responsible for updating the MRV portal
Representatives will be appointed in each relevant ministry, responsible for having access to the MRV portal and keeping it updated with relevant information, particularly details on mitigation actions.
Adaptation action; Mitigation action
Coordination, systems and tools; Institutional arrangements; Data flows
2024 National Communication and BTR
CC2.1 Establish the National Support and Climate Finance Tracking Team
The DCC should focus on establishing a national support and climate finance tracking team, starting from the relevant government departments and authors for the NC, NDC, BUR and NAP. Additional identification of the departments involved in the support and climate-finance landscape and which can provide expertise for tracking of support and climate finance is required.
National private investment; Government budget tracking; International support
Institutional arrangements; Technical team of experts; Coordination, systems and tools
2024 National Communication and BTR
CC3.1 Develop an annual data collection plan for the MRV system
Detailing the annual data collection plan: this will include the development of a registry of data-supplying stakeholders and datasets in the MRV management system
GHG Inventory; Adaptation action; Mitigation action; Climate monitoring and scenarios; National private investment; International support; Risks, vulnerabilities, and loss and damage; Government budget tracking; Projections
Coordination, systems and tools; Data flows
2023 EU Climate and Energy Union reporting on mitigation policies and measures, projections and adaptation actions
CC4.1 Establish formal QA/QC objectives and
Establish formal QA/QC objectives and procedures and integration into working files
GHG Inventory; Adaptation action; Climate monitoring and scenarios; Government budget
Coordination, systems and tools
2023 EU Climate and Energy Union reporting on
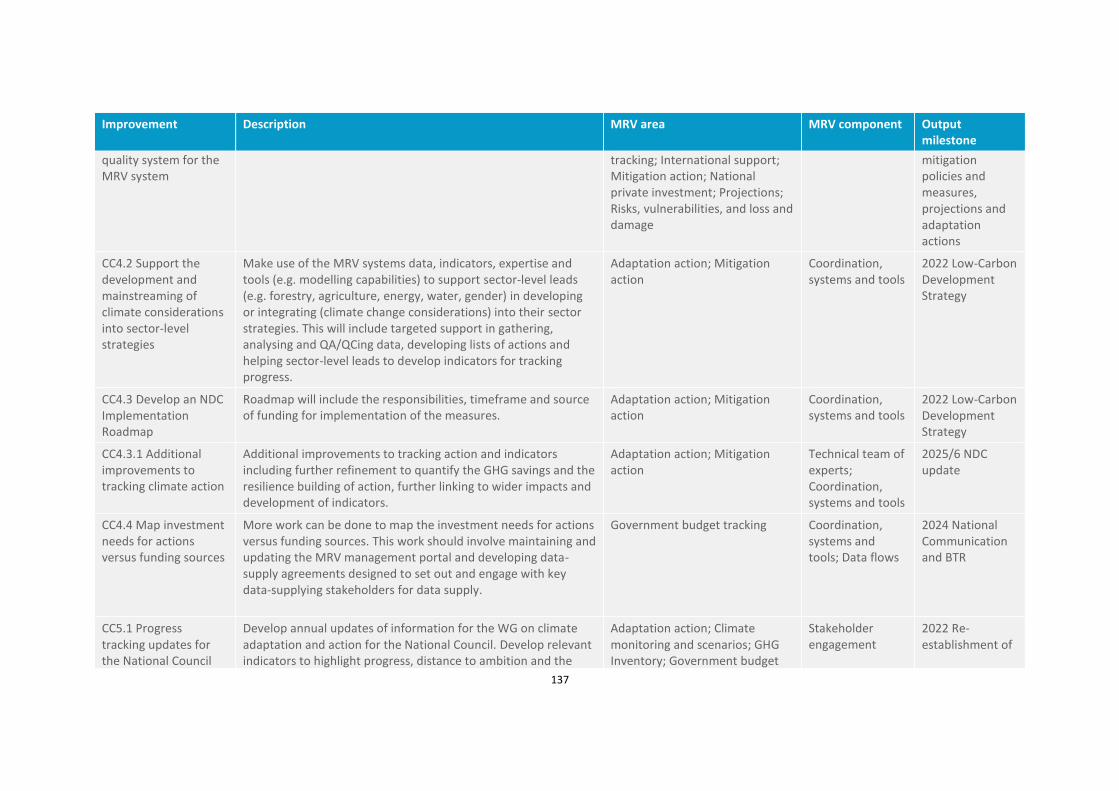
137
Improvement Description MRV area MRV component Output milestone
quality system for the MRV system
tracking; International support; Mitigation action; National private investment; Projections; Risks, vulnerabilities, and loss and damage
mitigation policies and measures, projections and adaptation actions
CC4.2 Support the development and mainstreaming of climate considerations into sector-level strategies
Make use of the MRV systems data, indicators, expertise and tools (e.g. modelling capabilities) to support sector-level leads (e.g. forestry, agriculture, energy, water, gender) in developing or integrating (climate change considerations) into their sector strategies. This will include targeted support in gathering, analysing and QA/QCing data, developing lists of actions and helping sector-level leads to develop indicators for tracking progress.
Adaptation action; Mitigation action
Coordination, systems and tools
2022 Low-Carbon Development Strategy
CC4.3 Develop an NDC Implementation Roadmap
Roadmap will include the responsibilities, timeframe and source of funding for implementation of the measures.
Adaptation action; Mitigation action
Coordination, systems and tools
2022 Low-Carbon Development Strategy
CC4.3.1 Additional improvements to tracking climate action
Additional improvements to tracking action and indicators including further refinement to quantify the GHG savings and the resilience building of action, further linking to wider impacts and development of indicators.
Adaptation action; Mitigation action
Technical team of experts; Coordination, systems and tools
2025/6 NDC update
CC4.4 Map investment needs for actions versus funding sources
More work can be done to map the investment needs for actions versus funding sources. This work should involve maintaining and updating the MRV management portal and developing data-supply agreements designed to set out and engage with key data-supplying stakeholders for data supply.
Government budget tracking Coordination, systems and tools; Data flows
2024 National Communication and BTR
CC5.1 Progress tracking updates for the National Council
Develop annual updates of information for the WG on climate adaptation and action for the National Council. Develop relevant indicators to highlight progress, distance to ambition and the
Adaptation action; Climate monitoring and scenarios; GHG Inventory; Government budget
Stakeholder engagement
2022 Re-establishment of

138
Improvement Description MRV area MRV component Output milestone
and other national decision makers
worsening or improvement of challenges and identification of opportunities.
tracking; International support; Mitigation action; National private investment; Projections; Risks, vulnerabilities, and loss and damage
the National Council
M1.1 A sustainable and continuously improving GHG Inventory
Develop a high-quality and continuously improving and regularly updated GHG inventory timeseries for year X to X−2. This requires a suitably trained team and expert resources, reliable data flows, inventory tools, procedures and agreed and useful outputs including NIR, datasets and data visualizations and indicators to support NDC tracking.
GHG Inventory Coordination, systems and tools; Data flows; Technical team of experts; Institutional arrangements; Stakeholder engagement
2022 Annual GHG Inventory
M1.2 A sustainable and continuously improving approach to tracking and quantifying action and modelling GHG projection scenarios
Develop a high-quality and continuously improving and regularly updated set of projections and mitigation policies and measures. This requires a suitably trained team and expert resources, reliable data flows, tools, procedures and agreed and useful outputs including data visualizations and indicators to support NDC tracking.
Climate monitoring and scenarios; Projections
Coordination, systems and tools; Technical team of experts; Data flows
2022 Low-Carbon Development Strategy
M2.1 Increase GHG Inventory Team
More staff are required to coordinate and perform quality control of the GHG Inventory compilation, as well as to provide expertise on specific sectors (Energy & large IPPU, Agriculture, LULUCF and Waste and F-Gases). One sector-level lead expert per group of sectors, sector or group of subcategories is required to support the development of higher-tier methods and use of country-specific emissions factors, which may also require external expert assistance. This process will require continued training and capacity building through courses, exams, as well as
GHG Inventory Technical team of experts
2022 Annual GHG Inventory

139
Improvement Description MRV area MRV component Output milestone
engagement with EEA EIONET initiatives and the UNFCCC annual review process.
M2.2 Establish a team of experts and or ToRs for experts on mitigation actions (PAMs) and projection scenarios.
Establish a team of experts and or ToRs for experts to become available to update and manage information on mitigation actions (PAMs) and projection scenarios.
Mitigation action; Projections Technical team of experts
2022 Low-Carbon Development Strategy
M3.1 Set up mitigation data-supply agreements
The data-supply process could be strengthened through the development of legal document and data-supply agreements with key stakeholders. With standardized templates for data providers and a secure data-supply chain, the MRV system portal can be used as a platform to retrieve Excel spreadsheets and templates and to submit data
GHG Inventory Data flows 2023 EU Climate and Energy Union reporting on mitigation policies and measures, projections and adaptation actions
M3.1.1 GHG Inventory data flows
GHG Inventory sustainable data supply system developed. Improve inventory annual data collection plan.
GHG Inventory Data flows 2022 Annual GHG Inventory
M4.1 Develop mitigation tracking MRV improvement plan
The work plan would focus on developing the data flows and expertise to track progress with mitigation action. Implementation of the work plan would enable Montenegro’s MRV system to gather, check, analyse and report on mitigation. It would include the development of definitions and nomenclature to describe challenges and action. It would consolidate QA/QC activities and information on mitigation actions, the development of Modality Procedure Guidelines and the production of training material, method statements and regular outputs on indicators to monitor progress. The MRV system should focus on tracking quantifiable, reportable and
Mitigation action Coordination, systems and tools
2022 Low-Carbon Development Strategy

140
Improvement Description MRV area MRV component Output milestone
verifiable, nationally appropriate mitigation actions across a number of key sectors.
M4.1.1 Maintain a GHG compilation improvement plan as part of the overall MRV system improvement plan.
Maintain the GHG compilation improvement plan and store it on the MRV management system
GHG Inventory Coordination, systems and tools
2022 Annual GHG Inventory
M4.1.2 GHG Inventory calculation systems
Through the unique environmental IT system, all data suppliers will have access with Excel spreadsheets and template that will be archived. This will be done through an on-going EU-funded project.
GHG Inventory Coordination, systems and tools; Technical team of experts
2022 Annual GHG Inventory
M4.1.3 Improve GHG key category assessment and uncertainties
Establish a regular process for assessing key categories and level-1 and level-2 uncertainties with expert training for all sectors. Uncertainty assessment (Monte Carlo) training for all sectors.
GHG Inventory Coordination, systems and tools; Technical team of experts
2022 Annual GHG Inventory
M4.1.4 Move to higher tiers for GHG Inventory sectors
Improve data input and move to higher tiers for GHG Inventory sectors (particularly AFOLU): this is especially important for sink data from forestry that is important for the next NDC update (expected 2025). Improve the detail of the GHG Inventory for sectors, as necessary, so that it is sufficient for reporting in the CRF format used for the Annex-I annual inventory and MMR reporting
GHG Inventory Data flows; Technical team of experts
2022 Annual GHG Inventory
M4.1.5 GHG Inventory NIR improvement
NIR generation and NIR training. The NIR is a key document underpinning the tracking of mitigation action. It will be required in EU reporting and as part of the BTR reporting under the Paris Agreement.
GHG Inventory Technical team of experts; Data flows; Coordination, systems and tools
2022 Annual GHG Inventory

141
Improvement Description MRV area MRV component Output milestone
M4.1.6 GHG Inventory reporting tools (CRF)
CRF software GHG Inventory Technical team of experts; Data flows; Coordination, systems and tools
2024 National Communication and BTR
M4.1.7 GHG Inventory quality systems
Develop inventory and mitigation QA/QC procedures. QA/QC analysis and drafting procedures. Part of CC4.
GHG Inventory Technical team of experts; Data flows; Coordination, systems and tools
2022 Annual GHG Inventory
M4.1.8 Integrating LRTAP and GHG Inventories
As the obligation arises from the Law on Ratification of the Convention on Climate Change, the Law on Ratification Convention on Long-Range Transboundary Air Pollution, Law on the Ratification of the Kyoto Protocol, the Law on Ratification of the Protocol to the Convention on Long-Range Transboundary Air Pollution, the Law on the Environment
GHG Inventory Data flows; Technical team of experts; Coordination, systems and tools
2023 EU Climate and Energy Union reporting on mitigation policies and measures, projections and adaptation actions
M4.2 Develop and maintain a list of mitigation actions and indicators for the NDC, LTS, NC, BTR and other publications
The list of actions would be drawn from a range of different line ministries and agencies. It will need to be coordinated by the MESPU. The list would include details of the mitigation measures: their timeframes, objectives and goals indicators to track progress and associated financial needs assessment and identification of support providers. Include analysis of support and finance and of wider impacts of action. This list can be combined and integrated with the list of adaptation actions.
Mitigation action Coordination, systems and tools
2022 Low-Carbon Development Strategy
M4.6 Establish a process and modelling
Integrate the 2019 and 2020/2021 NDC projections work into an archive and platform/process for regular projection updates. This
Projections Data flows; Technical team of experts;
2022 Low-Carbon Development Strategy

142
Improvement Description MRV area MRV component Output milestone
tools for updated GHG projections scenario
could be via the MRV portal. Develop ToR development for implementing new projections contracts.
Coordination, systems and tools
M4.7 Support for development of the Low-Carbon Development Strategy 2050
The MRV system will need to support the generation of data on projection scenarios and lists of actions for the Low-Carbon Development Strategy 2050. Develop a long-term low-carbon development strategy with governmental endorsement.
Mitigation action Institutional arrangements
2022 Low-Carbon Development Strategy
M4.8 Prepare for 1st Biennial Transparency Report
Prepare for reporting under the enhanced transparency framework (1st Biennial Transparency Report to be submitted in 2024)
GHG Inventory; Climate monitoring and scenarios
Institutional arrangements; Coordination, systems and tools
2024 National Communication and BTR
M4.9 Peer review of the BUR GHG Inventory, projections and mitigation actions
Peer review of GHG inventory, projections and mitigation actions used for the BUR.
GHG Inventory; Mitigation action; Projections
Coordination, systems and tools
2021 BUR completion
M5.2 GHG Inventory, projections and mitigation action stakeholder engagement
Increased awareness on the advantages and opportunities for the country of a strong inventory and mitigation MRV framework. A range of sessions/workshops with GHG projection and inventory data suppliers and potential GHG Inventory and projection users to highlight the usefulness and needs of the GHG Inventory and projections. Improved visibility on the websites of the EPA and the ministry. Develop visualizations of existing mitigation actions, GHG Inventory trends and projections. The MESPU could take on responsibilities for producing regular updates on indicators and analysis to inform the wider stakeholders and decision makers on mitigation progress and ambition (Including informing the National Council). The MESPU could develop communication and awareness-raising activities on mitigation-related trends, challenges and priorities at a high political level and to the
GHG Inventory; Mitigation action; Projections
Stakeholder engagement
2022 Re-establishment of the National Council

143
Improvement Description MRV area MRV component Output milestone
public, as well as to public and private decision makers. Further engagement could focus on using climate data of relevance and of interest from the MRV system and linking climate actions to wider joint benefits (the economy, health, ecosystems, flood protection, water quality, energy security, etc.). Produce factsheets and indicators highlighting the challenges and tracking progress. Hold stakeholder consultations on estimates and methods, data sources and assumptions. Achieve annual publication and use of the NIR’s chapter on Trends.