Huron-Manistee National Forests 2017 and 2018 Biennial ...
103
i United States Department of Agriculture Forest Service Huron-Manistee National Forests 2017 and 2018 Biennial Monitoring Report September 2017. The FY 2015-2016 Monitoring and Evaluation Report for the Huron-Manistee National Forests. The 2006 Forest Plan was implemented on March 20, 2006. This Monitoring and Evaluation Report evaluates the results of management. This report meets the intent of both the Forest Plan and the 2012 Planning Rule regulations contained in 36 CFR 219 and the National Forest Management Act.
-
Upload
khangminh22 -
Category
Documents
-
view
7 -
download
0
Transcript of Huron-Manistee National Forests 2017 and 2018 Biennial ...
i
United States Department of Agriculture
Forest Service
Huron-Manistee National Forests 2017 and 2018 Biennial Monitoring Report
September 2017. The FY 2015-2016 Monitoring and Evaluation Report for the Huron-Manistee National Forests. The 2006 Forest Plan was implemented on March 20, 2006. This Monitoring and Evaluation Report evaluates the results of management. This report meets the intent of both the Forest Plan and the 2012 Planning Rule regulations contained in 36 CFR 219 and the National Forest Management Act.

ii
Non-Discrimination Policy
In accordance with Federal civil rights law and U.S. Department of Agriculture (USDA) civil rights regulations and policies, the USDA, its Agencies, offices, and employees, and institutions participating in or administering USDA programs are prohibited from discriminating based on race, color, national origin, religion, sex, gender identity (including gender expression), sexual orientation, disability, age, marital status, family/parental status, income derived from a public assistance program, political beliefs, or reprisal or retaliation for prior civil rights activity, in any program or activity conducted or funded by USDA (not all bases apply to all programs). Remedies and complaint filing deadlines vary by program or incident.
Persons with disabilities who require alternative means of communication for program information (e.g., Braille, large print, audiotape, American Sign Language, etc.) should contact the responsible Agency or USDA’s TARGET Center at (202) 720-2600 (voice and TTY) or contact USDA through the Federal Relay Service at (800) 877-8339. Additionally, program information may be made available in languages other than English.
To file a program discrimination complaint, complete the USDA Program Discrimination Complaint Form, AD-3027, found online at http://www.ascr.usda.gov/complaint_filing_cust.html and at any USDA office or write a letter addressed to USDA and provide in the letter all of the information requested in the form. To request a copy of the complaint form, call (866) 632-9992. Submit your completed form or letter to USDA by:
(1) mail: U.S. Department of Agriculture
Office of the Assistant Secretary for Civil Rights
1400 Independence Avenue, SW
Washington, D.C. 20250-9410;
(2) fax: (202) 690-7442; or
(3) email: [email protected].
USDA is an equal opportunity provider, employer, and lender.
iii

iv
Table of Contents
Summary of Findings .................................................................................................................................................... 8
Watersheds ........................................................................................................................................................... 8
Aspen Management .............................................................................................................................................. 9
Endangered, Threatened and Sensitive Species ................................................................................................... 9
Visitor Use and Satisfaction ................................................................................................................................ 10
Pests and Pathogens - ......................................................................................................................................... 10
Projected Outputs - ............................................................................................................................................. 11
Productivity of the Land - ................................................................................................................................... 11
Lands Adequately Restocked .............................................................................................................................. 11
Land Suitability Class ........................................................................................................................................... 12
Hazardous Fuels .................................................................................................................................................. 12
Management Indicator Species .......................................................................................................................... 12
Invasive Species .................................................................................................................................................. 13
Timber Product Mix ............................................................................................................................................ 13
1.0 Introduction .......................................................................................................................................................... 14
2.0 Monitoring & Evaluation Requirements ............................................................................................................... 14
2.1 Monitoring Program ......................................................................................................................................... 14
2.2 Biennial Monitoring and Evaluation Report (Biennial M&E Report) ................................................................ 15
3.0 History of Monitoring Activities on the Huron-Manistee National Forest ........................................................... 15
4.0 Monitoring Questions ........................................................................................................................................... 16
5.0 Monitoring Results ................................................................................................................................................ 17
5.1 –Watershed Conditions .................................................................................................................................... 17
5.11 – Monitoring Question ................................................................................................................................ 17
5.2 – Select Ecological Conditions and Key Characteristics of Aspen Ecosystems ................................................. 25
5.21 – Monitoring Question ................................................................................................................................ 25
5.3 – Federally-listed endangered, threatened, or proposed species, and conservation of species of viability concern ................................................................................................................................................................... 31
5.31 – Monitoring Question ................................................................................................................................ 31
5.4 – Visitor Use and Satisfaction ........................................................................................................................... 41
5.41 – Monitoring Question ................................................................................................................................ 41
5.5 – Pests and Pathogens ...................................................................................................................................... 53
v
5.51 – Monitoring Question ................................................................................................................................ 53
5.6 – Projected Outputs .......................................................................................................................................... 64
5.61 – Monitoring Question ................................................................................................................................ 64
5.7 – Productivity of the Land ................................................................................................................................. 69
5.71 – Monitoring Question ................................................................................................................................ 69
5.8 – Lands Adequately Restocked ......................................................................................................................... 73
5.81 – Monitoring Question ................................................................................................................................ 73
5.9 – Land Suitability Class ...................................................................................................................................... 75
5.91 – Monitoring Question ................................................................................................................................ 75
5.10 – Hazardous Fuels ........................................................................................................................................... 77
5.101 – Monitoring Question.............................................................................................................................. 77
5.11 – Management Indicator Species ................................................................................................................... 81
5.111 – Monitoring Question.............................................................................................................................. 81
5.12 – invasive Species ........................................................................................................................................... 91
5.121 – Monitoring Question.............................................................................................................................. 91
5.13 – Timber Product Mix ..................................................................................................................................... 94
5.131 – Monitoring Question.............................................................................................................................. 94
6.0 Recommendations .............................................................................................................................................. 101
Aspen Management .......................................................................................................................................... 101
Endangered, Threatened and Sensitive Species ............................................................................................... 101
Visitor Use and Satisfaction .............................................................................................................................. 101
Pests and Pathogens ......................................................................................................................................... 101
Productivity of the Land .................................................................................................................................... 102
Lands Adequately Restocked ............................................................................................................................ 102
Land Suitability Class ......................................................................................................................................... 102
MIS .................................................................................................................................................................... 102
Invasive Species ................................................................................................................................................ 103
Forest Product Mix ........................................................................................................................................... 103
List of Tables
Table 1. Water Quality Indicator 1 ............................................................................................................................. 18 Table 2. Water Quality Indicator 2 ............................................................................................................................. 18
vi
Table 3. Water Quality Indicator 3 ............................................................................................................................. 19 Table 4. Water Quality Indicator 4 ............................................................................................................................. 20 Table 5. Water Quality Indicator 5 ............................................................................................................................. 20 Table 6. Water Quality Indicator 6 ............................................................................................................................. 21 Table 7. Water Quality Indicator 7 ............................................................................................................................. 22 Table 8. Water Quality Indicator 8 ............................................................................................................................. 22 Table 9. Water Quality Indicator 9 ............................................................................................................................. 23 Table 10. Water Quality Indicator 11 ......................................................................................................................... 23 Table 11. Water Quality Indicator 12 ......................................................................................................................... 24 Table 12. Percentage of National Forest Visits by race and ethnicity on the Huron-Manistee National Forests
(FY2001, FY2007, FY2012 and FY2017 data) .............................................................................................. 43 Table 13. Percentage of National Forest Visits by Distance Traveled ....................................................................... 44 Table 14. Percent of National Forest Visits by Annual Household Income ............................................................... 48 Table 15. Percent of Site Visits by Crowding Rating and Site Type (FY2017 compared to 2012 and 2007) .............. 50 Table 16. Acres of Forest Health Infestations by Year (map polygons) ..................................................................... 54 Table 17. Current Levels of Forest Health Infestations (Map Points) ......................................................................... 54 Table 18. Forest Plan Projected Outputs Compared to Actual Outputs for Decade 2 . ............................................ 68 Table 19. Acres of left to certify as fully stocked by year of harvest ......................................................................... 74 Table 20. Land Suitability Change 1st Decade by Acres .............................................................................................. 76 Table 21. Land Suitability 2nd Decade by Acres .......................................................................................................... 76 Table 22. FY 2016 Acres Mechanically Treated for Fuel Reduction by Fire Condition Class ..................................... 79 Table 23. FY 2016 Acres Treated with Prescribed Burning for Fuel Reduction by Fire Condition Class .................... 79 Table 24. 2016 Drumming Count Results for the Huron-Manistee National Forests. ............................................... 84 Table 25. 2017 Drumming Count Results for the Huron-Manistee National Forests. ............................................... 84 Table 26. 2018 Drumming Count Results for the Huron-Manistee National Forests. ............................................... 84 Table 27. Sites surveyed in 2015 and 2018 that had mottled sculpin. ...................................................................... 88 Table 28. The number of acres treated and monitoring for non-native invasive species for 2015. ......................... 92 Table 29. NNIS treatment and monitoring acres in 2016 .......................................................................................... 92 Table 30. NNIS Treatment and Monitoring Acres in Fiscal Years 2017 and 2018 ..................................................... 92 Table 31. 2006 Forest Plan Average Annual Timber Volume Projection - Decade 1, from Lands Suitable and Not
Suitable for Timber Production by Vegetation Class. ................................................................................. 95 Table 32. 2006 Forest Plan Average Annual Timber Volume Projection - Decade 2, from Lands Suitable and Not
Suitable for Timber Production by Vegetation Class. ................................................................................. 96 Table 33. 2006 Forest Plan Decade 1 Proposed and Probable Silvicultural Method Compared to Actual Sold Acres
from Suitable and Not Suitable Forest Land, FYs 2006-2015. .................................................................... 98 Table 34. 2006 Forest Plan Decade 2 Proposed and Probable Silvicultural Method Compared to Actual Sold Acres
from Suitable and Not Suitable Forest Land. ............................................................................................. 99
List of Figures
Figure 1. Bird Conservation Regions ........................................................................................................................... 26 Figure 2. Aspen Age Class distribution on lands suitable for timber production (LSC 500) compared to a regulated distribution of aspen over 60 years for the same acreage. ........................................................................................ 28
vii
Figure 3. Aspen Sold on the Huron-Manistee National Forests and Average Annual Objective for Decade 1 (2014/2015) and Decade 2(2016) from the Forest Plan. ............................................................................................ 29 Figure 4. Kirtland’s Warbler Census Results 2003 to 2017. ....................................................................................... 34 Figure 5 Acres per Singing Male and Acres Occupied on the Huron-Manistee National Forests ............................. 35 Figure 6. Number of Karner blue butterflies counted annually between 2007 and 2018 on Forest System land on the Huron-Manistee National Forests. ....................................................................................................................... 37 Figure 7. Mean difference in Karner blue butterfly counts for individual subpopulations between paired years on National Forest System land on the Huron-Manistee National Forests. .................................................................... 38 Figure 8. Long term trend in Karner blue butterfly presence/absence between 1997 and 2018 on National Forest System land on the Huron-Manistee National Forests. ............................................................................................. 39 Figure 9. Vicinity map of the five Karner blue butterfly metapopulation areas within the Muskegon and Newaygo Recovery Units on the Huron-Manistee National Forests. ......................................................................................... 40 Figure 10. Percentage of Visitation, by Visit Type – Compared to FY2007 and FY2012 ............................................ 43 Figure 11. Percentage of National Forest Visits by Age ............................................................................................. 44 Figure 12. Activity Participation, FY2012 ................................................................................................................... 46 Figure 13. Activity Participation, FY2017. ................................................................................................................... 47 Figure 14. Percent Satisfied Index Scores for Aggregate Categories, FY2012 ........................................................... 49 Figure 15. Percent Satisfied Index Scores for Aggregate Categories, FY2017 ............................................................ 49 Figure 16. Percent of Wilderness Site Visits by Age, FY2001, FY2007 and FY2012 ................................................... 51 Figure 17. Huron NF 2016 Aerial Survey Map ............................................................................................................ 57 Figure 18. Manistee NF 2016 Aerial Survey Map ....................................................................................................... 57 Figure 19. 2017 Manistee NF Aerial Survey Map ....................................................................................................... 58 Figure 20. 2018 Manistee NF Aerial Survey Map ....................................................................................................... 59 Figure 21. 2017 Huron NF Aerial Survey Map ............................................................................................................ 60 Figure 22. 2018 Huron NF Aerial Survey Map ............................................................................................................ 61 Figure 23. Accomplishment of Aquatic Resource Management 1st Decade.............................................................. 66 Figure 24. Annual Accomplishment of Vegetation Improvement Actions in the 1st Decade. ................................... 66 Figure 25. Annual Accomplishment of Habitat, Vegetation Establishment and Fuels .............................................. 67 Figure 26. Acres Treated within the Wildland Urban Interface by Year Second Decade .......................................... 80 Figure 27. Bald eagle active nests and nest productivity on the Huron-Manistee National Forests from 1961 to 2018. ........................................................................................................................................................................... 83 Figure 28. Average Ruffed Grouse Drums per Stop. .................................................................................................. 85 Figure 29. Brook trout populations (age 1+/acre) in watersheds within the HMNF between 2006 and 2018 based on MDNR Status and Trends Program (STP) data. Black dashed line denotes Forest Plan objective to maintain an average of 40 individuals, age 1+ per acre. ................................................................................................................ 87
8
Summary of Findings (see each section of the report for the details and data referenced here)
Watersheds - What is the status of select watershed conditions?
Approximately 65% of the streams on the HMNFs are scored as impaired waters due to atmospheric deposition of PCBs and/or mercury. When other metrics of lake and stream water quality are considered (e.g. sedimentation or nutrient loading) in the “water quality problems” attribute, the majority of lakes and streams are attaining water quality goals.
Most (approximately 80%) streams on the HMNF have no, or only minor, departure from natural conditions for flow characteristics. Improvements to this indicator in the future would relate to removal of dams or other barriers to stream flow.
Aquatic habitat condition is measured with respect to habitat fragmentation, large woody structure, and channel shape and function. About 36% of watersheds we are evaluating have “good” habitat connectivity (the opposite of fragmentation) and 43% have “fair” connectivity. The remaining watersheds have “poor” habitat connectivity, indicating that less than 25% of historic aquatic habitats are still connected. On the HMNF this usually occurs due to undersized or poorly designed road stream crossings. The Forests have recognized this and invested to improve this problem.
Most of the watersheds on the HMNF were rated as “functioning at risk” for both large woody debris and channel shape and function habitat attributes.
In half of the monitored watersheds approximately 70 to 90% of expected aquatic life forms and communities are present. This is compared to what would be expected under undisturbed conditions and, although some non-native species may be present within the watersheds, native species are self-maintaining where found. Close to half of the watersheds are functioning at risk with respect to invasive species impacting native species. The extent to which managers prevent future invasions from threats, such as the Asian carp, will influence the trend in this indicator.
In about one half of the watersheds native riparian vegetation is functioning at risk. Much of this can be attributed to the emerald ash borer; a non-native insect that has decimated ash trees throughout the Forest’s riparian corridors (and elsewhere). Future trends in this Indicator will relate to the Forest’s efforts to restore riparian areas by planting with appropriate species.
For conditions of roads and trails, monitoring indicators address changes to hydrologic and sediment regimes due to the density, location, distribution, and maintenance of the road and trail network. Road density within most watersheds on the HMNF is greater than 2.4 mi/mi2 which is considered to be a threshold for “Impaired Function”. However, watersheds on the HMNF tend to be topographically level and dominated by highly permeable soils. These characteristics tend to make watersheds comparatively resilient to high road densities. Adjustments to this metric may be warranted in the future. This, coupled with efforts of the HMNF to close unnecessary or redundant roads may move watersheds towards a better score of “Functioning at Risk” in the future. In all watersheds on the HMNF, between 50 to 75% of the roads within the watershed have appropriate drainage management features. Proximity to Water relates to the percentage of road miles within a watershed that are within 300 feet of an open water body. Most of the watersheds on the HMNF are “Fully Functioning” with respect to

9
this Indicator. The extent to which the HMNF is able to decrease road mileage near open bodies of water will determine the future trend in this Indicator.
Soil productivity is functioning properly on all watersheds within the Forests. Evidence of accelerated surface erosion is generally absent over the majority of the individual watersheds. All watersheds on HMNF are rated as having “Impaired Function” for Soil Contamination because the atmospheric deposition of Sulphur and/or nitrogen is above the established critical load. The source of the contamination is major city centers to the southwest of the Forests and there is little the HMNF can do to mitigate this concern.
A predominant percentage of all watersheds on the HMNF are currently believed to be within the natural range of variability with respect to vegetation, fuel composition, fire frequency, fire severity, and fire pattern with the potential to alter hydrologic and sediment regimes.
Less than 5% of NFS land within the watersheds is denuded or deforested to the extent that soil and water related values would be at risk.
Eighty five percent of the watersheds on the HMNF have populations of invasive species established within the watersheds. Ongoing actions are necessary to prevent increased infestation and/or damage to soil and water resource values.
Forty watersheds that are within or partially within the HMNF proclamation boundary have forest lands with a 20 to 40% imminent risk of abnormally high levels of tree mortality due to insect and disease outbreaks. Eight watersheds have forest lands with a greater than 40% imminent risk of abnormally high levels of tree mortality due to insect and disease outbreaks.
The Huron-Manistee National Forests are subjected to elevated levels of atmospheric ozone due to discharges from industrial areas to the west of the Forests. Currently, there is little the HMNF can do to mitigate adverse impacts associated with elevated ozone levels.
Aspen Management - Does the HMNFs have adequate acres of trembling and bigtooth aspen in early successional habitat? (Early seral stage aspen with a high aspen composition)
Current aspen management on the HMNF is approximately 12% of what was identified in the Forest Plan. This results in a decreased amount of available habitat for populations of such species as ruffed grouse and golden-winged warblers. An opportunity exists to increase management for early-successional habitats to benefit these species.
Endangered, Threatened and Sensitive Species - To what Extent is Forest Plan implementation contributing to the conservation of federally-listed endangered, threatened, or proposed species, and to the conservation of species of viability concern?
Huron-Manistee National Forests’ census efforts located 1,238 singing male Kirtland's warblers on or adjacent to National Forest System lands (NFSL) in 2017; no census was conducted in 2018, as the census is conducted other year, starting in 2017.
The 2017 count is 15 percent higher than in 2016, and a record high. The 1,238-male count is more than 2 ½ times the Forest’s minimum objective of 420 singing males in breeding habitat on NFSL. The HMNF has exceeded this goal every year since 2003.
10
The success from 2003 to 2017 can be largely attributed to the Forest’s efforts to develop plantation habitat, and a few very large wildfires that have created natural habitat.
Between 2017 and 2026, the HMNFs plan to restore 3,000 acres of high-quality savanna to promote the establishment of five viable KBB metapopulations (Figure 9). Savanna restoration activities are beginning to improve the status of the Karner blue butterfly. Twenty-five of the Forests’ savanna creation areas have become occupied by the Karner blue butterfly through natural dispersal. Occupied Karner blue butterfly habitat has increased from approximately 300 acres in 2006 to approximately 900 acres in 2018. In addition, observations of other savanna associated species have increased within managed savannas, including red-headed woodpecker, Hill’s thistle, prairie smoke, dusted skipper, olive-sided flycatcher, eastern box turtle, Ottoe skipper, American woodcock, ruffed grouse, whip-poor-will, Blanding’s turtle, prairie warbler, monarch butterfly, eastern massasauga rattlesnake, and Hill-prairie spittlebug. Habitat surveys also indicate other savanna creation areas now provide suitable habitat conditions for establishing new Karner blue butterfly subpopulations. Support from volunteers, partners, and grants (particularly the Great Lakes Restoration Initiative) has been critical to the success of the Forests’ recovery efforts.
Visitor Use and Satisfaction - What is the status of visitor use and visitor satisfaction?
The Huron-Manistee National Forests provide opportunities for a range of recreation opportunities such as hiking, camping, hunting, fishing, picnicking, non-motorized watercraft, snowmobiling, motorized trail use, driving for pleasure and gathering forest products (Forest Plan FEIS, Chapter 3). National Visitor Use Monitoring (NVUM) results indicate that visitors are enjoying a range of opportunities consistent with the opportunities identified in the Forest Plan. Forest recreation staff modified site selection in the pre-work phase of NVUM, and included more sites located at trailheads. This change helped identify trail users more accurately, which is reflected in the activities results.
Overall, recreation visitors to the Huron-Manistee National Forests are highly satisfied with their visits, which aligns with agency and Forest Plan objectives, goals and desired conditions. Additionally, the last round of NVUM did not indicate specific areas that needed improvement (see Visitor Satisfaction), unlike previous rounds. More visitors responded with a higher percentage of accessibility, which is another area that the HMNFs are striving to improve with infrastructure improvements.
Total visitation numbers changed slightly between the previous three rounds, but between Round 1 (FY2001) and Round 3 (FY2012), use has increased. Despite increased visitation there is not an increase in crowding, which may indicate that the use is spread out.
The results of visitor demographics data indicate that visitors of all ages and income ranges are recreating on the Forests however, visitors continue to predominately identify with one ethnic and racial group, which is white.
Pests and Pathogens - How are the occurrence, intensity, and distribution of pests and pathogens changing on an annual basis?
The HMNF continues to have forest health problems as climatic and environmental conditions change over time. The introduction of invasive forest pest and pathogens, along with invasive plant species have put a strain on our forests. There are many factors contributing declining forest health, but the

11
amount of tree decline and disease is growing faster than our capacity to identify and address the problems.
There is research needed in many areas to help with the control of these pests and pathogens. Some include the methods of detection, factors that promote/discourage establishment and spread, population dynamics, soil or climatic conditions favorable for establishment, and management practices, biocontrol measures, chemical treatments or genetic resistance development of trees to control the spread of these pests and pathogens.
The Forest should continue annual detection flights. Increasing the amount and types of surveys for pests and pathogens would improve the ability of the Forest to implement the Early Detection and Rapid Response protocols associated with Integrated Pest Management.
Projected Outputs - How close are projected outputs and services to actual?
The Huron-Manistee National Forests produced at or above the level proposed for most of the outputs in the Forest Plan’s proposed and probable practices. Several programs have continued to be implemented at a level below planned levels. These include: timber volume, treatment of noxious weeds, improvement of forest vegetation, improvement of trails, management of stream habitat, and the establishment of forest vegetation (due to the below predicted level of regeneration harvests).
Productivity of the Land - Are the effects of Forest management, including prescriptions, resulting in significant changes in productivity of the land?
This question is only monitored every 5 years and will next be reported out in 2021.
Results from this study, to date, suggest that heavy compaction and/or high organic matter removals (i.e. removal of the entire tree and removal of all organic matter (OM)) are generally detrimental to sustaining forest productivity on aspen stands growing in loamy sand soils. Removal of the entire tree with limited compaction may be sustainable. Managers should be cautious of approaches involving whole-tree harvests, or even trunk-only harvests, on short rotations (~10 years), as such approaches will limit the potential for recovery to pre-harvest bulk densities and may have the potential to result in cumulative increases in soil compaction until unacceptable levels are reached. Soil and stand productivity are susceptible to extreme OM removal on coarse-textured, poorly buffered sands. Given this result, it is probably best to utilize harvesting and silvicultural practices that retain some OM on similar soil types to ensure maintained productivity into the future (Slesak, 2017).
The study should continue for a full rotation and if funding becomes available other types such as jack pine on sandy sites should be included.
Lands Adequately Restocked - Are harvested lands adequately restocked after 5 years?
The percentage of satisfactorily stocked stands during in 2016 demonstrates that current management practices are successful at initiating restocking of cutover lands.
12
Land Suitability Class - To what extent have conditions or information changed the classification of lands "not suited" for timber production to "suitable" for timber production?
The 2016 LSC data will be used as a baseline to track tends in changes to Land Suitability on the Forests through the second decade. There was a shift of 132 acres out of LSC 500 (suitable) to other land classes. Part of this was due to better mapping showing that there were 20 acres of waterbodies that had been typed as Forest. Part of this was also due to creation of savannah and fuel breaks on the Forest. There was also a shift of 11 acres out of the total acres on the forest. This is most likely due to a rounding error or a re-delineation of stand lines with adjoining public land.
Hazardous Fuels - To what extent has the forest used fuels treatments to reduce hazardous fuels?
The Forest Plan made no projection of hazardous fuels reduction or fuelbreak creation for the second decade, however it is important to note that multiple treatments are often necessary to begin movement to an improved condition class. Also, future treatments are likely to be required to maintain an improved condition class.
Between 2016 and 2018, the Huron-Manistee has treated a total of 40,476 acres for the purposes of hazardous fuels reduction in the Wildland Urban Interface (WUI). The average annual acreage treated is 13,492.
Management Indicator Species - What are the population trends of management indicator species?
Current and cumulative monitoring for the bald eagle are consistent with Forest Plan objectives and the Bald and Golden Eagle Protection Act. Current monitoring validates HMNF management that protects bald eagle nests, as well as feeding, roosting and wintering sites.
Ruffed grouse drumming surveys suggest that the ruffed grouse population on the HMNF has risen and stabilized from the low in 2006. It may have reached the high phase of the ten-year cycle, peaking in 2009. A total of 261 ruffed grouse drums were heard on all routes in 2018, with an average 0.54 drums per stop. This data suggests that the ruffed grouse population continues to be viable on the HMNFs. However, the HMNF’s are not meeting the early successional habitat objectives in the Forest Plan.
The MDNR Status and Trends Program was used to estimate the number of brook trout per acre in watersheds. Five of ten watersheds the Huron-Manistee National Forests are meeting the Forest Plan objective of an average of 40 plus individuals per acre of trout age 1+.
Mottled sculpin: Field identification to species demands the ability to count pectoral fin rays; hence, traditional sampling has lumped these two species simply as sculpin. Additionally, sculpin are not a sport fish species. Thus, there is often limited information available to determine population trends within the HMNF.
13
Invasive Species - To what extent is forest management contributing or responding to populations of terrestrial / aquatic non-native invasive species of concern?
Acres accomplished in both FY2017 and 2018 are down about one third from those reported in FY2016, from 1,531 acres to 1,062 and 1,045 respectively. Similarly, the percent of acres monitored, and the effectiveness of treatment, are below levels reported in FY16. FY18 acres are below FY17 levels indicating the possibility of a downward trend in acres treated.
Timber Product Mix - What is the mix (product ratio) of sawtimber and pulpwood produced and what is the output level of non-chargeable timber (restoration treatments), versus chargeable (ASQ)?
In the first three years of the second decade, the Forests have harvested approximately 10 percent of the volume that was projected for cutting in the second decade. The Forests have harvested approximately 56 percent of the total volume proposed in the plan for harvesting in the second decade and only 6 percent of the aspen and short-lived conifer proposed for harvest in the second decade.
The plan projected an increase in the acres treated with selection cutting, shelterwood and clearcutting. After 3 years in the second decade, the Forests have only harvested 10 of the total acreage proposed in the Forest Plan. The Forests have thinned approximately 22 percent of the acres proposed for thinning for the decade. The have clearcut and selection cut only 3 and 4 percent of the plans projected acres respectively thus far for the second decade. Shelterwood cuts have been accomplished on 7 percent of the proposed acreage for the second decade.
14
1.0 Introduction
Effective Land Management Plan (LMP) monitoring and evaluation fosters improved management and more informed planning decisions. It helps identify the need to adjust management direction, such as desired conditions, goals, objectives, standards and guidelines, as conditions change. Monitoring and evaluation helps the Agency and the public determine how an LMP is being implemented, whether plan implementation is achieving desired outcomes, and whether assumptions made in the planning process are valid.
This report also describes to the public how their public lands are being managed and how effectively the commitments made to them within the LMP are being met.
2.0 Monitoring & Evaluation Requirements
Minimum monitoring and evaluation requirements have been established through the National Forest Management Act (NFMA) at 36 CFR 219. Some requirements provide guidance for the development of a monitoring program, while others include specific compliance requirements.
Monitoring and evaluation are separate, sequential activities required by NFMA regulations. Monitoring involves the repeated collecting of data by observation or measurement. Evaluation involves analyzing and interpreting monitoring data. The information gained from monitoring and evaluation is used to determine how well the desired conditions, goals, objectives, and outcomes of the LMP are being met. Monitoring and evaluation are critical steps in the process of keeping the LMP responsive to changing conditions, thereby providing the feedback mechanism for an adaptive management framework. The results are used to identify when changes are needed to the LMP or the way it is implemented.
2.1 Monitoring Program
The monitoring program contained within the LMP is strategic in nature and provides programmatic direction for monitoring and evaluating LMP implementation. The monitoring program addresses several types of monitoring. These requirements fall into four broad categories:
Category 1: Required monitoring items (NFMA and 36 CFR 219 regulations)
Category 2: Attainment of goals and objectives
Category 3: Implementation of standards and guidelines, and
Category 4: Effects of prescriptions, management practices.
Category 1 monitoring items are mandatory components of every LMP. Category 2 through 4 monitoring items are more flexible and tailored to address issues raised through public scoping and/or interdisciplinary team reviews. A more complete description of Category 1 through 4 monitoring items can be found in Chapter IV of the 2006 Land and Resource Management Plan, as amended.

15
Budgetary constraints may affect the level of monitoring that can be done in a particular fiscal year. If budget levels limit the Forest’s ability to perform all monitoring tasks, then those items specifically required by law are given the highest priority.
2.2 Biennial Monitoring and Evaluation Report (Biennial M&E Report)
Providing timely, accurate monitoring information to the decision makers and the public is a key requirement of the monitoring and evaluation strategy. The biennial monitoring and evaluation report, which provides the analysis and summary of the monitoring results, is the vehicle for disseminating this information.
Evaluation is the process of transforming data into information—a value-added process. It is a process of synthesis that brings together value, judgment and reason with monitoring information to answer the question, “So what?” and perhaps, “Why?” Evaluation requires context. A sense of the history of the place or the circumstances (temporal and spatial context) are important to the evaluation of management activities. Evaluation describes movement from a known point (base line or reference condition) either toward or away from a desired condition. The desired conditions may or may not ever be fully achieved, but it is important to know if management activities are heading in the right direction. Evaluation produces information that is used to infer outcomes and trends: Conclusions will be drawn from an interpretation of evidence. These conclusions are documented in the Biennial Monitoring and Evaluation Report.
The Biennial Monitoring and Evaluation Report is intended to be a comprehensive compilation of all the monitoring and evaluation described in the plan. This report will provide summaries of data collected, and complete evaluations of the data. The evaluation process determines whether the observed changes are consistent with LMP desired conditions, goals, and objectives and identifies adjustments that may be needed. Continuous updating and evaluation of monitoring data provides a means to track management effectiveness from year to year and to show the changes that have been made or are still needed.
3.0 History of Monitoring Activities on the Huron-Manistee National Forest
The Huron-Manistee National Forest has been performing Land Management Plan monitoring since the original land and Resource Management Plan was signed. The requirements for monitoring have changed from the 1982 rule to the 2012 rule, and the monitoring program for the Land Management Plan was changed due to the monitoring transition in April of 2016.
Monitoring Reports are filed on our website.
16
4.0 Monitoring Questions
The monitoring questions and indicators approved in April of 2016, therefore some items only have data beginning in 2016.
All of the Forests new monitoring questions will be included within every biennial report. The individual sections below for each question will present all data collected for that question since the plan was last revised, as well as the most recent evaluations performed for that question (based on monitoring frequency).
The following monitoring questions were addressed during the reporting period (from October 1st, 2014 to September 30th, 2016), and have had their associated evaluations updated in the next section of this report:
Monitoring Question 1 (see section 5.1): What is the status of select watershed conditions?
Monitoring Question 2 (see section 5.2): Does the HMNFs have adequate acres of trembling and bigtooth aspen in early successional habitat? (Early seral stage aspen with a high aspen composition)
Monitoring Question 3 (see section 5.3): To what Extent is Forest Plan implementation contributing to the conservation of federally-listed endangered, threatened, or proposed species, and to the conservation of species of viability concern?
Monitoring Question 4 (see section 5.4): What is the status of visitor use and visitor satisfaction?
Monitoring Question 5 (see section 5.5): How are the occurrence, intensity, and distribution of pests and pathogens changing on an annual basis?
Monitoring Question 6 (see section 5.6): How close are projected outputs and services to actual?
Monitoring Question 7 (see section 5.7): Are the effects of Forest management, including prescriptions, resulting in significant changes in productivity of the land?
Monitoring Question 8 (see section 5.8): Are harvested lands adequately restocked after 5 years?
Monitoring Question 9 (see section 5.9): To what extent have conditions or information changed the classification of lands "not suited" for timber production to "suitable" for timber production?
Monitoring Question 10 (see section 5.10): To what extent has the forest used fuels treatments to reduce hazardous fuels?
Monitoring Question 11 (see section 5.11): What are the population trends of management indicator species?
Monitoring Question 12 (see section 5.12): To what extent is forest management contributing or responding to populations of terrestrial / aquatic non-native invasive species of concern?
Monitoring Question 13 (see section 5.13): What is the mix (product ratio) of sawtimber and pulpwood produced and what is the output level of non-chargeable timber (restoration treatments), versus chargeable (ASQ)?
17
5.0 Monitoring Results
5.1 –Watershed Conditions
5.11 – Monitoring Question
What is the status of select watershed conditions?
Last Updated
This question was added 4/24/2016 to meet the requirements of the 2012 Planning Rule and is only evaluated every 5 years and was not evaluated in 2017 or 2018.
Monitoring Indicator(s)
Watershed Condition Class Score (25 indicators) - 24 Attributes Associated With 12 Core National Watershed Condition Indicators.
Monitoring Frequency
This will be monitored at least once every 5 years. We will report on this again in 2021.
Background & Driver(s)
The Watershed Condition Class Score is identified as an indicator for Planning Rule Topic 1 within 36 CFR 219.12(a)(5)(i). The status of select watershed conditions is a direct outcome of the implementation of the Watershed Condition Classification (WCC) system. As described below, the WCC system is a nationally developed methodology for reporting watershed condition that integrates current scientific understanding of watershed function and professional judgement into a core set of 12 watershed condition “indicators” (Forest Service 2011). Each watershed condition indicator is assessed based on one to three “attributes”. The Forest Service in general, and Huron-Manistee National Forests specifically, have already invested substantially in the WCC and it makes sense to leverage the results of this investment to address the monitoring question, “What is the status of select watershed conditions?”
The WCC was specifically designed to: 1) provide a consistent defensible methodology for assessing the condition of all NFS watersheds (watersheds with at least 10% NFS lands were considered to be “NFS”); 2) be quantitative, to the extent feasible; 3) be implementable within existing budgets; and 4) include resource areas and activities that have been shown to influence watershed condition (Forest Service 2011). The 6th-level watershed (here after “watershed”, see Seaber et. al 1987) was selected as the appropriate watershed scale on which to implement the WCC. In 2010/2011 all National Forests, including the Huron-Manistee National Forests, were required to apply the WCC system to document current status of all “NFS” 6th-level watersheds.
For each watershed, all attributes for each of the 12 indicators were scored by the Huron-Manistee National Forests as 1 (Good – Functioning Properly); 2 (Fair – Functioning at Risk); or 3 (Poor – Impaired function) using written criteria and rule sets (as described in Forest Service 2011) and the best available
18
data and professional judgement. This establishes the baseline for monitoring of watershed conditions. As such, for any given watershed, a change over time in the score of a particular indicator represents either an incremental improvement in watershed condition (e.g. from a score of “2” to a score of “1” or from “3” to “2”) or an incremental degradation (e.g. from a score of “1” to a score of “2”). For detailed information and discussion see (USDA Forest Service, 2011)
For simplicity, Attribute scores are reported within each Indicator as number of Huron-Manistee National Forests watersheds receiving a score of 1, 2, or 3. Specific data can be attained from the Huron-Manistee National Forests upon request. In future versions of this monitoring document, reporting will be similar. However, changes (if any) to attributes will also be specifically identified by watershed.
Monitoring Indicator 1: Core National Watershed Condition Indicator 1: Water Quality rating score for Impaired Waters and Water Quality Problems
Results
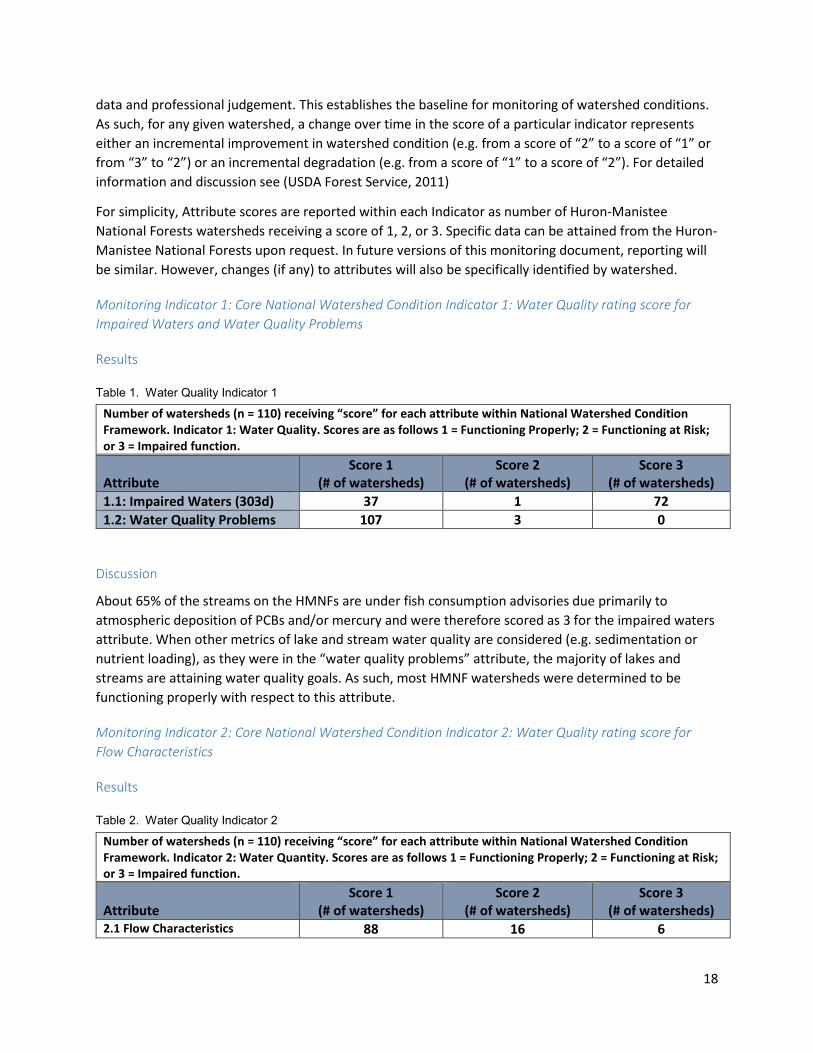
Table 1. Water Quality Indicator 1
Number of watersheds (n = 110) receiving “score” for each attribute within National Watershed Condition Framework. Indicator 1: Water Quality. Scores are as follows 1 = Functioning Properly; 2 = Functioning at Risk; or 3 = Impaired function. Attribute
Score 1 (# of watersheds)
Score 2 (# of watersheds)
Score 3 (# of watersheds)
1.1: Impaired Waters (303d) 37 1 72 1.2: Water Quality Problems 107 3 0
Discussion
About 65% of the streams on the HMNFs are under fish consumption advisories due primarily to atmospheric deposition of PCBs and/or mercury and were therefore scored as 3 for the impaired waters attribute. When other metrics of lake and stream water quality are considered (e.g. sedimentation or nutrient loading), as they were in the “water quality problems” attribute, the majority of lakes and streams are attaining water quality goals. As such, most HMNF watersheds were determined to be functioning properly with respect to this attribute.
Monitoring Indicator 2: Core National Watershed Condition Indicator 2: Water Quality rating score for Flow Characteristics
Results
Table 2. Water Quality Indicator 2
Number of watersheds (n = 110) receiving “score” for each attribute within National Watershed Condition Framework. Indicator 2: Water Quantity. Scores are as follows 1 = Functioning Properly; 2 = Functioning at Risk; or 3 = Impaired function. Attribute
Score 1 (# of watersheds)
Score 2 (# of watersheds)
Score 3 (# of watersheds)
2.1 Flow Characteristics 88 16 6
19
Discussion
This indicator addresses watershed impacts associated with alteration of the natural flow regime of streams. Most (80%) streams on the HMNF have no or only minor departure from natural conditions and are scored as 1 or “functioning properly”. However, locally within the HMNF hydropower dams and other impoundments have resulted in alterations to natural flow regime. Improvements to this indicator in the future would relate to removal of dams or other barriers to stream flow.
Monitoring Indicator 3: Core National Watershed Condition Indicator 3: Aquatic habitat rating score for Habitat Fragmentation, Large Woody Debris, Channel Shape and Function
Results
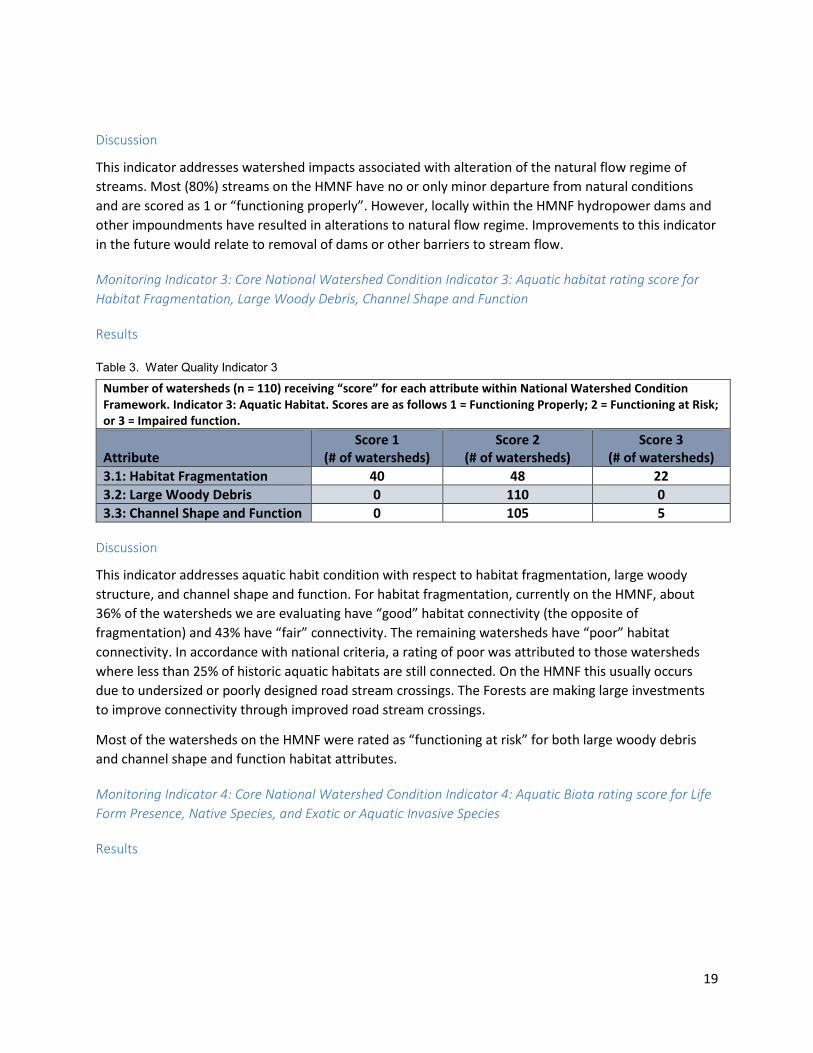
Table 3. Water Quality Indicator 3
Number of watersheds (n = 110) receiving “score” for each attribute within National Watershed Condition Framework. Indicator 3: Aquatic Habitat. Scores are as follows 1 = Functioning Properly; 2 = Functioning at Risk; or 3 = Impaired function. Attribute
Score 1 (# of watersheds)
Score 2 (# of watersheds)
Score 3 (# of watersheds)
3.1: Habitat Fragmentation 40 48 22 3.2: Large Woody Debris 0 110 0 3.3: Channel Shape and Function 0 105 5
Discussion
This indicator addresses aquatic habit condition with respect to habitat fragmentation, large woody structure, and channel shape and function. For habitat fragmentation, currently on the HMNF, about 36% of the watersheds we are evaluating have “good” habitat connectivity (the opposite of fragmentation) and 43% have “fair” connectivity. The remaining watersheds have “poor” habitat connectivity. In accordance with national criteria, a rating of poor was attributed to those watersheds where less than 25% of historic aquatic habitats are still connected. On the HMNF this usually occurs due to undersized or poorly designed road stream crossings. The Forests are making large investments to improve connectivity through improved road stream crossings.
Most of the watersheds on the HMNF were rated as “functioning at risk” for both large woody debris and channel shape and function habitat attributes.
Monitoring Indicator 4: Core National Watershed Condition Indicator 4: Aquatic Biota rating score for Life Form Presence, Native Species, and Exotic or Aquatic Invasive Species
Results
20
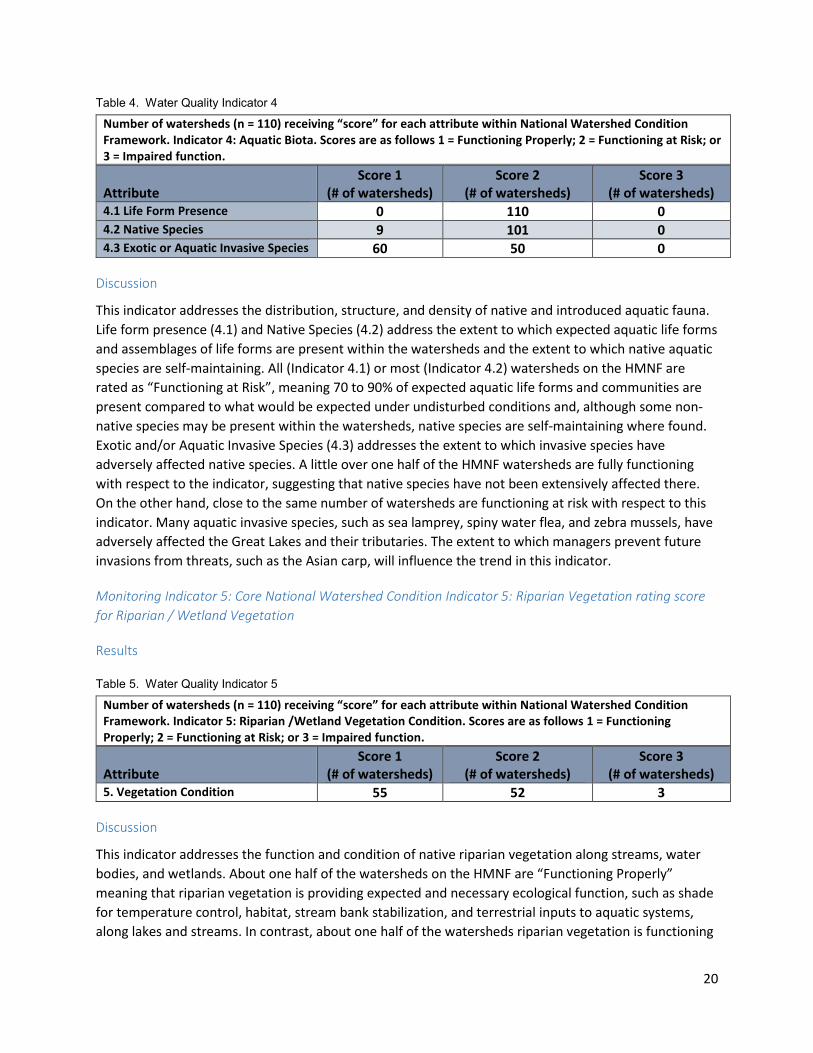
Table 4. Water Quality Indicator 4
Number of watersheds (n = 110) receiving “score” for each attribute within National Watershed Condition Framework. Indicator 4: Aquatic Biota. Scores are as follows 1 = Functioning Properly; 2 = Functioning at Risk; or 3 = Impaired function. Attribute
Score 1 (# of watersheds)
Score 2 (# of watersheds)
Score 3 (# of watersheds)
4.1 Life Form Presence 0 110 0 4.2 Native Species 9 101 0 4.3 Exotic or Aquatic Invasive Species 60 50 0
Discussion
This indicator addresses the distribution, structure, and density of native and introduced aquatic fauna. Life form presence (4.1) and Native Species (4.2) address the extent to which expected aquatic life forms and assemblages of life forms are present within the watersheds and the extent to which native aquatic species are self-maintaining. All (Indicator 4.1) or most (Indicator 4.2) watersheds on the HMNF are rated as “Functioning at Risk”, meaning 70 to 90% of expected aquatic life forms and communities are present compared to what would be expected under undisturbed conditions and, although some non-native species may be present within the watersheds, native species are self-maintaining where found. Exotic and/or Aquatic Invasive Species (4.3) addresses the extent to which invasive species have adversely affected native species. A little over one half of the HMNF watersheds are fully functioning with respect to the indicator, suggesting that native species have not been extensively affected there. On the other hand, close to the same number of watersheds are functioning at risk with respect to this indicator. Many aquatic invasive species, such as sea lamprey, spiny water flea, and zebra mussels, have adversely affected the Great Lakes and their tributaries. The extent to which managers prevent future invasions from threats, such as the Asian carp, will influence the trend in this indicator.
Monitoring Indicator 5: Core National Watershed Condition Indicator 5: Riparian Vegetation rating score for Riparian / Wetland Vegetation
Results
Table 5. Water Quality Indicator 5
Number of watersheds (n = 110) receiving “score” for each attribute within National Watershed Condition Framework. Indicator 5: Riparian /Wetland Vegetation Condition. Scores are as follows 1 = Functioning Properly; 2 = Functioning at Risk; or 3 = Impaired function. Attribute
Score 1 (# of watersheds)
Score 2 (# of watersheds)
Score 3 (# of watersheds)
5. Vegetation Condition 55 52 3
Discussion
This indicator addresses the function and condition of native riparian vegetation along streams, water bodies, and wetlands. About one half of the watersheds on the HMNF are “Functioning Properly” meaning that riparian vegetation is providing expected and necessary ecological function, such as shade for temperature control, habitat, stream bank stabilization, and terrestrial inputs to aquatic systems, along lakes and streams. In contrast, about one half of the watersheds riparian vegetation is functioning
21
at risk. Much of this can be attributed to the emerald ash borer; an introduced insect that has decimated ash trees throughout the Forest’s riparian corridors (and elsewhere). Future trends in this Indicator will relate to the Forest’s efforts to restore riparian areas by planting with appropriate species.
Monitoring Indicator 6: Core National Watershed Condition Indicator 6: Roads and Trails rating score for Open Road Density, Road and Trail Maintenance, Road Proximity to Water, and Mass Wasting
Results
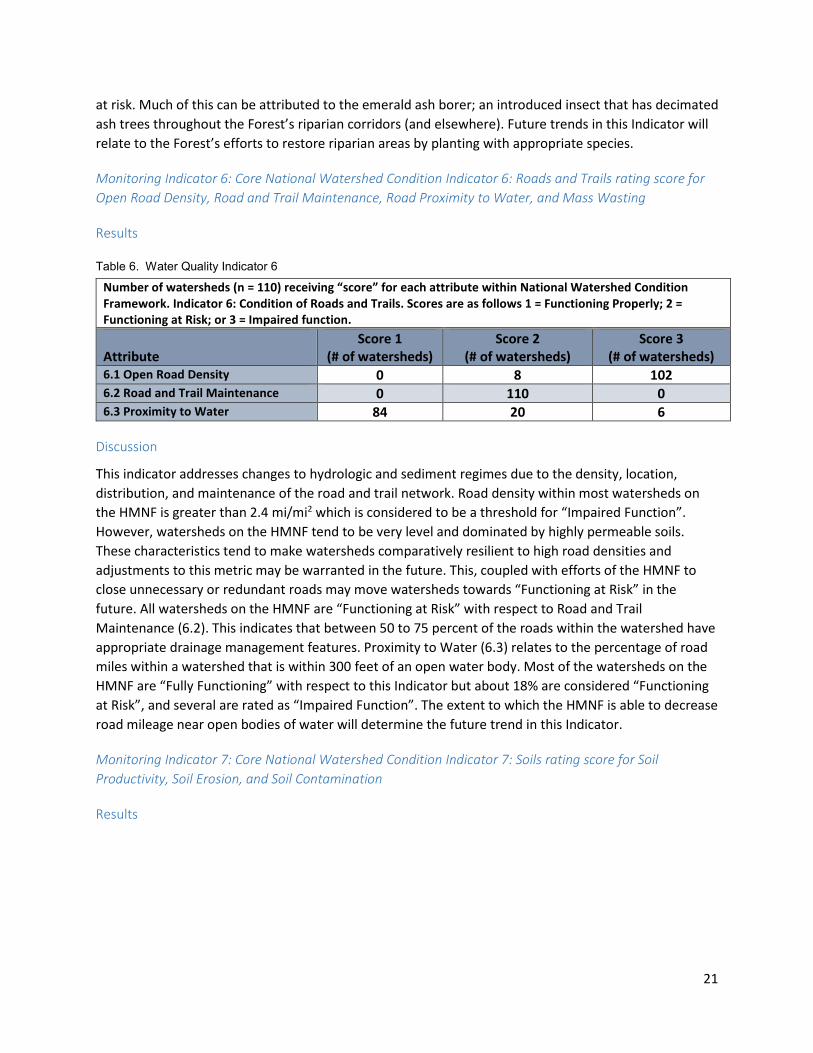
Table 6. Water Quality Indicator 6
Number of watersheds (n = 110) receiving “score” for each attribute within National Watershed Condition Framework. Indicator 6: Condition of Roads and Trails. Scores are as follows 1 = Functioning Properly; 2 = Functioning at Risk; or 3 = Impaired function. Attribute
Score 1 (# of watersheds)
Score 2 (# of watersheds)
Score 3 (# of watersheds)
6.1 Open Road Density 0 8 102 6.2 Road and Trail Maintenance 0 110 0 6.3 Proximity to Water 84 20 6
Discussion
This indicator addresses changes to hydrologic and sediment regimes due to the density, location, distribution, and maintenance of the road and trail network. Road density within most watersheds on the HMNF is greater than 2.4 mi/mi2 which is considered to be a threshold for “Impaired Function”. However, watersheds on the HMNF tend to be very level and dominated by highly permeable soils. These characteristics tend to make watersheds comparatively resilient to high road densities and adjustments to this metric may be warranted in the future. This, coupled with efforts of the HMNF to close unnecessary or redundant roads may move watersheds towards “Functioning at Risk” in the future. All watersheds on the HMNF are “Functioning at Risk” with respect to Road and Trail Maintenance (6.2). This indicates that between 50 to 75 percent of the roads within the watershed have appropriate drainage management features. Proximity to Water (6.3) relates to the percentage of road miles within a watershed that is within 300 feet of an open water body. Most of the watersheds on the HMNF are “Fully Functioning” with respect to this Indicator but about 18% are considered “Functioning at Risk”, and several are rated as “Impaired Function”. The extent to which the HMNF is able to decrease road mileage near open bodies of water will determine the future trend in this Indicator.
Monitoring Indicator 7: Core National Watershed Condition Indicator 7: Soils rating score for Soil Productivity, Soil Erosion, and Soil Contamination
Results
22
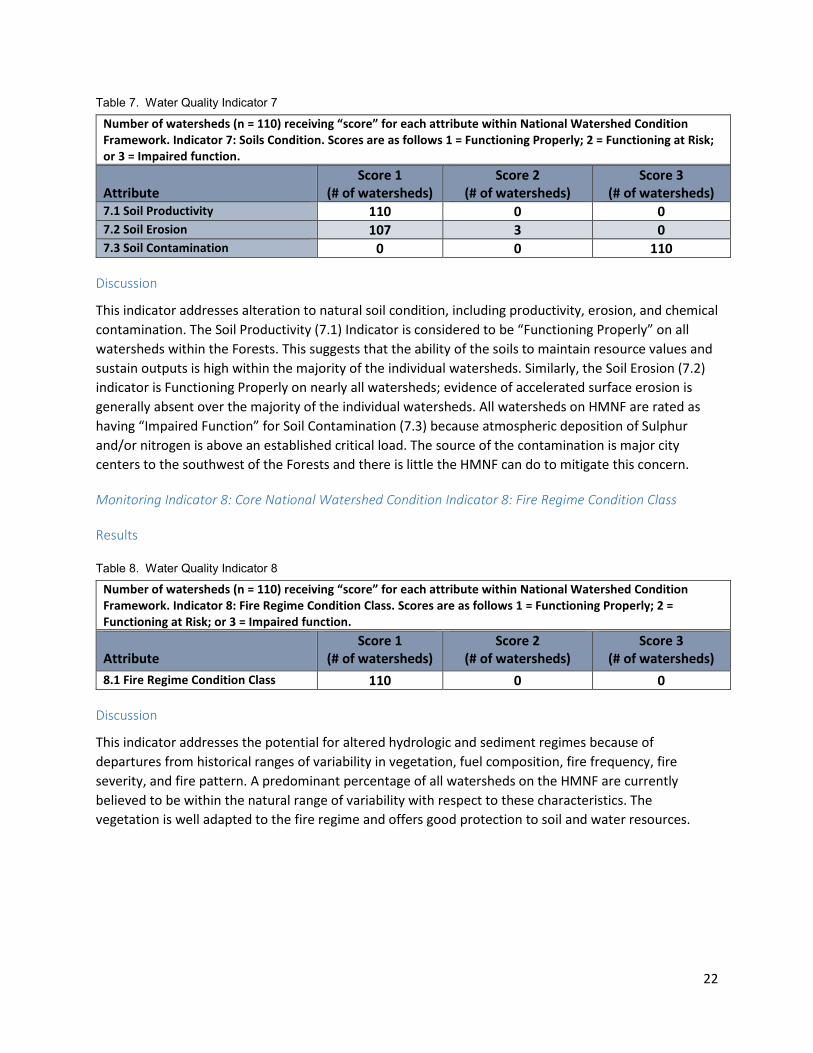
Table 7. Water Quality Indicator 7
Number of watersheds (n = 110) receiving “score” for each attribute within National Watershed Condition Framework. Indicator 7: Soils Condition. Scores are as follows 1 = Functioning Properly; 2 = Functioning at Risk; or 3 = Impaired function. Attribute
Score 1 (# of watersheds)
Score 2 (# of watersheds)
Score 3 (# of watersheds)
7.1 Soil Productivity 110 0 0 7.2 Soil Erosion 107 3 0 7.3 Soil Contamination 0 0 110
Discussion
This indicator addresses alteration to natural soil condition, including productivity, erosion, and chemical contamination. The Soil Productivity (7.1) Indicator is considered to be “Functioning Properly” on all watersheds within the Forests. This suggests that the ability of the soils to maintain resource values and sustain outputs is high within the majority of the individual watersheds. Similarly, the Soil Erosion (7.2) indicator is Functioning Properly on nearly all watersheds; evidence of accelerated surface erosion is generally absent over the majority of the individual watersheds. All watersheds on HMNF are rated as having “Impaired Function” for Soil Contamination (7.3) because atmospheric deposition of Sulphur and/or nitrogen is above an established critical load. The source of the contamination is major city centers to the southwest of the Forests and there is little the HMNF can do to mitigate this concern.
Monitoring Indicator 8: Core National Watershed Condition Indicator 8: Fire Regime Condition Class
Results
Table 8. Water Quality Indicator 8
Number of watersheds (n = 110) receiving “score” for each attribute within National Watershed Condition Framework. Indicator 8: Fire Regime Condition Class. Scores are as follows 1 = Functioning Properly; 2 = Functioning at Risk; or 3 = Impaired function. Attribute
Score 1 (# of watersheds)
Score 2 (# of watersheds)
Score 3 (# of watersheds)
8.1 Fire Regime Condition Class 110 0 0
Discussion
This indicator addresses the potential for altered hydrologic and sediment regimes because of departures from historical ranges of variability in vegetation, fuel composition, fire frequency, fire severity, and fire pattern. A predominant percentage of all watersheds on the HMNF are currently believed to be within the natural range of variability with respect to these characteristics. The vegetation is well adapted to the fire regime and offers good protection to soil and water resources.
23
Monitoring Indicator 9: Core National Watershed Condition Indicator 9: rating score for Forest Cover Condition
Results
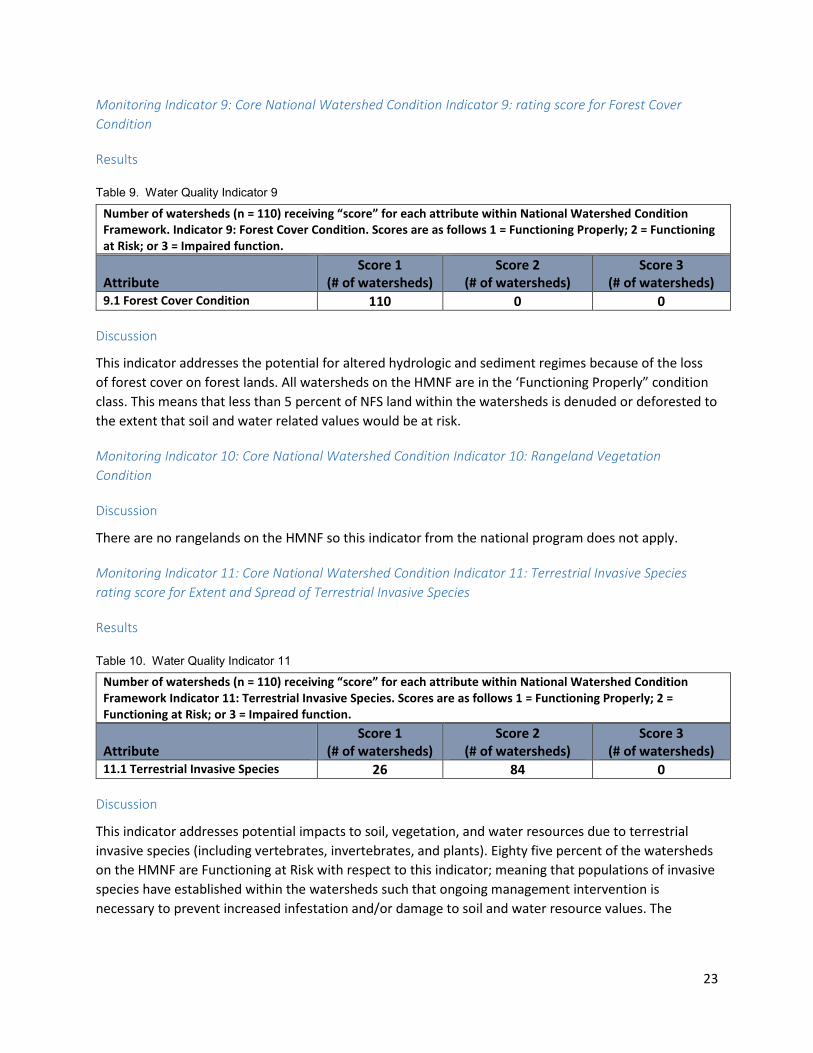
Table 9. Water Quality Indicator 9
Number of watersheds (n = 110) receiving “score” for each attribute within National Watershed Condition Framework. Indicator 9: Forest Cover Condition. Scores are as follows 1 = Functioning Properly; 2 = Functioning at Risk; or 3 = Impaired function. Attribute
Score 1 (# of watersheds)
Score 2 (# of watersheds)
Score 3 (# of watersheds)
9.1 Forest Cover Condition 110 0 0
Discussion
This indicator addresses the potential for altered hydrologic and sediment regimes because of the loss of forest cover on forest lands. All watersheds on the HMNF are in the ‘Functioning Properly” condition class. This means that less than 5 percent of NFS land within the watersheds is denuded or deforested to the extent that soil and water related values would be at risk.
Monitoring Indicator 10: Core National Watershed Condition Indicator 10: Rangeland Vegetation Condition
Discussion
There are no rangelands on the HMNF so this indicator from the national program does not apply.
Monitoring Indicator 11: Core National Watershed Condition Indicator 11: Terrestrial Invasive Species rating score for Extent and Spread of Terrestrial Invasive Species
Results
Table 10. Water Quality Indicator 11
Number of watersheds (n = 110) receiving “score” for each attribute within National Watershed Condition Framework Indicator 11: Terrestrial Invasive Species. Scores are as follows 1 = Functioning Properly; 2 = Functioning at Risk; or 3 = Impaired function. Attribute
Score 1 (# of watersheds)
Score 2 (# of watersheds)
Score 3 (# of watersheds)
11.1 Terrestrial Invasive Species 26 84 0
Discussion
This indicator addresses potential impacts to soil, vegetation, and water resources due to terrestrial invasive species (including vertebrates, invertebrates, and plants). Eighty five percent of the watersheds on the HMNF are Functioning at Risk with respect to this indicator; meaning that populations of invasive species have established within the watersheds such that ongoing management intervention is necessary to prevent increased infestation and/or damage to soil and water resource values. The
24
remaining watersheds on the HMNF have few to no populations of terrestrial invasive species infestations that necessitate removal treatments to protect resource values.
Monitoring Indicator 12: Core National Watershed Condition Indicator 12: Forest Health rating score for Insects and Diseases and Ozone
Results
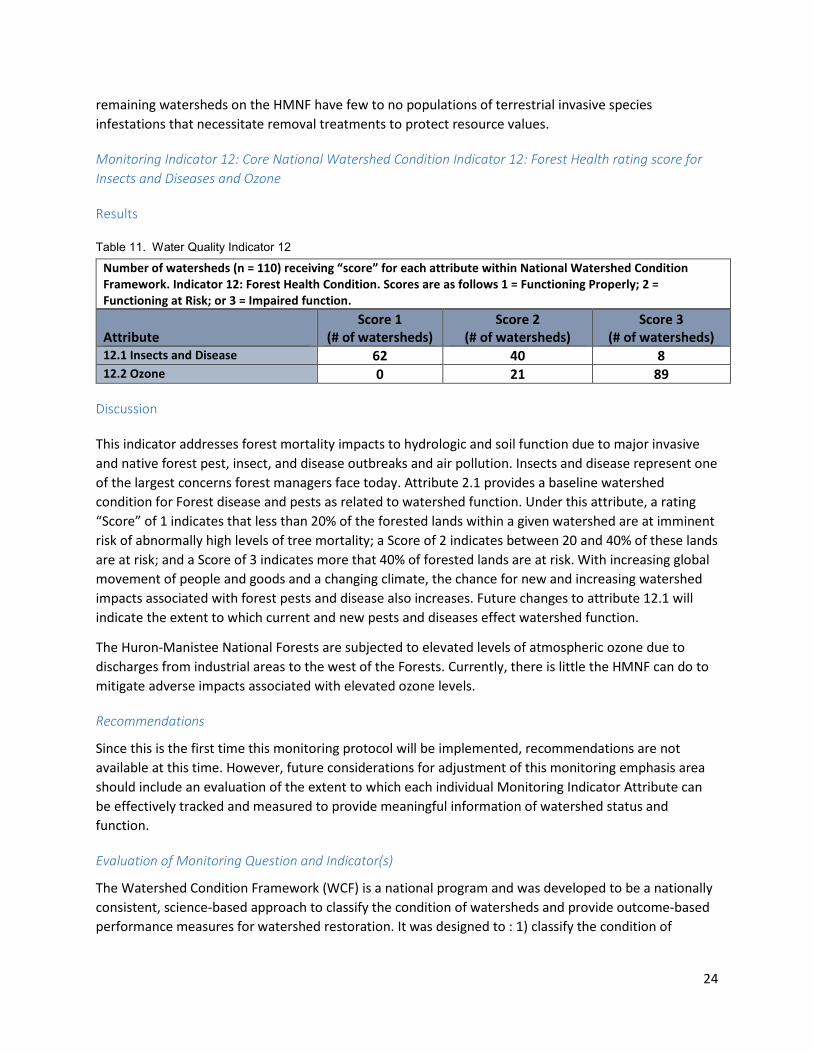
Table 11. Water Quality Indicator 12
Number of watersheds (n = 110) receiving “score” for each attribute within National Watershed Condition Framework. Indicator 12: Forest Health Condition. Scores are as follows 1 = Functioning Properly; 2 = Functioning at Risk; or 3 = Impaired function. Attribute
Score 1 (# of watersheds)
Score 2 (# of watersheds)
Score 3 (# of watersheds)
12.1 Insects and Disease 62 40 8 12.2 Ozone 0 21 89
Discussion
This indicator addresses forest mortality impacts to hydrologic and soil function due to major invasive and native forest pest, insect, and disease outbreaks and air pollution. Insects and disease represent one of the largest concerns forest managers face today. Attribute 2.1 provides a baseline watershed condition for Forest disease and pests as related to watershed function. Under this attribute, a rating “Score” of 1 indicates that less than 20% of the forested lands within a given watershed are at imminent risk of abnormally high levels of tree mortality; a Score of 2 indicates between 20 and 40% of these lands are at risk; and a Score of 3 indicates more that 40% of forested lands are at risk. With increasing global movement of people and goods and a changing climate, the chance for new and increasing watershed impacts associated with forest pests and disease also increases. Future changes to attribute 12.1 will indicate the extent to which current and new pests and diseases effect watershed function.
The Huron-Manistee National Forests are subjected to elevated levels of atmospheric ozone due to discharges from industrial areas to the west of the Forests. Currently, there is little the HMNF can do to mitigate adverse impacts associated with elevated ozone levels.
Recommendations
Since this is the first time this monitoring protocol will be implemented, recommendations are not available at this time. However, future considerations for adjustment of this monitoring emphasis area should include an evaluation of the extent to which each individual Monitoring Indicator Attribute can be effectively tracked and measured to provide meaningful information of watershed status and function.
Evaluation of Monitoring Question and Indicator(s)
The Watershed Condition Framework (WCF) is a national program and was developed to be a nationally consistent, science-based approach to classify the condition of watersheds and provide outcome-based performance measures for watershed restoration. It was designed to : 1) classify the condition of

25
National Forest watersheds (in this case on the Huron-Manistee); 2) be quantitative to the extent feasible; 3) rely on geographic information system (GIS) technology; 4) be cost effective; 5) be implementable within existing budgets; and 6) include resource areas and activates that have a significant influence on watershed condition. The WCF therefore aligns directly with the objective of this “Monitoring Question”. Moving forward, it will be important to evaluate the extent to which the WCF meets its stated objectives and, in so doing, the extent to which it meets the needs associated with this Monitoring Question.
References
USDA Forest Service. 2011. Watershed Condition Classification Technical Guide. FS-978 for full listing of indicators (available at http://www.fs.fed.us/biology/watershed/condition_framework.html at the time of this submittal).
Forest Service. 2011. Watershed Condition Framework. FS-977. May 2011. 34p.
U.S. Geological Survey. 1987. Hydrologic Unit Maps. U.S. Geological Survey water-Supply Paper 2294. 63p.5.2 – Aspen Early Successional Habitat
5.2 – Select Ecological Conditions and Key Characteristics of Aspen Ecosystems
5.21 – Monitoring Question
Does the HMNFs have adequate acres of trembling and bigtooth aspen in early successional habitat? (Early seral stage aspen with a high aspen composition)
Last Updated
This question was added 4/24/2016 to meet the requirements of the 2012 Planning Rule.
Monitoring Indicator(s)
Acres of Aspen in 0-9 age class Acres of Aspen sold
Monitoring Frequency
This will be monitored annually.
Background & Driver(s)
This monitoring question addresses monitoring topics numbers 2 and 3 within 36 CFR 219.12: The Status of Select Ecological Conditions Including Key Characteristics of Terrestrial and Aquatic Ecosystems. 36 CFR 219.12(a)(5)(ii) and The Status of Focal Species to Assess the Ecological Conditions. 219.9. 36 CFR 219.12(a)(5)(iii).
A number of wildlife species thrive when early successional aspen habitat is present in the landscape, including ruffed grouse, American woodcock, white-tailed deer and golden-winged warbler. Ruffed grouse, American woodcock and white-tailed deer are popular game species in Michigan.
26
Golden-winged Warbler In the past 45 years, the golden-winged warbler population has experienced one of the steepest declines of any American songbird, primarily due to a loss of breeding habitat (Roth et. al. 2012). Golden-winged warblers rely on early successional aspen stands for breeding habitat. Therefore, the status of early successional aspen was selected for monitoring because it is critical in the life cycle of the golden-winged warbler.
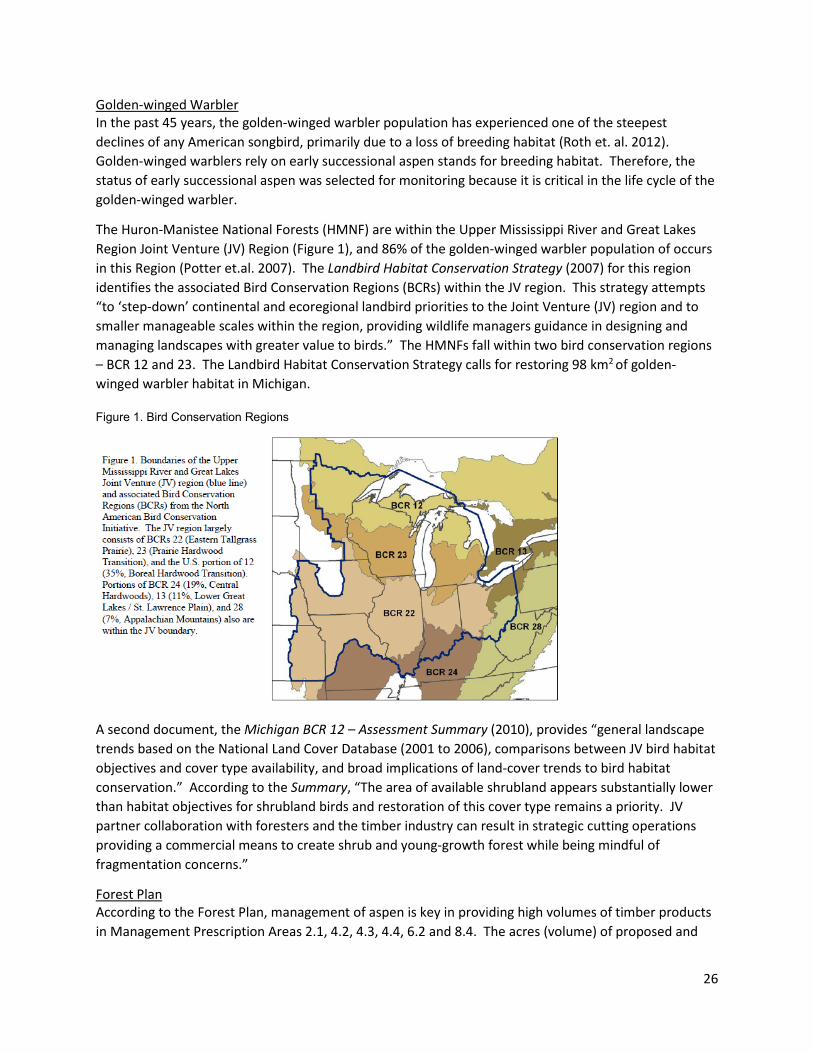
The Huron-Manistee National Forests (HMNF) are within the Upper Mississippi River and Great Lakes Region Joint Venture (JV) Region (Figure 1), and 86% of the golden-winged warbler population of occurs in this Region (Potter et.al. 2007). The Landbird Habitat Conservation Strategy (2007) for this region identifies the associated Bird Conservation Regions (BCRs) within the JV region. This strategy attempts “to ‘step-down’ continental and ecoregional landbird priorities to the Joint Venture (JV) region and to smaller manageable scales within the region, providing wildlife managers guidance in designing and managing landscapes with greater value to birds.” The HMNFs fall within two bird conservation regions – BCR 12 and 23. The Landbird Habitat Conservation Strategy calls for restoring 98 km2 of golden-winged warbler habitat in Michigan.
Figure 1. Bird Conservation Regions
A second document, the Michigan BCR 12 – Assessment Summary (2010), provides “general landscape trends based on the National Land Cover Database (2001 to 2006), comparisons between JV bird habitat objectives and cover type availability, and broad implications of land-cover trends to bird habitat conservation.” According to the Summary, “The area of available shrubland appears substantially lower than habitat objectives for shrubland birds and restoration of this cover type remains a priority. JV partner collaboration with foresters and the timber industry can result in strategic cutting operations providing a commercial means to create shrub and young-growth forest while being mindful of fragmentation concerns.”
Forest Plan According to the Forest Plan, management of aspen is key in providing high volumes of timber products in Management Prescription Areas 2.1, 4.2, 4.3, 4.4, 6.2 and 8.4. The acres (volume) of proposed and

27
probable aspen clearcutting in the first and second decades from lands suitable for timber production are 24,100 (45.2 million cubic feet) and 28,000 acres (54.2 million cubic feet), respectively (Table D-4, (USDA Forest Service, 2006)). This is an average of 2,410 per year in the first decade and 2,800 acres per year in the second decade. 2016 is the start of the second decade; therefore the Forest Plan proposed and probable aspen clearcutting for 2016 is approximately 2,800 acres.
Even-aged system of management (clearcutting) is recommended for growing and reproducing aspen (USDA Forest Service, 2006).
Acres of aspen in the 0-9 age class on the HMNFs are a good indicator of the amount of early-successional aspen habitat (structure and composition) available present in the landscape at any time. Age class tables and graphs are easily generated and efficiently summarize data that indicates the level of early-successional aspen management that has occurred on the HMNFs. However, if the level of aspen offer for sale changes, the changes may not be reflected in the data for a number of years due to the length of timber sale contracts. Therefore, acres of aspen sold will also be monitored to better predict future changes in the amount of early successional aspen habitat.
Monitoring Indicator 1: Acres of Aspen in 0-9 age class
Results
The age class distribution of aspen on the Huron and Manistee National Forests is displayed in Figure 2. Current vegetation data indicates that 3,309 acres exist in the 0-9 year-old age class for aspen on all lands suitable for timber production on the HMNFs. This is 72% of the minimum habitat objective for ruffed grouse, and approximately 12% of the proposed and probable aspen clearcutting for Decade 2.
28
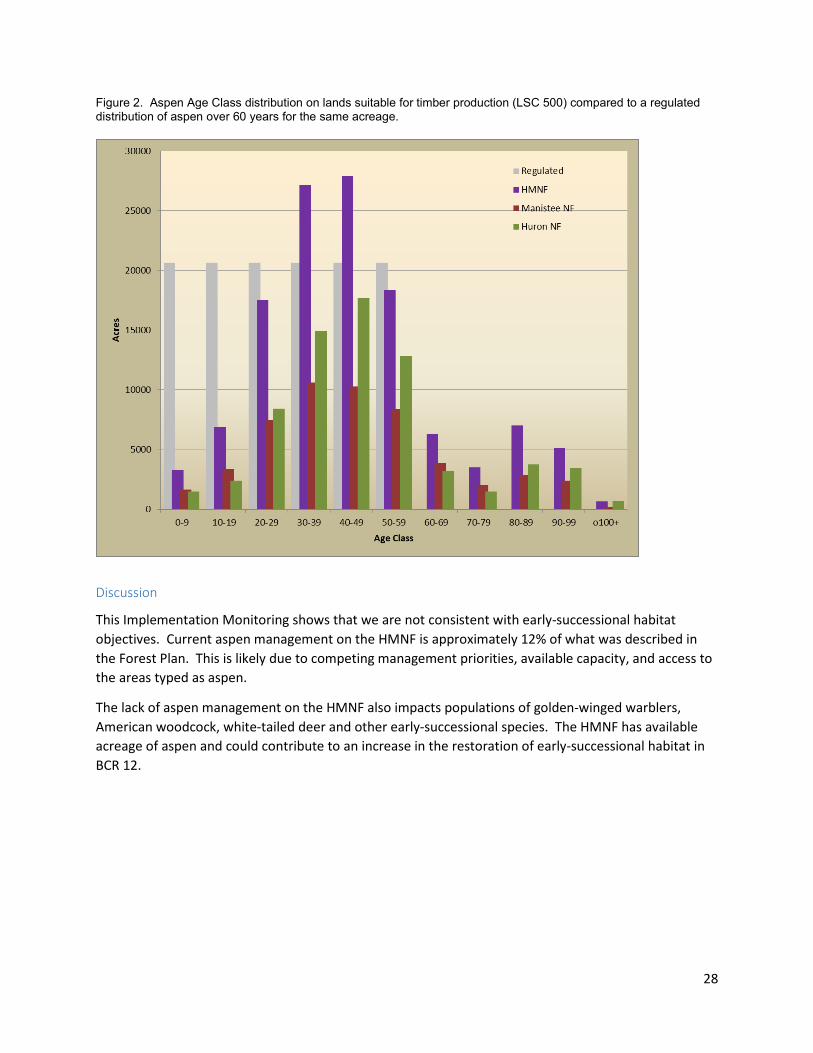
Figure 2. Aspen Age Class distribution on lands suitable for timber production (LSC 500) compared to a regulated distribution of aspen over 60 years for the same acreage.
Discussion
This Implementation Monitoring shows that we are not consistent with early-successional habitat objectives. Current aspen management on the HMNF is approximately 12% of what was described in the Forest Plan. This is likely due to competing management priorities, available capacity, and access to the areas typed as aspen.
The lack of aspen management on the HMNF also impacts populations of golden-winged warblers, American woodcock, white-tailed deer and other early-successional species. The HMNF has available acreage of aspen and could contribute to an increase in the restoration of early-successional habitat in BCR 12.
29
Recommendations
An opportunity exists to increase management for early-successional habitats to benefit these species. Figure 2 displays the need exists to better regulate the age class distribution of aspen on the HMNF, and the recommendations below describe actions that could improve aspen management.
• Increase management of aspen for early-successional habitat across the HMNF to benefit ruffed grouse, woodcock, golden-winged warblers, white-tailed deer and other associated species.
• Identify opportunities for aspen management where concentrations of aspen occurs outside of grouse management areas. Identify these “aspen management areas” to allow for age-class regulation and better identify aspen management objectives (acres per decade).
• Emphasize regulated harvest of aspen to maintain a more even distribution of habitat in each of the age classes 0-59 in grouse and other aspen management areas (Figure 2).
• Identify opportunities for potential aspen harvest in each new project area outside of grouse and aspen management areas.
Monitoring Indicator 2: Acres of Aspen Sold
Results
In 2016, 549 acres of aspen were sold; 34 acres were sold on the Manistee National Forest and 515 acres on the Huron National Forest.
Figure 3. Aspen Sold on the Huron-Manistee National Forests and Average Annual Objective for Decade 1 (2014/2015) and Decade 2(2016) from the Forest Plan.
Discussion
This Implementation Monitoring shows that we are only partially meeting the aspen management objectives in the Forest Plan. The average acres of aspen sold on the HMNF for the first decade was 331 acres per year, well below what was stated as proposed and probable in the Forest Plan (2,410 acres per
708 830549
60 86
2410 2410
2800 2800 2800
0
500
1000
1500
2000
2500
3000
2014 2015 2016 2017 2018
Aspen Sold on the HMNF and Average Annual Objective
Acres Sold Avg Annual Objective
30
year). For the first three years of the second decade the average sold dropped to 232 acres despite the proposed increase in average annual harvest to 2,800 acres. The Forest is below the level of Aspen harvest that was projected.
The priority of new vegetative management projects is determined at the district level, and aspen management may or may not be a priority. Therefore, it is difficult at best to determine the direction of future aspen management, and whether 2016 represents any kind of trend toward the Forest Plan goal of 28,000 acres for decade 2.
Several aspen projects are in the planning stages now so it is expected that aspen harvest will increase.
Recommendations
The Forest could increase aspen management activities to help meet Forest Plan objectives, based on how the aspen resource is distributed across the HMNFs.
Evaluation of Monitoring Question and Indicator(s)
This Validation Monitoring shows that we did consider the appropriate measure for early-successional habitat. Age class distribution effectively displays recent and long term trends in aspen management.
References
Dessecker, D.R. G.W. Norman, S.J. Williamson. 2006. Ruffed Grouse Conservation Plan. Association of Fish & Wildlife Agencies, Resident Game Bird Working Group.
Kelley, J., S. Williamson, T.R. Cooper. 2008. American Woodcock Conservation Plan. A Summary of and Recommendations for Woodcock Conservation in North America. Wildlife Management Institute, Washington, D.C. 168 pp.
Michigan Department of Natural Resources. 2009. A Review of Deer Management in Michigan. Michigan Department of Natural Resources, Lansing, MI. 50 pp.
Michigan Department of Natural Resources. 2010. Michigan Deer Management Plan. Michigan Department of Natural Resources, Lansing, MI. 50 pp.Pierce, R.L, B.M. Kahler, and G.J. Soulliere. 2014. State X BCR Assessment: Michigan 12 – Boreal Hardwood Transition. Upper Mississippi River and Great Lakes Region Joint Venture, U.S. Fish and Wildlife Service, Bloomington, MN, USA.
Potter, B. A., G. J. Soulliere, D. N. Ewert, M. G. Knutson, W. E. Thogmartin, J. S. Castrale, and M. J. Roell. 2007. Upper Mississippi River and Great Lakes Region Joint Venture Landbird Habitat Conservation Strategy. U.S. Fish and Wildlife Service, Fort Snelling, MN. 124pp.
Roth, A.M., R.W. Rohrbaugh, T. Will, and D.A. Buehler, editors. 2012. Golden-winged Warbler Status Review and Conservation Plan. www.gwwa.org/
USDA Forest Service. (2006). Land and Resource Management Plan: Huron-Manistee National Forests. Cadillac, MI: USDA Forest Service. http://www.fs.usda.gov/land/hmnf/landmanagement
31
5.3 – Federally-listed endangered, threatened, or proposed species, and conservation of species of viability concern
5.31 – Monitoring Question
To what Extent is Forest Plan implementation contributing to the conservation of federally-listed endangered, threatened, or proposed species, and to the conservation of species of viability concern?
Last Updated
This question was part of the 2006 Forest Plan.
Monitoring Indicator(s)
Number of Kirtland's warbler singing males counted in the census and estimated Karner blue butterfly abundance from surveys.
Starting in 2018, the percentage of historically occupied sites that have Karner blue butterfly observations each year will be reported within metapopulation areas. Surveys will occur annually to locate new occupied sites within savanna restoration areas that provide KBB habitat. Relative abundance surveys will be conducted for a select subset of occupied sites at least every 3 years to track trends.
Monitoring Frequency
Starting in 2017, the number of Kirtland’s warbler singing males will be monitored every two years.
For the Karner blue butterfly relative abundance surveys will be conducted at least every 3 years to track trends. Surveys to locate newly occupied sites will occur annually.
Background & Driver(s)
This monitoring question addresses monitoring topics number 4 within 36 CFR 219.12(a)(5)(iv): The Status of a Select Set of the Ecological Conditions Required under 36 CFR 219.9 to Contribute to the Recovery of Federally Listed Threatened and Endangered Species, Conserve Proposed and Candidate Species, and Maintains a Viable Population of each Species of Conservation Concern.
The Kirtland’s warbler and Karner blue butterfly are federally-listed endangered species that occur on the Huron-Manistee National Forests (HMNF). Both species have extensive management programs and have been monitored for many years using established protocols.
Monitoring the relative abundance of both species is the best indicator of presence of ecological conditions required to recover these species. Each species success or failure depends on the amount and quality of habitat produced under HMNF Forest Plan direction and available funding.
Kirtland’s Warbler
The management program for the Kirtland's warbler is carried out under the direction of the Kirtland's Warbler Breeding Range Conservation Plan (Michigan Department of Natural Resources, U.S. Fish and Wildlife Service, and U.S. Forest Service., 2015). One objective (C.1.6) of the plan is to "monitor the
32
breeding population of Kirtland’s Warblers to assess whether we are achieving our goal (1,000 breeding pairs)." The monitoring program consists of two phases: (1) an inventory of occupiable breeding habitat, and (2) counting singing males during a short period in June. The latest Kirtland’s Warbler Census and Survey Protocol (USDA Forest Service, Michigan Department of Natural Resources, 2019) covers the second phase of the monitoring program.
The original protocol used to monitor the Kirtland’s warbler singing males was established in the early 1970s. The protocol has evolved over the years to incorporate changes in technology and new ideas for conducting the census effectively and efficiently. The KW census protocol is reviewed and modified annually by the US Forest Service and Michigan Department of Natural Resources.
Census procedures make use of the behavior of male Kirtland's warblers to locate and count territorial males during a fifteen-day period in June. Kirtland's warblers tend to occur in loose assemblages within dense stands of young jack pine usually 5 to 20 feet tall. The males defend their territories with loud and persistent singing, and under good weather conditions, a census participant should hear singing males within one-eighth mile. Research suggests that there is a good probability that a territorial male will sing at least once during any five-minute period between sunrise and 11:00 am in good weather.
The census consists of traversing occupiable habitat early in the morning and mapping the location of singing male Kirtland's warblers. Field surveyors traverse the blocks of habitat in parallel lines using a compass or GPS. These transects are spaced no more than 0.25 miles apart. Surveyors keep track of their location on the line by using a compass and counting paces, or by using a GPS. Surveyors stop and listen for singing males every 10 chains (1/8 mile or 200 meters) or less, for one to five minutes. When a bird is heard from a stop, the surveyor documents its location on a map. Once a block of habitat is complete, surveyors compare parallel transects and create a master map and submit it to the census coordinator.
A paper was published that compares the census protocol to an observation-based mapping method (Probst, 2005). The paper concluded that the official census transect counts are a satisfactory relative index, but results should not be interpreted as an absolute count. The paper also suggested improvements to help correct sources of error, and those suggested improvements were incorporated into the survey protocol.
Karner Blue Butterfly
Abundance Surveys: The management program for the Karner blue butterfly is carried out under the direction of the Karner Blue Butterfly Recovery Plan (2003). The Plan specifies that “monitoring shall occur frequently during the initial period of maintaining a viable metapopulation. It may be relaxed as confidence accrues that the management system does maintain the metapopulation and habitat mosaic above that needed for a minimum viable population (VP). It shall be increased in frequency if new threats to the metapopulation are identified. A minimum VP shall be monitored intensively. If the metapopulation is greater than the minimum, then monitoring may be less intensive.” The Plan described four types of transect monitoring methods.
The HMNFs use two protocols for estimating KBB abundance: Distance Sampling Protocol and Pollard-Yates Protocol. Methods for each protocol are described in the Karner Blue Butterfly Survey Protocol for the Huron-Manistee National Forests (2015). In June of each year, permanent transects are established
33
within sites occupied by Karner blue butterfly subpopulations. These transects are surveyed during second flight to estimate Karner blue butterfly abundance within each subpopulation.
Karner blue butterfly subpopulations consist of habitat patches that exist structurally as openings or corridors within a matrix of dry to dry-mesic oak/pine forest. Permanent transects are systematically established within each habitat patch. During second flight, Distance sampling is conducted to obtain an estimate of Karner blue butterfly abundance within each subpopulation. Distance sampling begins approximately 7 days after confirmation of first emergence of second flight butterflies. Surveys are conducted for each of the habitat patches every 7 days until second flight ends. Two-person teams functioning as observer and recorder are assigned to each habitat patch. The observer and the recorder walk each permanent transect segment within the patch and note any butterflies that can be positively identified as a Karner blue butterfly.
During second flight, Pollard-Yates counts are conducted within Karner blue butterfly subpopulations where ≤10 butterflies have been observed during past surveys, as well as selected savanna restoration areas and previously occupied Karner blue butterfly subpopulations, to determine if the butterfly is present. Pollard-Yates counts are conducted at least twice for each site, with at least 7 days between surveys.
To conduct Pollard-Yates counts, an observer meanders through a site covering all areas that appeared to be good Karner blue butterfly habitat (e.g., patches of lupine or other blooming nectar plants). The route an observer walks on a given unit can change from day to day as the locations of nectar sources and aggregations of butterflies change. While conducting Pollard Yates counts, observers record the number of butterflies that can be positively identified as a Karner blue butterfly. If Karner blue butterflies are observed within a site during two successive surveys at least seven days apart, the site is designated as “occupied” and added to the list of Karner blue butterfly subpopulations to be monitored. If no Karner blue butterflies are observed within a site for four consecutive years, the site is designated as “unoccupied” and removed from the monitoring list.
Habitat Monitoring: For 2018 and beyond, vegetative surveys will be conducted within a select subset of savanna restoration sites and occupied sites to track trends in habitat suitability. Survey results will be used to determine where to focus monitoring efforts to assess the status of the Karner blue butterfly population and to inform management priorities.
Monitoring Indicator 1: Number of Kirtland's warbler singing males counted in the census every other year
Results
Huron-Manistee National Forests’ census efforts located 1,238 singing male Kirtland's warblers on or adjacent to National Forest System lands (NFSL) in 2017; no census was conducted in 2018, as the census is conducted every other year, starting in 2017.
The 2017 count is 15 percent higher than in 2016, and a record high. The 1,238-male count is more than 2 ½ times the Forest’s minimum objective of 420 singing males in breeding habitat on NFSL. The HMNF has exceeded this goal every year since 2003 (Figure 4). The success from 2003 to 2017 can be largely attributed to the Forest’s efforts to develop plantation habitat, and a few very large wildfires that have created natural habitat.

34
Figure 4. Kirtland’s Warbler Census Results 2003 to 2017.
Discussion
The Kirtland’s warbler population in Michigan has increased in response to availability of breeding habitat, cowbird trapping, and area closures. The 2006 Forest Plan increased the average annual harvest and reforestation objective from 1,070 to 1,600 acres per year and increased the maximum clearcut size from 370 to 550 acres. Management decisions relating to planning and scheduling of future habitat blocks will continue to emphasize large, adjacent treatment blocks where possible. We hypothesize that large treatment blocks have higher densities of Kirtland's warblers, and the birds use these areas for a longer period. Figure 5 appears to support this hypothesis and illustrates the benefits of large and adjacent treatment blocks. As treatment blocks have become larger and adjacent, the acres required for each singing male (mated pair) has declined. If this trend continues, fewer acres than originally projected (1,600 acres per year) are likely to be needed to be managed on the Huron- Manistee National Forests to maintain Kirtland’s warblers above the minimum of 420 singing males.

35
Figure 5 Acres per Singing Male and Acres Occupied on the Huron-Manistee National Forests
Monitoring Indicator 2: Estimated Karner blue butterfly abundance from surveys
Results
In 2017, Karner blue butterfly subpopulations were not monitored to estimate abundance within metapopulation areas on the HMNF. Instead, subpopulations with the greatest number of butterflies (based on past surveys) were monitored to document the phenology of second flight. This shift in monitoring effort was largely due to a reduction in resources, but it also was driven by a desire to understand the increased variation in second flight emergence that was noted anecdotally for subpopulations surveyed in 2016. Accurately estimating population size requires capturing the peak of second flight during surveys. It was hoped that documenting flight phenology within subpopulations would help refine the timing of future surveys.
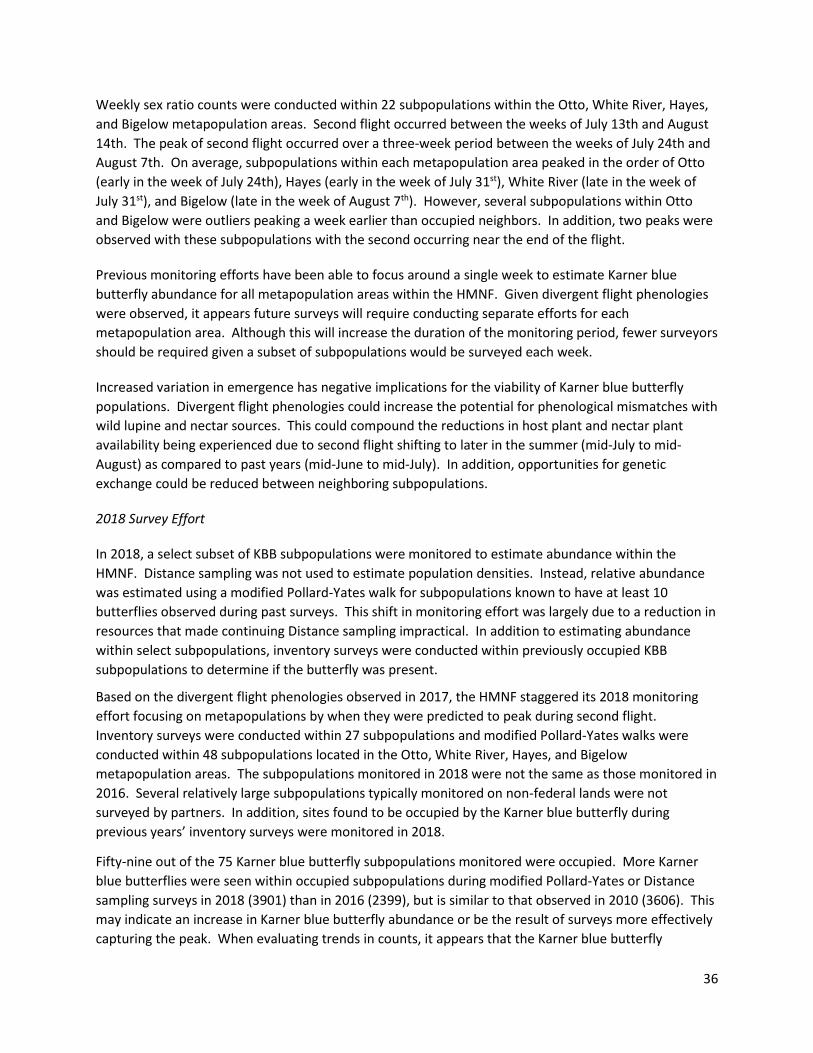
36
Weekly sex ratio counts were conducted within 22 subpopulations within the Otto, White River, Hayes, and Bigelow metapopulation areas. Second flight occurred between the weeks of July 13th and August 14th. The peak of second flight occurred over a three-week period between the weeks of July 24th and August 7th. On average, subpopulations within each metapopulation area peaked in the order of Otto (early in the week of July 24th), Hayes (early in the week of July 31st), White River (late in the week of July 31st), and Bigelow (late in the week of August 7th). However, several subpopulations within Otto and Bigelow were outliers peaking a week earlier than occupied neighbors. In addition, two peaks were observed with these subpopulations with the second occurring near the end of the flight.
Previous monitoring efforts have been able to focus around a single week to estimate Karner blue butterfly abundance for all metapopulation areas within the HMNF. Given divergent flight phenologies were observed, it appears future surveys will require conducting separate efforts for each metapopulation area. Although this will increase the duration of the monitoring period, fewer surveyors should be required given a subset of subpopulations would be surveyed each week.
Increased variation in emergence has negative implications for the viability of Karner blue butterfly populations. Divergent flight phenologies could increase the potential for phenological mismatches with wild lupine and nectar sources. This could compound the reductions in host plant and nectar plant availability being experienced due to second flight shifting to later in the summer (mid-July to mid-August) as compared to past years (mid-June to mid-July). In addition, opportunities for genetic exchange could be reduced between neighboring subpopulations.
2018 Survey Effort
In 2018, a select subset of KBB subpopulations were monitored to estimate abundance within the HMNF. Distance sampling was not used to estimate population densities. Instead, relative abundance was estimated using a modified Pollard-Yates walk for subpopulations known to have at least 10 butterflies observed during past surveys. This shift in monitoring effort was largely due to a reduction in resources that made continuing Distance sampling impractical. In addition to estimating abundance within select subpopulations, inventory surveys were conducted within previously occupied KBB subpopulations to determine if the butterfly was present.
Based on the divergent flight phenologies observed in 2017, the HMNF staggered its 2018 monitoring effort focusing on metapopulations by when they were predicted to peak during second flight. Inventory surveys were conducted within 27 subpopulations and modified Pollard-Yates walks were conducted within 48 subpopulations located in the Otto, White River, Hayes, and Bigelow metapopulation areas. The subpopulations monitored in 2018 were not the same as those monitored in 2016. Several relatively large subpopulations typically monitored on non-federal lands were not surveyed by partners. In addition, sites found to be occupied by the Karner blue butterfly during previous years’ inventory surveys were monitored in 2018.
Fifty-nine out of the 75 Karner blue butterfly subpopulations monitored were occupied. More Karner blue butterflies were seen within occupied subpopulations during modified Pollard-Yates or Distance sampling surveys in 2018 (3901) than in 2016 (2399), but is similar to that observed in 2010 (3606). This may indicate an increase in Karner blue butterfly abundance or be the result of surveys more effectively capturing the peak. When evaluating trends in counts, it appears that the Karner blue butterfly
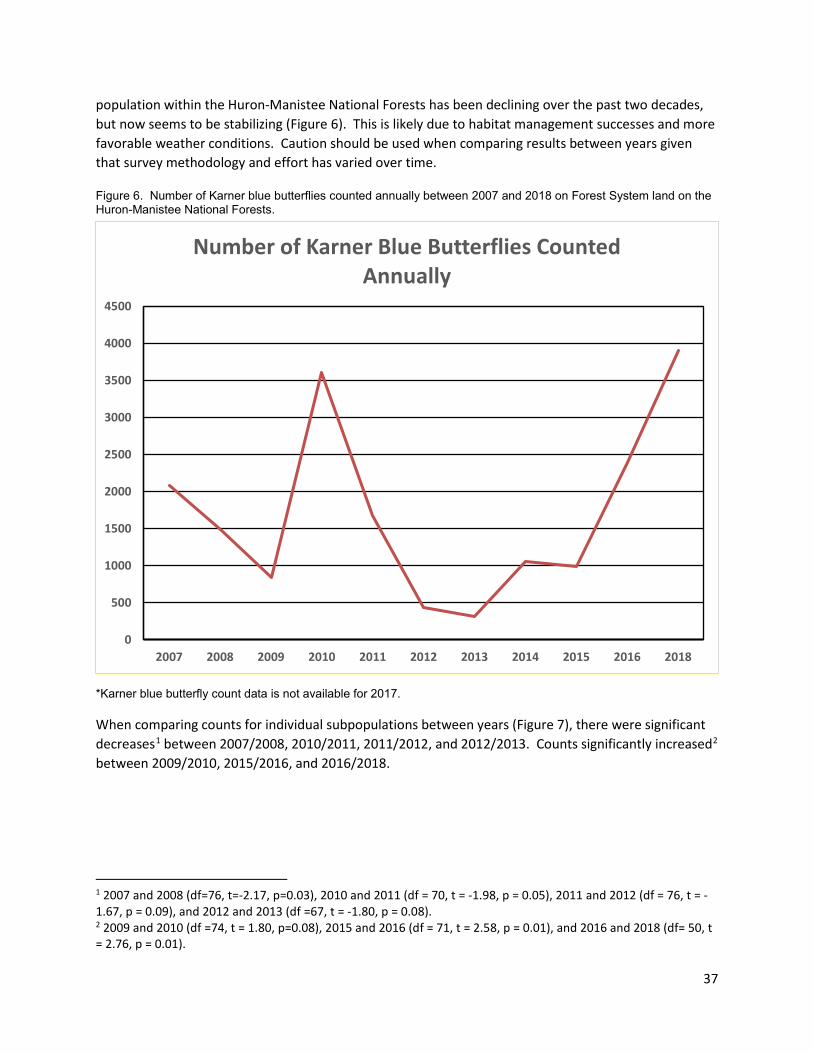
37
population within the Huron-Manistee National Forests has been declining over the past two decades, but now seems to be stabilizing (Figure 6). This is likely due to habitat management successes and more favorable weather conditions. Caution should be used when comparing results between years given that survey methodology and effort has varied over time.
Figure 6. Number of Karner blue butterflies counted annually between 2007 and 2018 on Forest System land on the Huron-Manistee National Forests.
*Karner blue butterfly count data is not available for 2017.
When comparing counts for individual subpopulations between years (Figure 7), there were significant decreases1 between 2007/2008, 2010/2011, 2011/2012, and 2012/2013. Counts significantly increased2 between 2009/2010, 2015/2016, and 2016/2018.
1 2007 and 2008 (df=76, t=-2.17, p=0.03), 2010 and 2011 (df = 70, t = -1.98, p = 0.05), 2011 and 2012 (df = 76, t = -1.67, p = 0.09), and 2012 and 2013 (df =67, t = -1.80, p = 0.08). 2 2009 and 2010 (df =74, t = 1.80, p=0.08), 2015 and 2016 (df = 71, t = 2.58, p = 0.01), and 2016 and 2018 (df= 50, t = 2.76, p = 0.01).
0
500
1000
1500
2000
2500
3000
3500
4000
4500
2007 2008 2009 2010 2011 2012 2013 2014 2015 2016 2018
Number of Karner Blue Butterflies Counted Annually
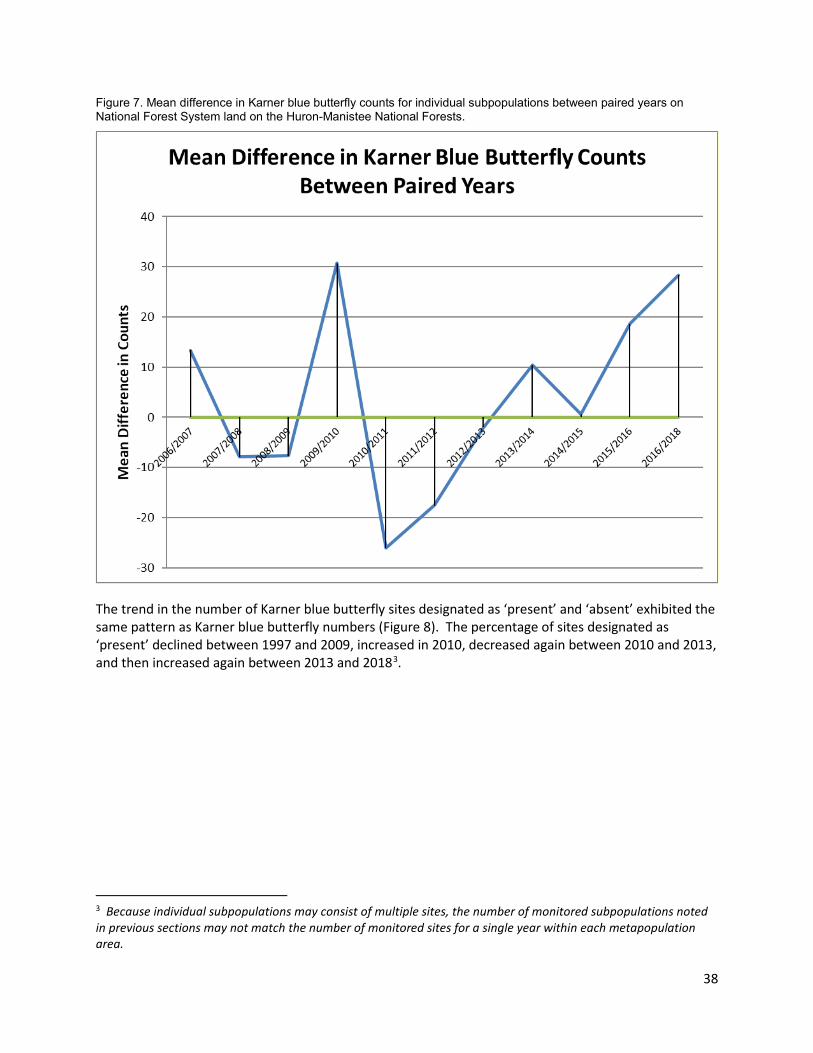
38
Figure 7. Mean difference in Karner blue butterfly counts for individual subpopulations between paired years on National Forest System land on the Huron-Manistee National Forests.
The trend in the number of Karner blue butterfly sites designated as ‘present’ and ‘absent’ exhibited the same pattern as Karner blue butterfly numbers (Figure 8). The percentage of sites designated as ‘present’ declined between 1997 and 2009, increased in 2010, decreased again between 2010 and 2013, and then increased again between 2013 and 20183.
3 Because individual subpopulations may consist of multiple sites, the number of monitored subpopulations noted in previous sections may not match the number of monitored sites for a single year within each metapopulation area.
39
Figure 8. Long term trend in Karner blue butterfly presence/absence between 1997 and 2018 on National Forest System land on the Huron-Manistee National Forests.
Discussion
Between 2017 and 2026, the HMNFs plan to restore 3,000 acres of high-quality savanna to promote the establishment of five viable KBB metapopulations (Figure 9). Savanna restoration activities are beginning to improve the status of the Karner blue butterfly. Twenty-five of the Forests’ savanna creation areas have become occupied by the Karner blue butterfly through natural dispersal. Occupied Karner blue butterfly habitat has increased from approximately 300 acres in 2006 to approximately 900 acres in 2018. In addition, observations of other savanna associated species have increased within managed savannas including red-headed woodpecker, Hill’s thistle, prairie smoke, dusted skipper, olive-sided flycatcher, eastern box turtle, Ottoe skipper, American woodcock, ruffed grouse, whip-poor-will, Blanding’s turtle, prairie warbler, monarch butterfly, eastern massasauga rattlesnake, and Hill-prairie spittlebug. Habitat surveys also indicate other savanna creation areas now provide suitable habitat conditions for establishing new Karner blue butterfly subpopulations. Support from volunteers, partners, and grants (particularly the Great Lakes Restoration Initiative) has been critical to the success of the Forests’ recovery efforts.
0
10
20
30
40
50
60
70
80
90
100
Long-Term Trend Karner Blue Butterfly Presence/Absence
%A
%P
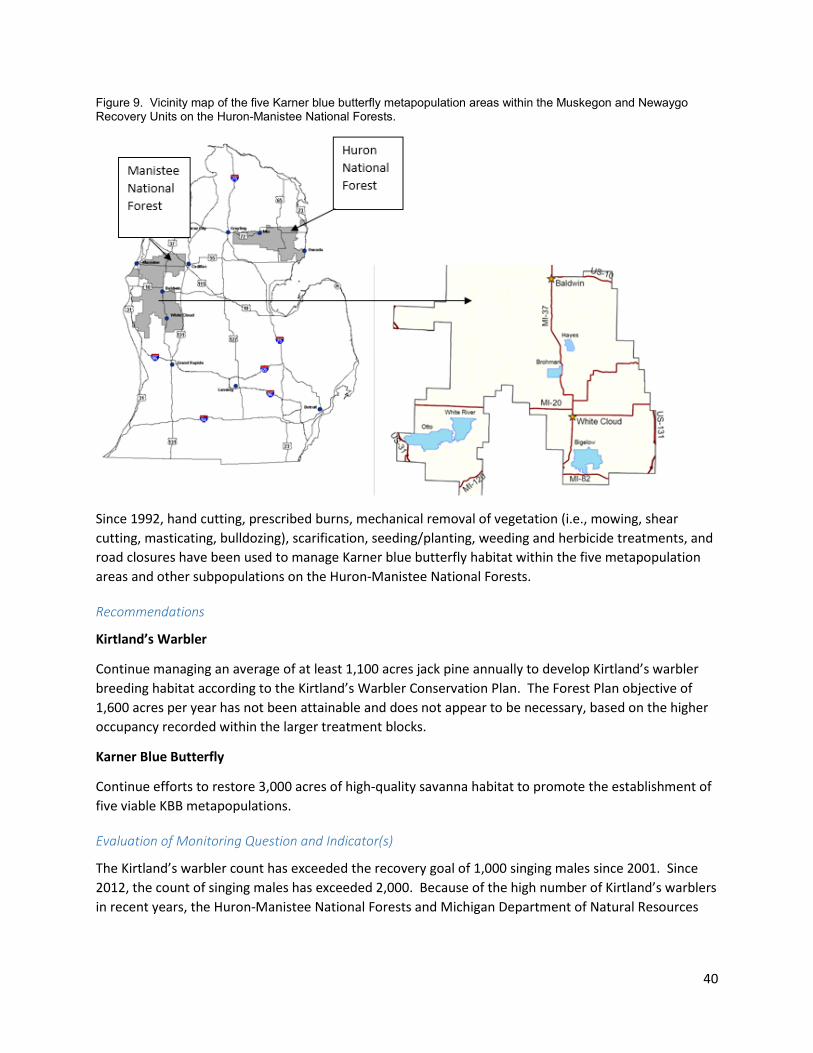
40
Figure 9. Vicinity map of the five Karner blue butterfly metapopulation areas within the Muskegon and Newaygo Recovery Units on the Huron-Manistee National Forests.
Since 1992, hand cutting, prescribed burns, mechanical removal of vegetation (i.e., mowing, shear cutting, masticating, bulldozing), scarification, seeding/planting, weeding and herbicide treatments, and road closures have been used to manage Karner blue butterfly habitat within the five metapopulation areas and other subpopulations on the Huron-Manistee National Forests.
Recommendations
Kirtland’s Warbler
Continue managing an average of at least 1,100 acres jack pine annually to develop Kirtland’s warbler breeding habitat according to the Kirtland’s Warbler Conservation Plan. The Forest Plan objective of 1,600 acres per year has not been attainable and does not appear to be necessary, based on the higher occupancy recorded within the larger treatment blocks.
Karner Blue Butterfly
Continue efforts to restore 3,000 acres of high-quality savanna habitat to promote the establishment of five viable KBB metapopulations.
Evaluation of Monitoring Question and Indicator(s)
The Kirtland’s warbler count has exceeded the recovery goal of 1,000 singing males since 2001. Since 2012, the count of singing males has exceeded 2,000. Because of the high number of Kirtland’s warblers in recent years, the Huron-Manistee National Forests and Michigan Department of Natural Resources
41
are now conducting the Kirtland’s warbler census or survey every other year (starting in 2017), and therefore no rangewide total is available for every other year.
The Huron-Manistee National Forests should continue collecting presence/absence data for the Karner blue butterfly and estimate Karner blue butterfly abundance at least every 3 years.
References
Michigan Department of Natural Resources, U.S. Fish and Wildlife Service, and U.S. Forest Service. (2015). Kirtland's Warbler Breeding Range Conservation Plan. Lansing, MI: MDNR.
Probst, J. R. (2005). Comparing census methods for the endangered Kirtland's Warbler. Journal of Field Ornithology, 76(1):50-60, 2005.
US Fish and Wildlife Service. (2003). Karner Blue Butterfly Recovery Plan. Fort Snelling, MN: Department of Interior, US Fish and Wildlife Service.
US Forest Service. (2015). Karner Blue Butterfly Survey Protocols. Cadillac, MI: Huron-Manistee National Forests.
US Forest Service, MDNR. (2017). Instructions for the Kirtland's Warbler Census. June 6 through June 20, 2017. Cadillac, MI: USDA Forest Service, Huron-Manistee National Forests.
5.4 – Visitor Use and Satisfaction
5.41 – Monitoring Question
What is the status of visitor use and visitor satisfaction?
Last Updated
This question was added 4/24/2016 to meet the requirements of the 2012 Planning Rule.
Monitoring Indicator(s)
National Visitor Use Monitoring (NVUM) data report • Annual Visitation Estimates (by type of visit - day use, developed, general forest area,
designated wilderness visits) • Description of Visit (demographics, visit descriptions, activities) • Economic Information (spending, substitute behavior, etc.) • Visitor Satisfaction • Wilderness Visit Demographics
Monitoring Frequency
This will be monitored at least once every 5 years. It will next be reported in 2023.
42
Background & Driver(s)
This monitoring question addresses monitoring topics number 5 within 36 CFR 219.12(a)(5)(v): The Status of Visitor Use, Visitor Satisfaction, and Progress Toward Meeting Recreation Objectives.
The National Visitor Use Monitoring survey completed on Forests across the nation will be used to monitor visitor satisfaction and visitor numbers. The national program has been implemented across the nation and is the only survey of visitors that takes place on a regular basis to track trends in visitation to the Forests.
NVUM methodology and analysis is explained in detail in the research paper entitled: Forest Service National Visitor Use Monitoring Process: Research Method Documentation; English, Kocis, Zarnoch, and Arnold; Southern Research Station; May 2002 (http://www.fs.fed.us/recreation/programs/nvum).
Monitoring Indicator 1- FY17 NVUM Data Report - Annual Visitation Estimates (by type of visit - day use, developed, general forest area, designated wilderness visits)
Results and Discussion
The Huron-Manistee National Forests completed Round 4 of National Visitor Use Monitoring in 2017. His monitoring report will compare Round 4 results with results from rounds 1, 2, and 3 (which were completed in FY 2001, FY 2007, and FY 2012 respectively).
The FY 2017 Visitor Use Report includes the following results:
• Annual Visitation Estimates (by type of visit - day use, developed, general forest area, designated wilderness visits)
• Description of Visit (demographics, visit descriptions, activities) • Economic Information (spending, substitute behavior, etc.) • Visitor Satisfaction • Wilderness Visit Demographics
Annual Visitation Estimates
Total National Forest Site Visits for FY17 are estimated to be 1,758,000. This is defined as the entry of one person upon a national forest to participate in recreation activities for an unspecified amount of time. One National Forest visit can be composed of multiple site visits.
Total visitation in FY2001 was estimated to be 1,451,000, in FY2007 the estimate was 4,063,000, and in FY2012 the total was 2,085,000. According to these results, overall use has declined from FY2012.
Visitation by type of visit is demonstrated below. A majority (82 percent) of visitors recreate in the general forest area, which includes rivers, trails and dispersed use outside of day use and campground facilities. Compared to the past two rounds of data, day use has declined slightly and overnight use and Wilderness visits have remained the same. Visitation to the general forest area has continually increased. Round 1 data did not estimate visitation by type of visit so there is no comparison with FY2001 available.
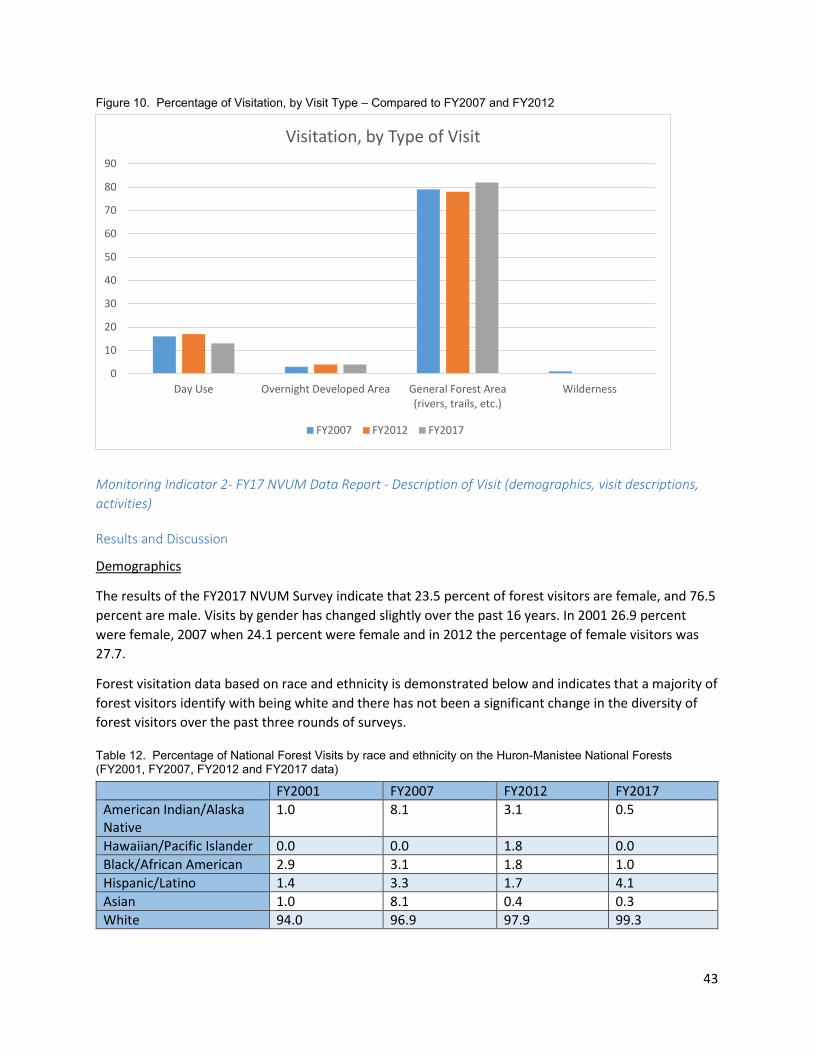
43
Figure 10. Percentage of Visitation, by Visit Type – Compared to FY2007 and FY2012
Monitoring Indicator 2- FY17 NVUM Data Report - Description of Visit (demographics, visit descriptions, activities)
Results and Discussion
Demographics
The results of the FY2017 NVUM Survey indicate that 23.5 percent of forest visitors are female, and 76.5 percent are male. Visits by gender has changed slightly over the past 16 years. In 2001 26.9 percent were female, 2007 when 24.1 percent were female and in 2012 the percentage of female visitors was 27.7.
Forest visitation data based on race and ethnicity is demonstrated below and indicates that a majority of forest visitors identify with being white and there has not been a significant change in the diversity of forest visitors over the past three rounds of surveys.
Table 12. Percentage of National Forest Visits by race and ethnicity on the Huron-Manistee National Forests (FY2001, FY2007, FY2012 and FY2017 data)
FY2001 FY2007 FY2012 FY2017 American Indian/Alaska Native
1.0 8.1 3.1 0.5
Hawaiian/Pacific Islander 0.0 0.0 1.8 0.0 Black/African American 2.9 3.1 1.8 1.0 Hispanic/Latino 1.4 3.3 1.7 4.1 Asian 1.0 8.1 0.4 0.3 White 94.0 96.9 97.9 99.3
0
10
20
30
40
50
60
70
80
90
Day Use Overnight Developed Area General Forest Area(rivers, trails, etc.)
Wilderness
Visitation, by Type of Visit
FY2007 FY2012 FY2017
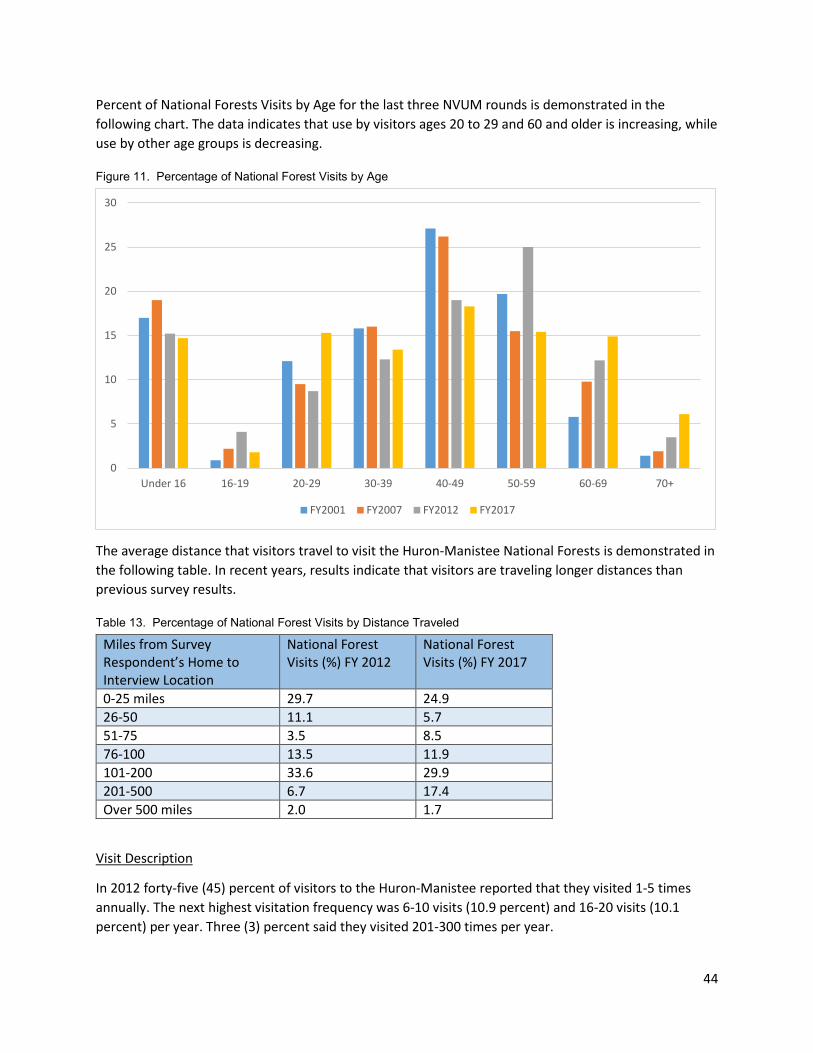
44
Percent of National Forests Visits by Age for the last three NVUM rounds is demonstrated in the following chart. The data indicates that use by visitors ages 20 to 29 and 60 and older is increasing, while use by other age groups is decreasing.
Figure 11. Percentage of National Forest Visits by Age
The average distance that visitors travel to visit the Huron-Manistee National Forests is demonstrated in the following table. In recent years, results indicate that visitors are traveling longer distances than previous survey results.
Table 13. Percentage of National Forest Visits by Distance Traveled
Miles from Survey Respondent’s Home to Interview Location
National Forest Visits (%) FY 2012
National Forest Visits (%) FY 2017
0-25 miles 29.7 24.9 26-50 11.1 5.7 51-75 3.5 8.5 76-100 13.5 11.9 101-200 33.6 29.9 201-500 6.7 17.4 Over 500 miles 2.0 1.7
Visit Description
In 2012 forty-five (45) percent of visitors to the Huron-Manistee reported that they visited 1-5 times annually. The next highest visitation frequency was 6-10 visits (10.9 percent) and 16-20 visits (10.1 percent) per year. Three (3) percent said they visited 201-300 times per year.
0
5
10
15
20
25
30
Under 16 16-19 20-29 30-39 40-49 50-59 60-69 70+
FY2001 FY2007 FY2012 FY2017
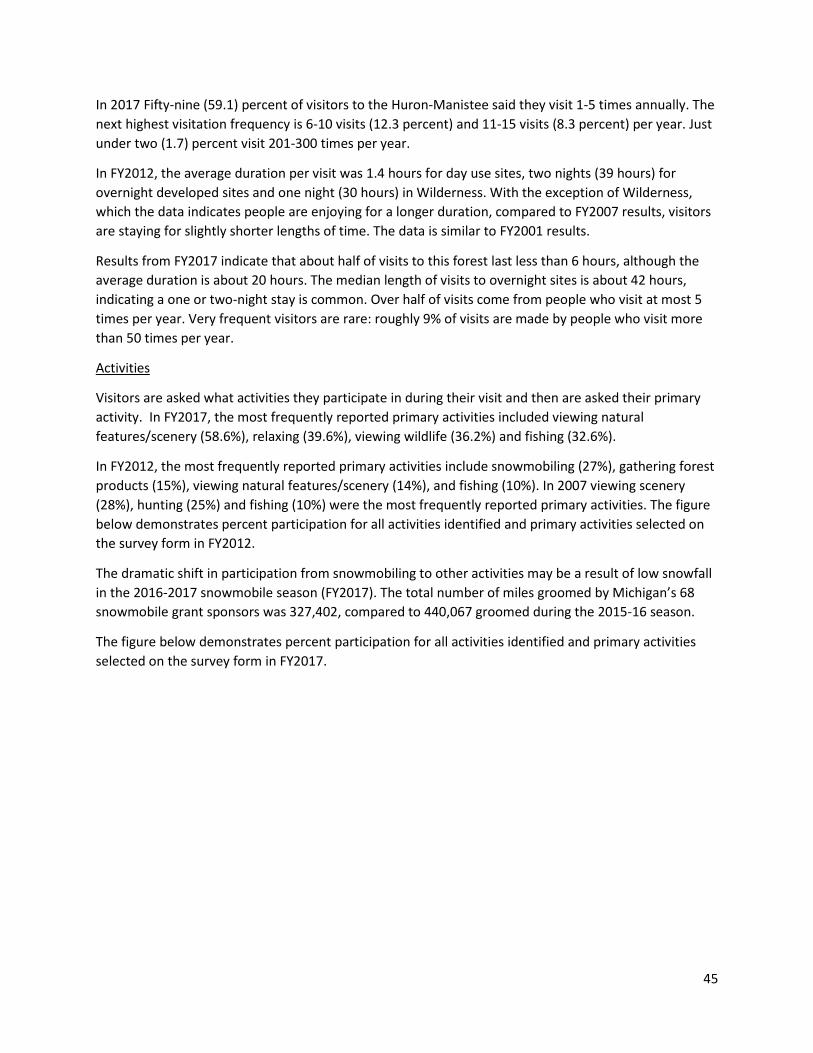
45
In 2017 Fifty-nine (59.1) percent of visitors to the Huron-Manistee said they visit 1-5 times annually. The next highest visitation frequency is 6-10 visits (12.3 percent) and 11-15 visits (8.3 percent) per year. Just under two (1.7) percent visit 201-300 times per year.
In FY2012, the average duration per visit was 1.4 hours for day use sites, two nights (39 hours) for overnight developed sites and one night (30 hours) in Wilderness. With the exception of Wilderness, which the data indicates people are enjoying for a longer duration, compared to FY2007 results, visitors are staying for slightly shorter lengths of time. The data is similar to FY2001 results.
Results from FY2017 indicate that about half of visits to this forest last less than 6 hours, although the average duration is about 20 hours. The median length of visits to overnight sites is about 42 hours, indicating a one or two-night stay is common. Over half of visits come from people who visit at most 5 times per year. Very frequent visitors are rare: roughly 9% of visits are made by people who visit more than 50 times per year.
Activities
Visitors are asked what activities they participate in during their visit and then are asked their primary activity. In FY2017, the most frequently reported primary activities included viewing natural features/scenery (58.6%), relaxing (39.6%), viewing wildlife (36.2%) and fishing (32.6%).
In FY2012, the most frequently reported primary activities include snowmobiling (27%), gathering forest products (15%), viewing natural features/scenery (14%), and fishing (10%). In 2007 viewing scenery (28%), hunting (25%) and fishing (10%) were the most frequently reported primary activities. The figure below demonstrates percent participation for all activities identified and primary activities selected on the survey form in FY2012.
The dramatic shift in participation from snowmobiling to other activities may be a result of low snowfall in the 2016-2017 snowmobile season (FY2017). The total number of miles groomed by Michigan’s 68 snowmobile grant sponsors was 327,402, compared to 440,067 groomed during the 2015-16 season.
The figure below demonstrates percent participation for all activities identified and primary activities selected on the survey form in FY2017.
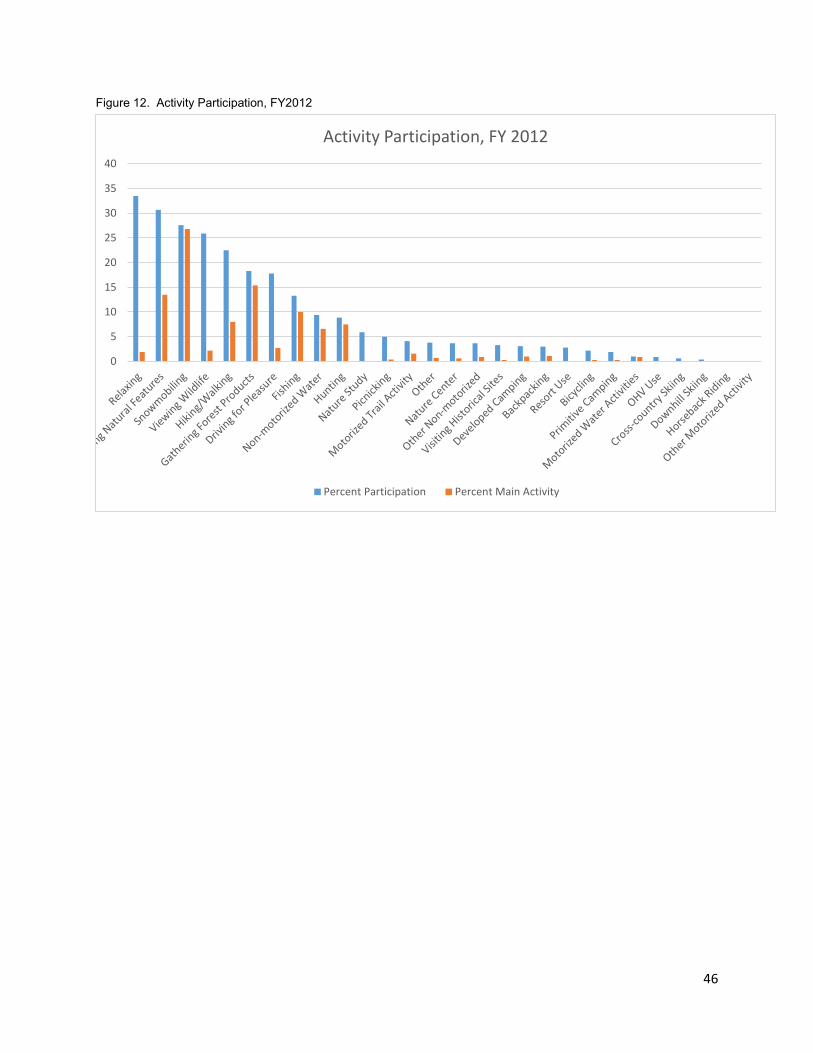
46
Figure 12. Activity Participation, FY2012
0
5
10
15
20
25
30
35
40
Activity Participation, FY 2012
Percent Participation Percent Main Activity
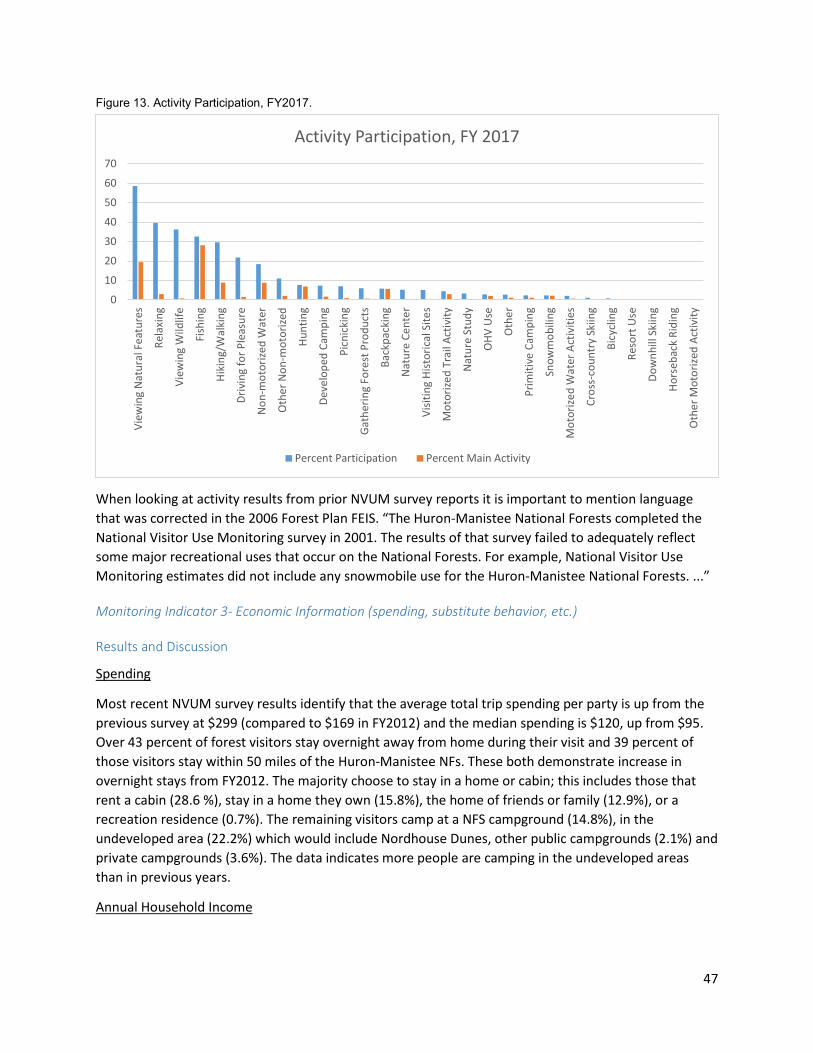
47
Figure 13. Activity Participation, FY2017.
When looking at activity results from prior NVUM survey reports it is important to mention language that was corrected in the 2006 Forest Plan FEIS. “The Huron-Manistee National Forests completed the National Visitor Use Monitoring survey in 2001. The results of that survey failed to adequately reflect some major recreational uses that occur on the National Forests. For example, National Visitor Use Monitoring estimates did not include any snowmobile use for the Huron-Manistee National Forests. ...”
Monitoring Indicator 3- Economic Information (spending, substitute behavior, etc.)
Results and Discussion
Spending
Most recent NVUM survey results identify that the average total trip spending per party is up from the previous survey at $299 (compared to $169 in FY2012) and the median spending is $120, up from $95. Over 43 percent of forest visitors stay overnight away from home during their visit and 39 percent of those visitors stay within 50 miles of the Huron-Manistee NFs. These both demonstrate increase in overnight stays from FY2012. The majority choose to stay in a home or cabin; this includes those that rent a cabin (28.6 %), stay in a home they own (15.8%), the home of friends or family (12.9%), or a recreation residence (0.7%). The remaining visitors camp at a NFS campground (14.8%), in the undeveloped area (22.2%) which would include Nordhouse Dunes, other public campgrounds (2.1%) and private campgrounds (3.6%). The data indicates more people are camping in the undeveloped areas than in previous years.
Annual Household Income
0
10
20
30
40
50
60
70
View
ing
Nat
ural
Fea
ture
s
Rela
View
ing
Wild
life
Fish
ing
Hiki
ng/W
alki
ng
Driv
ing
for P
leas
ure
Non
-mot
orize
d W
ater
Oth
er N
on-m
otor
ized
Hunt
ing
Deve
lope
d Ca
mpi
ng
Picn
icki
ng
Gath
erin
g Fo
rest
Pro
duct
s
Back
pack
ing
Nat
ure
Cent
er
Visit
ing
Hist
oric
al S
ites
Mot
orize
d Tr
ail A
ctiv
ity
Nat
ure
Stud
y
OHV
Use
Oth
er
Prim
itive
Cam
ping
Snow
mob
iling
Mot
orize
d W
ater
Act
iviti
es
Cros
s-co
untr
y Sk
iing
Bicy
clin
g
Reso
rt U
se
Dow
nhill
Ski
ing
Hors
ebac
k Ri
ding
Oth
er M
otor
ized
Activ
ity
Activity Participation, FY 2017
Percent Participation Percent Main Activity
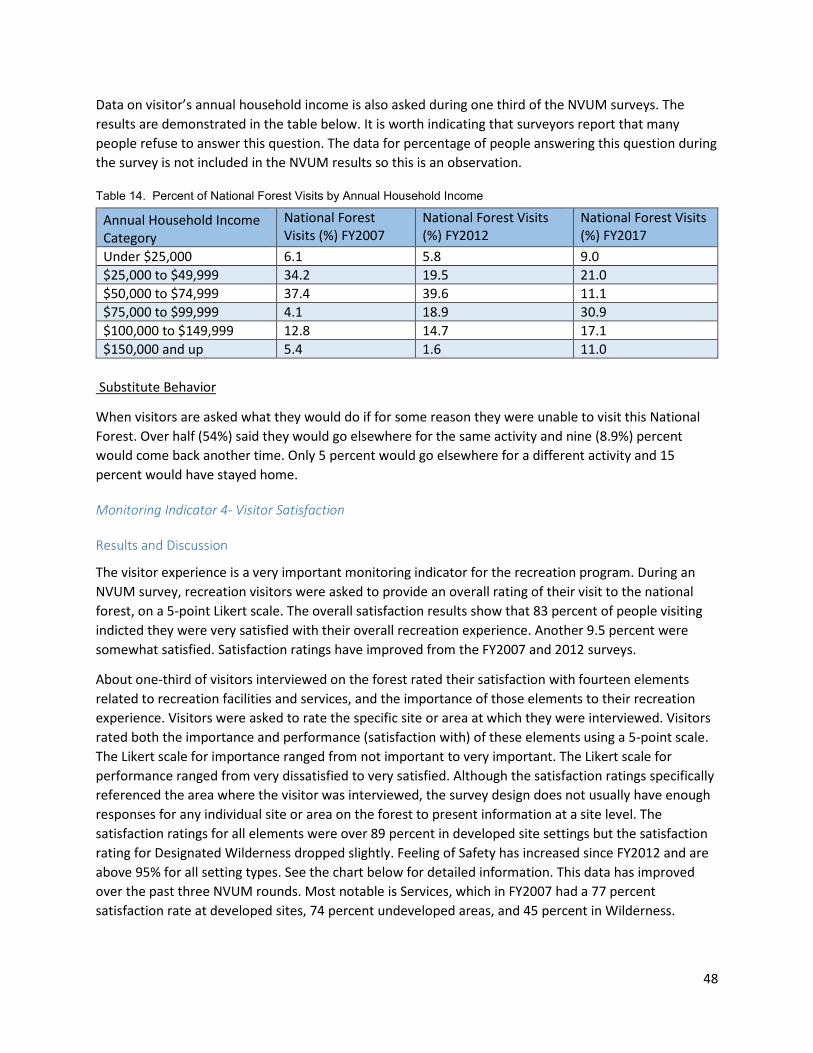
48
Data on visitor’s annual household income is also asked during one third of the NVUM surveys. The results are demonstrated in the table below. It is worth indicating that surveyors report that many people refuse to answer this question. The data for percentage of people answering this question during the survey is not included in the NVUM results so this is an observation.
Table 14. Percent of National Forest Visits by Annual Household Income
Annual Household Income Category
National Forest Visits (%) FY2007
National Forest Visits (%) FY2012
National Forest Visits (%) FY2017
Under $25,000 6.1 5.8 9.0 $25,000 to $49,999 34.2 19.5 21.0 $50,000 to $74,999 37.4 39.6 11.1 $75,000 to $99,999 4.1 18.9 30.9 $100,000 to $149,999 12.8 14.7 17.1 $150,000 and up 5.4 1.6 11.0
Substitute Behavior
When visitors are asked what they would do if for some reason they were unable to visit this National Forest. Over half (54%) said they would go elsewhere for the same activity and nine (8.9%) percent would come back another time. Only 5 percent would go elsewhere for a different activity and 15 percent would have stayed home.
Monitoring Indicator 4- Visitor Satisfaction
Results and Discussion
The visitor experience is a very important monitoring indicator for the recreation program. During an NVUM survey, recreation visitors were asked to provide an overall rating of their visit to the national forest, on a 5-point Likert scale. The overall satisfaction results show that 83 percent of people visiting indicted they were very satisfied with their overall recreation experience. Another 9.5 percent were somewhat satisfied. Satisfaction ratings have improved from the FY2007 and 2012 surveys.
About one-third of visitors interviewed on the forest rated their satisfaction with fourteen elements related to recreation facilities and services, and the importance of those elements to their recreation experience. Visitors were asked to rate the specific site or area at which they were interviewed. Visitors rated both the importance and performance (satisfaction with) of these elements using a 5-point scale. The Likert scale for importance ranged from not important to very important. The Likert scale for performance ranged from very dissatisfied to very satisfied. Although the satisfaction ratings specifically referenced the area where the visitor was interviewed, the survey design does not usually have enough responses for any individual site or area on the forest to present information at a site level. The satisfaction ratings for all elements were over 89 percent in developed site settings but the satisfaction rating for Designated Wilderness dropped slightly. Feeling of Safety has increased since FY2012 and are above 95% for all setting types. See the chart below for detailed information. This data has improved over the past three NVUM rounds. Most notable is Services, which in FY2007 had a 77 percent satisfaction rate at developed sites, 74 percent undeveloped areas, and 45 percent in Wilderness.
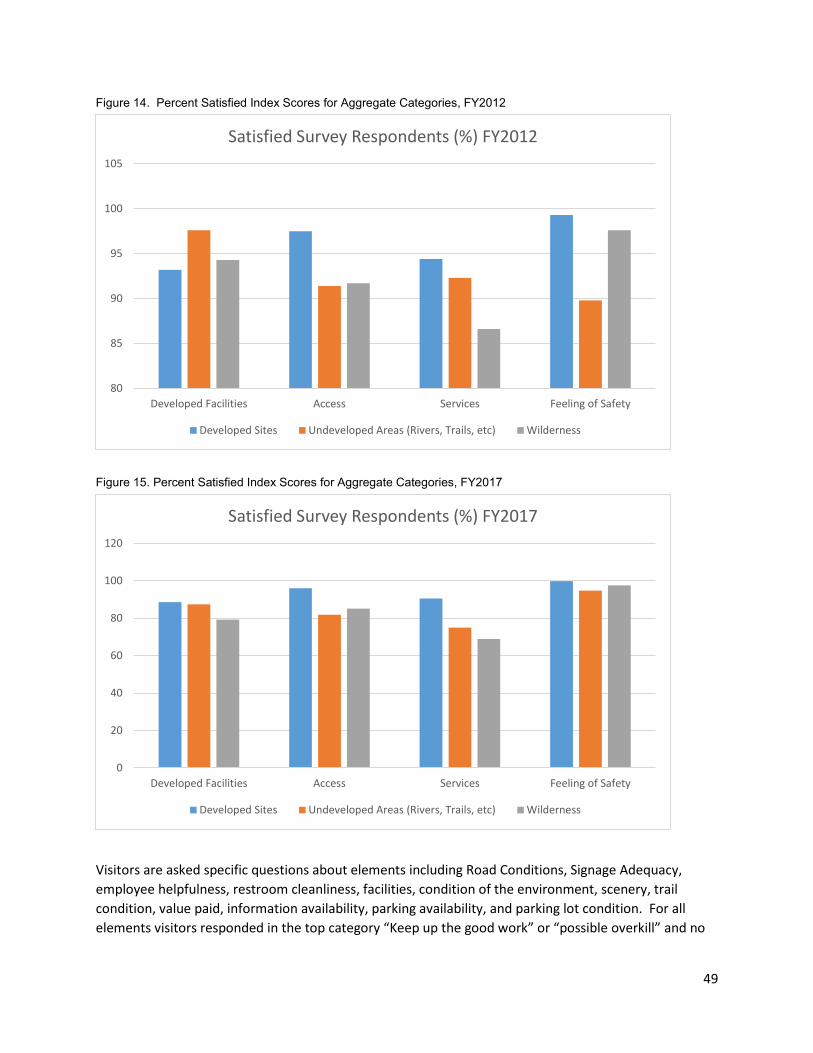
49
Figure 14. Percent Satisfied Index Scores for Aggregate Categories, FY2012
Figure 15. Percent Satisfied Index Scores for Aggregate Categories, FY2017
Visitors are asked specific questions about elements including Road Conditions, Signage Adequacy, employee helpfulness, restroom cleanliness, facilities, condition of the environment, scenery, trail condition, value paid, information availability, parking availability, and parking lot condition. For all elements visitors responded in the top category “Keep up the good work” or “possible overkill” and no
80
85
90
95
100
105
Developed Facilities Access Services Feeling of Safety
Satisfied Survey Respondents (%) FY2012
Developed Sites Undeveloped Areas (Rivers, Trails, etc) Wilderness
0
20
40
60
80
100
120
Developed Facilities Access Services Feeling of Safety
Satisfied Survey Respondents (%) FY2017
Developed Sites Undeveloped Areas (Rivers, Trails, etc) Wilderness
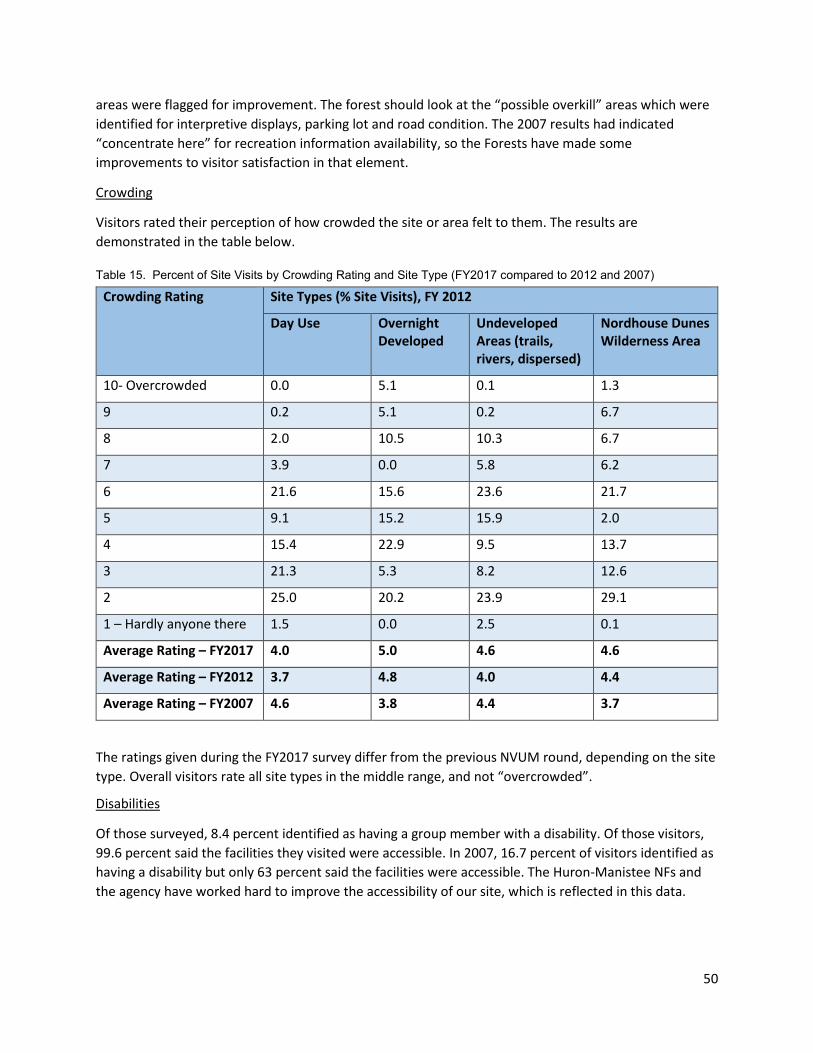
50
areas were flagged for improvement. The forest should look at the “possible overkill” areas which were identified for interpretive displays, parking lot and road condition. The 2007 results had indicated “concentrate here” for recreation information availability, so the Forests have made some improvements to visitor satisfaction in that element.
Crowding
Visitors rated their perception of how crowded the site or area felt to them. The results are demonstrated in the table below.
Table 15. Percent of Site Visits by Crowding Rating and Site Type (FY2017 compared to 2012 and 2007)
Crowding Rating Site Types (% Site Visits), FY 2012
Day Use Overnight Developed
Undeveloped Areas (trails, rivers, dispersed)
Nordhouse Dunes Wilderness Area
10- Overcrowded 0.0 5.1 0.1 1.3
9 0.2 5.1 0.2 6.7
8 2.0 10.5 10.3 6.7
7 3.9 0.0 5.8 6.2
6 21.6 15.6 23.6 21.7
5 9.1 15.2 15.9 2.0
4 15.4 22.9 9.5 13.7
3 21.3 5.3 8.2 12.6
2 25.0 20.2 23.9 29.1
1 – Hardly anyone there 1.5 0.0 2.5 0.1
Average Rating – FY2017 4.0 5.0 4.6 4.6
Average Rating – FY2012 3.7 4.8 4.0 4.4
Average Rating – FY2007 4.6 3.8 4.4 3.7
The ratings given during the FY2017 survey differ from the previous NVUM round, depending on the site type. Overall visitors rate all site types in the middle range, and not “overcrowded”.
Disabilities
Of those surveyed, 8.4 percent identified as having a group member with a disability. Of those visitors, 99.6 percent said the facilities they visited were accessible. In 2007, 16.7 percent of visitors identified as having a disability but only 63 percent said the facilities were accessible. The Huron-Manistee NFs and the agency have worked hard to improve the accessibility of our site, which is reflected in this data.
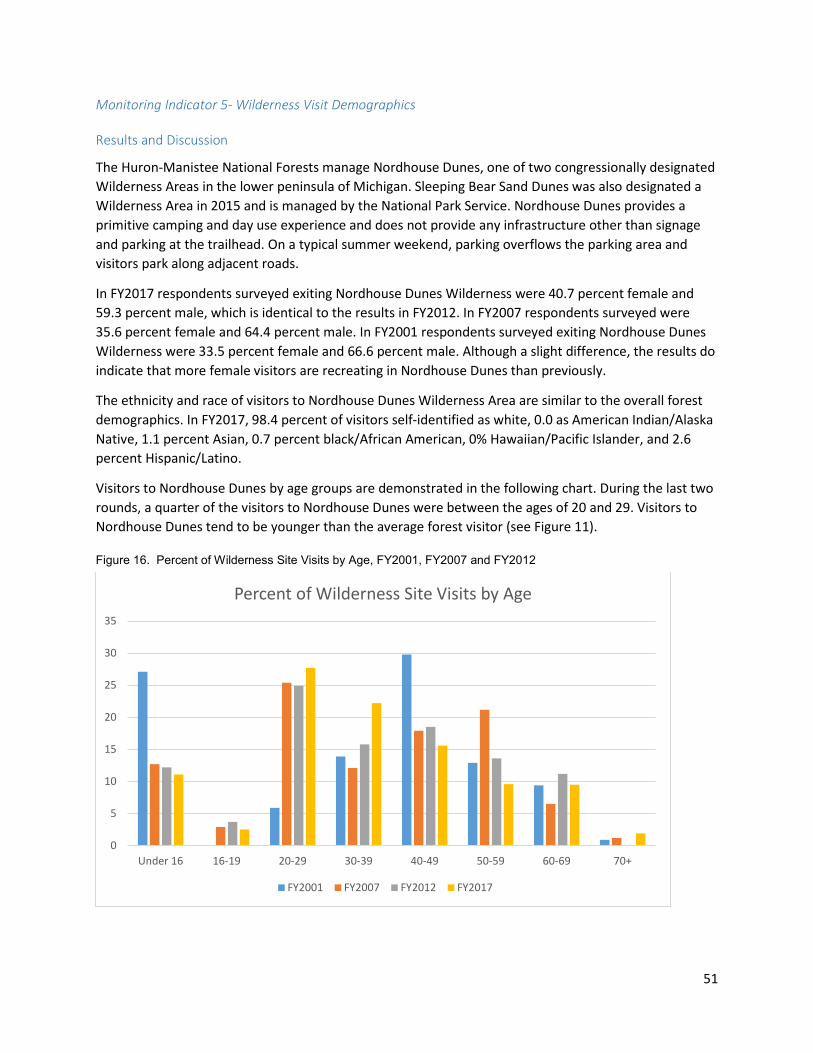
51
Monitoring Indicator 5- Wilderness Visit Demographics
Results and Discussion
The Huron-Manistee National Forests manage Nordhouse Dunes, one of two congressionally designated Wilderness Areas in the lower peninsula of Michigan. Sleeping Bear Sand Dunes was also designated a Wilderness Area in 2015 and is managed by the National Park Service. Nordhouse Dunes provides a primitive camping and day use experience and does not provide any infrastructure other than signage and parking at the trailhead. On a typical summer weekend, parking overflows the parking area and visitors park along adjacent roads.
In FY2017 respondents surveyed exiting Nordhouse Dunes Wilderness were 40.7 percent female and 59.3 percent male, which is identical to the results in FY2012. In FY2007 respondents surveyed were 35.6 percent female and 64.4 percent male. In FY2001 respondents surveyed exiting Nordhouse Dunes Wilderness were 33.5 percent female and 66.6 percent male. Although a slight difference, the results do indicate that more female visitors are recreating in Nordhouse Dunes than previously.
The ethnicity and race of visitors to Nordhouse Dunes Wilderness Area are similar to the overall forest demographics. In FY2017, 98.4 percent of visitors self-identified as white, 0.0 as American Indian/Alaska Native, 1.1 percent Asian, 0.7 percent black/African American, 0% Hawaiian/Pacific Islander, and 2.6 percent Hispanic/Latino.
Visitors to Nordhouse Dunes by age groups are demonstrated in the following chart. During the last two rounds, a quarter of the visitors to Nordhouse Dunes were between the ages of 20 and 29. Visitors to Nordhouse Dunes tend to be younger than the average forest visitor (see Figure 11).
Figure 16. Percent of Wilderness Site Visits by Age, FY2001, FY2007 and FY2012
0
5
10
15
20
25
30
35
Under 16 16-19 20-29 30-39 40-49 50-59 60-69 70+
Percent of Wilderness Site Visits by Age
FY2001 FY2007 FY2012 FY2017

52
Discussion of NVUM Results
NVUM results indicate that the recreation opportunities provided to visitors align with the forest-wide goals and objectives.
Applicable forest wide goal and objectives identified in the Forest Plan include:
• Provide a variety of access opportunities for a range of user abilities consistent with management area direction and Standards and Guidelines. (G-NR-29)”
• Provide for a combination of motorized and nonmotorized recreation opportunities (G-NR-28)”
• Use a combination of personal contacts, brochures, maps, and informational signing to inform and educate users about forest management. (G-PR&P-6 )
• Provide for Law Enforcement and compliance patrols based on user activity and resource protection needs (G H&S-9)
The Huron-Manistee National Forests provide opportunities for a range of recreation opportunities such as hiking, camping, hunting, fishing, picnicking, non-motorized watercraft, snowmobiling, motorized trail use, driving for pleasure and gathering forest products (Forest Plan FEIS, Chapter 3). NVUM results indicate that visitors are enjoying a range of opportunities consistent with the opportunities identified in the Forest Plan. Forest recreations staff made improvements to site identification in the pre-work phase of NVUM, and included more sites located at trailheads. This change helped identify trail users more accurately, which is reflected in the activities results.
Overall recreation visitors to the Huron-Manistee National Forests are highly satisfied with their visits, which aligns with agency and Forest Plan objectives, goals and desired conditions. Additionally, the last round of NVUM did not indicate specific areas that needed improvement (see Visitor Satisfaction), unlike previous rounds. More visitors responded with a higher percentage of accessibility, which is another area that the HMNFs are striving to improve with infrastructure improvements.
Total visitation numbers changed slightly between the previous 3 rounds but between round 1 (FY2001) and round 4 (FY2017) use has increased. Despite increased visitation there is not an increase in crowding, which may indicate the use is spread out.
The results of visitor demographics data indicate that visitors of all ages and income ranges are recreating on the forest, however visitors continue to predominately identify with one ethnic and racial group, which is white. The HMNF should look at opportunities to welcome a more ethnically-diverse visitor population to more reflect the population of the United States.
Recommendations
Based on the above discussion, there are no recommendations to change the Forest Plan based on visitor use monitoring.
Evaluation of Monitoring Question and Indicator(s)
Using National Visitor Use Monitoring Surveys as a monitoring indicator is the best tool we have to measure use, demographics and overall satisfaction. The agency is working to improve the format of the surveys to more align with modern technology, which will help.

53
References
USDA Forest Service Huron-Manistee National Forest, Recreation Supply and Demand Analysis. January 2012.
USDA Forest Service, National Visitor Use Monitoring Process: Research Method Documentation; English, Kocis, Zarnoch, and Arnold; Southern Research Station; May 2002 (http://www.fs.fed.us/recreation/programs/nvum).
USDA Forest Service, Southern Research Station. Research Paper SRS-37. An Outdoor Recreation Use Model with Applications to Evaluating Survey Estimators. Stanley J. Zarnoch, Donald B.K. English, and Susan M. Kocis. September 2005.
5.5 – Pests and Pathogens
5.51 – Monitoring Question
How are the occurrence, intensity, and distribution of pests and pathogens changing on an annual basis?
Last Updated
This question was added 4/24/2016 to meet the requirements of the 2012 Planning Rule.
Monitoring Indicator(s)
Acres infected /infested and insects and diseases found on the Forests.
Monitoring Frequency
This will be monitored annually.
Background & Driver(s)
This monitoring question addresses monitoring topic number 6 within 36 CFR 219.12(a)(5)(vi): Measurable Changes on the Plan Area Related to Climate Change and Other Stressors That may be Affecting the Plan Area. Forest pest and pathogen occurrence and extent can be affected by climate, so tracking trends and new pest and pathogens may indicate changes to the forest associated with climate change. The Forests are flown annually by the Research Station staff who use visual observations, photographic and satellite imagery to map areas of forest infestation or infection. Flights are flown along flight lines that normally run at 3.45 miles apart, but vary with visibility, time constraints or in areas of special concern. Flights are normally flown at 1500 to 2000 feet above the terrain, but height also varies with visibility during the flight. Flights are normally made in mid to late July and are generally coordinated with the Michigan DNR’s flights.
A portion of areas identified are spot checked after the flights to verify data.
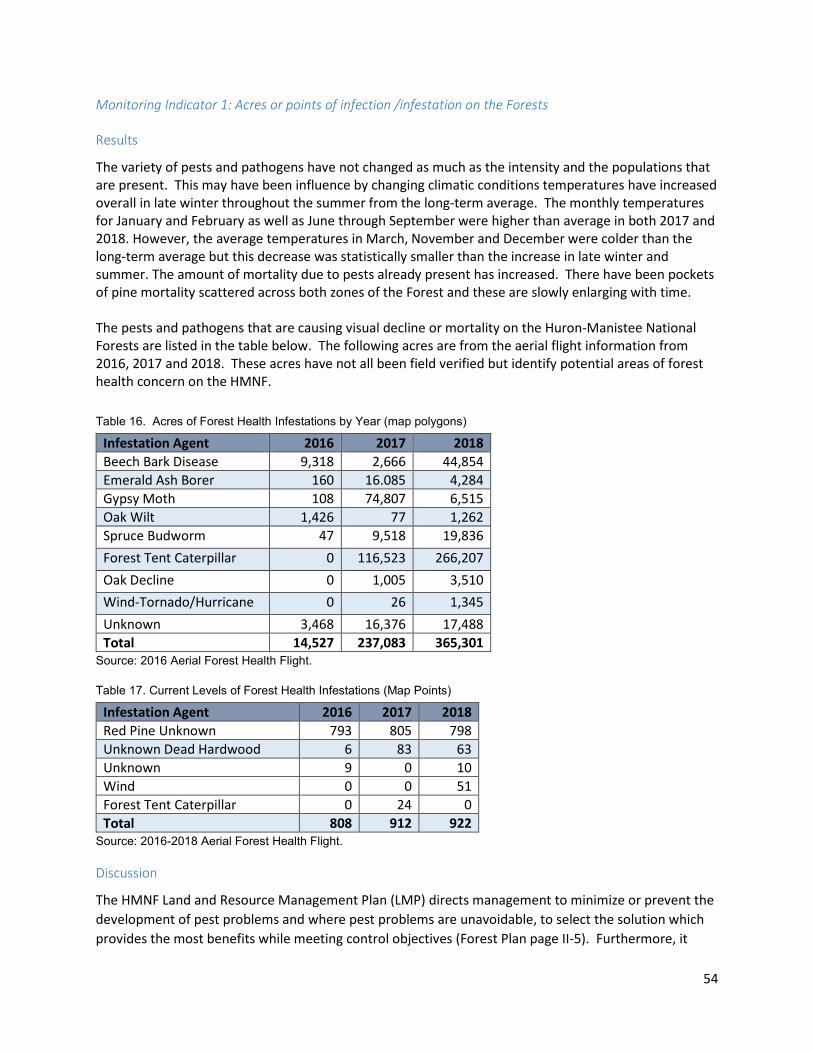
54
Monitoring Indicator 1: Acres or points of infection /infestation on the Forests
Results
The variety of pests and pathogens have not changed as much as the intensity and the populations that are present. This may have been influence by changing climatic conditions temperatures have increased overall in late winter throughout the summer from the long-term average. The monthly temperatures for January and February as well as June through September were higher than average in both 2017 and 2018. However, the average temperatures in March, November and December were colder than the long-term average but this decrease was statistically smaller than the increase in late winter and summer. The amount of mortality due to pests already present has increased. There have been pockets of pine mortality scattered across both zones of the Forest and these are slowly enlarging with time. The pests and pathogens that are causing visual decline or mortality on the Huron-Manistee National Forests are listed in the table below. The following acres are from the aerial flight information from 2016, 2017 and 2018. These acres have not all been field verified but identify potential areas of forest health concern on the HMNF.
Table 16. Acres of Forest Health Infestations by Year (map polygons)
Infestation Agent 2016 2017 2018 Beech Bark Disease 9,318 2,666 44,854 Emerald Ash Borer 160 16.085 4,284 Gypsy Moth 108 74,807 6,515 Oak Wilt 1,426 77 1,262 Spruce Budworm 47 9,518 19,836 Forest Tent Caterpillar 0 116,523 266,207 Oak Decline 0 1,005 3,510 Wind-Tornado/Hurricane 0 26 1,345 Unknown 3,468 16,376 17,488 Total 14,527 237,083 365,301
Source: 2016 Aerial Forest Health Flight.
Table 17. Current Levels of Forest Health Infestations (Map Points)
Infestation Agent 2016 2017 2018 Red Pine Unknown 793 805 798 Unknown Dead Hardwood 6 83 63 Unknown 9 0 10 Wind 0 0 51 Forest Tent Caterpillar 0 24 0 Total 808 912 922
Source: 2016-2018 Aerial Forest Health Flight.
Discussion
The HMNF Land and Resource Management Plan (LMP) directs management to minimize or prevent the development of pest problems and where pest problems are unavoidable, to select the solution which provides the most benefits while meeting control objectives (Forest Plan page II-5). Furthermore, it
55
mandates using management practices to control forest pests which follow Integrated Pest Management guidelines, applicable laws, regulations and policy (Page II-37) [Standard].
The tables above, show the total acres of infestation and number of points where mortality or decline is occurring on the Forest. Management practices are occurring on the Forest to control, salvage, or using research to develop appropriate management options. The following are descriptions for the infestations identified on the Forests.
Beech bark disease was first discovered in Michigan in 2000. The white scale insect is an invasive from Europe which feeds on the tree that allows the Neonectria fungi to enter and infect the tree. Trees are slowly being infected and the disease is beginning its killing front. Many beech trees have begun to “snap” and show signs of crown thinning or decline with scattered mortality starting across the Forest. Most beech stands are showing signs of scale to various degrees. Some salvage is being planned in the most recent planning areas. The majority of the mortality is on the Cadillac-Manistee Ranger District, where most of the hardwood-beech stands occur. The Forest is starting to identify trees that are potentially resistant to the scale when marking harvest stands. The Forest is coordinating with MDNR to set up resistance testing in those trees, working in concert with the Northern Research Station.
Emerald ash borer has already come through and killed most of the large ash trees on the Forests. Some of these trees have re-sprouted and are creating shrub-like sprouts surrounding the base of the tree. There is still ash regeneration occurring as seedlings and saplings within the hardwood stands, especially where ash was not a high percentage of the previous stand. In areas where ash was the primary species in the previous stand, there is more total mortality and less regeneration. Oftentimes invasive species of plants and shrubs have filled in the available growing area in these more “open” areas. Some of these “open” areas that are along riparian corridors are being replanted with native tree species and other areas are filling in with natural regeneration. The forest, working with the Brighton field lab, has used biocontrol measures in the past few years, in an attempt to develop a population of parasitoid wasps that predate on the emerald ash borer eggs or larvae. Results from those releases have not been determined.
Gypsy moth is an exotic insect introduced into Michigan in the 1950s. Gypsy moth caterpillars defoliate trees, leaving trees vulnerable to diseases and other pests, which may lead to tree mortality. They mostly feed on the leaves of oak and aspen but are found on many other plant species. The gypsy moth continues to infest and defoliate trees across the forest but mortality due to the gypsy moth is scattered and its presence more often contributes as an inciting condition to other disease problems by decreasing the vigor of forest trees. The gypsy moth population increased in 2017, defoliating many trees, but decreased in 2018. Gypsy moth will continually have outbreaks in oak and aspen forests, but they will be shorter as natural enemies that reduce caterpillar numbers become more prevalent.
Oak wilt has been a continuing problem on the Forests. New areas occur every year, even with the oak cutting restrictions from April 15 to July 15. In 2016 most of the trees identified with oak wilt were removed with salvage cutting before the pressure pads could develop on the trees to spread the fungus. The Forest continues to monitor for oak wilt through aerial surveys and some field surveys. The HMNF is working in cooperation with MDNR to both identify, and to treat oak wilt sites. Trenching is the preferred course of action, with subsequent removal of infected trees.
56
Spruce budworm is a destructive native insect that is found in the northern spruce and fir forests of the Eastern United States and Canada. The budworm larvae primarily defoliate balsam fir and white spruce, although they do some feeding on tamarack, pine, and hemlock. Widespread outbreaks occur every 30 to 50 years and mature balsam fir stands are the most severely damaged. Budworm numbers have increased from 2016 and will continue to rise as the outbreak continues. They typically last 10-15 years. However, there is a very low amount of balsam fir dominated stands on the Forests, so damage is generally minimal overall. Management is to harvest balsam fir at its rotation age of 50 years and to salvage any spruce stands with significant damage.
The HMNF continue to have forest health problems as climatic and environmental conditions change over time. The introduction of invasive forest pest and pathogens, along with invasive plant species have put a strain on our forests. There are many factors contributing declining forest health, but the amount of tree decline and disease is growing faster than our capacity to identify and address the problems.
Forest Tent Caterpillars are native to the eastern United States and Canada and feed on maple, aspen and oak. Outbreaks typically occur every eight to 12 years and the last one was in 2009-2010. It looks like the outbreak is on course as the number of acres infected has increased substantially since 2016. Gratefully, outbreaks only last from two to three years of severe defoliation on a large scale and most trees survive the defoliation. The caterpillars spin long, silken threads and mats in the trees as they feed. One of their many natural enemies that help keep populations under control, is the “friendly fly”. It does not bite and controls forest tent caterpillar populations by laying eggs on the caterpillar cocoons. Forest tent caterpillars are often confused with the Eastern tent caterpillar which is also increasing in number. They build a tent in the tree and also defoliate trees.
The HMNF continue to have forest health problems as climatic and environmental conditions change over time. The introduction of invasive forest pest and pathogens, along with invasive plant species have put a strain on our forests. There are many factors contributing declining forest health, but the amount of tree decline and disease is growing faster than our capacity to identify and address the problems.
Monitoring Indicator 2: the number of pests and pathogens present on the Forests.
Results
The number of pests and pathogens on the Forests has been steadily increasing over time, primarily due to the increase in the number of invasive insects or pathogens that have entered the United States, but also due to a resurgence of native pathogens. The maps below, made from data obtained in the 2016 and 2018 aerial forest health flight, show where the stands and points of infection occur on the Forests.
The map of the Manistee NF illustrates the large number of mortality pockets that occur across the Forest. Many of the points are red pine pocket mortality but HRD infections also occur. The shaded area in the northeast portion of the Manistee Forest is due to beech bark disease.
The map of the Huron NF, in comparison, illustrates a lower amount of pest and pathogen occurrence across the Forest. Historically, the most notable forest health problems on the Huron NF have been jack pine budworm outbreaks and small pockets of oak wilt. The problem areas mapped here are labeled as unknown since it was not possible to determine the exact cause of decline/mortality from the plane. Few of these areas have been field verified.
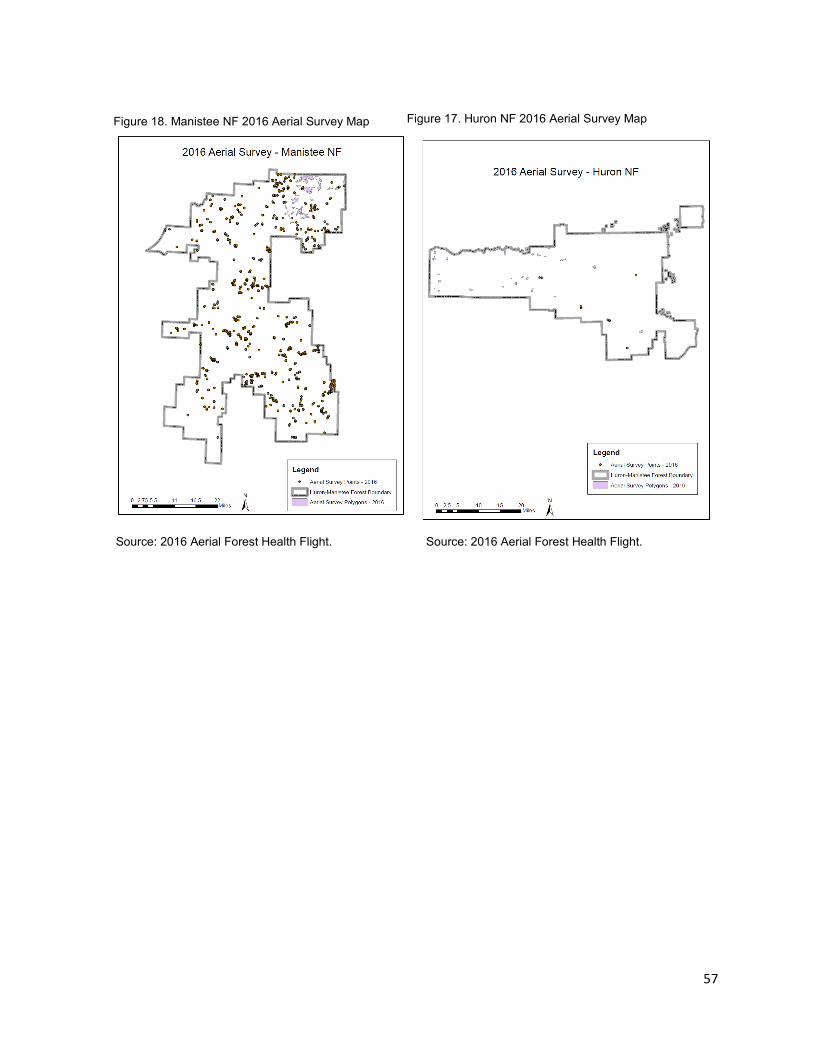
57
Source: 2016 Aerial Forest Health Flight. Source: 2016 Aerial Forest Health Flight.
Figure 18. Manistee NF 2016 Aerial Survey Map Figure 17. Huron NF 2016 Aerial Survey Map
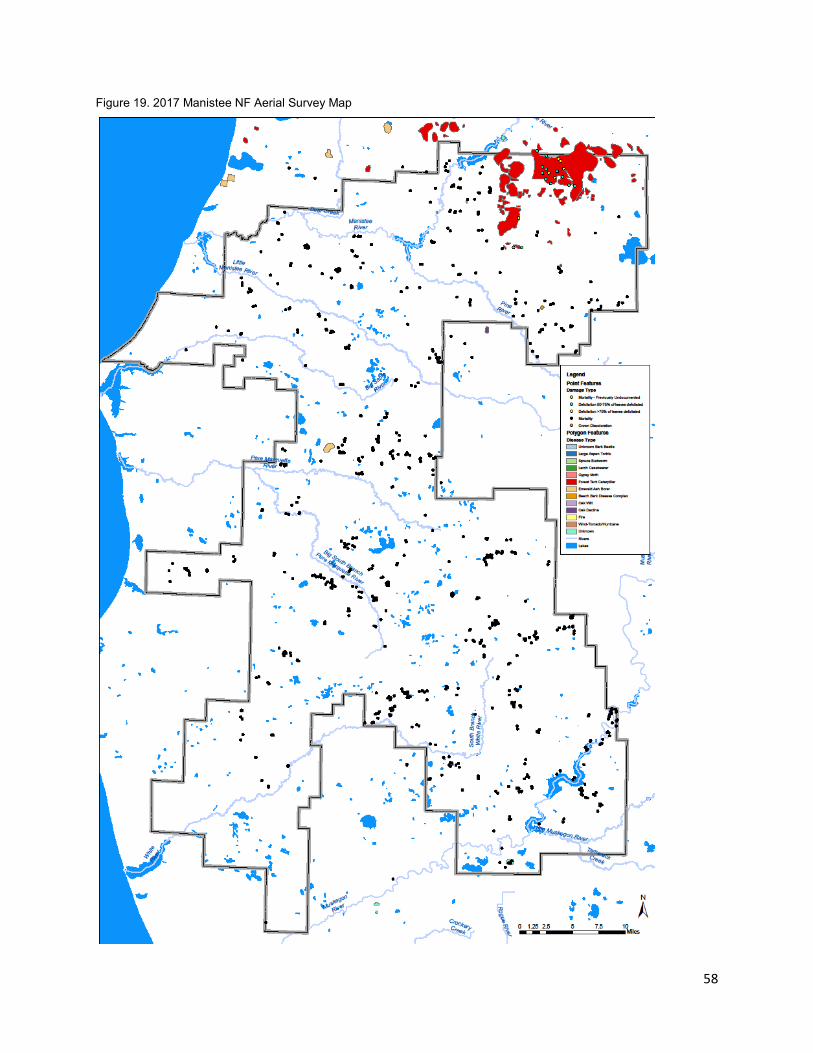
58
Figure 19. 2017 Manistee NF Aerial Survey Map
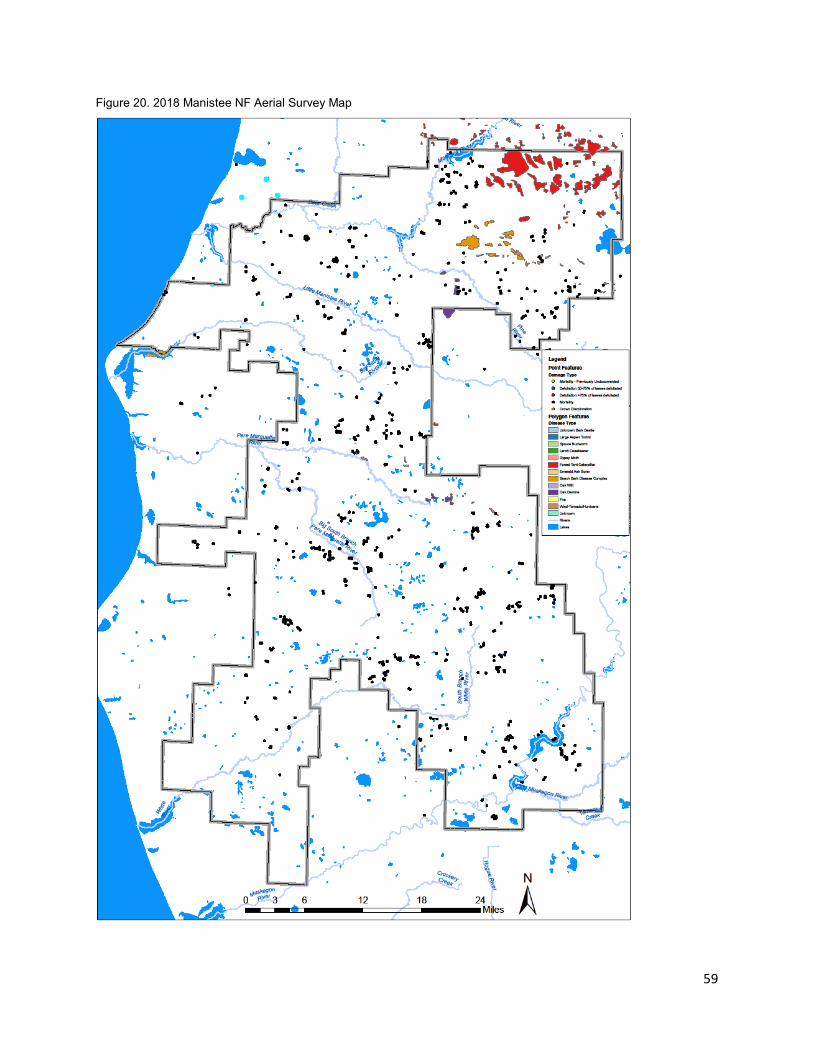
59
Figure 20. 2018 Manistee NF Aerial Survey Map
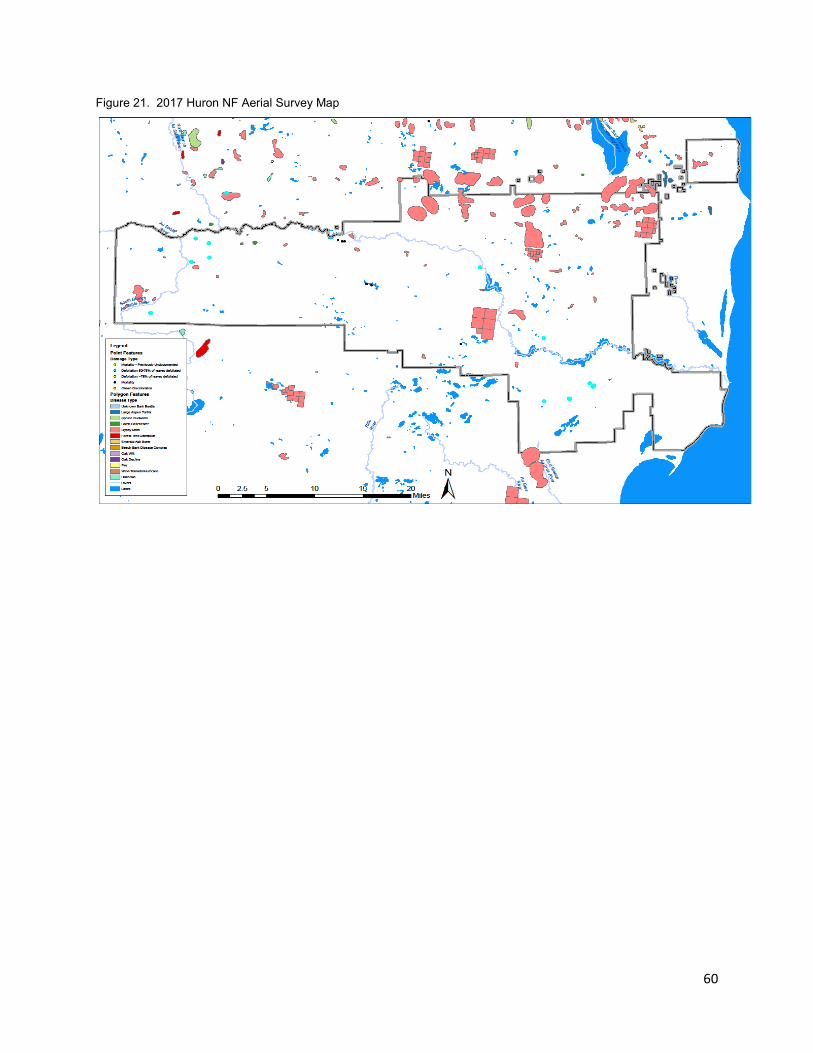
60
Figure 21. 2017 Huron NF Aerial Survey Map

61
Figure 22. 2018 Huron NF Aerial Survey Map
Discussion
There are a number of invasive forest pests that are on the Forests watchlist that have not be identified on the Forests to date but are predicted to occur soon. These include the hemlock wooly adelgid, Asian longhorned beetle, sirex woodwasp, and the spotted lanternfly. Other diseases now affecting the Forests include heterobasidion root disease and white pine decline (Caliciopsis Canker).
Hemlock Wooly Adelgid (HWA) has not yet been confirmed on the Forests. Forest health surveys completed specifically for the HWA, but field crews have been trained to look for it when they are working throughout the Forest. As of November 2018, HWA has been detected in four counties in western Michigan (Allegan, Muskegon, Oceana, and Ottawa). To slow the spread of HWA, the Michigan Dept. of Agriculture and Rural Development (MDARD) enacted an interior state quarantine effective July 5, 2017, which regulates the movement of hemlock materials out of and within the four-county area. A coordinated State-wide strategy was developed in 2017 to help manage HWA and it is currently being implemented. Treatment of infested areas began in 2017 and surveys and treatments continued into 2018 by MDNR and the Ottawa Conservation District. No infection sites have been found on the Forests to date.
Asian Longhorned Beetle (ALB) (Anoplophora glabripennis) is a large wood-boring beetle native to China and Korea. It was accidentally introduced into the U.S., probably in wood crating or pallets shipped from Asia. Maple trees are the ALB’s favorite host, but it can attack and kill many other tree species, including poplar, willow, sycamore, and horse chestnut. The nearest ALB populations known are in southern Ohio. The Beetle is transported into new areas in logs and firewood. The economic and
62
ecological impacts of ALB entering Michigan would be enormous, since North American trees have little or no resistance to infestation.
Sirex woodwasp (Sirex noctilio F.) is a nonnative, non-stinging wasp from Eurasia and N. Africa. It occurs primarily in red, Scots, and jack pine, but occasionally in white pine. Scots pine is the most susceptible. The wasp inoculates the tree with a fungus when it drills into the tree. It attacks suppressed trees and goes from smaller to larger trees as the population builds. The sirex wasp flies from the first week in July to September and peaks in late July/early August. Integrated pest management plans are to keep pines thinned and there are also bio-control nematodes and native parasitoids. Early detection is critical for successful sirex management. This could be a problem in stands managed for the Kirtland’s Warbler, where contiguous acres of dense jack pine are managed. The nearest verified location of the wasp is in the Midland area of Michigan.
Beach Leaf Disease has recently caused the decline of beech trees. Little is known about the disease, but research suggests it may be caused by a species of nematode (microscopic worm). It was first detected in 2012 and occurs in Ohio, Pennsylvania, New York and southern Ontario. Symptoms include dark, slightly thickened bands between leaf veins, leaves becoming puckered and eventually the entire canopy sparse with small yellow or dark leathery or swollen leaves. It is a disease to watch for but not yet present.
Spotted Lanternfly (Lycorma delicatula) Is an invasive planthopper native to China, India and Vietnam. It is thought to have arrived as egg masses on a stone shipment in 2012 and was discovered in eastern Pennsylvania in 2014. It is difficult to contain and now infests four states and has been sighted in four additional states. It is a potential threat to grapes, stone fruit, and some ornamental plants but host trees include apples, birch, cherry, maple, beech, some oak, poplar, tree of heaven, and many others. The distinctive and sedentary nature of this insect, and its tendency to aggregate, should make future detections likely should it become established closer to Michigan.
Heterobasidion Root Disease (HRD) is a native pathogen that is increasingly a concern on the Forests. It is most commonly found in managed forests, since freshly cut stumps provide an entry path for airborne spores of HRD. Stands that have been thinned multiple times are at high risk of infection. HRD infects primarily red, white, and jack pine and to a lesser degree, fir, spruce and tamarack. Symptoms of infection include thinner foliage, slower shoot growth, reduced height and diameter, and circular pockets of dead and dying trees over time. Without the actual fruiting bodies on the site, it is difficult to detect HRD from other pathogens that cause pocket mortality. The HMNF completed a HRD EA in 2017, allowing stump treatment to prevent the spread of HRD across the Forest. HRD surveys are being completed to further identify infection sites on the Forest through a State & Private grant implemented by MDNR on National Forest lands.
Caliciopsis canker (pine canker) (Caliciopsis pinea) is found on eastern and western white pine and in many firs. It was first reported in N. Hampshire in 1997 and occurs on sandy, well-drained soils. The cankers are found between the tree whorls. It is not well understood but spores are probably disseminated through rain splash and enter through bark lenticels or small insect wounds. Mortality due to Caliciopsis is usually low, but reports of declining trees have been increasing, including mature trees now being affected. Trees exhibit sunken red cankers and eyelash-shaped fruiting bodies, characteristic of a disease caused by a fungal pathogen called Caliciopsis pinea. In 2018 MSU surveyed white pine stands to determine the distribution, identify site factors that predict the disease, and collect samples to help characterize the fungal pathogen. Fruiting bodies were found in many of the areas

63
sampled. Multiple species of Caliciopsis may be present in Michigan and they appear to be associated with high densities of white pine, especially on wetter sites.
Red pine pocket mortality has been a problem on the Forests for a number of years and continues to spread in size and location. Pockets are more common in stands where trees have been cut than in unthinned stands. This is because the Leptographium fungus moves from tree to tree through root graphs. Insects feed on freshly cut stumps, and the lower stem and roots of red pine, and then carry the fungi Leptographium terebrantis and L. procerum into the lower stem and root system. The infected trees are stressed and less able to take up and move water or make defensive compounds. The stressed trees attract lower stem feeding beetles and bark beetles ultimately kill the trees. Red pine pocket mortality has not been identified in jack or white pine plantations.
Recommendations
There is research needed in many areas to help with the control of these pests and pathogens. Some include the methods of detection, factors that promote/discourage establishment and spread, population dynamics, soil or climatic conditions favorable for establishment, and management practices, biocontrol measures, chemical treatments or genetic resistance development of trees to control the spread of these pests and pathogens.
Some management practices that the Forests are starting to employ are harvesting restrictions for the time of cutting, for example to restrict the spread of oak wilt and HRD. While trenching and tree and stump removal can also be done to remove both oak wilt and HRD infection sites, these methods are expensive. There are research programs looking for resistance of trees to some of these pest/pathogens (such as identifying lingering ash or beech trees to test for resistance for emerald ash borer or beech scale, respectively). There are also biocontrols being reared and released for some of the pests and insecticides tested for disease control.
The Forest should continue annual detection flights. Increasing the amount and types of surveys for pests and pathogens would improve the ability of the Forest to implement the Early Detection and Rapid Response protocols associated with Integrated Pest Management.
Evaluation of Monitoring Question and Indicator(s)
The monitoring indicators and questions are adequate to address changes in forest health on the HMNF.
References
Campbell, J. L., L. E. Rustad, E. W. Boyer, S. F. Christopher, C. T. Driscoll, I. J. Fernandez, P. M. Groffman, D. Houle, J. Kiekbusch, A. H. Magill, M. J. Mitchell and S. V. Ollinger (2009). "Consequences of climate change for biogeochemical cycling in forests of northeastern North America." Canadian Journal of Forest Research 39(2): 264-284
Dara, S.K., L. Barringer, and S.P. Arthurs. 2015. Lycorma delicatula (Hemiptera: Fulgoridae): A New Invasive Pest in the United States. J. Integ. Pest Mngmt. (2015) 6(1): 20; DOI: 10.1093/jipm/pmv021.
Dukes, J. S., et al. (2009). "Responses of insect pests, pathogens, and invasive plant species to climate change in the forests of northeastern North America: What can we predict?" Canadian Journal of Forest Research 39(2): 231-248.
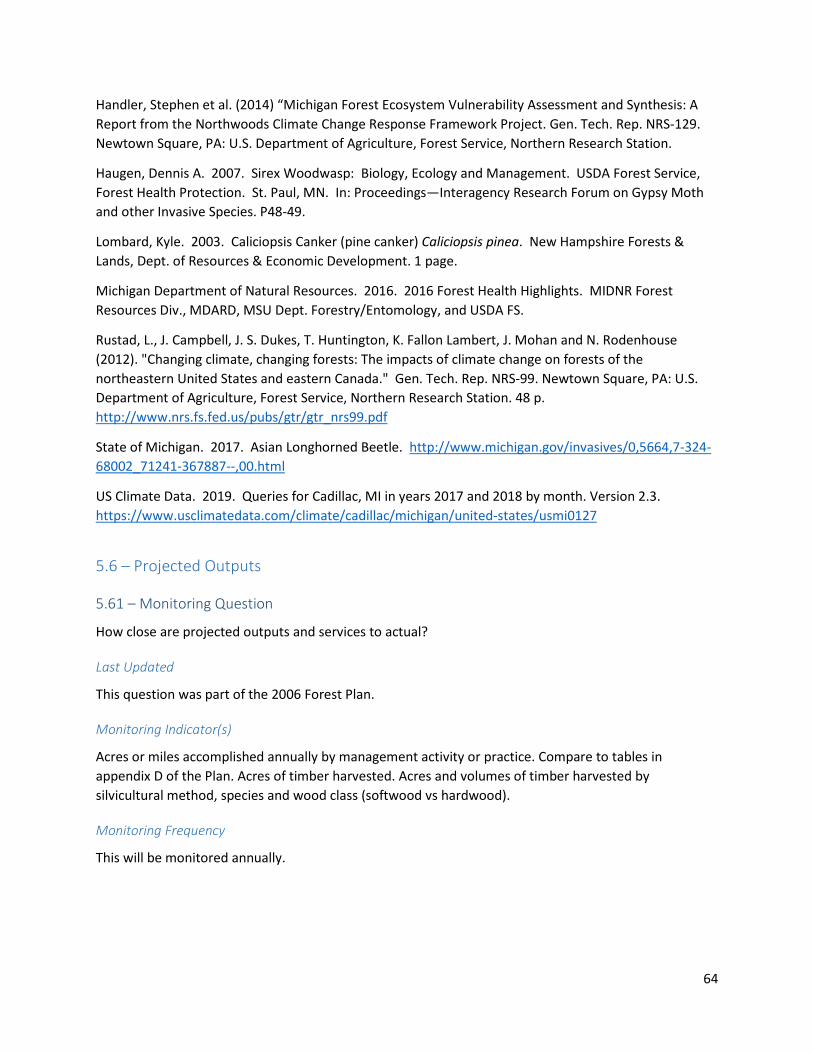
64
Handler, Stephen et al. (2014) “Michigan Forest Ecosystem Vulnerability Assessment and Synthesis: A Report from the Northwoods Climate Change Response Framework Project. Gen. Tech. Rep. NRS-129. Newtown Square, PA: U.S. Department of Agriculture, Forest Service, Northern Research Station.
Haugen, Dennis A. 2007. Sirex Woodwasp: Biology, Ecology and Management. USDA Forest Service, Forest Health Protection. St. Paul, MN. In: Proceedings—Interagency Research Forum on Gypsy Moth and other Invasive Species. P48-49.
Lombard, Kyle. 2003. Caliciopsis Canker (pine canker) Caliciopsis pinea. New Hampshire Forests & Lands, Dept. of Resources & Economic Development. 1 page.
Michigan Department of Natural Resources. 2016. 2016 Forest Health Highlights. MIDNR Forest Resources Div., MDARD, MSU Dept. Forestry/Entomology, and USDA FS.
Rustad, L., J. Campbell, J. S. Dukes, T. Huntington, K. Fallon Lambert, J. Mohan and N. Rodenhouse (2012). "Changing climate, changing forests: The impacts of climate change on forests of the northeastern United States and eastern Canada." Gen. Tech. Rep. NRS-99. Newtown Square, PA: U.S. Department of Agriculture, Forest Service, Northern Research Station. 48 p. http://www.nrs.fs.fed.us/pubs/gtr/gtr_nrs99.pdf
State of Michigan. 2017. Asian Longhorned Beetle. http://www.michigan.gov/invasives/0,5664,7-324-68002_71241-367887--,00.html
US Climate Data. 2019. Queries for Cadillac, MI in years 2017 and 2018 by month. Version 2.3. https://www.usclimatedata.com/climate/cadillac/michigan/united-states/usmi0127
5.6 – Projected Outputs
5.61 – Monitoring Question
How close are projected outputs and services to actual?
Last Updated
This question was part of the 2006 Forest Plan.
Monitoring Indicator(s)
Acres or miles accomplished annually by management activity or practice. Compare to tables in appendix D of the Plan. Acres of timber harvested. Acres and volumes of timber harvested by silvicultural method, species and wood class (softwood vs hardwood).
Monitoring Frequency
This will be monitored annually.
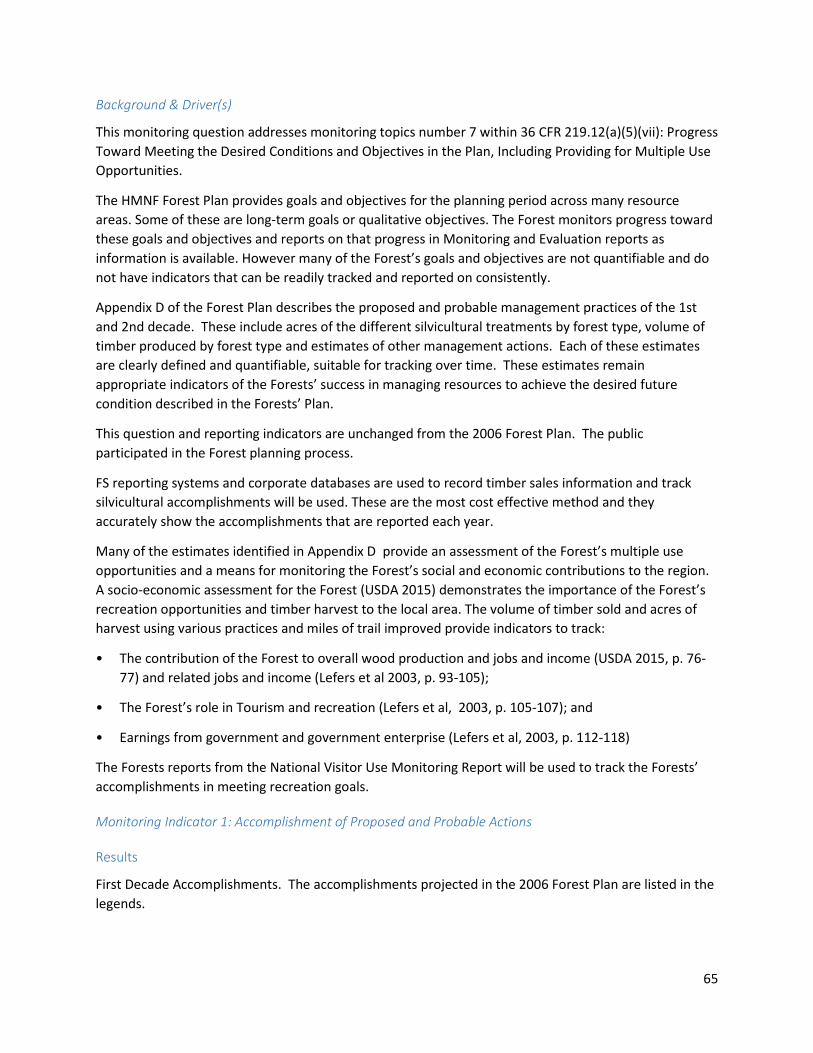
65
Background & Driver(s)
This monitoring question addresses monitoring topics number 7 within 36 CFR 219.12(a)(5)(vii): Progress Toward Meeting the Desired Conditions and Objectives in the Plan, Including Providing for Multiple Use Opportunities.
The HMNF Forest Plan provides goals and objectives for the planning period across many resource areas. Some of these are long-term goals or qualitative objectives. The Forest monitors progress toward these goals and objectives and reports on that progress in Monitoring and Evaluation reports as information is available. However many of the Forest’s goals and objectives are not quantifiable and do not have indicators that can be readily tracked and reported on consistently.
Appendix D of the Forest Plan describes the proposed and probable management practices of the 1st and 2nd decade. These include acres of the different silvicultural treatments by forest type, volume of timber produced by forest type and estimates of other management actions. Each of these estimates are clearly defined and quantifiable, suitable for tracking over time. These estimates remain appropriate indicators of the Forests’ success in managing resources to achieve the desired future condition described in the Forests’ Plan.
This question and reporting indicators are unchanged from the 2006 Forest Plan. The public participated in the Forest planning process.
FS reporting systems and corporate databases are used to record timber sales information and track silvicultural accomplishments will be used. These are the most cost effective method and they accurately show the accomplishments that are reported each year.
Many of the estimates identified in Appendix D provide an assessment of the Forest’s multiple use opportunities and a means for monitoring the Forest’s social and economic contributions to the region. A socio-economic assessment for the Forest (USDA 2015) demonstrates the importance of the Forest’s recreation opportunities and timber harvest to the local area. The volume of timber sold and acres of harvest using various practices and miles of trail improved provide indicators to track:
• The contribution of the Forest to overall wood production and jobs and income (USDA 2015, p. 76-77) and related jobs and income (Lefers et al 2003, p. 93-105);
• The Forest’s role in Tourism and recreation (Lefers et al, 2003, p. 105-107); and
• Earnings from government and government enterprise (Lefers et al, 2003, p. 112-118)
The Forests reports from the National Visitor Use Monitoring Report will be used to track the Forests’ accomplishments in meeting recreation goals.
Monitoring Indicator 1: Accomplishment of Proposed and Probable Actions
Results
First Decade Accomplishments. The accomplishments projected in the 2006 Forest Plan are listed in the legends.
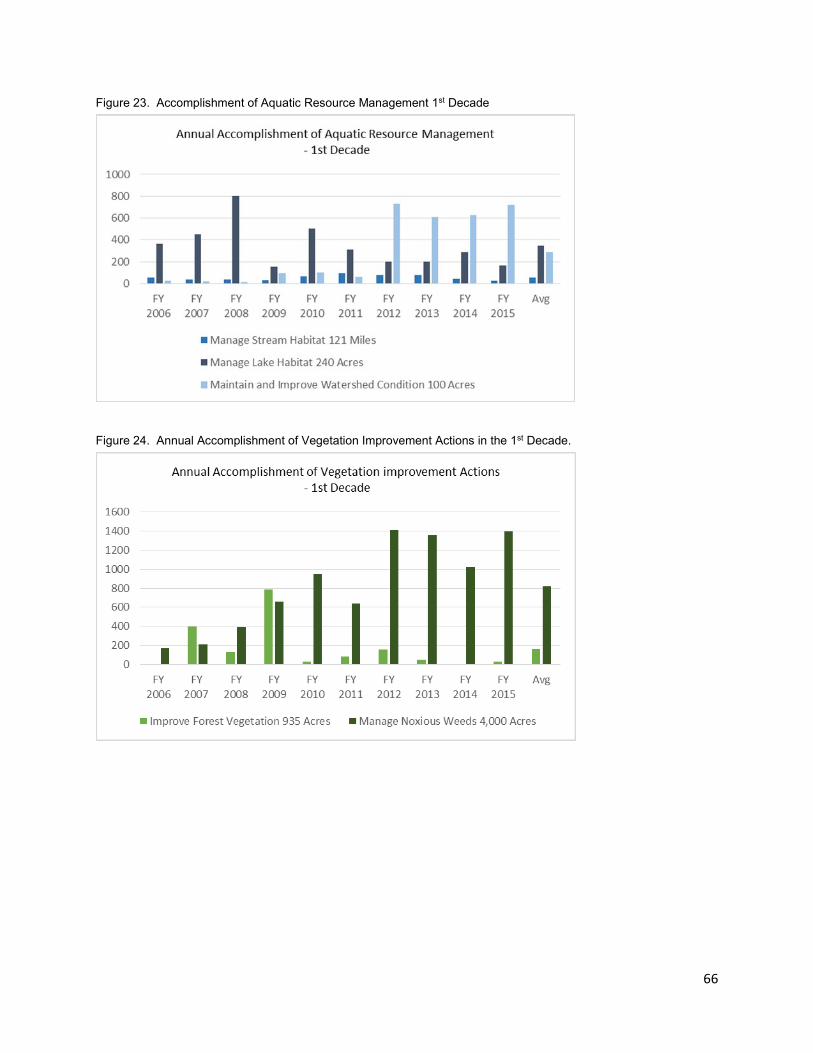
66
Figure 23. Accomplishment of Aquatic Resource Management 1st Decade
Figure 24. Annual Accomplishment of Vegetation Improvement Actions in the 1st Decade.
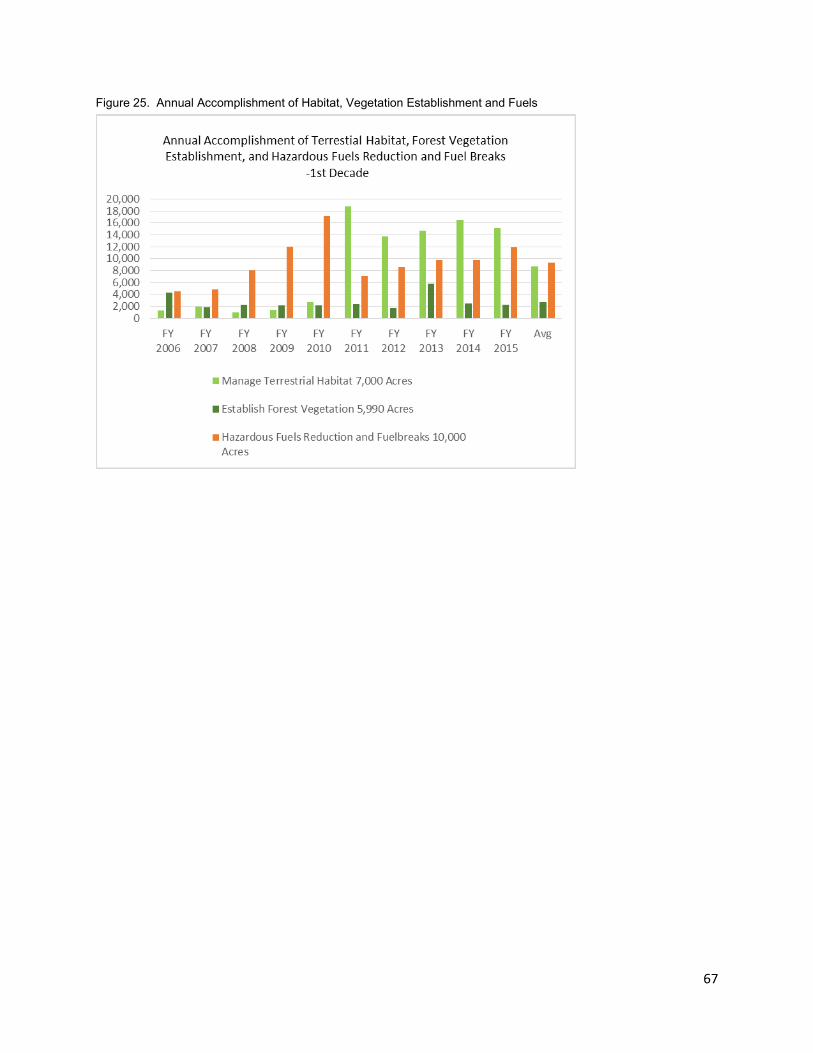
67
Figure 25. Annual Accomplishment of Habitat, Vegetation Establishment and Fuels
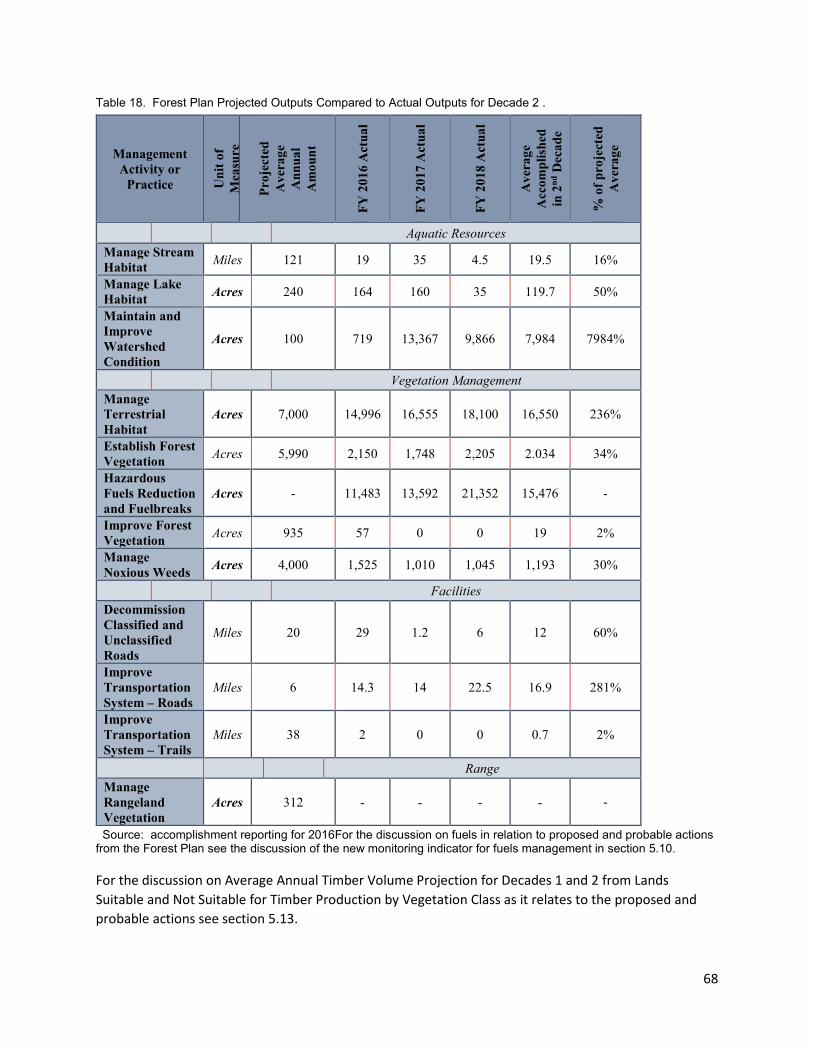
68
Table 18. Forest Plan Projected Outputs Compared to Actual Outputs for Decade 2 .
Management Activity or
Practice Uni
t of
Mea
sure
Proj
ecte
d A
vera
ge
Ann
ual
Am
ount
FY 2
016
Act
ual
FY 2
017
Act
ual
FY 2
018
Act
ual
Ave
rage
A
ccom
plis
hed
in 2
nd D
ecad
e
% o
f pro
ject
ed
Ave
rage
Aquatic Resources Manage Stream Habitat Miles 121 19 35 4.5 19.5 16%
Manage Lake Habitat Acres 240 164 160 35 119.7 50%
Maintain and Improve Watershed Condition
Acres 100 719 13,367 9,866 7,984 7984%
Vegetation Management Manage Terrestrial Habitat
Acres 7,000 14,996 16,555 18,100 16,550 236%
Establish Forest Vegetation Acres 5,990 2,150 1,748 2,205 2.034 34%
Hazardous Fuels Reduction and Fuelbreaks
Acres - 11,483 13,592 21,352 15,476 -
Improve Forest Vegetation Acres 935 57 0 0 19 2%
Manage Noxious Weeds Acres 4,000 1,525 1,010 1,045 1,193 30%
Facilities Decommission Classified and Unclassified Roads
Miles 20 29 1.2 6 12 60%
Improve Transportation System – Roads
Miles 6 14.3 14 22.5 16.9 281%
Improve Transportation System – Trails
Miles 38 2 0 0 0.7 2%
Range Manage Rangeland Vegetation
Acres 312 - - - - -
Source: accomplishment reporting for 2016For the discussion on fuels in relation to proposed and probable actions from the Forest Plan see the discussion of the new monitoring indicator for fuels management in section 5.10.
For the discussion on Average Annual Timber Volume Projection for Decades 1 and 2 from Lands Suitable and Not Suitable for Timber Production by Vegetation Class as it relates to the proposed and probable actions see section 5.13.
69
For the discussion of the 2006 Forest Plan Decades 1 and 2 Proposed and Probable Silvicultural Method Compared to Actual Sold Acres from Suitable and Not Suitable Forest Land see Question 13 section 5.13.
Discussion
The Huron-Manistee National Forests produced at or above the level proposed for most of the outputs in the Forest Plan’s proposed and probable practices. Several programs have continued to be implemented at a level below planned levels. These include: timber volume, treatment of noxious weeds, improvement of forest vegetation, improvement of trails, management of stream and lake habitat, and the establishment of forest vegetation.
Lack of funding for noxious weed treatment, stream and lake habitat management, improvement of forest vegetation, and trails maintenance has limited work in those areas. Timber harvest has been at a lower than planned level, therefore the need to establish vegetation and for opportunities for stand improvement have declined, as there is less need to replant and improve conditions for regenerating stands. The Forests have received funding to work on watershed restoration projects and have achieved more stream restoration work than was anticipated. Those projects also improve stream habitat by: reducing sedimentation; restoring stream channels to more natural conditions and; improving aquatic organism passage.
For the first decade the HMNF achieved 94 percent of the hazardous fuel reduction treatment and fuel break creation proposed in the 2006 Forest Plan or a total of 93,733 acres. Since 2016 the HMNF accomplished 46,427 acres of fuel reduction and the Forest Plan hadn’t projected any need for additional fuels treatments. See the fuels discussion in section 5.10.
Recommendations
No recommendations at this time.
Evaluation of Monitoring Question and Indicator(s)
Our monitoring indicators and question do not need updating at this time.
References
USDA gPAS program for accomplishment reporting for fiscal year 2016- 2018.
USFS FACTS Database Query. 2019. FACTS accomplishments for FY 2017 and 2018.
5.7 – Productivity of the Land
5.71 – Monitoring Question
Are the effects of Forest management, including prescriptions, resulting in significant changes in productivity of the land?
70
Last Updated
This question was part of the 2006 Forest Plan.
Monitoring Indicator(s)
Growth metrics of trees and remaining soil nutrient stocks following different harvest scenarios on FS land- data from LTSP study plot on Huron side of Forest.
Monitoring Frequency
This will be monitored every five years. This question was not updated in the 2017-2018 report. The next report on this question is projected for 2021.
Background & Driver(s)
This monitoring question addresses monitoring topics number 8 within 36 CFR 219.12(a)(5)(viii): The Effects of Each Management System to Determine That They do Not Substantially and Permanently Impair the Productivity of the Land (16 U.S.C. 1604 (g)(3)(c).
Several peer-reviewed studies were consulted during the identification of BASI for this monitoring question. That process indicated several important considerations when designing a soil productivity monitoring strategy:
1) Stand characteristics and soil factors have an inseparable connection to tree growth and nutrient uptake, and therefore, biogeochemical cycling between soils and trees is site-specific, dependent on a variety of factors, and highly spatially heterogeneous at the Forest-wide scale.
2) Most peer-reviewed studies are narrowly focused on either a single management system or a single soil type (or narrow range of soil types) in order to tease out relevant relationships between specific soil and site factors. Moreover, they typically are short term in duration or specific to a season.
3) The best way to derive meaningful conclusions about the effects of management systems on soil productivity is through repeated long-term measurements.
These considerations lead us to conclude that the best source of information to answer this monitoring question is data from the Long-Term Soil Productivity (LTSP) study on the HMNF (Voldseth, Palik, and Elioff 2011). Nationwide, the LTSP study was designed by Forest Service Research Station Scientists to directly answer this monitoring question. The study design takes repeated measurements of soil organic matter, porosity, and soil nutrients with depth on sandy soils under nine different combinations of harvest intensity and soil compaction (actually compacted by harvest equipment commonly used on our forest). Furthermore, the site on the Huron side of the forest has been in existence and continually measured since 1994. The LTSP study also represents one of the most intensive kinds of management (aspen clear-cutting) on soils particularly susceptible to long-term depletion of nutrients (loamy sand soil). Therefore, it represents the most local, relevant, long-term dataset to use for monitoring the effects of forest management on soil productivity on the HMNF. Finally, the LTSP study is funded by the Northern Research Station, this data is provided to the HMNF at no expense.
One considerable draw back of the LTSP research design is that it does not address all of the intensive management systems that are currently in use on the HMNF- such as jack pine clear cutting, or repeated
71
red pine regeneration on the same stands. Because of this limitation, we actively work with university research partners in Michigan who focus on forest soil productivity to design studies that can directly help us answer this question on other management types (LeDuc and Rothstein 2007; Yermakov and Rothstein 2006; Curzon, D’Amato, and Palik 2014). Furthermore, a study is currently underway, which aims to answer questions related to soil disturbance levels in a pre- and post-harvest scenario on different management systems susceptible to productivity decline across the HMNF. While these additional studies are not long-term in nature, they help us refine important questions regarding specific effects of forest management on soil productivity, which can then be considered during future revisions of Forests’ planning and monitoring efforts.
Monitoring Indicator 1: Growth metrics of trees and remaining soil nutrient stocks following different harvest scenarios on FS land- data from LTSP study plot on Huron side of Forest.
Results
The Long-Term Soil Productivity (LTSP) study was initiated on the Huron-Manistee National Forests in 1994 and its results are used here as indicator of the extent to which management activities result in significant changes to productivity of the land. In the LTSP, experimental timber harvests of aspen stands growing on loamy sand soils were conducted to evaluate the effect of different levels of organic matter removal and soil compaction on forest productivity, soil physical properties, and soil chemical properties. (Organic matter is woody material, leaves, and plant material in various stages of decomposition laying on and incorporated into the soil surface and soil compaction is the degree to which heavy objects such as timber harvest equipment have compressed the soil.) Three levels of organic matter removal were evaluated: 1) removal of only the main tree trunk; 2) removal of the entire tree (i.e. trunk, branches, twigs, leaves, etc.); and 3) removal of all organic matter (i.e. entire tree and all forest floor organic material). Similarly, three levels of soil compaction were experimentally evaluated: 1) normal harvest levels; 2) moderate additional soil compaction; and 3) heavy soil compaction. Further, all combinations of the six treatments were evaluated; i.e. main trunk removal with normal compaction, main trunk removal with moderate compaction, main trunk removal with heavy compaction, entire tree removal with normal compaction, etc.
The results of the first 20 years of the LTSP are described in detail in Voldseth et al. 2011 and additional information is provided in (Curzon et al. 2014, Curzon et al. 2016, Slesak et al. 2017). Pertinent results of the study to date are briefly summarized here. All compaction levels increased the soil physical property called “bulk density” (a common means of measuring compaction) above pre-harvest levels after the experimental harvests were conducted. Ten years later, the soil bulk density decreased significantly compared to immediately after harvest, but was still generally above pre-harvest levels. Total carbon and nitrogen (important plant nutrients) in the soil showed no impact from the treatments at year 10. When all soil organic matter was removed: 1) near-surface calcium (also an important plant nutrient) was found to be lower compared to pre-harvest levels. For both “removal of the entire tree” and “removal of all organic matter” levels, potassium at 10-20 cm depth was also found to be lower compared to pre-harvest levels. Tree growth actually increased with moderate compaction. Finally, total tree harvest with forest floor removal reduced tree growth.

72
Discussion
Results from this study, to date, suggest that heavy compaction and/or high organic matter removals (i.e. removal of the entire tree and removal of all organic matter) are generally detrimental to sustaining forest productivity on aspen stands growing in loamy sand soils. Removal of the entire tree with limited compaction may be sustainable. Managers should be cautious of approaches involving whole-tree harvests, or even trunk-only harvests, on short rotations (~10 years), as such approaches will limit the potential for recovery to pre-harvest bulk densities and may have the potential to result in cumulative increases in soil compaction until unacceptable levels are reached. Soil and stand productivity are susceptible to extreme OM removal on coarse-textured, poorly buffered sands. Given this result, it is probably best to utilize harvesting and silvicultural practices that retain some OM on similar soil types to ensure maintained productivity into the future (Slesak, 2017).
Recommendations
The study should be continued for a full timber rotation (40-70 years) or beyond. Further, the study represents only one timber type (aspen) / soil type (loamy sand) combination and there are many on the Huron-Manistee National Forests. The following recommendations should be implemented if time and funding are or become available. The study should be expanded to include jack pine on sand soils and red pine on sand soils. Data from years 15 and 20 of the study should be compiled, analyzed, and published in a peer-reviewed scientific journal. The LTSP should continue to be supported and associated data should continue to be collected at least until one full timber rotation age has been met.
Evaluation of Monitoring Question and Indicator(s)
No changes to the monitoring question are suggested at this time.
References
Curzon MT, D’Amato AW, Palik BJ. Harvest residue removal and soil compaction impact forest productivity and recovery: Potential implications for bioenergy harvests. For Ecol Manage. 2014;329:99-107. doi:10.1016/j.foreco.2014.05.056.
Hazlett PW, Morris DM, Fleming RL. Effects of Biomass Removals on Site Carbon and Nutrients and Jack Pine Growth in Boreal Forests. Soil Sci Soc Am Journal, North Am For Soils Conferernce Proceedings, Whitefish, MT, 16-20 June 2013. 2014;78(S1):S183. doi:10.2136/sssaj2013.08.0372nafsc.
LeDuc SD, Rothstein DE. Initial recovery of soil carbon and nitrogen pools and dynamics following disturbance in jack pine forests: A comparison of wildfire and clearcut harvesting. Soil Biol Biochem. 2007;39(11):2865-2876. doi:10.1016/j.soilbio.2007.05.029.
Slesak RA, Palik B.J, DAmoto AW, Kurth VJ. Changes in soil physical and chemical properties following organic matter removal and compaction: 20-year response of the aspen Lake-States Long Term Soil Productivity installations. Forest Ecology and Management 2017; 392: 68-77.
Thompson T, Rothstein D. Effects of Preceding Stand Age on Nutrient Availability in Postharvest Jack Pine Pinus banksiana. North Jounral Appl For. 2009; 26(1):28-30
73
Voldseth R, Palik B, Elioff J. Ten-Year Results from the Long-Term Soil Productivity Study in Aspen Ecosystems of the Northern Great Lakes Region: Northern Research Station Research Paper NRS-17.; 2011. http://www.treesearch.fs.fed.us/pubs/39448
Yermakov Z, Rothstein DE. Changes in soil carbon and nitrogen cycling along a 72-year wildfire chronosequence in Michigan jack pine forests. Oecologia. 2006;149(4):690-700. doi:10.1007/s00442-006-0474-4.
5.8 – Lands Adequately Restocked
5.81 – Monitoring Question
Are harvested lands adequately restocked after 5 years?
Last Updated
This question was part of the 2006 Forest Plan.
Monitoring Indicator(s)
Number of acres certified from stands harvested five year previous.
Monitoring Frequency
This will be monitored annually.
Background & Driver(s)
Providing for restocking of harvested stands is part of the National Forest Management Act. This monitoring assures our measures are adequately providing for restocking.
All stands should be certified within five years or remedial actions taken to provide adequate stocking if certification has not been met. Also the number of acres where stocking surveys have been completed from harvested lands to show that monitoring of regeneration is taking place.
National Forest Management Act regulations require cutover lands to be adequately restocked five years following final harvest. This regulation applies where the objectives, expressed in the 2006 Forest Plan, indicate the need to reforest areas that have been cut-over or otherwise denuded or deforested. This monitoring item measures to what extent the National Forests’ are sustainably growing trees following harvest treatments that remove mature trees. Restocking occurs naturally in most aspen, oak or other hardwood forest types and by planting or seeding in the pine and oak types, or a combination of these methods. Stands with stocking below the desired density prescribed for the stand are planted to ensure adequate regeneration within five years following the final harvest.
Stocking surveys measure the amount of tree regeneration between the first and fifth growing seasons after a regeneration harvest is completed; survival surveys measure seedling survival during the first and third growing seasons following planting. Stands meeting or exceeding the minimum number, distribution, and size of desired stems per acre are considered successfully regenerated (but usually not
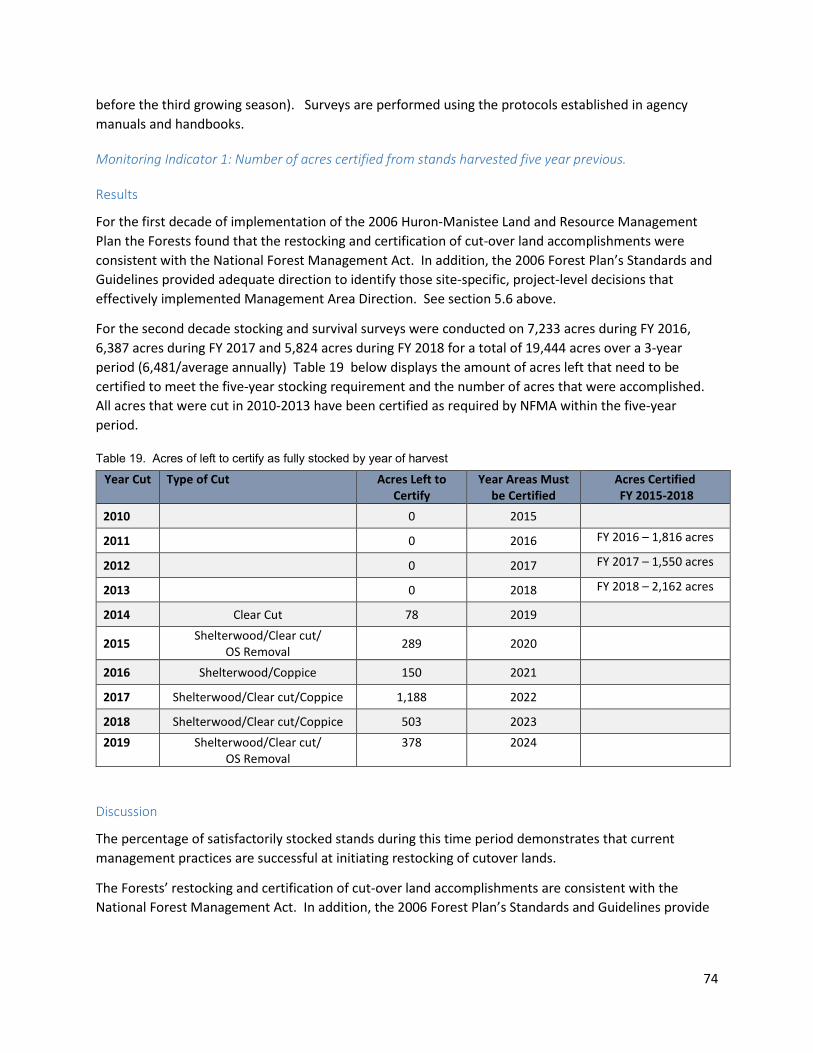
74
before the third growing season). Surveys are performed using the protocols established in agency manuals and handbooks.
Monitoring Indicator 1: Number of acres certified from stands harvested five year previous.
Results
For the first decade of implementation of the 2006 Huron-Manistee Land and Resource Management Plan the Forests found that the restocking and certification of cut-over land accomplishments were consistent with the National Forest Management Act. In addition, the 2006 Forest Plan’s Standards and Guidelines provided adequate direction to identify those site-specific, project-level decisions that effectively implemented Management Area Direction. See section 5.6 above.
For the second decade stocking and survival surveys were conducted on 7,233 acres during FY 2016, 6,387 acres during FY 2017 and 5,824 acres during FY 2018 for a total of 19,444 acres over a 3-year period (6,481/average annually) Table 19 below displays the amount of acres left that need to be certified to meet the five-year stocking requirement and the number of acres that were accomplished. All acres that were cut in 2010-2013 have been certified as required by NFMA within the five-year period.
Table 19. Acres of left to certify as fully stocked by year of harvest
Year Cut Type of Cut Acres Left to Certify
Year Areas Must be Certified
Acres Certified FY 2015-2018
2010 0 2015
2011 0 2016 FY 2016 – 1,816 acres
2012 0 2017 FY 2017 – 1,550 acres
2013 0 2018 FY 2018 – 2,162 acres
2014 Clear Cut 78 2019
2015 Shelterwood/Clear cut/ OS Removal 289 2020
2016 Shelterwood/Coppice 150 2021
2017 Shelterwood/Clear cut/Coppice 1,188 2022
2018 Shelterwood/Clear cut/Coppice 503 2023
2019 Shelterwood/Clear cut/ OS Removal
378 2024
Discussion
The percentage of satisfactorily stocked stands during this time period demonstrates that current management practices are successful at initiating restocking of cutover lands.
The Forests’ restocking and certification of cut-over land accomplishments are consistent with the National Forest Management Act. In addition, the 2006 Forest Plan’s Standards and Guidelines provide

75
adequate direction to identify those site-specific, project-level decisions that effectively implement Management Area Direction.
Recommendations
Project-level interdisciplinary teams should continue to fully incorporate the length of time and costs necessary to re-stock and certify cut-over lands in vegetation management decisions. The emerging trend in silvicultural practices, especially in regeneration harvesting, will result in a short-term shift from young to older age vegetation classes, especially in aspen, long-lived conifers and low and high-site oaks.
There is a need to be consistent in recording the harvest cut used on the Forest and to change the LSC when needed as stated in the Land Suitability monitoring report.
Evaluation of Monitoring Question and Indicator(s)
Our monitoring programs are subject to change as needed (adaptive monitoring). Monitoring methods are sufficient and no changes are recommended to current Forests’ procedures. at this time.
References
USFS FACTS Database. 2017. GI Report: harvest without certifications.
USFS FACTS Database. 2019. GI Report: harvest without certifications.
5.9 – Land Suitability Class
5.91 – Monitoring Question
To what extent have conditions or information changed the classification of lands "not suited" for timber production to "suitable" for timber production?
Last Updated
This question was modified from the 2006 Forest Plan.
Monitoring Indicator(s)
Acres moved from not suitable for timber production to suitable or vice versa.
Monitoring Frequency
This will be monitored annually.
Background & Driver(s)
Tracking Land Suitability Class is part of the National Forest Management Act. This monitoring informs us on the need to update the Forest Plan.
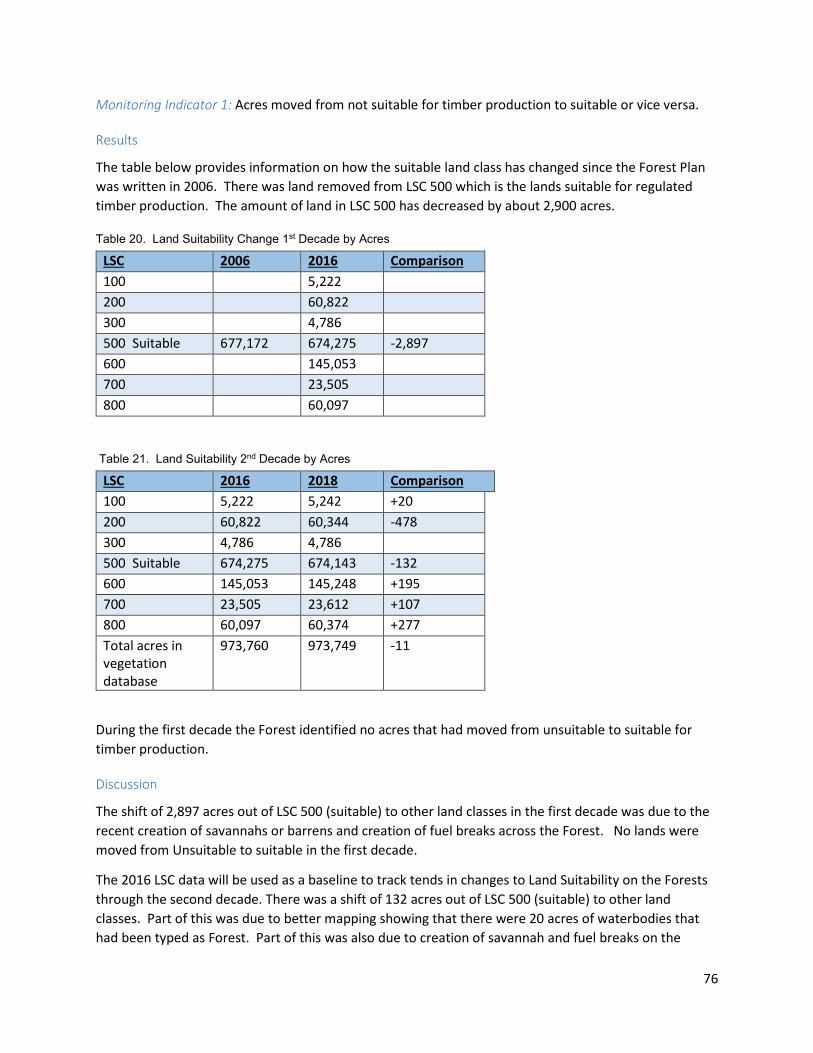
76
Monitoring Indicator 1: Acres moved from not suitable for timber production to suitable or vice versa.
Results
The table below provides information on how the suitable land class has changed since the Forest Plan was written in 2006. There was land removed from LSC 500 which is the lands suitable for regulated timber production. The amount of land in LSC 500 has decreased by about 2,900 acres.
Table 20. Land Suitability Change 1st Decade by Acres
LSC 2006 2016 Comparison 100
5,222
200 60,822
300
4,786
500 Suitable 677,172 674,275 -2,897 600
145,053
700 23,505
800
60,097
Table 21. Land Suitability 2nd Decade by Acres
LSC 2016 2018 Comparison 100 5,222 5,242 +20 200 60,822 60,344 -478 300 4,786 4,786 500 Suitable 674,275 674,143 -132 600 145,053 145,248 +195 700 23,505 23,612 +107 800 60,097 60,374 +277 Total acres in vegetation database
973,760 973,749 -11
During the first decade the Forest identified no acres that had moved from unsuitable to suitable for timber production.
Discussion
The shift of 2,897 acres out of LSC 500 (suitable) to other land classes in the first decade was due to the recent creation of savannahs or barrens and creation of fuel breaks across the Forest. No lands were moved from Unsuitable to suitable in the first decade.
The 2016 LSC data will be used as a baseline to track tends in changes to Land Suitability on the Forests through the second decade. There was a shift of 132 acres out of LSC 500 (suitable) to other land classes. Part of this was due to better mapping showing that there were 20 acres of waterbodies that had been typed as Forest. Part of this was also due to creation of savannah and fuel breaks on the
77
Forest. There was also a shift of 11 acres out of the total acres on the forest. This is most likely due to a rounding error or a re-delineation of stand lines with adjoining public land.
Recommendations
There is a need to review all land ownership and check for accuracy of data on the Forest compared to the vegetation layer.
There is a need to review Land Suitability Class information and see that current land on the Forest has been classified correctly before the next Plan revision.
Evaluation of Monitoring Question and Indicator(s)
The monitoring indicators are appropriate but the movement into and out of other LSC classes may also be relevant to determine why changes to timber suitable lands have occurred.
References
USDA Forest Service. 2019. FACTS database queries in the USFS stand layer and the USFS ownership layer.
USDA Forest Service. 2016. FACTS database queries in the USFS stand layer and the USFS ownership layer.
USDA Forest Service. 2006. Huron-Manistee National Forest Final Environmental Impact Statement.
USDA Forest Service. 2006. Forest Service Handbook 1909.12.
5.10 – Hazardous Fuels
5.101 – Monitoring Question
To what extent has the forest used fuels treatments to reduce hazardous fuels?
Last Updated
This question was part of the 2006 Forest Plan.
Monitoring Indicator(s)
As recommended in 2017 the indicator for fuels treatments was changed to acres treated within the Wildland Urban Interface (WUI) as the Wildfire Condition Class is no longer being reported.
Monitoring Frequency
This will be monitored annually.
Background & Driver(s)
The Huron-Manistee National Forests’ Plan has the objective of implementing fuels reduction and fuelbreak projects to aid in the protection of life, property and safety. Standards and Guidelines call for
78
fuels reduction projects and establishment of fuel breaks where needed outside of MA 5.1, 8.2 and 9.1. The proposed and probable practices included 8,000 acres a year of hazardous fuels mitigation activities and 2,000 acres a year of fuel breaks.
The indicator will show the amount of fuels work by fire condition class showing the fuels hazard of the treated areas.
The goal of moving towards an improved Condition Class has multiple benefits. The overall goal ecologically is to move the condition of fuels towards that which mimics natural or historic range and lessens the risk of losing key ecosystem components. A significant benefit of treating fuels and creating fuel breaks is to lessen the impacts of unwanted fire. Fuel breaks reduce risks to firefighters who respond to wildfires, enhance protection of private property, including homes and public infrastructure. Hazardous fuels left untreated, have been proven to create additional risks to life, property and safety.
Fire Regime Condition Class:
Condition Class 1 Conditions are within the natural (historical) range of variability of vegetation characteristics; fuel composition; fire frequency; severity and pattern; and other associated disturbances
Condition Class 2 Moderate departure from the natural (historic) regime of vegetation characteristics; fuel composition; fire frequency; severity and pattern; and other associated disturbances.
Condition Class 3 High departure from the natural (historic) regime of vegetation characteristics; fuel composition; fire frequency; severity and pattern; and other associated disturbances.
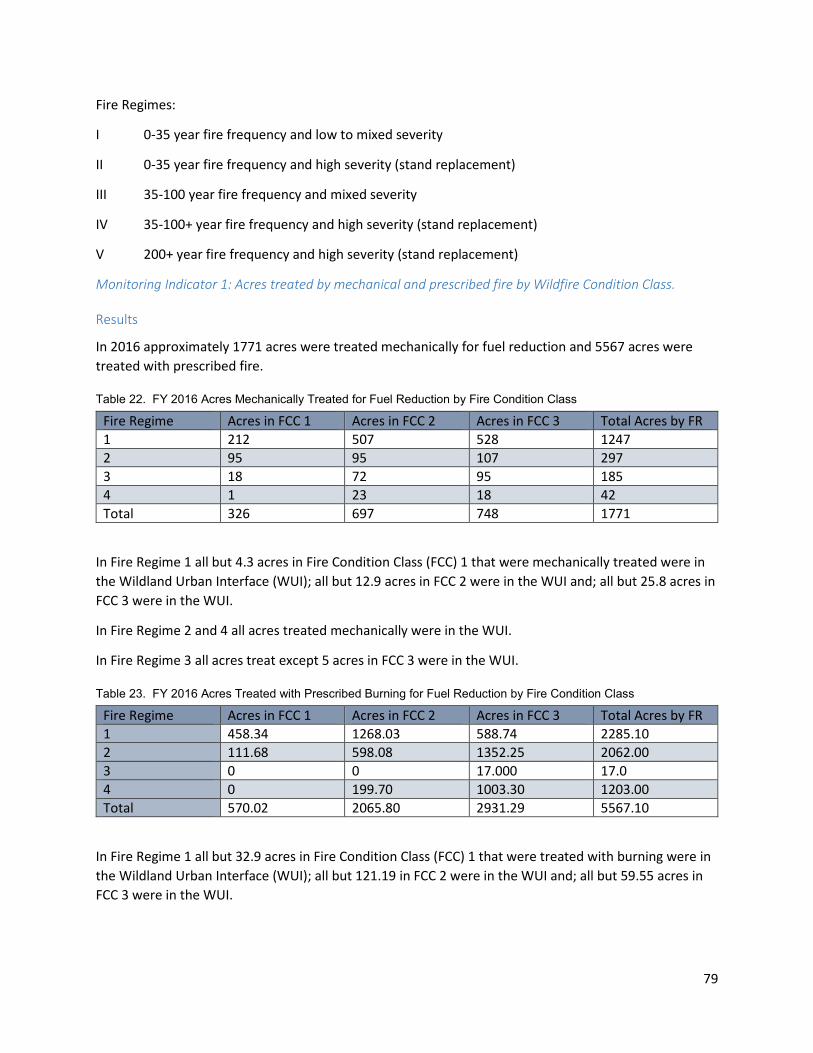
79
Fire Regimes:
I 0-35 year fire frequency and low to mixed severity
II 0-35 year fire frequency and high severity (stand replacement)
III 35-100 year fire frequency and mixed severity
IV 35-100+ year fire frequency and high severity (stand replacement)
V 200+ year fire frequency and high severity (stand replacement)
Monitoring Indicator 1: Acres treated by mechanical and prescribed fire by Wildfire Condition Class.
Results
In 2016 approximately 1771 acres were treated mechanically for fuel reduction and 5567 acres were treated with prescribed fire.
Table 22. FY 2016 Acres Mechanically Treated for Fuel Reduction by Fire Condition Class
Fire Regime Acres in FCC 1 Acres in FCC 2 Acres in FCC 3 Total Acres by FR 1 212 507 528 1247 2 95 95 107 297 3 18 72 95 185 4 1 23 18 42 Total 326 697 748 1771
In Fire Regime 1 all but 4.3 acres in Fire Condition Class (FCC) 1 that were mechanically treated were in the Wildland Urban Interface (WUI); all but 12.9 acres in FCC 2 were in the WUI and; all but 25.8 acres in FCC 3 were in the WUI.
In Fire Regime 2 and 4 all acres treated mechanically were in the WUI.
In Fire Regime 3 all acres treat except 5 acres in FCC 3 were in the WUI.
Table 23. FY 2016 Acres Treated with Prescribed Burning for Fuel Reduction by Fire Condition Class
Fire Regime Acres in FCC 1 Acres in FCC 2 Acres in FCC 3 Total Acres by FR 1 458.34 1268.03 588.74 2285.10 2 111.68 598.08 1352.25 2062.00 3 0 0 17.000 17.0 4 0 199.70 1003.30 1203.00 Total 570.02 2065.80 2931.29 5567.10
In Fire Regime 1 all but 32.9 acres in Fire Condition Class (FCC) 1 that were treated with burning were in the Wildland Urban Interface (WUI); all but 121.19 in FCC 2 were in the WUI and; all but 59.55 acres in FCC 3 were in the WUI.
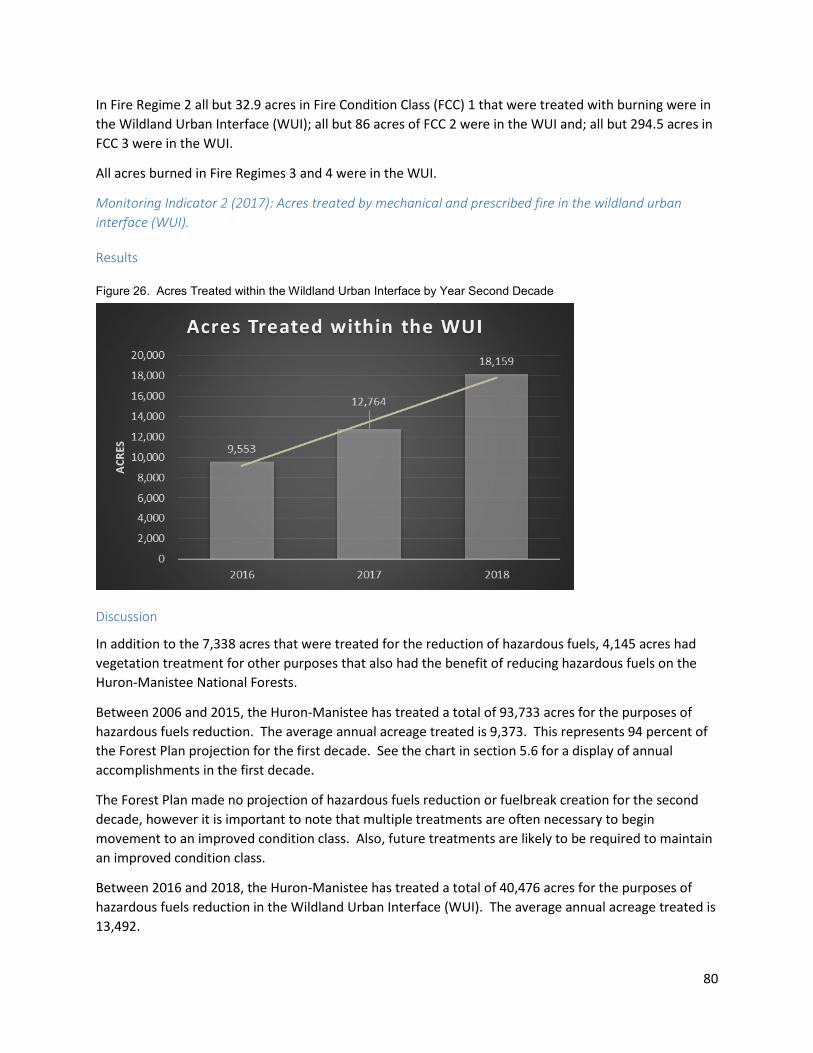
80
In Fire Regime 2 all but 32.9 acres in Fire Condition Class (FCC) 1 that were treated with burning were in the Wildland Urban Interface (WUI); all but 86 acres of FCC 2 were in the WUI and; all but 294.5 acres in FCC 3 were in the WUI.
All acres burned in Fire Regimes 3 and 4 were in the WUI.
Monitoring Indicator 2 (2017): Acres treated by mechanical and prescribed fire in the wildland urban interface (WUI).
Results
Figure 26. Acres Treated within the Wildland Urban Interface by Year Second Decade
Discussion
In addition to the 7,338 acres that were treated for the reduction of hazardous fuels, 4,145 acres had vegetation treatment for other purposes that also had the benefit of reducing hazardous fuels on the Huron-Manistee National Forests.
Between 2006 and 2015, the Huron-Manistee has treated a total of 93,733 acres for the purposes of hazardous fuels reduction. The average annual acreage treated is 9,373. This represents 94 percent of the Forest Plan projection for the first decade. See the chart in section 5.6 for a display of annual accomplishments in the first decade.
The Forest Plan made no projection of hazardous fuels reduction or fuelbreak creation for the second decade, however it is important to note that multiple treatments are often necessary to begin movement to an improved condition class. Also, future treatments are likely to be required to maintain an improved condition class.
Between 2016 and 2018, the Huron-Manistee has treated a total of 40,476 acres for the purposes of hazardous fuels reduction in the Wildland Urban Interface (WUI). The average annual acreage treated is 13,492.
81
Recommendations
No recommendations at this time.
Evaluation of Monitoring Question and Indicator(s)
No recommendations at this time.
References
None.
5.11 – Management Indicator Species
5.111 – Monitoring Question
What are the population trends of management indicator species?
Last Updated
This question was part of the 2006 Forest Plan.
Monitoring Indicator(s)
Number of active bald eagle nests and nest productivity; average number of ruffed grouse drums per stop. Brook Trout and mottled sculpin: Relative (Catch-Per-Unit-Effort), total (e.g. pounds/acre, fish/acre), or age-class abundance of brook trout and mottled sculpin. The number of Kirtland's warbler singing males. Estimated Karner blue butterfly abundance.
Monitoring Frequency
This will be monitored annually.
Background & Driver(s)
The Forest Plan Forest-wide Goals and Objectives and Desired Future Condition includes: “Monitor wildlife responses to management practices using identified Management Indicator Species to determine the effects of management practices on wildlife and fish populations.” (Forest Plan II-3)
Forest Plan direction is to implement the Bald Eagle Management Plan for the Huron-Manistee National Forests (USDA-Forest Service 2006), or current version. The Plan was originally written in 1985, with the most recent revision occurring in 2006. In addition, habitat and population objectives, conservation activities and monitoring direction were incorporated into the Forest Plan:
Habitat and Population Objectives: Habitat and population objectives are in accordance with the Northern States Bald Eagle Recovery Plan and the Bald Eagle Management Plan, Huron-Manistee National Forests. Habitat objectives include the protection of essential habitat, protection from environmental contamination and habitat acquisition.
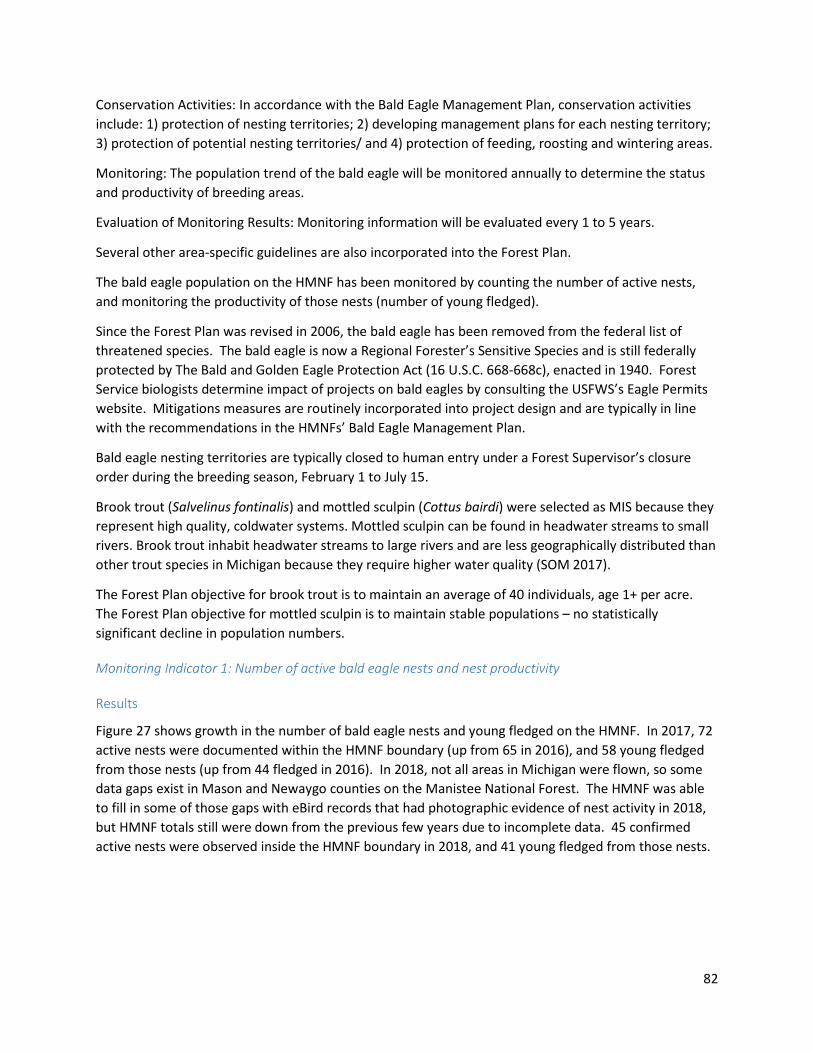
82
Conservation Activities: In accordance with the Bald Eagle Management Plan, conservation activities include: 1) protection of nesting territories; 2) developing management plans for each nesting territory; 3) protection of potential nesting territories/ and 4) protection of feeding, roosting and wintering areas.
Monitoring: The population trend of the bald eagle will be monitored annually to determine the status and productivity of breeding areas.
Evaluation of Monitoring Results: Monitoring information will be evaluated every 1 to 5 years.
Several other area-specific guidelines are also incorporated into the Forest Plan.
The bald eagle population on the HMNF has been monitored by counting the number of active nests, and monitoring the productivity of those nests (number of young fledged).
Since the Forest Plan was revised in 2006, the bald eagle has been removed from the federal list of threatened species. The bald eagle is now a Regional Forester’s Sensitive Species and is still federally protected by The Bald and Golden Eagle Protection Act (16 U.S.C. 668-668c), enacted in 1940. Forest Service biologists determine impact of projects on bald eagles by consulting the USFWS’s Eagle Permits website. Mitigations measures are routinely incorporated into project design and are typically in line with the recommendations in the HMNFs’ Bald Eagle Management Plan.
Bald eagle nesting territories are typically closed to human entry under a Forest Supervisor’s closure order during the breeding season, February 1 to July 15.
Brook trout (Salvelinus fontinalis) and mottled sculpin (Cottus bairdi) were selected as MIS because they represent high quality, coldwater systems. Mottled sculpin can be found in headwater streams to small rivers. Brook trout inhabit headwater streams to large rivers and are less geographically distributed than other trout species in Michigan because they require higher water quality (SOM 2017).
The Forest Plan objective for brook trout is to maintain an average of 40 individuals, age 1+ per acre. The Forest Plan objective for mottled sculpin is to maintain stable populations – no statistically significant decline in population numbers.
Monitoring Indicator 1: Number of active bald eagle nests and nest productivity
Results
Figure 27 shows growth in the number of bald eagle nests and young fledged on the HMNF. In 2017, 72 active nests were documented within the HMNF boundary (up from 65 in 2016), and 58 young fledged from those nests (up from 44 fledged in 2016). In 2018, not all areas in Michigan were flown, so some data gaps exist in Mason and Newaygo counties on the Manistee National Forest. The HMNF was able to fill in some of those gaps with eBird records that had photographic evidence of nest activity in 2018, but HMNF totals still were down from the previous few years due to incomplete data. 45 confirmed active nests were observed inside the HMNF boundary in 2018, and 41 young fledged from those nests.
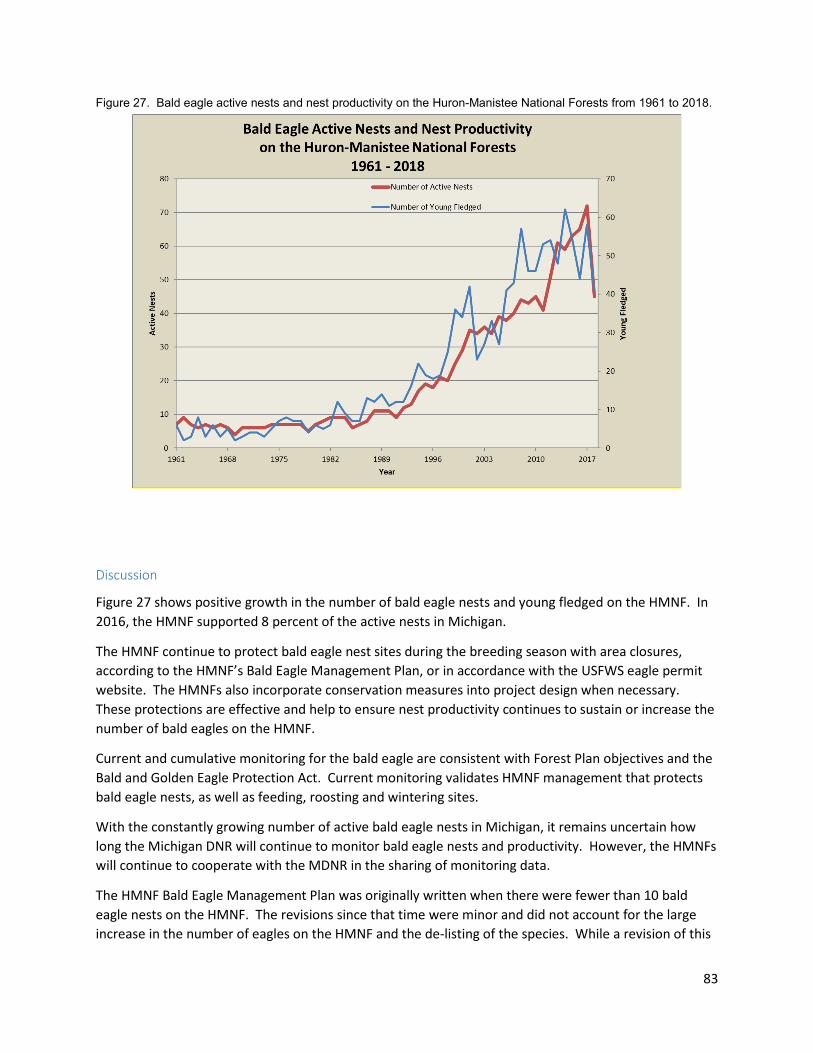
83
Figure 27. Bald eagle active nests and nest productivity on the Huron-Manistee National Forests from 1961 to 2018.
Discussion
Figure 27 shows positive growth in the number of bald eagle nests and young fledged on the HMNF. In 2016, the HMNF supported 8 percent of the active nests in Michigan.
The HMNF continue to protect bald eagle nest sites during the breeding season with area closures, according to the HMNF’s Bald Eagle Management Plan, or in accordance with the USFWS eagle permit website. The HMNFs also incorporate conservation measures into project design when necessary. These protections are effective and help to ensure nest productivity continues to sustain or increase the number of bald eagles on the HMNF.
Current and cumulative monitoring for the bald eagle are consistent with Forest Plan objectives and the Bald and Golden Eagle Protection Act. Current monitoring validates HMNF management that protects bald eagle nests, as well as feeding, roosting and wintering sites.
With the constantly growing number of active bald eagle nests in Michigan, it remains uncertain how long the Michigan DNR will continue to monitor bald eagle nests and productivity. However, the HMNFs will continue to cooperate with the MDNR in the sharing of monitoring data.
The HMNF Bald Eagle Management Plan was originally written when there were fewer than 10 bald eagle nests on the HMNF. The revisions since that time were minor and did not account for the large increase in the number of eagles on the HMNF and the de-listing of the species. While a revision of this
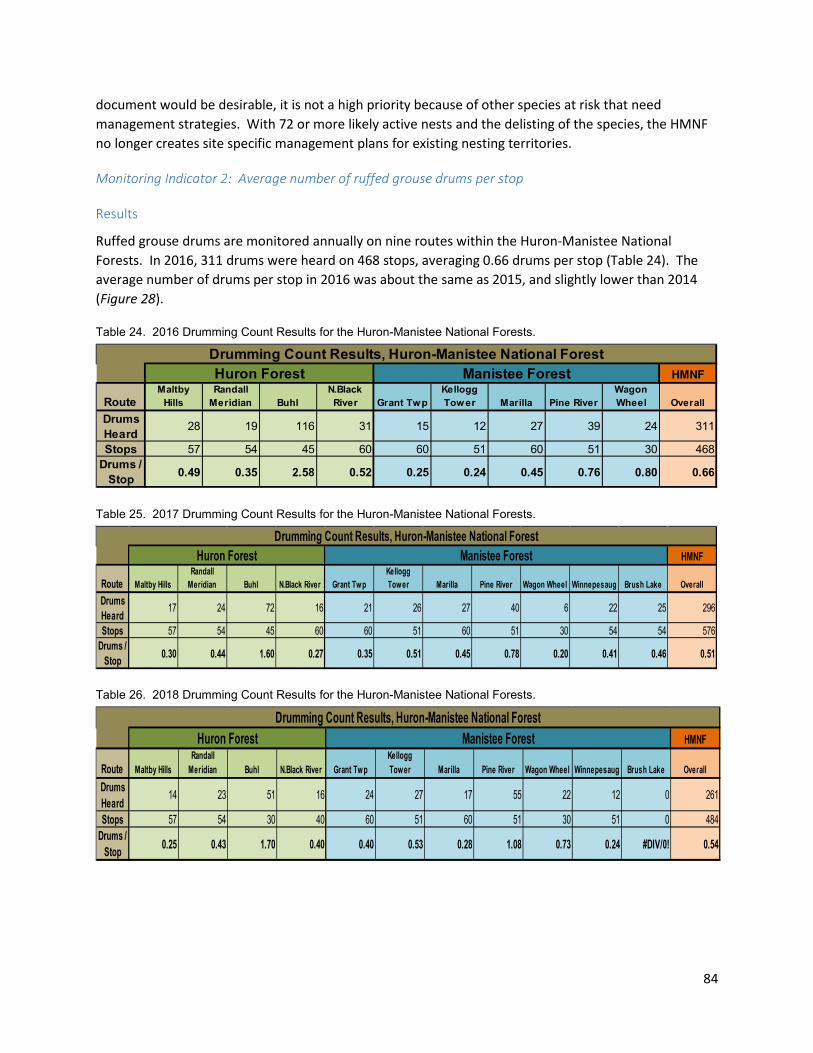
84
document would be desirable, it is not a high priority because of other species at risk that need management strategies. With 72 or more likely active nests and the delisting of the species, the HMNF no longer creates site specific management plans for existing nesting territories.
Monitoring Indicator 2: Average number of ruffed grouse drums per stop
Results
Ruffed grouse drums are monitored annually on nine routes within the Huron-Manistee National Forests. In 2016, 311 drums were heard on 468 stops, averaging 0.66 drums per stop (Table 24). The average number of drums per stop in 2016 was about the same as 2015, and slightly lower than 2014 (Figure 28).
Table 24. 2016 Drumming Count Results for the Huron-Manistee National Forests.
Table 25. 2017 Drumming Count Results for the Huron-Manistee National Forests.
Table 26. 2018 Drumming Count Results for the Huron-Manistee National Forests.
HMNF
RouteMaltby
HillsRandall
Meridian BuhlN.Black River Grant Twp
Kellogg Tower Marilla Pine River
Wagon Wheel Overall
Drums Heard 28 19 116 31 15 12 27 39 24 311
Stops 57 54 45 60 60 51 60 51 30 468Drums /
Stop 0.49 0.35 2.58 0.52 0.25 0.24 0.45 0.76 0.80 0.66
Drumming Count Results, Huron-Manistee National ForestHuron Forest Manistee Forest
HMNF
Route Maltby HillsRandall
Meridian Buhl N.Black River Grant TwpKellogg Tower Marilla Pine River Wagon Wheel Winnepesaug Brush Lake Overall
Drums Heard 17 24 72 16 21 26 27 40 6 22 25 296
Stops 57 54 45 60 60 51 60 51 30 54 54 576Drums /
Stop 0.30 0.44 1.60 0.27 0.35 0.51 0.45 0.78 0.20 0.41 0.46 0.51
Drumming Count Results, Huron-Manistee National ForestHuron Forest Manistee Forest
HMNF
Route Maltby HillsRandall
Meridian Buhl N.Black River Grant TwpKellogg Tower Marilla Pine River Wagon Wheel Winnepesaug Brush Lake Overall
Drums Heard 14 23 51 16 24 27 17 55 22 12 0 261
Stops 57 54 30 40 60 51 60 51 30 51 0 484Drums /
Stop 0.25 0.43 1.70 0.40 0.40 0.53 0.28 1.08 0.73 0.24 #DIV/0! 0.54
Drumming Count Results, Huron-Manistee National ForestHuron Forest Manistee Forest
85
Figure 28. Average Ruffed Grouse Drums per Stop.
Discussion
Variations in numbers of grouse drums heard, between areas and years, may be due to the well-known “ten-year cycle” in ruffed grouse numbers. Figure 28 illustrates the average number of ruffed grouse drums per stop for the period 2006 to 2018. The graph suggests that the ruffed grouse population on the HMNF has risen and stabilized from the low in 2006. It may have reached the high phase of the ten-year cycle, peaking in 2009. A total of 261 ruffed grouse drums were heard on all routes in 2018, with an average 0.54 drums per stop. This data suggests that the ruffed grouse population continues to be viable on the HMNFs.
Habitat and population objectives in the Forest Plan are to “maintain a minimum of 750 breeding pairs on the Huron National Forest and 1,000 breeding pairs on the Manistee National Forest. Two and one-half acres of zero to nine-year-old aspen adjacent to mature aspen will be maintained per breeding pair for a total of 1,875 acres on the Huron National Forest and 2,500 acres on the Manistee National Forest,” or a total of 4,375 for the HMNFs. In 2018, a total of 2,881 acres of aspen is in the 0-9 age class on the HMNFs; 1,673 acres on the Manistee National Forest and 1,480 acres on the Huron National Forest. This is 66 percent of the minimum objective for 0-9 year old aspen.
While ruffed grouse population is viable, the HMNFs are not meeting the early successional habitat objectives stated in the Forest Plan. See section 5.2 – Select Ecological Conditions and Key Characteristics of Aspen Ecosystems for the discussion on early successional habitat.
86
Monitoring Indicator 3: Brook Trout and mottled sculpin: Relative (Catch-Per-Unit-Effort), total (e.g. pounds/acre, fish/acre), or age-class abundance of brook trout and mottled sculpin
Results
Data collected by the Michigan DNR (MDNR) Fisheries Division Status and Trends Program (STP) was used to estimate the number of brook trout per acre in watersheds within the HMNF (SOM 2017). The STP has a series of fixed sites across the state that are sampled on a 3-years-on/3-years-off rotation to assess population trends across the state and over time (SOM 2017, Wills et al. 2006). Total number of brook trout per acre was calculated by using the sum of fish in age 1, 2 and 3+ age classes per year from 2006-2018. Of the ten sites where STP data was available, five maintained or exceeded an average of 40 individuals, age 1+/acre (Figure 29).
Data on mottled sculpin was collected using single-pass backpack electrofishing. Five systems were sampled to monitor changes associated with habitat restoration activities (
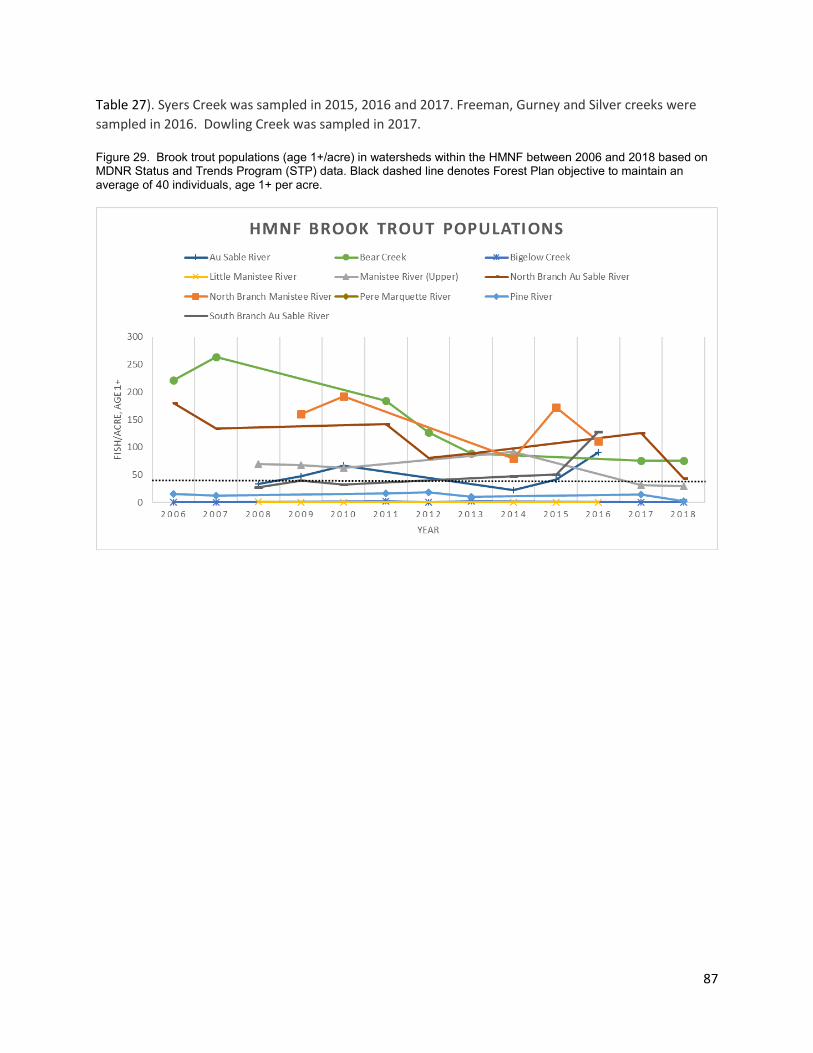
87
Table 27). Syers Creek was sampled in 2015, 2016 and 2017. Freeman, Gurney and Silver creeks were sampled in 2016. Dowling Creek was sampled in 2017.
Figure 29. Brook trout populations (age 1+/acre) in watersheds within the HMNF between 2006 and 2018 based on MDNR Status and Trends Program (STP) data. Black dashed line denotes Forest Plan objective to maintain an average of 40 individuals, age 1+ per acre.
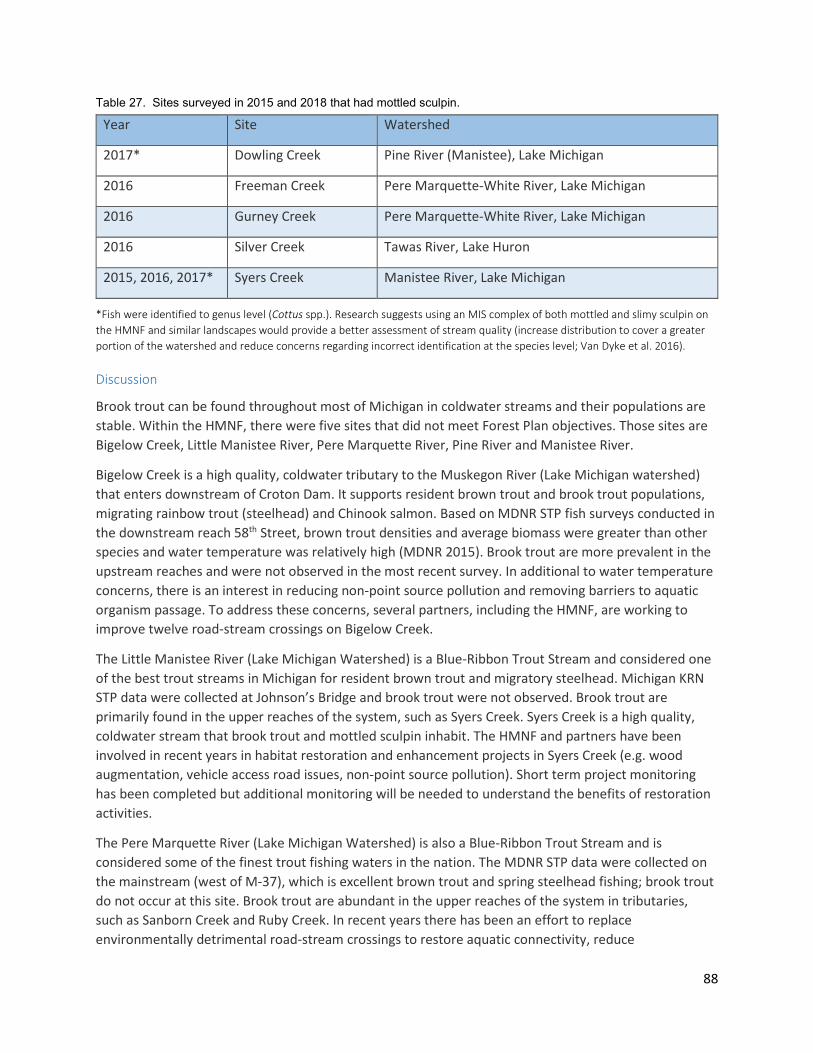
88
Table 27. Sites surveyed in 2015 and 2018 that had mottled sculpin.
Year Site Watershed
2017* Dowling Creek Pine River (Manistee), Lake Michigan
2016 Freeman Creek Pere Marquette-White River, Lake Michigan
2016 Gurney Creek Pere Marquette-White River, Lake Michigan
2016 Silver Creek Tawas River, Lake Huron
2015, 2016, 2017* Syers Creek Manistee River, Lake Michigan
*Fish were identified to genus level (Cottus spp.). Research suggests using an MIS complex of both mottled and slimy sculpin on the HMNF and similar landscapes would provide a better assessment of stream quality (increase distribution to cover a greater portion of the watershed and reduce concerns regarding incorrect identification at the species level; Van Dyke et al. 2016).
Discussion
Brook trout can be found throughout most of Michigan in coldwater streams and their populations are stable. Within the HMNF, there were five sites that did not meet Forest Plan objectives. Those sites are Bigelow Creek, Little Manistee River, Pere Marquette River, Pine River and Manistee River.
Bigelow Creek is a high quality, coldwater tributary to the Muskegon River (Lake Michigan watershed) that enters downstream of Croton Dam. It supports resident brown trout and brook trout populations, migrating rainbow trout (steelhead) and Chinook salmon. Based on MDNR STP fish surveys conducted in the downstream reach 58th Street, brown trout densities and average biomass were greater than other species and water temperature was relatively high (MDNR 2015). Brook trout are more prevalent in the upstream reaches and were not observed in the most recent survey. In additional to water temperature concerns, there is an interest in reducing non-point source pollution and removing barriers to aquatic organism passage. To address these concerns, several partners, including the HMNF, are working to improve twelve road-stream crossings on Bigelow Creek.
The Little Manistee River (Lake Michigan Watershed) is a Blue-Ribbon Trout Stream and considered one of the best trout streams in Michigan for resident brown trout and migratory steelhead. Michigan KRN STP data were collected at Johnson’s Bridge and brook trout were not observed. Brook trout are primarily found in the upper reaches of the system, such as Syers Creek. Syers Creek is a high quality, coldwater stream that brook trout and mottled sculpin inhabit. The HMNF and partners have been involved in recent years in habitat restoration and enhancement projects in Syers Creek (e.g. wood augmentation, vehicle access road issues, non-point source pollution). Short term project monitoring has been completed but additional monitoring will be needed to understand the benefits of restoration activities.
The Pere Marquette River (Lake Michigan Watershed) is also a Blue-Ribbon Trout Stream and is considered some of the finest trout fishing waters in the nation. The MDNR STP data were collected on the mainstream (west of M-37), which is excellent brown trout and spring steelhead fishing; brook trout do not occur at this site. Brook trout are abundant in the upper reaches of the system in tributaries, such as Sanborn Creek and Ruby Creek. In recent years there has been an effort to replace environmentally detrimental road-stream crossings to restore aquatic connectivity, reduce
89
sedimentation and bank erosion, and restore stream flow in Sanborn Creek. This process is ongoing. Aside from the poorly designed road-stream crossings, Sanborn Creek is a high quality, coldwater tributary.
The Pine River is a major tributary to the Manistee River (Lake Michigan Watershed). Portions of the river are state-designated Blue-Ribbon Trout Stream and Brook Trout Better Fishing Waters that support self-sustaining populations of brook trout, brown trout and rainbow trout (non-migratory; SOM 2017). Based on MDNR STP surveys at 230th Avenue, brook trout numbers (fish/acre) are > 50% below the long-term average. From 1997-2003 Stronach Dam was removed. Following the removal, a decline in brook trout and an increase in both rainbow trout and brown trout was documented (Burroughs et al. 2010). An exact reason for their decline is not possible given the changes in physical and biological conditions, thus, it is uncertain if habitat enhancement and rehabilitation activities would benefit the species.
Michigan DNR STP sampling for the Manistee River occurs in the upper portion of the watershed at Cameron Bridge. Results from 2017-2018 sampling show a decline in the total number of brook trout (fish/acre). However, numbers are within 50% of the long-term average.
Mottled sculpin have a broad geographic distribution and their global populations are considered secure (NatureServe 2013). Two species of sculpin are known to occur in streams of the HMNF, mottled sculpin (Cottus bairdii) and slimy sculpin (C. cognatus). Field identification to species demands the ability to count pectoral fin rays; hence, traditional sampling has lumped these two species simply as sculpin. Additionally, sculpin are not sport fish species. Thus, there is often limited information available to determine population trends within the HMNF.
Monitoring Indicator 4: The number of Kirtland's warbler singing males
Results
See discussion of KW under question 3 above.
Discussion See above
Monitoring Indicator 5: Estimated Karner blue butterfly abundance
Results
See the discussion of KBB under question 3 above
Discussion See above
Recommendations
The HMNF should continue its current efforts to work with partners on aquatic habitat restoration projects with a focus on high quality, coldwater streams. The incorporation of freshwater mussels as a management indicator species in the future would be useful. Freshwater mussels are good indicators of water quality, biological integrity and aquatic connectivity (Grabarkiewicz and Davis 2008).

90
Evaluation of Monitoring Question and Indicator(s)
Brook trout are an appropriate indicator selected for this monitoring question. Mottled sculpin are more challenging to use an indicator species due to the limited availability of data and difficulty of differentiating sculpin species.
References
Burroughs, B.A., D. B. Hayes, K. D. Klomp, J. F. Hansen & J. Mistak. 2010. The Effects of the Stronach Dam Removal on Fish in the Pine River, Manistee County, Michigan. Transactions of the American Fisheries Society Vol. 139 , Iss. 5, 2010.
Grabarkiewicz, J. and W. Davis. 2008. An introduction to freshwater mussels as biological indicators. EPA-260-R08-015. U.S. Environmental Protection Agency, Office of Environmental Information, Washington, DC.
Michigan Department of Natural Resources (MDNR). 2015. Central Lake Michigan Management Unit Newsletter, Issue 3. Michigan Department of Natural Resources.
NatureServe. 2013. Cottus bairdii. The IUCN Red List of Threatened Species 2013: e.T202652A15361487. Last Modified September 2017. Last accessed August 22, 2017 at: http://dx.doi.org/10.2305/IUCN.UK.2013-1.RLTS.T202652A15361487.en
State of Michigan (SOM). 2017. Brook trout. Michigan Department of Natural Resources. Last modified 2017. Last accessed August 20, 2017 at: http://www.michigan.gov/dnr/0,4570,7-153-10364_53405-213981--,00.html.
State of Michigan (SOM). 2017. Brook Trout Better Fishing Waters. Michigan Department of Natural Resources. Last modified 2017. Last accessed August 23, 2017 at: http://www.michigan.gov/dnr/0,1607,7-153-10364_53405-218165--,00.html
State of Michigan (SOM). 2017. Stream Fish Population Trend Viewer. Michigan Department of Natural Resources. Last modified 2017. Last accessed August 21, 2017 at: https://www.mcgi.state.mi.us/fishpop/?source=govdelivery&source=govdelivery#.
Van Dyke, F., B.W. Van Ee, J. W. Budi, H.E. Burrows, T.B. Sokolowski & D. Wong. 2016. Value of the Mottled Sculpin as a Management Indicator Species. Unpublished manuscript.
Wills, Todd C., T. G. Zorn, and A. J. Nuhfer. 2006. Stream Status and Trends Program sampling protocols. Chapter 26 in Schneider, James C. (ed.) 2000. Manual of fisheries survey methods II: with periodic updates. Michigan Department of Natural Resources, Fisheries Special Report 25, Ann Arbor.

91
5.12 – Invasive Species
5.121 – Monitoring Question
To what extent is forest management contributing or responding to populations of terrestrial / aquatic non-native invasive species of concern?
Last Updated
This question was part of the 2006 Forest Plan.
Monitoring Indicator(s)
Number of acres treated and monitored for non-native invasive species by fiscal year.
Monitoring Frequency
This will be monitored annually.
Background & Driver(s)
Non-native invasive species are widely accepted as a major threat to social, economic, and ecological values associated with natural resources management. The Goal of the Forest Service Region 9 NNIS Program is to implement “appropriate and successful invasion prevention measures to maintain intact ecosystems on each national forest and grassland. Populations of non-native invasive plants and animals are managed by an efficient program of prevention and control…” (Forest Service 2003). The Huron-Manistee National Forests Land and Resource Plan includes the following under Forest-wide Goals and Objectives: “Reduce non-native invasive species infestations and prevent new invasive species from becoming established, when possible.” The indicator chosen for this monitoring question directly measures status and actions taken to control NNIS on the HMNF.
Monitoring Indicator 1: Number of acres treated and monitored for non-native invasive species by fiscal year
Results
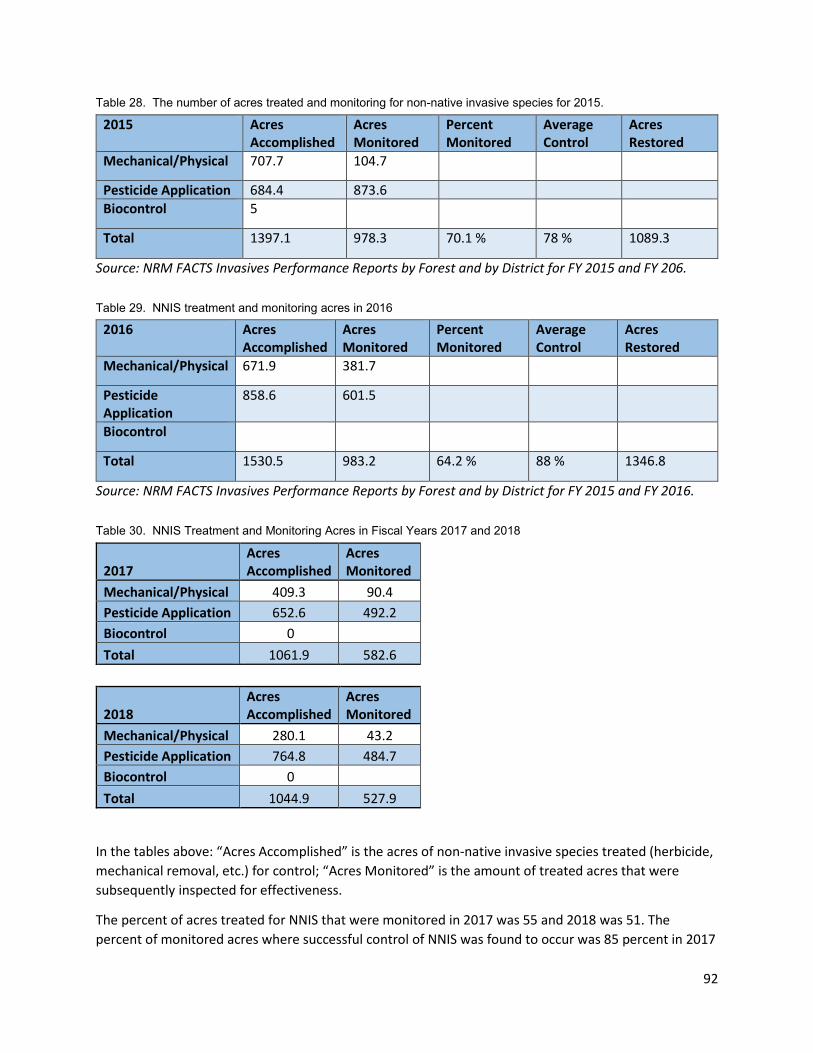
92
Table 28. The number of acres treated and monitoring for non-native invasive species for 2015.
2015 Acres Accomplished
Acres Monitored
Percent Monitored
Average Control
Acres Restored
Mechanical/Physical 707.7 104.7
Pesticide Application 684.4 873.6 Biocontrol 5
Total 1397.1 978.3 70.1 % 78 % 1089.3
Source: NRM FACTS Invasives Performance Reports by Forest and by District for FY 2015 and FY 206.
Table 29. NNIS treatment and monitoring acres in 2016
2016 Acres Accomplished
Acres Monitored
Percent Monitored
Average Control
Acres Restored
Mechanical/Physical 671.9 381.7
Pesticide Application
858.6 601.5
Biocontrol
Total 1530.5 983.2 64.2 % 88 % 1346.8
Source: NRM FACTS Invasives Performance Reports by Forest and by District for FY 2015 and FY 2016.
Table 30. NNIS Treatment and Monitoring Acres in Fiscal Years 2017 and 2018
2017 Acres Accomplished
Acres Monitored
Mechanical/Physical 409.3 90.4 Pesticide Application 652.6 492.2 Biocontrol 0 Total 1061.9 582.6
2018 Acres Accomplished
Acres Monitored
Mechanical/Physical 280.1 43.2 Pesticide Application 764.8 484.7 Biocontrol 0 Total 1044.9 527.9
In the tables above: “Acres Accomplished” is the acres of non-native invasive species treated (herbicide, mechanical removal, etc.) for control; “Acres Monitored” is the amount of treated acres that were subsequently inspected for effectiveness.
The percent of acres treated for NNIS that were monitored in 2017 was 55 and 2018 was 51. The percent of monitored acres where successful control of NNIS was found to occur was 85 percent in 2017
93
and 74 percent in 2018. The average successful control rate (i.e. “Average Control”) was applied to the total number of acres treated to estimate total acres successfully restored for the Fiscal Year. The total acres successfully restored was 905 in 2017 and 777 in 2018 (FACTS database 2019).
Discussion
The results indicate that the HMNF continues to make progress towards attaining Regional and Forest Plan goals as described in the “Background & Drivers” section. Results also suggest that implementation rate is slow relative to the scope of the problem.
Acres accomplished in both FY2017 and 2018 are down about one third from those reported in FY2016. Similarly, the percent of acres monitored, and the effectiveness of treatment, are below levels reported in FY16. FY18 acres are below FY17 levels indicating the possibility of a downward trend in acres treated.
Recommendations
HMNF should explore the reason for reduced reported treatment acreage in FY17 and 18 compared to FY16. External funding sources, such as the Great Lakes Restoration Initiative (GLRI), may have resulted in unusually high accomplishment in FY16. However, the time period of record overlaps a Region-wide operational change where non-fire and timber targets, such as NNIS treatment, were deemphasized and this may be a contributing factor. It is too early to suggest that a downward trend is, in fact, occurring or if the information is showing normal fluctuation in NNIS accomplishment; future accomplishment levels will provide greater insight.
Recommendations provided in the FY2016 Monitoring Report suggested that the HMNF should continue its efforts to manage NNIS on NFS lands but should also use partnerships (e.g. State of Michigan and Cooperative Invasive Species Management Areas (CISMAs)) and other funding opportunities (e.g. Good Neighbor Authority (GNA) and Stewardship) to accomplish goals. The HMNF has made good progress in setting up such partnerships, especially using GNA dollars to fund CISMAs for NNIS treatment. FY2020 will be the first year that NNIS treatments are accomplished under this partnership arrangement. Implementation of this partnership is expected to provide additional capacity for NNIS treatment on and adjacent to NFS lands administered by the HMNF.
Evaluation of Monitoring Question and Indicator(s)
This monitoring question and associated indicator appear to be appropriate at this time and no changes are currently recommended.
References
Forest Service. 2003. Non-Native Invasive Species Framework for Plants and Animals in the U.S. Forest Service, Eastern Region. R9 Regional Leadership Team. April 11, 2003. 20p.
94
5.13 – Timber Product Mix
5.131 – Monitoring Question
What is the mix (product ratio) of sawtimber and pulpwood produced and what is the output level of non-chargeable timber (restoration treatments), versus chargeable (ASQ)?
Last Updated
This question was part of the 2006 Forest Plan.
Monitoring Indicator(s)
Total volume sold of chargeable and nonchargeable by fiscal year. Ratio of sawtimber and pulpwood sold volume by fiscal year. Acres treated by silvicultural method by fiscal year.
Monitoring Frequency
This will be monitored annually.
Background & Driver(s)
This is a measure of the expected forest outputs described in the Forest Plan vs. actual forest outputs.
The indicators used are how the volume of timber is recorded in the Forest Service data systems.
Monitoring Indicator 1: Total volume sold of chargeable and nonchargeable by fiscal year
Results
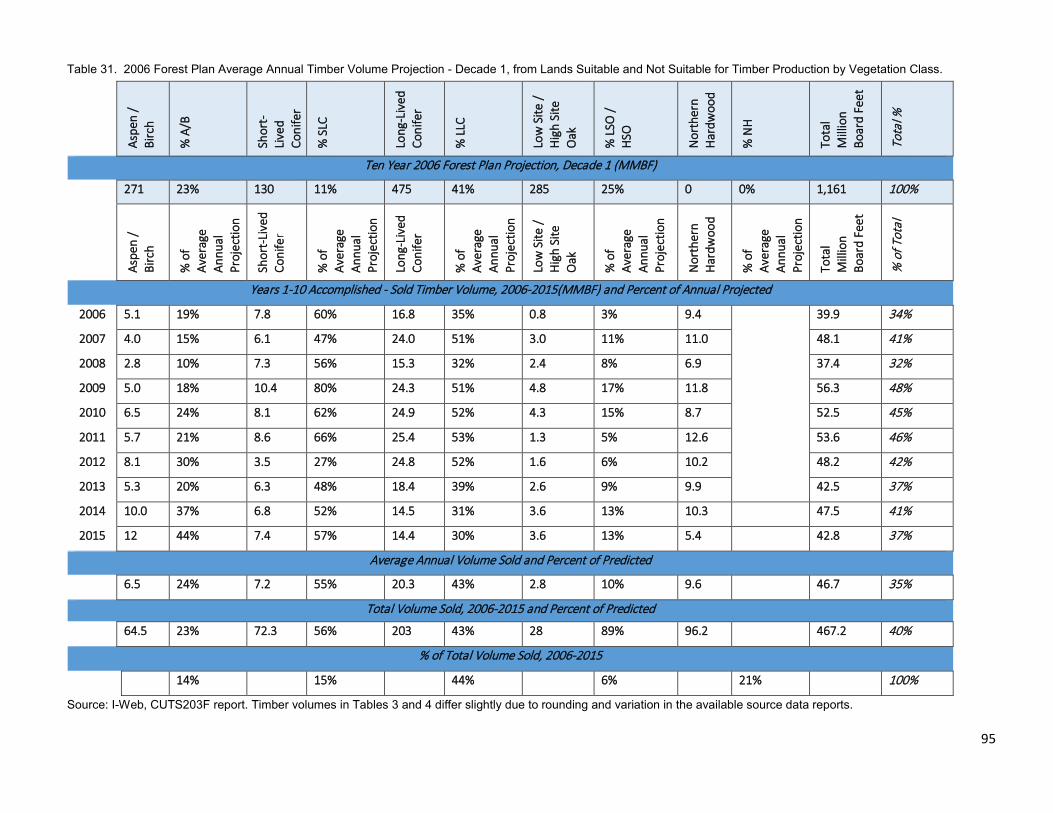
95
Table 31. 2006 Forest Plan Average Annual Timber Volume Projection - Decade 1, from Lands Suitable and Not Suitable for Timber Production by Vegetation Class.
Aspe
n /
Birc
h
% A
/B
Shor
t-Li
ved
Coni
fer
% S
LC
Long
-Liv
ed
Coni
fer
% L
LC
Low
Site
/ H
igh
Site
O
ak
% L
SO /
HSO
Nor
ther
n H
ardw
ood
% N
H
Tota
l M
illio
n Bo
ard
Feet
Tota
l %
Ten Year 2006 Forest Plan Projection, Decade 1 (MMBF)
271 23% 130 11% 475 41% 285 25% 0 0% 1,161 100%
Aspe
n /
Birc
h
% o
f Av
erag
e An
nual
Pr
ojec
tion
Shor
t-Li
ved
Coni
fer
% o
f Av
erag
e An
nual
Pr
ojec
tion
Long
-Liv
ed
Coni
fer
% o
f Av
erag
e An
nual
Pr
ojec
tion
Low
Site
/ H
igh
Site
O
ak
% o
f Av
erag
e An
nual
Pr
ojec
tion
Nor
ther
n H
ardw
ood
% o
f Av
erag
e An
nual
Pr
ojec
tion
Tota
l M
illio
n Bo
ard
Feet
% o
f Tot
al
Years 1-10 Accomplished - Sold Timber Volume, 2006-2015(MMBF) and Percent of Annual Projected
2006 5.1 19% 7.8 60% 16.8 35% 0.8 3% 9.4 39.9 34%
2007 4.0 15% 6.1 47% 24.0 51% 3.0 11% 11.0 48.1 41%
2008 2.8 10% 7.3 56% 15.3 32% 2.4 8% 6.9 37.4 32%
2009 5.0 18% 10.4 80% 24.3 51% 4.8 17% 11.8 56.3 48%
2010 6.5 24% 8.1 62% 24.9 52% 4.3 15% 8.7 52.5 45%
2011 5.7 21% 8.6 66% 25.4 53% 1.3 5% 12.6 53.6 46%
2012 8.1 30% 3.5 27% 24.8 52% 1.6 6% 10.2 48.2 42%
2013 5.3 20% 6.3 48% 18.4 39% 2.6 9% 9.9 42.5 37%
2014 10.0 37% 6.8 52% 14.5 31% 3.6 13% 10.3 47.5 41%
2015 12 44% 7.4 57% 14.4 30% 3.6 13% 5.4 42.8 37%
Average Annual Volume Sold and Percent of Predicted
6.5 24% 7.2 55% 20.3 43% 2.8 10% 9.6 46.7 35%
Total Volume Sold, 2006-2015 and Percent of Predicted
64.5 23% 72.3 56% 203 43% 28 89% 96.2 467.2 40%
% of Total Volume Sold, 2006-2015
14% 15% 44% 6% 21% 100%
Source: I-Web, CUTS203F report. Timber volumes in Tables 3 and 4 differ slightly due to rounding and variation in the available source data reports.
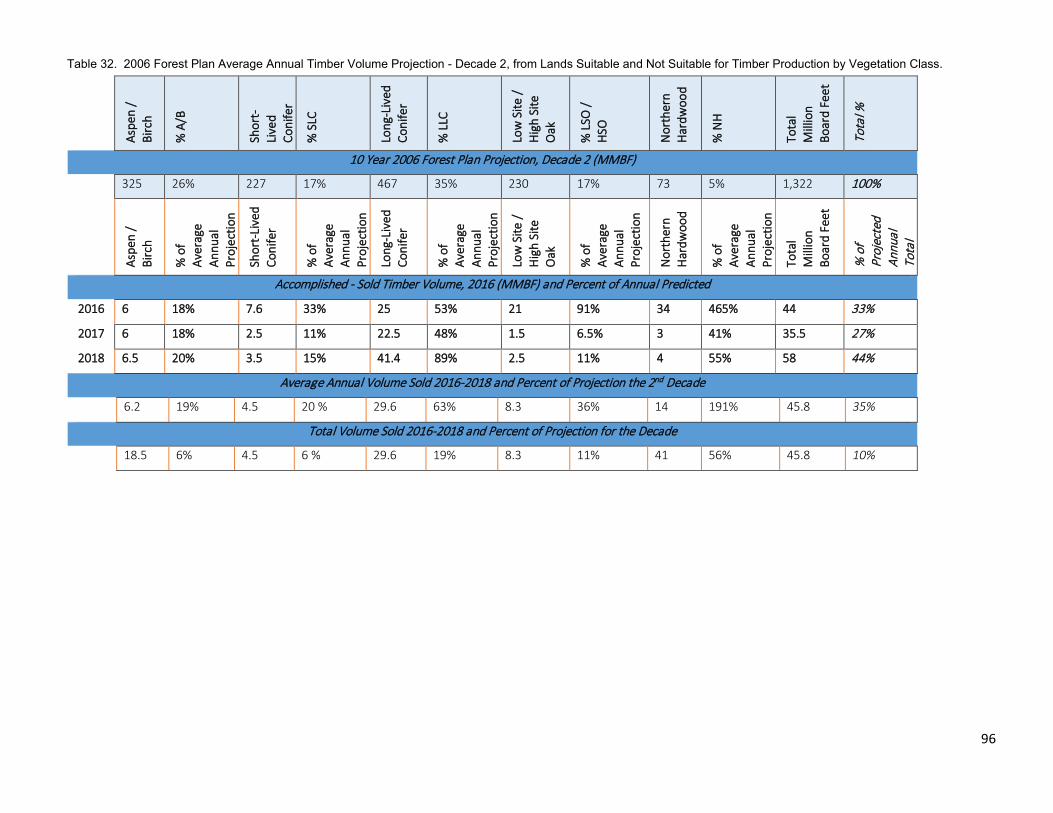
96
Table 32. 2006 Forest Plan Average Annual Timber Volume Projection - Decade 2, from Lands Suitable and Not Suitable for Timber Production by Vegetation Class.
Aspe
n /
Birc
h
% A
/B
Shor
t-Li
ved
Coni
fer
% S
LC
Long
-Liv
ed
Coni
fer
% L
LC
Low
Site
/ H
igh
Site
O
ak
% L
SO /
HSO
Nor
ther
n H
ardw
ood
% N
H
Tota
l M
illio
n Bo
ard
Feet
Tota
l %
10 Year 2006 Forest Plan Projection, Decade 2 (MMBF)
325 26% 227 17% 467 35% 230 17% 73 5% 1,322 100%
Aspe
n /
Birc
h
% o
f Av
erag
e An
nual
Pr
ojec
tion
Shor
t-Li
ved
Coni
fer
% o
f Av
erag
e An
nual
Pr
ojec
tion
Long
-Liv
ed
Coni
fer
% o
f Av
erag
e An
nual
Pr
ojec
tion
Low
Site
/ H
igh
Site
O
ak
% o
f Av
erag
e An
nual
Pr
ojec
tion
Nor
ther
n H
ardw
ood
% o
f Av
erag
e An
nual
Pr
ojec
tion
Tota
l M
illio
n Bo
ard
Feet
% o
f Pr
ojec
ted
Annu
al
Tota
l
Accomplished - Sold Timber Volume, 2016 (MMBF) and Percent of Annual Predicted
2016 6 18% 7.6 33% 25 53% 21 91% 34 465% 44 33%
2017 6 18% 2.5 11% 22.5 48% 1.5 6.5% 3 41% 35.5 27%
2018 6.5 20% 3.5 15% 41.4 89% 2.5 11% 4 55% 58 44%
Average Annual Volume Sold 2016-2018 and Percent of Projection the 2nd Decade
6.2 19% 4.5 20 % 29.6 63% 8.3 36% 14 191% 45.8 35%
Total Volume Sold 2016-2018 and Percent of Projection for the Decade
18.5 6% 4.5 6 % 29.6 19% 8.3 11% 41 56% 45.8 10%
97
Discussion
HMNF capability to complete project environmental analyses, and prepare and award timber sale contracts, is based on funding, staffing levels, and assigned targets that are established based on Regional and National outputs. The Allowable Sale Quantity (ASQ) is the maximum harvest level that still provides for maintaining a long-term sustainable flow of timber.
The amount of timber volume sold for the first decade was below the proposed and probable actions identified in the 2006 Forest Plan.
For the second decade the amount of timber volume sold overall was down compared to the proposed and probable actions identified in the Forest Plan. In 2018 the volume sold increased over previous years. The species product mix projected for the second decade is different than the first, and we will track the trend as we move further into the second decade. The amount of timber sold as it relates to the ASQ for the Forest is expected to increase but may not reach full ASQ levels without changes in funding.
Monitoring Indicator 2: Ratio of sawtimber and pulpwood sold volume by fiscal year
Results
In 2016 HMNF sold 29,565.97 CCF in Sawtimber compared to 43,798 CCF of Pulpwood.
In 2017 HMNF sold 12,003 CCF in Sawtimber compared to 50,011 CCF in pulpwood.
In 2018 HMNF sold 32,481 CCF in Sawtimber compared to 45,616 CCF in pulpwood.
Discussion
The ratio of sawtimber to pulpwood is a direct reflection of the size of the timber being removed, and the type of silvicultural prescriptions being utilized. With large amounts of the volume sold being done through thinning, often, smaller trees are being removed to allow space for the larger trees to continue to flourish. Also, stands are so densely stocked, that stems are small in diameter due to competition.
Monitoring Indicator 3: Acres treated by silvicultural method by fiscal year.
Results

98
Table 33. 2006 Forest Plan Decade 1 Proposed and Probable Silvicultural Method Compared to Actual Sold Acres from Suitable and Not Suitable Forest Land, FYs 2006-2015.
Thin Clearcut Shelterwood Selection Total
Forest Plan Annual Projection: ASQ, PLUS Barrens and Fuelbreaks;
Acres % of Average
Annual Projection
Acres % of Average
Annual Projection
Acres % of Average
Annual Projection
Acres % of Average
Annual Projection
Acres % of Average
Annual Projection
Decade 1 59,457 38% 88,684 57% 8,261 5% 0 0% 156,402 100%
Acres Accomplished
Acres % of Thin Acres % of Clearcut Acres % of Shelterwood Acres % of Selection Acres
% of Average Annual Forest Plan Projection
2006 3,498 59% 3,230 36% 636 77% 0 - 7,364 47%
2007 4,036 68% 3,269 37% 694 84% 0 - 7,999 51%
2008 3,074 52% 1,737 20% 384 46% 27 - 5,222 33%
2009 2,998 50% 3,083 35% 194 23% 10 - 6,285 40%
2010 2,244 38% 3,178 36% 638 77% 0 - 6,060 39%
2011 896 15% 1,917 22% 494 60% 0 - 3,307 21%
2012 2,348 39% 2,009 23% 218 26% 206 - 4,781 31%
2013 1,894 32% 2,126 24% 128 15% 0 - 4,148 27%
2014 1,740 29% 1,320 15% 365 44% 81 - 3,506 22%
2015 2,731 46% 1,405 16% 237 29% 51 - 4,424 28%
Average Annual Acres Sold, 2006-2015 and Percent of Projection for the Decade
2,546 43% 2,327 26% 399 48% 38 - 5,310 34%
Total Accomplished, 2006- 2015 and Percent of the Projection for the Decade
25,459 43% 23,274 26% 3,988 48% 375 - 53,096 34%
Source: NRM Staff - FACTS User View Query. Fuel Break Maintenance not a timber harvest action.
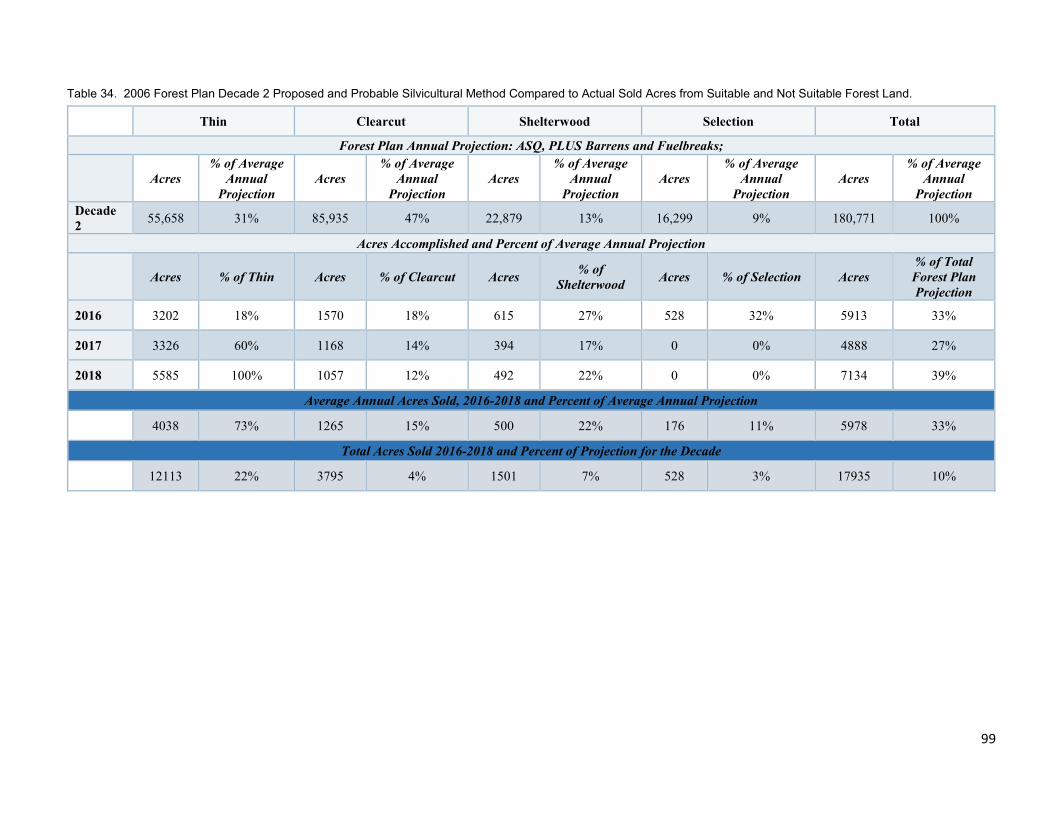
99
Table 34. 2006 Forest Plan Decade 2 Proposed and Probable Silvicultural Method Compared to Actual Sold Acres from Suitable and Not Suitable Forest Land.
Thin Clearcut Shelterwood Selection Total
Forest Plan Annual Projection: ASQ, PLUS Barrens and Fuelbreaks;
Acres % of Average
Annual Projection
Acres % of Average
Annual Projection
Acres % of Average
Annual Projection
Acres % of Average
Annual Projection
Acres % of Average
Annual Projection
Decade 2 55,658 31% 85,935 47% 22,879 13% 16,299 9% 180,771 100%
Acres Accomplished and Percent of Average Annual Projection
Acres % of Thin Acres % of Clearcut Acres % of Shelterwood Acres % of Selection Acres
% of Total Forest Plan Projection
2016 3202 18% 1570 18% 615 27% 528 32% 5913 33%
2017 3326 60% 1168 14% 394 17% 0 0% 4888 27%
2018 5585 100% 1057 12% 492 22% 0 0% 7134 39%
Average Annual Acres Sold, 2016-2018 and Percent of Average Annual Projection
4038 73% 1265 15% 500 22% 176 11% 5978 33%
Total Acres Sold 2016-2018 and Percent of Projection for the Decade
12113 22% 3795 4% 1501 7% 528 3% 17935 10%
100
Discussion
For the first decade the Forests treated only approximately 34% of the acres that were projected to be cut. The Forests did slightly less clearcutting and thinning than proposed in the first decade but did more shelterwood and treated 10 percent of the acreage that had harvesting by selection cutting which was not proposed for the first decade.
For the second decade thus far, the Forests have averaged approximately 33 percent of the acres that were projected for cutting. The plan projected an increase in the acres treated with selection cutting, shelterwood and clearcutting. After 3 years in the second decade the greatest percentage of the acres harvested have been thinned. An average of 59 percent of the acreage that the plan projected for thinning have been cut, despite the overall average number of acres having timber cuts being only 33 percent of the projected amount. The average yearly clearcutting acreage thus far for the second decade is approximately 15 percent of the projected acreage, selection is 11 percent of projected, and shelterwood is 22 percent of projected.
Recommendations
More final harvest should be accomplished to maintain age class diversity. Aspen forest types should be harvested to maintain this type.
Evaluation of Monitoring Question and Indicator(s)
No changes to the monitoring indicators are recommended.
References
None.
101
6.0 Recommendations
Aspen Management
An opportunity exists to increase management for early-successional habitats to benefit ruffed grouse, woodcock, golden-winged warblers, white-tailed deer and other associated species. A need exists to better regulate the age class distribution of aspen on the HMNF, and the recommendations below describe actions that could improve aspen management.
• Identify opportunities for aspen management where concentrations of aspen occurs outside of grouse management areas. Identify these “aspen management areas” to allow for age-class regulation and better identify aspen management objectives (acres per decade).
• Emphasize regulated harvest of aspen to maintain a more even distribution of habitat in each of the age classes 0-59 in grouse and other aspen management areas.
• Identify opportunities for potential aspen harvest in each new project area outside of grouse and aspen management areas.
The Forest could implement aspen management activities to help meet Forest Plan objectives, based on how the aspen resource is distributed across the HMNFs.
Endangered, Threatened and Sensitive Species
Kirtland’s Warbler
Continue managing an average of at least 1,100 acres jack pine annually to develop Kirtland’s warbler breeding habitat according to the Kirtland’s Warbler Conservation Plan. The Forest Plan objective of 1,600 acres per year has not been attainable and does not appear to be necessary, based on the higher occupancy recorded within the larger treatment blocks.
Karner Blue Butterfly
Continue efforts to restore 3,000 acres of high-quality savanna habitat to promote the establishment of five viable KBB metapopulations.
Visitor Use and Satisfaction
Using National Visitor Use Monitoring Surveys as a monitoring indicator is the best tool we have to measure use, demographics and overall satisfaction. The agency is working to improve the format of the surveys to more align with modern technology, which will help.
The HMNF should look at opportunities to welcome a more ethnically-diverse visitor population to more reflect the population of the United States.
Pests and Pathogens
There is research needed in many areas to help with the control of these pests and pathogens. Some include the methods of detection, factors that promote/discourage establishment and spread, population dynamics, soil or climatic conditions favorable for establishment, and management practices,
102
biocontrol measures, chemical treatments or genetic resistance development of trees to control the spread of these pests and pathogens.
Some management practices that the Forests are starting to employ are harvesting restrictions for the time of cutting, for example to restrict the spread of oak wilt and HRD. While trenching and tree and stump removal can also be done to remove both oak wilt and HRD infection sites, these methods are expensive. There are research programs looking for resistance of trees to some of these pest/pathogens (such as identifying lingering ash or beech trees to test for resistance for emerald ash borer or beech scale, respectively). There are also biocontrols being reared and released for some of the pests and insecticides tested for disease control.
The Forest should continue annual detection flights. Increasing the amount and types of surveys for pests and pathogens would improve the ability of the Forest to implement the Early Detection and Rapid Response protocols associated with Integrated Pest Management.
Productivity of the Land
The long-term soil productivity (LTSP) study should be continued for a full timber rotation (40-70 years) or beyond. Further, the study represents only one timber type (aspen) / soil type (loamy sand) combination and there are many on the Huron-Manistee National forests. The following recommendations should be implemented if time and funding are or become available. The study should be expanded to include jack pine on sand soils and red pine on sand soils. Data from years 15 and 20 of the study should be compiled, analyzed, and published in a peer-reviewed scientific journal. The LTSP should continue to be supported and associated data should continue to be collected at least until one full timber rotation age has been met.
Lands Adequately Restocked
Project-level interdisciplinary teams should continue to fully incorporate the length of time and costs necessary to re-stock and certify cut-over lands in vegetation management decisions. The emerging trend in silvicultural practices, especially in regeneration harvesting, will result in a short-term shift from young to older age vegetation classes, especially in aspen, long-lived conifers and low and high-site oaks.
There is a need to be consistent in recording the harvest cut used on the Forest and to change the LSC when needed as stated in the Land Suitability monitoring report.
Land Suitability Class
There is a need to review all land ownership and check for accuracy on the Forest compared to the vegetation layer.
There is a need to review Land Suitability Class information and see that current land on the Forest has been classified correctly before the next Plan revision.
MIS
The HMNF should continue its current efforts to work with partners on aquatic habitat restoration projects with a focus on high quality, coldwater streams. The incorporation of freshwater mussels as a
103
management indicator species in the future would be useful. Freshwater mussels are good indicators of water quality, biological integrity and aquatic connectivity (Grabarkiewicz and Davis 2008).
Invasive Species
HMNF should explore the reason for reduced reported treatment acreage in FY17 and 18 compared to FY16. External funding sources, such as the Great Lakes Restoration Initiative (GLRI), may have resulted in unusually high accomplishment in FY16. However, the time period of record overlaps a Region-wide operational change where non-fire and timber targets, such as NNIS treatment, were deemphasized and this may be a contributing factor. It is too early to suggest that a downward trend is, in fact, occurring or if the information is showing normal fluctuation in NNIS accomplishment; future accomplishment levels will provide greater insight.
Recommendations provided in the FY2016 Monitoring Report suggested that the HMNF should continue its efforts to manage NNIS on NFS lands but should also use partnerships (e.g. State of Michigan and Cooperative Invasive Species Management Areas (CISMAs)) and other funding opportunities (e.g. Good Neighbor Authority (GNA) and Stewardship) to accomplish goals. The HMNF has made good progress in setting up such partnerships, especially using GNA dollars to fund CISMAs for NNIS treatment. FY2020 will be the first year that NNIS treatments are accomplished under this partnership arrangement. Implementation of this partnership is expected to provide additional capacity for NNIS treatment on and adjacent to NFS lands administered by the HMNF.
Forest Product Mix
More final harvest should be accomplished to maintain age class diversity. Aspen forest types should be harvested to maintain this type.