Biochemical identification and ganglionic localization of leech angiotensin-converting enzymes
Upload
independentCategory
view
2download
0
This is a pre- or post-print of an article published inChen, H.-L., Lünsdorf, H., Hecht, H.-J., Tsai, H.
Porcine pulmonary angiotensin I-converting enzyme-Biochemical characterization and spatial arrangement of the N- and C-domains by three-
dimensional electron microscopic reconstruction(2010) Micron, 41 (6), pp. 674-685.

Porcine pulmonary angiotensin I-converting enzyme-Biochemical characterization and spatial arrangement of
the N- and C- domains by three-dimensional electron microscopy reconstruction
Hui-Ling Chen a,1, Heinrich Lünsdorf b,1, Hans-Jürgen Hecht c,2, and Hsin Tsai d,*
a Development Center for Biotechnology, Taipei County 221, Taiwan, ROCb Department of Vaccinology and Applied Microbiology, Helmholtz-Center of Infection
Research, 38124 Braunschweig, Germany
c Department of Structural Biology, Helmholtz-Center of Infection Research, 38124 Braunschweig, Germanyd Graduate Institute of Biotechnology, Chinese Culture University, Taipei 111,Taiwan, ROC1 Contributed equally to this work; 2 in memoriam, who died in November 2009* Corresponding author. Tel: +886 2 28623660; fax: +886 2 28623660E-mail address: [email protected]
1
5
10
15
Abstract
The somatic angiotensin I-converting enzyme (sACE; peptidyl-dipeptidase A; EC 3.4.15.1)
was isolated from pig lung and purified to homogeneity. The purified enzyme had a
molecular mass of about 180 kDa. Upon proteolytic cleavage, two approximately 90 kDa
fragments were obtained and identified by amino-terminal sequence analysis as the N- and
C- domains of sACE . Both purified domains were shown to be catalytically active. A 2.3 nm
low resolution model of sACE was obtained by three-dimensional electron microscopy
reconstruction of negatively stained sACE particles, based on atomic X-ray data fitting. Our
model shows for the first time the relative orientation of the sACE catalytically active domains
and their spatial distance.
Keywords: Somatic angiotensin I-converting enzyme; Pig Lung; N-domain; C-domain;
Electron microscopy; 3D reconstruction.
Abbreviations:
sACE, somatic angiotensin converting enzyme; tACE, testicular angiotensin converting
enzyme;Con A, concanavalin A; DEAE, diethylaminoethyl; DIEA, diisopropylethylamine; DMF,
N,N-dimethylformamide; DTT, dithiothreitol; EDTA, ethylene diamine tetraacetic acid; FA-Phe-
Gly-Gly, L-furylacryloyl-L-phenylalanyl-glycylglycine; HBTU, 2-(1H-benzotroazol-1-yl)-
1,1,3,3-tetramethyluronium hexafluorophosphate; Hepes, N-(2-hydroxyethyl) piperazine-N'-
(2-ethanesulfonic acid); HOBt, 1-hydroxybenzotriazole; HPLC, high performance liquid
chromatography; IEF, isoelectric focusing; MALDI-MS, matrix assisted laser desorption
ionization mass spectrometry; pI, isoelectric point; PNGase F, peptide N-glycosidase F; PVDF,
polyvinylidene difluoride; SDS-PAGE, sodium dodecyl sulfate polyacrylamide gel
electrophoresis; Tris, tris(hydroxymethyl)aminomethane
___________________________________________________________________________________________
2
5
10
15
20
25

1. Introduction
Somatic angiotensin I-converting enzyme (sACE; EC 3.4.15.1) is a zinc metalloprotease that
catalyzes the hydrolysis of carboxyl-terminal dipeptides from oligopeptide substrates, most
notably the decapeptide angiotensin I and the nonapeptide bradykinin (Corvol et al., 1995).
sACE exists primarily as a cell-surface integral membrane glycoprotein with the bulk of its
mass, including the catalytic sites, facing the extracellular milieu; therefore, it is an
ectoenzyme (Coates, 2003). ACE has been purified from most mammalian tissues and two
distinct isozymes have been identified. The larger form, Mr 150-180 kDa, is present
throughout the body, with the highest abundance in the lung and kidney. This form is
generally referred to as endothelial (or somatic) ACE. A smaller ACE isozyme of Mr 90-100
kDa, is found exclusively in the testis and generally referred to as testicular (or germinal) ACE.
The first full-length cDNA clone for ACE was constructed from the transcripts of ACE gene of
human kidney (Soubrier et al., 1988). Human endothelial ACE consists of a single polypeptide
chain composed of 1277 residues, of which 14 are cysteine residues. It contains 17 potential
N-glycosylation sites but no Ser/Thr rich region for O-glycosylation.
Molecular cloning of the cDNA of the sACE also demonstrated that the enzyme is composed
of two homologous domains, referred to here as the N- and C-domains, which are supposed
to result from gene duplication (Hubert et al., 1991; Riordan, 2003). The overall sequence
similarity between the two domains is 60% in both nucleotide and amino acid sequences but
increases to 89% in a sequence of 40 amino acids in each domain containing essential active
site residues. Therefore, each domain of sACE contains a catalytic site (Soubrier et al., 1988;
Wei et al., 1991). There is no sequence similarity between the carboxyl- and amino-terminal
extremities of the sACE molecule, and the central region which separates the two homologous
domains, called the 'interdomain linker' (Corradi et al., 2006) is also unique.
Although the physiological importance of ACE has long been recognized, its structure and
mechanism of action were not understood in detail. Recent advances in molecular biological
techniques made it possible to grow crystals of the N- domain of sACE (Corradi et al., 2006),
tACE (Natesh et al., 2003), and ACE2 (Towler et al., 2004), a C-domain homologue. However,
a three-dimensional crystal structure of full-length somatic ACE is still lacking.
3
5
10
15
20
25
To investigate the structure-function relationship of sACE, we have purified full-length sACE
from porcine lung, and its individual N- and C-domains by limited proteolysis. This enabled
us to investigate the molecular and enzymatic properties of these proteins and to compare
the properties of their native and individual domain forms. In addition, the electron
microscopic reconstruction and structure fitting reveals for the first time the tertiary structure
of intact sACE and the relative orientation of its N- and C-domains.
2. Experimental procedures
2.1. Materials
Fresh pig lungs were taken from the local slaughterhouse. PMSF (phenyl-methylsulfonyl
fluoride), Triton X-100, Fractogel EMD DEAE-650(M), p-aminobenzoic acid and 6-
aminocaproic acid were obtained from Merck. Epoxy-activated Sepharose 6B and Con A-
Sepharose, PhastGelTM homogeneous 7.5, IEF 4-6.5 and IEF 3-9 were supplied by GE
healthcare. 2-(1H-benzotriazol-1-yl)-1,1,3,3-tetramethyluronium hexafluorophosphate
(HBTU) and 1-hydroxybenzo-triazole (HOBt) were from Applied Biosystems. Lisinopril (N2-
[(S)-1-carboxy-3-phenylpropyl]-L-lysyl-L-proline) was a gift by Mr. R. Lüdecke from MSD
Sharp & Dohme GmbH, Germany. FA-Phe-Gly-Gly (L-furylacryloyl-L-phenylalanyl-
glycylglycine) and methyl-α-D-mannopyranoside were purchased from Sigma.
Endoproteinase Asp-N (EC 3.4.24.33), Endoglycosidase F (EC 3.2.1.96), N-glycosidase F (EC
3.5.1.52) and DIG glycan differentiation kit (containing SNA, MAA, blocking reagent, anti-
digoxigenin-AP and NBT / X-phosphate solution) were purchased from Boehringer Mannheim
GmbH. Molecular weight markers for electrophoresis were from Bio-Rad. All other chemicals
were of reagent grade.
4
5
10
15
20
25

2.2. Extraction of membrane-bound ACE and ammonium sulfate fractionation
All procedures were carried out at 4oC. Pig lung tissue (0.9 kg) was cut into small pieces and
suspended in 2 volumes of 1 mM PMSF, 20 mM Tris-HCl buffer,pH 7.8(suspension buffer).
The tissue was homogenized in a Waring blender by six 30 Sec bursts at top-speed. Triton X-
100 was added to the homogenate at a final concentration of 0.2 % (w/v). The suspension
was stirred for 90 min, followed by centrifugation at 9000 x g for 30 min. The pellets were
resuspended in 300 ml of suspension buffer and re-extracted with 0.2 % (w/v) Triton X-100.
The combined ACE-containing supernatant was kept on an ice-bath, and further purified by
ammonium sulfate fractionation. Solid ammonium sulfate was added slowly to a final
concentration of 30 % (w/v). After stirring for 1 hour, the mixture was centrifuged at 10,000 x
g for 20 min and the supernatant was collected. Solid ammonium sulfate was added to the
supernatant to a final concentration of 70 % (w/v), stirred for 1 hour and centrifuged as
described above. The precipitates were collected and redissolved in 20 mM Tris-HCl buffer
(pH7.8) and dialysed three-times against 24 volumes of the same Tris-HCl buffer for 24 hour
at 4 oC.
2.3. DEAE-Fractogel chromatography
The enzyme was further purified by column chromatography on a Fractogel EMD DEAE-
650(M) column (5.0cm x 20cm) equilibrated with 20 mM Tris-HCl buffer (pH7.8). The
dialyzed solution was centrifuged at 14,000 rpm to remove the insoluble particles and then
loaded onto the DEAE column at a flow rate of 3 ml/min. The column was washed with 6
column volumes (total 2400 ml) of 20 mM Tris-HCl, pH 7.8, and the enzyme was eluted over
a 3000 ml 0-0.25 M NaCl linear gradient in 20 mM Tris-HCl, pH 7.8. Active fractions were
pooled.
2.4. Con A-Sepharose chromatography
The pooled ACE fractions from the DEAE column were applied to a 2.6 cm x 15 cm Con A-
Sepharose column. The flow rate was 1 ml/min. The column was washed with 5 column
volumes (400ml) of buffer A (20 mM Tris-HCl, 0.2M NaCl, pH7.4), and the enzyme was eluted
5
5
10
15
20
25
with 10 column volume (800 ml) of buffer B (20 mM Tris-HCl, 100 mM methyl-α-D-
mannopyranoside, pH7.4) in 20 ml fractions. Active fractions were collected and pooled for
further purification.
2.5. Preparation of Sepharose-lisinopril affinity resin
Preparation of lisinopril-coupled Sepharose was modified from Hooper and Turner (1987).
384 mg of p-aminobenzoic acid (2.8 mmol) were dissolved in 12 ml of DMF and 0.5 ml of
DIEA, and mixed with 4 g of epoxy-activated Sepharose 6B suspended in water. The coupling
reaction was performed in a glass reactor by gently shaking for 15 hours at room
temperature. After filtering and washing the matrix with DMF and H2O, residual epoxy groups
were blocked with 20 ml of 1M ethanolamine for at least 1 h. Following this, the matrix was
washed with H2O and finally with DMF extensively.
Next, the modified Sepharose was activated for 2.5 hours with 1.1 g of HBTU (2.8 mmol) and
378 mg of HOBt (2.8 mmol) which were dissolved in 12 ml of DMF and 0.2 ml of DIEA,
respectively. The solution was filtered, and the second coupling reaction was performed by
adding 551 mg of 6-aminocaproic acid (4.2 mmol) to 12 ml of 0.1 M Na2CO3 (pH 11.8)
solution for 24 hours at room temperature. After the coupling was completed, the gel was
filtered and washed again with H2O and finally DMF.
The filtered and extensively washed matrix was activated with HBTU/HOBt as described
above. At last 486 mg of lisinopril (1.2 mmol) was coupled to the extended matrix arm in 12
ml of 0.1 M K2CO3 (pH 11.8) for 24 hours at room temperature. Unreacted groups were
blocked with 1M glycine (pH 10.0), and the resulting Sepharose-lisinopril gel was washed
extensively with H2O, followed by 0.5 M NaCl, 0.1 M Tris-HCl buffer (pH 8.5), sodium acetate
buffer (pH 4.5) containing 0.5 M NaCl, and finally equilibration buffer (20 mM Tris-HCl, pH
7.2, 0.3 M NaCl, 100 µM ZnCl2) prior to usage.
The coupling of p-aminobenzoic acid and 6-aminocaproic acid was monitored by UV254 nm
absorption. When caproic acid is coupled to the epoxy-activated Sepharose an absorption
peak is observed at approx. 292 nm. The coupling of lisinopril to the affinity resin can be
monitored by a decrease in the lisinopril content of the coupling solution as measured by
6
5
10
15
20
25

reverse-phase HPLC. The concentration of covalently bound lisinopril in the affinity gel was
1-2 µmol/ml of gel as determined by reverse-phase HPLC analysis of the coupling solution.
2.6. sACE purification by Sepharose-lisinopril affinity chromatography
The Sepharose-lisinopril affinity gel preparation was packed into a column (6 cm x 1.6 cm)
and equilibrated with 20 mM Tris-HCl (pH 7.2) buffer, containing 300 mM NaCl, and 100 µM
ZnCl2. Pooled fractions from the Con A-Sepharose were loaded onto the column at a flow rate
of 0.6 ml/min. sACE was eluted with 50 mM Na2B4O7 (pH 9.5) buffer and collected in 2 ml
fractions. Each tube was prefilled with 0.2 ml of 1M Tris-HCl (pH 7.2) and 3 M NaCl buffer in
order to balance the pH of eluents.
2.7 Enzyme assay
sACE activity measurements were made using a spectrophotometer (Beckman Model DU640)
by continuously monitoring the absorbance at 340 nm. The standard assay volume is 1ml and
consists of 0.5 mM FA-Phe-Gly-Gly in 50 mM Hepes buffer (pH 7.5) and 0.3 M NaCl
(Holmquist et al., 1979). The reaction was performed at 37 ºC and the initial rate was
determined by absorbance at 340 nm. The data of ΔA/min were converted into U/ml
according to the following formula: U/ml = (ΔA/min) ÷ (Δε × 1cm) × (Vt / Vs), where Vt is the
final volume of reaction mixture and Vs is the volume of enzyme sample used. Δε is the
differential molar extinction coefficient which is 0.977 mM-1 x cm-1. One unit of ACE activity is
defined as the amount of enzyme that catalyzes the formation of 1 µmol of FA-Phe/min at 37 oC. The specific activity was expressed as units/mg of protein. The protein concentration was
determined by using the Bio-Rad protein assay kit using bovine serum albumin as a standard.
2.8. Electrophoresis
Sodium dodecyl sulfate-polyacrylamide gel electrophoreses (SDS-PAGE) were performed on
Pharmacia PhastGel Homogeneous 7.5. Isoelectric focusing (IEF) was on Pharmacia PhastGel
IEF 4-6.5. All electrophoresis were carried out on the separation and control unit and the
protein bands were detected by sensitive silver staining on the development unit of
7
5
10
15
20
25

PhastSystem (Pharmacia LKB Biotechnology; now GE Health Care). The molecular mass and the
isoelectric point (pI) values were calibrated, using the high molecular weight marker and IEF
standard marker from Bio-Rad.
2.9. Protein sequence determination
The N-terminal sequences of proteins were determined by automated Edman degradation in
an Applied Biosystems model 473 protein sequencer. Protein bands separated by SDS-PAGE
were transferred onto PVDF membrane by Western blotting. The membranes or the intact
protein solutions were loaded on the sequencer for automated analysis.
2.10. Limited proteolysis with endoproteinase Asp-N
Purified pig lung ACE (1.6 mg) in 0.25 ml of 50 mM Hepes (pH 8.0) buffer was digested with 2
µg of endoproteinase Asp-N for 18 hours at 37 ºC. The extent of digestion was monitored by
SDS-PAGE.
2.11. Electron microscopy and 3D reconstruction
Purified sACE was diluted in 20 mM Tris-HCl buffer (pH 7.8) to a final protein concentration
of 70 µg/ml. The sample was adsorbed onto a carbon-foil (Valentine et al., 1968) and
examined by negative-staining electron microscopy as described in detail by Winkler et al.
(1997). The in focus, high contrast imaging was done with the 'in-column' energy-filtered
transmission electron microscope (EF-TEM; Zeiss CEM 902, Oberkochen, Germany). Electron
spectroscopic imaging (ESI) was done at UO4,5 -edge at 115 eV at medium dose exposures. For
3D reconstruction images at Scherzer focus were taken near low-dose exposure settings at
50000x magnification in the elastic bright-field mode (30 µm objective aperture; 200 µm
condenser aperture; energy-slit width: 15 eV; emission current: 1 µA; acceleration voltage: 80
kV). Images were collected on AgfaScientia plate film and developed to full strength with
Kodak D-76.
Digitization of negatives, which were checked for drift and astigmatism by optical diffraction,
was done using an Agfa Duoscan T2500 at 2000 lpi-setting, corresponding to a 0.278 nm
8
5
10
15
20
25

final sampling size at the probe level. A total of 3918 particles was sampled using the 'boxer'
routine of EMAN (Ludtke et al., 1999) from 3x3 median-filtered images with a box size set to
72 pixels. 3D reconstruction was done using the EMAN software suite with a symmetry-
setting of C1 after rough classification of the original data set (running the EMAN command
line 'refine 2d.py start.hed' iteratively to get some unbiased 2D class views) and selecting 10
representative classes of typical particle projections. Finally, 12 'refinement' iterations were
run to reach FSC convergence.
The 'lx_mapman' program (Kleywegt and Jones, 1996) was used to convert the EMAN voxel
data into the CCP4-format for 3D-modeling using 'Chimera' (version 1, build 2470) (Pettersen
et al., 2004) and manually fitting of atomic coordinates into the electron microscopic volume
densities. Voxel-slice viewing was done with VMD (version 1.8.6.) program (Humphrey et al.,
1996). Atomic coordinates used for structure fitting of the C-(ACE2; PDB entry code 1R42;
Towler et al., 2004) and N-domains (human sACE; PDB entry code 2C6F; Corradi et al., 2006)
were obtained from the Protein Data Bank (Research Collaboratory for Structural
Bioinformatics, Rutgers University, New Brunswick, NJ). CorelDRAW Graphics Suite 13 was
used for general image processing and presentation.
3. Results
3.1. sACE preparation from porcine lung
sACE was purified as in Materials and Methods described, the purified enzyme was
concentrated to 14 mg/ml and stored at -20 oC. The purity of the enzyme preparation was
determined by SDS-polyacrylamide gel electrophoresis (PAGE; 7,5 % gel concentration). On
silver staining, only a single band of 170 kDa was observed. This indicates that the enzyme
has been purified to homogeneity. A summary of the purification procedures and results are
presented in Table 1. The final yield was about 14 mg of homogeneous sACE from 0.9 kg of
fresh pig lung tissue. The overall purification was 875 fold with a final 45% recovery of
9
5
10
15
20
25
activity. The specific activity of the sACE preparation is about 219 units/mg protein, which is
considerably higher than that previously reported in the literature (Andujar-Sánchez et al.,
2003).
3.2. ACE N- and C-domain isolation
3.2.1. Properties of the sACE
The effect of pH and buffer nature on the hydrolysis of FA-Phe-Gly-Gly was studied over a pH
range from pH 5.5 to 9.5 (Mes from pH 5.5 to 6.5; Hepes from pH 7.0 to 8.5, and sodium
borate from pH 9.0 to 10.0). Hydrolysis of FA-Phe-Gly-Gly (5 x 10⁻⁴ M) followed first-order
kinetics over this pH range. The optimum pH is at 7.5 as determined from the pH-rate profile
which fell off markedly when the pH was below 7.0 (fig.1; dashed line). All measurements
were carried out in the presence of 0.3 M sodium chloride.
The decrease in activity below pH 7.0 was partly due to dissociation of zinc ions from the
enzyme. Under acidic pH conditions, the dissociation of metal ions could be overcome by
addition of zinc (10-4 M) to the assay mixture. This resulted in an increase of sACE activity,
whereas in the pH range above 7.5, zinc suppressed the activity slightly. Thus, in the
presence of 10-4 M of zinc, the activity versus pH profile showed that the pH optimum could
be shifted from 7.5 to 6.5 (fig.1, solid line).
When the enzyme was incubated at 37 oC for 24 h up to several days in a mixed buffer (such
as acetate, phosphate, Tris and borate) with pH values ranging from 4.0 to 11.0, it was found
that the enzyme was relatively stable over a pH range from 7.0 to 8.0, and more than 90 % of
activity could be retained after this treatment.
The Km and kcat values of the enzyme were obtained from Lineweaver-Burk plots, and were
determined to be 7.8 x 10⁻⁴ M and 5.27 x 10⁴ min-1, respectively, when FA-Phe-Gly-Gly was
used as the substrate. The catalytic efficiency (kcat/Km) of sACE was calculated to be 67.6 x
106 M-1·min-1 as shown in Table 2. This value is in good agreement with data obtained by
Bünning et al. (1983). Table 3 presents the Ki values for captopril and BPP9a, as determined by
the graphical method of Dixon et al. (1979). The molecular mass of the enzyme was
determined to be 170 kDa by SDS-PAGE and 175 kDa by MALDI mass spectrometry, which is
10
5
10
15
20
25
in good agreement with reported data (Andujar-Sánchez et al., 2003).
3.2.2. N-terminal sequencing of sACE
The N-terminal amino acid sequence analysis of the purified porcine lung sACE revealed the
following sequence: Leu-Asp-Ser-Ala-Leu-Gln-Pro-Gly-Asp-Phe-Thr-Ala-Asp-Glu-Ala-Gly-
Ala-Glu-Asp-Phe-Ala-Gln-Ser-Phe-Asp-Ser-Ser-X-Glu-Gln-Val-Leu-Phe-Gln. It is 76%
identical to that of human sACE (Soubrier et al., 1988).
3.2.3. Purification of the N- and C-domains
The proteolytic products of sACE obtained from endoproteinase Asp-N digestion were
separated and purified by Sepharose-lisinopril affinity chromatography. The affinity column
was equilibrated with 20 mM Tris-HCl (pH7.2), 0.3 M NaCl, and 100 µM ZnCl2. After washing
with the same buffer to remove unbound proteins, peak I was eluted with 20 mM Mes-NaOH
(pH 6.0) containing 10 µM ZnCl2 (buffer B, fig. 2). Peak II was then eluted with 20 mM Hepes-
NaOH (pH 6.0) containing 10 µM ZnCl2 (buffer C, fig. 2). Both peak fractions were analysed by
amino acid sequencing for protein identification (see below).
3.2.4. N-terminal sequence of the N- and C-domains
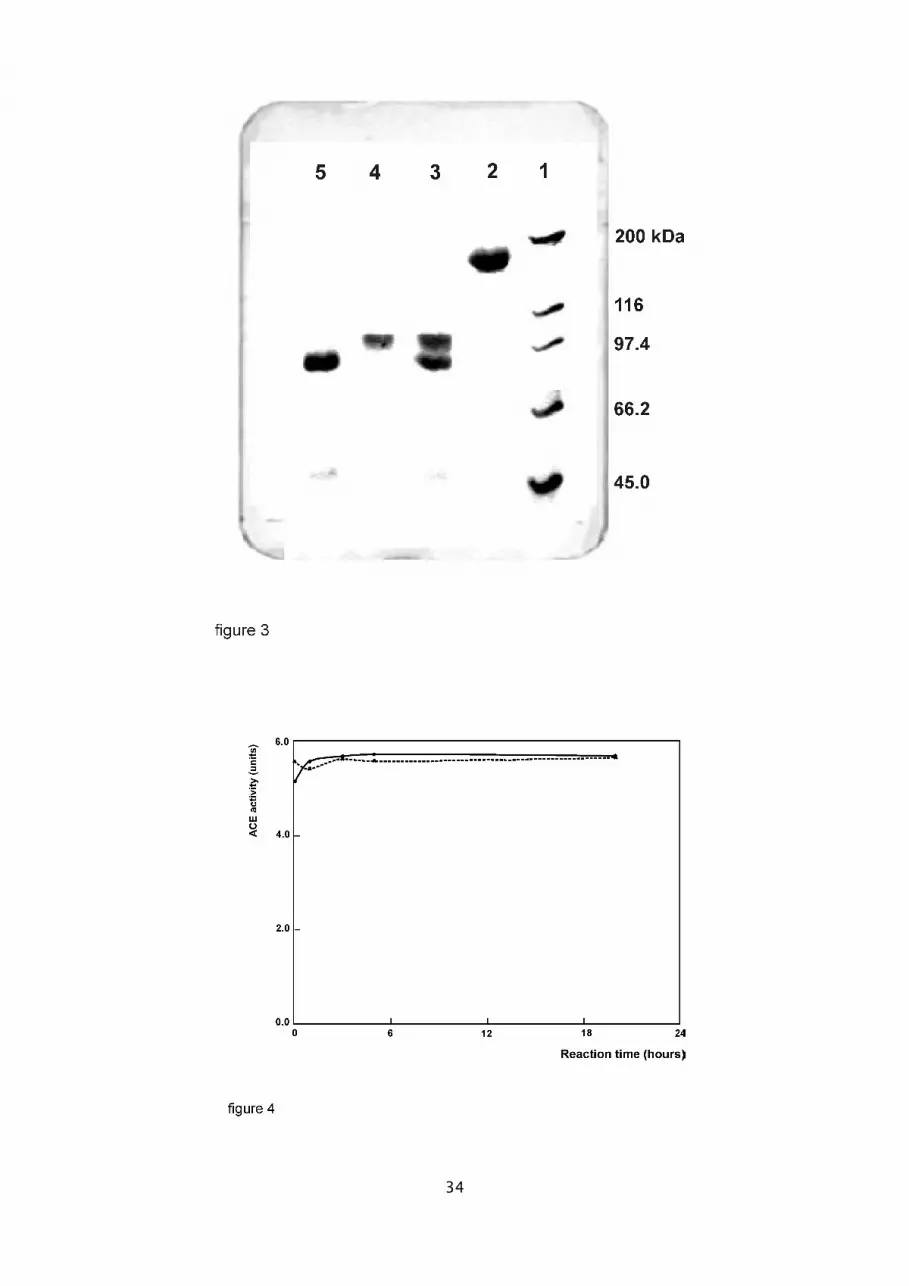
The intact sACE protein was subjected to limited proteolysis with endoproteinase Asp-N,
leading to the presence of two major protein bands in the SDS-PAGE (fig. 3, lane 3). The
molecular mass of these two protein fragments was estimated to be 90 kDa and 80 kDa. The
bands were transferred to PVDF membranes and analyzed by N-terminal sequencing. The
results are shown in Table 4. The sequence data correspond to residues 1-24 and 616-640 of
human sACE (Soubrier et al., 1988) and suggest that they were derived from the N- and C-
domains, respectively. Peak I (fig. 2) which was eluted with 20mM Mes-NaOH (pH 6.0) and 10
µM ZnCl2 represents the 90 kDa N-domain (fig.3; lane4). Peak II (fig. 2) which was eluted with
20mM Hepes-NaOH (pH 6.0) and 10 µM ZnCl2 corresponds to the 80 kDa C-domain (fig.3;
lane 5).
11
5
10
15
20
25

3.2.5. Kinetic parameters of the N- and C-domains
During the course of proteolytic digestion with endoproteinase Asp-N, the activity of the Asp-
N treated sACE was unaltered with respect to the time of digestion as shown in fig.. 4. This
indicated that, after proteolysis, both domains are as active as native sACE. The purified N-
and C-domains have similar Km values for the tested substrate, FA-Phe-Gly-Gly. However,
the kinetic data (Table 5) indicated that the catalytic efficiency (Kcat/Km) of the isolated C-
domain is about two-fold higher than that of the native sACE. These results are compatible
with the notion that the catalytic activity of the C-domain is negatively regulated by it’s N-
domain counterpart in native sACE (Binevski et al., 2003; Woodman et al., 2005; Skirgello et
al., 2005).
3.3. Electron microscopy analysis
3.3.1. Structural studies of porcine lung sACE and its isolated N- and C-domains.
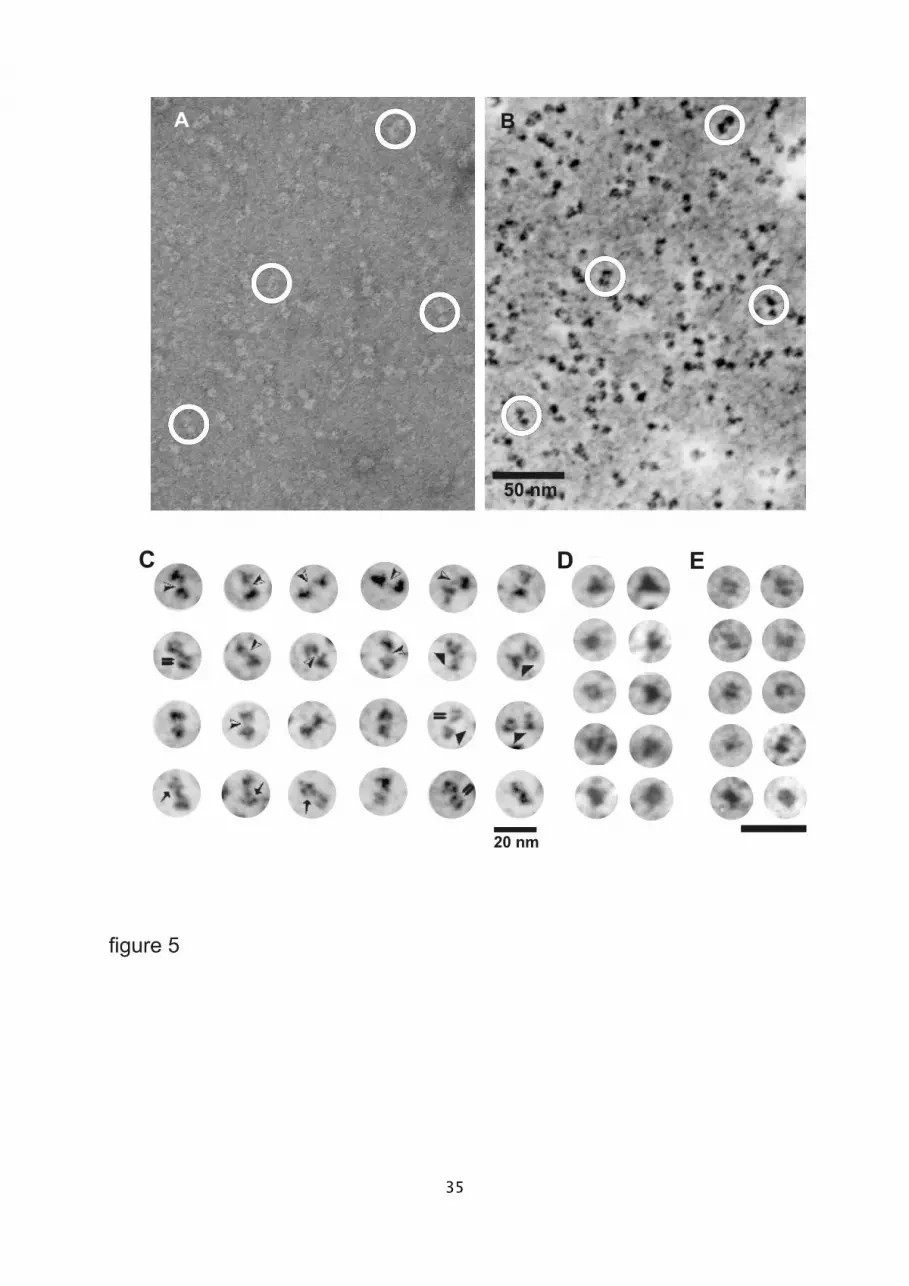
The isolated sACE molecules, as analyzed by electron microscopy, showed that the enzyme
preparation is pure and homogeneous (fig. 5 a and b). The molecules have a characteristic
bilobed shape (fig. 5 a and b; circles) as seen from either the global elastic bright-field
(fig.5a) or the inelastic darkfield view (reversed contrast at the uranium edge O4,5 = 115 eV;
fig.5b). The overall dimensions of sACE range from 11.7 nm to 19.2 nm in length, with a
mean length of 15.3 nm (N = 129) and a mean width of 7.4 nm (N = 154) within the range
from 4.2 nm to 10.3 nm. Both domains, which appear similar in size, differ in their
substructural, tertiary organization, as revealed from details in their projection features. While
one domain shows an overall triangular projection contour, the other appears as an
orthogonal rectangular projection (fig. 5-c). Furthermore, both domains are connected by a
distinct filigree hinge-region (fig. 5c; black/white arrowheads), also termed 'interdomain-
linker'. In the inelastic darkfield view at the Gaussian focus both domains show a distinct
spatial arrangement of centers of mass. The triangular projections (fig.5c) often appear to be
composed of three (fig. 5c; solid triangles) or four protein masses arranged at the vertices of
a tetrahedron (fig. 5c; arrows). These triangular projection contours are characteristic for the
12
5
10
15
20
25

N-domains, which were isolated from lung sACE after mild proteolysis (fig.5d). Conversely,
the compact orthogonal projection, representing a substructure of two parallel elongated
centers of mass, was mainly observed for the isolated C-domain (fig. 5e). Obviously mild
proteolysis and purification of these domains did not affect the overall tertiary structure. Thus
the apparent different conformational states of the isolated N- and C-domains are similar to
those in the native enzyme.
3.3.2. 3D-image reconstruction of sACE.
Negatively stained sACE molecules, analysed by electron microscopy and reconstructed by
single-particle analysis with EMAN from digitized negatives – free from drift and astigmatism
– lead to a 3D model of the native molecule with 2.3 nm low resolution. A total of 3918
particle projections was boxed at a 72 x 72 pixel box size (fig. 6a) and was analyzed using C1
symmetry. Exposure of negatives at medium dose and focusing near Scherzer focus resulted
in noisy micrographs which were 3x3 median-filtered prior to particle selection. Reference-
free 2D refinement (EMAN subprogram 'refine 2d.py') was done to get characteristic means of
noiseless particle projections of the sACE molecules. Ten typical views (fig. 6b) were chosen
and the 'startany' routine was run, resulting in a total of 236 classes. The presence of tertiary
substructure and their connection by a faint bridge could be verified (fig. 6b), which was
already visible from inspection at the individual molecule level (fig. 5c).
A total of 16 refinement iterations was calculated, and convergence was reached after seven
refinement cycles. All 3D-models of the corresponding iterations were checked for
homogeneity of class distribution in Euler-space. Finally the 3D electron microscopic density
of the 11th iteration was chosen for final modeling since it showed the most uniform class
distribution in Euler-space (fig. 6d). Resolution was checked by Fourier-Shell-correlation
(FSC) at a threshold of 0.5 σ, which proved 2.31 nm for the corresponding 3D-model. A
collection of 18 out of 236 class views (fig. 6e) shows top views and different side views as
averages of the corresponding ACE projections. Based on visual inspection of all sections of
the matrix view, looking for the onset and disappearance of protein densities along the z-
axis, 55 layers were found to be occupied by protein density, leading to a molecule height of
13
5
10
15
20
25

15.3 nm for sACE (data not shown). This length is consistent with direct length measurements
from survey view micrographs as shown above (fig. 5a and b).
3D-model refinement was done using Chimera over a volume range from - 4.28 to 9.04. The
final level was set to 2.45 and a surface smoothing was applied with three iterations and 0.5
factor-setting, followed by Gaussian filter setting the width (2 sdev) to 5 at step 1. This led to
the final 3D-model and supports the notion that sACE is an asymmetric molecule. Four main
aspects can be discerned by rotation of the model around its z-axis, termed 'front view', 'left
side view', 'backside view' and 'right side view' (fig. 7a). Both N- and C-domains are linked by
a single oligopeptide segment, distinctly visible as a filigree spacer that represents the
'interdomain-linker'. This spacer is made up from assumed 15 amino acids and is prone to
proteolysis (Sturrock et al., 1997). The linker keeps both domains at a distance of about 2.0-
2.6 nm. Nevertheless, even at the given low resolution, both domains show individual
dissimilarities, which can be recognized mainly as (1) surface mass deficient areas termed
'central holes' (fig. 7a; arrows, ch-N, ch-C). (2) A distinct protuberance is visible mainly at the
lower domain (fig. 7a; arrowhead) and belongs to the subdomain I (SD I; see Towler et al.,
(2004) for nomenclature) residual. (3) Both C- and N-domains show intradomain cleft-like
mass deficiencies, which indicate distinct tertiary structure details.
By slice viewing of the electron microscopic density model (fig.7b) the protein mass
distribution and the molecule's interior organization could be revealed. Here, eight slices,
indicated by the black vertical or horizontal bars of the 3D-model icons, represent the main
section 'on-views' of sACE. It is obvious from views #2, 3, 5, 7 and 8 (fig.7b) that the interior
of both domains show bright-shining voids, surrounded by protein densities colored blue.
These voids obviously are not arranged symmetrically to each other and also their shape is
dissimilar to one another. Section on-view #6 shows characteristic features of the molecule as
already observed from individual negatively stained particles (fig. 5c-e), i.e. N-domain
projections appear triangular in contour and the C-domain shows orthogonal mass
projections. Furthermore, the molecule seen from its 'right side view' (fig.7a) has been cut
mainly through the ventral part of the C-domain (fig.7b; #4), and its corresponding 'slice-
view' distinctly reveals a 'cone-like' protuberance (fig.7b; #4, arrow), which represents a
14
5
10
15
20
25

prominent feature of the sACE molecule, as it is indicated in fig. 7a by arrowheads. This
difference in shape of the internal voids of both domains is further emphasized by their
appearance as Z-slices (fig. 7c), which show central circular dark void areas in the N-domain's
interior, which is distinctly different from the inner C-domain, characterized by dark
elongated void contours, framed yellow and pile up for roughly 14 nm along the z-axis, and
thus form a cleft-like interior space, distinctly larger than the N-domain's equivalent.
3.3.3. Molecular fitting of atomic models for the N- and C-domain into the 3D electron
microscoic densities of porcine lung sACE.
Direct inspection of negatively stained sACE molecules and the corresponding 3D electron
microscopic density, suggest that the enzyme's conformational state is stable and even
withstands mild proteolysis followed by affinity-chromatographic purification. This led us to
examine the density model more closely by fitting high resolution atomic coordinates of the
N-domain of human sACE into the assumed N-domain moiety, and the atomic coordinates of
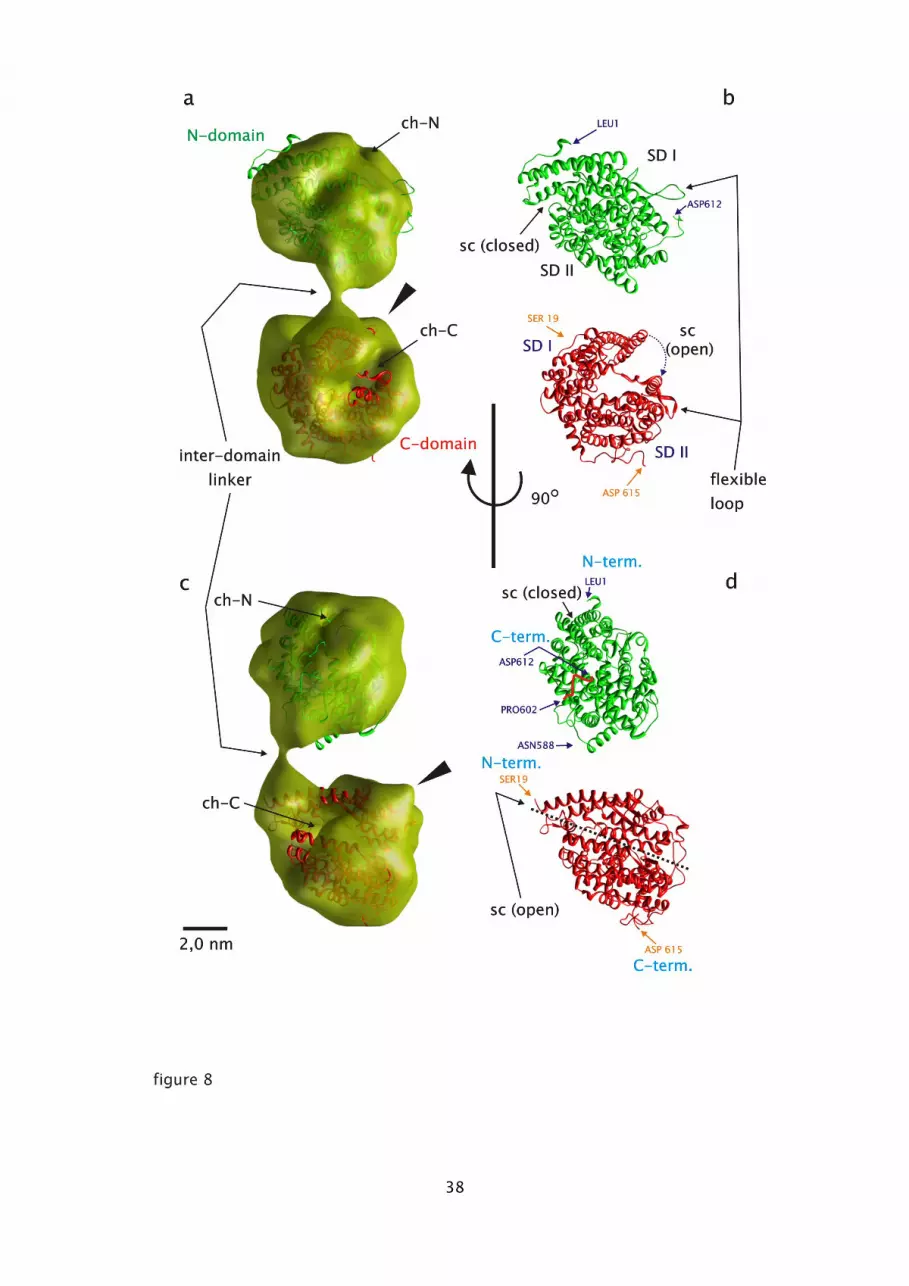
ACE2 into the analogous C-domain part (fig. 8). The fitting procedure was done semi-
automatically using the Chimera 'Fit map into model' routine. Since the resolution of the
model is 2.31 nm, only a few distinct markers could be used to align overall atomic model
features. The C-domain as the basal part of the sACE-model (fig. 8a and c) showed at least
three characteristic aspects, which are consistent with those of the corresponding atomic
model. These are first the central hole (fig. 8a; ch-C), which offers a deep view into the
interior void of the C-domain, as is recognized from volume slice-views (fig. 7b; #1, 2, 3).
Second, the 'cone-like protuberance' (Fig. 7a, and 8a, c; solid arrowheads), and third, the
neck-like 'interdomain-linker'. The atomic model did fit and docked rather well to the first
two features in such a way that (1) the 'substrate cleft' in its substrate-unbound state (fig. 8b;
sc (open)) aligned with the 'central hole' and (2) the SD I of the C-domain (fig. 8b) with the
'cone-like' protuberance. This 'two-point-alignment' is straight forward and leads to
acceptable fitting of high and low resolution data. From this alignment it is obvious that the
position of the 'interdomain-linker' of the atomic model (fig. 8d; red-colored C-terminus of
15
5
10
15
20
25

the N-domain) is different from the electron microscopic density model.
Conversely, fitting the N-domain atomic structure, here in its 'closed substrate-bound' state,
into the corresponding EM density was not straightforward. The split 'interdomain-linker' end,
i.e. the C-terminus of the N-domain (Fig. 8b and d; Asp612) , was oriented relative to its
corresponding counterpart (Fig. 8b and d; Ser19) and the residual part of the atomic model
was rotated and shifted to optimally fit with the rudimentary 'central hole' (Fig. 8a andc; ch-N)
into the electron microscopic density model. The absence of a prominent cone-like
protuberance (fig. 8a and c; massive arrowheads) and the missing of a pronounced cleft-like
'central hole' within the N-domain of the sACE obviously is indicative for the 'closed
substrate-cleft' conformation.
4. Discussion
4.1. Isolation and biochemical characterization of sACE from porcine lung.
It has been reported that sACE from human kidney can be split into two active domains by
limited proteolysis using endoproteinase Asp-N. Here, we have obtained similar results with
purified sACE from porcine lung. Due to the similar physicochemical properties of the two
sACE domains, it has proven very difficult to isolate the individual domains using standard
chromatography techniques. Sturrock et al., (1997) therefore, generated an immunoaffinity
column with monoclonal antibodies recognizing specific epitopes, which were used for
separation of the N-domain of sACE.
Although the N- and C-domains of sACE appear to be very similar, subtle differences exist
between them. For example, ileal ACE, the naturally occurring active N-domain, has been
found to poorly bind to a Sepharose-lisinopril affinity column with eluting buffer containing
only 0.3M NaCl; however, it bound well in the presence of a higher salt (Deddish et al.,
1994) . Ileal ACE bound to a Sepharose-lisinopril column in 10 mM Hepes (pH 8.0) containing
0.8 M NaCl and 10 µM ZnSO4 and could be eluted with 10 mM Hepes (pH 6.0) containing 10
µM ZnSO4. In another work the importance of pH on the dissociation of lisinopril and sACE
16
5
10
15
20
25

was pointed out (Bull et al., 1985). Here we used the Sepharose-lisinopril affinity column to
separate the rather similar N- and C-domains of sACE taking advantage of the subtle
difference that exists between the two domain forms. Native sACE as well as both N- and C-
domains can bind to Sepharose-lisinopril in buffer consisting of 20 mM Tris-HCl (pH 7.2), 0.3
M NaCl and 100 µM ZnCl2. Surprisingly, only the N-domain was eluted from column when
washed with 20 mM Mes-NaOH (pH 6.0) containing 10 µM ZnCl2. The C-domain was eluted
by changing the nature of the buffer to Hepes and could be eluted in 20 mM Hepes (pH 6.0)
and 10 µM ZnCl2. Finally, the remaining bound protein could be eluted with 50 mM Na2B4O7
(pH 9.5) buffer, which was identified as native sACE. It is quite remarkable that the intact
sACE, the N- and the C- domain molecules all can be separated by Sepharose-lisinopril
affinity column chromatography simply by changing the buffer system.
4.2. Native structure of the sACE.
Though low in resolution, the presented TEM-structure of negatively stained sACE and that of
its isolated N- and C-domains provide close-up views of the main conformational state of the
native molecule. To our knowledge this is the first detailed molecular structure analysis of
sACE from porcine lung and complements earlier dynamic light and neutron scattering data of
Baudin et al. (1988), which showed the porcine lung sACE to have a radius of gyration of 44.5
Å. The authors assumed the molecule to be rod-shaped, measuring 4-6 nm in diameter and
13.5 nm in length. These values are close to our data, i.e. 15.3 nm in length and 7.4 nm in
width.
Based on our data it is possible to describe three distinct substructures of sACE, which
correspond to (1) the 'hinge-region' or 'interdomain-linker', (2) the two-centered,
orthogonally shaped moiety, and (3) the monocentered, triangular contoured moiety (see Fig.
5). Both N- and C- domains were isolated after mild proteolysis of the purified sACE, followed
by affinity chromatography, and were confirmed by N-terminal sequencing. The different
molecular shapes can be assigned to either different conformations or differences in shape of
both domains. Remarkably, neither mild proteolysis nor affinity chromatography abolished
enzymatic activity, indicating that the conformation of the individual domains represent
17
5
10
15
20
25

stable conformers, which is also true for intact sACE. This is consistent with a 'two-mass'
conformation, with the orthogonal moiety representing the C-domain in its substrate-
unbound, 'open-cleft' state, while the triangular moiety representing the N-domain with the
substrate-cleft 'closed' (see Fig. 5b-e). From X-ray crystallographic studies of inhibitor-
bound and unbound ACE2, which is a homologue of the sACE's C-domain, both these distinct
conformational states were confirmed. It was shown, that SD I in the 'open-cleft' state moves
about 1.5 nm towards the SD II subdomain upon binding of one molecule of lisinopril, which
fixes the ACE2 domain in the 'closed-cleft' state (Towler et al., 2004). This relative movement
of the SD I subdomain was verified and described in detail with glycosylation mutants of the
germinal tACE as the ACE2-homologue (Watermeyer et al., 2006). Naverova et al. (2008) were
able to create monoclonal antibodies (mAbs) directed to conformational epitopes on the C-
domain surface of human ACE. Two of these showed some anticatalytic activities to the C-
domain, though significantly lower than mAbs directed to the N-domain (Danilov et al., 2007;
Skirgello et al., 2006). According to the resulting epitope binding maps Naperova et al. (2008)
constructed a putative 3D-arrangement of N- and C-domains, based on corresponding X-ray
data, and thus simulated a model of the somatic ACE molecule. This model, however, shows
both domains in contact to each other and the interdomain-linker in the position of the
central axis of the molecule, contradicting our data of clearly separated and distant domains
and a lateral, off-axis position of the linker.
In the present 3D reconstruction of the electron microscopic densities a significant structural
similarity to the 'open' conformational state could be established, referred to as the 'central
hole' of the C-domain (Fig. 7A and 8a, c), which represents the large void space of the C-
domain's interior (Fig. 7b and c). The 'central hole', next to the origin of the neck-like
'interdomain-linker', forms the entrance to the interior void-pocket which represents the
open substrate cleft. The 'open-state' of the C-domain's cleft is outlined by the intense
binding and/or accumulation of the cationic uranyl stain molecules, since the inside of the
cleft is aligned with acidic amino acids (Towler et al., 2004). This is in congruence with the
appearance and dimensions of the substrate-unbound 'open-cleft' conformation, which was
found to be characteristic for the active form of human sACE and ACE2 in the presence of
18
5
10
15
20
25
chlorine (Ehlers and Kirsch, 1988). Similarly prominent deep clefts have been observed from
neurolysin (Brown et al., 2001) and a carboxypeptidase from the hyperthermophilic archaeon
Pyrococcus furiosus (Arndt et al., 2002). Both enzymes are functionally homologous to ACE
and belong to the metalloprotease (zincin) superfamily (Sturrock et al., 2004).
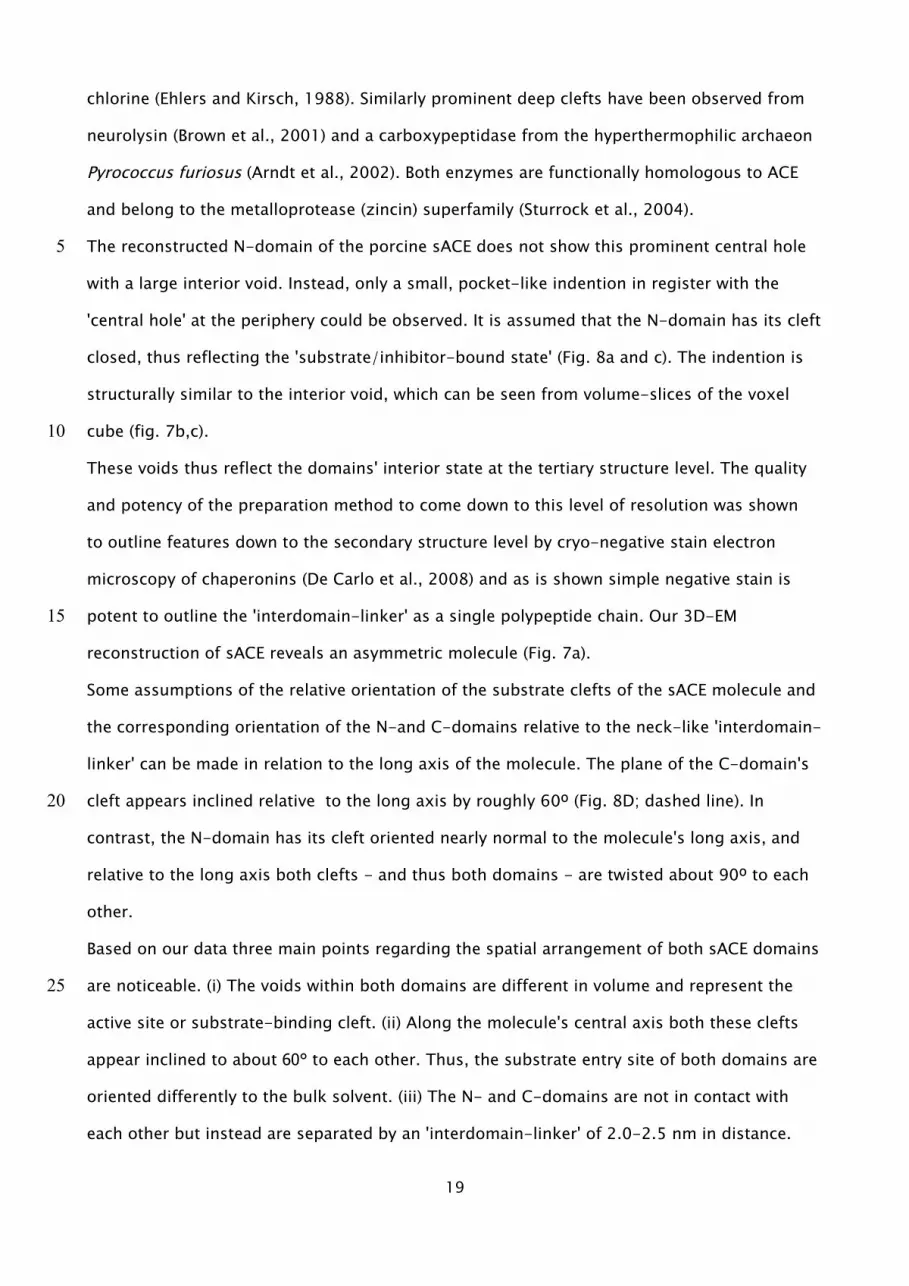
The reconstructed N-domain of the porcine sACE does not show this prominent central hole
with a large interior void. Instead, only a small, pocket-like indention in register with the
'central hole' at the periphery could be observed. It is assumed that the N-domain has its cleft
closed, thus reflecting the 'substrate/inhibitor-bound state' (Fig. 8a and c). The indention is
structurally similar to the interior void, which can be seen from volume-slices of the voxel
cube (fig. 7b,c).
These voids thus reflect the domains' interior state at the tertiary structure level. The quality
and potency of the preparation method to come down to this level of resolution was shown
to outline features down to the secondary structure level by cryo-negative stain electron
microscopy of chaperonins (De Carlo et al., 2008) and as is shown simple negative stain is
potent to outline the 'interdomain-linker' as a single polypeptide chain. Our 3D-EM
reconstruction of sACE reveals an asymmetric molecule (Fig. 7a).
Some assumptions of the relative orientation of the substrate clefts of the sACE molecule and
the corresponding orientation of the N-and C-domains relative to the neck-like 'interdomain-
linker' can be made in relation to the long axis of the molecule. The plane of the C-domain's
cleft appears inclined relative to the long axis by roughly 60º (Fig. 8D; dashed line). In
contrast, the N-domain has its cleft oriented nearly normal to the molecule's long axis, and
relative to the long axis both clefts - and thus both domains - are twisted about 90º to each
other.
Based on our data three main points regarding the spatial arrangement of both sACE domains
are noticeable. (i) The voids within both domains are different in volume and represent the
active site or substrate-binding cleft. (ii) Along the molecule's central axis both these clefts
appear inclined to about 60° to each other. Thus, the substrate entry site of both domains are
oriented differently to the bulk solvent. (iii) The N- and C-domains are not in contact with
each other but instead are separated by an 'interdomain-linker' of 2.0-2.5 nm in distance.
19
5
10
15
20
25

Our 3D-model obtained by semi-automatic fitting atomic coordinates into the electron
microscopic densities suggests that subdomain SD I of the C-domain is closest to the N-
domain's SD II vertice. This domain arrangement keeps the 'flexible loops' (Fig.8b) at
intermediate distance to each other. This means that the flexible C-domain's SD I is distant
to the corresponding, flexible N-domain's SD I and comes close to the N-domain's SD II helix
H27 (residues 568-588) and helix H19 (residues 417-432) (Corradi et al., 2006). Additionally,
based on the actual atomic fitting the 'flexible loop', comprising residues 128-136 of the
human somatic N-domain, does not appear proximal or in even contact with the
'interdomain-linker', contradicting the model view of the human sACE (Corradi et al., 2006).
Although human as well as bovine sACE display negative cooperativity between the N- and C-
domains' active sites upon binding of diverse peptides or inhibitors (Binevski et al., 2003;
Woodman et al., 2005; Skirgello et al., 2005), the enzymic activities are not linked to the
glycosylation state. Deglycosylation of sACE from porcine lung did not markedly affect the
biochemistry or structural properties of the enzyme (Baudin et al., 1997). However, this has
been disputed by Watermeyer et al. (2006), who found that interactions of glycan chains at
N72 and N109 in tACE stabilized the α1 and α2 helices of the lid.
Concerning the degree of spatial freedom both domains receive their flexibility by the
'interdomain-linker', whose N-terminal portion (residues 602-612) has been well defined
(Corradi et al., 2006). At full stretch it may span a length of 3.98 nm based on a peptide
length of 0.362 nm (Corey, Pauling, 1953). This length is long enough to bridge the
interdomain distance of 2.0-2.5 nm observed in the electron microscopic density model.
From the hinge end at the N-domains's C-terminus Asp612 to the N-terminus Asp616 of the C-
domain (Sturrock et al., 1997) (cf. the 80 kDa protein, Table 4) the tripeptide Leu-Val-Thr
(residues 613-615 of human sACE, Soubrier et al., 1988) has to be added to the
'interdomain-linker' of the intact molecule, thus giving it an overall length of 15 amino acids.
The data presented here provide new insight into the biochemical characteristics of the sACE .
Isolating the N- and C-domains combined with electron microscopy studies, provided for the
first time detailed tertiary structure information for both domains. The 3D reconstruction of
20
5
10
15
20
25
sACE obtained at 2.3 nm resolution allowed interactive fitting of the atomic coordinates for
the N- and the C-domain determined by X-ray crystallography into the electron microscopic
density. The focus for alignment of both atomic models with their open (C-domain) and
closed (N-domain) 'substrate clefts' was set to the orientation of their electron microscopic
counterparts, i.e. the interior voids of both domains.
Here, we have presented for the first time the conformational state of isolated porcine lung
sACE and addressed the spatial relationship of the N- and C-domain’s active sites at the
tertiary structure level. Future studies will focus on electron microscopy studies of substrate-
and inhibitor-bound complexes, which should provide key insight into how the
conformational states will differ during catalysis.
Acknowledgements
Hui-Ling Chen was recipient of a fellowship from the NSC-DAAD (National Science Council,
Republic of China/ Deutscher Akademischer Austauschdienst, Germany ) ‘Sandwich’ Program.
We thank Mrs. Rita Getzlaff for protein sequencing;and Dr. Francis T. F. Tsai, Baylor College of
Medicine, for critical reading of this manuscript.
References
Andujar-Sánchez, M., Cámara-Artigas, V., Jara-Pérez, V., 2003. Purification of
angiotensin I converting enzyme from pig lung using concanavalin-A Sepharose
chromatography. J. Chromatogr. B 783, 247-252.
Arndt, J.W., Hao, B., Ramakrishnan, V., Chen, T., Chan, S.I., Chan, M.K., 2002. Crystal
structure of a novel carboxypeptidase from the hyperthermophilic archaeon
Pyrococcus furiosus. Structure 10, 215-224.
Baudin, B., Timmins, P.A., Drouet, L., Legrand, Y., Baumann, F.Ch. 1988. Molecular weight and
21
5
10
15
20
25
shape of angiotensin-I converting enzyme. A neutron scattering study. Biochem.
Biophys. Res. Commun. 154, 1144-1150.
Baudin, B., Alves, N., Pilon, A., Bénéteau-Burnat, B., Giboudeau, J. 1997. Structural and
biological roles of glycosylations in pulmonary angiotensin I-converting enzyme.
Glycobiology 7, 565-570.
Binevski, P.V., Sizova, E.A., Pozdnev, V.F., Kost, O.A., 2003. Evidence for the negative
cooperativity of the two active sites within bovine somatic angiotensin converting
enzyme. FEBS Lett. 550, 84-88.
Brown, C.K., Madauss, K., Lian, W., Beck, M.R., Tolbert, W.D., Rodgers, D.W., 2001. Structure
of neurolysin reveals a deep channel that limits substrate access. Proc. Nat. Acad. Sci.
U.S.A. 98, 3127-3132.
Bull, H.G., Thornberry, N.A., Cordes, E.H., 1985. Purification of angiotensin-converting
enzyme from rabbit lung and human plasma by affinity chromatography. J. Biol. Chem.
260, 2963-2972.
Bünning, P., Holmquist, B., Riordan, J. F., 1983. Substrate specificity and kinetic
characteristics of angiotensin converting enzyme. Biochemistry 22, 103-110.
Checler, F., Vincent, J.P., Kitabgi, P., 1983. Degradation of neurotensin by rat brain
synaptic membranes: involvement of a thermolysin-like metalloendopeptidase
(enkephalinase), angiotensin-converting enzyme, and other unidentified peptidases. J.
Neurochem. 41, 375-384.
Cheung, H.S., Cushman, D.W., 1973. Inhibition of homogeneous angiotensin-converting
22
5
10
15
20
25

enzyme of rabbit lung by synthetic venom peptides of Bothrops jararaca. Biochim.
Biophys. Acta 293, 451-463.
Coates, D., 2003. Molecules in focus. The angiotensin converting enzyme (ACE). Int. J.
Biochem. Cell. Biol. 35, 769-773.
Corey, R.B., Pauling, L., 1953. Fundamental dimensions of polypeptide chains. Proc. R.
Soc. (Lond.) B141,10-20.
Corradi, H.R., Schwager, S.L.U., Nchinda, A.T., Sturrock, E.D., Acharya, K.R., 2006. Crystal
structure of the N domain of human somatic angiotensin I-converting enzyme provides
a structural basis for domain-specific inhibitor design. J. Mol. Biol. 357, 964-974.
Corvol, P., Williams, T.A., Soubrier, F., 1995. Peptidyl dipeptidase A: angiotensin I- converting
enzyme. Methods Enzymol. 248, 283-305.
Cushman, D.W., Cheung, H.S., Sabo, E.F., Rubin, B., Ondetti, M.A., 1979. Development of
specific inhibitors of angiotensin I converting enzyme (kininase II). Federation Proc. 38,
2778-2782.
Danilov, S.M., Watermeyer, J., Balyasnikova, I.V., Gordon, K., Kugaevskaya, E.V., Elisseeva, Y.E.,
Albrecht, R.F. II., Sturrock, E.D. 2007. Fine epitope mapping of mAb 5F1 reveals
anticatalytic activity. Biochemistry 46, 9019-9031.
De Carlo, S., Boisset, N., Hoenger, A., 2008. High-resolution single-particle 3D analysis on
GroEL prepared by cryo-negative staining. Micron. Doi:10.1016/j.micron.2007.11.003
23
5
10
15
20
25

Deddish, P.A., Wang, J., Michel, B., Morris, P.W., Davidson, N.O., Skidgel, R.A., Davidson, N.O.,
1994. Naturally occurring active N-domain of human angiotensin I-converting enzyme.
Proc. Natl. Acad. Sci. U.S.A. 91, 7807-7811.
Dixon, M., Webb, E.C., Thorne, C.J.R., Tipton, K.F., 1979. Enzymes. third ed. Longman Group
Ltd., London.
Ehlers, M.R.W., Kirsch, R.E., 1988. Catalysis of angiotensin I hydrolysis by human
angiotensin-converting enzyme: effect of choride and pH. Biochemistry 27, 5538-
5544.
Holmquist, B., Bünning, P., Riordan, J.F., 1979. A continuous spectrophotometric assay for
angiotensin converting enzyme. Anal. Biochem. 95, 540-548.
Hooper, N.M., Turner, A.J., 1987. Isolation of two differentially glycosylated forms of
peptidyl-dipeptidase A (angiotensin converting enzyme) from pig brain: a re-
evaluation of their role in neuropeptide metabolism. Biochem. J. 24, 625-633.
Hubert, C., Houot, A.M., Corvol, P., Soubrier, F., 1991. Structure of the angiotensin I-
converting enzyme gene. Two alternate promoters correspond to evolutionary steps of
a duplicated gene. J. Biol. Chem. 266, 15377-15383.
Humphrey, W., Dalke, A., Schulten, K., 1996. VMD - visual molecular dynamics. J. Mol. Graph.
14, 33-38.
Kleywegt, G.J., Jones, T.A., 1996. xdlMAPMAN and xdlDATAMAN-programs for
reformatting, analysis and manipulation of biomacromolecular electron-density maps
24
5
10
15
20
25

and reflection data sets. Acta Crystallogr. D52, 826-828.
Ludtke, S.J., Baldwin, P.R., Chiu, W. 1999. EMAN: semiautomated software for high-
resolution single-particle reconstructions. J. Struct. Biol. 128, 82-97.
Naperova, I.A., Balyasnikova, I.V., Schwartz, D.E., Watermeyer, J., Sturrock, E.D., Kost, O.A.,
Danilov, S.M. 2008. Mapping of conformational mAb epitopes to the C domain of
human angiotensin I-converting enzyme. J. Proteome Res. 7, 3396-3411.
Natesh, R., Schwager, S.L.U., Sturrock, E.D., Acharya, K.R., 2003. Crystal structure of the
human angiotensin-converting enzyme-lisinopril complex. Nature 421, 551-554.
Pettersen, E.F., Goddard, T.D., Huang, C.C., Couch, G.S., Greenblatt, D.M., Meng, E.C., Ferrin,
T.E., 2004. UCSF chimera - a visualization system for exploratory research and
analysis. J. Comput. Chem. 25,1605-1612.
Riordan, J.F., 2003. Angiotensin I-converting enzyme and its relatives. Genome Biol. 4, 225.
Skirgello, O.E., Binevski, P.V., Pozdnev, V.F., Kost, O.A. 2005. Kinetic probes for inter-domain
co-operation in human somatic angiotensin-converting enzyme. Biochem. J. 391, 641-
647.
Skirgello, O.E., Balyasnikova, I.V., Binevski, P.V., Sun, Z.-L., Baskin, I.I., Palyulin, V.A.,
Nesterovitch, A.B., Albrecht, R.F. II., Kost, O.A., Danilov, S.M. 2006. Inhibitory
antibodies to human angiotensin-converting enzyme: fine epitope mapping and
mechanism of action. Biochemistry 45, 4831-4847.
Soubrier, F., Alhenc-Gelas, F., Hubert, C., Allegrini, J., John, M., Tregear, G., Corvol, P., 1988.
25
5
10
15
20
25

Two putative active centers in human angiotensin I converting enzyme revealed by
molecular cloning. Proc. Natl. Acad. Sci. U.S.A. 85, 9386-9390.
Strittmatter, S.M., Snyder, S.H., 1985. Characterization of angiotensin converting enzyme by
[3H]captopril binding. Mol. Pharmacol. 29, 142-148.
Sturrock, E.D., Danilov, S.M., Riordan, J.F. 1997. Limited proteolysis of human kidney
angiotensin-converting enzyme and generation of catalytically active N- and C-
terminal domains. Biochem. Biophys. Res. Commun. 236, 16-19.
Sturrock, E.D., Natesh, R., van Rooyen, J.M., Acharya, K.R., 2004. Structure of angiotensin I-
converting enzyme. Cell. Mol. Life Sci. 61, 2677-2686.
Towler, P., Staker, B., Prasad, S.G., Menon, S., Tang, J., Parsons, T., Ryan, D., Fisher, M.,
Williams, D., Dales, N.A., Patane, M.A., Pantoliano, M.W., 2004. ACE2 X-ray structures
reveal a large hinge-bending motion important for inhibitor binding and catalysis. J.
Biol. Chem. 279, 17996-18007.
Valentine, R.C., Shapiro, B.M., Stadtman, E.R., 1968. Regulation of glutamine synthetase;
electron microscopy of the enzyme from Escherichia coli. Biochemistry 7, 3266-3273.
Watermeyer, J.M., Sewell, T., Schwager, S.L., Natesh, R., Corradi, H.R., Acharya, K.R., Sturrock,
E.D., 2006. Structure of testis glycosylation mutants and evidence for conserved
domain movement. Biochemistry 45, 12654-12663.
Wei. L., Alhenc-Gelas, F., Corvol, P., Clauser, E., 1991. The two homologous domains of the
human angiotensin 1-converting enzyme are both catalytically active. J. Biol. Chem.
26
5
10
15
20
25

266, 9002-9008.
Winkler, J., Lünsdorf, H., Jokusch, B.M., 1997 Energy-filtered electron microscopy reveals that
talin is a highly flexible protein composed of a series of globular domains. Eur. J.
Biochem. 243, 430-436.
Woodman, Z.L., Schwager, S.L.U., Redelinghuys, P., Carmona, A.K., Ehlers, M.R.W., Sturrock,
E.D., 2005. The N domain of somatic angiotensin-converting enzyme negatively
regulates ectodomain shedding and catalytic activity. Biochem. J. 389, 739-744.
27
5
Figure legends:
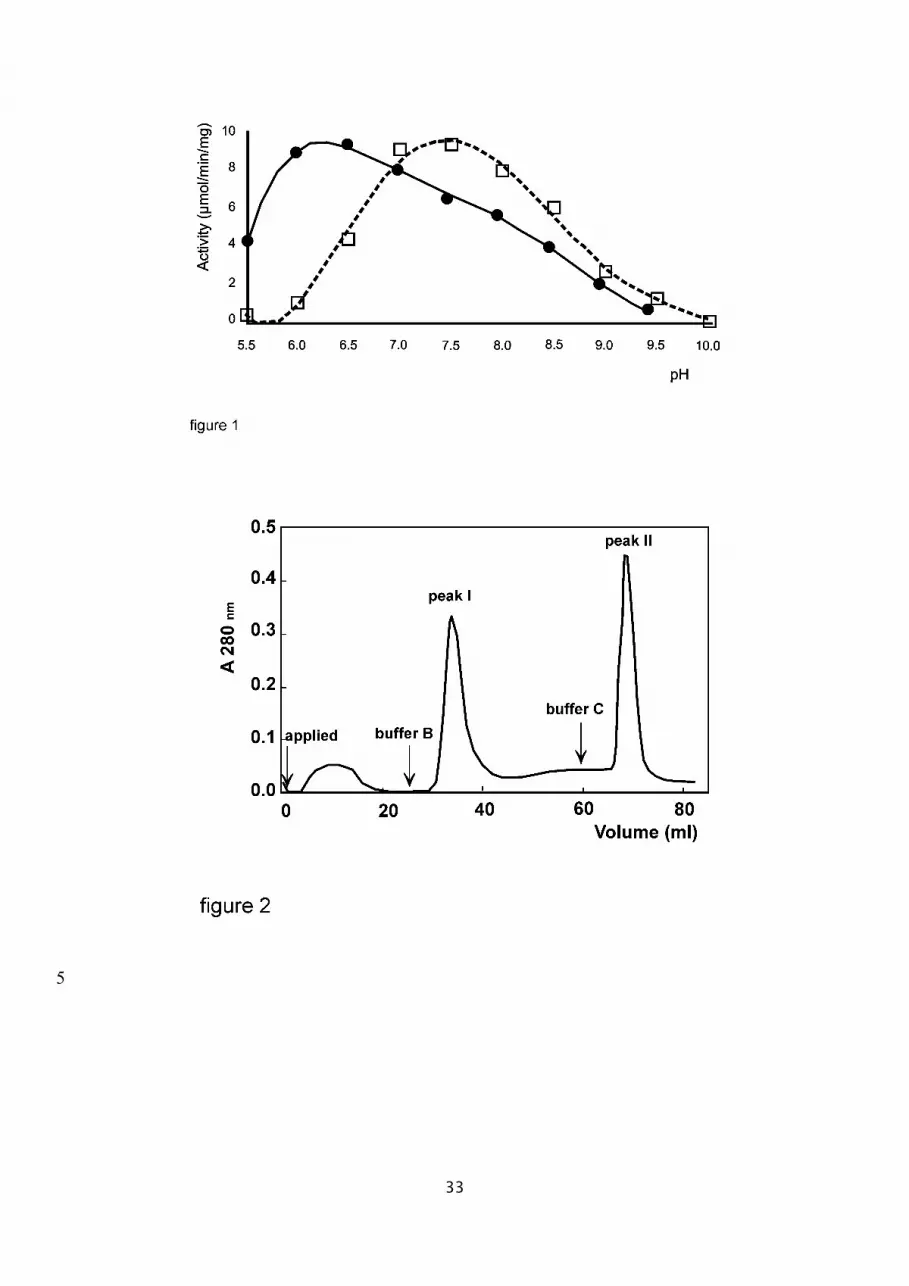
Fig. 1. pH optimum of ACE activity. pH dependence of the ACE-catalyzed hydrolysis of FA-
Phe-Gly-Gly (0.5mM) was determined at 37°C in 300mM NaCl containing none (dashed line)
or 0.1mM zinc ion (solid line) in either 50mM Mes (pH 5.5-6.5), Hepes (pH 7.0-8.5) or borate
(pH 9.0-10.0) buffer.
Fig. 2. Sepharose-lisinopril affinity chromatography for purification of N- and C-domains.
About 1.6 mg of purified sACE was digested with 2 µg of endoproteinase Asp-N in 50 mM
Hepes (pH 8.0) buffer at 37 °C for 18 hours. The proteolytic products were then purified by a
Sepharose-lisinopril column, which was equilibrated with 20 mM Tris-HCl (pH 7.2), 0.3 M
NaCl, 100 µM ZnCl2. The N-domain of ACE (Peak I) was eluted first with buffer B: 20 mM
Mes-NaOH (pH 6.0), 10 µM ZnCl2. The C-domain (Peak II) was then obtained by elution with
buffer C: 20 mM Hepes-NaOH (pH 6.0), 10 µM ZnCl2.
Fig. 3. SDS-PAGE analysis of separation of N- and C-domains. The fractions of Peaks I and II
(fig.2), were examined by 7.5% SDS-PAGE. Lanes 4 and 5 were Peaks I and II, respectively.
Lane 2 was the pure sACE, and lane 3 was the pure sACE being digested with endoproteinase
Asp-N. Lane 1 were high molecular mass markers, composed of myosin (200.0 kDa), E. coli
β-galactosidase (116.3 kDa), rabbit muscle phosphorylase b (97.4 kDa), bovine serum
albumin (66.2 kDa) and hen egg white ovalbumin (45.0 kDa).
Fig. 4. The time course of proteolytic digestion of sACE. About 120 µg of purified sACE was
digested with 0.1 µg of endoproteinase Asp-N in Hepes (pH 8.0) at 37 °C for 20 hours. The
ACE activity was measured at time intervals of 0h, 1h, 3h, 5h and 20 h ( • ). The control
experiment was performed under the same condition except for the omission of
endoproteinase Asp-N ( ---×--- ).
Fig. 5. Survey views of negatively stained porcine lung somatic ACE. (a) Elastic bright-field
28
5
10
15
20
25
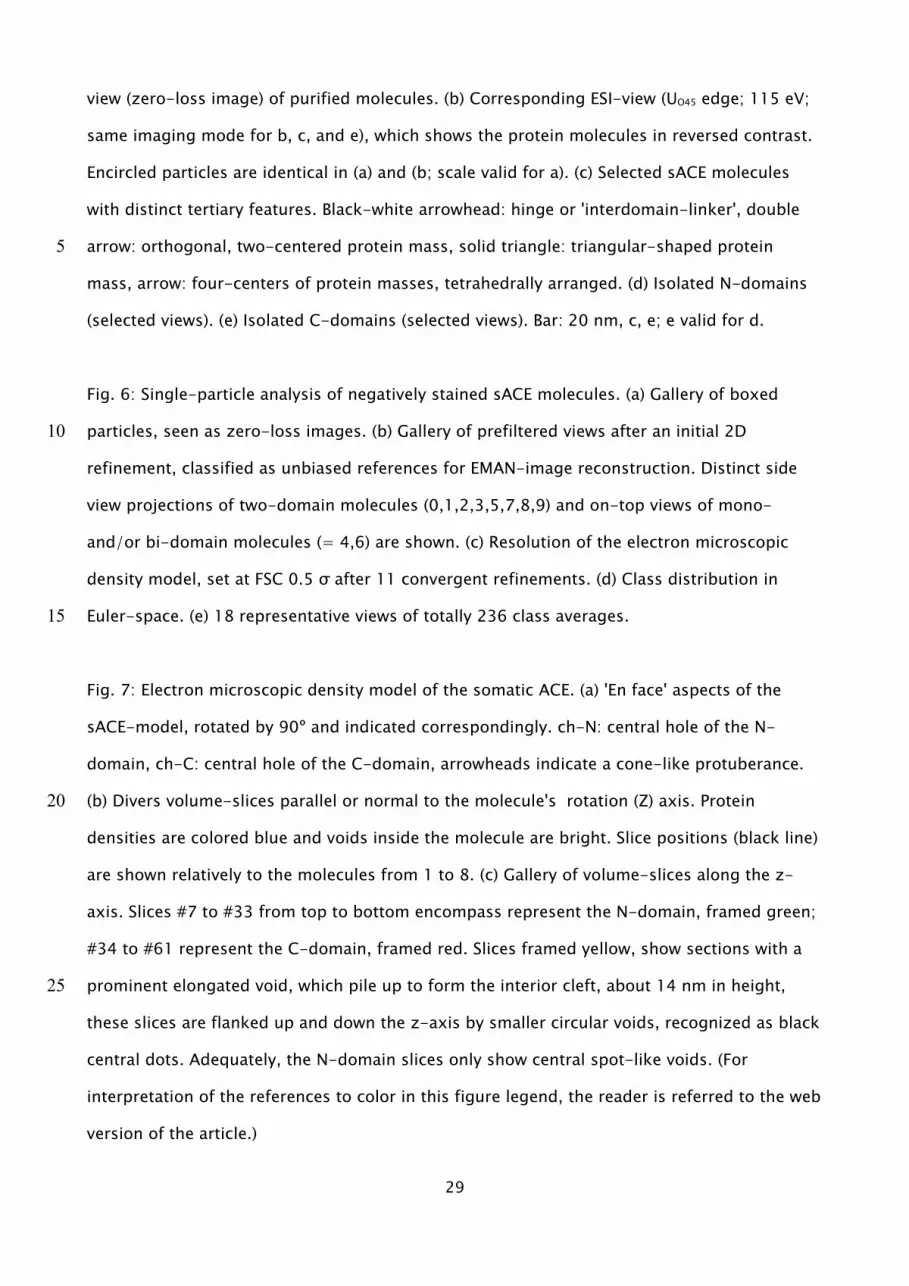
view (zero-loss image) of purified molecules. (b) Corresponding ESI-view (UO45 edge; 115 eV;
same imaging mode for b, c, and e), which shows the protein molecules in reversed contrast.
Encircled particles are identical in (a) and (b; scale valid for a). (c) Selected sACE molecules
with distinct tertiary features. Black-white arrowhead: hinge or 'interdomain-linker', double
arrow: orthogonal, two-centered protein mass, solid triangle: triangular-shaped protein
mass, arrow: four-centers of protein masses, tetrahedrally arranged. (d) Isolated N-domains
(selected views). (e) Isolated C-domains (selected views). Bar: 20 nm, c, e; e valid for d.
Fig. 6: Single-particle analysis of negatively stained sACE molecules. (a) Gallery of boxed
particles, seen as zero-loss images. (b) Gallery of prefiltered views after an initial 2D
refinement, classified as unbiased references for EMAN-image reconstruction. Distinct side
view projections of two-domain molecules (0,1,2,3,5,7,8,9) and on-top views of mono-
and/or bi-domain molecules (= 4,6) are shown. (c) Resolution of the electron microscopic
density model, set at FSC 0.5 σ after 11 convergent refinements. (d) Class distribution in
Euler-space. (e) 18 representative views of totally 236 class averages.
Fig. 7: Electron microscopic density model of the somatic ACE. (a) 'En face' aspects of the
sACE-model, rotated by 90º and indicated correspondingly. ch-N: central hole of the N-
domain, ch-C: central hole of the C-domain, arrowheads indicate a cone-like protuberance.
(b) Divers volume-slices parallel or normal to the molecule's rotation (Z) axis. Protein
densities are colored blue and voids inside the molecule are bright. Slice positions (black line)
are shown relatively to the molecules from 1 to 8. (c) Gallery of volume-slices along the z-
axis. Slices #7 to #33 from top to bottom encompass represent the N-domain, framed green;
#34 to #61 represent the C-domain, framed red. Slices framed yellow, show sections with a
prominent elongated void, which pile up to form the interior cleft, about 14 nm in height,
these slices are flanked up and down the z-axis by smaller circular voids, recognized as black
central dots. Adequately, the N-domain slices only show central spot-like voids. (For
interpretation of the references to color in this figure legend, the reader is referred to the web
version of the article.)
29
5
10
15
20
25

Fig. 8: Fitting of high-resolution X-ray atomic data into the low-resolution electron
microscopic 3D reconstruction. (a) Backside-view of the semi-transparent model, showing
the molecule's topography and inside orientation of the N-domain atomic data (human sACE-
N-domain; PDB-code: 2C6F) and of the C-domain atomic data (human ACE2; PDB-code:
1R42). (b) Same view as in (a), showing the helix-sheet atomic models. (c) and (d)
Corresponding aspects of the molecule, seen from the 'right side'. The N-domain is shown in
green, the C-domain is colored red. ch-C: central hole of the C-domain; ch-N: central hole of
the N-domain; arrowheads indicate the prominent protuberance; sc: substrate cleft; N-term:
amino-terminus; C-term: carboxy-terminus; individual amino acids are indicated; SD:
subdomain, H19, H27: helices, according to the nomenclature of Corradi et al. (2006). (For
interpretation of the references to color in this figure legend, the reader is referred to the web
version of the article.)
30
5
10
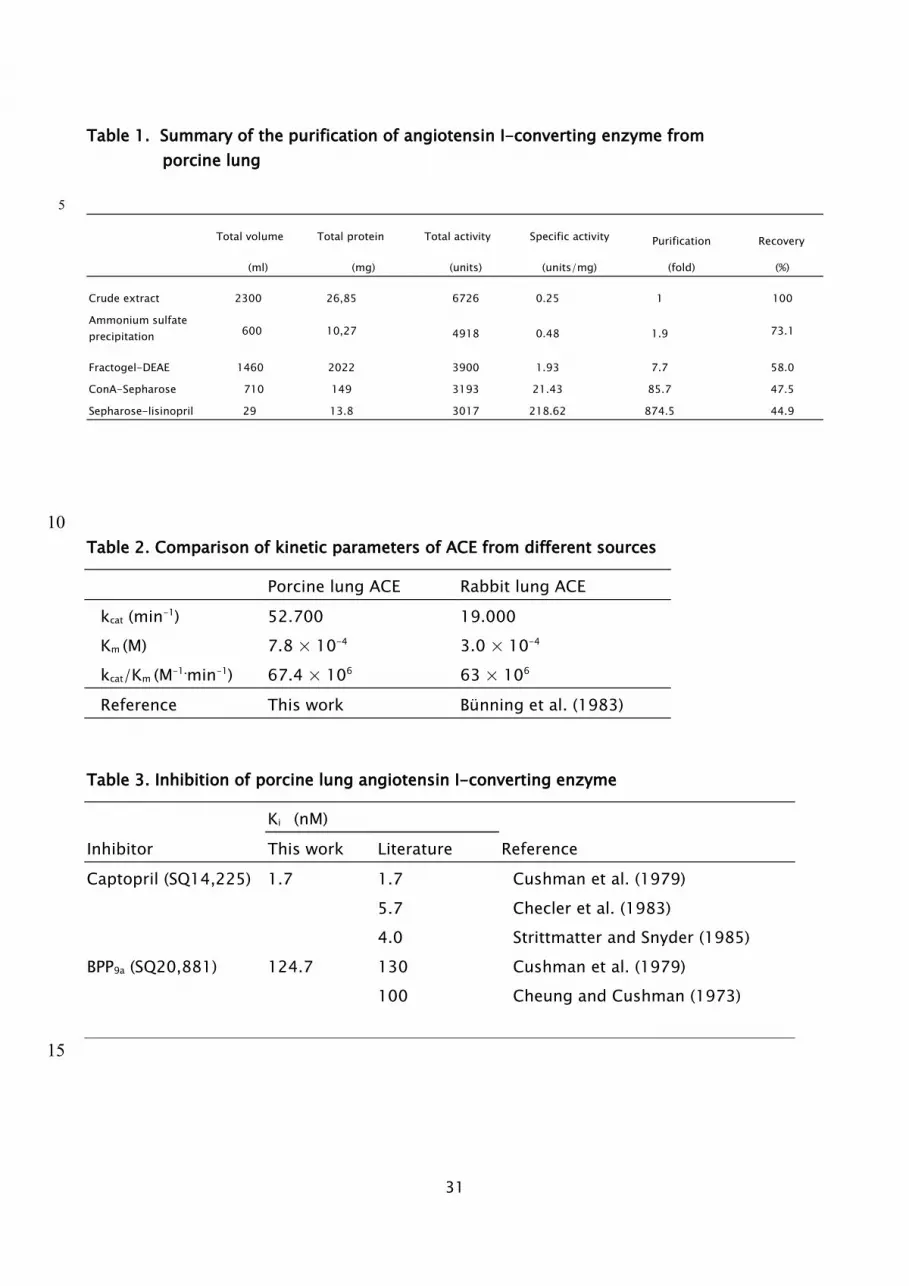
Table 1. Summary of the purification of angiotensin I-converting enzyme from porcine lung
Total volume Total protein Total activity Specific activity Purification Recovery
(ml) (mg) (units) (units/mg) (fold) (%)
Crude extract 2300 26,85 6726 0.25 1 100
Ammonium sulfate precipitation 600 10,27 4918 0.48 1.9 73.1
Fractogel-DEAE 1460 2022 3900 1.93 7.7 58.0
ConA-Sepharose 710 149 3193 21.43 85.7 47.5
Sepharose-lisinopril 29 13.8 3017 218.62 874.5 44.9
Table 2. Comparison of kinetic parameters of ACE from different sources
Porcine lung ACE Rabbit lung ACEkcat (min-1) 52.700 19.000Km (M) 7.8 × 10⁻⁴ 3.0 × 10⁻⁴
kcat/Km (M-1.min-1) 67.4 × 10⁶ 63 × 106
Reference This work Bünning et al. (1983)
Table 3. Inhibition of porcine lung angiotensin I-converting enzyme
Ki (nM)Inhibitor This work Literature ReferenceCaptopril (SQ14,225) 1.7 1.7 Cushman et al. (1979)
5.7 Checler et al. (1983) 4.0 Strittmatter and Snyder (1985)
BPP9a (SQ20,881) 124.7 130 Cushman et al. (1979) 100 Cheung and Cushman (1973)
31
5
10
15
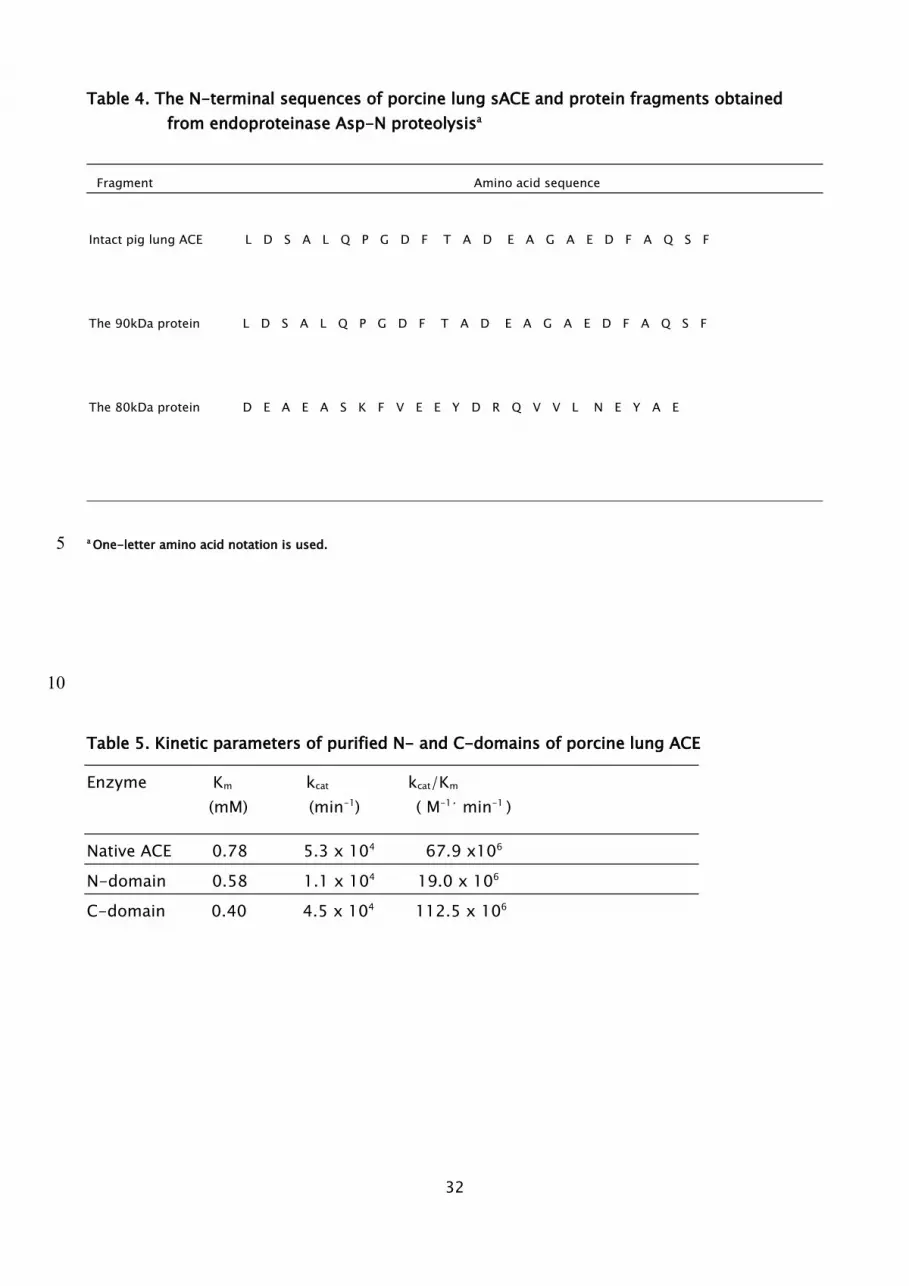
Table 4. The N-terminal sequences of porcine lung sACE and protein fragments obtained from endoproteinase Asp-N proteolysisa
Fragment Amino acid sequence
Intact pig lung ACE L D S A L Q P G D F T A D E A G A E D F A Q S F
The 90kDa protein L D S A L Q P G D F T A D E A G A E D F A Q S F
The 80kDa protein D E A E A S K F V E E Y D R Q V V L N E Y A E
a One-letter amino acid notation is used.
Table 5. Kinetic parameters of purified N- and C-domains of porcine lung ACE
Enzyme Km kcat kcat/Km
(mM) (min-1) ( M-1· min-1 )
Native ACE 0.78 5.3 x 10⁴ 67.9 x10⁶
N-domain 0.58 1.1 x 10⁴ 19.0 x 10⁶
C-domain 0.40 4.5 x 10⁴ 112.5 x 10⁶
32
5
10
33
5
34
35

36

37
38
Copyright © 2022 FDOKUMEN