MINISTERIO DE EDUCACIÓN UNIBOL QUECHUA " CASIMIRO HUANCA " SEGUNDA CONVOCATORIA PÚBLICA externa
Upload
independentCategory
view
3download
0
HIGH ALTITUDE MEDICINE & BIOLOGYVolume 9, Number 2, 2008© Mary Ann Liebert, Inc.DOI: 10.1089/ham.2007.1066
Angiotensin-Converting Enzyme Genotype and ArterialOxygen Saturation at High Altitude in Peruvian Quechua
Abigail W. Bigham,1 Melisa Kiyamu,2 Fabiola León-Velarde,3 Esteban J. Parra,4 Maria Rivera-Ch,3
Mark D. Shriver,1 and Tom D. Brutsaert2
Abstract
Bigham, Abigail W., Melisa Kiyamu, Fabiola León-Verlarde, Esteban J. Parra, Maria Rivera-Ch, Mark D. Shriver,and Tom D. Brutsaert. Angiotensin-converting enzyme genotype and arterial oxygen saturation at high alti-tude in Peruvian Quechua. High Alt. Med. Biol. 9:167–178, 2008.—The I-allele of the angiotensin-converting en-zyme (ACE) gene insertion/deletion (I/D) polymorphism has been associated with performance benefits athigh altitude (HA). In n � 142 young males and females of largely Quechua origins in Peru, we evaluated 3specific hypotheses with regard to the HA benefits of the I-allele: (1) the I-allele is associated with higher arte-rial oxygen saturation (SaO2) at HA, (2) the I-allele effect depends on the acclimatization state of the subjects,and (3) the putative I-allele effect on SaO2 is mediated by the isocapnic hypoxic ventilatory response (HVR,l/min�1/%SaO2
�1). The subject participants comprised two different study groups including BLA subjects (bornat low altitude) who were lifelong sea-level residents transiently exposed to hypobaric hypoxia (�24 h) andBHA subjects (born at HA) who were lifelong residents of HA. To control for the possibility of population strat-ification, Native American ancestry proportion (NAAP) was estimated as a covariate for each individual usinga panel of 70 ancestry-informative molecular markers (AIMS). At HA, resting and exercise SaO2 was stronglyassociated with the ACE genotype, p � 0.008 with �4% of the total variance in SaO2 attributed to ACE geno-type. Moreover, I/I individuals maintained �2.3 percentage point higher SaO2 compared to I/D and D/D. ThisI-allele effect was evident in both BLA and BHA groups, suggesting that acclimatization state has little influ-ence on the phenotypic expression of the ACE gene. Finally, ACE genotype was not associated with the iso-capnic HVR, although HVR had a strong independent effect on SaO2 (p � 0.001). This suggests that the I-alleleeffect on SaO2 is not mediated by the peripheral control of breathing, but rather by some other central car-diopulmonary effect of the ACE gene on the renin–angiotensin–aldosterone system (RAAS).
Key words: genetics; angiotensin-converting enzyme; renin–angiotensin–aldosterone system; polymorphism;hypoxic ventilatory response
167
Introduction
THE HUMAN renin–angiotensin–aldosterone system(RAAS) maintains circulatory homeostasis. A central
component of this system is the angiotensin-converting en-zyme (ACE), which is involved in blood-pressure regulationthrough the conversion of angiotensin-I (AT-I) to the vaso-constrictor peptide angiotensin-II (AT-II), as well as throughthe degradation of the vasodilator bradykinin (Muller et al.,
1997). Additionally, ACE is involved in plasma-volume reg-ulation, as AT-II affects water and salt retention via stimu-lation of aldosterone release. The gene for human ACE islocated on chromosome 17, and a frequently studied poly-morphism is the Alu insertion/deletion (I/D) polymorphismlocated in intron 16 (Rigat et al., 1990). This polymorphismexplains some of the variation in circulating plasma and tis-sue ACE levels, with the insertion (I) allele associated withlower ACE activities compared with the deletion (D) (Cos-
1Department of Anthropology, Pennsylvania State University, University Park, Pennsylvania.2Department of Anthropology, University at Albany, SUNY, Albany, New York.3Departamento de Ciencias Biológicas y Fisiológicas, Universidad Peruana Cayetano Heredia.4Department of Anthropology, University of Toronto at Mississauga, Mississauga, Ontario, Canada.
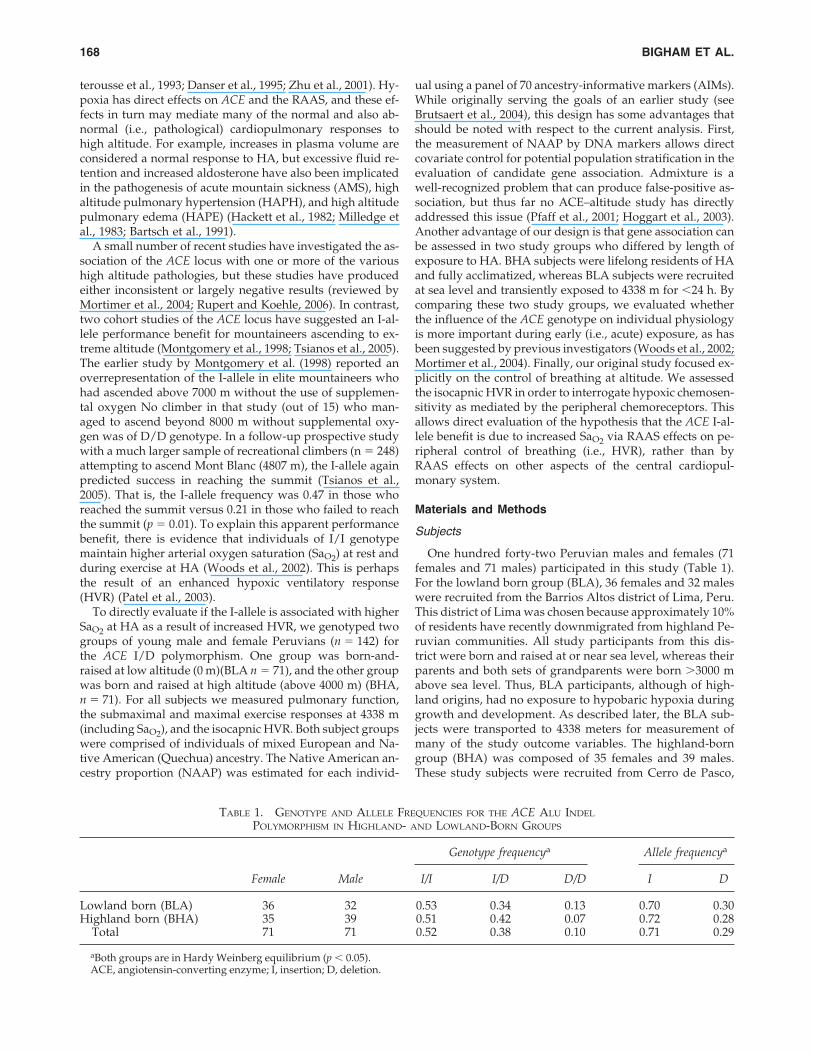
terousse et al., 1993; Danser et al., 1995; Zhu et al., 2001). Hy-poxia has direct effects on ACE and the RAAS, and these ef-fects in turn may mediate many of the normal and also ab-normal (i.e., pathological) cardiopulmonary responses tohigh altitude. For example, increases in plasma volume areconsidered a normal response to HA, but excessive fluid re-tention and increased aldosterone have also been implicatedin the pathogenesis of acute mountain sickness (AMS), highaltitude pulmonary hypertension (HAPH), and high altitudepulmonary edema (HAPE) (Hackett et al., 1982; Milledge etal., 1983; Bartsch et al., 1991).
A small number of recent studies have investigated the as-sociation of the ACE locus with one or more of the varioushigh altitude pathologies, but these studies have producedeither inconsistent or largely negative results (reviewed byMortimer et al., 2004; Rupert and Koehle, 2006). In contrast,two cohort studies of the ACE locus have suggested an I-al-lele performance benefit for mountaineers ascending to ex-treme altitude (Montgomery et al., 1998; Tsianos et al., 2005).The earlier study by Montgomery et al. (1998) reported anoverrepresentation of the I-allele in elite mountaineers whohad ascended above 7000 m without the use of supplemen-tal oxygen No climber in that study (out of 15) who man-aged to ascend beyond 8000 m without supplemental oxy-gen was of D/D genotype. In a follow-up prospective studywith a much larger sample of recreational climbers (n � 248)attempting to ascend Mont Blanc (4807 m), the I-allele againpredicted success in reaching the summit (Tsianos et al.,2005). That is, the I-allele frequency was 0.47 in those whoreached the summit versus 0.21 in those who failed to reachthe summit (p � 0.01). To explain this apparent performancebenefit, there is evidence that individuals of I/I genotypemaintain higher arterial oxygen saturation (SaO2) at rest andduring exercise at HA (Woods et al., 2002). This is perhapsthe result of an enhanced hypoxic ventilatory response(HVR) (Patel et al., 2003).
To directly evaluate if the I-allele is associated with higherSaO2 at HA as a result of increased HVR, we genotyped twogroups of young male and female Peruvians (n � 142) forthe ACE I/D polymorphism. One group was born-and-raised at low altitude (0 m)(BLA n � 71), and the other groupwas born and raised at high altitude (above 4000 m) (BHA,n � 71). For all subjects we measured pulmonary function,the submaximal and maximal exercise responses at 4338 m(including SaO2), and the isocapnic HVR. Both subject groupswere comprised of individuals of mixed European and Na-tive American (Quechua) ancestry. The Native American an-cestry proportion (NAAP) was estimated for each individ-
ual using a panel of 70 ancestry-informative markers (AIMs).While originally serving the goals of an earlier study (seeBrutsaert et al., 2004), this design has some advantages thatshould be noted with respect to the current analysis. First,the measurement of NAAP by DNA markers allows directcovariate control for potential population stratification in theevaluation of candidate gene association. Admixture is awell-recognized problem that can produce false-positive as-sociation, but thus far no ACE–altitude study has directlyaddressed this issue (Pfaff et al., 2001; Hoggart et al., 2003).Another advantage of our design is that gene association canbe assessed in two study groups who differed by length ofexposure to HA. BHA subjects were lifelong residents of HAand fully acclimatized, whereas BLA subjects were recruitedat sea level and transiently exposed to 4338 m for �24 h. Bycomparing these two study groups, we evaluated whetherthe influence of the ACE genotype on individual physiologyis more important during early (i.e., acute) exposure, as hasbeen suggested by previous investigators (Woods et al., 2002;Mortimer et al., 2004). Finally, our original study focused ex-plicitly on the control of breathing at altitude. We assessedthe isocapnic HVR in order to interrogate hypoxic chemosen-sitivity as mediated by the peripheral chemoreceptors. Thisallows direct evaluation of the hypothesis that the ACE I-al-lele benefit is due to increased SaO2 via RAAS effects on pe-ripheral control of breathing (i.e., HVR), rather than byRAAS effects on other aspects of the central cardiopul-monary system.
Materials and Methods
Subjects
One hundred forty-two Peruvian males and females (71females and 71 males) participated in this study (Table 1).For the lowland born group (BLA), 36 females and 32 maleswere recruited from the Barrios Altos district of Lima, Peru.This district of Lima was chosen because approximately 10%of residents have recently downmigrated from highland Pe-ruvian communities. All study participants from this dis-trict were born and raised at or near sea level, whereas theirparents and both sets of grandparents were born �3000 mabove sea level. Thus, BLA participants, although of high-land origins, had no exposure to hypobaric hypoxia duringgrowth and development. As described later, the BLA sub-jects were transported to 4338 meters for measurement ofmany of the study outcome variables. The highland-borngroup (BHA) was composed of 35 females and 39 males.These study subjects were recruited from Cerro de Pasco,
BIGHAM ET AL.168
TABLE 1. GENOTYPE AND ALLELE FREQUENCIES FOR THE ACE ALU INDEL
POLYMORPHISM IN HIGHLAND- AND LOWLAND-BORN GROUPS
Genotype frequencya Allele frequencya
Female Male I/I I/D D/D I D
Lowland born (BLA) 36 32 0.53 0.34 0.13 0.70 0.30Highland born (BHA) 35 39 0.51 0.42 0.07 0.72 0.28
Total 71 71 0.52 0.38 0.10 0.71 0.29
aBoth groups are in Hardy Weinberg equilibrium (p � 0.05).ACE, angiotensin-converting enzyme; I, insertion; D, deletion.
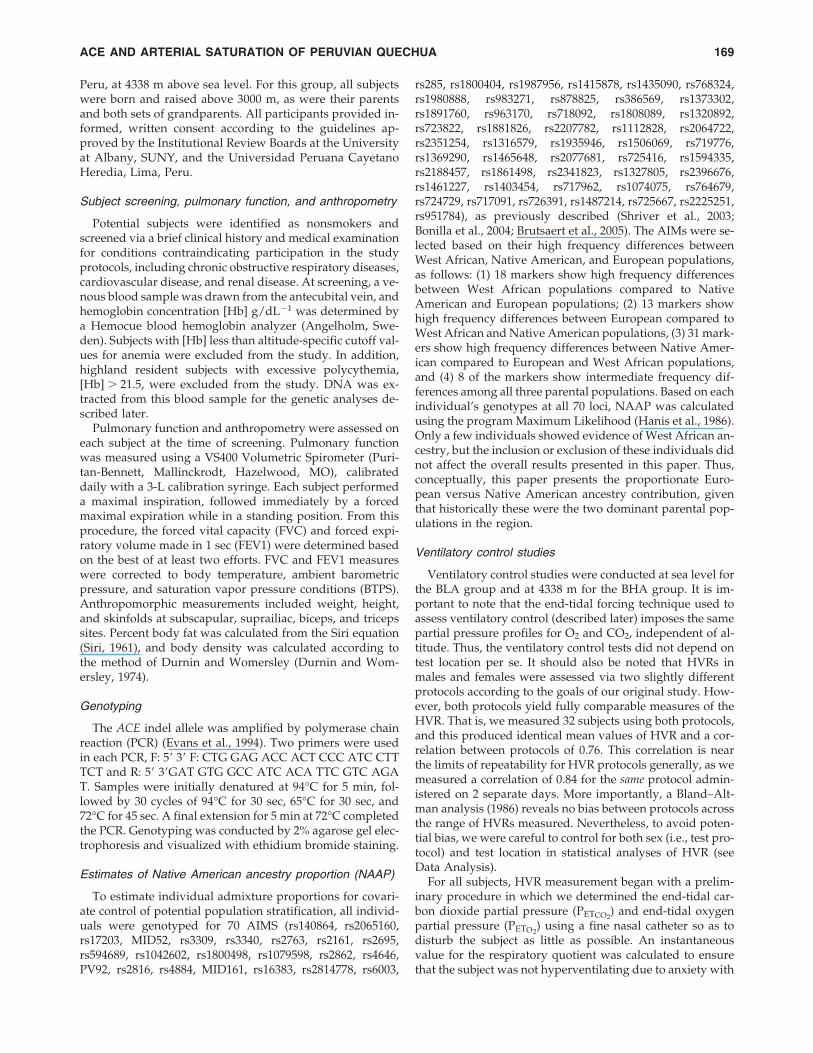
Peru, at 4338 m above sea level. For this group, all subjectswere born and raised above 3000 m, as were their parentsand both sets of grandparents. All participants provided in-formed, written consent according to the guidelines ap-proved by the Institutional Review Boards at the Universityat Albany, SUNY, and the Universidad Peruana CayetanoHeredia, Lima, Peru.
Subject screening, pulmonary function, and anthropometry
Potential subjects were identified as nonsmokers andscreened via a brief clinical history and medical examinationfor conditions contraindicating participation in the studyprotocols, including chronic obstructive respiratory diseases,cardiovascular disease, and renal disease. At screening, a ve-nous blood sample was drawn from the antecubital vein, andhemoglobin concentration [Hb] g/dL�1 was determined bya Hemocue blood hemoglobin analyzer (Angelholm, Swe-den). Subjects with [Hb] less than altitude-specific cutoff val-ues for anemia were excluded from the study. In addition,highland resident subjects with excessive polycythemia,[Hb] � 21.5, were excluded from the study. DNA was ex-tracted from this blood sample for the genetic analyses de-scribed later.
Pulmonary function and anthropometry were assessed oneach subject at the time of screening. Pulmonary functionwas measured using a VS400 Volumetric Spirometer (Puri-tan-Bennett, Mallinckrodt, Hazelwood, MO), calibrateddaily with a 3-L calibration syringe. Each subject performeda maximal inspiration, followed immediately by a forcedmaximal expiration while in a standing position. From thisprocedure, the forced vital capacity (FVC) and forced expi-ratory volume made in 1 sec (FEV1) were determined basedon the best of at least two efforts. FVC and FEV1 measureswere corrected to body temperature, ambient barometricpressure, and saturation vapor pressure conditions (BTPS).Anthropomorphic measurements included weight, height,and skinfolds at subscapular, suprailiac, biceps, and tricepssites. Percent body fat was calculated from the Siri equation(Siri, 1961), and body density was calculated according tothe method of Durnin and Womersley (Durnin and Wom-ersley, 1974).
Genotyping
The ACE indel allele was amplified by polymerase chainreaction (PCR) (Evans et al., 1994). Two primers were usedin each PCR, F: 5� 3� F: CTG GAG ACC ACT CCC ATC CTTTCT and R: 5� 3�GAT GTG GCC ATC ACA TTC GTC AGAT. Samples were initially denatured at 94°C for 5 min, fol-lowed by 30 cycles of 94°C for 30 sec, 65°C for 30 sec, and72°C for 45 sec. A final extension for 5 min at 72°C completedthe PCR. Genotyping was conducted by 2% agarose gel elec-trophoresis and visualized with ethidium bromide staining.
Estimates of Native American ancestry proportion (NAAP)
To estimate individual admixture proportions for covari-ate control of potential population stratification, all individ-uals were genotyped for 70 AIMS (rs140864, rs2065160,rs17203, MID52, rs3309, rs3340, rs2763, rs2161, rs2695,rs594689, rs1042602, rs1800498, rs1079598, rs2862, rs4646,PV92, rs2816, rs4884, MID161, rs16383, rs2814778, rs6003,
rs285, rs1800404, rs1987956, rs1415878, rs1435090, rs768324,rs1980888, rs983271, rs878825, rs386569, rs1373302,rs1891760, rs963170, rs718092, rs1808089, rs1320892,rs723822, rs1881826, rs2207782, rs1112828, rs2064722,rs2351254, rs1316579, rs1935946, rs1506069, rs719776,rs1369290, rs1465648, rs2077681, rs725416, rs1594335,rs2188457, rs1861498, rs2341823, rs1327805, rs2396676,rs1461227, rs1403454, rs717962, rs1074075, rs764679,rs724729, rs717091, rs726391, rs1487214, rs725667, rs2225251,rs951784), as previously described (Shriver et al., 2003;Bonilla et al., 2004; Brutsaert et al., 2005). The AIMs were se-lected based on their high frequency differences betweenWest African, Native American, and European populations,as follows: (1) 18 markers show high frequency differencesbetween West African populations compared to NativeAmerican and European populations; (2) 13 markers showhigh frequency differences between European compared toWest African and Native American populations, (3) 31 mark-ers show high frequency differences between Native Amer-ican compared to European and West African populations,and (4) 8 of the markers show intermediate frequency dif-ferences among all three parental populations. Based on eachindividual’s genotypes at all 70 loci, NAAP was calculatedusing the program Maximum Likelihood (Hanis et al., 1986).Only a few individuals showed evidence of West African an-cestry, but the inclusion or exclusion of these individuals didnot affect the overall results presented in this paper. Thus,conceptually, this paper presents the proportionate Euro-pean versus Native American ancestry contribution, giventhat historically these were the two dominant parental pop-ulations in the region.
Ventilatory control studies
Ventilatory control studies were conducted at sea level forthe BLA group and at 4338 m for the BHA group. It is im-portant to note that the end-tidal forcing technique used toassess ventilatory control (described later) imposes the samepartial pressure profiles for O2 and CO2, independent of al-titude. Thus, the ventilatory control tests did not depend ontest location per se. It should also be noted that HVRs inmales and females were assessed via two slightly differentprotocols according to the goals of our original study. How-ever, both protocols yield fully comparable measures of theHVR. That is, we measured 32 subjects using both protocols,and this produced identical mean values of HVR and a cor-relation between protocols of 0.76. This correlation is nearthe limits of repeatability for HVR protocols generally, as wemeasured a correlation of 0.84 for the same protocol admin-istered on 2 separate days. More importantly, a Bland–Alt-man analysis (1986) reveals no bias between protocols acrossthe range of HVRs measured. Nevertheless, to avoid poten-tial bias, we were careful to control for both sex (i.e., test pro-tocol) and test location in statistical analyses of HVR (seeData Analysis).
For all subjects, HVR measurement began with a prelim-inary procedure in which we determined the end-tidal car-bon dioxide partial pressure (PETCO2
) and end-tidal oxygenpartial pressure (PETO2
) using a fine nasal catheter so as todisturb the subject as little as possible. An instantaneousvalue for the respiratory quotient was calculated to ensurethat the subject was not hyperventilating due to anxiety with
ACE AND ARTERIAL SATURATION OF PERUVIAN QUECHUA 169

the protocol. After the preliminary procedure, HVR wasmeasured by imposing specific profiles for PETCO2
and PETO2
using an end-tidal forcing system (see later). In males, weused the protocol devised by Mou et al. (1995) and validatedfurther by Zhang and Robbins (2000). This protocol, as wellas the protocol used for females, is sufficiently brief so as tominimize the confounding effects of hypoxic ventilatory de-cline on the HVR. Throughout the protocol, the PETCO2
washeld at �2 torr above the subjects’ natural resting value. Asettling period of 5 min was employed during which thePETO2
was held at 100 torr. After this settling period, PETO2
was lowered stepwise in a series of seven steps from 100 to45 torr, with each step lasting for 50 sec. Values for PETO2
forthe five intervening steps had been calculated so as to pro-vide approximately even reductions in SaO2 between stepsand, consequently, approximately even increases in VE be-tween steps. In females, the settling period was 10 min, againat PETO2
of 100 torr, followed by a single-step drop to 50 Torrfor the next 5 min (hypoxia). In both protocols, HVR was cal-culated from the average values for ventilation (VE in BTPSunits) and PETO2
. The latter were then converted into calcu-lated values for arterial saturation using the equation of Sev-eringhaus (Severinghaus, 1979). HVR is given as the absolutevalue of the slope term (HVR, L/min�1/%SaO2
�1) calculatedvia linear regression from the relationship between VE anddesaturation.
The end-tidal forcing technique. In both protocols, the tech-nique of end-tidal forcing was used to generate the desiredprofiles in PETCO2
and PETO2. In this technique, a computa-
tional model of the cardiorespiratory system and gas storesis first used to calculate the profiles for inspiratory PCO2 andPO2 that are likely to generate the desired PETCO2
and PETO2.
Once these values have been calculated, the experiment be-gins when a computer connected to a fast gas-mixing sys-tem generates the inspiratory gas mixtures. In general, thesepredicted inspiratory gas mixtures will not of themselvesgenerate the desired end-tidal values with sufficient pre-cision, because the physiology of the individual deviatesfrom the assumptions of the cardiorespiratory model. Toovercome this problem, these predicted inspiratory valuesare modified during the course of the experiment by usingbreath-by-breath feedback from the measured PETCO2
andPETO2
. These measured values of PETCO2and PETO2
are com-pared with the desired values, and an integral-proportionalfeedback control algorithm is used to calculate the actual ad-justments required for the inspiratory PCO2 and PO2. Detailsof the forcing procedure and the gas-mixing system used inPeru have been described previously (Mou et al., 1995; Brut-saert et al., 2005). In all experiments, the subject sat uprightand breathed to and from a gas-mixing chamber via a mouth-piece while wearing a nose clip. A pulse oximeter monitoredSaO2 (Ohmeda 5740, Soma Technology, Chester, Connecti-cut). Respiratory volumes were measured using a turbinevolume-measuring device (VMM 400, Interface Associates,Laguna Niguel, CA) fixed in series with the mouthpiece. Gaswas sampled continuously from the mixing chamber (100mL) close to the mouth at a rate of 20 mL/min and analyzedusing a gas analyzer (Datex Normocap 200-Oxy, Meda, SA).All experimental data were recorded by computer at a sam-pling rate of 50 Hz using real-time, data-acquisition softwarewritten in LabView (National Instruments, Austin, TX).
Exercise testing
All exercise testing was conducted in Cerro de Pasco at4338 m. BLA subjects traveled from sea level to Cerro dePasco where they were tested within a few hours of their ar-rival to our laboratory. Subjects came to the laboratory insmall groups over about a 1-week period, and so generaltravel times were as follows: Cerro de Pasco is a 7 to 10-h busride from Lima on paved road. The first �4 to 6 hours of thetrip involve a steady gain in altitude to a high mountain pass(�4800 m). The road then descends to the Peruvian Altiplano(3600–4300 m) for the next 3 to 4 hours of the trip. Subjectsrested in the laboratory for 2 to 4 h before studies were ini-tiated and therefore were studied after 9 to 14 h of acute ex-posure to hypobaric hypoxia. Of 68 subjects recruited andmeasured in Lima, four were not measured in Cerro de Pasco.One was unable to make the trip for personal reasons, andthree were diagnosed with acute mountain sickness on ar-rival to Cerro de Pasco and returned to the lowlands.
To begin, VO2 was measured at rest (5 min) with the sub-ject seated. Following resting measurements, VO2max wasmeasured while subjects operated a mechanically brakedMonarch 818e research ergometer. Male and female subjectsstarted with workloads of 1.0- to and 0.5-kg resistance, re-spectively, and were instructed to maintain 60 rpm. Resis-tance was incremented every 3 min by 0.5 and 0.25 kg formales and females, respectively, until subject volitional fa-tigue. VO2max was defined as the highest level of oxygen con-sumption averaged over the final minute of the test con-comitant with at least one of the following conditions: (1) anonlinear increase in exercise ventilation resulting in a res-piratory exchange ratio greater than 1.10, (2) a plateau in theVO2–work rate relationship, or (3) a maximal heart rate within10% of the age-predicted maximum. In this paper we pres-ent maximal exercise response variables, as well as exerciseresponse variables during the first two levels of submaximalexercise, when subjects were more likely to be at steady state.
During VO2 testing, subjects breathed through a low-re-sistance breathing valve. The expired ventilation (VE, L/min�1 BTPS), as well as the fractional concentrations of O2
and CO2 in the expired air, were processed by a ParvomedicsTrue Max metabolic measuring system (Sandy, Utah) to pro-duce 1-minute interval calculations of VO2, carbon dioxideproduction (VCO2), the respiratory exchange ratio (RER), andthe ventilatory equivalents for oxygen and carbon dioxide(VE/VO2 and VE/VCO2, respectively). Gas analyzers were cal-ibrated with standard gases before each exercise test. Thepneumotach used to measure ventilatory flow was also cal-ibrated prior to each test with a 3-L calibration syringe. Heartrate (HR) was continuously monitored via telemetry (PolarElectric Oy, Kempele, Sweden) interfaced with the metabolicmeasuring system. SaO2 by pulse oximetry was continuouslymonitored by an Ohmeda 5740 pulse oximeter using a fin-gertip sensor (subjects were instructed not to grip with thatfinger). The pulse oximetry signal was acquired by anREM/400M data acquisition system (CB Sciences, Dover,New Hampshire) and recorded every 15 sec during VO2 mea-surements.
Data analysis
Allele and genotype frequencies for the BLA- and BHA-born groups were determined by gene counting and com-
BIGHAM ET AL.170

pared by a 2 � 2 contingency table. A �-squared test wasused to compare genotype frequencies with those expectedunder the Hardy–Weinberg equilibrium (HWE). ANOVA/ANCOVA was used to test for sex, group (i.e., altitude ofbirth), and ACE genotype effects on study outcome variablesusing the general linear model procedure of the SPSS statis-tical software package, version 10.0. Repeat measures AN-COVA was used to test for ACE genotype effects on sub-maximal exercise response variables from rest through worklevels 1 and 2. In analyses of ACE allele association involv-ing the HVR measure, it should be emphasized that sex andstudy group were included as control variables to accountfor any potential differences in HVR by protocol (i.e., malesand females were measured by different protocols) and bytest location (i.e., HVR was measured at sea-level and at al-titude in BHA vs. BLA subjects, respectively), as previouslydescribed. Although the different protocols yield fully com-parable values of HVR, statistical control in this manner en-sures a nonbiased test of association between ACE and HVR.Statistical significance criteria was p � 0.05 for all tests.
Results
Allele and genotype frequencies are shown in Table 1.There were no significant differences in allele or genotypefrequencies between the BLA and BHA subject groups. TheACE genotype frequencies for the BLA and BHA groups didnot deviate from HWE. Table 2 gives subject characteristicsorganized by ACE genotype and study group. In general, thenumbers of males and females were equally distributedwithin genotypes, except for BLA subjects of D/D genotype,where females (n � 7) exceeded males (n � 2). This distri-bution difference is a factor of small sample size for D/Dgenotypes in the population given the relatively low fre-quency of the D-allele in the Andes. This discrepancy doesnot affect the results of this study, as sex was controlled whentesting for genotype effects by ANCOVA to account for well-
known differences between males and females in height,weight, body fat percent, FVC, [Hb], and VO2max mL/min�1/kg�1.
Controlling for sex, we detected no significant genotypedifferences within study groups for any of the subject char-acteristics except for age, which was slightly higher in theD/D BLA group (p � 0.029). When BLA and BHA groupswere combined for analysis, again only age was significantlydifferent by genotype (slightly higher in D/D, p � 0.026).Notably, substantial group differences related to the altitudeof birth (i.e., BHA versus BLA), were observed. For exam-ple, when controlling for sex, BLA subjects were significantlytaller (p � 0.048), heavier (p � 0.01), and fatter (p � 0.01)than BHA. BLA subjects also had smaller FVCs, lower [Hb],and lower VO2max, mL/min�1/kg�1 measured at 4338 m (p �0.01 for all comparisons). However, these differences wereexpected and are consistent with many previous studiescomparing highland- and lowland-born groups in the An-des. These group differences are controlled for in the statis-tical analyses when testing for ACE genotype associations(see later). A final general consideration is that mean NAAPwas relatively high in the sample (0.90) and was not signif-icantly different by genotype, sex, or group. The high NAAPwas expected based on subject-selection criteria. That is, allsubjects were selected on the basis of their self-identificationas indigenous Andean and the highland Andean origins oftheir parents and grandparents.
Genotype differences in the HVR and exercise response at4338 m were tested by ANCOVA or repeated measures AN-COVA using the entire study sample available, which rangedfrom n � 138 to 142 depending on the outcome measure. Ourapproach was to test covariate effects on a particular studyoutcome first, including age, sex, birthplace, and sex-by-birthplace interactions. If a covariate was significant as anindependent effect, it was retained in the ANCOVA modeltesting for a genotypic effect. A final step was to rerun theanalysis, including NAAP as an additional covariate in order
ACE AND ARTERIAL SATURATION OF PERUVIAN QUECHUA 171
TABLE 2. SUBJECT CHARACTERISTICS (MEAN � SD) BY ALTITUDE OF BIRTH AND ACE ALU INDEL POLYMORPHISM GENOTYPE
I/I I/D D/D
Lowland born (BLA) M � 20, F � 16 M � 10, F � 13 M � 2, F � 7Age,a yr 25.3 � 3.8 23.4 � 3.8 27.7 � 5.8Height,b cm 158.3 � 8.7 154.4 � 7.1 154.0 � 11.7Weight,b kg 61.2 � 9.6 59.1 � 7.3 59.0 � 13.8Fat,b % 28.8 � 9.3 30.4 � 9.7 32.4 � 6.9FVCb 4.26 � 0.89 3.94 � 0.79 3.59 � 0.71[Hb],b g/dL�1 14.3 � 0.9 14.1 � 1.4 14.2 � 1.2VO2max,
b mL/min�1/kg�1 31.6 � 8.6 31.0 � 10.0 24.0 � 5.1NAAP 0.90 � 0.08 0.89 � 0.11 0.85 � 0.15
Highland born (BHA) M � 19, F � 19 M � 17, F � 14 M � 3, F � 2Age, yr 25.9 � 4.4 24.3 � 4.9 25.8 � 5.8Height, cm 155.3 � 8.0 155.5 � 8.4 155.4 � 8.0Weight, kg 56.2 � 6.8 57.1 � 6.8 51.9 � 7.0Fat, % 24.7 � 7.6 25.4 � 10.1 21.2 � 8.6FVC 4.56 � 0.91 4.64 � 0.98 4.81 � 1.14[Hb], g/dL�1 17.5 � 1.8 17.8 � 1.8 17.6 � 2.3VO2max, mL/min�1/kg�1 39.0 � 10.2 38.8 � 10.9 46.6 � 13.7NAAP 0.90 � 0.10 0.90 � 0.08 0.90 � 0.07
aVariable differs significantly by genotype controlling fo sex, p 0.05.bVariable is significantly different between lowland- and highland-born groups across all genotypes, p 0.05.ACE, angiotensin-converting enzyme; FVC, forced vital capacity; NAAP, Native American ancestry proportion; I, insertion; D, deletion.

to control for possible population stratification. As shown inTable 3, there were no significant differences by genotypefor HVR, VO2max,-L/min�1, VO2max, mL/min�1/kg�1, orSaO2 at maximal work output, although for the latter (SaO2)the p-value approached significance at 0.071. NAAP was re-tained as a covariate testing for ACE effects on VO2max givena marginally significant p-value (i.e., higher VO2max withhigher NAAP, p � 0.059), and given results published pre-viously showing smaller VO2max decrement with increasingNAAP in subjects tested at sea level and again at high alti-tude (Brutsaert et al., 2003). However, it is important to notethat for all variables tested ACE genotype analyses were sim-ilar with or without NAAP included as a covariate, whichindicates that there is no problem with population stratifi-cation in this study sample.
In repeated measures analysis of the submaximal exerciseresponse at 4338 m (Table 4), there were no significant dif-ferences by genotype for VO2, VE, VE/VO2, HR, or RER. How-ever, SaO2 levels at rest and across different levels of sub-maximal exercise were significantly higher in subjects of I/Igenotype (Table 4 and Fig. 1, p � 0.008). Again, inclu-sion/exclusion of NAAP made no difference to these analy-ses. However, NAAP was retained as a covariate in the fi-nal analysis of VE or VE-derived variables, as we havepreviously shown that subjects of high NAAP have lowerVE at altitude (Brutsaert et al., 2005). It should be noted thatthe ACE I/I genotype effect on SaO2 was evident in bothhighland- and lowland-born subjects, although no signifi-cant interaction between ACE genotype and birthplace wasdetected. Combining I/D and D/D genotypes into one groupfor comparison with I/I yielded nearly identical results. Thatis, individuals with I/I genotype did not differ for any mea-sured phenotype against the combined I/D D/D subjectsexcept for SaO2, where the difference by genotype was highlysignificant, large, and consistent from rest to submaximal ex-ercise.
To more fully explore the hypothesis that the I-allele ef-fect on SaO2 works through an increased HVR, we ran mul-tivariate models with resting and exercise SaO2s as depen-dent variables and ACE genotype, study group, and HVR asindependent variables. The results of these statistical mod-els were similar for all SaO2 outcome measures, includingresting and exercise measures. To simplify presentation, onlyresults for SaO2 measured at work level 1 are given in Table5. In addition, ACE was entered as a dichotomous variablecomparing the I/I genotype effect against the combined I/D D/D genotypes. This is justified based on the results pre-
sented in Table 4 and Fig. 1. Model 1 shows significant in-dependent effects of birthplace (i.e., BHA vs. BLA), ACEgenotype, and HVR on the SaO2, explaining about 52% of thetotal variance. All possible two- and three-way interactionsamong independent variables were tested, but none of thesewere significant. As expected, the group effect on the SaO2was quite large, accounting for most of the variance. Also asexpected, higher HVR predicted higher SaO2. However, in-dependent of these effects, ACE I/I genotype was associatedwith a 2.3 percentage point higher SaO2 compared to the com-bined I/D and D/D genotypes. Models 2 and 3 were runwithout the ACE and HVR variables, respectively. The ACEgenotype and the HVR each explained approximately thesame amount of the variance in SaO2, that is, �4%. However,the most important consideration is that the elimination ofeither ACE (model 2) or HVR (model 3) from a statisticalmodel did not greatly modify the effect of the remaining in-dependent variables when compared to model 1. Thus, ACEgenotype and HVR have independent effects on SaO2, andthere is no direct evidence that the ACE genotype worksthrough the HVR to affect the SaO2. This can also be seen inFig. 2, which shows higher overall SaO2 in I/I individuals,but a similar positive relationship between HVR and SaO2within genotypes.
Discussion
The results of this study show an association of ACE I/Igenotype with higher resting and submaximal exercise SaO2in two groups of Peruvians who differed by place of birthand who were tested at 4338 m altitude (p � 0.008). In bothstudy groups, individuals of I/I genotype maintained a �2.3percentage point higher SaO2, explaining about 4% of the to-tal variance in resting and exercise values. This finding isconsistent with a previous cohort study that measured SaO2over many days in trekkers of European ancestry to �5000meters in the Himalaya (Woods et al., 2002). In that study,individuals of I/I genotype who ascended to above 5000 min 12 days were able to maintain higher SaO2, especially asaltitude increased. A similar trend was evident, but not sig-nificant, in a slower ascent group who trekked over 18.5days. In contrast, a study by Patel el al. (2003) showed nosignificant association of the I-allele or I/I genotype withhigher SaO2 when subjects were briefly exposed to a frac-tional inspired oxygen concentration (FIO2
) of 0.125 in the lab-oratory. Again, a nonsignificant trend for higher SaO2 wasevident in I/I study subjects.
BIGHAM ET AL.172
Adjusted mean values � SE
Covariatesa
TABLE 3. ADJUSTED MEAN VALUES � SE BY ACE GENOTYPE FROM ANCOVA FOR VARIOUS PHYSIOLOGIC MEASURES
p-value,I/I I/D D/D ACE
(n � 72) (n � 52) (n � 14) S BP NAAP effect
HVR, L/min�1/%�1 0.71 � 0.05 0.67 � 0.06 0.55 � 0.13 0.456VO2max, L/min�1 2.08 � 0.04 2.04 � 0.04 2.06 � 0.08 x x x 0.673VO2max, L/min�1/kg�1 35.3 � 0.6 34.9 � 0.8 36.0 � 1.5 x x x 0.663SaO2 @ max, % 82.7 � 0.5 82.0 � 0.6 80.0 � 1.1 x x 0.071
aCovariates are S � sex, BP � birthplace, and NAAP � Native American ancestry proportion. A covariate was retained in ANCOVA whenit had an independent effect on an outcome variable (P 0.05), or as indicated in the text.
ACE, angiotensin-converting enzyme; I, insertion; D, deletion; HVR � hypoxic-ventilatory response.

The results of the current study extend these previousfindings in a number of important ways. First, the associa-tion of I/I genotype with higher SaO2 persisted even afterstatistical control for ancestry (NAAP). This control step ac-counts for the possibility of spurious association due to pop-
ulation stratification, a problem that is well recognized ingene association studies (e.g., (Kittles et al., 2002). Controlfor stratification allows strong inference that the ACE I/D lo-cus is either functionally related to SaO2 or in close linkagedisequilibrium (LD) with a true causal locus affecting SaO2
ACE AND ARTERIAL SATURATION OF PERUVIAN QUECHUA 173
TABLE 4. ADJUSTED MEAN VALUES OF EXERCISE RESPONSE AT 4338 M BY ACE GENOTYPE
p-value,I/I I/D D/D ACE
(n � 72) (n � 52) (n � 14) S BP NAAP effect
SaO2, % R 86.49 � 0.46 85.41 � 0.53 82.61 � 1.03 x 0.008E1 83.45 � 0.50 81.04 � 0.59 81.27 � 1.14E2 82.60 � 0.51 81.30 � 0.60 80.53 � 1.16
VO2, L/min�1 R 0.33 � 0.01 0.32 � 0.01 0.32 � 0.01 x 0.396E1 1.05 � 0.01 1.06 � 0.01 1.04 � 0.02E2 1.38 � 0.01 1.38 � 0.01 1.33 � 0.03
VE L/min�1 R 6.5 � 0.1 6.1 � 0.2 5.6 � 0.3 x x x 0.307STPD E1 16.9 � 0.3 16.9 � 0.4 16.0 � 0.7
E2 23.8 � 0.4 23.8 � 0.5 22.7 � 0.9VE/VO2 R 19.9 � 0.4 19.9 � 0.5 17.9 � 1.0 x x 0.583
E1 16.5 � 0.2 16.2 � 0.3 16.1 � 0.6E2 17.8 � 0.3 17.5 � 0.3 18.3 � 0.7
HR, bpm R 87.4 � 1.3 88.1 � 1.5 87.4 � 3.0 x x 0.402E1 123.9 � 1.4 126.5 � 1.6 124.4 � 3.2E2 144.2 � 1.7 148.0 � 1.9 141.1 � 3.8
RER R 0.84 � 0.01 0.84 � 0.01 0.78 � 0.02 x x 0.563E1 0.85 � 0.01 0.84 � 0.01 0.86 � 0.01E2 0.93 � 0.01 0.93 � 0.01 0.94 � 0.02
aCovariates are S � sex, BP � birthplace, and NAAP � Native American ancestry proportion. A covariate was retained in repeated measures ANCOVA when it had an independent effect on an exercise variable (p 0.05) or as indicated in the text.
Values are from R through two-levels of submaximal exercise (E1 and E2).STPD, standard temperature, pressure, dry; VE, expired ventilation; HR, heart rate; RER, respiratory exchange rate.
Adjusted mean values � SE
Covariatesa
FIG. 1. Mean SaO2 shown across the three stages of submaximal exercise: rest,k work1, and work2, for ACE genotype andgroups BLA and BHA. Subjects with the I/I genotype have higher mean SaO2 than either I/D or D/D individuals for bothBLA and BHA groupings.

at HA. When alleles at two or more loci are inherited to-gether they are in LD (for a review, see Ardlie et al., 2002).This is in contrast to linkage equilibrium, where there is noassociation of alleles between loci. Therefore, if the ACE I/Dlocus is in LD with the causal locus, the I-allele may alwaysbe inherited with the allelic variant at the causal locus thatincreases SaO2, and the D-allele may always be inherited withthe allelic variant at the causal locus that does not increaseSaO2. In addition, it is also possible that the ACE I/D locusacts synergistically with another as yet unidentified unlinkedlocus or loci. It has been shown that polymorphic loci in theRAAS act synergistically with one another in the pathogen-esis of disease (Qi et al., 2007). Moreover, the ACE I/D poly-morphism has been shown to act in such a manner withgenes outside the RAAS (Ryu et al., 2002; Castellano et al.,2003; Wang et al., 2006).
The second important result is that the association of I/Igenotype with higher SaO2 was similar in both BLA and BHA
subjects, and these two study groups differed greatly in theirlength of exposure to hypoxia. BLA subjects were nonaccli-matized, whereas BHA subjects were fully acclimatized andhad lived their entire lives at HA. Thus, the I-allele effect ap-pears to be independent of acclimatization status and pene-trant, whether or not subjects have experienced a lifelong ordevelopmental exposure to hypoxia. The finding that the I-allele effect is independent of acclimatization state is rele-vant to the hypothesis of Woods et al. (2002), who suggestedthat the I-allele benefit is short lived and more importantduring early-stage acclimatization to HA. According toWoods et al., this could be due to the normalization of theplasma aldosterone concentration to plasma renin activityratio (PAC/PRA) that occurs after 12 to 20 days at HA. Ourresults clearly do not support this hypothesis. Rather, it ispossible that the Woods et al. study was underpowered todetect a 1% to 2% difference in SaO2 in their “slow ascen-ders,” given a sample size of only n � 40 (14 D/D, 22 I/D,
BIGHAM ET AL.174
TABLE 5. MULTIVARIATE MODELS TESTING FOR EFFECTS ON THE SaO2MEASURED DURING SUBMAXIMAL EXERCISE AT 4338 M
Model 1 Model 2 Model 3
Variable � p-value � p-value � p-valueBHA vs. BLA �7.62a �0.001 �7.61a �0.001 �7.65a �0.001HVR �2.61a �0.001 �2.80a �0.001 — �0.001ACE �2.33b �0.001 — �0.001 �2.42b �0.001
R2 � 0.52 R2 � 0.48 R2 � 0.48
a�-value represents the difference in mean SaO2 (i.e., lower SaO2) for BLA subjects tested at 4338 m compared with BHA subjects.
b�-value represents the difference in mean SaO2 for I/I subjects compared with combined I/D and D/Dsubjects.
BHA, high altitude birth; BLA, low altitude birth; HVR, hypoxic ventilatory response; ACE, angiotensin-converting enzyme; I, insertion; D, deletion.
FIG. 2. The relationship between SaO2 and HVR shown by genotype. I/I individuals are compared to I/D and D/D in-dividuals combined.

and 4 I/I), compared with the n � 142 in this study (14 D/D,54 I/D, and 74 I/I). For example, based on SaO2 mean andvariance values from the current study, we calculate a powerof no more than 24% to detect a 2% difference in SaO2 be-tween I/I and either of the other two genotypes in the Woodset al. study. Obviously, this is an important limitation to con-sider for future studies with European populations, giventhe low frequency of the I-allele compared to the present Na-tive American group. Additionally, there is high variance inSaO2 measured by pulse oximetry, and we attribute only arelatively small effect of the ACE locus on SaO2. Alterna-tively, the difference between our study and the negativefindings in the Woods et al. and Patel et al. studies could bedue to differences in the patterns of LD between populationsthat affect the strength of the I-allele–SaO2 association. How-ever, this explanation seem less likely, given the clear trendto higher SaO2 that was shown in both aforementioned stud-ies with European groups.
The similarity between BHA and BLA subject groups isalso important to consider with respect to the issue ofgene–environment (GE) interaction and developmental ef-fects. In this particular case, apparently no GE interaction istaking place over developmental time to determine SaO2 atHA, as both of our study groups show the same I-allele ef-fect. We surmise from this that the ACE I/D polymorphismis not involved in differential regulation of gene expressionduring growth and development with lifelong consequenceson the adult phenotype, at least not for the SaO2 phenotype.This does not mean that this is generally the case, and in-deed there are examples in the broader literature of GE in-teraction taking place over developmental time frames (e.g.Kajantie et al., 2004). However, in the HA literature, ourstudy represents the first direct test for interaction betweena gene with a known phenotypic effect and lifelong envi-ronmental exposure to altitude or sea-level conditions.
Despite a strong association of the ACE genotype withSaO2, we detected no association of the ACE genotype withthe isocapnic HVR. More importantly, there was no evi-dence, via multivariate modeling, that the ACE I-allele worksthrough increased HVR to increase SaO2, as previously hy-pothesized (Patel et al., 2003; Swenson, 2004). The ACE–HVR–SaO2 hypothesis derives in part from animal studiesthat have shown that the peripheral chemoreceptors containangiotensin receptors with potential effects on the regulationof VE (Allen, 1998; Paton and Kasparov, 1999). But, supportfor this mechanism is based only on the results from Patelet al. (2003), who showed an increased VE response in I/I in-dividuals when subjects were exercised in hypoxia and nor-moxia. However, some consideration is warranted, as the ex-ertional VE is not the same thing as the HVR. HVR is theincrease in VE per unit decrease in SaO2, and when measuredunder isocapnic conditions the measure evaluates peripheralchemosensitivity and the peripheral control of breathing. Incontrast, exercise hyperpnea is measured under poikilocap-nic conditions and has a much more complex regulation thatis not well understood (Dempsey et al., 1995). Thus, the pres-ent study provides no support for an HVR-mediated mech-anism to explain higher SaO2s in individuals of I/I genotype.If it is true that control of breathing does not explain higherSaO2, then perhaps other central cardiopulmonary effects ofACE underlie the I-allele–SaO2 association. For example, an-giotensin II modulates hypoxia-induced pulmonary vaso-
constriction (Kiely et al., 1995), and differences in circulatingACE could affect ventilation–perfusion (V/Q) relationshipswithin the lung (Woods et al., 2002; Mortimer et al., 2004).However, given the lack of information in the literature onthis topic, such mechanisms remain speculative.
We also failed to detect an association of the ACE geno-type with VO2max at 4338 m, despite a number of positive re-ports from studies conducted at sea level. For example, astudy by Hagberg et al. (2002) showed 23% higher VO2maxinpostmenopausal women of I/I versus D/D genotype. Astudy by Rankinen et al. (2000) showed no association of ACEwith baseline VO2max, but showed larger increases in VO2maxafter training in subjects of D/D genotype. In the Rankinenet al. study, the effect was only evident in subjects of Euro-pean ancestry, but not in subjects with significant Africanancestry. This sort of ancestry dependence again raises theissue of population stratification. It is noteworthy that wedid not detect an association between ACE and VO2max evenafter controlling for NAAP. By doing so, we accounted forthe possibility that stratification is hiding a true association.Nevertheless, our study was not designed to specifically ad-dress the hypothesis of ACE genotype effects on VO2max, andso we urge caution in the interpretation of this negative find-ing. In particular, VO2max is affected by a large number of so-cial and environmental factors, especially physical activitylevel. We were unable to control for physical activity level(i.e., training) nor were we able to impose a training pro-gram as was the case in the study by Rankinen et al. (2000).
Given the Quechua origins and long-term HA ancestry ofour study population, the results of this study should alsobe considered briefly from an evolutionary or adaptive per-spective. If there is an I-allele benefit at HA, then the ques-tion becomes whether natural selection has increased the I-allele frequency in native groups like the Quechua. Rupertet al. (1999) were the first to document the relatively high I-allele frequency in Quechua (0.72), and our study now doc-uments practically the same frequency (0.71, Table 1). How-ever, the Quechua I-allele frequency does not appear to beincreased relative to all other Native American populations.Among published Native American population frequenciesfor the ACE Indel polymorphism, the I-allele ranges from a low in Alaskan Natives (Eskimos, Native Amerindians, and Aleuts) of 0.45 to a high of 1.0 in the Ache of easternParaguay. Moreover, many low altitude Native Americansexhibit I-allele frequencies greater than that observed in theQuechua. However, it should be noted that the allele fre-quency differences observed among the Native Americanpopulations may be the result of different founder events,due to differences in genetic drift based on varying popula-tion size or a combination of the two. Perhaps the relativelyhigh ACE-I frequency in Amerindians was due to a founderevent and then later facilitated the rapid expansion into theAndes, as originally speculated by Rupert et al. (1999). If true,this would imply that subsequent selective pressure was notsufficient to increase the frequency further, but again this isspeculation only.
In comparison to Asian HA populations in the Himalaya,the I-allele frequency has been documented at 0.67 in high-land native Ladakhis from Northern India (Qadar Pasha etal., 2001) and ranging from 0.51 to 0.64 in native Tibetansfrom Lhasa, depending on whether subjects were hyperten-sive (Gesang et al., 2002). These frequencies are slightly
ACE AND ARTERIAL SATURATION OF PERUVIAN QUECHUA 175

higher than the mean European, African, or Asian I-allelefrequencies in the literature, but there is substantial varia-tion within regionally defined groups worldwide (Brutsaertand Parra, 2006). Indeed, in many populations from sea level,the I-allele frequency is as high or higher than the frequen-cies reported above for HA natives. For example, in the studyby Qadar Pasha et al. (2001), the highest I-allele frequency(0.73, n � 20) was actually observed in a study populationof lowland origins who were first generation migrants to theLadakhi region. Thus, from the existing data, natural selec-tion cannot be conclusively evoked as the explanation for therelatively high I-allele frequency in Quechua. This is similarto the conclusion reached previously by Rupert et al. (1999).The possibility of a more complex involvement of the ACEgene in human evolutionary history at HA remains. For ex-ample, it is possible that the ACE I/D polymorphism is notthe locus under selection, but rather is in LD with an HA-selected locus in some populations such as the Quechua, butnot in other populations. Moreover, one study indicates anI-allele disadvantage with respect to HAPE. This study ofKyrgyz highlanders revealed threefold higher frequency ofthe I/I genotype in subjects with HAPE (Aldashev et al.,2002). In addition, the highland Kyrgyz actually had lowerI-allele frequency (0.56, n � 87) compared with a Bishkeklowland control group, for which the I-allele frequency was0.65 (n � 276). However, it should be noted that high alti-tude performance and high altitude disease are two unre-lated phenomena that are not mutually exclusive. The I-al-lele may confer a performance benefit at HA, but it may alsorender the carrier more susceptible to certain diseases, suchas HAPE. This could in fact explain why the I-allele is notfound at or near fixation in HA populations if it both grantsselective advantage as well as disadvantage.
The phenotypic effects of the ACE I/D polymorphism arestill poorly understood, and it is possible (perhaps likely)that the adaptive process involves selection of alleles at mul-tiple loci (i.e., haplotypes) with beneficial effects on the phe-notype. Although we did not examine other loci in the ACEgene, such future work will most likely reveal the complexselection history of this gene.
Conclusions
In two groups of Peruvians who differed in altitude atbirth and who were tested at 4388-m altitude, this studyfound that the ACE I/I genotype is associated with higherresting and submaximal exercise SaO2. Moreover, the I-alleleeffect has little to do with the acclimatization state of sub-jects. In addition, the ACE genotype was not associated withthe isocapnic HVR.
Acknowledgments
We would like to thank the volunteers who gave theirtime, sweat, and DNA for this research. This work was sup-ported in part by grants from the National Science Founda-tion BCS-0129377 to T. D. Brutsaert and the National Insti-tutes of Health (HG002154) to M. D. Shriver.
References
Aldashev A.A., Sarybaev A.S., Sydykov A.S., Kalmyrzaev B.B.,Kim E.V., Mamanova L.B., Maripov R., Kojonazarov B.K.,
Mirrakhimov M.M., Wilkins M.R. and Morrell N.W. (2002).Characterization of high-altitude pulmonary hypertension inthe Kyrgyz: association with angiotensin-converting enzymegenotype. Am. J. Respir. Crit. Care Med. 166:1396–402. Epub2002 Aug 28.
Allen A.M. (1998). Angiotensin AT1 receptor-mediated excita-tion of rat carotid body chemoreceptor afferent activity. J.Physiol. 510(Pt. 3):773–781.
Ardlie K.G., Kruglyak L., and Seielstad M. (2002). Patterns of linkage disequilibrium in the human genome. Nat. Rev.Genet. 3:299–309.
Bartsch P., Maggiorini M., Schobersberger W., Shaw S., RascherW., Girard J., Weidmann P., and Oelz O. (1991). Enhanced ex-ercise-induced rise of aldosterone and vasopressin precedingmountain sickness. J. Appl. Physiol. 71:136–143.
Bland J.M., and Altman D.G. (1986). Statistical methods for as-sessing agreement between two methods of clinical measure-ment. Lancet. 1:307–310.
Bonilla C., Shriver M.D., Parra E.J., Jones A., and Fernandez J.R.(2004). Ancestral proportions and their association with skinpigmentation and bone mineral density in Puerto Ricanwomen from New York City. Hum. Genet. 115:57–68.
Brutsaert T., Parra E., Shriver M., Gamboa A., Palacios J., RiveraM., Rodriquez I., and Leon-Velarde F. (2003). Spanish geneticadmixture is associated with larger VO2max decrement fromsea level to 4.338 m in Peruvan Quechua. J. Appl. Physiol.95:519–528.
Brutsaert T., Parra E., Shriver M., Gamboa A., Palacios J., RiveraM., Rodriquez I., and Leon-Velarde F. (2004). Effects of birthplace and individual admixture on lung volume and exercisephenotypes of Peruvian Quechua. Am. J. Phys. Anthropol.123:390–398.
Brutsaert T.D., and Parra E.J. (2006). What makes a champion?Explaining variation in human athletic performance. Respir.Physiol. Neurobiol. 151:109–123.
Brutsaert T.D., Parra E.J., Shriver M.D., Gamboa A., Rivera M.,and Leon-Velarde F. (2005). Ancestry explains the bluntedventilatory response to sustained hypoxia and lower exerciseventilation of Quechua altitude natives. Am. J. Physiol. Regul.Integr. Comp. Physiol. 289:225–234.
Castellano M., Glorioso N., Cusi D., Sarzani R., Fabris B.,Opocher G., Zoccali C., Golin R., Veglio F., Volpe M., Man-tero F., Fallo F., Rossi G.P., Barlassina C., Tizzoni L., Fil-igheddu F., Giacche M., and Rossi F. (2003). Genetic poly-morphism of the renin-angiotensin-aldosterone system andarterial hypertension in the Italian population: the GENIPERProject. J. Hypertens. 21:1853–1860.
Costerousse O., Allegrini J., Lopez M., and Alhenc-Gelas F.(1993). Angiotensin I-converting enzyme in human circulat-ing mononuclear cells: genetic polymorphism of expressionin T-lymphocytes. Biochem. J. 290(Pt. 1):33–40.
Danser A.H., Schalekamp M.A., Bax W.A., van den Brink A.M.,Saxena P.R., Riegger G.A., and Schunkert H. (1995). An-giotensin-converting enzyme in the human heart. Effect ofthe deletion/insertion polymorphism. Circulation. 92:1387–1388.
Dempsey J.A., Forster H.V., and Ainsworth D.M., Eds. (1995).Regulation of hyperpnea, hyperventilation, and respiratorymuscle recruitment during exercise. Lung Biology in Healthand Disease: Regulation of Breathing. Marcel Dekker, NewYork.
Durnin J.V., and Womersley J. (1974). Body fat assessed from to-tal body density and its estimation from skinfold thickness:measurements on 481 men and women aged from 16 to 72years. Br. J. Nutr. 32:77–97.
BIGHAM ET AL.176
Evans A.E., Poirier O., Kee F., Lecerf L., McCrum E., FalconerT., Crane J., O’Rourke D.F., and Cambien, F. (1994). Poly-morphisms of the angiotensin-converting-enzyme gene insubjects who die from coronary heart disease. Q. J. Med.87:211–214.
Gesang L., Liu G., Cen W., Qiu C., Zhuoma C., Zhuang L., RenD., Pincuo Z., and Chan Y. (2002). Angiotensin-converting en-zyme gene polymorphism and its association with essentialhypertension in a Tibetan population. Hypertens Res. 25:481–485.
Hackett P.H., Rennie D., Hofmeister S.E., Grover R.F., GroverE.B., and Reeves J.T. (1982). Fluid retention and relative hypo-ventilation in acute mountain sickness. Respiration. 43:321–329.
Hagberg J.M., McCole S.D., Brown M.D., Ferrell R.E., WilundK.R., Huberty A., Douglass L.W., and Moore G.E. (2002). ACEinsertion/deletion polymorphism and submaximal exercisehemodynamics in postmenopausal women. J. Appl. Physiol.92:1083–1088.
Hanis C.L., Chakraborty R., Ferrell R.E., and Schull W.J. (1986).Individual admixture estimates: disease associations and in-dividual risk of diabetes and gallbladder disease among Mex-ican-Americans in Starr County, Texas. Am. J. Phys. Anthro-pol. 70:433–441.
Hoggart C.J., Parra E.J., Shriver M.D., Bonilla C., Kittles R.A.,Clayton D.G., and McKeigue P.M. (2003). Control of con-founding of genetic associations in stratified populations. Am.J. Hum. Genet. 72:1492–1504.
Kajantie E., Rautanen A., Kere J., Andersson S., Yliharsila H.,Osmond C., Barker D.J., Forsen T., and Eriksson J. (2004). Theeffects of the ACE gene insertion/deletion polymorphism onglucose tolerance and insulin secretion in elderly people aremodified by birth weight. J. Clin. Endocrinol. Metab. 89:5738–5741.
Kiely D.G., Cargill R.I., and Lipworth B.J. (1995). Acute hypoxicpulmonary vasoconstriction in man is attenuated by type I angiotensin II receptor blockade. Cardiovasc Res. 30:875–880.
Kittles R.A., Chen W., Panguluri R.K., Ahaghotu C., Jackson A.,Adebamowo C.A., Griffin R., Williams T., Ukoli F., Adams-Campbell L., Kwagyan J., Isaacs W., Freeman V., and Dun-ston G.M. (2002). CYP3A4-V and prostate cancer in AfricanAmericans: causal or confounding association because of pop-ulation stratification? Hum. Genet. 110:553–560.
Milledge J.S., Catley D.M., Williams E.S., Withey W.R., andMinty B.D. (1983). Effect of prolonged exercise at altitude onthe renin–aldosterone system. J. Appl. Physiol. 55:413–418.
Montgomery H.E., Marshall R., Hemingway H., Myerson S.,Clarkson P., Dollery C., Hayward M., Holliman D.E., Jubb M.,World M., Thomas E.L., Brynes A.E., Saeed N., Barnard M.,Bell J.D., Prasad K., Rayson M., Talmud P.J., and HumphriesS.E. (1998). Human gene for physical performance. Nature.393:221–222.
Mortimer H., Patel S., and Peacock A.J. (2004). The genetic basisof high-altitude pulmonary oedema. Pharmacol. Ther. 101:183–192.
Mou X.B., Howard L.S., and Robbins, P.A. (1995). A protocol fordetermining the shape of the ventilatory response to hypoxiain humans. Respir. Physiol. 101:139–143.
Muller D.N., Bohlender J., Hilgers K.F., Dragun D., CosterousseO., Menard J., and Luft F.C. (1997). Vascular angiotensin-con-verting enzyme expression regulates local angiotensin II. Hy-pertension. 29:98–104.
Patel S., Woods D.R., Macleod N.J., Brown A., Patel K.R., Mont-gomery H.E., and Peacock A.J. (2003). Angiotensin-convert-
ing enzyme genotype and the ventilatory response to exer-tional hypoxia. Eur. Respir. J. 22:755–760.
Paton J.F., and Kasparov S. (1999). Differential effects of an-giotensin II on cardiorespiratory reflexes mediated by nucleustractus solitarii—a microinjection study in the rat. J. Physiol.521 Pt. 1:213–225.
Pfaff C.L., Parra E.J., Bonilla C., Hiester K., McKeigue P.M., Kam-boh M.I., Hutchinson R.G., Ferrell R.E., Boerwinkle E., andShriver M.D. (2001). Population structure in admixed popu-lations: effect of admixture dynamics on the pattern of link-age disequilibrium. Am. J. Hum. Genet. 68:198–207.
Qadar Pasha M.A., Khan A.P., Kumar R., Grover S.K., Ram R.B.,Norboo T., Srivastava K.K., Selvamurthy W., and BrahmachariS.K. (2001). Angiotensin converting enzyme insertion allele inrelation to high altitude adaptation. Ann. Hum. Genet. 65:531–536.
Qi Y., Niu W., Zhu T., Zhou W., and Qiu C. (2007). Synergisticeffect of the genetic polymorphisms of the renin–angioten-sin–aldosterone system on high-altitude pulmonary edema: astudy from Qinghai–Tibet altitude. Eur. J. Epidemiol.
Rankinen T., Perusse L., Gagnon J., Chagnon Y.C., Leon A.S.,Skinner J.S., Wilmore J.H., Rao D.C., and Bouchard C. (2000).Angiotensin–converting enzyme ID polymorphism and fit-ness phenotype in the HERITAGE Family Study. J. Appl.Physiol. 88:1029–1035.
Rigat B., Hubert C., Alhenc-Gelas F., Cambien F., Corvol P., andSoubrier F. (1990). An insertion/deletion polymorphism in theangiotensin I-converting enzyme gene accounting for half thevariance of serum enzyme levels. J. Clin. Invest. 86:1343–1346.
Rupert J.L., Devine D.V., Monsalve M.V., and Hochachka P.W.(1999). Angiotensin-converting enzyme (ACE) alleles in theQuechua, a high altitude South American native population.Ann. Hum. Biol. 26:375–380.
Rupert J.L., and Koehle M.S. (2006). Evidence for a genetic ba-sis for altitude-related illness. High Alt. Med. Biol. 7:150–167.
Ryu S.K., Cho E.Y., Park H.Y., Im E.K., Jang Y.S., Shin G.J., ShimW.H., and Cho S.Y. (2002). Renin–angiotensin–aldosteronesystem (RAAS) gene polymorphism as a risk factor of coro-nary in-stent restenosis. Yonsei Med. J. 43:461–472.
Severinghaus J.W. (1979). Simple, accurate equations for humanblood O2 dissociation computations. J. Appl. Physiol. 46:599–602.
Shriver M.D., Parra E.J., Dios S., Bonilla C., Norton H., Jovel C.,Pfaff C., Jones C., Massac A., Cameron N., Baron A., JacksonT., Argyropoulos G., Jin L., Hoggart C.J., McKeigue P.M., andKittles R.A. (2003). Skin pigmentation, biogeographical an-cestry and admixture mapping. Hum. Genet. 112:387–399.
Siri W.E. (1961). Body composition from fluid spaces and den-sity: analysis of methods. In: Techniques for Measuring BodyComposition. J. Brozek and A. Henschel, eds. National Acad-emy of Sciences, National Research Council, Washington, DC;pp. 223–224.
Swenson E.R. (2004). ACE inhibitors and high altitude. High Alt.Med. Biol. 5:92–94.
Tsianos G., Eleftheriou K.I., Hawe E., Woolrich L., Watt M., WattI., Peacock A., Montgomery H., and Grant S. (2005). Perfor-mance at altitude and angiotensin I-converting enzyme geno-type. Eur. J. Appl. Physiol. 93:630–633.
Wang B., Jin F., Yang Z., Lu Z., Kan R., Li S., Zheng C., andWang L. (2006). The insertion polymorphism in angiotensin-converting enzyme gene associated with the APOE epsilon 4allele increases the risk of late-onset Alzheimer disease. J. Mol.Neurosci. 30:267–271.
Woods D.R., Pollard A.J., Collier D.J., Jamshidi Y., Vassiliou V.,Hawe E., Humphries S.E., and Montgomery H.E. (2002). In-
ACE AND ARTERIAL SATURATION OF PERUVIAN QUECHUA 177

sertion/deletion polymorphism of the angiotensin I-convert-ing enzyme gene and arterial oxygen saturation at high alti-tude. Am. J. Respir. Crit. Care Med. 166:362–366.
Zhang S., and Robbins P.A. (2000). Methodological and physio-logical variability within the ventilatory response to hypoxiain humans. J. Appl. Physiol. 88:1924–1932.
Zhu X., Bouzekri N., Southam L., Cooper R.S., Adeyemo A.,McKenzie C.A., Luke A., Chen G., Elston R.C., and Ward R.(2001). Linkage and association analysis of angiotensin I-converting enzyme (ACE)-gene polymorphisms with ACEconcentration and blood pressure. Am. J. Hum. Genet. 68:1139–1148.
Address reprint requests to:Tom Brutsaert
Department of Anthropology1400 Washington Ave.
The University at Albany, SUNY,Albany, New York, 12222
E-mail: [email protected]
Received October 30, 2007; accepted in final formFebruary 7, 2008.
BIGHAM ET AL.178
Copyright © 2022 FDOKUMEN