LDS Saturation Studies for Horizontal Drift - INDICO-FNAL (Indico)
Upload
khangminh22Category
view
3download
0
Faculty of Science and Engineering
Department of Exploration Geophysics
Investigation of Pressure and Saturation Effects on Elastic Parameters: an Integrated Approach to Improve Time-Lapse
Interpretation
Marcos Hexsel Grochau
This thesis is presented for the Degree of Doctor of Philosophy
of Curtin University of Technology
March 2009

____________________________________________________________________
ii
Declaration To the best of my knowledge and belief this thesis contains no material previously
published by any other person except where due acknowledgment has been made.
This thesis contains no material which has been accepted for the award of any other
degree or diploma in any university.
Signature: ………………………………………….
Date: ………………………...

____________________________________________________________________
iii
To my parents, Harry and Ruth, whose efforts permitted my education.

_______________________________________________________________________
iv
ABSTRACT
Time-lapse seismic is a modern technology for monitoring production-induced
changes in and around a hydrocarbon reservoir. Time-lapse (4D) seismic may help
locate undrained areas, monitor pore fluid changes and identify reservoir
compartmentalization. Despite several successful 4D projects, there are still many
challenges related to time-lapse technology. Perhaps the most important are to perform
quantitative time-lapse and to model and interpret time-lapse effects in thin layers. The
former requires one to quantify saturation and pressure effects on rock elastic
parameters. The latter requires an understanding of the combined response of time-lapse
effects in thin layers and overcoming seismic vertical resolution limitation.
This thesis presents an integrated study of saturation and pressure effects on
elastic properties. Despite the fact that Gassmann fluid substitution is standard practice
to predict time-lapse saturation effects, its validity in the field environment rests upon a
number of assumptions. The validity of Gassmann equations, ultimately, can only be
tested in real geological environments. In this thesis I developed a workflow to test
Gassmann fluid substitution by comparing saturated P-wave moduli computed from dry
core measurements with those obtained from sonic and density logs. The workflow has
been tested on a turbidite reservoir from the Campos Basin, offshore Brazil. The results
show good statistical agreement between the P-wave elastic moduli computed from
cores using the Gassmann equations and the corresponding moduli computed from log
data. This confirms that all the assumptions of the Gassmann theory are adequate within
the measurement error and natural variability of elastic properties. These results provide
further justification for using the Gassmann theory to interpret time-lapse effects in this
sandstone reservoir and in similar geological formations.
Pressure effects on elastic properties are usually obtained by laboratory
measurements, which can be affected by core damage. I investigated the magnitude of
this effect on compressional-wave velocities by comparing laboratory experiments and

ABSTRACT
_______________________________________________________________________
_______________________________________________________________________
v
log measurements. I used Gassmann fluid substitution to obtain low-frequency saturated
velocities from dry core measurements taken at reservoir pressure, thus mitigating the
dispersion effects. The analysis is performed for an unusual densely cored well from
which 43 cores were extracted over a 45 m thick turbidite reservoir. These computed
velocities show very good agreement with the sonic-log measurements. This is
encouraging because it implies that core damages that may occur while bringing the core
samples to the surface are small and do not adversely affect the measurement of elastic
properties on these core samples. Should core damage have affected our measurements,
we would have expected a systematic difference between properties measured in situ
and on the recovered. This confirms that, for this particular region, the effect of core
damage on ultrasonic measurements is less than the measurement error. Consequently,
stress sensitivity of elastic properties as obtained from ultrasonic measurements are
adequate for quantitative interpretation of time-lapse seismic data.
In some circumstances, stress sensitivity may not be obtained by ultrasonic
measurements. Cores may be affected by damage, bias in the plugging process and scale
effects and therefore may not be representative of the in situ properties. Consequently it
is desirable to obtain this dependence from an alternative method. This other approach
ideally should provide the pressure – velocity dependence from an intact rock. Few
methods can sample the in situ rock. Seismic, for instance, provides in situ information,
but lacks vertical resolution. Well logs, on the other hand, can provide high vertical
resolution information, but usually are not available before and after production changes.
I propose a method to assess the in situ pressure - velocity dependence using well data. I
apply this method to a reservoir made up of sandstone. I used 23 wells drilled and
logged in different stages of development of a hydrocarbon field providing rock and
fluid properties at different pressures. For each well logged at a specific time, pore
pressure, velocity and porosity, among other properties, are known. Pore pressure is
accessed from a Repeat Formation Tester (RFT). As a field depletes and new wells are
drilled and logged, similar data sets related to different stages of depletion are available.

ABSTRACT
_______________________________________________________________________
_______________________________________________________________________
vi
I present an approach expanding Furre et al. (2009) study incorporating porosity and
obtaining a three dimensional relationship with velocity and pressure. The idea is to help
to capture rock property variability.
Quantitative time-lapse studies require precise knowledge of the response of
rocks sampled by a seismic wave. Small-scale vertical changes in rock properties, such
as those resulting from centimetre scale depositional layering, are usually undetectable
in both seismic and standard borehole logs (Murphy et al., 1984). I present a
methodology to assess rock properties by using X-ray computed tomography (CT)
images along with laboratory velocity measurements and borehole logs. This
methodology is applied to rocks extracted from around 2.8 km depth from offshore
Brazil. This improved understanding of physical property variations may help to
correlate stratigraphy between wells and to calibrate pressure effects on velocities, for
seismic time-lapse studies.
Small scale intra-reservoir shales have a very different response from sands to
fluid injection and depletion, and thus may have a strong effect on the equivalent
properties of a heterogeneous sandstone reservoir. Since shales have very low
permeability, an increase of pore pressure in the sand will cause an increase of confining
pressure in the intra-reservoir shale. I present a methodology to compute the combined
seismic response for depletion and injection scenarios as a function of net to gross (NTG
or sand – shale fraction). This approach is appropriate for modelling time-lapse effects
of thin layers of sandstones and shales in repeated seismic surveys when there is no time
for pressure in shale and sand to equilibrate. I apply the developed methodology to
analyse the sand - shale combined response to typical shale and sandstone stress
sensitivities for an oil field located in Campos Basin, Brazil. For a typical NTG of 0.6,
there is a difference of approximately 35% in reflection coefficient during reservoir
depletion from the expected value if these shales are neglected. Consequently, not
considering the small shales intra-reservoir may mislead quantitative 4D studies.

ABSTRACT
_______________________________________________________________________
_______________________________________________________________________
vii
The results obtained in this research are aimed to quantify pressure and
saturation effects on elastic properties. New methodologies and workflows have been
proposed and tested using real data from South America (Campos Basin) datasets. The
results of this study are expected to guide future time-lapse studies in this region. Further
investigations using the proposed methodologies are necessary to verify their
applicability in other regions.

_______________________________________________________________________
viii
ACKNOWLEDGEMENTS
I would like to thank my supervisor Professor Boris Gurevich for his guidance,
patience, availability and inspiring ideas. Without his support completing this thesis
would not have been easy. I also appreciate the assistance of Dr. Bruce Hartley, Dr.
Christian Dupuis and Dr. Tobias Müller. Their careful reading has greatly improved the
accuracy and clarity of this thesis.
I would like to thank all the staff members of the Department of Exploration
Geophysics, who have assisted me in the course of my research, with special thanks to
Ms. Deirdre Hollingsworth for her administrative help and Mr. Robert Verstandig for his
computing help.
I would also like to thank my colleagues at the Department of Exploration
Geophysics, Curtin University of Technology and CSRIO for their useful discussions
and friendship throughout my PhD research, especially Ben Clennell, Dariush Nadri,
Marina Pervukhina, Maxim Lebedev, Mohammed Alhussain and Putri Wisman.
I would also like to acknowledge Andre Gerhardt for his encouragement in the
early phase of this project. My thanks also go to David Lumley for his suggestion to use
combined analysis of core and log data in conjunction with seismic data.
I am also grateful for the financial assistance of Petrobras, the state-owned
Brazilian oil company, through the commitment of the following E&P-managers who
endorsed this project: Sebastião Benedito Martins, Paulo Marcos Tinoco, Sueli Ueta,
Gilson Ferreira, Jose Adilson Tenorio, Paulo Johann, Carlos Eugênio da Ressureicão,
Carlos Bruhn, Jose Antonio Figueiredo, Alberto Sampaio de Almeida and Guilherme
Estrella. Their encouragement and support during all stages of this journey was
extremely important and very much appreciated.
Thanks are due to to the efficient and extremely helpful secretary Maria Goretti
who was always available to assist me with organizational requirements and the paper

ACKNOWLEDGEMENTS
_______________________________________________________________________
_______________________________________________________________________
ix
work involved. I should also thank Julio Machado, Marcos Gomes and Edno Souza for
helping me to organize the 4D papers database. Thank you to my tennis friends Dr. and
Mrs. David Thwaites for suggesting grammatical improvements for this thesis.
Thank you to my colleagues of Petrobras with whom I have exchanged ideas and
experience: Ana Moliterno, Armando Scarparo Cunha, Elisabete Campos, Gilberto
Albertão, Gilberto Lima, Guilherme Vasquez, Marcos Sebastião, Osni de Paula and
Silvia Malagutti. I really have appreciated the technical discussions and I acknowledge
your help. Petrobras surely has a highly qualified group and can take great pride in this.
Special thanks to my sons Artur and Hugo for their understanding of the long
hours spent studying hard; and to my wife, Lise, who provided support to continue my
studies at Curtin.
Finally, a very special thank you to my parents, Harry Rodolfo Grochau and
Ruth Guilhermina Hexsel Grochau for the opportunities their sacrifices have provided
me with. Since my childhood they have shown me the importance of knowledge and
have provided motivation and support.

_______________________________________________________________________
x
TABLE OF CONTENTS
ABSTRACT………………………………………………………………………..……iv
ACKNOWLEDGEMENTS……………………………………………………….…...viii
TABLE OF CONTENTS…………………………………………………………….......x
LIST OF FIGURES…………………………………………………………………….xiii
LIST OF TABLES………………………………………………………………….....xvii
LIST OF APPENDICES………………………………………………………….......xviii
CHAPTER 1 – INTRODUCTION……………………………………………………..1
1.1 Time-Lapse Seismic Technology………………………………………...............1
1.2 Time-Lapse Seismic – Market and Economics Aspects……………….………...6
1.3 Technical Challenges using Time-Lapse Seismic………………..………………8
1.4 Aim of the Research…………………………………………………………….10
1.5 Thesis Configuration……………………………………………………………11
CHAPTER 2 - FLUID EFFECTS ON ELASTIC PROPERTIES………………….13
2.1 Theoretical Background………………………………………………………...14
2.1.1 Elastic moduli…………………………………………………………...14
2.1.2 Gassmann theory and assumptions……...….…………………………...15
2.2 Testing Gassmann Fluid Substitution: Sonic Logs versus Ultrasonic
Measurements…………………………………………………………………………...17
2.2.1 Core extraction and sampling………………………………………...…19
2.2.2 Ultrasonic core measurements………………………………………......21
2.2.3 Estimation of reservoir effective pressure………………………………21
2.2.4 Quality control……………………………………………….………….22
2.2.5 Gassmann fluid substitution to calculate elastic moduli………………..24
2.2.6 Statistical analysis and results ………………………………………..…24
2.3 Discussion and Conclusions………………………………………………….....27

TABLE OF CONTENTS
_______________________________________________________________________
_______________________________________________________________________
xi
CHAPTER 3 – PRESSURE EFFECTS ON ELASTIC PROPERTIES………...…30
3.1 Stress Sensitivity from Ultrasonic Measurements (Cores)……………………...31
3.1.1 Description of field data………………………………………………...32
3.1.2 Methodology…………………………………………………………….35
3.1.3 Results……………………………………………………………..........47
3.1.4 Conclusions…………….………………………………….....................51
3.2 Stress Sensitivity using an In Situ Approach (Well Logs)….....……….……….52
3.2.1 Description of data……………………………………………………...53
3.2.2 Objectives and methodology……………………………………………54
3.2.3 Results.……………………………………………………………….....59
3.2.4 Conclusions……………………………………………………………..64
CHAPTER 4 – CHARACTERIZATION OF THIN STRATIFICATION………...66
4.1 Using X-Ray Computed Tomography to Characterize Finely Layered
Sediments……………………………………………………………………………….67
4.1.1 Description of data….…………………………………………………..68
4.1.2 Methodology……………………………………………………………69
4.1.3 Quantification of sedimentary cycles on the centimetre scale………….73
4.1.4 Discussion………………………………………………………………76
4.1.5 Conclusions…………………………………………………………..…78
4.2 Effect of Net to Gross (Thin Layers) on Pressure Sensitivity in Hydrocarbons
Reservoirs……………………………………………………………………………….79
4.2.1 Effect of thin intra-reservoir shale layers during production…………...80
4.2.2 Computing elastic parameters of an equivalent medium ...…………….80
4.2.3 A case study for a clastic reservoir in Campos Basin…………………..81
4.2.4 Results…………………………………………………………….…….86
4.2.5 Discussion and conclusions…………………………………….……….91

TABLE OF CONTENTS
_______________________________________________________________________
_______________________________________________________________________
xii
CHAPTER 5 – CONCLUSIONS AND FUTURE RESEARCH ...………………....92
5.1 Conclusions..............................………………………………………….……...93
5.2 Future Research........................…………………………………………………96
REFERENCES………………………………………………………………………...99
APPENDICES……………………………………………………….………………..106
Appendix A - Papers related with time-lapse (4D) studies…………………………....106

_______________________________________________________________________
xiii
LIST OF FIGURES
Figure 1.1: Illustration of the most important technologies influencing E&P spending
(Lehman Brother E&P Spending Summary: Most Influential 2006
Technology)………………………………………………………………………3
Figure 1.2: Maturity S-curve for different 4D applications (adapted from Staples et al.,
2006)……………………………………………………………………………...5
Figure 1.3: Cumulative expenditures on 4D seismic services to contractor and service
companies for 2000-2003 (from Lumley, 2004)………….……………..…….....7
Figure 2.1: Workflow used for preparing the data and for testing Gassmann fluid
substitution……………………………………………………………………...18
Figure 2.2: Map of the Campos Basin oil fields showing the location and age of the main
reservoirs (from Bruhn et al., 2003)……………………….......…………..……20
Figure 2.3: Porosity from log and cores showing the samples that meet the quality
control criteria ...................................................…….............….......……..........23
Figure 2.4: Water saturation log showing the water content in this interval,
predominantly lower than 10% (the other phase is oil)........….......…….............25
Figure 2.5: P-wave modulus computed from ultrasonic dry measurements; the saturated
modulus computed from dry core measurements using Gassmann equation; and
obtained from sonic and density logs.......................................................…........26
Figure 2.6: Differences between P-wave elastic moduli computed from logs and
ultrasonic dry core measurements and between logs and saturated cores
(computed from dry using Gassmann equation). In (a) both curves are plotted
against depth whereas in (b) the histograms of differences are plotted..........….29
Figure 3.1: (a) Gamma-ray, water saturation, P-wave velocity, porosity and density from
the studied well; (b) coarse sandstone representative of confined turbidites

LIST OF FIGURES
_______________________________________________________________________
_______________________________________________________________________
xiv
present in this field in Campos Basin; (c) representative thin section from the
analysed reservoir with mineralogic composition ……………………..…….…34
Figure 3.2: (a) Under-representativeness, (b) dispersion (modified from Batzle,
2006)...............................................................................................................…..36
Figure 3.3: X-Ray CT images ...........……………………………………..….…….......37
Figure 3.4: Measurement system device………………………………………….….…40
Figure 3.5: The effect of 10% variation in bulk mineral (Km) and fluid moduli (Kfluid) on
saturated P-wave velocities (VPsat): (a) sample-by-sample, (b) average over the
reservoir interval.......................................................................…....................…44
Figure 3.6: Velocity versus effective pressure for a selection of core samples at different
depths…………………………………………………………….……....……...46
Figure 3.7: Comparison of saturated P-wave velocities computed using Gassmann
equations from dry core measurements against a sonic log .................………...48
Figure 3.8: Differences between saturated P-wave velocities computed using Gassmann
equations from dry core measurements and the sonic log.......................…….....49
Figure 3.9: Differences in percentage between saturated P-wave velocities computed
using Gassmann equations from dry core measurements and the sonic log........50
Figure 3.10: Pore pressure variation with time (depletion) from the main reservoir.......55
Figure 3.11: Map showing wells drilled through the main reservoir............…..….....…56
Figure 3.12: Wells W8 and W12 exemplifying the characteristics of data used for
obtaining in situ velocity dependence on pressure..………………….................58
Figure 3.13: In situ P-wave velocity dependence on porosity and effective pressure for
Area 1 (19 wells from 20 available)................………………………....….……61
Figure 3.14: In situ P-wave velocity dependence on porosity and effective pressure for
Area 2 (all the 4 wells available are used)........………………………..…..…....62

LIST OF FIGURES
_______________________________________________________________________
_______________________________________________________________________
xv
Figure 3.15: P-wave velocity dependence on porosity and effective pressure for Area 2.
Points are obtained from ultrasonic measurements in 26 cores (in the laboratory)
at different confining pressures..………………………………………….....….63
Figure 4.1: X-ray CT values obtained by computing the average value over a circular
area for each of the 143 CT images at every 5 cm.........……………...………...71
Figure 4.2: Ultrasonic P-wave velocity measured from plugs versus relative X-ray
density from CT images. CT images from samples 3 (2863.25 m) and 8 (2864.40
m) are also shown..........................................................................................…...72
Figure 4.3: Ultrasonic P-wave velocity from plugs at reservoir effective pressure
measured on vertically and horizontally oriented core plugs; P-wave velocity
from high resolution sonic log and velocity derived from CT images.................74
Figure 4.4: (a) Autocorrelation function of gamma-ray log, density log and CT velocities
for the depth interval shown in Figure 4.3. The autocorrelation function of the
CT velocities consists of two parts: (1) a signature of a random process; and (2) a
signature of a periodic (cyclic) process. (b) Power spectral density computed
from CT images in shale-marl interval................................................…….……75
Figure 4.5: Ultrasonic P-wave velocities (plugs) versus confining pressure measured in
the laboratory..................................................................................................…..77
Figure 4.6: Gamma-ray logs over the reservoir interval for 4 wells located in an oil field
in Campos Basin.................................................................……….………….…83
Figure 4.7: Velocity dependency on effective pressure from ultrasonic measurements for
sand and shales.........................................................……….........………..…….85
Figure 4.8: P-wave impedance of a heterogeneous (shales and sands) reservoir computed
using Backus average. Depletion and injection of 10 MPa from the initial
conditions are modelled as a function of net to gross....................................…..87
Figure 4.9: Relative changes in P-wave impedance (Delta IP) relative to the initial
pressure condition as a function of net to gross. Depletion and injection of 10
MPa are modelled..........................................................................................…...88

LIST OF FIGURES
_______________________________________________________________________
_______________________________________________________________________
xvi
Figure 4.10: P-P reflection coefficients corresponding to the interface between the
overburden shale and the heterogeneous reservoir. Depletion and injection of 10
MPa from the initial conditions are modelled as a function of net to gross….....90

_______________________________________________________________________
xvii
LIST OF TABLES
Table 3.1: Laboratory measurements at reservoir effective pressure (5000 psi) of 43
samples extracted over the reservoir interval…………………………….…......41

_______________________________________________________________________
xviii
LIST OF APPENDICES
Appendix A– Papers related with time-lapse (4D) studies………………………...…106

_______________________________________________________________________
1
Chapter 1
INTRODUCTION
1.1 Time-Lapse Seismic Technology
Seismic technology has been used in hydrocarbon exploration for over half a
century. Initially only 2D seismic lines were acquired. Then, from the 1970’s 3D seismic
surveys were introduce to investigate the subsurface in three dimensions. The 3D
seismic data began to be used not only for exploration, but also for characterization of
reservoirs, thus assisting the development of oil and gas fields. 3D seismic usually helps
to optimize reservoir management maximizing economic return from hydrocarbon
fields.
In the 1980s and 1990s substantial progress in seismic technology and computer
power led to the introduction development of 4D or time-lapse technology, in which
repeated seismic (usually 3D) surveys were carried out to monitor changes in and around
the reservoir induced by hydrocarbon production. This technology started to be tested in
the early 1980’s and commercialized in the late 1990’s (Amundsen and Landro, 2007).
Each seismic survey represents a snapshot of reservoir conditions at a certain time. 4D
signals could reveal changes in rock elastic properties due to reservoir production,
assisting in reservoir characterization. The differences between surveys may be
attributed to changes in saturation, pressure, temperature, and other effects.
The benefits of time-lapse monitoring are many and occur in different stages of
the production life of a hydrocarbon field. 4D seismic may assist in locating undrained

Chapter 1 - INTRODUCTION
_______________________________________________________________________
2
areas to be drilled increasing the recovery factor (Anderson et al., 1997), monitoring
pore fluid pressure changes (Jenkins et al., 1997), guiding pressure maintenance
(injection) programs (Staples et al., 2007), monitoring fluid movement (Sonneland et al.,
1997), including CO2, and identifying fault compartmentalization (Weisenborn and
Hague, 2005). The potential benefits go beyond identifying saturation and pressure
changes within the reservoir. Changes in overburden rock strength and subsidence due to
reservoir compaction may also be identified (Tura et al., 2005), and thus help reduce risk
from hazardous effects on wells and facilities.
Time-lapse seismic has become a new practice in monitoring reservoir
production, reducing reservoir uncertainties and identifying additional reserves. Figure
1.1 shows the major technologies used in hydrocarbon exploration and production.
Industry-wide market surveys identify 3D and 4D (time-lapse) seismic technologies as
having a major impact on ultimate recovery and drilling efficiency, providing more
accurate predictions of future reservoir production (Pickering, 2006).

Chapter 1 - INTRODUCTION
_______________________________________________________________________
3
Figure 1.1: Illustration of the most important technologies influencing E&P spending
(Lehman Brother E&P Spending Summary: Most Influential 2006 Technology).
3D / 4D Seismic25%
Fracturing / Stimulation
22%Horizontal Drilling
16%
Directional Drilling9%
Drill Bit Technology8%
Reservoir Recovery Optimization
7%
Intelligent Well Completions
4%
WirelineLogging3%
Under‐BalanceDrilling3%
Measurement While Drilling
2%Deepwater Technology
1%
Expandable Products 0%

Chapter 1 - INTRODUCTION
_______________________________________________________________________
4
Some of the early successful 4D projects, related to monitoring steam injection,
were conducted by Pullin et al. (1987), Eastwood et al. (1994), Lumley (1995a) and
Jenkins et al. (1997). Greaves and Fulp (1987) succeeded in their experiment design and
analysis of a 4D seismic project to monitor a fireflood EOR process. Important projects
related to gas monitoring include a North Sea gas cap expansion project by Johnstad et
al. (1995), a west Texas CO2 injection project by Harris et al. (1996), and a Paris basin
gas storage project by Meunier and Huguet (1998).
Notable investments and interesting results in time-lapse projects occurred in
Norwegian and UK North Sea: Oseberg field (Johnstad et al., 1995; Rutledal et al.,
2003), the Magnus field (Watts et al., 1996), the Gullfaks field (Sonneland et al., 1997;
Veire et al., 1998), the Draugen field (Gabriels et al., 1999), the Statfjord field (Al-
Naijjar et al., 1999), and the Snorre field (Smith et al., 2001). In other regions around the
world there are also many successful studies such as in carbonates in Canada (Hannah et
al., 2005), a gas field (Maui) in New Zealand (Staples et al., 2006), Gulf of Mexico,
USA (Burkhart et al., 2000; Johnston et al., 1999); Oman in Middle East (Waal and
Calvert, 2003) and North West Shelf of Australia (Smith et al., 2007; Smith et al., 2008).
In the last 10-15 years time-lapse seismic has become a proven technology based on
successes around the world.
The vast number of publications demonstrates a keen interest in this technology
by the scientific community and industry. Appendix A shows a list of papers related to
time-lapse (4D) studies prepared in the initial stage of this PhD program. This database
includes all the related pdf format files and has been made available to students and staff
from Curtin University and may be available to anyone else upon request to the author.
These publications show examples of application of 4D technology to clastic and
carbonate fields; thin and thick reservoir; onshore and offshore in different regions.
Successful applications of 4D projects depend on the time-lapse signal strength,
non-repeatable noise, and the complexity of interpreting the signal to be able to make
conclusions about reservoir conditions (Staples et al., 2006). Figure 1.2 shows a maturity

Chapter 1 - INTRODUCTION
_______________________________________________________________________
5
S-curve for different 4D applications. The position on the maturity curve represents a
combination of the signal strength and the complexity of the reservoir conditions. Pore
pressure increase, for instance, sits high in this maturity S-curve, whereas depletion sits
lower. This curve is general and only a general guideline of time-lapse maturity level to
different field conditions. Simple assessments of technical risk of 4D projects have
already been proposed in the literature (Lumley et al., 1997; Lumley et al., 2000).
Following the basics assessments, I suggest performing a full technical feasibility study
considering rock and fluid properties.
Figure 1.2: Maturity S-curve for different 4D applications (adapted from Staples et al.,
2006).

Chapter 1 - INTRODUCTION
_______________________________________________________________________
6
Developments in this technology over the past few years indicate the potential of
obtaining quantitative information rather than only qualitative. This quantitative
approach is highly desirable by the oil industry in order to maximize profits, and is also
important for humankind in terms of making better usage of our non renewable
resources. In order to obtain useful quantitative information from time-lapse seismic
data, however, it is necessary to better understand the seismic response to changes in
rock and fluid properties as discussed in the Section 1.3.
1.2 Time-Lapse Seismic – Market and Economics Aspects
To analyse the value of 4D projects, costs and benefits should be taken into
account. According to a study undertaken by the French Institute of Petroleum for the
period 2000-2003 (Lumley, 2004), the expenditures of contractor and service companies
related to 4D seismic were dominated mainly by North Sea projects (Figure 1.3). These
expenditures include acquisition, processing and interpretation services, and the main
component is acquisition costs. Today, the picture is almost the same (Amundsen and
Landro, 2007). Other important geographical areas are offshore West Africa (Angola
and Nigeria), offshore North America (Gulf of Mexico), and offshore South America
(predominantly Brazil).

________
Figure 1.3
companies
$400 milli
$30 millio
(3%) elsew
and interp
__________
3: Cumulati
s for 2000-
ion (80%) h
on (6%) in N
where. This
retation/ana
__________
ive expendi
2003. Of $
has been sp
North Ame
s estimate o
alysis servic
__________
itures on 4D
$500 million
pent in the N
erica, $20 m
of expenditu
ces (from L
__________
7
D seismic s
n cumulativ
North Sea,
million (4%)
ures is for 4
umley, 200
Chapte
__________
services to
ve 4D servi
$35 million
) in the Far
4D seismic
4).
r 1 - INTRO
__________
contractor
ice expendi
n (7%) in W
r East, and
acquisition,
ODUCTION
__________
and service
tures, abou
West Africa
$15 million
, processing
N
_
e
ut
a,
n
g

Chapter 1 - INTRODUCTION
_______________________________________________________________________
8
In terms of benefits, the economic impact of 4D seismic has been significant,
especially in the North Sea. Open sources, however, estimate the added value of North
Sea 4D to be more than US$ 4 billion, with the added value at Gullfaks alone calculated
to be close to US$ 1 billion. Furthermore, 4D is estimated to have reduced drilling costs
by more than 6%, and contributed to additional reserves averaging 5% per field
(Amundsen and Landro, 2007).
The dominant player in the 4D acquisition market today is StatoilHydro. More
than twenty 4D streamer surveys were acquired during 2006. The other two big players
are BP and Shell. BP has decided to invest strongly in permanently buried sensors for
4D, with installations at the North Sea Valhall field, the Caspian Sea Chiraz field and the
US Clair field. The other main companies are ExxonMobil, ConocoPhillips, Chevron,
Total and Petrobras (Amundsen and Landro, 2007).
1.3 Technical Challenges using Time-Lapse Seismic
Despite several successful 4D projects there are still many challenges related to
time-lapse seismic technology. Applications in hard reservoirs, particularly in
carbonates, often yield a small 4D signal (Waal and Calvert, 2003). Development of new
acquisition technologies to enhance 4D repeatability and signal-to-noise ratio (Landro,
2008; Lumley, 2004), integrate time-lapse seismic data with reservoir engineering
(Oldenziel, 2003) and 4D in thin-bedded clastic reservoirs (Amundsen and Landro,
2007) are also required. The main focus of the research presented in this thesis is related
to another important challenge: quantitative analysis of 4D seismic responses of
producing reservoirs. More specifically, to investigate pressure and saturation effects on
elastic parameters.
The idea of repeating seismic surveys to monitor changes is an old one; however,
the first quantitative data came from rock physics measurements at Stanford University
in the mid 1980’s (Lumley, 2001). These laboratory measurements on heavy-oil

Chapter 1 - INTRODUCTION
_______________________________________________________________________
9
saturated core samples showed large decreases in seismic rock velocity when the viscous
oil was heated (Nur, 1989; Nur et al., 1984; Wang et al., 1990). Despite many studies
investigating the relationships between changes in reservoir (rock and fluid) properties
and seismic response, quantitative interpretation of time-lapse data is still a challenge
and a very important research subject. In this thesis I focus on quantification of both
saturation and pressure effects on rock elastic properties. Usually these are the most
relevant effects on the 4D signal (Calvert, 2005; Eiken and Tondel, 2005; Hatchell and
Bourne, 2005; Tura et al., 2005).
The effect of saturation changes on elastic properties is usually described by
Biot-Gassmann theory of poroelasticity (Biot, 1956a, b; Gassmann, 1951). However, the
validity of this theory on real (in situ) data has not been widely tested and requires
further investigation.
The effect of pressure changes on elastic properties is usually obtained from
ultrasonic measurements on core samples (Nes et al., 2002; Grochau and Gurevich,
2007b, 2008a). Issues such as core damage (Holt et al., 2005; Grochau and Gurevich,
2007a) and velocity dispersion always arise and need to be accounted for in order to
provide reliable pressure-velocity relationship for time-lapse studies. Another approach
to obtain this relationship is from in situ measurements (Furre et al., 2009; Hansen et al.,
2006). A more reliable in situ measurement is provided by logs. In this thesis, feasibility
of obtaining pressure sensitivity of rock properties from both logs and core
measurements is investigated.
To fully understand 4D effects on seismic data, it is appropriate to start from
small scale and move to larger scales. Interpretation of 4D data at a field scale may lead
to ambiguous or even erroneous results when it is not calibrated with other more detailed
data. The reason for this is due to the typical wavelengths of the seismic signals recorded
in surface seismic surveys, which are often too large to separate different rock-fluid
systems. Instead, seismic waves normally average over the heterogeneous systems and
consequently add more unknowns to the inverse problem for each system.

Chapter 1 - INTRODUCTION
_______________________________________________________________________
10
Consequently, another technological challenge is to characterize thin
stratification to help 4D interpretation. Moreover, this thin stratification and its
combined seismic response should be understood both inside and in the surrounding of a
reservoir. Small scale shales in clastic reservoirs may affect 4D seismic response during
production and depletion. Fine layers with distinct elastic properties may impact the
time-lapse response as well.
1.4 Aim of the Research
The main objective of this PhD thesis is to investigate saturation and pressure
effects on elastic properties of rocks. These effects are commonly the most important
ones in a time-lapse study.
Although it is possible to assess theoretically the validity of each of the
assumptions and the impact of their violations on the predictions of Gassmann
equations, they can ultimately be validated by in situ testing in real geological
environments. One of the goals of this research is to verify the adequacy of Gassmann
fluid substitution to the properties of in situ rocks.
Regarding the stress sensitivities of elastic parameters, they can be obtained from
laboratory and from in situ measurements. Stress sensitivity of elastic properties as
obtained from ultrasonic measurements can be affected, among other effects, by core
damage. Velocity-pressure relationship can also be obtained from in situ measurements
using well data. Another aim of this research is to investigate the reliability and
limitations of obtaining this relationship from laboratory and from well data (in situ).
Considering the potential impact of thin stratification on 4D interpretation,
another objective of this research is improve its characterization. This research proposes
to use X-ray CT scan combined with ultrasonic and log measurements to better
understand reservoir and overburden rocks, which may contribute to modelling and
interpretation of 4D seismic data. The spatial resolution provided by the standard data

Chapter 1 - INTRODUCTION
_______________________________________________________________________
11
type (seismic and logs) may not be enough to fully capture and understand small scale
geologic variations. Taking into consideration that typical Brazilian offshore clastic
reservoirs contain small scale shales and considering the importance of 4D studies in this
region, I also aim to investigate the combined seismic response of sandstone – shale due
to pressure variation in a sandstone reservoir.
Meticulous analysis of time-lapse effects on different scales and a variety of
tools provide better understanding and higher confidence for time-lapse interpretations.
Development of new workflows and tests using real data increases the robustness of 4D
interpretation and validate theoretical research towards a consistent application for field
scale 4D studies.
1.5 Thesis Configuration
This thesis is composed of five chapters. After this introductory chapter, Chapter
2 provides some background regarding fluid effects on elastic properties. The effect of
saturation changes on elastic properties is properly described by Gassmann (1951)
theory. Despite being widely used to predict and interpret fluid changes, the validity of
Gassmann theory in a real environment is not always evident since assumptions and
limitations of this theory are often violated when considering real geology. After
providing background information on Gassmann equations and assumptions, I present
and apply a workflow to test the adequacy of this theory to a real environment.
Chapter 3 presents pressure effects on elastic parameters. Firstly, the velocity
dependence on stress is obtained from core measurements. Core damage, velocity
dispersion and under-representation of cores are discussed. I investigate the magnitude
of core damage on compressional-wave velocities by comparing laboratory experiments
and log measurements. All the experiments and results related to this approach are
shown in this chapter. Secondly, the velocity dependence on stress is obtained from well
data. In this in situ approach I present cross plots of velocity, confining stress and

Chapter 1 - INTRODUCTION
_______________________________________________________________________
12
porosity obtained from well logs and RFT (Repeated Formation Tester) data. Finally, the
limitations of this approach for application in a real and complex environment are
discussed.
The characterization of thin stratification and its impact on time-lapse response is
discussed in Chapter 4. I use X-ray CT to obtain detailed information from small scale
geologic variations, which were not fully captured using logs. Besides providing
climatic insights and potentially assist accurate stratigraphic correlation, this high
resolution technique may help to model and interpret time-lapse effects in the reservoir
overburden rocks. The effect of the combined seismic response of shales inside
sandstone during depletion and injection of a given reservoir is also discussed in this
chapter.
In Chapter 5, I discuss the conclusions drawn from this research, the possible
applicability of the results and make recommendations regarding directions of future
research.
______________________________________________________________________
13
CHAPTER 2
FLUID EFFECTS ON ELASTIC
PROPERTIES
One of the main aims for hydrocarbon reservoir management is to better map the
fluid distribution during the production process. The development design is based on the
a priori reservoir model, which initially has high uncertainty due to insufficient
information about geometry and properties of the reservoir. The use of time-lapse (4D)
seismic to monitor fluid distribution may allow optimization of the production layout
and increase the recovery factor.
Time-lapse seismic requires understanding of the change of elastic wave
velocities due to changes in fluid saturation. The elastic properties of a saturated rock are
often predicted using Gassmann’s equations (Gassmann, 1951; Landro, 2001).
Gassmann fluid substitution has been used for various purposes: e. g. time-lapse effect
prediction and mud filtrate corrections (Walls and Carr, 2001).
Gassmann theory is based on a number of assumptions. Although it is possible to
assess theoretically the validity of each of these assumptions (Brown and Koringa, 1975;
Wang, 2000; Artola and Alvarado, 2006) and the impact of their violations on the
predictions of Gassmann equations, they can only, ultimately, be validated by in situ
testing in real geological environments. According to Wang (2000), the rock-fluid
system is so complicated that virtually all the theories for such a system have to make
major assumptions in order to simplify the mathematics. Considering the above
mentioned complexity, more studies testing Gassmann theory in real oil fields are
important, particularly in South America where there are no or only a few in situ studies.

Chapter 2 – FLUID EFFECTS ON ELASTIC PROPERTIES
_______________________________________________________________________
14
In this chapter, I present a brief theoretical background about elastic moduli of
materials as well as Gassmann theory and its assumption. Subsequently I describe a
workflow proposed to apply its equations and to test the underlying assumptions of this
theory. The strategy is to compare saturated P-wave moduli computed from dry core
measurements against those obtained from sonic and density logs.
2.1 Theoretical Background
2.1.1 Elastic moduli
According to Sheriff and Geldart (1995), elasticity deals with deformations that
vanish entirely upon removal of the stresses that cause them. For small deformations,
Hooke’s law holds and strain is proportional to stress. The stress-strain properties of
materials that obey Hooke’s law are specified by elastic moduli. The relationship
between stress and strain can be expressed by the elasticity tensor. In a general
anisotropic media this tensor has up to 21 independent constants. In this research I
consider isotropic media; therefore there are only two independent elastic constants.
The stress-strain ratio under hydrostatic pressure is given by the bulk modulus
( K ), and expresses the ratio of pressure change to relative volume strain ( V VΔ )
PKV VΔ
=Δ
, (2.1)
where PΔ is the pressure change, V is the initial volume and VΔ is the volume change.
The stress-strain ratio for single shear is given by the shear modulus, rigidity
modulus or Lame’s constant ( μ )
F AL L
μ Δ=Δ
, (2.2)

Chapter 2 – FLUID EFFECTS ON ELASTIC PROPERTIES
_______________________________________________________________________
15
where FΔ is the shearing (tangential) force, A is the cross-sectional area, L is the
distance between shear planes and LΔ is the shear displacement.
2.1.2 Gassmann theory and assumptions
Gassmann’s fluid-substitution relation is commonly applied to predict the bulk
modulus, and the expected changes in velocities, for rocks saturated with different fluids
(Mavko et al. 1998). The saturated bulk modulus satK is computed using the Gassmann
equation (Gassmann, 1951):
2
min
2min min
1
1( )
dry
sat drydry
fluid
KK
K K KK K Kφ φ
⎛ ⎞−⎜ ⎟
⎝ ⎠= +−
+ −, (2.3)
where
( )2 24 3dry dry Pdry SdryK V Vρ= − (2.4)
is the bulk modulus of the frame or dry rock, minK is the effective modulus of the solid
mineral grains, fluidK is the effective modulus of the saturating fluid, φ is the porosity,
dryρ is the density of the dry sample, PdryV and SdryV are the compressional and shear
wave velocities measured in a dry sample.
Gassmann equations can also be expressed as follows:
( )min min min
dry fluidsat
sat dry fluid
K KKK K K K K Kφ
= +− − −
. (2.5)
Gassmann equation allows transforming the bulk modulus from one fluid to
another and calculating the expected change in velocities as a result of a change in pore
fluid (Mavko et al., 1998):
Chapter 2 – FLUID EFFECTS ON ELASTIC PROPERTIES
_______________________________________________________________________
16
( ) ( )2 12 1
min 2 min 1min 2 min 1
fluid fluidsat sat
sat satfluid fluid
K KK KK K K KK K K Kφ φ
− = −− −− −
. (2.6)
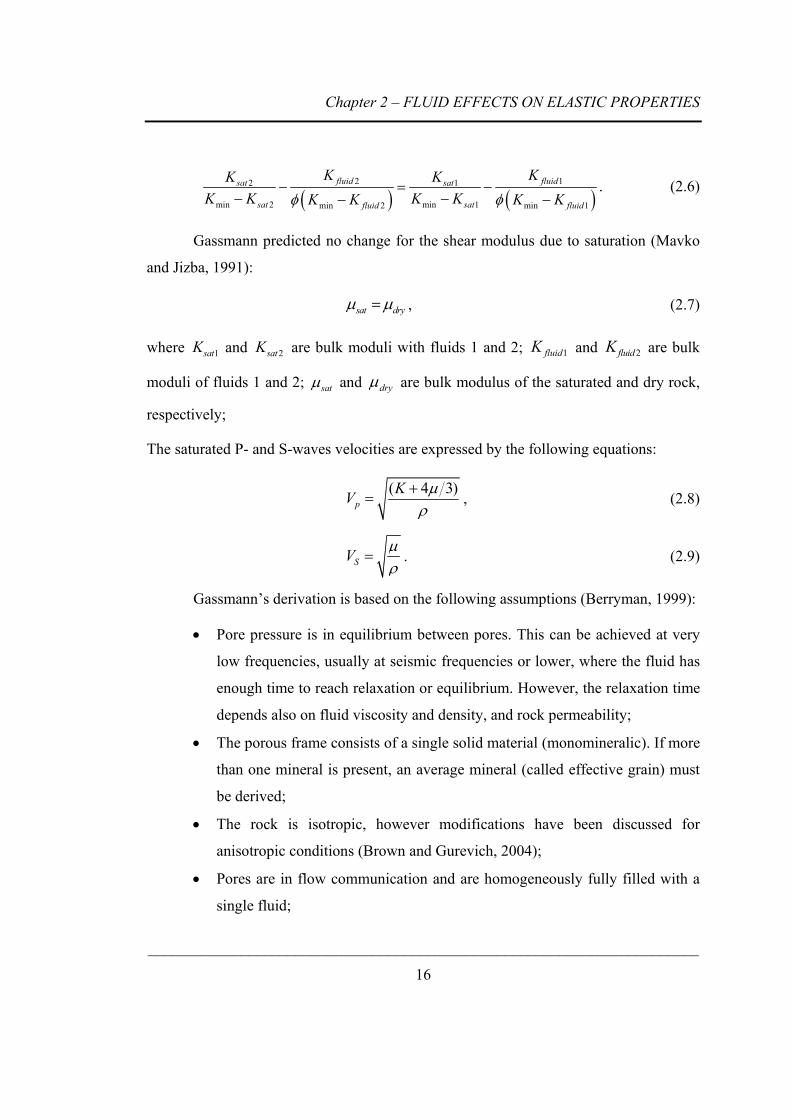
Gassmann predicted no change for the shear modulus due to saturation (Mavko
and Jizba, 1991):
sat dryμ μ= , (2.7)
where 1satK and 2satK are bulk moduli with fluids 1 and 2; 1fluidK and 2fluidK are bulk
moduli of fluids 1 and 2; satμ and dryμ are bulk modulus of the saturated and dry rock,
respectively;
The saturated P- and S-waves velocities are expressed by the following equations:
( 4 3)p
KV μρ
+= , (2.8)
SV μρ
= . (2.9)
Gassmann’s derivation is based on the following assumptions (Berryman, 1999):
• Pore pressure is in equilibrium between pores. This can be achieved at very
low frequencies, usually at seismic frequencies or lower, where the fluid has
enough time to reach relaxation or equilibrium. However, the relaxation time
depends also on fluid viscosity and density, and rock permeability;
• The porous frame consists of a single solid material (monomineralic). If more
than one mineral is present, an average mineral (called effective grain) must
be derived;
• The rock is isotropic, however modifications have been discussed for
anisotropic conditions (Brown and Gurevich, 2004);
• Pores are in flow communication and are homogeneously fully filled with a
single fluid;

Chapter 2 – FLUID EFFECTS ON ELASTIC PROPERTIES
_______________________________________________________________________
17
• The system is closed undrained;
• The pore fluid does not chemically influence the solid frame.
2.2 Testing Gassmann Fluid Substitution: Sonic Logs versus
Ultrasonic Measurements
In this section, I present a workflow to test Gassmann fluid substitution in a real
geological environment. The most obvious way to test the adequacy of Gassmann fluid
substitution to the properties of the in situ rocks is to use repeated velocity
measurements before and after fluid saturation changes in the reservoir. However such
testing is not easy because time-lapse seismic lacks resolution while time-lapse sonic
logs are seldom available. Gommesen et al. (2007) presented an analysis of the
Gassmann prediction that was restricted to well log data.
One other option is to use dry velocities measured in the lab, perform Gassmann
fluid substitution and compare the result with in situ sonic velocities (Mavko and
Mukerji, 1998). This can be done in almost any well where sonic logs of good quality
and ultrasonic measurements on cores are available. However, such testing also presents
certain challenges, as the Gassmann fluid substitution effect on sonic velocities may be
obscured by scale effects (well log measurements represent much larger volume than the
core measurements). A way to overcome these effects is to use a large number of
samples and apply statistical analysis to discern the deterministic effect from the random
variability. A simple workflow (Figure 2.1) aimed at such analysis is proposed and
tested on 43 samples taken from a 45 m turbidite reservoir from the Campos Basin,
offshore Brazil.

________
Figure 2.
substitutio
__________
1: Workflo
on.
Cha
__________
ow used fo
apter 2 – FL
__________
or preparing
LUID EFFE
__________
18
g the data
ECTS ON EL
__________
and for te
ELASTIC PR
__________
esting Gass
ROPERTIES
__________
smann fluid
S
_
d

Chapter 2 – FLUID EFFECTS ON ELASTIC PROPERTIES
_______________________________________________________________________
19
2.2.1 Core extraction and sampling
The well logs and cores analysed were obtained in the south portion of Campos
Basin, around 100 km off the coast of Rio de Janeiro (south eastern Brazil), in a water
depth of approximately 700 meters. In this basin there are more than 40 oil fields of
different ages, representing a variety of reservoir properties (Figure 2.2). Each field and
each reservoir has its own characteristics in terms of lithology, grain size, and
cementation.
The first step is to ensure that the cores are extracted from a representative
reservoir interval. For this study I use cores extracted continuously from a 45 m interval
within and close to the reservoir zone from an oil field. The reservoir is composed of
sandstone from turbidites deposited in the Cretaceous Period. Special care is required to
ensure that the cores are not subject to significant damage during the drilling and
extraction processes (Nes et al., 2002). As soon as samples are extracted, it is usual to
follow these procedures. Cores are freezing by putting it in an ice container. After that, a
small piece of the core is immersed in liquid nitrogen and the frozen rock is cored in a
cylinder sample (plug). The plug is jacketed with a tin sleeve with screens at the faces of
the cylinder in order to allow the measurement of porosity and permeability.

Chapter 2 – FLUID EFFECTS ON ELASTIC PROPERTIES
_______________________________________________________________________
20
Figure 2.2: Map of the Campos Basin oilfields showing the location and age of the main
reservoirs (Bruhn et al., 2003).

Chapter 2 – FLUID EFFECTS ON ELASTIC PROPERTIES
_______________________________________________________________________
21
2.2.2 Ultrasonic core measurements
Ultrasonic measurements need to be performed on dry samples to exclude (or
minimize) the effect of dispersion (Winkler, 1986), which can affect ultrasonic
velocities. To this end 43 samples were extracted over a 45m thick reservoir and were
dried under room-temperature conditions. The ultrasonic measurements were performed
by positioning samples between two pairs of piezoelectric transducers (for P and S-
waves) and immersed in a pressure chamber with hydraulic oil. The confining pressure
was varied between 1000 and 6000 psi. A sinusoidal pulse with the central frequency
500 kHz was propagated through the sample and for each step of pressure increment
velocities were determined (courtesy of J.E. Lira, A. Sobrinho and J. Pinheiro,
Petrobras).
2.2.3 Estimation of reservoir effective pressure
In order to make an adequate comparison between log and lab data, both log and
laboratory velocities need to be taken at the same effective pressure. Since in situ
pressure is fixed we need to ensure that lab velocity is taken at the reservoir pressure.
The effective pressure effecP can be estimated from the lithostatic pressure and pore
pressure using the equation
( )effec w r w porP Ah B h h Pη= + − − , (2.10)
where η is the effective stress coefficient, porP is the pore pressure, A and B are ocean
water and lithostatic pressure gradients, wh and rh are water and reservoir depths,
respectively. Pore pressure was obtained from well RFT (Repeat Formation Tester)
measurements, which were made at the time when logs were acquired, and provided
constant values over the reservoir interval. The effective stress coefficient η for
velocities was assumed to be 1. The resulting value of effective pressure was taken to be
34.5 MPa (5000 psi) for the interval under investigation.

Chapter 2 – FLUID EFFECTS ON ELASTIC PROPERTIES
_______________________________________________________________________
22
Formation testing is the final evaluation step before the well is put into
production and provides essential information to design the well completion and
production facilities. Among the applications of RFT are static pressure measurement
and depletion determination, determination of reservoir fluid contacts and fluid density
from gradients, and reservoir permeability (Schlumberger, Fundamentals of Formation
Testing, internal report).
2.2.4 Quality control
Tests of Gassmann fluid substitution should be performed on porous rocks and
should exclude low porosity and low permeability intervals where full draining of the
core samples is not technically possible. Kahraman (2007) shows that P-wave velocities,
estimated by applying the Gassmann equations, can widely differ from measured ones
for rocks with very low porosities. Furthermore, it seems reasonable to exclude the cores
extracted from strongly heterogeneous zones, since these are impossible to sample
adequately with a few core measurements. For instance, the reservoir interval from the
Campos Basin contains very thin low-porosity and high-velocity layers (concretions),
which are under-sampled (smoothed over) by both porosity and sonic logs. At the same
time, core samples can be taken either from concretions or from the surrounding sand. In
both cases this may result in large discrepancies between log and core porosities. Such
samples can be excluded from the test by comparing the core porosity against the total
porosity from the well log. Figure 2.3 shows log and core porosities versus depth, and
we can see that for 27 out of 43 samples the agreement between laboratory and log
porosity is very good (discrepancy is within 0.03). Log porosities are systematically
higher than core porosities. This difference may be caused by the presence of fractures
in the vicinity of the well. Regarding the quality of log measurements, the caliper log
shows integrity of the borehole over the interval under study.

Chapter 2 – FLUID EFFECTS ON ELASTIC PROPERTIES
_______________________________________________________________________
23
Figure 2.3: Porosity from log and cores showing the samples (blue) that meet the quality
control criteria (discrepancy is within 0.03).

Chapter 2 – FLUID EFFECTS ON ELASTIC PROPERTIES
_______________________________________________________________________
24
2.2.5 Gassmann fluid substitution to calculate elastic moduli
The most direct way to estimate the validity of Gassmann fluid substitution is to
compare dry and saturated (obtained using Gassmann equation) bulk moduli dryK , satK
against the bulk moduli obtained from sonic log data logK . However, to compute these
moduli, the knowledge of both P and S velocities is required. If S-wave velocities are not
available, the comparison can be made of dry and saturated P-wave core velocities PdryV ,
PsatV or P wave moduli 2dry dry PdryM Vρ= , 4 / 3sat satM K μ= + , against sonic velocity logPV
or P wave modulus 2log log logPM Vρ= , respectively. The use of P wave moduli is
preferable to the use of velocities, as the effect of fluid substitution on velocities can be
partially offset by the density effects, which increase relative errors and make precise
comparison more difficult. The saturated bulk modulus satK is computed using
Gassmann (equation (2.3)). If the saturation log is available, fluid modulus can be
computed using Wood’s equation (Mavko and Jizba, 1991):
1 (1 )fluid w o w wK S K S K= − + , (2.11)
where wS is water saturation, oK and wK are the bulk moduli of the oil and water
phases. The fluid substitution was performed using two-phase system: water and oil. The
water saturation was taken directly from saturation log (Figure 2.4) at each core sample
position.
2.2.6 Statistical analysis and results
The results of the workflow described above for the well data analysed are shown in
Figures 2.5 and 2.6. Figure 2.5 shows the dry and saturated P-wave moduli dryM and
satM computed from laboratory data as well as the logM obtained from the sonic log.
These moduli are plotted against core porosity. We see that the differences between dry

Chapter 2 – FLUID EFFECTS ON ELASTIC PROPERTIES
_______________________________________________________________________
25
and saturated moduli for the same samples are of the same order of magnitude as
variation of velocities for a given porosity, or the average error between moduli obtained
from laboratory and log data. This demonstrates that we cannot obtain a reliable
conclusion about validity of fluid substitution from comparison of individual data points.
Figure 2.4: Water saturation log showing the water content in this interval,
predominantly lower than 10% (the other phase is oil).

Chapter 2 – FLUID EFFECTS ON ELASTIC PROPERTIES
_______________________________________________________________________
26
Figure 2.5: P-wave modulus computed from ultrasonic dry measurements (red symbols);
the saturated modulus computed from dry core measurements using Gassmann equation
(blue symbols); and obtained from sonic and density logs (black symbols). Lines are
power-law regressions for each dataset.

Chapter 2 – FLUID EFFECTS ON ELASTIC PROPERTIES
_______________________________________________________________________
27
However when we look at the regression trends of modulus vs. porosity, we can
see that there is a systematic difference between dry laboratory moduli (magenta line)
and sonic log moduli (black line), which is almost completely eliminated by Gassmann
fluid substitution (blue line).
To perform a more quantitative statistical analysis Figure 2.6 shows the
histograms of the difference between computed P-wave moduli from log and dry
measurements (brown) and from logs and Gassmann saturated moduli (blue). The
average difference between sonic log and dry lab moduli is 2.47 GPa, but reduces to
0.23 after fluid substitution. We also see that this shift is of the same order of magnitude
as the standard deviation (width of each distribution), but the difference log dryM M− is
centred around 2.47 GPa while log satM M− is centred very close to zero (0.23 GPa).
We observe a very good match between P-wave moduli numerically saturated
from cores and from logs. The results suggest the adequacy of Gassmann theory (despite
all assumptions and limitations) in this particular reservoir interval.
2.3 Discussion and Conclusions
In this research I have developed a workflow to test Gassmann fluid substitution
by comparing saturated P-wave moduli computed from dry core measurements against
those obtained from sonic and density logs. The workflow has been tested on 43 samples
taken from a 45 m turbidite reservoir in the Campos Basin, offshore Brazil. The results
show good statistical agreement between the P-wave elastic moduli computed from
cores using Gassmann equation with the corresponding moduli computed from log data.
This confirms that all the assumptions of the Gassmann equations are adequate within
the measurement error and natural variability of elastic properties.

Chapter 2 – FLUID EFFECTS ON ELASTIC PROPERTIES
_______________________________________________________________________
28
These results provide further justification for using the Gassmann theory to
interpret time-lapse effects in this sandstone reservoir and in similar geological
formations.

Chapter 2 – FLUID EFFECTS ON ELASTIC PROPERTIES
_______________________________________________________________________
29
Figure 2.6: Differences between P-wave elastic moduli computed from logs and
ultrasonic dry core measurements (red) and between logs and saturated cores (computed
from dry cores using Gassmann equation) (blue). In (a) both curves are plotted against
depth whereas in (b) the histograms of differences are plotted.
(a)
(b)

_______________________________________________________________________
30
Chapter 3
PRESSURE EFFECTS ON ELASTIC
PROPERTIES
In order to develop hydrocarbon fields it is important to understand production
effects on repeated seismic data. The main production related effects on seismic
properties of rocks are caused by changes in saturation and pore pressure. Saturation
effects have been considered in Chapter 2. In this chapter I examine the effects caused
by the changes in pore pressure.
It is well known that pore pressure can have a significant impact on the seismic
response (Lumley, 1995b). Pressure depletion as a result of oil and gas production
causes increase in elastic moduli of the rock, and creates changes in the stress and strain
fields of the rock material both inside and outside the reservoir (Hatchell and Bourne,
2005). Pressure increase due to injection is even more pronounced due to asymmetry in
the time-lapse response (Sayers, 2007). Therefore, to correctly interpret time-lapse (4D)
seismic, the impact of pressure changes on rock physics properties should be studied.
Moreover, quantitative interpretation of time-lapse data will require knowledge of
quantitative pressure-velocity relationships.
In this chapter the pressure – velocity dependence is analysed from two different
perspectives. First, I analyse the reliability of this relationship as obtained from cores.
Core damage, under representation and dispersion are issues which may affect stress
sensitivity of elastic properties as obtained from ultrasonic measurements. Second, this
relationship is investigated using in situ measurements from logs and pressure derived

Chapter 3 - PRESSURE EFFECTS ON ELASTIC PROPERTIES
_______________________________________________________________________
31
from repeated formation tester (RFT) data. The advantages and limitations of using each
of these approaches are discussed.
3.1 Stress Sensitivity from Ultrasonic Measurements (Cores)
Analysis of pressure changes from time-lapse seismic data requires the
knowledge of the effect of pressure on elastic properties of rocks, and this effect is
usually studied by ultrasonic measurements on core samples at different pressures.
However, laboratory measurements, mainly pressure effect on seismic velocities, may
not be representative of the in situ formation and could cause misinterpretation of time-
lapse effects. One reason for this is core damage. Cores may be irreversibly damaged
during the drilling and extraction processes, inducing the creation of cracks and
consequently increasing stress sensitivity.
Several studies have investigated core damage as a result of the stress release
during the drill out. Holt et al. (2000), using synthetic rocks manufactured under stress,
measured material properties in virgin conditions and compared these to properties of
cores that have been unloaded to simulate coring and subsequently reloaded to in situ
conditions. Nes et al. (2002) used synthetic sandstones formed under stress to
systematically study stress release, which in turn induces core-damage effects.
The validity of acoustic core measurements can be assessed by comparing them
to in situ measurements. Perhaps the most reliable in situ measurements of elastic
properties of rocks are provided by the sonic log. In this section I assess the adequacy of
ultrasonic measurements on core samples by comparing measured ultrasonic velocities
at reservoir pressures with sonic-log data from a well in an oil field in Campos Basin,
offshore Brazil. The well was chosen because of an unusually large number of core
sample measurements; 43 samples of sandstone were available from 45 m of the
turbidite reservoir, providing a relatively good representation of reservoir properties.

Chapter 3 - PRESSURE EFFECTS ON ELASTIC PROPERTIES
_______________________________________________________________________
32
Measurements of ultrasonic P- and S-wave velocities as functions of confining
pressure were performed on these samples under room-dry conditions. The Gassmann
equation was then applied to compute the properties of the saturated samples (Mavko et
al., 1998), which is expected to give the static limit of the elastic properties. By using
dry measurements, we can reduce the effects associated with the dispersion between
sonic and ultrasonic frequencies; such dispersion can be large for fluid-saturated samples
(Mavko and Jizba, 1991; Batzle et al., 2006). Still, a difference may occur because of
dispersion between low-frequency (Gassmann) velocities and sonic-log velocities
measured at the kilohertz frequency range.
By mitigating the effect of dispersion, we can focus on the effect of core damage.
To assess the magnitude of this effect, I compare the saturated low-frequency elastic-
wave velocities at reservoir conditions (computed from the laboratory measurements)
with sonic log data recorded in the well.
3.1.1 Description of field data
The dataset analysed was obtained from a hydrocarbon field in the Campos
Basin, Brazil. The reservoir pressure has undergone changes during the life of the field.
Close to the water injection wells, pore pressure can increase significantly; in other
wells, it could decrease because of depletion, resulting in higher effective pressure.
Considering the vast range of reservoir properties and the lateral variation of effective
pressure within the reservoir (3000 to 6000 psi), local and specific petrophysical studies
should be done to guide 4D interpretations.
The reservoir is made up of gravel-to-sand-rich lobes from confined turbidites related to
a Santonian / Campanian marine transgressive megasequence. The reservoir is
composed of an amalgamation of six turbidite events with thickness ranging between 2.5
– 14.5 m each, and with grain size ranging from sand conglomerate at the base to
medium/coarse sandstone at the top.
Chapter 3 - PRESSURE EFFECTS ON ELASTIC PROPERTIES
_______________________________________________________________________
33
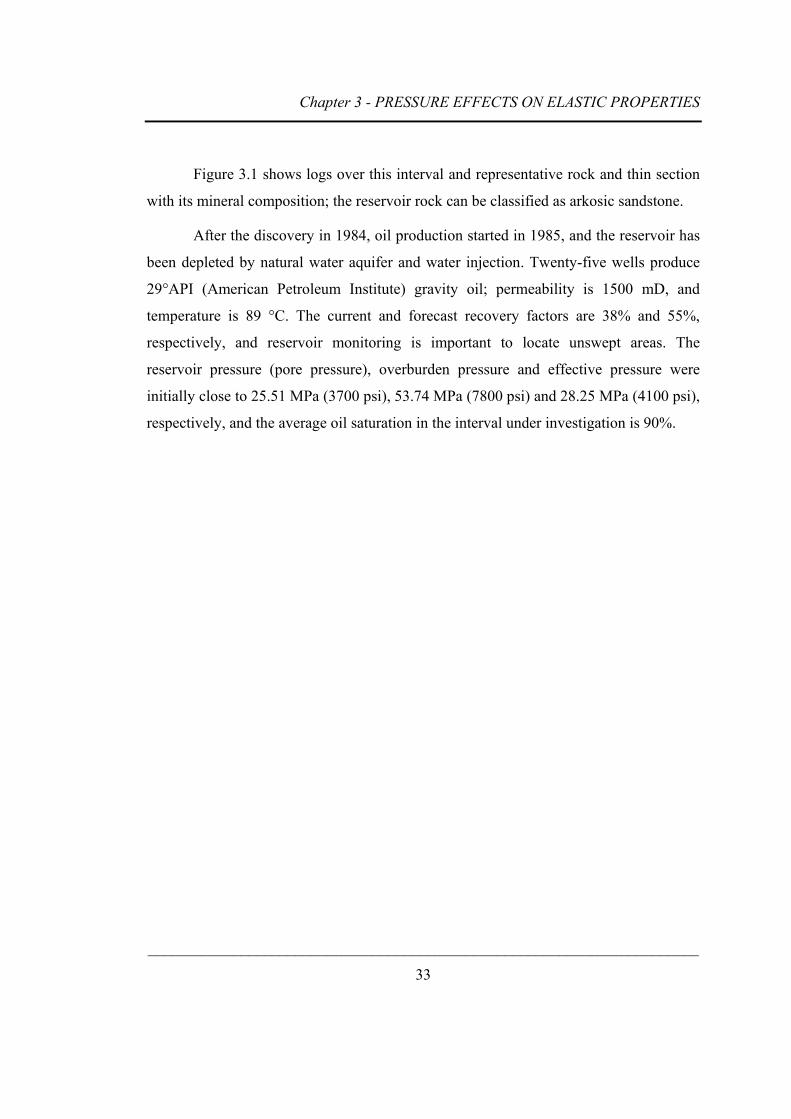
Figure 3.1 shows logs over this interval and representative rock and thin section
with its mineral composition; the reservoir rock can be classified as arkosic sandstone.
After the discovery in 1984, oil production started in 1985, and the reservoir has
been depleted by natural water aquifer and water injection. Twenty-five wells produce
29°API (American Petroleum Institute) gravity oil; permeability is 1500 mD, and
temperature is 89 °C. The current and forecast recovery factors are 38% and 55%,
respectively, and reservoir monitoring is important to locate unswept areas. The
reservoir pressure (pore pressure), overburden pressure and effective pressure were
initially close to 25.51 MPa (3700 psi), 53.74 MPa (7800 psi) and 28.25 MPa (4100 psi),
respectively, and the average oil saturation in the interval under investigation is 90%.

Chapter 3 - PRESSURE EFFECTS ON ELASTIC PROPERTIES
_______________________________________________________________________
34
Figure 3.1: (a) Gamma-ray, water saturation, P-wave velocity, porosity and density from
the studied well; (b) coarse sandstone representative of confined turbidites present in this
field in Campos Basin; (c) representative thin section from the analysed reservoir with
mineralogic composition (quartz, 39.5%; feldspar, 25.5%; rock fragments, 10.5%; other
minerals (biotite/grenade), 1.5%; cement, 0.5%; and porosity, 22.5%).

Chapter 3 - PRESSURE EFFECTS ON ELASTIC PROPERTIES
_______________________________________________________________________
35
3.1.2 Methodology
The main objective of this study is to test the adequacy of using ultrasonic
measurements on core samples for quantitative interpretation of time-lapse seismic data.
This strategy can be compromised by the following factors.
Under-representation
Core samples are small, and core extraction is usually extremely sparse
compared to the volume of rock sampled by seismic waves. Furthermore, cores are more
easily taken from well-consolidated intervals, whereas more friable samples may fall
apart. Thus, core samples may not be representative of the entire formation interval.
Dispersion
Core measurements are usually performed at ultrasonic frequencies (0.25 –
1 MHz) and may not be representative of the properties at seismic frequencies (10 –
100 Hz) or at log frequencies (10 – 20 KHz) because of dispersion (variation of elastic-
wave velocity with frequency).
Core damage
Cores may be irreversibly damaged during the drilling and extraction processes.
Specifically, these processes can create cracks and damage cement and grain contacts,
that increase the stress sensitivity of the cores as compared to the intact formation (Holt
et al., 2000; Holt et al., 2005).
Figures 3.2 and 3.3 illustrates these three factors.

Chapter 3 - PRESSURE EFFECTS ON ELASTIC PROPERTIES
_______________________________________________________________________
36
Figure 3.2: (a) Under-representativeness: cores are small and sparse compared with rock
sampled by logs and by seismic; (b) dispersion: schematic relation among elastic moduli
(or velocity) and frequency and fluid mobility. At low mobility, pore pressure remains
unrelaxed, even at seismic frequencies. Hence, for low-permeability shales, even seismic
frequencies are unrelaxed or ultrasonic. Only the more permeable rocks can be
unrelaxed and remain in the low-frequency domain. (Batzle, 2006).

Chapter 3 - PRESSURE EFFECTS ON ELASTIC PROPERTIES
_______________________________________________________________________
37
Figure 3.3: X-Ray CT images show cracks that typify core damage in plugs.

Chapter 3 - PRESSURE EFFECTS ON ELASTIC PROPERTIES
_______________________________________________________________________
38
The proposed methodology to assess the adequacy of ultrasonic measurements to
the properties of the intact rock and to test the significance of these factors consists of
seven steps:
1) Extract as many cores as possible along the reservoir interval;
2) Perform ultrasonic measurements on dry cores, obtaining the relationship
between stress and velocities;
3) Estimate effective pressure at the reservoir level, taking into account pore
pressure and overburden pressure;
4) Estimate properties of fluid and dry rock at the reservoir conditions;
5) Apply Gassmann equation to compute saturated velocities from the dry
ultrasonic measurements at the reservoir effective pressure;
6) Perform quality control to discard some samples where the vertical variations
in rock properties could not be sampled adequately by either logs or cores
(resolution problems);
7) Compare the calculated saturated velocities with sonic-log measurements.
Key elements of this approach are discussed below.
Log and core measurements
Gamma-ray, saturation, sonic (velocity), porosity, and density logs were available in the
reservoir zone (Figure 3.1). Cores were extracted continuously from 49.5 m of rocks in
and close to the reservoir zone. Core measurements were performed by positioning dry
cylindrical samples (3.8 cm in diameter) between two pairs of piezoelectric transducers
(for P- and S-waves). Cores were oriented vertically within the core holder, and all were
immersed together in a pressure chamber with hydraulic oil (Figure 3.4). The confining
pressure was increased up to 41.37 MPa (6000 psi) in 3.45 MPa steps (500 psi) from

Chapter 3 - PRESSURE EFFECTS ON ELASTIC PROPERTIES
_______________________________________________________________________
39
3.45 up to 20.68 MPa (3000 psi), then with 6.89 MPa steps (1000 psi). A period of a
sinusoidal pulse with 500 kHz central frequency was propagated through the sample. For
each step of pressure increment, velocities were determined from the traveltime and
length of each sample (J. E. Lira, A. Sobrinho, and J. Pinheiro, personal communication,
2007). I focus on P-wave velocities, but S-wave velocities were also used to compute
dry bulk modulus. The measured data are given in Table 3.1.
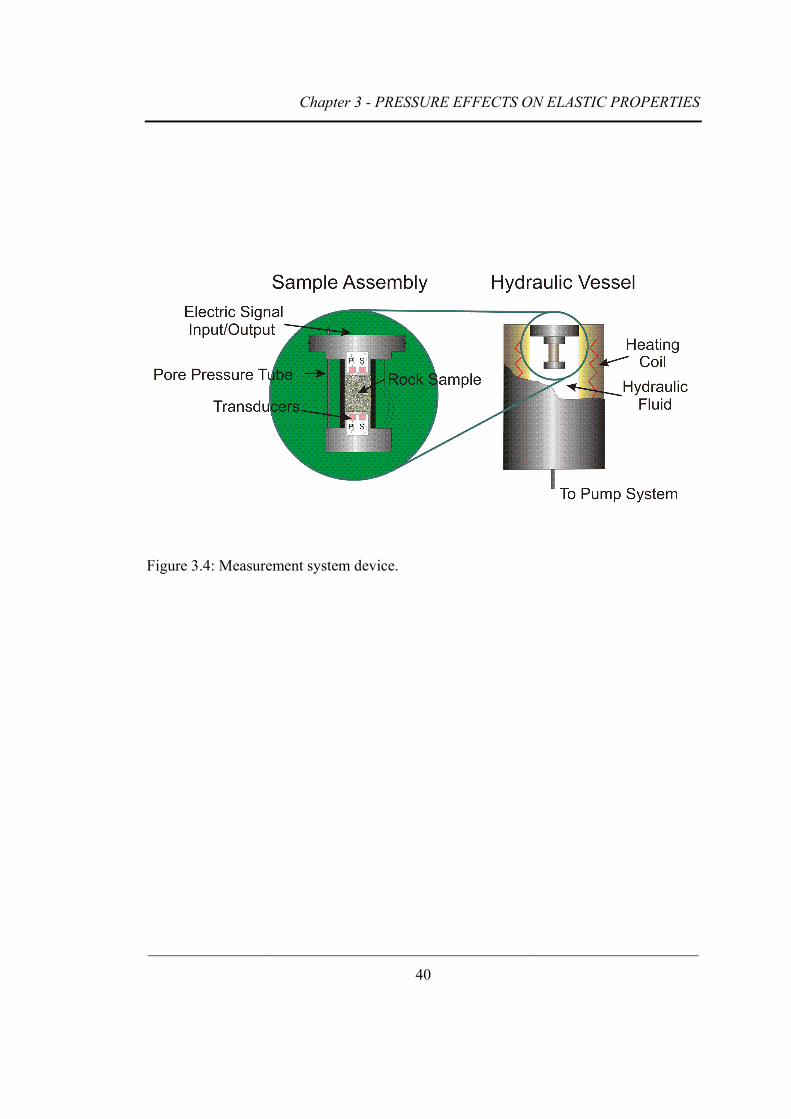
Chapter 3 - PRESSURE EFFECTS ON ELASTIC PROPERTIES
_______________________________________________________________________
40
Figure 3.4: Measurement system device.

Chapter 3 - PRESSURE EFFECTS ON ELASTIC PROPERTIES
_______________________________________________________________________
41
Table 3.1: Laboratory measurements at reservoir effective pressure (5000 psi) of 43
samples extracted over the reservoir interval.
Sample Depth (m)
Vp (m/s)
Vs (m/s)
Density mineral (kg/m3)
Porosity (fraction)
1 3053.65 3060 1818 2680 0.261 2 3054.70 3084 1861 2670 0.249 3 3055.70 3089 1923 2080 0.249 4 3056.70 3182 1924 2680 0.238 5 3058.70 3297 1936 2690 0.221 6 3059.70 3381 2050 2690 0.210 7 3062.25 5974 3334 2710 0.031 8 3063.30 3854 2075 2700 0.191 9 3064.30 3095 1892 2700 0.265
10 3065.25 3136 1886 2700 0.227 11 3066.15 3250 1964 2690 0.228 12 3067.10 3277 1991 2700 0.231 13 3068.20 3196 1966 2700 0.232 14 3069.25 3331 1982 2690 0.201 15 3070.45 3603 2085 2690 0.197 16 3071.20 3377 2057 2700 0.204 17 3072.25 3306 2057 2690 0.218 18 3073.60 3444 2113 2690 0.204 19 3074.25 3477 2175 2690 0.203 20 3075.05 3437 2110 2700 0.219 21 3075.90 3492 2114 2700 0.200 22 3076.80 3355 2047 2700 0.224 23 3077.70 3469 1949 2630 0.198 24 3078.80 4159 2176 2650 0.195 25 3079.45 5268 3276 2720 0.010 26 3080.35 3905 2131 2780 0.199 27 3081.25 3742 2164 2680 0.194 28 3082.10 3364 2085 2690 0.215 29 3083.00 3482 2134 2710 0.220 30 3083.85 3499 2139 2690 0.212 31 3084.65 3409 2072 2700 0.216 32 3085.90 3441 2108 2690 0.208 33 3086.80 2783 1551 2690 0.200

Chapter 3 - PRESSURE EFFECTS ON ELASTIC PROPERTIES
_______________________________________________________________________
42
Table 3.1 (continued): Laboratory measurements at reservoir effective pressure (5000
psi) of 43 samples extracted over the reservoir interval.
Sample Depth (m)
Vp (m/s)
Vs (m/s)
Density mineral (kg/m3)
Porosity (fraction)
34 3087.80 3534 2162 2700 0.203 35 3088.75 3555 2136 2690 0.204 36 3089.65 3439 2098 2690 0.205 37 3090.55 3531 2139 2690 0.194 38 3091.50 3668 2230 2700 0.196 39 3093.45 3803 2195 2700 0.192 40 3094.70 3640 2106 2690 0.206 41 3095.80 3666 2065 2690 0.190 42 3097.00 4070 2248 2680 0.183 43 3098.30 4040 2339 2670 0.136

Chapter 3 - PRESSURE EFFECTS ON ELASTIC PROPERTIES
_______________________________________________________________________
43
Estimating the reservoir’s effective pressure
To estimate the effective pressure effecP affecting elastic-wave velocities in the
reservoir, I use the equation (2.10) from Chapter 2. Pore pressure was obtained from
well (RFT) measurements. The resulting value of effective pressure was 34.47 MPa for
this interval. Considering the large number of cores available, it was possible to discard
some samples deemed to be nonrepresentative of the reservoir properties. As discussed
in Section 2.2.4, a few samples were excluded due to strongly heterogeneous intervals.
Calculation of elastic modulus and sensitivity analyses
Once the laboratory measurements were made on dry cores, the saturated bulk
modulus satK was computed using Gassmann’s equation (equation (2.1)).
The petrologic description of the reservoir sands suggests some heterogeneity of
the mineral composition of the reservoir. This may lead to a depth-dependent composite
mineral modulus. Since the mineral composition was not available for all samples, I
used a single representative bulk mineral modulus ( minK ) value of 41188 MPa. I also
performed a sensitivity analysis to evaluate the impact of variations of minK (and fluidK )
on fluid substitution (Figure 3.5). This analysis shows that 10% variations in mineral and
fluid modulus have small (less than 0.4%) effect on velocities (8 m/s to -11 m/s and 14
m/s to -13 m/s, respectively), which are insignificant for this study.

Chapter 3 - PRESSURE EFFECTS ON ELASTIC PROPERTIES
_______________________________________________________________________
44
Figure 3.5: The effect of 10% variation in bulk mineral (Km) and fluid moduli (Kfluid) on
saturated P wave velocities (VPsat): (a) sample-by-sample; (b) average over the reservoir
interval. A variation in bulk mineral modulus of ± 10% will result in VPsat changes of
8 m/s and -11 m/s, and the same percentage of change in fluid modulus will cause
14 m/s and -13 m/s changes, respectively.

Chapter 3 - PRESSURE EFFECTS ON ELASTIC PROPERTIES
_______________________________________________________________________
45
As a saturation log was available, the variation of saturation with depth was
taken into account to calculate the fluid bulk modulus as a function of depth using
Wood’s equation (equation (2.11)). Finally, the saturated compressional velocity PsatV
was obtained using the standard equation
124
3sat
Psatsat
K GV
ρ
⎛ ⎞+⎜ ⎟= ⎜ ⎟
⎜ ⎟⎝ ⎠
, (3.1)
where 2S dryG V ρ= is the shear modulus of the rock, ( )1fluid w w w oS Sρ ρ ρ= + − is the
composite fluid density, and sat fluid dryρ ρ φ ρ= + is the density of the saturated rock.
Dry rocks are usually assumed to have little or no velocity dispersion, at least
relative to the large dispersion that occurs when pore liquids are introduced (Mavko and
Jizba, 1991; Winkler, 1986). Therefore, the velocities computed from dry measurements
using Gassmann’s equation can be considered as measured in the low-frequency (quasi-
static) limit.
As a result of this calculation, elastic moduli and saturated velocities were
obtained for each sample and for each effective pressure step (3.45 – 41.37 MPa).
Figure 3.6 shows the dependency of velocities on effective pressure for six samples
extracted from different depths. To compare with log measurements, I selected velocities
corresponding to the estimated effective pressure present in situ (34.47 MPa).

Chapter 3 - PRESSURE EFFECTS ON ELASTIC PROPERTIES
_______________________________________________________________________
46
Figure 3.6: Velocity versus effective pressure for a selection of core samples at different
depths (from 3053.65 m to 3091.50 m).
Reservoir effective pressure

Chapter 3 - PRESSURE EFFECTS ON ELASTIC PROPERTIES
_______________________________________________________________________
47
3.1.3 Results
In Figure 3.7, Figure 3.8 and Figure 3. 9, I compare the saturated velocities
computed from cores (blue dots) against corresponding sonic-log data. We see very
good agreement between the two sets of data. The average difference (systematic error)
between the two sets is -32 m/s (0.93%), which is within the core measurement error
range (up to 3%). The root mean square (rms) of the differences between the sonic log
and the computed core velocities is 110 m/s. The fact that random errors are larger than
systematic ones suggests that the effect of core damage is insignificant because this
effect is expected to result in a systematic weakening of the samples. A similar result
was observed in Schiehallion field by Meadows et al. (2005).

Chapter 3 - PRESSURE EFFECTS ON ELASTIC PROPERTIES
_______________________________________________________________________
48
Figure 3.7: Comparison of saturated P-wave velocities computed using Gassmann
equations from dry core measurements (dots) against a sonic log (line).

Chapter 3 - PRESSURE EFFECTS ON ELASTIC PROPERTIES
_______________________________________________________________________
49
Figure 3.8: Differences between saturated P-wave velocities computed using Gassmann
equations from dry core measurements and the sonic log. We can see that differences are
usually smaller than 200 m/s.

Chapter 3 - PRESSURE EFFECTS ON ELASTIC PROPERTIES
_______________________________________________________________________
50
Figure 3. 9: Differences in percentage between saturated P-wave velocities computed
using Gassmann equations from dry core measurements and the sonic log.
% Vp error (m/s)(Vp core sat / Vp log)

Chapter 3 - PRESSURE EFFECTS ON ELASTIC PROPERTIES
_______________________________________________________________________
51
3.1.4 Conclusions
I have described a methodology to assess the adequacy of ultrasonic velocities
measured in the laboratory for use in sonic and seismic modelling (with potential use in
time-lapse interpretation), focusing on the effect of core damage. Dispersion effects have
been minimized by using dry cores and then computing saturated velocities (Gassmann);
under-representing cores are reduced by extracting several cores over the reservoir
interval.
The main conclusion is that the saturated velocities computed from core
measurements on dry samples match the sonic-log velocities quite well. This is
encouraging because it implies that core damages that may occur while bringing the core
samples to the surface are small and do not adversely affect the measurement of elastic
properties on these core samples. Should core damage have affected our measurements,
we would have expected a systematic difference between properties measured in situ
and on the recovered. Consequently, stress sensitivity of elastic parameters, as obtained
from ultrasonic measurements, is adequate for quantitative interpretation of time-lapse
seismic data. These results also suggest the usefulness of laboratory measurements on
cores, including core preservation during extraction.
The results of the study relate to a particular reservoir in the Campos Basin,
offshore Brazil. Other studies in the same basin and other parts of the world are needed
to verify the generality of this conclusion. It is expected that the match between core and
log data may be worse at lower effective pressures. Therefore it would be useful to
perform similar comparisons for reservoirs with lower effective pressures, particularly in
overpressured regimes.

Chapter 3 - PRESSURE EFFECTS ON ELASTIC PROPERTIES
_______________________________________________________________________
52
3.2 Stress Sensitivity using an In Situ Approach (Well Logs)
As shown in Section 3.1, velocity-pressure relationship for reservoir rocks can be
obtained from ultrasonic measurements on core samples. However, this approach has its
limitations. Cores may be affected by damage, bias in the plugging process, scale effects
and may not be representative of the in situ properties. Effects of dispersion can be
minimised by measuring cores dry, and then applying Gassmann’s equation; however
drying may sometimes alter the rock fabric, especially for clay-rich rocks (Batzle et al.,
2006). Another limitation of using core measurements is the high extraction cost.
Considering the importance of knowing the pressure effect on elastic rock
properties for time-lapse studies and the limitations of using cores, it is desirable to
obtain this relationship from some in situ measurements. Few methods can sample the in
situ rock. Seismic, for instance, provides in situ information, but lacks sufficient vertical
resolution. Well logs, on the other hand, can provide high vertical resolution
information, but usually are not available in the same well before and after production.
In this section I develop a method to infer the in situ pressure – velocity
relationship using log data from wells drilled and logged at different stages of field
development, thus providing rock and fluid properties at different pressures. For each
well logged at a specific time, pore pressure Pp, P-wave velocity Vp and porosity φ,
among others properties, are assumed known. Pore pressure is obtained from repeat
formation tester (RFT). As the field depletes over time and new wells are drilled and
logged, similar datasets related to different pressures become available.
The idea of obtaining the relationship between acoustic impedance versus pore
pressure from multiple wells was proposed by Hansen et al. (2006). Furre et al. (2009)
proposed a similar approach for predicting the effect on seismic data of pressure
depletion within the reservoir, utilizing sonic logs acquired in different wells drilled
during varying depletion stages. To avoid pressure dependent fluid effects, Furre et al.

Chapter 3 - PRESSURE EFFECTS ON ELASTIC PROPERTIES
_______________________________________________________________________
53
(2009) focused on the stress dependence of the framework (or dry) elastic moduli of the
rock and applied it to slightly tilted fault blocks of fluvial deposits in the North Sea. This
approach can only be applied to very homogeneous reservoirs, otherwise spatial
heterogeneity may cause bigger variations of elastic properties between wells than
changes in pressure do. To mitigate this effect, Furre et al. (2009) classified rocks into a
few porosity ranges.
In this study I expand and broaden the approach of Furre et al. (2009) by
analysing variation of velocity as a function of both pressure and porosity. The idea of
including porosity and obtaining a three-dimensional relationship with velocity and
pressure helps account for rock properties variability (Meadows et al., 2005).
I apply this approach to a reasonably continuous deposit made up of sandstone
turbidites in Campos Basin, Brazil. I obtain the velocity–pressure-porosity relationship
in two neighbouring areas with distinct hydraulic compartmentalization, and compare
them with the laboratory measurements. The final goal is to increase our understanding
of velocity dependence on pressure to support further quantitative time-lapse analyses.
3.2.1 Description of data
An overview of the oil field is provided in Section 3.1.1. There are 24 wells
drilled since the start of production. Considering the strong depletion (around 2000 psi)
in the main reservoir, there is an opportunity to use pore pressure information from RFT
and associate it with rock properties sampled by logs. Twenty three wells penetrated the
reservoir with original oil saturation, have borehole logs (including sonic, porosity,
gamma-ray and density) and RFT measurements.
It is a challenge to get 4D quantitative information from this field using
conventional seismic, probably due to low repeatability. Seismic data were acquired in
1984 and 1999 using streamers, and in 2005 using ocean bottom cable (OBC). This last
survey was designed to provide a better image of the reservoir rather than maximise

Chapter 3 - PRESSURE EFFECTS ON ELASTIC PROPERTIES
_______________________________________________________________________
54
repeatability with the previous surveys. Considering low seismic repeatability, an
additional effort using both well (in situ) and core (laboratory measurements)
approaches is explored to understand production effects (pressure) on elastic properties.
3.2.2 Objectives and methodology
The main objective of this study is to assess in situ velocity dependence on
pressure to calibrate time-lapse (4D) interpretation. Another aim is to compare the in situ
relationship to the one obtained using ultrasonic measurements.
To estimate the pressure-velocity-porosity relationship, I propose the following
workflow:
1. Select all wells that fulfil the following conditions: they drain the main reservoir
in this field, were logged at original oil saturation and have RFT measurements.
I select log velocities and porosities into a specific stratigraphic interval from 23
wells.
2. Load all data (logs, markers, RFT and core measurements) in a software
(Rokdoc from Ikon Science).
3. Analyse pore pressure depletion over time. In Figure 3.10 I plot pore pressure
obtained by RFT measurements at each well against production time. There are
two distinct hydraulic compartments (black line and red ellipse) and the in situ
stress sensitivity of elastic properties should be analysed separately for each area.
The importance of analysing pressure variation in this time scale is to restrict
effects due to production. Changes induced during geological time should not be
considered; in this case other effects (e.g. plasticity, the propensity of a material
to undergo permanent deformation under load) should be acting.
4. Analyse pore pressure depletion in space. The well location shown in Figure 3.11
helps to confirm the existence of two distinct hydraulic compartments, as
suggested in Figure 3.10. Each group of wells that belongs to a particular
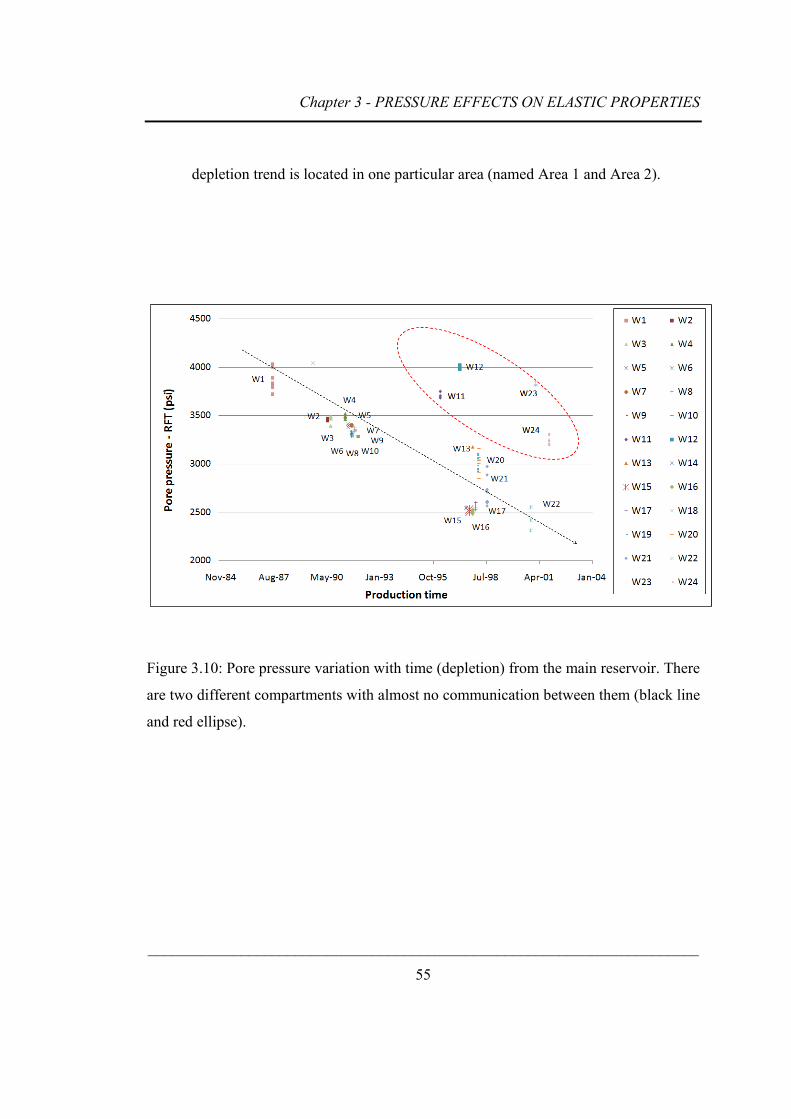
Chapter 3 - PRESSURE EFFECTS ON ELASTIC PROPERTIES
_______________________________________________________________________
55
depletion trend is located in one particular area (named Area 1 and Area 2).
Figure 3.10: Pore pressure variation with time (depletion) from the main reservoir. There
are two different compartments with almost no communication between them (black line
and red ellipse).

Chapter 3 - PRESSURE EFFECTS ON ELASTIC PROPERTIES
_______________________________________________________________________
56
Figure 3.11: Map showing wells drilled through the main reservoir. The wells located at
southeast from the dashed line (Area 2) are hydraulically isolated from the other wells
(Area 1). All these wells were drilled in the original oil saturation, except W21. The real
coordinates have been modified, however the relative distances are preserved (*).
W1
W2
W3
W4
W5
W6
W7
W8
W9
W10
W11
W12
W13
W14
W15W16
W17
W18
W19
W20
W21
W22
W23
W24
8000
9000
10000
11000
12000
13000
14000
9000 11000 13000 15000 17000 19000 21000
Y coordina
tes* (m
)
X coordinates* (m)
Area 1
Area 2

Chapter 3 - PRESSURE EFFECTS ON ELASTIC PROPERTIES
_______________________________________________________________________
57
5. Select all log samples from the main reservoir interval, which have similar
lithologic characteristics, by applying gamma-ray and porosity cut-offs. The
reason for this is that despite the reasonable lateral continuity of rock properties
of this sandstone, the spatial heterogeneity is still one of the biggest causes of
uncertainty (Figure 3.12). Cut-offs also help eliminate outliers in log
measurements.
6. Estimate effective pressure (differential pressure). It is done based on sea water
and lithostatic pressure gradients, integration of density log and pore pressure
measurements (RFT). The water depth for each well is taken into account
(equation (2.10)), and it is assumed that effective pressure is constant in the
reservoir interval.
7. Cross-plot Vp, porosity (logs) and Peffec and fit a plane through these points. A
plane is fitted for each hydraulic compartment using a least-square method in a
Vp, φ and Peffec space.
8. Compute ultrasonic (core) velocities to compare with the in situ approach. Core
samples are extracted along the reservoir interval and dry ultrasonic velocities are
measured for varying confining pressures up to 6000 psi. Saturated velocities are
computed from dry core ultrasonic measurements by applying Gassmann
equations using in situ fluid properties.
9. Analyse the results.

Chapter 3 - PRESSURE EFFECTS ON ELASTIC PROPERTIES
_______________________________________________________________________
58
Figure 3.12: Wells W8 and W12 illustrate the characteristics of data used for obtaining
in situ velocity dependence on pressure. In the upper part gamma-ray, porosity and
velocity from logs and pore pressure discrete measurements (red “x”). In the lower part
are shown cross-plots of velocity versus porosity for all values from logs in the reservoir
interval which satisfying cut-offs: gamma-ray (GR) < 70 and φ > 0.15.

Chapter 3 - PRESSURE EFFECTS ON ELASTIC PROPERTIES
_______________________________________________________________________
59
3.2.3 Results
Pore pressure decay during production time (Figure 3.10) shows clearly the
hydraulic compartmentalization in this reservoir. While the majority of wells follow a
specific depletion trend, the other four wells are outside of this trend. This other
hydraulic compartment is located in the south eastern region of the field (Figure 3.11).
The in situ stress sensitivity of elastic properties is analysed separately for each of these
two areas.
It is also important to select relatively homogeneous sandstones. Figure 3.12
shows representative wells for Area 1 and Area 2 exemplifying the quality control step.
Basically this is done in two steps: by limiting the log data to be used in the same
stratigraphic interval; and by applying cut-offs to exclude rocks with different
characteristics. Even after applying porosity and gamma-ray cut-offs to exclude intra-
reservoir cement and shaly zones, there are still variations of porosity with velocity.
These could be related to the rock framework and small changes in mineral composition.
For some wells no sample was discarded (i.e. W8), for others (i.e. W12), a few thin
intervals with calcite cement and higher shale content were discarded. The remaining log
porosities and velocities are then cross-plotted, and the strong influence that porosity has
on velocities becomes evident.
Despite appropriate procedures, there are still intrinsic uncertainties like the
impact of very small heterogeneities (smaller than 5 cm) that could be smoothed over by
log measurements. To mitigate uncertainties and achieve more robust analyses, I used as
many points as possible that meet quality control requirements in order to provide
statistical robustness. Hundreds of points for which log values fulfil cut-off conditions
are selected from this stratigraphic interval.
To capture velocity dependence in both porosity and pore pressure (or
corresponding effective pressure), I plot in three dimensions all values (Vp, φ and Peffec)
corresponding to this sandstone. A plane was fitted among these hundreds of points

Chapter 3 - PRESSURE EFFECTS ON ELASTIC PROPERTIES
_______________________________________________________________________
60
using a least-square method.
Planes adjusted over datasets for both Area 1 (Figure 3.13) and Area 2 (Figure
3.14) represent the velocity dependence on effective pressure and porosity. Given the
uncertainty level, a simple linear function (a plane in 3D) in a relatively narrow range of
porosity and pressure is a reasonable approximation.
In Area 1 given the higher number of wells available (19 from 20 fulfil our
requirements), the regression coefficients should be more robust, at least in the reservoir
effective range used to estimate this plane:
3707 4002 0.091P effecV Pφ= − + (3.2)
In Area 2 there are only four wells within the same hydraulic compartment. Core
samples are available in this area; so saturated velocities have also been computed from
dry core ultrasonic measurements by applying Gassmann equations. Then, a plane is
fitted for the core dataset (Figure 3.15). The equations for Area 2 from in situ (log) and
laboratory (core) approaches are, respectively,
3787 4619 0.1284P effecV Pφ= − + (3.3)
3988 5774 0.1306P effecV Pφ= − + (3.4)

Chapter 3 - PRESSURE EFFECTS ON ELASTIC PROPERTIES
_______________________________________________________________________
61
Figure 3.13: In situ P-wave velocity dependence on porosity and effective pressure for
Area 1 (19 wells from 20 available). Points are obtained from pressure measurements
and from sonic and porosity logs. The plane corresponds to a best fit among all points
using a least-square method.

Chapter 3 - PRESSURE EFFECTS ON ELASTIC PROPERTIES
_______________________________________________________________________
62
Figure 3.14: In situ P-wave velocity dependence on porosity and effective pressure for
Area 2 (all the 4 wells available are used). Points are obtained from pressure
measurements and from sonic and porosity logs. The plane corresponds to a best fit
among all points using a least-square method.

Chapter 3 - PRESSURE EFFECTS ON ELASTIC PROPERTIES
_______________________________________________________________________
63
Figure 3.15: P-wave velocity dependence on porosity and effective pressure for Area 2.
Points are obtained from ultrasonic measurements in 26 cores (in the laboratory) at
different confining pressures. The plane corresponds to a best fit among all points using
a least-square method.

Chapter 3 - PRESSURE EFFECTS ON ELASTIC PROPERTIES
_______________________________________________________________________
64
3.2.4 Conclusions
I have described a methodology to assess the in situ velocity dependence on both
pressure and porosity. Velocity sensitivity to effective pressure is estimated using log
data and pore pressure (RFT) measurements. Wells drilled and logged in different stages
of depletion allow us to estimate the effect of pressure on elastic parameters.
Due to a lack of lateral stress information, it was assumed confining stress can be
approximated by a vertical stress. This approximation appears to be appropriate since
there are no significant tectonic forces related to Cretaceous Period in the Campos
Basin.
Substituting average porosity and effective pressure (0.25 and 3447 psi,
respectively) in regression equations (3.2) - (3.4), the resulting velocities are 3020 m/s
(in situ, Area 1), 3075 m/s (in situ, Area 2) and 2995 (lab, Area 2). The difference
between Area 1 and Area 2 (in situ approach) is 1.8% and between in situ and laboratory
approaches (Area 2) is 2.7%.
Although in situ and lab approaches show similar results for mean properties,
uncertainties related to rock and fluid properties are still high. The main intrinsic
uncertainties in this methodology are caused by rock heterogeneity and errors in
effective pressure estimation. Despite using constraints (same stratigraphic unit,
applying gamma-ray and porosity cut-offs), there is a significant porosity variability.
Cement and mineral composition may also affect velocity response. Pore pressure
derived from repeat formation tester (RFT) measurements is assumed constant within
the same stratigraphic unit. The expected magnitude of errors in velocity estimation due
to this approximation and effective pressure estimation is up to 1.5%.
Consequently, for this particular dataset from Campos Basin, the results are not
conclusive mainly, perhaps, because spatial variations (heterogeneity) mask a relatively
small pressure effect. In more favourable conditions (higher rock homogeneity) or

Chapter 3 - PRESSURE EFFECTS ON ELASTIC PROPERTIES
_______________________________________________________________________
65
steeper part of the pressure - velocity curve, this methodology may be used as a
complementary assessment of rock elastic properties together with the one derived from
core measurements.
The possibility of comparing velocity dependence on pressure and porosity
relationship using in situ and laboratory approaches is very attractive. It represents a
significant increase in spatial coverage of information over an oil field, particularly in
mature oil fields, in comparison to the typically sparse samples provided by cores.
Considering that the pressure response is much quicker than the saturation response, the
understanding of the pressure changes can significantly contribute to the early
identification of preferential zones and barriers within the reservoir.

_______________________________________________________________________
66
Chapter 4
CHARACTERIZATION OF THIN
STRATIFICATION
Quantitative time-lapse studies require precise knowledge of the response of
rocks sampled by a seismic wave. Small-scale vertical changes in rock properties, such
as those resulting from centimetre scale depositional layering, are usually undetectable
in either seismic or standard borehole logs (Murphy et al., 1984).
In the first section of this chapter I present a methodology to assess rock
properties by using X-ray computed tomography (CT) images along with laboratory
velocity measurements and borehole logs. This methodology is applied to rocks
extracted around 2.8 km depth from offshore Brazil. The improved understanding of
physical property variations may help to correlate stratigraphy between wells and to
calibrate pressure effects on velocities for seismic time-lapse studies.
Small scale intra-reservoir shales have a very different response to fluid injection
and depletion from that of sand, and thus may have a strong effect on the equivalent
properties of a heterogeneous clastic reservoir. In the second part of this chapter I
present a methodology to compute the combined seismic response for depletion and
injection scenarios as a function of net to gross (sand – shale fraction). This approach is
appropriate for modelling time-lapse effects of thin layers of sandstones and shales in
repeated seismic surveys when there is no time for pressure in shale and sand to
equilibrate.

Chapter 4 - CHARACTERIZATION OF THIN STRATIFICATION
_______________________________________________________________________
67
4.1 Using X-Ray Computed Tomography to Characterize Finely
Layered Sediments
In order to correctly model and interpret time-lapse data, the effect of finely
layered sediments should be taken into account. The wavelength of seismic data usually
is much bigger than is required to resolve small scale rock property variations. Well logs
have higher vertical resolution (or smaller volume of investigation) than seismic. But
even when the log sampling interval is small (e.g. frame spacing of 2 inches = 5.08 cm),
it may still have a relatively large investigation volume. This presents a problem when
we wish to capture the full variation in physical properties for purposes such as rock
physics modelling and time-lapse interpretation.
One method that gives useful information in an automated way and at a higher
resolution than downhole logs is X-ray computed tomography (CT) of cores (Mees et
al., 2003). Marine sediment core samples are the fundamental source of information on
seabed character, depositional history and environmental change (Rothwell and Rack,
2006). The CT number encodes a combination of mass density and electron density
proportional to mean atomic number (Desrues et al., 2006; Moore and Reynolds, 1997;
Wellington and Vinegar, 1987). CT analysis is completely non-destructive, preserving
all core material for additional analyses or archiving. CT scanning can be used routinely
at slice and pixel resolutions of 1 mm, so that very fine-scale changes in rock properties
can be distinguished.
In this section, I present a methodology to assess rock properties by using X-ray
computed tomography images combined with ultrasonic measurements. I apply this
methodology to a Brazilian offshore deepwater oil field. This analysis demonstrates that
these data provide valuable information on centimetre-scale heterogeneity. The analysis
also reveals sedimentary cyclicity and potentially can reveal other small scale
heterogeneity that may help in 4D studies. Moreover, possible stress changes in this

Chapter 4 - CHARACTERIZATION OF THIN STRATIFICATION
_______________________________________________________________________
68
interval (reservoir’s overburden rock) due to production or injection in the subjacent
reservoir could further be modelled using this dataset.
4.1.1 Description of data
The data come from a well in Campos Basin, offshore Brazil. The interval is
approximately 2800 m below sea floor, in an Oligocene to Miocene hemipelagic
sequence of alternating marls and shales that form the overburden to the main sandstone
reservoir. The data consist of CT images of the whole core, ultrasonic P-wave
measurements on core plugs and electronic borehole logs.
X-ray CT images were taken every 5 cm from cores at the depth of around
2800 m. To acquire these CT images, we used a Picker – PQS scanner with X-ray
voltage set to 130 kV and current to 100 mA. The time per scan was 4 seconds and
image resolution was 0.5 mm x 0.5 mm. The standard deviation of the X-ray CT value
measurements is 0.56%. The slice thickness is 1 cm, meaning that the support volume of
the measurements is smaller than the sampling interval. This is an important difference
from the high resolution downhole density log, where the sampling interval is similar (2
inches = 5.08 cm), but the support volume is larger (10 cm).
Ultrasonic (500 kHz) P-wave velocities were measured at different pressures on
23 rock samples, providing complementary information about their elastic properties.
The measurements were done for horizontally and vertically oriented samples using
varying confining pressures from 1000 to 6000 psi.
An extensive suite of borehole logs is also available including high-resolution
gamma-ray and density logs with sample interval of 5.08 cm, as well as photoelectric
factor and density correction. The sonic P- and S- velocities were measured by a
monopole sonic logging tool with a spacing of 20 cm (standard) and 5.08 cm (high
resolution).

Chapter 4 - CHARACTERIZATION OF THIN STRATIFICATION
_______________________________________________________________________
69
4.1.2 Methodology
I initially investigated standard borehole logs over the interval to assess the rock
physical properties. I found that the resolution was not enough to detect lithology
intercalation in the rocks immediately above the sandstone reservoir. However,
ultrasonic velocity measurements made at different depths and at different confining
pressures show a substantial variation in elastic properties. High resolution logs showed
some indications of a cyclic pattern. These logs have a small sampling rate (5.08 cm);
but the actual resolution is lower because the volume of investigation of the sensors is 2
to 6 times larger than the frame spacing at which data were collected.
In order to get more insight about the variation of elastic properties, I used the
regularly spaced X-ray CT scans performed on the whole core. I computed the mean X-
ray CT value for each image by averaging it over a large circular area chosen to remove
the outer part of the slices, in order to reduce the impact of beam hardening (Desrues et
al., 2006). Beam hardening is the process of selective removal of soft X-rays from the
X-ray beam. As these X-rays are removed, the beam becomes progressively harder or
more penetrating. The amount of beam hardening depends on the initial X-ray spectrum
as well as on the composition of the material traversed. This effect causes so-called
beam hardening artefacts in CT images. If uncorrected, beam hardening artefacts appear
as cupping, or a reduction of the reconstructed attenuation coefficient toward the centre
of a large object.
Though beam hardening is ubiquitous and difficult to correct for, cropping the
edge off is a reasonable way to deal with it. Figure 4.1 (a) shows X-ray CT values in
Hounsfield units (HU) for different depths. The Hounsfield unit (HU) scale is a linear
transformation of the original linear attenuation coefficient measurement in one in which
the radio density of distilled water at standard pressure and temperature (STP) is defined
as zero Hounsfield units (HU), while the radio density of air at STP is defined as -1000
HU (Mess et al., 2003). Figure 4.1 (b) shows CT values obtained from the HU values by

Chapter 4 - CHARACTERIZATION OF THIN STRATIFICATION
_______________________________________________________________________
70
conversion to an 8-bit gray scale. In the depth interval from 2862 m to 2870 m there is a
clear signature of cyclicity. In the sandstone interval (2870 m to 2874.3 m), the X-ray
CT values are lower and the cyclicity disappears.
Using a correlation between mass density measured on core samples and X-ray
CT value, I computed so-called X-ray densities (or “mean density from CT”). Next, I
crossploted ultrasonic P-wave velocity versus mean X-ray density of the corresponding
samples (Figure 4.2). I selected velocities corresponding to the estimated in situ
confining pressure (3000 psi), by taking into account lithostatic stress. Figure 4.2 shows
reasonable good correlation between X-ray density and P-velocity. This correlation is
then used to compute the velocities as a function of density for each CT image.

Chapter 4 - CHARACTERIZATION OF THIN STRATIFICATION
_______________________________________________________________________
71
Figure 4.1: X-ray CT values obtained by computing the average value over a circular
area for each CT image at every 5 cm. Alternating low and high CT values provide
evidence of cyclicity. Hounsfield units (a) and arbitrary unit after conversion to an 8-bit
gray scale (b).

Chapter 4 - CHARACTERIZATION OF THIN STRATIFICATION
_______________________________________________________________________
72
Figure 4.2: Ultrasonic P-wave velocity measured from plugs versus relative X-ray
density from CT images, obtained at the same position. The correlation coefficient is
0.56. Red and blue symbols correspond to Vp values for vertically and horizontally
oriented samples, respectively. CT images from samples 3 (2863.25 m) and 8
(2864.40 m) are also shown. Bright colours mean higher X-ray CT values (higher mass
densities, higher P-wave velocities), whereas dark colours correspond to low CT values.
Chapter 4 - CHARACTERIZATION OF THIN STRATIFICATION
_______________________________________________________________________
73
4.1.3 Quantification of sedimentary cycles on the centimetre scale
The computed X-ray densities reveal well defined cycles. Shales are related to
dark images with smaller densities and velocities; marlstones are in the other extreme,
and there exist a gradation between the two (Figure 4.2 and Figure 4.3). These changes
are caused by the differing amount of calcium carbonate, which is enhanced in CT
imagery owing to the relatively high atomic number of calcium. These cycles are not
visible in standard resolution logs, and even in high resolution logs they are still aliased
or smoothed over.
The computed velocities from CT images (using previously established
correlation) show clearly the cyclic behaviour with much higher resolution than the
sonic log (Figure 4.3). However, comparison between these velocities and the sonic log
shows discrepancy in the upper part of the interval. There is a better agreement in the
lower part. The misfit between sonic log and ultrasonic measurements may be related to
dispersion effects (500 kHz in the lab; 10 - 20 kHz in the logs) and/or fluid substitution
effects. The lab measurements were done on partially dried samples. Correction for
frequency, fluids and anisotropy would be needed to adequately upscale this layered
sequence to match interval travel times on the log or seismic scale.
Vertical variation of X-ray CT values shows a clear pattern of sedimentary
cyclicity with a spatial period of 37.7 cm estimated from the autocorrelation function
and the periodogram (Figure 4.4). Given an estimated accumulation rate of 2 cm/ka (G.
Albertao, personal communication, 2008) for this interval, it corresponds to a time
period of approximately 19 ka. This appears to be related to precessional cycles (23 ka -
19 ka). This interpretation hinges on the accuracy of the accumulation rate which, in
general, is difficult to obtain.

________
Figure 4.3
(3000 psi)
oriented c
velocity d
related to
velocities
__________
3: Ultrason
) measured
core plugs;
derived from
higher (co
computed f
Chapter 4
__________
nic P-wave
d on vertic
P-wave ve
m CT imag
ontains mor
from CT im
4 - CHARA
__________
7
e velocity
cally (red
elocity from
es (black li
re CaCO3),
mages.
CTERIZATI
__________
74
from plugs
symbols) a
m high reso
ine). Magen
, medium a
TION OF TH
__________
s at reserv
and horizon
olution son
nta, yellow
and lower
HIN STRATI
__________
voir effectiv
ntally (blu
nic log (blu
and green
(contains m
TIFICATION
__________
ve pressure
ue symbols)
ue line) and
colours are
more shale)
N
_
e
)
d
e
)

Chapter 4 - CHARACTERIZATION OF THIN STRATIFICATION
_______________________________________________________________________
75
Figure 4.4: (a) Autocorrelation function of gamma-ray log (green dots), density log (blue
dashed line) and CT velocities (red line) for the depth interval shown in Figure 4.3. The
autocorrelation function of the CT velocities consists of two parts: (1) a signature of a
random process showing a decrease of correlation function with correlation lag; and (2)
a signature of a periodic (cyclic) process with a period of 37.7 cm. (b) Power spectral
density computed from CT images in shale-marl interval showing the dominant period
of 37.7 cm.

Chapter 4 - CHARACTERIZATION OF THIN STRATIFICATION
_______________________________________________________________________
76
4.1.4 Discussion
CT images over the reservoir interval, aside from giving extraordinary vertical
resolution, also provide lithologic information (Figure 4.1), which is useful for
interpretation of petrophysical and rock physics measurements on core plugs.
In principle, the resolution of the CT-derived information could be increased
further by reducing the spacing between slices (down to 1 mm so that the slices are
adjacent), though for this study the time and expense of this would be unwarranted. The
real value of X-ray CT as compared with other observations on core (e.g. colour, texture
or mineralogic analysis) is the direct quantitative link to seismically relevant physical
properties (velocities and densities) and the parallel assessment of the quality of the core
for laboratory testing purposes.
X-ray density obtained from CT images shows a reasonable correlation
(correlation coefficient 0.56) with ultrasonic P-wave velocity. This correlation is much
better than X-ray density with mass density (correlation coefficient 0.2). This may be
explained by the fact that variations in calcium carbonate content have a strong effect on
both velocity and X-ray CT, but lesser effect on mass density. Higher content of calcium
carbonate causes stiffening and shifts the Vp curve to higher velocities. I classified the
velocities computed from CT images into three groups according to their magnitude, and
associated to the gradation of shales and marlstones (Figure 4.3). The above
observations help understand the relationship between velocity and confining pressure
(Figure 4.5). All the ultrasonic measurements are now consistent with this interpretation,
and this insight could be useful for future time-lapse studies as these rocks are located in
the vicinity of a reservoir which should experience a pressure variation with time.

Chapter 4 - CHARACTERIZATION OF THIN STRATIFICATION
_______________________________________________________________________
77
Figure 4.5: Ultrasonic P-wave velocities (23 plugs) versus confining pressure measured
in the laboratory. From the meaningless (from a geological point of view) curves (a), I
classify and group plugs based on CT X-ray absorption (b), to be used in a further 4D
study. Magenta, yellow and green colours are related to higher, middle and smaller
ranges of velocity computed from CT images.

Chapter 4 - CHARACTERIZATION OF THIN STRATIFICATION
_______________________________________________________________________
78
4.1.5 Conclusions
I have shown that densely sampled X-ray CT images over a shale/marl interval
reveal small scale sedimentary heterogeneity and aid in the interpretation of
petrophysical and rock physics measurements. In particular, I demonstrated that there is
spatial cyclicity that cannot be revealed even using high resolution logs. The
understanding of the cyclicity characteristics in the area under study allowed us to
identify Milankovich cycles, which I interpret as precession cycles (19 ka periodicity).
There are other evidences of sedimentary cyclicity in this region at larger scales obtained
by other methods (Azambuja et al., 2007; Barbosa et al., 2007; Cunha and Koutsoukos,
2001). Consequently, there is a potential for X-ray CT studies to assess not only rock
physical properties when used in combination with ultrasonic measurements or logs, but
to be used for paleo-climate studies.
The good match between measured ultrasonic velocities and those computed
from CT shows that the large variations of ultrasonic velocities between different
samples are caused by vertical heterogeneity (variation of calcium carbonate content)
and not by strong anisotropy. The cyclic variations in X-ray CT values disappear
completely in the sand reservoir (turbidite).
The understanding of cyclicity characteristics and the presence of velocity
variability with confining pressure in the study interval (which lies over a hydrocarbon
reservoir), could be further used for detailed modelling of time-lapse effects.

Chapter 4 - CHARACTERIZATION OF THIN STRATIFICATION
_______________________________________________________________________
79
4.2 Effect of Net to Gross (Thin Layers) on Pressure Sensitivity in
Hydrocarbons Reservoirs
Time-lapse studies consider changes of elastic properties in the vicinity of a
reservoir interval according to changes in pressure due to production or injection.
Considering clastic reservoirs, it is usual to have sub-seismic low permeability shales
intercalated with sandstone reservoir. During depletion, sandstone compacts and shales
may expand. On the other hand, during fluid injection, sandstones may soften. This
phenomenon may induce hardening of the surrounding shales. The combined seismic
response depends on the net to gross, permeability of both shales and sands, and on the
required time for the layers to reach the equilibrium pressure. Hatchell and Bourne
(2005) studied time-shifts taking into account intra-reservoir shales during reservoir
depletion. Because shales have very low permeability, the pore pressure in shales may
not have enough time between seismic surveys to equilibrate with the pressure in
surrounding sands MacBeth et al. (2008). In such cases shales may be considered as
impermeable. This is an approach that I have investigated in this research.
The evaluation of the magnitude of thin shale layers on the reservoir stress
sensitivity response may help to correct this effect for quantitatively modelling 4D
seismic. The impact of this study in hydrocarbon reservoirs which have varying net to
gross (turbidites, deltas) may be significant. In Brazil, for instance, the majority of
known Campos Basin mature reservoirs undergoing development are comprised of
sandstone turbidites containing thin intra-shale layers (Bruhn et al., 2003).
In this study I propose a workflow to compute the combined seismic response of
a reservoir undergoing pressure changes as a function of net to gross. To evaluate the
magnitude of thin shale layers on the reservoir stress sensitivity response, I apply the
developed workflow to a typical clastic reservoir located in Campos Basin, offshore
Brazil.

Chapter 4 - CHARACTERIZATION OF THIN STRATIFICATION
_______________________________________________________________________
80
4.2.1 Effect of thin intra-reservoir shale layers during production
Consider a reservoir interval composed of a sequence of hydraulically
communicating sands and nearly impermeable shales. During production, fluid pore
pressure in the sandstone is reduced, increasing the effective pressure. Consider that
there is no fluid communication among shales and sands during a period of time
between repeated 3D surveys. As there is no time for fluids to move between shales and
sands in order to equilibrate pressure, the stress conditions will change only due to the
mechanical pull caused by neighbouring depleting sands. Consequently, during
depletion the pore pressure will decrease in sandstones and stiffen these rocks
(hardening), whereas the surrounding shales will mechanically expand (softening)
(MacBeth et al., 2008). Fluid injection into sand will cause the opposite effect: pore
pressure in sand will increase causing its softening and consequently the hardening of
the shales.
4.2.2 Computing elastic parameters of an equivalent medium
To quantify the effect of the extension and contraction induced by stress changes,
I consider the vertical P-wave propagation through the stack of shales and sands for
different NTG (net to gross or sand-shale ratio) in the reservoir interval. In this study I
assume that the induced stress change in the shales has the same magnitude as, and the
opposite sign to, the stress change in the sandstone: shale sandP Pδ δ= − .
To estimate velocity dependence on pressure I use the equation (Eberhart-
Phillips et al., 1989; Shapiro, 2003):
( ) exp( )V P A KP B PD= + − − , (4.1)
where V is the P-wave velocity (in m/s), P is the effective stress (in MPa), A, K, B and D
are fitting parameters for the set of measurements.

Chapter 4 - CHARACTERIZATION OF THIN STRATIFICATION
_______________________________________________________________________
81
The elastic moduli of the sand/shale package are computed using Backus
averaging (Backus, 1962; Mavko et al., 1998). The long-wave equivalent P-wave
modulus 0avM
and density 0
avρ of the package before production can be written as
0
1 1( ) ( )av sand shale
N NM M P M P
−= + , (4.2)
and
0 ( ) (1 ) ( )av sand shaleN P N Pρ ρ ρ= + − . (4.3)
After depletion or production we have
1
1 1( ) ( )av sand shale
N NM M P P M P P
−= +
+ Δ − Δ , (4.4)
and
1 ( ) (1 ) ( )av sand shaleN P P N P Pρ ρ ρ= + Δ + − − Δ , (4.5)
where ( )sandM P , ( )shaleM P , ρsand(P) and ρshale(P) are P-wave moduli and densities of
sand and shales, respectively, at effective pressure P, N is the net to gross (sand-shale
ratio). The superscripts 0 and 1 refer to times before and after production and 1 0P P PΔ = − is effective pressure change between the two surveys.
4.2.3 A case study for a clastic reservoir in Campos Basin
In this subsection I analyse the seismic combined response (1D) using real data
from a clastic reservoir in Campos Basin. In this basin there are more than 40 oil fields
from different ages, representing a variety of reservoir properties. Each field and each
reservoir has its own characteristics in terms of lithology, grain size, and cementation. I
analyse rock properties from a clastic reservoir located in the south portion of Campos

Chapter 4 - CHARACTERIZATION OF THIN STRATIFICATION
_______________________________________________________________________
82
Basin, around 100 km off the coast of Rio de Janeiro (south eastern Brazil), in a water
depth of approximately 700 m.
In deep and ultra-deep water projects, it is important to avoid costly workovers;
therefore programs of pressure maintenance are frequently used (Bruhn et al., 2003).
Close to the water injector wells, pore pressure can significantly increase, whereas in
other positions it could decrease due to depletion, resulting in higher effective pressure.
The sub seismic intra-reservoir shale layers can vary in thickness and content (NTG)
(Figure 4.6). Considering the variation of NTG and the possible lateral variation of
effective pressure within the reservoir, the understanding of the combined seismic
response of small scale intra-reservoir shales may be essential for quantitative 4D
interpretations.

Chapter 4 - CHARACTERIZATION OF THIN STRATIFICATION
_______________________________________________________________________
83
Figure 4.6: Gamma-ray logs over the reservoir interval for 4 wells located in an oil field
in Campos Basin. The reservoir is comprised of sandstones (orange) and shales (white,
GR > 55) with composition (NTG) varying laterally.

Chapter 4 - CHARACTERIZATION OF THIN STRATIFICATION
_______________________________________________________________________
84
The reservoir is comprised of gravel to sand rich lobes - mainly arkosic
sandstone - from confined turbidities related to Santonian / Campanian Stage. This 45 m
thick reservoir is comprised of an amalgamation of turbidites intercalated by shale layers
with thickness ranging from centimetres to several meters. After the discovery in 1984,
oil production started in 1985 and the reservoir (hydraulically interconnected) has been
depleted by natural water aquifer and water injection. There are 25 wells producing
29°API oil, permeability is 1500 mD and temperature 89ºC. The current and forecast
recovery factors are 38% and 55%, respectively, and reservoir monitoring is important
to locate unswept areas and map pressure variations.
Ultrasonic measurements were routinely done on sandstones and, in some cases,
on shales to calibrate velocity sensitivity to pressure. A sinusoidal pulse with the central
frequency 500 kHz was propagated through the sample and for each step of pressure
increment velocities were determined from the travel time and the length of each
sample.
The velocity-pressure dependence is obtained by fitting equation (4.1) to
ultrasonic data using a nonlinear least-squares regression (Figure 4.7). The fitting
parameters A, K, B and D for the set of measurements are, respectively, A = 2.86·103,
K = 6.40, B = 1.04·103, D = 0.205 for sand; and A = 3.43·103, K = 0.0, B = 0.27·103,
D = 0.0585 for shale.
I consider two production scenarios: injection and depletion. During injection,
the pore pressure in the sand increases by 10PΔ = MPa, causing a decrease of effective
pressure for shales by the same amount. During the depletion the opposite happens: pore
pressure decreases: 10PΔ = − MPa (Figure 4.7), causing corresponding increase of
effective pressure on shale layers.

Chapter 4 - CHARACTERIZATION OF THIN STRATIFICATION
_______________________________________________________________________
85
Figure 4.7: Velocity dependency on effective pressure from ultrasonic measurements for
sand (brown) and shales (green). During depletion (red arrow) sand increases velocity
(hardening) whereas shale decreases (softening). During injection (blue arrow) the
opposite occurs.

Chapter 4 - CHARACTERIZATION OF THIN STRATIFICATION
_______________________________________________________________________
86
From the original pressure condition, using equation (4.1) I compute new
velocities for sandstone and shale for both scenarios: pressure increase (10 MPa) and
decrease (-10 MPa). Using these velocities, I calculate average P-wave moduli ( avM )
and average density ( avρ ) as a function of net to gross (equations (4.2) and (4.4)). In the
range of stress considered, density is expected to vary by no more than 0.1% (Mavko
and Jizba, 1991; Gurevich, 2004); thus it is assumed to be independent of pressure0 1( )av avρ ρ= . Finally, impedances and reflection coefficients are obtained from P-wave
moduli and densities for each net to gross increment.
4.2.4 Results
Figure 4.8 shows the expected P-wave impedance of a sand/shale package as a
function of NTG for undisturbed conditions (black), and after depletion (red) and
injection (blue) corresponding to change of pressure by ±10MPa. Impedances of this
package increase for higher shale content since shale has higher impedance than sand.
The rate of increase is higher for injection than depletion due to the shape of the stress
sensitivity curves.
The variation of impedance relative to the initial pressure condition as a function
of net to gross is shown in Figure 4.9. In a depletion scenario (red line), hardening
occurs in a reservoir made up only by sand (NTG = 1). This is easily predictable since
pore pressure is reduced, thus hardening the rock. When shale content increases
(reducing NTG), the combined sand/shale impedance response decreases due to shale
expansion, reacting to sand contraction. For NTG smaller than 0.3 the composite
reservoir package changes the expected behaviour: instead of hardening, softening
happens even in a reservoir depletion scenario. For an injection scenario (blue line) the
opposite occurs. These unexpected combined pressure responses could happen even for
higher NTG for shales which are more sensitive to pressure.

Chapter 4 - CHARACTERIZATION OF THIN STRATIFICATION
_______________________________________________________________________
87
Figure 4.8: P-wave impedance of a heterogeneous (shales and sands) reservoir computed
using Backus average. Depletion (red) and injection (blue) of 10 MPa from the initial
(black) conditions are modelled as a function of net to gross.

Chapter 4 - CHARACTERIZATION OF THIN STRATIFICATION
_______________________________________________________________________
88
Figure 4.9: Relative changes in P-wave impedance (Delta IP) relative to the initial
pressure condition as a function of net to gross. Depletion (red) and injection (blue) of
10 MPa are modelled.

Chapter 4 - CHARACTERIZATION OF THIN STRATIFICATION
_______________________________________________________________________
89
Figure 4.9 also shows asymmetry in the impedance response during depletion
and injection as pointed out by Sayers (2007). For a homogeneous sandstone reservoir
(NTG=1) undergoing depletion, the impedance increases by 2.3%, whereas during
injection it decreases by 3.5%.
The impact of intra-reservoir shales on seismic data can be better understood by
looking at reflection coefficients. Figure 4.10 shows P-wave reflection coefficients
related to the top of the heterogeneous reservoir as a function of net to gross. Reflection
coefficients become smaller (by absolute value) with the increase of shale content in the
reservoir. The anticipated dimming effect on 4D data will be more prominent for a
depletion scenario once the composite reservoir impedance is more similar to that of the
overburden rock. When we analyse changes in reflection coefficients due to shale/sand
expansion and contraction, their correct magnitude (as shown in Figure 4.10 for stress
sensitivities in this study) should be taken into account for quantitative time-lapse
interpretation.

Chapter 4 - CHARACTERIZATION OF THIN STRATIFICATION
_______________________________________________________________________
90
Figure 4.10: P-P reflection coefficients corresponding to the interface between the
overburden shale and the heterogeneous reservoir. Depletion (red) and injection (blue)
of 10 MPa from the initial (black) conditions are modelled as a function of net to gross.

Chapter 4 - CHARACTERIZATION OF THIN STRATIFICATION
_______________________________________________________________________
91
4.2.5 Discussion and conclusions
Small scale intra-reservoir shales have a very different response to fluid injection
and depletion from that of sand, and thus may have a strong effect on the equivalent
properties of a heterogeneous sandstone reservoir. I proposed a methodology using
Backus average to compute the combined seismic response for depletion and injection
scenarios as a function of net to gross. This approach is appropriate for modelling time-
lapse effects in repeated seismic surveys when there is no time for pressure in shale and
sand to equilibrate.
I apply this methodology using typical Campos Basin elastic properties. I
conclude that impedances and reflection coefficients may be wrongly estimated without
considering the presence of small scale intra-reservoir shales. The magnitude of the error
in impedance estimation can vary from 3.5% to 0.8% (injection) and 2.3% to -1.5%
(depletion), the same magnitude as many expected changes in real time-lapse effects.
Similarly, reflection coefficients could be largely misestimated if the presence of small
scale intra-reservoir shales is ignored. Considering net to gross of 0.6, for example, the
correct value of the reflection coefficient is -0.053 instead of -0.086 (depletion scenario),
and -0.080 instead of -0.126 (injection scenario). The differences are 38% and 36%,
respectively.
Disregarding the net to gross effect may bias results for frequently repeated
surveys. The time-lapse response from the combined sand-shale reservoir can be even
the opposite of the expected response. Instead of hardening during depletion, softening
could occur. This unexpected behaviour is more likely to happen for low net to gross or
in places where shales have higher sensitivity to pressure, as shallow layers.
Based on presented evidence of net to gross effect on time-lapse response, I
suggest this methodology to be taken into account for quantitative time-lapse studies. I
also suggest expanding analyses to 3D models to incorporate other geomechanical
effects (like stress arching effects).

_______________________________________________________________________
92
Chapter 5
CONCLUSIONS AND FUTURE
RESEARCH
Time-lapse (4D) seismic is a modern geophysical technology for monitoring
producing hydrocarbon fields. This technology can be used to detect changes related to
fluid movements and pressure variations during reservoir depletion or injection. Time-
lapse seismic has evolved during the past decade and become a widespread monitor tool
utilised in petroleum industry. Time-lapse seismic technology has proven extremely
useful in identifying compartments, barriers to flow, unswept zones and improved
characterisation of the reservoir geometry. However time-lapse monitoring has also
potential to optimize production strategy using quantitative mapping of pressure, stress
and saturation in and around the reservoir. To this end, knowledge of the quantitative
dependency of elastic properties on pressure and saturation is required.
In this Chapter I present the main conclusions of the thesis and directions for
future work. The broadness of time-lapse seismic subject means that this thesis cannot
cover all the related problems. However, a number of important challenges have been
addressed and several conclusions are presented. These challenges are related to the
investigation of production induced changes in time-lapse seismic data. Both saturation
and pressure effects on elastic parameters have been investigated. I have analysed
pressure effects using information from laboratory and in situ measurements. I have also
integrated seismic, logs, cores, and X-ray CT in order to analyse and predict time-lapse
effects on various scales.

Chapter 5 – CONCLUSIONS AND FUTURE RESEARCH
_______________________________________________________________________
93
5.1 Conclusions
Changes in elastic properties due to changes in saturation are usually calculated
using Gassmann equations. Gassmann theory is based on a number of assumptions. In
this research I have proposed a workflow to test the validity of Gassmann theory in a
real geologic environment (Grochau and Gurevich, 2008b, 2009a). To this end, I
compared saturated P-wave moduli computed from dry core measurements against those
obtained from sonic and density logs. The workflow was tested with a dataset from
Campos Basin, Brazil. The results show good statistical agreement between the P-wave
elastic moduli computed from cores using Gassmann equation and the corresponding
moduli computed from log data. This confirms that all the assumptions of the Gassmann
equations are adequate within the measurement error and natural variability of elastic
properties. The proposed workflow and the results obtained provide further justification
for using the Gassmann theory to interpret time-lapse effects in similar geological
formations.
In this thesis I have also analysed the pressure – velocity dependence of rocks. It
was done from two different perspectives: as obtained from ultrasonic measurements
and from in situ measurements (logs). The pressure effect on seismic velocities is
usually obtained from core samples, and they may not be representative of the in situ
formation due to core damage. One of the achievements of this thesis is to present a
methodology to assess the adequacy of ultrasonic measurements to the in situ properties
from core samples (Grochau and Gurevich, 2007a, b, 2008a). Dispersion effects have
been minimized by using dry cores and then computing saturated velocities using
Gassmann equations. To mitigate under-representation, cores were extracted over all
reservoir interval. Then I compared measured ultrasonic velocities at reservoir pressure
with sonic-log data, and the saturated velocities computed from core measurements on
dry samples match the sonic-log velocities quite well. The core damages that may occur
while bringing the core samples to the surface are small and do not adversely affect the
measurement of elastic properties on these core samples. Should core damage have

Chapter 5 – CONCLUSIONS AND FUTURE RESEARCH
_______________________________________________________________________
94
affected our measurements, we would have expected a systematic difference between
properties measured in situ and on the recovered. Consequently, stress sensitivity of
elastic parameters, as obtained from ultrasonic measurements (including core
preservation during extraction), is adequate for quantitative interpretation of time-lapse
seismic data.
Another achievement of this research is to present a method to infer the in situ
pressure – velocity relationship using log data from wells drilled and logged during field
development. I have analysed velocity variations as a function of both pressure and
porosity. The three dimensional regression proposed in this thesis aims to help account
for rock property variability. The proposed methodology was applied to a reservoir with
heavy depletion. The in situ stress sensitivity of elastic properties was analysed from
twenty three well logs and from repeated formation tester. The pore pressure changes in
time and space suggest two distinct hydraulic compartments. I plotted, in three
dimensions, all values (Vp, φ and Peffec) corresponding to this sandstone and a plane was
fitted among these hundreds of points using a least-square method for each
compartment. I also compared the relationship between Vp, -φ - Peffec, from in situ
approach and the laboratory measurements, which showed similar results for the
reservoir’s mean properties. Despite using constraints (same stratigraphic unit, gamma-
ray and porosity cut-offs), there was still significant porosity variability. Therefore, I
concluded that the uncertainties related to rock and fluid properties remain high. The
main intrinsic uncertainties in this methodology are caused by rock heterogeneity and
errors in effective pressure estimation. Consequently, for this particular dataset from
Campos Basin, the results are not completely reliable to assure the true in situ pressure –
velocity – porosity relationship. Spatial variations (heterogeneity), perhaps, mask a
relatively small pressure effect. In more favourable conditions (higher rock
homogeneity) or steeper part of pressure-velocity curve, this methodology may be used
as a complementary assessment of rock elastic properties together with the ones derived
from core measurements.

Chapter 5 – CONCLUSIONS AND FUTURE RESEARCH
_______________________________________________________________________
95
Production induced effects in time-lapse seismic data often occur in small scale
layers, below seismic resolution. Ideally, in order to model or interpret these effects,
those layers should be identified and taken into account. In this thesis I have
demonstrated that even high resolution logs may not identify very thin layers. Thus I
have proposed a methodology to assess rock properties and to overcome log (and
seismic) resolution limitation by using X-ray computed tomography (CT) together with
ultrasonic measurements (Grochau et al., 2009). This methodology was applied to rocks
extracted from a deepwater oil field, offshore Brazil at 2.8 km depth. Densely sampled
X-ray CT images over a shale/marl interval revealed small scale sedimentary
heterogeneity and thereby aided the interpretation of petrophysical and rock physics
measurements. Sedimentary cyclicity was revealed and interpreted as precession cycles
(19 ka periodicity), related to Milankovich cycles. This could potentially reveal other
small scale heterogeneity that could help 4D studies. Possible stress changes in this
interval (reservoir’s overburden rock) due to production or injection in the subjacent
reservoir could further be modelled using this dataset. Moreover, the improved
understanding of physical property variations may help to correlate stratigraphy between
wells and to calibrate pressure effects on velocities for seismic time-lapse studies.
Another achievement of this thesis was the development of a methodology to
compute the combined seismic response of a reservoir undergoing pressure changes as a
function of net to gross (NTG or sand – shale fraction). Considering clastic reservoirs, it
is usual to have sub-seismic low permeability shales intercalated within a sandstone
reservoir. During depletion, the sandstone compacts and the shales may expand. During
injection, the opposite occurs. To evaluate the effect of thin shale layers on the reservoir
stress sensitivity response, I have applied the methodology using Backus average to a
typical clastic reservoir located in Campos Basin, offshore Brazil. I concluded that
impedances and reflection coefficients may be erroneously estimated without
considering the presence of small scale intra-reservoir shales (Grochau and Gurevich,
2009b). The magnitude of the error in impedance estimation can vary from 3.5% to

Chapter 5 – CONCLUSIONS AND FUTURE RESEARCH
_______________________________________________________________________
96
0.8% (injection) and 2.3% to -1.5% (depletion), i. e., the same magnitude of generally
expected changes in real 4D effects. The reflection coefficients could be poorly
estimated if the presence of small scale intra-reservoir shales is ignored. Disregarding
the net to gross effect may bias results for frequently repeated surveys. The 4D response
from the combined sand-shale reservoir can even be the opposite of the expected
response. Instead of hardening during depletion, softening could occur for low NTG or
in places where shales have higher sensitivity to pressure, as shallow layers.
5.2 Future Research
I found that Gassmann equations are adequate within the measurement error and
natural variability of elastic properties in the area under study (Section 2.3). Tests in
other geological environments with different rocks (e. g. carbonates), fluid content and
pressure ranges may affect more significantly Gassmann predictions. Similar tests of
Gassmann assumptions should be done in different parts of the world to verify how
generic the conclusions obtained in this research are.
Regarding the evaluation of pressure – velocity relationship from core
measurements (Section 3.1), I also suggest applying the methodology proposed in this
research (to test core integrity by comparing with measured sonic logs) in other regions
and petrophysical conditions. Obtaining a good match between computed saturated
velocities from measurements in dry cores and sonic logs may indicate the adequacy of
core extraction and preservation processes. On the other hand, mismatch between both
datasets may indicate those processes should be reviewed. This could be a standard
quality control step for 4D studies because it indicates the reliability of pressure -
velocity –relationship obtained from cores.
Concerning the velocity dependence on pressure from the in situ approach
(Section 3.2), it is necessary to investigate other factors that may affect velocities. I
suggest for future works including more physical quantities than those investigated here

Chapter 5 – CONCLUSIONS AND FUTURE RESEARCH
_______________________________________________________________________
97
(Vp, φ and Peffec), e. g., cementation. Another suggestion for further work is to take into
account lateral stresses in order to have a better representation of the effective pressure. I
recommend to further explore the in situ approach, particularly in mature oil fields,
where many wells with logs are usually available. The use of well logs can give a
significant increase in spatial coverage of information in comparison to the typically
sparse sampling provided by cores. Furthermore, the joint comparison of in situ and
laboratory approaches may provide robustness for determining the pressure – velocity
relationship. Considering that the pressure response is much quicker than the saturation
response, the understanding of the pressure changes can significantly contribute to the
early identification of preferential zones and barriers within the reservoir.
In order to identify time-lapse effects in thin layers (Section 4.1), I suggest
routinely analysing X-ray computed tomography images from all core samples extracted
from drilled wells. Based on the correlation of X-ray absorption, logs and ultrasonic
measurements, petrophysical properties may be derived. A natural improvement from
this research is to compute X-ray absorption from a three dimensional volume rather
than using a two dimensional image. A three dimensional visualization of X-ray
absorption could guide the selection process of plug extraction from cores to perform
ultrasonic measurements. Otherwise a bias may be introduced caused by performing
ultrasonic measurements only in the most preserved regions of the extracted cores. I
suggest for future work, the use of high resolution information derived from CT images
to improve correlation between wells and to model time-lapse response in details.
In relation to thin intra-reservoir shale layers (net to gross) behaviour during
depletion and injection (Section 4.2), I suggest expanding the approach presented in this
research to a three dimensional investigation. This could be done using both numerical
and physical models to incorporate other geomechanical effects (like stress arching
effects). The physical models to be created, could mimic real depositional environments
and applying simulated production effects (pressure and saturation changes) on these
models it may be possible to obtain useful insights. I also suggest evaluating the time

Chapter 5 – CONCLUSIONS AND FUTURE RESEARCH
_______________________________________________________________________
98
scale which should affect pressure equilibration between sands and low permeable
shales.

_______________________________________________________________________
99
REFERENCES
Al-Naijjar, N., P. Doyen, I. Brevik, L. Kvamme, and D. Psaila, 1999, Statfjord field – time-lapse seismic interpretation using a 4D earth model: Presented at SEG Annual International Meeting, Expanded Abstracts.
Amundsen, L., and M. Landro, 2007, 4D seismic – status and future challenges, Recent Advances in Technology: GEO ExPro, 66-68.
Anderson, R. N., A. Boulanger, W. He, L. Xu, P. B. Flemings, T. D. Burkhart, and A. R. Hoover, 1997, 4-D time-lapse seismic monitoring in the south Timbalier 295 field, Gulf of Mexico: 67th Ann. Internat. Mtg., Soc. Expl. Geophys., Expanded Abstracts, 868–871.
Artola, F. A. V., and V. Alvarado, 2006, Sensitivity analysis of Gassmann's fluid substitution equations: some implications in feasibility studies of time-lapse seismic reservoir monitoring: Applied Geophysics, 59, 47-62.
Azambuja, N. C., A. H. A. Castro, A. A. S. Cunha, C. R. Becker, C. F. Santos, J. G. R. Silva, J. M. C. Mendes, M. C. G. Severino, P. R. C. Cunha, and R. L. M. Azevedo, 2007, Application of Climatic Changes to Understand Sedimentary Processes and a Tool to Refine the Stratigraphy in Brazilian Sedimentary Basins - An Overview: AAPG Annual Conference.
Backus, G. E., 1962, Long-wave elastic anisotropy produced by horizontal layering: Journal of Geophysical Research, 67, 4427-4440.
Barbosa, V., A. Cunha, S. Shimabukuro, and L. Gamboa, 2007, Relative sea level variations driven by short-term orbital-climatic cycles in Campos Basin during the Oligocene: a palaeoecological, biostratigraphic and cyclostratigraphic approach. Geological Society Bicentenary Conference, Expanded Abstracts, 145-148.
Batzle, M., D.-h. Han, and R. Hofmann, 2006, Fluid mobility and frequency-dependent seismic velocity — Direct measurements: Geophysics, 71, no. 1, N1-N9.
Berryman, J. G., 1999, Origin of Gassmann’s equations: Geophysics, 64, 1627-1629.
Biot, M., 1956a, Theory of propagation of elastic waves in a fluid saturated porous solid; I-Low frequency range: Journal of the Acoustical Society of America, 28, 168-178.
—, 1956b, Theory of propagation of elastic waves in a fluid saturated porous solid; II-High frequency range: Journal of the Acoustical Society of America, 28, 179-191.
Brown, R.J.S., J. Korringa, 1975. On the dependence of the elastic properties of a porous rock on compressibility of a pore fluid. Geophysics, 40, 608– 616.

REFERENCES
_______________________________________________________________________
_______________________________________________________________________
100
Brown, L., and B. Gurevich, 2004, Frequency-dependent seismic anisotropy of porous rocks with penny-shaped cracks: Exploration Geophysics, 35, 111-115.
Bruhn, C. H. L., C. D. Lucchese, J. A. T. Gomes, and P. R. S. Johann, 2003, Campos Basin: Reservoir characterization and management — Historical overview and future challenges: Presented at Offshore Technology Conference, OTC - Expanded Abstracts.
Burkhart, T., A. Hoover, and P. B. Flemings, 2000, Time-lapse (4-D) seismic monitoring of primary production of turbidite reservoirs at South Timbalier Block 295, offshore Louisiana, Gulf of Mexico: Geophysics, 65, 351-367.
Calvert, R., 2005, Insights and methods for 4D reservoir monitoring and characterization: Society of Exploration Geophysicists.
Cunha, A. A., and E. A. M. Koutsoukos, 2001, Orbital cyclicity in a Turonian sequency of the Cotinguiba Formatio, Sergipe Basin, NE Brazil: Cretaceous Research, 22, 529-548.
Desrues, J., G. Viggiani, and P. Besuelle, 2006, Advances in X-ray tomography for geomaterials: Presented at International Workshop on X-ray CT for Geomaterials.
Eberhart-Phillips, D., D.-H. Han, and M. D. Zoback, 1989, Empirical relationships among seismic velocity, effective pressure, porosity and clay content in sandstone: Geophysics, 54, 82-89.
Eiken, O., and R. Tøndel, 2005, Sensitivity of time-lapse seismic data to pore pressure changes: Is quantification possible?: The Leading Edge, 24, 1250-1254.
Eastwood, J., P. Lebel, A. Dilay, and S. Blakeslee, 1994, Seismic monitoring of steam-based recovery of bitumen: The Leading Edge, 13, 242–251.
Furre, A. K., A. S. Anderson, A. S. Moen, and R. K. Tonnessen, 2009, Deriving effects of pressure depletion on elastic framework moduli from sonic logs: Geophysical Prospecting, 58, 1-11.
Gabriels, P. W., N. A. Horvei, J. K. Koster, A. Onstein, A. Geo, and R. Staples, 1999, Time lapse seismic monitoring of the Draugen Field: Presented at SEG Annual International Meeting, Expanded Abstracts.
Gassmann, F., 1951, Uber die Elastizitat poroser Medien: Verteljahrsschrift der Naturforschenden Gesellschaft in Zurich, 96, 1-23.
Gommesen, L., I. L. Fabricius, T. Mukerji, G. Mavko, and J. M. Pedersen, 2007, Elastic behaviour of North Sea chalk: A well-log study: Geophysical Prospecting, 55, 307-322.
Greaves, R. J., and T. J. Fulp, 1987, Three-dimensional seismic monitoring of an enhanced oil recovery process: Geophysics, 52, 1175–1187.

REFERENCES
_______________________________________________________________________
_______________________________________________________________________
101
Grochau, M., and B. Gurevich, 2007a, Effect of core damage on elastic properties for time-lapse interpretation, offshore Brazil: Presented at Annual Rock Physics Workshop.
—, 2007b, Investigation of core data reliability to support time-lapse interpretation in Campos Basin, Brazil: Presented at SEG Annual International Meeting (Award of Merit: Best student paper in 2007).
—, 2008a, Investigation of core data reliability to support time-lapse interpretation in Campos Basin, Brazil: Geophysics, 73, E59-E65.
—, 2008b, Testing Gassmann fluid substitution using sonic logs and core measurements in a sandstone reservoir: Presented at EAGE Conference & Exhibition.
—, 2009a, Testing Gassmann fluid substitution: sonic logs versus ultrasonic core measurements: Geophysical Prospecting, 57, 75-79.
—, 2009b, Effect of net to gross on time-lapse seismic response in Campos Basin, Brazil: Accepted for SBGf International Conference.
Grochau, M., E. Campos, T. Muller, B. Clennell, and B. Gurevich, 2009, Using CT images to improve rock physics calibrations and stratigraphic analysis: an example from Campos Basin, Brazil: Accepted for EGU International Conference.
Gurevich, B., 2004, A simple derivation of the effective stress coefficient for seismic velocities in porous rocks: Geophysics, 69, 393-397.
Hannah, T., L. R. Bentley, and E. S. Krebes, 2005, Monitoring fluid injection in a carbonate pool using time-lapse analysis: Rainbow Lake case study: The Leading Edge, 24, 530-534.
Hansen, H. J., L. Gommesen, and Y. El Ouair, 2006, Using RFT data for elastic rock properties’ dependency on pore pressure in 4D quantitative analysis: Presented at EAGE meeting, Expanded Abstracts.
Harris, J. M., R. T. Langan, T. Fasnacht, D. Melton, B. Smith, J. Sinton, and H. Tan, 1996, Experimental verification of seismic monitoring of CO2 injection in carbonate reservoirs: Presented at SEG Annual International Meeting, Expanded Abstracts. 1870–1872.
Hatchell, P., and S. Bourne, 2005, Rocks under strain: Strain-induced time-lapse time shifts are observed for depleting reservoirs: The Leading Edge, 24, 1222-1225.
Holt, R. M., M. Brignoli, and C. J. Kenter, 2000, Core quality: Quantification of coring-induced rock alteration: International Journal of Rock Mechanics and Mining Sciences, 37, 889-907.
Holt, R. M., O. M. Nes, and E. Fjaer, 2005, In-situ stress dependence of wave velocities in reservoir and overburden rocks: The Leading Edge, 24, 1268-1274.

REFERENCES
_______________________________________________________________________
_______________________________________________________________________
102
Jenkins, S. D., M. W. Waite, and M. F. Bee, 1997, Time-lapse monitoring of the Duri steamflood: A pilot and case study: The Leading Edge, 16, 1267–1273.
Johnstad, S. E., R. H. Seymour, and P. J. Smith, 1995, Seismic reservoir monitoring over the Oseberg field during the period 1989–1992: First Break, 13, 169-183.
Johnston, D., J. Shyeh, and J. Eastwood, 1999, Interpretation and modeling of time-lapse seismic data: Lena Field, Gulf of Mexico: Presented at SEG Annual International Meeting, Expanded Abstracts.
Kahraman, S., 2007, The correlations between the saturated and dry P-wave velocity of rocks: Ultrasonics, 46, 341-348.
Landro, M., 2001, Discrimination between pressure and fluid saturation changes from time-lapse seismic data: Geophysics, 66, 836-844.
Landro, M., 2008, Source strength variations and 4D seismic: Presented at SEG Annual International Meeting, Expanded Abstract.
Lumley, D., 1995a, 4-D seismic monitoring of an active steamflood: Presented at SEG Annual International Meeting, Expanded Abstract, 203–206.
—, 1995b, Seismic time-lapse monitoring of subsurface fluid flow: Ph.D. Thesis, Stanford University.
Lumley, D., 2001, Time-lapse seismic reservoir monitoring: Geophysics, 66, 50-53.
—, 2004, Business and technology challenges for 4D seismic reservoir monitoring: The Leading Edge, 23, 1166-1168.
Lumley, D., R.A. Behrens, and Z. Wang, 1997, Assessing the technical risk of a 4D seismic project: The Leading Edge, 16, 1287-1291.
Lumley, D., S. Cole, M. Meadows, A. Tura, B. Hottman, B. Cornish, M. Curtis, and N. Maerefat, 2000, A risk analysis spreadsheet for both time-lapse VSP and 4D seismic reservoir monitoring: Presented at SEG Annual International Meeting, Expanded Abstracts.
MacBeth, C., K. Stephen, and A. Gardiner, 2008, The impact of sub-seismic shale layers on the reservoir’s stress sensitivity: Presented at SEG Annual International Meeting, Expanded Abstracts.
Mavko, G., and D. Jizba, 1991, Estimating grain-scale fluid effects on velocity dispersion in rocks: Geophysics, 56, 1940-1949.
Mavko, G., and T. Mukerji, 1998, Bounds on low-frequency seismic velocities in partially saturated rocks: Geophysics, 63, no. 3, 918-924.
Mavko, G., T. Mukerji, and J. Dvorkin, 1998, The rock physics handbook - tools for seismic analysis in porous media: Cambridge University Press.

REFERENCES
_______________________________________________________________________
_______________________________________________________________________
103
Meadows, M., D. Adams, R. Wright, A. Tura, S. Cole, and D. Lumley, 2005, Rock physics analysis for time-lapse seismic at Schiehallion field, North Sea: Geophysical Prospecting, 53, 205-213.
Mees, F., R. Swennen, M. Van Geet, and P. Jacobs, 2003, Applications of X-ray computed tomography in the geosciences: Geological Society London Special Publications, 215, 1-6.
Meunier, J., and F. Huguet, 1998, Cere-la-Ronde: A laboratory for time-lapse seismic monitoring in the Paris Basin: The Leading Edge, 17, 1388, 1390, 1392–1394.
Moore, D. M., and R. C. J. Reynolds, 1997, X-Ray diffraction and the identification and analysis of clay mineral: Oxford University Press.
Murphy, W. F. I., J. N. Roberts, D. Yale, and K. W. Winkler, 1984, Centimeter scale heterogeneities and microstratification in sedimentary rocks: Geophysical Research Letters, 11, 697-700.
Nes, O. M., M. H. Holtz, and E. Fjaer, 2002, The reliability of core data as input to seismic reservoir monitoring studies: Presented at SPE Annual International Meeting.
Nur, A., 1989, Four-dimensional seismology and (true) direct detection of hydrocarbons: The petrophysical basis: The Leading Edge, 8, 30-36.
Nur, A., C. Tosaya, and D. Thanh, 1984, Seismic monitoring of thermal enhanced oil recovery processes: Presented at SEG Annual International Meeting, Expanded Abstracts.
Oldenziel, T., 2003, Time-lapse seismic within reservoir engineering: Delft University of Technology.
Pickering, S., 2006, Time-lapse seismic technology - Past, Present and Future: E&P Magazine, Hart Energy Publishing.
Pullin, N., L. Matthews, and K. Hirsche, 1987, Techniques applied to obtain very high resolution three-dimensional seismic imaging at an Athabasca tar sands thermal pilot: The Leading Edge, 6, 10–15.
Rothwell, R. G., and F. R. Rack, 2006, New techniques in sediment core analysis: an introduction: Geological Society London Special Publications, 267, 1-29.
Rutledal, H., J. Helgesen, and H. Buran, 2003, 4D elastic inversion helps locate in-fill wells at Oseberg field: First Break, 21, 39-43.
Sayers, C. M., 2007, Asymmetry in the time-lapse seismic response to injection and depletion: Geophysical Prospecting, 55, 699-705.
Shapiro, S. A., 2003, Elastic piezosensitivity of porous and fractured rocks: Geophysics, 68, 482-486.

REFERENCES
_______________________________________________________________________
_______________________________________________________________________
104
Sheriff, R. E., and L.P. Geldart, 1995, Exploration seismology: Cambridge University Press.
Smith, M., A. Gerhardt, L. Bourdon, and B. Mee, 2007, Using 4D seismic data to understand production-related changes in Enfield, NWS Australia: Presented at ASEG, Expanded Abstracts.
Smith, M., A. Gerhardt, B. Mee, T. Ridsdill-Smith, A. Wulff, and L. Bourdon, 2008, The Benefits of Early 4D Seismic Monitoring to Understand Production Related Effects at Enfield, North West Shelf, Australia: Presented at SEG Expanded Abstracts, Expanded Abstracts.
Smith, P. J., J. I. Berg, F. Verhelst, and J. Helgesen, 2001, 4-D seismic in a complex fluvial reservoir: The Snorre feasibility study: The Leading Edge, 20, 270-276.
Sonneland, L., H. H. Veire, B. Raymond, C. Signer, L. Pedersen, S. Ryan, and C. Sayers, 1997, Seismic reservoir monitoring on Gullfaks: The Leading Edge, 16, 1247-1252.
Staples, R., J. Ita, R. Burrell, and R. Nash, 2007, Monitoring pressure depletion and improving geomechanical models of the Shearwater Field using 4D seismic: The Leading Edge, 26, 636-642.
Staples, R., J. Stammeijer, S. Jones, J. Brain, F. Smith, and P. Hatchell, 2006, Time-Lapse (4D) Seismic Monitoring - Expanding Applications: Presented at CSPG - CSEG - CWLS Convention.
Tura, A., T. Barker, P. Cattermole, C. Collins, J. Davis, and P. Hatchell, 2005, Monitoring primary depletion reservoirs using amplitudes and time shifts from high-repeat seismic survey: The Leading Edge, 24, 1214-1221.
Veire, H. H., S. B. Reymond, C. Signer, P. O. Tennebo, and L. Sonneland, 1998, Estimation of reservoir fluid volumes through 4D seismic analysis on Gullfaks: Presented at SEG Expanded Abstracts, Expanded Abstracts.
Waal, H., and R. Calvert, 2003, Overview of global 4D seismic implementation strategy: Petroleum Geoscience, 9, 1-6.
Walls, J. D., and M. B. Carr, 2001, The use of fluid substitution modeling for correction of mud filtrate invasion in sandstone reservoirs: Presented at SEG Annual International Meeting, Expanded Abstract, 385-387.
Wang, Z., 2000, The Gassmann equation revisited: Comparing laboratory data with Gassmann’s predictions: Seismic and Acoustic Velocities in Reservoir Rocks - SEG - Recent Developments.
Wang, Z., M.L. Batzle, and A.M. Nur, 1990, Effect of different pore fluids on seismic velocities in rocks: Canadian Journal of Exploration Geophysics, 26, no. 1, 2, 104-112.

REFERENCES
_______________________________________________________________________
_______________________________________________________________________
105
Watts, G., D. Jizba, D. Gawith, and P. Gutteridge, 1996, Reservoir monitoring of the Magnus field through 4-D time-lapse seismic analysis: Petroleum Geoscience, 2, 361-372.
Weisenborn, T., and P. Hague, 2005, Time-lapse seismic in Gannet A: One more lead firmly integrated: The Leading Edge, 24, 80-85.
Wellington, S. L., and H. J. Vinegar, 1987, X-ray computerized tomography: Journal of Petroleum Technology: Journal of Petroleum Technology, 39, 885-898.
Winkler, K. W., 1986, Estimates of velocity dispersion between seismic and ultrasonic frequencies: Geophysics, 51, 183-189.
Every reasonable effort has been made to acknowledge the owners of copyright
material. I would be pleased to hear from any copyright owner who has been omitted or
incorrectly acknowledged.

106
APPENDIX A – Papers related with time-lapse (4D) studies
Author Publication Year Title Aanonsen SPE International 2003 Effect of Scale Dependent Data Correlations in an Integrated History Matching Loop Combining
Production Data and 4D Seismic Data
Abubakar, A. SEG Expanded Abstracts 2001 A feasibility study on nonlinear inversion of time-lapse seismic data
Acuna, Catalina SEG Expanded Abstracts 2001 Time-lapse multicomponent seismic characterization of Glorieta-Paddock carbonate reservoir at Vacuum Field -New Mexico
Akintunde, Olusoga M.
SEG Expanded Abstracts 2004 Cross-well seismic monitoring of Coal Bed Methane (CBM) production: A case study from the Powder River Basin of Wyoming
Al-Ismaili, I SEG Expanded Abstracts 2004 Matching time-lapse seismic data using neural networks
Almaskeri, Y. SEG Expanded Abstracts 2005 Location and evaluation of flow barriers using 4D seismic
Al-Mazroey, M. SEG Expanded Abstracts 2002 Identifying non-linear time-lapse wavefield perturbations using predictability and spectral coherency
Al-Mazroey, M. SEG Expanded Abstracts 2002 Identifying production zones using time-lapse coherency
Al-Naamani, A. SEG Expanded Abstracts 2003 Constraining the reservoir model of a turbidite reservoir using production and 4D seismic
Al-Naamani, A. SEG Expanded Abstracts 2002 Joint interpretation of the time-lapse P-P and P-S response of a thin-bed reservoir
Al-Najjar, Nazih SPE International 1999 4D Seismic Modelling of the Statfjord Field: Initial Results
Al-Najjar, Nazih SEG Expanded Abstracts 1999 Statfjord field — Time lapse seismic interpretation using a 4-D earth model
Altan, Suat SEG Expanded Abstracts 1997 Time-lapse seismic monitoring: Repeatability processing tests
Altan, Suat SEG Expanded Abstracts 2001 Schiehallion 4D: From time-lapse repeatability study to reservoir monitoring
Altan, Suat SEG Expanded Abstracts 1999 Schiehallion: A 3-D time - lapse processing case history
Anderson, Roger N. The Leading Edge 1998 4-D seismic reservoir simulation in a South Timbalier 295 turbidite reservoir
Anderson, Roger N. SEG Expanded Abstracts 1997 4D time-lapse seismic monitoring in the South Timbalier 295 field, Gulf of Mexico
Angerer, Erika SEG Expanded Abstracts 2000 Time-lapse seismic changes in a CO2 injection process in a fractured reservoir
Artola, Fredy A.V. Journal of Applied Geophysics
2005 Sensitivity analysis of Gassmann's fluid substitution equations: Some implications in feasibility studies of time-lapse seismic reservoir monitoring
Arts, R. Energy, Volume 29 2004 Monitoring of CO2 injected at Sleipner using time-lapse seismic data
Ashbaugh, James P. SEG Expanded Abstracts 1999 Dynamic reservoir characterization of the ST295 field (offshore Louisiana): Reservoir simulation, acoustic modeling, and time-lapse seismic refines geologic model and illuminates dynamic behavior

107
Bachrach, Ran SEG Expanded Abstracts 2004 Joint estimation of porosity and saturation and of effective stress and saturation for 3D and 4D seismic reservoir characterization using stochastic rock physics modeling and Bayesian inversion
Bair, J. F. SEG Expanded Abstracts 1999 Time-lapse imaging of steam and heat movement in the Cymric 36W Cyclic Steam Pilot using crosswell seismology
Bard, Karen C. SPE International 1999 Tracking Miscible Processes in the Subsurface Utilizing Time Lapse Shear Wave Seismic Data
Barker, Ron The Leading Edge 1998 The application of time-lapse electrical tomography in groundwater studies
Barkved, Olav I. SEG Expanded Abstracts 2004 Continuous seismic monitoring
Beasley, Craig J. The Leading Edge 1997 Repeatability of 3-D ocean-bottom cable seismic surveys
Behrens, Ronald SPE International 2001 4D Seismic Monitoring of Water Influx at Bay Marchand: The Practical Use of 4D in an Imperfect World
Behrens, Ronald SPE International 2002 4D Seismic Monitoring of Water Influx at Bay Marchand: The Practical Use of 4D in an Imperfect World
Benson SPE International 2000 Time-Lapse Seismic Monitoring and Dynamic Reservoir Characterization, Central Vacuum Unit, Lea County, New Mexico
Benson SPE International 1998 Time-Lapse Seismic Monitoring and Dynamic Reservoir Characterization, Central Vacuum Unit, Lea County, New Mexico
Berkhout, A. J. Geophysics 2001 Seismic imaging beyond depth migration
Bertrand, A. SEG Expanded Abstracts 2002 Seawater velocity variations and their impact in permanent installations for reservoir monitoring
Bertrand, A. SEG Expanded Abstracts 2004 Uncertainties in the 4D seismic signature due to seawater velocity variations
Bianchi, T. SEG Expanded Abstracts 2004 Acquisition and processing challenges in continuous active reservoir monitoring
Birken, Ralf Journal of Applied Geophysics
2000 Use of four-dimensional ground penetrating radar and advanced visualization methods to determine subsurface fluid migration
Bogan, Catherine SPE International 2003 Building Reservoir Models Based on 4D Seismic & Well Data in Gulf of Mexico Oil Fields
Boyd-Gorst, John The Leading Edge 2001 4-D time lapse reservoir monitoring of Nelson Field, Central North Sea: Successful use of an integrated rock physics model to predict and track reservoir production
Brevik, Ivar SEG Expanded Abstracts 1999 Rock model based inversion of saturation and pressure changes from time lapse seismic data
Brinks, John SPE - Colorado School of Mines
2001 Geologic Sequestration: Modeling and Monitoring Injected CO2
Brown, Leo T. SEG Expanded Abstracts 2002 Integration of rock physics, reservoir simulation, and time-lapse seismic data for reservoir characterization at Weyburn Field, Saskatchewan
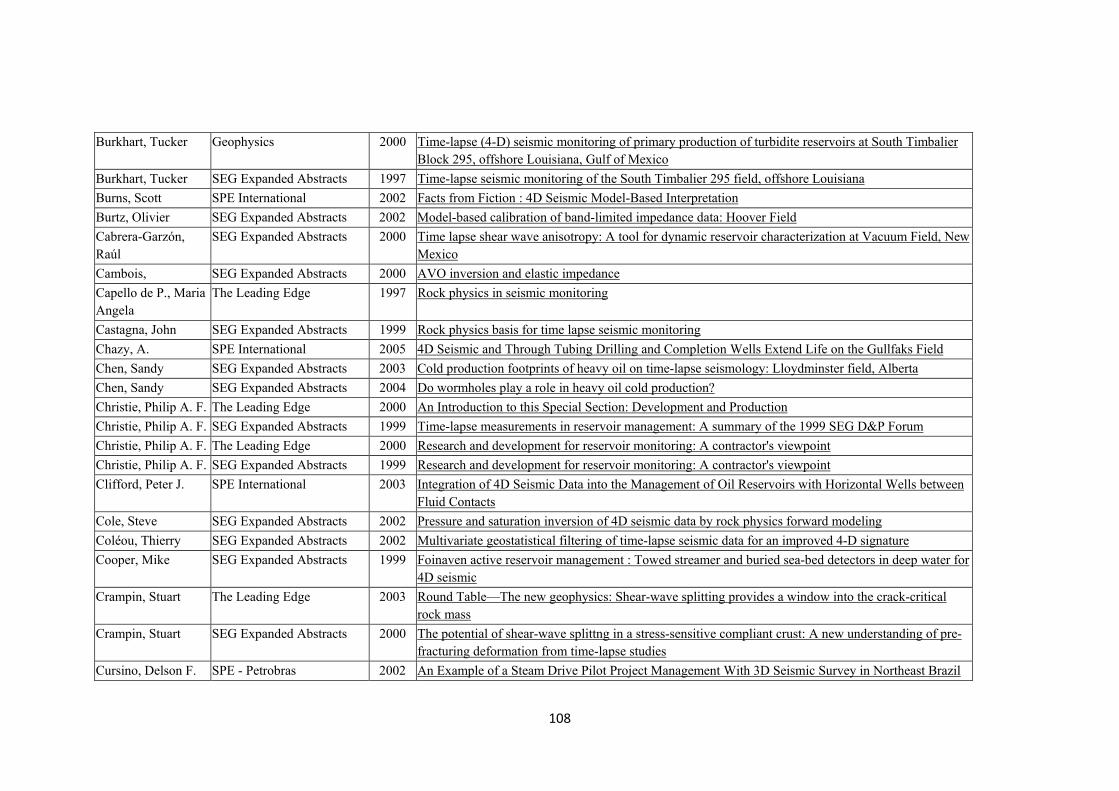
108
Burkhart, Tucker Geophysics 2000 Time-lapse (4-D) seismic monitoring of primary production of turbidite reservoirs at South Timbalier Block 295, offshore Louisiana, Gulf of Mexico
Burkhart, Tucker SEG Expanded Abstracts 1997 Time-lapse seismic monitoring of the South Timbalier 295 field, offshore Louisiana
Burns, Scott SPE International 2002 Facts from Fiction : 4D Seismic Model-Based Interpretation
Burtz, Olivier SEG Expanded Abstracts 2002 Model-based calibration of band-limited impedance data: Hoover Field
Cabrera-Garzón, Raúl
SEG Expanded Abstracts 2000 Time lapse shear wave anisotropy: A tool for dynamic reservoir characterization at Vacuum Field, New Mexico
Cambois, SEG Expanded Abstracts 2000 AVO inversion and elastic impedance
Capello de P., Maria Angela
The Leading Edge 1997 Rock physics in seismic monitoring
Castagna, John SEG Expanded Abstracts 1999 Rock physics basis for time lapse seismic monitoring
Chazy, A. SPE International 2005 4D Seismic and Through Tubing Drilling and Completion Wells Extend Life on the Gullfaks Field
Chen, Sandy SEG Expanded Abstracts 2003 Cold production footprints of heavy oil on time-lapse seismology: Lloydminster field, Alberta
Chen, Sandy SEG Expanded Abstracts 2004 Do wormholes play a role in heavy oil cold production?
Christie, Philip A. F. The Leading Edge 2000 An Introduction to this Special Section: Development and Production
Christie, Philip A. F. SEG Expanded Abstracts 1999 Time-lapse measurements in reservoir management: A summary of the 1999 SEG D&P Forum
Christie, Philip A. F. The Leading Edge 2000 Research and development for reservoir monitoring: A contractor's viewpoint
Christie, Philip A. F. SEG Expanded Abstracts 1999 Research and development for reservoir monitoring: A contractor's viewpoint
Clifford, Peter J. SPE International 2003 Integration of 4D Seismic Data into the Management of Oil Reservoirs with Horizontal Wells between Fluid Contacts
Cole, Steve SEG Expanded Abstracts 2002 Pressure and saturation inversion of 4D seismic data by rock physics forward modeling
Coléou, Thierry SEG Expanded Abstracts 2002 Multivariate geostatistical filtering of time-lapse seismic data for an improved 4-D signature
Cooper, Mike SEG Expanded Abstracts 1999 Foinaven active reservoir management : Towed streamer and buried sea-bed detectors in deep water for 4D seismic
Crampin, Stuart The Leading Edge 2003 Round Table—The new geophysics: Shear-wave splitting provides a window into the crack-critical rock mass
Crampin, Stuart SEG Expanded Abstracts 2000 The potential of shear-wave splittng in a stress-sensitive compliant crust: A new understanding of pre-fracturing deformation from time-lapse studies
Cursino, Delson F. SPE - Petrobras 2002 An Example of a Steam Drive Pilot Project Management With 3D Seismic Survey in Northeast Brazil

109
S. Dasgupta, Shiv N. SEG Expanded Abstracts 2004 Reservoir monitoring with permanent borehole seismic sensors: Ghawar field arab-D reservoir
Davies, Paul SEG Expanded Abstracts 1999 Non-linear cross-equalisaton of seismic surveys acquired with different bandwidths
Davis, Thomas L. The Leading Edge 2003 Multicomponent seismic characterization and monitoring of the CO2 flood at Weyburn Filed, Saskatchewan
Davis, Thomas L. SEG Expanded Abstracts 2003 The future of reservoir characterization
Davis, Thomas L. SEG Expanded Abstracts 2001 Monitoring production processes by 4-D multicomponent seismic surveys at Vacuum Field, New Mexico
Davis, Thomas L. SEG Expanded Abstracts 2004 Weyburn field seismic monitoring project
Day-Lewis, Frederick D.
Geophysics 2002 Time-lapse inversion of crosswell radar data
DeVault, Bryan Geophysics 2002 Multicomponent AVO analysis, Vacuum field, New Mexico
Dewhurst, David N. SEG Expanded Abstracts 2004 Impact of stress and sedimentary anisotropies on velocity anisotropy in shale
Dey, A. SEG Expanded Abstracts 2004 A convolutional earth: Modeling, inversion and time-lapse considerations
DiFrancesco, Daniel J.
SEG Expanded Abstracts 2002 Time lapse gravity gradiometry for reservoir monitoring
Dillen, Menno SEG Expanded Abstracts 2000 Convolution type interaction of time-lapse acoustic wave fields
Dong, Yannong SPE - Society of Petroleum Engineers
2005 Quantitative Use of 4D Seismic Data for Reservoir Description
Dorrington, Kevin P. SEG Expanded Abstracts 2002 A genetic algorithm/neural network approach to seismic attribute selection for well log prediction
Druzhinin, A. SEG Expanded Abstracts 2001 Factorized ray tracing for time-lapse seismic reservoir monitoring
Dubucq, Dominique SEG Expanded Abstracts 2003 Deep offshore seismic monitoring: The Girassol field, a West Africa textbook example
Duranti, Luca SEG Expanded Abstracts 2000 Time-lapse analysis and detection of fluid changes at Vacuum field, New Mexico
Eastwood, John SEG Expanded Abstracts 1998 Processing for robust time-lapse seismic analysis: Gulf of Mexico example, Lena Field
Ebrom, Dan SEG Expanded Abstracts 2002 Numerical modeling of PS moveout as a function of pore pressure
Ebrom, Dan SEG Expanded Abstracts 1999 Offshore multicomponent seismics for time-lapse observations
Ecker, Christine SEG Expanded Abstracts 1999 Estimating separate steam thickness and temperature maps from 4D seismic data: An example from San Joaquin Valley, California
Eiken, Ola The Leading Edge 2005 Sensitivity of time-lapse seismic data to pore pressure changes: Is quantification possible?

110
Eiken, Ola SEG Expanded Abstracts 2002 Repeated seismic surveys from the Norwegian Sea using new streamer technology
Eiken, Ola SEG Expanded Abstracts 2004 Gravimetric monitoring of gas production from the Troll field
Elde, Rigmor M. SEG Expanded Abstracts 2000 Troll West — Time lapse processing and analysis
Elde, Rigmor M. SPE International 2000 Troll West - Reservoir Monitoring by 4D Seismic
Ellison, Shelley J. Geophysics 2004 Modeling offset-dependent reflectivity for time-lapse monitoring of water-flood production in thin-layered reservoirs
Ellison, Shelley J. SEG Expanded Abstracts 2001 Modeling offset-dependent reflectivity for time-lapse monitoring of water flood production in thin-layered reservoirs
Erdemir, Cemal SEG Expanded Abstracts 2002 Multi-mode, multi-component time-lapse imaging at Lost Hills
Fagervik, K. SEG Expanded Abstracts 2001 A method for performing history matching of reservoir flow models using 4D seismic
Falcone, Gioia SPE International 2004 Petroelastic Modelling as Key Element of 4D History Matching: A Field Example
Fanchi, John R. The Leading Edge 2001 Time-lapse seismic monitoring in reservoir management
Fanchi, John R. Journal of Petroleum Science and Engineering
2001 Integrating forward modeling into reservoir simulation
Fanchi, John R. SPE - Colorado School of Mines
2001 Feasibility of Monitoring CO2 Sequestration in a Mature Oil Field Using Time-Lapse Seismic Analysis
Floricich, Mariano SEG Expanded Abstracts 2005 An engineering approach for separating pressure and saturation using 4D seismic: Application to a Jurassic reservoir in the UK North Sea
Floricich, Mariano SEG Expanded Abstracts 2006 Determination of a seismic and engineering consistent petro-elastic model for time-lapse seismic studies: Application to the Schiehallion Field
Floricich, Mariano EAGE Expanded Abstracts 2006 A new technique for pressure - saturation separation from time-lapse seismic: Schiehallion Case Study
Fuh, Shi-Chie SEG Expanded Abstracts 2004 Comprehensive analysis of hydrocarbon entrapment of the Hsinying gas field and its application to hydrocarbon exploration
Gabriels, Pieter W. SEG Expanded Abstracts 1999 Time lapse seismic monitoring of the Draugen field
Gaiser, James E. SEG Expanded Abstracts 2004 Vector-fidelity benefits of buried OBC detectors at Teal South
Gaiser, James E. The Leading Edge 2001 Multicomponent technology: the players, problems, applications, and trends: Summary of the workshop sessions
Gaiser, James E. SEG Expanded Abstracts 2002 PS-wave azimuthal anisotropy: benefits for fractured-reservoir management
Galikeev, Tagir SEG Expanded Abstracts 2003 Reservoir modeling of a thin carbonate reservoir using geostatistics and 4-D seismic attributes,

111
Weyburn field, Saskatchewan, Canada
Galikeev, Tagir SEG Expanded Abstracts 2002 Reservoir-scale velocity modelling — An integrated part of reservoir characterization
Gan, Lideng SEG Expanded Abstracts 2004 Applying 4D seismic to monitoring water drive reservoir
Gasperikova, Erika SEG Expanded Abstracts 2004 A feasibility study of geophysical methods for monitoring geologic CO2 sequestration
Geo, A. O. A. SEG Expanded Abstracts 1999 Time-lapse seismic - A reservoir engineer's perspective
Gesbert, Stéphane Geophysics 2002 From acquisition footprints to true amplitude
Gibson, Garth The Leading Edge 2004 Business Bottom Line—Optimizing performance: Object storage for seismic applications
Gilbert, Fabien SEG Expanded Abstracts 2002 Downscaling a seismic scale acoustic impedance model with stochastic modeling for uncertainty analysis
Gluck, S. SEG Expanded Abstracts 2000 Time-lapse impedance inversion of post-stack seismic data
Gonzalez, Ezequiel F.
SEG Expanded Abstracts 1999 Discriminating seismic signatures of steam injection from lithology variations: Feasibility study in a Venezuela heavy oil reservoir
Gosselin SPE International 2003 History matching Using Time-lapse Seismic (HUTS)
Goto, Richard SEG Expanded Abstracts 2004 Steered-streamer 4D case study over the Norne field
Gouveia, Wences P. The Leading Edge 2004 Jotun 4D: Characterization of fluid contact movement from time-lapse seismic and production logging tool data
Gouveia, Wences P. SEG Expanded Abstracts 2004 Remarks on the estimation of time-lapse elastic properties: The case for the Jotun Field, Norway
Grannemann, W. W. Geophysics 1995 FIELD TESTING SEISMIC INSTRUMENTS
Grechka, Vladimir SEG Expanded Abstracts 2002 Feasibility of seismic characterization of multiple fracture sets
Grêt, A. SEG Expanded Abstracts 2002 Time lapse monitoring of acoustic emissions with Coda Wave interferometry
Groenenboom, Jeroen
Geophysics 1998 Monitoring the width of hydraulic fractures with acoustic waves
Groenenboom, Jeroen
Geophysics 2000 Monitoring hydraulic fracture growth: Laboratory experiments
Hall, Stephen A. SEG Expanded Abstracts 2003 Time-lapse seismic analysis of pressure depletion in the Southern Gas Basin
Hall, Stephen A. SEG Expanded Abstracts 2001 AVOA attribute analysis and cross-plotting for time-lapse monitoring of stress and saturation changes: Application to the Teal South 4D-4C dataset
Hall, Stephen A. SEG Expanded Abstracts 2002 Time-lapse seismic monitoring of compaction and subsidence at Valhall through cross-matching and interpreted warping of 3D streamer and OBC data

112
Hannah T. Ng The Leading Edge 2005 Monitoring fluid injection in a carbonate pool using time-lapse analysis: Rainbow Lake case study
Hanson, R. SEG Expanded Abstracts 2000 4C seismic data and reservoir modeling at Alba Field, North Sea
Hare, Jennifer L. Geophysics 1999 The 4-D microgravity method for waterflood surveillance: A model study for the Prudhoe Bay reservoir, Alaska
Harris, Jerry M. Geophysics 1995 High-resolution crosswell imaging of a west Texas carbonate reservoir: Part 1—Project summary and interpretation
Harris, P. E. SEG Expanded Abstracts 1998 Time-lapse processing: A North Sea case study
Harris, P. E. SEG Expanded Abstracts 1999 Seismic resolution and uncertainty in time-lapse studies
Hatchell, P. J. SEG Expanded Abstracts 2003 Whole earth 4D: Reservoir monitoring geomechanics
Haverl, M. C. SPE International 2005 Integrated workflow for quantitative use of time-lapse seismic data in history matching: A North Sea field case
He, Bingshou SEG Expanded Abstracts 2001 Theoretical analyse of time-lapse explosion method
He, Wei SEG Expanded Abstracts 1998 Constructing 3-D reservoir model of a complex turbidite sand using time-lapse seismic and well data in the ST295 Field, Gulf of Mexico
Herawati, Ida SEG Expanded Abstracts 2003 The use of time-lapse P-wave impedance inversion to monitor CO2 flood at Weyburn Field, Saskatchewan, Canada
Herron, Don The Leading Edge 2004 An introduction—Gulf of Mexico
Hicks, Paul J. Jr. SEG Expanded Abstracts 1997 Reservoir simulation in time-lapse (4D) seismic analysis
Hirsche, Keith SEG Expanded Abstracts 1998 Time-lapse seismic monitoring of a SE Asian field — A case history
Hofmann, Ronny SEG Expanded Abstracts 2004 Which effective pressure coefficient do you mean?
Hoover, A. R. SEG Expanded Abstracts 1997 Reservoir and production analysis of the K40 sand, South Timbalier 295, offshore Louisiana, with comparison to time-lapse (4-D) seismic results
Houston, Louis M. The Leading Edge 1998 Minimal-effort time-lapse seismic monitoring: Exploiting the relationship between acquisition and imaging in time-lapse data
Hoversten, G. Michael
SEG Expanded Abstracts 2002 Fluid saturation and pressure prediction in a multi-component reservoir by combined seismic and electromagnetic imaging
Howie, John M. The Leading Edge 2005 Developing the long-term seismic strategy for Azeri-Chirag-Gunashli, South Caspian Sea, Azerbaijan
Howie, John M. SEG Expanded Abstracts 2004 Long-term seismic strategy for a major asset: Azeri-Chirag-Gunashli, South Caspian Sea, Azerbaijan
Huang, Xuri The Leading Edge 2001 Integration of time-lapse seismic and production data in a Gulf of Mexico gas field

113
Huang, Xuri The Leading Edge 2001 Integrating time-lapse seismic with production data: A tool for reservoir engineering
Huang, Xuri SEG Expanded Abstracts 1997 Production history matching with time lapse seismic data
Huang, Xuri SEG Expanded Abstracts 2000 Constraining time-lapse seismic analysis with production data
Huang, Xuri SEG Expanded Abstracts 1999 Reprocessing of time-lapse seismic data improves seismic history matching
Huang, Xuri SEG Expanded Abstracts 1999 Integration of production and time-lapse seismic data
Huang, Xuri The Leading Edge 1998 Improving production history matching using time-lapse seismic data
Jenkins, S. D. The Leading Edge 1997 Time-lapse monitoring of the Duri steamflood: A pilot and case study
Jin, Long SEG Expanded Abstracts 2004 New quality control method for time-lapse seismic processing
Johnston, David H. The Leading Edge 2000 Using legacy seismic data in an integrated time-lapse study: Lena Field, Gulf of Mexico
Johnston, David H. The Leading Edge 1998 Time-lapse seismic analysis of Fulmar Field
Johnston, David H. SEG Expanded Abstracts 1997 Time-lapse seismic analysis of the North Sea Fulmar Field
Johnston, David H. SEG Expanded Abstracts 1999 Interpretation and modeling of time-lapse seismic data: Lena Field, Gulf of Mexico
Johnston, David H. SEG Expanded Abstracts 2003 Integration of time-lapse seismic and production logging data: Jotun Field, Norway
Johnston, David H. SEG Expanded Abstracts 2002 Time-lapse seismic analysis at Irong Barat: Malay Basin
Jones, Ian F. SEG Expanded Abstracts 2002 4D illumination and elastic modeling
Jones, Ian F. SEG Expanded Abstracts 2002 Continuous high resolution velocity as a 4D attribute
Julien, P. SEG Expanded Abstracts 2002 The importance of pre-stack massive seismic modeling for AVO calibration and seismic reservoir characterization
Kaldy, W. John SEG Expanded Abstracts 2004 Amberjack 4D seismic processing — A Gulf of Mexico case history
Kelly, Michael C. SEG Expanded Abstracts 2002 Prediction of bed geometry, net and gross reservoir thickness
Kendall, Robert R. SEG Expanded Abstracts 2003 9C, 4D seismic processing for the weyburn CO2 flood, Saskatchewan, Canada
Key, Scott C. The Leading Edge 1998 Adding value to reservoir management with seismic monitoring technologies
Khazanehdari, J. SEG Expanded Abstracts 2005 Quantitative time-lapse seismic analysis through prestack inversion and rock physics
Khoshood, A. The Leading Edge 2005 Effect of reservoir properties changes on time-lapse synthetics for well 31 in Gachsaran Field, Iran
King, Michael S. Geophysics 2005 Rock-physics developments in seismic exploration: A personal 50-year perspective
Kjelstadli SPE International 2005 Quantitative History Match of 4D Seismic Response and Production Data in the Valhall Field
Korneev, Valeri A. Geophysics 2004 Seismic low-frequency effects in monitoring fluid-saturated reservoirs
Koster, Klaas The Leading Edge 2000 Time-lapse seismic surveys in the North Sea and their business impact
Kragh, Ed The Leading Edge 2002 Seismic repeatability, normalized rms, and predictability

114
Kragh, Ed SEG Expanded Abstracts 2001 Seismic Repeatability, Normalized RMS and Predictability
Kretz, Vicent SPE International 2004 Fluid Front History Matching Using 4D Seismic and Streamline Simulation
Kretz, Vicent SPE International 2002 An Integrated Reservoir Characterization Study Matching Production Data and 4D Seismic
Kretz, Vicent SPE International 2004 An Integrated Reservoir Characterization Study Matching Production Data and 4D Seismic
Kristiansen, Pål SEG Expanded Abstracts 2000 Foinaven 4D: Processing and analysis of two designer 4Ds
Kvam, Øyvind Geophysics 2005 Pore-pressure detection sensitivities tested with time-lapse seismic data
Kvam, Øyvind SEG Expanded Abstracts 2003 Lithological inversion of time-lapse seismic data using reflectivity ratios
Landa, Jorge L. SEG Expanded Abstracts 1999 Integration of 4D seismic and production data for reservoir parameter estimation
Landa, Jorge L. SPE International 1997 A Procedure to Integrate Well Test Data, Reservoir Performance History and 4-D Seismic Information into a Reservoir Description
Landrø, Martin Journal of Petroleum Science and Engineering
2001 Time-lapse seismic as a complementary tool for in-fill drilling
Landrø, Martin Geophysics 2001 Discrimination between pressure and fluid saturation changes from time-lapse seismic data
Landrø, Martin Geophysics 2004 Quantitative estimation of compaction and velocity changes using 4D impedance and traveltime changes
Landrø, Martin Geophysics 2003 Discrimination between pressure and fluid saturation changes from marine multicomponent time-lapse seismic data
Landrø, Martin Geophysics 1999 Repeatability issues of 3-D VSP data
Landrø, Martin SEG Expanded Abstracts 2004 Vp-Vs ratio versus effective pressure and rock consolidation — a comparison between rock models and time-lapse AVO studies
Landrø, Martin SEG Expanded Abstracts 1999 Discrimination between pressure and fluid saturation changes from time lapse seismic data
Landrø, Martin SEG Expanded Abstracts 2004 Time lapse refraction seismic - a tool for monitoring carbonate fields?
Langan, R. T. SEG Expanded Abstracts 2000 Time-lapse reflection and velocity imaging in the Lost Hills Steam Pilot using crosswell seismology
Langlais SPE International 2005 4D Monitoring of an Underground Gas Storage Case Using an Integrated History-Matching Technique
Lankston, Robert W. SEG Expanded Abstracts 1998 Propagating uncertainty in fluid replacement modeling: A tool for time lapse seismic survey planning and amplitude variation with angle (ava) analysis
Lazaratos, Spyros K. The Leading Edge 1997 Crosswell seismic imaging of reservoir changes caused by CO2 injection
Leary, P. C. SEG Expanded Abstracts 1998 Wide-angle scattering detection of a thermal event in time-lapse borehole seismics
Lecerf, D. SEG Expanded Abstracts 2004 High resolution processing for time-lapse seismic

115
Lecomte, Isabelle SEG Expanded Abstracts 2003 Simulated prestack local imaging: A robust and efficient interpretation tool to control illumination, resolution, and time-lapse properties of reservoirs
Lee, Doo Sung Geophysics 1995 Time-lapse crosswell seismic tomography to characterize flow structure in the reservoir during the thermal stimulation
Lefeuvre, Frédéric SEG Expanded Abstracts 2003 Improved reservoir understanding through rapid and effective 4D: Girassol field, Angola, West Africa
Leggott, Richard J. SEG Expanded Abstracts 1999 Co-location of 4D seismic data in the presence of navigational and timing errors
Leggott, Richard J. SEG Expanded Abstracts 1999 Accurate positioning of seismic surveys in space and time for improved 4-D sensitivity
Leslie, Damian M. SEG Expanded Abstracts 2001 Focusing time-lapse seismic data using time-reversed acoustics
Li, Guoping The Leading Edge 2001 Effective processing of nonrepeatable 4-D seismic data to monitor heavy oil SAGD steam flood at East Senlac, Saskatchewan, Canada
Li, Guoping The Leading Edge 2003 4D seismic monitoring of CO2 flood in a thin fractured carbonate reservoir
Li, Jingye SEG Expanded Abstracts 2004 Study on time-lapse seismic AVO of fine layering porous unconsolidated reservoir
Li, X.-P. SEG Expanded Abstracts 2004 Oseberg 4D re-processing — a case history of seismic repeatability analysis
Liner, Christopher L. The Leading Edge 1997 On the history and culture of geophysics, and science in general
Lines, Laurence R. SEG Expanded Abstracts 2002 Seismic monitoring of "hot" and "cold" heavy oil Production
Litvak SPE International 2005 Uncertainty Estimation in Production Predictions Constrained by Production History and Time-Lapse Seismic in a GOM Oil Field
Liu, Enru The Leading Edge 2004 Modeling seismic wave propagation during fluid injection in a fractured network: Effects of pore fluid pressure on time-lapse seismic signatures
Liu, Enru SEG Expanded Abstracts 2000 Seismic detection of fluid saturation in aligned fractures
Liu, Wei SEG Expanded Abstracts 1998 Time-lapse crosswell seismic imaging of the Athabasca Tar Sands at Steepbank
Lou, Min SEG Expanded Abstracts 2000 Modeling study of marine multi-component seismic data in anisotropic fractured media by a Fourier method
Lucet, Nathalie SEG Expanded Abstracts 2001 4D data interpretation through seismic facies analysis
Lumley, David E. The Leading Edge 2004 Business and technology challenges for 4D seismic reservoir monitoring
Lumley, David E. Geophysics 2001 Time-lapse seismic reservoir monitoring
Lumley, David E. The Leading Edge 2002 Synergies in time-lapse seismic, medical, and space imaging
Lumley, David E. SEG Expanded Abstracts 1997 Assessing the technical risk of a 4D seismic project
Lumley, David E. SEG Expanded Abstracts 1999 Meren Field, Nigeria: A 4D seismic case study

116
Lumley, David E. SEG Expanded Abstracts 2000 A risk analysis spreadsheet for both time-lapse VSP and 4D seismic reservoir monitoring
Lumley, David E. SEG Expanded Abstracts 1997 Practical geophysical issues of 4D seismic reservoir monitoring
Lumley, David E. SEG Expanded Abstracts 2003 4D seismic data processing issues and examples
Lumley, David E. SEG Expanded Abstracts 2003 Estimation of reservoir pressure and saturations by crossplot inversion of 4D seismic attributes
Lumley, David E. SPE International 1998 Practical Issues of 4D Seismic Reservoir Monitoring: What an Engineer Needs to Know
Lygren, M. SEG Expanded Abstracts 2002 History matching of CO2 flow models using seismic modeling and time-lapse data
Maaø, Frank SEG Expanded Abstracts 2000 Prestack calibration of time-lapse seismic data
MacBeth, Colin SEG Expanded Abstracts 2002 4D seismic signatures of OWC movement on the Nelson field — Modeling and interpretation
MacBeth, Colin SEG Expanded Abstracts 2004 Going quantitative with 4D seismic analysis
MacBeth, Colin SEG Expanded Abstracts 2004 Deconvolving permeability from time-lapsed seismic data
MacKay, Scott The Leading Edge 2003 The impact of water-velocity variations on deepwater seismic data
Magesan, Mag The Leading Edge 2005 Seismic processing for time-lapse study: Genesis Field, Gulf of Mexico
Malaver, Cristian SEG Expanded Abstracts 2004 Statistical applications for quantitative reservoir characterization and monitoring at West Pearl Queen field, Lea County, New Mexico
Marschall SPE International 2002 Some Aspects of 4-D Seismics for Reservoir Monitoring
Mathisen, Mark E. Geophysics 1995 Time-lapse crosswell seismic tomogram interpretation: Implications for heavy oil reservoir characterization, thermal recovery process monitoring, and tomographic imaging technology
Matsushima, Jun Journal of Volcanology and Geothermal Research
2004 Repeated seismic reflection measurements in the Kakkonda geothermal field
Maxwell, Shawn C. The Leading Edge 2001 The role of passive microseismic monitoring in the instrumented oil field
McGillivray, Peter R.
SEG Expanded Abstracts 2004 Microseismic and time-lapse monitoring of a heavy oil extraction process at Peace River
McKenna, Jason Journal of Contaminant Hydrology
2001 Time-lapse 3-D seismic imaging of shallow subsurface contaminant flow
McKenna, Jason SEG Expanded Abstracts 2000 Repeatability of physical modelling time-lapse 3-D seismic data
Meadows, Mark A. SEG Expanded Abstracts 2001 Enhancements to Landro's method for separating time-lapse pressure and saturation changes
Meadows, Mark A. SEG Expanded Abstracts 2002 Rock physics analysis for time-lapse seismic at Schiehallion Field, North Sea
Meunier, Julien The Leading Edge 1998 Céré-la-Ronde: A laboratory for time-lapse seismic monitoring in the Paris Basin
Meunier, Julien SEG Expanded Abstracts 2003 Evaluation and handling of positioning differences in 4D seismic

117
Mezghani SPE International 2004 History Matching and Quantitative Use of 4D Seismic Data for an Improved Reservoir Characterization
Michaud, Gwénola SEG Expanded Abstracts 2001 Time-lapse borehole case study in vacuum field, New Mexico
Michaud, Gwénola SEG Expanded Abstracts 2000 Time-lapse vertical seismic profile study in Vacuum Field, New Mexico
Mikkelsen SPE International 2005 IMPROVED RESERVOIR MANAGEMENT THROUGH INTEGRATION OF 4D SEISMIC INTERPRETATION
Miller, Richard D. SEG Expanded Abstracts 2004 4-D high-resolution seismic reflection monitoring of miscible CO2 injected into a carbonate reservoir in the Hall-Gurney Field, Russell County, Kansas
Minkoff, Susan E. Geophysics 2004 Coupled geomechanics and flow simulation for time-lapse seismic modeling
Minkoff, Susan E. SEG Expanded Abstracts 1999 Coupled geomechanics and flow simulation for time-lapse seismic modeling
Minkoff, Susan E. SEG Expanded Abstracts 1998 Reservoir characterization via time-lapse prestack seismic in version
Mitra, Partha P. SPE International 2003 4D Seismic in Mapping the Change in Fluid Phase in Carbonate: A Case Study Moldoveanu, N. SEG Expanded Abstracts 1996 Repeatability of the seismic experiments for 4D seismic in transition zone surveys
Nakagawa, Seiji SEG Expanded Abstracts 2000 Effect of static shear stress on the scattering of elastic waves across fractures
Navarro, J.B. SPE - Delta Are & Capillary Services Ltd
2005 Key High-Quality Technologies as Pilot for Hydrocarbon-Reserves Expansion
Nickel, M. SEG Expanded Abstracts 1999 Non-rigid matching of migrated time-lapse seismic
Nickel, M. SEG Expanded Abstracts 2001 New tools for 4D seismic analysis in carbonate reservoirs
Nivlet, Philippe SEG Expanded Abstracts 2001 A new methodology to account for uncertainties in 4D seismic interpretation
Nolen-Hoeksema, Richard C.
Geophysics 1995 High-resolution crosswell imaging of a west Texas carbonate reservoir: Part 5—Core analysis
Nur, A. SEG Expanded Abstracts 1997 Rock physics and 4D seismic for improved oil recovery
O'Brien, John The Leading Edge 2004 Time-lapse VSP reservoir monitoring
O'Brien, John SEG Expanded Abstracts 2004 Time-lapse 3-D VSP monitoring of a CO2 EOR Flood
O'Donovan, A. R. SPE International 2000 Foinaven 4D Seismic - Dynamic Reservoir Parameters and Reservoir Management Olden, Peter The Leading Edge 2001 Modeling combined fluid and stress change effects in the seismic response of a producing hydrocarbon
reservoir
P. L. A. Winthaegen SEG Expanded Abstracts 2001 CFP-approach to time-lapse angle-dependent reflectivity analysis
Pacheco, Carlos SEG Expanded Abstracts 2003 Time-lapse monitoring with multiply scattered waves
Pannett, Stephen SPE International 2004 Constraining a Complex Gas-Water Dynamic Model Using 4D Seismic

118
Parr, R. S. SEG Expanded Abstracts 2003 Andrew 4D reservoir surveillance
Parr, R. S. SEG Expanded Abstracts 2000 Interpretation and integration of 4-D results into reservoir management, Schiehallion Field, UKCS
Pennington, Wayne D.
The Leading Edge 2001 Seismic time-lapse surprise at Teal South: That little neighbor reservoir is leaking!
Pennington, Wayne D.
SEG Expanded Abstracts 2000 "Do No Harm!" — Seismic petrophysical aspects of time — Lapse monitoring
Peterson, John E. Jr. SEG Expanded Abstracts 1998 Moisture migration using high resolution time-lapse radar tomography
Phan, Vinh SPE - Stanford University 1999 Determining Depth-Dependent Reservoir Properties Using Integrated Data Analysis
Phan, Vinh SPE International 2002 Fluvial Channel Parameter Estimation Constrained to Static, Production, and 4D Seismic Data
Pisetski, V. B. SEG Expanded Abstracts 2001 Dynamic fluid method of reservoir characterization. Last step of interpretation — estimation of the current fluid flow: Kogalym (Western Siberia) and Chagodaev (Tatarstan) fields' examples
Poggiagliolmi, Elio SEG Expanded Abstracts 1998 Time-lapse seismic repeatability — A case study
Porter-Hirsche, Jan SEG Expanded Abstracts 1998 Repeatability study of land data acquisition and processing for time lapse seismic
Pramanik, A. G. SEG Expanded Abstracts 2002 Stratigraphic interpretation using post stack seismic inversion: Case histories from Indian basins
Raef, A. E. The Leading Edge 2005 4D seismic to image a thin carbonate reservoir during a miscible CO2 flood: Hall-Gurney Field, Kansas, USA
Raef, A. E. The Leading Edge 2004 4D seismic monitoring of the miscible CO2 flood of Hall-Gurney Field, Kansas, U.S.
Ribeiro, Christophe SEG Expanded Abstracts 2004 A petroelastic-based approach to pressure and saturation estimation using 4D seismic
Ribeiro, Christophe SEG Expanded Abstracts 2005 Inversion for reservoir pressure and saturation changes in the Foinaven field, UK
Ribeiro, N. SPE International 2005 Challenges of the 4D Seismic in the Reservoir Management of Marlim Field, Campos Basin
Richardson, Sarah E. SEG Expanded Abstracts 2002 Time-lapse imaging of CO2 injection into coalbed methane strata; a numerical modeling study
Rickett, James Geophysics 2001 Cross-equalization data processing for time-lapse seismic reservoir monitoring: A case study from the Gulf of Mexico
Rickett, James SEG Expanded Abstracts 1998 A cross-equalization processing flow for off-the-shelf 4D seismic data
Rickett, James SEG Expanded Abstracts 1999 Acoustic daylight imaging via spectral factorization: Helioseismology and reservoir monitoring
Ritchie, Bryan SEG Expanded Abstracts 2002 The impact of new 4D seismic technology on the magnus field
Robertsson, Johan O. A.
Geophysics 2000 A finite-difference injection approach to modeling seismic fluid flow monitoring
Robertsson, Johan O. Geophysics 2000 An efficient method for calculating finite-difference seismograms after model alterations

119
A. Robertsson, Johan O. A.
SEG Expanded Abstracts 1999 A finite-difference injection approach to modeling of seismic fluid flow monitoring
Robinson, Nigel The Leading Edge 2005 4D time-lapse monitoring of Chirag Field
Roche, Steven L. SEG Expanded Abstracts 1998 An onshore time-lapse (4-D), multicomponent, data processing case history, vacuum field, New Mexico
Ronen, Shuki SEG Expanded Abstracts 1999 Repeatability of sea bed multi-component data
Ross, Christopher P. The Leading Edge 1996 Inside the crossequalization black box
Ross, Christopher P. The Leading Edge 1997 Time-lapse seismic monitoring: Some shortcomings in nonuniform processing
Rossi, D. J. SPE - Schlumberger 2000 Discussion on Integrating Monitoring Data into the Reservoir Management Process
Rothert, Elmar SEG Expanded Abstracts 2002 Microseismic monitoring of borehole fluid injections: Data modeling and inversion for hydraulic properties of rocks
Sanches, V. SEG Expanded Abstracts 2005 Is it statiscally significant anomaly?
Sarkar, Debashish Geophysics 2003 Anisotropic inversion of seismic data for stressed media: Theory and a physical modeling study on Berea Sandstone
Sarkar, Sudipta SEG Expanded Abstracts 2003 On the inversion of time-lapse seismic data
Sasagawa, Glenn S. Geophysics 2003 A new sea-floor gravimeter
Saunders, Mike SEG Expanded Abstracts 2004 Source signature repeatability and source array directivity — Measurements from the Valhall 4D survey
Schmitt, Douglas R. SEG Expanded Abstracts 1998 Shallow seismic profiling over heated heavy oils: Directions towards time lapse monitoring
Schonewille, M. A. Geophysics 2003 A general reconstruction scheme for dominant azimuth 3D seismic data
Schonewille, M. A. SEG Expanded Abstracts 2003 A modeling study on seismic data regularization for time-lapse applications
Sengupta, Madhumita
Geophysics 2003 Quantifying subresolution saturation scales from time-lapse seismic data: A reservoir monitoring case study
Sengupta, Madhumita
SEG Expanded Abstracts 2000 Integrating time-lapse seismic and flow simulation to map saturation changes: A reservoir monitoring case study
Seymour SPE International 1996 An Improved Seabed Seismic 4D Data Collection Method for Reservoir Monitoring
Shams, A. SEG Expanded Abstracts 2002 Robust time-lapse AVOA analysis using OBC: A case study from Teal South
Shen, Feng SEG Expanded Abstracts 2000 Scattering of P-S converted waves in fractured reservoirs

120
Sherlock, Donald H. SEG Expanded Abstracts 2004 Analog reservoir modeling of turbidite channel sands
Sherlock, Donald H. The Leading Edge 2001 Time-lapse monitoring of immiscible fluid-flow models
Sherlock, Donald H. SEG Expanded Abstracts 1999 Time-lapse 3-D seismic with analogue sandbox models
Sinartio, Franciscus Boetje
SEG Expanded Abstracts 2002 Predicting fluid composition from seismic data: CO2 detection from seismic
Skidmore, Charles M.
SEG Expanded Abstracts 2002 Visualization of rock property attribute cubes for field analysis
Skjervheim SPE International 2005 Incorporating 4D Seismic Data in Reservoir Simulation Models Using Ensemble Kalman Filter
Skov, Thorleif SEG Expanded Abstracts 2002 Monitoring and characterization of a CO2 storage site
Slawinski, Raphael A.
SEG Expanded Abstracts 2000 Non-welded contact: A finite-difference approach
Smit, Dirk SEG Expanded Abstracts 2004 Tidal-driven constraints for time-lapse reservoir monitoring
Smith, Patrick The Leading Edge 2001 4-D seismic in a complex fluvial reservoir: The Snorre feasibility study
Sønneland, Lars The Leading Edge 1997 Seismic reservoir monitoring on Gullfaks
Sønneland, Lars SEG Expanded Abstracts 2000 Detecting flow-barriers with 4D seismic
Sparkman, Gene W. The Leading Edge 1998 An introduction to this special section: Time lapse or time elapse?
Sparkman, Gene W. The Leading Edge 2001 Paving the road to real-time reservoir monitoring—The next step? Summary of an ERCH workshop
Spetzler, Jesper SEG Expanded Abstracts 2003 Time-lapse seismic monitoring in the prestack domain
Spetzler, Jesper SEG Expanded Abstracts 2004 On the sensitivity of the NRMS function to non-repeatability causes and production
Staples, Rob SPE International 2002 Integrating 4D seismic to optimize production
Stephen, K. First Break 2006 Seismic history matching in the UKCS Schiehallion field
Stephen, Ralph A. SEG Expanded Abstracts 1999 Ambient noise below the seafloor
Stovas, A. Geophysics 2005 Fluid-pressure discrimination in anisotropic reservoir rocks — A sensitivity study
Swanston, A. M. Geophysics 2003 Time-lapse imaging at Bullwinkle field, Green Canyon 65, offshore Gulf of Mexico
Talwani, Manik SEG Expanded Abstracts 1999 Time lapse gravity gradiometry
Tennebø, P. O. SEG Expanded Abstracts 1998 Inversion of 4D seismic with best feasible approximation
Terrell, Martin J. SEG Expanded Abstracts 2002 Seismic monitoring of a CO2 flood at Weyburn field, Saskatchewan, Canada: demonstrating the robustness of time-lapse seismology
Theune, Ulrich SEG Expanded Abstracts 2003 Feasibility study of time-lapse seismic monitoring for heavy oil reservoir development — The rock-

121
physical basis
Tiwari, U. SEG Expanded Abstracts 2005 Estimation of effective pressure and water saturation by viscoelastic inversion of synthetic time-lapse seismic data for a gas sandstone reservoir
Toinet, Sylvain SPE International 2004 4D Feasibility and Calibration Using 3D Seismic Modeling of Reservoir Models
Tura, A. The Leading Edge 2001 An introduction to this special section: Instrumented Oil Fields
Tura, A. SEG Expanded Abstracts 1999 Estimating pressure and saturation changes time-lapse AVO data
Tura, A. SEG Expanded Abstracts 2003 Time-lapse seismic: Are we there yet?
Vasco, Don W. Geophysics 2004 Seismic imaging of reservoir flow properties: Time-lapse pressure changes
Vasco, Don W. Geophysics 2005 On the use of quasi-static deformation to understand reservoir fluid flow
Vasco, Don W. Geophysics 2004 Seismic imaging of reservoir flow properties: Time-lapse amplitude changes
Vauthrin, Robert SEG Expanded Abstracts 1999 Improvements in 4D legacy data quality and repeatability through reprocessing, Lena Field
Veire, Helene Hafslund
SEG Expanded Abstracts 1998 Estimation of reservoir fluid volumes through 4D seismic analysis on Gullfaks
Veire, Helene Hafslund
SEG Expanded Abstracts 2003 Stochastic inversion of pressure and saturation changes from time-lapse seismic data
Vesnaver, A. L. SEG Expanded Abstracts 2001 Target-oriented time-lapse analysis by AVO and tomographic inversion
Vesnaver, A. L. Geophysics 2003 Time-lapse tomography
Vidal, Sandrine SEG Expanded Abstracts 2001 Feasibility study of time-lapse parameters estimate for mean effective stress and saturation changes in gas storage
Voutay, Olivier SEG Expanded Abstracts 2002 Seismic interpretation with new attributes extracted from a prestack multicube analysis
Waggoner, J. R. SPE International 2000 Quantifying the Economic Impact of 4D Seismic Projects
Waggoner, J. R. SPE International 1998 Lessons Learned From 4D Projects
Waggoner, J. R. SPE International 2002 Improved Reservoir Modeling With Time-Lapse Seismic in a Gulf of Mexico Gas Condensate Reservoir
Waggoner, J. R. SPE International 1998 Lessons Learned from 4D Projects
Waggoner, J. R. SPE International 2002 Improved Reservoir Modeling With Time-Lapse Seismic in a Gulf of Mexico Gas Condensate Reservoir
Wagner, Sean SEG Expanded Abstracts 2004 Gas saturation calculated from patchy and homogeneous models at Foinaven Field
Waite, Michael W. The Leading Edge 1997 Seismic monitoring of the Duri steamflood: Application to reservoir management

122
Waite, Michael W. SEG Expanded Abstracts 2002 Probabilistic risk assessment from fuzzy seismic information, well measurements, and inferences of spatial continuity: Hamaca Field, Venezuela
Wang, Zhijing Geophysics 1998 Seismic monitoring of a CO2 flood in a carbonate reservoir: A rock physics study
Wang, Zhijing The Leading Edge 1997 Feasibility of time-lapse seismic reservoir monitoring: The physical basis
Wapenaar, Kees SEG Expanded Abstracts 2001 Elastodynamic reciprocity theorems for time-lapse seismic methods
Wapenaar, Kees SEG Expanded Abstracts 2000 One-way acoustic reciprocity and its applications in multiple elimination and time-lapse seismics
Watanabe, Toshiki SEG Expanded Abstracts 2004 Differential waveform tomography for time-lapse crosswell seismic data with application to gas hydrate production monitoring
Weathers, Lloyd R. The Leading Edge 1998 Wavelet control allows differencing of 3-D from 2-D
Weisenborn, Toon The Leading Edge 2005 Time-lapse seismic in Gannet A: One more lead firmly integrated
Wever, A. SEG Expanded Abstracts 2004 Criteria for source and receiver positioning in time-lapse seismic acquisition
Whitcombe, David N.
SEG Expanded Abstracts 2001 Systematic application of 4D in BP's NW Europe operations
Winterstein, Don The Leading Edge 1998 9-C time-lapse VSP monitoring of steam injection at Cymric Oil Field
Wu, J. SPE International 2005 Improving Water Saturation Prediction With 4D Seismic
Wu, Jianbing SEG Expanded Abstracts 2004 Establishing spatial pattern correlation for interpreting time lapse seismic amplitudes
Xu, Haibin The Leading Edge 2001 Integrating reservoir engineering and satellite remote sensing for (true) continuous time-lapse reservoir monitoring
Yuh, Sung H. SEG Expanded Abstracts 2000 Effects of pressure and fluid saturation changes on time-lapse AVO response
Yuh, Sung H. SEG Expanded Abstracts 2001 Time-lapse seismic monitoring of CO2 sequestration in hydrocarbon reservoirs
Yuh, Sung H. SEG Expanded Abstracts 1999 A feasibility study of time-lapse seismic monitoring using stochastic reservoir models
Yuh, Sung H. SEG Expanded Abstracts 2002 Uncertainty analysis in time-lapse seismic modeling
Zeeman, Jan Harry SEG Expanded Abstracts 2001 Time-lapse GPR measurement to study the imaging operator
Zhang, Yajun SEG Expanded Abstracts 2004 Time-lapse impedance inversion using hybrid data transformation and the spike deconvolution method
Zheng, Ye SEG Expanded Abstracts 2002 Integrating seismic fracture analysis with migration
Zhou, Chengdang SPE - Petroleum Exploration & Development Institute
2000 A Feasibility Study of Time-Lapse (4D) Seismic Monitoring of Water Injection Recovery Processes
Zou, Ying The Leading Edge 2003 Time-lapse well log analysis, fluid substitution, and AVO
Zou, Ying SEG Expanded Abstracts 2003 Seismic modelling for a heavy oil reservoir time-lapse study

123
Zou, Ying SEG Expanded Abstracts 2004 Time-lapse seismic analysis of a heavy oil cold production field, Lloydminster, Western Canada
Zou, Ying SEG Expanded Abstracts 2002 Time-lapse well log analysis, fluid substitution and AVO
Copyright © 2022 FDOKUMEN