First-principles study of structural, elastic, electronic and optical properties of perovskites XCaH...
6
Solid State Communications 150 (2010) 1896–1901 Contents lists available at ScienceDirect Solid State Communications journal homepage: www.elsevier.com/locate/ssc First-principles study of the structural, elastic, electronic, optical and thermodynamic properties of the cubic perovskite CsCdCl 3 under high pressure B. Ghebouli a,* , M.A. Ghebouli b , M. Fatmi c , A. Bouhemadou d,e a Département de Physique, Faculté des Sciences, Université de Sétif, 19000, Algeria b Département de Physique, Centre Universitaire, Bordj Bou-Arréridj, 34000, Algeria c Laboratoire de Physique et Mécanique des Matériaux Métalliques (LP3M), Université de Sétif, 19000, Algeria d Laboratory for Developing New Materials and their Characterization, Department of Physics, Faculty of Science, University of Setif, 19000 Setif, Algeria e Department of Physics and Astronomy, College of Science, King Saud University, P.O. Box 2455, Riyadh 11451, Saudi Arabia article info Article history: Received 12 May 2010 Received in revised form 7 July 2010 Accepted 22 July 2010 by P. Sheng Available online 2 August 2010 Keywords: A. Perovskite B. PP-PW method D. Elastic properties D. Electronic band structure abstract The structural, elastic, electronic, optical and thermodynamic properties of the perovskite chloride CsCdCl 3 were investigated using the pseudo-potential plane wave (PP-PW) within the Generalized Gradient Approximation (GGA) and Local Density Approximation (LDA). The computed lattice parameter agrees well with experimental and previous theoretical works. Based on the elastic constants and their related parameters, the crystal rigidity and mechanical stability have been discussed. Energy band structure shows that the investigated material is 0–R indirect energy band gap semiconductor. The static dielectric constant and static refractive index are indeed, proportional to the fundamental indirect band gap. The thermal effect on the lattice parameter, bulk modulus, volume expansion coefficient, Grüneisen parameter, heat capacities and Debye temperature were predicted using the quasi-harmonic Debye model. To the best of the authors’ knowledge, most of the studied properties are reported for the first time. © 2010 Elsevier Ltd. All rights reserved. 1. Introduction Perovskites are of great interest in materials science because of their electric, magnetic, piezoelectric, optical, catalytic and mag- netoresistive properties. These solids are very important in elec- trical ceramics, geophysics, astrophysics, particle accelerators, fission and fusion reactors, etc. [1–4]. Perovskites are used in fuel cells or hydrogen sensors. Experimental and theoretical investiga- tions were devoted to the study of perovskites ABX 3 (A is a cation with different valence, B is a transition metal and X is oxides, halides or chlorides). The cubic perovskite structure shows a larger A–X distance than the B–X bond one. Their geometry is related to the chemical composition, temperature and pressure [5–9]. Their gap is in the visible spectrum and gives a particular interest to these materials [5–12]. Exploring in ABX 3 compounds with perovskite structure is an active approach in developing new-type Pb-free fer- roelectrics such as ZnSnO 3 [13], multiferroics BiMO 3 [14] as well as other multifunctional materials. In the present work, we have investigated the structural, elas- tic electronic, optical and thermodynamic properties of the semi- conductor perovskite chloride CsCdCl 3 using the pseudo-potential * Corresponding author. E-mail address: [email protected] (B. Ghebouli). plane-wave (PP-PW) method within GGA and LDA. To the best of the authors’ knowledge, most of the studied properties have not been conducted and are predictions. The paper is organized as follows: After a brief introduction in Section 1, the theoretical framework within which all the calcu- lations have been performed is outlined in Section 2. In Section 3, we present and discuss the results of our study. A conclusion of the present investigation is given in Section 4. 2. Computational method The first-principles calculations were performed using the Cambridge Serial Total Energy (CASTEP) code [15]. The Kohn–Sham equations are solved within the framework of density functional theory (DFT) [16,17] by expanding the wave functions of valence electrons in a basis set of plane waves with kinetic energy smaller than specified cut-off energy, E cut . The states Cl : 3s 2 3p 5 , Cs : 5s 2 5p 6 6s 1 , Cd : 4d 10 5s 2 were treated as valence states. The inte- grations over the Brillouin zone were replaced by discrete summa- tion over special set of k-points using Monkhorst–Pack scheme [18]. Plane-wave cut-off energy of 660 eV and an 8 × 8 × 8 grid of Monkhorst–Pack [18] points have been employed in this study to ensure well convergence of the computed structures and energies. The calculation of the optical properties requires a dense mesh of 0038-1098/$ – see front matter © 2010 Elsevier Ltd. All rights reserved. doi:10.1016/j.ssc.2010.07.041
-
Upload
independent -
Category
Documents
-
view
5 -
download
0
Transcript of First-principles study of structural, elastic, electronic and optical properties of perovskites XCaH...

Solid State Communications 150 (2010) 1896–1901
Contents lists available at ScienceDirect
Solid State Communications
journal homepage: www.elsevier.com/locate/ssc
First-principles study of the structural, elastic, electronic, optical andthermodynamic properties of the cubic perovskite CsCdCl3 under high pressureB. Ghebouli a,∗, M.A. Ghebouli b, M. Fatmi c, A. Bouhemadou d,ea Département de Physique, Faculté des Sciences, Université de Sétif, 19000, Algeriab Département de Physique, Centre Universitaire, Bordj Bou-Arréridj, 34000, Algeriac Laboratoire de Physique et Mécanique des Matériaux Métalliques (LP3M), Université de Sétif, 19000, Algeriad Laboratory for Developing New Materials and their Characterization, Department of Physics, Faculty of Science, University of Setif, 19000 Setif, Algeriae Department of Physics and Astronomy, College of Science, King Saud University, P.O. Box 2455, Riyadh 11451, Saudi Arabia
a r t i c l e i n f o
Article history:Received 12 May 2010Received in revised form7 July 2010Accepted 22 July 2010by P. ShengAvailable online 2 August 2010
Keywords:A. PerovskiteB. PP-PWmethodD. Elastic propertiesD. Electronic band structure
a b s t r a c t
The structural, elastic, electronic, optical and thermodynamic properties of the perovskite chlorideCsCdCl3 were investigated using the pseudo-potential plane wave (PP-PW) within the GeneralizedGradient Approximation (GGA) and Local Density Approximation (LDA). The computed lattice parameteragrees well with experimental and previous theoretical works. Based on the elastic constants and theirrelated parameters, the crystal rigidity and mechanical stability have been discussed. Energy bandstructure shows that the investigated material is 0–R indirect energy band gap semiconductor. The staticdielectric constant and static refractive index are indeed, proportional to the fundamental indirect bandgap. The thermal effect on the lattice parameter, bulk modulus, volume expansion coefficient, Grüneisenparameter, heat capacities and Debye temperature were predicted using the quasi-harmonic Debyemodel. To the best of the authors’ knowledge, most of the studied properties are reported for the firsttime.
© 2010 Elsevier Ltd. All rights reserved.
1. Introduction
Perovskites are of great interest in materials science because oftheir electric, magnetic, piezoelectric, optical, catalytic and mag-netoresistive properties. These solids are very important in elec-trical ceramics, geophysics, astrophysics, particle accelerators,fission and fusion reactors, etc. [1–4]. Perovskites are used in fuelcells or hydrogen sensors. Experimental and theoretical investiga-tions were devoted to the study of perovskites ABX3 (A is a cationwith different valence, B is a transition metal and X is oxides,halides or chlorides). The cubic perovskite structure shows a largerA–X distance than the B–X bond one. Their geometry is related tothe chemical composition, temperature and pressure [5–9]. Theirgap is in the visible spectrumandgives a particular interest to thesematerials [5–12]. Exploring in ABX3 compounds with perovskitestructure is an active approach in developing new-type Pb-free fer-roelectrics such as ZnSnO3 [13], multiferroics BiMO3 [14] as well asother multifunctional materials.In the present work, we have investigated the structural, elas-
tic electronic, optical and thermodynamic properties of the semi-conductor perovskite chloride CsCdCl3 using the pseudo-potential
∗ Corresponding author.E-mail address: [email protected] (B. Ghebouli).
0038-1098/$ – see front matter© 2010 Elsevier Ltd. All rights reserved.doi:10.1016/j.ssc.2010.07.041
plane-wave (PP-PW) method within GGA and LDA. To the best ofthe authors’ knowledge, most of the studied properties have notbeen conducted and are predictions.The paper is organized as follows: After a brief introduction in
Section 1, the theoretical framework within which all the calcu-lations have been performed is outlined in Section 2. In Section 3,we present and discuss the results of our study. A conclusion of thepresent investigation is given in Section 4.
2. Computational method
The first-principles calculations were performed using theCambridge Serial Total Energy (CASTEP) code [15]. The Kohn–Shamequations are solved within the framework of density functionaltheory (DFT) [16,17] by expanding the wave functions of valenceelectrons in a basis set of plane waves with kinetic energy smallerthan specified cut-off energy, Ecut . The states Cl : 3s23p5, Cs :5s25p66s1, Cd : 4d105s2 were treated as valence states. The inte-grations over the Brillouin zone were replaced by discrete summa-tion over special set of k-points usingMonkhorst–Pack scheme [18].Plane-wave cut-off energy of 660 eV and an 8 × 8 × 8 grid ofMonkhorst–Pack [18] points have been employed in this study toensure well convergence of the computed structures and energies.The calculation of the optical properties requires a dense mesh of

B. Ghebouli et al. / Solid State Communications 150 (2010) 1896–1901 1897
uniformly distributed k-points. The Brillouin zone integration wasperformed using a 20×20×20 grid ofMonkhorst–Pack points. Theexchange–correlation potential is treatedwithin the GGA and LDA.The structural parameters were determined using the Broy-
den–Fletcher–Goldfarb–Shanno (BFGS) minimization technique[19], with the following thresholds for converged structures, en-ergy change per atom less than 5×10⁻⁶ eV, residual force less than0.01 eV/Å, stress below 0.03 GPa and the displacement of atomsduring the geometry optimization less than 0.0005 Å. The knowl-edge of the complex dielectric function ε(ω) = ε1(ω) + iε2(ω)gives information on optical properties. The imaginary part wascalculated from the momentum matrix elements between the oc-cupied and unoccupied wave functions within the selection rules.The real part of dielectric function follows from the Kramer–Kronigrelationship. There are two contributions to ε(ω), namely, intra-band and interband transitions. The contribution from intraband isimportant only formetals. The interband transitions can further besplit into direct and indirect transitions. Optical constants such asthe refractive index, extinction coefficient, optical reflectivity andenergy loss spectrum may be computed from the values of ε(ω).The study of thermal effects was done within the quasi-
harmonic Debye model implemented in the Gibbs program [20].For a solid described by an energy-volume (E–V ) relationship inthe static approximations, the Gibbs program allows us to evaluateDebye temperature, to obtain the Gibbs free energy G(V , P, T ) andto minimize G for deriving the thermal equation of state (EOS)V (P, T ). The detailed description of the quasi-harmonic Debyemodel was found in [20–24].
3. Results and discussions
3.1. Ground states
The CsCdCl3 compound has ideal cubic structure with spacegroup Pm− 3m (221). The atomic positions in the elementary cellare at Cs (0, 0, 0), Cd (0.5, 0.5, 0.5) and Cl (0, 0.5, 0.5). The latticeparameter is calculated using PP-PW within GGA and LDA and issummarized in Table 1. Also shown for comparison are the experi-mental and theoretical data reported byMoreira et al. [5] and Jianget al. [6]. The theoretical equilibrium lattice constant a0, the bulkmodulus B0 and its pressure derivative B′ are determined by fit-ting the total energy versus the volume to the Murnaghan equa-tion of state [25]. Our calculated equilibrium lattice parameter a0is in reasonable agreement with the experimental and theoreticalones quoted in Refs. [5,6]. The obtained B0 and B′ values are listedin Table 1. The bulk modulus B0 is a measure of the crystal rigidity,thus a large B0 is for high crystal rigidity. No previous experimen-tal or theoretical results for these parameters are available for theCsCdCl3 compound to be compared with the present calculation.
3.2. Elastic properties
The elastic constants are important parameters that describethe response to an applied macroscopic stress. The dependence ofthe elastic constants on pressure assumes particular structural sta-bility. In the present study, our results regarding C11, C12, C44 andbulk modulus B at zero pressure are depicted in Table 1. The vari-ation of the elastic constants as a function of pressure is displayedin Fig. 1. We observe that all elastic constants of interest increasemonotonically and linearlywith increasing pressure. The enhance-ment of the elastic constants of CsCdCl3 under compression indi-cates that this structure becomes mechanically stable. Generally,a given crystal structure cannot exist in a stable or a metastablephase unless its elastic constants obey certain relationships. Thetraditionalmechanical stability conditions in cubic crystals at equi-librium are expressed in terms of elastic constants as follows [26]:
C11 − C12 > 0, C44 > 0, C11 + 2C12 > 0 andC12 < B < C11.
(1)
Table 1The calculated lattice constant a0 , bulk modulus B, pressure derivative B′ , elasticconstants C11 , C12 and C44 , shear modulus G, shear wave modulus Cs , Young’smodulus E, Kleinman parameter ζ and Poisson’s ratio σ at zero pressure.
Present work Experiment Other worksGGA LDA
a0 (Å) 5.3107 5.125 a5.210 a5.289,b5.32B0 (GPa) 30.81 42.94 – –B′ 4.74 4.83 – –C11 53.75 79.08 – –C12 19.77 25.38 – –C44 12.52 14.28 – –ζ 0.51 0.47 – –G 14.15 18.43 – –E 36.85 48.43 – –σ 0.302 0.31 – –Cs 16.99 26.85 – –a [5].b [6].
Table 2The elasticwave velocities in (m s−1) for different propagation directions and elasticanisotropy factor at zero pressure.
v100L v100T1 v100T2 v110L v110T1 v110T2 v111L v111T1 v111T2 A
LDA 4269 1814 1814 3915 3751 1814 3789 2285 2285 −0.31GGA 3713 1792 1792 3555 3182 1792 3501 1993 1993 −0.16
200C11
C12
C44
B
150
100
50
00 5 10
Pressure (GPa)
Ela
stic
mod
uli (
GPa
)
15 20
Fig. 1. Elastic moduli C11 , C12 , C44 and B as function of pressure.
At equilibrium, the above criteria reflect their mechanical sta-bility in the cubic phase.The elastic wave velocities were calculated by the above elastic
constants. These velocities were given by the resolution of theChristoffel equation [27] in different directions.
(Cijkl.nj.nk − ρv2.δil)ul = 0 (2)
where Cijkl, is the single-crystal elastic constant tensor, n is thepropagation direction, ρ is the density of material, u is the wavepolarization and ν is the wave velocity. The solutions of thisequation are of two types: a longitudinal wave with polarizationparallel to the direction of propagation vl and two shear waves vT1and vT2 with polarization perpendicular to n. Another importantparameter is the elastic anisotropy factor, A, which gives ameasureof the anisotropy of the elastic wave velocity in a crystal. In a cubiccrystal, the elastic anisotropy factor is given by [28]:
A =2C44 + C12C11
− 1 (3)
which is zero for an isotropicmaterial. The GGA and LDA calculatedelastic anisotropy factor and elasticwave velocities along the [100],[110] and [111] directions at zero pressure are listed in Table 2.The longitudinal waves are fastest along [100] and shear waves areslowest along [100] and [110].The bulk modulus B and shear constant Cs were deduced from
the elastic constants. The shear constant also known as the rigidity

1898 B. Ghebouli et al. / Solid State Communications 150 (2010) 1896–1901
modulus is defined as the ratio of shear stress to the shear strainand it describes the response of material to shearing strain. Theisotropic bulk modulus B and the shear constant Cs for a cubiccrystal are given by:
B =C11 + 2C12
3and C5 =
12(C11 − C12). (4)
Our results regarding B0 and Cs are tabulated in Table 1. The B0value determined from the relation (4) depends on C11 and C12values seem to be slightly larger than that calculated by fitting theenergy–volume data to a third-order Birch–Murnaghan equationof state.The Kleinman parameter, ζ , describes the relative positions of
the cation and anion under volume-conserving strain distortionsfor which positions are not fixed by symmetry. The low value ofζ implies that there is a large resistance against bond bending orbond-angle distortion and vice versa [29,30]. The ζ value reportedin Table 1 has been calculated using the following relation [31]:
ζ =C11 + 8C127C11 + 2C12
. (5)
The study of material hardness requires the knowledge ofYoung’s modulus E and Poisson’s ratio σ . Young’s modulus is ameasure of the stiffness of a given material, whereas, Poisson’s ra-tio, is the ratio, when a sample object is stretched, of the contrac-tion or transverse strain (perpendicular to the applied load), to theextension or axial strain (in the direction of the applied load). Thesequantities are related to the bulk and shearmoduli by the followingequations [32]:E =
9BG3B+ G
v =3B− E6B
(6)
where,
G =GR + Gv2
, GR =5C44(C11 − C12)4C44 + 3(C11 − C12)
and Gv =C11 − C12 + 3C44
5. (7)
Our results of the calculated E and σ values are given in Table 1.The value of σ obtained for material of interest is ranging between0 and 0.5. However, one should observe that σ of CsCdCl3 sug-gesting thus when compressed, CsCdCl3 shows larger lateral ex-pansion. Due to the lack of both experimental and theoretical dataregarding C11, C12, C44, B, ζ ,G, E, σ and Cs, our results are predic-tions and may serve for a reference for future works.
3.3. Sound velocities and Debye temperature
Having calculatedYoung’smodulus E, bulkmodulusB and shearmodulus G, one can calculate Debye temperature, which is an im-portant fundamental parameter closely related to many physi-cal properties such as elastic constants, specific heat and meltingtemperature. At low temperature, the vibrational excitation arisessolely from acoustic mode. Hence, at low temperature Debye tem-perature calculated from elastic constants is the same as that de-termined from specific heat measurements. One of the standardmethods to calculate Debye temperature θD is from elastic data,since it may be estimated from the average sound velocity vm us-ing the following equation [33]:
θD =hkB
(3n4πVa
)1/3vm (8)
where, h is Plank’s constant, kB is Boltzmann’s constant, n the num-ber of atoms by cell and Va the atomic volume. The average soundvelocity in polycrystalline material is given by [34]:
Table 3The calculated density ρ, the longitudinal, transverse and average sound velocitiesvl , vl and vm and Debye temperature θD at zero pressure.
ρ (g cm−3) νl (m s−1) νt (m s−1) νm (m s−1) ΘD (K)
LDA 4.3386 3955 2061 2306 254GGA 3.8986 3580 1905 2128 226
15
10
5
0
Ene
rgy
(eV
)
–5
–10
–15
–20
X R M Γ R
Fig. 2. Band structure of CsCdCl3 . The Fermi level is located at 0 eV.
Table 4The calculated values of band gaps at equilibrium.
E0–0 ER–R EM–M EX–X ER–X ER–M ER–0
LDA 2.203 5.654 6.307 5.393 4.419 6.297 1.544GGA 2.064 6.4 5.821 4.73 4.164 5.814 1.691
vm =
[13
(2v2l+1v3t
)]−1/3(9)
where, vl and vt are the longitudinal and transverse sound veloci-ties of an isotropic aggregate obtained by using the shear modulusG and the bulk modulus B from Navier’s equation [32]:
vl =
(3B+ 4G3ρ
)1/2and vt =
(Gρ
)1/2. (10)
The predicted sound velocities, Debye temperature and density aregiven in Table 3.
3.4. Electronic properties
Now we discuss our results of the electronic properties ofCsCdCl3 via the energy band, the total and partial densities ofstates. The calculated band structure along the higher symmetrydirections, 0, R,Mand X in the Brillouin zone using GGA approachis plotted in Fig. 2. At zero pressure, this compound shows anindirect band gap semiconductor with a minimum of conductionband located at 0 and the valence band maximum is at R point.The zero energy reference is at the top of the valence band. Thevalence band is mainly due to Cl 2p, Cd 4d and Cs 5p electrons inthis structure. The Cs 5p and Cd 4d states contribute preferably tothe valence band bottom. The conduction band is more dispersivethan the valence band. This is because it is more delocalized.The free electron behavior results in more dispersive band andband crossing. The first conduction band at 0 is predominantlyof cationic p character. The pressure-induced energy shifts forthe optical transition related to the energy band gaps are shownin Fig. 3. We observe that the fundamental band gap increasesmonotonically when the pressure is enhanced. The computedvalues of band gaps for material studied in this work are given inTable 4.The linear pressure coefficients are important parameters for
fundamental research and device applications. In this respect thecalculated band gaps are fitted to a quadratic function of the form:
Eg(p) = Eg(0)+ αp+ βp2 (11)where, the band gap energy Eg is expressed in eV, and the pressurep in GPa, α and β represent the first- and second-order pressure

B. Ghebouli et al. / Solid State Communications 150 (2010) 1896–1901 1899
Ene
rgy
(eV
)
5
Γ–R M–MR–RX–X
Γ−Γ
10 15Pressure (GPa)
0 20
7.5
6.0
4.5
3.0
1.5
Fig. 3. Direct 0–0, X–X, M–M and R–R and indirect 0–R band gap energies as afunction of pressure.
18Totale
Cs (s)
Cs (p)
Cd (s)
Cd (p)
C1 (s)
C1 (d)
EF
12
6
0
12
8
4
0
PDO
S
15
10
5
0
12
6
9
3
0–8 –4 0
Energy (eV)4 8
3
2
1
0
0.0
0.2
0.4
0.6
0 2 4 6 8 10
0 1 2 3 4 5
Fig. 4. Calculated partial and total densities of states (PDOS) and (TDOS) of CsCdCl3 .
ε2
ε1
4
3
2
1
0
0 5 10Energy (eV)
15 20
Fig. 5. Real and imaginary parts of dielectric function versus photon energy.
derivatives, respectively. Our results regarding α and β listed inTable 5 are predictions, since no experimental and theoretical dataare available.The investigation of the nature of the electronic band structure
and the bonding situation requires the calculated partial and totaldensities of states (PDOS) and (TDOS). The PDOS and TDOS ofCsCdCl3 are shown in Fig. 4, within the energy interval from (EF −10 eV) up to (EF+10 eV). In the valence band, there are two distinctstructures in the partial density of electronic states separated fromeach other by gaps. The lower valence band of CsCdCl3 situated inthe range (−7.5 to −5 eV) is due to the Cd: d mixed with Cs: p.
Table 5The calculated first- and second-order pressure coefficients α (eV/GPa) and β(eV/GPa2) of the gaps 0–0, R–R, X–X and 0–R.
0–0 R–R X–X 0–Rα α α α
β · 10−4 β · 10−4 β · 10−4 β · 10−4
LDA 0.07 −0.03 0.15 0.080−10.4 −1.90 −20.0 −10
GGA 0.103 −0.017 0.184 0.05−15.6 −1.5 −24.7 −10.4
ε 2
P = 0 GPa
P = 20 GPa
Energy (eV)
6
4
2
00 5 10 15 20
Fig. 6. The imaginary part of the dielectric function at zero and 30 GPa pressures.
3.4
3.3
3.2
3.1
3.0
2.9
ε
1.84
1.80
1.76
1.72
n
0 5 10 15 20
Pressure (GPa)
Fig. 7. The static dielectric constant and static refractive index as a function ofpressure.
The hybridization between Cd: d and Cs: p states was observedin the valence bonding region. The upper valence band extendedbetween−4.66 eV and EF is due to the Cl: d. The top of the valenceband reflects the d electronic character. Only the s valence statesof Cd contribute to the formation of the first conduction band. Theconduction band is mainly Cd: s mixedwith Cs: p and s for CsCdCl3structure.
3.5. Optical properties
The investigation of compoundhaving cubic symmetry requiresonly the calculation of one dielectric tensor component to cha-racterize the linear optical properties. The imaginary part of thedielectric function ε2(ω)was calculated using the expression givenin Ref. [35]. The real part ε1(ω) of the dielectric function can bederived from the imaginary part using the Kramer–Kronig relation.From the real and imaginary parts of the dielectric function onecan calculate the refractive index, reflectivity and electron energyloss spectra using the expressions given in Ref. [36].We display thereal ε1(ω) and imaginary ε2(ω) parts of the dielectric function atzero pressure in Fig. 5. The identification of interband transitionsresponsible for the structures of ε2(ω) requires the use of bandstructure. The threshold energy of the dielectric function occurs at

1900 B. Ghebouli et al. / Solid State Communications 150 (2010) 1896–1901
3
2
1
nk
1.2
0.8
0.4
0.0
0 5 10 15 20Energy (eV)
0 5 10 15 20Energy (eV)
0.3
0.2
0.1
Ref
lect
ivity
3
2
1
0
Ene
rgy
loss
Fig. 8. The refractive index, extinction coefficient, reflectivity and energy loss as a function of energy.
about 0.2 eV. The main peaks in the spectra are located at 5.31 and8.74 eV. Both peaks correspond to the transition from the occupiedstate Cl: d (valence band) to the unoccupied state Cs: p (conductionband) [37]. For the interpretation of the optical spectra, it seemsnot realistic to attribute the transitions only to the present peaksin spectra, because many transitions can be observed in the bandstructure with an energy corresponding to the same peak. Whenthis compound is compressed, the threshold energy and the mainpeak were shifted with an increasing energy to 1.86 and 8.81 eV(see Fig. 6). The reason lies on the enhancement of the0–R indirectgap. Under pressure of 30 GPa, only themain peak is present in thespectra. The static dielectric constant ε1(0) is 2.99. This could beexplained by the Penn model [38] based on the expression. Thisindicates that a smaller energy gap yields to a larger ε1(0) value.Fig. 7 shows the variation of the static dielectric constant and
static refractive index of CsCdCl3 compound as functions of pres-sure. One notice that these parameters increase monotonicallywith increasing pressure.We observe that the static dielectric con-stant and static refractive index are indeed, proportional to the in-direct band gap. The pressure dependence of the static dielectricconstant and static refractive index were determined by quadraticpolynomial fit giving the following relations:{ε1 = 2.989+ 0.019 p− 7.95× 10⁻⁵ p2
n = 1.729+ 0.0057 p− 2.83× 10⁻⁵ p2
}. (12)
The refractive index, extinction coefficient, reflectivity and energyloss are displayed in Fig. 8. The static refractive index has the value1.72. It increases with energy in the transparency region reachinga peak in the ultraviolet at 4.47 eV. It then decreases to a mini-mum level at 16.19 eV. The local maxima of extinction coefficientat 9.28 eV corresponds to the zero of ε1(ω). The maximum reflec-tivity value is 29.4% and occurs at 11.9 eVwhich is in the ultravioletspectra. The electron energy loss function, which is an importantfactor describing the energy loss of a fast electron traversing in amaterial. The peaks in this spectrum represent the characteristicassociated with the plasma resonance (a collective oscillation ofthe valence electrons) and the corresponding frequency is the so-called plasma frequency ωP . The peaks of energy loss correspondto the trailing edges in the reflectivity spectrum, for instance, theprominent peaks of loss are located at energies corresponding tothe abrupt reduction of reflectivity.
3.6. Thermodynamic properties
The dependence of the lattice parameter on temperature isshown in Fig. 9. The lattice constant increases with increasing
10.4
10.2
10.0
9.8
9.6
9.4
9.2
9.00 200 400 600 800 1000
Temperature (K)
P=0
P=5 GPa
P=10 GPa
P=20 GPaL
attic
e co
nsta
nt
Fig. 9. Variation of the lattice constant as a function of temperature.
105
90
75
60
45
30
15
Bul
k m
odul
us (
GPa
)
0 200 400 600 800 1000Temperature (K)
P=10 GPa
P=5 GPa
P=0 GPa
P=20 GPa
Fig. 10. Variation of the bulk modulus as a function of temperature.
temperature for a given pressure. At a given temperature, thelattice parameter decreases with increasing pressure. The effectof increasing temperature and decreasing pressure on the latticeparameter are identical. Fig. 10 shows the variation of bulk mod-ulus versus temperature at a given pressure. It is seen that thebulk modulus decreases with increasing temperature. At a giventemperature, the bulkmodulus increaseswith increasing pressure.The effect of increasing pressure and decreasing temperature onthe bulk modulus are practically the same. The variation of theheat capacities CV and CP versus temperature at various pressuresare shown in Fig. 11. From 0 to about 400 K, CV and CP increaseexponentially. At high temperature CP follows a linear increase,whereas CV tends to the Petit and Dulong limit (123 J mol−1 K−1),which is common to all solids at high temperature [39,35,36]. Atzero pressure and ambient temperature, CV and CP are 119.12 and127.47 Jmol−1 K−1, respectively. In Fig. 12, we present the effect oftemperature on the volume expansion coefficient α and Grüneisenparameter γ . The variation of the thermal expansion coefficientwith temperature is similar to that of CP . It is shown that, at a givenpressure, α increases sharply with the increase of temperature up
B. Ghebouli et al. / Solid State Communications 150 (2010) 1896–1901 1901
120
80
40
0
Cv
(J.m
ol–1
K–1
)C
P (J
.mol
–1 K
–1)
160
120
80
40
00 200 400 600 800 1000
Temperature (K)
P=0 GPa
P=20 GPa
P=10 GPa
Dulong–Petit limit
P=5 GPa
P=0 GPa
P=20 GPa
P=10 GPaP=5 GPa
Fig. 11. Variation of the heat capacities CV and CP versus temperature at variouspressures.
8
6
4
2
0
α. 1
0–5 (
K–1
)
2.2
2.0
1.8
1.6
γ
a
b
P=5 GPa
P=5 GPa
P=20 GPa
P=20 GPa
P=10 GPa
P=10 GPa
P=15 GPa
P=15 GPa
0 200 400 600 800 1000Temperature (K)
Fig. 12. Variation of the volume expansion coefficient α and Grüneisen parameterγ as a function of temperature.
550
500
450
400
350
300
250
Deb
ye te
mpe
ratu
re (
K)
0 200 400 600 800 1000
Temperature (K)
P=20 GPa
P=5 GPa
P=0 GPa
P=10 GPa
Fig. 13. Variation of Debye temperature θD as a function of temperature.
to about 400 K. From this temperature, α approaches to a linearincreasing when temperature is increased and the propensity ofincrement becomes moderate, which means that the temperaturedependence of α is very small at high pressure. For a given tem-perature, the effect of pressure on α is greater at low pressure. TheGrüneisen parameter γ , describes the alteration in a crystal andcan predict the anharmonic properties of a solid, such as the effectof temperature on phonon frequencies and lattice volume. For aGrüneisen parameter γ having anharmonic behavior, its variation
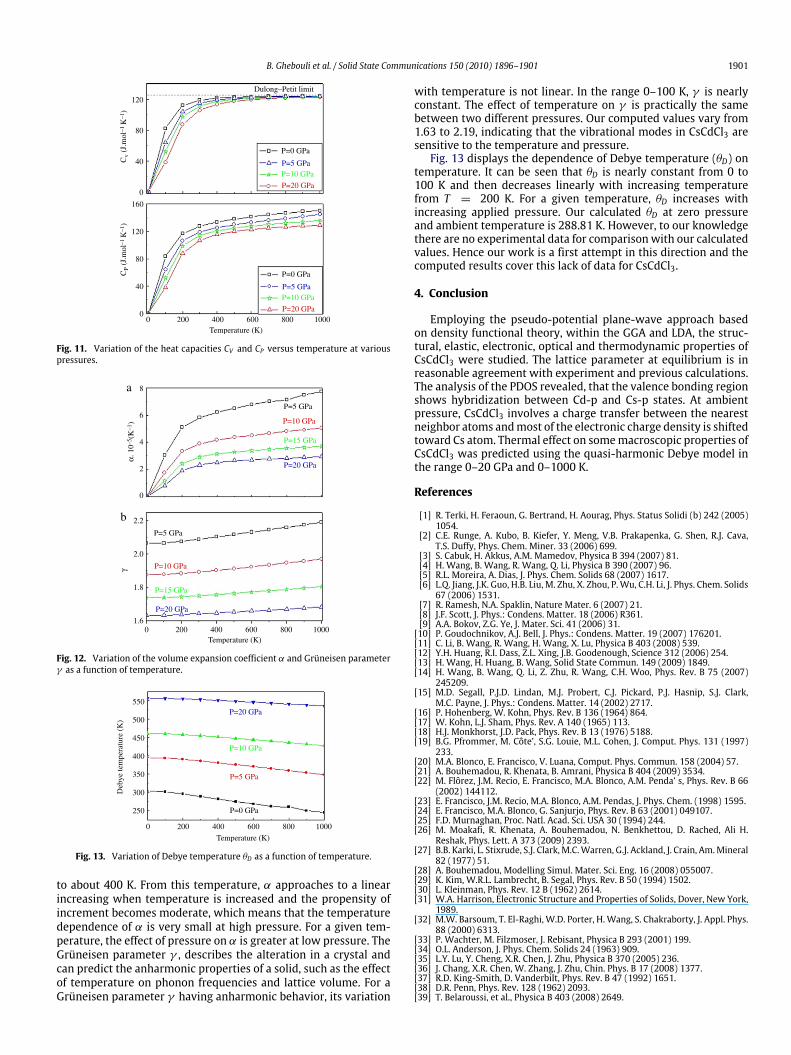
with temperature is not linear. In the range 0–100 K, γ is nearlyconstant. The effect of temperature on γ is practically the samebetween two different pressures. Our computed values vary from1.63 to 2.19, indicating that the vibrational modes in CsCdCl3 aresensitive to the temperature and pressure.Fig. 13 displays the dependence of Debye temperature (θD) on
temperature. It can be seen that θD is nearly constant from 0 to100 K and then decreases linearly with increasing temperaturefrom T = 200 K. For a given temperature, θD increases withincreasing applied pressure. Our calculated θD at zero pressureand ambient temperature is 288.81 K. However, to our knowledgethere are no experimental data for comparison with our calculatedvalues. Hence our work is a first attempt in this direction and thecomputed results cover this lack of data for CsCdCl3.
4. Conclusion
Employing the pseudo-potential plane-wave approach basedon density functional theory, within the GGA and LDA, the struc-tural, elastic, electronic, optical and thermodynamic properties ofCsCdCl3 were studied. The lattice parameter at equilibrium is inreasonable agreement with experiment and previous calculations.The analysis of the PDOS revealed, that the valence bonding regionshows hybridization between Cd-p and Cs-p states. At ambientpressure, CsCdCl3 involves a charge transfer between the nearestneighbor atoms andmost of the electronic charge density is shiftedtoward Cs atom. Thermal effect on somemacroscopic properties ofCsCdCl3 was predicted using the quasi-harmonic Debye model inthe range 0–20 GPa and 0–1000 K.
References
[1] R. Terki, H. Feraoun, G. Bertrand, H. Aourag, Phys. Status Solidi (b) 242 (2005)1054.
[2] C.E. Runge, A. Kubo, B. Kiefer, Y. Meng, V.B. Prakapenka, G. Shen, R.J. Cava,T.S. Duffy, Phys. Chem. Miner. 33 (2006) 699.
[3] S. Cabuk, H. Akkus, A.M. Mamedov, Physica B 394 (2007) 81.[4] H. Wang, B. Wang, R. Wang, Q. Li, Physica B 390 (2007) 96.[5] R.L. Moreira, A. Dias, J. Phys. Chem. Solids 68 (2007) 1617.[6] L.Q. Jiang, J.K. Guo, H.B. Liu, M. Zhu, X. Zhou, P.Wu, C.H. Li, J. Phys. Chem. Solids67 (2006) 1531.
[7] R. Ramesh, N.A. Spaklin, Nature Mater. 6 (2007) 21.[8] J.F. Scott, J. Phys.: Condens. Matter. 18 (2006) R361.[9] A.A. Bokov, Z.G. Ye, J. Mater. Sci. 41 (2006) 31.[10] P. Goudochnikov, A.J. Bell, J. Phys.: Condens. Matter. 19 (2007) 176201.[11] C. Li, B. Wang, R. Wang, H. Wang, X. Lu, Physica B 403 (2008) 539.[12] Y.H. Huang, R.I. Dass, Z.L. Xing, J.B. Goodenough, Science 312 (2006) 254.[13] H. Wang, H. Huang, B. Wang, Solid State Commun. 149 (2009) 1849.[14] H. Wang, B. Wang, Q. Li, Z. Zhu, R. Wang, C.H. Woo, Phys. Rev. B 75 (2007)
245209.[15] M.D. Segall, P.J.D. Lindan, M.J. Probert, C.J. Pickard, P.J. Hasnip, S.J. Clark,
M.C. Payne, J. Phys.: Condens. Matter. 14 (2002) 2717.[16] P. Hohenberg, W. Kohn, Phys. Rev. B 136 (1964) 864.[17] W. Kohn, L.J. Sham, Phys. Rev. A 140 (1965) 113.[18] H.J. Monkhorst, J.D. Pack, Phys. Rev. B 13 (1976) 5188.[19] B.G. Pfrommer, M. Côte’, S.G. Louie, M.L. Cohen, J. Comput. Phys. 131 (1997)
233.[20] M.A. Blonco, E. Francisco, V. Luana, Comput. Phys. Commun. 158 (2004) 57.[21] A. Bouhemadou, R. Khenata, B. Amrani, Physica B 404 (2009) 3534.[22] M. Flôrez, J.M. Recio, E. Francisco, M.A. Blonco, A.M. Penda’ s, Phys. Rev. B 66
(2002) 144112.[23] E. Francisco, J.M. Recio, M.A. Blonco, A.M. Pendas, J. Phys. Chem. (1998) 1595.[24] E. Francisco, M.A. Blonco, G. Sanjurjo, Phys. Rev. B 63 (2001) 049107.[25] F.D. Murnaghan, Proc. Natl. Acad. Sci. USA 30 (1994) 244.[26] M. Moakafi, R. Khenata, A. Bouhemadou, N. Benkhettou, D. Rached, Ali H.
Reshak, Phys. Lett. A 373 (2009) 2393.[27] B.B. Karki, L. Stixrude, S.J. Clark,M.C.Warren, G.J. Ackland, J. Crain, Am.Mineral
82 (1977) 51.[28] A. Bouhemadou, Modelling Simul. Mater. Sci. Eng. 16 (2008) 055007.[29] K. Kim, W.R.L. Lambrecht, B. Segal, Phys. Rev. B 50 (1994) 1502.[30] L. Kleinman, Phys. Rev. 12 B (1962) 2614.[31] W.A. Harrison, Electronic Structure and Properties of Solids, Dover, New York,
1989.[32] M.W. Barsoum, T. El-Raghi, W.D. Porter, H.Wang, S. Chakraborty, J. Appl. Phys.
88 (2000) 6313.[33] P. Wachter, M. Filzmoser, J. Rebisant, Physica B 293 (2001) 199.[34] O.L. Anderson, J. Phys. Chem. Solids 24 (1963) 909.[35] L.Y. Lu, Y. Cheng, X.R. Chen, J. Zhu, Physica B 370 (2005) 236.[36] J. Chang, X.R. Chen, W. Zhang, J. Zhu, Chin. Phys. B 17 (2008) 1377.[37] R.D. King-Smith, D. Vanderbilt, Phys. Rev. B 47 (1992) 1651.[38] D.R. Penn, Phys. Rev. 128 (1962) 2093.[39] T. Belaroussi, et al., Physica B 403 (2008) 2649.