FT–Raman spectroscopic study of calcium-rich and magnesium-rich carbonate minerals

ARTICLE IN PRESS
0022-4596/$ - se
doi:10.1016/j.jss
�CorrespondE-mail addr
Journal of Solid State Chemistry 180 (2007) 2143–2148
www.elsevier.com/locate/jssc
Raman-spectroscopic investigation of Ba2InTaO6 andSr2InTaO6 perovskites
A. Diasa,�, L.A. Khalamb, M.T. Sebastianb, R.L. Moreirac
aDepartamento de Quımica, UFOP, Ouro Preto-MG, 35400-000, BrazilbMaterials and Minerals Division, Regional Research Laboratory, Trivandrum 695019, India
cDepartamento de Fısica, UFMG, C.P. 702, Belo Horizonte-MG, 30123-970, Brazil
Received 19 January 2007; received in revised form 19 May 2007; accepted 24 May 2007
Available online 29 May 2007
Abstract
Raman spectroscopy was employed to investigate the structures and phonon modes of Ba2InTaO6 and Sr2InTaO6 ceramics. It was
found that Ba-based samples belong to the tetragonal P4=mnc (#128 or D64hÞ space group, while Sr-based materials belong to the
monoclinic P21=n (#14 or C52hÞ space group. Low-temperature measurements did not show any phase transition down to 77K.
Lorentzian lines were used to fit the experimental data, which presented 14 phonon modes for Ba2InTaO6 and 24 modes for Sr2InTaO6,
in perfect agreement with the theoretical factor-group analyses for the proposed structures. This paper reports, for the first time, a
tetragonal P4=mnc structure for an indium-containing perovskite material.
r 2007 Elsevier Inc. All rights reserved.
Keywords: Perovskites; Indium; Raman spectroscopy; Crystal structures
1. Introduction
Complex double perovskites of the type A2B0B00O6 have
held interest over many years because of their scientific andtechnological importance [1]. For these ceramics, manychemical substitutions on both A- and B-sites can be done,which lead to inherent flexibility towards industrialapplications [2]. Among these technological demands, theuse of double perovskites as dielectric resonators onmicrowave based wireless communication devices must beemphasized [3]. Recently, indium-containing ceramics havebeen subject of investigations aiming to determine theirstructures [4–6]. A2InBO6 ðA ¼ Ba, Sr and Ca; B ¼ Nb,Ta)materials were first studied in the 1960s by Galasso et al. [7]and Filip’ev et al. [8,9], which observed ordered ceramicsbut no space group symmetry was given. On the otherhand, Yin et al. [10] considered Inþ3 and Nbþ5 ionsrandomly distributed and assumed cubic Pm3m symmetryfor both Ba2InNbO6 and Sr2InNbO6 compounds.Ratheesh et al. [11] observed an unresolved Raman
e front matter r 2007 Elsevier Inc. All rights reserved.
c.2007.05.021
ing author.
ess: [email protected] (A. Dias).
spectrum for Sr2InNbO6, supporting the random B-siteordering, which was also verified for Pb2InNbO6 single-crystals by Kania et al. [12].Ting et al. [4,5] presented a careful structural analysis of
A2InNbO6 materials by using neutron powder diffraction,electron diffraction and bond valence calculations. In theirfirst report, using a combination of bond valence sumcalculations, powder X-ray diffraction and electron dif-fraction, these authors concluded that Ba2InNbO6 occursin the Fm3m elpasolite-type structure, while Sr2InNbO6
presents a P121=n1 (� P21=n, in a simplified notation)monoclinic perovskite-related superstructure. In their finalconclusion, the authors suggested an additional Rietveldrefinement through neutron diffraction data in order toenhance the oxygen ions positions. This procedure wasconducted and reported by the same authors in asubsequent work [5]. For Sr2InNbO6, the monoclinic but‘‘very close to metrically tetragonal’’ P21=n space groupsymmetry was confirmed, although an additional anti-siterefinement indicated that approximately 10% of the In/Nbcations were in ‘‘exchanging sites’’. For Ba2InNbO6,the Fm3m space group symmetry was found to refine‘‘readily’’. However, satellite reflections were being

ARTICLE IN PRESS
20 30 40 50 60 70 80
Sr2InTaO6
Ba2InTaO6
Inte
nsity (
arb
. units)
2 Theta (°)
Fig. 1. XRD data for the double perovskites investigated.
A. Dias et al. / Journal of Solid State Chemistry 180 (2007) 2143–21482144
systematically over-calculated and attributed to the pre-sence of fine scale translational stacking faults [5]. Thisevidence comes from the broadening of the satellitereflections as well as from the existence of characteristicanti-phase boundary-type contrast in dark field images.Thus, a ‘‘second phase’’ based on a disordered perovskiteparent P4=mnm structure was introduced in order toimprove the fitting of the asymmetric parent reflections.
In view of that, it seems that the nice works of Ting et al.[4,5] still leave opened questions, especially for Ba2InNbO6
ceramics (where a tetragonal phase was employed to fit theneutron diffraction data). The present paper reports the useof Raman-spectroscopic analysis to investigate the struc-tures of Ba2InTaO6 and Sr2InTaO6 perovskites. Previousworks [13–15] demonstrated the power of this spectro-scopic technique to investigate and resolve structures ofdifferent complex perovskites based on space grouptheoretical analysis of their vibrational phonons. Experi-mental data for both Ta-analog ceramics were obtainedfrom room temperature down to 77K, in order todetermine the correct structure for both materials, andalso to investigate structural stability and phonon behaviorupon cooling.
2. Experimental
Ba2InTaO6 and Sr2InTaO6 ceramics were prepared fromstoichiometric mixtures of high-purity SrCO3, In2O3 andBaCO3 (99.9%; Aldrich Chemical, St. Louis, MO), andTa2O5 (99.9%; Nuclear Fuel Complex, Hyderabad, India)by the solid-state ceramic route. The powders were ballmilled for 48 h using zirconia balls in distilled water. Theslurry was dried and double calcined at 1375 �CðBa2InTaO6Þ and 1250 �C ðSr2InTaO6Þ, for 4 h. Thecalcined powders were ground well and mixed thoroughlywith 3wt% polyvinyl alcohol-PVA (BDH Laboratory,Poole, U.K.; molecular weight � 22 000, degree of hydro-lysis X98%) solution. Around 0.5mL of PVA was addedto 10 g of the ceramic powder. The slurries were dried andpressed into cylindrical compacts of diameter 14mm andheight 7–9mm under a pressure of 150MPa. The greencompacts were sintered at 1625 �C ðBa2InTaO6Þ and1600 �C ðSr2InTaO6Þ, for 4 h. The bulk densities of thesintered samples were measured by the Archimedesmethod. X-ray diffractograms were collected using amodified Rigaku powder apparatus (Geigerflex 2037),equipped with a Cu2Ka source (with graphite mono-chromator) and automatic data collection.
Micro-Raman scattering spectra were collected using atriple-monochromator Dilor XY spectrometer, equippedwith a liquid-N2-cooled charge-coupled-device detectorand an Olympus BXL microscope (100� objective). Themeasurements were done in back-scattering geometry usingthe 514.5 and 647.1 nm lines of an Arþ laser (2.5mW) asexciting source. Low-temperature measurements werecarried out in a triple-monochromator Jobin YvonT64000 spectrometer with an Olympus microscope
ð20� objectiveÞ, from 77 to 300K in a controlled(Lakeshore) gas flow cryostat (Janis) with an accuracy ofabout 0.1K. Measurements were done by using the secondharmonic of a YVO4:Nd laser line as excitation source(532 nm, and effective 10mW at the sample’s surface).Accumulation times were typically 10 collections of 30 sand the spectral resolution was better than 2 cm�1. Theresulting spectra were corrected by the Bose–Einsteinthermal factor.
3. Results and discussion
First, XRD was employed to investigate the quality ofour samples. Fig. 1 presents the results, which showed thatsingle-phase materials were produced without secondaryphases or impurities. Also, the profiles of the Ba2InTaO6
samples did not present any reflections that could beinterpreted as distortions or deviations from cubic sym-metry. For Sr2InTaO6 ceramics, XRD patterns wereindexed by monoclinic structures, as expected. This initialprocedure was important to conduct the Raman analysis inwell-characterized samples, whose diffractograms are verysimilar to those obtained by other authors [4,5,16,17].Thus, according to XRD data, our samples seem to becubic (Ba) and monoclinic (Sr).Room temperature Raman analysis was then carried out
in both Ba2InTaO6 and Sr2InTaO6 materials, and theresults are displayed in Fig. 2. As it can be seen, twodifferent spectral profiles are clearly observed, whichindicates that the ceramics likely occur in differentstructures. For Ba-based perovskites, dominating bandscentered at 100, 390, 550, and 800 cm�1 are present, whichwas previously observed in similar 1:1 ordered ceramics

ARTICLE IN PRESS
Ram
an inte
nsity
Ba2InTaO6
Sr2InTaO6
Wavenumber (cm-1)
900800700600500400300200100
Fig. 2. Room temperature Raman spectra of the Ba2InTaO6 and
Sr2InTaO6 complex perovskites.
A. Dias et al. / Journal of Solid State Chemistry 180 (2007) 2143–2148 2145
[14,18]. Sr-based perovskites showed phonon modescentered in similar positions besides many additionalstrong bands in the region 1502350 cm�1, probablyassociated with a lower-symmetry structure. As a generaltrend, the bands of the Sr2InTaO6 ceramics are up-shiftedcompared to their Ba-analogues. This is as a consequenceof the smaller Sr ions compared to Ba ions, which leads toa contracted unit-cell, with smaller ionic distances and,then, to general stronger ionic bonds.
For complex cubic perovskites of general formulaA2B
0B00O6, a Fm3m symmetry is frequently expected inordered lattice arrangements with 1:1 ratio. This config-uration allows a classification of the normal modes at theBrillouin zone-center as:
G ¼ Ag � Eg � F1g � 2F2g � 5F1u � F2u. (1)
The resulting factor-group analysis indicates that fourmodes are Raman-active ðAg;Eg; 2F2gÞ, and also fourmodes are infrared-active (4 F1u) [11]. For the Ba2InTaO6
ceramics, XRD data showed that a Fm3m structure couldbe possible, agreeing with most literature available sofar. However, an easy inspection of the Raman spectrum(Fig. 2) shows that this material presents a larger numberof features than the four dominating Raman-active modes.Then, we take the previous results developed by Ting et al.[4,5] to help us to start a new group theory analysis in amore realistic basis. Assuming the conclusions from Tinget al. [5] for a tetragonal structure, set in space groupP4=mnc, Ba2InTaO6 materials could be described asbelonging to the D6
4h space-group. For this structure, theBa atoms occupy 4d sites of special D02 symmetry, the Inand Ta ions occupy 2a and 2b sites of C4h symmetry, and
the oxygen atoms are in the 8h and 4e sites (Chs and C4
symmetries, respectively). Then, using the site groupmethod of Rousseau et al. [19] it is possible to obtain thefollowing distribution in terms of the irreducible represen-tations of the D4h point group:
G ¼ 3A1g � 4A2g � 3B1g � 2B2g � 6Eg � 4A1u
� 5A2u � 2B1u � B2u � 12Eu. ð2Þ
Thus, excluding the silent modes ð4A2gÞ, we would expect14 Raman modes ð3A1g; 3B1g; 2B2g; 6EgÞ for this group. Letus now assume the monoclinic P21=n space group ðC5
2hÞ forthe Sr2InTaO6 ceramics, according to the suggestions ofTing et al. [4,5]. In this case, In and Ta ions should occupythe 2a and 2b Wyckoff-sites of both Ci symmetry, and Srand O ions would be in 4e sites of general C1 symmetry.The site group method leads now to the followingdistribution of irreducible representations of the C2h pointgroup:
G ¼ 12Ag � 12Bg � 18Au � 18Bu. (3)
For Sr2InTaO6, one would have 24 Raman-active phononmodes ð12Ag; 12BgÞ.Based on the above factor-group analyses, careful fitting
of Raman spectra of both Ba2InTaO6 and Sr2InTaO6
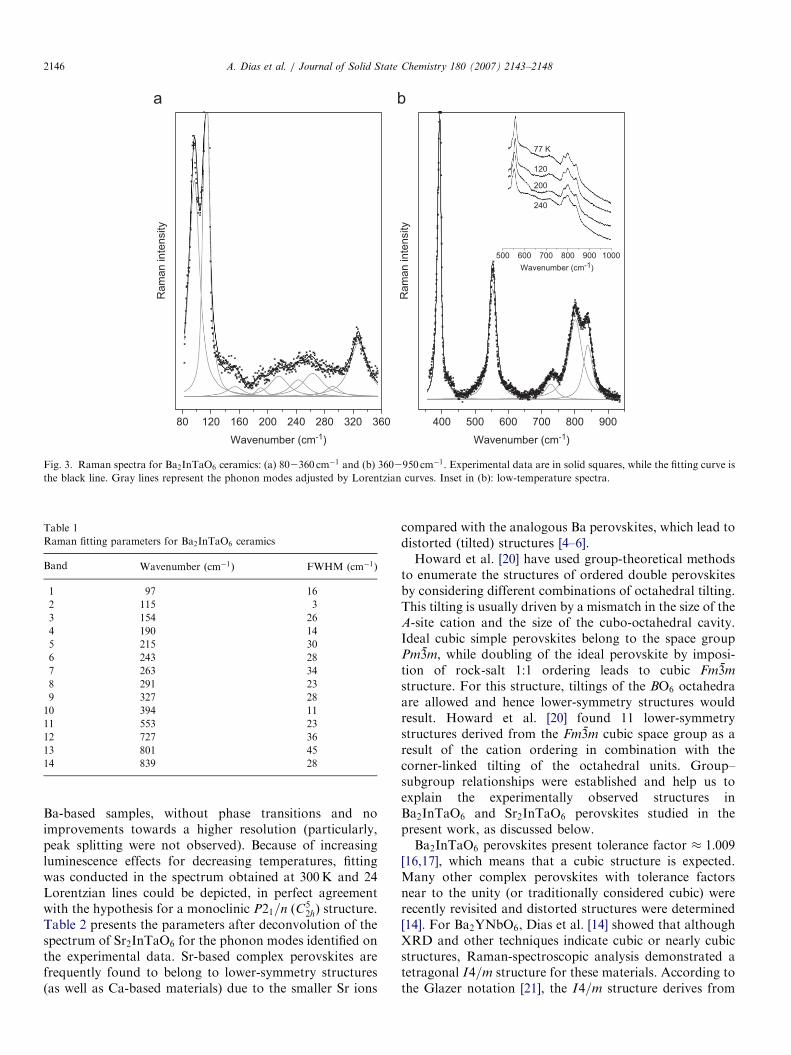
samples were carried out. The results for Ba-basedcompound are displayed in Fig. 3, which shows thespectrum obtained at 300K divided in two wavenumberregions, 802360 cm�1 (Fig. 3a) and 3602950 cm�1
(Fig. 3b), for better visualization. For this sample, theexperimental data are rather scattered, particularly for thefirst region (Fig. 3a), which sometimes makes it difficult tohave the correct fitting of the spectrum. In order toimprove the analysis and investigate the structural stability,low-temperature Raman measurements were conducteddown to 77K. Although the results did not bring anyimprovement in the quality of collected data (inset inFig. 3b), they show the absence of phase transitionstowards lower-symmetry structures. Therefore, the modedepicting was done on the room temperature spectra. Thefinal fitting (black lines in Fig. 3) was obtained through asum of 14 Lorentzian lines, in good agreement with thetheoretical predictions. Table 1 presents the parametersafter deconvolution of the spectrum of Ba2InTaO6:wavenumbers ðcm�1Þ and full width at half-maximaðcm�1Þ for the phonon modes identified on the experi-mental data. Thus, the correct structure for the Ba2InTaO6
perovskites appears to be within the tetragonal P4=mnc
ðD64hÞ space group, which agrees with the assumptions of
Ting et al. [5] after neutron diffraction analysis.Fig. 4 presents the Raman spectra for the Sr2InTaO6
perovskite, divided in three spectral regions for bettervisualization: 502300 cm�1 (Fig. 4a), 3002650 cm�1
(Fig. 4b), and 6502950 cm�1 (Fig. 4c). Experimental datadid not scatter as for Ba2InTaO6 materials, which wasbeneficial for the analysis conducted in the spect-rum obtained at 300K. Low-temperature measurementsdown to 77K (inset of Fig. 4b) showed similar results to
ARTICLE IN PRESS
80 120 160 200 240 280 320 360
Ram
an inte
nsity
Wavenumber (cm-1 )
400 500 600 700 800 900
500 600 700 800 900 1000
77 K
120
200
240
Wavenumber (cm-1 )
Ram
an inte
nsity
Wavenumber (cm-1 )
Fig. 3. Raman spectra for Ba2InTaO6 ceramics: (a) 802360 cm�1 and (b) 3602950 cm�1. Experimental data are in solid squares, while the fitting curve is
the black line. Gray lines represent the phonon modes adjusted by Lorentzian curves. Inset in (b): low-temperature spectra.
Table 1
Raman fitting parameters for Ba2InTaO6 ceramics
Band Wavenumber ðcm�1Þ FWHM ðcm�1Þ
1 97 16
2 115 3
3 154 26
4 190 14
5 215 30
6 243 28
7 263 34
8 291 23
9 327 28
10 394 11
11 553 23
12 727 36
13 801 45
14 839 28
A. Dias et al. / Journal of Solid State Chemistry 180 (2007) 2143–21482146
Ba-based samples, without phase transitions and noimprovements towards a higher resolution (particularly,peak splitting were not observed). Because of increasingluminescence effects for decreasing temperatures, fittingwas conducted in the spectrum obtained at 300K and 24Lorentzian lines could be depicted, in perfect agreementwith the hypothesis for a monoclinic P21=n ðC5
2hÞ structure.Table 2 presents the parameters after deconvolution of thespectrum of Sr2InTaO6 for the phonon modes identified onthe experimental data. Sr-based complex perovskites arefrequently found to belong to lower-symmetry structures(as well as Ca-based materials) due to the smaller Sr ions
compared with the analogous Ba perovskites, which lead todistorted (tilted) structures [4–6].Howard et al. [20] have used group-theoretical methods
to enumerate the structures of ordered double perovskitesby considering different combinations of octahedral tilting.This tilting is usually driven by a mismatch in the size of theA-site cation and the size of the cubo-octahedral cavity.Ideal cubic simple perovskites belong to the space groupPm3m, while doubling of the ideal perovskite by imposi-tion of rock-salt 1:1 ordering leads to cubic Fm3m
structure. For this structure, tiltings of the BO6 octahedraare allowed and hence lower-symmetry structures wouldresult. Howard et al. [20] found 11 lower-symmetrystructures derived from the Fm3m cubic space group as aresult of the cation ordering in combination with thecorner-linked tilting of the octahedral units. Group–subgroup relationships were established and help us toexplain the experimentally observed structures inBa2InTaO6 and Sr2InTaO6 perovskites studied in thepresent work, as discussed below.Ba2InTaO6 perovskites present tolerance factor � 1:009
[16,17], which means that a cubic structure is expected.Many other complex perovskites with tolerance factorsnear to the unity (or traditionally considered cubic) wererecently revisited and distorted structures were determined[14]. For Ba2YNbO6, Dias et al. [14] showed that althoughXRD and other techniques indicate cubic or nearly cubicstructures, Raman-spectroscopic analysis demonstrated atetragonal I4=m structure for these materials. According tothe Glazer notation [21], the I4=m structure derives from

ARTICLE IN PRESSR
am
an
in
ten
sity
Wavenumber (cm-1)
100 150 200 250 300
Ra
ma
n in
ten
sity
Wavenumber (cm-1)
Wavenumber (cm-1)
350300 400 450 500 550 600 650
700 800 900 1000600
77 k
100
250
200
Ra
ma
n in
ten
sity
Wavenumber (cm-1)
650 950900850800750700
Fig. 4. Raman spectra for Sr2InTaO6 ceramics: (a) 502300 cm�1; (b) 3002650 cm�1; and (c) 6502950 cm�1. Experimental data are in solid squares, while
the fitting curve is the black line. Gray lines represent the phonon modes adjusted by Lorentzian curves. Inset in (b): low-temperature spectra.
Table 2
Raman fitting parameters for Sr2InTaO6 samples
Band Wavenumber ðcm�1Þ FWHM ðcm�1Þ
1 88 12
2 98 19
3 105 12
4 113 11
5 124 12
6 135 6
7 144 7
8 162 10
9 213 17
10 219 14
11 239 23
12 274 71
13 312 42
14 339 16
15 364 4
16 405 13
17 422 13
18 449 9
19 565 24
20 741 39
21 802 26
22 825 33
23 844 64
24 889 37
A. Dias et al. / Journal of Solid State Chemistry 180 (2007) 2143–2148 2147
the Fm3m ða0a0a0Þ by a single rotation of the BO6
octahedra about one of the fourfold axes, lowering thesymmetry to tetragonal ða0a0c�Þ. This structure presents 9Raman-active bands [14], which is not compatible with our
findings for the Ba2InTaO6 perovskite. We believe that thesmall tetragonal distortion in this material is similar to thatobserved in Ba2YNbO6, i.e., the octahedral tilting is toosmall to be detected by XRD or even more sophisticatedtechniques, like neutrons and electron diffraction. How-ever, the out-of-phase distortions appear to be sufficientlylarge to be detected by Raman spectroscopy.We start with the same hypothesis for a distorted
structure by tilting only one axis (smaller possibledistortion), and using group–subgroup relationships devel-oped by Howard et al. [20]. From the Fm3m space group,there are only two possibilities: I4=m ða0a0c�Þ, discussedabove, and P4=mnc ða0a0cþÞ. The only difference betweenthem is the direction of the distortion: out-of-phase for theformer and in-phase for the last space group. Bothstructures are tetragonal and the P4=mnc space groupapplied to our Ba2InTaO6 materials agrees well with thenumber of Raman-active modes experimentally verified.Also, fortunately, this structure represents the intermediatephase between the Fm3m cubic and the monoclinic P21=n
ðaþb�b�Þ, assumed in the present work as being the correctstructure for Sr2InTaO6 perovskites. In this respect,Howard et al. [20] pointed out this phase transformationas a continuous Fm3m! P4=mnc! P21=n ‘‘natural’’sequence. The authors appeared to be surprised for thefact that ‘‘there has been no report to date of the directobservation of the intermediate tetragonal structure inP4=mnc space group’’. In this respect, experimental Ramandata allowed us to determine the correct structure forBa2InTaO6 and Sr2InTaO6 perovskites at the light of

ARTICLE IN PRESSA. Dias et al. / Journal of Solid State Chemistry 180 (2007) 2143–21482148
group-theoretical models. Besides, these results contributedto understand and explain small distortions in materialswith tolerance factors close to the unity (considered ideallycubic), and to report the first example of a P4=mnc indium-containing tetragonal perovskite.
4. Conclusions
The crystal structures of Ba2InTaO6 and Sr2InTaO6
perovskites were analyzed by Raman spectroscopy, fromroom temperature down to 77K. Based on XRD data andon the available literature, we have investigated thepossibilities for a non-cubic structure for Ba2InTaO6 anddiscussed the expected results for the monoclinic structureproposed for the Sr-based analog perovskite. The resultsshowed quite different spectra for the analyzed materials,which in turn are similar for each perovskite for decreasingtemperatures. No phase transition was detected for bothceramics down to 77K. Room temperature spectra werefitted by sum of Lorentzian lines, and a tetragonal P4=mnc
ðD64hÞ structure (14 Raman-active phonon modes) was
found for Ba2InTaO6. On the other hand, Sr-basedmaterials belong to the monoclinic P21=n ðC5
2hÞ spacegroup, with 24 Raman bands clearly identified. In bothcases, the results are in perfect agreement with thetheoretical factor-group analysis for the assumed struc-tures. This paper reports for the first time a tetragonalP4=mnc structure for a indium-containing perovskitematerial.
Acknowledgments
The Brazilian authors acknowledge the financial supportfrom MCT/CNPq, FINEP and FAPEMIG. Indianauthors are grateful to CSIR. One of the authors (L.A.Khalam) thanks UGC for the award of a fellowship.
Special thanks to Prof. F.M. Matinaga (UFMG) for hishospitality during low-temperature Raman experiments.
References
[1] T.A. Vanderah, Science 298 (2002) 1182–1184.
[2] W. Wersing, Curr. Opin. Solid State Mater. Sci. 1 (1996) 715–731.
[3] I.M. Reaney, D.M. Iddles, J. Am. Ceram. Soc. 89 (2006) 2063–2072.
[4] V. Ting, Y. Liu, R.L. Withers, E. Krausz, J. Solid State Chem. 177
(2004) 979–986.
[5] V. Ting, Y. Liu, R.L. Withers, L. Noren, M. James, J.D. Fitz Gerald,
J. Solid State Chem. 179 (2006) 551–562.
[6] W.T. Fu, D.J.W. Ijdo, Solid State Commun. 134 (2005) 177–181.
[7] F. Galasso, W. Darby, J. Phys. Chem. 66 (1962) 131–132.
[8] V.S. Filip’ev, E.G. Fesenko, Sov. Phys.-Crystallogr. 10 (1966)
243–247.
[9] V.S. Filip’ev, E.G. Fesenko, Sov. Phys.-Crystallogr. 10 (1966)
532–534.
[10] J. Yin, Z. Zou, J. Ye, J. Phys. Chem. B 107 (2003) 61–65.
[11] R. Ratheesh, M. Wohlecke, B. Berge, Th. Wahlbrink, H. Haeuseler,
E. Ruhl, R. Blachnik, P. Balan, N. Santha, M.T. Sebastian, J. Appl.
Phys. 88 (2000) 2813–2818.
[12] A. Kania, K. Roleder, G.E. Kugel, M. Hafid, Ferroelectrics 135
(1992) 75–84.
[13] R.L. Moreira, F.M. Matinaga, A. Dias, Appl. Phys. Lett. 78 (2001)
428–430.
[14] A. Dias, L.A. Khalam, M.T. Sebastian, C.W.A. Paschoal, R.L.
Moreira, Chem. Mater. 18 (2006) 214–220.
[15] R.L. Moreira, A. Feteira, A. Dias, J. Phys.: Condens. Matter 17
(2005) 2775–2781.
[16] L.A. Khalam, H. Sreemoolanathan, R. Ratheesh, P. Mohanan, M.T.
Sebastian, Mater. Sci. Eng. B 107 (2004) 264–270.
[17] L.A. Khalam, M.T. Sebastian, Int. J. Appl. Ceram. Technol. 3 (2006)
364–374.
[18] R.L. Moreira, L.A. Khalam, M.T. Sebastian, A. Dias, J. Eur. Ceram.
Soc. 27 (2007) 2803–2809.
[19] D.L. Rousseau, R.P. Bauman, S.P.S. Porto, J. Raman Spectrosc. 10
(1981) 253–290.
[20] C.J. Howard, B.J. Kennedy, P.M. Woodward, Acta Cryst. B59
(2003) 463–471.
[21] A.M. Glazer, Acta Cryst. A 31 (1975) 756–762.
Copyright © 2022 FDOKUMEN