Phase transition and electric properties of long chain Cd(II) layered perovskites
18
This article was downloaded by:[Pusan National University Library] [Pusan National University Library] On: 21 January 2007 Access Details: [subscription number 731982920] Publisher: Taylor & Francis Informa Ltd Registered in England and Wales Registered Number: 1072954 Registered office: Mortimer House, 37-41 Mortimer Street, London W1T 3JH, UK Phase Transitions A Multinational Journal Publication details, including instructions for authors and subscription information: http://www.informaworld.com/smpp/title~content=t713647403 Phase transition and electric properties of long chain Cd(II) layered perovskites Mohga F. Mostafa a ; Arafa Hassen a a Faculty of Science, Physics Department, Fayoum branch, University of Cairo. Egypt To link to this article: DOI: 10.1080/01411590600670237 URL: http://dx.doi.org/10.1080/01411590600670237 Full terms and conditions of use: http://www.informaworld.com/terms-and-conditions-of-access.pdf This article maybe used for research, teaching and private study purposes. Any substantial or systematic reproduction, re-distribution, re-selling, loan or sub-licensing, systematic supply or distribution in any form to anyone is expressly forbidden. The publisher does not give any warranty express or implied or make any representation that the contents will be complete or accurate or up to date. The accuracy of any instructions, formulae and drug doses should be independently verified with primary sources. The publisher shall not be liable for any loss, actions, claims, proceedings, demand or costs or damages whatsoever or howsoever caused arising directly or indirectly in connection with or arising out of the use of this material. © Taylor and Francis 2007
Transcript of Phase transition and electric properties of long chain Cd(II) layered perovskites
This article was downloaded by:[Pusan National University Library][Pusan National University Library]
On: 21 January 2007Access Details: [subscription number 731982920]Publisher: Taylor & FrancisInforma Ltd Registered in England and Wales Registered Number: 1072954Registered office: Mortimer House, 37-41 Mortimer Street, London W1T 3JH, UK
Phase TransitionsA Multinational JournalPublication details, including instructions for authors and subscription information:http://www.informaworld.com/smpp/title~content=t713647403
Phase transition and electric properties of long chainCd(II) layered perovskitesMohga F. Mostafa a; Arafa Hassen aa Faculty of Science, Physics Department, Fayoum branch, University of Cairo.Egypt
To link to this article: DOI: 10.1080/01411590600670237URL: http://dx.doi.org/10.1080/01411590600670237
Full terms and conditions of use: http://www.informaworld.com/terms-and-conditions-of-access.pdfThis article maybe used for research, teaching and private study purposes. Any substantial or systematic reproduction,re-distribution, re-selling, loan or sub-licensing, systematic supply or distribution in any form to anyone is expresslyforbidden.The publisher does not give any warranty express or implied or make any representation that the contents will becomplete or accurate or up to date. The accuracy of any instructions, formulae and drug doses should beindependently verified with primary sources. The publisher shall not be liable for any loss, actions, claims, proceedings,demand or costs or damages whatsoever or howsoever caused arising directly or indirectly in connection with orarising out of the use of this material.© Taylor and Francis 2007
Dow
nloaded By: [Pusan National U
niversity Library] At: 02:31 21 January 2007
Phase Transitions,Vol. 79, Nos. 4–5, April–May 2006, 305–321
Phase transition and electric properties of long chainCd(II) layered perovskites
MOHGA F. MOSTAFA* and ARAFA HASSEN
Faculty of Science, Physics Department, Fayoum branch,University of Cairo, Egypt
(Received 7 April 2005; in final form 10 January 2006)
The new layered perovskite [(CH2)12(NH3)2]CdCl4 material exhibits a secondorder phase transition at T1p¼ 376.8K (�S1’ 12.5 JK�1mol�1) of theorder–disorder type. The dielectric permittivity has been studied in thetemperature range 300–400K and frequency range 0.1–100 kHz, on heating andcooling. The ac conductivity is thermally activated with different activationenergies in the range of ionic conduction. The variation of ac conductivity withfrequency follows the power law:
�ð!Þ ¼ A0!0 þ A1!
s1 þ A2!s2 , where 0 < s1 < 1 and 1 < s2 < 2:
Proton hopping and localised reorientational motion, ionic hopping of chlorinevacancies and large polarons are possible conduction mechanisms in the differenttemperature ranges. Comparison with other isomorphous transition metalperovskites is discussed.
Keywords: Phase transition; Transport properties; Conduction in layered perovskites;Permittivity studies
1. Introduction
The biologically significant lipid membranes are known to exhibit low dimensionalcharacteristics and to undergo structural phase transitions at temperatures nearambient [1]. An excellent representative model for a lipid is found in the long chainalkylene-diammonium complexes [(CH2)n(NH3)2]MCl4, where n¼ 6, 7, . . . , andM¼ divalent transition metal ion [2–8]. The metal ion is in a distorted octahedronof halogen ions. The octahedra share corners extending in infinite sheets separatedby the alkylene [(CH2)n(NH3)2]
þþ groups [2, 7, 8]. Structural phase changes,magnetic properties and transport properties in some of these lipid models, such as[(CH2)n(NH3)2MCl4], n¼ 6, 9, 10 and 12, M¼Fe, Cu and Co have been studiedin our laboratory [6, 9–13]. The dielectric and transport properties have beenassociated mainly with the alkylene diammonium chain orientation ignoring the roleplayed by the metal-chloride matrix. Comparison of the Cu and Co salt, for n¼ 12,
*Corresponding author. Email: [email protected]
Phase Transitions
ISSN 0141-1594 print/ISSN 1029-0338 online � 2006 Taylor & Francis
http://www.tandf.co.uk/journals
DOI: 10.1080/01411590600670237
Dow
nloaded By: [Pusan National U
niversity Library] At: 02:31 21 January 2007
did not give definite answers to the role played by the metal halide matrix. This isbecause Co salt has intercalated chains and the metal halide does not extend in thetwo-dimensional net work but forms separate [CoCl4]
�2 entities [14, 15]. The Cd salthas the general structural features as the corresponding Cu, where the chainsseparate the metal chloride layers forming hydrogen bonds to the MCI�2
6 octahedra.In both salts the metal halide matrix extends in two dimensional layers. The maindifference is the Jahn-Teller distortion in the Cu salt which leads to a distortion in[CuCl6]
�2 octahedra resulting in two bridging Cu–Cl bonds longer than the othertwo [16]. In the Cd salt the bridging Cd–Cl distances are equal [17]. Hence, dielectricand conductivity study of the Cd salt, for n¼ 12, denoted C12Cd, and comparison tothe previously studied Cu salt (n¼ 12), denoted C12Cu, would shed some light on therole played by the metal halide matrix in these layered system.
In this work the differential thermal scanning in the range of temperatures 300Kto 400K, the dielectric studies in the same temperature range and in the frequencyrange 110Hz–80 kHz are presented. IR in the frequency range 4000 cm�1–200 cm�1
was performed to ensure the formation of the correct sample.
2. Experimental details
2.1. Sample preparation
The compound is prepared by mixing equimolar ratios of (CH2)12(NH3)2Cl2 andCdCl2 � 2H2O in an acidified alcoholic solution. The mixture was kept at 90�C fortwo hours. Then the product is cooled gradually to room temperature. Creamcoloured polycrystalline material precipitates out. The material was recrystallisedfrom a mixture of alcohol and ether and then dried under a vacuum. Samples wereground and pressed into pellets at pressure of 1 ton cm�2. The chemical analysis wascarried out at the microanalysis unit at the University of Cairo. It showed that thecompound has the chemical formula [(CH2)12(NH3)2CdCl4]. The analysis resultsare listed in table 1.
2.2. Measurements
IR measurement was performed using an FTIR 5000 spectrometer in the range4000 cm�1–200 cm�1.
Differential thermal analysis (DSC) measurement was performed on aShimadzu (50)-differential scanning analyser with a scanning speed of 10�Cmin�1.The data were calibrated with the melting transition of Indium at 125�C.
The complex dielectric permittivity "* in the frequency range 110Hz–100 kHzwas measured using a computer controlled lock-in amplifier type PAR 5207.
Table 1. Results of the chemical analysis [(CH2)12(NH3)2]CdCl4.
Element C H N Cl Cd
% Calcd 35.72 7.45 6.95 35.22 14.51% fnd. 35.31 6.77 6.58 34.10 14.43
306 M. F. Mostafa and A. Hassen
Dow
nloaded By: [Pusan National U
niversity Library] At: 02:31 21 January 2007
The temperature was measured using a copper constantan thermocouple. To ensurea good electrical contact, each measured sample is coated with silver paste. Themeasuring technique and precautions to avoid stray capacitance have been discussedpreviously [10].
3. Results and discussion
3.1. Infrared
The obtained IR spectra is typical for these long chains alkylene-diammonimperovskites [11, 18, 19]. Table 2 lists the most characteristic absorption peaks andtheir assignment. The most characteristic bands in the infrared are those associatedwith the CH2 rocking motion, which are usually stronger than the much weakerCH2-wagging that are not always observable. Bands found at 610–730 cm�1 areassigned to the CH2 rocking fundamental mode �r(CH2) [19]. The CH2 waggingmodes are observed at 1150–1400 cm�1, for crystalline n-paraffins. These modes aremixed with the (NH3)
þ modes. The coupling with ammonium anion may be thereason why a strong enhancement of the intensity of CH2 wagging modes is observedcompared to the corresponding ones in the case of n-alkanes. Bands located at1400–1500 cm�1 belong probably to the NH3 symmetric deformation mode. Strongbands found at 1620 cm�1 are assigned to N–H deformation. Meanwhile the bandsin the range 400–200 cm�1 are typical for M–Cl vibration [18]. The results prove thepresence of the M–Cl layer and together with the chemical analysis confirm theformation of the newly prepared material.
3.2. Thermal properties
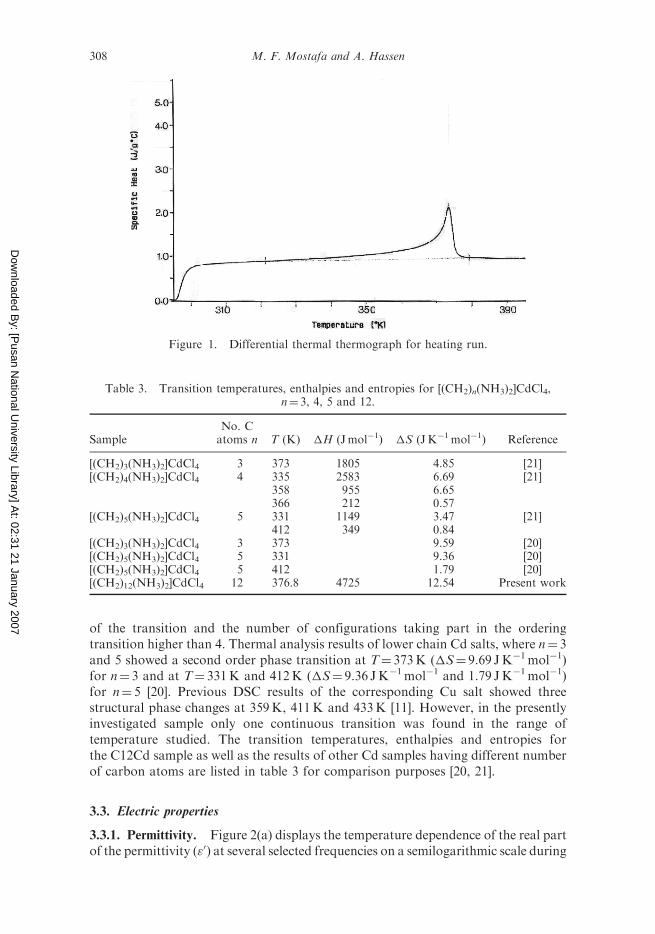
3.2.1. Differential thermal analysis. Figure 1 shows the DSC thermograph atscanning speed of 10�Cmin�1 for C12Cd in the temperature range 300–400K,obtained while heating up. Most probably the continuous transition with a long tailon the low temperature side, with the peak maximum at 376.8K is second order.The change in entropy calculated from the peak area is �S¼ 12.5 JK�1mol�1
¼
1.5R. The high value of the entropy implies a well defined order–disorder character
Table 2. Absorption bands and their assignment for[(CH2)12(NH3)2]CdCl4.
Wave number (cm�1) Attributed to
248–208 Cd–Cl str.680–730 �r (CH2)1409 CH2 Wagging/(NHþ
3 /(CH) str.1580–1660 N–H def.2420–2670 N–H–Cl2940 C–H str.3111 C–H str./(NH3) (vs)3653–3631 C–H str.
Phase transition and electric properties of long chain Cd(II) layered perovskites 307
Dow
nloaded By: [Pusan National U
niversity Library] At: 02:31 21 January 2007 of the transition and the number of configurations taking part in the orderingtransition higher than 4. Thermal analysis results of lower chain Cd salts, where n¼ 3and 5 showed a second order phase transition at T¼ 373K (�S¼ 9.69 JK�1mol�1)for n¼ 3 and at T¼ 331K and 412K (�S¼ 9.36 JK�1mol�1 and 1.79 JK�1mol�1)for n¼ 5 [20]. Previous DSC results of the corresponding Cu salt showed threestructural phase changes at 359K, 411K and 433K [11]. However, in the presentlyinvestigated sample only one continuous transition was found in the range oftemperature studied. The transition temperatures, enthalpies and entropies forthe C12Cd sample as well as the results of other Cd samples having different numberof carbon atoms are listed in table 3 for comparison purposes [20, 21].
3.3. Electric properties
3.3.1. Permittivity. Figure 2(a) displays the temperature dependence of the real partof the permittivity ("0) at several selected frequencies on a semilogarithmic scale during
Figure 1. Differential thermal thermograph for heating run.
Table 3. Transition temperatures, enthalpies and entropies for [(CH2)n(NH3)2]CdCl4,n¼ 3, 4, 5 and 12.
SampleNo. Catoms n T (K) �H (Jmol�1) �S (JK�1mol�1) Reference
[(CH2)3(NH3)2]CdCl4 3 373 1805 4.85 [21][(CH2)4(NH3)2]CdCl4 4 335 2583 6.69 [21]
358 955 6.65366 212 0.57
[(CH2)5(NH3)2]CdCl4 5 331 1149 3.47 [21]412 349 0.84
[(CH2)3(NH3)2]CdCl4 3 373 9.59 [20][(CH2)5(NH3)2]CdCl4 5 331 9.36 [20][(CH2)5(NH3)2]CdCl4 5 412 1.79 [20][(CH2)12(NH3)2]CdCl4 12 376.8 4725 12.54 Present work
308 M. F. Mostafa and A. Hassen

Dow
nloaded By: [Pusan National U
niversity Library] At: 02:31 21 January 2007
heating of the C12Cd sample. In the temperature range T<350K, region (III), thepermittivity "0 is nearly frequency independent and weakly increases with temperature(figure 2a). In the transition regime, region II (Tr), 355K<T<380K, the rate ofincrease in ("0) with temperature, (d"0/dT ) undergoes a slight change at T’ 377Kwhich is evident in the low frequencies ( f� 410Hz). At higher temperatures,
heating
4
4.5
5
5.5
300 320 340 360 380 400 420
T (K)
110(a)
(b)
210 410 610 1010 20104010 6010 8000 10000
ITr IIIII
Hz
ln(e
′)ln
(e′)
cooling
4
4.5
5
5.5
300 320 340 360 380 400 420
T (K)
III ITr II
heat ooocool ----
50
90
130
170
310 360 410
T (K)
Figure 2. (a) The real part of the permittivity ("0) vs. temperature, (heating run), (b) theimaginary part of the permittivity ("0 0) vs. temperature, (heating run).
Phase transition and electric properties of long chain Cd(II) layered perovskites 309

Dow
nloaded By: [Pusan National U
niversity Library] At: 02:31 21 January 2007
region (I), T>380K, a strong dispersion is observed. It is to be noted that theanomalous change in d"0/dT becomes weaker as the frequency increases and barelyvisible for f>1kHz. Figure 2(b) shows the temperature dependence of the real part ofthe permittivity ("0) as a function of temperature obtained during the cooling cycle atseveral selected frequencies. Similar behaviour to that obtained during heating isobserved, however the permittivity has lower values during the cooling cycle than thatfound during the heating cycle in regime (II) as seen in the insert (figure 2c). In the hightemperature phase (I), the permittivity has the same value for both cycles. Similarresults are obtained for the room temperature phase (III). This suggests that theintermediate phase (II) through which the sample passes on heating is different fromthat which it goes through during the cooling cycle. Previous structural studies haveindicated that members of alkylene diammonium series with even numbers of carbonatoms aremonoclinic and have rigid ordered chains in the room temperature phase [5].The [(CH2)n(NH3)2]CdCl4, n¼ 4 undergoes structural change to an orthorhombicphase at high temperature [5]. The transition is a result of conformation of the alkylenechains. Adopting this structural consideration together with the DSC results wepropose that a reversible second order phase change from an all-trans configuration toa twisted state in the orthorhombic high temperature phase takes place in C12Cd.The disordered high temperature phase is associated with orientation of the dipolesleading to the observed increase in polarisation.
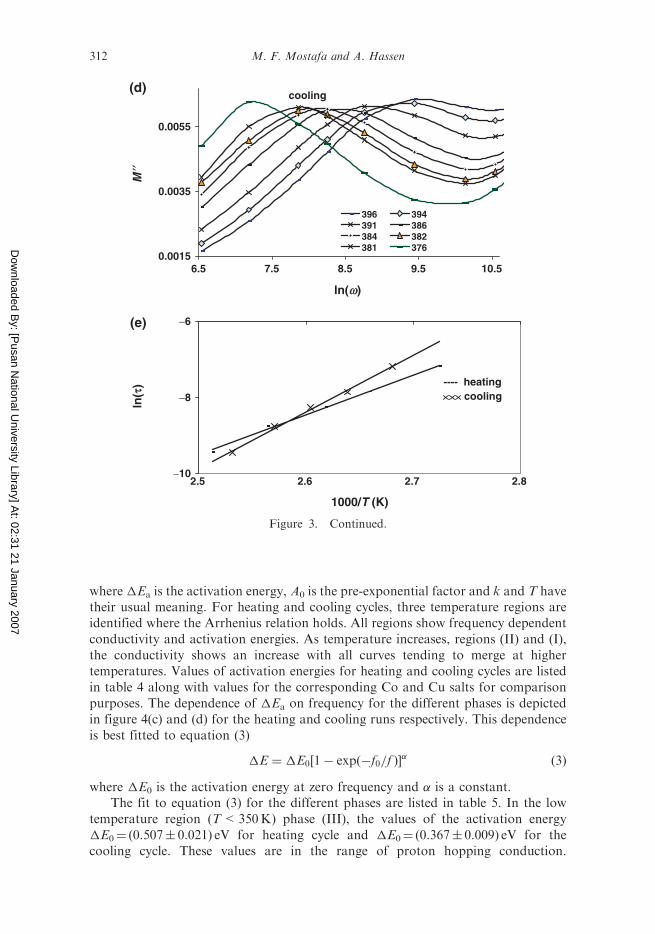
3.3.2. Dielectric relaxation. The dielectric modulus M*¼ 1/"* is used to obtain theconductivity relaxation so as to avoid the effect of electrode polarisation [22, 23]. Thefrequency dependence M* versus ln(!) for heating and cooling runs are shownin figures 3(a–d), respectively. As frequency increases M0(!) increases to a maximumasymptotic value defined as M1. The spectra of M00(!) show an asymmetric peakwhich moves to higher frequencies with increasing temperature. The s-shapeddispersion ofM0 and the bell shaped peaks inM00 are typical of ionic conductors. Thefrequency !c at which the maximum of M00 occurs, defines the conductivityrelaxation time, where !c�c¼ 1. The variation of the maximum was fitted to
� ¼ �0 expð��Er=kT Þ ð1Þ
where �Er is the activation energy for relaxation process and �0 is the hightemperature limit of the relaxation time. Plot of ln(�) versus 1000/T is shown infigure 3(e) for heating–cooling cycle. The graph yields the values �Er¼ 0.84 eV and1.25 eV and �0¼ 1.9� 10�15 (s) and 9.6� 10�21 (s) for the heating and cooling runs,respectively. It is also observed that the shape of the full width at half the height �,does not change appreciably in the temperature range investigated, yet it is widerthan the maximum breadth of the Debye peak (1.14 decades). Using the relation�¼ 1.14/�, we get a � value¼ 0.54 indicating a non-Debye behavior of theac conductivity.
3.3.3. Conductivity. The temperature dependence of the conductivity presented asln(�) versus reciprocal temperature at selected frequencies is shown in figure 4(a) and(b) for heating/cooling cycle respectively. Generally conductivity is thermallyactivated following the Arrhenius relation:
�ðT Þ ¼ A0 expð��Ea=kT Þ ð2Þ
310 M. F. Mostafa and A. Hassen

Dow
nloaded By: [Pusan National U
niversity Library] At: 02:31 21 January 2007
heating(a)
(b)
(c)
0
0.008
0.016
6 10 14
M′
M′′
M′
338354359370382388392395401
heating
0.0015
0.0035
0.0055
6.5 8.5 10.5
364 371376 378381 384389 392396
cooling
0
0.005
0.01
0.015
6 10 14
403399396391384379374366353352331
ln(w)
ln(w)
ln(w)
Figure 3. (a) The real part of the dielectric modulus (M0) vs. ln!, (heating run), (b) theimaginary part of the dielectric modulus (M0 0) vs. ln!, (heating run), (c) the real part of thedielectric modulus (M0) vs. ln!, (cooling run), (d) the imaginary part of the dielectric modulus(M0 0) vs. ln!, (cooling run), (e) ln � vs. 1000/T, for heating run (- - -) and cooling run (���).
Phase transition and electric properties of long chain Cd(II) layered perovskites 311
Dow
nloaded By: [Pusan National U
niversity Library] At: 02:31 21 January 2007
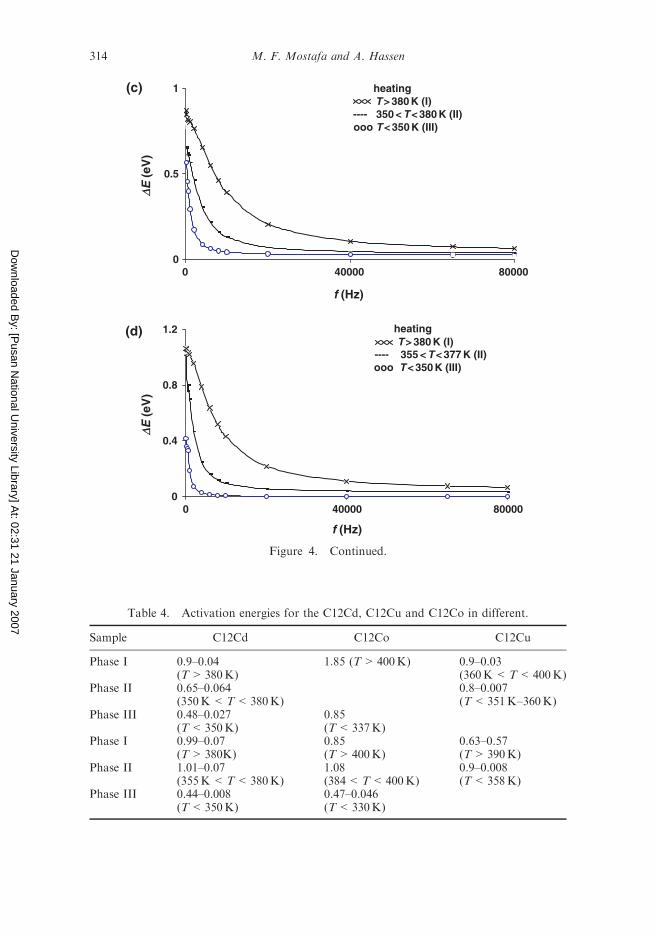
where �Ea is the activation energy, A0 is the pre-exponential factor and k and T havetheir usual meaning. For heating and cooling cycles, three temperature regions areidentified where the Arrhenius relation holds. All regions show frequency dependentconductivity and activation energies. As temperature increases, regions (II) and (I),the conductivity shows an increase with all curves tending to merge at highertemperatures. Values of activation energies for heating and cooling cycles are listedin table 4 along with values for the corresponding Co and Cu salts for comparisonpurposes. The dependence of �Ea on frequency for the different phases is depictedin figure 4(c) and (d) for the heating and cooling runs respectively. This dependenceis best fitted to equation (3)
�E ¼ �E0½1� expð�f0=f Þ��
ð3Þ
where �E0 is the activation energy at zero frequency and � is a constant.The fit to equation (3) for the different phases are listed in table 5. In the low
temperature region (T<350K) phase (III), the values of the activation energy�E0¼ (0.507� 0.021) eV for heating cycle and �E0¼ (0.367� 0.009) eV for thecooling cycle. These values are in the range of proton hopping conduction.
cooling
0.0015
0.0035
0.0055
(d)
(e)
6.5 7.5 8.5 9.5 10.5
M′′
396 394391 386384 382381 376
---- heatingcooling
−10
−8
−6
2.5 2.6 2.7 2.8
1000/T (K)
ln(w)
ln(t
)
Figure 3. Continued.
312 M. F. Mostafa and A. Hassen

Dow
nloaded By: [Pusan National U
niversity Library] At: 02:31 21 January 2007
In region (II) (350K<T<380K), the activation energy is �E0¼ (0.64� 0.007) eV,for the heating cycle. This value is typical of vacancy conduction mechanism andsuggests that hopping of chlorine vacancies may be responsible for the conduction inthis temperature range. It is to be noted that this value is nearly half that found forthe cooling cycle with �E0� (1.033� 0.045) eV confirming that the sample passesthrough a different phase during the cooling process. In region (I), T>380K, theactivation energy has nearly the same magnitude within experimental error,�E0� (1.024� 0.004) eV and (1.032� 0.005) eV for heating and cooling respectively.In this temperature region, phase (I), the activation energy value and theconductivity behaviour suggests band type conduction. Comparison of the activationenergies on heating the sample C12Cd with other previously studied samples haveindicated that for phase (I) the activation energy is essentially the same for allsamples except C12Co. This is not unexpected since C12Co has a different structural
heating
−23
−19
−15
2.4 2.6 2.8 3 3.2 3.4
1000/T (K)
410(a)
(b)
1010 2010 4010 60108000 10000 20000 40000 80000
IIII Tr
Hz
II
cooling
−23
−19
−15
2.4 2.6 2.8 3 3.2 3.4
1000/T (K)
ln(s
)ln
(s)
610 1010 2010 4010 60108000 10000 20000 40000 80000
I II IIITr
Hz
Figure 4. (a) The conductivity ln(�T) vs. reciprocal temperature, (heating run), (b) theconductivity ln(�T) vs. reciprocal temperature, (cooling run), (c) fit to equation (3), for�Ea� f (Hz), (heating cycle), (d) fit to equation (3), for �Ea� f (Hz), (cooling cycle).
Phase transition and electric properties of long chain Cd(II) layered perovskites 313
Dow
nloaded By: [Pusan National U
niversity Library] At: 02:31 21 January 2007
heating T > 380 K (I)
T > 380 K (I)
---- 350 < T < 380 K (II)ooo T < 350 K (III)
heating
---- 355 < T < 377 K (II)ooo T < 350 K (III)
0
0.5
1(c)
(d)
0 40000 80000
f (Hz)
DE (
eV)
DE (
eV)
0
0.4
0.8
1.2
0 40000 80000
f (Hz)
Figure 4. Continued.
Table 4. Activation energies for the C12Cd, C12Cu and C12Co in different.
Sample C12Cd C12Co C12Cu
Phase I 0.9–0.04 1.85 (T>400K) 0.9–0.03(T>380K) (360K<T<400K)
Phase II 0.65–0.064 0.8–0.007(350K<T<380K) (T<351K–360K)
Phase III 0.48–0.027 0.85(T<350K) (T<337K)
Phase I 0.99–0.07 0.85 0.63–0.57(T>380K) (T>400K) (T>390K)
Phase II 1.01–0.07 1.08 0.9–0.008(355K<T<380K) (384<T<400K) (T<358K)
Phase III 0.44–0.008 0.47–0.046(T<350K) (T<330K)
314 M. F. Mostafa and A. Hassen
Dow
nloaded By: [Pusan National U
niversity Library] At: 02:31 21 January 2007
characteristic from the rest of the series [14, 15]. In the temperature range (II),
heating cycle, C12Cd has the lowest activation energy compared to other listed
values for Co and Cu samples. This could be due to the fact that the system is in a
metastable state, as this is the temperature range where the continuous phase
transformation takes place.Frequency dependence: the variation of ln(�T) versus ln(!) is shown in figure 5(a)
and (b) for the heating–cooling cycle. At low frequencies f<410Hz and low
temperatures T<350K, some of the data are scattered and have been omitted from
the plots. The frequency dependent conductivity can be used to get information
about the concentration of the mobile ions in the solid. As has been suggested
by Funggao et al., the dc conductivity and the parameters A0 can be related
to a characteristic frequency !p, the ion hoping rate [24]:
�ð!Þ ¼ K!p½1þ !=!p�n
ð4Þ
where �dc¼K!p, A0¼K(!p)1�n. It is natural to expect the ion hopping rate to
increase in a thermally activated manner such that
!p ¼ !0expð��G=kT Þ ð5Þ
where �G is the free energy, !0 is the attempt frequency of the hopping process.Considering the concentration and temperature dependence of the mobile ions, one
can compare the temperature dependence of the hopping rate to that of the
dc conductivity. The temperature dependence of the hopping rate¼!p is obtained by
using the relationship [24]:
�ð!Þ ¼ 2�, ! ¼ !p: ð6Þ
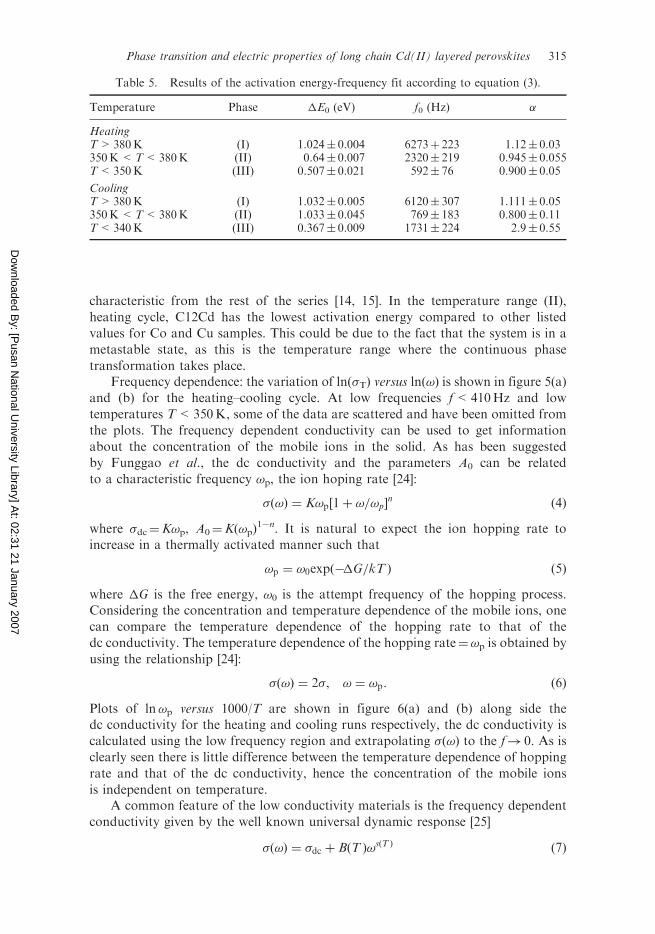
Plots of ln!p versus 1000/T are shown in figure 6(a) and (b) along side thedc conductivity for the heating and cooling runs respectively, the dc conductivity is
calculated using the low frequency region and extrapolating �(!) to the f! 0. As is
clearly seen there is little difference between the temperature dependence of hopping
rate and that of the dc conductivity, hence the concentration of the mobile ions
is independent on temperature.A common feature of the low conductivity materials is the frequency dependent
conductivity given by the well known universal dynamic response [25]
�ð!Þ ¼ �dc þ BðT Þ!sðT Þ ð7Þ
Table 5. Results of the activation energy-frequency fit according to equation (3).
Temperature Phase �E0 (eV) f0 (Hz) �
HeatingT>380K (I) 1.024� 0.004 6273þ 223 1.12� 0.03350K<T<380K (II) 0.64� 0.007 2320� 219 0.945� 0.055T<350K (III) 0.507� 0.021 592� 76 0.900� 0.05
CoolingT>380K (I) 1.032� 0.005 6120� 307 1.111� 0.05350K<T<380K (II) 1.033� 0.045 769� 183 0.800� 0.11T<340K (III) 0.367� 0.009 1731� 224 2.9� 0.55
Phase transition and electric properties of long chain Cd(II) layered perovskites 315

Dow
nloaded By: [Pusan National U
niversity Library] At: 02:31 21 January 2007
where �dc is the dc (or low frequency) conductivity, s is the universal exponentusually has values 0–1, B is a pre-exponential factor. Both s and B are function oftemperature and the conduction mechanism.
As seen in figures 5(a) and (b) the conductivity increases with increasingfrequency and eventually attains a high frequency plateau. These plateaux arecommonly found in ionic conductors such as Na-�-alumina [26]. Attempts to fit the
heating
−23
−18
−13
6 7 8 9 10 11 12 13
ln(s
)ln
(s)
310
(b)
(a) 324 336 350 361364 370 375 377 378382 383 386 390 392395 398 401 404
cooling
−23
−19
−15
6 7 8 9 10 11 12 13
ln(w)
ln(w)
Figure 5. (a) The conductivity ln(�T) vs. ln(!) (heating run), (b) the conductivity ln(�T) vs.ln(!), (cooling run).
316 M. F. Mostafa and A. Hassen
Dow
nloaded By: [Pusan National U
niversity Library] At: 02:31 21 January 2007 data to equation (7) failed, and the frequency dependent conductivity is found to be
best represented by the two power term equation [26]:
�ð!Þ ¼ A0!0 þ A1!
s1 þ A2!s2 : ð8Þ
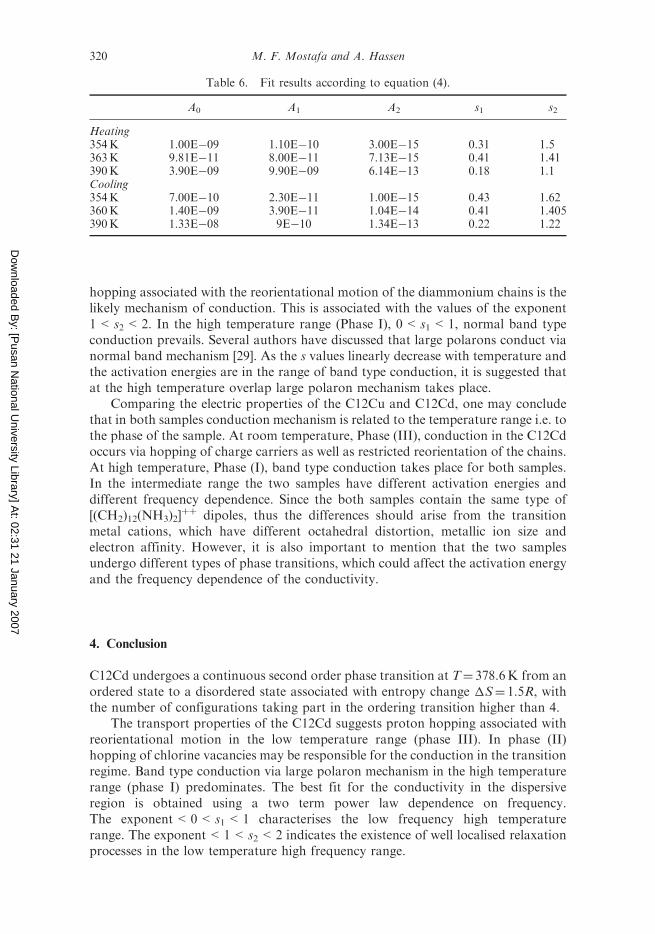
The exponents and the pre-exponential factors are both functions of temperatureand the type of conduction mechanisms. Values of s1 and s2 as obtained from the
fit at different temperatures are plotted as function of temperature in figure 6(c)and (d) for the heating and cooling runs respectively. It is clear that 0< s1<1,
dominate at high temperatures, and low frequency and correspond to transla-
tional motion. On the other hand, values 1< s2<2, dominate at low
temperatures and at high frequency, correspond to well localised hopping
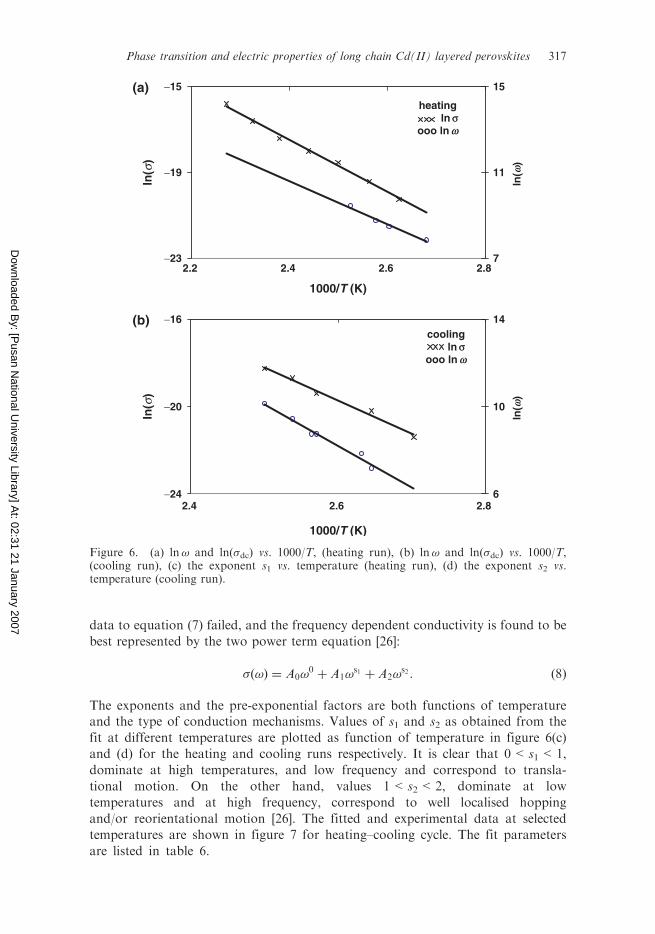
and/or reorientational motion [26]. The fitted and experimental data at selectedtemperatures are shown in figure 7 for heating–cooling cycle. The fit parameters
are listed in table 6.
heating ln s ooo ln w
−23
−19
−15(a)
(b)
2.2 2.4 2.6 2.8
1000/T (K)
7
11
15
cooling ln s ooo ln w
−24
−20
−16
2.4 2.6 2.8
1000/T (K)
6
10
14
ln(w
)ln
(w)
ln(s
)ln
(s)
Figure 6. (a) ln! and ln(�dc) vs. 1000/T, (heating run), (b) ln! and ln(�dc) vs. 1000/T,(cooling run), (c) the exponent s1 vs. temperature (heating run), (d) the exponent s2 vs.temperature (cooling run).
Phase transition and electric properties of long chain Cd(II) layered perovskites 317

Dow
nloaded By: [Pusan National U
niversity Library] At: 02:31 21 January 2007 Different models have been used to explain the mechanism of conduction in
solids [27, 28]. In the quantum mechanical tunneling model (QMT), the frequency
exponent is given by
s ¼ 1� 4=½lnð1=!�0Þ: ð9Þ
It predicts a temperature independent s� 0.81, for !¼ 104 s�1 and �0¼ 10�13, while s
decreases with increasing !. The experimental results show a decrease for s values
with increasing temperature in marked disagreement with the QMT model. For small
polaron the model predicts an increase in s with increasing temperature. On the
contrary formation of large polaron predicts linear decrease in s with increasing
temperature in reasonable agreement with the results of phase (I). Alternatively
hopping over a potential barrier shows a gradual decrease in s with increasing
temperature according to [27]
s ¼ 1� ½kT=ðWm � kTðlnð1=!�ÞÞÞ� ð10Þ
heating
0
1
2(c)
(d)
300 320 340 360 380 400
T (K)
s 2s 2
s 1s 1
−0.2
0.2
0.6
1
cooling
0
1
2
300 320 340 360 380 400
T (K)
−0.2
0.2
0.6
1
Figure 6. Continued.
318 M. F. Mostafa and A. Hassen
Dow
nloaded By: [Pusan National U
niversity Library] At: 02:31 21 January 2007
Wm is the maximum barrier height. The results in regions (II) and (III) seems toqualitatively agree with this model. Thus we suggest that both the temperatureand frequency dependence of the conductivity may be interpreted in terms ofdifferent conduction mechanisms at different temperature and frequency ranges.In the low temperature (Phase III), and high frequency region localised protonic
−22
−18
−14
heating (a)
(b)
T = 354 KT = 354 K
T = 363 KT = 363 K
T = 390 K T = 390 K
−21
−17
−13
ln(s
)
heating
heating
−18
−16
−14
6 10
ln(w) ln(w)
14 6 10 14
−21
−17
−13 cooling
−21
−17
−13cooling
−18
−16
−14
cooling
Figure 7. (a) Fit of ln(�T) vs. ln(!) at three different temperatures (heating run), (b) fit ofln(�T) vs. ln(!) at three different temperatures (cooling run).
Phase transition and electric properties of long chain Cd(II) layered perovskites 319
Dow
nloaded By: [Pusan National U
niversity Library] At: 02:31 21 January 2007
hopping associated with the reorientational motion of the diammonium chains is thelikely mechanism of conduction. This is associated with the values of the exponent1< s2<2. In the high temperature range (Phase I), 0< s1<1, normal band typeconduction prevails. Several authors have discussed that large polarons conduct vianormal band mechanism [29]. As the s values linearly decrease with temperature andthe activation energies are in the range of band type conduction, it is suggested thatat the high temperature overlap large polaron mechanism takes place.
Comparing the electric properties of the C12Cu and C12Cd, one may concludethat in both samples conduction mechanism is related to the temperature range i.e. tothe phase of the sample. At room temperature, Phase (III), conduction in the C12Cdoccurs via hopping of charge carriers as well as restricted reorientation of the chains.At high temperature, Phase (I), band type conduction takes place for both samples.In the intermediate range the two samples have different activation energies anddifferent frequency dependence. Since the both samples contain the same type of[(CH2)12(NH3)2]
þþ dipoles, thus the differences should arise from the transitionmetal cations, which have different octahedral distortion, metallic ion size andelectron affinity. However, it is also important to mention that the two samplesundergo different types of phase transitions, which could affect the activation energyand the frequency dependence of the conductivity.
4. Conclusion
C12Cd undergoes a continuous second order phase transition at T¼ 378.6K from anordered state to a disordered state associated with entropy change �S¼ 1.5R, withthe number of configurations taking part in the ordering transition higher than 4.
The transport properties of the C12Cd suggests proton hopping associated withreorientational motion in the low temperature range (phase III). In phase (II)hopping of chlorine vacancies may be responsible for the conduction in the transitionregime. Band type conduction via large polaron mechanism in the high temperaturerange (phase I) predominates. The best fit for the conductivity in the dispersiveregion is obtained using a two term power law dependence on frequency.The exponent<0< s1<1 characterises the low frequency high temperaturerange. The exponent<1< s2<2 indicates the existence of well localised relaxationprocesses in the low temperature high frequency range.
Table 6. Fit results according to equation (4).
A0 A1 A2 s1 s2
Heating354K 1.00E�09 1.10E�10 3.00E�15 0.31 1.5363K 9.81E�11 8.00E�11 7.13E�15 0.41 1.41390K 3.90E�09 9.90E�09 6.14E�13 0.18 1.1Cooling354K 7.00E�10 2.30E�11 1.00E�15 0.43 1.62360K 1.40E�09 3.90E�11 1.04E�14 0.41 1.405390K 1.33E�08 9E�10 1.34E�13 0.22 1.22
320 M. F. Mostafa and A. Hassen
Dow
nloaded By: [Pusan National U
niversity Library] At: 02:31 21 January 2007
Acknowledgment
The authors would like to acknowledge the support of the Egyptian Ministry ofInternational Cooperation.
References
[1] R.E. Jacobs, B.S. Hudson and H. Anderson, Biochem. 16 4349 (1977).[2] H. Arend and K.T. Tichy, Solid State Comm. 18 999 (1976).[3] R. Kind, Ferroelectrics 24 81 (1980).[4] R. Kind, S. Plesko, P. Gunter, J. Roos and J. Fousek, Phys. Rev. B 23 5301 (1981).[5] M.F. Mostafa and M.A. Mohamed, Egyptian J. Solids 2 96 (1980).[6] M.F. Mostafa, M.A. Semary and M.M. Abdel-Kader, Physica B 112 197 (1982).[7] L. Battaglia, R. Corradi, G. Pelosi, M. Cramarossa, T. Manferdini, G. Pellacani,
A. Motori, R. Saccani, F. Sandrolini and M. Brigatti, Chem. Mater. 4 813 (1992).[8] C. Courseille, N. Chan, Th. Maris, A. Daoud, Y. Abed and M. Laguerre, Phys. Stat.
Sol. A 143 203 (1994).[9] M.F. Mostafa, A.S. Atallah and R. Emrick, J. Appl. Phys. 81 4134 (1997).[10] M.F. Mostafa, M.M. Abdel-Kadar, A.S. Atallah and M. El-Nimer, Phys. Stat. Sol. A 135
549 (1992).[11] M.F. Mostafa and S.A. El-Hakim, Phase Trans. 76 587 (2003).[12] M.F. Mostafa and A.A.A. Youssef, Z. Naturforsch. A 56 568 (2001).[13] M.F. Mostafa, A.A.A. Youssef and S.S. El-Hakim, Phase Trans. 77 317 (2004).[14] C. Socfas, M. Arriendiaga, M. Telo, J. Fernandez and P. Gili, Phys. Stat. Sol. A 57
405 (1980).[15] S. Sveleba, Z. Volodynyr, I. Polovinko, Z. Trybula, W. Kempinski and T. Zuk, Physica B
183 183 (1993).[16] D. Pheps, D. Losee, W. Hatfield and D. Dodgson, Inorg. Chem. 15 3147 (1976).[17] R.D. Willett, Acta Cryst. B 33 1641 (1977).[18] S. Kararup and R. Burg, J. Sol. Stat. Chem. 26 59 (1978).[19] S. Kammoun and A. Daoud, Phys. Stat. Sol. A 162 575 (1997).[20] A. Fouskova, Ferroelectrics 25 451 (1980).[21] M. Tello, M. Arriendiaga and J. Fernandez, Sol. Stat. Comm. 24 299 (1977).[22] P. Macedo, C. Moynihan and R. Bose, Phys. Chem. Glasses 13 171 (1972).[23] C. Moynihan, L. Boesch and N. Laberge, Phys. Chem. Glasses 14 122 (1973).[24] C. Funggao, G. Saunders, Z. Wei, D. Allmond, M. Coutrone and C. Mandanici,
Solid State Ionics 109 89 (1998).[25] A.K. Jonscher, Dielectric Relaxation in Solids (Chelsea Dielectric Press, London, 1983),
p. 340.[26] K. Funke, Prog. Sol. Stat. Chem. 22 111 (1983).[27] R. Elliott, Adv. Phys. 36 135 (1977).[28] A.R. Long, Adv. Phys. 31 553 (1982).[29] J. Appeal, Solid State Physics (Academic Press, New York, 1988), p. 193.
Phase transition and electric properties of long chain Cd(II) layered perovskites 321