
A practical approach to modelling induction machine saturation
14
1 A practical approach to modelling induction machines saturation M.E.H. Benbouzid 1 , M. Zerikat 2 and M.S. Naït-Saïd 3 1 CREA – EA 3299, University of Picardie “Jules Verne”, Amiens, France 2 ENSET, Oran, Algeria 3 University of Batna, Batna, Algeria SUMMARY This paper deals with a new approach for saturated induction machines modelling based on the so-called H-G diagram. This allows the description of the saturation in the machine using only three parameters that are instantaneously determined by a plotted circle (H-G diagram) for each saturation point. Furthermore, this approach can be extended to induction machine modelling taking into account other phenomena such as temperature and skin effects. The proposed approach has been compared to the conventional induction machine modelling with and without cross-saturation. Simulation results have shown that the proposed approach has some advantages over cross-saturation such simplicity and accuracy, especially during the induction machine starting-phase and also when it is sufficiently loaded. KEY WORDS: Induction machine; modelling; saturation; cross-saturation; H-G diagram. 1. INTRODUCTION When induction machine saturation is neglected, especially at rated condition, its transient is erroneously analyzed when using constant Park model parameters. In fact, the machine inductances could widely vary depending on the flux inside the machine, which is greatly depending on the absorbed currents. Therefore, it becomes necessary to use an induction machine nonlinear time-varying inductive parameters model. The induction machine parameters are in this case derived from the magnetization characteristic [1-5]. Moreover, the machine saturation could change very quickly, leading to very quick change of rotor inductance, which could affect the drive dynamic when the induction machine is vector controlled [6-7]. The induction machine model taking into account saturation is represented in the orthogonal d-q axis system. The orthogonal d- and q-axis are greatly coupled by time- varying terms introduced by the saturation effect. The existence of such coupled terms, defining the so-called cross-saturation phenomena, is up to now the subject of a controversy. In fact, some researchers have argued that the presence of cross-saturation in saturated induction machine modelling is the pure consequence of a mathematical derivation [8]. *Correspondance to: M.E.H. Benbouzid, CREA, University of Picardie “Jules Verne” – 7, Rue du Moulin Neuf, 80000 Amiens, France. Phone: +33 3 22 82 76 80, Fax: +33 3 22 82 78 22, E-mail: [email protected].
-
Upload
independent -
Category
Documents
-
view
3 -
download
0
Transcript of A practical approach to modelling induction machine saturation

1
A practical approach to modelling induction machines saturation
M.E.H. Benbouzid1, M. Zerikat2 and M.S. Naït-Saïd3 1CREA – EA 3299, University of Picardie “Jules Verne”, Amiens, France
2ENSET, Oran, Algeria 3University of Batna, Batna, Algeria
SUMMARY This paper deals with a new approach for saturated induction machines modelling based on the so-called H-G diagram. This allows the description of the saturation in the machine using only three parameters that are instantaneously determined by a plotted circle (H-G diagram) for each saturation point. Furthermore, this approach can be extended to induction machine modelling taking into account other phenomena such as temperature and skin effects. The proposed approach has been compared to the conventional induction machine modelling with and without cross-saturation. Simulation results have shown that the proposed approach has some advantages over cross-saturation such simplicity and accuracy, especially during the induction machine starting-phase and also when it is sufficiently loaded.
KEY WORDS: Induction machine; modelling; saturation; cross-saturation;
H-G diagram.
1. INTRODUCTION When induction machine saturation is neglected, especially at rated condition, its transient is erroneously analyzed when using constant Park model parameters. In fact, the machine inductances could widely vary depending on the flux inside the machine, which is greatly depending on the absorbed currents. Therefore, it becomes necessary to use an induction machine nonlinear time-varying inductive parameters model. The induction machine parameters are in this case derived from the magnetization characteristic [1-5]. Moreover, the machine saturation could change very quickly, leading to very quick change of rotor inductance, which could affect the drive dynamic when the induction machine is vector controlled [6-7]. The induction machine model taking into account saturation is represented in the orthogonal d-q axis system. The orthogonal d- and q-axis are greatly coupled by time-varying terms introduced by the saturation effect. The existence of such coupled terms, defining the so-called cross-saturation phenomena, is up to now the subject of a controversy. In fact, some researchers have argued that the presence of cross-saturation in saturated induction machine modelling is the pure consequence of a mathematical derivation [8].
*Correspondance to: M.E.H. Benbouzid, CREA, University of Picardie “Jules Verne” – 7, Rue du Moulin Neuf, 80000 Amiens, France. Phone: +33 3 22 82 76 80, Fax: +33 3 22 82 78 22, E-mail: [email protected].

2
In a recent paper [9], it has been shown that it is possible to keep the same dynamics if the cross-saturation is neglected by setting the dynamic inductance equal to the steady-state inductance in the cross-saturation model. In some other approaches of saturated induction machine modelling, the problem of time-derivative inductance has been avoided [10]. In this context, this paper deals with a new approach of saturated induction machines modelling based on the so-called H-G diagram [11]. This allows the description of the saturation in the machine using only three parameters that are instantaneously determined by a plotted circle (H-G diagram) for each saturation point. Furthermore, this approach can be extended to induction machine modelling taking into account other phenomena such as temperature and skin effects.
2. THE INDUCTION MACHINE CROSS-SATURATION MODEL
The transient behaviour of an induction machine is generally analyzed by means of the conventional d-q axis model given in an arbitrary reference frame rotating at ω. This model is described by the following equations.
sssss jpiRu Φω+Φ+= , (1)
( ) rprrr njpiR0 ΦΩ−ω+Φ+= , (2)
{ }ssp iImnT Φ= , (3)
Ω−−=Ω fTTJp l , (4)
where each space vector x can be expressed as qd jxxx += .
The winding leakage inductance is assumed to be constant considering that all the magnetic induction lines are in the air gap. Therefore
μσ Ψ+=Φ sss il , (5)
μσ Ψ+=Φ rrr il , (6)
where ⎪⎩
⎪⎨⎧
+=
=Ψ
μ
μμ
rs
sat
iii
iM
(7)
In eq. (7), the hysteresis angle is neglected and Msat is given by the conventional magnetization characteristic.

3
⎪⎪⎪
⎩
⎪⎪⎪
⎨
⎧
+=
+=
+=
Φ=
μ
μ
μμμ
μ
μ
rqsqq
rdsdd
2q
2d
sat
iiiiii
iii
iM
.
(8) Differentiating eqs. (5) and (6) leads to
μσσ Ψ+=Φ piplp r,sr,sr,s , (9)
with ⎩⎨⎧
+=Ψ+=Ψ
μμμ
μμμ
dququq
qdudud
piMpiLppiMpiLp
. (10)
Therefore, cross-saturation will be defined by the following inductances.
( ) α−−=μ2
satdyndynd sinMMML , (11)
( ) α−−=μ2
satdyndynq cosMMML , (12)
( ) αα−=μ cossinMMM satdyn , (13)
where μ
μΨ=
did
Mdyn , (14)
and μ
μ
μ
μ =α=αii
cos,ii
sin qd . (15)
Mdyn is the dynamic inductance and α is the angular displacement of the magnetizing current space vector with respect to the d-axis of the common reference frame. The differential system of a saturated induction machine can be represented by
[ ] [ ][ ] [ ] [ ]ILIZU p+= , (16)
where [ ]
⎥⎥⎥⎥⎥
⎦
⎤
⎢⎢⎢⎢⎢
⎣
⎡
ωωωω−
ωωω−ω−
=
rsatsrsatr
satsrrsatr
satssats
satsatss
RL0MLRM00MRLM0LR
Z , (17)

4
[ ]
⎥⎥⎥⎥⎥
⎦
⎤
⎢⎢⎢⎢⎢
⎣
⎡
=
μμμμ
μμμμ
μμμμ
μμμμ
qrq
drd
qqs
dds
LMLMMLMLLMLMMLML
L , (18)
[ ] [ ][ ] [ ]⎪⎩
⎪⎨⎧
=
=T
rqrdsqsd
Tsqsd
iiii
00uu
I
U, (19)
with the slip frequency Ω−ω=ω pr n
and ⎪⎩
⎪⎨
⎧
+=+=+=
μμσμμ
μμσμμ
σσ
q,drqr,dr
q,dsqs,ds
satr,ssat
r,s
LlLLlLMlL
. (20)
If real saturation or cross-saturation are neglected,
then dynsat MM = , (21)
and ⎪⎩
⎪⎨⎧
=
==
μ
μμ
0M
MLL satqd . (22)
In this case, the d-q axis coupling inductances are cancelled, especially in the L-matrix in eq. (18). This will lead to a linearized model of the induction machine.
3. SATURATED INDUCTION MACHINE MODELLING
USING THE H-G DIAGRAM
3.1. Modelling by stator-referred parameters
This can be achieved by the following transformation.
[ ] ( )[ ]
⎪⎩
⎪⎨
⎧
=
=−
satr
sat
LMk
kk11diag II refs
(23)
Where k is the stator/rotor turns ratio. Using eqs. (16) through (20) with eqs. (21) and (22) as conditions, one can derive a differential system defined by only four parameters.
[ ]
( ) ( )( ) ( ) [ ]refsI −
−
−
⎥⎥⎥⎥⎥
⎦
⎤
⎢⎢⎢⎢⎢
⎣
⎡
τ+ωωω−τ+ω−σ−σ−ω+ωσ−ω−σ−ω−+
=
1rrr
r1
rr
sats
sats
satss
sats
sats
sats
sats
satss
pppp
L1pL1pLRLL1L1pLpLR
U , (24)

5
where Lssat, σ, and τ - defined in the next sub-chapter - depend on the machine
saturation.
3.2. Modelling by the H-G diagram
Lssat, σ, and τ can be instantaneously determined using the H-G diagram, depicted in
Fig. 1, which allows to take into account complex phenomena such as temperature and skin effect [11]. This diagram is obtained using the orthogonal G and H functions, which are determined at steady-state induction machine operation. G and H represent, respectively, the real and imaginary part of the induction machine stator winding input impedance. When considering the synchronous rotating frame, where ω and ωr become the stator and the slip frequencies, respectively, G and H will be given by
( ) ( )rrss
sin HjGR
iuZ ωω+ωω+== , (25)
where ( ) ( ) ( )sats2sat
r2r
satrr
satr L1
1Gτω+
τωσ−=ω , (26)
( ) ( ) ( )( ) ⎟
⎟⎠
⎞⎜⎜⎝
⎛
τω+
τωσ−−=ω 2sat
r2r
2satr
2r
satsatsr
111LH . (27)
Linear case
Saturation
Slip frequency scale
G (H
enry
)
G
ωsl MAXsat
− ωsl MAXlin
− ωsllin
− light-load
H (Henry) satlσ sL sL
linH
Linear case
Saturation
Slip frequency scale
G (H
enry
)
G
ωsl MAXsat
− ωsl MAXlin
− ωsllin
− light-load
H (Henry) satlσ sL sL
linH
satlσ sL sL
linHlσlσ sLsL sLsL
linH
Fig. 1. The H-G diagram.
In this modelling approach, we assume that the entire flux losses are referred to the stator side and are constant, such as
ttanconsLl sat
ssat ≅σ=σ . (28)
In practice, lσ can be experimentally determined by the conventional locked rotor test with a reduced stator voltage and with varying the stator frequency.

6
As shown by Fig. 1, the half circle intersection with the H-axis gives two particular points. The “purely synchronous” one (at the right), obtained when ωr = 0, allowing the computation of Ls
sat, and the “infinite” one (at the left), obtained when ωr → ∞, allowing the computation of σsat. When the induction machine saturation increases, the purely synchronous point moves left on the H-axis. Therefore
cirsats lL φ+= σ , (29)
cirsat l
lφ
=σ+σ
σ , (30)
where satcir kM=φ (31)
is the H-G circle diameter. The rotor time constant is determined by the maximum of the G-function.
satMAXr
satr
1
−ω=τ . (32)
The “linear” circle, in the unsaturated case, can be easily determined by a simple no-load test corresponding to H(0) and a locked rotor test corresponding to H(∞). In this case, the knowledge of the slip frequency in light load conditions leads to
HLG
lins
linloadlightr
linMAXr −
ω=ω −−− . (33)
With the so constituted slip frequency scale (Fig. 1), one can linearly determine the rotor time constant by the following equations.
linMAXrlin
c
satc
linclin
MAXrsat
MAXr −−− ωφ
φ−φ+ω=ω , (34)
satcir
lincir
lincirlin
rsatr 2 φ−φ
φτ=τ . (35)
4. EFFECT OF SATURATION ON THE INDUCTION MACHINE PARAMETERS
The relevant data of the simulated induction machine are given in the Appendix. Fig. 2 clearly illustrates how the G(ωr) and the H(ωr) characteristics are affected by the saturation of the induction machine. When analyzing these results, one should note a decrease of the G-function, which indicates the induction machine output torque capability, due to the saturation increase. Moreover, the machine inductances represented by the H-function also decrease. This will lead to an increase in the reactive stator current input and then to an increase of the Joule and iron losses. As a consequence, the induction machine efficiency will be negatively affected.

7
Figs. 3 and 4 show how the stator/rotor turns ratio, Lssat, σ, and τ are affected by the
induction machine saturation. When analyzing these results, one can note that the saturation decreases the stator cyclic inductance and the rotor time constant and increases the flux losses inside the machine.
5. SIMULATION RESULTS
Fig. 5 shows the transient characteristics of an unloaded induction machine starting under rated stator voltage. This operating condition will lead the machine to sufficient saturation. Simulations were performed with three induction machine models: (1) the cross-saturation model, (2) the linearized cross-saturation model assuming eq. (21) [9], and (3) the H-G diagram model. When analyzing the simulation results the following conclusions could be derived. 1) The torque (Fig. 5a) and speed transients (Fig. 5b) obtained with the H-G diagram
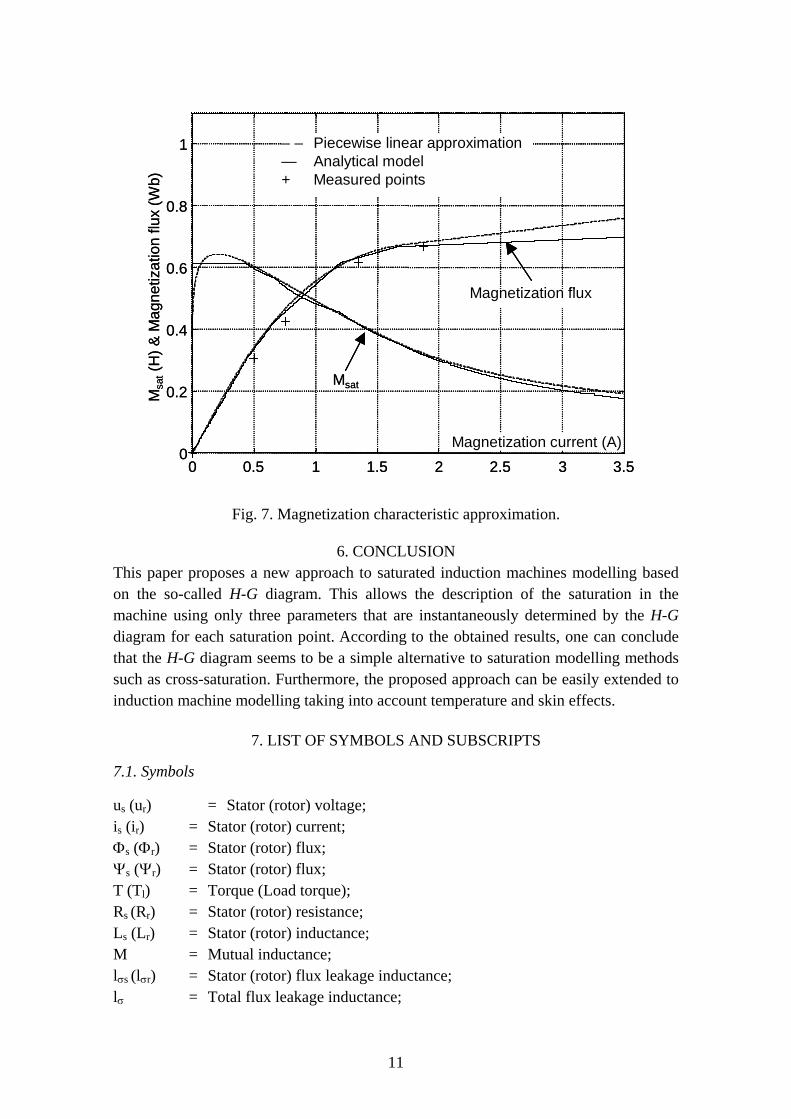
are in good agreement with the cross-saturation model. 2) The stator-current transient (Fig. 5c) obtained with the H-G diagram is in good agreement with the cross-saturation model. However, a difference is noted in steady-state. This difference can be very small when the machine is sufficiently loaded as Fig. 6, which summarizes comparisons between saturated induction machine models showing it. This difference mainly depends on the analytical model of the magnetization characteristic (Fig. 7).
0 10 20 30 40 500
0.2
0.4
0.6
0.8
slip frequency (rad/sec)
H (H
enry
)
0 10 20 30 40 500
0.1
0.2
0.3
slip frequency (rad/sec)
G (H
enry
)
0% saturation20% saturation
50% saturation
0% saturation
20% saturation
50% saturation
0 10 20 30 40 500
0.2
0.4
0.6
0.8
slip frequency (rad/sec)
H (H
enry
)
0 10 20 30 40 500
0.1
0.2
0.3
slip frequency (rad/sec)
G (H
enry
)
0% saturation20% saturation
50% saturation
0% saturation
20% saturation
50% saturation
Fig. 2. Saturation effect on the G and H functions.

8
0 0.5 1 1.5 2 2.5 3 3.50
0.2
0.4
0.6
0.8
1.0
Magnetization current (A)
k
– – Linear ratio— Saturation ratio
0 0.5 1 1.5 2 2.5 3 3.50
0.2
0.4
0.6
0.8
1.0
Magnetization current (A)
k
– – Linear ratio— Saturation ratio
Fig. 3. Saturation effect on the transformation ratio.
0 1 2 30
0.2
0.4
0.6
0.8
Magnetizing current (A)
0 1 2 30
0.05
0.10
Magnetizing current (A)
0 1 2 30
0.2
0.4
0.6
0.8
Magnetizing current (A)
0 1 2 30
10
20
30
40
Magnetizing current (A)
Mag
netic
flux
& φ
cir(W
b)
L ssa
t(H
)Ls
lin
φcir
σ (%
)
σlin
τrlin
τ rsa
t(s
)
0 1 2 30
0.2
0.4
0.6
0.8
Magnetizing current (A)
0 1 2 30
0.05
0.10
Magnetizing current (A)
0 1 2 30
0.2
0.4
0.6
0.8
Magnetizing current (A)
0 1 2 30
10
20
30
40
Magnetizing current (A)
Mag
netic
flux
& φ
cir(W
b)
L ssa
t(H
)Ls
lin
φcir
σ (%
)
σlin
τrlin
τ rsa
t(s
)
Fig. 4. H-G diagram parameters with time-varying saturation.

9
0 0.1 0.2 0.3 0.4 0.5
0
10
20Torque (Nm)
Time (sec)
0 0.1 0.2 0.3 0.4 0.5
0
10
20
Torq
ue (N
m)
Time (sec)
(1) — Cross-saturation(2) – – Msat = Mdyn
(1) — Cross-saturation(3) – – H-G diagram
Torq
ue (N
m)
0 0.1 0.2 0.3 0.4 0.5
0
10
20Torque (Nm)
Time (sec)
0 0.1 0.2 0.3 0.4 0.5
0
10
20
Torq
ue (N
m)
Time (sec)
(1) — Cross-saturation(2) – – Msat = Mdyn
(1) — Cross-saturation(3) – – H-G diagram
Torq
ue (N
m)
(a) Comparison of starting torque transient.
0 0.1 0.2 0.3 0.4 0.50
50
100
150
Time (sec)
0 0.1 0.2 0.3 0.4 0.50
50
100
150
Spee
d (ra
d/se
c)
Time (sec)
(1) — Cross-saturation(2) – – Msat = Mdyn
(1) — Cross-saturation(3) – – H-G diagram
Spee
d (r
ad/s
ec)
0 0.1 0.2 0.3 0.4 0.50
50
100
150
Time (sec)
0 0.1 0.2 0.3 0.4 0.50
50
100
150
Spee
d (ra
d/se
c)
Time (sec)
(1) — Cross-saturation(2) – – Msat = Mdyn
(1) — Cross-saturation(3) – – H-G diagram
Spee
d (r
ad/s
ec)
(b) Comparison of starting rotor speed.

10
0.25 0.3 0.35 0.4 0.45-10
-5
0
5
10
Time (sec)
0.25 0.3 0.35 0.4 0.45
-10-5
0
5
10
Stat
or c
urre
nt (A
)
Time (sec)
(1) — Cross-saturation(2) – – Msat = Mdyn
(1) — Cross-saturation(3) – – H-G diagram
Stat
or c
urre
nt (A
)
0.25 0.3 0.35 0.4 0.45-10
-5
0
5
10
Time (sec)
0.25 0.3 0.35 0.4 0.45
-10-5
0
5
10
Stat
or c
urre
nt (A
)
Time (sec)
(1) — Cross-saturation(2) – – Msat = Mdyn
(1) — Cross-saturation(3) – – H-G diagram
Stat
or c
urre
nt (A
)
(c) Comparison of starting stator current transient.
Fig. 5.
0 1 2 3 4 5 60
0.5
1
1.5
2
2.5
3
Load torque (Nm)
Stat
or c
urre
ntrm
s-va
lue
(A)
ο Cross-saturation+ Linearized Cross-saturation∗ H-G diagram× Linear model
Light load region
Rated load region
0 1 2 3 4 5 60
0.5
1
1.5
2
2.5
3
Load torque (Nm)
Stat
or c
urre
ntrm
s-va
lue
(A)
ο Cross-saturation+ Linearized Cross-saturation∗ H-G diagram× Linear model
Light load region
Rated load region
Fig. 6. Stator current–torque characteristic.
11
0 0.5 1 1.5 2 2.5 3 3.50
0.2
0.4
0.6
0.8
1
Magnetization current (A)
Msat
– – Piecewise linear approximation— Analytical model+ Measured points
Magnetization flux
Msa
t(H
) & M
agne
tizat
ion
flux
(Wb)
0 0.5 1 1.5 2 2.5 3 3.50
0.2
0.4
0.6
0.8
1
Magnetization current (A)
Msat
– – Piecewise linear approximation— Analytical model+ Measured points
Magnetization flux
Msa
t(H
) & M
agne
tizat
ion
flux
(Wb)
Fig. 7. Magnetization characteristic approximation.
6. CONCLUSION This paper proposes a new approach to saturated induction machines modelling based on the so-called H-G diagram. This allows the description of the saturation in the machine using only three parameters that are instantaneously determined by the H-G diagram for each saturation point. According to the obtained results, one can conclude that the H-G diagram seems to be a simple alternative to saturation modelling methods such as cross-saturation. Furthermore, the proposed approach can be easily extended to induction machine modelling taking into account temperature and skin effects.
7. LIST OF SYMBOLS AND SUBSCRIPTS
7.1. Symbols
us (ur) = Stator (rotor) voltage; is (ir) = Stator (rotor) current; Φs (Φr) = Stator (rotor) flux; Ψs (Ψr) = Stator (rotor) flux; T (Tl) = Torque (Load torque); Rs (Rr) = Stator (rotor) resistance; Ls (Lr) = Stator (rotor) inductance; M = Mutual inductance; lσs (lσr) = Stator (rotor) flux leakage inductance; lσ = Total flux leakage inductance;

12
ω = Frequency; Ω = Rotor speed; np = Pole pair number; σ = Total leakage coefficient; J = Inertia; f = Friction coefficient; p = Differential operator;
7.2. subscripts
sat = Saturation index; lin = Linearity index; µ = Magnetization index; MAX = Maximum value index.
APPENDIX A
A.1. Induction machine data [9]
0.75 kW – 220/380 V – 50 Hz – 3.6/2.1 A – np = 2 Rs = 10 Ω – Rr = 6.3 Ω – lσs = 0.043 H – lσr = 0.04 H
Mlin =0.612 H – Mrated = 0.4212 H Tl = 5.15 N.m – J = 0.02 kg.m²
A.2. Measured points of the magnetization characteristic
Iµ Ψµ Msat (A) (Wb) (H)
0.000 0.000 0.6120 0.500 0.306 0.6120 0.750 0.425 0.4260 1.350 0.615 0.2005 1.875 0.667 0.0100 14.140 0.848 0.0100
A.3. Analytical magnetization characteristic [9]

13
⎪⎩
⎪⎨⎧
>+⋅=Ψ<⋅⋅=Ψ
μμμ
μμμμ
95.1iif5902.0i0432.095.1iifi59976.086427.0 1211.1i
8. REFERENCES
1. Moon SI, Keyhani A. Estimation of induction machine parameters from standstill time domain data. IEEE Transactions on Industry Applications 1994; 30: 1609–1615.
2. Klaes NR. Parameter identification of an induction machine with regard to dependencies on saturation. IEEE Transactions on Industry Applications 1993; 29: 1135–1140.
3. Keyhani A, Tsai H. Igspice simulation of induction machines with saturable inductances. IEEE Transactions on Energy Conversion 1989; 4: 118–125.
4. Vas P. Electrical Machines and Drives. A Space-Vector Theory Approach; Clarendon Press: Oxford (UK), 1992.
5. Krause PC, Wasynczuk O, Sudhoff SD. Analysis of Electric Machinery; IEEE Press: Piscataway (USA), 1995.
6. Levi E, Vuckovic V. Field-oriented control of induction machines in the presence of magnetic saturation. Electric Machines & Power Systems 1989; 16: 133–147.
7. Levi E. Method for magnetizing curve identification in vector controlled induction machines. European Transactions on Electric Power 1992, 2: 309–314.
8. Kovacs KP. On the theory of cylindrical rotor ac machines including main flux saturation. IEEE Transactions on Power Apparatus & Systems 1984; 103: 261–264.
9. Levi E. Impact of cross-saturation on accuracy of saturated induction machine models. IEEE Transactions on Energy Conversion 1997; 12: 211–216.
10. Lipo TA, Consoli A. Modeling and simulation of induction motors with saturable leakage reactances. IEEE Transactions on Industry Applications 1985; 20: 180–189.
11. Naït-Saïd M, Benbouzid MEH. H-G diagram based rotor parameters identification for induction motors thermal monitoring purpose. IEEE Transactions on Energy Conversion 2000; 15: 14–18.

14
9. THE AUTHORS Mohamed El Hachemi BENBOUZID (1968) received the B.Sc. degree in Electrical Engineering, in 1990, from the Electrical Engineering Institute of Batna University, Algeria; the M.Sc. and Ph.D. degrees both in Electrical and Computer Engineering, from the National Polytechnic Institute of Grenoble, France, in 1991 and 1994 respectively. After graduation, he joined the University of Picardie “Jules Verne”, France, where he is an Associate Professor of Electrical and Computer Engineering at the Professional Institute of Amiens. In November 2001, he received the “Habilitation à Diriger des Recherches” degree from the University of Picardie “Jules Verne”. His current research interests include electric machines and drives modelling, control and diagnosis. He is a Senior Member of the IEEE. (CREA / University of Picardie – Jules Verne, 7, Rue du Moulin Neuf, 80000 Amiens/France, Phone: +33 3 22 82 76 80, Fax: +33 3 22 82 78 22, E-mail: [email protected])
Mokhtar ZERIKAT (1957) is graduated from the University of Sciences and Technology of Oran, Algeria. He received the M.Sc. degree in Computer Engineering and Automatic Control, in 1992, from the Electrical Engineering Institute (ENSET) of Oran, Algeria. Since 1984, he has been a Teaching Assistant at the ENSET of Oran, Algeria. His current research interests include large-scale systems, modeling and adaptive control systems, time-delay systems, and neural networks.
Mohamed Saïd NAÏT-SAÏD (1958) received the B.Sc. degree in Electrical Engineering, in 1983, from the National Polytechnic Institute of Algiers, Algeria; the M.Sc. and Ph.D. degrees both in Electrical and Computer Engineering, in 1992 and 1999 respectively from the University of Constantine and the University of Batna, Algeria. After graduation, he joined the University of Batna, Algeria, where he is an Associate Professor at the Electrical Engineering Institute. His current research interests include electric machines and drives modelling and control.