Practical Advances in Core-Based Water Saturation Analysis ...
14
SCA2006-29 1/14 PRACTICAL ADVANCES IN CORE-BASED WATER SATURATION ANALYSIS OF SHALY TIGHT GAS SANDS John Dacy and Paul Martin, Core Laboratories, Houston, Texas This paper was prepared for presentation at the International Symposium of the Society of Core Analysts held in Trondheim, Norway 12-16 September, 2006 ABSTRACT New core analysis methods are presented for R w , formation water resistivity, and Q v , cation exchange capacity per unit pore volume. Accurate R w values are needed for all resistivity-based water saturation models. Representative values of the rock property Q v are necessary for Q v -based shaly sand models such as Waxman-Smits-Thomas and Dual- Water. Traditional core analysis methods for R w and Q v in shaly tight gas sands are limited and tend to be inaccurate or impractical due to the clay-bound water, extensive cementation, and very low permeability that characterize these formations. The new methods address the influence of clay-bound water on results and include its quantification by nuclear magnetic resonance techniques. They are designed to overcome the limitations and inaccuracies of the traditional methods, particularly with respect to tight gas sands, and result in practical approaches for R w and Q v . Additionally, an improved and unifying equation is presented for the shaly sand parameter B, the counter-ion conductance term found in the Waxman-Smits-Thomas model. Effective use of this model includes application of representative B values for both the laboratory and reservoir environments. Standard sources of B for each environment are identified and standard values are compared to those provided from published equations. The poor and biased comparisons lead to development of a single equation with results that compare more favorably with the reservoir-environment standard and exactly with the laboratory-environment standard. INTRODUCTION Formation evaluation for water saturation (S w ) in many tight gas sands is complicated by the extensive cementation, low porosity, very low permeability, and conductive clay minerals in the pore space of these formations. Further complications arise from uncertainties in formation water salinity because produced water is either unavailable, of uncertain origin, diluted by water condensation, or mixed with returned completion/stimulation fluids. Practical advances are described for core and log analysis approaches to the shaly sand parameters: • R w , formation water resistivity • B, equivalent ionic conductance of clay exchange cations and • Q v , cation exchange capacity (CEC) per unit pore volume.
-
Upload
khangminh22 -
Category
Documents
-
view
1 -
download
0
Transcript of Practical Advances in Core-Based Water Saturation Analysis ...

SCA2006-29 1/14
PRACTICAL ADVANCES IN CORE-BASED WATER SATURATION ANALYSIS OF SHALY TIGHT GAS SANDS
John Dacy and Paul Martin, Core Laboratories, Houston, Texas
This paper was prepared for presentation at the International Symposium of the
Society of Core Analysts held in Trondheim, Norway 12-16 September, 2006
ABSTRACT New core analysis methods are presented for Rw, formation water resistivity, and Qv, cation exchange capacity per unit pore volume. Accurate Rw values are needed for all resistivity-based water saturation models. Representative values of the rock property Qv are necessary for Qv-based shaly sand models such as Waxman-Smits-Thomas and Dual-Water. Traditional core analysis methods for Rw and Qv in shaly tight gas sands are limited and tend to be inaccurate or impractical due to the clay-bound water, extensive cementation, and very low permeability that characterize these formations. The new methods address the influence of clay-bound water on results and include its quantification by nuclear magnetic resonance techniques. They are designed to overcome the limitations and inaccuracies of the traditional methods, particularly with respect to tight gas sands, and result in practical approaches for Rw and Qv. Additionally, an improved and unifying equation is presented for the shaly sand parameter B, the counter-ion conductance term found in the Waxman-Smits-Thomas model. Effective use of this model includes application of representative B values for both the laboratory and reservoir environments. Standard sources of B for each environment are identified and standard values are compared to those provided from published equations. The poor and biased comparisons lead to development of a single equation with results that compare more favorably with the reservoir-environment standard and exactly with the laboratory-environment standard. INTRODUCTION Formation evaluation for water saturation (Sw) in many tight gas sands is complicated by the extensive cementation, low porosity, very low permeability, and conductive clay minerals in the pore space of these formations. Further complications arise from uncertainties in formation water salinity because produced water is either unavailable, of uncertain origin, diluted by water condensation, or mixed with returned completion/stimulation fluids. Practical advances are described for core and log analysis approaches to the shaly sand parameters:
• Rw, formation water resistivity • B, equivalent ionic conductance of clay exchange cations and • Qv, cation exchange capacity (CEC) per unit pore volume.

SCA2006-29 2/14
The improvements are designed to overcome limitations and inaccuracies found with existing approaches. This is accomplished, in part, by accounting for the influence of clay-bound water (CBW) through its quantification using nuclear magnetic resonance (NMR) techniques. The methods are shown to be particularly well-suited for tight gas sands. The three topics, Rw, B, and Qv, are addressed separately with respect to background, applications, limitations of existing methods, new developments, and results. These discussions are preceded with reviews of the characteristics of tight gas sands, the Waxman-Smits-Thomas (WST) model, and clay-bound water in the context of the improved approaches to Rw, B, and Qv. Summary Characteristics of Tight Gas Sands Tight gas sands can be generally characterized as having porosities from 4 to 15 percent, absolute slip-corrected gas permeabilities from <0.001 to 1 md, and clay content from 2 to 8 weight percent. Low porosities are consistent with presence of extensive cementation. Clay species commonly encountered are kaolinite, chlorite, illite, and mixed-layer illite/smectite. This clay profile is often considered benign with respect to excess conductivity leading to a standard Archie-type analysis or one that under-emphasizes the contribution from the clay mineralogy. However, because of low porosity and the presence of this otherwise small amount of clay within it, the porosity-effective CEC, or Qv, can be substantial, making these sands candidates for interpretation using a resistivity model that accounts for excess conductivity. Productive intervals can exist over a large span of Sw, from less than 10% (despite the low permeability) to greater than 70%, hence the importance of Sw and gas relative permeability for successful evaluation of producible reserves. Many of these formations are stimulated by hydraulic fracturing with aqueous fluids. Loss of drilling/completion/stimulation fluids can be volumetrically low but high with respect to pore space because of low porosity. Relation of Methods and Equation to the Waxman-Smits-Thomas Model The new methods for Rw and Qv are presented in context of the WST model; however they would equally benefit any other approach that uses these properties, such as the Dual-Water model (Clavier, et al. 1984). Waxman and Smits (1968) and Waxman and Thomas (1972) developed a modified Archie equation that accounts for excess conductivity by increasing observed true resistivity (Rt) by, in part, the product RwBQv. An expression of the WST equation for water saturation from resistivity is given by:
**
*
1n
w
vwt
wmw
SBQR
R
Ra
S
⎟⎟⎠
⎞⎜⎜⎝
⎛+
= φ . (1)

SCA2006-29 3/14
Both Rw and B depend on temperature and salinity whereas Qv is a rock property. The canceling units of measure for Rw, B, and Qv are, respectively, ohm m, (1/ohm m)/(e/l), and e/l. The modified Archie parameters a*, m*, and n* represent temperature- and salinity-independent core-derived values having been corrected for excess conductivity using the laboratory-environment Rw and B and the core sample Qv. Correction terms for application with the resistivity log include Rw and B for the reservoir environment and the estimated reservoir log-sample Qv. The solution for Sw is iterative. Relation of Methods to Clay-Bound Water The new core analysis solutions for Rw and Qv use an assessment of clay-bound water by NMR techniques. Clay-bound water is the volume of water retained by or associated with clay surfaces and clay interlayers due to electrochemical bonding. It includes anion-free (fresh) water adsorbed to clay surfaces and hydration water of clay exchange cations but does not include water retained by capillarity (formation water) or interpreted “water” due to hydroxyl (OH-) groups in clay structures. The volume of clay-bound water is proportional to surface area and is significant with clay species having moderate to high surface area such as smectite, illite, and mixed-layer illite/smectite. This water is immoveable by mechanical means although it can be removed by evaporation or distillation. The volume is otherwise considered independent of temperature. Hill, et al. (1979) related clay-bound water to Qv and the equilibrium salinity of a porosity-filling brine by the equation:
vOP
S
t
e QCVV
0.22 0.0841 21
⎟⎠⎞
⎜⎝⎛ +==− −
φφ . (2)
Here, effective porosity is the difference between total porosity and clay-bound-water porosity (φe = φt − φCBW), VS is the volume of clay-bound water while VP is the pore volume, and CO is the equilibrium solution concentration, e/l. Straley, et al. (1994) and Martin and Dacy (2004) have demonstrated that clay-bound water as defined by equation 2 can be accurately assessed by the volume represented at 2.8 to 3 milliseconds from NMR T2 cumulative porosity distributions of brine-filled cores. Clay-bound water volume determined by the humidity-drying core analysis approach represents a minimum according to Bush and Jenkins (1970) and has been found to under-estimate the value from equation 2 as discussed by Schipper (1994) and Elseth, et al. (2001). Authors of the three preceding references agree that essentially all CBW is recovered by distillation in the dean stark (DS) core analysis method (API, 1998) or by drying at 110 to 116ºC. CORE ANALYSIS FOR Rw, FORMATION WATER RESISTIVITY Formation water samples of high quality are rare in tight gas sands. Often there is no produced water from these intervals. When produced water is available it is of uncertain

SCA2006-29 4/14
quality because of one or more of the following: 1) mixing with produced water from other intervals, 2) mixing with water of condensation, 3) mixing with flowback of completion/stimulation fluids. Cores cut under conditions of minimal and/or quantifiable disturbance to reservoir Sw provide a source for improved Rw data. Direct Rw determinations are possible if uncontaminated whole brine can be recovered from the core. Also, recovered brine can be analyzed for salt concentration and standard references used to determine Rw. Cores cut with oil-based mud (OBM) can contain uncontaminated formation brine while those cut with water-based mud (WBM) may also have some filtrate contamination in the core water. This contamination can be quantified if the water filtrate contains a tracer. Further, CBW can be present according to equation 2 regardless of filtrate type. Mechanical removal of core formation brine by immiscible displacement or by centrifugation provides a sample, void of CBW, for direct salinity analysis by one of a variety of chemical or analytical methods (API, 1998). The very low permeability and high capillarity of tight gas sands typically preclude recovery of sufficient whole water for this type of direct salinity analysis. Rather, after water removal by distillation, the dry core with remaining precipitated salts is disaggregated and soaked in distilled water until all salts are in solution. The solution is analyzed for chloride ion (Cl-) concentration, converted to mass of sodium chloride (NaCl) removed from the core, and mathematically recombined with the volume of water distilled from the core to arrive at the core water salinity concentration. In theory, this salinity will be underestimated if the volume of water distilled from the core is not corrected for CBW. Hill, et al. (1979) suggested such a correction was due and described an approach through determination of Qv. However, little or no further treatment of this CBW effect has been found in literature nor have measured data been available. Examination of the Effect of CBW on Core-Water-Salt-Extraction Salinity Results We examined the impact of CBW on the disaggregated-core, salt-extraction method by performing controlled experiments using tight gas sand core samples recovered from a well in the Rocky Mountain region of the U.S.A. The test plan was designed to quantify total and CBW porosity, establish a partial saturation at known salinity, and then process to observe the impact of CBW. Three fully-extracted and dried core plugs had total porosities that ranged from 9.9 to 11.2%. They were saturated and flow-equilibrated with a laboratory brine of 19,750 ppm NaCl concentration. Each core sample, injected brine, and recovered brine were monitored by resistivity determinations for equilibrium conditions. The equilibration period enabled water from the brine to rehydrate clay surfaces and clay counter-ions while replacement by flow maintained the “formation water” salinity. Clay-bound water porosity was determined for the saturated and equilibrated samples by the NMR technique of Martin and Dacy (2004) and averaged 2.4%. Samples were centrifuged to establish a partial water saturation (40 to 50% Sw) representative of a fresh,

SCA2006-29 5/14
uncontaminated core. Chloride ion concentration of both saturant and centrifuge-displaced fluid was determined by ion chromatograph and compared favorably. Core samples were dried at 116ºC in a normal convection oven and removed water computed by mass difference. This step mimics removal of water by distillation and subsequent drying of solvent. Core plugs were crushed and leached with distilled water. Resulting solutions were analyzed for Cl- content and that mass was recombined with both total and CBW-adjusted water removed during the drying step. Results, given in Table 1, show the average “formation brine” concentration computed using total water was 9,817 ppm NaCl while use of CBW-adjusted water yielded an average of 19,137 ppm NaCl. Although many measurements are involved in this process, if one assumes all error lies in the determination of CBW, the difference from observed CBW porosity to that required for perfect agreement with injected brine concentration varies from 0.0006 to 0.0013 fractional porosity units. These findings demonstrate that much more representative formation water salinity results from the core-salt extraction method when CBW is accounted for and that not doing so can result in significant underestimation of the property. Also demonstrated is the need for multiple tests to develop confidence in an average salinity value. Rw-Salinity Core Analysis Method Accounting for CBW Accounting for CBW requires a brine-saturated sample while a fresh sample is used for the water-distillation, salt-extraction step. To address these needs, twin samples are taken for each Rw-salinity investigation. Each sample pair is cut from a section of core with enough uniformity to yield near-identical samples. The core plugs, of either vertical or horizontal orientation, are cut with cool nitrogen gas or oil as the bit lubricant and taken near the central axis of the full core to avoid filtrate invasion as much as possible. If WBM is used in coring, a tracer such as tritiated water is recommended and the plugs are cut and trimmed to right-cylindricity and preserved at the wellsite or within hours of recovery to minimize the effects of tracer diffusion. All sample handling and preservation steps are designed to reduce the effects of diffusion and to eliminate or otherwise track evaporation effects. In the laboratory, one sample of each pair is used for CBW analysis. This sample is processed for determination of total porosity, fully-saturated to equilibrium conditions with a brine of known concentration, and tested for its NMR T2 distribution. The twin plug is processed for total water by dean stark analysis, or, in the absence of oil saturation or contamination by WBM filtrate, oven-dried. With precipitated salts in place, the sample is disaggregated and salt-extracted by soaking in distilled water. Chloride ion content of the extract solution is determined by an analytical method such as ion chromatograph. Further corrections, in addition to that for CBW, are applied for cores cut with tritium-traced WBM. Tracer analysis of the DS distilled water permits subtraction of filtrate

SCA2006-29 6/14
from that volume. Correction of the Cl- mass removed is made based on knowledge of the filtrate fraction of the total water and the filtrate Cl- concentration. B, COUNTER-ION CONDUCTANCE Application of the WST model requires B values for both the laboratory and reservoir environments. Waxman and Smits (1968) performed multiple-salinity core conductivity tests (C0-Cw, where C0 and Cw are conductivities of core and water, respectively) at room temperature with independent wet-chemical tests for Qv to arrive at values of B for two groups of samples. This resulted in two empirical equations for B at 25ºC as functions of Rw:
)]3.83exp(-0.5/ 0.83 -[1 :1 Group 25 wRB = (3) and
)]4.64exp(-0.77/ 0.6 -[1 :2 Group 25 wRB = . (4) Waxman and Smits reasoned the Group 2 equation was most representative. However, on the basis of additional work, Waxman and Thomas (1972) later argued the Group 1 equation best represented B for the laboratory environment. This conclusion was supported by Yuan and Diederix (1987). Waxman and Thomas extended the experiments to reservoir temperatures using similar techniques and derived B vs. Rw relationships for six temperatures from 50 to 200ºC. Results were presented graphically in their figure 16. No equation was given to represent their cross-plot results. The B isotherms for temperatures above 25ºC were digitized and are reproduced here as Figure 1. This figure also illustrates the B25 isotherm that represents the Group 1 equation. Examination of this figure reveals several features. Each isotherm reaches a maximum value, referred to as Bmax, on the left side of the Rw axis representing low Rw and high salinity. Proceeding from Bmax to higher Rw each elevated-temperature B isotherm decreases but reaches a point of truncation that represents an experimental but not theoretical limit for B. One could anticipate an extension beyond the truncation somewhat consistent in form with the trend suggested by the B25 isotherm. Subsequently, other authors have provided empirical equations to represent B at the reservoir environment consistent with W-T figure 16. Juhasz (1981) gave the following equation for B as a function of Rw and temperature:
0.27)- (0.0451
0.0004059 - 0.2251.281.23
2
TR
TTBw+
+−= . (5)
Equation 5 has practical units for B and Rw, (1/ohm m)/(e/l) and ohm m, and temperature, T, has units of degrees C. Gravestock (1991) found that equation 5 did not provide expected variation in B for hot, fresh formation brines and so developed the following equation:
TCB W 4/20)]1.581exp( 0.83[1 25 −−= . (6)

SCA2006-29 7/14
This equation (6) has units of mmho/cm for brine conductivity at 25ºC, CW 25, and degrees C for temperature. Units for B in this equation are cm2 equiv-1 ohm-1 requiring division by 10 to be consistent with other B units discussed here. Comparison to Standards An average of twenty-seven points for each of the six B isotherms of Waxman-Thomas figure 16 were digitized to provide a basis of comparison for the reservoir-environment standard to the published equations. Accuracy in this effort was enhanced by use of the full-page figure available in the transactions version of the W-T paper. Twenty-nine Rw-distributed B values were computed using the Group 1 equation to represent a laboratory-environment standard data set for comparison to these equations. Digitized points along with the isotherms derived from each equation (5 and 6) are illustrated in Figures 2 to 4. Comparison of results for equation 5 is given in Figure 2 and shows the equation output tends to underestimate B particularly at the extremes of Rw. The average absolute deviation from standard is 1.2 units while the maximum deviation is 3.6 units. We observe the absence of temperature effect at high Rw for this equation, hence it does not account for the theoretical extension of Waxman and Thomas’ work into the region of hot, fresh brines. Comparison of results for equation 6, given in Figure 3, reveals a tendency to both over and underestimate B. There is particular poor agreement for the 200ºC isotherm consistent with Gravestock’s caution to limit use of the equation for temperatures up to 170ºC. The average absolute deviation from standard is also 1.2 units while the maximum deviation is 4.3 units. This equation provides a reasonable extension of the standard isotherms for the hot, fresh-brine region where equation 5 fails. Output of both equations 5 and 6 at 25ºC are compared with the Group 1 equation isotherm in Figure 4 with an emphasis on the Bmax region of the cross plot. Here it is seen these equations overestimate the Bmax standard by up to 5 and 3% respectively. Use of either with C0-Cw BmaxQv core data would result in an equal underestimation of Qv. Use of either with wet chemistry Qv data would result in overcorrected core resistivities. Hence, equations 5 and 6 should not be used for laboratory data computations. Development of an Improved and Unifying B Equation Given the variety of equations available and the discrepancies observed compared to standard values (up to 20%), we sought a single equation that would provide better agreement with standard values for the reservoir environment and exactly-matching values for the laboratory environment. Further, we desired prediction of B at hot, fresh brines similar to equation 6. It was observed that each isotherm of W-T figure 16 follows the general form of the Group 1 equation. Sensitive terms in the equation were found to be the last term, which represents Bmax (3.83 for Group 1) and the term that is the numerator to Rw (0.5 for Group

SCA2006-29 8/14
1) that WST described as inverse gamma, γ-1, an empirical constant with units of ohm m. The average digitized value of Bmax for each isotherm was found and regressions were performed using it and all digitized data per isotherm to arrive at a series of best values for γ-1. Determination of temperature functions of Bmax and γ-1 followed. Points were weighted so that function values at 25ºC would be identical to those of the Group 1 equation. Bmax and γ-1 values and their temperature functions can be viewed in Figure 5. These temperature functions were applied to the Group 1 equation form resulting in the following expression:
( )2)ln( 1.593.16
42.172.38-exp-exp 0.831 T
RT
Bw
+−
⎟⎟⎟⎟⎟
⎠
⎞
⎜⎜⎜⎜⎜
⎝
⎛
⎟⎟⎟⎟⎟
⎠
⎞
⎜⎜⎜⎜⎜
⎝
⎛⎟⎟⎠
⎞⎜⎜⎝
⎛⎟⎠⎞
⎜⎝⎛ +
−= . (7)
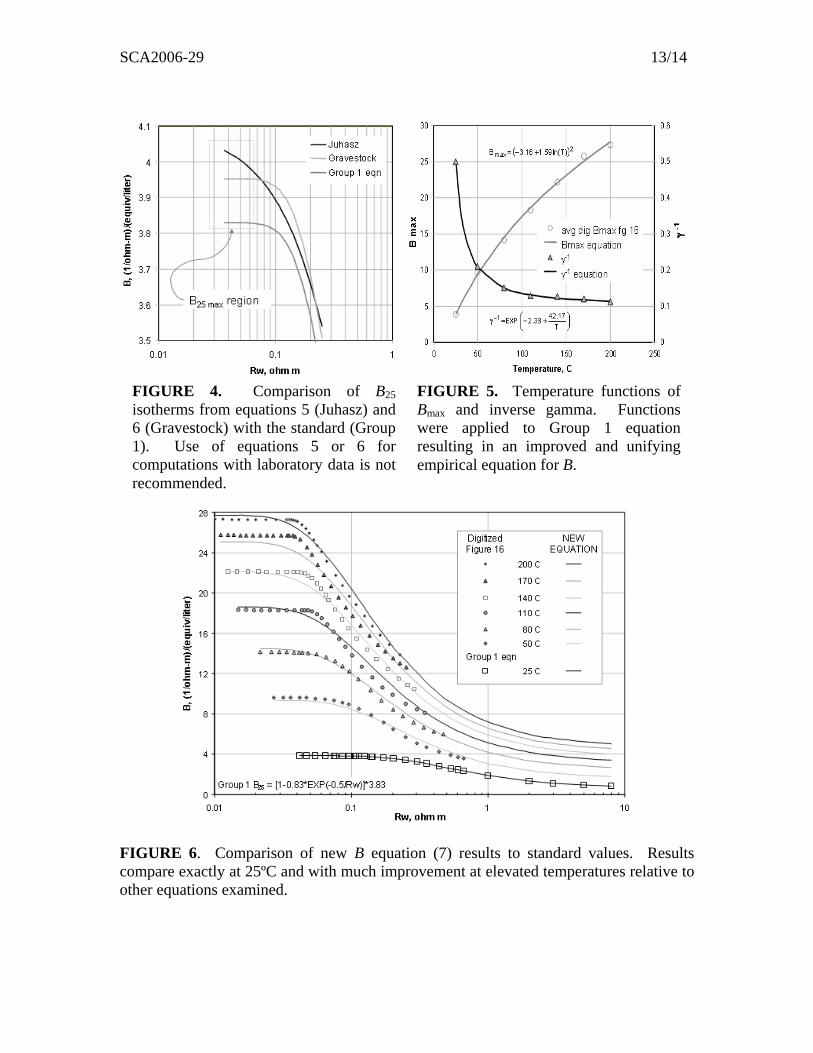
Practical units of B, (1/ohm m)/(e/l), result from equation 7 with Rw in ohm m and T in degrees C. A comparison of equation 7 output to standard values is given in Figure 6. The average absolute deviation from standard is 0.4 units while the maximum deviation is 1.5 units. Only 12 of 188 points of comparison deviate by greater than 1 unit from the standard. At 25ºC the equation exactly matches the standard (equation 3) and logical extensions of the reservoir standard isotherms are given for hot, fresh brines. Equation stability was checked by surface analysis (Figure 7) and results were found to be stable for all anticipated values of Rw and temperature. We believe equation 7 effectively replaces those previously published and we recommend its use by both core and log analysts. Qv, CEC per Unit Pore Volume Traditional core analysis methods for Qv are often inaccurate or impractical when testing tight gas sands. The wet-chemistry (titration) approach tends to over-predict the intrinsic property in well-cemented sands primarily resulting from the disaggregation required by the method. The multiple-salinity core conductivity test (C0-Cw) is the preferred method for effective Qv; however, being a flow-through technique, test times for tight gas sand samples tend to be lengthy and impractical. Qv Method Development Martin and Dacy (2004) presented a new technique for effective Qv that provides results consistent with the C0-Cw method. The technique is based on determination of stressed total porosity and results of a brine-saturated core NMR T2 experiment. Requirements for brine flow-through are minimized or eliminated. Stressed Qv is computed by the following rearranged expression of the Hill, et al. equation (2):
1-1-NCS helium totalms 2.8CBW NMR Sv FQ φφ= . (8)
Use of total helium porosity at net confining stress (NCS), CBW porosity (defined as that cumulative porosity at NMR T2 of 2.8 ms), and a salinity factor (FS) for the equilibrated,

SCA2006-29 9/14
saturating brine result in stressed Qv in units of e/l. The salinity factor is computed by (FS=0.6425 S-0.5 + 0.22) where S is the equilibrating brine concentration in g/l NaCl. The authors determined both Qv by C0-Cw and an NMR T2 cumulative saturated porosity distribution for each of a diverse set of 80 core samples. Equation 2 was used to calculate CBW porosity and that value was found at a corresponding T2 for each sample. Analysis of the T2 values revealed a mean and mode of 2.8 ms to represent CBW porosity. Equation 8 was used to compute Qv by the NMR method for comparison to the C0-Cw method results. Application of Method for Tight Gas Sands We have reassessed this data base to identify and highlight those samples below 1 md and less than 15% porosity to demonstrate the method’s application for tight gas sands. These twenty-three samples are graphically identified and illustrate the distribution of permeability vs. porosity (Figure 8) and the comparison of Qv results, C0-Cw vs. NMR (Figure 9). Review of comparative results confirms the method is suitable for tight gas sands. Use of intact samples and the requirement for limited brine flow-through lead to comparatively rapid and representative results. These features make the method a practical approach to derivation of Qv for these unconventional formations. CONCLUSIONS We have demonstrated the substantial impact of fresh clay-bound water on core-water salinity determinations and have defined an NMR approach that accounts for these effects as part of a core-based method for Rw. It has particular application to tight gas sands because of the difficulties in obtaining representative formation water samples and because these sands often contain CBW. Standard sources for B at the laboratory and reservoir environments have been identified. The poor comparison of standard B values with those from published equations lead to development of a unifying equation that provides both improved B results for the reservoir environment and standard values for the laboratory environment. The new equation effectively replaces those previously published hence it can be used by both core and log analysts. A new NMR method for Qv using intact samples and limited brine flow-through provides results consistent with the C0-Cw method and has been shown to be a practical approach for tight gas sands. Although these methods and equation are presented in the context of tight gas sands and the Waxman-Smits-Thomas model, one or more of them apply for any shaly-sand water saturation model irrespective of permeability.

SCA2006-29 10/14
ACKNOWLEDGEMENT The authors thank the management of Core Laboratories for support in our pursuit of these studies and for permission to publish the results. REFERENCES American Petroleum Institute, Recommended Practices for Core Analysis - Recommended Practice 40, Second Edition, API Publishing Services, Washington D.C., (1998) 231p. Bush, D.C. and R.E. Jenkins, “Proper hydration of clays for rock property determinations,” Journal of Petroleum Technology, (1970), July, 800-804. Clavier, C., G. Coates, and J. Dumanoir, “Theoretical and experimental bases for the dual-water model for interpretation of shaly sands,” Society of Petroleum Engineers Journal, (1984), April, 153-168. Elseth, T., R. Nicolaysen, and D. Roberts, “Grain density correction of the density log: a core-log calibration method for improved porosity prediction in mineralized micaceous sandstone reservoirs,” presented at the SPWLA Annual Logging Symposium, (2001), paper B. Gravestock, D.I., “Behavior of Waxman-Smits parameter ‘B’ in high Rw, high temperature reservoirs,” The Log Analyst, (1991), Sept-Oct, 596-602. Hill, H.J., O.J. Shirley, and G.E. Klein, “Bound water in shaly sands – its relation to Qv and other formation properties,” The Log Analyst, (1979), May-June, 3-19. Juhasz, I., “Normalised Qv – the key to shaly sand evaluation using the Waxman-Smits equation in the absence of core data,” presented at the SPWLA Annual Logging Symposium, (1981), paper Z. Martin, P and J. Dacy, “Effective Qv by NMR core tests,” presented at the SPWLA Annual Logging Symposium, (2004), paper HH. Schipper, B.A., “A critical review of two common core analysis measurements for reservoir evaluation,” presented at the EAPG/RMC/SCA workshop on “Core Analysis for Reservoir Management”, June 6, 1994, Vienna Austria. Straley, C., D. Rossini, H. Vinegar, P. Tutunjian, and C. Morris, “Core analysis by low field NMR,” presented at the Annual Meeting of the Society of Core Analysts, (1994), paper SCA-9404, 43-56. Waxman, M.H. and L.J.M. Smits, “Electrical conductivities in oil-bearing shaly sands,” Society of Petroleum Engineers Journal, (1968), June, 107-121. Waxman, M.H., and E.C. Thomas, “Electrical conductivities in shaly sands – I. the relation between hydrocarbon saturation and resistivity index – II. the temperature coefficient of electrical resistivity,” presented at the Annual Fall Meeting of the Society of Petroleum Engineers, (1972), paper SPE 4094. Yuan, H.H. and K.M. Diederix, “The role of membrane potential measurements in shaly sand evaluation,” presented at the SPWLA Annual Logging Symposium, (1987), paper GG.

SCA2006-29 11/14
TABLE 1. Impact of Clay-Bound Water on Salt-Extraction Salinity Determination
Cl-, ppm Cl-, ppm Recombined with Core WaterTotal CBW Equilibrium Representing Core Water Salinity
Sample Porosity Porosity Saturating Solution Total Water Total Water - CBWA 0.112 0.022 11967 6227 11693B 0.101 0.021 11967 6408 11786C 0.099 0.028 11967 5214 11316
Expressed as NaCl, ppmAverage: 0.104 0.024 19746 9817 19137
FIGURE 1. Standards for B, counter-ion conductance. Isotherms of B as functions of Rw represent the laboratory environment standard (Group 1 equation, 25ºC) and the reservoir environment standard (consistent with Figure 16 of Waxman and Thomas, 1972).

SCA2006-29 12/14
FIGURE 2. Comparison of B standard values (data points) to output of Juhasz’s equation (5). Equation tends to underestimate B and shows little temperature effect at high Rw.
FIGURE 3. Comparison of B standard values (data points) to output of Gravestock’s equation (6). Equation tends to both over and underestimate B but shows a temperature effect at high Rw.
SCA2006-29 13/14
FIGURE 6. Comparison of new B equation (7) results to standard values. Results compare exactly at 25ºC and with much improvement at elevated temperatures relative to other equations examined.
FIGURE 4. Comparison of B25isotherms from equations 5 (Juhasz) and 6 (Gravestock) with the standard (Group 1). Use of equations 5 or 6 for computations with laboratory data is not recommended.
FIGURE 5. Temperature functions of Bmax and inverse gamma. Functions were applied to Group 1 equation resulting in an improved and unifying empirical equation for B.

SCA2006-29 14/14
FIGURE 7. Surface plot of new B equation. Figure illustrates stable equation performance for all anticipated values of Rw and temperature.
0.001
0.01
0.1
1
10
100
1000
10000
0 0.05 0.1 0.15 0.2 0.25 0.3 0.35
Porosity at Net Confining Stress (NCS)
Klin
kenb
erg
Perm
eabi
lity,
md
at N
CS
n=80; ALL SAMPLES
n= 23 at k<1 md & phi<0.15
0.1
1
10
0.1 1 10
Qv, e/l CoCw
Qv,
e/l
NM
R 2
.8 m
s
n=80; ALL SAMPLES
n=23 at k<1 md & phi<0.15
y=x
FIGURE 8. Permeability vs. porosity
for database samples used in development of NMR Qv technique. Samples with low permeability and porosity are indicated
FIGURE 9. Comparison of C0-Cw Qvresults with those of the NMR method. New method is well-suited for tight gas sands as it is rapid, non-destructive, and results compare favorably with those of C0-Cw method.