Rabbit Nipple-Search Pheromone Versus Rabbit Mammary Pheromone Revisited
Population of Computational Rabbit-Specific VentricularAction Potential Models for Investigating Sources ofVariability in Cellular RepolarisationPhilip Gemmell1, Kevin Burrage1,2, Blanca Rodriguez1, T. Alexander Quinn3*
1 Department of Computer Science, University of Oxford, Oxford, United Kingdom, 2 School of Mathematical Sciences, Queensland University of Technology, Brisbane,
Australia, 3 Department of Physiology and Biophysics, Dalhousie University, Halifax, NS, Canada
Abstract
Variability is observed at all levels of cardiac electrophysiology. Yet, the underlying causes and importance of this variabilityare generally unknown, and difficult to investigate with current experimental techniques. The aim of the present study wasto generate populations of computational ventricular action potential models that reproduce experimentally observedintercellular variability of repolarisation (represented by action potential duration) and to identify its potential causes. Asystematic exploration of the effects of simultaneously varying the magnitude of six transmembrane current conductances(transient outward, rapid and slow delayed rectifier K+, inward rectifying K+, L-type Ca2+, and Na+/K+ pump currents) in tworabbit-specific ventricular action potential models (Shannon et al. and Mahajan et al.) at multiple cycle lengths (400, 600,1,000 ms) was performed. This was accomplished with distributed computing software specialised for multi-dimensionalparameter sweeps and grid execution. An initial population of 15,625 parameter sets was generated for both models ateach cycle length. Action potential durations of these populations were compared to experimentally derived ranges forrabbit ventricular myocytes. 1,352 parameter sets for the Shannon model and 779 parameter sets for the Mahajan modelyielded action potential duration within the experimental range, demonstrating that a wide array of ionic conductancevalues can be used to simulate a physiological rabbit ventricular action potential. Furthermore, by using clutter-baseddimension reordering, a technique that allows visualisation of multi-dimensional spaces in two dimensions, the interactionof current conductances and their relative importance to the ventricular action potential at different cycle lengths wererevealed. Overall, this work represents an important step towards a better understanding of the role that variability incurrent conductances may play in experimentally observed intercellular variability of rabbit ventricular action potentialrepolarisation.
Citation: Gemmell P, Burrage K, Rodriguez B, Quinn TA (2014) Population of Computational Rabbit-Specific Ventricular Action Potential Models for InvestigatingSources of Variability in Cellular Repolarisation. PLoS ONE 9(2): e90112. doi:10.1371/journal.pone.0090112
Editor: Vladimir E. Bondarenko, Georgia State University, United States of America
Received August 19, 2013; Accepted January 29, 2014; Published February 28, 2014
Copyright: � 2014 Gemmell et al. This is an open-access article distributed under the terms of the Creative Commons Attribution License, which permitsunrestricted use, distribution, and reproduction in any medium, provided the original author and source are credited.
Funding: PG is supported by the Engineering and Physical Sciences Research Council (EPSRC) through the Systems Biology Doctoral Training Centre at theUniversity of Oxford. BR holds Medical Research Council (MRC) Career Development, Centenary, and Industrial Partnership Awards. TAQ was holder of an EPSRCPostdoctoral Fellowship and was further supported by the British Heart Foundation and the Magdi Yacoub Institute. The funders had no role in study design, datacollection and analysis, decision to publish, or preparation of the manuscript.
Competing Interests: The authors have declared that no competing interests exist.
* E-mail: [email protected]
Introduction
Variability is perhaps an essential component of physiological
systems. It is observed at all levels of spatial and temporal
organisation, from sub-cellular processes to the whole-organism,
and over time scales spanning from nanoseconds to years. In most
cases, however, the underlying causes of physiological variability
remain unclear. Moreover, its importance in health and disease,
where it may explain the spectrum of responses often seen between
individuals, is largely unknown. Thus, it has long been ignored in
experimental and computational research.
The method usually taken by experimentalists in dealing with
variability involves averaging across many subjects, thus deter-
mining the mean response. Subsequently, computational models
are generated based on reported mean values, creating represen-
tations of the ‘typical’ case that fail to account for underlying
variability [1]. This approach results not only in a loss of
information, but in an inability of models to explain physiological
observations that may depend on the presence of variability. This
is certainly the case in the field of computational cardiac
electrophysiology modelling. At all levels of integration, variability
in cardiac activity exists, whether it is across the heart, between
individual cells, or within ion-channels.
Even so, by extending investigations beyond that which is
experimentally feasible, computational research is becoming an
increasingly valuable tool for improving our understanding of
cardiac electrophysiology [2]. While it may be that current cell
models are limited in that they generally produce only an ‘average’
action potential (AP), efforts are underway to improve their scope
by representing variability in cellular processes. This is being
approached in multiple ways: i) by the inclusion of stochasticity in
model formulations [3–9]; ii) by the use of parameter sensitivity
analyses [10–14]; and iii) by the generation of model populations
representing observed variability [4,15–19]. The most extensive
example to date of the use of a model population to investigate
cardiac electrophysiological variability comes from a study by
PLOS ONE | www.plosone.org 1 February 2014 | Volume 9 | Issue 2 | e90112
Britton et al. [15], in which a large population of rabbit-specific
Purkinje AP models was generated by randomly assigning specific
parameter values to various ionic current conductances and
channel kinetics. This was followed by constraint of the model
population using experimental data (a validation step essential for
model development [1,2]). Results demonstrated that particular
combinations of parameters (‘parameter sets’) appeared to
determine AP shape and rate-dependence, and that under
conditions of K+ channel block the model population was able
to predict experimentally measured AP prolongation.
The current study is focused on understanding variability of
ventricular AP repolarisation, as increased variability in the
ventricles has been related to increased arrhythmic risk [20–31].
Our specific aim was to generate physiologically relevant
populations of computational rabbit-specific ventricular AP
models with variable transmembrane current conductances that
reproduce experimentally observed intercellular variability of
repolarisation (represented by AP duration, APD) to explore its
potential sources. We present a framework for systematic
parameter space exploration using distributed computing software
[32–34] and specialised visualisation techniques [35–38], specif-
ically designed for large-scale parameter sweeps and grid
execution, along with model calibration using experimental data.
This allowed investigation of the interactions between the varied
conductances, their relative importance to AP repolarisation, and
rate- and model-dependent effects.
Materials and Methods
Exploring Ventricular AP Response to SimultaneousVariations in the Magnitude of Transmembrane CurrentConductances Important for Repolarisation
Two biophysically-detailed computational cell models were used
in this study to simulate the AP of a rabbit ventricular epicardial
myocyte (allowing assessment of model-dependent effects). The
first was created by Shannon et al. [39] and the second was an
updated version of that model by Mahajan et al. [40], which
includes updates to the L-type Ca2+ current, intracellular Ca2+
cycling, Na+- Ca2+ exchanger, and channel distributions updated
to better replicate AP and Ca2+-handling dynamics at rapid
stimulation rates. Importantly, of the small animals, rabbit has
cardiac electrophysiology most similar to human, and thus is a
preferred model for experimental research and pharmacological
testing [41], providing established reference values for constraining
models to a physiological range.
Simulations were designed to examine the response of these
models to simultaneous variation of the magnitude of multiple
transmembrane current conductances important for ventricular
repolarisation. The currents considered (with their conductance
given in parentheses) were: the transient outward current (gto); the
rapid delayed rectifier K+ current (gKr); the slow delayed rectifier
K+ current (gKs); the inward rectifying K+ current (gK1); the L-type
Ca2+ current (gCa,L); and the Na+/K+ pump current (gNaK).
Synthesising the information available in the literature to create
well-defined ranges is difficult because available experimental
values for these current conductances come from various
laboratories and are often produced using vastly different (and
sometimes ill-reported) methods and conditions ([42]). Thus,
conductances were varied by 0%, 615%, and 630%, which is
within the bounds of experimentally reported variability in rabbit
ventricular myocytes [43], aligns with previous computational
investigations [11], and provided a good compromise between the
size of the parameter space and computational tractability.
Current formulations, on the other hand, were left unchanged,
based on the assumption that AP variability is primarily a result of
differences in the relative magnitude of currents, rather than
underlying current dynamics. This generated a population of
15,625 models for both the Shannon and Mahajan formulations.
Model APD was compared to experimentally reported values to
define physiological parameter sets, and in cases where no
parameter sets generated matches, the range of conductance
variation was expanded until matches were found (described
further in the next section). Simulations were performed at a cycle
length (CL) of 400, 600, and 1,000 ms to constrain the populations
of models and to examine potential rate-dependent effects.
Both models were downloaded from the CellML model
repository (http://models.cellml.org/cellml). [K+]i was unclamped
and the Shannon model was corrected as suggested previously
[44]. The CellML files were converted to C++ using the Cellular
Open Resource (COR) software (http://cor.physiol.ox.ac.uk/)
[45] and simulations were performed using an ordinary differential
equation solver with adaptive time-stepping (Sundials CVODE,
version 2.4.0) and relative and absolute tolerances set to 1027 and
1029, respectively. Simulation duration was set to 1,000 s and run
Table 1. Normal range of rabbit epicardial APD50 and APD90
used to define physiological parameter sets.
CL (ms)
Biomarker 400 600 1,000
APD50 (ms) 104–135 116–159 137–188
APD90 (ms) 142–185 160–220 167–230
Values are derived from previously reported studies [46–58], as described in thetext.doi:10.1371/journal.pone.0090112.t001
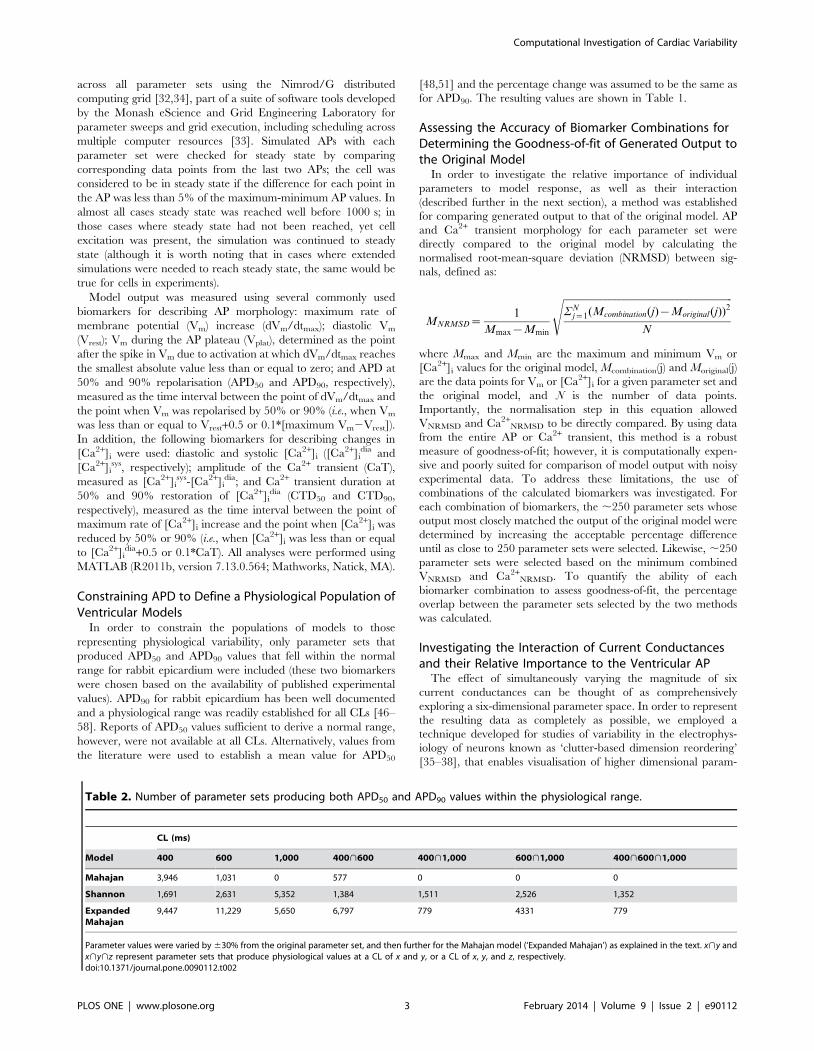
Figure 1. The dimensional stacking process. (A) The effect of two‘low order’ conductances (g1 and g2) are plotted in a contour plot, withall other conductances held constant at their control value. This plot isthen embedded in a larger grid spanning two ‘medium order’conductances (g3 and g4). For each value of g3,4, the g1,2 plot isrepeated for the respective values. This process is repeated to representthe two ‘high order’ conductances (g5 and g6). (B) Example showing arandom stack order (left), versus an optimised stack order (right) for thesame variable.doi:10.1371/journal.pone.0090112.g001
Computational Investigation of Cardiac Variability
PLOS ONE | www.plosone.org 2 February 2014 | Volume 9 | Issue 2 | e90112
across all parameter sets using the Nimrod/G distributed
computing grid [32,34], part of a suite of software tools developed
by the Monash eScience and Grid Engineering Laboratory for
parameter sweeps and grid execution, including scheduling across
multiple computer resources [33]. Simulated APs with each
parameter set were checked for steady state by comparing
corresponding data points from the last two APs; the cell was
considered to be in steady state if the difference for each point in
the AP was less than 5% of the maximum-minimum AP values. In
almost all cases steady state was reached well before 1000 s; in
those cases where steady state had not been reached, yet cell
excitation was present, the simulation was continued to steady
state (although it is worth noting that in cases where extended
simulations were needed to reach steady state, the same would be
true for cells in experiments).
Model output was measured using several commonly used
biomarkers for describing AP morphology: maximum rate of
membrane potential (Vm) increase (dVm/dtmax); diastolic Vm
(Vrest); Vm during the AP plateau (Vplat), determined as the point
after the spike in Vm due to activation at which dVm/dtmax reaches
the smallest absolute value less than or equal to zero; and APD at
50% and 90% repolarisation (APD50 and APD90, respectively),
measured as the time interval between the point of dVm/dtmax and
the point when Vm was repolarised by 50% or 90% (i.e., when Vm
was less than or equal to Vrest+0.5 or 0.1*[maximum Vm2Vrest]).
In addition, the following biomarkers for describing changes in
[Ca2+]i were used: diastolic and systolic [Ca2+]i ([Ca2+]idia and
[Ca2+]isys, respectively); amplitude of the Ca2+ transient (CaT),
measured as [Ca2+]isys-[Ca2+]i
dia; and Ca2+ transient duration at
50% and 90% restoration of [Ca2+]idia (CTD50 and CTD90,
respectively), measured as the time interval between the point of
maximum rate of [Ca2+]i increase and the point when [Ca2+]i was
reduced by 50% or 90% (i.e., when [Ca2+]i was less than or equal
to [Ca2+]idia+0.5 or 0.1*CaT). All analyses were performed using
MATLAB (R2011b, version 7.13.0.564; Mathworks, Natick, MA).
Constraining APD to Define a Physiological Population ofVentricular Models
In order to constrain the populations of models to those
representing physiological variability, only parameter sets that
produced APD50 and APD90 values that fell within the normal
range for rabbit epicardium were included (these two biomarkers
were chosen based on the availability of published experimental
values). APD90 for rabbit epicardium has been well documented
and a physiological range was readily established for all CLs [46–
58]. Reports of APD50 values sufficient to derive a normal range,
however, were not available at all CLs. Alternatively, values from
the literature were used to establish a mean value for APD50
[48,51] and the percentage change was assumed to be the same as
for APD90. The resulting values are shown in Table 1.
Assessing the Accuracy of Biomarker Combinations forDetermining the Goodness-of-fit of Generated Output tothe Original Model
In order to investigate the relative importance of individual
parameters to model response, as well as their interaction
(described further in the next section), a method was established
for comparing generated output to that of the original model. AP
and Ca2+ transient morphology for each parameter set were
directly compared to the original model by calculating the
normalised root-mean-square deviation (NRMSD) between sig-
nals, defined as:
MNRMSD~1
Mmax{Mmin
ffiffiffiffiffiffiffiffiffiffiffiffiffiffiffiffiffiffiffiffiffiffiffiffiffiffiffiffiffiffiffiffiffiffiffiffiffiffiffiffiffiffiffiffiffiffiffiffiffiffiffiffiffiffiffiffiffiffiffiffiffiffiffiffiffiffiffiffiSN
j~1(Mcombination(j){Moriginal(j))2
N
s
where Mmax and Mmin are the maximum and minimum Vm or
[Ca2+]i values for the original model, Mcombination(j) and Moriginal(j)
are the data points for Vm or [Ca2+]i for a given parameter set and
the original model, and N is the number of data points.
Importantly, the normalisation step in this equation allowed
VNRMSD and Ca2+NRMSD to be directly compared. By using data
from the entire AP or Ca2+ transient, this method is a robust
measure of goodness-of-fit; however, it is computationally expen-
sive and poorly suited for comparison of model output with noisy
experimental data. To address these limitations, the use of
combinations of the calculated biomarkers was investigated. For
each combination of biomarkers, the ,250 parameter sets whose
output most closely matched the output of the original model were
determined by increasing the acceptable percentage difference
until as close to 250 parameter sets were selected. Likewise, ,250
parameter sets were selected based on the minimum combined
VNRMSD and Ca2+NRMSD. To quantify the ability of each
biomarker combination to assess goodness-of-fit, the percentage
overlap between the parameter sets selected by the two methods
was calculated.
Investigating the Interaction of Current Conductancesand their Relative Importance to the Ventricular AP
The effect of simultaneously varying the magnitude of six
current conductances can be thought of as comprehensively
exploring a six-dimensional parameter space. In order to represent
the resulting data as completely as possible, we employed a
technique developed for studies of variability in the electrophys-
iology of neurons known as ‘clutter-based dimension reordering’
[35–38], that enables visualisation of higher dimensional param-
Table 2. Number of parameter sets producing both APD50 and APD90 values within the physiological range.
CL (ms)
Model 400 600 1,000 400>600 400>1,000 600>1,000 400>600>1,000
Mahajan 3,946 1,031 0 577 0 0 0
Shannon 1,691 2,631 5,352 1,384 1,511 2,526 1,352
ExpandedMahajan
9,447 11,229 5,650 6,797 779 4331 779
Parameter values were varied by 630% from the original parameter set, and then further for the Mahajan model (‘Expanded Mahajan’) as explained in the text. x>y andx>y>z represent parameter sets that produce physiological values at a CL of x and y, or a CL of x, y, and z, respectively.doi:10.1371/journal.pone.0090112.t002
Computational Investigation of Cardiac Variability
PLOS ONE | www.plosone.org 3 February 2014 | Volume 9 | Issue 2 | e90112
eter spaces in two dimensions. This method can be thought of as a
linear projection of a multi-dimensional space to a lower
dimensional space, with each point in n-dimensions assigned to a
unique point in two-dimensions (much like slicing a cube and
placing the resulting squares next to each other, only with ‘slices’
taken in more than three-dimensions, such that with continuous
slicing the dimensionality of the space is iteratively reduced until it
can be visualised in two-dimensions).
The first step in clutter-based dimension reordering is ‘dimen-
sional stacking’ (Fig. 1A). In our case, two of the conductances
being varied were randomly chosen (g1 and g2), and with all other
conductances held constant at control values, their effect on the
measured biomarkers was displayed by a contour plot (‘Level 1’ in
Fig. 1). Two other conductances were chosen (g3 and g4) and the
original contour plot was repeated for each combination of these
parameters. The subsequent plots were arranged in a grid
reflecting the variation of g3 and g4 (‘Level 2’ in Fig. 1), i.e. the
Level 1 plot that has g3 and g4 at their minimum values is at the
bottom left of the Level 2 grid, and the Level 1 plot that has g3 and
g4 at their maximum values is at the top right of the Level 2 grid.
This process was then repeated for the last two conductances.
The resulting ‘dimensional stack’ was then optimised by
rearranging the levels of the conductances (Fig. 1B). This was
achieved by minimising the absolute difference between each point
and its four neighbours in the x and y plane. The result of this
optimisation was to ‘smooth’ the resulting plot, which leads to the
‘low order’ conductances (that have the smallest effect) being in
Level 1, and the ‘high order’ conductances (that have the largest
effect) being in Level 3. By determining the optimum ‘stack order’,
patterns within the data are revealed. For instance, the greatest
changes in the biomarker being considered are observed on the
largest scale of the highest order conductances. It should be noted
that in some cases the stack order before optimisation was used, to
allow direct comparison of individual stacks for revealing inter-
stack differences.
Results
Physiological Ventricular AP Variability can beReproduced using a Population of Cell Models withDiverse Repolarising Current Conductances
By using the values derived from the literature to describe
physiological ranges for APD50 and APD90 (Table 1), it was
possible to constrain the combinations of current conductances to
those producing experimentally measured variability at each CL.
The numbers of parameter sets that produced a physiological
output are given in Table 2, with the associated minimum, mean,
and maximum values for all computed biomarkers presented in
Table 3.
With the Shannon model, there existed at least one parameter
set that produced a physiological output at each CL, with some of
these generating a physiological output at all CLs (interestingly,
however, this did not include the original parameter set,
demonstrating that the original Shannon model does not
reproduce physiological output under some conditions). On the
other hand, while a relatively large number of parameter sets
produced a physiological output at a CL of 400 ms with the
Mahajan model (the CL for which the Mahajan model was
designed), fewer parameter sets matched at a CL of 600 ms, and
none at a CL of 1,000 ms (the increase in APD with increasing CL
was disproportionately large).
In order to address the failure of the Mahajan model in finding
parameter sets that generated a physiological output with
increased CL, the range of conductance variation was expanded.
To determine an appropriate new parameter space to be explored,
first the ranges of APD50 and APD90 used for constraint were
moderately extended (610%) and the model population was
compared to this new range. This extended range of APD resulted
in 24 matches with outputs at a CL of 1,000 ms. Based on the
distribution of the conductance values that were present in these
matching parameter sets, the range of conductance values for each
current was expanded by following the underlying trend. The
expanded ranges chosen were: gto = 215%–+45%; gCa,L = +30%–
+90%; gKr = 215%–+45%; gKs = +45%–+105%; gK1 = 215%–
+45%; gNaK = 245%–+15%. A new parameter search was then
performed as before, using the original physiological ranges for
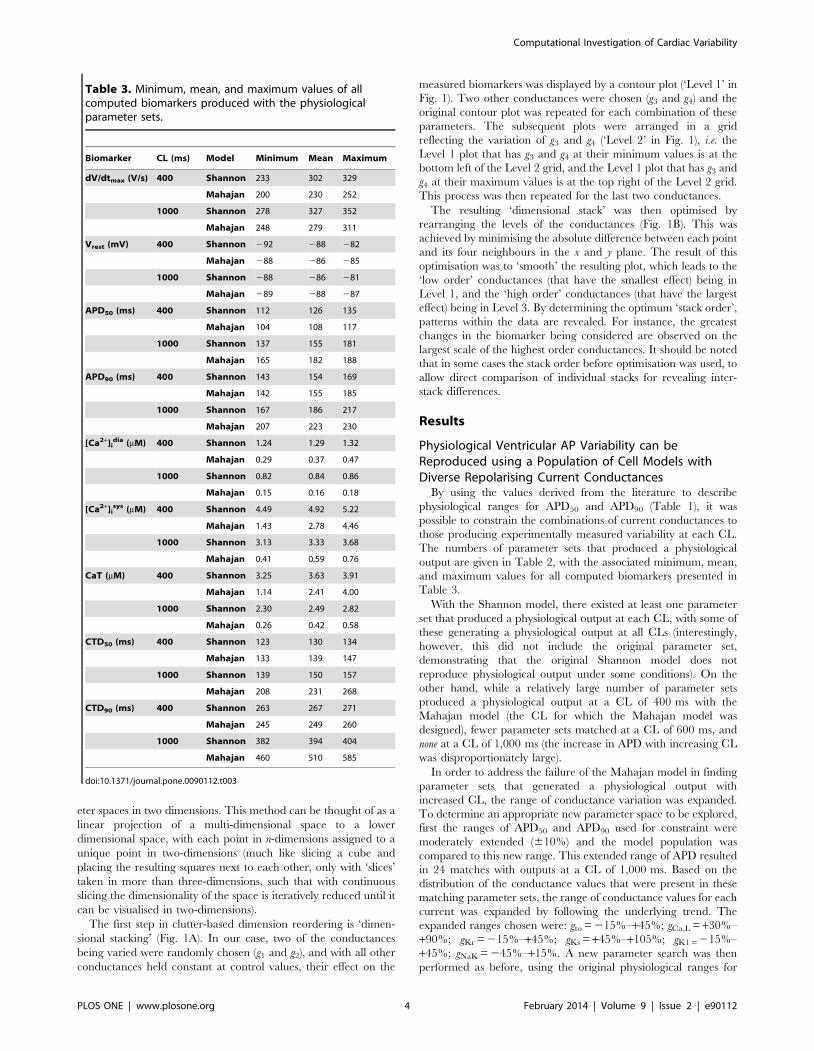
Table 3. Minimum, mean, and maximum values of allcomputed biomarkers produced with the physiologicalparameter sets.
Biomarker CL (ms) Model Minimum Mean Maximum
dV/dtmax (V/s) 400 Shannon 233 302 329
Mahajan 200 230 252
1000 Shannon 278 327 352
Mahajan 248 279 311
Vrest (mV) 400 Shannon 292 288 282
Mahajan 288 286 285
1000 Shannon 288 286 281
Mahajan 289 288 287
APD50 (ms) 400 Shannon 112 126 135
Mahajan 104 108 117
1000 Shannon 137 155 181
Mahajan 165 182 188
APD90 (ms) 400 Shannon 143 154 169
Mahajan 142 155 185
1000 Shannon 167 186 217
Mahajan 207 223 230
[Ca2+]idia (mM) 400 Shannon 1.24 1.29 1.32
Mahajan 0.29 0.37 0.47
1000 Shannon 0.82 0.84 0.86
Mahajan 0.15 0.16 0.18
[Ca2+]isys (mM) 400 Shannon 4.49 4.92 5.22
Mahajan 1.43 2.78 4.46
1000 Shannon 3.13 3.33 3.68
Mahajan 0.41 0.59 0.76
CaT (mM) 400 Shannon 3.25 3.63 3.91
Mahajan 1.14 2.41 4.00
1000 Shannon 2.30 2.49 2.82
Mahajan 0.26 0.42 0.58
CTD50 (ms) 400 Shannon 123 130 134
Mahajan 133 139 147
1000 Shannon 139 150 157
Mahajan 208 231 268
CTD90 (ms) 400 Shannon 263 267 271
Mahajan 245 249 260
1000 Shannon 382 394 404
Mahajan 460 510 585
doi:10.1371/journal.pone.0090112.t003
Computational Investigation of Cardiac Variability
PLOS ONE | www.plosone.org 4 February 2014 | Volume 9 | Issue 2 | e90112
APD and with current conductances varied in 15% increments
across their new range, resulting in an additional 15,625
parameter sets at each CL. In the case of this expanded search,
the number of parameter sets that matched at all CLs was
approximately half of that with the Shannon model.
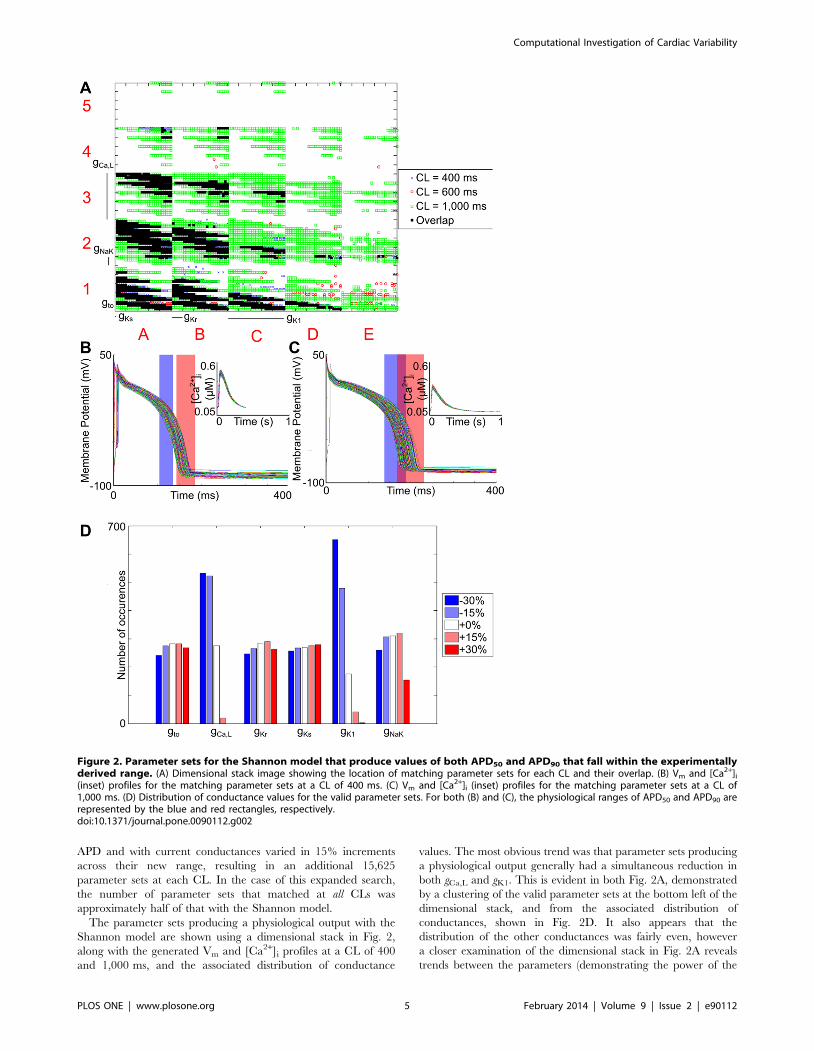
The parameter sets producing a physiological output with the
Shannon model are shown using a dimensional stack in Fig. 2,
along with the generated Vm and [Ca2+]i profiles at a CL of 400
and 1,000 ms, and the associated distribution of conductance
values. The most obvious trend was that parameter sets producing
a physiological output generally had a simultaneous reduction in
both gCa,L and gK1. This is evident in both Fig. 2A, demonstrated
by a clustering of the valid parameter sets at the bottom left of the
dimensional stack, and from the associated distribution of
conductances, shown in Fig. 2D. It also appears that the
distribution of the other conductances was fairly even, however
a closer examination of the dimensional stack in Fig. 2A reveals
trends between the parameters (demonstrating the power of the
Figure 2. Parameter sets for the Shannon model that produce values of both APD50 and APD90 that fall within the experimentallyderived range. (A) Dimensional stack image showing the location of matching parameter sets for each CL and their overlap. (B) Vm and [Ca2+]i
(inset) profiles for the matching parameter sets at a CL of 400 ms. (C) Vm and [Ca2+]i (inset) profiles for the matching parameter sets at a CL of1,000 ms. (D) Distribution of conductance values for the valid parameter sets. For both (B) and (C), the physiological ranges of APD50 and APD90 arerepresented by the blue and red rectangles, respectively.doi:10.1371/journal.pone.0090112.g002
Computational Investigation of Cardiac Variability
PLOS ONE | www.plosone.org 5 February 2014 | Volume 9 | Issue 2 | e90112
clutter-based dimension reordering technique for visualisation of
multi-dimensional parameter spaces). For instance, within the
gNaK/gKr surfaces (Level 2 of the stack), the matching parameter
sets are spread in an approximately diagonal line from top left to
bottom right, indicating that when gNaK was increased, this was
offset by a decrease in gKr, and vice versa. As gCa,L and gK1 decrease,
this diagonal line moves further towards the bottom left corner,
indicating that a further reduction of gNaK and gKr was required to
continue to produce a physiological output.
The effect of gto was more complicated. When gCa,L and gK1
were reduced by 30%, and gNaK was also reduced, matching
parameter sets then included those with an increased gto. The
opposite was true when gNaK was increased, as in these cases a
decrease in gto was necessary (square A1 in Fig. 2A). As gK1 was
increased, fewer parameter sets with an increased gNaK were valid,
such that an increase in gto was observed (squares B1, C1, and D1
in Fig. 2A). However, in all cases where gCa,L was not reduced by
30%, the opposite was true: parameter sets including reduced gNaK
and increased gto were no longer valid (squares A2 and A3 in Fig.
2A). Finally, in all valid parameter sets as gKr was increased, gto
decreased. On the other hand, there appeared to be no limitations
on the values of gKs.
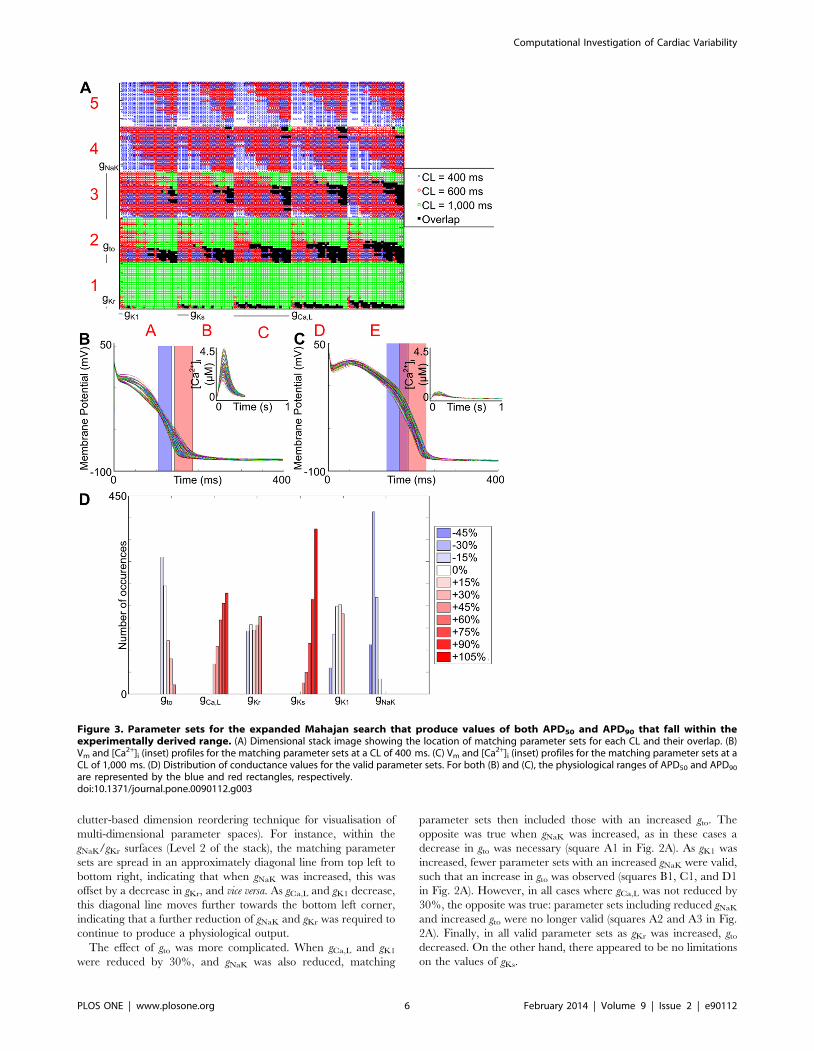
Figure 3. Parameter sets for the expanded Mahajan search that produce values of both APD50 and APD90 that fall within theexperimentally derived range. (A) Dimensional stack image showing the location of matching parameter sets for each CL and their overlap. (B)Vm and [Ca2+]i (inset) profiles for the matching parameter sets at a CL of 400 ms. (C) Vm and [Ca2+]i (inset) profiles for the matching parameter sets at aCL of 1,000 ms. (D) Distribution of conductance values for the valid parameter sets. For both (B) and (C), the physiological ranges of APD50 and APD90
are represented by the blue and red rectangles, respectively.doi:10.1371/journal.pone.0090112.g003
Computational Investigation of Cardiac Variability
PLOS ONE | www.plosone.org 6 February 2014 | Volume 9 | Issue 2 | e90112
For the expanded Mahajan search, the parameter sets
producing a physiological output, the generated cellular profiles,
and the distribution of valid conductance values are shown in Fig.
3. There are some differences compared to the Shannon model.
For instance, with the Shannon model, gKs appeared to have no
effect in determining the validity of parameter sets, while with the
Mahajan model it had a strong influence, as most matching
parameter sets included the largest conductance variation
(+105%). The opposite was true for gK1: while it had a large
influence with the Shannon model, it was relatively unimportant
with the Mahajan model. Similarly, with the Shannon model, gto
and gNaK generally varied in the opposite direction, while with the
Mahajan model they changed in the same direction.
With the Mahajan model there was also a strong correlation
between gNaK and gKs, such that when gNaK was increased, gKs also
increased (demonstrated by a shift of matching parameter sets
from the predominantly lower left corner to the upper right corner
of level two plots; for instance, compare the distribution within E1
and E3). On the other hand, there appeared to be no limitations
on the values of gKr.
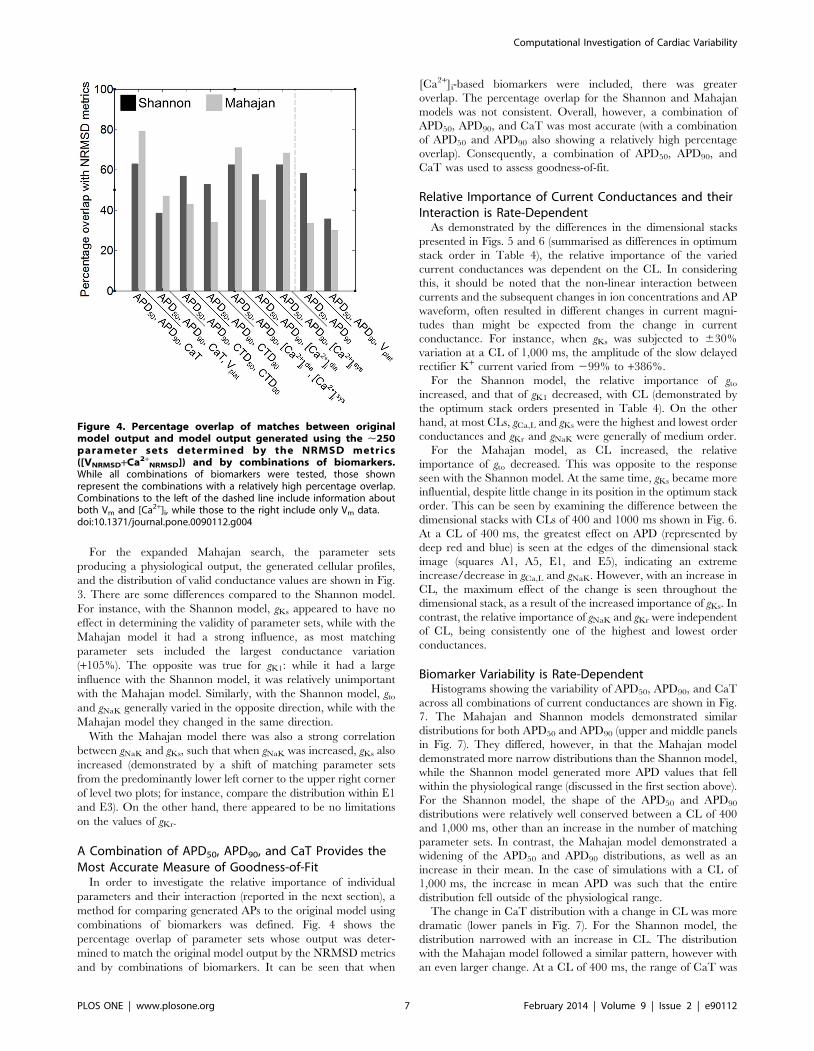
A Combination of APD50, APD90, and CaT Provides theMost Accurate Measure of Goodness-of-Fit
In order to investigate the relative importance of individual
parameters and their interaction (reported in the next section), a
method for comparing generated APs to the original model using
combinations of biomarkers was defined. Fig. 4 shows the
percentage overlap of parameter sets whose output was deter-
mined to match the original model output by the NRMSD metrics
and by combinations of biomarkers. It can be seen that when
[Ca2+]i-based biomarkers were included, there was greater
overlap. The percentage overlap for the Shannon and Mahajan
models was not consistent. Overall, however, a combination of
APD50, APD90, and CaT was most accurate (with a combination
of APD50 and APD90 also showing a relatively high percentage
overlap). Consequently, a combination of APD50, APD90, and
CaT was used to assess goodness-of-fit.
Relative Importance of Current Conductances and theirInteraction is Rate-Dependent
As demonstrated by the differences in the dimensional stacks
presented in Figs. 5 and 6 (summarised as differences in optimum
stack order in Table 4), the relative importance of the varied
current conductances was dependent on the CL. In considering
this, it should be noted that the non-linear interaction between
currents and the subsequent changes in ion concentrations and AP
waveform, often resulted in different changes in current magni-
tudes than might be expected from the change in current
conductance. For instance, when gKs was subjected to 630%
variation at a CL of 1,000 ms, the amplitude of the slow delayed
rectifier K+ current varied from 299% to +386%.
For the Shannon model, the relative importance of gto
increased, and that of gK1 decreased, with CL (demonstrated by
the optimum stack orders presented in Table 4). On the other
hand, at most CLs, gCa,L and gKs were the highest and lowest order
conductances and gKr and gNaK were generally of medium order.
For the Mahajan model, as CL increased, the relative
importance of gto decreased. This was opposite to the response
seen with the Shannon model. At the same time, gKs became more
influential, despite little change in its position in the optimum stack
order. This can be seen by examining the difference between the
dimensional stacks with CLs of 400 and 1000 ms shown in Fig. 6.
At a CL of 400 ms, the greatest effect on APD (represented by
deep red and blue) is seen at the edges of the dimensional stack
image (squares A1, A5, E1, and E5), indicating an extreme
increase/decrease in gCa,L and gNaK. However, with an increase in
CL, the maximum effect of the change is seen throughout the
dimensional stack, as a result of the increased importance of gKs. In
contrast, the relative importance of gNaK and gKr were independent
of CL, being consistently one of the highest and lowest order
conductances.
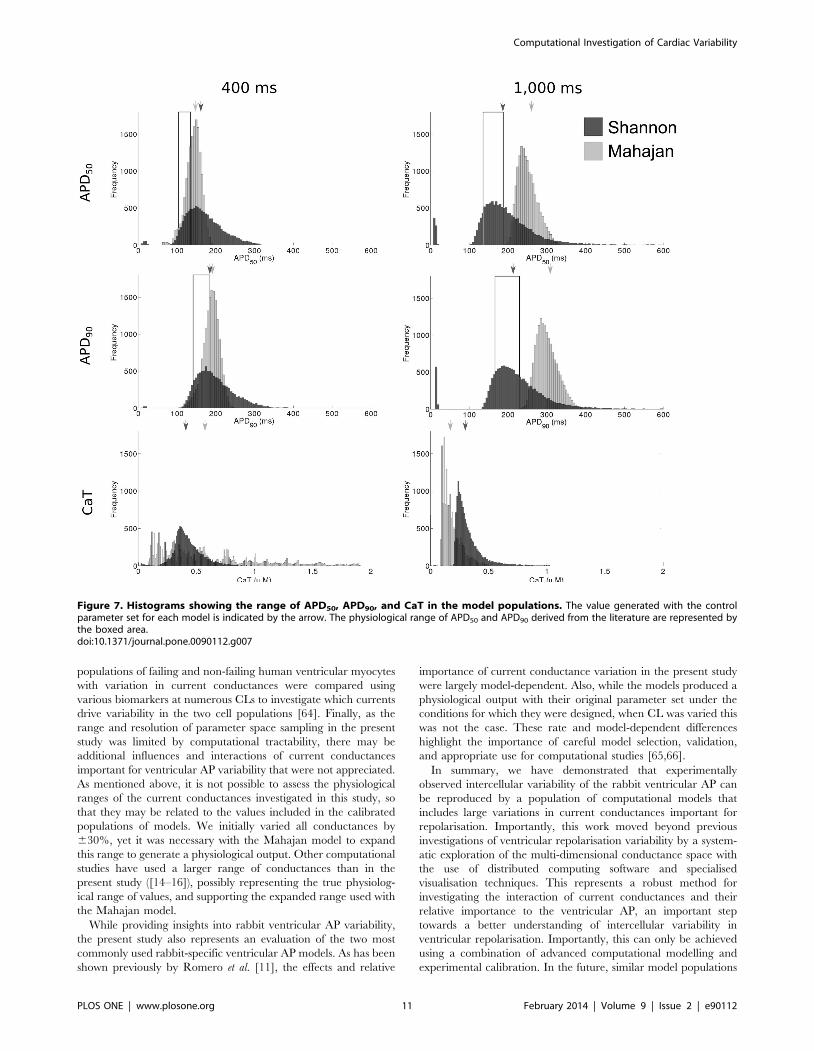
Biomarker Variability is Rate-DependentHistograms showing the variability of APD50, APD90, and CaT
across all combinations of current conductances are shown in Fig.
7. The Mahajan and Shannon models demonstrated similar
distributions for both APD50 and APD90 (upper and middle panels
in Fig. 7). They differed, however, in that the Mahajan model
demonstrated more narrow distributions than the Shannon model,
while the Shannon model generated more APD values that fell
within the physiological range (discussed in the first section above).
For the Shannon model, the shape of the APD50 and APD90
distributions were relatively well conserved between a CL of 400
and 1,000 ms, other than an increase in the number of matching
parameter sets. In contrast, the Mahajan model demonstrated a
widening of the APD50 and APD90 distributions, as well as an
increase in their mean. In the case of simulations with a CL of
1,000 ms, the increase in mean APD was such that the entire
distribution fell outside of the physiological range.
The change in CaT distribution with a change in CL was more
dramatic (lower panels in Fig. 7). For the Shannon model, the
distribution narrowed with an increase in CL. The distribution
with the Mahajan model followed a similar pattern, however with
an even larger change. At a CL of 400 ms, the range of CaT was
Figure 4. Percentage overlap of matches between originalmodel output and model output generated using the ,250parameter sets determined by the NRMSD metrics([VNRMSD+Ca2+
NRMSD]) and by combinations of biomarkers.While all combinations of biomarkers were tested, those shownrepresent the combinations with a relatively high percentage overlap.Combinations to the left of the dashed line include information aboutboth Vm and [Ca2+]i, while those to the right include only Vm data.doi:10.1371/journal.pone.0090112.g004
Computational Investigation of Cardiac Variability
PLOS ONE | www.plosone.org 7 February 2014 | Volume 9 | Issue 2 | e90112
very broad (,0.1 mM to ,1.9 mM), indicating that CaT was
relatively poorly constrained within the parameter space. When
CL was increased, however, the range was greatly reduced
(,0.1 mM to ,0.5 mM).
Discussion
This study examined the effects of variability in six transmem-
brane current conductances on rabbit ventricular AP repolarisa-
tion (represented by APD). This was accomplished by performing
a systematic exploration of the multi-dimensional parameter space
using distributed computing software with two biophysically-
detailed computational models of the rabbit ventricular AP. The
results were used to determine a population of models that
reproduced experimentally reported intercellular variability in
APD at a variety of CLs. It was shown that the populations of
models were able to produce physiological ventricular APs with a
wide range of conductance values. Specialised techniques for
visualisation of the multi-dimensional spaces revealed interaction
of individual current conductances, as well as their relative
importance for APD. It was demonstrated that this interaction and
influence, as well as biomarker variability, were rate- and model-
dependent. Specifically, with the Shannon model, gCa,L had the
greatest influence on APD variability at both 400 and 1000 ms,
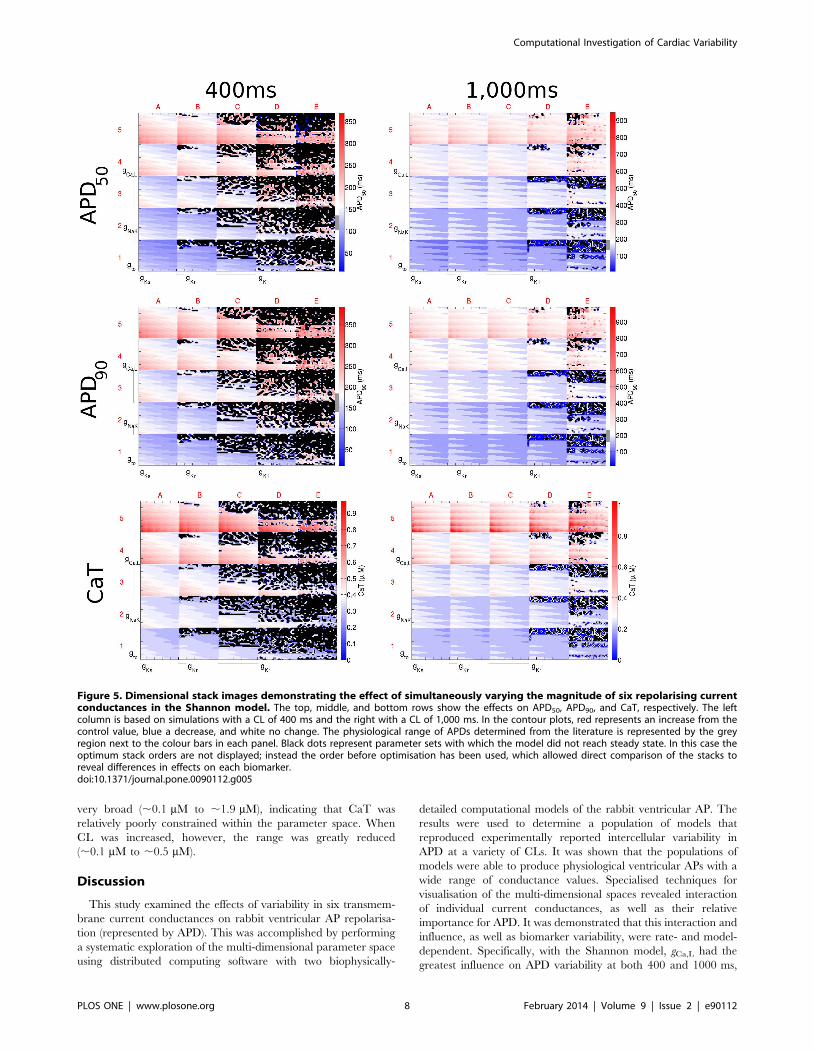
Figure 5. Dimensional stack images demonstrating the effect of simultaneously varying the magnitude of six repolarising currentconductances in the Shannon model. The top, middle, and bottom rows show the effects on APD50, APD90, and CaT, respectively. The leftcolumn is based on simulations with a CL of 400 ms and the right with a CL of 1,000 ms. In the contour plots, red represents an increase from thecontrol value, blue a decrease, and white no change. The physiological range of APDs determined from the literature is represented by the greyregion next to the colour bars in each panel. Black dots represent parameter sets with which the model did not reach steady state. In this case theoptimum stack orders are not displayed; instead the order before optimisation has been used, which allowed direct comparison of the stacks toreveal differences in effects on each biomarker.doi:10.1371/journal.pone.0090112.g005
Computational Investigation of Cardiac Variability
PLOS ONE | www.plosone.org 8 February 2014 | Volume 9 | Issue 2 | e90112
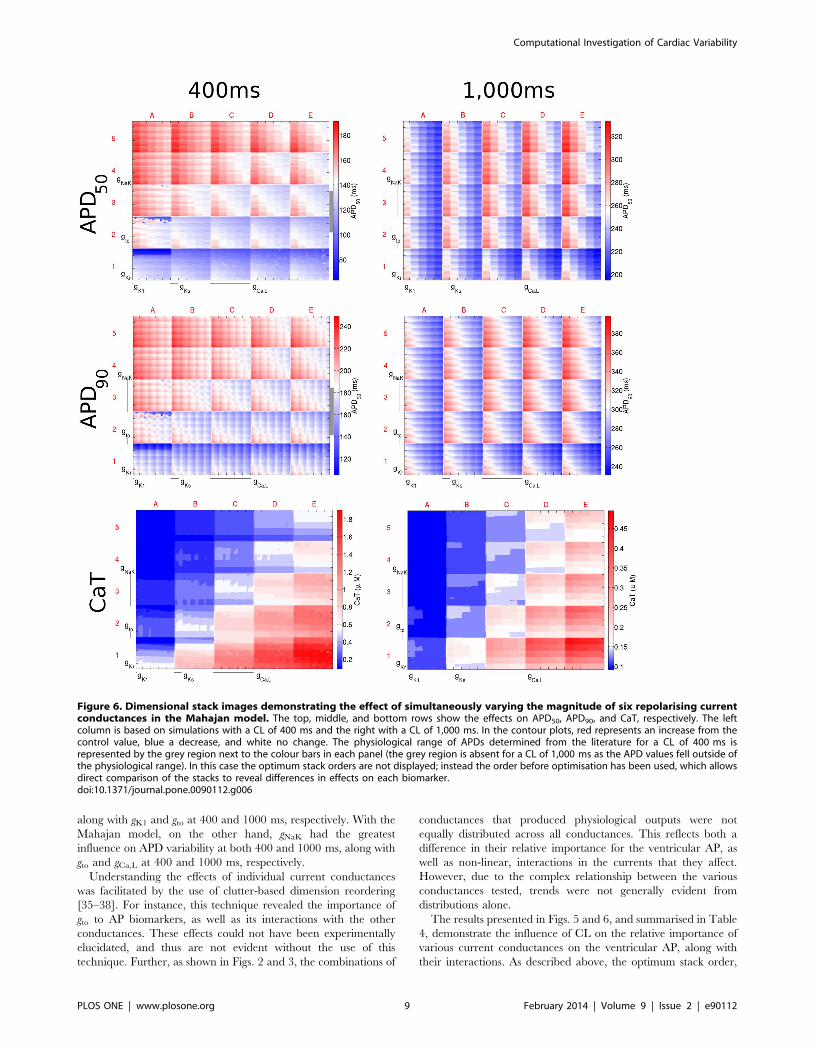
along with gK1 and gto at 400 and 1000 ms, respectively. With the
Mahajan model, on the other hand, gNaK had the greatest
influence on APD variability at both 400 and 1000 ms, along with
gto and gCa,L at 400 and 1000 ms, respectively.
Understanding the effects of individual current conductances
was facilitated by the use of clutter-based dimension reordering
[35–38]. For instance, this technique revealed the importance of
gto to AP biomarkers, as well as its interactions with the other
conductances. These effects could not have been experimentally
elucidated, and thus are not evident without the use of this
technique. Further, as shown in Figs. 2 and 3, the combinations of
conductances that produced physiological outputs were not
equally distributed across all conductances. This reflects both a
difference in their relative importance for the ventricular AP, as
well as non-linear, interactions in the currents that they affect.
However, due to the complex relationship between the various
conductances tested, trends were not generally evident from
distributions alone.
The results presented in Figs. 5 and 6, and summarised in Table
4, demonstrate the influence of CL on the relative importance of
various current conductances on the ventricular AP, along with
their interactions. As described above, the optimum stack order,
Figure 6. Dimensional stack images demonstrating the effect of simultaneously varying the magnitude of six repolarising currentconductances in the Mahajan model. The top, middle, and bottom rows show the effects on APD50, APD90, and CaT, respectively. The leftcolumn is based on simulations with a CL of 400 ms and the right with a CL of 1,000 ms. In the contour plots, red represents an increase from thecontrol value, blue a decrease, and white no change. The physiological range of APDs determined from the literature for a CL of 400 ms isrepresented by the grey region next to the colour bars in each panel (the grey region is absent for a CL of 1,000 ms as the APD values fell outside ofthe physiological range). In this case the optimum stack orders are not displayed; instead the order before optimisation has been used, which allowsdirect comparison of the stacks to reveal differences in effects on each biomarker.doi:10.1371/journal.pone.0090112.g006
Computational Investigation of Cardiac Variability
PLOS ONE | www.plosone.org 9 February 2014 | Volume 9 | Issue 2 | e90112

which is an indication of the relative importance of the individual
conductances to the AP and illustrates their interrelation, changed
with CL. Changes, however, were unpredictable. The most
extreme example of an unexpected change in the relative
importance of a conductance to the AP was the change seen for
the influence of gto on APD50 and APD90 with the Shannon model.
At a CL of 400 ms, gto was a low-order conductance (reflecting a
low importance), while at a CL of 1,000 ms, it became a high-
order conductance. The importance of some conductances, on the
other hand, changed little with CL. For instance, gCa,L was
consistently of high-order and gKs of low-order. The importance of
CL in determining the effects of current conductance variability on
AP biomarkers highlights the need to consider rate in experimen-
tal investigations, as well as for adequately constraining model
populations for computational studies of variability.
Previous efforts to relate variability in current conductances to
ventricular AP variability have focused on three approaches: i) the
inclusion of stochasticity in model formulations; ii) the use of
parameter sensitivity analyses; and iii) the generation of model
populations (as in the present paper). Regarding the use of
stochastic formulations, studies by Pueyo et al. [3] and Sato et al.
[8] have investigated the effect of stochastic gating of the slow
delayed rectifier K+ current on human, guinea pig, and rabbit
ventricular AP repolarisation, and studies by Tanskanen et al. [9]
and Hashambhoy et al. [5] have done the same for stochastic
gating of the L-type Ca2+ current and sarcoplasmic-reticulum
Ca2+ release in a canine model; these, however, considered
variability in no other currents. Lemay et al., on the other hand,
did include stochastic gating in multiple currents of a guinea pig
model, but this was a purely computational investigation, without
the use of experimental data for model constraint [6]. In a study by
Walmsley et al. stochasticity was included in the gating variables of
a phenomenological guinea pig ventricular AP model, though this
did not allow for consideration of the effects of specific currents
[4]. Examples of the use of parameter sensitivity analysis come
from studies by Romero et al. [11,12] that investigated the role of
ionic current variability on biomarkers in human and rabbit
models, yet these were limited as they focused on variation of only
one current at a time, missing potential important current
interactions. Work by Sarkar and Sobie. has employed a
combination of sensitivity analysis and model populations with
human and canine models, but this work was restricted to random
sampling of a narrow parameter space close to the control model
conditions [13,14,19]. A population of 19 canine models was
utilised by Davies et al. to capture variability of the canine
ventricular AP, however this represents only a small population
[16]. Thus, there remains the need for investigations of the effects
of simultaneous variation of current conductances on ventricular
repolarisation over the entire physiological range.
This was recently addressed for the rabbit Purkinje AP by
Britton et al. [15]. In this study, a methodology was developed to
simulate the complete range of observed AP variability by
randomly varying current conductances and channel kinetics
across a wide range of values. By reducing the resulting population
of over 10,000 models down to 213 using experimental data, it was
shown that a wide range of parameter values could produce a
physiological Purkinje AP. Interestingly, while the results from that
study demonstrated non-uniform distributions of some current
conductance across the population of models, as in the present
work, they did not show any obvious relationships between
currents by pair-wise correlation analysis. This is in contrast to the
current study, in which important interactions between currents
were revealed by projecting the multi-dimensional parameter
space onto a two-dimensional representation using clutter-based
dimension reordering [35–38]. This re-emphasises the power of
this technique, as previously shown in neuroscience applications
[59–62], for revealing unsuspected compensatory mechanisms that
may contribute to normal cellular function. Differences in
outcomes of the two studies may relate to other important
methodological factors, such as effects of generating model
populations by random (as in Britton et al.) versus systematic (as
in the current study) sampling of the parameter space. The study
by Britton et al. employed the Latin hypercube sampling method
[63], which generates parameter sets without bias, but only
provides a random subset of the entire parameter space, while the
present work utilised the Nimrod/G distributed computing grid
platform [32,34] to perform a systematic exploration of the
complete parameter space. Finally, it should be noted that
dissimilarities may also represent differences between Purkinje
and ventricular electrophysiology and their model representations.
While the results presented here suggest that variation in
current conductances over a wide range of values may account for
normal variability in rabbit ventricular AP repolarisation, other
factors may be involved. One of the underlying assumptions of this
study was that AP variability is primarily a result of differences in
the relative magnitude of currents, rather than underlying current
dynamics, which were not varied. Changes in channel properties
other than conductance could result in similar changes in AP
biomarkers and also account for some of the experimentally
observed variability. A study by Romero et al., in which a one-
dimensional sensitivity analysis of the rabbit-specific models used
in this study was performed with a similar range of parameter
variation, showed that along with repolarisation currents, APD
was significantly modified by changes in the activation and
inactivation rates of the associated channels [11]. At the same
time, further constraints to the model populations (for example
matching of rate-adaption or restitution properties), as well as
consideration of additional biomarkers (for instance relating to
intracellular ion concentrations), may be necessary to ensure their
applicability to additional physiological states. This has been
recently demonstrated in a study by Walmsley et al., in which
Table 4. Optimum stack order for APD50, APD90, and CaTwith the two rabbit-specific ventricular AP models.
Optimum Stack Order (x, y)
Model Biomarker CL (ms) Low OrderRHigh Order
Shannon APD50 400 (gto, gKs) (gNaK, gKr) (gCa,L, gK1)
1,000 (gK1, gKs) (gNaK, gKr) (gCa,L, gto)
APD90 400 (gto, gKs) (gNaK, gKr) (gCa,L, gK1)
1,000 (gK1, gKs) (gNaK, gKr) (gCa,L, gto)
CaT 400 (gK1, gKs) (gNaK, gto) (gCa,L, gKr)
1,000 (gK1, gKs) (gNaK, gKr) (gCa,L, gto)
Mahajan APD50 400 (gKr, gK1) (gKs, gCa,L) (gto, gNaK)
1,000 (gKr, gK1) (gto, gCa,L) (gKs, gNaK)
APD90 400 (gKr, gCa,L) (gK1, gKs) (gto, gNaK)
1,000 (gKr, gK1) (gKs, gto) (gCa,L, gNaK)
CaT 400 (gKr, gK1) (gto, gKs) (gNaK, gCa,L)
1,000 (gKr, gK1) (gKs, gto) (gNaK, gCa,L)
Each pair of parameters represents low, medium, or high order currentconductances. For each pair, the first component is plotted on the x-axis andthe second component on the y-axis. The (x,y) order can be reversed withoutaffecting the result only if all (x,y) pairs are reversed.doi:10.1371/journal.pone.0090112.t004
Computational Investigation of Cardiac Variability
PLOS ONE | www.plosone.org 10 February 2014 | Volume 9 | Issue 2 | e90112
populations of failing and non-failing human ventricular myocytes
with variation in current conductances were compared using
various biomarkers at numerous CLs to investigate which currents
drive variability in the two cell populations [64]. Finally, as the
range and resolution of parameter space sampling in the present
study was limited by computational tractability, there may be
additional influences and interactions of current conductances
important for ventricular AP variability that were not appreciated.
As mentioned above, it is not possible to assess the physiological
ranges of the current conductances investigated in this study, so
that they may be related to the values included in the calibrated
populations of models. We initially varied all conductances by
630%, yet it was necessary with the Mahajan model to expand
this range to generate a physiological output. Other computational
studies have used a larger range of conductances than in the
present study ([14–16]), possibly representing the true physiolog-
ical range of values, and supporting the expanded range used with
the Mahajan model.
While providing insights into rabbit ventricular AP variability,
the present study also represents an evaluation of the two most
commonly used rabbit-specific ventricular AP models. As has been
shown previously by Romero et al. [11], the effects and relative
importance of current conductance variation in the present study
were largely model-dependent. Also, while the models produced a
physiological output with their original parameter set under the
conditions for which they were designed, when CL was varied this
was not the case. These rate and model-dependent differences
highlight the importance of careful model selection, validation,
and appropriate use for computational studies [65,66].
In summary, we have demonstrated that experimentally
observed intercellular variability of the rabbit ventricular AP can
be reproduced by a population of computational models that
includes large variations in current conductances important for
repolarisation. Importantly, this work moved beyond previous
investigations of ventricular repolarisation variability by a system-
atic exploration of the multi-dimensional conductance space with
the use of distributed computing software and specialised
visualisation techniques. This represents a robust method for
investigating the interaction of current conductances and their
relative importance to the ventricular AP, an important step
towards a better understanding of intercellular variability in
ventricular repolarisation. Importantly, this can only be achieved
using a combination of advanced computational modelling and
experimental calibration. In the future, similar model populations
Figure 7. Histograms showing the range of APD50, APD90, and CaT in the model populations. The value generated with the controlparameter set for each model is indicated by the arrow. The physiological range of APD50 and APD90 derived from the literature are represented bythe boxed area.doi:10.1371/journal.pone.0090112.g007
Computational Investigation of Cardiac Variability
PLOS ONE | www.plosone.org 11 February 2014 | Volume 9 | Issue 2 | e90112
may be applied to tissue and organ level studies of diseased states
to better understand the role of intercellular repolarisation
variability in the generation of ventricular arrhythmias.
Acknowledgments
The authors would like to thank Dr Alberto Corrias, Dr David Abramson,
and Monash University for providing and assisting in the use of their
Nimrod/G software, as well as for providing computational resources to
perform this work.
Author Contributions
Conceived and designed the experiments: PG KB BR TAQ. Performed the
experiments: PG. Analyzed the data: PG. Wrote the paper: PG KB BR
TAQ. Performed the simulations and analysed the data: PG. Interpreted
the data: PG KB BR TAQ. Drafted the paper: PG. Critically revised the
paper: KB BR TAQ. Approved the final version of the manuscript: PG KB
BR TAQ.
References
1. Carusi A, Burrage K, Rodriguez B (2012) Bridging experiments, models and
simulations: an integrative approach to validation in computational cardiac
electrophysiology. Am J Physiol Heart Circ Physiol 303: H144–155.
2. Quinn TA, Kohl P (2013) Combining wet and dry research: experience with
model development for cardiac mechano-electric structure-function studies.
Cardiovasc Res 97: 601–611.
3. Pueyo E, Corrias A, Virag L, Jost N, Szel T, et al. (2011) A multiscale
investigation of repolarization variability and its role in cardiac arrhythmogen-
esis. Biophys J 101: 2892–2902.
4. Walmsley J, Mirams G, Bahoshy M, Bollensdorff C, Rodriguez B, et al. (2010)
Phenomenological modeling of cell-to-cell and beat-to-beat variability in isolated
Guinea Pig ventricular myocytes. Conf Proc IEEE Eng Med Biol Soc 2010:
1457–1460.
5. Hashambhoy YL, Winslow RL, Greenstein JL (2011) CaMKII-dependent
activation of late INa contributes to cellular arrhythmia in a model of the cardiac
myocyte. Conf Proc IEEE Eng Med Biol Soc 2011: 4665–4668.
6. Lemay M, de Lange E, Kucera JP (2011) Effects of stochastic channel gating and
distribution on the cardiac action potential. J Theor Biol 281: 84–96.
7. Ponard JG, Kondratyev AA, Kucera JP (2007) Mechanisms of intrinsic beating
variability in cardiac cell cultures and model pacemaker networks. Biophys J 92:
3734–3752.
8. Sato D, Xie LH, Sovari AA, Tran DX, Morita N, et al. (2009) Synchronization
of chaotic early afterdepolarizations in the genesis of cardiac arrhythmias. Proc
Natl Acad Sci U S A 106: 2983–2988.
9. Tanskanen AJ, Greenstein JL, O’Rourke B, Winslow RL (2005) The role of
stochastic and modal gating of cardiac L-type Ca2+ channels on early after-
depolarizations. Biophys J 88: 85–95.
10. Corrias A, Giles W, Rodriguez B (2011) Ionic mechanisms of electrophysiolog-
ical properties and repolarization abnormalities in rabbit Purkinje fibers. Am J
Physiol Heart Circ Physiol 300: H1806–1813.
11. Romero L, Carbonell B, Trenor B, Rodriguez B, Saiz J, et al. (2011) Systematic
characterization of the ionic basis of rabbit cellular electrophysiology using two
ventricular models. Prog Biophys Mol Biol 107: 60–73.
12. Romero L, Pueyo E, Fink M, Rodriguez B (2009) Impact of ionic current
variability on human ventricular cellular electrophysiology. Am J Physiol Heart
Circ Physiol 297: H1436–1445.
13. Sarkar AX, Sobie EA (2011) Quantification of repolarization reserve to
understand interpatient variability in the response to proarrhythmic drugs: a
computational analysis. Heart Rhythm 8: 1749–1755.
14. Sobie EA (2009) Parameter sensitivity analysis in electrophysiological models
using multivariable regression. Biophys J 96: 1264–1274.
15. Britton OJ, Bueno-Orovio A, Van Ammel K, Lu HR, Towart R, et al. (2013)
Experimentally calibrated population of models predicts and explains intersub-
ject variability in cardiac cellular electrophysiology. Proc Natl Acad Sci U S A
110: E2098–2105.
16. Davies MR, Mistry HB, Hussein L, Pollard CE, Valentin JP, et al. (2012) An in
silico canine cardiac midmyocardial action potential duration model as a tool for
early drug safety assessment. Am J Physiol Heart Circ Physiol 302: H1466–1480.
17. Gemmell P, Burrage K, Rodriguez B, Quinn T (2010) Exploring the parameter
space of a rabbit ventricular action potential model to investigate the effect of
variation on action potential and calcium transients. Conf Proc IEEE Eng Med
Biol Soc 2010: 2662–2665.
18. Maltsev VA, Lakatta EG (2013) Numerical models based on a minimal set of
sarcolemmal electrogenic proteins and an intracellular Ca(2+) clock generate
robust, flexible, and energy-efficient cardiac pacemaking. J Mol Cell Cardiol 59:
181–195.
19. Sarkar AX, Christini DJ, Sobie EA (2012) Exploiting mathematical models to
illuminate electrophysiological variability between individuals. J Physiol 590:
2555–2567.
20. Hinterseer M, Beckmann BM, Thomsen MB, Pfeufer A, Ulbrich M, et al. (2010)
Usefulness of short-term variability of QT intervals as a predictor for electrical
remodeling and proarrhythmia in patients with nonischemic heart failure. Am J
Cardiol 106: 216–220.
21. Hondeghem LM, Carlsson L, Duker G (2001) Instability and triangulation of the
action potential predict serious proarrhythmia, but action potential duration
prolongation is antiarrhythmic. Circulation 103: 2004–2013.
22. Johnson DM, Heijman J, Pollard CE, Valentin JP, Crijns HJ, et al. (2010) I(Ks)
restricts excessive beat-to-beat variability of repolarization during beta-
adrenergic receptor stimulation. J Mol Cell Cardiol 48: 122–130.
23. Myles RC, Burton FL, Cobbe SM, Smith GL (2008) The link between
repolarisation alternans and ventricular arrhythmia: does the cellular phenom-
enon extend to the clinical problem? J Mol Cell Cardiol 45: 1–10.
24. Thomsen MB, Verduyn SC, Stengl M, Beekman JD, de Pater G, et al. (2004)
Increased short-term variability of repolarization predicts d-sotalol-induced
torsades de pointes in dogs. Circulation 110: 2453–2459.
25. Myles RC, Bernus O, Burton FL, Cobbe SM, Smith GL (2010) Effect of
activation sequence on transmural patterns of repolarization and action potential
duration in rabbit ventricular myocardium. Am J Physiol Heart Circ Physiol
299: H1812–1822.
26. Cheng Y, Mowrey KA, Nikolski V, Tchou PJ, Efimov IR (2002) Mechanisms of
shock-induced arrhythmogenesis during acute global ischemia. Am J Physiol
Heart Circ Physiol 282: H2141–2151.
27. Ripplinger CM, Lou Q, Li W, Hadley J, Efimov IR (2009) Panoramic imaging
reveals basic mechanisms of induction and termination of ventricular
tachycardia in rabbit heart with chronic infarction: implications for low-voltage
cardioversion. Heart Rhythm 6: 87–97.
28. Chou CC, Zhou S, Hayashi H, Nihei M, Liu YB, et al. (2007) Remodelling of
action potential and intracellular calcium cycling dynamics during subacute
myocardial infarction promotes ventricular arrhythmias in Langendorff-perfused
rabbit hearts. J Physiol 580: 895–906.
29. Morita N, Sovari AA, Xie Y, Fishbein MC, Mandel WJ, et al. (2009) Increased
susceptibility of aged hearts to ventricular fibrillation during oxidative stress. Am
J Physiol Heart Circ Physiol 297: H1594–1605.
30. Burton RA, Schneider JE, Bishop MJ, Hales PW, Bollensdorff C, et al. (2012)
Microscopic magnetic resonance imaging reveals high prevalence of third
coronary artery in human and rabbit heart. Europace 14 Suppl 5: v73–v81.
31. Dutta S, Bishop MJ, P P, Lee P, Kohl P, et al. (2011) Interpreting optical
mapping recordings in the ischemic heart: a combined experimental and
computational investigation. In: Metaxas DN, Axel L, editors. Functional
Imaging and Modeling of the Heart. Berlin Heidelberg: Springer. pp. 20–27.
32. Abramson D, Giddy J, Kotler L. High performance parametric modeling with
Nimrod/G: killer application for the global grid? In: Proceedings of the 14th
International Parallel and Distributed Processing Symposium; 2000 1–5 May;
Cancun, Mexico. Insitute of Electrical and Electronics Engineers, Inc. pp. 520–
528.
33. Abramson D, Bethwaite B, Enticott C, Garic S, Peachey T (2011) Parameter
exploration in science and engineering using many-task computing. IEEE Trans
Parallel Distrib Syst 22: 960–973.
34. Abramson D, Bernabeu MO, Bethwaite B, Burrage K, Corrias A, et al. (2010)
High-throughput cardiac science on the Grid. Philos Trans A Math Phys Eng
Sci 368: 3907–3923.
35. Peng W (2005) Clutter-based dimension reordering in multi-dimensional data
visualization [MSc Thesis]. Worcester, MA, USA: Worcester Polytechnic
Institute. 82 p.
36. Peng W, Ward MO, Rundensteiner EA. Clutter reduction in multi-dimensional
data visualization using dimension reordering. In: Ward MO, Munzer T,
editors. Proceedings of the IEEE Symposium on Information Visualization,
2004; 2004 10–12 Oct; Austin, TX, USA. Insitute of Electrical and Electronics
Engineers, Inc. pp. 89–96.
37. Taylor AL, Hickey TJ, Prinz AA, Marder E (2006) Structure and visualization of
high-dimensional conductance spaces. J Neurophysiol 96: 891–905.
38. LeBlanc J, Ward MO, Wittels N. Exploring N-dimensional databases. In:
Kaufman A, editor. Proceedings of the First IEEE Conference on Visualization;
1990 23–26 Oct; San Francisco, CA, USA. Insitute of Electrical and Electronics
Engineers, Inc. pp. 230–237.
39. Shannon TR, Wang F, Puglisi J, Weber C, Bers DM (2004) A mathematical
treatment of integrated Ca dynamics within the ventricular myocyte. Biophys J
87: 3351–3371.
40. Mahajan A, Shiferaw Y, Sato D, Baher A, Olcese R, et al. (2008) A rabbit
ventricular action potential model replicating cardiac dynamics at rapid heart
rates. Biophys J 94: 392–410.
41. Nattel S, Duker G, Carlsson L (2008) Model systems for the discovery and
development of antiarrhythmic drugs. Prog Biophys Mol Biol 98: 328–339.
Computational Investigation of Cardiac Variability
PLOS ONE | www.plosone.org 12 February 2014 | Volume 9 | Issue 2 | e90112
42. Quinn TA, Granite S, Allessie MA, Antzelevitch C, Bollensdorff C, et al. (2011)
Minimum Information about a Cardiac Electrophysiology Experiment (MI-
CEE): standardised reporting for model reproducibility, interoperability, and
data sharing. Prog Biophys Mol Biol 107: 4–10.
43. Sims C, Reisenweber S, Viswanathan PC, Choi BR, Walker WH, et al. (2008)
Sex, age, and regional differences in L-type calcium current are important
determinants of arrhythmia phenotype in rabbit hearts with drug-induced long
QT type 2. Circ Res 102: e86–100.
44. Shannon TR, Wang F, Puglisi J, Weber C, Bers DM (2012) Correction. Biophys
J 102: 1996–2001.
45. Garny A, Noble D, Hunter PJ, Kohl P (2009) Cellular Open Resource (COR):
current status and future directions. Philos Trans A Math Phys Eng Sci 367:
1885–1905.
46. Biagetti MO, Quinteiro RA (2006) Gender differences in electrical remodeling
and susceptibility to ventricular arrhythmias in rabbits with left ventricular
hypertrophy. Heart Rhythm 3: 832–839.
47. Chen X, Cordes JS, Bradley JA, Sun Z, Zhou J (2006) Use of arterially perfused
rabbit ventricular wedge in predicting arrhythmogenic potentials of drugs. J
Pharmacol Toxicol Methods 54: 261–272.
48. Eckardt L, Haverkamp W, Gottker U, Madeja M, Johna R, et al. (1998)
Divergent effect of acute ventricular dilatation on the electrophysiologic
characteristics of d,l-sotalol and flecainide in the isolated rabbit heart. J
Cardiovasc Electrophysiol 9: 366–383.
49. Goldhaber JI, Xie LH, Duong T, Motter C, Khuu K, et al. (2005) Action
potential duration restitution and alternans in rabbit ventricular myocytes: the
key role of intracellular calcium cycling. Circ Res 96: 459–466.
50. Jung BC, Lee SH, Cho YK, Park HS, Kim YN, et al. (2011) Role of the
alternans of action potential duration and aconitine-induced arrhythmias in
isolated rabbit hearts. J Korean Med Sci 26: 1576–1581.
51. Kirchhof P, Degen H, Franz MR, Eckardt L, Fabritz L, et al. (2003)
Amiodarone-induced postrepolarization refractoriness suppresses induction of
ventricular fibrillation. J Pharmacol Exp Ther 305: 257–263.
52. Kurz RW, Mohabir R, Ren XL, Franz MR (1993) Ischaemia induced alternans
of action potential duration in the intact-heart: dependence on coronary flow,
preload and cycle length. Eur Heart J 14: 1410–1420.
53. McIntosh MA, Cobbe SM, Smith GL (2000) Heterogeneous changes in action
potential and intracellular Ca2+ in left ventricular myocyte sub-types fromrabbits with heart failure. Cardiovasc Res 45: 397–409.
54. Szigligeti P, Pankucsi C, Banyasz T, Varro A, Nanasi PP (1996) Action potential
duration and force-frequency relationship in isolated rabbit, guinea pig and ratcardiac muscle. J Comp Physiol B 166: 150–155.
55. Wu L, Ma J, Li H, Wang C, Grandi E, et al. (2011) Late sodium currentcontributes to the reverse rate-dependent effect of IKr inhibition on ventricular
repolarization. Circulation 123: 1713–1720.
56. Yan GX, Rials SJ, Wu Y, Liu T, Xu X, et al. (2001) Ventricular hypertrophyamplifies transmural repolarization dispersion and induces early afterdepolar-
ization. Am J Physiol Heart Circ Physiol 281: H1968–1975.57. Zabel M, Hohnloser SH, Behrens S, Woosley RL, Franz MR (1997) Differential
effects of D-sotalol, quinidine, and amiodarone on dispersion of ventricularrepolarization in the isolated rabbit heart. J Cardiovasc Electrophysiol 8: 1239–
1245.
58. Zabel M, Woosley RL, Franz MR (1997) Is dispersion of ventricularrepolarization rate dependent? Pacing Clin Electrophysiol 20: 2405–2411.
59. Marder E (2011) Variability, compensation, and modulation in neurons andcircuits. Proc Natl Acad Sci U S A 108 Suppl 3: 15542–15548.
60. Marder E, Taylor AL (2011) Multiple models to capture the variability in
biological neurons and networks. Nat Neurosci 14: 133–138.61. Prinz AA, Bucher D, Marder E (2004) Similar network activity from disparate
circuit parameters. Nat Neurosci 7: 1345–1352.62. Taylor AL, Goaillard JM, Marder E (2009) How multiple conductances
determine electrophysiological properties in a multicompartment model. JNeurosci 29: 5573–5586.
63. McKay MD, Beckman RJ, Conover WJ (1979) A comparison of three methods
for selecting values of input variables in the analysis of output from a computercode. Technometrics 21: 239–245.
64. Walmsley J, Rodriguez JF, Mirams GR, Burrage K, Efimov IR, et al. (2013)mRNA expression levels in failing human hearts predict cellular electrophys-
iological remodeling: a population-based simulation study. PLoS One 8: e56359.
65. Niederer SA, Fink M, Noble D, Smith NP (2009) A meta-analysis of cardiacelectrophysiology computational models. Exp Physiol 94: 486–495.
66. Quinn TA, Kohl P (2011) Systems biology of the heart: hype or hope? Ann N YAcad Sci 1245: 40–43.
Computational Investigation of Cardiac Variability
PLOS ONE | www.plosone.org 13 February 2014 | Volume 9 | Issue 2 | e90112
Copyright © 2022 FDOKUMEN