Comparative genomics reveals high biological diversity and ...
Upload
ucriversideCategory
view
2download
0
Population genomics of natural and experimentalpopulations of guppies (Poecilia reticulata)
BONNIE A. FRASER,* AXEL K €UNSTNER,*† ‡ DAVID N. REZNICK,§ CHRISTINE DREYER* and
DETLEF WEIGEL*
*Department of Molecular Biology, Max Planck Institute for Developmental Biology, Spemannstrasse 35, 72076 T€ubingen,
Germany, †Guest Group Evolutionary Genomics, Max Planck Institute for Evolutionary Biology, August-Thienemann-Str. 2,
24306 Pl€on, Germany, ‡Institute of Experimental Dermatology, University of L€ubeck, Ratzeburger Allee 160, 23538 L€ubeck,
Germany, §Department of Biology, University of California at Riverside, Riverside, CA 92521, USA
Abstract
Convergent evolution represents one of the best lines of evidence for adaptation, but
few cases of phenotypic convergence are understood at the genetic level. Guppies
inhabiting the Northern Mountain Range of Trinidad provide a classic example of
phenotypic convergent evolution, where adaptation to low or high predation environ-
ments has been found for a variety of traits. A major advantage of this system is the
possibility of long-term experimental studies in nature, including transplantation from
high to low predation sites. We used genome scans of guppies from three natural high
and low predation populations and from two experimentally established populations
and their sources to examine whether phenotypic convergent evolution leaves foot-
prints at the genome level. We used population-genetic modelling approaches to recon-
struct the demographic history and migration among sampled populations. Naturally
colonized low predation populations had signatures of increased effective population
size since colonization, while introduction populations had signatures of decreased
effective population size. Only a small number of regions across the genome had sig-
natures of selection in all natural populations. However, the two experimental popula-
tions shared many genomic regions under apparent selection, more than expected by
chance. This overlap coupled with a population decrease since introduction provides
evidence for convergent selection occurring in the two introduced populations. The
lack of genetic convergence in the natural populations suggests that convergent evolu-
tion is lacking in these populations or that the effects of selection become difficult to
detect after a long-time period.
Keywords: convergent evolution, genome scan, long-term field experiments, natural selection,
Poecilia reticulata
Received 21 August 2014; revision received 20 November 2014; accepted 25 November 2014
Introduction
Convergent evolution, where similar adaptive pheno-
types have independently arisen across similar environ-
mental contrasts or clines, provides some of the
strongest evidence for natural selection in the wild
(Arendt & Reznick 2008). Classic examples include sim-
ilar mouth morphology of cichlids in different lakes in
East Africa, similar body size and limb morphology in
Anolis lizards on different Caribbean islands, and lati-
tudinal clines of temperature tolerance in Drosophila
melanogaster [(Hoffmann et al. 2002), reviewed in (Sch-
luter 2000)]. With few exceptions, for example melanism
in rock and beach mice to match dark backgrounds
(Hoekstra 2006), we are ignorant about the genes that
underlie such convergence because of the difficulties
associated with identifying these genes by forward
genetics. The situation is currently changing, as the fac-
ile generation of large DNA variation data sets supportsCorrespondence: Bonnie A. Fraser, Fax: +49 7071 601 1412;
E-mail: [email protected]
© 2014 John Wiley & Sons Ltd
Molecular Ecology (2015) 24, 389–408 doi: 10.1111/mec.13022

genomewide scans for candidate loci that are undergo-
ing selection in similar environments. Genomewide
scans in multiple pairs of populations adapted to alter-
native environments have been used to identify conver-
gent evolution in a variety of systems, for example
three-spine stickleback [Gasterosteus aculeatus, (Hohen-
lohe et al. 2010; Jones et al. 2012)], groundsels [Senecio
spp., (Roda et al. 2013)], lake whitefish [Coregonus clu-
peaformis (Renaut et al. 2012)], sunflowers [Helianthus
spp. (Renaut et al. 2014)] and stick insects [Timema cristi-
nae (Soria-Carrasco et al. 2014)].
It remains to be seen how common genetic conver-
gent evolution is and what factors allow or hinder this
kind of repeated evolution. Many factors could influ-
ence the probability that the same genetic changes are
selected for independently, including population size,
gene flow and similarity of starting genetic variation
(Rosenblum et al. 2014). Rarely, however, do we know
how or if these factors vary within a single system
allowing researchers to test these predictions. Methods
are now available to reconstruct the demographic his-
tory of populations at the whole genome level [e.g.
(Gutenkunst et al. 2009; Li & Durbin 2011)], allowing
researchers to formally compare populations with dif-
ferent demographic and population histories. Timescale
is also important in detecting convergent genetic evolu-
tion because linkage disequilibrium between adaptive
and nonadaptive loci is expected to decrease with time
since the selective sweep (Barrett & Schluter 2008). This
is especially important when only a small portion of the
genome is surveyed, for example RAD-seq. Here, we
present the first study to use a genome-scan approach
in the guppy, Poecilia reticulata, one of the prime models
for micro-evolution and convergent evolution in verte-
brates. The guppy system offers a unique resource,
long-term experimental populations, which can provide
direct insight into the importance of population history
and timescale in detecting selection at the genetic level.
Guppies inhabiting the rivers in the Northern Range
Mountains of Trinidad display convergent adaptations
to life in different predator regimes. Rivers traversing
the mountain range are frequently punctuated by steep
waterfalls that exclude large piscivorous fishes from
upper reaches of the rivers. Only a single species of
small predatory fish is found above many such water-
falls. Because of the mountainous barriers between river
systems, guppy populations in headwater streams of
different rivers must have evolved independently from
one another, and there appears to be repeated and inde-
pendent adaptation to reduced predation in the tribu-
taries of each river. The rivers show population-genetic
separation (Barson et al. 2009; Suk & Neff 2009; Willing
et al. 2010), presumably because of limited gene flow
between them. The rivers draining the southern slopes
of these mountains reside in two major drainages: the
Caroni, which drains to the west, and the Oropuche,
which drains to the east. Populations from the Caroni
and Oropuche drainage have been shown to be diverg-
ing for some 600 000–1.2 million years (Carvalho et al.
1991; Fajen & Breden 1992; Alexander et al. 2006) and
are sufficiently different from one another to have been
named different species (Schories et al. 2009).
Investigators have documented several instances of
phenotypic convergent evolution in guppies from low
vs. high predation populations from different rivers.
Males in the low predation environments of upper
reaches tend to be more colourful than high predation
populations in the lower reaches, bearing a larger num-
ber of spots and larger individual spots (Endler 1980).
Populations in opposing predation regimes also differ
in several life history traits; in low predation popula-
tions, both males and females are larger and mature
later, and females give birth to larger and fewer young
(Reznick 1982; Reznick et al. 1996). Finally, behaviour
and swimming performance differ between predation
regimes; in low predation populations, both sexes are
less wary of predators (Kelley & Magurran 2003), shoal
less (Seghers 1974; Seghers & Magurran 1995), and
males rely more on courtship than sneaking when
attempting to mate (Houde 1997). Guppies from high
predation localities are less likely to be eaten by preda-
tors in experimental trials and have faster escape
responses than guppies from low predation localities
(O’Steen et al. 2002; Ghalambor et al. 2004). Many of
these phenotypes have been shown to be highly herita-
ble in laboratory studies, for example (Reznick 1982;
Reznick & Bryga 1996). Therefore, the guppy is an ideal
system to explore how phenotypic convergence is
reflected at the genetic level.
A major advantage in the guppy system is the
availability of long-term experimental populations,
where researchers have transferred fish from high
predation localities to streams, isolated by waterfalls,
that were previously free of both guppies and most
predators (e.g. Endler 1980). Long-term monitoring of
these experimental populations showed that guppies
have evolved towards phenotypes typical of low pre-
dation environments; they mature later, invest less in
reproduction, and are more colourful than their ances-
tral populations from high predation localities down-
stream. In some cases, adaptation after experimental
introduction has been shown to be quite rapid, occur-
ring within 4 years (approximately eight generations)
(Endler 1980; Reznick & Bryga 1987, 1996; Reznick
et al. 1990; O’Steen et al. 2002). These experimental
populations, therefore, provide researchers an oppor-
tunity to test predictions concerning genetic conver-
gent evolution by comparing them to naturally
© 2014 John Wiley & Sons Ltd
390 B. A. FRASER ET AL.

colonized populations that differ in their population
history and time since colonization.
Here, we present the first genome scan to examine
the convergent evolution in the guppy, using a RAD-
seq approach (Miller et al. 2007). This study builds on
recent examples of convergent evolution at the genetic
level using the unique attributes found in the guppy
system, that is largely independent replicates in pairs of
high and low predation environments in separate rivers
of known ancestral relationships and in situ experimen-
tal populations. By comparing putative signatures of
selection among many river pairs, we have the power
to delineate drift from selection. Additionally, we esti-
mated the demographic history and relatedness of each
natural and experimental high and low predation pair
to determine whether the likelihood of genetic conver-
gent evolution is related to these factors.
Materials and methods
Sampling
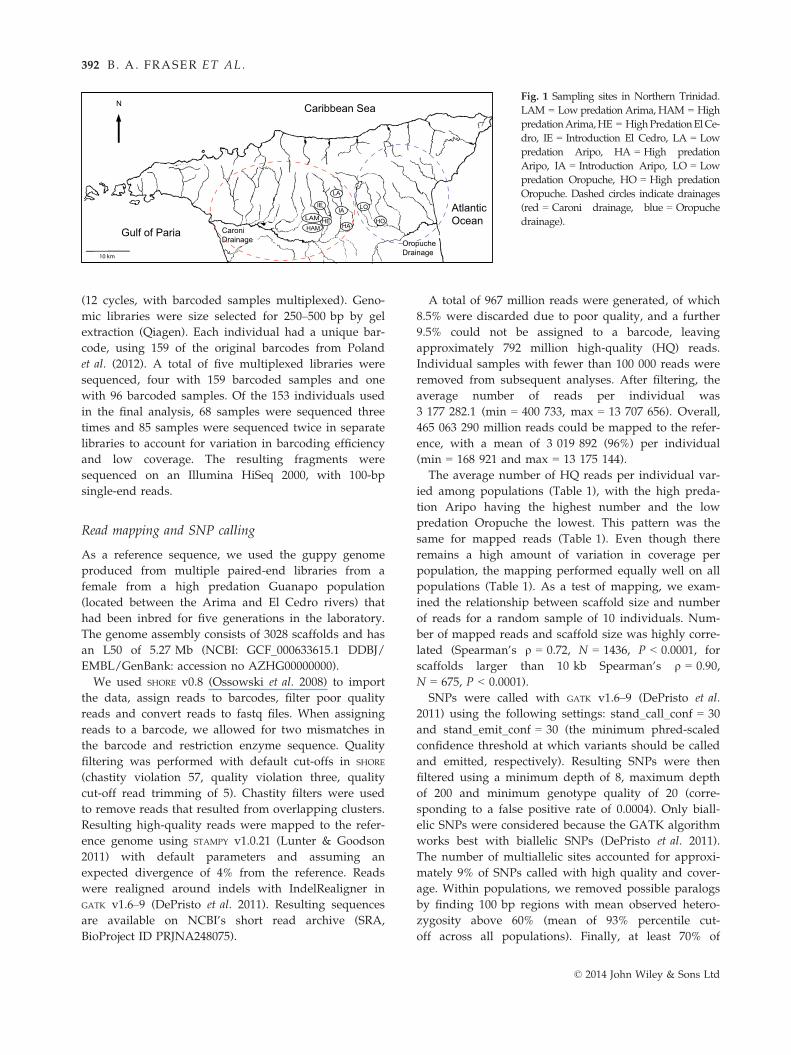
Fish were collected in February 2012 (Table 1 and
Fig. 1). Fish were caught with butterfly nets and eutha-
nized with MS222 and stored in 95% ethanol. This
study was performed in accordance to the Max Planck
Institute guidelines for treatment of animals. The three
natural population comparisons were chosen because
the differences in adaptive antipredator traits have been
well documented. Differences in amount of colour (En-
dler 1978, 1980), life history characteristics (Reznick &
Endler 1982; Reznick et al. 1996) and behaviour (O’Steen
et al. 2002) have been shown for each river pair. Also,
the populations have shown differences in predator
communities (Endler 1978; Reznick & Endler 1982).
Details about the Aripo and El Cedro introduction
experiments can be found in Endler (1980) and Reznick
& Bryga (1987), respectively. Briefly, approximately 200
individuals were introduced into the Aripo Introduction
site in 1976 from a high predation Aripo source, and
100 individuals were introduced into the El Cedro
Introduction site in 1981 from a high predation El Ce-
dro source, both with equal amounts of males and
females. Because female guppies can store sperm [as
many as nine sires per brood has been reported (Neff
et al. 2008)], the estimated founding census population
size is likely to be higher than the introduced number.
Both introduction sites were checked multiple times
before the introduction of high predation fish to deter-
mine that they were free of guppies and therefore
migration from natural populations is unlikely. Guppies
in the Aripo Introduction population were found to
show an increase in the number and size of orange,
black and iridescent colour spots (Endler 1980), while
guppies in the El Cedro Introduction population were
found to show an increase in iridescent coloration
(Kemp et al. 2009). Both populations showed differences
in life histories with males and females maturing later
and at larger sizes than their source populations (Rez-
nick & Bryga 1987; Reznick et al. 1990, 1997). In addi-
tion, the Aripo Introduction site fish evolved the
production of larger offspring and smaller litter sizes
early in life.
Sequencing
Genomic DNA was extracted from caudal peduncle tis-
sue using the DNeasy Blood and Tissue kit (Qiagen).
We genotyped each individual using a RAD-seq
method adapted from Poland et al. (2012) (Miller et al.
2007; Baird et al. 2008). Briefly, double-digested genomic
DNA (enzymes: PstI and MseI) was annealed with cut-
site-specific sequencing adaptors bearing individual
barcodes. Barcoded samples were amplified via PCR
Table 1 Summary of population samples
River Population N Grid reference Avg. HQ reads Avg. mapped reads HE
Arima HAM 14 PS 82000 686800 2 288 761 2 211 423 0.16
LAM 19 PS 1181500 687300 2 376 598 2 366 832 0.08
El Cedro HE 16 PS 1178900 689500 4 105 864 3 910 696 0.10
IE 20 PS 1179900 689500 3 495 089 3 328 987 0.05
Aripo HA 19 PS 1179500 6937000 4 782 516 4 564 046 0.14
LA 19 PS 1181900 692 900 4 130 695 3 936 416 0.11
IA 13 PS 1179900 693700 2 169 641 2 067 852 0.09
Oropuche HO 18 PS 1180900 697000 3 079 306 2 959 967 0.21
LO 15 QS 1178800 704100 1 128 363 1 082 971 0.18
For each population, we report the river, population ID (H = high predation, L = low predation, I = introduction to low predation
habitat), N = Number of individuals (after filtering for low coverage individuals), grid reference, (UTM 20 P), average number of
high quality reads (HQ) per individual, average number of mapped reads per individual and expected heterozygosity (HE).
© 2014 John Wiley & Sons Ltd
POPULATION GENOMICS OF GUPPY POPULATIONS 391
(12 cycles, with barcoded samples multiplexed). Geno-
mic libraries were size selected for 250–500 bp by gel
extraction (Qiagen). Each individual had a unique bar-
code, using 159 of the original barcodes from Poland
et al. (2012). A total of five multiplexed libraries were
sequenced, four with 159 barcoded samples and one
with 96 barcoded samples. Of the 153 individuals used
in the final analysis, 68 samples were sequenced three
times and 85 samples were sequenced twice in separate
libraries to account for variation in barcoding efficiency
and low coverage. The resulting fragments were
sequenced on an Illumina HiSeq 2000, with 100-bp
single-end reads.
Read mapping and SNP calling
As a reference sequence, we used the guppy genome
produced from multiple paired-end libraries from a
female from a high predation Guanapo population
(located between the Arima and El Cedro rivers) that
had been inbred for five generations in the laboratory.
The genome assembly consists of 3028 scaffolds and has
an L50 of 5.27 Mb (NCBI: GCF_000633615.1 DDBJ/
EMBL/GenBank: accession no AZHG00000000).
We used SHORE v0.8 (Ossowski et al. 2008) to import
the data, assign reads to barcodes, filter poor quality
reads and convert reads to fastq files. When assigning
reads to a barcode, we allowed for two mismatches in
the barcode and restriction enzyme sequence. Quality
filtering was performed with default cut-offs in SHORE
(chastity violation 57, quality violation three, quality
cut-off read trimming of 5). Chastity filters were used
to remove reads that resulted from overlapping clusters.
Resulting high-quality reads were mapped to the refer-
ence genome using STAMPY v1.0.21 (Lunter & Goodson
2011) with default parameters and assuming an
expected divergence of 4% from the reference. Reads
were realigned around indels with IndelRealigner in
GATK v1.6–9 (DePristo et al. 2011). Resulting sequences
are available on NCBI’s short read archive (SRA,
BioProject ID PRJNA248075).
A total of 967 million reads were generated, of which
8.5% were discarded due to poor quality, and a further
9.5% could not be assigned to a barcode, leaving
approximately 792 million high-quality (HQ) reads.
Individual samples with fewer than 100 000 reads were
removed from subsequent analyses. After filtering, the
average number of reads per individual was
3 177 282.1 (min = 400 733, max = 13 707 656). Overall,
465 063 290 million reads could be mapped to the refer-
ence, with a mean of 3 019 892 (96%) per individual
(min = 168 921 and max = 13 175 144).
The average number of HQ reads per individual var-
ied among populations (Table 1), with the high preda-
tion Aripo having the highest number and the low
predation Oropuche the lowest. This pattern was the
same for mapped reads (Table 1). Even though there
remains a high amount of variation in coverage per
population, the mapping performed equally well on all
populations (Table 1). As a test of mapping, we exam-
ined the relationship between scaffold size and number
of reads for a random sample of 10 individuals. Num-
ber of mapped reads and scaffold size was highly corre-
lated (Spearman’s q = 0.72, N = 1436, P < 0.0001, for
scaffolds larger than 10 kb Spearman’s q = 0.90,
N = 675, P < 0.0001).
SNPs were called with GATK v1.6–9 (DePristo et al.
2011) using the following settings: stand_call_conf = 30
and stand_emit_conf = 30 (the minimum phred-scaled
confidence threshold at which variants should be called
and emitted, respectively). Resulting SNPs were then
filtered using a minimum depth of 8, maximum depth
of 200 and minimum genotype quality of 20 (corre-
sponding to a false positive rate of 0.0004). Only biall-
elic SNPs were considered because the GATK algorithm
works best with biallelic SNPs (DePristo et al. 2011).
The number of multiallelic sites accounted for approxi-
mately 9% of SNPs called with high quality and cover-
age. Within populations, we removed possible paralogs
by finding 100 bp regions with mean observed hetero-
zygosity above 60% (mean of 93% percentile cut-
off across all populations). Finally, at least 70% of
CaroniDrainage Oropuche
Drainage
Caribbean Sea
Gulf of Paria
AtlanticOcean
10 km
N
LAM
HAMHE
IE
LA
IA
HA
LO
HO
Fig. 1 Sampling sites in Northern Trinidad.
LAM = Low predation Arima, HAM = High
predationArima,HE = HighPredationElCe-
dro, IE = Introduction El Cedro, LA = Low
predation Aripo, HA = High predation
Aripo, IA = Introduction Aripo, LO = Low
predation Oropuche, HO = High predation
Oropuche. Dashed circles indicate drainages
(red = Caroni drainage, blue = Oropuche
drainage).
© 2014 John Wiley & Sons Ltd
392 B. A. FRASER ET AL.

individuals within each population needed to be geno-
typed at a given SNP and a minor allele frequency of
above 0.01 within river to include it in subsequent
analysis. Filtering and summary statistics were calcu-
lated using VCFTOOLS v0.1.9 (Danecek et al. 2011) or cus-
tom R (v3.0.0) or PERL (v5.12.3) scripts.
Population structure analysis
We used STRUCTURE v2.3 (Pritchard et al. 2000) to esti-
mate the population-genetic clusters in our data. For
this analysis, we considered only SNPs represented in
all populations by at least 10 individuals and a minor
allele frequency of 0.01 within river and were separated
by 10 kb to be ‘unlinked’, when SNPs were within
10 kb of each other the most polymorphic SNP was
chosen. We used a burn-in of 10 000, followed by
another 10 000 MCMC steps. We assumed an admix-
ture model and correlated allele frequencies with no
prior information. We estimated lambda, with the maxi-
mum cluster (K) equal to 1 (lambda = 0.46). Then, we
estimated the most likely number of clusters by estimat-
ing the maximum likelihood for K = 2–9. We ran each
cluster option five times. The most likely number of
clusters was determined by finding the region where
the likelihood reached a plateau and did not vary
among replicate runs, for example (Evanno et al. 2005).
The resulting graphical display was created in DISTRUCT
v1.1 (Rosenberg 2004). A neighbour-joining unrooted
tree based on Nei’s distance and a PCA was calculated
to summarize population structure using the R package
ADEGENET v1.3–9 on the same SNP set (Jombart 2008).
Here, missing data were replaced with the mean SNP
frequency (Jombart 2008).
Demographic analysis
We inferred within-river population history using the
joint allele frequency spectrum (AFS) diffusion based
approach implemented in oaoi (Gutenkunst et al. 2009).
For each pairwise comparison, we projected the data set
to 10 (averaging over all possible resamplings of the lar-
ger sample size) for each population pair. This was to
minimize missing data in the allele frequency matrix
but to maximize the number of segregating sites (Gut-
enkunst et al. 2009). The number of segregating sites
ranged from 933.5 to 2429 (mean = 1635.6) depending
on the pair analysed. We used the isolation migration
model provided by oaoi, with the slight modification
that founding populations were estimated indepen-
dently, instead of estimating the size of population 1 as
‘s’ and the size of population 2 as ‘s-1’. This modifica-
tion was necessary because low predation populations
had extremely small sizes compared to high predation
populations causing these parameters to be estimated at
their boundaries of 1 and 0, which is problematic for
exploring likelihood space. The parameters estimated
were founding effective population size of the high and
low predation populations, the current effective popula-
tion size of both populations, time at which the popula-
tions split and migration between both populations.
Times are given in 2Nref generations, migration in 2Nref
Mij, and sizes are relative to Nref.
We used a nested model to determine whether migra-
tion between populations was likely, first fixing both
migration estimates to 0, then migration of high to low
predation to 0 (upstream migration is considered to be
less likely) and then allowing migration between both
sites. Significance of model fit was made with log-likeli-
hood ratio tests. We used the log_fmin optimizer, bounds
of parameters were at least 10 times higher than what
was estimated, and the maxiter was set to 20. Optimiza-
tion runs always began by first perturbing the starting
parameters by onefold to ensure that independent runs
converged on similar values, and grid sizes were much
higher than sample sizes (grid sizes = 40 60 80). To esti-
mate parameters we used conventional bootstrapping
(fitting 100 data sets resampled over the loci), we report
the median and 5 and 95% percentiles.
We decided that for two river analyses, the El Cedro
and Arima, a 2-population model did not adequately
reflect the population history because of admixture
from outside rivers as determined in the STRUCTURE
analysis. For these two cases, we used a similar popula-
tion model but with a 3rd ‘ghost’ or unsampled popula-
tion to represent the entire metapopulation of the
Northern Mountain Range guppies. Here, the parameter
estimates were similar to the 2-population model but
with a prior time of split between the high predation
and ghost population, and migration between the ghost
and high predation population.
To compare among models, we converted time at
split into years and effective population size of the low
predation population into numbers of individuals. To
do so, we obtained Nref from theta (theta = 4NreflLeff,
where l is the mutation rate, and Leff is the effective
length of the genomic region used). We used a muta-
tion rate of 4.8 9 10�8 (estimated through genotyping
parental and F1 SNPs, A. K€unstner, M. Hoffmann, B. A.
Fraser, V. A. Kottler, E. Sharma, D. Weigel & C. Dreyer,
unpubl. data), effective sequence length of 233 013 bp
(corresponding to 3377 RAD-seq tags of 69 bp) and two
generations per year (Reznick et al. 1997).
Outlier analysis
We used an FST window outlier approach to detect
regions undergoing divergent selection between paired
© 2014 John Wiley & Sons Ltd
POPULATION GENOMICS OF GUPPY POPULATIONS 393

high and low predation populations. Here, each pair-
wise comparison within river was considered (nine
populations, five pairwise comparisons). We also mea-
sured overall FST by comparing pooled groups [all natu-
ral low predation populations vs. all high predation
populations, for example (Axelsson et al. 2013)]. We
adapted the methods of Hohenlohe et al. (2010) to
detect outliers in FST, with the modification of removing
the kernel-smoothing algorithm. This was to avoid non-
independence among windows, needed to use a chi-
squared test used to test significance of overlap between
comparisons. We used Weir and Cockerham’s FST esti-
mate (Weir & Cockerham 1984). Significance was deter-
mined using a bootstrapping approach, where SNPs
were bootstrapped 10 000 times and outliers were iden-
tified if their FST occurred within the upper 95% or 99%
of bootstrapped values. We report analyses that
employed a 150 kb window size. Different window
sizes were assessed, and we found that the divergent
regions of the genome did not vary with these numbers
within population comparison. We found that a win-
dow size of 150 kb limited the variation of windows
assayed and SNP density among different river compari-
sons. Significant difference in allele frequency within river
at individual SNPs was determined using a G-statistic
test, with an FDR P < 0.05 (Hohenlohe et al. 2010).
We tested for independence among outlier lists using
chi-squared tests. For the multidimensional chi-squared
test, we only evaluated windows that were covered in
all populations. A Venn diagram was created using the
R package gplots. We next compared outlier lists to test
specific predictions about convergent evolution. If simi-
larity in standing genetic variation were related to the
repeatability of evolution, we expected that the overlap
among outlier lists would reflect the similarity across
the entire genome and geographical proximity. If, how-
ever, population history or timescale are more impor-
tant in detecting convergent evolution, we expected
different degrees of overlap between introduction and
natural populations. We tested for independence
between any two outlier lists using a chi-squared test
and using all assayed windows within the comparison.
Methods concerning the distribution and genomic attri-
butes of the outlier windows can be found in the sup-
plementary materials. We also evaluated individual
SNP FST, extracting the set of SNPs above the 95% FSTquantile for each river pair. Then, the overlap of these
SNPs was evaluated using a chi-squared test as with
the window analysis.
To investigate whether allele frequencies at any indi-
vidual SNP loci correlated with predation environment,
we used the programme BAYENV2, which accounts for
overall population relationships (G€unther & Coop
2013). We chose this approach over other FST outlier
methods because it has been shown to be robust to false
positives in populations with recent range expansions
(Lotterhos & Whitlock 2014). The covariance matrix was
estimated from the ‘nonlinked’ SNP set used in the
STRUCTURE analysis and was calculated by averaging
over 10 random iterations sampled after an initial
50 000 iterations. The individual SNP matrices were
then correlated to a standardized environmental matrix
(populations with high predation coded as 1 and those
with low predation as 0) with 100 000 iterations. Outlier
SNPs were identified as those with a Bayes factor of
above 20, rho of above 0.4 and minor allele frequency
of above 0.01 within river pair.
Annotations
Annotations were obtained for regions of interest
from gene model predictions from guppy reference
genome (A. K€unstner, M. Hoffmann, B. A. Fraser, V. A.
Kottler, E. Sharma, D. Weigel & C. Dreyer, unpubl.
data, NCBI ascension: GCF_000633615.1). We evaluated
enrichment of functional classes in specific contrasts
using Gene Ontology classification. GO IDs for gene
models in the reference database were derived using
Blast2Go (Conesa & G€otz 2008). We evaluated overrep-
resentation of biological process ontologies using the
topGo package. To account for correlation in the GO
graph topology, we used the elim algorithm, which
eliminates genes from ancestor terms if they are signifi-
cantly enriched in a child term. We report those with a
P < 0.05 and enrichment of at least 3.
Results
We used RAD-seq for genomewide genotyping of nine
populations found in the Northern Range Mountains of
Trinidad (Fig. 1 and Table 1), with approximately equal
numbers of males and females from each population,
for a total of 153 individuals. After SNP filtering, we
were able to evaluate 7757 SNP loci from at least 70%
of individuals in all populations (corresponding to 3801
loci more than 10 kb apart). As expected (Lynch 2007),
there were more transitions (5066) than transversions
(2691). For within-river pairwise population compari-
sons, we had information on an average of 45 535 SNPs
(min = 13 285 in Oropuche and max = 83 066 in Aripo,
Table S1, Supporting information).
Population structure
High predation populations had a significantly higher
expected heterozygosity (HE) than their low predation
counterparts (Table 1, paired t-tests across loci for all
pairs of populations; all P < 0.0001). The largest
© 2014 John Wiley & Sons Ltd
394 B. A. FRASER ET AL.

difference in HE was found between the Arima popula-
tions, probably due to admixture from other popula-
tions found in the high predation Arima (discussed
below). The highest diversity was found in the high
predation population found in the Oropuche
(HE = 0.21) and the lowest in the El Cedro introduction
(HE = 0.05). Populations within a river were more
related than populations between rivers (Table S2, Sup-
porting information). Populations from different rivers
and from the Caroni vs. Oropuche drainages were more
distantly related to one another than those from within
the same river (Table S2, Supporting information).
STRUCTURE analysis revealed that the most likely num-
ber of clusters was four (Fig. 2A and Fig. S1, Support-
ing information). In general, clusters were in agreement
with geography. Three of the clusters are from the
Caroni drainage and the other one from the Oropuche
drainage. Within the Caroni drainage, the three clusters
distinguish between the El Cedro, Arima and Aripo
River populations. High predation populations, found
in the lower stretches of each river, showed more evi-
dence of admixture than low predation populations, as
evident by individuals with a probability of <90% of
belonging to a single cluster (Table S3, Supporting
information). The highest amount of admixture was
found in the high predation Arima, where evidence of
admixture is visible in all individuals from many differ-
ent clusters. We also found four individuals from the El
Cedro high predation population to have evidence of
admixture with the Arima populations (Table S3, Sup-
porting information). Similar groupings were obtained
with the neighbour-joining tree (Fig. 2B) and PCA (Fig.
S2, Supporting information).
Demographic analysis
We estimated demographic parameters within the five
river pairs using a joint allele frequency spectrum (AFS)
diffusion approach (Table 2a). First, we used a nested-
model approach to determine whether migration
between high predation and low predation populations
was likely (Table S4, Supporting information). No
migration was likely between the populations in the
Oropuche River, nor between the Aripo and El Cedro
Introduction populations with their source sites. Migra-
tion downstream (low predation to high predation) was
likely within the Arima River, and migration both
upstream and downstream was likely in the Aripo
River. In the Aripo River, the estimate for low preda-
tion to high predation migration was five times higher
than high predation to low predation migration.
We estimated population parameters by bootstrap-
ping the data over all loci (Table 2a). Among the natu-
rally colonized populations, the Aripo populations had
the oldest divergence time, while the Oropuche popula-
tions had the youngest. Estimates of population split
in the two introduced population were slightly
shorter than the actual times of the events (estimate of
10–24 years ago for the Aripo Introduction [actual
36 years] and 8–30 years ago for El Cedro Introduction
[actual 31 years]).
The ancestral and current effective population sizes
were approximately the same in the Oropuche and
Aripo high predation sites as they split with their
respective low predation populations (Table 2a, specifi-
cally HPAnc < HP in 52%, 42% of the bootstrap repli-
cates for Aripo and Oropuche, respectively). The Arima
and El Cedro high predation populations seemed to
have increased in size using the two-population model
(HPAnc < HP in 100%, 96% for Arima and El Cedro,
respectively). Because these two populations also
showed evidence of substantial admixture in the STRUC-
TURE analysis, we tested a three-population model
(Table 2b). While the estimated time of population split
between high and low predation populations was not
different from the two-population model, the estimated
current population sizes of the high predation popula-
tions were smaller and were comparable to the esti-
mates for the other high predation sites, from the Aripo
and Oropuche in the two-population model (Table 2b).
All naturally colonized low predation populations
have grown in size since the population split (Table 2,
specifically LPAnc < LP 100% of the bootstrap replicates
for all natural low predation populations). Conversely,
HO
LO
LAM
HAM
IA
LAHA
IE
HE
HA
M
LAM HE IE HA LA IA HO LO
(A) (B) Fig. 2 Population structure among sam-
pled populations. (A) Structure analysis
with K = 4 clusters. Each line represents
one individual and the colour distin-
guishes clusters. The population is indi-
cated on the x-axis. (B) Neighbour-
joining tree based on Nei’s distance
between sampled populations. Popula-
tion names can be found in Table 1.
© 2014 John Wiley & Sons Ltd
POPULATION GENOMICS OF GUPPY POPULATIONS 395

Table 2 Demographic analysis of population river pairs
(a) 2-population model
Arima Aripo Oropuche Aripo Introduction El Cedro Introduction
S 1732.5 1629.5 2429.0 1453.4 933.5
HPAnc 2.80
1.35 to 4.49
1.54
0.83 to 2.85
0.11
0.05 to 0.18
1.25
0.80 to 2.79
1.50
0.77 to 2.76
LPAnc 0.0099
0.0062 to 0.017
0.0017
0.0007 to 0.0037
0.0045
0.0028 to 0.0072
0.010
0.005 to 0.018
0.0084
0.0044 to 0.014
LPAnc NE 112.03
70.98 to 181.93
16.06
6.67 to 35.89
74.19
45.39 to 117.42
103.29
53.50 to 178.83
55.66
29.48 to 93.68
HP 70.53
35.07 to 93.85
1.48
0.81 to 2.61
0.12
0.07 to 0.19
1.54
0.83 to 3.04
4.24
2.26 to 8.62
LP 0.20
0.10 to 0.34
2.92
1.75 to 5.38
0.51
0.26 to 0.96
0.0040
0.0022 to 0.0080
0.0026
0.0013 to 0.0040
LP NE 2207.82
1199.95 to 3838.86
27917.53
15946.72 to 54020.57
8408.33
4292.79 to 15820.25
39.69
22.31 to 80.16
17.41
8.33 to 26.40
T 0.039
0.027 to 0.051
0.15
0.10 to 0.24
0.0036
0.0024 to 0.0048
0.0021
0.0013 to 0.0030
0.0026
0.0017 to 0.0037
Tyears 439.56
314.51 to 562.02
1461.88
947.45 to 2250.28
58.27
40.46 to 78.70
21.56
21.84 to 69.41
16.95
11.58 to 24.19
MHP-LP 0 1.45
0.82 to 2.67
0 0 0
MLP-HP 7.63
5.26 to 12.32
8.22
5.83 to 11.75
0 0 0
Theta 512.0
499.6 to 523.3
�31.8
395.7 to 468.4
746.5
743.0 to 753.5
456.8
455.9 to 457.6
301.8
301.0 to 302.3
Ll �219.6
�225.4 to �218.0
�160.0
�167.6 to �156.7
�159.4
�161.0 to �158.5
�168.5
�168.9 to �167.8
�181.9
�182.4 to �181.7
(b) 3-population model
Arima El Cedro introduction
HPAnc 2.78
1.56 to 5.57
1.56
0.82 to 2.87
GAnc 0.95
0.55 to 1.82
1.03
0.54 to 1.81
LPAnc 0.02
0.01 to 0.04
0.008
0.005 to 0.017
LPAnc NE 140.94
68.66 to 306.35
64.49
29.03 to 114.09
HP 0.62
0.31 to 1.02
1.02
0.54 to 1.79
G 1.54
0.79 to 2.63
0.96
0.53 to 1.86
LP 0.07
0.04 to 0.11
0.0039
0.0021 to 0.0061
LP NE 504.22
280.38 to 778.15
24.67
13.21 to 50.14
T 1.91
1.10 to 3.57
0.58
0.29 to 1.30
T2 0.05
0.03 to 0.08
0.0024
0.0013 to 0.0037
T2 years 379.95
200.04 to 578.87
15.91
8.04 to 30.30
MHP-G 10.41
6.12 to 17.56
1.06
0.54 to 1.84
© 2014 John Wiley & Sons Ltd
396 B. A. FRASER ET AL.

the two introduction populations showed evidence of
population decrease after their introduction (Table 2,
LPAnc > LP 94% of replicates in El Cedro and 100% of
replicates Aripo Introduction). The direction of popula-
tion size change in the Arima low predation population
and El Cedro Introduction in the two-population model
was not different from the estimates derived from the
three-population model.
Outlier window analysis
We used an FST outlier window approach to probe for
evidence of selection between paired high and low pre-
dation populations within river (Table 3). A median of
3901 windows of 150 kb length was assayed for each
river pair (Table 3). 2126 windows were common to all
five comparisons (three between natural high–low pre-
dation pairs and two between introduction and ances-
tral sites). These included 955 stretches of immediately
adjacent windows on 157 scaffolds, with the greatest
distance between windows being 1950 kb.
Overall, 9–13% of windows were detected as outliers
at a 95% threshold and 3–7% were detected as outliers
at a 99% threshold. Among the comparisons between
high–low predation sites, the Arima and El Cedro com-
parison had the highest percentage of outlier windows
and the Oropuche comparison had the fewest. We
observed similar patterns when we probed for FST out-
liers at individual SNPs (G-statistic; Table S1, Support-
ing information). The number of outlier windows was
not correlated with the total number of windows
assayed, not considering the Oropuche comparison.
Indeed, when we reran the analyses on just the subset
of SNPs genotyped in all populations, the general pat-
terns among river analyses remained the same (Table S5,
Supporting information).
We refined our evaluation of genomic regions under
selection by combining immediately adjacent outlier
windows to produce outlier intervals [comparable to
‘peaks’ in (Hohenlohe et al. 2010)]. The El Cedro and
Arima comparisons had the highest number of outlier
intervals and the Oropuche comparison had the fewest.
The Arima comparison had many outlier windows, but
these combined into relatively few, long intervals in
comparison with the other rivers (Table 3). We found
that both the Aripo and El Cedro Introduction analyses
and the Arima analysis had nonrandom distributions
of outlier windows on linkage groups (Table S6, Sup-
porting information). Both the Arima and El Cedro
comparisons had an enrichment of outlier windows on
linkage group 12 (LG12) and LG15 (Table S6, Support-
ing information). The other enriched LGs were unique
to each river. The enrichment found in El Cedro
remained the same after removing the ‘admixed’ indi-
viduals found in the high predation El Cedro popula-
tion. Outlier windows are unlikely to be caused by
differences in genetic content; there were no differ-
ences in percentage of Ns between outlier and nonou-
tlier windows, and only the Aripo comparison had a
significantly higher GC content in outlier windows and
Table 2 Continued
(b) 3-population model
Arima El Cedro introduction
MG-HP 10.41
5.90 to 18.46
4.33
2.12 to 7.68
MHP-LP 0 0
MLP-HP 11.06
6.42 to 17.97
0
Theta 327.0
244.2 to 421.9
299
229 to 463
Ll �178.6
�208.4 to �162.2
�182
�189 to �180
(a) Parameter estimates (medians and 95% CI) for a 2-population isolation with migration model. S is the number of segregating
sites, HP is the high predation, LP is the low predation and ‘anc’ the ancestral population at time of split, T is the time since popula-
tion split (2Nref generations), migration between populations (MHP-LP MLP-HP) are in units of 2Nrefmij, Theta = 4Nrefl, and ll is the
long-likelihood of the model. To make comparisons among river pairs, LPANC and LP were translated to number of individuals
(LPANC NE and LP NE) and T to years (Tyears) based on theta. Migration estimates were fixed at zero depending on the nested-likeli-
hood models (see supplement). Parameter medians and confidence intervals were estimated by conventional bootstraps. (b) Similar
population parameters were estimated using a 3-population isolation with migration model. The third population (G) represents a
ghost or unsampled population. T is the time of the split between the HP and G population, while T2 is the time of split of the HP
and LP population.
© 2014 John Wiley & Sons Ltd
POPULATION GENOMICS OF GUPPY POPULATIONS 397

even here the effect size was quite small (GC content
in nonoutliers = 0.36, in outliers = 0.37, P < .002; Table
S7, Supporting information). Indeed, outlier windows
were significantly more diverged than nonoutlier win-
dows, using the absolute divergence measure Dxy
(Cruickshank & Hahn 2014) (Table S7, Supporting
information). To determine whether similar types of
genes were within outlier windows in different river
analyses, we analysed Gene Ontology (GO) enrichment
in biological processes (BP) annotations for gene mod-
els in outlier windows for each river analysis sepa-
rately. No GO category was found to be significantly
enriched in more than one river comparison (data not
shown).
The difference between linkage disequilibrium (LD)
within outlier windows compared to all windows var-
ied between rivers. The low predation Arima, El Cedro
Introduction, Aripo Introduction and high predation El
Cedro (only before removing admixed individuals) all
showed significantly higher LD in outlier windows
than nonoutlier windows. No difference was found in
the other populations (Table S7, Supporting informa-
tion). Autocorrelation of FST outliers along LGs was
found in four LGs in the El Cedro, two in Arima and
one in the Aripo (Table S8, Supporting information).
Similar to the clustering analysis, we found an autocor-
relation of outliers in El Cedro on LG12 and in Arima
on LG15. Linkage disequilibrium was not higher across
LGs between outlier and nonoutlier windows in
any of the river comparisons (Table S7, Supporting
information).
Overlap of outlier windows
We used a multidimensional chi-squared test to quan-
tify the extent of overlap in outlier windows among
rivers. When we compared all five river pairs, the
outlier lists were significantly dependent on one
another (v2 = 43.35, d.f. = 1, P < 0.001). However, no
windows were found to overlap in all five compari-
sons, two overlapped in four river comparisons
(expected 2), 33 overlapped in three comparisons
(expected 28), 238 overlapped in two river compari-
sons (expected 208) and 690 were unique to the river
(Fig. 3). The two windows that overlapped in four of
the river comparisons were on scaffold 56 (LG22) and
scaffold 9 (LG19). Neither showed a significant differ-
ence in FST when all populations were pooled, but
both showed a significant decrease in heterozygosity
when LP populations were pooled (Tables S9 and
S10, Supporting information). Nine gene models were
Table 3 Summary of FST outlier analysis
River
Mean SNP
density
(per window)
Mean FST(min–max)
Total no. of
windows
No. of outlier
windows
95% (%)
No. of outlier
windows
99% (%)
No. of
outlier
intervals
Mean outlier
interval length
kb (min-max)
Arima 9.74 0.11 (0–0.92) 3990 480 (12) 230 (6) 329 217 (150–1350)Aripo 15.73 0.05 (0–0.5) 4114 475 (11) 243 (6) 362 196 (150–750)Oropuche 3.88 0.06 (0–0.53) 2354 222 (9) 74 (3) 202 164 (150–450)Aripo Introduction 6.80 0.06 (0–0.83) 3812 348 (9) 154 (4) 290 179 (150–750)El Cedro
Introduction
10.57 0.10 (0–0.59) 3980 503 (12) 274 (7) 364 206 (150–900)
El Cedro
Introduction NoAd
7.91 0.11 (0–0.70) 3821 492 (13) 273 (7) 350 210 (150–1350)
Using a window size of 150 kb, FST was calculated between paired high and low predation populations within a river. Outlier
windows were determined with a bootstrapping approach for FST at both the 95 and 99% confidence level. Outlier windows were
then collapsed into intervals. We reran the same analysis on El Cedro with the four ‘admixed’ individuals removed (El Cedro
NoAd).
Arima
Aripo
Oropuche
El cedrointroduction
Aripointroduction
152
152
115
161110
27
24
4123
1725
33
18
11
19
2
5
7
10
6
62
6
2
1
0
1
0
0
0
Fig. 3 Overlap in outlier windows for all river pairs. A Venn
diagram indicating the degree of overlap in FST outlier win-
dows found in all five river pairs using the set of windows
that were assayed in all five rivers.
© 2014 John Wiley & Sons Ltd
398 B. A. FRASER ET AL.

found in these two windows (Table S11, Supporting
information). There were a few genes that may under-
lie adaptive phenotypes related to growth and life
history on scaffold 56. The SLC2A2 gene is involved
in sugar transport and homoeostasis and may be
related to sugar transport to yolk and developing
embryos in zebrafish (Castillo et al. 2009), and GHSR
is related to somatic growth and metabolism in fish
(J€onsson 2013). A similar lack of overlap in all river
comparisons was found when individual SNPs were
queried, where no outlier SNPs overlapped in four or
five river comparisons and only 4 SNPs overlapped in
three comparisons (Tables S12 and S13, Supporting
information).
We next compared outlier lists to test whether dif-
ferent factors influenced the probability of genetic
convergent evolution. The outlier lists did not overlap
significantly when we considered only the naturally
colonized river pairs (Arima, Aripo and Oropuche:
v2 = 1.48, d.f. = 1, P = 0.22). Three windows over-
lapped in all three rivers (expected 4), 90 overlapped
in two rivers (expected 82) and the remaining 584
were unique to a single river pair. Of the three win-
dows that overlapped in the natural river pairs, two
of the windows were outliers in the El Cedro Intro-
duction and one was an outlier in the Aripo Intro-
duction. Two were also significant when all high and
low predation populations were pooled and FST calcu-
lated (Table S9, Supporting information). None of
these windows were found to show a consistent
decrease in heterozygosity across either high or low
predation populations but two showed a significant
decrease in heterozygosity in the low predation popu-
lations when all low predation populations were
pooled (Table S10, Supporting information). We analy-
sed the gene content of the windows that overlapped
in all natural population comparisons. These regions
contained 21 gene models (Table S11, Supporting
information).
We next examined lists of outliers in each pairwise
comparison to test whether some outlier lists over-
lapped more than others, using a chi-squared test
method (Table 4). None of the comparisons among nat-
ural high–low predation pairs overlapped with each
other more than expected by chance (Table 4). The
Aripo high–low predation and Aripo Introduction–highpredation outlier lists overlapped significantly (Table 4),
but the Aripo high predation population was common
to each outlier list so these pairs are not independent of
each other. The El Cedro Introduction–high predation
outlier list had a significant amount of overlap with the
Arima outlier list (Table 4). After removing the four
individuals from the high predation El Cedro showing
admixture with the Arima population, the overlap
between Arima and El Cedro became nonsignificant.
Finally, the two introduction experiment comparisons
(El Cedro and Aripo Introductions) overlapped more
than expected by chance (Table 4).
Overall, the overlap between introduced populations
occurred more than the naturally colonized populations.
The 63 outlier windows shared in both experimental intro-
duction population comparisons collapsed to 59 intervals
distributed across 40 scaffolds and 16 LGs. Figure 4 shows
the distribution of this overlap in the four linkage groups
with the most overlap in introduced populations com-
pared to the overlap found in natural populations. The
outlier regions were not distributed randomly. There was
a significant enrichment of shared outlier windows on
LG8, with eight windows (2 expected; v2 = 11.46, d.f. = 1,
P < 0.0007, Fig. 4) and LG23 with six windows
(2 expected; v2 = 13.79 d.f. = 1, P = 0.0002, Fig. 4). LG8
was also enriched with outliers in the El Cedro Introduc-
tion (Table S6, Supporting information). GC content did
not differ between the overlapping outlier windows and
the rest of the genome (outliers = 0.36 � 0.005,
all = 0.36 � 0.0005, t = 0.36, d.f. = 63.41, P = 0.72), nor per-
centage of Ns (outliers = 0.085 � 0.011, all = 0.077 � 0.001,
t = 0.72, d.f. = 63.64, P = 0.48) and the absolute divergence
Table 4 Tests of independence of outlier windows between rivers
Arima Aripo Oropuche Aripo Introduction El Cedro Introduction
Arima 0.58 0.05 3.6 9.97*(0.96)
Aripo 62 0.61 15.3** 0.43
Oropuche 30 32 2.6 0.06
Aripo Introduction 53 64 15 9.98*
El Cedro Introduction 82 (67) 64 30 63
Shown above the diagonal are individual chi-squared test values with associated significance. Below the diagonal is the number of
overlapping outlier windows at a 95% confidence level. The El Cedro set without admixed individuals is given in brackets for the El
Cedro and Arima comparisons.
**P < 0.001.
*P < 0.01.
© 2014 John Wiley & Sons Ltd
POPULATION GENOMICS OF GUPPY POPULATIONS 399

was higher in outlier windows than nonoutlier windows (IE
outliers = 0.0015 � 0.00007, nonoutliers = 0.0011 � 0.000007,
t = 5.5, d.f. = 112 263, P < 0.0001, IA out-
liers = 0.0018 � 0.0001, IA nonoutliers = 0.0010 � 0.000009,
t = 7.9, d.f. = 77237, P < 0.0001). Of the outlier windows, 22
had low heterozygosity in pooled introduction populations,
while only onehad low heterozygosity in the pooled high pre-
dation populations (Table S14, Supporting information). We
also annotated the gene models found in the overlap regions
between the two introduction populations; 396 gene models
mapped to this region. Of these gene models 168 could be
annotated with biological process in a GO analysis (Table S15,
Supporting information). Many enriched developmental,
reproduction and gamete generation terms were found
among them. We report the annotation for gene models in
these overlapping windows (Table S16, Supporting informa-
tion). There were a few interesting candidates genes, for
example genes involved in growth and metabolism [CTSF is
involved in fat metabolism (Russo et al. 2004) and CASQ1 in
diabetes susceptibility (Das & Elbein 2006)] and in ovarian
development and resource provisioning in zebrafish [inhibin-
alpha (Wu et al. 2000)].
0.0
0.4
0.8
0.0
0.4
0.8
0.0
0.4
0.8
0.0
0.4
0.8
LG4
0 7.5 15 22.5 30 37.5
0.0
0.4
0.8
LG8
0 7.5 15 22.5 30 0 7.5 15 22.5 30 0 7.5 15 22.5LG20 LG23
F ST
(Mb)
Fig. 4 Overlap in outlier windows in introduced populations compared to naturally colonized populations. FST for windows for each
river pair, Arima (pink), Aripo (orange), Oropuche (blue), Aripo Introduction (red) and El Cedro Introduction (yellow). Outliers
within river pair are indicated by a grey triangle, while outliers shared by any two naturally colonized pair are indicated by blue tri-
angle and outliers shared by both introduced populations by a red triangle. Shown are the four linkage groups with the most overlap
between introduced populations.
© 2014 John Wiley & Sons Ltd
400 B. A. FRASER ET AL.

Individual SNP analysis
We identified five SNPs that were significantly corre-
lated with predation environment using BAYENV2. As
with the FST outlier approach, no SNP showed
allele frequency differences in all five pairwise com-
parisons (Table 5, Fig. 5 and Table S17, Supporting
information).
Two of the outlier SNPs, ‘scaffold_50_4557695’ and
‘scaffold_50_4575198’, were within ~17.5 kb of each
other on LG15. These SNPs were fixed for the minor
allele in the Arima low predation, Aripo Introduction
and El Cedro Introduction populations. There was no
difference in allele frequency between the Aripo low
and high predation populations for either SNP. A dif-
ference in allele frequency was seen for only one SNP
in the Oropuche. These two SNPs were also in a region
of strong autocorrelation and enrichment of outlier FSTin the Arima and El Cedro paired comparisons on
LG15 (Tables S6 and S8, Supporting information). One
Table 5 Correlation of individual loci to predation regime
ID LG BF q Closest gene
scaffold_50_4557695 15 568.66 0.60 B-cadherin-like
scaffold_50_4575198 15 99.72 0.50 B-cadherin-like
scaffold_5_11523021 16 32.03 0.41 Pleckstrin homology domain containing, family G (with RhoGef domain) member*
scaffold_148_1123620 11 27.22 0.44 MHC class I
related gene protein-like
scaffold_67_757135 21 24.27 0.43 Uridine-cytidine kinase-like 1
Loci with a strong correlation between allele frequency matrix and environmental matrix after correcting for overall population
covariance using a Bayesian approach. For each SNP, we report the ID (which is its scaffold and position concatenated), the linkage
group (LG), Bayes factor (BF), Spearman’s rho and annotation of the closest gene.
*Outlier SNP was in the gene model.
Scaffold_50_4557722
010
2030
40
Scaffold_50_4575198
010
2030
40
Scaffold_5_115230210
1020
3040
Scaffold_148_1123620
010
2030
40
Scaffold_67_757135
010
2030
40
HAMLA
M HA LA HO LO HA IA HE IE
HAMLA
M HA LA HO LO HA IA HE IE
HAMLA
M HA LA HO LO HA IA HE IE
HAMLA
M HA LA HO LO HA IA HE IE
HAMLA
M HA LA HO LO HA IA HE IE
Freq
uenc
yFr
eque
ncy
Fig. 5 Loci with strong correlation between allele frequency and predation regime. Shown are the frequency of major allele (in black)
and minor allele (in grey) for each population grouped by river pair for each outlier SNP.
© 2014 John Wiley & Sons Ltd
POPULATION GENOMICS OF GUPPY POPULATIONS 401

of these SNPs (scaffold_50_4557695) was also found to
be above the 95% quantile of FST values in three river
comparisons (Table S13, Supporting information).
The other three outlier SNPs were distributed across
different scaffolds and LGs (Table 5). SNP ‘scaf-
fold_5_11523021’ differed in allele frequency in the
comparison of Aripo populations and was fixed for the
minor allele in the Aripo and El Cedro Introductions.
SNP ‘scaffold_148_1123620’ was fixed for the minor
allele in the El Cedro Introduction, and allele frequen-
cies differed between the Arima populations. However,
no difference was seen in the Oropuche, the Aripo or
the Aripo Introduction populations. Finally, SNP ‘scaf-
fold_67_757135’ was fixed for the minor allele in the Ar-
ima low predation and El Cedro Introduction and
showed a difference in allele frequencies between the
Aripo populations but not in the Aripo Introduction or
Oropuche populations. This SNP was also found to be
above the 95% quantile of FST values in three river com-
parisons (Table S13, Supporting information). We anno-
tated the closest gene models to these outlier SNPs,
which provides candidates for investigating allelic dif-
ferentiation between groups (Table 5). We also anno-
tated genes within 50 kb of these SNPs (Table S18,
Supporting information). Results for all major analyses
were similar with low coverage individuals removed
(Tables S19–S22, Supporting information).
Discussion
Here, we investigated convergent evolution in natural
and experimental guppy populations using genome-
wide selection scans. While we detected perhaps a sur-
prisingly high number of FST outlier windows
differentiating each matched high and low predation
population, we did not find evidence for convergent
evolution in all five pairwise comparisons. Importantly,
there were only two outlier windows that were com-
mon to at least four comparisons; this was equal to
what was expected by chance. Similarly, using individ-
ual SNP analysis, we found loci differing in a maxi-
mum of four of the five high and low predation
comparisons. This may seem surprising given the con-
siderable evidence for phenotypic convergence among
guppy populations, for example (Endler 1980; Reznick
1982; Kelley & Magurran 2003). We examined all pair-
wise combinations of overlapping windows to test the
specific hypotheses concerning the importance of simi-
lar standing genetic variation, timescale and population
history in detecting convergent evolution. The sharing
of outlier windows in the natural populations was
lower than what would be expected by chance. This
was different for the El Cedro and Arima contrasts, but
the overlap between them was apparently caused by
recent admixture from the Arima to the El Cedro. The
two recent experimental introduction populations also
shared a significant number of outliers. Our demo-
graphic analysis revealed evidence of effective popula-
tion size decrease in the introductions. In contrast, all
naturally colonized low predation populations showed
an increase in effective population size since coloniza-
tion (Table 2). While, this decline in population size
could be caused by random mortality, our results sug-
gests instead that convergent evolution has occurred in
these introduced populations due to the high amount of
overlap in outlier windows in these two populations.
There were other indications of recent, convergent
directional selection in the two introductions. The over-
lap of outlier windows occurred over many LGs, and
the affected regions were enriched with gene annota-
tions associated with reproduction and growth (Tables
S15 and S16, Supporting information). LD was higher in
the introduced population outlier windows than in no-
noutlier windows. Many of the windows also had low
heterozygosity in both introduced populations, a pat-
tern not seen in their source populations, as is expected
if there was a recent selective sweep. Together with pre-
vious evidence of rapid phenotypic change, we now
have strong evidence that introduced populations
underwent recent selective events. Reznick & Bryga
(1987) and Reznick et al. (1997) reported a change in
male size and maturation age after only 4 years
(approximately eight generations) and in both male and
female size at maturity after 7 years (approximately 14
generations) in the El Cedro Introduction population.
Similarly, male and female age and size at maturity, as
well as number of offspring in the first litter and off-
spring size had all significantly changed after only
11 years in the Aripo population (Reznick et al. 1990).
While there is no published census population size for
these introduction populations from personal observa-
tion, it is in the hundreds in the Aripo Introduction and
the thousands in the El Cedro Introduction, that is
much higher than the estimated current effective popu-
lation sizes (Table 2). The population dynamics of trans-
ferring fish from a high predation population, where
they have short generation times and high fecundity,
into a low predation environment, where they have
reduced risk of mortality, have been simulated (Reznick
et al. 2004). The simulations suggested rapid population
growth, with populations exceeding 1000 individuals in
<1 year. Rapid population growth can lead to fast adap-
tation because it is permissive of natural selection with-
out local extinction. It is likely that this signal of genetic
convergent evolution found in the introduced popula-
tions and not in natural populations is due to this
shared demographic history or recent timescale of
convergence.
© 2014 John Wiley & Sons Ltd
402 B. A. FRASER ET AL.

Population structure
As reported before (Crispo et al. 2006; Barson et al.
2009; Willing et al. 2010), guppies from high predation
populations had a higher amount of heterozygosity and
more admixture from other rivers when compared to
their low predation population counterparts. The high
predation Arima population had a large and consistent
amount of admixture from the Oropuche and El Cedro
rivers. Each individual genotyped was assigned to both
the Oropuche and El Cedro cluster with approximately
20% probability. The possible basis for this admixture is
that the high predation Arima site is adjacent to many
research facilities visited by guppy biologists. We know
that fish from multiple populations were accidentally
released in the Arima in September 2001 (F.H. Rodd,
personal communication). It is possible that other simi-
lar accidental introductions have occurred (Magurran
2005). The high predation El Cedro also showed evi-
dence of admixture with the Arima, likely because these
rivers lie in close proximity to one another, and there
are no major barriers between the two populations. The
other rivers are strongly differentiated from one
another, with only five individuals (only one from a
low predation population) assigned to its river cluster
with <90% probability. Differences in heterozygosities
within populations likely did not affect the FST outlier
tests, as absolute divergence differs significantly
between outlier windows and nonoutlier windows
(Table S7; Cruickshank & Hahn 2014). Our observed
genetic differentiation among populations confirms
inferences from allozyme and low-density genotyping
studies (Carvalho et al. 1991; Alexander et al. 2006; Suk
& Neff 2009; Willing et al. 2010).
Our estimates of effective population size and migra-
tion rates are high but not outside of the range previ-
ously reported for guppies. The overall patterns of
relative population size are comparable to those
observed by Barson et al. (2009). Low predation popula-
tions had smaller or similar effective population sizes
as their high predation counterparts, except for low pre-
dation Aripo [this discrepancy was also reported in
(Barson et al. 2009)]. Migration was higher downstream
(low to high predation) than upstream (high to low pre-
dation). To these data, we add estimates of founding
effective population sizes and colonization times. We
estimated that some low predation populations were
colonized by very few individuals and the largest
ancestor population size was 112 individuals. It is well
documented that guppies are strong colonizers; they
have successfully invaded at least 69 countries outside
of their natural range, where they were initially intro-
duced for mosquito control (Deacon et al. 2011). Also,
Deacon et al. (2011) have shown that a single pregnant
female could establish a population of up to 60 individ-
uals and that the population remained viable for
2 years (the duration of the experiment). The evidence
for inbreeding depression and inbreeding avoidance in
natural guppy populations is mixed (Pitcher et al. 2008;
Johnson et al. 2010).
Detecting convergent evolution
One possible explanation for the differences in the
signatures of selection between natural and intro-
duced populations is that they were caused by differ-
ences in the amount of initial genetic variation in the
founders. Our results do not fully support this alter-
native. The estimated ancestral effective population
size in the introduced populations was not larger
than in all natural low predation populations. How-
ever, a limitation of these genetic data is that they
alone cannot distinguish multiple natural colonization
events occurring in quick succession from one larger
colonization event. Furthermore, high migration and
reduced divergence affect the allele frequency spec-
trum similarly, both showing high correlation of allele
frequencies between the populations. Shared low-fre-
quency alleles will distinguish the two models, but
these may have been filtered or missed in our data
(Gutenkunst et al. 2009). The Aripo River analysis
yielded the longest divergence time, smallest low pre-
dation ancestral population and was also the only
river to show evidence for migration upstream. The
Oropuche population analysis yielded the youngest
divergence time, and no migration was found to be
likely between the populations. It is also possible that
low predation populations are older than estimated
here, but that they have gone through repeated
genetic bottlenecks due to flooding and multiple colo-
nization (Van Oosterhout et al. 2007). Also, generation
time (used to estimate time in years) itself is under
selection and may change over time (Reznick & En-
dler 1982). Therefore, our migration and time of
divergence estimates should be interpreted with cau-
tion. Another possible reason for the strong overlap
in introduced populations is that introduced popula-
tions are more similar in selective forces other than
predation compared to naturally colonized popula-
tions. Future studies measuring pathogen pressures
and diet of these populations would help to clarify
the interactions and the importance of different selec-
tive pressures in this system.
The number FST outlier windows, up to 13% at the
95% confidence threshold, within individual rivers may
appear surprisingly high. Outlier windows occurring in
a single river pair should be interpreted with caution
because they cannot be distinguished from the effects of
© 2014 John Wiley & Sons Ltd
POPULATION GENOMICS OF GUPPY POPULATIONS 403

drift and bottlenecks. The possibility of drift overshad-
owing selection is likely to be common in the guppy
system because of the limited number of founders and
limited migration into the upper reaches of rivers (Cri-
spo et al. 2006; Van Oosterhout et al. 2006). Addition-
ally, populations in fractal landscapes like rivers are
more likely to have false positive FST outliers due to
correlated ancestry and inflated variance in FST mea-
sures (Fourcade et al. 2013). These factors could also be
responsible for the lack of genetic convergent evolution
found in other similar study systems [e.g. Atlantic sal-
mon (Salmo salar) (Perrier et al. 2013) and Rainbow trout
(Oncorhynchus mykiss) (Hecht et al. 2013)]. However,
these factors are unlikely to generate false positives in
the same genomic regions in multiple comparisons
because they would affect randomly distributed regions
of the genome. Overlap in outlier regions could be
caused by other neutral factors such as reduced recom-
bination around centromeres and isochores or differ-
ences in mutation rate. Indeed, Roesti et al. (2012) found
a large bias of FST outliers in nonrecombining centro-
meres using a similar approach in lake–stream stickle-
back. However, we have no evidence that outlier
regions had different genetic properties then the rest of
the genome (Table S7, Supporting information). There-
fore, overlapping regions showing evidence of genetic
divergence in multiple populations are more likely sig-
natures of selection.
Our analyses revealed little evidence of genetic con-
vergence in guppy evolution. Only two windows
were outliers in at least four river pairs, and only
three outliers were found in all natural paired com-
parisons, not more than expected by chance alone.
Similarly, an analysis detecting correlation between
environment and allele frequencies, after accounting
for overall covariance among populations, showed a
difference in allele frequency in a maximum of four
river pairs. We may have missed the genetic regions
selected in all populations because we used a RAD-
seq approach, which sequences only a small fraction
of the genome. Increased recombination between
selected loci and neutral loci would further decrease
the chance of detecting selected regions. LD was sig-
nificantly higher in outlier windows than nonoutlier
windows in the Arima low predation and the two
introduction sites. There were no such differences in
the natural Oropuche and Aripo populations. The Ar-
ima and introduction populations also had the strong-
est evidence for convergent evolution in the form of
shared FST outlier windows. The differences in the
presence of LD are thus suggestive of recombination
having erased the evidence of selection in the paired
comparisons of LP and HP populations in natural
rivers.
Another intriguing possibility is that phenotypic con-
vergent evolution was mediated by different genes in dif-
ferent rivers. A recent review of genome scans to detect
outlier loci revealed that only a small fraction of loci (1–12%) were found to be outliers in more than one diver-
gent pair within the same system, suggesting that conver-
gent phenotypic evolution cannot be easily equated with
convergent genetic evolution (Nosil et al. 2009). Similarly,
a meta-analysis has shown that the likelihood of the same
gene undergoing selection in independent systems
decreases with increasing age of ancestral node (Conte
et al. 2012). Evolution in which similar phenotypes are
the product of different genes has been found in a variety
of systems. For example, adaptive melanism in different
populations of rock pocket mice has apparently distinct
genetic causes (Nachman et al. 2003). Likewise, different
genes could be responsible for similar adaptive changes
in the guppy. Many adaptive traits in this system, such
as body size, body shape, behaviour, swimming perfor-
mance, coloration and life histories, are likely to be poly-
genic. Additionally, if different enhancers affecting the
same gene were selected, we would not be able to detect
a signal of convergent evolution. While phenotypic dif-
ferences between the populations may be examples of
adaptive plasticity (Ghalambor et al. 2007), many of these
phenotypic differences remain heritable in common labo-
ratory conditions (Reznick 1982; Reznick & Bryga 1996),
indicating that they are caused by genetic differences.
Differences in ecological variables have been shown to
have a large influence on adaptive phenotypes in the
guppy. For example, substrate size relates to male colour
spot size (Endler 1980) and canopy openness influences
primary productivity and food availability, which in turn
affect life history traits and male colour (Endler 1995;
Grether et al. 2001; Reznick et al. 2001). Clearly, conver-
gent evolution at the phenotypic level in the guppy is
nuanced in a way that could reduce the odds of corre-
lated genetic convergence.
Sticklebacks adapted to freshwater and marine envi-
ronments present an iconic example of aligned pheno-
typic and genetic convergent evolution, where the
derived allele at the Eda locus, which is associated with
reduced lateral plates (Colosimo et al. 2005), is found seg-
regating at low frequencies in marine populations and
has been fixed repeatedly in freshwater populations (Ho-
henlohe et al. 2010; Jones et al. 2012). Why would the
results for sticklebacks be so much more deterministic
than those for guppies? One possibility is the nature of
the founding populations. We know of no estimate for
founding population sizes for lake stickleback from mar-
ine populations, but it is most likely large, to account for
high amounts of standing variation (Hohenlohe et al.
2010). Also, continuous migration between the founding
freshwater and marine populations is likely (Bell & Fos-
© 2014 John Wiley & Sons Ltd
404 B. A. FRASER ET AL.

ter 1994). Our estimates of population histories in gup-
pies paint a very different picture. We inferred that the
natural low predation populations were founded with
relatively few individuals, approximately 10–100, and
even the introduced populations had low ancestral effec-
tive population sizes. We also have strong evidence that
migration upstream is very limited. Therefore, the start-
ing genetic variation in low predation populations was
most likely low, decreasing the likelihood of selection act-
ing on similar standing genetic variation in natural popu-
lations (Rosenblum et al. 2014). Our results also imply
that the founders of guppy populations in different low
predation environments may have been genetically dis-
tinct at the outset. In contrast, the founders of the fresh-
water stickleback populations in the Pacific Northwest
were all derived from a large, panmictic marine popula-
tion. Therefore, the guppy represents a system with
equally striking phenotypic convergent evolution as the
stickleback system but with a very different population
history, one that would decrease the likelihood of genetic
convergent evolution (Rosenblum et al. 2014).
Limitations of RAD-seq analyses
Several studies have examined the biases and limitations
of reduced-complexity genotyping, such as RAD-seq in
selection studies. Due to the differences in restriction
enzyme recognition sites, RAD-seq may underestimate
diversity through allele drop out, although FST appears
to be fairly robust to this problem (Arnold et al. 2013). It
has been suggested including low read coverage worsens
allele dropout effects (Gautier et al. 2012). We therefore
used minimum coverage thresholds. Restricting the
analysis to loci with complete information for all individ-
uals may be helpful as well, but is rarely sensible, as this
would eliminate the majority of loci when many individ-
uals are studied. As a compromise, we only considered
loci with information from at least 70% of individuals
from each population. We found approximately equal
heterozygosity for four populations and even higher het-
erozygosity for two populations than what had been
found with conventional genotyping methods (Willing
et al. 2010), the opposite of what would be expected with
allele dropout. Another concern with RAD-seq is ascer-
tainment bias, as genotypes closer to the reference gen-
ome are more easily determined (Sousa & Hey 2013).
Again reassuringly, we were able to map a similar frac-
tion of reads for all populations, arguing against ascer-
tainment bias. While we found fewer SNPs in the most
distantly related populations from the reference (the ref-
erence genome was created with a fish from the Guanapo
River found in the Caroni watershed between the Arima
and El Cedro rivers), these also had the lowest sequence
coverage.
Conclusions
Results from high-density genotyping of paired high–low predation natural and experimental populations
have revealed several notable patterns of selection.
First, using population-genetic modelling approaches to
reconstruct the demographic history and migration
among sampled populations, we found that naturally
colonized low predation populations experienced popu-
lation growth since colonization, while introduction
populations shrank. Second, we detected only very few
regions across the genome with signatures of selection
common to all populations. In contrast, the two experi-
mental populations shared many such regions. Together
our results suggest convergent genetic evolution in
introduced populations but not natural populations.
Our results emphasize that detecting the signature of
convergent evolution at the genome level requires sam-
pling at the appropriate timescale or population history;
otherwise neutral processes or population-specific selec-
tive forces may obscure or decrease the likelihood of
convergent genetic evolution.
Acknowledgements
We thank Phillip Ganz, John Kronenberger, Verena Kottler,
Will Roberts, Troy Simon and Jack Torresdal for field sampling
and field support, Margarete Hoffmann for help in library
preparation and Christa Lanz for library sequencing. We thank
Paul Hohenlohe for help in altering his original scripts to esti-
mate FST in windows. We thank Reto Buri for providing R
scripts to estimate the absolute divergence. We are also thank-
ful for insightful comments on this manuscript from Cameron
Weadick, Andrew Furness, Peter Ralph and three anonymous
reviewers. This work was supported by funds from the Max
Planck Society.
References
Alexander HJ, Taylor JS, Wu SS-T, Breden F (2006) Parallel
evolution and vicariance in the guppy (Poecilia reticulata)
over multiple spatial and temporal scales. Evolution, 60,
2352–2369.Arendt J, Reznick D (2008) Convergence and parallelism recon-
sidered: what have we learned about the genetics of adapta-
tion? Trends in Ecology & Evolution, 23, 26–32.Arnold B, Corbett-Detig RB, Hartl D, Bomblies K (2013) RAD-
seq underestimates diversity and introduces genealogical
biases due to nonrandom haplotype sampling. Molecular
Ecology, 22, 3179–3190.Axelsson E, Ratnakumar A, Arendt M-L et al. (2013) The geno-
mic signature of dog domestication reveals adaptation to a
starch-rich diet. Nature, 495, 360–364.Baird NA, Etter PD, Atwood TS et al. (2008) Rapid SNP discov-
ery and genetic mapping using sequenced RAD markers.
PLoS ONE, 3, e3376.
Barrett RDH, Schluter D (2008) Adaptation from standing
genetic variation. Trends in Ecology & Evolution, 23, 38–44.
© 2014 John Wiley & Sons Ltd
POPULATION GENOMICS OF GUPPY POPULATIONS 405

Barson NJ, Cable J, Van Oosterhout C (2009) Population genetic
analysis of microsatellite variation of guppies (Poecilia reticula-
ta) in Trinidad and Tobago: evidence for a dynamic source-
sink metapopulation structure, founder events and population
bottlenecks. Journal of Evolutionary Biology, 22, 485–497.Bell M, Foster S (1994) The Evolutionary Biology of the Threespine
Stickleback. Oxford University Press, Oxford.
Carvalho GR, Shaw PW, Magurran AE, Seghers BH (1991)
Marked genetic divergence revealed by allozymes among
populations of the guppy Poecilia reticuluta (Poeciliidae), in
Trinidad. Biological Journal of the Linnean Socieity, 42, 389–405.Castillo J, Crespo D, Capilla E et al. (2009) Evolutionary struc-
tural and functional conservation of an ortholog of the
GLUT2 glucose transporter gene (SLC2A2) in zebrafish.
American Journal of Physiology Regulatory, Integrative, and Com-
parative Physiology, 297, 1570–1581.Colosimo PF, Hosemann KE, Balabhadra S et al. (2005) Wide-
spread parallel evolution in sticklebacks by repeated fixation
of Ectodysplasin alleles. Science, 307, 1928–1933.Conesa A, G€otz S (2008) Blast2GO: a comprehensive suite for
functional analysis in plant genomics. International Journal of
Plant Genomics, 2008, 619832.
Conte GL, Arnegard ME, Peichel CL, Schluter D (2012) The
probability of genetic parallelism and convergence in natural
populations. Proceedings Biological Sciences/The Royal Society,
279, 5039–5047.Crispo E, Bentzen P, Reznick DN, Kinnison MT, Hendry AP
(2006) The relative influence of natural selection and geogra-
phy on gene flow in guppies. Molecular Ecology, 15, 49–62.Cruickshank TE, Hahn MW (2014) Reanalysis suggests that
genomic islands of speciation are due to reduced diversity,
not reduced gene flow. Molecular Ecology, 23, 3133–3157.Danecek P, Auton A, Abecasis G et al. (2011) The variant call
format and VCFtools. Bioinformatics, 27, 2156–2158.Das SK, Elbein SC (2006) The genetic basis of type 2 diabetes.
Cellscience, 2, 100–131.Deacon AE, Ramnarine IW, Magurran AE (2011) How repro-
ductive ecology contributes to the spread of a globally inva-
sive fish. PLoS ONE, 6, e24416.
DePristo MA, Banks E, Poplin R et al. (2011) A framework for
variation discovery and genotyping using next-generation
DNA sequencing data. Nature Genetics, 43, 491–498.Endler JA (1978) A predator’s view of animal color patterns.
Evolutionary Biology, 11, 319–364.Endler JA (1980) Natural selection on color patterns in Poecilia
reticulata. Evolution, 34, 76–91.Endler JA (1995) Multiple-trait coevolution and environmental
gradients in guppies. Trends in Ecology & Evolution, 10, 22–29.Evanno G, Regnaut S, Goudet J (2005) Detecting the number of
clusters of individuals using the software STRUCTURE: a
simulation study. Molecular Ecology, 14, 2611–2620.Fajen A, Breden F (1992) Mitochondrial DNA sequence varia-
tion among natural populations of the Trinidad guppy,
Poecilia reticulata. Evolution, 46, 1457–1465.Fourcade Y, Chaput-Bardy A, Secondi J, Fleurant C, Lemaire C
(2013) Is local selection so widespread in river organisms?
Fractal geometry of river networks leads to high bias in out-
lier detection. Molecular Ecology, 22, 2065–2073.Gautier M, Gharbi K, Cezard T et al. (2012) The effect of RAD
allele dropout on the estimation of genetic variation within
and between populations. Molecular Ecology, 22, 3165–3178.
Ghalambor CK, Reznick DN, Walker JA (2004) Constraints on
adaptive evolution: the functional trade-off between reproduc-
tion and fast-start swimming performance in the Trinidadian
guppy (Poecilia reticulata). The American Naturalist, 164, 38–50.Ghalambor CK, McKay JK, Carroll SP, Reznick DN (2007)
Adaptive versus non-adaptive phenotypic plasticity and the
potential for contemporary adaptation in new environments.
Functional Ecology, 21, 394–407.Grether GF, Millie DF, Bryant MJ, Reznick DN, Mayea W
(2001) Rain forest canopy cover, resource availability, and
life history evolution in guppies. Ecology, 82, 1546–1559.G€unther T, Coop G (2013) Robust identification of local adapta-
tion from allele frequencies. Genetics, 195, 205–220.Gutenkunst RN, Hernandez RD, Williamson SH, Bustamante
CD (2009) Inferring the joint demographic history of multiple
populations from multidimensional SNP frequency data.
PLoS Genetics, 5, e1000695.
Hecht BC, Campbell NR, Holecek DE, Narum SR (2013) Gen-
ome-wide association reveals genetic basis for the propensity
to migrate in wild populations of rainbow and steelhead
trout. Molecular Ecology, 22, 3061–3076.Hoekstra HE (2006) Genetics, development and evolution of
adaptive pigmentation in vertebrates. Heredity, 97, 222–234.Hoffmann AA, Anderson A, Hallas R (2002) Opposing clines
for high and low temperature resistance in Drosophila mela-
nogaster. Ecology Letters, 5, 614–618.Hohenlohe PA, Bassham S, Etter PD et al. (2010) Population
genomics of parallel adaptation in threespine stickleback
using sequenced RAD tags. PLoS Genetics, 6, e1000862.
Houde AE (1997) Sex, Color, and Mate Choice in Guppies. Prince-
ton University, Princeton.
Johnson AM, Chappell G, Price AC et al. (2010) Inbreeding
depression and inbreeding avoidance in a natural population
of guppies (Poecilia reticulata). Ethology, 116, 448–457.Jombart T (2008) Adegenet: a R package for the multivariate
analysis of genetic markers. Bioinformatics, 24, 1403–1405.Jones FC, Grabherr MG, Chan YF et al. (2012) The genomic
basis of adaptive evolution in threespine sticklebacks. Nature,
484, 55–61.J€onsson E (2013) The role of ghrelin in energy balance regula-
tion in fish. General and Comparative Endocrinology, 187, 79–85.Kelley JL, Magurran AE (2003) Effects of relaxed predation
pressure on visual predator recognition in the guppy. Behav-
ioral Ecology and Sociobiology, 54, 225–232.Kemp DJ, Reznick DN, Grether GF, Endler JA (2009) Predicting
the direction of ornament evolution in Trinidadian guppies
(Poecilia reticulata). Proceedings Biological Sciences/The Royal
Society, 276, 4335–4343.Li H, Durbin R (2011) Inference of human population history
from individual whole-genome sequences. Nature, 475,
493–496.Lotterhos KE, Whitlock MC (2014) Evaluation of demographic
history and neutral parameterization on the performance of
FST outlier tests. Molecular Ecology, 23, 2178–2192.Lunter G, Goodson M (2011) Stampy: a statistical algorithm for
sensitive and fast mapping of Illumina sequence reads.
Genome Research, 21, 936–939.Lynch M (2007) The Origins of Genome Architecture. Sinauer
Associates, Sunderland.
Magurran AE (2005) Evolutionary Ecology: The Trinidadian
Guppy. Oxford University Press, Oxford.
© 2014 John Wiley & Sons Ltd
406 B. A. FRASER ET AL.

Miller MR, Dunham JP, Amores A, Cresko WA, Johnson EA
(2007) Rapid and cost-effective polymorphism identification
and genotyping using restriction site associated DNA (RAD)
markers. Genome Research, 17, 240–248.Nachman MW, Hoekstra HE, D’Agostino SL (2003) The genetic
basis of adaptive melanism in pocket mice. Proceedings of the
National Academy of Sciences of the United States of America,
100, 5268–5273.Neff BD, Pitcher TE, Ramnarine IW (2008) Inter-population
variation in multiple paternity and reproductive skew in the
guppy. Molecular Ecology, 17, 2975–2984.Nosil P, Funk DJ, Ortiz-Barrientos D (2009) Divergent selection
and heterogeneous genomic divergence. Molecular Ecology,
18, 375–402.Ossowski S, Schneeberger K, Clark RM et al. (2008) Sequencing
of natural strains of Arabidopsis thaliana with short reads.
Genome Research, 18, 2024–2033.O’Steen S, Cullum AJ, Bennett AF (2002) Rapid evolution of
escape ability in Trinidadian guppies (Poecilia reticulata). Evo-
lution, 56, 776–784.Perrier C, Bourret V, Kent MP, Bernatchez L (2013) Parallel
and nonparallel genome-wide divergence among replicate
population pairs of freshwater and anadromous Atlantic sal-
mon. Molecular Ecology, 22, 5577–5593.Pitcher TE, Rodd FH, Rowe L (2008) Female choice and the
relatedness of mates in the guppy (Poecilia reticulata). Geneti-
ca, 134, 137–146.Poland JA, Brown PJ, Sorrells ME, Jannink J-L (2012) Develop-
ment of high-density genetic maps for barley and wheat
using a novel two-enzyme genotyping-by-sequencing
approach. PLoS ONE, 7, e32253.
Pritchard JK, Stephens M, Donnelly P (2000) Inference of popu-
lation structure using multilocus genotype data. Genetics,
155, 945–959.Renaut S, Maillet N, Normandeau E et al. (2012) Genome-wide
patterns of divergence during speciation: the lake whitefish
case study. Philosophical transactions of the Royal Society of Lon-
don Series B, Biological Sciences, 367, 354–363.Renaut S, Owens GL, Rieseberg LH (2014) Shared selective
pressure and local genomic landscape lead to repeatable pat-
terns of genomic divergence in sunflowers. Molecular Ecology,
23, 311–324.Reznick D (1982) The impact of predation on life history evolu-
tion in Trinidadian guppies: genetic basis of observed life
history patterns. Evolution, 36, 1236–1250.Reznick DN, Bryga H (1987) Life-history evolution in guppies
(Poecilia reticulata): 1. Phenotypic and genetic changes in an
introduction experiment. Evolution, 41, 1370–1385.Reznick DN, Bryga HA (1996) Life-history evolution in guppies
(Poecilia reticulata: Poeciliidae). V. Genetic basis of parallelism
in life histories. The American Naturalist, 147, 339–359.Reznick D, Endler JA (1982) The impact of predation on life
history evolution in Trinidadian guppies (Poecilia reticulata).
Evolution, 36, 160–177.Reznick DN, Bryga H, Endler JA (1990) Experimentally
induced life-history evolution in a natural population. Nat-
ure, 346, 357–359.Reznick DN, Rodd FH, Cardenas M (1996) Life-history
evolution in guppies (Poecilia reticulata: Poeciliidae). IV. Par-
allelism in life-history phenotypes. American Naturalist, 147,
319–338.
Reznick DN, Shaw FH, Rodd FH, Shaw RG (1997) Evaluation
of the rate of evolution in natural populations of guppies
(Poecilia reticulata). Science, 275, 1934–1937.Reznick D, Butler MJ IV, Rodd H (2001) Life-history evolution
in guppies. VII. The comparative ecology of high- and low-
predation environments. The American Naturalist, 157,
126–140.Reznick D, Rodd H, Nunney L (2004) Empirical evidence for
rapid evolution. In: Evolutionary Conservation Biology (eds
Ferrier R, Dieckmann U, Covet D), pp. 101–118. Cambridge
University Press, Cambridge, UK.
Roda F, Ambrose L, Walter GM et al. (2013) Genomic evidence
for the parallel evolution of coastal forms in the Senecio lau-
tus complex. Molecular Ecology, 22, 2941–2952.Roesti M, Hendry AP, Salzburger W, Berner D (2012) Genome
divergence during evolutionary diversification as revealed in
replicate lake-stream stickleback population pairs. Molecular
Ecology, 21, 2852–2862.Rosenberg NA (2004) DISTRUCT: a program for the graphical
display of population structure. Molecular Ecology Notes, 4,
137–138.Rosenblum EB, Parent CE, Brandt EE (2014) The molecular
basis of phenotypic convergence. Annual Review of Ecology,
Evolution, and Systematics, 45, 203–226.Russo V, Fontanesi L, Davoli R, Galli S (2004) Linkage map-
ping of the porcine cathepsin F (CTSF) gene close to the QTL
regions for meat and fat deposition traits on pig chromo-
some 2. Animal Genetics, 35, 142–167.Schluter D (2000) The Ecology of Adaptive Radiation. Oxford Uni-
versity Press, Oxford.
Schories S, Meyer MK, Schartl M (2009) Description of Poecilia
(Acanthophacelus) obscura n.sp., (Teleostei: Poeciliidae), a
new guppy species from western Trinidad, with remarks on
P.wingei and the status of the “Endler’s guppy”. Zootaxa,
2266, 35–50.Seghers BH (1974) Schooling behavior in the guppy (Poecilia re-
ticulata): an evolutionary response to predation. Evolution, 28,
486–489.Seghers BH, Magurran AE (1995) Population differences in the
schooling behavior of the Trinidad guppy, Poecilia reticulata: adap-
tation or constraint?Canadian Journal of Zoology, 73, 1100–1105.Soria-Carrasco V, Gompert Z, Comeault AA et al. (2014) Stick
insect genomes reveal natural selection’s role in parallel spe-
ciation. Science, 344, 738–742.Sousa V, Hey J (2013) Understanding the origin of species with
genome-scale data: modelling gene flow. Nature Reviews
Genetics, 14, 404–414.Suk HY, Neff BD (2009) Microsatellite genetic differentiation
among populations of the Trinidadian guppy. Heredity, 102,
425–434.Van Oosterhout C, Joyce DA, Cummings SM et al. (2006)
Balancing selection, random genetic drift, and genetic vari-
ation at the major histocompatibility complex in two wild
populations of guppies (Poecilia reticulata). Evolution, 60,
2562–2574.Van Oosterhout C, Mohammed RS, Hansen H et al. (2007)
Selection by parasites in spate conditions in wild Trinidadian
guppies (Poecilia reticulata). International Journal for Parasitol-
ogy, 37, 805–812.Weir BS, Cockerham CC (1984) Estimating F-statistics for the
analysis of population structure. Evolution, 38, 1358–1370.
© 2014 John Wiley & Sons Ltd
POPULATION GENOMICS OF GUPPY POPULATIONS 407

Willing E-M, Bentzen P, van Oosterhout C et al. (2010) Gen-
ome-wide single nucleotide polymorphisms reveal popula-
tion history and adaptive divergence in wild guppies.
Molecular Ecology, 19, 968–984.Wu T, Patel H, Mukai S et al. (2000) Activin, inhibin, and
follistatin in zebrafish ovary: expression and role in oocyte
maturation. Biology of Reproduction, 62, 1585–1592.
B.A.F., D.N.R., C.D. and D.W. designed the research.
B.A.F. and D.N.R. collected the samples. B.A.F. did the
molecular work. B.A.F. and A.K. conducted the bioinfor-
matics analysis. B.A.F. analysed the data. B.A.F. wrote the
manuscript with input from the other authors.
Data accessibility
All demultiplexed read data used for genotyping submitted
to NCBI SRA: BioProject ID PRJNA248075. The reference
genome used for mapping and annotation is available on
NCBI assembly accession no: GCF_000633615.1.
A full SNP data set is available on dryad. Dryad
doi:10.5061/dryad.n35j4
Supporting information
Additional supporting information may be found in the online
version of this article.
Appendix S1 Materials and Methods.
Fig. S1 Results from STRUCTURE with increasing number of clus-
ters estimated (K = 2–9) and the resulting maximum likelihood
scores [lnP(d)].
Fig. S2 Principal component analysis, axis 1 and 2.
Table S1 Summary of SNPs and outlier analysis on individual
SNPs usng an FST outlier approach for each river pair (high
and low predation population within the same river system).
Table S2 Pairwise FST values for each population studied.
Table S3 Q-values (5–95% CI) for each individual grouped by
population for the four cluster model from the Structure analy-
sis (excel spreadsheet).
Table S4 Nested demographic models.
Table S5 Outlier analysis on individual SNPs that were
genotyped for all populations using an FST outlier approach
for each river pair (high and low predation population within
the same river system).
Table S6 Non-random distribution of outlier windows on link-
age groups.
Table S7 Comparison of outlier windows and non-outlier
windows.
Table S8 Autocorrelation of outlier SNPs within each river
pair.
Table S9 FST results for windows where all three natural river
pairs or at least four pairs had a significant FST window
outlier.
Table S10 Heterozygosity measures for windows where all
three natural river pairs or at least four pairs had a significant
FST outlier.
Table S11 Annotation of gene models for windows where all
three natural river pairs or at least four river pairs had a signif-
icant FST outlier.
Table S12 The number of overlap in SNPs above the 95%
quantile among river comparisons (v2 = 67.5, d.f. = 1,
P < 0.0001).
Table S13 The four SNPs that were above the 95% quantile in
three river comparisons.
Table S14 Pooled heterozygosity measures for windows with
overlapping FST outliers in the two introduction river analyses.
Table S15 Enriched GO annotations (Biological Processes) for
gene models found in FST outliers regions shared in both intro-
duction populations (Aripo and El Cedro) river analyses.
Table S16 Annotation of gene models within outlier windows
shared by both introduction populations.
Table S17 Descriptive statistics for outlier loci using BAYENV2.
Table S18 Annotation of bayenv outlier loci within 50 kb.
Table S19 Summary of population samples with low coverage
individuals removed.
Table S20 Summary of FST analysis with low coverage individ-
uals removed.
Table S21 Tests of independence of outlier windows between
rivers with low coverage individuals removed.
Table S22 Correlation of individual loci to predation regime
with low coverage individuals removed.
© 2014 John Wiley & Sons Ltd
408 B. A. FRASER ET AL.
Copyright © 2022 FDOKUMEN