
BMC Genomics - CiteSeerX
15
BioMed Central Page 1 of 15 (page number not for citation purposes) BMC Genomics Open Access Research article Gene connectivity, function, and sequence conservation: predictions from modular yeast co-expression networks Marc RJ Carlson 1 , Bin Zhang 2 , Zixing Fang 3,4 , Paul S Mischel 5 , Steve Horvath 1,6 and Stanley F Nelson* 1,7 Address: 1 Department of Human Genetics, David Geffen School of Medicine at UCLA, Gonda (Goldschmied) Neuroscience and Genetics Research Center, 695 Charles E. Young Drive South, Los Angeles, CA 90095-7088, USA, 2 Rosetta Inpharmatics LLC, 401 Terry Avenue North, Seattle, WA 98109, USA, 3 Cancer Prevention Institute 4100 South Kettering Blvd., Dayton, OH 45439, USA, 4 Department of Community Health, School of Medicine, Wright State University 136 F.A. White Health Center 3640 Colonel Glenn Highway, Dayton, OH 45435, USA, 5 Department of Pathology and Laboratory Medicine, UCLA, 10833 Le Conte Ave. Los Angeles, CA 90095, USA, 6 Department of Biostatistics, UCLA, CHS Suite 51- 236 650 Charles E. Young Dr. Los Angeles, CA 90095, USA and 7 Department of Psychiatry, David Geffen School of Medicine, UCLA, 760 Westwood Plaza Los Angeles, CA 90095, USA Email: Marc RJ Carlson - [email protected]; Bin Zhang - [email protected]; Zixing Fang - [email protected]; Paul S Mischel - [email protected]; Steve Horvath - [email protected]; Stanley F Nelson* - [email protected] * Corresponding author Abstract Background: Genes and proteins are organized into functional modular networks in which the network context of a gene or protein has implications for cellular function. Highly connected hub proteins, largely responsible for maintaining network connectivity, have been found to be much more likely to be essential for yeast survival. Results: Here we investigate the properties of weighted gene co-expression networks formed from multiple microarray datasets. The constructed networks approximate scale-free topology, but this is not universal across all datasets. We show strong positive correlations between gene connectivity within the whole network and gene essentiality as well as gene sequence conservation. We demonstrate the preservation of a modular structure of the networks formed, and demonstrate that, within some of these modules, it is possible to observe a strong correlation between connectivity and essentiality or between connectivity and conservation within the modules particularly within modules containing larger numbers of essential genes. Conclusion: Application of these techniques can allow a finer scale prediction of relative gene importance for a particular process within a group of similarly expressed genes. Background Genes and their protein products carry out cellular proc- esses in the context of functional modules and are related to each other through a complex network of interactions [1]. Understanding an individual gene or protein's net- work properties within such networks may prove to be as important as understanding its function in isolation [2]. Because of this, numerous studies have focused on the large scale modeling of genomic and proteomic data. Uti- lizing network theory, these studies have yielded insights into biological systems. For example, both protein inter- action networks and gene co-expression networks exhibit Published: 03 March 2006 BMC Genomics2006, 7:40 doi:10.1186/1471-2164-7-40 Received: 04 September 2005 Accepted: 03 March 2006 This article is available from: http://www.biomedcentral.com/1471-2164/7/40 © 2006Carlson et al; licensee BioMed Central Ltd. This is an Open Access article distributed under the terms of the Creative Commons Attribution License (http://creativecommons.org/licenses/by/2.0 ), which permits unrestricted use, distribution, and reproduction in any medium, provided the original work is properly cited.
-
Upload
khangminh22 -
Category
Documents
-
view
2 -
download
0
Transcript of BMC Genomics - CiteSeerX
BioMed CentralBMC Genomics
ss
Open AcceResearch articleGene connectivity, function, and sequence conservation: predictions from modular yeast co-expression networksMarc RJ Carlson1, Bin Zhang2, Zixing Fang3,4, Paul S Mischel5, Steve Horvath1,6 and Stanley F Nelson*1,7Address: 1Department of Human Genetics, David Geffen School of Medicine at UCLA, Gonda (Goldschmied) Neuroscience and Genetics Research Center, 695 Charles E. Young Drive South, Los Angeles, CA 90095-7088, USA, 2Rosetta Inpharmatics LLC, 401 Terry Avenue North, Seattle, WA 98109, USA, 3Cancer Prevention Institute 4100 South Kettering Blvd., Dayton, OH 45439, USA, 4Department of Community Health, School of Medicine, Wright State University 136 F.A. White Health Center 3640 Colonel Glenn Highway, Dayton, OH 45435, USA, 5Department of Pathology and Laboratory Medicine, UCLA, 10833 Le Conte Ave. Los Angeles, CA 90095, USA, 6Department of Biostatistics, UCLA, CHS Suite 51-236 650 Charles E. Young Dr. Los Angeles, CA 90095, USA and 7Department of Psychiatry, David Geffen School of Medicine, UCLA, 760 Westwood Plaza Los Angeles, CA 90095, USA
Email: Marc RJ Carlson - [email protected]; Bin Zhang - [email protected]; Zixing Fang - [email protected]; Paul S Mischel - [email protected]; Steve Horvath - [email protected]; Stanley F Nelson* - [email protected]
* Corresponding author
AbstractBackground: Genes and proteins are organized into functional modular networks in which thenetwork context of a gene or protein has implications for cellular function. Highly connected hubproteins, largely responsible for maintaining network connectivity, have been found to be muchmore likely to be essential for yeast survival.
Results: Here we investigate the properties of weighted gene co-expression networks formedfrom multiple microarray datasets. The constructed networks approximate scale-free topology,but this is not universal across all datasets. We show strong positive correlations between geneconnectivity within the whole network and gene essentiality as well as gene sequence conservation.We demonstrate the preservation of a modular structure of the networks formed, anddemonstrate that, within some of these modules, it is possible to observe a strong correlationbetween connectivity and essentiality or between connectivity and conservation within themodules particularly within modules containing larger numbers of essential genes.
Conclusion: Application of these techniques can allow a finer scale prediction of relative geneimportance for a particular process within a group of similarly expressed genes.
BackgroundGenes and their protein products carry out cellular proc-esses in the context of functional modules and are relatedto each other through a complex network of interactions[1]. Understanding an individual gene or protein's net-work properties within such networks may prove to be as
important as understanding its function in isolation [2].Because of this, numerous studies have focused on thelarge scale modeling of genomic and proteomic data. Uti-lizing network theory, these studies have yielded insightsinto biological systems. For example, both protein inter-action networks and gene co-expression networks exhibit
Published: 03 March 2006
BMC Genomics2006, 7:40 doi:10.1186/1471-2164-7-40
Received: 04 September 2005Accepted: 03 March 2006
This article is available from: http://www.biomedcentral.com/1471-2164/7/40
© 2006Carlson et al; licensee BioMed Central Ltd.This is an Open Access article distributed under the terms of the Creative Commons Attribution License (http://creativecommons.org/licenses/by/2.0), which permits unrestricted use, distribution, and reproduction in any medium, provided the original work is properly cited.
Page 1 of 15(page number not for citation purposes)
BMC Genomics 2006, 7:40 http://www.biomedcentral.com/1471-2164/7/40
a strong modularity reflecting functional partitioning.Both of these network types have been frequentlyobserved as having a scale-free topology, with the exist-ence of highly connected hub nodes [3-7].
Scale-free networks are resistant to random perturbationsbut sensitive to targeted removal of highly connectednodes [8]. Comprehensive efforts to determine the func-tional consequences of individual gene deletions in yeastprovide the opportunity to study the relationship betweenindividual gene network properties and gene deletionlethality [9]. For example, physical interaction studies inyeast have allowed comparison of connectivity to geneessentiality based on gene deletion. [10]. Typical of scale-free networks, there were few highly connected proteinswithin the network, and the deletion of a protein with alarge number of binding partners is more likely to belethal in yeast. Thus, the relative position of nodes withina protein interaction network is strongly affiliated withdistinct biological properties of individual proteins. Simi-larly, analysis of unweighted gene co-expression networkshave revealed a relationship between connectivity andessentiality across all genes [11].
Correlation of gene expression across a wide variety ofexperimental perturbations has been shown to clustergenes of similar function [12]. Since this guilt-by-associa-tion approach may lead to false positive groupings,approaches have been refined by comparing orthologsacross divergent species indicating that highly conservedco-expression is a strong predictor that two genes willfunction in similar pathways [13-15]. This indicates thatfunctionally related genes are under similar expressionconstraints. The gene co-expression networks that arebased on these relationships have been shown in multiplespecies to be frequently scale-free and exhibit a smallworld architecture similar to protein interaction networkseven though they are generally more strongly connected[3,14]. It is still unclear however, to what degree the net-work properties of individual genes within a co-expres-sion network can predict relative gene importance for aparticular process. To assess this, we have constructedthree networks based on a weighted measure of connectiv-ity [16] of correlated gene expression in yeast using threeseparate microarray data sets. We assessed relationshipsbetween essentiality and connectivity of each gene withinthe whole network. Further, we define 'modules' (groupsof highly correlated genes) and determine that in someinstances, the relative importance of genes within thesemodules can be inferred from network connectivity. Wedemonstrate that genes which have high connectivity (i.e.'hub' genes) within a weighted co-expression network aresignificantly more likely to be essential for yeast viability.Furthermore, we demonstrate a relationship between con-nectivity and a measure of sequence conservation. Finally,
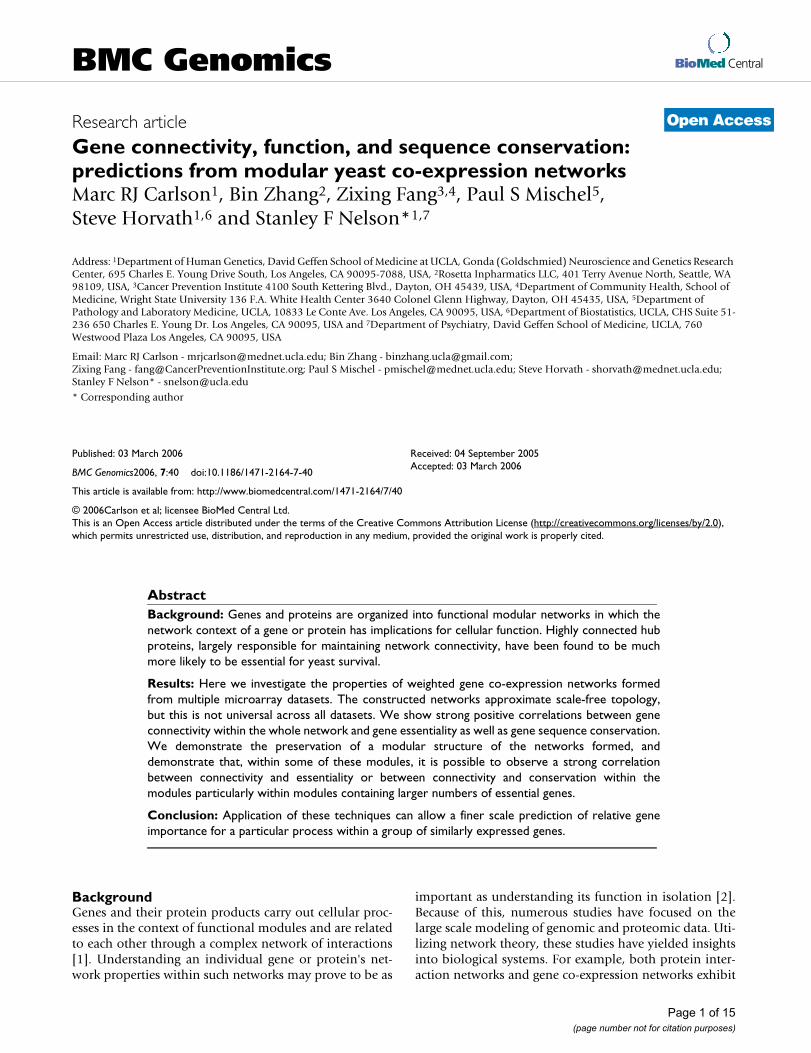
Generating a gene co-expression networkFigure 1Generating a gene co-expression network. (A) Illustra-tion to show how genes that are highly correlated (blue) will look across a dataset. (B-C) Flow chart for defining a gene co-expression network based on a simple Pearson correla-tion matrix. (D) An example visualization of a network pro-duced by using the Fruchterman Rheingold algorithm on the data in Figure 1B and 1C. The node highlighted in yellow, is an example of the kind of highly connected node that this study shows is more likely to be an essential gene for sur-vival.
Page 2 of 15(page number not for citation purposes)

BMC Genomics 2006, 7:40 http://www.biomedcentral.com/1471-2164/7/40
Page 3 of 15(page number not for citation purposes)
Global gene co-expression networksFigure 2Global gene co-expression networks. (A-C) Log-log plots of connectivity distributions in each of the three networks drawn from DNA Damage, Environmental Response, and Cell Cycle, respectively. The linear relationship indicates a scale-free structure. (D-F) Correlation plots showing the relationship between gene group connectivity and essentiality in the same order as A-C. On the y axis of these plots is the percentage of genes determined to be essential in yeast. (G-I) Relationship between the average blastp score of a node and k for all datasets in the same order as A-C. On the y axis of these plots is the average log(e score) of genes within that bin. For plots D-I, the connectivity within each network for each gene was determined and each gene rank ordered by connectivity. 20 equal sized bins for each of the expression datasets were formed and the average connectivity of the genes in each bin plotted on the X axis
BMC Genomics 2006, 7:40 http://www.biomedcentral.com/1471-2164/7/40
Page 4 of 15(page number not for citation purposes)
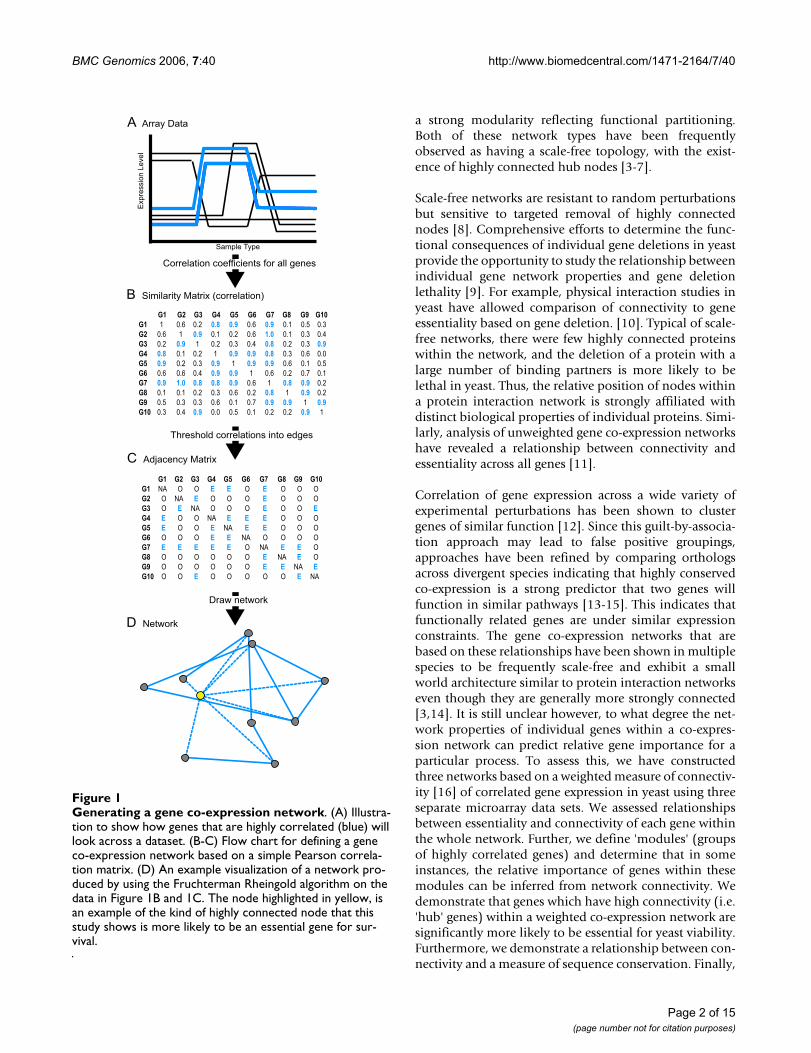
A co-expression network of the DNA Damage datasetFigure 3A co-expression network of the DNA Damage dataset. For all panels in the figure: blue color represents members of the rRNA processing module, yellow color represents members of the protein synthesis module and red color represents members of the ubiquitin pathway. (A) A hierarchical clustering of the topological overlap matrix for the DD dataset. (B) A drawn network of gene co-expression from the DD dataset. Edges were computed from the Pearson correlation coefficients. Network structure was drawn in Pajek [20]. Each gene is represented as a dot. Edges are drawn as grey lines. Colored dots belong to the module that their color indicates and grey dots indicate all other genes in the network. (C-E) Scatter plots show-ing the relationship between gene group connectivity and essentiality for rRNA processing, protein synthesis and ubiquitin from the DD network respectively. On the y axis of these plots is the percentage of genes determined to be essential in yeast. The number of essential genes in each module/total number of genes in each module was: 196/390 = 50.3 (C), 122/441 = 27.7 (D), 50/222 = 22.5 (E). (F-H) Relationship between the average blastp score of a node and k for the same module members listed in C-E. On the y axis of these plots is the average log(e score) of genes within that bin. For plots C-H, the connectivity within each module for each gene was determined and each gene rank ordered by connectivity. 20 equal sized bins for each of the expression datasets were formed and the average connectivity of the genes in each bin plotted on the X axis.
BMC Genomics 2006, 7:40 http://www.biomedcentral.com/1471-2164/7/40
Page 5 of 15(page number not for citation purposes)
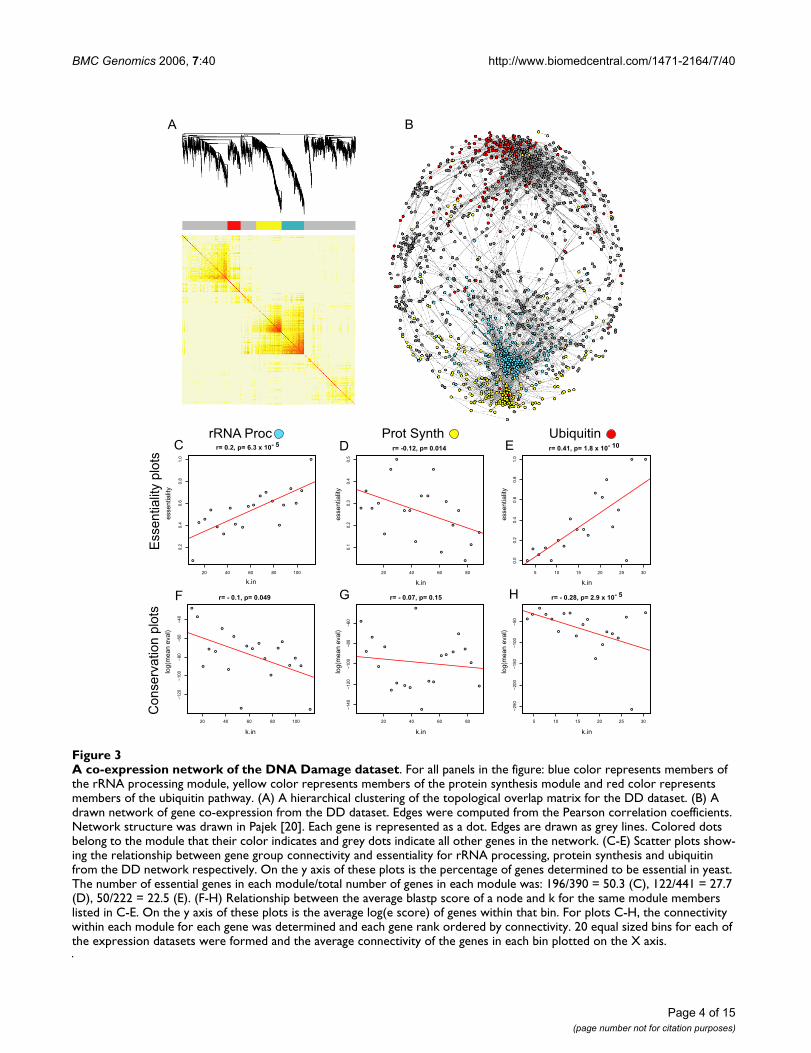
A co-expression network of the Environmental Response datasetFigure 4A co-expression network of the Environmental Response dataset. For all panels in the figure: blue color represents members of the rRNA processing module, yellow color represents members of the protein synthesis module and red color represents members of the ubiquitin pathway. (A) A hierarchical clustering of the topological overlap matrix for the ER data-set. (B) A drawn network of gene co-expression from the ER dataset. A drawn network of gene co-expression from the DD dataset. Edges were computed from the Pearson correlation coefficients. Network structure was drawn in Pajek [20]. Each gene is represented as a dot. Edges are drawn as grey lines. Colored dots belong to the module that their color indicates and grey dots indicate all other genes in the network. (C-E) Correlation plots showing the relationship between gene group con-nectivity and essentiality for rRNA processing, protein synthesis and ubiquitin from the ER network respectively. On the y axis of these plots is the percentage of genes determined to be essential in yeast. The number of essential genes in each module/total number of genes in each module was: 317/929 = 34.1 (C), 98/323 = 30.3 (D), 18/37 = 48.6 (E). (F-H) Relationship between the average blastp score of a node and k for the same module members listed in C-E. On the y axis of these plots is the average log(e score) of genes within that bin. For plots C-H, the connectivity within each module for each gene was deter-mined and each gene rank ordered by connectivity.

BMC Genomics 2006, 7:40 http://www.biomedcentral.com/1471-2164/7/40
Page 6 of 15(page number not for citation purposes)
A co-expression network of the Cell Cycle datasetFigure 5A co-expression network of the Cell Cycle dataset. For all panels in the figure: blue color represents members of the rRNA processing module, yellow color represents members of the protein synthesis module and red color represents mem-bers of the ubiquitin pathway. (A) A hierarchical clustering of the topological overlap matrix for the CC dataset. (B) A drawn network of gene co-expression from the CC dataset. A drawn network of gene co-expression from the DD dataset. Edges were computed from the Pearson correlation coefficients. Network structure was drawn in Pajek [20]. Each gene is repre-sented as a dot. Edges are drawn as grey lines. Colored dots belong to the module that their color indicates and grey dots indi-cate all other genes in the network. (C-E) Correlation plots showing the relationship between gene group connectivity and essentiality for rRNA processing, protein synthesis and ubiquitin from the CC network respectively. On the y axis of these plots is the percentage of genes determined to be essential in yeast. The number of essential genes in each module/total number of genes in each module was: 154/300 = 51.3 (C), 105/398 = 26.4 (D), 38/312 = 12.2 (E). (F-H) Relationship between the average blastp score of a node and k for the same module members listed in C-E. On the y axis of these plots is the aver-age log(e score) of genes within that bin. For plots C-H, the connectivity within each module for each gene was determined and each gene rank ordered by connectivity.
BMC Genomics 2006, 7:40 http://www.biomedcentral.com/1471-2164/7/40
we show that certain critical modules are conserved fromone network to another, and that in many cases it is pos-sible to extend the relationship between connectivity andessentiality or between connectivity and conservationwithin given modules. Thus, analysis of gene co-expres-sion networks provides insight into the functional impor-tance of individual genes within modules of co-expressedgenes.
ResultsNetwork validation and propertiesIn order to test the relationship between gene connectivitywithin the co-expression network and gene essentiality,we first constructed three networks corresponding to threemicroarray datasets. The yeast microarray data werederived from experiments designed to analyze DNA Dam-age (DD) (n = 51), Cell Cycle (CC) (n = 44), and Environ-mental Response (ER) (n = 151) [17-19]. Each networkwas constructed as conceptually shown in Figure 1. Nodeswere defined as individual genes. The co-expression net-work is based upon the correlation relationships betweenindividual genes across a dataset (Figure 1A). From themicroarray data, the absolute value of the Pearson corre-lation is the initial measure of gene co-expression similar-ity (Figure 1B). This co-expression similarity was thentransformed into an adjacency matrix (Figure 1C) by rais-ing the similarity to a certain power based on a scale freetopology criterion as described previously [16]. The pow-ers selected were 12 (DD), 10 (CC), and 18 (ER). Thesedata can also be visualized as a drawn network (Figure1D).
Each of the datasets resulted in the construction of distinctnetworks but with global similarities. The differences inthe modularity of the three networks is demonstrated bycomparing the heat maps of the topological overlapmatrices (Figures 3A, 4A, and 5A). A topological overlapmatrix is an indicator of the similarity of all the nodes inquestion and is defined in detail in the methods section ofthis manuscript. Approximations of all three of the net-works are also drawn in Figures 3B, 4B and 5B using theFruchterman-Reingold algorithm as implemented inPajek [20,21] and demonstrate obvious modularity withaggregation of genes into strongly co-expressed groups.
Individual gene connections can be difficult to visualizein such complex graphs as presented. Thus, in order toprobe the structure of the network, we first sought todetermine characteristics of the general network topology.We considered two models. To quantify the fit to the scalefree topology model or to the truncated exponentialmodel, we used the model fitting index R-squared of thecorresponding linear model involving the log trans-formed variables [16]. The pattern of network connectiv-ity in these datasets approximated a scale-free topology
(Figures 2A, 2B, and 2C). These results are similar to thegeneral trend with genetic perturbation networks andother gene co-expression networks [3,22]. However, geneco-expression networks may better fit an exponentialpower law [23]. For two of the three constructed yeast net-works (DD and ER), the distribution of connectivity (k) ofgenes best fits a power law p(k) ~ k-γ and the other (CC)best fits an exponentially truncated power law p(k) ~ k-γe-αk [24]. We point out that in general that regardless ofthe overall structure, the major trend is that the high con-nectivity genes are few in number, and that most geneshave low connectivity (Figure 2A–2C).
Global network connectivity relationshipsNetwork modeling in biological systems [2,8,11] stressesthe relative importance of highly connected nodes. Thus,the small number of high connectivity genes within thegene co-expression networks defined here are expected tobe more important. To test the relative importance of eachgene across the entire network, we determined the rela-tionship between connectivity and gene essentiality. Allthe genes for a network were first ranked according totheir weighted connectivity and then placed into 20 equalsized bins according to their position in this ranking. Theweighted connectivity of a given gene is defined as thesum of its connection strengths with all other genes in thenetwork (see the methods section). The percentage ofessential genes in each bin was then plotted against themean connectivity in each bin (Figure 2D–2F). We alsocalculated the Spearman correlation coefficient based onthe ranked unbinned data and found that there is a rela-tionship between the connectivity and the proportion ofessential genes in each of the three datasets (R > 0.2, andp value < 10-39) for each network. While the binned plotsare well suited for visualizing the results, we calculated thecorrelation coefficients on the raw, unbinned data toarrive at a valid p-value.
To study whether our conclusions were being undulyinfluenced by data outliers, we removed genes whose con-nectivity was more than two standard deviations awayfrom mean connectivity but found no substantial varia-tion in the reported relationships. Thus, there is a clearrelationship between connectivity of genes, in theseweighted gene co-expression networks, and gene essenti-ality across the whole network. These results are robustwith respect to experimental conditions since the threeseparate datasets all have the same functional relationshipbetween connectivity and gene essentiality. These resultsare consistent with a single whole network generated fromgene co-expression data and using an unweighted net-work [11], as well as networks based on protein-proteininteractions [10].
Page 7 of 15(page number not for citation purposes)

BMC Genomics 2006, 7:40 http://www.biomedcentral.com/1471-2164/7/40
Table 1: Identifying modules that repeated from one dataset to another
Ontology term rRNA Prot Ubiq
DNA Dmg
Env Stress
Cell Cycle
DNA Dmg
Env Stress
Cell Cycle
DNA Dmg
Env Stress
Cell Cycle
35S primary transcript processing 1E-17 8.8E-16 7.5E-16 0.17 0.51 0.52 0.26 1 0.16processing of 20S pre-rRNA 2E-32 5E-19 3.8E-32 0.018 0.37 1 0.17 1 0.11ribosomal large subunit biogenesis 9.6E-13 0.0000071 3.5E-15 0.38 1 0.38 1 1 0.62rRNA modification 2.1E-08 0.0043 0.00014 0.66 0.019 0.00066 1 1 0.62rRNA processing 1.2E-25 1.6E-16 2.5E-23 0.48 1 0.62 0.11 1 0.046protein biosynthesis 0.0001 1.1E-11 0.0023 5.9E-83 5.6E-108 1.4E-80 0.53 0.42 0.00033translational elongation 0.62 0.14 0.63 2.1E-08 3E-08 1.7E-09 1 1 0.64translational initiation 0.19 1 0.025 0.000017 1.8E-14 3.4E-07 0.41 1 0.25ubiquitin-dependent protein catabolism
0.039 0.02 0.071 0.027 0.048 0.018 2.5E-25 7.3E-25 6.3E-17
ATP-dependent RNA helicase activity
7.2E-11 9.2E-08 4.1E-11 0.39 0.62 1 1 1 0.62
DNA-directed RNA polymerase activity
6.1E-13 4E-08 1.4E-09 0.77 0.012 0.13 0.42 1 0.4
snoRNA binding 1.3E-27 7.6E-17 2.4E-25 0.042 0.51 0.76 0.42 1 0.16structural constituent of ribosome 0.00012 2.2E-11 0.000078 3.1E-92 5.3E-117 1.8E-95 0.097 0.41 0.0021translation initiation factor activity 0.16 0.48 0.14 4.7E-08 5.5E-17 2.3E-10 1 1 0.39endopeptidase activity 0.25 0.21 0.62 0.16 0.62 0.39 9.2E-21 2.6E-18 2.7E-11
nucleolus 1.6E-48 3.4E-29 1.3E-45 0.18 0.65 0.84 0.021 0.48 0.0056nucleus 1.2E-18 8.3E-13 7.8E-10 0.0053 2.1E-07 0.12 0.0048 1 0.033small nucleolar ribonucleoprotein complex
7.9E-20 2.8E-09 1.3E-14 0.16 0.67 0.42 0.63 1 0.39
cytosolic large ribosomal subunit 0.03 0.0000016 0.0087 2.1E-65 3.4E-75 6.1E-67 0.021 1 0.0056cytosolic small ribosomal subunit 0.059 0.0013 0.26 1.5E-41 1.2E-47 4.6E-42 0.073 1 0.03ribosome 1 0.39 0.3 2.7E-09 6.2E-14 3.7E-09 1 1 0.62
*For each module in each dataset analyzed, an EASE analysis [25] was performed by using Fisher's exact test and the resulting p-values were placed into the table based on the prevalence of the GO (Gene Ontology) term being searched for. The most significant enrichments for a given term are indicated in italics
Yeast co-expression networks fit an evolutionarily plausi-ble model in which network connection distribution is anatural consequence of gene duplication, mutation anddeletions [13]. The emergence of approximate power-lawdistribution (scale free topology) is intimately linked tothe growth of the network in which new nodes are prefer-entially attached to highly connected already establishednodes [2,8]. A direct consequence of this network growthmodel is that high connectivity 'hub' genes are more likelyto be highly conserved across different species. Statedanother way, within a gene co-expression network theoldest nodes would be more likely than the newer nodesto be in hub positions. With this in mind, we examinedthe relationship between connectivity and the relativeevolutionary sequence conservation of a node (as evi-denced by the average best blastp hit log(e score) againstN. crassa C. elegans, D. melanogaster, H. sapiens, and M.musculus). High connectivity genes are plotted in Figure2G–2I relative to the average of the blastp hit in four othereukaryotic genomes. As before, we calculated the Spear-man correlation for the ranked, but still unbinned, data
and found that there is a relatively weak but highly signif-icant correlation indicating that high connectivity genesare more evolutionarily conserved (R = -0.15, p value =1.3 × 10⁻¹⁹, for the DD network; R = -0.22, p value < 1.4 ×10-39 for ER network; and R = -0.18, p value = 4.0 × 10⁻²⁹
for the CC network). Our results were robust with respectto the removal of outlier genes (i.e. genes whose connec-tivity was more than two standard deviations away frommean connectivity). This relationship is similar to thatreported for gene perturbation networks [22] and in evo-lutionarily conserved gene co-expression relationships[14].
Identification of modulesIn order to identify modules, we performed hierarchicalclustering on the topological overlap matrix derived fromthese networks as described in the methods section. Indoing so, we identified modules that involve conservedprocesses for rRNA processing, protein synthesis, andubiquitination (Table 1) using an EASE analysis [25]. Oneprediction about network constructions is that certain crit-
Page 8 of 15(page number not for citation purposes)
BMC Genomics 2006, 7:40 http://www.biomedcentral.com/1471-2164/7/40
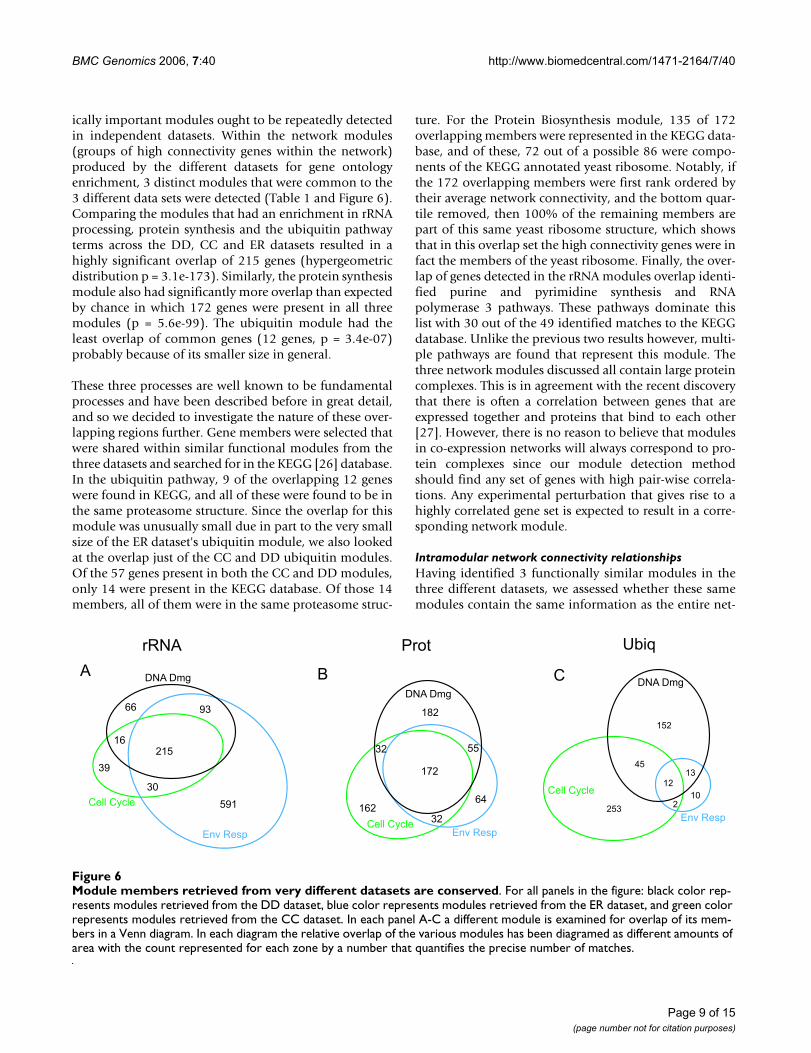
ically important modules ought to be repeatedly detectedin independent datasets. Within the network modules(groups of high connectivity genes within the network)produced by the different datasets for gene ontologyenrichment, 3 distinct modules that were common to the3 different data sets were detected (Table 1 and Figure 6).Comparing the modules that had an enrichment in rRNAprocessing, protein synthesis and the ubiquitin pathwayterms across the DD, CC and ER datasets resulted in ahighly significant overlap of 215 genes (hypergeometricdistribution p = 3.1e-173). Similarly, the protein synthesismodule also had significantly more overlap than expectedby chance in which 172 genes were present in all threemodules (p = 5.6e-99). The ubiquitin module had theleast overlap of common genes (12 genes, p = 3.4e-07)probably because of its smaller size in general.
These three processes are well known to be fundamentalprocesses and have been described before in great detail,and so we decided to investigate the nature of these over-lapping regions further. Gene members were selected thatwere shared within similar functional modules from thethree datasets and searched for in the KEGG [26] database.In the ubiquitin pathway, 9 of the overlapping 12 geneswere found in KEGG, and all of these were found to be inthe same proteasome structure. Since the overlap for thismodule was unusually small due in part to the very smallsize of the ER dataset's ubiquitin module, we also lookedat the overlap just of the CC and DD ubiquitin modules.Of the 57 genes present in both the CC and DD modules,only 14 were present in the KEGG database. Of those 14members, all of them were in the same proteasome struc-
ture. For the Protein Biosynthesis module, 135 of 172overlapping members were represented in the KEGG data-base, and of these, 72 out of a possible 86 were compo-nents of the KEGG annotated yeast ribosome. Notably, ifthe 172 overlapping members were first rank ordered bytheir average network connectivity, and the bottom quar-tile removed, then 100% of the remaining members arepart of this same yeast ribosome structure, which showsthat in this overlap set the high connectivity genes were infact the members of the yeast ribosome. Finally, the over-lap of genes detected in the rRNA modules overlap identi-fied purine and pyrimidine synthesis and RNApolymerase 3 pathways. These pathways dominate thislist with 30 out of the 49 identified matches to the KEGGdatabase. Unlike the previous two results however, multi-ple pathways are found that represent this module. Thethree network modules discussed all contain large proteincomplexes. This is in agreement with the recent discoverythat there is often a correlation between genes that areexpressed together and proteins that bind to each other[27]. However, there is no reason to believe that modulesin co-expression networks will always correspond to pro-tein complexes since our module detection methodshould find any set of genes with high pair-wise correla-tions. Any experimental perturbation that gives rise to ahighly correlated gene set is expected to result in a corre-sponding network module.
Intramodular network connectivity relationshipsHaving identified 3 functionally similar modules in thethree different datasets, we assessed whether these samemodules contain the same information as the entire net-
Module members retrieved from very different datasets are conservedFigure 6Module members retrieved from very different datasets are conserved. For all panels in the figure: black color rep-resents modules retrieved from the DD dataset, blue color represents modules retrieved from the ER dataset, and green color represents modules retrieved from the CC dataset. In each panel A-C a different module is examined for overlap of its mem-bers in a Venn diagram. In each diagram the relative overlap of the various modules has been diagramed as different amounts of area with the count represented for each zone by a number that quantifies the precise number of matches.
Page 9 of 15(page number not for citation purposes)

BMC Genomics 2006, 7:40 http://www.biomedcentral.com/1471-2164/7/40
work. Is the connectivity of a gene within the identifiedmodules correlated with the likelihood that a gene wasessential by deletion analysis and also whether it was con-served (Figures 3, 4, 5)? To test connectivity correlationswithin these modules, we define the intramodular con-nectivity (k.in) as the sum of all connectivity measuresonly with genes within the same module. Similar to thatperformed for the total gene connectivity within thewhole network, binned values were plotted to observe thepossible relationships (Figures 3C–H, 4C–H, and 5C–H).To evaluate significance, Spearman correlation coeffi-cients for the ranked but unbinned data were calculatedfor relationship of k.in to essentiality and sequence con-servation. Interestingly, there was a general trend to simi-lar correlations as that seen within the whole network.The correlation with sequence conservation was generallyweak: The ubiquitin module formed from the DD datasetand the rRNA processing modules in the ER and CC werethe most correlated with k.in. There was a correlation ofk.in and essentiality in all three datasets within the rRNAProcessing module (Figures 3C, 4C and 5C), and for twoof the datasets (DD and ER but not CC) within the ubiq-uitin module, and a trend towards a weak anticorrelationwithin the protein synthesis module (Figures 3D, 4D, and5D). Thus, some of the relationships between connectiv-ity and essentiality or sequence conservation and notdetected when the analysis is restricted within the mod-ules.
Characterizing modules that contain essential hub genesThe relationship between intramodular connectivity andessentiality is not necessarily universal for any module inany dataset. Whether or not a module contains meaning-ful information for predicting essentiality depends on theexpression data (biological perturbations) that were ana-lyzed. One can view the correlation of k.in and essentialityas a test of the modules importance. The key issue is thatin order for a module to demonstrate this relationship,there must be a sufficient number of essential geneswithin the module. As some modules have substantiallyfewer essential genes than others, there is little power todetect any relationship with k.in within those modules.We calculated the Spearman correlation between the pro-portion of essential genes within a module and the corre-lation of k.in with essentiality and show that there is astrong positive correlation (r = 0.48). Since in actual appli-cations the goal will be to find unknown 'essential' genes,it would be preferable to have another metric of 'essential'gene enrichment. In this regard, it is interesting to notethat of the three modules studied in the 3 datasets (9total), there were 4 that had a correlation of k.in withsequence conservation (p < 0.05). Of these 4 modules, all4 were shown to have a strong relationship of k.in withessentiality in the same modules. Of the 5 without a cor-relation (p > 0.05), only one showed a correlation
between k.in and essentiality (DD, ubiquitin module).Thus, the detection of a relationship between intramodu-lar connectivity and sequence conservation may predictthose modules with a relationship between k.in andessentiality.
DiscussionOur results extend the inferences made from protein andmetabolic networks to the more prolific datasets availablefrom gene expression data. These results are made possi-ble due to broad surveys of expression and the compre-hensive characterization of the yeast genome withdeletion mutants. In contrast to gene expression data,which are based on the assessment of cells in many differ-ent states of perturbation, protein interaction measure-ments are determined in only a limited set of conditionswhich by nature only capture a subset of all possible pro-tein-protein interactions. Others [22,28,29] have con-structed gene perturbation networks by looking at theexpression changes when individual genes are eliminatedor in relation to transcription factor expression. Microar-ray based surveys of gene expression allow detailed sur-veys of gene expression across a wide variety ofexperimental perturbations. From these data a strong cor-relation of gene expression for two genes implies thatboth genes act within a common functional group and areunder similar transcriptional control. Since these net-works are not based on direct measurements of proteinbinding/interaction, the presence of two genes that arehighly correlated has a different interpretation than thatderived from a protein interaction network. In a co-expression network, two closely tied nodes would behighly correlated but not necessarily direct binding part-ners. In spite of this key difference, numerous other stud-ies have indicated that genes that are correlated with eachother across a modest range of experiments tend to func-tion in similar ways and that this functional categoriza-tion is strengthened when gene co-expression exists acrosslarge evolutionary distances [12,14].
Here, we use a more general weighted gene co-expressionnetwork construction method for network constructionthat can be applied generically to microarray data usingsimple correlational analyses of individual genes [16].Advantages of weighted networks over unweighted net-works based on dichotomizing the correlation matrixinclude a) that the continuous nature of the gene co-expression information is preserved and b) that the resultsof weighted network analyses are highly robust withrespect to the choice of the parameter β, [16]. We showthat there is a strong correlation with the weighted geneco-expression connectivity measure and gene essentialityand sequence conservation. Our analysis demonstratesthat individual conserved modules are identifiable withina network. Moreover, the presence of these modules,
Page 10 of 15(page number not for citation purposes)
BMC Genomics 2006, 7:40 http://www.biomedcentral.com/1471-2164/7/40
which were detected in three independent networks, illus-trates that these networks have a structure to them whichmatches known cellular biology. We have also shown thatwhen sufficient information is available, these correlationmodules can provide further information about which oftheir members are more likely to be important for a givenprocess. The ability to assess whether or not a module iscomplete enough to be informative using a test like eitherof the ones employed here will be important for validat-ing the merit of less understood modules in the future.
Our study extends the strong links between the networkproperties of a gene within co-expression networks andthe global importance of each gene to the yeast cell, andmay have implications for targeted drug therapy in morecomplex biological systems like cancer. For instance, onecan infer from an analysis of the single gene deletion datathat single targets for inhibition can be partially predictedfrom expression data. However, in biological systems anoptimal effect is frequently achieved by inhibiting multi-ple specific targets. Can we extrapolate network positionsand relationships to infer effective combinations of tar-geted therapeutics? Yeast is an excellent model for estab-lishing the rules for applying network theories to practicalpredictions. For instance, will double deletions of highconnectivity genes within the network which reside in thesame module have substantially greater negative conse-quences to the yeast than double deletions of low connec-tivity genes? Alternatively, will genes which areconnecting distinct modules, and serving as key connec-tions between integrators prove to be better disruptiontargets? The modeling of such proposed interactions inyeast is attractive because of the relative tractability ofyeast studies and the availability of large scale datasets.Technologies like synthetic genetic arrays which automatedouble deletion screens or chemical genomic profilingprovide an expanding capability to survey the effects ofmultiple target inhibition or deletion [30-32]. However,even with these powerful methods, only a small fractionof the millions of possible combinations will be assayed.For instance in a substantial recent survey of double dele-tions only 0.02% of all possible double deletions weretested for synthetic lethality [33]. Thus, network basedmodeling may be a useful adjunct for the design of doubleknockout experiments or combination inhibition experi-ments to permit a more efficient search for syntheticlethals. An interplay between predictive models and tar-geted large scale inhibition studies may be quite useful forsurveying pathway analysis in yeast. In the long term, suchstudies may also be critical in the development of thera-pies for diseases like cancer.
ConclusionIn conclusion, our study demonstrates that weighted geneco-expression networks can be used to predict both the
likelihood of essentiality and the likelihood of conserva-tion for their gene members within the entire network.Furthermore, we show that these networks can be subdi-vided into identifiable modules, which themselves canoften contain enough individual information to indicatewhich genes are more likely to be crucial for a particularprocess. We have indicated a means for testing whetherthis is true or not. Thus, we have illustrated how this proc-ess can be applied to common microarray data for thepurpose of predicting both functional assignment as wellas the ranking of gene significance in a particular processwith which it is found to be associated. We believe thatthese kinds of predictions will be helpful for identifyinggene targets for therapeutics and for directing multi-drugtherapies.
MethodsData sourcesYeast microarray data were obtained from the Saccharomy-ces Genome Database in ratio format [34]. In each case,microarray based gene expression analysis was previouslyreported to have been performed for the analysis of DNADamage [18], Cell Cycle [17], and EnvironmentalResponse [19]. Not all of the data obtained from eachdatasets listed was used in these experiments. Becausemissing data is especially confounding for our analysis,arrays where greater than 5% of the gene expression infor-mation was missing were removed from our analysis. Theexact number of arrays chosen to represent each datasetwas: DNA Damage (n = 51), Cell Cycle (n = 44), and Envi-ronmental Response (n = 151). Essential genes were deter-mined from the Saccharomyces Genome Deletion Project[35]. Genomic data for conducting the blastp searcheswere obtained from the following locations: Neurosporagenome data (version 7) was obtained from the BroadInstitute [36,37]. Drosophila genome data was obtainedfrom the Berkeley Drosophila genome project [38], C. ele-gans genome data was obtained from the wormbase data-base [39], while both the human and mouse genomeswere obtained from the UCSC genome browser [40]. Theblastp algorithm was run locally.
Weighted Network constructionIn gene co-expression networks, each gene corresponds toa node. The neighbors of a node i are the nodes that areconnected to the node i. Two genes are connected by anedge with a weight indicating the connection strength. Agene co-expression network can be represented by anadjacency matrix A = [aij], where aij is the weight of a con-nection between two nodes i and j. For all of the networksconsidered in this paper, the connectivity equals the sumof connection weights being considered.
Our analysis follows a general framework for constructionof gene co-expression networks [16]. To transform the co-
Page 11 of 15(page number not for citation purposes)
BMC Genomics 2006, 7:40 http://www.biomedcentral.com/1471-2164/7/40
expression measure (here the absolute value of the Pear-son correlation matrix) into measures of pair wise connec-tion strengths, one can make use of an adjacency function.The choice of the adjacency function determines whetherthe resulting network will be weighted (soft thresholding)or unweighted (hard thresholding). A widely used adja-cency function is the signum function which implements'hard' thresholding involving the threshold parameter tau.Specifically, aij = Ind(|cor(xi, xj)| > τ where the indicatorfunction takes on the value 1 if the condition is satisfiedand 0 otherwise. Hard thresholding using the signumfunction leads to intuitive network concepts (e.g., thenode connectivity equals the number of direct neighbors),but it may lead to a loss of information. For instance, if thethreshold has been set to 0.8, there will be no connectionbetween two genes if their correlation equals 0.79. Toavoid the disadvantages of hard thresholding, Zhang andHorvath [16] proposed a 'soft' power adjacency function:aij = |cor(xi, xj)|β with the single parameter beta. The poweradjacency function preserves the continuous nature of thegene co-expression information and, leads to results thatare highly robust with respect to the choice of beta.
Zhang and Horvath [16] also proposed a criterion forchoosing the power beta of the adjacency function whichis based on the fact that despite significant variation intheir individual constituents and pathways, metabolicnetworks have been found to display approximate scalefree topology. The linear regression model fitting indexR^2 can be used to quantify how well a network satisfiesa scale-free topology. While the scale free model has only1 parameter (γ), the truncated exponential model allowsfor 2 parameters γ and α. Empirically, we find that the twoparameters of the truncated exponential model providetoo much flexibility in curve fitting so that the R-squaredvalues are always high [16]. Thus, we focus on the scalefree topology model fitting index in this application andemphasize the major trend that the high connectivitygenes are few in number, and that most genes have lowconnectivity (Figure 2A–2C). There is a natural trade-offbetween maximizing scale-free topology model fit (R^2)and maintaining a high mean number of connections:parameter values that lead to an R^2 value close to 1 maylead to networks with very few connections. These consid-erations motivated the scale-free topology criterion. Tochoose the parameters of an adjacency function: Onlythose parameter values that lead to a network satisfyingscale-free topology at least approximately were considered(e.g. signed R^2 > 0.80). When considering the signumand power adjacency functions, we find the relationshipbetween R^2 and the adjacency function parameter (tauor beta) is characterized by a saturation curve. In ourapplications, we use the first parameter value where satu-ration is reached as long as it is above 0.8. An R^2 > .80results in networks that may only approximate the scale
free property as is highlighted by the Cell Cycle networkin this manuscript.
For each dataset, we first selected the top 4000 most vary-ing transcripts based on the standard deviation. The net-work adjacency between 2 genes i and j was defined as apower of the correlation coefficient between the corre-sponding gene expression profiles xi and xj, i.e. aij = |cor(xi,
xj)|β where the power beta is chosen using the scale free
topology criterion. From this function, the 3000 most-connected genes were selected for further detailed net-work analysis. Using the 4000 most varying transcriptswas not very restrictive since the original data are derivedfrom yeast arrays and therefore only contained only about6000 genes in total. Many of these genes needed to beremoved due to high rates (>40%) of missing data for agene across a data set. By definition, module genes arehighly connected with the genes of their module (i.e.module genes tend have relatively high connectivity).Thus, for the purpose of module detection, restricting theanalysis to the most connected genes does not lead tomajor information loss for the key points of this presenta-tion. However, there may be applications where geneswith relatively low connectivity are biologically interest-ing so that gene filtering based on connectivity would leadto information loss. The adjacency matrix was also visual-ized as a graph and the number of topological propertiesof this graph examined. Important network derived con-cepts include: hub (a node with many strong connectionsto other nodes), topological overlap (the interconnectiv-ity between two nodes), modules (tightly connected sub-sets of the network), connectivity (the sum of the
adjacencies, ie. ) and intramodular connectiv-
ity (the sum of the adjacencies within a module). Onepotential drawback of soft thresholding is that the net-work cannot be visualized directly because the number ofrelationships to display becomes intractable. A soft adja-cency matrix specifies pair wise connection strengths andall nodes are connected. To visualize the network withPajek, one needs to threshold the connection strengths.The resulting dichotomized adjacency matrix can be con-sidered as an unweighted network approximation of theweighted network. Therefore, to make a visual representa-tion, only the strongest correlations (0.9 or greater) weredrawn in these renderings. Subsequent to this, networkswere then visualized with Pajek [20,41].
k ai iuu i
=≠
∑
Page 12 of 15(page number not for citation purposes)

BMC Genomics 2006, 7:40 http://www.biomedcentral.com/1471-2164/7/40
Definition of Topological Overlap and ModularityTopological overlap of two nodes (genes) reflects their rel-ative interconnectivity. For a network represented by anadjacency matrix A = [aij], aij ∈ [0,1], a well-known for-mula for defining topological overlap was given by [4],and it can be extended to weighted networks[16]:
where, denotes the number of nodes to
which both i and j are connected, and k is the number of
connections of a node, with and .
Since aij ∈ [0,1], we find that
. Thus, . Since 1 - aij ≥ 0, we
find that ωij is a number between 0 and 1. There are 2 rea-
sons for adding 1 - aij to the denominator in the topolog-
ical overlap matrix: 1) in this form, the denominator cannever be 0 and 2) for an unweighted network, one can
show that ωij = 1 only if the node with fewer links satisfies
two conditions: (a) all of its neighbors are also neighborsof the other node, i.e. it is connected to all of the neigh-bors of the other node and (b) it is linked to the othernode.
In contrast, ωij = 0 if i and j are unlinked and the twonodes don't have common neighbors. Further, the topo-logical overlap matrix is symmetric, i.e, ωij = ωji. and itsdiagonal elements are set to 0 (i.e. ωii = 0). The rationalefor considering this similarity measure is that nodes thatare part of highly integrated modules are expected to havehigh topological overlap with their neighbors [4].
It is important to note that the definition of topologicaloverlap matrix (equation 1) was taken from the methodssupplement of reference [4] since there is a typo in the pri-mary text. Different definitions of the topological overlapmatrix are possible, but we have found empirically thatmany of these possible generalizations lead to very similarmodules [42].
Modules are groups of nodes that have high topologicaloverlap. Module identification is based on the topological
overlap matrix Ω = [ωij defined as (1). To use it in hierar-
chical clustering, it is turned into a dissimilarity measure
by using the standard approach of subtracting it from one(i.e, the topological overlap based dissimilarity measure is
defined by = 1 - ϖij).
In networks involving few nodes, modules can easily beidentified by inspecting the network, but for large net-works involving hundred of nodes, it is useful to generatea topological overlap matrix (TOM) plot, which we reviewin the following. A TOM plot provides a "reduced" view ofthe network that allows one to visualize and identify net-work modules. The TOM plot is a color-coded depiction
of the values of [ ], described above.
Based on the TOM based dissimilarity matrix we can usehierarchical clustering to discriminate one module fromanother. We used a dynamic cut-tree algorithm for auto-matically and precisely identifying modules in hierarchi-cal clustering dendrogram [43]. The algorithm makes useof the internal structure in a dendrogram and clipsbranches of the dendrogram. The algorithm is based on anadaptive process of cluster decomposition and combina-tion and the process is iterated until the number of clus-ters becomes stable. No claim is made that our moduleconstruction method is optimal and future researchshould compare different method for cluster identifica-tion. Each module represents a group of genes with simi-lar expression profiles across the samples and theexpression profile pattern is distinct from those of theother modules. In each case, the modules were thenassessed for enrichment in ontology terms based onFisher's exact test as described in [25]. These modules andtheir relative connectivities were then separated out forfurther analysis.
Based on the network modules, we can define theintramodular connectivity (k.in) for each node i (i.e., thenumber of neighbors in the same module as node i). Theconnectivity of node i across the whole network isdenoted as k.all.
BlastpThe translated sequences of the entire yeast genome wereeach blasted against the entire translated sequences of theHuman, Mouse, Fly, Neurospora and C. elegans genomes.In each case, the best hit was determined using blastp, andthe log(e score) scores were averaged across the 5 differentcomparisons in a manner similar to what was publishedby [22]. These average blastp scores were then averaged foreach point in (Figure 2H–2K, 3F–3H, 4F–4H, 5F–5H).This method is not necessarily an optimal measure ofgene conservation, and it is used here simply as anapproximate measure of gene conservation, that is inde-
ωijij ij
i j ij
l a
k k a=
++ −
( )min , 1
1
l a aij iu uju i j
=≠∑
,
k ai iuu i
=≠
∑ k aj juu j
=≠∑
l a a a a a aij iuu i j
uj iuu i j
uju i j
iuu i
juu
= ≤ =≠ ≠ ≠ ≠∑ ∑ ∑ ∑
, , ,
min( , ) min( ,≠≠∑ −
jija)
l a a aij ij iuu i
juu j
+ ≤≠ ≠
∑ ∑min( , )
dijϖ
dijϖ
Page 13 of 15(page number not for citation purposes)

BMC Genomics 2006, 7:40 http://www.biomedcentral.com/1471-2164/7/40
pendent of annotation. Future research should study theadvantages and disadvantages of using different measuresfor gene conservation in network analysis.
Analysis of module overlapWe used a hyper-geometric p-value to evaluate the signif-icance of the overlap of the module genes across the 3 datasets. Suppose N1, N2 N3 out of N genes are in rRNAprocessing module of the DNA Damage data, the Environ-mental Response data, and the Cell Cycle data, respec-tively. We then denote by 'overlap' the number of genes inthe rRNA module that overlap in the 3 data sets.
To arrive at an upper limit of the p-value, we first com-puted pair wise p-values as follows. Denote as p12 the p-value that by randomly selecting N2 genes from a pool ofN genes with N1 module 1 genes, ≥ overlap selected genesare in the rRNA-processing module in both data sets. Thisp-value can easily be computed using the hypergeometricdistribution (dhyper function in R). N1 and N2 were thenswapped to obtain a second p-value, which we denoted asp21. The maximum of those two values can be used toassess the significance of overlap between data sets 1 and2. Similarly, we computed a p-value of overlap betweendata sets 1 and 3, and data sets 2 and 3. The minimum ofthe 3 resulting p-values provided an upper limit for assess-ing the significance of overlap between all 3 data sets, i.e.the final p-value was computed as p = min(max(p12,p21),max(p13,p31), max(p23,p32))
Data and softwarePrepared Data and R code are available online [44].
AbbreviationsCC, cell cycle; DD, DNA damage; ER, environmentalresponse
Authors' contributionsMC and SFN conceived of and developed the project, andwrote the final manuscript. MC analyzed the data, partic-ipated in the construction of all the software tools used inthis study and drafted the manuscript and figures. SH, BZauthored the majority of the R code needed for develop-
ing these weighted networks, developing network meas-ures, and providing crucial statistical guidance for thisproject. ZF helped with the statistical analysis. PM andSFN both contributed key ideas and suggestions as theproject progressed. All authors participated in the devel-opment of the ideas presented in this manuscript. Allauthors read and approved the final manuscript.
AcknowledgementsThe authors extend their thanks to the SGD for providing data for this anal-ysis. Also, special mention should be made of Allen Day, Ally Perlina and Andy Yip for their input during the analysis of this project. The work was supported by a grant from the NCI (U01 CA881273) as well as the Henry Singleton Brain Tumor Program, the Elliott Family Foundation in memory of Neal Elliott, the Ziering Family Foundation in memory of Sigi Ziering, Accelerate Brain Cancer Cure, and Art of the Brain. MRJC was supported by the UCLA Tumor Cell Biology Training Program, funded by NIH/National Cancer Institute 5T32CA09056. This work was also supported by the UCLA DNA Microarray Facility and the NINDS/NIMH Microarray Consortium.
References1. Hartwell LH, Hopfield JJ, Leibler S, Murray AW: From molecular
to modular cell biology. Nature 1999, 402:C47-52.2. Barabasi AL, Oltvai ZN: Network biology: understanding the
cell's functional organization. Nat Rev Genet 2004, 5:101-113.3. van Noort V, Snel B, Huynen MA: The yeast coexpression net-
work has a small-world, scale-free architecture and can beexplained by a simple model. EMBO Rep 2004, 5:280-284.
4. Ravasz E, Somera AL, Mongru DA, Oltvai ZN, Barabasi AL: Hierar-chical organization of modularity in metabolic networks. Sci-ence 2002, 297:1551-1555.
5. Jeong H, Tombor B, Albert R, Oltvai ZN, Barabasi AL: The large-scale organization of metabolic networks. Nature 2000,407:651-654.
6. Bergmann S, Ihmels J, Barkai N: Similarities and differences ingenome-wide expression data of six organisms. PLoS Biol 2004,2:E9.
7. Carter SL, Brechbuhler CM, Griffin M, Bond AT: Gene co-expres-sion network topology provides a framework for molecularcharacterization of cellular state. Bioinformatics 2004,20:2242-2250.
8. Albert R, Jeong H, Barabasi AL: Error and attack tolerance ofcomplex networks. Nature 2000, 406:378-382.
9. Giaever G, Chu AM, Ni L, Connelly C, Riles L, Veronneau S, Dow S,Lucau-Danila A, Anderson K, Andre B, Arkin AP, Astromoff A, El-Bakkoury M, Bangham R, Benito R, Brachat S, Campanaro S, CurtissM, Davis K, Deutschbauer A, Entian KD, Flaherty P, Foury F, GarfinkelDJ, Gerstein M, Gotte D, Guldener U, Hegemann JH, Hempel S, Her-man Z, Jaramillo DF, Kelly DE, Kelly SL, Kotter P, LaBonte D, LambDC, Lan N, Liang H, Liao H, Liu L, Luo C, Lussier M, Mao R, MenardP, Ooi SL, Revuelta JL, Roberts CJ, Rose M, Ross-Macdonald P, Sche-rens B, Schimmack G, Shafer B, Shoemaker DD, Sookhai-Mahadeo S,
Table 2: Summary of tests for network predictive power
Module name DNA Dmg Env Stress Cell Cycle
Ess Test Cons Test Ess Test Cons Test Ess Test Cons Test
Entire Network 0.23 1.0E-39 -0.15 1.3E-19 0.21 1.0E-39 -0.22 1.4E-39 0.2 1.0E-39 -0.18 4.0E-29rRNA proc 0.2 6.3E-5 -0.1 0.049 0.28 1.0E-39 -0.091 0.0066 0.22 0.00011 -0.23 8.3E-5Prot Synth -0.12 0.014 -0.07 0.15 -0.16 0.0035 -0.042 0.46 0.019 0.7 -0.099 0.055Ubiq 0.41 1.8E-10 -0.28 2.9E-5 0.49 0.0022 -0.16 0.34 -0.044 0.44 -0.032 0.59
*Spearman correlation and associated p-values for each network and module tested
Page 14 of 15(page number not for citation purposes)

BMC Genomics 2006, 7:40 http://www.biomedcentral.com/1471-2164/7/40
Publish with BioMed Central and every scientist can read your work free of charge
"BioMed Central will be the most significant development for disseminating the results of biomedical research in our lifetime."
Sir Paul Nurse, Cancer Research UK
Your research papers will be:
available free of charge to the entire biomedical community
peer reviewed and published immediately upon acceptance
cited in PubMed and archived on PubMed Central
yours — you keep the copyright
Submit your manuscript here:http://www.biomedcentral.com/info/publishing_adv.asp
BioMedcentral
Storms RK, Strathern JN, Valle G, Voet M, Volckaert G, Wang CY,Ward TR, Wilhelmy J, Winzeler EA, Yang Y, Yen G, Youngman E, YuK, Bussey H, Boeke JD, Snyder M, Philippsen P, Davis RW, JohnstonM: Functional profiling of the Saccharomyces cerevisiaegenome. Nature 2002, 418:387-391.
10. Jeong H, Mason SP, Barabasi AL, Oltvai ZN: Lethality and central-ity in protein networks. Nature 2001, 411:41-42.
11. Provero P: Gene networks from DNA microarray data: cen-trality and lethality. arXiv:cond-mat/0207345 2002, 2:.
12. Eisen MB, Spellman PT, Brown PO, Botstein D: Cluster analysisand display of genome-wide expression patterns. Proc NatlAcad Sci U S A 1998, 95:14863-14868.
13. van Noort V, Snel B, Huynen MA: Predicting gene function byconserved co-expression. Trends Genet 2003, 19:238-242.
14. Stuart JM, Segal E, Koller D, Kim SK: A gene-coexpression net-work for global discovery of conserved genetic modules. Sci-ence 2003, 302:249-255.
15. Quackenbush J: Genomics. Microarrays--guilt by association.Science 2003, 302:240-241.
16. Zhang B, Horvath S: A General Framework for Weighted GeneCo-Expression Network Analysis. Statistical Applications in Genet-ics and Molecular Biology 2005, 4:.
17. Spellman PT, Sherlock G, Zhang MQ, Iyer VR, Anders K, Eisen MB,Brown PO, Botstein D, Futcher B: Comprehensive identificationof cell cycle-regulated genes of the yeast Saccharomyces cer-evisiae by microarray hybridization. Mol Biol Cell 1998,9:3273-3297.
18. Gasch AP, Huang M, Metzner S, Botstein D, Elledge SJ, Brown PO:Genomic expression responses to DNA-damaging agentsand the regulatory role of the yeast ATR homolog Mec1p.Mol Biol Cell 2001, 12:2987-3003.
19. Gasch AP, Spellman PT, Kao CM, Carmel-Harel O, Eisen MB, StorzG, Botstein D, Brown PO: Genomic expression programs in theresponse of yeast cells to environmental changes. Mol Biol Cell2000, 11:4241-4257.
20. Batagelj VMA: Pajek - Program for Large Data Analysis. Con-nections 1998, 21:47-57.
21. Fruchterman TMJ, Reingold EM: Graph Drawing by Force-Directed Placement. Software - Practice and Experience 1991,21:1129-1164.
22. Featherstone DE, Broadie K: Wrestling with pleiotropy:genomic and topological analysis of the yeast gene expres-sion network. Bioessays 2002, 24:267-274.
23. Pereira-Leal JB, Audit B, Peregrin-Alvarez JM, Ouzounis CA: Anexponential core in the heart of the yeast protein interactionnetwork. Mol Biol Evol 2005, 22:421-425.
24. Csanyi G, Szendroi B: Fractal-small-world dichotomy in real-world networks. Phys Rev E Stat Nonlin Soft Matter Phys 2004,70:16122.
25. Hosack DA, Dennis GJ, Sherman BT, Lane HC, Lempicki RA: Identi-fying biological themes within lists of genes with EASE.Genome Biol 2003, 4:R70.
26. Ogata H, Goto S, Sato K, Fujibuchi W, Bono H, Kanehisa M: KEGG:Kyoto Encyclopedia of Genes and Genomes. Nucleic Acids Res1999, 27:29-34.
27. Ge H, Liu Z, Church GM, Vidal M: Correlation between tran-scriptome and interactome mapping data from Saccharo-myces cerevisiae. Nat Genet 2001, 29:482-486.
28. Rung J, Schlitt T, Brazma A, Freivalds K, Vilo J: Building and analys-ing genome-wide gene disruption networks. Bioinformatics2002, 18 Suppl 2:S202-10.
29. Wagner A: Estimating coarse gene network structure fromlarge-scale gene perturbation data. Genome Res 2002,12:309-315.
30. Tong AH, Evangelista M, Parsons AB, Xu H, Bader GD, Page N, Rob-inson M, Raghibizadeh S, Hogue CW, Bussey H, Andrews B, Tyers M,Boone C: Systematic genetic analysis with ordered arrays ofyeast deletion mutants. Science 2001, 294:2364-2368.
31. Haggarty SJ, Clemons PA, Schreiber SL: Chemical genomic profil-ing of biological networks using graph theory and combina-tions of small molecule perturbations. J Am Chem Soc 2003,125:10543-10545.
32. Giaever G, Flaherty P, Kumm J, Proctor M, Nislow C, Jaramillo DF,Chu AM, Jordan MI, Arkin AP, Davis RW: Chemogenomic profil-ing: identifying the functional interactions of small moleculesin yeast. Proc Natl Acad Sci U S A 2004, 101:793-798.
33. Tong AH, Lesage G, Bader GD, Ding H, Xu H, Xin X, Young J, BerrizGF, Brost RL, Chang M, Chen Y, Cheng X, Chua G, Friesen H, Gold-berg DS, Haynes J, Humphries C, He G, Hussein S, Ke L, Krogan N,Li Z, Levinson JN, Lu H, Menard P, Munyana C, Parsons AB, Ryan O,Tonikian R, Roberts T, Sdicu AM, Shapiro J, Sheikh B, Suter B, WongSL, Zhang LV, Zhu H, Burd CG, Munro S, Sander C, Rine J, GreenblattJ, Peter M, Bretscher A, Bell G, Roth FP, Brown GW, Andrews B, Bus-sey H, Boone C: Global mapping of the yeast genetic interac-tion network. Science 2004, 303:808-813.
34. Saccharomyces Genome Database. [http://db.yeastge-nome.org/cgi-bin/SGD/expression/expressionConnec-tion.pl]:.
35. Saccharomyces Genome Deletion Project. [http://www-sequence.stanford.edu/group/yeast_deletion_project/data_sets.html]:.
36. Version 7 Neurospora genome data from the Broad Insti-tute. [http://www.broad.mit.edu/annotation/fungi/neurospora_crassa_7/index.html]:.
37. Galagan JE, Calvo SE, Borkovich KA, Selker EU, Read ND, Jaffe D, Fit-zHugh W, Ma LJ, Smirnov S, Purcell S, Rehman B, Elkins T, Engels R,Wang S, Nielsen CB, Butler J, Endrizzi M, Qui D, Ianakiev P, Bell-Ped-ersen D, Nelson MA, Werner-Washburne M, Selitrennikoff CP, Kin-sey JA, Braun EL, Zelter A, Schulte U, Kothe GO, Jedd G, Mewes W,Staben C, Marcotte E, Greenberg D, Roy A, Foley K, Naylor J, Stange-Thomann N, Barrett R, Gnerre S, Kamal M, Kamvysselis M, MauceliE, Bielke C, Rudd S, Frishman D, Krystofova S, Rasmussen C, Metzen-berg RL, Perkins DD, Kroken S, Cogoni C, Macino G, Catcheside D,Li W, Pratt RJ, Osmani SA, DeSouza CP, Glass L, Orbach MJ, BerglundJA, Voelker R, Yarden O, Plamann M, Seiler S, Dunlap J, Radford A,Aramayo R, Natvig DO, Alex LA, Mannhaupt G, Ebbole DJ, Freitag M,Paulsen I, Sachs MS, Lander ES, Nusbaum C, Birren B: The genomesequence of the filamentous fungus Neurospora crassa.Nature 2003, 422:859-868.
38. Drosophila genome project. [http://www.fruitfly.org/sequence/download.html]:.
39. Wormbase database. [ftp://ftp.wormbase.org/pub/worm-base/]:.
40. UCSC genome browser. [http://genome.ucsc.edu/down-loads.html]:.
41. Pajek Algorithm. [http://vlado.fmf.uni-lj.si/pub/networks/pajek/]:.
42. Generalized Topological Overlap Matrix and its Applica-tions. [http://www.genetics.ucla.edu/labs/horvath/GTOM/]:.
43. Dynamic Tree Cut Algorithm. [http://www.genet-ics.ucla.edu/labs/horvath/binzhang/DynamicTreeCut]:.
44. Prepared Data and R Code. [http://www.genetics.ucla.edu/labs/horvath/CoexpressionNetwork/MarcCarlson]:.
Page 15 of 15(page number not for citation purposes)
http://www.ncbi.nlm.nih.gov/entrez/query.fcgi?cmd=Retrieve&db=PubMed&dopt=Abstract&list_uids=9843981
http://www.ncbi.nlm.nih.gov/entrez/query.fcgi?cmd=Retrieve&db=PubMed&dopt=Abstract&list_uids=9843981
http://www.ncbi.nlm.nih.gov/entrez/query.fcgi?cmd=Retrieve&db=PubMed&dopt=Abstract&list_uids=9843569
http://www.ncbi.nlm.nih.gov/entrez/query.fcgi?cmd=Retrieve&db=PubMed&dopt=Abstract&list_uids=9843569
http://www.ncbi.nlm.nih.gov/entrez/query.fcgi?cmd=Retrieve&db=PubMed&dopt=Abstract&list_uids=9843569
http://www.ncbi.nlm.nih.gov/entrez/query.fcgi?cmd=Retrieve&db=PubMed&dopt=Abstract&list_uids=9847135