Comparative genomics of downy mildews reveals potential ...
23
RESEARCH ARTICLE Open Access Comparative genomics of downy mildews reveals potential adaptations to biotrophy Kyle Fletcher 1 , Steven J. Klosterman 2 , Lida Derevnina 1,5 , Frank Martin 2 , Lien D. Bertier 1 , Steven Koike 3,6 , Sebastian Reyes-Chin-Wo 1 , Beiquan Mou 2 and Richard Michelmore 1,4* Abstract Background: Spinach downy mildew caused by the oomycete Peronospora effusa is a significant burden on the expanding spinach production industry, especially for organic farms where synthetic fungicides cannot be deployed to control the pathogen. P. effusa is highly variable and 15 new races have been recognized in the past 30 years. Results: We virulence phenotyped, sequenced, and assembled two isolates of P. effusa from the Salinas Valley, California, U.S.A. that were identified as race 13 and 14. These assemblies are high quality in comparison to assemblies of other downy mildews having low total scaffold count (784 & 880), high contig N 50 s (48 kb & 52 kb), high BUSCO completion and low BUSCO duplication scores and share many syntenic blocks with Phytophthora species. Comparative analysis of four downy mildew and three Phytophthora species revealed parallel absences of genes encoding conserved domains linked to transporters, pathogenesis, and carbohydrate activity in the biotrophic species. Downy mildews surveyed that have lost the ability to produce zoospores have a common loss of flagella/motor and calcium domain encoding genes. Our phylogenomic data support multiple origins of downy mildews from hemibiotrophic progenitors and suggest that common gene losses in these downy mildews may be of genes involved in the necrotrophic stages of Phytophthora spp. Conclusions: We present a high-quality draft genome of Peronospora effusa that will serve as a reference for Peronospora spp. We identified several Pfam domains as under-represented in the downy mildews consistent with the loss of zoosporegenesis and necrotrophy. Phylogenomics provides further support for a polyphyletic origin of downy mildews. Keywords: Peronospora effusa, Peronospora farinosa, Spinach downy mildew, Oomycete, Genomics, Peronospora lineage, Gene loss, Biotrophy Background Downy mildew diseases are caused by species of several genera of obligate biotrophic oomycetes and impact production of crops and ornamental plants worldwide [1]. The phylogenetic relationships of downy mildews to one another, as well as to closely related Phytophthora species (spp.), are unclear, with uncertainty as to how often the adaptation to obligate biotrophy has occurred [2–4]. Among the 19 downy mildew genera, Peronospora contains the highest number of species (~ 500) [1]. Peronospora spp. produce sexual oospores for survival in soil and plant debris, typical of oomycetes. However, unlike many oomycetes, the asexual sporangia of Peronospora germinate by forming a germ tube from the sporangia, rather than by releasing motile zoospores [1]. A prominent example of a destructive oomycete is Peronospora effusa, which causes spinach downy mildew; it is the most important pathogen of spinach globally [1, 5]. Like other pathogens in this genus, P. effusa has a narrow host range, only infecting spinach (Spinacia oleracea)[6, 7]. This pathogen has occasionally been incorrectly grouped with other Peronospora spp., such as Peronospora schachtii (causal agent of chard downy mildew) under the umbrella Peronospora farinosa [5, 6, 8–10], despite molecular data for distinct species [11, 12]. A formal rejection of the * Correspondence: [email protected] 1 The Genome Center, Genome and Biomedical Sciences Facility, University of California, 451 East Health Sciences Drive, Davis, CA 95616, USA 4 Departments of Plant Sciences, Molecular & Cellular Biology, Medical Microbiology & Immunology, University of California, Davis 95616, USA Full list of author information is available at the end of the article © The Author(s). 2018 Open Access This article is distributed under the terms of the Creative Commons Attribution 4.0 International License (http://creativecommons.org/licenses/by/4.0/), which permits unrestricted use, distribution, and reproduction in any medium, provided you give appropriate credit to the original author(s) and the source, provide a link to the Creative Commons license, and indicate if changes were made. The Creative Commons Public Domain Dedication waiver (http://creativecommons.org/publicdomain/zero/1.0/) applies to the data made available in this article, unless otherwise stated. Fletcher et al. BMC Genomics (2018) 19:851 https://doi.org/10.1186/s12864-018-5214-8
-
Upload
khangminh22 -
Category
Documents
-
view
0 -
download
0
Transcript of Comparative genomics of downy mildews reveals potential ...

RESEARCH ARTICLE Open Access
Comparative genomics of downy mildewsreveals potential adaptations to biotrophyKyle Fletcher1, Steven J. Klosterman2, Lida Derevnina1,5, Frank Martin2, Lien D. Bertier1, Steven Koike3,6,Sebastian Reyes-Chin-Wo1, Beiquan Mou2 and Richard Michelmore1,4*
Abstract
Background: Spinach downy mildew caused by the oomycete Peronospora effusa is a significant burden on theexpanding spinach production industry, especially for organic farms where synthetic fungicides cannot be deployedto control the pathogen. P. effusa is highly variable and 15 new races have been recognized in the past 30 years.
Results: We virulence phenotyped, sequenced, and assembled two isolates of P. effusa from the Salinas Valley,California, U.S.A. that were identified as race 13 and 14. These assemblies are high quality in comparison toassemblies of other downy mildews having low total scaffold count (784 & 880), high contig N50s (48 kb & 52 kb),high BUSCO completion and low BUSCO duplication scores and share many syntenic blocks with Phytophthoraspecies. Comparative analysis of four downy mildew and three Phytophthora species revealed parallel absences ofgenes encoding conserved domains linked to transporters, pathogenesis, and carbohydrate activity in thebiotrophic species. Downy mildews surveyed that have lost the ability to produce zoospores have a common lossof flagella/motor and calcium domain encoding genes. Our phylogenomic data support multiple origins of downymildews from hemibiotrophic progenitors and suggest that common gene losses in these downy mildews may beof genes involved in the necrotrophic stages of Phytophthora spp.
Conclusions: We present a high-quality draft genome of Peronospora effusa that will serve as a reference forPeronospora spp. We identified several Pfam domains as under-represented in the downy mildews consistent withthe loss of zoosporegenesis and necrotrophy. Phylogenomics provides further support for a polyphyletic origin ofdowny mildews.
Keywords: Peronospora effusa, Peronospora farinosa, Spinach downy mildew, Oomycete, Genomics, Peronosporalineage, Gene loss, Biotrophy
BackgroundDowny mildew diseases are caused by species of severalgenera of obligate biotrophic oomycetes and impactproduction of crops and ornamental plants worldwide[1]. The phylogenetic relationships of downy mildews toone another, as well as to closely related Phytophthoraspecies (spp.), are unclear, with uncertainty as to howoften the adaptation to obligate biotrophy has occurred[2–4]. Among the 19 downy mildew genera, Peronosporacontains the highest number of species (~ 500) [1].
Peronospora spp. produce sexual oospores for survival insoil and plant debris, typical of oomycetes. However,unlike many oomycetes, the asexual sporangia ofPeronospora germinate by forming a germ tube from thesporangia, rather than by releasing motile zoospores [1].A prominent example of a destructive oomycete is
Peronospora effusa, which causes spinach downy mildew;it is the most important pathogen of spinach globally[1, 5]. Like other pathogens in this genus, P. effusa has anarrow host range, only infecting spinach (Spinaciaoleracea) [6, 7]. This pathogen has occasionally beenincorrectly grouped with other Peronospora spp.,such as Peronospora schachtii (causal agent of charddowny mildew) under the umbrella Peronosporafarinosa [5, 6, 8–10], despite molecular data fordistinct species [11, 12]. A formal rejection of the
* Correspondence: [email protected] Genome Center, Genome and Biomedical Sciences Facility, University ofCalifornia, 451 East Health Sciences Drive, Davis, CA 95616, USA4Departments of Plant Sciences, Molecular & Cellular Biology, MedicalMicrobiology & Immunology, University of California, Davis 95616, USAFull list of author information is available at the end of the article
© The Author(s). 2018 Open Access This article is distributed under the terms of the Creative Commons Attribution 4.0International License (http://creativecommons.org/licenses/by/4.0/), which permits unrestricted use, distribution, andreproduction in any medium, provided you give appropriate credit to the original author(s) and the source, provide a link tothe Creative Commons license, and indicate if changes were made. The Creative Commons Public Domain Dedication waiver(http://creativecommons.org/publicdomain/zero/1.0/) applies to the data made available in this article, unless otherwise stated.
Fletcher et al. BMC Genomics (2018) 19:851 https://doi.org/10.1186/s12864-018-5214-8
name P. farinosa (a.k.a. Botrytis farinosa) was re-cently proposed, in part because P. farinosa couldnot be associated with a type specimen [13].Demand for and production of fresh market spinach is
consistently high in the United States of America [14]and control of downy mildew is essential for sustainableproduction of spinach, particularly on organic farms.While synthetic fungicides have been effective in man-aging downy mildew diseases in conventional production[15], such fungicides are unavailable for organic spinachproduction. Therefore, the introduction of genes for re-sistance to downy mildew into spinach through breedingcurrently provides the most effective option for diseasecontrol for the burgeoning organic industry [15]. Basedupon reactions of cultivars in the differential set usedfor screening isolates, six major loci for resistance toP. effusa have been proposed [8, 9]. Genome sequencingof S. oleracea identified 139 candidate resistance genes,five of which are closely linked to the DM-1 gene, whichconfers resistance to P. effusa race (R) 6 [16].New virulent races of P. effusa have appeared rapidly
after the deployment of cultivars with new resistancegenes, leading to a large increase in the number of racesdesignated over the past decade [5]. Prior to the 1990s,only three P. effusa races had been described [17], to date17 races have been denominated based on reactions to dif-ferentially susceptible or resistant lines [5, 8, 9, 18, 19].The reason for the rapid appearance of the new races of P.effusa is not understood; the recent finding of oospores ofP. effusa in ~ 16% of modern spinach seed lots hasprovided evidence for global movement of P. effusa onspinach seed [20] from seed production areas to freshmarket production fields elsewhere. Sexual progeny fromoospores will be highly variable because P. effusa is hetero-thallic [10, 21] and the global movement increases thepotential for sexual recombination between novel combi-nations of isolates of P. effusa. While within-field geno-typic diversity may be driven by asexual variation, theoverall diversity of the species may be influenced by sexualrecombination on broad temporal and geographic scales[19]. Oospores introduced into the fresh market produc-tion areas on spinach seed could introduce new combina-tions of virulence factors and contribute to the rapiddemise of resistance genes.Genome sequencing is now sufficiently inexpensive
to permit the rapid sequencing and assembly of mul-tiple isolates of small genome Peronospora spp. [22].Recently the genomes of two Peronospora tabacinaisolates were sequenced and shown to be compactand gene rich with fewer repeated sequences com-pared to other oomycetes [23]. While multiple speciesof several oomycete genera have been sequenced (e.g.Phytophthora, Pythium, Saprolegnia, Aphanomyces),only one genus (Plasmopara) of the obligately
biotrophic downy mildews has had two species se-quenced [3, 24, 25].In this study, two isolates of P. effusa were collected
from the field, virulence-phenotyped, and sequenced toproduce high quality annotated assemblies comparableto other downy mildews and Phytophthora spp. P. effusa,like P. tabacina, has a small consensus genome size withfew repeated sequences, although fewer gene modelswere identified. We contrasted these new assemblies andtheir gene models to other oomycetes and identifiedseveral domains that are under-represented in downymildews with many orthologs missing when comparedto Phytophthora spp. These data have implications tothe loss of motile flagella and the necrotrophic mode ofnutrition in downy mildews.
ResultsTwo isolates of P. effusa were collected from commercialspinach production fields in Monterey County, Californiain 2012 and 2013 and their virulence phenotypes tested byinoculations onto the standard differential set of resistantspinach cultivars to provide race designations as previ-ously described [8]. Cultivars Avenger, Lion (Solomon),and Pigeon were resistant to the 2012 isolate indicatingthat it was race 13 (R13), while cultivars Califlay, Whale,and Lion were resistant to the 2013 isolate indicating thatit was race 14 (R14).An additional isolate was collected from Monterey
County in January 2016 to determine total nuclear DNAcontent. Flow cytometry revealed three peaks indicatingnuclear DNA contents of 80 +/− 2 Mb, 149 +/− 9 Mb,and 300 +/− 18 Mb (Additional file 1). These results areconsistent with the P. effusa isolate surveyed containingpopulations of nuclei within a coenocytic mycelium; asmall proportion is approximately 80 Mb, while themajority are 149 Mb. The larger 300 Mb representsreplicating 149 Mb nuclei.
Read processing and assemblyApproximately 230 million 100 base-par (bp) paired-endreads were generated for both isolates that were reducedby 32% (R13) and 18% (R14) after quality and k-mertrimming. Read filtering identified approximately 58 and97 million read pairs associated with other oomycete as-semblies and 65 and 77 million un-associated read pairsfor R13 and R14, respectively. Optimal k-mer lengths forhighest output statistics were empirically found to bebetween 91 and 99 nt for both isolates. The top fiveBLASTn [26] filtered assemblies of R13 were assembledusing k-mer sizes 92 to 96 and had scaffold N50s rangingfrom 20.9 k-base-pair (kb) to 23.8 kb with between 12and 16 scaffolds over 100 kb with BUSCO [27] com-pleteness (protist library) ranging from 94.9 to 97.9%.The top five R14 assemblies (k-mer sizes 92–95 + 97)
Fletcher et al. BMC Genomics (2018) 19:851 Page 2 of 23

had scaffold N50 ranges of 18,157 to 18,478 bp, with 18to 23 scaffolds over 100 kb and BUSCO completenessranging from 95.3 to 97.4%.Post mitochondrial fragment filtering, pairwise mer-
ging of assemblies, from lowest scaffold count size tohighest, and removal of fragments under 1 kb, the scaf-fold N50 of isolates R13 and R14 rose to 52.8 kb and42.8 kb respectively and the highest BUSCO [27] scorepreviously observed was retained in both isolates,although the duplication rate had increased. A singleround of redundancy removal with Redundans [28] andHaplomerger2 [29] resulted in the final assemblies, withlittle redundancy detected by BUSCO. Completestatistics for the intermediate assemblies generated areprovided in Additional file 2.P. effusa R13 was assembled into 1475 contigs and 785
scaffolds. The contig N50 was 48.369 kb and the scaffoldN50 was 72.2 kb. The assembly totaled 32.1 Mb, con-tained 0.26% gaps, and presented 68 scaffolds over100 kb, three of which were over 250 kb. JELLYFISH[30] analysis produced an estimated haploid genome sizeof 44.1 Mega-base-pairs (Mb) with 26.6 Mb inferred assingle copy (Additional file 3). BUSCO [27] reported acompleteness of 97.8, 0.4% of complete BUSCOs werereported as duplicated and 2.2% reported as missing.There were no fragmented BUSCOs (Table 1).P. effusa R14 was assembled in to 1275 contigs and
880 scaffolds. The contig N50 was 51.71 kb and the scaf-fold N50 was 61.4 kb. The assembly totaled 30.8 Mb,contained 0.56% gaps and had 47 scaffolds over 100 kb,one of which was over 250 kb. JELLYFISH analysisproduced an estimated haploid genome size of 41.2 Mbwith 27.9 Mb inferred as single copy (Additional file 3).BUSCO reported a completeness of 97.0%, with noduplicated predictions and 0.4% fragmented predic-tions. The remaining 2.6% BUSCOs were reported asmissing (Table 1).
Assembly qualitySyMap [31] plots showed that the two P. effusa assem-blies had a high degree of collinearity although they arehighly fragmented (Fig. 1). There were 237 and 214scaffolds over 50 kb for R13 and R14, respectively;inter-isolate alignments were identified for 141 R13 and134 R14 of these scaffolds. When compared to P. sojae,177 R13 and 167 R14 scaffolds over 50 kb could bealigned with 23 P. sojae scaffolds over 50 kb.
Repeat masking and LTR analysisRepeat libraries for both isolates were generated usingRepeatModeler [32], identifying 98 elements in R13 and88 in R14. In both isolates most elements identifiedwere Long Terminal Repeat (LTR) Retrotransposons(Additional file 4). The LTR profiles of the two
isolates of P. effusa were similar to one another,although the density profile indicates that isolate R14may have more similar Copia elements than R13(Additional file 5).
AnnotationInitial SNAP [33] hidden Markov model (HMM) train-ing with MAKER [34] resulted in 7853 gene predictionsfor R13. Subsequent runs with intermediate SNAP boot-strapping produced predictions ranging from 6493 to9601 models, the mean residue length ranged from 407to 482 amino acids. Equivalent bootstrapping of thesame HMM run on P. effusa R14 produced predictionsranging from 6691 to 9034 gene models, the meanresidue length ranged from 407 to 476 amino acids(Additional file 6). Further assessment of each individualunfiltered run showed mean BLAST [26] scores back tothe training data ranging between 569 to 671 for R13and 603 to 678 for R14 (Additional file 6). When orthol-ogy analysis was performed for each run against thetraining data, the number of orthogroups detected variedfrom 4803 to 7117 for R13 and 5363 to 7073 for R14(Additional file 6). The mean e-value for Pfam [35]domains, scoring under 1e− 5, of individual MAKER runsranged from 1.99 e− 7 to 2.20 e− 7 for R13 and 1.99 e− 7
to 2.23 e− 7 for R14 (Additional file 6). For R13 theMAKER run with the highest mean BLAST score, sec-ond highest orthogroup count, and lowest mean Pfame-value was considered the best. For R14, the best anno-tation set scored the highest mean BLAST score, highestorthogroup count, and lowest mean Pfam e-value(Additional file 6). Investigating gene models at uniqueloci from alternative MAKER runs did not produce ahigh scoring set of gene models; therefore, integratingunique models from multiple runs was not performed.Independent translation of the entire genome of both
isolates, followed by effector identification through acombination of HMM-profiling and string searches(Additional file 7) resulted in a total of 148 and 137putative single open reading frame (ORF) effectors.Intersecting these loci with MAKER predictions identi-fied 41 and 43 previously unpredicted loci for each iso-late (Additional file 8). Putative effectors were manuallycurated in cases of overlapping or flanking ORFs. Recon-ciliation of these cases resulted in three multi-exonic ef-fectors for both isolates, in every case the first exoncontained a signal peptide, RxLR motif, and EER motifas well as possibly more than one WY domain. The sec-ond exon always contained at least one WY domain.These were added with the other ORF predictions totheir respective annotated gene sets (Additional file 9).The effector prediction pipeline was run on the finalgene sets, producing counts of 113 and 107 putative
Fletcher et al. BMC Genomics (2018) 19:851 Page 3 of 23

Table
1Com
parativestatisticsof
downy
mildew
geno
meassembliesandselect
Phytophtho
raassemblies
Gen
usSpecies
Isolate/labe
lScaffold
N50
(kb)
aScaffold
coun
tCon
tigN50
(kb)
Con
tigCou
ntAssem
bly
size
(Mb)
Gaps
(%)
Gen
emod
elcoun
tbBU
SCO
Reference
Com
plete(%)
Dup
licated
(%)
Fragmen
ted(%)
Missing
(%)
Perono
spora
effusa
R13
72784
481472
32.2
0.261
8607
97.8
0.4
02.2
This
stud
yR14
61880
521275
30.8
0.564
8571
970
0.4
2.6
tabacina
968-J2
794016
1110,799
63.1
27.351
11,310
94.9
29.5
32.1
[23]
968-S26
613245
158552
55.3
19.089
10,707
94.9
29.1
3.4
1.7
Hyaloperono
spora
arabidopsid
isEm
oy2
332
3044
4310,401
78.9
10.224
14,321
96.6
4.7
2.6
0.8
[45]
Psuedoperono
spora
cubensis
ASM
25260v1
435,539
435,539
64.3
0n/a
942.1
4.7
1.3
[82]
Plasmopara
halstedii
OS-Ph
8–99-
BlA4
1546
3162
1625,359
75.3
11.322
15,469
97.4
01.7
0.9
[3]
viticola
INRA
-PV221
181
1883
493995
74.7
2.83
n/a
95.7
4.7
1.7
2.6
[24]
JL-7-2
172
2165
1423,193
101.2
16.712
n/a(17,014)
84.6
8.1
8.5
6.9
[25]
Sclerospora
gram
inicola
UoM
-SG-P.1
1826,786
1628,799
299.9
0.29
n/a(38,120)
86.4
12.0
4.3
9.3
[102]
Phytophtho
rainfestan
sT30–4
1589
4921
4418,288
228.5
16.806
17,797
973
1.3
1.7
[103]
ramorum
ASM
14973v1
308
2576
487589
66.7
18.346
15,605
97.4
31.7
0.9
[104]
sojae
Physo3
7609
83386
863
82.6
3.959
26,489
99.5
3.8
00.5
[104]
a Num
bers
over
1000
kb(1
Mb)
arehigh
lighted
with
bold
type
face
bn/aas
gene
mod
elsareno
tavailablefrom
apu
blicresource
fordo
wnloa
d.Bracketednu
mbe
rsarerepo
rted
from
thereferencearticle
Fletcher et al. BMC Genomics (2018) 19:851 Page 4 of 23

effectors for the draft assemblies of R13 and R14respectively (Table 2).
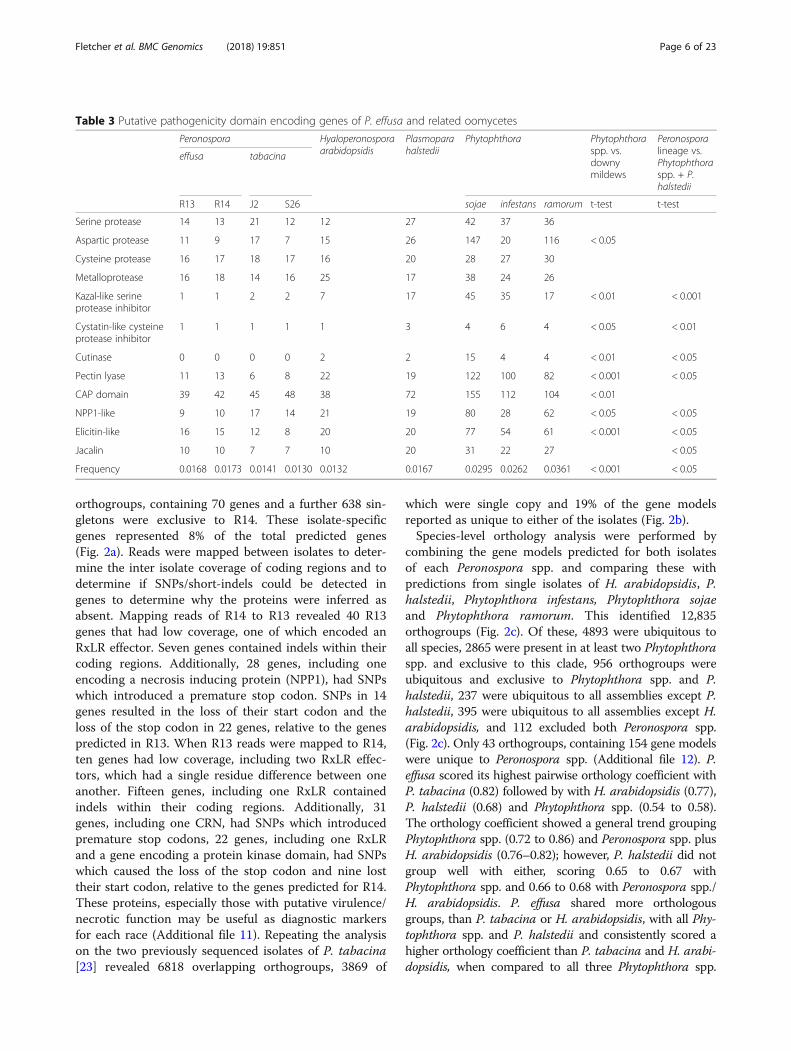
Comparative analysisGene models encoding putative pathogenicity domainswere identified through InterProScan for each assembly(Table 3). T-tests indicated that the frequencies of genemodels encoding several of these domain types weresignificantly different between Phytophthora spp. anddowny mildews, as was the total frequency of pathogenicityrelated models. The frequency of pathogenicity-associatedgene models in Phytophthora spp. ranged between 0.026 to0.036, while all downy mildews had lower incidencesranging from 0.013 to 0.017. The two isolates of P. effusahad the highest incidence of pathogenicity genes of thedowny mildews analyzed.
Analysis (chi-squared) of Pfam domains revealed 96 assignificantly enriched or depleted relative to theirexpected distributions, scoring below the Bonferroniadjusted e-value of 1.33 e− 5 (Additional file 10) in atleast one of the four multi-species comparisons per-formed (Table 4). Of these, six were enriched but wereexcluded because they had a skewed over-representationin P. tabacina (possibly due to under assembly of the ge-nomes; see section on K-mer analysis and heterozygositybelow) compared to P. effusa and Hyaloperonospora ara-bidopsidis; excluding P. tabacina resulted in insignificantscores for these six. The 90 remaining Pfam domainswere all indicated as depleted in the Peronosporalineage made up of P. effusa, P. tabacina and H.arabidopsidis, when compared to Phytophthora spp.(Table 4). In addition, 64 of the 90 domains were alsounder-represented in Plasmopara halstedii including24 of which could be grouped as phytopathology,transporter and carbohydrate associated domains.When P. halstedii, the only downy mildew analyzedthat has motile flagella, was grouped with thePhytophthora spp., 26 domains obtained a moresignificant score including 14 in the classes: flagellaapparatus and calcium associated domains. These fiveclasses contained 42% (38/90) of the domainsdetected as significantly depleted; the other 58% couldnot be assigned to one of these classes(Additional file 10).Orthology analysis between the two isolates of P.
effusa identified 7314 overlapping orthogroups, of which6833 were single copy. Nine orthogroups, containing 54genes and a further 653 singletons unassigned toorthogroups were found exclusive to R13, while 10
Fig. 1 SyMap plots of P. effusa R13 aligned against P. effusa R14, P. sojae v3.0 against P. effusa R13 and P. sojae v3.0 against P. effusa R14. The plotsaligned against P. sojae are scaled so the area of the plot occupied by P. sojae scaffolds is scaled to the size of the P. effusa sequences. No scalingis applied to the P. effusa cross isolate comparison
Table 2 Putative effectors identified through regular expressionand HMMs
Category R13 R14
RxLR-[DE][DE][ER] 33 34
[GHQ]xLR-[DE][DE][ER] 7 7
RxL[GKQ]-[DE][DE][ER] 14 12
RxLR-WY 12 12
[GHQ]xLR-WY 0 0
RxL[GKQ]-WY 1 0
RxLR-[DE][DE][ER]-WY 24 20
[GHQ]xLR-[DE][DE][ER]-WY 1 0
RxL[GKQ]-[DE][DE][ER]-WY 1 2
Total 93 87
CRN (Secreted) 20 (8) 20 (5)
Fletcher et al. BMC Genomics (2018) 19:851 Page 5 of 23
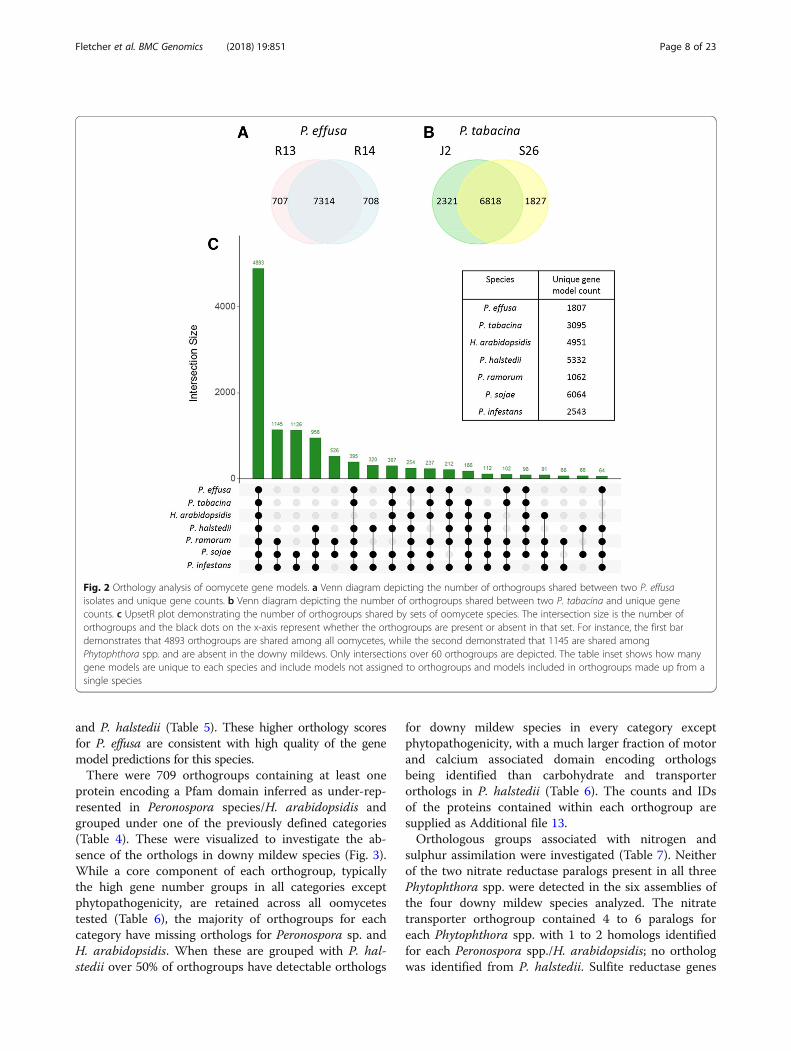
orthogroups, containing 70 genes and a further 638 sin-gletons were exclusive to R14. These isolate-specificgenes represented 8% of the total predicted genes(Fig. 2a). Reads were mapped between isolates to deter-mine the inter isolate coverage of coding regions and todetermine if SNPs/short-indels could be detected ingenes to determine why the proteins were inferred asabsent. Mapping reads of R14 to R13 revealed 40 R13genes that had low coverage, one of which encoded anRxLR effector. Seven genes contained indels within theircoding regions. Additionally, 28 genes, including oneencoding a necrosis inducing protein (NPP1), had SNPswhich introduced a premature stop codon. SNPs in 14genes resulted in the loss of their start codon and theloss of the stop codon in 22 genes, relative to the genespredicted in R13. When R13 reads were mapped to R14,ten genes had low coverage, including two RxLR effec-tors, which had a single residue difference between oneanother. Fifteen genes, including one RxLR containedindels within their coding regions. Additionally, 31genes, including one CRN, had SNPs which introducedpremature stop codons, 22 genes, including one RxLRand a gene encoding a protein kinase domain, had SNPswhich caused the loss of the stop codon and nine losttheir start codon, relative to the genes predicted for R14.These proteins, especially those with putative virulence/necrotic function may be useful as diagnostic markersfor each race (Additional file 11). Repeating the analysison the two previously sequenced isolates of P. tabacina[23] revealed 6818 overlapping orthogroups, 3869 of
which were single copy and 19% of the gene modelsreported as unique to either of the isolates (Fig. 2b).Species-level orthology analysis were performed by
combining the gene models predicted for both isolatesof each Peronospora spp. and comparing these withpredictions from single isolates of H. arabidopsidis, P.halstedii, Phytophthora infestans, Phytophthora sojaeand Phytophthora ramorum. This identified 12,835orthogroups (Fig. 2c). Of these, 4893 were ubiquitous toall species, 2865 were present in at least two Phytophthoraspp. and exclusive to this clade, 956 orthogroups wereubiquitous and exclusive to Phytophthora spp. and P.halstedii, 237 were ubiquitous to all assemblies except P.halstedii, 395 were ubiquitous to all assemblies except H.arabidopsidis, and 112 excluded both Peronospora spp.(Fig. 2c). Only 43 orthogroups, containing 154 gene modelswere unique to Peronospora spp. (Additional file 12). P.effusa scored its highest pairwise orthology coefficient withP. tabacina (0.82) followed by with H. arabidopsidis (0.77),P. halstedii (0.68) and Phytophthora spp. (0.54 to 0.58).The orthology coefficient showed a general trend groupingPhytophthora spp. (0.72 to 0.86) and Peronospora spp. plusH. arabidopsidis (0.76–0.82); however, P. halstedii did notgroup well with either, scoring 0.65 to 0.67 withPhytophthora spp. and 0.66 to 0.68 with Peronospora spp./H. arabidopsidis. P. effusa shared more orthologousgroups, than P. tabacina or H. arabidopsidis, with all Phy-tophthora spp. and P. halstedii and consistently scored ahigher orthology coefficient than P. tabacina and H. arabi-dopsidis, when compared to all three Phytophthora spp.
Table 3 Putative pathogenicity domain encoding genes of P. effusa and related oomycetes
Peronospora Hyaloperonosporaarabidopsidis
Plasmoparahalstedii
Phytophthora Phytophthoraspp. vs.downymildews
Peronosporalineage vs.Phytophthoraspp. + P.halstedii
effusa tabacina
R13 R14 J2 S26 sojae infestans ramorum t-test t-test
Serine protease 14 13 21 12 12 27 42 37 36
Aspartic protease 11 9 17 7 15 26 147 20 116 < 0.05
Cysteine protease 16 17 18 17 16 20 28 27 30
Metalloprotease 16 18 14 16 25 17 38 24 26
Kazal-like serineprotease inhibitor
1 1 2 2 7 17 45 35 17 < 0.01 < 0.001
Cystatin-like cysteineprotease inhibitor
1 1 1 1 1 3 4 6 4 < 0.05 < 0.01
Cutinase 0 0 0 0 2 2 15 4 4 < 0.01 < 0.05
Pectin lyase 11 13 6 8 22 19 122 100 82 < 0.001 < 0.05
CAP domain 39 42 45 48 38 72 155 112 104 < 0.01
NPP1-like 9 10 17 14 21 19 80 28 62 < 0.05 < 0.05
Elicitin-like 16 15 12 8 20 20 77 54 61 < 0.001 < 0.05
Jacalin 10 10 7 7 10 20 31 22 27 < 0.05
Frequency 0.0168 0.0173 0.0141 0.0130 0.0132 0.0167 0.0295 0.0262 0.0361 < 0.001 < 0.05
Fletcher et al. BMC Genomics (2018) 19:851 Page 6 of 23

Table 4 Chi-square results of Pfam domain representation in gene models of 9 oomycete assemblies
Pfam P. effusa vs all Peronospora spp. vs. All Peronosporalineage vs. all
Downy mildew vs.Phytophthora spp.
Pfam title Category
PF11051 8.34e−10 6.11e−10 8.62e−10 Mannosyltransferase Carbohydrate associated
PF00232 7.81e−8 Glycosyl hydrolase family 1
PF00295 3.66e−6 7.04e−8 4.71e−11 Glycoside hydrolase family 28
PF00933 1.20e−5 1.70e−6 1.69e− 8 Glycosyl hydrolase family 3 N terminaldomain
PF01762 3.93e−6 Galactosyltransferase
PF01915 3.19e− 6 2.45e− 8 Glycoside hydrolase family 3
PF00612 2.17e−6 2.88e−7 IQ calmodulin binding motif Calcium associated
PF13202 4.68e−6 9.71e−9 9.92e−7 EF hand
PF13499 3.70e−8 4.59e−10 9.75e− 8 EF hand
PF13833 1.13e−7 EF hand
PF00225 1.16e−7 7.33e−10 2.75e−6 Kinesin motor domain Flagella / Motor associated
PF07728 9.14e−6 6.35e−8 ATPases associated; dynein relatedsubfamily
PF03028 6.28e− 9 4.15e−12 9.94e−8 Dynein heavy chain and region D6 ofdynein motor
PF08385 2.85e−6 Dynein heavy chain
PF08393 1.94e−9 1.51e−13 3.36e− 9 Dynein heavy chain, N-terminal region 2
PF12774 8.43e−9 1.23e−12 4.65e−8 ATPases associated; P-loop containingdynein motor region
PF12775 2.04e−8 4.35e− 12 2.18e−7 ATPases associated; P-loop containingdynein motor region
PF12777 3.49e−9 3.50e−13 9.69e− 9 Microtubule-binding stalk of dynein motor
PF12780 2.21e−7 6.99e−11 1.49e−6 ATPases associated; P-loop containingdynein motor region-D4
PF12781 2.74e−8 6.61e−12 3.62e−7 ATPases associated; P-loop containingdynein motor region-D5
PF00050 1.46e−8 2.47e−9 1.06e−7 Kazal-type serine protease Phytopathology associated
PF00734 4.92e−6 1.14e−5 Fungal cellulose binding domain
PF07648 9.31e−8 4.11e−10 2.77e−08 Kazal domain
PF00544 5.44e−7 1.88e−6 9.83e− 10 Pectate lyase
PF00964 1.17e−8 5.92e−10 1.87e−12 Elicitin
PF02902 2.59e−10 1.53e−14 1.62e−20 ULP1 protease family, C-terminal catalyticdomain
PF03211 3.68e−13 1.21e−13 6.77e−19 Pectate lyase
PF05630 3.81e−09 3.88e−9 9.46e−12 Necrosis inducing protein
PF09461 5.22e−6 Phytotoxin PcF
PF16810 6.38e−10 4.13e−32 6.61e−45 1.08e−64 RxLR phytopathogen effector protein.
PF00083 3e−7 1e−10 3e−6 Sugar (and other) transporter Transporter associated
PF00520 1.03e−6 2.86e−14 3.15e−21 7.97e−21 Ion channel family
PF00005 3.84e−6 1.32e−19 9.28e−23 5.70e−32 ABC transporter
PF00664 2.11e−9 8.42e-11 2.34e-14 Transmembrane domain of ABCtransporters
PF01061 2.36e−17 2.11e-20 3.45e-29 ATP-binding cassette transporter
PF03083 1.63e−7 1.88e-10 2.16e-14 Sugar efflux transporter for intercellularexchange
PF03092 5.98e−7 BT1 family
PF06422 3.41e−10 5.84e-10 1.37e-13 CDR ABC transporter
The bold score for each Pfam domain is the best p-value obtained from all four comparisons
Fletcher et al. BMC Genomics (2018) 19:851 Page 7 of 23
and P. halstedii (Table 5). These higher orthology scoresfor P. effusa are consistent with high quality of the genemodel predictions for this species.There were 709 orthogroups containing at least one
protein encoding a Pfam domain inferred as under-rep-resented in Peronospora species/H. arabidopsidis andgrouped under one of the previously defined categories(Table 4). These were visualized to investigate the ab-sence of the orthologs in downy mildew species (Fig. 3).While a core component of each orthogroup, typicallythe high gene number groups in all categories exceptphytopathogenicity, are retained across all oomycetestested (Table 6), the majority of orthogroups for eachcategory have missing orthologs for Peronospora sp. andH. arabidopsidis. When these are grouped with P. hal-stedii over 50% of orthogroups have detectable orthologs
for downy mildew species in every category exceptphytopathogenicity, with a much larger fraction of motorand calcium associated domain encoding orthologsbeing identified than carbohydrate and transporterorthologs in P. halstedii (Table 6). The counts and IDsof the proteins contained within each orthogroup aresupplied as Additional file 13.Orthologous groups associated with nitrogen and
sulphur assimilation were investigated (Table 7). Neitherof the two nitrate reductase paralogs present in all threePhytophthora spp. were detected in the six assemblies ofthe four downy mildew species analyzed. The nitratetransporter orthogroup contained 4 to 6 paralogs foreach Phytophthora spp. with 1 to 2 homologs identifiedfor each Peronospora spp./H. arabidopsidis; no orthologwas identified from P. halstedii. Sulfite reductase genes
Fig. 2 Orthology analysis of oomycete gene models. a Venn diagram depicting the number of orthogroups shared between two P. effusaisolates and unique gene counts. b Venn diagram depicting the number of orthogroups shared between two P. tabacina and unique genecounts. c UpsetR plot demonstrating the number of orthogroups shared by sets of oomycete species. The intersection size is the number oforthogroups and the black dots on the x-axis represent whether the orthogroups are present or absent in that set. For instance, the first bardemonstrates that 4893 orthogroups are shared among all oomycetes, while the second demonstrated that 1145 are shared amongPhytophthora spp. and are absent in the downy mildews. Only intersections over 60 orthogroups are depicted. The table inset shows how manygene models are unique to each species and include models not assigned to orthogroups and models included in orthogroups made up from asingle species
Fletcher et al. BMC Genomics (2018) 19:851 Page 8 of 23

were identified in one isolate of P. tabacina and both P.effusa assemblies but were not detected in H. arabidop-sidis and P. halstedii. Orthologs of other nitrogen andsulphur assimilation associated enzymes were nearly ubi-quitous in the tested assemblies, except no orthologs ofglutamate synthase were detected in one of the isolatesof P. tabacina and no orthologs of glutamine synthetasewere detected in P. halstedii.
K-mer analysis and heterozygosityKAT density plots [36] were made to investigate hetero-zygosity in P. effusa. Two clusters of 21-mers are visiblein both plots in addition to the many low-frequency21-mers due to sequencing errors and contaminants(Fig. 4a). R14 has strong homozygous k-mer signal and aweak heterozygous signal at half coverage. R13 hasstrong homozygous k-mer signal and a significant signalat higher than half coverage. The same analysis of two P.tabacina isolates [23] detected strong homozygousk-mer signal and two heterozygous signals at half andquarter coverage consistent with the presence of mul-tiple distinct haplotypes due to polyploidy, heterokaryo-sis, or mixtures for both isolates (Fig. 4a).Spectra-cn plots that are also generated by KAT [36]
were used to investigate the frequencies of k-mers incommon between the read sets and assemblies of P.effusa. R14 contains one significant peak with the major-ity of 21-mers being represented once in the assembly,consistent with a high-quality assembly of a predomin-antly homozygous organism (Fig. 4b). The majority of21-mers of the R13 read set were represented once,regardless of the k-mer frequency in the read set; thisindicates that neither cluster of k-mers in R13 was het-erozygous because most of the k-mers in the lowercoverage peak were incorporated in the assembly ratherthan the anticipated proportion (50%) of the k-mers be-ing absent. Therefore, the assembly of R13 seems to beof high quality but these k-mer plots are not consistentwith a simple diploid genome. In contrast, spectra-cnplots of P. tabacina confirmed that both isolates con-tained three clusters of k-mers with a high proportion of
k-mers from the first peaks absent in the assembly,approximately half the k-mers absent from the secondpeaks, and a small fraction absent from the homozygouspeaks. Both isolates of P. tabacina had high levels ofk-mer duplication; a significant proportion in the homo-zygous peak was represented twice as much as expectedin the assembly indicating that both P. tabacina assem-blies are under-assembled (Fig. 4b).Reads were mapped back to the respective assemblies
to identify single nucleotide polymorphisms (SNPs) andinvestigate the frequency of reads supporting the alter-native allele in P. effusa. In R13, 106,714 heterozygousSNP sites were identified and 74,690 in R14, indicating0.33 and 0.24% heterozygosity for R13 and R14, respect-ively (Fig. 4c). Plots of the frequency of reads supportingthe alternative allele at each SNP revealed a clear peak at0.5 in both isolates as expected in a diploid; however, asmaller second peak was present for both isolates at~ 0.33. When only SNPs in genes were considered, theSNP count was reduced to 31,041 and 17,943 inferring a0.23 and 0.13% heterozygosity in the predicted gene spaceof R13 and R14, respectively. Plots of the frequency of readssupporting the alternative allele of genic SNPs retained thepeak at 0.5, although the peak at 0.33 was greatly reduced,containing ~ 5.7% (R13) to 8.6% (R14) of the genic SNPs(Fig. 4c). Collectively, these data indicate that the allele fre-quencies of numerous SNPs in P. effusa are not consistentwith the 1:1 ratio expected in a diploid organism.The normalized coverage of each predicted gene in
R13 was more variable than in R14 (Fig. 4d). While themajority of the ~ 8600 predicted genes had around 1 to1.2x normalized coverage in both isolates, 851 genemodels in R13 had 0.6 to 0.8x coverage; in contrast, only67 genes in R14 had 0.6 to 0.8x coverage. There was nosignificant deviation in representation of the 513 Pfamdomains encoded by these genes.
PhylogeneticsA maximum likelihood tree with 1000 bootstraps wasproduced from 49 concatenated, single copy genes pre-dicted by BUSCO [27] from both P. effusa isolates and all
Table 5 Pairwise overlaps of orthology groups (top right) and calculated orthology coefficients (bottom left bold and bracketed onintersecting diagonal) of publicly available gene models of downy mildew genome assemblies and select Phytophthora spp.
P. effusaa P. tabacinaa H. arabidopsidis P. halstedii P. ramorum P. sojae P. infestans
P. effusaa 7430 (1) 6646 6425 6572 6557 6860 6882
P. tabacinaa 0.82 7209 (1) 6283 6421 6378 6680 6755
H. arabidopsidis 0.77 0.76 7211 (1) 6388 6365 6638 6668
P. halstedii 0.68 0.67 0.66 8578 (1) 7469 8020 8055
P. ramorum 0.58 0.57 0.56 0.65 9963 (1) 9436 9016
P. sojae 0.54 0.52 0.52 0.64 0.76 11,798 (1) 10,711
P. infestans 0.57 0.56 0.55 0.67 0.72 0.86 11,272 (1)aTwo isolates used in analysis
Fletcher et al. BMC Genomics (2018) 19:851 Page 9 of 23
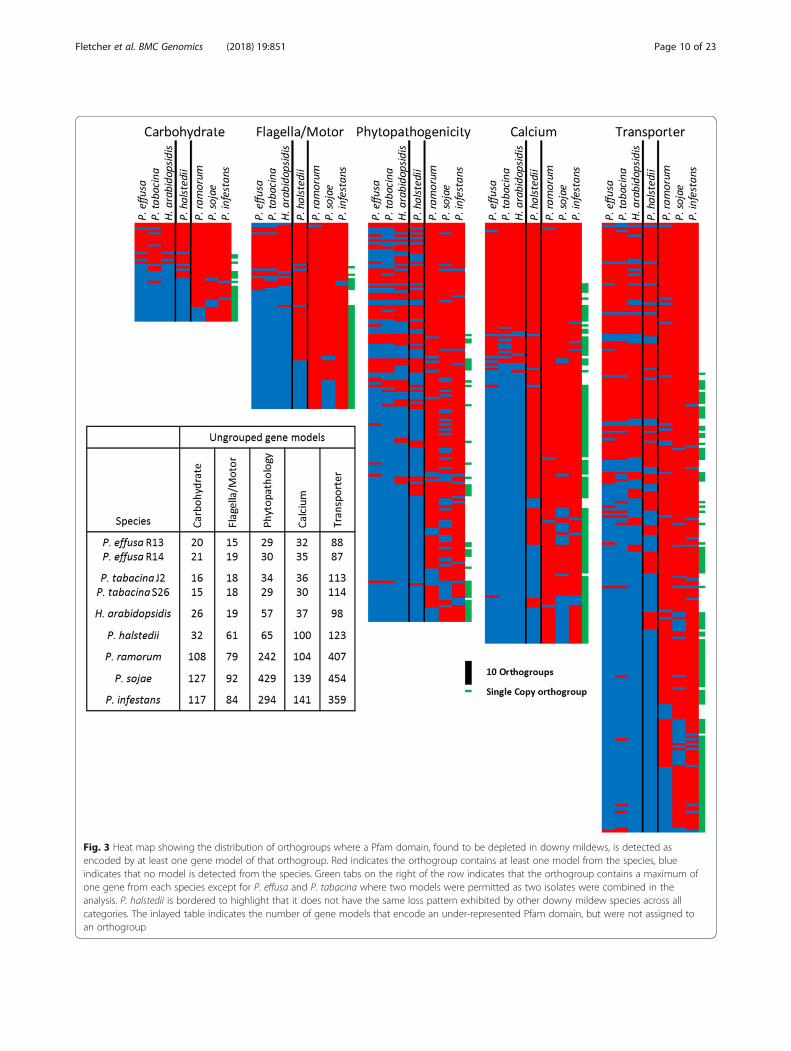
Fig. 3 Heat map showing the distribution of orthogroups where a Pfam domain, found to be depleted in downy mildews, is detected asencoded by at least one gene model of that orthogroup. Red indicates the orthogroup contains at least one model from the species, blueindicates that no model is detected from the species. Green tabs on the right of the row indicates that the orthogroup contains a maximum ofone gene from each species except for P. effusa and P. tabacina where two models were permitted as two isolates were combined in theanalysis. P. halstedii is bordered to highlight that it does not have the same loss pattern exhibited by other downy mildew species across allcategories. The inlayed table indicates the number of gene models that encode an under-represented Pfam domain, but were not assigned toan orthogroup
Fletcher et al. BMC Genomics (2018) 19:851 Page 10 of 23

Table
6Presen
ceof
ortholog
sen
coding
domains
unde
r-represen
tedin
downy
mildew
s
All
>1Phytophtho
raspecies
>1do
wny
mildew
>1Perono
sporalineage
species
#Ortho
grou
ps#Sing
leCop
yOrtho
grou
ps#Ortho
grou
ps#Sing
leCop
yOrtho
grou
ps#Ortho
grou
ps#Sing
leCop
yOrtho
grou
ps#Ortho
grou
ps#Sing
leCop
yOrtho
grou
ps
Calcium
174
127
174(100%)
127(100%)
133(76.4%
)92
(72.4%
)62
(35.6%
)29
(22.8%
)
Carbo
hydrate
4122
41(100%)
22(100%)
23(56.1%
)7(31.8%
)20
(48.9%
)4(18.2%
)
Flagella/M
otor
7750
77(100%)
55(100%)
57(74.0%
)30
(60.0%
)27
(35.1%
)8(16.0%
)
Phytop
atho
genicity
165
41163(98.8%
)40
(98.6%
)75
(45.5%
)21
(51.2%
)61
(37.0%
)15
(36.6%
)
Transporter
252
127
251(99.6%
)126(99.2)
144(57.1%
)59
(46.5%
)117(46.4%
)43
(33.9%
)
Fletcher et al. BMC Genomics (2018) 19:851 Page 11 of 23

Table
7Ortho
logy
assign
men
tof
nitrog
en&sulphu
rassimilatio
nen
zymes
describ
edpreviously.O
rtho
grou
psareseparatedby
borders
Putativefunctio
nP.infestan
sP.ramorum
P.sojae
H.arabidopsidis
P.tabacina
968-J2
P.tabacina
968-S26
P.effusa
R13
P.effusa
R14
P.ha
lstedii
Nitrateredu
ctase
XP_002900554.1
Phyra76696
XP_009533168.1
––
––
––
XP_002900553.1
Phyra71442
XP_009533167.1
––
––
––
Nitratetransporter
XP_002900550.1
XP_002900551.1
XP_002900552.1
XP_002903614.1
Phyra43555
Phyra43556
Phyra76698
Phyra76702
Phyra76703
XP_009526093.1
XP_009533166.1
XP_009533172.1
XP_009533173.1
XP_009533174.1
XP_009535913.1
HpaP804258
Ptab1_000523.1
Ptab1_001793.1
Ptab2_000415.1
Ptab2_023789.1
PeffR
13_006272-
RAPeffR
14_007341-
RA–
Glutaminesynthe
tase
XP_002899289.1
XP_002899288.1
Phyra72153
Phyra72154
XP_009537735.1
XP_009537736.1
HpaP802420
Ptab1_007691.1
Ptab2_018669.1
PeffR
13_007392-
RAPeffR
14_006695-
RA–
Glutamatesynthase
(NADH)
XP_002904413.1
Phyra72102
XP_009528137.1
HpaP805196
–Ptab2_009166.1
PeffR
13_005711-
RAPeffR
14_000994-
RAPh
al12782
Glutamatesynthase
(Ferrid
oxin)
XP_002901469.1
XP_002897669.1
Phyra78125
XP_009535431.1
HpaP812981
Ptab1_006627.1
Ptab2_001634.1
PeffR
13_005438-
RAPeffR
14_005090-
RAPh
al04802
Glutamatede
hydrog
enase
XP_002904619.1
Phyra71959
XP_009534337.1
HpaP805610
HpaP806677
Ptab1_013770.1
Ptab1_014043.1
Ptab2_016507.1
PeffR
13_004916-
RAPeffR
14_007520-
RAPh
al12692
ATP
sulfurylase
Ade
nylylsulfate
kinase
Pyroph
osph
atase
XP_002907034.1
Phyra79353
XP_009527256.1
HpaP813786
Ptab1_021733.1
Ptab2_020487.1
PeffR
13_005995-
RAPeffR
14_007707-
RAPh
al00799
Phosph
oade
nosine
phosph
osulfate
redu
ctase
XP_002905356.1
Phyra74880
XP_009520480.1
HpaP809449
Ptab1_009492.1
Ptab2_001511.1
PeffR
13_006965-
RAPeffR
14_006997-
RAPh
al12096
Cysteinesynthe
tase
XP_002900123.1
XP_002900124.1
Phyra71224
Phyra71225
XP_009530251.1
XP_009530252.1
HpaP814750
Ptab1_008049.1
Ptab2_003698.1
PeffR
13_004177-
RAPeffR
14_003698-
RAPh
al08105
Sulfite
redu
ctase
XP_002997199.1
Phyra81878
XP_009516220.1
––
Ptab2_003268.1
Ptab2_013985.1
PeffR
13_005098-
RAPeffR
14_004743-
RA–
XP_002896336.1
Phyra81882
XP_009516225.1
––
Ptab2_000240.1
PeffR
13_005095-
RAPeffR
14_004746-
RA–
Notead
dedin
proo
f.P.
effusa
R13proteins
canbe
queriedfrom
Gen
Bank
bysubstitutingthestrin
gPe
ffR1
3with
DD23
7an
dremov
ingthe-RAsuffix.For
P.effusa
R14replacePe
ffR1
4with
DD23
8an
dremov
ethe
-RAsuffix
Fletcher et al. BMC Genomics (2018) 19:851 Page 12 of 23

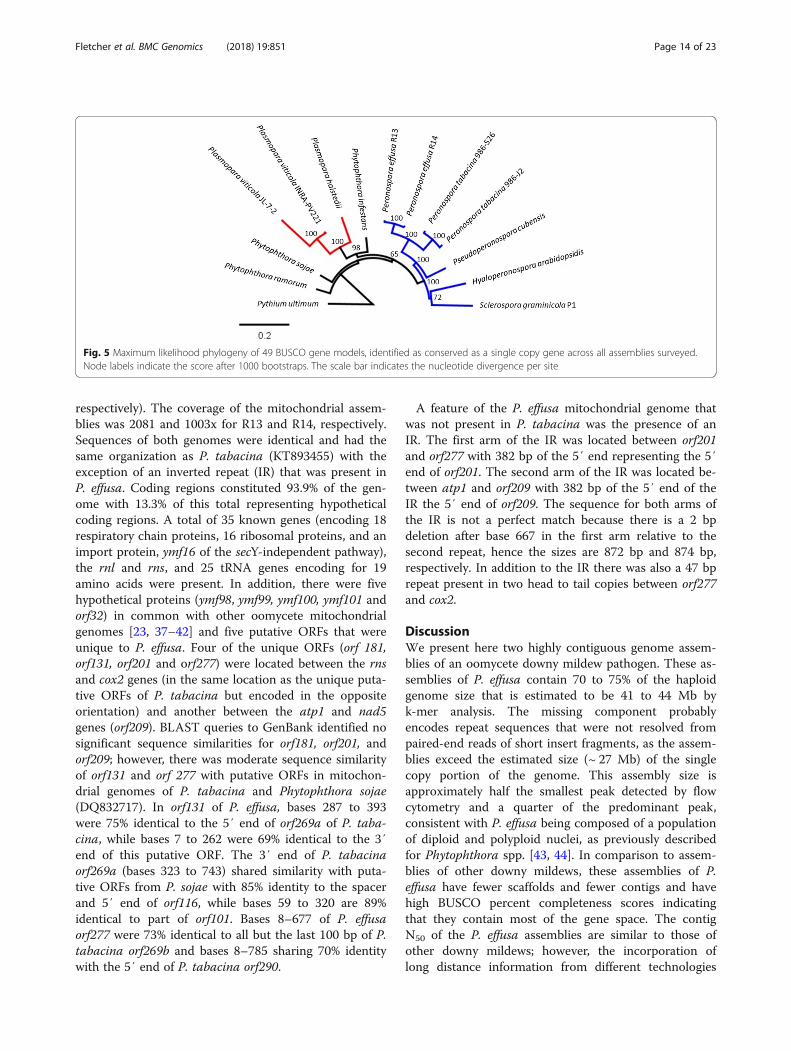
published downy mildew assemblies available from NCBI,plus three diverse Phytophthora spp. and rooted withPythium ultimum as the out-group (Fig. 5). Two downymildew clades were evident. P. effusa was in the larger cladewith P. tabacina and clusters with Pseudoperonosporacubensis, H. arabidopsidis and Sclerospora graminicola. Thesecond downy mildew clade is made up of the three isolates
of two Plasmopara spp., which were more closely related toP. infestans than to the other downy mildews.
MitochondriaThe mitochondrial genomes of race 13 and 14 isolateswere both 41,318 bp in size with a GC content of 22.8%(GenBank accessions MH142315 and MH325167,
Fig. 4 K-mer and read mapping overview. a KAT density plots demonstrating the 21-mer multiplicity of read 1 (x axis) against read 2 (y axis) forP. effusa R13, P. effusa R14, P. tabacina J2 and P. tabacina S26. Approximate locations of homozygous and heterozygous 21-mer are labeled onthe x-axis. b KAT spectra-cn plots of the 21-mer multiplicity of the read set (x axis) against their respective assembly (y axis) for P. effusa R13,P. effusa R14, P. tabacina J2 and P. tabacina S26. Black areas under the peaks represent 21-mers present in the reads, absent in the assembly,red indicates 21-mers are present once in the assembly, purple 21-mers are present twice, green thrice. c Frequency of reads supporting thealternative allele over the entire assembly and gene space for P. effusa R13 and P. effusa R14. The allele frequency is cut-off at 0.2 and 0.8 on thex-axis of all plots. d Normalized read depth of every gene predicted in both P. effusa R13 and P. effusa R14. The height of each plot indicates thenumber of gene models at the normalized coverage displayed on the x axis
Fletcher et al. BMC Genomics (2018) 19:851 Page 13 of 23
respectively). The coverage of the mitochondrial assem-blies was 2081 and 1003x for R13 and R14, respectively.Sequences of both genomes were identical and had thesame organization as P. tabacina (KT893455) with theexception of an inverted repeat (IR) that was present inP. effusa. Coding regions constituted 93.9% of the gen-ome with 13.3% of this total representing hypotheticalcoding regions. A total of 35 known genes (encoding 18respiratory chain proteins, 16 ribosomal proteins, and animport protein, ymf16 of the secY-independent pathway),the rnl and rns, and 25 tRNA genes encoding for 19amino acids were present. In addition, there were fivehypothetical proteins (ymf98, ymf99, ymf100, ymf101 andorf32) in common with other oomycete mitochondrialgenomes [23, 37–42] and five putative ORFs that wereunique to P. effusa. Four of the unique ORFs (orf 181,orf131, orf201 and orf277) were located between the rnsand cox2 genes (in the same location as the unique puta-tive ORFs of P. tabacina but encoded in the oppositeorientation) and another between the atp1 and nad5genes (orf209). BLAST queries to GenBank identified nosignificant sequence similarities for orf181, orf201, andorf209; however, there was moderate sequence similarityof orf131 and orf 277 with putative ORFs in mitochon-drial genomes of P. tabacina and Phytophthora sojae(DQ832717). In orf131 of P. effusa, bases 287 to 393were 75% identical to the 5′ end of orf269a of P. taba-cina, while bases 7 to 262 were 69% identical to the 3′end of this putative ORF. The 3′ end of P. tabacinaorf269a (bases 323 to 743) shared similarity with puta-tive ORFs from P. sojae with 85% identity to the spacerand 5′ end of orf116, while bases 59 to 320 are 89%identical to part of orf101. Bases 8–677 of P. effusaorf277 were 73% identical to all but the last 100 bp of P.tabacina orf269b and bases 8–785 sharing 70% identitywith the 5′ end of P. tabacina orf290.
A feature of the P. effusa mitochondrial genome thatwas not present in P. tabacina was the presence of anIR. The first arm of the IR was located between orf201and orf277 with 382 bp of the 5′ end representing the 5′end of orf201. The second arm of the IR was located be-tween atp1 and orf209 with 382 bp of the 5′ end of theIR the 5′ end of orf209. The sequence for both arms ofthe IR is not a perfect match because there is a 2 bpdeletion after base 667 in the first arm relative to thesecond repeat, hence the sizes are 872 bp and 874 bp,respectively. In addition to the IR there was also a 47 bprepeat present in two head to tail copies between orf277and cox2.
DiscussionWe present here two highly contiguous genome assem-blies of an oomycete downy mildew pathogen. These as-semblies of P. effusa contain 70 to 75% of the haploidgenome size that is estimated to be 41 to 44 Mb byk-mer analysis. The missing component probablyencodes repeat sequences that were not resolved frompaired-end reads of short insert fragments, as the assem-blies exceed the estimated size (~ 27 Mb) of the singlecopy portion of the genome. This assembly size isapproximately half the smallest peak detected by flowcytometry and a quarter of the predominant peak,consistent with P. effusa being composed of a populationof diploid and polyploid nuclei, as previously describedfor Phytophthora spp. [43, 44]. In comparison to assem-blies of other downy mildews, these assemblies of P.effusa have fewer scaffolds and fewer contigs and havehigh BUSCO percent completeness scores indicatingthat they contain most of the gene space. The contigN50 of the P. effusa assemblies are similar to those ofother downy mildews; however, the incorporation oflong distance information from different technologies
Fig. 5 Maximum likelihood phylogeny of 49 BUSCO gene models, identified as conserved as a single copy gene across all assemblies surveyed.Node labels indicate the score after 1000 bootstraps. The scale bar indicates the nucleotide divergence per site
Fletcher et al. BMC Genomics (2018) 19:851 Page 14 of 23

into assemblies of H. arabidopsidis [45] and Plasmoparaspp. [3, 24, 25] resulted in higher scaffold N50s. Thescaffold N50s are similar to those reported for P.tabacina, which were assembled using mate-pair reads[23] (Table 1).The scaffolds of P. effusa are highly syntenic with
those of P. sojae v3.0 (Fig. 1). P. sojae v3.0 is the mostcontiguous oomycete assembly available with 83 scaf-folds and 99.12% of 82.6 Mb assembled into 31 scaffoldsover 50 kb. The assemblies of P. effusa are more frag-mented; 69% of R13 was encoded in 237 scaffolds over50 kb, while 60% of R14 was contained in 214 scaffoldsover 50 kb. The SyMap [31] plots (Fig. 1) provided littleevidence for chimeric scaffolds in P. effusa. Furthermore,177 R13 scaffolds and 167 R14 scaffolds could be or-dered against 23 P. sojae scaffolds possibly indicative ofpseudomolecules; pseudomolecules were not generatedbecause of the potential for genome re-arrangementsreported within the Peronosporales [46–50]. Thegeneration of improved assemblies with chromosomalpseudomolecules awaits the future application of tech-nologies that utilize long distance information [51].The repertoires of annotated genes differed between P.
effusa and P. tabacina. The assemblies of P. tabacinahave a high BUSCO [27] duplication scores (~ 30%),indicating that these may not be high-quality consensusassemblies (i.e. the assembly is not representative of asingle haplotype) and may have inflated the estimatednumber of gene models in P. tabacina compared to P.effusa. The BUSCO score of P. tabacina indicates that~ 30% of the ~ 11,000 gene models may be duplicated;this is supported by the duplication of single copy regionsin these assemblies detected by KAT [36] plots (Fig. 4b).If this is the case, there are ~ 8000 gene models in P.tabacina, similar to P. effusa. Interestingly, 4148 genemodels were unique to one or the other isolate of P. taba-cina (Fig. 2b) and 3095 genes were unique to P. tabacinawhen compared to other oomycetes (Fig. 2). The BUSCOduplication score for P. effusa was less than 0.5%; 1807genes were unique to P. effusa when compared to otheroomycetes (Fig. 2). Therefore, these isolates of P. tabacinamay have more dispensable genes or not all genes weresuccessfully assembled and annotated in both isolates ofP. tabacina. This difference could be due to the isolatesof P. effusa being genetically more similar to one anotherthan the two isolates of P. tabacina, therefore having lessopportunity to differentiate their gene repertoire. Thisdifference in diversity is supported by both isolates of P.effusa having identical mitochondrial sequences, whilethose of the two P. tabacina isolates differed by sevenSNPs, three indels and copy number of a 128 bp repeat[23]. Other oomycetes also have a higher unique genecontent compared to P. effusa (Fig. 2) as well as goodBUSCO scores, possibly indicating specialized sets of
genes or misannotations in the other species. Our analysiswas based on annotation developed using the transcrip-tomes of other oomycetes including Hyaloperonospora,Bremia and Phytophthora species [52–55]. RNAseq datafor P. effusa may increase the number of unique orspecialized genes identified in this species. Furthergenome and transcriptome sequencing of more isolatesare required to characterize the pan genomes and extentof specialization in multiple oomycete species.The effector repertoire of P. effusa is reduced in com-
parison to Phytophthora spp., similar to other downymildews [3, 23, 45]. P. effusa has fewer RxLR motifencoding effectors, (~ 90) than P. tabacina (~ 165),although our analysis had the additional requirement ofa degenerate EER motif or WY domain being encoded,which was not used for the predictions of P. tabacina[23]. More Crinklers (CRNs) were reported for P. taba-cina (~ 130) than P. effusa (20; Table 2). P. effusa had amarginally higher incidence of genes models encodingputative pathogenicity associated domains but notRxLRs or CRNs (Table 3); ~ 1.7% of the gene models ofeach isolate encoded a putative pathogenicity domain vs.~ 1.4% of the gene models for P. tabacina and H. arabi-dopsidis. P. effusa has a similar frequency of pathogen-icity associated genes as P. halstedii, while over 2.5% ofPhytophthora spp. gene models encode putative patho-genicity domains. Less than 3% of the predicted genes inP. effusa are implicated in pathogenicity.Several Pfam [35] domains were found to be depleted
in downy mildews, possibly reflecting adaptations to bio-trophy (Table 6; Fig. 3). Eight transporter-associatedPfam domains were significantly depleted in P. effusaand all other downy mildews compared to Phytophthoraspp. (Table 4) similar to previous reports [23, 45]. Manyorthogroups containing gene models encoding thesedomains were not detected in downy mildews (Fig. 3,Table 6). The same analysis revealed the absence oforthogroups containing genes encoding carbohydratebinding or pathogenicity domains from all downymildews (Fig. 3, Table 6). These observations are consist-ent with observations of the reduction in the frequencyof pathogenicity associated proteins (Table 3) encodingkazal domains, pectate lyase, elicitin, and necrosis indu-cing proteins. Therefore, the repertoire of pathogenicityproteins seems to be consistently reduced in the bio-trophic downy mildews.Three of the four downy mildew species also had a
reduction in calcium binding and flagella associated do-mains (Fig. 3, Table 6). The absence of flagella-associateddomains is expected because P. halstedii is the onlydowny mildew species analyzed which produceszoospores [1, 49, 56]. The absence of genes encodingcalcium associated domains (Fig. 3, Table 6) is consistentwith the upregulation of one of the depleted domains
Fletcher et al. BMC Genomics (2018) 19:851 Page 15 of 23
(EF-hand) during sporangial development and cleavageduring zoospore formation [55]. Genes encoding thesedomains would be under reduced selection in the absenceof flagella. The missing genes encoding calcium-associateddomains are good candidates for genes associated withzoospore biology.Phylogenomics resolved two independent lineages of
downy mildews (Fig. 5), consistent with other studies[2, 3], but not with those that infer a single origin[4]. Our topology placed Peronospora spp. in a cladethat included H. arabidopsidis, P. cubensis and S. gramini-cola. This clade was separate from a clade that includedthe two species of Plasmopara spp. analyzed. The consist-ent loss of genes encoding transporter, phytopathogeni-city, and carbohydrate-associated domains between theseclades indicates that these genes are functional in thenecrotrophic stages of Phytophthora spp. [57] and there-fore have been lost in the biotrophic downy mildews.The allele frequencies of P. effusa were not consistent
with those of a regular diploid (Fig. 4c). Both isolateshad alternative allele frequencies of ~ 0.33 in addition tothe peak at 0.5 expected for a diploid. The absence ofheterozygous 21-mers in P. effusa R14 (Fig. 4a) and thelow frequency of SNPs detected when reads weremapped back to the assembly indicated that this isolatewas largely homozygous. The frequency of SNPs wasslightly higher in R13 though this was not proportionalto the two clusters of 21-mers. Additionally, the 21-merswere not at the expected coverage for heterozygous loci(Fig. 4a). The majority of 21-mers from both of theseclusters were present in the assembly (Fig. 4b), althoughthe assembly size of R13 was not inflated relative to R14.If this was heterozygosity in R13 then half the 21-merswould be expected to be absent [36]. These results im-plied that few of the 21-mers were heterozygous in R13.The 21-mer profile of R13 cannot be explained by a mix-ture of isolates; shared 21-mers in a mixture of two iso-lates would be present in the highest coverage clusterand the lower coverage cluster would be made up of21-mers differentiating the two. This is not what was ob-served (Fig. 4b). In addition, these 21-mers should notall be present in an assembly of a mixture of isolates be-cause they would produce bubbles in the assembly graphthat would be collapsed in a consensus assembly. The21-mer profile of R13 indicates that this isolate has anambiguous genomic architecture, in which a proportionof its genome has either been lost or duplicated. Thiswas supported by the normalized read depth of genes(Fig. 4d), in which R13 had a wider spectrum of normal-ized read coverage than R14. While measurements byflow cytometry were not possible for these two isolates,later measurements of a separate isolate revealed thatsome nuclei were smaller at 80 Mb than the majority of2C nuclei at 149 Mb (Additional file 1). The basis of the
apparent variation in nuclear DNA size warrants furtherinvestigation to determine the prevalence of aneuploidyand polyploidy in P. effusa as has previously been docu-mented for Phytophthora spp. [43, 44, 46, 58].The mitochondrial genome of P. effusa is circular in
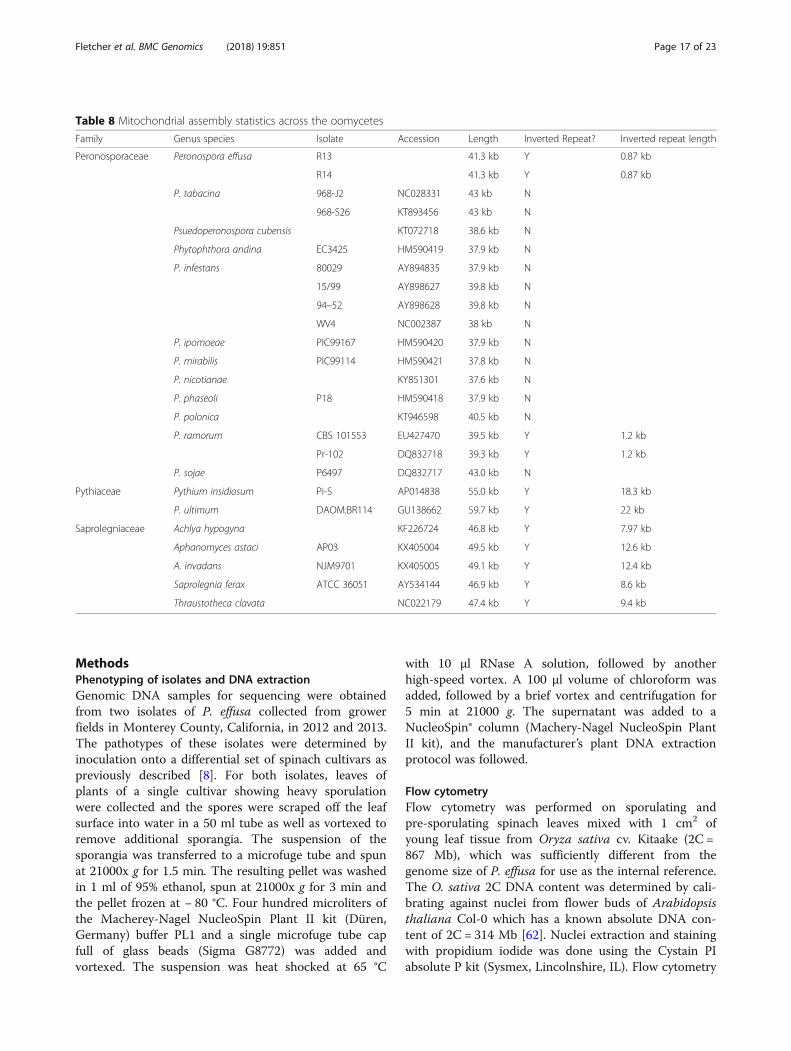
orientation, approximately 41.3 kb in size and exhibitedno sequence divergence between the genomes of race 13and 14. The size is similar to other oomycetes (Table 8).The mitochondrial genome of P. effusa encodes thesame common suite of genes, including the putativeORFs ymf16, ymf98, ymf99, ymf100, and ymf101 as ob-served in the related taxa. There were also an additionalfour putative ORFs of unknown function encodedbetween rns and cox2 and one putative ORF betweenthe atp1 and nad5 genes that are unique to P. effusa,two of which share some level of sequence identity witha putative ORF in P. tabacina and P. sojae. The locationsof the four species-specific putative ORFs between rnsand cox2 were the same as in P. tabacina and P. cuben-sis. Inverted repeats (IRs) have been observed in themitochondrial genomes of the PeronosporomycetePythium and Saprolegniomycetes Saprolegnia, Achyla,Thraustotheca and Aphanomyces, but these typicallyrepresent between 34 to 73% of the genome and encodethe large and small ribosomal RNAs [37–39, 41, 59, 60].While an IR is present in P. effusa, it is atypical for anoomycete because it is less than 900 bp and does notencode rRNA. These features are similar to the 1150 bpinverted repeat present in P. ramorum [40]. Recombin-ation between the small IRs in P. ramorum generatedisomers of the genome where the region between therepeats was also present in an inverted orientation [61]additional experimentation is needed with P. effusa toconfirm if this is occurring in this taxon as well.
ConclusionsWe sequenced, assembled and annotated two isolatesrepresenting distinct races of P. effusa, the causal oomy-cete of spinach downy mildew. These assemblies arehigh quality (Table 1) and will serve as good referencesfor this genus of over 500 species [1]. Approximately8600 gene models were identified in each isolate thatshared a high level of orthology between one anotherand with other oomycetes. Genes encoding domainsassociated with pathogenicity, transporters, andcarbohydrate-binding were depleted across multipledowny mildews compared to Phytophthora spp. indica-tive of a parallel gene loss during the evolution ofobligate biotrophy and genes associated with flagellawere consistently absent in the non-flagellate downymildews. These isolates of P. effusa were predominantlyhomozygous. High quality annotated assemblies of moreisolates are required to resolve the complex genomearchitecture of P. effusa.
Fletcher et al. BMC Genomics (2018) 19:851 Page 16 of 23
MethodsPhenotyping of isolates and DNA extractionGenomic DNA samples for sequencing were obtainedfrom two isolates of P. effusa collected from growerfields in Monterey County, California, in 2012 and 2013.The pathotypes of these isolates were determined byinoculation onto a differential set of spinach cultivars aspreviously described [8]. For both isolates, leaves ofplants of a single cultivar showing heavy sporulationwere collected and the spores were scraped off the leafsurface into water in a 50 ml tube as well as vortexed toremove additional sporangia. The suspension of thesporangia was transferred to a microfuge tube and spunat 21000x g for 1.5 min. The resulting pellet was washedin 1 ml of 95% ethanol, spun at 21000x g for 3 min andthe pellet frozen at − 80 °C. Four hundred microliters ofthe Macherey-Nagel NucleoSpin Plant II kit (Düren,Germany) buffer PL1 and a single microfuge tube capfull of glass beads (Sigma G8772) was added andvortexed. The suspension was heat shocked at 65 °C
with 10 μl RNase A solution, followed by anotherhigh-speed vortex. A 100 μl volume of chloroform wasadded, followed by a brief vortex and centrifugation for5 min at 21000 g. The supernatant was added to aNucleoSpin® column (Machery-Nagel NucleoSpin PlantII kit), and the manufacturer’s plant DNA extractionprotocol was followed.
Flow cytometryFlow cytometry was performed on sporulating andpre-sporulating spinach leaves mixed with 1 cm2 ofyoung leaf tissue from Oryza sativa cv. Kitaake (2C =867 Mb), which was sufficiently different from thegenome size of P. effusa for use as the internal reference.The O. sativa 2C DNA content was determined by cali-brating against nuclei from flower buds of Arabidopsisthaliana Col-0 which has a known absolute DNA con-tent of 2C = 314 Mb [62]. Nuclei extraction and stainingwith propidium iodide was done using the Cystain PIabsolute P kit (Sysmex, Lincolnshire, IL). Flow cytometry
Table 8 Mitochondrial assembly statistics across the oomycetes
Family Genus species Isolate Accession Length Inverted Repeat? Inverted repeat length
Peronosporaceae Peronospora effusa R13 41.3 kb Y 0.87 kb
R14 41.3 kb Y 0.87 kb
P. tabacina 968-J2 NC028331 43 kb N
968-S26 KT893456 43 kb N
Psuedoperonospora cubensis KT072718 38.6 kb N
Phytophthora andina EC3425 HM590419 37.9 kb N
P. infestans 80029 AY894835 37.9 kb N
15/99 AY898627 39.8 kb N
94–52 AY898628 39.8 kb N
WV4 NC002387 38 kb N
P. ipomoeae PIC99167 HM590420 37.9 kb N
P. mirabilis PIC99114 HM590421 37.8 kb N
P. nicotianae KY851301 37.6 kb N
P. phaseoli P18 HM590418 37.9 kb N
P. polonica KT946598 40.5 kb N
P. ramorum CBS 101553 EU427470 39.5 kb Y 1.2 kb
Pr-102 DQ832718 39.3 kb Y 1.2 kb
P. sojae P6497 DQ832717 43.0 kb N
Pythiaceae Pythium insidiosum Pi-S AP014838 55.0 kb Y 18.3 kb
P. ultimum DAOM:BR114 GU138662 59.7 kb Y 22 kb
Saprolegniaceae Achlya hypogyna KF226724 46.8 kb Y 7.97 kb
Aphanomyces astaci AP03 KX405004 49.5 kb Y 12.6 kb
A. invadans NJM9701 KX405005 49.1 kb Y 12.4 kb
Saprolegnia ferax ATCC 36051 AY534144 46.9 kb Y 8.6 kb
Thraustotheca clavata NC022179 47.4 kb Y 9.4 kb
Fletcher et al. BMC Genomics (2018) 19:851 Page 17 of 23

was done on a BD FACScan (Becton Dickinson, EastRutherford, NJ). For each measurement, 10,000 nucleiwere assessed. Data was analyzed using FlowJo (Ashland,OR).
SequencingIllumina TruSeq DNA libraries were prepared and se-quenced at the Center for Genome Research & Biocom-puting, Oregon State University (Corvallis, OR; http://cgrb.oregonstate.edu/core). DNA was quantified using aQubit HS dsDNA assay (Invitrogen, Carlsbad, CA) andsheared by sonication followed by end repair, adenyla-tion of 3′ ends, and adapter ligation. Fragments werepurified by excision from an agarose gel, enriched byPCR, and the library was quantified with a Qubit HSdsDNA assay (Invitrogen). Sizing of the library was doneusing Agilent Bioanalyzer HS-DNA chip (Agilent Tech-nologies, Waldbronn, Germany), with final quantifica-tion by qPCR using a KAPA Library quantification kit.The median library fragment sizes were 516 bp and365 bp, for R13 and R14, respectively. Paired endlibraries were prepared from genomic DNA of two P.effusa isolates (R13 and R14) and sequenced, 100 bppaired-end on an Illumina HiSeq 2000.
AssemblyReads were adapter and quality trimmed using BBMAP[63] and mapped to a reference containing bacterial andoomycete genomes available from NCBI, using BWAMEM, v0.7.12 [64], with flags -aC. Paired reads whichmapped to oomycete genomes or failed to map to anyorganism were then advanced to assembly withMaSuRCA v2.3.2 [65]. Assemblies were done, specifyinga JELLYFISH [30] size of 1 × 10¹⁰, in iterative k-mersteps of 10, ranging from 31 to 91, and 99 with add-itional assemblies performed at single step k-mer sizesflanking the highest scoring assemblies (measured onN50, assembly size, number of scaffolds > 100 kb, totalnumber of scaffolds, BUSCO [27] score). The top fiveassemblies of each isolate were then positively filteredfor oomycete scaffolds against NCBI nt, and negativelyfiltered for mitochondrial associated scaffolds with themitochondrial assembly (produced as described below)using BLASTn [26]. Assemblies made up of scaffoldswith a top BLASTn hit against oomycete scaffolds andwith a minimum scaffold size of 1 kb, were then mergedin a step-wise manner from lowest scaffold number tohighest using Quickmerge [66]. Repeat libraries were gen-erated with RepeatModeler [32], assemblies soft-maskedwith RepeatMasker [67] and secondary haplotypes col-lapsed, first with Redundans [28], then Haplomerger2[29]. Final assembly statistics were obtained using BBMAP[63] and compared to previously assembled genomes.Completeness statistics were obtained with BUSCO.
Assemblies were aligned against one another withNUCmer [68] (−l 100), and both were independentlyaligned against P. sojae v3.0 with PROmer [68] (−l 30).These were ran and visualized as part of SyMap [31],with a minimum dot requirement of 5 and allowingmerged blocks. REAPR [69] summary scores of the finaland intermediate assemblies were calculated as previous[70]. REAPR summary scores of both isolates increasedas post-assembly processing was performed on each iso-late with the final draft assemblies presented here havingthe highest score (Additional files 2 and 14).
AnnotationThe annotation workflow is depicted in Additional file 8.Ab initio annotation was performed with SNAP [33] aspart of the MAKER pipeline [34]. Initial predictions weregenerated with MAKER from all oomycete EST andprotein data available on NCBI (est2genome = 1,protein2genome = 1) masking with the above generatedrepeat library. These predictions were used to produce aHMM using SNAP default settings (fathom, forge,hmm-assembler.pl) and then bootstrapped through sub-sequent rounds of MAKER, the first using the est2gen-ome and protein2genome evidence for prediction, withsubsequent runs turning this off to use only the SNAPHMM for gene prediction (est2genome = 0, protein2gen-ome = 0). All maker runs surveyed single exon proteinswith a minimum nucleotide length of 240 being consid-ered (single_exon = 1, single_length = 240). The optimalrun was identified through comparative analysis of alter-native predictions, namely runs were scored for BLAST[26] hits to the Oomycete training protein sequences, %orthology detected with the Oomycete training databaseas detected by OrthoFinder [71] and average e-value ofPfam [35] domains detected with InterProScan [72] witha value under 1e− 5.Additional putative effector gene models were identi-
fied from all ORFs predicted from the genome over 80residues in length with no missing data. All ORFswere surveyed for secretion signals using SignalP v4.1(−u 0.34) and independently with SignalP v3.0 (de-fault settings) [73, 74]. ORFs were considered secretedif a positive result was obtained through either orboth approaches and no trans-membrane domainswere detected by SignalP v4.1. Further filtering,removing ORFs targeted to the mitochondria wasperformed using TargetP [75]. All ORFs predicted (i.e.regardless of signal peptide prediction) were surveyedfor Crinklers (CRN) and WY repeats using hiddenMarkov models (HMMs) with HMMER v3.1b1 [76].The CRN HMM was produced with hmmsearch, in-putting an alignment of all labelled Phytophthora spp.CRNs from NCBI. The WY HMM was described previ-ously [77, 78]. Predicted secreted ORFs were surveyed for
Fletcher et al. BMC Genomics (2018) 19:851 Page 18 of 23
RxLR motifs and previously described/queried degenerate[GHQ]xLR or RxL[GKQ] motifs [53, 79–82] linked witheither degenerate [DE][DE][ER] motif or a WY repeat[78]. Predicted effectors were integrated into the Makerproduced GFF file by identifying over-lapping gene modelson the same strand with BEDTools [83]. Gene modelswere characterized as to whether they shared either orboth start and stop codon positions.Candidate effectors at unique genomic loci were
further curated to ensure that they did not overlap orneighbor one another within 1 kb on the same strand. Ininstances when not the case, these models were manu-ally refined, with the aid of BLAST [26], to producemulti-exonic RxLR-(EER)-WY models [84, 85].The final predicted protein sequence was then gener-
ated from the GFF using GAG and putative effectorswere re-identified on the entire annotation set to obtainfinal putative effector counts, which include those inde-pendently predicted by MAKER [34]. Conserved func-tional domains, including pathogenicity associateddomains, of the final gene models were identified withInterProScan [72] and putative gene model names wereassigned through stringent BLAST to the UniProt refer-ence database [86]. These features were added to theNCBI table file with Annie and GAG [87, 88].
Comparative genomicsDe novo identification of genes encoding pathogenicityassociated domains for P. effusa, other downy mildewand Phytophthora species was performed by runningInterProScan on all available gene models. Gene modelswere inferred to contain a pathogenicity associated do-main if such a domain was identified by CDD, Gene3d,PANTHER, Pfam, PRINTS, ProDom, ProSitePatterns, Pro-SiteProfiles, SMART or SUPERFAMILY [35, 72, 89–94].The total frequency of gene models encoding pathogenicityassociated domains was calculated as the number ofunique gene models identified with any of the specified do-mains divided by the total number of gene models sur-veyed. T-tests were performed on the frequency of modelscontaining each domain and on the total frequency ofpathogenicity associated gene models, segregating the re-sults as downy mildew vs. Phytophthora and Peronosporaspp., and H. arabidopsidis vs. Phytophthora spp. and P.halstedii. Chi-squared testing was performed on Pfam [35]domains detected across all seven species. In this test, aprotein was counted once for each unique domain itencoded (i.e. it was not weighted if it encoded multiple of asingle domain type). Expected scores were weighted for thenumber of proteins detected as having Pfam domains ineach species. Tests were performed on all domains as P.effusa vs. all, Peronospora spp. vs. all, Peronospora spp. andH. arabidopsidis vs. all, and downy mildews vs. Phy-tophthora spp. A Bonferroni-adjusted p-value was
calculated based on the number of domains tested, withPfam domain scoring below this p-value manually investi-gated. Instances where an over-representation of domainsin P. tabacina appeared to score a significant result wereinvestigated, owing to the high duplication in the P. taba-cina assemblies detected in this study.Orthogroups were inferred using OrthoFinder [71].
First gene models of P. effusa isolates were compared ina two-way analysis. Proteins detected as absent betweenisolates were investigated by mapping reads of one iso-late to the other isolates assembly using BWA MEMv0.7.12 [64] and calling SNPs/Indels with SAMtoolsmpileup v0.1.18 [95]. For comparison, the same wasreplicated on the two P. tabacina isolates. These isolateswere then combined into a set for their respectivespecies and a seven-way comparison was performed,including H. arabidopsidis, P. infestans, P. ramorum, P.sojae and P. halstedii. Intersects were visualized withupsetR [96] and orthology coefficients (OC) were calcu-lated as OC = (C/T1) x (C/T2), where C is the number ofoverlapping orthologous groups, T1 is the total numberof orthologous groups identified in sample 1 and T2 isthe total number of orthologous groups identified insample 2. Orthogroups which contained gene modelsencoding Pfam domains, inferred as under-representedby the Chi-squared analysis, in downy mildew assemblieswere identified and analyzed for presence/absence ofeach species. An orthogroup was considered single copyif only 0–1 models were present for each Phytophthoraspp., P. halstedii and H. arabidopsidis and 0–2 modelsdetected for P. tabacina and P. effusa, owing to a) twoisolates being used in the analysis for both Peronosporaspp. and b) the high level of duplication detected in P.tabacina assemblies. Finally, orthogroups containingpreviously identified P. infestans nitrogen and sulphurassimilation enzymes [45] were identified to obtainorthologs of these enzymes in downy mildew species.
K-mer and read analysisJELLYFISH [30] 21-mer hashes for individual read fileswere generated and histograms were obtained toestimate the genome size of both isolates. These wereplotted with R [97] to obtain the 21-mer boundaries ofsingle copy regions of the genome. K-mer based genomesize estimates were calculated by summing the results ofk-mer density multiplied by its frequency. Estimates ofthe size of the single copy portion of the genome wereproduced by limiting this calculations to k-mers withdensities between the limits of the k-mer peak profiles(R13; 82–340, R14; 142–560; Additional file 13). Hasheswere visually inspected through KAT density plots [36],for both P. effusa isolates and comparatively for twopreviously sequenced P. tabacina isolates [23]. Hashesgenerated from pairs of read files were also compared to
Fletcher et al. BMC Genomics (2018) 19:851 Page 19 of 23

assembly hashes generated from resulting isolate assem-blies and visually inspected through KAT spectra-cn plots.Heterozygosity of each isolate was estimated by calling
SNPs from reads mapped back to either assembly, usingSAMtools v0.1.18 mpileup [95] and calculating the num-ber of heterozygous sites, defined as those with an allelefrequency between 0.2 and 0.8. Plotting the frequency ofthe alternative allele of heterozygous SNPs was per-formed by extracting the number of reads supportingthe reference and alternative allele at each bi-allelic SNPsite and obtaining the frequency of reads supporting thealternative allele and binned to the nearest hundredth.For SNP sites to be counted they had to be covered by aminimum of 50 reads. The number of SNPs per binwere summed and plotted in R [97]. Variant call filescontaining the SNP coordinates were intersected withgenic lines of the annotated gff using BEDTools [83] toobtain SNP counts within genic regions and the allelefrequency plots were produced as above. Read coverageper gene was calculated by obtaining the number ofreads per genic locus, using BEDTools multicov [83] re-quiring the assembly file and an indexed binary align-ment map file, multiplied by the read length, divided bythe length of the gene. The coverage was normalized foreach isolate (calculated from a BEDTools genomecovplot) and plotted in R using ggplot2 [98] applying a mul-tiplicate bandwidth adjustment of ten.
PhylogenomicsPhylogenetics of BUSCO [27] orthologs across a panelof published, publicly available downy mildewassemblies was carried out with select, high qualityPhytophthora assemblies and rooted with Pythiumultimum. BUSCO was run independently on everyassembly to be surveyed and single copy orthologsfrom each were identified. Amino acid sequences oforthologs present in all isolates were then aligned inde-pendently using MAFFT v7.123b [99] (Additional file 15).Alignments were concatenated and RAxML v8.0.26 [100]was run with 1000 bootstraps and the PROTGAM-MAAUTO substitution model. The resulting tree wasrooted with P. ultimum and visualized in Geneious andlabels were manually placed to improve legibility.
Mitochondrial assembly and annotationContigs from a de novo genomic assembly in CLCGenomics Workbench (v8; Qiagen, Redwood City, CA)were identified as mitochondrial due to sequencesimilarity with P. tabacina mitochondrial sequences(KT893455) by BLAST analysis. These were used astemplates for further assembly with SeqMan NGen(v4.1.2, DNASTAR, Madison, WI, USA). The resultingassemblies were evaluated for uniformity and depth ofcoverage. Contigs were broken when gaps/low coverage
or inconsistencies were observed and the set of smallercontigs reassembled using the small templated assemblyoption of SeqMan NGen to extend the ends of thecontigs and the close gaps. ORFs were predicted andannotated with DS Gene v1.5 (Accelrys, San Diego, CA)using the universal genetic code with confirmation ofgene identities using BLAST [26] analysis against mito-chondrial genome sequences published for P. tabacina,Pythium, and Phytophthora spp. [23, 38, 40] tRNA cod-ing regions were placed using tRNAscan-SE v1.3.1 [101].
Additional files
Additional file 1: Flow cytometry measurements of a P. effusa isolate.(PDF 305 kb)
Additional file 2: Intermediate assembly statistics and REAPR scores.(XLSX 24 kb)
Additional file 3: JELLYFISH histogram outputs and line plots. (7Z 171 kb)
Additional file 4: RepeatModeler summary of outputs. (XLSX 8 kb)
Additional file 5: Long Terminal Repeat plots. Long terminal repeats areplotted as previously described [23]. The top panel show the distributionof insertion estimates for each LTR family, the number to the rightreports the number of members in that family. The bottom panelestimates the time from initial insertion of the major LTR super-families;retrotransposon LTR Gypsy (RLG) and retrotransposon LTR Copia (RLC).(JPEG 243 kb)
Additional file 6: Intermediate annotation results. Summary of makerruns bootstrapping SNAP hidden markov model. (XLSX 13 kb)
Additional file 7: Annotation pipeline. Workflow overview for theannotation of P. effusa. (PNG 242 kb)
Additional file 8: ORF annotation results. Summary of the results fromhmm search and regular expression string searches when applied to allopen reading frames of both P. effusa isolates. (XLSX 8 kb)
Additional file 9: Manual ORF curation. Image summarizing the initialORFs predicted, manually curated exon structure, and RxLR, EER and WYlocations along genomic fragments of both P. effusa isolates. Three wereannotated in each isolate. The ORFs are not aligned. (PNG 123 kb)
Additional file 10: Significant chi-squared results. All significant Chisquared results detected, when comparing the occurrence of domainsencoded by P. effusa, P. tabacina, H. arabidopsidis, P. halstedii, P. ramorum,P. sojae and P. infestans. (XLSX 32 kb)
Additional file 11: Read alignment summary of isolate specific genes.Details genes which were found to contain inter-isolate indels or SNPswhich affected either the start or stop codon position of the protein. Toquery P.effusa proteins in GenBank, substitute PeffR13 with DD237,PeffR14 with DD238 and remove the -RA suffix. (XLSX 17 kb)
Additional file 12: Orthogroups unique to Peronospora spp. Detailssequence names of all proteins inferred as being orthologous onlybetween P. effusa and P. tabacina. To query P. effusa proteins in GenBank,substitute PeffR13 with DD237, PeffR14 with DD238 and remove the -RAsuffix. (XLSX 10 kb)
Additional file 13: Orthogroup overview. Listing all the orthogroupsidentified and the genes they contain, which were plotted in Fig. 4. Toquery P. effusa proteins in GenBank, substitute PeffR13 with DD237,PeffR14 with DD238 and remove the -RA suffix. (7Z 21 kb)
Additional file 14: REAPR scores. Summarizing the REAPR scoresreported in Additional file 1. (JPEG 89 kb)
Additional file 15: BUSCO alignments used to create Fig. 5. Thealignments are not concatenated. Note: .7z files can be accessed bydownloading 7zip. This software is free and available at https://www.7-zip.org/. (7Z 50 kb)
Fletcher et al. BMC Genomics (2018) 19:851 Page 20 of 23

Abbreviationsbp: Base-pair; CRN: Crinkler; H. arabidopsidis: Hyaloperonospora arabidopsidis;HMM: Hidden Markov model; IR: Inverted repeat; kb: Kilo-base-pair; LTR: Longterminal repeat; Mb: Mega-base-pair; ml: Milliliter; ORF: Open reading framw;P. cubensis: Pseudoperonospora cubensis; P. effusa: Peronospora effusa; P.farinosa: Peronospora farinosa; P. halstedii: Plasmopara halstedii; P.infestans: Phytophthora infestans; P. ramorum: Phytophthora ramorum; P.sojae: Phytophthora sojae; P. tabacina: Peronospora tabacina; P.ultimum: Pythium ultimum; R: Race; R13: Race 13; R14: Race 14; S.graminicola: Sclerospora graminicola; S. oleracea: Spinacia oleracea;SNPs: Single nucleotide polymorphisms; spp.: Species; μl: Microliter
AcknowledgmentsWe thank Amy Anchieta (USDA ARS, Salinas) for performing the DNAextraction of P. effusa isolates R13 and R14, Huaqin Xu for databasesupport, and acknowledge Oregon State University, where thesequencing of both P. effusa isolates was performed. This project wassupported by the University of California Davis Flow Cytometry SharedResource Laboratory with funding from the NCI P30 CA093373 (CancerCenter), and NIH NCRR C06-RR12088, S10 OD018223, S10 RR12964 andS10 RR 026825 grants and with technical assistance from Ms. BridgetMcLaughlin and Mr. Jonathan Van Dyke.
FundingThe work was supported by The Novozymes Inc. Endowed Chair inGenomics to RWM.
Availability of data and materialsAll sequence data is available under BioProject PRJNA453556.
Authors’ contributionsKF performed the assembly, annotation, and in silico nuclear analysis aswell as drafted the manuscript; SKl, SKo, BM collected and characterizedthe isolates and prepared sequencing libraries; LD & SR assisted the insilico analysis; FM performed the in silico mitochondrial analysis; LBperformed the flow cytometry; RM provided conceptual input andsupervision as well as made major contributions to writing themanuscript. All authors contributed to writing and approved the finalmanuscript.
Ethics approval and consent to participateNot applicable.
Consent for publicationNot applicable.
Competing interestsThe authors declare that they have no competing interests.
Publisher’s NoteSpringer Nature remains neutral with regard to jurisdictional claims inpublished maps and institutional affiliations.
Author details1The Genome Center, Genome and Biomedical Sciences Facility, University ofCalifornia, 451 East Health Sciences Drive, Davis, CA 95616, USA. 2UnitedStates Department of Agriculture, Agricultural Research Service, Salinas, CA93905, USA. 3UC Davis Cooperative Extension Monterey County, Salinas, CA93901, USA. 4Departments of Plant Sciences, Molecular & Cellular Biology,Medical Microbiology & Immunology, University of California, Davis 95616,USA. 5Present Address: The Sainsbury Laboratory, Norwich Research Park,Norwich NR4 7UH, UK. 6Present Address: TriCal Diagnostics, Hollister, CA95023, USA.
Received: 30 April 2018 Accepted: 31 October 2018
References1. Thines M, Choi YJ. Evolution, diversity, and taxonomy of the
Peronosporaceae, with focus on the genus Peronospora. Phytopathology.2016;106(1):6–18.
2. McCarthy CGP, Fitzpatrick DA. Phylogenomic Reconstruction of theOomycete Phylogeny Derived from 37 Genomes. mSphere. 2017;2(2):e00095–17.
3. Sharma R, Xia X, Cano LM, Evangelisti E, Kemen E, Judelson H, Oome S,Sambles C, van den Hoogen DJ, Kitner M, et al. Genome analyses of thesunflower pathogen Plasmopara halstedii provide insights into effectorevolution in downy mildews and Phytophthora. BMC Genomics.2015;16(1):741.
4. Ye W, Wang Y, Shen D, Li D, Pu T, Jiang Z, Zhang Z, Zheng X, Tyler BM,Wang Y. Sequencing of the litchi downy blight pathogen reveals it is aPhytophthora species with downy mildew-like characteristics.Mol Plant-Microbe Interact. 2016;29(7):573–83.
5. Correll JC, Bluhm BH, Feng C, Lamour K, du Toit LJ, Koike ST. Spinach: bettermanagement of downy mildew and white rust through genomics.Eur J Plant Pathol. 2011;129(2):193–205.
6. Byford W. Host specialization of Peronospora farinosa on Beta, Spinacia andChenopodium. Trans Br Mycol Soc. 1967;50(4):603–7.
7. Klosterman SJ, Anchieta A, McRoberts N, Koike ST, Subbarao KV, Voglmayr H,Choi YJ, Thines M, Martin FN. Coupling spore traps and quantitative PCRassays for detection of the downy mildew pathogens of spinach(Peronospora effusa) and beet (P. schachtii). Phytopathology.2014;104(12):1349–59.
8. Feng C, Correll JC, Kammeijer KE, Koike ST. Identification of new races anddeviating strains of the spinach downy mildew pathogen Peronosporafarinosa f. sp. spinaciae. Plant Dis. 2013;98(1):145–52.
9. Feng C, Saito K, Liu B, Manley A, Kammeijer K, Mauzey SJ, Koike S, Correll JC.New races and novel strains of the spinach downy mildew pathogenPeronospora effusa. Plant Dis. 2018;102(3):613–8.
10. Van Asch MAJ, Frinking HD. Heterothallism in Peronospora farinosa f.sp.spinaciae. Trans Br Mycol Soc. 1988;91(4):692–3.
11. Choi YJ, Hong SB, Shin HD. Re-consideration of Peronospora farinosainfecting Spinacia oleracea as distinct species, Peronospora effusa. MycolRes. 2007;111(Pt 4):381–91.
12. Choi YJ, Klosterman SJ, Kummer V, Voglmayr H, Shin HD, Thines M. Multi-locus tree and species tree approaches toward resolving a complex clade ofdowny mildews (Straminipila, Oomycota), including pathogens of beet andspinach. Mol Phylogenet Evol. 2015;86:24–34.
13. Choi Y-J, Thines M. (2288) Proposal to reject the name Botrytis farinosa(Peronospora farinosa) (Peronosporaceae: oomycetes). Taxon. 2014;63(3):675–6.
14. Minor T Bond J. Vegetables and Pulses Outlook. Washington DC: U.S.Department of Agriculture, Economic Research Service, Situation andOutlook, VGS-358. 2017. Retrieved from: http://usda.mannlib.cornell.edu/usda/ers/VGS//2010s/2017/VGS-04-28-2017.pdf. Accessed 8 Nov 2018.
15. Koike S, Cahn M, Cantwell M, Fennimore S, Lestrange M, Natwick E, SmithRF, Takele E. Spinach production in California. Univ Calif Agric Nat ResourPubl. 2011;7212. https://escholarship.org/uc/item/67w2p91c. Accessed 8Nov 2018.
16. Xu C, Jiao C, Sun H, Cai X, Wang X, Ge C, Zheng Y, Liu W, Sun X, Xu Y, et al.Draft genome of spinach and transcriptome diversity of 120 Spinaciaaccessions. Nat Commun. 2017;8:15275.
17. Brandenberger L, Correll J, Morelock T. Identification of and cultivarreactions to a new race (race 4) of Peronospora farinosa f. sp. spinaciae onspinach in the United States. Plant Dis. 1991;75(6):630–4.
18. Correll J. Denomination of Pfs: 17, a new race of downy mildew in spinach.In: ANR Blogs: University of California Cooperative Extension, Division ofAgriculture and Natural Resources; 2018. https://ucanr.edu/blogs/blogcore/postdetail.cfm?postnum=26906. Accessed 8 Nov 2018.
19. Lyon R, Correll J, Feng C, Bluhm B, Shrestha S, Shi A, Lamour K. Populationstructure of Peronospora effusa in the southwestern United States. PLoSOne. 2016;11(2):e0148385.
20. Kunjeti SG, Anchieta A, Subbarao KV, Koike ST, Klosterman SJ. Plasmolysisand vital staining reveal viable oospores of Peronospora effusa in spinachseed lots. Plant Dis. 2015;100(1):59–65.
Fletcher et al. BMC Genomics (2018) 19:851 Page 21 of 23

21. Inaba T, Morinaka T. Heterothallism in Peronospora effusa. Phytopathology.1984;74(2):214–6.
22. Voglmayr H, Greilhuber J. Genome size determination in peronosporales(Oomycota) by Feulgen image analysis. Fungal Genet Biol. 1998;25(3):181–95.
23. Derevnina L, Chin-Wo-Reyes S, Martin F, Wood K, Froenicke L, Spring O,Michelmore R. Genome sequence and architecture of the tobacco downymildew pathogen Peronospora tabacina. Mol Plant-Microbe Interact.2015;28(11):1198–215.
24. Dussert Y, Gouzy J, Richart-Cervera S, Mazet ID, Delière L, Couture C,Legrand L, Piron M-C, Mestre P, Delmotte F. Draft genome sequence ofPlasmopara viticola, the grapevine downy mildew pathogen. GenomeAnnounc. 2016;4(5):e00987–16.
25. Yin L, An Y, Qu J, Li X, Zhang Y, Dry I, Wu H, Lu J. Genome sequence ofPlasmopara viticola and insight into the pathogenic mechanism. Sci Rep.2017;7:46553.
26. Altschul SF, Gish W, Miller W, Myers EW, Lipman DJ. Basic local alignmentsearch tool. J Mol Biol. 1990;215(3):403–10.
27. Simao FA, Waterhouse RM, Ioannidis P, Kriventseva EV, Zdobnov EM.BUSCO: assessing genome assembly and annotation completeness withsingle-copy orthologs. Bioinformatics. 2015;31(19):3210–2.
28. Pryszcz LP, Gabaldon T. Redundans: an assembly pipeline for highlyheterozygous genomes. Nucleic Acids Res. 2016;44(12):e113.
29. Huang S, Kang M, Xu A. HaploMerger2: rebuilding both haploid sub-assemblies from high-heterozygosity diploid genome assembly.Bioinformatics. 2017;33:2577–9.
30. Marçais G, Kingsford C. A fast, lock-free approach for efficient parallelcounting of occurrences of k-mers. Bioinformatics. 2011;27(6):764–70.
31. Soderlund C, Nelson W, Shoemaker A, Paterson A. SyMAP: a system fordiscovering and viewing syntenic regions of FPC maps. Genome Res.2006;16(9):1159–68.
32. Smit A, Hubley R. RepeatModeler Open-1.0.; 2008-2015.33. Korf I. Gene finding in novel genomes. BMC Bioinformatics. 2004;5(1):59.34. Cantarel BL, Korf I, Robb SMC, Parra G, Ross E, Moore B, Holt C,
Sánchez Alvarado A, Yandell M. MAKER: an easy-to-use annotationpipeline designed for emerging model organism genomes. GenomeRes. 2008;18(1):188–96.
35. Finn RD, Bateman A, Clements J, Coggill P, Eberhardt RY, Eddy SR, Heger A,Hetherington K, Holm L, Mistry J, et al. Pfam: the protein families database.Nucleic Acids Res. 2014;42(D1):D222–30.
36. Mapleson D, Garcia Accinelli G, Kettleborough G, Wright J, Clavijo BJ. KAT: aK-mer analysis toolkit to quality control NGS datasets and genomeassemblies. Bioinformatics. 2017;33(4):574–6.
37. Grayburn WS, Hudspeth DS, Gane MK, Hudspeth ME. The mitochondrialgenome of Saprolegnia ferax: organization, gene content and nucleotidesequence. Mycologia. 2004;96(5):981–9.
38. Levesque CA, Brouwer H, Cano L, Hamilton JP, Holt C, Huitema E, Raffaele S,Robideau GP, Thines M, Win J. Genome sequence of the necrotrophic plantpathogen Pythium ultimum reveals original pathogenicity mechanisms andeffector repertoire. Genome Biol. 2010;11:R73.
39. Makkonen J, Vesterbacka A, Martin F, Jussila J, Diéguez-Uribeondo J, KortetR, Kokko H. Mitochondrial genomes and comparative genomics ofAphanomyces astaci and Aphanomyces invadans. Sci Rep. 2016;6:36089.
40. Martin FN, Bensasson D, Tyler BM, Boore JL. Mitochondrial genomesequences and comparative genomics of Phytophthora ramorum and P.sojae. Curr Genet. 2007;51(5):285–96.
41. O'Brien MA, Misner I, Lane CE. Mitochondrial genome sequences andcomparative genomics of Achlya hypogyna and Thraustotheca clavata.J Eukaryot Microbiol. 2014;61(2):146–54.
42. Yuan X, Feng C, Zhang Z, Zhang C. Complete mitochondrial genome ofPhytophthora nicotianae and identification of molecular markers for theoomycetes. Front Microbiol. 2017;8:1484.
43. Bertier L, Leus L, D’hondt L, de Cock AWAM, Höfte M. Host adaptation andspeciation through hybridization and polyploidy in Phytophthora.PLoS One. 2013;8(12):e85385.
44. Whittaker SL, Shattock RC, Shaw DS. Variation in DNA content of nuclei ofPhytophthora infestans as measured by a microfluorimetric method usingthe fluorochrome DAPI. Mycol Res. 1991;95(5):602–10.
45. Baxter L, Tripathy S, Ishaque N, Boot N, Cabral A, Kemen E, Thines M, Ah-Fong A, Anderson R, Badejoko W. Signatures of adaptation to obligatebiotrophy in the Hyaloperonospora arabidopsidis genome. Science(New York, NY). 2010;330:1549–51.
46. Kasuga T, Bui M, Bernhardt E, Swiecki T, Aram K, Cano LM, Webber J, BrasierC, Press C, Grünwald NJ, et al. Host-induced aneuploidy and phenotypicdiversification in the sudden oak death pathogen Phytophthora ramorum.BMC Genomics. 2016;17(1):385.
47. Li Y, Shen H, Zhou Q, Qian K, van der Lee T, Huang S. Changing ploidy as astrategy: the Irish potato famine pathogen shifts ploidy in relation to itssexuality. Mol Plant-Microbe Interact. 2016;30(1):45–52.
48. Spring O, Zipper R. Evidence for asexual genetic recombination in sunflowerdowny mildew, Plasmopara halstedii. Mycol Res. 2006;110(6):657–63.
49. Spring O, Zipper R. Asexual recombinants of Plasmopara halstediiPathotypes from dual infection of sunflower. PLoS One. 2016;11(12):e0167015.
50. Yoshida K, Schuenemann VJ, Cano LM, Pais M, Mishra B, Sharma R, Lanz C,Martin FN, Kamoun S, Krause J, et al. The rise and fall of the Phytophthorainfestans lineage that triggered the Irish potato famine. eLife. 2013;2:e00731.
51. Jiao W-B, Schneeberger K. The impact of third generation genomictechnologies on plant genome assembly. Curr Opin Plant Biol.2017;36:64–70.
52. Cabral A, Stassen JHM, Seidl MF, Bautor J, Parker JE, Van den Ackerveken G.Identification of Hyaloperonospora arabidopsidis transcript sequencesexpressed during infection reveals isolate-specific effectors. PLoS One.2011;6(5):e19328.
53. Stassen JH, Boer E, Vergeer PW, Andel A, Ellendorff U, Pelgrom K, Pel M,Schut J, Zonneveld O, Jeuken MJ. Specific in planta recognition of twoGKLR proteins of the downy mildew Bremia lactucae revealed in a largeeffector screen in lettuce. Mol Plant-Microbe Interact. 2013;26(11):1259–70.
54. Sun J, Gao Z, Zhang X, Zou X, Cao L, Wang J. Transcriptome analysis ofPhytophthora litchii reveals pathogenicity arsenals and confirms taxonomicstatus. PLoS One. 2017;12(6):e0178245.
55. Ah-Fong AMV, Kim KS, Judelson HS. RNA-seq of life stages of the oomycetePhytophthora infestans reveals dynamic changes in metabolic, signaltransduction, and pathogenesis genes and a major role for calciumsignaling in development. BMC Genomics. 2017;18(1):198.
56. Judelson HS. Dynamics and innovations within oomycete genomes: insightsinto biology, pathology, and evolution. Eukaryot Cell. 2012;11(11):1304–12.
57. Lee S-J, Rose JKC. Mediation of the transition from biotrophy tonecrotrophy in hemibiotrophic plant pathogens by secreted effectorproteins. Plant Signal Behav. 2010;5(6):769–72.
58. Catal M, King L, Tumbalam P, Wiriyajitsomboon P, Kirk WW, Adams GC.Heterokaryotic nuclear conditions and a heterogeneous nuclear populationare observed by flow cytometry in Phytophthora infestans. Cytometry A.2010;77(8):769–75.
59. Hudspeth ME, Shumard DS, Bradford CJ, Grossman LI. Organization of AchlyamtDNA: a population with two orientations and a large inverted repeatcontaining the rRNA genes. Proc Natl Acad Sci U S A. 1983;80(1):142–6.
60. McNabb SA, Boyd DA, Belkhiri A, Dick MW, Klassen GR. An inverted repeatcomprises more than three-quarters of the mitochondrial genome in twospecies of Pythiumm. Curr Genet. 1987;12(3):205–8.
61. Martin FN. Mitochondrial haplotype determination in the oomycete plantpathogen Phytophthora ramorum. Curr Genet. 2008;54(1):23–34.
62. Bennett MD, Leitch IJ, Price HJ, Johnston JS. Comparisons withCaenorhabditis (∼100 Mb) and drosophila (∼175 Mb) using flow cytometryshow genome size in Arabidopsis to be ∼157 Mb and thus ∼25% largerthan the Arabidopsis genome initiative estimate of ∼125 Mb. Ann Bot.2003;91(5):547–57.
63. Bushnell B. BBMap short read aligner. Berkeley: University of California; 2016.https://sourceforge.net/projects/bbmap. Accessed 8 Nov 2018.
64. Li H. Aligning sequence reads, clone sequences and assembly contigs withBWA-MEM: arXiv preprint arXiv:1303.3997; 2013.
65. Zimin AV, Marçais G, Puiu D, Roberts M, Salzberg SL, Yorke JA. TheMaSuRCA genome assembler. Bioinformatics. 2013;29(21):2669–77.
66. Chakraborty M, Baldwin-Brown JG, Long AD, Emerson JJ. Contiguous andaccurate de novo assembly of metazoan genomes with modest long readcoverage. Nucleic Acids Res. 2016;44(19):e147.
67. Smit A, Hubley R, Green P. RepeatMasker open-4.0.; 2013-2015.68. Delcher AL, Kasif S, Fleischmann RD, Peterson J, White O, Salzberg SL.
Alignment of whole genomes. Nucleic Acids Res. 1999;27(11):2369–76.69. Hunt M, Kikuchi T, Sanders M, Newbold C, Berriman M, Otto TD. REAPR: a
universal tool for genome assembly evaluation. Genome Biol. 2013;14(5):R47.70. Bradnam KR, Fass JN, Alexandrov A, Baranay P, Bechner M, Birol I, Boisvert S,
Chapman JA, Chapuis G, Chikhi R, et al. Assemblathon 2: evaluating de
Fletcher et al. BMC Genomics (2018) 19:851 Page 22 of 23

novo methods of genome assembly in three vertebrate species.GigaScience. 2013;2(1):10.
71. Emms DM, Kelly S. OrthoFinder: solving fundamental biases in wholegenome comparisons dramatically improves orthogroup inference accuracy.Genome Biol. 2015;16(1):157.
72. Jones P, Binns D, Chang H-Y, Fraser M, Li W, McAnulla C, McWilliam H,Maslen J, Mitchell A, Nuka G, et al. InterProScan 5: genome-scale proteinfunction classification. Bioinformatics. 2014;30(9):1236–40.
73. Bendtsen JD, Nielsen H, von Heijne G, Brunak S. Improved prediction ofsignal peptides: SignalP 3.0. J Mol Biol. 2004;340(4):783–95.
74. Petersen TN, Brunak S, von Heijne G, Nielsen H. SignalP 4.0: discriminatingsignal peptides from transmembrane regions. Nat Methods. 2011;8(10):785–6.
75. Emanuelsson O, Nielsen H, Brunak S, von Heijne G. Predicting subcellularlocalization of proteins based on their N-terminal amino acid sequence.J Mol Biol. 2000;300(4):1005–16.
76. Finn RD, Clements J, Eddy SR. HMMER web server: interactive sequencesimilarity searching. Nucleic Acids Res. 2011;39(Web Server issue):W29–37.
77. Boutemy LS, King SRF, Win J, Hughes RK, Clarke TA, Blumenschein TMA,Kamoun S, Banfield MJ. Structures of RXLR Effector Proteins. J Biol Chem.2011;286(41):35834–842.
78. Win J, Krasileva KV, Kamoun S, Shirasu K, Staskawicz BJ, Banfield MJ.Sequence divergent RXLR effectors share a structural fold conserved acrossplant pathogenic oomycete species. PLoS Pathog. 2012;8(1):e1002400.
79. Fawke S, Doumane M, Schornack S. Oomycete interactions with plants:infection strategies and resistance principles. Microbiol Mol Biol Rev.2015;79(3):263–80.
80. Mestre P, Carrere S, Gouzy J, Piron MC, Tourvieille de Labrouhe D, VincourtP, Delmotte F, Godiard L. Comparative analysis of expressed CRN and RXLReffectors from two Plasmopara species causing grapevine and sunflowerdowny mildew. Plant Pathol. 2016;65(5):767–81.
81. Stassen JHM. Identification and functional analysis of downy mildeweffectors in lettuce and Arabidopsis; 2012.
82. Tian M, Win J, Savory E, Burkhardt A, Held M, Brandizzi F, Day B. 454genome sequencing of Pseudoperonospora cubensis reveals effectorproteins with a QXLR translocation motif. Mol Plant-Microbe Interact.2011;24(5):543–53.
83. Quinlan AR. BEDTools: the Swiss-army tool for genome feature analysis.Curr Protoc Bioinformatics. 2014;47:11.12.11–34 editoral board, Andreas DBaxevanis [et al].
84. Burkhardt A, Buchanan A, Cumbie JS, Savory EA, Chang JH, Day B.Alternative splicing in the obligate biotrophic oomycete pathogenPseudoperonospora cubensis. Mol Plant-Microbe Interact. 2015;28(3):298–309.
85. Savory EA, Zou C, Adhikari BN, Hamilton JP, Buell CR, Shiu S-H, Day B.Alternative splicing of a multi-drug transporter from Pseudoperonosporacubensis generates an RXLR effector protein that elicits a rapid cell death.PLoS One. 2012;7(4):e34701.
86. The UniProt Consortium. UniProt: the universal protein knowledgebase.Nucleic Acids Res. 2017;45(D1):D158–69.
87. GAG: the Genome Annotation Generator (Version 1.0) [Software] [http://genomeannotation.github.io/GAG]. Accessed 8 Nov 2018.
88. Annie: the ANNotation Information Extractor (Version 1.0) [Software] [http://genomeannotation.github.io/annie]. Accessed 8 Nov 2018.
89. Bru C, Courcelle E, Carrere S, Beausse Y, Dalmar S, Kahn D. The ProDomdatabase of protein domain families: more emphasis on 3D. Nucleic AcidsRes. 2005;33(Database issue):D212–5.
90. Kasuya A, Thornton JM. Three-dimensional structure analysis of PROSITEpatterns. J Mol Biol. 1999;286(5):1673–91.
91. Lees J, Yeats C, Perkins J, Sillitoe I, Rentzsch R, Dessailly BH, Orengo C.Gene3D: a domain-based resource for comparative genomics, functionalannotation and protein network analysis. Nucleic Acids Res. 2012;40(Database issue):D465–71.
92. Letunic I, Bork P. "20 years of the SMART protein domain annotationresource." Nucleic Acids Res. 2017;46(D1):D493-6.
93. Marchler-Bauer A, Bo Y, Han L, He J, Lanczycki CJ, Lu S, Chitsaz F, DerbyshireMK, Geer RC, Gonzales NR, et al. CDD/SPARCLE: functional classification ofproteins via subfamily domain architectures. Nucleic Acids Res.2017;45(Database issue):D200–3.
94. Thomas PD, Kejariwal A, Campbell MJ, Mi H, Diemer K, Guo N, Ladunga I,Ulitsky-Lazareva B, Muruganujan A, Rabkin S, et al. PANTHER: a browsabledatabase of gene products organized by biological function, using curated
protein family and subfamily classification. Nucleic Acids Res. 2003;31(1):334–41.
95. Li H, Handsaker B, Wysoker A, Fennell T, Ruan J, Homer N, Marth G, AbecasisG, Durbin R. The sequence alignment/map format and SAMtools.Bioinformatics. 2009;25(16):2078–9.
96. Conway JR, Lex A, Gehlenborg N. "UpSetR: an R package for thevisualization of intersecting sets and their properties." Bioinformatics. 2017;33(18):2938–40.
97. R Development Core Team. R: a language and environment for statisticalcomputing. Vienna: R Foundation for Statistical Computing; 2012.
98. R Core Team. R: a language and environment for statistical computing. RFoundation for Statistical Computing, Vienna, Austria. 2013.
99. Katoh K, Standley DM. MAFFT multiple sequence alignment softwareversion 7: improvements in performance and usability. Mol Biol Evol.2013;30(4):772–80.
100. Stamatakis A. RAxML version 8: a tool for phylogenetic analysis and post-analysis of large phylogenies. Bioinformatics. 2014;30(9):1312–3.
101. Lowe TM, Eddy SR. tRNAscan-SE: a program for improved detection oftransfer RNA genes in genomic sequence. Nucleic Acids Res.1997;25(5):955–64.
102. Nayaka, S. Chandra, et al. Draft genome sequence of Sclerosporagraminicola, the pearl millet downy mildew pathogen. Biotechnologyreports. 2017;16:18-20.
103. Haas BJ, Kamoun S, Zody MC, Jiang RHY, Handsaker RE, Cano LM, GrabherrM, Kodira CD, Raffaele S, Torto-Alalibo T, et al. Genome sequence andanalysis of the Irish potato famine pathogen Phytophthora infestans. Nature.2009;461(7262):393–8.
104. Tyler BM, Tripathy S, Zhang X, Dehal P, Jiang RH, Aerts A, Arredondo FD,Baxter L, Bensasson D, Beynon JL. Phytophthora genome sequencesuncover evolutionary origins and mechanisms of pathogenesis. Science(New York, NY). 2006;313:1261–6.
Fletcher et al. BMC Genomics (2018) 19:851 Page 23 of 23