Comparative Population Genomics of the Borrelia burgdorferi Species Complex Reveals High Degree of...
19
Comparative Population Genomics of the Borrelia burgdorferi Species Complex Reveals High Degree of Genetic Isolation among Species and Underscores Benefits and Constraints to Studying Intra-Specific Epidemiological Processes Maude Jacquot 1 *, Mathieu Gonnet 1 , Elisabeth Ferquel 2¤a , David Abrial 1 , Alexandre Claude 1¤b , Patrick Gasqui 1 , Vale ´ rie Choumet 2¤c , Myriam Charras-Garrido 1 , Martine Garnier 2¤d , Benjamin Faure 1¤e , Natacha Sertour 2¤f , Nelly Dorr 1 , Jocelyn De Goe ¨r 1 , Gwenae ¨ l Vourc’h 1 , Xavier Bailly 1 1 INRA, UR346 Epide ´miologie Animale, Saint Gene `s Champanelle, France, 2 Institut Pasteur, CNR Borrelia, Paris, France Abstract Lyme borreliosis, one of the most frequently contracted zoonotic diseases in the Northern Hemisphere, is caused by bacteria belonging to different genetic groups within the Borrelia burgdorferi species complex, which are transmitted by ticks among various wildlife reservoirs, such as small mammals and birds. These features make the Borrelia burgdorferi species complex an attractive biological model that can be used to study the diversification and the epidemiology of endemic bacterial pathogens. We investigated the potential of population genomic approaches to study these processes. Sixty-three strains belonging to three species within the Borrelia burgdorferi complex were isolated from questing ticks in Alsace (France), a region where Lyme disease is highly endemic. We first aimed to characterize the degree of genetic isolation among the species sampled. Phylogenetic and coalescent-based analyses revealed clear delineations: there was a ,50 fold difference between intra-specific and inter-specific recombination rates. We then investigated whether the population genomic data contained information of epidemiological relevance. In phylogenies inferred using most of the genome, conspecific strains did not cluster in clades. These results raise questions about the relevance of different strategies when investigating pathogen epidemiology. For instance, here, both classical analytic approaches and phylodynamic simulations suggested that population sizes and migration rates were higher in B. garinii populations, which are normally associated with birds, than in B. burgdorferi s.s. populations. The phylogenetic analyses of the infection-related ospC gene and its flanking region provided additional support for this finding. Traces of recombination among the B. burgdorferi s.s. lineages and lineages associated with small mammals were found, suggesting that they shared the same hosts. Altogether, these results provide baseline evidence that can be used to formulate hypotheses regarding the host range of B. burgdorferi lineages based on population genomic data. Citation: Jacquot M, Gonnet M, Ferquel E, Abrial D, Claude A, et al. (2014) Comparative Population Genomics of the Borrelia burgdorferi Species Complex Reveals High Degree of Genetic Isolation among Species and Underscores Benefits and Constraints to Studying Intra-Specific Epidemiological Processes. PLoS ONE 9(4): e94384. doi:10.1371/journal.pone.0094384 Editor: Brian Stevenson, University of Kentucky College of Medicine, United States of America Received December 10, 2013; Accepted March 13, 2014; Published April 10, 2014 Copyright: ß 2014 Jacquot et al. This is an open-access article distributed under the terms of the Creative Commons Attribution License, which permits unrestricted use, distribution, and reproduction in any medium, provided the original author and source are credited. Funding: This work was supported by funding from the French National Institute for Agricultural Research (INRA) through the ’AIP Bioressources 2009’ initiative, the Auvergne region through the ’Lifegrid’ program, and the European Union through the European Regional Development Fund (ERDF). Maude Jacquot received PhD funding from the French Ministry of Higher Education and Research (MESR), Mathieu Gonnet was supported by the ERDF and by the OSCAR project of the French National Research Agency. Alexandre Claude was supported by the ’Lifegrid’ program. Interactions between members of the INRA and the Pasteur Institute are promoted by the ’Tick and Tick-Borne Diseases’ (TMT) group, which is part of the Research Consortium on Biological Interactions (GdR REID). The funders had no role in study design, data collection and analysis, decision to publish, or preparation of the manuscript. Competing Interests: The authors have declared that no competing interests exist. * E-mail: [email protected] ¤a Current address: Institut Pasteur, De ´partement de Virologie, Paris, France ¤b Current address: CNRS IN2P3, Laboratoire de Physique Corpusculaire, Aubie `re, France ¤c Current address: Institut Pasteur, Unite ´ des Interactions Mole ´culaires Flavivirus-Ho ˆ tes, Paris, France ¤d Current address: Institut Pasteur, Unite ´ de Recherche et d’Expertise des Bacte ´ ries Pathoge `nes Ente ´riques, Paris, France ¤e Current address: INRA, Centre de Traitement de l’Information Ge ´ne ´tique, Jouy-en-Josas, France ¤f Current address: Institut Pasteur, Unite ´ Biologie et Pathoge ´ nicite ´ Fongiques, Paris, France Introduction Zoonotic diseases caused by pathogens that are transmitted among different host species represent an emergent threat for human health [1]. However, the study of these pathosystems is hampered by their complexity, as each pathogen may have multiple potential reservoirs. In vector-borne systems, in which infected vectors feed on and transmit the pathogen to several hosts, it is possible to characterize pathogen diversity using population genomic studies. These studies, which use information obtained PLOS ONE | www.plosone.org 1 April 2014 | Volume 9 | Issue 4 | e94384
-
Upload
independent -
Category
Documents
-
view
0 -
download
0
Transcript of Comparative Population Genomics of the Borrelia burgdorferi Species Complex Reveals High Degree of...

Comparative Population Genomics of the Borreliaburgdorferi Species Complex Reveals High Degree ofGenetic Isolation among Species and UnderscoresBenefits and Constraints to Studying Intra-SpecificEpidemiological ProcessesMaude Jacquot1*, Mathieu Gonnet1, Elisabeth Ferquel2¤a, David Abrial1, Alexandre Claude1¤b,
Patrick Gasqui1, Valerie Choumet2¤c, Myriam Charras-Garrido1, Martine Garnier2¤d, Benjamin Faure1¤e,
Natacha Sertour2¤f, Nelly Dorr1, Jocelyn De Goer1, Gwenael Vourc’h1, Xavier Bailly1
1 INRA, UR346 Epidemiologie Animale, Saint Genes Champanelle, France, 2 Institut Pasteur, CNR Borrelia, Paris, France
Abstract
Lyme borreliosis, one of the most frequently contracted zoonotic diseases in the Northern Hemisphere, is caused bybacteria belonging to different genetic groups within the Borrelia burgdorferi species complex, which are transmitted byticks among various wildlife reservoirs, such as small mammals and birds. These features make the Borrelia burgdorferispecies complex an attractive biological model that can be used to study the diversification and the epidemiology ofendemic bacterial pathogens. We investigated the potential of population genomic approaches to study these processes.Sixty-three strains belonging to three species within the Borrelia burgdorferi complex were isolated from questing ticks inAlsace (France), a region where Lyme disease is highly endemic. We first aimed to characterize the degree of geneticisolation among the species sampled. Phylogenetic and coalescent-based analyses revealed clear delineations: there was a,50 fold difference between intra-specific and inter-specific recombination rates. We then investigated whether thepopulation genomic data contained information of epidemiological relevance. In phylogenies inferred using most of thegenome, conspecific strains did not cluster in clades. These results raise questions about the relevance of different strategieswhen investigating pathogen epidemiology. For instance, here, both classical analytic approaches and phylodynamicsimulations suggested that population sizes and migration rates were higher in B. garinii populations, which are normallyassociated with birds, than in B. burgdorferi s.s. populations. The phylogenetic analyses of the infection-related ospC geneand its flanking region provided additional support for this finding. Traces of recombination among the B. burgdorferi s.s.lineages and lineages associated with small mammals were found, suggesting that they shared the same hosts. Altogether,these results provide baseline evidence that can be used to formulate hypotheses regarding the host range of B. burgdorferilineages based on population genomic data.
Citation: Jacquot M, Gonnet M, Ferquel E, Abrial D, Claude A, et al. (2014) Comparative Population Genomics of the Borrelia burgdorferi Species Complex RevealsHigh Degree of Genetic Isolation among Species and Underscores Benefits and Constraints to Studying Intra-Specific Epidemiological Processes. PLoS ONE 9(4):e94384. doi:10.1371/journal.pone.0094384
Editor: Brian Stevenson, University of Kentucky College of Medicine, United States of America
Received December 10, 2013; Accepted March 13, 2014; Published April 10, 2014
Copyright: � 2014 Jacquot et al. This is an open-access article distributed under the terms of the Creative Commons Attribution License, which permitsunrestricted use, distribution, and reproduction in any medium, provided the original author and source are credited.
Funding: This work was supported by funding from the French National Institute for Agricultural Research (INRA) through the ’AIP Bioressources 2009’ initiative,the Auvergne region through the ’Lifegrid’ program, and the European Union through the European Regional Development Fund (ERDF). Maude Jacquotreceived PhD funding from the French Ministry of Higher Education and Research (MESR), Mathieu Gonnet was supported by the ERDF and by the OSCAR projectof the French National Research Agency. Alexandre Claude was supported by the ’Lifegrid’ program. Interactions between members of the INRA and the PasteurInstitute are promoted by the ’Tick and Tick-Borne Diseases’ (TMT) group, which is part of the Research Consortium on Biological Interactions (GdR REID). Thefunders had no role in study design, data collection and analysis, decision to publish, or preparation of the manuscript.
Competing Interests: The authors have declared that no competing interests exist.
* E-mail: [email protected]
¤a Current address: Institut Pasteur, Departement de Virologie, Paris, France¤b Current address: CNRS IN2P3, Laboratoire de Physique Corpusculaire, Aubiere, France¤c Current address: Institut Pasteur, Unite des Interactions Moleculaires Flavivirus-Hotes, Paris, France¤d Current address: Institut Pasteur, Unite de Recherche et d’Expertise des Bacteries Pathogenes Enteriques, Paris, France¤e Current address: INRA, Centre de Traitement de l’Information Genetique, Jouy-en-Josas, France¤f Current address: Institut Pasteur, Unite Biologie et Pathogenicite Fongiques, Paris, France
Introduction
Zoonotic diseases caused by pathogens that are transmitted
among different host species represent an emergent threat for
human health [1]. However, the study of these pathosystems is
hampered by their complexity, as each pathogen may have
multiple potential reservoirs. In vector-borne systems, in which
infected vectors feed on and transmit the pathogen to several hosts,
it is possible to characterize pathogen diversity using population
genomic studies. These studies, which use information obtained
PLOS ONE | www.plosone.org 1 April 2014 | Volume 9 | Issue 4 | e94384
from the genome of pathogens isolated from questing vectors, offer
researchers the opportunity to indirectly study the spread of
pathogens within and among host communities. However, genetic
information can be affected by many processes, and untangling
various lines of evidence in order to obtain a coherent picture of
the evolutionary history of a population represents a significant
challenge for population genomic studies [2].
In particular, the selective constraints on pathogen genomes can
be highly heterogeneous. For example, infection-related genes are
expected to be affected by disruptive and/or negative frequency-
dependent selection due to the molecular interactions occurring
among pathogens, hosts, and the hosts’ immune systems.
Therefore, within bacterial lineages associated with similar hosts
these genes would be predicted to share similar features due to
host-driven selective sweeps, DNA exchange by recombination, or
convergent evolution. Patterns of diversity in these genes could
thus potentially reveal which lineages infect overlapping host
communities. Alternatively, housekeeping genes, which are
involved in basic cell cycle and metabolic functions, are mostly
subject to purifying selective pressures [3]. They are more likely to
contain relevant information about gene flow among pathogen
populations and other demographic events, especially if pathogen
lineages have had the opportunity to recombine [4]. Indeed, most
regions of the genome should not be affected by host driven
selection if the recombination rate is sufficiently high [5], which is
an advantage for researchers examining demographic and/or
epidemiological processes. Infection-related genes and other
genome regions can thus provide complementary information on
bacterial transmission. One of the main challenges of population
genomic approaches is to integrate hypotheses about patterns of
diversity that are observed at the scale of individual genes or
genome regions into evolutionary scenarios that are coherent at
the level of the whole genome.
Using appropriate genome regions, analyses of demographic
and epidemiological processes from population genomic data rely
on models that describe both the way pathogens spread within and
among susceptible individuals, as well as processes that govern
genome evolution. These two aspects have historically been
investigated independently in the literature. On the one hand, the
spread of pathogens has often been studied by epidemiologists
using population dynamic models that take into account complex
infection and transmission processes [6], but most of the time
neglect the diversity of pathogens. On the other hand, the
evolution of genomes has been studied using tools of population
genetics that often assume basic demographic hypotheses, as in the
Wright-Fisher [7] or the Moran [8] model. The increasing
prevalence of molecular epidemiology studies highlights the need
to close the gap between these two approaches, a feature that
defines the burgeoning field of phylodynamics. While phylody-
namic approaches have produced promising results in the study of
epidemics of fast-evolving viruses, their applicability to endemic,
slow-evolving, bacterial pathogens remains to be assessed [9]. A
particular challenge for the use of phylodynamic models is that
genomic polymorphisms represent the footprints of processes that
have occurred across multiple geographic and/or time scales. For
example, phylogeographical studies have shown that a popula-
tion’s history plays a major role in shaping its current diversity
patterns. Large-scale patterns, such as the occurrence of major
clades within a species can be due to ancestral differentiation in
independent geographic locations (called refugia), while the
distribution of diversity on a smaller scale is subsequently shaped
by more recent colonization and migration events [10]. The
picture is even more complex in multi-host pathogen systems, in
which major clades can emerge either from isolated geographic
regions where the pathogen circulates or from independent
reservoir hosts as defined by Haydon et al. [11]. Then, the
diversity that is maintained in a given reservoir at endemic
equilibrium would depend not only on epidemiological parameters
such as the number of infected hosts and transmission parameters,
but also on the processes that generate sequence diversity in that
population [12].
In core regions of bacterial genomes, sequence diversity emerges
through both mutation and homologous recombination. Twenty
years ago, Maynard Smith et al. revealed the impact of
recombination on the evolution of bacterial pathogens, which
can be hidden by differences in the reproductive success of
genotypes [13]. In the so-called epidemic population structure, the
uneven frequencies of recombinant lineages lead to high statistical
associations among genotypes at different loci, i.e. linkage
disequilibrium. By selecting a subsample of unique multilocus
genotypes within a population, Maynard Smith and colleagues
were able to more easily identify statistical evidence for
recombination. Although still relevant, this sub-sampling approach
has major drawbacks, as it is difficult to quantitatively study the
processes that shape the distribution of diversity in subsamples that
have been defined by genetic criteria a priori [14]. Therefore,
studies of pathogen diversity commonly use hierarchical sampling.
Factors that structure diversity, such as bacterial taxonomy or
sampling location, are defined a priori, and a random sample of
strains is obtained for each selected factor [15]. Then, the accuracy
of species delineations (or whichever structuring factor is used) can
be evaluated a posteriori with regard to the observed patterns of
polymorphism before fitting more complex evolutionary and
epidemic models to the genomic data.
To assess the potential of population genomic approaches in the
study of multi-host zoonotic disease, we chose the Borrelia burgdorferi
species complex as our model system. This species complex
includes the bacteria that cause Lyme borreliosis, one of the most
common vector-borne diseases in the Northern Hemisphere. In
Europe, most human cases are caused by Borrelia afzelii, Borrelia
burgdorferi sensu stricto (s.s.), and Borrelia garinii [16], which are
transmitted by the tick Ixodes ricinus among different reservoir
species. The ticks can become infected during their first blood
meal, which occurs before they molt from larvae into nymphs.
They can also acquire and/or transmit bacteria during their other
blood meal(s), which occur before the molt from nymph to adult
(all ticks) and before laying eggs (females only).
Bacteria within the B. burgdorferi complex do not share a
common, fixed set of host species (referred to hereafter as host
range) [17]. Phylogenetic analysis of multi-locus sequence typing
(MLST) data suggests that similar host ranges have evolved several
times within this complex, so that bacteria associated with similar
hosts are not clustered in clades, but rather, dispersed throughout
the whole phylogeny [18]. Borrelia garinii and Borrelia valaisiana,
which are only distantly related to each other, both infect birds
[19–22], whereas B. afzelii, Borrelia spielmanii, and Borrelia bavariensis,
which do not cluster together in phylogenies, infect small
mammals [23–25]. Furthermore, the host range of B. burgdorferi
s.s. appears to be broader than that of most Borrelia, as this species
has been identified in both small mammals and birds [26–28].
However, despite the large number of host shifts that have
occurred through the course of the evolution of this species
complex, the influence of mutation and recombination events on
these bacteria’s ability to adapt to new hosts is poorly understood
[29].
Different approaches have been used to investigate the influence
of host communities on the diversity of the B. burgdorferi species
complex. From a population genetic point of view, differences in
Borrelia burgdorferi Population Genomics
PLOS ONE | www.plosone.org 2 April 2014 | Volume 9 | Issue 4 | e94384

the population size and the migration potential of reservoir species
have been shown to influence MLST diversity patterns of these
bacterial species at a continental scale [30], but there is a lack of
information at smaller geographical scales. From an epidemiolog-
ical point of view, a statistical model has been used to estimate the
respective contributions of different host species to the infection of
ticks by genotypes of B. burgdorferi s.s. in the USA [31]. This
approach takes advantage of the associations found among
genotypes of the B. burgdorferi species complex obtained from
different populations and host species at the infection-related gene
ospC [32,33].
The development of genetic and genomic tools has allowed the
in-depth investigation of genes involved in infection phenotypes
within the B. burgdorferi species complex [34]. A recent study of
synonymous and non synonymous mutation rates from multiple
genomes has highlighted a potential role for lipoproteins-encoding
genes in the adaptation of the B. burgdorferi species complex to hosts
[35]. The same sample of genomes, which was predominantly
obtained from strains of B. burgdorferi s.s., was also used to
investigate evolutionary processes within this species [36],
although inter-specific patterns were described only superficially.
While the focus of this study was to investigate recombination
patterns and selective constraints within B. burgdorferi s.s., the
selected isolates were chosen in order to capture a maximum of
genetic diversity [37]. However, as described above, this type of
sampling could reveal a different genetic structure compared to a
random regional sampling.
Here, we investigated the genomic diversity of strains of B.
burgdorferi s.s., B. garinii, and B. afzelii isolated from questing ticks in
France, in a region where Lyme borreliosis is highly endemic.
Using a hierarchical sampling scheme at a regional scale, we
aimed to investigate the genetic diversity within and isolation
among species of the complex. We also evaluated multiple models,
involving both evolutionary and epidemiological constraints, and
examined the information obtained from them to understand the
forces that have shaped diversity within this species complex. This
lead to different hypotheses regarding the evolution and the
epidemiology of these bacteria. The data gathered here are then
discussed in the context of what is currently known about the
ecology and evolution of these vector-borne pathogens.
Materials and Methods
Ethics statementIsolates of the B. burgdorferi species complex were recovered from
questing nymphs and adults of I. ricinus that were sampled at two
sites largely covered by dense and continuous forests; these sites
were located near the towns of Munster and Guebwiller, in Alsace
(France) [38] (Figure 1). No specific permission is required by
French law to sample ticks and to perform field studies in these
locations. Our study did not involve any endangered or protected
species.
Bacterial strains and sequencing proceduresTicks were collected at each site in two consecutive years (2003
and 2004) by dragging a large piece of cotton fabric across the
vegetation and leaf litter [38]. Ticks were then kept alive in
individual tubes until they could be processed. Bacterial isolation
was performed by incubating ticks individually at 32uC in 5 ml of
BSK-H medium (Sigma-Aldrich, St. Louis, USA) without
antibiotics for 8 weeks. Bacterial growth was checked weekly via
dark field microscopy. Cultures that showed evidence of spirochete
growth were maintained until they reached high densities. After
that PCR-RFLP was used to assign each culture to a Borrelia
species [39]. Lastly, each culture was supplemented with 60%
glycerol in an equal amount to that of the culture and kept at
280uC, pending further analyses.
From the different isolates, we chose 63 strains, to be sequenced.
As we aimed i)to study species delineations within the B. burgdorferi
complex, ii) to examine the distribution of diversity within
sympatric species of the complex at a regional scale, and iii) to
compare the genetic structures of different bacterial species, we
selected a set of strains that included 25 genotypes of B. burgdorferi
s.s., 34 genotypes of B. garinii, and 4 genotypes of B. afzelii. Within
each species, genotypes were randomly selected. The size of the
three samples was determined by the rate of success of the isolation
procedure rather than by the observed frequency of the different
species within ticks. Moreover, we selected isolates with the goal of
having a similar number of strains for each sampling site within
each species. We also tried to select strains that were sampled
during the same year in order to limit confounding factors: all B.
garinii and B. afzelii strains were isolated in 2004, whereas an equal
number of B. burgdorferi s.s. strains were isolated in 2003 and in
2004 (Table S1).
To obtain enough material for sequencing, bacteria were
iteratively cultured using 50 ml of BSK-H medium (Sigma-
Aldrich) until high bacterial densities were reached. All strains
underwent fewer than 15 passages from tick incubation to DNA
extraction in order to limit the possibility of plasmid loss.
Independent DNA extractions were performed using the DNeasy
Blood & Tissue Kit (Qiagen, Venlo, Netherlands). The quantity of
DNA after extraction was measured by spectrophotometry at 260
and 280 nm (Nanodrop, Thermo Fisher Scientific, Waltham,
USA), and DNA extractions were sent to Genoscreen (Lille,
France) to be tagged with standard multiplex identifiers (MID,
Roche, Basel, Switzerland). Samples were then mixed to prepare
libraries, which were distributed among three-quarters of a GS
FLX Titanium (Roche) sequencing plate.
In order to analyze sequence data, raw reads were first mapped
on reference sequences. Contigs were aligned with reference
genomes. The genetic structure of the sample was studied using
single nucleotide polymorphisms (SNPs)-based analyses at intra-
and inter-specific levels. Additionally, phylogenetic analyses were
performed at the same scales. Loci showing atypical polymorphism
patterns were identified using allelic spectrum-based approaches
and the functions they encode were analyzed. Finally, the results of
SNP-based analyses on the chromosome, which revealed homo-
geneous polymorphism patterns, were used to fit a long term
coalescent based model and a basic, shorter term, phylodynamic
model. These different steps are described in details below.
Reconstruction of genetic sequencesTo obtain robust data, each sequence read was mapped
independently onto reference sequences of B. burgdorferi s.s., B.
bavariensis/B. garinii, and B. afzelii. For each of the three mappings,
reference sequences of the chromosome, the circular plasmid
cp26, and the linear plasmid lp54 were chosen from public
databases (Table S2). We focused on the chromosome and the
plasmids cp26 and lp54 because the gene content and the synteny
of these replication units are relatively conserved among strains of
the B. burgdorferi species complex [35]. Other replication units tend
to show more polymorphism, both in terms of gene copy number
and in term of gene arrangement. We did not include them in this
study because of the problems they raised with sequence assembly
and the specific analyses they required. To ensure accurate
mapping in divergent genomic regions while maintaining sufficient
stringency for subsequent analyses, we used GSMAPPER software
(Roche) parameterized as follows: the length of seeds used to
Borrelia burgdorferi Population Genomics
PLOS ONE | www.plosone.org 3 April 2014 | Volume 9 | Issue 4 | e94384

anchor alignments was fixed to 10 base pairs (bp) and the
identification of three seeds per sequence was required for
alignment analysis. Identity thresholds were fixed at 60 bp and
60% identity. The results of mapping onto a given replicon of a
given species were stored if more than 90% of the reference
sequence was covered. Then, a strict consensus sequence was
generated for each replication unit of each bacterial isolate from
the alignment of the stored mapping results. This was performed
using a program we developed in Pascal; unless otherwise
indicated, programs developed in Pascal were used for all analyses
described below.
Finally, to compare our genomic data to published sequences
(Table S3), we constructed multiple alignments for each of the
three studied replication units. PROGRESSIVEMAUVE software [40]
was used to define homologous sequence regions using default
parameters, and local alignments were refined using MUSCLE
software [41] on contiguous windows of 1 kilobase pairs (kb) in
length.
Single-nucleotide polymorphism analysesSNPs were identified using multiple alignments. To explore the
population structure of B. burgdorferi s.s. and B. garinii, a set of SNPs
was for each species that included all polymorphic sites in the
chromosome that were identified in at least 90% of strains. The
two sets of SNPs were analyzed separately using the program
STRUCTURE V2.3.4 to identify potential populations and explore
their degree of admixture [42]. This method has been developed
to estimate allele frequencies in an user-defined number of
populations and to assign individuals to these populations based on
a Markov Chain Monte Carlo (MCMC) scheme. For each species,
we performed analyses assuming correlations among linked loci
and allowing admixture among potential populations. We
investigated models with K, the number of populations, ranging
from 1 to 15. For each value of K, five different runs were
performed in which the MCMC algorithm was run for a 25,000-
iteration burn-in step and followed by 25,000 further iterations.
The most appropriate K values were chosen by taking into
account the observed likelihood and the reproducibility of results.
In order to limit the impact of base-calling errors (which should
be independent among individuals) and to obtain sufficient
statistical power for subsequent analyses, we selected SNPs that:
i) were present in all individual strains and ii) had at least two
alleles with frequencies higher than 10%. Differentiation measures
reflect the genetic variability among groups of individuals relative
to the variability of a whole sample [43]. In order to explore the
distribution of genetic variability, we chose to measure differen-
tiation, using HST values [44]. HST is a multiallelic numerical
analog of Wright’s FST [45], and is obtained using the formula
HST = 1-HS/HT, where HS and HT represent Nei diversity indices
within and among populations, respectively. We calculated HST
for selected SNPs at different levels of genetic resolution: i) among
species of the complex, to assess their genetic isolation from each
other and ultimately identify evidence of inter-specific homologous
recombination; and ii) within studied species and between
sampling sites, in order to investigate geographic isolation and
identify genomic regions evolving under particular selective
pressures [46]. As no evidence of genetic differentiation was
observed between strains of B. burgdorferi s.s. sampled in 2003 and
those sampled in 2004 (data not shown), we did not consider this
potential structuring factor in the analyses described above. The
significance of the HST values was tested with a Monte-Carlo
approach (p = 0.05): for each SNP, 1000 simulated datasets that
distributed individual genotypes at random among populations
were created. Additionally, we compared the distribution of HST
values in bacterial populations of B. burgdorferi s.s. and B. garinii that
were sampled in different locations using a Wilcoxon rank-sum test
with continuity correction, performed in R [47].
As the distribution of HST values depends on the genetic linkage
between SNPs, we investigated the impact of homologous
recombination on the genetic diversity of the studied strains.
Standardized linkage disequilibrium measures between pairs of
SNPs were obtained using the D’ statistic [48], and the approach
proposed by Hedrick [49] to summarize linkage disequilibrium
among different allelic combinations. D’ values were computed for
each pair of SNPs within the following groups: i) all strains, ii) all
strains assigned to the same species, and iii) conspecific strains
isolated from both of our sampling sites in Alsace. For each
species, we then explored the relationship between D’ values and
physical distance.
Phylogeny-based analysesTo conduct detailed analyses of the phylogenetic relationships
among genotypes using the alignments of the three replication
units, contiguous 1-kb-long windows were created. We decided not
to work at the gene level in order to standardize the amount of
phylogenetic information contained in each unit. A phylogenetic
search that applied a maximum-likelihood approach using PHYML
software [50], was performed on each window. The most
appropriate model of evolution was chosen for each alignment
based on the Akaike Information Criterion (AIC) [51] using the
APE library in R [52]. For each window, the maximum-likelihood
tree was screened to assess whether different species or groups of
species were monophyletic. This analysis provided information
about which genome regions supported the consensus phylogeny
and, conversely, which genome regions were potentially affected
by interspecific recombination or other evolutionary events.
To illustrate global genetic relationships within and among
species, phylogenetic networks, based on chromosomal sequences
of sampled genotypes and reference genomes, were constructed
with SPLITSTREE 4 software [53] using the Neighbor-Net method
[54]. To generate these networks, we first created an alignment of
chromosome sequences, and then used this alignment to compute
a distance matrix in PAUP* 4.0 b10 [55] using a GTR+I+G model
[56,57] with the following settings: the substitution rate matrix was
Figure 1. Map of the sampling sites. Tick sampling sites (yellowstars) were located near the towns of Munster and Guebwiller innortheastern France. The data used to construct the map wereobtained from BD-Ortho in 2011 (IGN; National Institute of Geographicand Forest Information, Paris, France).doi:10.1371/journal.pone.0094384.g001
Borrelia burgdorferi Population Genomics
PLOS ONE | www.plosone.org 4 April 2014 | Volume 9 | Issue 4 | e94384

estimated via maximum likelihood assuming empirical nucleotide
frequencies, while the proportion of invariable sites and the shape
parameter of the gamma distribution were fixed at the respective
mean values that were obtained from the maximum likelihood
phylogenetic analyses of the 1-kb-long windows described above.
Next, we assessed whether the percentage of windows in which
a given species was not monophyletic could be explained not by
recombination but simply by a lack of resolution. With this aim,
we simulated 300 alignments of 63 sequences of 1000 kb according
to i) the GTR+I+G model described above and ii) a neighbor-
joining tree [58] obtained from the average distance matrix
described in the previous paragraph and based on the appropriate
model of sequence evolution that described divergence patterns
among the studied genomes. For each simulated alignment, 1,000
1-kb-long contiguous windows were delineated and a maximum
likelihood phylogeny based on the assumed model of sequence
evolution was obtained for each window. For each phylogeny, the
monophyly of species was assessed as described for observed data.
Afterwards, the distribution of the percentage of windows in which
species were not monophyletic within the simulated alignments
was compared to that obtained from observed data. Simulations
and phylogenies were generated using the Bio++ C++ library [59].
Further alignment-based analysesTo describe diversity within each of the three species, two
statistics were computed using contiguous 1-kb windows of
alignments of each replicon for each species: i) Watterson’s hS
which is based on the number of segregating sites along the
alignment [60], and ii) Tajima’s hp, which is based on the average
divergence among samples [61]. Furthermore, to obtain insight
into deviation from demographic equilibrium and selective
neutrality within the B. burgdorferi species complex, values of
Tajima’s D [62] were calculated for the 1-kb windows within each
replication unit for each species. Again, we chose not to work at
the gene level to standardize the amount of available information
among analyses; annotated genes in genomes of the B. burgdorferi
species complex vary widely in length, with some too short to
provide an adequate amount of mutation for this type of analysis.
Gapped sites were not considered, as in Tajima’s original
publication. Tajima’s D statistic measures the difference between
the two estimators of h previously described, standardized by the
variance of this difference. Under the neutral evolutionary model,
which assumes that polymorphisms segregate at mutation–drift
equilibrium, Tajima’s D is expected to be null. Positive Tajima’s D
value can be induced by balancing selection, due to the
maintenance of highly divergent variants. Conversely, negative
Tajima’s D values can be the result of purifying selection or a
selective sweep, which both result in an excess of weakly divergent
alleles. However, these two patterns (positive or negative) may
alternatively be due to demographical/epidemiological processes
that affect the whole genome. Trying to distinguish between
potential whole-genome versus gene-region-specific process, we
looked for windows within each species’ sequence that were
characterized by a highly structured pattern of diversity. These
genome regions might be evolving under host-driven selective
pressures. Towards this end, we first obtained the distribution
containing Tajima’s D values for every window of chromosomal
data for each studied species. As Tajima’s D values were, on
average, negative (see results), standard tests that identify
deviations from neutrality did not provide relevant information.
We thus studied chromosomal Tajima’s D values and defined a
threshold that distinguished relatively high measures within each
species, based on the 95th percentile of the distribution of Tajima’s
D values within that species. Then, we identified and selected the
windows in the three replication units that had Tajima’s D values
that were higher than the defined thresholds.
Genes that overlapped the selected windows were identified and
compared among the different species, and we created a non-
redundant list containing the selected genes. The function and the
cellular localization of the proteins encoded by the selected genes
were studied using the online pipeline SLEP [63]. The distribution
of genes among the different functional categories was compared
to the results obtained from the total proteome of the three studied
replication units.
Differentiation measures, Tajima’s D values, and linkage
disequilibrium patterns revealed that a 4-kb region around the
ospC gene on the cp26 plasmid was characterized by a peculiar
polymorphism pattern. To illustrate the amount of incongruent
phylogenetic information in ospC sequences and flanking regions,
Neighbor-Net networks, based on uncorrected p-distances, were
obtained from alignments of the ospC gene, the 2,000 bp before
and after the gene, and regions located further upstream and
downstream.
Long-term coalescent based modelAs described in the introduction, genome sequences contain
evidences of processes that occur at different time scale. In order to
study the long-term processes that have shaped the diversity of the
B. burgdorferi species complex, we developed a coalescent model to
investigate the divergence between B. burgdorferi s.s. and B. garinii.
This model used species-specific properties to simulate sequence
datasets and employed Approximate Bayesian Computations
(ABC) [64] to obtain inferences regarding parameters of interest.
The original coalescent model can be defined as a Markov
process describing how, assuming a Wright-Fisher or Moran
model of genetic variation, sampled individuals would share a
common ancestor (coalesce) as one goes back in time [65]. A
central result of this is that the number of generations that one
must go back in time to the next common ancestor shared by one
pair of samples in a population, i.e. a coalescence event, follows an
exponential distribution, the shape of which depends on both the
number of samples included in the analysis and the effective
population size. Using an iterative procedure, the properties of an
entire genealogy of samples can be recovered and the genealogy
can then be used to simulate sequence data.
In its simplest form, the coalescent model assumes a lack of
recombination and a lack of population structure; however the
model has been extended to allow for such evolutionary events as
homologous recombination [66] or population subdivision [67].
For example, to include recombination in the model, the
exponential distribution is modified so that it describes the time
before either a coalescence event or a recombination event.
Similarly, to take population subdivision into account population,
the exponential distribution is modified so that: i) it describes the
time interval to previous coalescence event in each population,
and ii) the population size of the two populations can differ, using
scaling factors.
The model we developed for this study assumes two steps.
During the first step, two populations, representing B. burgdorferi
and B. garinii, are simulated, characterized by constant effective
population sizes of c1*N and c2*N, respectively. Coalescence events
are only possible within populations, and unidirectional homolo-
gous recombination is allowed both within and between popula-
tions. In each generation, for each individual, any sequence site in
a given population is susceptible to intra-population homologous
recombination at respective rates of rintra1 and rintra2. Similarly,
recombination events can occur between individuals belonging to
different populations at rates rinter1 and rinter2. After M * (c1*N+c2*N)
Borrelia burgdorferi Population Genomics
PLOS ONE | www.plosone.org 5 April 2014 | Volume 9 | Issue 4 | e94384

generations during which the two populations evolve indepen-
dently, a new step is initiated. The two populations merge into a
single ancestral population, with effective population size c3*N and
intra-population recombination rate rintra3. As it is impossible for
the populations to coalesce into a single common ancestor if the
probability of recombination is higher than the probability of
coalescence, if the common ancestor as not been reached after
(M+S) *(c1*N+c2*N) generations, recombination is stopped. Once a
complete genealogy is obtained, mutations are added along
branches at a rate m per site per generation according to the
Jukes–Cantor model [68].
Various nested models were used to simulate alignments of
10,000-bp sequences that included 23 samples for the first
population (B. burgdorferi s.s.) and 32 samples for the second (B.
garinii). In our initial model (M0), all the variables described above
were assumed to be independent. In model M1 and all subsequent
models, we assumed rinter1 = rinter2. In models M2 and M3, we
assumed, respectively, c1 = c2 = c3 and rintra1 = rintra2 = rintra3, while
the M4 model incorporated both of these assumptions. We finally
investigated an M5 model that assumed rinter1 = rinter2 = rintra1 =
rintra2 = rintra3 and c1 = c2 = c3. After exploring model behavior, we
performed 50,000 simulations for each model, fixing the
parameters as follows to shorten computation time: N = 1e+09,
m = 1e-07 and S = 5. Based on the relationship we observed
between linkage disequilibrium and physical distance on the
genome (see results), we assumed a fixed recombination fragment
length of 500 bp, a length that is consistent with current
hypotheses about recombination track lengths [34]. For each
simulation, we sampled values for the different parameters of
interest in uniform distributions ranging from 0 to 1e-08 for rinter,
from 0 to 8e-07 for rintra, from 5e-07 to 2e-05 for values of c, and
from 1 to 35 for values of M.
From each simulation, we computed a set of summary statistics.
In order to fit the diversity of simulated populations to the
observed dataset, we identified SNPs from simulated alignments as
previously described. To calibrate diversity patterns within
populations, we computed the density of SNPs along the simulated
sequences and the average Nei diversity indices for the selected
SNPs. We also measured linkage disequilibrium between pairs of
SNPs using the D’ statistic within and among populations to study
the impact of recombination rates on simulated sequences. To
assess the impact of species divergence on the simulated data, we
recorded the density of selected SNPs across the whole alignment,
as well as the percentage of polymorphic sites in the alignment that
were fixed in each population, and we then used HST to estimate
differentiation between the two simulated populations.
We used standard ABC procedures to infer appropriate values
for parameters of interest [69]. The Euclidean multivariate
distance between the observed and simulated normalized summa-
ry statistics was calculated, and sets of parameters were accepted
and stored if this distance was less than a tolerance threshold,
defined so that a small fraction of simulations (less than 1%) were
accepted for the estimation step. When comparing the fit of our
various models to the data, we used this same rejection threshold
and determined the best model using Bayes factors. Posterior
distributions of parameters of interest were summarized using
average values.
Intra-specific phylodynamic modelThe main genotypes that we observed in B. burgdorferi s.s. and B.
garinii, which were identified by both the phylogenetic and the
STRUCTURE approaches, likely emerged a long time ago. In order
to study how diversity is currently maintained in our sampling
sites, we developed an epidemic model that took pathogens
diversity into account. More precisely, we explored an individual
based model in which the infection status for a number of different
bacterial genotypes (Nbg) was monitored over time in hosts and
vectors. Our aim was to identify epidemiological settings that
would allow for the maintenance of the observed level of diversity
within each species.
In this model, one iteration represented one year. Two host
populations of equal and constant sizes, Nhosts, were simulated to
represent the reservoir of infection-causing bacteria at the Munster
and Guebwiller sites. Each host population came into contact with
a population of nymphs, with constant and equal populations sizes
Nticks. Due to the complete turnover in nymphs that happens each
year, larvae were not explicitly included in the model but implicitly
appeared at each generation as a source of new susceptible ticks
that are coming in contact with hosts. Likewise, adults were not
included, as they occur at lower densities and their preferred host
are large mammals, which are not known to be a reservoir of the
B. burgdorferi species complex. At each iteration of the model, each
host was exposed to a variable number of nymphs, this number
followed a Poisson distribution with parameter Nticks/Nhosts. The
bacterial genotype (or lack thereof) within each tick that fed on
each host was recorded to obtain the number of contact between
each individual host and each bacterial genotype. A host became
infected by the ith bacterial genotype according to a binomial
distribution which had as parameters the number of contacts this
host had with the ith genotype and the probability ITHi of infection
occurring during each contact. Infections were persistent, so that
an infected host retained this status for its whole life. Then, the
entire tick population was completely replaced with susceptible
individuals. These new ticks represented uninfected larvae who, in
the current iteration would, feed, become infected, molt into
nymphs and then infect hosts during the next iteration. Next, each
tick thus fed on a host chosen at random in the population. For
each of the Nbg different bacterial genotypes, ticks became infected
according to a Bernoulli distribution which took as parameters the
probability IHTi of infection per contact if the host was infected,
and 0 if the host was uninfected. Later, Nmig host individuals were
exchanged between the two host populations following a Poisson
distribution with parameter Fmig/Nhosts, where Fmig is a scaling
parameter. Finally, a proportion Rhosts of each host population was
renewed with susceptible individuals.
An important criterion in the parameterization of our model
was that the number of genotypes present in the model at
equilibrium (taking into account genetic drift and migration) was
equal the number of observed genotypes in our B. burgdorferi s.s.
and B. garinii samples. Therefore, for each simulation, the model
was run for 500 iterations in order to allow enough time to reach
this equilibrium. We began each simulation with the assumption
that each host, was infected by a single bacterial genotype, and
that bacterial genotypes occurred at equal frequencies within and
among populations. In such an epidemiological model, one of the
two main outcomes is expected: either more pathogens are lost
during population replacement than are created by new infections,
which leads to the extinction of pathogens; or the number of new
infections per iteration is much higher than the number of
individuals lost during replacement, which leads to high pathogen
prevalence and the maintenance of most genotypes in co-infected
individuals. Here, we focused on sets of parameters that would
enable the creation of intermediate situations. In order to identify
these situations, we started simulations with a high number of
genotypes, i.e. Nbg = 20; assumed strong rates of transmission
during contact between hosts and ticks, ITHi = IHTi = 0.8; and, as
high Nticks/Nhosts ratios lead to explosive pathogen dynamics, we
assumed that Nticks/Nhosts = 1. To explore the remaining parameter
Borrelia burgdorferi Population Genomics
PLOS ONE | www.plosone.org 6 April 2014 | Volume 9 | Issue 4 | e94384

space, we performed simulations using combinations of the
following values: Nhosts set at either 100, 300, 500, or 900
individuals; Fmig set at either 0, 0.2, 0.4, 0.6, 0.8, or 1; and Rhosts set
at values from 0.32 to 0.42 with a 0.005 step from one to the next.
Fifty simulations were performed for each combination of
parameters.
To evaluate the fit of the outcome of each simulation to our
observed data, we compared different summary statistics using
techniques similar to an ABC approach. At the end of each
simulation, a certain number of ticks were randomly selected, with
the goal of mimicking our real-world sampling of chromosomal
sequences; the number of ticks selected corresponded to our actual
sampling effort in each site. For B. burgdorferi s.s., 14 pathogens
were sampled from 14 infected ticks from the first population
(Munster) and 9 pathogens were sampled from the second
population (Guebwiller). For B. garinii, 13 pathogens were sampled
in the Munster population and 19 in the Guebwiller population.
We computed the Euclidean multivariate distance between the
observed and simulated values using the following normalized
summary statistics: i) genotype richness among pathogens sampled
in each population (R1, R2) and in the two populations combined
(RT); ii) Nei diversity indices within each population (H1, H2) and
differentiation between populations measured with HST. Sets of
parameters were accepted and stored if the distance was lower
than a tolerance threshold, defined so that less than 1% of
simulations were accepted. For B. burgdorferi s.s., the observed
statistics were R1 = 3, R2 = 2, RT = 3, H1 = 0.62, H2 = 0.44, and
HST = 0.09. For B. garinii, observed statistics were R1 = 6, R2 = 6,
RT = 8, H1 = 0.80, H2 = 0.78, and HST = 0.05.
Results
Genomic dataWe obtained 2,351,440 sequence reads in total, which
corresponded to chromosomal coverage ranging from 2.2X to
27.2X, with an average of 8.5X. Raw reads were deposited to the
Sequence Read Archive (SRA) database under accession
SRP031890. Whole Genome Shotgun projects have been
deposited in GenBank under the accessions listed in Table S1
(BioProject PRJNA223339).
The raw sequences obtained for each genome were mapped
onto reference sequences of the chromosome and plasmids cp26
and lp54. For the chromosomal sequences, we obtained at least
90% coverage of at least one of the reference sequence for 59 out
of the 63 genotypes. The four strains for which we did not find
90% coverage were IPT27 and IPT70 of B. burgdorferi s.s. and
IPT95 and IPT107 of B. garinii, which were subsequently excluded
from further chromosomal analyses. For the plasmids cp26 and
lp54, we obtained 90% reference sequence coverage for 61 strains,
excluding IPT95 (which was also excluded from chromosomal
analyses). Strains IPT107 and IPT136 of B. garinii did not reach
the coverage threshold for cp26 and lp54, respectively, and were
therefore excluded from further analyses of those respective
plasmids.
To perform SNPs-based analyses, we defined unique sets of
markers based on sequence alignments. For the entire species
complex, 39757, 1569, and 3658 SNPs were identified along the
chromosomal, cp26, and lp54 sequences, respectively. Within
species we identified i) 5342, 480, and 403 SNPs in B. burgdorferi
s.s.; ii) 10119, 451, and 873 in B. garinii; and iii) 8498, 568, and 762
in B. afzelii (number of sites from chromosomal, cp26, and lp54
alignments, respectively).
Inter-specific phylogenomic patterns of relatednessTo illustrate global phylogenetic relationships among the
sampled and reference strains at the species level, we constructed
a Neighbor-Net network based on chromosomal data (Figure 2).
Within this network, the taxonomic assignments of the isolates
were consistent with those obtained from PCR-RFLP data (data
not shown) and published species boundaries. Within this network,
all B. burgdorferi s.s. strains included in the network form a clade
that is separate from that of strain SV1, for which a unique species
name, B. finlandensis, has been proposed [70]. Similarly, all the B.
garinii strains included in the network were more closely related to
each other than to the B. bavariensis PBi reference strain. However,
as previously described [35], the average amount of sequence
divergence was low both between B. burgdorferi s.s. and B.
finlandensis, and between B. garinii and B. bavariensis, species pairs
for which we measured respective average divergences around
2.2% and 2.8%.
Contiguous 1-kb windows were obtained from alignments in
order to construct region-specific phylogenies and assess the
monophyly of Borrelia species and/or broader genetic groups using
different sets of genetic data (Figure 2, Table 1). Overall, the
relationships within these phylogenies were consistent with those
observed in the global network, and a high percentage of the
windows from each replication unit supported the monophyly of
the various Borrelia species, although this percentage was slightly
lower for the cp26 plasmid (Table 1). In the case of chromosomal
data, 85% of the window-based phylogenies supported a clade that
contained all the B. burgdorferi s.s. strains. Furthermore, 97% of
trees supported a larger monophyletic group that included all B.
burgdorferi s.s. strains as well as the B. finlandensis SV1 strain.
Similarly, 88% of phylogenies contained a monophyletic group of
B. garinii strains and nearly 98% of trees supported a clade that
included all B. garinii strains and the B. bavariensis strain PBi.
Finally, 99% of phylogenetic trees supported the monophyly of the
B. afzelii strains.
We also wanted to investigate whether the percentage of
windows that did not support the monophyly of B. burgdorferi s.s.
(15%) and B. garinii (12%) could simply be explained by a lack of
phylogenetic information, and not the presence of recombination.
However, when we generated 1-kb windows from simulated data
that did not allow for recombination, the percentages of windows
that did not support the monophyly of the two bacterial species
were significantly lower than those observed from the actual
molecular data (Figure 2).
Genomic structure among speciesHST values, i.e. measures of genetic differentiation based on
SNPs, were calculated for each pair of species within the B.
burgdorferi species complex with the aim of obtaining a quantitative
measurement of the degree of genetic isolation among the sampled
species (Table 2). In general, we found more differentiation
between species in the chromosome and lp54 data than in the
cp26 data. When we used SNPs from all replication units to
examine the differentiation between Borrelia burgdorferi s.s. and each
of the two other B. garinii and B. afzelii species, we found that over
90% of SNPs showed significant differentiation (p,0.05). Like-
wise, more than 80% of SNP sites were significantly differentiated
between sequences of B. garinii and B. afzelii (data from all three
replication units).
After observing this differentiation pattern, we investigated the
impact of homologous recombination on the genetic diversity of
the B. burgdorferi species complex by calculating D9 linkage
disequilibrium values for all pairs of SNPs, both in i) all genomes
grouped together and ii) within groups of conspecific genomes,
Borrelia burgdorferi Population Genomics
PLOS ONE | www.plosone.org 7 April 2014 | Volume 9 | Issue 4 | e94384

Figure 2. Phylogenetic delineation of species in the B. burgdorferi complex based on chromosomal sequences. (A) Neighbor-Netnetwork based on chromosomal sequence data that illustrates phylogenetic relationships among sampled and reference strains of Borrelia. Thenetwork was constructed with SPLITSTREE 4 software using the Neighbor-Net method and based on a distance matrix calculated in PAUP* 4.0 b10 usinga GTR+I+G model. In grey, the percentage of the 1-kb-long contiguous windows obtained from different genetic groups of Borrelia that support theirmonophyly. Distributions of expected probabilities of monophyly for strains of (B) B. garinii and (C) B. burgdorferi s.s. in the absence of recombination,based on 300 simulations of 1,000,000 genome alignments delineated into 1,000 bp windows. Continuous distributions (in red and green) wereobtained using Gaussian kernels.doi:10.1371/journal.pone.0094384.g002
Borrelia burgdorferi Population Genomics
PLOS ONE | www.plosone.org 8 April 2014 | Volume 9 | Issue 4 | e94384

assigned to B. burgdorferi s.s., B. garinii, or B. afzelii (Table 3). As
expected from our analysis of differentiation, the average D9 value
over the three replication units calculated for the set of all strains
was high (0.92; standard error of 6.2e-06); it was higher than the
values obtained for B. burgdorferi s.s. and B. garinii (0.75 and 0.81;
standard errors of 7.8e-05 and 4.3e-05, respectively) but lower
than that of B. afzelii (0.96; standard error of 2.9e-05).
Nevertheless, this last value should be treated with caution due
to the low sample size used to generate it. When we examined the
individual replication units in the whole sample, we found a
negative relationship between linkage disequilibrium and physical
distance, but the decrease of D’ values leveled off after 500 bp (e.g.
for chromosomal data Figure 3).
Intra-specific patterns of relatednessTo more precisely illustrate the genetic relationships among the
sampled and reference strains within species, we constructed
Neighbor-Net phylogenetic networks based on the chromosomal
data of B. burgdorferi s.s. and B. garinii (Figure 4).
Within B. burgdorferi s.s., most strains clustered together to form
two closely related phylogenetic groups that included the
published sequences of strains Bol26 and ZS7 (Figure 4). This
branching pattern was unexpected, as these two published strains
had been isolated in Italy and Germany, respectively, with the
latter originating from a study conducted more than twenty years
ago [71]. Conversely, strains IPT49, IPT77, and IPT141, which
were isolated from ticks sampled from a single location in both
2003 and 2004, grouped together in a separate clade and
appeared to be more closely related to North American strains
of B. burgdorferi s.s., such as strain 94A. In fact, most of the
reticulations in this region of the network involve branches leading
to American strains.
Strains assigned to B. garinii formed nine groups of closely
related genotypes (Figure 4). These genetic groups were connected
in a star-like phylogeny, with the exception of strain IPT126,
which was ambiguously connected via reticulations to two different
groups of strains (one including IPT75, IPT86, IPT89, IPT94,
IPT117, and IPT140, and the other containing IPT76, IPT90,
IPT98, IPT101, IPT114, IPT133, IPT134, and IPT136. None of
the B. garinii strains that were sequenced for this study clustered
with the reference strain B. garinii Far04, but we found that four of
our sampled strains (IPT91, IPT96, IPT99, and IPT124) grouped
with the reference strain B. garinii PBr, which had been isolated in
Germany in the 1980’s.
Finally, the network showed that the B. afzelii strains isolated in
this study were closely related to reference strains PKo and ACA-
1. However, it also showed that this group of sampled strains is not
monophyletic.
Population structure within sampled speciesWe performed STRUCTURE analyses to describe the population
structure of B. burgdorferi s.s. and B. garinii in more detail. The
population structure of strains of B. burgdorferi s.s. suggested an
optimal value of K = 7 populations (Figure S1). Results revealed
that European strains were assigned to three main populations,
which showed low levels of admixture (Figure 4). Conversely, high
levels of admixture were identified among American strains. For B.
garinii, the optimal number of populations was computed to be
K = 13 populations, and strains from this study were assigned to 9
of those 13 populations, with strain IPT126 showing a high degree
of admixture (Figure 4).
We then compared in more detail the distribution of genetic
diversity within the three sampled species by calculating two
estimates of the diversity statistic h (measured per site): hS and hp.
From the chromosomal data of each species, overall estimates
confirmed that strains of B. garinii contained more genetic diversity
than those of B. burgdorferi s.s. or B. afzelii (Table 4). Among our
samples, in B. burgdorferi s.s. we found that hS = 2.7e-03 and
hp = 2.0e-3. For B. garinii, hS and hp were 6.3e-03 and 5.5e-03,
respectively and in the case of B. afzelii, hS was 4.5e-03 and hp was
4.6e-03.
Next, we focused on pairwise D9 values for SNPs within either
the B. burgdorferi s.s. strains or the B. garinii strains from both of our
sampling sites. Interestingly, these values were higher and, in the
case of B. burgdorferi s.s., considerably higher than those that we
calculated from all available genomes (Table 3). For the three
replication units taken together, the average D’ value was 0.97 for
Table 1. Percentage of the 1-kb-long contiguous windowsobtained from different genetic groups of Borrelia thatsupport their monophyly.
Genetic groups Chromosome cp26 lp54
B. burgdorferi s.s. 84.8 60.0 83.0
B. burgdorferi s.s. and B. finlandensis SV1 97.5 86.7 88.7
B. garinii 87.7 83.3 83.0
B. garinii and B. bavariensis PBi 98.3 90.0 96.2
B. afzelii 98.7 93.3 98.1
B. afzelii and B. spielmanii A14S 90.2 83.3 90.6
doi:10.1371/journal.pone.0094384.t001
Table 2. Mean differentiation (HST values) of SNPs identified in different groups of Borrelia and the percentage of HST values thatdemonstrated a significant degree of differentiation (p,0.05).
Chromosome cp26 lp54
Groups compared Mean stda Sb Mean stda Sb Mean stda Sb
B. burgdorferi s.s. vs. B. afzelii 0.92 1.0e-03 95.2 0.82 7.5e-03 89.2 0.96 2.1e-03 98.0
B. burgdorferi s.s. vs. B. garinii 0.88 1.2e-03 99.7 0.83 7.5e-03 98.7 0.92 3.2e-03 99.9
B. garinii vs. B. afzelii 0.79 1.8e-03 85.0 0.73 1e-02 80.2 0.84 4.7e-03 90.3
B. burgdorferi s.s., Munster vs. Guebwiller 0.06 6.2e-04 0.52 0.05 2.6e-03 3.29 0.06 3.5e-03 4.6
B. garinii, Munster vs. Guebwiller -0.001 4.3e-04 3.58 0.00 2.2e-03 3.85 -0.005 1.3e-03 2.6
astandard error of the mean.bpercentage of HST values indicating significant differentiation (%).doi:10.1371/journal.pone.0094384.t002
Borrelia burgdorferi Population Genomics
PLOS ONE | www.plosone.org 9 April 2014 | Volume 9 | Issue 4 | e94384

B. burgdorferi s.s. and 0.81 for B. garinii (respective standard errors of
4.3e-05 and 4.2e-05). As for inter-specific data, we found a
negative relationship between linkage disequilibrium and physical
distance within species, and the decrease of D’ values especially
leveled off after 500 bp in B. garinii (Figure 3). Within both species,
we found SNPs with very low D’ values, indicating low levels of
linkage disequilibrium with most other SNPs and a large number
of these SNPs were located in the vicinity of the ospC gene
(Figure 5).
Given that the levels of linkage disequilibrium in B. burgdorferi s.s.
and B. garinii in our regional sample were higher than those
calculated for the global sample, we investigated the extent of
geographical isolation within each species by using SNPs
frequencies to analyze the distribution of HST values between
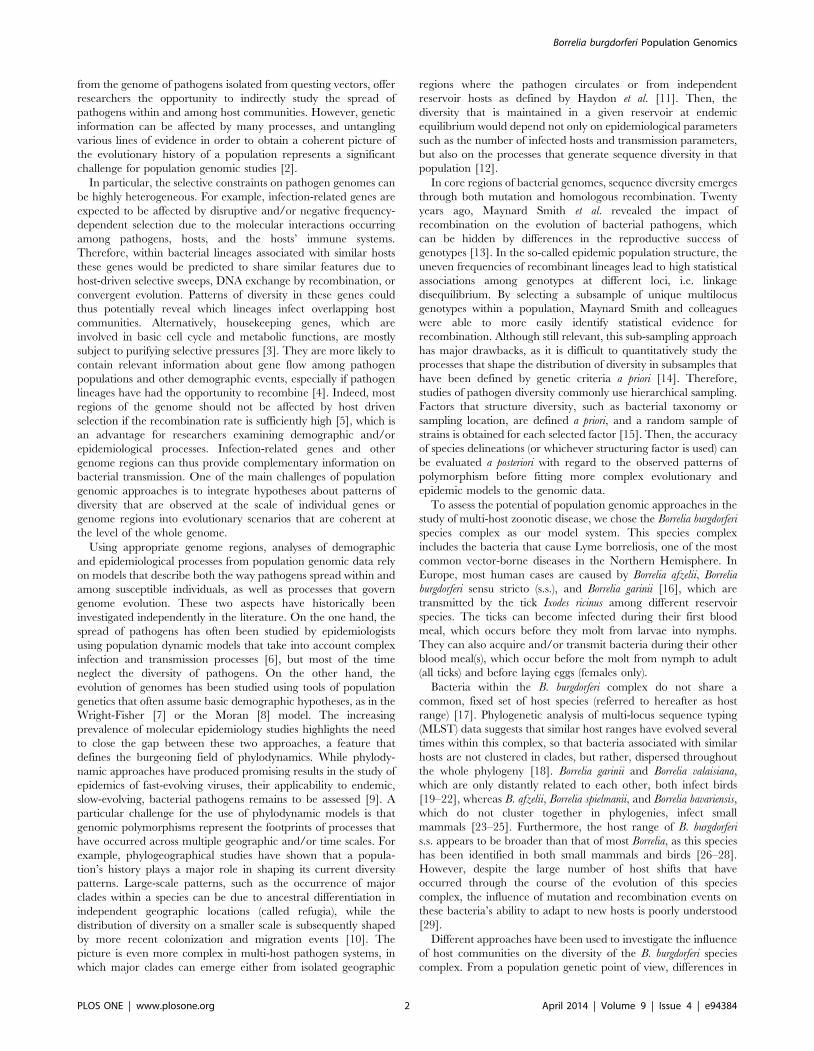
our two sampling sites (Table 2, Figure 6). At the SNP level, only a
few markers (ranging from 0.52% to 4.58% of SNPs per species/
replication unit combination) revealed significant isolation
(p,0.05) between samples obtained from Munster and those
obtained from Guebwiller for either B. burgdorferi s.s. or B. garinii.
However, the distribution of HST values obtained from isolates of
B. burgdorferi s.s was centered around a significantly higher value
(p,2.2e-16) than the distribution of values obtained from B. garinii,
indicating that the former species was significantly more differen-
tiated between our two study sites (Figure 6). In both species, HST
values computed from SNPs located in a region of 4 kb around the
ospC gene on cp26 deviated strongly from the rest of the
distribution (Figure S2), a signal that this region is subjected to
peculiar evolutionary constraints. Similarly atypical patterns could
be observed in various regions of the chromosome and of the lp54
plasmid (Figure S2).
Evidence of diversifying selection along replication unitsTajima’s D values were computed for 1-kb windows of sequence
data obtained from each replication unit for each of the sampled
species. Within each individual species, most of the mean Tajima’s
D values for the individual replication units were negative (Figure
S3): for B. burgdorferi s.s., mean Tajima’s D values were 21.02,
20.13, and 20.61 for the chromosome, cp26 and lp54 plasmid,
respectively; for B. garinii, they were 20.58, 20.46, and 20.58,
respectively; and for B. afzelii they were 20.33, 0.12, 20.37
respectively.
Because strong Tajima’s D values could be the result of host-
driven selective pressures on the genes contained within the
windows and indicate genome regions showing extensive genetic
diversity, we identified the 1-kb windows within each species that
had the highest absolute values. When we identified the genes that
Figure 3. Relationships between D’ and the physical distance between SNPs. D’ values were calculated from pairs of SNPs using thechromosomal sequences of (A) all strains used in this study, (B) all strains of B. burgdorferi s.s., and (C) all strains of B. garinii. Average D’ valuesobtained for all pairs of SNPs separated by less than 2,000 bp (using 50-bp intervals) are shown.doi:10.1371/journal.pone.0094384.g003
Table 3. Mean linkage disequilibrium (D’ values) at different sampling scale for pairs of SNPs within different genetic groups ofBorrelia.
Chromosome cp26 lp54
Sampling scales Mean stda Mean stda Mean stda
All strains 0.92 6.2e-06 0.87 2.1e-04 0.94 5.3e-05
All strains from this study 0.96 5.3e-06 0.92 1.8-04 0.98 3.5e-05
All B. burgdorferi s.s. strains 0.75 7.9e-05 0.76 9.2e-04 0.66 1.2e-03
B. burgdorferi s.s. strains from this study 0.97 4.3e-05 0.95 5.9e-04 0.93 1.1e-03
All B. garinii strains 0.81 4.3e-05 0.80 9.8e-04 0.73 5.5e-04
B. garinii strains from this study 0.82 4.2e-05 0.81 9.9e-04 0.74 5.5e-04
All B. afzelii strains 0.96 2.9e-05 0.92 6.1e-04 0.95 4.6e-04
B. afzelii strains from this study 0.98 2.9e-05 0.97 4.7e-04 0.97 2.8e-04
doi:10.1371/journal.pone.0094384.t003
Borrelia burgdorferi Population Genomics
PLOS ONE | www.plosone.org 10 April 2014 | Volume 9 | Issue 4 | e94384

Borrelia burgdorferi Population Genomics
PLOS ONE | www.plosone.org 11 April 2014 | Volume 9 | Issue 4 | e94384

were present within the selected windows, we found that,
compared to the total number of annotated genes for each of
the three replication units (chromosome, cp26, and lp54), the
genes within these highlighted windows contained a significantly
lower proportion of cytoplasmic protein-encoding genes and,
instead, were significantly enriched in surface lipoprotein-encoding
genes (Fisher’s exact test, p,0.05). More precisely, genes that
encoded cytoplasmic proteins (identified through SLEP analyses)
only represented 55% of genes with high Tajima’s D values even
though they made up 67% of the genes within the total proteome
encoded by the chromosome, cp26, and lp54. Genes annotated as
encoding for membrane-associated proteins made up 23% of
genes with high Tajima’s D values and 22% of genes in the studied
proteome, while genes described as encoding exported proteins
represented 4% and 5% of those respective groups. Finally, 18%
of the genes with high Tajima’s D values were annotated as
lipoprotein-encoding genes, which make up only 6% of genes in
the proteome as a whole. Another observation adds weight to the
unique position of lipoprotein-encoding genes in this sample is that
the only gene found in high-D-value windows in all three Borrelia
species was the ospC lipoprotein gene.
Phylogenetic analysis of the ospC gene and flankingregions
In order to more thoroughly investigate the reasons for which
the region around the ospC gene produced peculiar results in our
analyses of linkage disequilibrium, genetic differentiation, and
Tajima’s D values, we constructed phylogenetic networks of the
ospC gene and flanking regions (Figure 7). The network obtained
from the alignment of ospC sequences showed a star-like structure,
with most external branches including a small number of
genotypes (Figure 7C). When we examined either the 2,000 bp
upstream or the 2,000 bp downstream of the ospC gene, the
structure became more resolved (Figures 7B and 7D). Neverthe-
less, all of these networks differed markedly from the one based on
the chromosomal alignment (Figure 2). Most notably, in these
networks using cp26 data, B. burgdorferi s.s. did not form an obvious
clade. Its constituent strains were distributed into different
subgroups that were linked by large reticulations to strains of
either B. afzelii or B. spielmanii. Furthermore, B. finlandensis strain
SV1 was included within a group of B. burgdorferi s.s. strains.
Conversely, B. burgdorferi s.s. strains IPT49, IPT77, and IPT141,
for which the phylogenetic analysis based on chromosomal data
had revealed only a distant relationship to other B. burgdorferi
strains, were still grouped together but were embedded among
other B. burgdorferi s.s. strains. When we constructed networks
based on sequence data further upstream or further downstream
of the ospC gene, the patterns became more consistent with the
phylogenetic signal obtained from the chromosome (Figure 7A
and 7E).
Long-term coalescent based modelWe developed coalescent-based models to estimate the impact
of various divergence times, effective population sizes, and intra-
specific and inter-specific recombination rates on the evolutionary
history of B. burgdorferi s.s. and B. garinii. First, we checked that the
distributions of summary statistics obtained from our accepted
simulations contained the statistics generated from our observed
data (data not shown). To obtain quantitative support for our
inference, we used Bayes factors to compare different models that
had different constraints applied to the parameters of interest
(Table S4). As a result of this comparison, we chose the M3 model
for further analysis. From posterior distributions of the parameters
of interest (Figure S4), we computed average values for each
parameter and scaled the different estimates to yield interpretable
results. The resulting estimates of the h parameter were 8.2e-04 for
B. burgdorferi s.s. and 1.5e-03 for B. garinii, while the effective
population sizes of the two species (assuming a mutation rate of 1e-
07 per site per generation) were approximately 8200 and 14500
respectively. The inter-specific recombination rates, rinter1 = rinter2,
was estimated to be 3.1e-09, which was 50 times lower than the
intra-specific recombination rates, rintra1 = rintra2 = rintra3 = 1.7e-07.
The ratio of the recombination rate to the mutation rate was
approximately 1.7. The model estimated that the two species
shared a common ancestor around 490,000 generations ago. The
ancestral population size estimate should be treated with caution
Figure 4. Phylogenies and population structures of B. burgdorferi s.s. and B. garinii. Neighbor-Net networks based on chromosomal datareveal the phylogenetic relationships among sampled and reference strains of (A) B. burgdorferi s.s. and (C) B. garinii. Networks were constructed withSplitsTree 4 software and were based on a distance matrix calculated in PAUP* 4.0 b10 using a GTR+I+G model. Strain names are surrounded infunction of the main population they were assigned to using Structure; the results of the best run of STRUCTURE v2.3.4 are shown for (B) B. burgdorferis.s. (K = 7) and (D) B. garinii (K = 13). Analyses were based on all polymorphic sites present in at least 90% of strains identified using multiplealignments of chromosomal data, assuming correlations among linked loci and allowing admixture among potential populations.doi:10.1371/journal.pone.0094384.g004
Table 4. Chromosomal genetic diversity and Tajima’s D values.
hS hp Tajima’s D
Species Mean stda Mean stda Mean stda
All B. burgdorferi s.s. strains 4.2e-03 9.4e-05 3.1e-03 1.6e-04 -1.02 4.1e-02
B. burgdorferi s.s. strains from this study 2.7e-03 7.2e-05 2.0e-03 9.3e-05 -0.80 5.9e-02
All B. garinii strains 6.6e-03 8.7e-05 5.5e-03 8.7e-05 -0.58 2.1e-02
B. garinii strains from this study 6.3e-03 8.6e-05 5.5e-03 8.9e-05 -0.44 2.1e-02
All B. afzelii strains 4.0e-03 1.1e-04 3.6e-03 1.2e-04 -0.33 3.9e-02
B. afzelii strains from this study 4.4e-03 1.3e-04 4.5e-03 1.4e-04 0.18 7.1e-02
astandard error of the mean.To estimate the diversity statistic h, Watterson’s hS and Tajima’s hp were calculated using chromosomal sequence data for all 1-kb windows. Tajima’s D values werecalculated from these estimates; the mean and standard error for each group are shown.doi:10.1371/journal.pone.0094384.t004
Borrelia burgdorferi Population Genomics
PLOS ONE | www.plosone.org 12 April 2014 | Volume 9 | Issue 4 | e94384
as the posterior distribution from which it came indicates a large
degree of uncertainty regarding the outcomes of the model (Figure
S4).
Intra-specific phylodynamic modelWe explored the properties of an individual-based epidemio-
logical model to better understand factors that could influence the
maintenance of the diversity we observed in our two sites, Munster
and Guebwiller. Independently for each species, we performed 50
simulations that assumed different values for parameters of
interest: the number of hosts per population, Nhosts; the replace-
ment rate of the host population, Rhosts; and the migration rate
between sampling sites Fmig/Nhosts. Of these simulations, we
selected those whose summary statistics were similar to observed
values (1% of the total simulations for B. burgdorferi s.s. and B.
garinii). We then plotted the values of the parameters for the
selected simulations in order to identify patterns of epidemiological
relevance (Figure 8). Overall, larger population sizes and higher
migration rates were required to maintain the diversity that we
observed in B. garinii than were necessary for the maintenance of
observed patterns in B. burgdorferi s.s. According to the model, host
population sizes of l00 individuals would be sufficient to function
as effective reservoirs for the diversity we observed in our study.
Discussion
Distribution of diversity among species of the Borreliaburgdorferi complex
We studied species delineations within the B. burgdorferi complex
using genomic data from sympatric isolates and geographically
independent reference sequences. Our results show that the B.
burgdorferi species complex is composed of different genetic groups
that are clearly isolated from one another (Figure 2). These results
are consistent with the robust genetic boundaries that have been
observed among the members of the B. burgdorferi species complex
following analyses of concatenated MLST data [29]. Although
there were few obvious inter-specific recombination events, most
phylogenies based on contiguous 1-kb windows along the three
main replication units studied here (the chromosome, the cp26
plasmid, and the lp54 plasmid) showed clear delineations among
the B. burgdorferi s.s., B. garinii, and B. afzelii strains (Table 1). This
finding is further supported by the almost complete genetic
differentiation that we observed in our analysis of HST values
among the three species (Table 2). Finally, linkage disequilibrium
measures were much higher for the species complex as a whole
than within the two most frequently sampled species, B. burgdorferi
s.s. and B. garinii (Table 3). Additionally, coalescent-based
inference consistently revealed that within-species recombination
rates for B. burgdorferi s.s. and B. garinii may be more than ,50
times higher than between-species recombination rate (Figure S4).
Taken together, these data suggest that homologous recombina-
tion occurs much more frequently within than among species,
which counters previous suggestions that, the rate of cross-species
recombination in this species complex is high [36].
Some exceptions to the monophyly of the sampled species were
found: B. burgdorferi s.s. was non-monophyletic in 15% of the
phylogenies generated here, and B. garinii was non-monophyletic
in 12% (Figure 2). The majority of these incongruencies resulted
from the inclusion of the B. finlandensis SV1 strain within a cluster
of B. burgdorferi s.s. strains or the inclusion of the B. bavariensis PBi
strain with strains of B. garinii. However, the average amount of
sequence divergence in both cases (between B. burgdorferi s.s. and B.
finlandensis, and between B. garinii and B. bavariensis) is lower than
the 5% divergence usually observed among bona fide species [72].
This raises questions on the amount of information available to
delineate these groups. Additionally, the observed percentages of
windows that did not support the respective monophyly of our two
study species were much higher than would be predicted by an
evolutionary model lacking recombination, as our phylogenetic
simulations revealed (Figure 2). Thus, recombination presents itself
as a possible phenomenon that might be responsible for the
conflicting phylogenetic signal among windows. However, another
explanation is also likely: the inability of certain phylogenies to
distinguish between and to separate these pairs of species might
simply result from the incomplete sorting of closely related
bacterial lineages since the time of divergence [73]. This latter
hypothesis is supported by the low ratio between the inter-specific
and the intra-specific rate of recombination that was observed in
B. burgdorferi s.s. and B. garinii.
This sharp decrease between inter-specific and the intra-specific
recombination rates in the B. burgdorferi species complex, shown by
both the observed genomic data and the results of our coalescent-
based model, could be explained by various hypotheses. From an
Figure 5. Linkage disequilibrium along the cp26 plasmid. Theaxes are the positions on the plasmid of the SNPs included in eachpairwise analysis. An absence of shading corresponds to a high level oflinkage disequilibrium (D’ close to 1) and progressively darker shadingindicates decreasing values of D’. The genome region in and around theospC gene is characterized by low linkage disequilibrium.doi:10.1371/journal.pone.0094384.g005
Figure 6. Genetic differentiation between sampling sites for B.burgdorferi s.s. and B. garinii. Distributions of HST values wereobtained from within-species analyses of geographical genetic differ-entiation based on SNPs. Genetic differentiation between the two siteswas significantly higher for B. burgdorferi s.s. than for B. garinii.doi:10.1371/journal.pone.0094384.g006
Borrelia burgdorferi Population Genomics
PLOS ONE | www.plosone.org 13 April 2014 | Volume 9 | Issue 4 | e94384

Borrelia burgdorferi Population Genomics
PLOS ONE | www.plosone.org 14 April 2014 | Volume 9 | Issue 4 | e94384

ecological point of view, a lack of physical contact between genetic
groups in the species complex as a result of association with
different vertebrate hosts may result in divergence if mutations
accumulate via genetic drift and/or selection [29], and such
physical isolation may prevent the homogenization of lineages via
homologous recombination. The divergence of B. garinii from B.
bavariensis could be explained by this hypothesis, as it is associated
with a shift in host range [18]. However, no such evidence is
available to explain the separation of B. finlandensis from B.
burgdorferi. We also did not find obvious evidence for homologous
recombination between B. valaisiana and the studied B. garinii
genomes, even though both species co-infect the same host species
in our sampling location [38]. Thus, it seems that a lack of
opportunity is not the only factor inhibiting a higher recombina-
tion rate. Other hypotheses could be that inter-specific recombi-
nants are genetically less fit and do not persist in populations, or
that genetic divergence among species might depress homologous
recombination rates in this species complex. In this context,
looking for genes experiencing diversifying selection and present-
ing a high degree of divergence is particularly interesting.
Evidence of selective pressures within genomes andresulting ospC diversification
We used Tajima’s D statistic to determine which genes might be
affected by selective pressures, and we found that genes involved in
lipoprotein production had a greater representation among genes
with high Tajima’s D values than would have been predicted from
their prevalence in the overall proteome of each of the species
studied. In this, our results concur with the genetic evidence
reviewed by Brisson et al. [34] as well as a recent phylogenetic
analysis of the ratio of non-synonymous to synonymous mutation
rates [35]. Of the lipoprotein-encoding genes highlighted here, the
only one identified in all three taxa was ospC. The high genetic
diversity of the ospC gene is probably influenced by a combination
of selective pressures. The first type of selective pressure may be a
Figure 7. Phylogenetic ambiguities in the ospC gene in lineages associated with small mammals. Five Neighbor-Net networks wereobtained (using p-distances and SPLITSTREE 4) from alignments of the regions including and flanking the ospC gene and are presented in the order inwhich they physically occur in the cp26 sequence. (A) Upstream region; (B) 2,000 bp sequence that occurs before ospC; (C) the ospC gene, (D)2,000 bp sequence that occurs after ospC; and (E) downstream region delineated.doi:10.1371/journal.pone.0094384.g007
Figure 8. Distribution of the parameter values of the phylodynamic model simulations. The values of the parameters of interest for thesimulations we selected (based on their similarity to our observations) are plotted. Green points correspond to simulations of B. burgdorferi s.s. andred points to simulations of B. garinii and: (A and D) Fmig in function of Nticks = Nhosts; (B and E) Rhosts in function of Nticks = Nhosts; (C and F) Fmig infunction of Rhosts.doi:10.1371/journal.pone.0094384.g008
Borrelia burgdorferi Population Genomics
PLOS ONE | www.plosone.org 15 April 2014 | Volume 9 | Issue 4 | e94384

consequence of the function of the lipoprotein encoded by ospC,
which binds the tick salivary protein Salp15 [74] as well as host
plasminogen [75] in order to facilitate Borrelia dissemination within
hosts. Disruptive selective pressures on the various alleles of ospC
could give these bacteria the ability to interact with different host
species. Indeed, the multiple niche model has been suggested to be
a critical driver of the diversity of these bacteria [32]. Second, the
protein encoded by ospC has antigenic properties [76] and might
thus evolve under negative frequency-dependent selective pressure
[77]. Evidence of both of these types of selective pressure on ospC
diversity was obtained from a recent study [33] that found: i) a
strong association between bacterial ospC genotypes and the rodent
hosts they infect, suggesting their limited spread in the host
community; and ii) different ospC alleles associated with a common
genetic background, suggesting the influence of diversifying
selective pressure.
We did not find direct evidence of associations between ospC
alleles and potential host species. However, our phylogenetic
analysis of the flanking regions of ospC revealed ambiguous
relationships between B. burgdorferi s.s. and both B. afzelii and B.
spielmanii, an observation that probably indicates some degree of
recombination among these taxa despite high levels of divergence.
As recombination requires physical contact between genotypes,
the recombinant genotypes we observed provide evidence that co-
infections with B. burgdorferi s.s., B. afzelii, and B. spielmanii strains
occurred in the past. B. burgdorferi s.s. can be found in both birds
and small mammals, while the two other species are usually
associated with small mammals. Therefore, one explanation might
be that the B. burgdorferi s.s. lineages we sampled are infected the
same hosts as B. afzelii and B. spielmanii. The reticulations in the
ospC phylogeny suggest that inter-specific recombination may thus
be involved in the emergence of new genotypes within the B.
burgdorferi species complex (Figure 7). However, the lack of
evidence of ospC recombination between B. bavariensis PBi strain
and other species that infect small mammals indicates that other
evolutionary scenarios are also likely. Finally, it is difficult to
estimate the approximate time periods during which these inferred
recombinations may have occurred. If recombinations were more
recent, it would suggest that the strains of B. burgdorferi s.s. that we
sampled frequently infect small mammals within the geographical
area we studied. A future challenge for researchers will be to
calibrate a molecular clock for the ospC region that takes into
account its specific evolutionary constraints, i.e. high recombina-
tion rate and selective pressures.
When we examined the distribution of ospC diversity among
lineages, we found closely related genomic backgrounds associated
with different ospC alleles (Figure 7C); this was observed in both B.
burgdorferi s.s. and B. garinii. We also observed a lower degree of
linkage disequilibrium around the ospC region than in any other
genome location (Figure 5). These observations could be explained
by a locally higher recombination rate and/or selective pressure
driven by hosts’ immune systems. Considering the selective
pressures likely acting on the ospC region, it seems probably that
recombination could produce genetic combinations that would
subsequently be maintained in higher numbers by diversifying
selection than would persist as a result of neutral evolution or
purifying selection. However, in describing multiple ospC alleles
associated with similar genetic backgrounds and the low linkage
disequilibrium between ospC data and other parts of the genome,
our results differ substantially from those of Haven et al. [36] who
observed a strong relationship between allelic variation in ospC and
the rest of the genome. The authors of that study used this
relationship to hypothesize a major role for negative frequency-
dependent selection in the diversification of the B. burgdorferi
species complex, a role that our results call into question.
Genetic structure within Borrelia burgdorferi s.s.In addition to the patterns observed at the ospC locus, our
analyses also conflicted with previous observations regarding
linkage disequilibrium. Within B. burgdorferi s.s., our random
sampling at a regional scale revealed much higher linkage
disequilibrium values that what can be obtained from previously
sequenced genomes [36,37] (Table 3). This observation was
strengthened by a STRUCTURE analysis. While the strains we
sampled and sequenced, as well as the two other European
genomes included here, were assigned to clearly delineated
populations, genomes obtained from North American strains
showed marked evidence of admixture (Figure 4B). This difference
was also visible in the phylogenetic network of B. burgdorferi s.s.
strains, in which reticulation mostly involved branches leading to
American strains (Figure 4A). Originally, the sequenced American
strains were ‘‘chosen to cover a large fraction of the genetic and
geographic diversity’’ within B. burgdorferi s.s. and such a choice
might lead the emergence of peculiar diversity patterns [37]. For
example, in an analysis that used these American strains, Haven et
al. described a positive relationship between linkage disequilibrium
and physical distance [36], which was counter-intuitive [34].
However, the analysis of our local sample revealed the expected
negative relationship between the two statistics (Figure 3).
Additionally, the restriction of high values of linkage disequilib-
rium to genomic areas distant from less than a kilobase that we
observed is consistent with current knowledge on the length of
DNA fragment exchanged by homologous recombination [34].
The observed difference in linkage disequilibrium patterns
between our regional samples and the whole sample, including
Schutzer et al. genome sequences [37], may be compatible with the
hypothesis of an epidemic population structure in B. burgdorferi s.s.,
even though this hypothesis has been previously criticized [36].
The high degree of linkage disequilibrium measured here is
probably due to the prevalence in our sample of a small number of
bacterial genotypes that had high transmission success, and an
analysis of a collection of genomes that optimizes diversity might
show more evidence of genome-wide recombination, a pattern
that would be coherent with that given by Maynard Smith et al. in
their seminal paper [13]. In this context, it would be interesting to
determine whether the measured difference in linkage disequilib-
rium measures is due to either a difference in sample selection
based on a-priori genomic information, or a difference in the
geographic scale of sampling. Indeed it has been described in B.
afzelii that different recombinant genotypes were isolated from
independent locations [78].
Differences between the genetic structures of B. gariniiand B. burgdorferi s.s. and epidemiological considerations
Linkage disequilibrium values within Borrelia garinii genomes
sampled in Alsace were lower than those measured within strains
of B. burgdorferi s.s from the same locations (Table 3). Nevertheless,
the STRUCTURE analysis did not reveal extensive evidence of
admixture, with the exception of strain IPT126 (Figure 4C).
Further, coalescent-based modeling suggested that recombination
rates were similar in the two species. Assuming the same mutation
rate for each species and considering only the strains we sampled
for this study, we inferred a within-species ratio of recombination
rate to mutation rate of 1.7 in B. burgdorferi s.s. and B. garinii, figures
that were in close agreement with a previous estimation based on
three pairwise comparisons of related genomes (using chromo-
some, cp26 and lp54 data) within B. burgdorferi s.s. [36]. We
Borrelia burgdorferi Population Genomics
PLOS ONE | www.plosone.org 16 April 2014 | Volume 9 | Issue 4 | e94384

observed clearer differences between B. burgdorferi s.s. and B. garinii
from our analysis of population structure, in which we estimated
effective population sizes and analyzed genetic differentiation
between Munster and Guebwiller. As expected from our
measurements of diversity, our coalescent models suggested that
the effective population size of B. burgdorferi s.s. was lower than the
effective population size of B. garinii. Moreover, differentiation
measures, which are inversely proportional to migration rate, were
higher for B. burgdorferi s.s. than for B. garinii.
However, these measures, by themselves, may not directly help
in understanding the observed diversity patterns. The phylogenetic
relationships between our sequences and reference sequences,
which were isolated years ago in different areas, suggested that the
diversification of the observed lineages of B. burgdorferi s.s. and B.
garinii greatly preceded the establishment of the studied transmis-
sion networks. In order to more directly investigate current
patterns of diversity, then, we implemented a simple phylody-
namic model, which did not examine the diversification phase of
the different genotypes but focused only on the maintenance of
diversity. This model confirmed that the maintenance of the
observed level of diversity requires a higher host population size
and higher host migration rates in B. garinii than in B. burgdorferii
s.s. These results are similar to those obtained from MLST data in
a comparison of the genetic structures of rodent-associated B.
afzelii and bird-associated B. garinii at a broader geographic scale
[30]. The phylodynamic model thus provided this study with two
important benefits. From an applied point of view, the
phylodynamic information about the genetic structure of B.
burgdorferi s.s. and B. garinii was coherent with the phylogenetic
signal identified in the ospC gene region and both sets of results
support the hypothesis that small mammals might be the reservoir
of the B. burgdorferi s.s. strains studied here. From a purely
academic point of view, a simple phylodynamic model that does
not assume hypotheses about selective pressures contrary to
multiple-niche model and negative frequency-dependent selection,
allows researchers to explain the maintenance of numerous
bacterial lineages with realistic host population sizes. We thus
advocate that further efforts are required to incorporate explicit
epidemiological constraints into evolutionary models in order to
study the genome of both tick-borne and host associated strains
and obtain further insight into the evolution of the B. burgdorferi
species complex.
Supporting Information
Figure S1 Mean likelihood values of STRUCTURE runs.STRUCTURE analyses were conducted using K values ranging from
1 to 15; for each value, the analysis was repeated five times and the
mean likelihood value is plotted here. Analyses were based on all
the polymorphic sites identified in at least 90% of B. burgdorferi and
B. garinii strains using multiple chromosomal alignments. For each
species, analyses were performed assuming correlations among
linked loci and allowing admixture among potential populations.
Green points correspond to results for B. burgdorferi s.s. and red
points to results for B. garinii.
(TIFF)
Figure S2 Genetic differentiation between isolates fromMunster and Guebwiller for B. burgdorferi s.s. and B.garinii. The distributions of HST values were obtained from
within-species comparisons of SNPs between isolates from
Munster and Guebwiller for B. burgdorferi s.s. (left column) and B.
garinii (right column). The sequence alignments used in the
comparisons were obtained from (A and B) the chromosome, (C
and D) the cp26 plasmid, and (E and F) the lp54 plasmid. Red
circles correspond to values that showed a significant level of
differentiation (p,0.05).
(TIFF)
Figure S3 Distribution of Tajima’s D values obtainedfrom contiguous 1-kb windows for the three species ofBorrelia included in this study. Values were calculated for A)
chromosomal, B) cp26, and C) lp54 alignments. Green lines
indicate the mean value of Tajima’s D. Blue lines represent the
mean of Tajima’s D values calculated from chromosomal data
and are replicated in each plot. Red lines indicate the 5th and
95th percentiles of chromosomal Tajima’s D values for each
species.
(TIFF)
Figure S4 Posterior distributions of parameters of thecoalescent model M3. Distributions were obtained from the
simulations, of the coalescent model M3, we selected (based on
their similarity to our observations); (A) N1 = c1*N, the
population size of B. burgdorferi s.s., (B) N2 = c2*N, the
population size of B. garinii, (C) N3 = c3*N the ancestral
population size, (D) the recombination rate within the B.
burgdorferi s.s. species rintra1, (E) the recombination rate within
the B. garinii species rintra2, (F) the recombination rate within the
ancestral population rintra3, (G) the inter-specific recombination
rate rinter1, (H) the inter-specific recombination rate rinter2, (I)
M*(c1*N+c2*N) the time backward until the two populations
merged.
(TIFF)
Table S1 Description of the 63 strains of the B.burgdorferi species complex that were isolated andsequenced in this study. A: M: Adult male; F: Adult female;
N: Nymph. All strains were isolated from Ixodes ricinus ticks.
(DOC)
Table S2 Percentage of the length of reference sequenc-es onto which raw sequences were mapped for eachstrain of the B. burgdorferi species complex examined inthis study. Reference sequences came from i) the chromosome
(Chr), the circular plasmid cp26, and the linear plasmid lp54 of B.
burgdorferi s.s. strain B31; ii) the chromosome of B. bavariensis strain
PBi and the cp26 and lp54 plasmids of B. garinii strain Far04; iii)
the chromosome, cp26 plasmid, and lp54 plasmid of B. afzelii
strain PKo.
(DOC)
Table S3 Description of the 23 sequenced strainsisolated and sequenced in previous studies and used asreferences in this study.
(DOC)
Table S4 Bayes factors for each pair of coalescentmodels. Each cell gives the ratio of the number of simulations
selected for the column model to the number selected for the row
model (i.e., column: row).
(DOC)
Acknowledgments
We thank Isabelle Lebert for preparing the map of the sampling sites of the
study. We thank the Genoscreen team, especially Stephanie Ferreira and
Christine Hubans, for handling the sequencing process. We also thank
Jessica Pearce and Lindsay Higgins for proofreading and editing our
manuscript.
Borrelia burgdorferi Population Genomics
PLOS ONE | www.plosone.org 17 April 2014 | Volume 9 | Issue 4 | e94384

Author Contributions
Conceived and designed the experiments: EF XB. Performed the
experiments: EF VC M. Garnier NS XB. Analyzed the data: MJ XB.
Contributed reagents/materials/analysis tools: MJ M. Gonnet DA AC
PG MCG BF ND JDG XB. Wrote the paper: MJ EF DA MCG GV
XB.
References
1. Woolhouse MEJ, Gowtage-Sequeria S (2005) Host range and emerging and
reemerging pathogens. Emerg Infect Dis 11: 1842–1847.
2. Luikart G, England PR, Tallmon D, Jordan S, Taberlet P (2003) The power and
promise of population genomics: from genotyping to genome typing. Nat Rev
Genet 4: 981–994.
3. Charlesworth B, Morgan MT, Charlesworth D (1993) The effect of deleterious
mutations on neutral molecular variation. Genetics 134: 1289–1303.
4. Hanage WP, Fraser C, Spratt BG (2006) The impact of homologous
recombination on the generation of diversity in bacteria. J Theor Biol 239:
210–219.
5. Hill W, Robertson A (1966) The effect of linkage on limits to artificial selection.
Genet Res 8: 269–294.
6. Gilligan C, van den Bosch F (2008) Epidemiological models for invasion and
persistence of pathogens. Annu Rev Phytopathol 46: 385–418.
7. Wright S (1931) Evolution in Mendelian populations. Genetics 16: 97–159.
8. Moran P (1958) Random processes in genetics. Math Proc Cambridge Philos
Soc 54: 60. =
9. Volz EM, Koelle K, Bedford T (2013) Viral phylodynamics. PLoS Comput Biol
9: e1002947. =
10. Taberlet P, Fumagalli L, Wust-Saucy A-G, Cosson J-F (1998) Comparative
phylogeography and postglacial colonization routes in Europe. Mol Ecol 7: 453–
464.
11. Haydon DT, Cleaveland S, Taylor LH, Laurenson MK (2002) Identifying
reservoirs of infection: a conceptual and practical challenge. Emerg Infect Dis 8:
1468–1473.
12. Koelle K, Rasmussen DA (2012) Rates of coalescence for common
epidemiological models at equilibrium. J R Soc Interface 9: 997–1007.
13. Maynard Smith J, Smith N, O’Rourke M, Spratt BG (1993) How clonal are
bacteria? Proc Natl Acad Sci U S A 90: 4384–4388.
14. Hudson RR, Kaplan NL (1986) On the divergence of alleles in nested
subsamples from finite populations. Genetics 113: 1057–1076.
15. Balloux F (2010) Demographic influences on bacterial population structure. Bact
Popul Genet Infect Dis: 103–120.
16. Rizzoli A, Hauffe H, Carpi G, Vourc’h G, Neteler M, et al. (2011) Lyme
borreliosis in Europe. Euro Surveill 16: 1–8.
17. Kurtenbach K, Peacey M, Rijpkema SG, Hoodless AN, Nuttall PA, et al. (1998)
Differential transmission of the genospecies of Borrelia burgdorferi sensu lato by
game birds and small rodents in England. Appl Environ Microbiol 64: 1169–
1174.
18. Margos G, Vollmer SA, Cornet M, Garnier M, Fingerle V, et al. (2009) A new
Borrelia species defined by multilocus sequence analysis of housekeeping genes.
Appl Environ Microbiol 75: 5410–5416.
19. Dubska L, Literak I, Kocianova E, Taragelova V, Sychra O (2009) Differential
role of passerine birds in distribution of Borrelia spirochetes, based on data from
ticks collected from birds during the postbreeding migration period in Central
Europe. Appl Environ Microbiol 75: 596–602.
20. Hanincova K, Taragelova V, Koci J, Schafer SM, Hails R, et al. (2003)
Association of Borrelia garinii and B. valaisiana with songbirds in Slovakia. Appl
Environ Microbiol 69: 2825–2830.
21. Taragel’ova V, Koci J, Hanincova K, Kurtenbach K, Derdakova M, et al.
(2008) Blackbirds and song thrushes constitute a key reservoir of Borrelia garinii,
the causative agent of borreliosis in Central Europe. Appl Environ Microbiol 74:
1289–1293.
22. Humair P, Postic D, Wallich R, Gern L (1998) An avian reservoir (Turdus merula)
of the Lyme borreliosis spirochetes. Zentralblatt fur Bakteriol 538: 521–538.
23. Humair PF, Rais O, Gern L (1999) Transmission of Borrelia afzelii from Apodemus
mice and Clethrionomys voles to Ixodes ricinus ticks: differential transmission pattern
and overwintering maintenance. Parasitology 118: 33–42.
24. Hu CM, Humair P-F, Wallich R, Gern L (1997) Apodemus sp. rodents, reservoir
hosts for Borrelia afzelii in an endemic area in Switzerland. Zentralblatt fur
Bakteriol 285: 558–564.
25. Hanincova K, Schafer SM, Etti S, Sewell H-S, Taragelova V, et al. (2003)
Association of Borrelia afzelii with rodents in Europe. Parasitology 126: 11–20.
26. Brisson D, Dykhuizen DE (2006) A modest model explains the distribution and
abundance of Borrelia burgdorferi strains. Am J Trop Med Hyg 74: 615–622.
27. Hanincova K, Kurtenbach K, Diuk-Wasser M, Brei B, Fish D (2006) Epidemic
spread of Lyme borreliosis, northeastern United States. Emerg Infect Dis 12:
604–611.
28. Richter D, Spielman A, Komar N, Matuschka F-R (2000) Competence of
American robins as reservoir hosts for Lyme disease spirochetes. Emerg Infect
Dis 6: 133–138.
29. Margos G, Vollmer SA, Ogden NH, Fish D (2011) Population genetics,
taxonomy, phylogeny and evolution of Borrelia burgdorferi sensu lato. Infect Genet
Evol 11: 1545–1563.
30. Vollmer SA, Bormane A, Dinnis RE, Seelig F, Dobson ADM, et al. (2011) Host
migration impacts on the phylogeography of Lyme borreliosis spirochaete
species in Europe. Environ Microbiol 13: 184–192.
31. Brisson D, Dykhuizen DE, Ostfeld RS (2008) Conspicuous impacts of
inconspicuous hosts on the Lyme disease epidemic. Proc R Soc Biol Sci 275:
227–235.
32. Brisson D, Dykhuizen DE (2004) ospC diversity in Borrelia burgdorferi: different
hosts are different niches. Genetics 168: 713–722.
33. Jacquot M, Bisseux M, Abrial D, Marsot M, Ferquel E, et al. (2014) High-
throughput sequence typing reveals genetic differentiation and host specializa-
tion among populations of the Borrelia burgdorferi species complex. PLoS One 9:
e88581.
34. Brisson D, Drecktrah D, Eggers CH, Samuels DS (2012) Genetics of Borrelia
burgdorferi. Annu Rev Genet 46: 515–536.
35. Mongodin EF, Casjens SR, Bruno JF, Xu Y, Drabek E, et al. (2013) Inter- and
intra-specific pan-genomes of Borrelia burgdorferi sensu lato: genome stability and
adaptive radiation. BMC Genomics 14: 693.
36. Haven J, Vargas LC, Mongodin EF, Xue V, Hernandez Y, et al. (2011)
Pervasive recombination and sympatric genome diversification driven by
frequency-dependent selection in Borrelia burgdorferi, the lyme disease bacterium.
Genetics 189: 951–966.
37. Schutzer SE, Fraser-Liggett CM, Casjens SR, Qiu W-G, Dunn JJ, et al. (2011)
Whole-genome sequences of thirteen isolates of Borrelia burgdorferi. J Bacteriol
193: 1018–1020.
38. Ferquel E, Garnier M, Marie J, Bernede-Bauduin C, Baranton G, et al. (2006)
Prevalence of Borrelia burgdorferi sensu lato and Anaplasmataceae members in Ixodes
ricinus ticks in Alsace, a focus of Lyme borreliosis endemicity in France. Appl
Environ Microbiol.
39. Postic D, Assous MV, Grimont PAD, Baranton G (1994) Diversity of Borrelia
burgdorferi sensu lato evidenced by Restriction Fragment Length Polymorphism of
rrf (5S)-rrl (23S) intergenic spacer amplicons. Int J Syst Bacteriol 44: 743–752.
40. Darling AE, Mau B, Perna NT (2010) progressiveMauve: multiple genome
alignment with gene gain, loss and rearrangement. PLoS One 5: e11147.
41. Edgar RC (2004) MUSCLE: multiple sequence alignment with high accuracy
and high throughput. Nucleic Acids Res 32: 1792–1797.
42. Falush D, Stephens M, Pritchard JK (2003) Inference of population structure
using multilocus genotype data: linked loci and correlated allele frequencies.
Genetics 164: 1567–1587.
43. Wright S (1965) The interpretation of population structure by F-Statistics with
special regard to systems of mating. Evolution (N Y) 19: 395–420.
44. Hudson RR, Boos DD, Kaplan NL (1992) A statistical test for detecting
geographic subdivision. Mol Biol Evol 9: 138–151.
45. Nei M (1973) Analysis of gene diversity in subdivided populations. Proc Natl
Acad Sci U S A 70: 3321–3323.
46. Beaumont M (2005) Adaptation and speciation: what can Fst tell us? Trends
Ecol Evol 20: 435–440.
47. Team R (2011) R: A language and environment for statistical computing:
900051.
48. Lewontin R (1964) The interaction of selection and linkage. Genetics 50: 757–
782.
49. Hedrick PW (1987) Gametic disequilibrium measures: proceed with caution.
Genetics 117: 331–341.
50. Guindon S, Gascuel O (2003) A Simple, fast, and accurate algorithm to estimate
large phylogenies by maximum likelihood. Syst Biol 52: 696–704.
51. Akaike H (1974) A new look at the statistical model identification. Autom
Control IEEE Trans 19: 1974.
52. Paradis E, Claude J, Strimmer K (2004) APE: Analyses of Phylogenetics and
Evolution in R language. Bioinformatics 20: 289–290.
53. Huson DH, Bryant D (2006) Application of phylogenetic networks in
evolutionary studies. Mol Biol Evol 23: 254–267.
54. Bryant D, Moulton V (2004) Neighbor-net: an agglomerative method for the
construction of phylogenetic networks. Mol Biol Evol 21: 255–265.
55. Swofford D (2003) PAUP*: phylogenetic analysis using parsimony, version 4.0
b10: 2003.
56. Tavare S (1986) Some probabilistic and statistical problems in the analysis of
DNA sequences. Lect Math Life Sci 17.
57. Gu X, Fu Y, Li W (1995) Maximum likelihood estimation of the heterogeneity of
substitution rate among nucleotide sites. Mol Biol Evol.
58. Saitou N, Nei M (1987) The neighbor-joining method: a new method for
reconstructing phylogenetic trees. Mol Biol Evol 4: 406–425.
59. Dutheil J, Gaillard S, Bazin E, Glemin S, Ranwez V, et al. (2006) Bio++: a set of
C++ libraries for sequence analysis, phylogenetics, molecular evolution and
population genetics. BMC Bioinformatics 7: 188.
60. Watterson G (1975) On the number of segregating sites in genetical models
without recombination. Theor Popul Biol: 256–276.
Borrelia burgdorferi Population Genomics
PLOS ONE | www.plosone.org 18 April 2014 | Volume 9 | Issue 4 | e94384

61. Tajima F (1983) Evolutionary relationship of DNA sequences in finite
populations. Genetics 105: 437–460.62. Tajima F (1989) Statistical method for testing the neutral mutation hypothesis by
DNA polymorphism. Genetics 123: 585–595.
63. Giombini E, Orsini M, Carrabino D, Tramontano A (2010) An automaticmethod for identifying surface proteins in bacteria: SLEP. BMC Bioinformatics
11: 39.64. Beaumont MA, Zhang W, Balding DJ (2002) Approximate Bayesian
Computation in Population Genetics. Methods 2035: 2025–2035.
65. Kingman J (1982) The coalescent. Stoch Process their Appl 13: 235–248.66. Wiuf C, Hein J (2000) The coalescent with gene conversion. Genetics 155: 451–
462.67. Hudson RR (1990) Gene genealogies and the coalescent process. Oxford Surv
Evol Biol 7: 44.68. Jukes T, Cantor C (1969) Evolution of protein molecules. In: Munro H, editor.
Mammalian Protein metabolism, III. New-York. pp. 21–132.
69. Bertorelle G, Benazzo A, Mona S (2010) ABC as a flexible framework toestimate demography over space and time: some cons, many pros. Mol Ecol 19:
2609–2625.70. Casjens SR, Fraser-Liggett CM, Mongodin EF, Qiu W-G, Dunn JJ, et al. (2011)
Whole genome sequence of an unusual Borrelia burgdorferi sensu lato isolate.
J Bacteriol 193: 1489–1490.71. Schaible U, Kramer M, Museteanu C, Zimmer G, Mossmann H, et al. (1989)
The severe combined immunodeficiency (scid) mouse. A laboratory model forthe analysis of Lyme arthritis and carditis. J Exp Med 170: 1427–1432.
72. Konstantinidis KT, Ramette A, Tiedje JM (2006) The bacterial species
definition in the genomic era. Philos Trans R Soc Lond B Biol Sci 361:
1929–1940.
73. Castillo-Ramırez S, Gonzalez V (2008) Factors affecting the concordance
between orthologous gene trees and species tree in bacteria. BMC Evol Biol 8:
300.
74. Ramamoorthi N, Narasimhan S, Pal U, Bao F, Yang XF, et al. (2005) The Lyme
disease agent exploits a tick protein to infect the mammalian host. Nature 436:
573–577.
75. Onder O, Humphrey PT, McOmber B, Korobova F, Francella N, et al. (2012)
OspC is potent plasminogen receptor on surface of Borrelia burgdorferi. J Biol
Chem 287: 16860–16868.
76. Wilske B, Preac-Mursic V, Jauris S, Hofmann A, Pradel I, et al. (1993)
Immunological and molecular polymorphisms of ospC, an immunodominant
major outer surface protein of Borrelia burgdorferi. Infect Immun 61: 2182–2191.
77. Qiu W-G, Bosler EM, Campbell JR, Ugine GD, Wang I-N, et al. (1997) A
population genetic study of Borrelia burgdorferi sensu stricto from eastern Long
Island, New York, suggested frequency-dependent selection, gene flow and host
adaptation. Hereditas 127: 203–216.
78. Hellgren O, Andersson M, Raberg L (2011) The genetic structure of Borrelia
afzelii varies with geographic but not ecological sampling scale. J Evol Biol 24:
159–167.
Borrelia burgdorferi Population Genomics
PLOS ONE | www.plosone.org 19 April 2014 | Volume 9 | Issue 4 | e94384