Phospholipidome of Candida : Each Species of Candida Has Distinctive Phospholipid Molecular Species
14
Phospholipidome of Candida: Each Species of Candida Has Distinctive Phospholipid Molecular Species Ashutosh Singh, 1 Tulika Prasad, 2 Khyati Kapoor, 1 Ajeet Mandal, 1 Mary Roth, 3 Ruth Welti, 3 and Rajendra Prasad 1 Abstract By employing electrospray ionization tandem mass spectrometry (ESI-MS/MS), the phospholipidomes of eight hemiascomycetous human pathogenic Candida species have been characterized. Over 200 phospholipid mo- lecular species were identified and quantified. There were no large differences among Candida species in phosphoglyceride class composition; however, differences in phosphoglycerides components (i.e., fatty acyl chains) were identified. In contrast, differences in sphingolipid class composition as well as in molecular species were quite evident. The phospholipid compositions of C. albicans, C. glabrata, C. parapsilosis, C. kefyr, C. tropicalis, C. dubliniensis, C. krusei, and C. utilis could be further discriminated by principal component analysis. Not- withstanding that a single strain of each species was analyzed, our data do point to a typical molecular species imprint of Candida strains. Introduction S everal antifungal drugs target enzymes involved in lipid biosynthesis in Candida. Use of these drugs invariably leads to the development of multidrug resistance (MDR) (Prasad and Kapoor, 2005). Membrane lipid metabolism and physical properties appear to be closely linked to MDR in Candida (Mukhopadhyay et al., 2002). For example, changes in membrane lipid phase and asymmetry affect azole resistance (Kohli et al., 2002). Indeed, the drug susceptibility phenotype of Candida appears to result from interplay among drug diffusion, drug extrusion, and the membrane lipid environment (Mukhopadhyay et al., 2004; Pasrija et al., 2005, 2008). Although lipid metabolic pathways are fairly well estab- lished in yeast (Gasper et al., 2007), our knowledge of lipid compositional profile, particularly in Candida species, is rather limited (Mago and Khuller, 1990a, 1990b; Mahmoudabadi et al., 2001; Van et al., 2008). Employing classical analytical methods, Dembitskii and Pechenkina (1991) analyzed phos- pholipid (PL) and fatty-acid (FA) compositions of nine species of fungi, identifying and quantifying major classes of lipids. Phosphatidylcholine (PC) and phosphatidylethanolamine (PE) were found to be the main classes of phosphoglycerides, followed by phosphatidylserine (PS), phosphatidylinositol (PI), phosphatidylglycerol (PG), and cardiolipin (CL). The introduction of high-throughput analyses of PLs, recently performed on nonpathogenic Saccharomyces cerevisiae, is accelerating our ability to analyze yeast lipid metabolism and signaling, and the factors that regulate them (Ejsing et al., 2009; Guan and Wenk, 2006). Lipidomics is a branch of metabolomics that provides a systematic approach to decoding lipid-based information in biosystems (Bleijerveld et al., 2006; Roberts et al., 2008; Watson, 2006; Wenk, 2005). In the present study, eight different Candida species, C. albicans, C. glabrata, C. tropicalis, C. parapsilosis, C. dubliniensis, C. krusei, C. utilis, and C. kefyr, were characterized using profiling based on electrospray ionization (ESI) triple quadrupole mass spectrometry (MS/MS). Nine major phos- phoglyceride classes, PC, PE, PS, PG, PI, phosphatidic acid (PA), lysophosphatidylglycerol (LysoPG), lysophosphatidylethanol- amine (LysoPE), lysophosphatidylcholine (LysoPC), and three major groups of sphingolipids (SL), inositolpho- sphorylceramide (IPC), mannosylphosphatidylinositol (MIPC), and mannosyldiinositolphosphorylceramide (M(IP) 2 C), were analyzed. Employing high-throughput lipid profiling and sta- tistical analyses, we have determined molecular lipid species imprints characteristic of specific Candida species. Materials and Methods Lipid standards Synthetic lipids with FA compositions that are not found or are of very low abundance in Candida were used as internal 1 Membrane Biology Laboratory, School of Life Sciences, Jawaharlal Nehru University, New Delhi, India. 2 Advanced Instrumentation Research Facility, Jawaharlal Nehru University, New Delhi, India. 3 Kansas Lipidomics Research Center, Division of Biology, Ackert Hall, Kansas State University, Manhattan, KS, USA. OMICS A Journal of Integrative Biology Volume 14, Number 6, 2010 ª Mary Ann Liebert, Inc. DOI: 10.1089/omi.2010.0041 665
-
Upload
independent -
Category
Documents
-
view
0 -
download
0
Transcript of Phospholipidome of Candida : Each Species of Candida Has Distinctive Phospholipid Molecular Species
Phospholipidome of Candida: Each Speciesof Candida Has Distinctive Phospholipid Molecular Species
Ashutosh Singh,1 Tulika Prasad,2 Khyati Kapoor,1 Ajeet Mandal,1 Mary Roth,3
Ruth Welti,3 and Rajendra Prasad1
Abstract
By employing electrospray ionization tandem mass spectrometry (ESI-MS/MS), the phospholipidomes of eighthemiascomycetous human pathogenic Candida species have been characterized. Over 200 phospholipid mo-lecular species were identified and quantified. There were no large differences among Candida species inphosphoglyceride class composition; however, differences in phosphoglycerides components (i.e., fatty acylchains) were identified. In contrast, differences in sphingolipid class composition as well as in molecular specieswere quite evident. The phospholipid compositions of C. albicans, C. glabrata, C. parapsilosis, C. kefyr, C. tropicalis,C. dubliniensis, C. krusei, and C. utilis could be further discriminated by principal component analysis. Not-withstanding that a single strain of each species was analyzed, our data do point to a typical molecular speciesimprint of Candida strains.
Introduction
Several antifungal drugs target enzymes involved inlipid biosynthesis in Candida. Use of these drugs invariably
leads to the development of multidrug resistance (MDR)(Prasad and Kapoor, 2005). Membrane lipid metabolismand physical properties appear to be closely linked to MDRin Candida (Mukhopadhyay et al., 2002). For example,changes in membrane lipid phase and asymmetry affect azoleresistance (Kohli et al., 2002). Indeed, the drug susceptibilityphenotype of Candida appears to result from interplayamong drug diffusion, drug extrusion, and the membrane lipidenvironment (Mukhopadhyay et al., 2004; Pasrija et al., 2005,2008).
Although lipid metabolic pathways are fairly well estab-lished in yeast (Gasper et al., 2007), our knowledge of lipidcompositional profile, particularly in Candida species, is ratherlimited (Mago and Khuller, 1990a, 1990b; Mahmoudabadiet al., 2001; Van et al., 2008). Employing classical analyticalmethods, Dembitskii and Pechenkina (1991) analyzed phos-pholipid (PL) and fatty-acid (FA) compositions of nine speciesof fungi, identifying and quantifying major classes of lipids.Phosphatidylcholine (PC) and phosphatidylethanolamine(PE) were found to be the main classes of phosphoglycerides,followed by phosphatidylserine (PS), phosphatidylinositol(PI), phosphatidylglycerol (PG), and cardiolipin (CL). Theintroduction of high-throughput analyses of PLs, recently
performed on nonpathogenic Saccharomyces cerevisiae, isaccelerating our ability to analyze yeast lipid metabolism andsignaling, and the factors that regulate them (Ejsing et al.,2009; Guan and Wenk, 2006).
Lipidomics is a branch of metabolomics that provides asystematic approach to decoding lipid-based information inbiosystems (Bleijerveld et al., 2006; Roberts et al., 2008; Watson,2006; Wenk, 2005). In the present study, eight different Candidaspecies, C. albicans, C. glabrata, C. tropicalis, C. parapsilosis, C.dubliniensis, C. krusei, C. utilis, and C. kefyr, were characterizedusing profiling based on electrospray ionization (ESI) triplequadrupole mass spectrometry (MS/MS). Nine major phos-phoglyceride classes, PC, PE, PS, PG, PI, phosphatidic acid (PA),lysophosphatidylglycerol (LysoPG), lysophosphatidylethanol-amine (LysoPE), lysophosphatidylcholine (LysoPC), andthree major groups of sphingolipids (SL), inositolpho-sphorylceramide (IPC), mannosylphosphatidylinositol (MIPC),and mannosyldiinositolphosphorylceramide (M(IP)2C), wereanalyzed. Employing high-throughput lipid profiling and sta-tistical analyses, we have determined molecular lipid speciesimprints characteristic of specific Candida species.
Materials and Methods
Lipid standards
Synthetic lipids with FA compositions that are not found orare of very low abundance in Candida were used as internal
1Membrane Biology Laboratory, School of Life Sciences, Jawaharlal Nehru University, New Delhi, India.2Advanced Instrumentation Research Facility, Jawaharlal Nehru University, New Delhi, India.3Kansas Lipidomics Research Center, Division of Biology, Ackert Hall, Kansas State University, Manhattan, KS, USA.
OMICS A Journal of Integrative BiologyVolume 14, Number 6, 2010ª Mary Ann Liebert, Inc.DOI: 10.1089/omi.2010.0041
665
standards. Lipid standards were obtained from Avanti PolarLipids (Alabaster, AL, USA).
Strains, media and culture conditions
Candida strains used in this study are listed in Table 1.Candida cells were kept on YPD plates and inoculated in YPDmedium (1% yeast extract, 2% glucose, and 2% bactopeptone).The cells were diluted into 50 mL fresh medium at 0.1 OD(*106 cells/mL) at A600 and grown for 14 h until the cellsreached exponential growth (*2�108 cells/mL). Three sep-arate cultures of each Candida strain were used.
Lipid extraction
Lipids were extracted from Candida cells using an earlierdescribed method with slight modification (Bligh and Dyer,1959). Briefly, the Candida cells were harvested at exponentialphase and were suspended in 10 mL methanol. Glass beads(4 g) (Glaperlon 0.40–0.60 mm) were added and the suspen-sion was shaken in a cell disintegrator (B. Braun, Melsungen,Germany) four times for 30 s with a gap of 30 s between eachshaking. Approximately 20 mL chloroform were added to thesuspension to give a ratio of 2:1 of chloroform:methanol (v/v).The suspension was stirred on a flat-bed stirrer at roomtemperature for 2 h. The suspension was filtered throughWhatman No. 1 filter paper, and the extract was transferred toa separatory funnel and washed with 0.2 volumes of 0.9%NaCl to remove the nonlipid contaminants. The aqueouslayer was aspirated and the solvent of the lipid-containing,lower organic layer was evaporated under N2; the lipids werestored at �808C until analysis.
ESI-MS/MS lipid profiling
Phosphoglyceride quantification. An automated ESI-MS/MS approach was used. Data acquisition and analysiswere carried out as described previously with minor modifi-cations (Devaiah et al., 2006). The extracted dry lipid sampleswere dissolved in 1 mL chloroform (Devaiah et al., 2006). Analiquot of 2 to 8mL of extract in chloroform was analyzed, withthe exact amount depending upon the dry lipid weight of eachsample. Previously described precise amounts of internalstandards, obtained and quantified (Welti et al., 2002), wereadded in the following quantities (with some small variationin amounts in different batches of internal standards):0.6 nmol di12:0-PC, 0.6 nmol di24:1-PC, 0.6 nmol 13:0-LysoPC, 0.6 nmol 19:0-LysoPC, 0.3 nmol di12:0-PE, 0.3 nmoldi23:0-PE, 0.3 nmol 14:0-LysoPE, 0.3 nmol 18:0-LysoPE,
0.3 nmol di14:0-PG, 0.3 nmol di20:0(phytanoyl)-PG, 0.3 nmol14:0-LysoPG, 0.3 nmol 18:0-LysoPG, 0.3 nmol di14:0-PA,0.3 nmol di20:0(phytanoyl)-PA, 0.2 nmol di14:0-PS, 0.2 nmoldi20:0(phytanoyl)-PS, 0.23 nmol 16:0-18:0-PI, and 0.16 nmoldi18:0-PI. The sample and internal standard mixture wascombined with solvents, such that the ratio of chloroform/methanol/300 mM ammonium acetate in water was 300/665/35 (v/v/v) in a final volume of 1.4 mL. Each phos-phoglyceride class was quantified in comparison to the twointernal standards of that class.
Unfractionated lipid extracts were directly introduced bycontinuous infusion into the ESI source on a triple quadrupoleMS (API 4000, Applied Biosystems, Foster City, CA, USA).Samples were introduced using an autosampler (LC MiniPAL, CTC Analytics AG, Zwingen, Switzerland) fitted withthe required injection loop for the acquisition time and passedto the ESI needle at 30 mL/min.
Sequential precursor (Pre) and neutral loss (NL) scans ofthe extracts produce a series of spectra revealing a set of lipidspecies containing a common head group fragment. Lipidspecies were detected with the following scans: PC and Ly-soPC, [MþH]þ ions in positive ion mode with Pre 184.1; PEand LysoPE, [MþH]þ ions in positive ion mode with NL141.0; PA, [MþNH4]þ in positive ion mode with NL 115.0;PG, [MþNH4]þ in positive ion mode with NL 189.0; PI,[MþNH4]þ in positive ion mode with NL 277.0; PS, [MþH]þ
in positive ion mode with NL 185.0; LysoPG, [M – H]� innegative mode with Pre 152.9. The collision gas pressure wasset at 2 [arbitrary units (au)]. The collision energies, with ni-trogen in the collision cell, were þ40 V for PC, þ28 V for PE,þ25 V for PA, þ22 V for PG, PI, and PS, and �57 V for Ly-soPG. Declustering potentials were þ100 V for PC, PE, PA,PG, PI, and PS, and �100 V for LysoPG. Entrance potentialswere þ14 V for PC, PA, PG, PI, and PS, þ15 V for PE, and�10 V for LysoPG. Exit potentials wereþ14 V for PC, PA, PG,PI, and PS, þ11 V for PE, and �14 V for LysoPG. The massanalyzers were adjusted to a resolution of 0.7 U full width athalf height. For each spectrum, 9 to 150 continuum scans wereaveraged in multiple channel analyzer (MCA) mode. Thesource temperature (heated nebulizer) was 1008C, the inter-face heater was ‘‘on,’’ and þ5.5 kV or �4.5 kV were applied tothe electrospray capillary. The curtain gas was set at 20 au,and the two ion source gases were set at 45 au.
Processing of the data, including isotope deconvolution,was similar to that described earlier (Devaiah et al., 2006;Welti et al., 2002). The background of each spectrum wassubtracted, the data were smoothed, and peak areas inte-grated using a custom script and Applied Biosystems Analyst
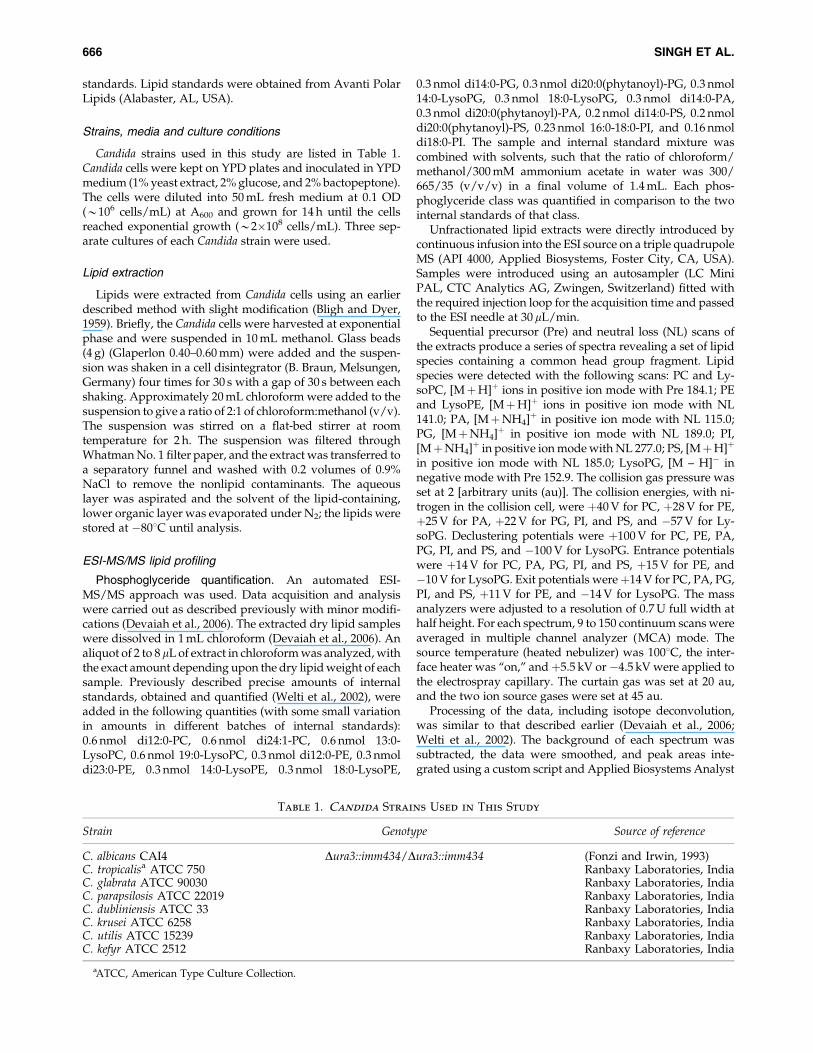
Table 1. Candida Strains Used in This Study
Strain Genotype Source of reference
C. albicans CAI4 Dura3::imm434/Dura3::imm434 (Fonzi and Irwin, 1993)C. tropicalisa ATCC 750 Ranbaxy Laboratories, IndiaC. glabrata ATCC 90030 Ranbaxy Laboratories, IndiaC. parapsilosis ATCC 22019 Ranbaxy Laboratories, IndiaC. dubliniensis ATCC 33 Ranbaxy Laboratories, IndiaC. krusei ATCC 6258 Ranbaxy Laboratories, IndiaC. utilis ATCC 15239 Ranbaxy Laboratories, IndiaC. kefyr ATCC 2512 Ranbaxy Laboratories, India
aATCC, American Type Culture Collection.
666 SINGH ET AL.
software. The lipids in each class were quantified in com-parison to the two internal standards of that class. The firstand typically every 11th set of mass spectra were acquired onthe internal standard mixture only. Peaks corresponding tothe target lipids in these spectra were identified and molaramounts calculated in comparison to the internal standards ofthe same lipid class. To correct for chemical or instrumentalnoise in the samples, the molar amount of each lipid metab-olite detected in the ‘‘internal standards only’’ spectra wassubtracted from the molar amount of each metabolite calcu-lated in each set of sample spectra. The data from each ‘‘in-ternal standards only’’ set of spectra were used to correct thedata from the following 10 samples. The analyzed data (innmol) were normalized to the sample’s ‘‘dry lipid weight’’ toproduce data in the units nmol/mg dry lipid weight. Finally,the data were expressed as mole percent of total lipid ana-lyzed.
Sphingolipid quantification. The ESI-MS/MS procedurefor SL quantification was similar to that for phosphoglyceridequantification. Lipid species were detected with the followingscans: IPC, [M�H]� ions in negative ion mode with Pre 259;MIPC, [M�H]� ions in negative ion mode with Pre 421;M(IP)2C, [M�H]� in negative mode with Pre 663.1. The in-ternal standard, 16:0–18:1-PI, was detected with [MþNH4]þ
in positive ion mode with NL 277.0, as described in the pre-vious section. The collision gas pressure was set at 2 au. Thecollision energies, with nitrogen in the collision cell, were�72 V for IPC, �80 V for MIPC, and �75 V for M(IP)2C. Thedeclustering potential was �180 V for IPC, MIPC, andM(IP)2C. The entrance potential was �15 V for IPC, MIPC,and M(IP)2C. The exit potential was�10 V for IPC, MIPC, andM(IP)2C. The mass analyzers were adjusted to a resolution of0.7 U full width at half height. For each spectrum, 125 to 250continuum scans were averaged in multiple channel analyzer(MCA) mode. The source temperature (heated nebulizer) was1008C, the interface heater was ‘‘on,’’ and þ5.5 kV or �4.5 kVwere applied to the electrospray capillary. The curtain gaswas set at 20 au, and the two ion source gases were set at45 au. The rest of the processing was similar to that forphosphoglycerides; however, all SL signals were normalizedto the signal for 0.23 nmol 16:0–18:0-PI that was added in as aninternal standard.
SL amounts were determined by normalizing the massspectral signal so that a signal of 1.0 represents a signal equalto the signal of 1 nmol 16:0–18:0-PI (the internal standard).These data were then divided by the sample dry lipid weightto obtain signal/dry lipid weight, by the total SL signal toobtain % of total SL signal, or by the total phosphoglycer-ideþ SL signal to obtain % of total phosphoglycerideþ SLsignal. It is possible that there is variation in ionization effi-ciency among various SLs and between the internal standardand SL species. Thus, normalized SL species amounts may notreflect their molar amounts. However, the employed proce-dure allows for determination of relative abundance of SLsand comparison of amounts of particular SLs among samples.
Statistical analysis
The mean of three independent biological repli-cates� standard deviation (SD) from the individual sampleswas used to compare the lipids of Candida species. Multi-
variate data analysis (pattern recognition) was employed.Principal component analysis (PCA) was performed using thesoftware SYSTAT, version 10 (Systat Software Inc., Rich-mond, CA, USA) using three replicates of each of the eightCandida species to highlight the statistically significant lipiddifferences. To assess the statistical significance of the differ-ence in PC scores, the Student t-test was performed using thesignificance level of 0.05. Hierarchical cluster analysis wasalso performed using SYSTAT, version 10. When all the val-ues for a particular lipid species were zero in all samples, thedata for that lipid species were removed from the analysis.The data in percentage were log-transformed and normalizedto the same scale for PCA and hierarchical cluster analysis.
Results
Candida species have nine major phosphoglycerides
To evaluate lipid composition, we performed quantitativecompositional analysis of each Candida species. As describedin Materials and Methods, C. albicans, C. glabrata, C. para-psilosis, C. kefyr, C. tropicalis, C. dubliniensis, C. krusei, andC. utilis cells were harvested in the exponential growth phaseand their total lipids were extracted (Bligh and Dyer, 1959).The extracted lipids were subjected to ESI-MS/MS by directinfusion of the lipid extracts. The total PLs (phosphoglycer-ides and SLs) were quantified and PL content was found torange between 731 to 932 nmol per mg dry lipid weight in theCandida species analyzed (Supplementary Table 1).
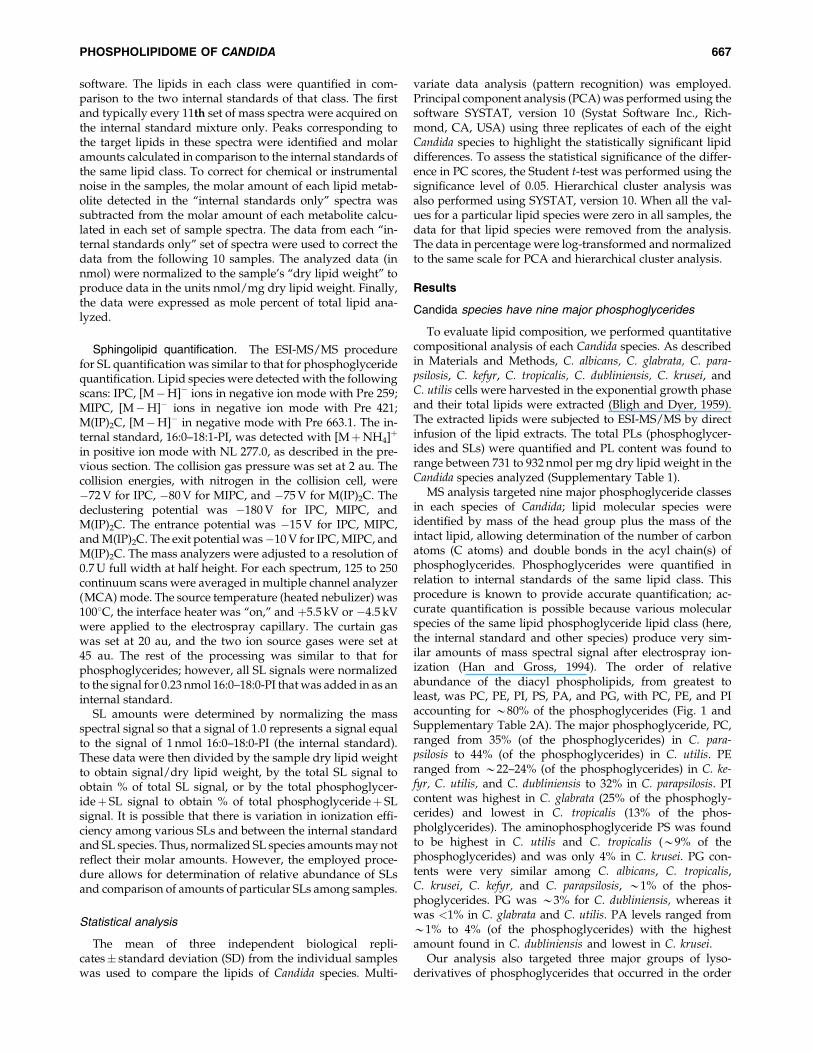
MS analysis targeted nine major phosphoglyceride classesin each species of Candida; lipid molecular species wereidentified by mass of the head group plus the mass of theintact lipid, allowing determination of the number of carbonatoms (C atoms) and double bonds in the acyl chain(s) ofphosphoglycerides. Phosphoglycerides were quantified inrelation to internal standards of the same lipid class. Thisprocedure is known to provide accurate quantification; ac-curate quantification is possible because various molecularspecies of the same lipid phosphoglyceride lipid class (here,the internal standard and other species) produce very sim-ilar amounts of mass spectral signal after electrospray ion-ization (Han and Gross, 1994). The order of relativeabundance of the diacyl phospholipids, from greatest toleast, was PC, PE, PI, PS, PA, and PG, with PC, PE, and PIaccounting for *80% of the phosphoglycerides (Fig. 1 andSupplementary Table 2A). The major phosphoglyceride, PC,ranged from 35% (of the phosphoglycerides) in C. para-psilosis to 44% (of the phosphoglycerides) in C. utilis. PEranged from *22–24% (of the phosphoglycerides) in C. ke-fyr, C. utilis, and C. dubliniensis to 32% in C. parapsilosis. PIcontent was highest in C. glabrata (25% of the phosphogly-cerides) and lowest in C. tropicalis (13% of the phos-pholglycerides). The aminophosphoglyceride PS was foundto be highest in C. utilis and C. tropicalis (*9% of thephosphoglycerides) and was only 4% in C. krusei. PG con-tents were very similar among C. albicans, C. tropicalis,C. krusei, C. kefyr, and C. parapsilosis, *1% of the phos-phoglycerides. PG was *3% for C. dubliniensis, whereas itwas <1% in C. glabrata and C. utilis. PA levels ranged from*1% to 4% (of the phosphoglycerides) with the highestamount found in C. dubliniensis and lowest in C. krusei.
Our analysis also targeted three major groups of lyso-derivatives of phosphoglycerides that occurred in the order
PHOSPHOLIPIDOME OF CANDIDA 667
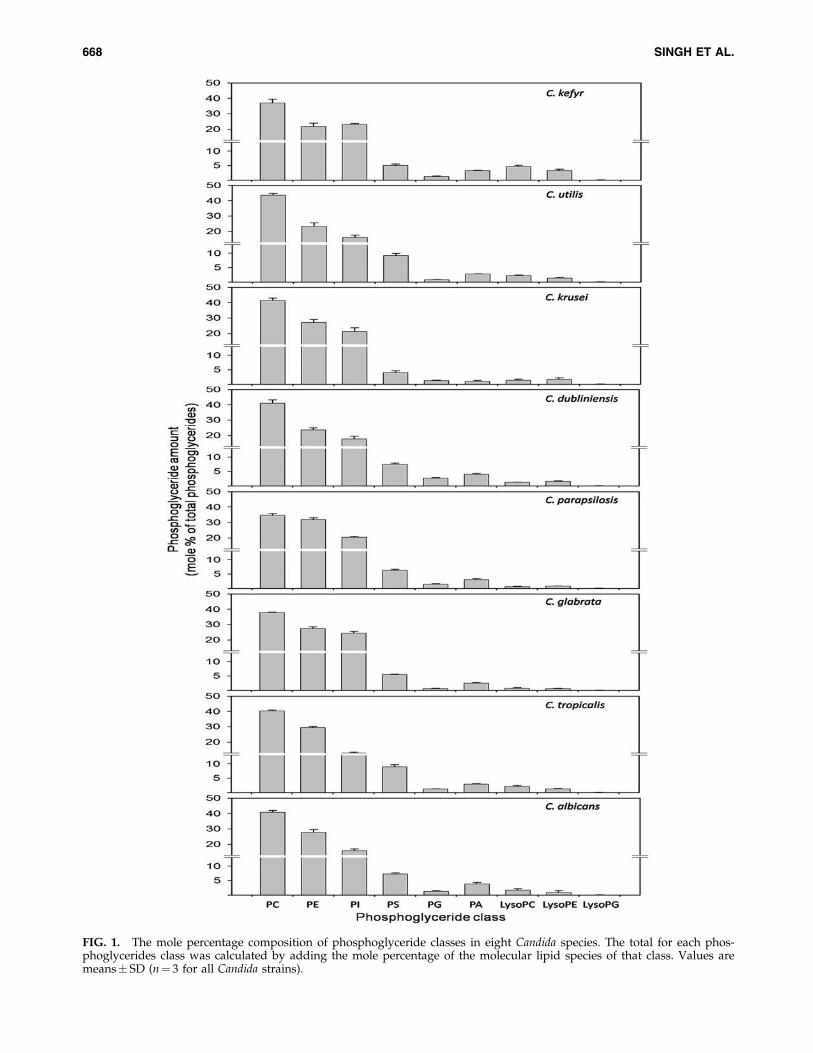
FIG. 1. The mole percentage composition of phosphoglyceride classes in eight Candida species. The total for each phos-phoglycerides class was calculated by adding the mole percentage of the molecular lipid species of that class. Values aremeans� SD (n¼ 3 for all Candida strains).
668 SINGH ET AL.
LysoPC>LysoPE>LysoPG. LysoPC was found to be highestin C. kefyr (*5% of the phosphoglycerides) and was lowest inC. parapsilosis and C. glabrata (*0.7% of the phosphoglycer-ides). LysoPE was less abundant and varied between *0.6%and 3% (of the phosphoglycerides). The least abundant lyso-phosphoglyceride was LysoPG in all Candida species (Fig. 1and Supplementary Table 2).
Analysis of three major sphingolipids
Using MS analysis, we targeted three major groups of SLs,IPC, MIPC, and M(IP)2C, and determined the relativeamounts of these lipids. The mass spectral signals of the SLswere normalized to those of a phosphoglyceride internalstandard, 16:0–18:0-PI. (use of this internal standard wasnecessary because standard compounds of each yeastsphingolipid class are not available). The SLs accounted for*2 to 13% of the total PL mass spectral signal (Fig. 2 andSupplementary Tables 1 and 2B). In C. tropicalis and C. al-
bicans, total SL levels were several-fold higher than in theother Candida species. To evaluate the differences betweenSLs of Candida species, we calculated mole percentage ofeach class based on total SL normalized mass spectral signal.As is evident from Figure 2B, there were variations in therelative abundance of the SL classes between different Can-dida species. IPCs were detected in all Candida species butwere particularly high in C. kefyr and C. parapsilosis (*84and 96% of total normalized SL mass spectral signal, re-spectively) and were lowest in C. glabrata and C. albicans(*31 and 32% of total normalized SL mass spectral signal,respectively). For the rest of Candida species IPCs variedbetween *48 and 68%. MIPC ranged from *29 to 69% oftotal normalized SL mass spectral signal, except in C. para-psilosis and C. kefyr, where it was between *2 and 7%, re-spectively. M(IP)2C produced less than 4% of the massspectral signal in most of the species (lowest in C. glabrata)except for C. kefyr where it was 9%. M(IP)2C was not de-tected in C. krusei.
FIG. 2. (A) Shows the relative abundance of SLs as mass spectral signal (% of total signal for phosphoglyceridesþ SL afternormalization to internal standards) in eight Candida species. (B) Shows the relative abundance of SL groups as molepercentage of the normalized total SL mass spectral signal. The total for each SL group was calculated by adding thenormalized mass spectral signal of molecular lipid species of that group. Data in tabular form can be found in the Sup-plementary Table 2. Values are means� SD (n¼ 3 for all Candida strains).
PHOSPHOLIPIDOME OF CANDIDA 669
Lipid molecular species
Our analyses thus determined nine phosphoglyceridesand three major SLs. These PLs could be further differenti-ated based on differences in their composition and thedegree of unsaturation of their FAs. Lipid profiling by ESI-MS/MS generated data in the form of ‘‘number of acylcarbons: number of acyl carbon-carbon double bonds.’’ Thenumbers of detected phosphoglyceride species for Candidawere 35, 44, 29, 32, 15, 12, 19, 11, and 6 for PC, PE, PI, PS,PA, LysoPC, PG, LysoPE, and LysoPG, respectively. No-tably, PC, which was most abundant on mole percentagebasis (Fig. 1), had fewer detectable molecular species (35species) compared to PE (44 species). To highlight the dis-tribution of molecular species of PL groups, the mole per-centage of major molecular species (those with> 0.01% oftotal normalized mass spectral signal) are depicted in Fig-ures 3 and 4. The composition of all lipid molecular speciesis shown in Supplementary Tables 3 and 4.
The PC molecular species included diacyl species with 26 to40 acyl carbons. These PC species had mono- or di- un-saturation in the lower carbon number PCs, and poly-unsaturation was observed for PCs with 34 or more C atoms.Out of 26 major PC species illustrated in Figure 3, PC 34:2, PC34:3, PC 36:3, and PC 36:4 are the major lipid species inC. albicans, C. tropicalis, C. dubliniensis, C. krusei, and C. kefyr.Other Candida species showed some variations. For example,C. parapsilosis had PC 34:3 and PC 36:4 in low abundance,whereas the amounts of less unsaturated PC species such asPC 34:1, PC 36:1, and PC 36:2, were higher. C. utilis had loweramounts of PC 34:3 compared to PC 34:1. C. glabrata, on theother hand, had only three major PC species: PC 32:2, PC 34:2,and PC 36:2.
The molecular species of PE contained 26 to 44 C atomswith polyunsaturation in the 34, 36, and 40 C atom diacylspecies. Among the 27 major PE species, PE 34:1, PE 34:2, PE34:3, PE 36:2, and PE 36:3 were present in most of the Candidaspecies, but in C. glabrata, PE 34:2, PE 32:2, and PE 36:2 werethe major PE species (Fig. 3). PI (29 species) included molec-ular species with 26 to 38 C atoms with polyunsaturationobserved only in PIs with 34 and 36 acyl carbons. All Candidaspecies have PI 34:1 and PI 34:2 as the major PI species.C. glabrata and C. parapsilosis are rich in PI 36:1 and PI 36:2species. PS molecular species (32 species) contained 30 to 42 Catoms with PS 34:1 and PS 34:2 being the major PS species inall Candida species (Fig. 3). PG molecular species (19 species)contained 30 to 38 C atoms with PG 34:1 and PG 34:2 being themajor PG species in all Candida species. C. parapsilosis andC. krusei were rich in PG 36:2 and PG 36:4, respectively. PAmolecular species (15 species) contained 32 to 36 C atoms withPA 34:1, PA 34:2, PA36:2, and PA36:3 being the major PAspecies in all Candida species (Fig. 4).
Among the lysophosphoglycerides analyzed (Fig. 5), Ly-soPC was the most abundant. Twelve species of LysoPC with14, 15, 16, 17, and 18 acyl C atoms were quantified. LysoPC16:1, LysoPC 18:1, LysoPC 18:2, and LysoPC 18:3 are themajor LysoPCs amongst Candida species (Fig. 5). Eleven mo-lecular species of LysoPE were detected with LysoPE 16:0,LysoPE 16:1, LysoPE 18:0, and LysoPE 18:1 as the major ly-sophosphoglycerides measured in Candida species. Six mo-lecular LysoPG species containing 16 and 18 acyl C atomswere analyzed, but these were present in very low amounts.
Using SL profiling by ESI-MS/MS as discussed in Materialsand Methods, we determined 21 molecular SL species of IPC(9 species), MIPC (8 species), and M(IP)2C (4 species) (Fig. 5).SL molecular species are represented as ‘‘total number ofcarbons in the sphingoid base and acyl chains: total number ofcarbon–carbon double bonds in the sphingoid base and acylchains; number of hydroxyl groups present in the sphingoidbase and acyl chains.’’ Nine IPC species were analyzed for allCandida species. IPC species 50:0;3 (m/z of [M – H]�¼ 924.6 U)and 52:0;3 (952.6 U) were the major IPCs except in C. krusei,C. utilis, and C. kefyr where IPC 52:0;4 (968.6 U) was abundant.IPC 52:0;3 (952.6 U) was highest in C. utilis and C. kefyr (*55%of total SL signal). Eight MIPC species were detected as[M�H]� for all Candida species. MIPC species 56:0;3(1086.6 U) and 58:0;3 (1114.7 U) were the major MIPCs inCandida except in C. krusei, C. utilis, and C. kefyr, where MIPC58:0;4 (1130.7 U) was abundant. MIPC 58:0;3 (1114.7 U) was invery high amount in C. glabrata (>61% of total SL signal). FourM(IP)2C molecular species were analyzed for all Candidaspecies. M(IP)2C was not detected in C. krusei. M(IP)2C species62:0;3 (1329.0 U) and 64:0;3 (1357.0 U) were the major speciesin Candida except in C. utilis and C. glabrata where M(IP)2C62:0;3 (1329 U) was not detected. The importance of theselipidomic differences in differentiating among the Candidaspecies was further confirmed by principal componentanalysis.
Principal component analysis (PCA) of lipid speciesquantitative data distinctly separates differentCandida species
PCA is a mathematical algorithm that reduces the dimen-sionality of the data while retaining most of the variation inthe data set (Ringner, 2008). The data are represented byprincipal components, with the first principal componentaccounting for the maximum possible variation in the data,and each succeeding component accounting for a portion ofthe remaining possible variation. Plots allow visual assess-ment of the similarities and differences among samples andhelp to determine whether and how samples can be grouped(Devaiah et al., 2006; Ferreira et al., 2010). We performed PCAusing the molecular species percentage composition ofphosphoglycerideþ SL molecular species (data in Supple-mentary Table 4) to identify and highlight the Candidaspecies–specific, statistically significant lipid differences.Analysis allowed the extraction of 21 principal components.The scores of the first three principal components, explaining52.8% of the total variance, were plotted. Principal compo-nents 1, 2, and 3 explained 22.2, 16.9, and 13.7% of the totalvariance, respectively.
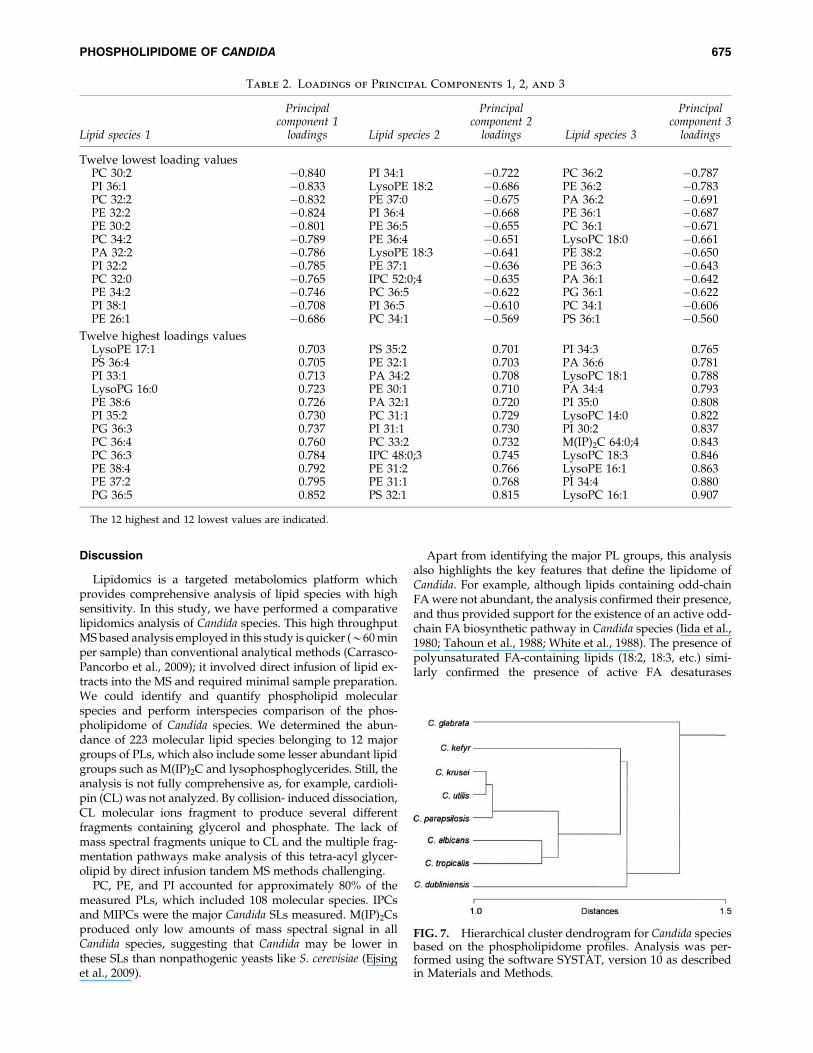
As shown in the plot of principal component 1 versus 2(Fig. 6A), principal component 1 describes the separation ofC. glabrata from the other species, particularly from C. krusei,C. dubliniensis, and C. tropicalis. The highest and lowestloading values reflect the lipid species that are most importantin the assignment of each principal component (Table 2). Ex-amination of the loadings associated with principal compo-nent 1 (Table 2) shows that the content of 30, 32, and 34 carbonphosphoglycerides with two double bonds (PCs 30:2, 32:2,and 34:2, PEs 30:2, 32:2, and 34:2, PA 32:2, and PI 32:2) isimportant for the separation of Candida species along theprincipal component 1 axis. In fact, each of the molecular
670 SINGH ET AL.
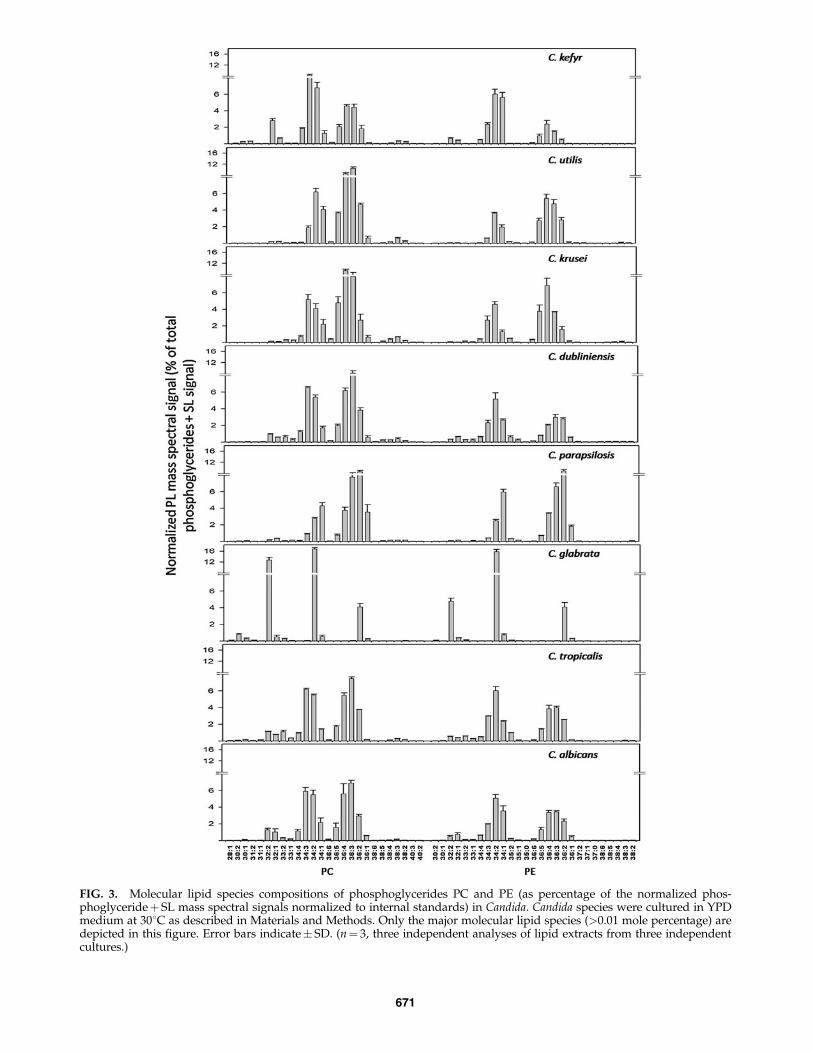
FIG. 3. Molecular lipid species compositions of phosphoglycerides PC and PE (as percentage of the normalized phos-phoglycerideþ SL mass spectral signals normalized to internal standards) in Candida. Candida species were cultured in YPDmedium at 308C as described in Materials and Methods. Only the major molecular lipid species (>0.01 mole percentage) aredepicted in this figure. Error bars indicate� SD. (n¼ 3, three independent analyses of lipid extracts from three independentcultures.)
671
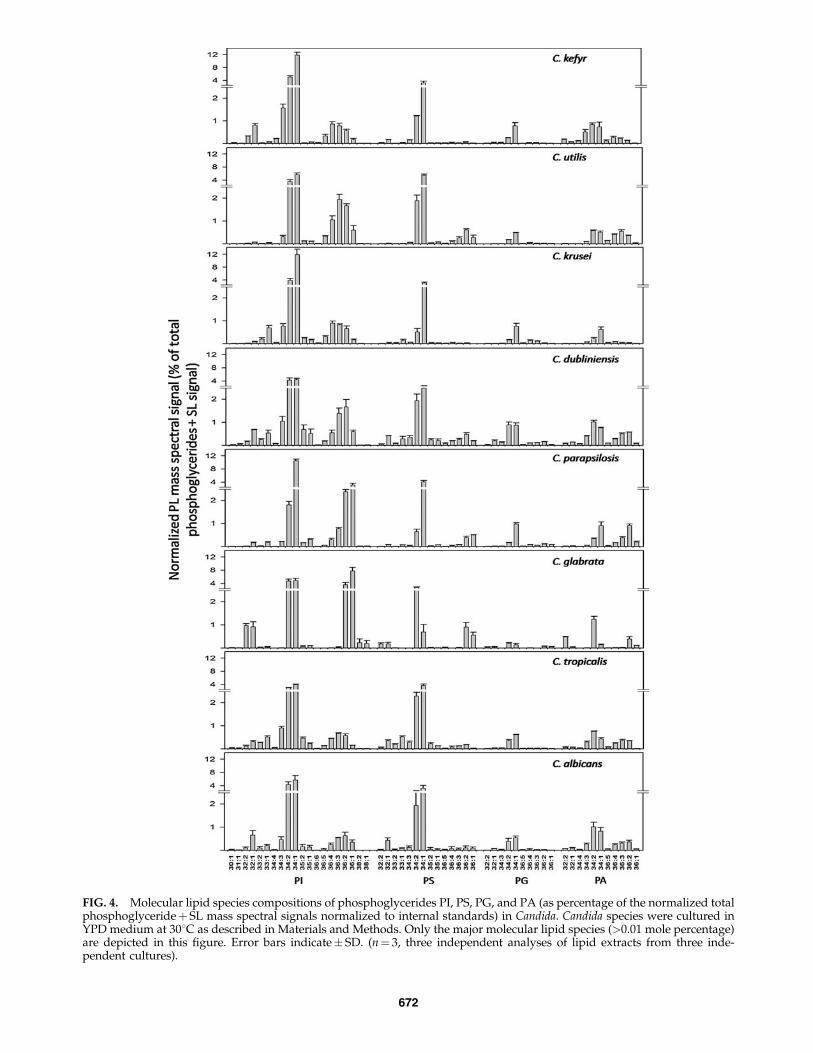
FIG. 4. Molecular lipid species compositions of phosphoglycerides PI, PS, PG, and PA (as percentage of the normalized totalphosphoglycerideþ SL mass spectral signals normalized to internal standards) in Candida. Candida species were cultured inYPD medium at 308C as described in Materials and Methods. Only the major molecular lipid species (>0.01 mole percentage)are depicted in this figure. Error bars indicate� SD. (n¼ 3, three independent analyses of lipid extracts from three inde-pendent cultures).
672
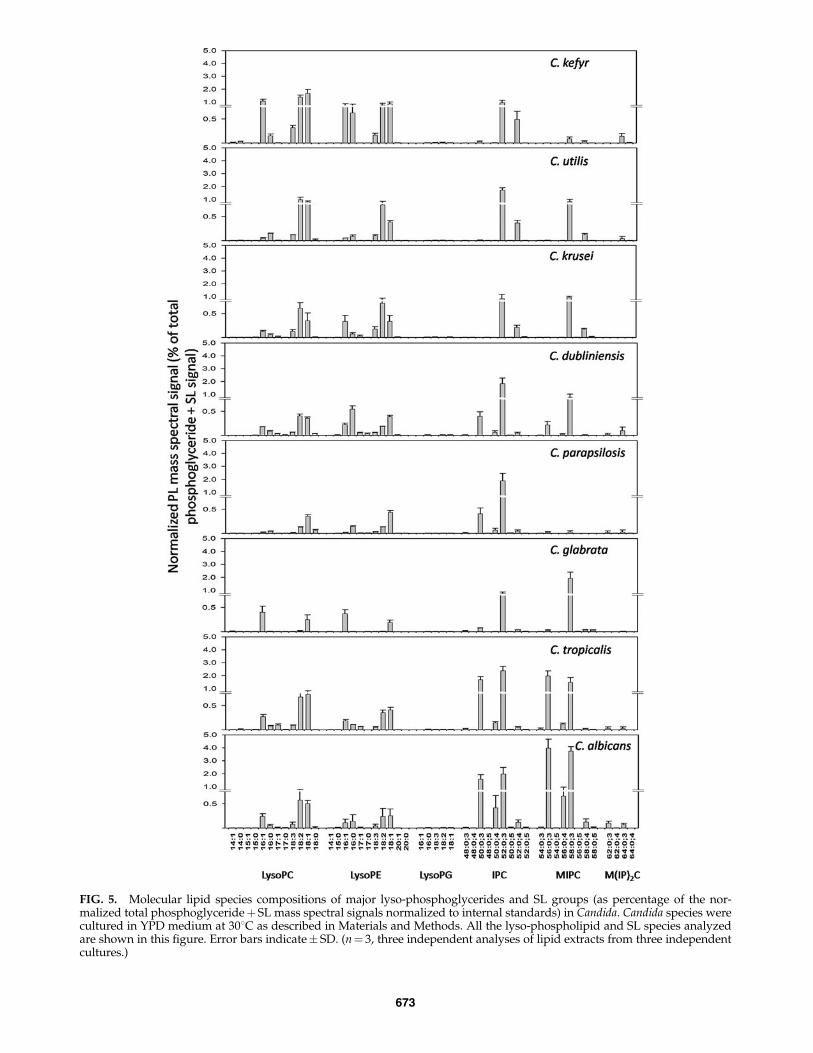
FIG. 5. Molecular lipid species compositions of major lyso-phosphoglycerides and SL groups (as percentage of the nor-malized total phosphoglycerideþ SL mass spectral signals normalized to internal standards) in Candida. Candida species werecultured in YPD medium at 308C as described in Materials and Methods. All the lyso-phospholipid and SL species analyzedare shown in this figure. Error bars indicate� SD. (n¼ 3, three independent analyses of lipid extracts from three independentcultures.)
673
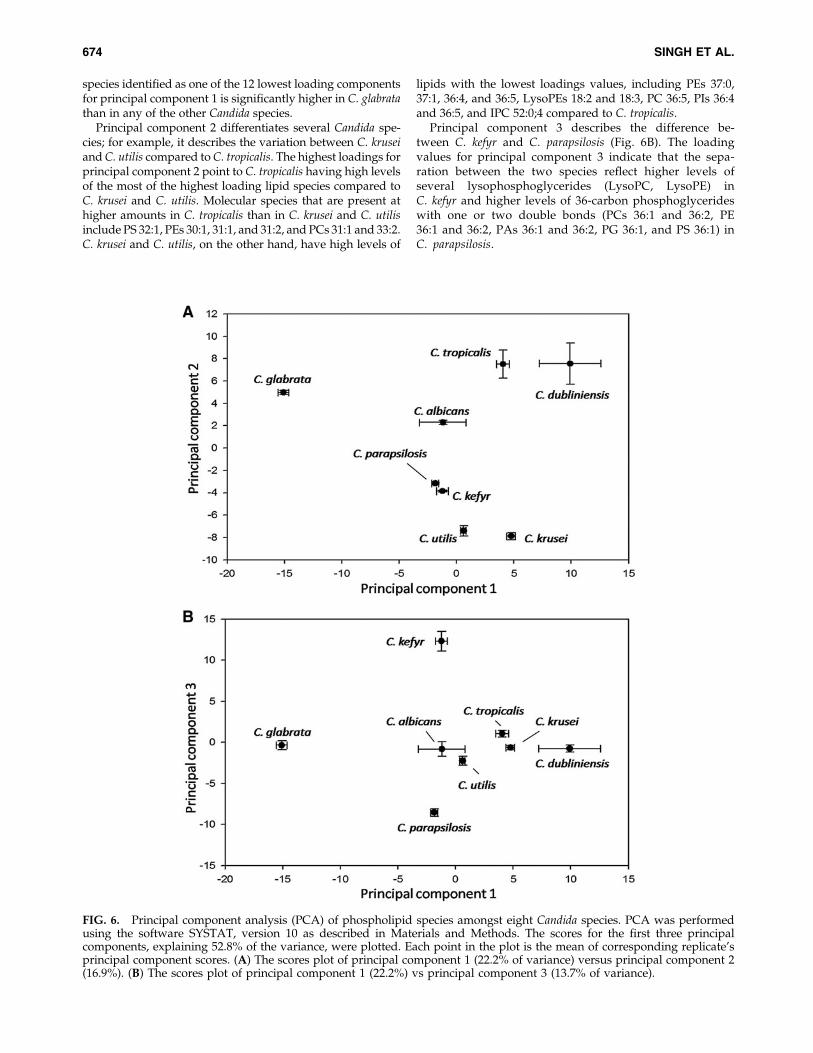
species identified as one of the 12 lowest loading componentsfor principal component 1 is significantly higher in C. glabratathan in any of the other Candida species.
Principal component 2 differentiates several Candida spe-cies; for example, it describes the variation between C. kruseiand C. utilis compared to C. tropicalis. The highest loadings forprincipal component 2 point to C. tropicalis having high levelsof the most of the highest loading lipid species compared toC. krusei and C. utilis. Molecular species that are present athigher amounts in C. tropicalis than in C. krusei and C. utilisinclude PS 32:1, PEs 30:1, 31:1, and 31:2, and PCs 31:1 and 33:2.C. krusei and C. utilis, on the other hand, have high levels of
lipids with the lowest loadings values, including PEs 37:0,37:1, 36:4, and 36:5, LysoPEs 18:2 and 18:3, PC 36:5, PIs 36:4and 36:5, and IPC 52:0;4 compared to C. tropicalis.
Principal component 3 describes the difference be-tween C. kefyr and C. parapsilosis (Fig. 6B). The loadingvalues for principal component 3 indicate that the sepa-ration between the two species reflect higher levels ofseveral lysophosphoglycerides (LysoPC, LysoPE) inC. kefyr and higher levels of 36-carbon phosphoglycerideswith one or two double bonds (PCs 36:1 and 36:2, PE36:1 and 36:2, PAs 36:1 and 36:2, PG 36:1, and PS 36:1) inC. parapsilosis.
FIG. 6. Principal component analysis (PCA) of phospholipid species amongst eight Candida species. PCA was performedusing the software SYSTAT, version 10 as described in Materials and Methods. The scores for the first three principalcomponents, explaining 52.8% of the variance, were plotted. Each point in the plot is the mean of corresponding replicate’sprincipal component scores. (A) The scores plot of principal component 1 (22.2% of variance) versus principal component 2(16.9%). (B) The scores plot of principal component 1 (22.2%) vs principal component 3 (13.7% of variance).
674 SINGH ET AL.
Discussion
Lipidomics is a targeted metabolomics platform whichprovides comprehensive analysis of lipid species with highsensitivity. In this study, we have performed a comparativelipidomics analysis of Candida species. This high throughputMS based analysis employed in this study is quicker (*60 minper sample) than conventional analytical methods (Carrasco-Pancorbo et al., 2009); it involved direct infusion of lipid ex-tracts into the MS and required minimal sample preparation.We could identify and quantify phospholipid molecularspecies and perform interspecies comparison of the phos-pholipidome of Candida species. We determined the abun-dance of 223 molecular lipid species belonging to 12 majorgroups of PLs, which also include some lesser abundant lipidgroups such as M(IP)2C and lysophosphoglycerides. Still, theanalysis is not fully comprehensive as, for example, cardioli-pin (CL) was not analyzed. By collision- induced dissociation,CL molecular ions fragment to produce several differentfragments containing glycerol and phosphate. The lack ofmass spectral fragments unique to CL and the multiple frag-mentation pathways make analysis of this tetra-acyl glycer-olipid by direct infusion tandem MS methods challenging.
PC, PE, and PI accounted for approximately 80% of themeasured PLs, which included 108 molecular species. IPCsand MIPCs were the major Candida SLs measured. M(IP)2Csproduced only low amounts of mass spectral signal in allCandida species, suggesting that Candida may be lower inthese SLs than nonpathogenic yeasts like S. cerevisiae (Ejsinget al., 2009).
Apart from identifying the major PL groups, this analysisalso highlights the key features that define the lipidome ofCandida. For example, although lipids containing odd-chainFA were not abundant, the analysis confirmed their presence,and thus provided support for the existence of an active odd-chain FA biosynthetic pathway in Candida species (Iida et al.,1980; Tahoun et al., 1988; White et al., 1988). The presence ofpolyunsaturated FA-containing lipids (18:2, 18:3, etc.) simi-larly confirmed the presence of active FA desaturases
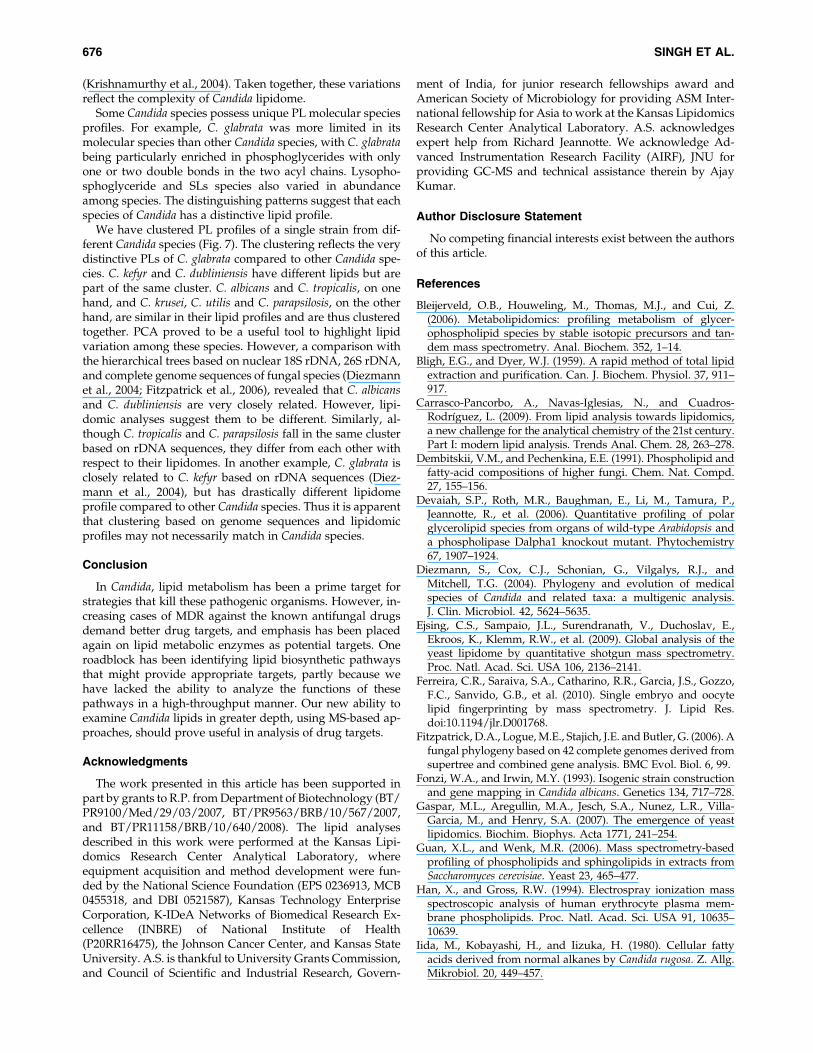
FIG. 7. Hierarchical cluster dendrogram for Candida speciesbased on the phospholipidome profiles. Analysis was per-formed using the software SYSTAT, version 10 as describedin Materials and Methods.
Table 2. Loadings of Principal Components 1, 2, and 3
Lipid species 1
Principalcomponent 1
loadings Lipid species 2
Principalcomponent 2
loadings Lipid species 3
Principalcomponent 3
loadings
Twelve lowest loading valuesPC 30:2 �0.840 PI 34:1 �0.722 PC 36:2 �0.787PI 36:1 �0.833 LysoPE 18:2 �0.686 PE 36:2 �0.783PC 32:2 �0.832 PE 37:0 �0.675 PA 36:2 �0.691PE 32:2 �0.824 PI 36:4 �0.668 PE 36:1 �0.687PE 30:2 �0.801 PE 36:5 �0.655 PC 36:1 �0.671PC 34:2 �0.789 PE 36:4 �0.651 LysoPC 18:0 �0.661PA 32:2 �0.786 LysoPE 18:3 �0.641 PE 38:2 �0.650PI 32:2 �0.785 PE 37:1 �0.636 PE 36:3 �0.643PC 32:0 �0.765 IPC 52:0;4 �0.635 PA 36:1 �0.642PE 34:2 �0.746 PC 36:5 �0.622 PG 36:1 �0.622PI 38:1 �0.708 PI 36:5 �0.610 PC 34:1 �0.606PE 26:1 �0.686 PC 34:1 �0.569 PS 36:1 �0.560
Twelve highest loadings valuesLysoPE 17:1 0.703 PS 35:2 0.701 PI 34:3 0.765PS 36:4 0.705 PE 32:1 0.703 PA 36:6 0.781PI 33:1 0.713 PA 34:2 0.708 LysoPC 18:1 0.788LysoPG 16:0 0.723 PE 30:1 0.710 PA 34:4 0.793PE 38:6 0.726 PA 32:1 0.720 PI 35:0 0.808PI 35:2 0.730 PC 31:1 0.729 LysoPC 14:0 0.822PG 36:3 0.737 PI 31:1 0.730 PI 30:2 0.837PC 36:4 0.760 PC 33:2 0.732 M(IP)2C 64:0;4 0.843PC 36:3 0.784 IPC 48:0;3 0.745 LysoPC 18:3 0.846PE 38:4 0.792 PE 31:2 0.766 LysoPE 16:1 0.863PE 37:2 0.795 PE 31:1 0.768 PI 34:4 0.880PG 36:5 0.852 PS 32:1 0.815 LysoPC 16:1 0.907
The 12 highest and 12 lowest values are indicated.
PHOSPHOLIPIDOME OF CANDIDA 675
(Krishnamurthy et al., 2004). Taken together, these variationsreflect the complexity of Candida lipidome.
Some Candida species possess unique PL molecular speciesprofiles. For example, C. glabrata was more limited in itsmolecular species than other Candida species, with C. glabratabeing particularly enriched in phosphoglycerides with onlyone or two double bonds in the two acyl chains. Lysopho-sphoglyceride and SLs species also varied in abundanceamong species. The distinguishing patterns suggest that eachspecies of Candida has a distinctive lipid profile.
We have clustered PL profiles of a single strain from dif-ferent Candida species (Fig. 7). The clustering reflects the verydistinctive PLs of C. glabrata compared to other Candida spe-cies. C. kefyr and C. dubliniensis have different lipids but arepart of the same cluster. C. albicans and C. tropicalis, on onehand, and C. krusei, C. utilis and C. parapsilosis, on the otherhand, are similar in their lipid profiles and are thus clusteredtogether. PCA proved to be a useful tool to highlight lipidvariation among these species. However, a comparison withthe hierarchical trees based on nuclear 18S rDNA, 26S rDNA,and complete genome sequences of fungal species (Diezmannet al., 2004; Fitzpatrick et al., 2006), revealed that C. albicansand C. dubliniensis are very closely related. However, lipi-domic analyses suggest them to be different. Similarly, al-though C. tropicalis and C. parapsilosis fall in the same clusterbased on rDNA sequences, they differ from each other withrespect to their lipidomes. In another example, C. glabrata isclosely related to C. kefyr based on rDNA sequences (Diez-mann et al., 2004), but has drastically different lipidomeprofile compared to other Candida species. Thus it is apparentthat clustering based on genome sequences and lipidomicprofiles may not necessarily match in Candida species.
Conclusion
In Candida, lipid metabolism has been a prime target forstrategies that kill these pathogenic organisms. However, in-creasing cases of MDR against the known antifungal drugsdemand better drug targets, and emphasis has been placedagain on lipid metabolic enzymes as potential targets. Oneroadblock has been identifying lipid biosynthetic pathwaysthat might provide appropriate targets, partly because wehave lacked the ability to analyze the functions of thesepathways in a high-throughput manner. Our new ability toexamine Candida lipids in greater depth, using MS-based ap-proaches, should prove useful in analysis of drug targets.
Acknowledgments
The work presented in this article has been supported inpart by grants to R.P. from Department of Biotechnology (BT/PR9100/Med/29/03/2007, BT/PR9563/BRB/10/567/2007,and BT/PR11158/BRB/10/640/2008). The lipid analysesdescribed in this work were performed at the Kansas Lipi-domics Research Center Analytical Laboratory, whereequipment acquisition and method development were fun-ded by the National Science Foundation (EPS 0236913, MCB0455318, and DBI 0521587), Kansas Technology EnterpriseCorporation, K-IDeA Networks of Biomedical Research Ex-cellence (INBRE) of National Institute of Health(P20RR16475), the Johnson Cancer Center, and Kansas StateUniversity. A.S. is thankful to University Grants Commission,and Council of Scientific and Industrial Research, Govern-
ment of India, for junior research fellowships award andAmerican Society of Microbiology for providing ASM Inter-national fellowship for Asia to work at the Kansas LipidomicsResearch Center Analytical Laboratory. A.S. acknowledgesexpert help from Richard Jeannotte. We acknowledge Ad-vanced Instrumentation Research Facility (AIRF), JNU forproviding GC-MS and technical assistance therein by AjayKumar.
Author Disclosure Statement
No competing financial interests exist between the authorsof this article.
References
Bleijerveld, O.B., Houweling, M., Thomas, M.J., and Cui, Z.(2006). Metabolipidomics: profiling metabolism of glycer-ophospholipid species by stable isotopic precursors and tan-dem mass spectrometry. Anal. Biochem. 352, 1–14.
Bligh, E.G., and Dyer, W.J. (1959). A rapid method of total lipidextraction and purification. Can. J. Biochem. Physiol. 37, 911–917.
Carrasco-Pancorbo, A., Navas-Iglesias, N., and Cuadros-Rodrı́guez, L. (2009). From lipid analysis towards lipidomics,a new challenge for the analytical chemistry of the 21st century.Part I: modern lipid analysis. Trends Anal. Chem. 28, 263–278.
Dembitskii, V.M., and Pechenkina, E.E. (1991). Phospholipid andfatty-acid compositions of higher fungi. Chem. Nat. Compd.27, 155–156.
Devaiah, S.P., Roth, M.R., Baughman, E., Li, M., Tamura, P.,Jeannotte, R., et al. (2006). Quantitative profiling of polarglycerolipid species from organs of wild-type Arabidopsis anda phospholipase Dalpha1 knockout mutant. Phytochemistry67, 1907–1924.
Diezmann, S., Cox, C.J., Schonian, G., Vilgalys, R.J., andMitchell, T.G. (2004). Phylogeny and evolution of medicalspecies of Candida and related taxa: a multigenic analysis.J. Clin. Microbiol. 42, 5624–5635.
Ejsing, C.S., Sampaio, J.L., Surendranath, V., Duchoslav, E.,Ekroos, K., Klemm, R.W., et al. (2009). Global analysis of theyeast lipidome by quantitative shotgun mass spectrometry.Proc. Natl. Acad. Sci. USA 106, 2136–2141.
Ferreira, C.R., Saraiva, S.A., Catharino, R.R., Garcia, J.S., Gozzo,F.C., Sanvido, G.B., et al. (2010). Single embryo and oocytelipid fingerprinting by mass spectrometry. J. Lipid Res.doi:10.1194/jlr.D001768.
Fitzpatrick, D.A., Logue, M.E., Stajich, J.E. and Butler, G. (2006). Afungal phylogeny based on 42 complete genomes derived fromsupertree and combined gene analysis. BMC Evol. Biol. 6, 99.
Fonzi, W.A., and Irwin, M.Y. (1993). Isogenic strain constructionand gene mapping in Candida albicans. Genetics 134, 717–728.
Gaspar, M.L., Aregullin, M.A., Jesch, S.A., Nunez, L.R., Villa-Garcia, M., and Henry, S.A. (2007). The emergence of yeastlipidomics. Biochim. Biophys. Acta 1771, 241–254.
Guan, X.L., and Wenk, M.R. (2006). Mass spectrometry-basedprofiling of phospholipids and sphingolipids in extracts fromSaccharomyces cerevisiae. Yeast 23, 465–477.
Han, X., and Gross, R.W. (1994). Electrospray ionization massspectroscopic analysis of human erythrocyte plasma mem-brane phospholipids. Proc. Natl. Acad. Sci. USA 91, 10635–10639.
Iida, M., Kobayashi, H., and Iizuka, H. (1980). Cellular fattyacids derived from normal alkanes by Candida rugosa. Z. Allg.Mikrobiol. 20, 449–457.
676 SINGH ET AL.
Kohli, A., Smriti, Mukhopadhyay, K., Rattan, A., and Prasad, R.(2002). In vitro low-level resistance to azoles in Candida albi-cans is associated with changes in membrane lipid fluidity andasymmetry. Antimicrob. Agents Chemother. 46, 1046–1052.
Krishnamurthy, S., Plaine, A., Albert, J., Prasad, T., Prasad, R.,and Ernst, J.F. (2004). Dosage-dependent functions of fattyacid desaturase Ole1p in growth and morphogenesis of Can-dida albicans. Microbiology 150, 1991–2003.
Mago, N., and Khuller, G.K. (1990a). Biosynthesis of majorphospholipids in Candida albicans. Curr. Microbiol. 20, 369–372.
Mago, N. and Khuller, G.K. (1990b). Subcellular localization ofenzymes of phospholipid metabolism in Candida albicans.J. Med. Vet. Mycol. 28, 355–362.
Mahmoudabadi, A.Z., Boote, V., and Drucker, D.B. (2001).Characterization of polar lipids of oral isolates of Candida,Pichia and Saccharomyces by Fast Atom Bombardment MassSpectrometry (FAB MS). J. Appl. Microbiol. 90, 668–675.
Mukhopadhyay, K., Kohli, A., and Prasad, R. (2002). Drugsusceptibilities of yeast cells are affected by membranelipid composition. Antimicrob. Agents Chemother. 46, 3695–3705.
Mukhopadhyay, K., Prasad, T., Saini, P., Pucadyil, T.J., Chatto-padhyay, A., and Prasad, R. (2004). Membrane Sphingoli-pid-Ergosterol interactions are important determinants ofMultidrug Resistance in Candida albicans. Antimicrob. AgentsChemother. 48, 1778–1787.
Pasrija, R., Prasad, T., and Prasad, R. (2005). Membrane raft lipidconstituents affect drug susceptibilities of Candida albicans.Biochem. Soc. Trans. 33, 1219–1223.
Pasrija, R., Panwar, S.L., and Prasad, R. (2008). Multidrugtransporters CaCdr1p and CaMdr1p of Candida albicans dis-play different lipid specificities: both ergosterol and sphingo-lipids are essential for targeting of CaCdr1p to membranerafts. Antimicrob. Agents Chemother. 52, 694–704.
Prasad, R., and Kapoor, K. (2005). Multidrug resistance in yeastCandida. Int. Rev. Cytol. 242, 215–248.
Ringner, M. (2008). What is principal component analysis? Nat.Biotechnol. 26, 303–304.
Roberts, L.D., McCombie, G., Titman, C.M., and Griffin, J.L.(2008). A matter of fat: an introduction to lipidomic profilingmethods. J. Chromatogr. B Anal. Technol. Biomed. Life Sci.871, 174–181.
Tahoun, M.K., Shata, O.H., Mashalley, R.I., and Bou-Domia, S.A.(1988). Influence of selected sugars and temperature on fattyacids composition in Candida tropicalis. Nahrung 32, 327–333.
Van, M.G., Voelker, D.R., and Feigenson, G.W. (2008). Mem-brane lipids: where they are and how they behave. Nat. Rev.Mol. Cell Biol. 9, 112–124.
Watson, A.D. (2006). Lipidomics: A global approach to lipidanalysis in biological systems. J. Lipid Res. 47, 2101–2111.
Welti, R., Li, W., Li, M., Sang, Y., Biesiada, H., Zhou, H.E., et al.(2002). Profiling membrane lipids in plant stress responses.Role of phospholipase D alpha in freezing-induced lipidchanges in Arabidopsis. J. Biol. Chem. 277, 31994–32002.
Wenk, M.R. (2005). The emerging field of lipidomics. Nat. Rev.Drug Discov. 4, 594–610.
White, M.J., Hammond, R.C., and Rose, A.H. (1988). Effect ofglucose and long-chain fatty acids on synthesis of long-chainalcohols by Candida albicans. J. Gen. Microbiol. 134, 2131–2137.
Address correspondence to:Dr. Rajendra Prasad
School of Life SciencesJawaharlal Nehru University
Lab #101New Delhi-110067, India
E-mail: [email protected]; [email protected]
PHOSPHOLIPIDOME OF CANDIDA 677