Modelling species diversity through species level hierarchical modelling
Upload
independentCategory
view
1download
0
Molecular Ecology (2010) doi: 10.1111/j.1365-294X.2010.04917.x
CpDNA-based species identification and phylogeography:application to African tropical tree species
J . DUMINIL,* M. HEUERTZ,*† J . -L . DOUCET,‡ N. BOURLAND,‡ C. CRUAUD,§ F . GAVORY,§
C. DOUMENGE,– M. NAVASCUES**†† and O. J . HARDY*
*Service Evolution Biologique et Ecologie, CP160 ⁄ 12, Faculte des Sciences, Universite Libre de Bruxelles, 50 Av. F. Roosevelt,
1050 Brussels, Belgium, †Department of Biodiversity and Conservation, Real Jardın Botanico, CSIC, Plaza de Murillo,
2, E-28014 Madrid, Spain, ‡Laboratoire de Foresterie des Regions tropicales et subtropicales, Unite de Gestion des Ressources
forestieres et des Milieux naturels, Gembloux Agro-Bio Tech, Universite de Liege, Passage des Deportes, 2 – 5030 Gembloux,
Belgium, §CEA, DSV, Institut de Genomique, Genoscope, 2 rue Gaston Cremieux, CP5706, 91057 Evry, France, –Unite Biens
et Services des Ecosystemes Forestiers, CIRAD, TA C-105 ⁄ D, Campus International de Baillarguet, F-34398 Montpellier Cedex
5, France, **Equipe Eco-evolution Mathematique, CNRS UMR 7625 Ecologie et Evolution, Universite Pierre et Marie Curie,
Ecole Normale Superieure, UMR 7625, 46 rue d’Ulm, F-75230 Paris Cedex 05, France, ††INRA, UMR CBGP
(INRA ⁄ IRD ⁄ Cirad ⁄ Montpellier SupAgro), Campus International de Baillarguet, CS 30016, F-34988 Montferrier-sur-Lez Cedex,
France
Corresponde
E-mail: jdum
� 2010 Black
Abstract
Despite the importance of the African tropical rainforests as a hotspot of biodiversity,
their history and the processes that have structured their biodiversity are understood
poorly. With respect to past demographic processes, new insights can be gained through
characterizing the distribution of genetic diversity. However, few studies of this type
have been conducted in Central Africa, where the identification of species in the field
can be difficult. We examine here the distribution of chloroplast DNA (cpDNA) diversity
in Lower Guinea in two tree species that are difficult to distinguish, Erythrophleumivorense and Erythrophleum suaveolens (Fabaceae). By using a blind-sampling approach
and comparing molecular and morphological markers, we first identified retrospectively
all sampled individuals and determined the limits of the distribution of each species. We
then performed a phylogeographic study using the same genetic data set. The two species
displayed essentially parapatric distributions that were correlated well with the rainfall
gradient, which indicated different ecological requirements. In addition, a phylogeo-
graphic structure was found for E. suaveolens and, for both species, substantially higher
levels of diversity and allelic endemism were observed in the south (Gabon) than in the
north (Cameroon) of the Lower Guinea region. This finding indicated different histories
of population demographics for the two species, which might reflect different responses
to Quaternary climate changes. We suggest that a recent period of forest perturbation,
which might have been caused by humans, favoured the spread of these two species and
that their poor recruitment at present results from natural succession in their forest
formations.
Keywords: African rainforest, Erythrophleum, Pleistocene forest refuges, species delimitation
Received 28 January 2010; revision received 27 September 2010; accepted 30 September 2010
Introduction
Geographic patterns of genetic diversity provide useful
information that enables the different factors that have
nce: Jerome Duminil, Fax: +32 2650 2445;
well Publishing Ltd
influenced the history of a species to be determined ret-
rospectively (Petit et al. 2003; Heuertz et al. 2006; Dumi-
nil et al. 2009). Whereas many such phylogeographic
studies have been conducted on temperate plants (Petit
et al. 2003), comparatively few studies have been
undertaken on tropical species, despite their importance
2 J . DUM INIL ET AL.
for our knowledge of tropical biomes. Owing to their
remarkable diversity, it is frequently difficult to identify
species in the field when studying tropical plants,
although this is a necessary preliminary step before any
phylogeographic study can be carried out (Duminil
et al. 2006; Ley & Hardy 2010). This difficulty is of par-
ticular relevance to the study of tree species that have a
taxonomically close relationship, the identification of
which frequently relies on the characteristics of flowers
and ⁄ or fruit. Given that these botanical features are
absent most of the year and ⁄ or difficult to access in the
canopy, it is often difficult to distinguish sister tree spe-
cies on the basis of morphological characteristics
(Duminil et al. 2006; Koffi et al. 2010).
To overcome difficulties in identifying species using
only morphological characteristics, a blind-sampling
approach—an approach where samples are collected
without being identified definitively—followed by
assignment of the individuals to species on the basis of
molecular genetic analysis has proven to be effective
(Duminil et al. 2006). However, so far, such approaches
have relied on the use of nuclear markers that are
highly polymorphic, such as microsatellites, which are
often unavailable for the species of interest. An alterna-
tive is to rely on DNA markers that use universal prim-
ers. In this case, markers in chloroplast DNA (cpDNA)
have been shown to be very useful (Hollingsworth et al.
2009), but their power to discriminate between species
of tropical trees for identification purposes is limited
(Gonzalez et al. 2009). The limited discrimination might
be because interspecific introgression of chloroplasts
can occur in species that are closely related taxonomi-
cally. As a consequence, in cases where hybridization is
a possibility, phylogeographic studies on a given spe-
cies should include all closely related taxa for which
species identification and ⁄ or species delimitation is
problematic. It is also important to compare information
from nuclear and cpDNA because the rate of introgres-
sion is typically higher for the latter, which can lead to
discordant patterns of species differentiation (Petit &
Excoffier 2009). However, in contrast to cpDNA mark-
ers, the use of nuclear DNA (nrDNA) was problematic
because universal primers were not available. This
problem has now been resolved partly by the develop-
ment of conserved ortholog sets (COSs) of genes (Li
et al. 2008).
Chloroplast DNA has often been used for phylogeo-
graphic studies because sequences can be obtained eas-
ily using universal markers and enable historical
demographic events to be reconstructed (Petit & Vendr-
amin 2007). Despite the absence of recombination
among cpDNA markers, which means that the inferred
genealogy represents only a single realization of the
coalescent process, their informativeness for phylogeo-
graphic studies has been demonstrated well. cpDNA
enables testing the presence of a phylogeographic struc-
ture, namely haplotypes from the same population are
on average more related than haplotypes from distinct
populations, which can indicate long-term population
isolation or past fragmentation. For example, with
respect to lowland forest-dwelling species, phylogeo-
graphic studies can identify possible zones in which
species survived (forest refuges) during the last glacial
period and routes by which colonization occurred dur-
ing periods of forest expansion (El Mousadik & Petit
1996; Dutech et al. 2000; Chiang et al. 2001; Dobes et al.
2004; Heuertz et al. 2006). Moreover, cpDNA markers
can also be used to infer past changes in population
demographics, such as population expansion or decline,
by means of neutrality tests (Depaulis et al. 2005).
Therefore, cpDNA markers can be used simultaneously
as (i) a tool for species identification (a barcode-like
approach; Hollingsworth et al. 2009); and (ii) a tool for
inferring the population history of related taxa.
The history of vegetation in Central Africa has been
analysed mainly from palynological records, retrospec-
tive studies of lake levels and studies using techniques
that utilize stable isotopes (e.g. Maley 1991; Marret et al.
2006; Bonnefille 2007; Cowling et al. 2008; Ngomanda
et al. 2009). In particular, palynological records have
revealed that changes in plant communities of varying
degrees of abruptness have occurred at different times
(Bonnefille 2007). Climatic oscillations between glacial
and interglacial periods that occurred during the Pleis-
tocene have played an important role in shaping the
structure of ecosystems in Central Africa. The most
recent glacial maxima occurred from 160 000 to 130 000
and from 24 000 to 12 000 cal. years BP (Maley 1996).
On the basis of the available evidence, arguments have
been marshalled to the effect that the climate in the tro-
pics was dry and cool during glacial episodes, which
led to an expansion of savannah and ⁄ or mountain for-
est and a fragmentation of lowland tropical rainforests
into regions with sufficient moisture to support these
forests (mid-altitude mountain regions and river flood-
plains). In contrast, during interglacial episodes, condi-
tions were close to those of the present, which led to an
expansion of forest formations into regions of savannah.
Changes in vegetation during the Pleistocene should
not be reduced to simple cycles of fragmentation and
expansion of forest, given that transitions among differ-
ent types of forest communities also occurred. How-
ever, there is little doubt that climatic oscillations have
caused recurrent episodes of fragmentation ⁄ expansion
among the populations of rainforest species (Flenley
1998). Consequently, we can expect to find signs of
the effects of these events on the phylogeography of
species.
� 2010 Blackwell Publishing Ltd

CpDNA SPECIES IDENTIFICATION AND PHYLOGE OGRAPHY 3
During the Holocene, around 2500 cal. years BP, the
rainforest in Lower Guinea—the region with the highest
level of phytogeographical diversity of the African
rainforest, which covers an area from Nigeria to the
Republic of Congo (White 1979)—was marked by a
period of disturbance owing to a southwards shift of
the intertropical convergence zone (ITCZ) (Maley 1992;
Ngomanda et al. 2009). The contraction of the forests
that resulted might have triggered the southward
migration of Bantu-speaking people who were engaged
in agricultural activities, as evidenced by findings that
indicate substantial levels of agriculture in Southern
Cameroon (van Gemerden et al. 2003). This previous
anthropogenic disturbance might have produced effects
that still influence the species composition of vegetal
communities. Such effects might explain the abundance
of late secondary species that must have become estab-
lished in relatively open or disturbed forest, namely
species that currently recruit poorly under a closed can-
opy (Letouzey 1979). Recent demographic changes
might also be detectable genetically in the patterns of
allelic polymorphism.
In addition to historical factors, environmental hetero-
geneity can also influence the distribution of plant spe-
cies and their genetic structure. The distribution of
types of forest is correlated strongly with rainfall levels
in Central Africa (Letouzey 1979): evergreen forests that
are characterized by an abundance of Caesalpiniaceae
species are distributed along the coast (Atlantic equato-
rial coastal forest), whereas semideciduous forests that
are characterized by Ulmaceae and Sterculiaceae species
are found inland (northwestern Congolian lowland
forests).
The study reported herein focused on two sister tree
species from the Leguminosae–Caesalpinioideae family,
Erythrophleum ivorense A. Chev. (syn. Erythrophleum
micranthum Harms) and Erythrophleum suaveolens (Guill.
et Perr.) Brenan (syn. Erythrophleum guineense G. Don.),
that are found in the Lower Guinea region. Given that
these two species are difficult to distinguish in the field,
they constitute an ideal model to address the problem
of identification of species of tropical trees that are
highly similar morphologically. Moreover, given that
the two species are widespread geographically in tropi-
cal Africa and may be ecologically distinct from each
other, they constitute an interesting model for the inves-
tigation of the influence of historical factors on the rain-
forest. First, we carried out a comparative analysis of
cpDNA and nrDNA polymorphisms and morphological
data gathered from Erythrophleum samples from the
phytogeographical region of Lower Guinea to address
the following question: Can the two species be identi-
fied retrospectively on the basis of polymorphism of
cpDNA? Then, we characterized the spatial distribution
� 2010 Blackwell Publishing Ltd
of cpDNA diversity in each species and addressed the
following questions. (i) Is there evidence for a phyloge-
ographic structure that might reflect past fragmentation
of populations? (ii) Are there geographic areas that
show particularly high or low levels of allelic ende-
mism, which might indicate the presence of old popula-
tions or a recent colonization event, respectively?
Finally, given that these two species of timber tree are
known to suffer from poor natural recruitment, we used
neutrality tests to examine whether recent changes in
population demographics have taken place.
Materials and methods
Description of the species
The paleotropical woody genus Erythrophleum is
represented by three species in continental Africa
[Erythrophleum ivorense, Erythrophleum suaveolens and
Erythrophleum africanum (Welw. ex Benth.) Harms], one
species in Madagascar (Erythrophleum couminga Baill.),
one species in Australia [Erythrophleum chlorostachys
(F.Muell.) Baillon] and one species in China (Erythroph-
leum fordii Oliver). The phylogenetic relationships
among these species are not known. The African species
are distributed widely on the continent. E. ivorense is
found in evergreen and semideciduous tropical rainfor-
ests; E. suaveolens is found in semideciduous tropical
forests, forest galleries and dry forests; E. africanum
grows in woodlands (Aubreville 1970; Vivien & Faure
1985; Hawthorne & Jongkind 2006). As a consequence,
these three species should not be found in sympatry, or
only rarely. The study reported herein focused exclu-
sively on the two species of timber tree, E. ivorense and
E. suaveolens (the vernacular name commonly used for
both species in the area studied is ‘tali’). Both species
are the source of very poisonous bark that was formerly
used widely in Africa in trials by ordeal.
According to Hawthorne & Jongkind (2006), E. ivo-
rense has rather shiny leaflets that blacken when dried.
The pods generally measure <10 cm in length. Inflores-
cences are smaller than 1 cm across when the flowers
are fully open. The flowers have reddish brown hairs.
Each flower has a minute bract, which more or less per-
sists on the inflorescence axis alongside a persistent
short pedicel (<1 mm) when the flower has fallen; this
leaves an uneven stalk. E. suaveolens has leaflets that
are not particularly shiny, and they usually turn a
green-grey colour when dried. The upper side of the
leaflets displays a fine transverse venation. Some pods
are more than 10 cm long. Inflorescences are wider than
1 cm with slender pedicels and no bracts. The pedicels
are barely persistent on the stalk, and the axis is left
almost without scars when the flowers fall.

4 J . DUM INIL ET AL.
Erythrophleum species are hermaphroditic. Pollination
is insect-mediated in E. fordii (Zhu et al. 2009), which is
probably also the case in the African species. Seed
dispersal is probably mainly ballochorous. However,
secondary dispersal by primates can occur (Kone et al.
2008; Kunz & Linsenmair 2008). Analysis of population
structure using the distribution of the diameters of
trunks (data not shown) indicates that both species
currently experience difficulty recruiting in Cameroon,
Gabon and North Congo, which results in a relatively
low number of individuals with a trunk of small diame-
ter. Given that both species are light-demanding during
their juvenile phase (Kouadio 2009), this lack of recruit-
ment might reflect the natural succession of the forest
formations.
Sampling
Plant material (pieces of leaves or cambium) was sam-
pled from 281 saplings or adult trees of Erythrophleum
in Cameroon, Gabon, the Central African Republic and
the Republic of the Congo (Fig. 1 and Data S1, Sup-
porting information) and dried immediately in silica gel
to preserve the DNA. The species could not be identi-
fied at this stage because fertile material was rarely
available. Individuals were grouped together arbitrarily
into 59 localities (hereafter called ‘populations’) on the
basis of their geographic coordinates (Data S1, Support-
ing information). Within these populations, individuals
were separated by at least 100 m and at most 10 km.
One individual of E. africanum that was collected in
1
2
3
5
4 7
6 89
1011
18
19
29 31
33 3
1716
202221
15
2324
14
251312
272628
3738
3635
3439
46
4748
49 50
51
45
5255
5657
58
59
5354
444342
4140
Equator
0 250 500km
Benin (N-10�209 E-1�206) and one individual of Calpoca-
lyx dinklagei that was collected in the Korup National
Park (population 2, Fig. 1) were used as outgroups in
the phylogenetic analyses.
Fourteen herbarium samples were collected from four
of the populations (three from population 41, five from
population 26, two from population 11 and four from
population 20) and were deposited in the National
Botanical Garden of Belgium under the following desig-
nations: Ipandi 4, Ipandi 6, Ipandi 15, Doucet G1, Doucet
G4, Doucet G11, Doucet G12, Doucet G21, Doucet G42,
Doucet G45, Doucet G46, Doucet G47, Doucet G49 and
Doucet G50. Additional material was obtained from her-
barium vouchers of fertile material from the National
Botanic Garden of Belgium (hereafter called ‘herbaria
from herbarium collections’, Data S2, Supporting infor-
mation), and DNA was extracted successfully from 31
individuals. The sampling date of the fertile herbarium
vouchers allowed the flowering period of individuals of
Erythrophleum to be identified in a given geographic
zone. In addition, 793 seeds were gathered from a total
of 22 trees from seven populations (Data S1, Supporting
information) for morphological analyses.
Morphological traits
When possible, the following morphological characters
were assessed for the available herbarium samples:
flower length, pedicel length, pilosity of the flowers,
presence ⁄ absence of persistent pedicels, colour of leaf-
lets when dried and pod length. It was impossible to
30
2
Fig. 1 Map showing locations of study
populations (numbers refer to popula-
tions as indicated in Data S1, Support-
ing information). The light-grey zone
corresponds to the Atlantic equatorial
coastal forest and the dark-grey zone to
the lowland forests of northwest Congo-
lian region in accordance with the eco-
regions defined by World Wildlife Fund
(Olson et al. 2001). Details of other eco-
regions are not indicated. The position
of the equator is indicated as well as
the approximate position of the latitude
that corresponds to seasonal inversion
caused by the annual movement of the
intertropical convergence zone (ITCZ,
dashed line).
� 2010 Blackwell Publishing Ltd

CpDNA SPECIES IDENTIFICATION AND PHYLOGE OGRAPHY 5
measure flower length and pedicel length when the
flowers were immature. We considered only herbarium
samples with sufficient discriminatory characters (at
least one of the six characters described in Data S2,
Supporting information) to enable unambiguous identi-
fication of species. Seeds collected in the field were
weighed and measured (length of minor and major
axes), and the effects of species (classification on the
basis of DNA analysis), family, and population were
tested using a nested ANOVA with random effects.
Sequencing and genotyping
Total DNA was isolated with a NucleoSpin� plant kit
(Macherey-Nagel). Polymorphism of cpDNA was eval-
uated first by the sequencing of 16 individuals from
different populations from Cameroon and Gabon using
universal primers. The following six fragments
were tested: psbA ⁄ trnH, trnC ⁄ petN1R, trnLR ⁄ trnLF,
rbcL1F ⁄ rbcL724R, trnT ⁄ trnL and rpl36 ⁄ rps8 (Kress et al.
2005). Given that the trnC ⁄ petN1R fragment was the
most polymorphic and the other fragments did not
provide additional information, only this region was
amplified and sequenced using primers described pre-
viously in the further analyses (Demesure et al. 1995;
Lee & Wen 2004). In addition, three chloroplast micro-
satellites [hereafter called ‘ccmps’ to distinguish them
from the two simple sequence repeat (SSR) motifs
present in the trnC ⁄ petN1R fragment and called ‘trnC-
SSRs’] were analysed using universal primers (ccmp2,
ccmp4 and ccmp6; Weising & Gardner 1999). Polymer-
ase chain reactions (PCRs) were carried out in a Biom-
etra TProfessional Thermocycler. PCRs (total volume of
25 lL) included 2 lL of template DNA (10–100 ng),
0.1 lL of Taq polymerase (Qiagen), 2 lL of PCR buffer,
1 lL of MgCl2 (25 mM), 0.5 lL of dNTP (10 lM),
0.25 lL of each primer (10 lM) and 18.9 lL of H2O.
The cycling profile for PCR of the trnC ⁄ petN1R inter-
genic region included an initial step of 3 min at 94 �C
followed by 35 cycles of 30 s at 94 �C, 30 s at 56 �C
and 1 min at 72 �C, followed by a final incubation at
72 �C for 5 min. Ccmps were amplified in accordance
with the conditions described by Weising & Gardner
(1999). Sequences and genotypes were resolved on a
3100 Genetic Analyzer (Applied Biosystems). The
lengths of the ccmp fragments were determined by
comparison with the GeneScan 350 ROX Size Standard
(Applied Biosystems) using the GeneMapper v3.0 soft-
ware (Applied Biosystems). In general, the trnC ⁄petN1R fragment could be amplified successfully for
field samples and samples from herbaria that were
obtained recently but not from herbaria from herbar-
ium collections. In contrast, the ccmps could be geno-
typed for all samples, which was probably because
� 2010 Blackwell Publishing Ltd
they involve the amplification of relatively short DNA
fragments (ca. 90–250 bp). CpDNA haplotypes were
defined separately for the trnC ⁄ petN1R sequences and
for size variants at the three ccmps. Subsequent analy-
ses were carried out on a portion or all of the poly-
morphic characters of trnC ⁄ petN1R and ⁄ or on the
ccmp data as detailed below.
The nuclear conserved ortholog set (COS) gene Eif3E
(Li et al. 2008) was amplified to cross-check the results
for species identification obtained by the comparison of
morphological and cpDNA markers. The PCR protocol
was the same as that used for the trnC ⁄ petN1R
sequences except that the annealing temperature was
52 �C. Eif3E was sequenced for a subset of the 281 indi-
viduals for which the trnC ⁄ petN1R fragment was ampli-
fied successfully. This subset consisted of 93 individuals
that represented all cpDNA haplotypes, covered as
much of the present study area as possible and
included most of the individuals of the populations
where both species were found in sympatry. Moreover,
one individual of E. africanum and one individual of a
sister genus, Erythrophleum sp., C. dinklagei, were
sequenced. Only three haplotypes were obtained for the
nuclear Eif3E gene for the 93 sequenced individuals of
E. ivorense (two haplotypes) and E. suaveolens (one hap-
lotype), and only one individual per haplotype was
used for the phylogenetic analyses. The accession num-
bers for the corresponding sequences are as follows:
FR670627–FR670631.
Phylogenetic network reconstruction
A minimum-spanning network of the cpDNA haplo-
types was reconstructed using MINSPNET software
(Laurent Excoffier; available at http://cmpg.unibe.ch/
people/Excoffier-perso.htm). Given that ccmps may dis-
play considerable levels of homoplasy (Provan et al.
2001) and that the exact nature of the mutations involved
in the size variation of the ccmps was not known, the
network was constructed from the trnC ⁄ petN1R
sequences only, using a state difference distance matrix
of all polymorphic characters [single-nucleotide poly-
morphisms (SNPs), insertions–deletions (INDELs) and
trnC-SSRs]. Note that the trnC-SSR microsatellites were
used in this analysis, although the ccmp microsatellites
were not, because the exact nature of the variation was
known for the former (number of repeated motifs). The
size polymorphism of ccmps can be because of variation
in the number of repeated motifs and ⁄ or of the presence
of INDELs. The species E. africanum was used to root the
phylogenetic network.
Maximum-parsimony analysis using a heuristic
search with 1000 replicates of random, stepwise branch
swapping followed by tree bisection–reconnection was

6 J . DUM INIL ET AL.
carried out on the nuclear sequences using the individ-
ual of C. dinklagei as the outgroup. All characters were
set as unordered and having equal weight. One thou-
sand bootstrap replicates using the same search param-
eters as in the parsimony analysis were produced to
assess clade support.
Partitioning of cpDNA variation and testing for aphylogeographic signal
Within-population (HS) and total (HT) gene diversities
(the probability that two random individuals bear differ-
ent haplotypes), as well as the level of population differ-
entiation (GST = 1-HS ⁄ HT), were estimated separately (i)
for SNPs and INDELs from the trnC ⁄ petN1R sequences;
and (ii) for the ccmp loci. We also computed the corre-
sponding parameters of diversity measures when dis-
tances between haplotypes were taken into account (vS,
vT, and NST or RST) using the method described by Pons
& Petit (1996). For the trnC ⁄ petN1R sequences, the dis-
tance between each pair of haplotypes was defined as
the number of characters that differed between their
sequences (as for the minimum-spanning network), and
NST was estimated using PERMUT software (available
at http://www.pierroton.inra.fr/genetics/labo/Software/
Permut/). For the ccmps, the distance between haplo-
types was defined as the squared difference in sequence
length, summed over the three ccmp loci, and RST was
estimated using CpSSR software (included in the
PERMUT software). Populations with fewer than three
individuals were discarded for these analyses, following
the recommendation of Pons & Petit (1996). We consid-
ered that a phylogeographic signal occurred when
distinct haplotypes found in the same population were
related more closely (i.e. separated by fewer mutational
events) on average than distinct haplotypes sampled in
different populations, a pattern that results in NST > GST
and RST > GST. Such a signal was tested using a random-
ization procedure of the haplotype assignations in
the distance matrices, as implemented in PERMUT soft-
ware.
On the basis of the results that were obtained earlier
in the study, in which individuals were assigned to spe-
cies by comparing the morphological and genetic data,
all genetic analyses were carried out on the whole set
of individuals and on two subsets of individuals that
putatively matched the two species, E. suaveolens and
E. ivorense (subsets ‘sua’ and ‘iv’).
Geographic patterns of genetic diversity
To evaluate differences in the levels of diversity and
genetic structure between the southern (S) and the
northern (N) regions of the study area (regions that
were separated by the latitude of seasonal inver-
sion—average latitude of the ITCZ, Fig. 1), as well as
between the western (W) and eastern (E) regions
(delineated in accordance with the gradient of rainfall),
populations were grouped as follows. For E. suaveolens,
four groups were defined and denoted sua-NW, sua-
NE, sua-SW and sua-SE. For E. ivorense, which was
found only in the western part of the study area, two
groups were defined and denoted iv-N and iv-S. Using
SPAGeDi software (Hardy & Vekemans 2002), genetic
diversity (He) was estimated for all these groups, as
well as the ratio of the number of unique haplotypes
per group to the total number of haplotypes per group
(hereafter defined as Na). We also measured genetic
differentiation (GST, NST) and tested for the presence of
a phylogeographic signal (NST > GST) between these
groups. These analyses were carried out using a
distance matrix (number of polymorphic sites that
differed between haplotypes) that was based on the
ccmp data for E. ivorense (in which no sequence
polymorphism was observed, see Results) and on the
combination of cpSSRs and trnC ⁄ petN1R sequences for
E. suaveolens.
Test of the neutral model
A neutral model with constant population size was
tested for each species using the cpSSRs. The frequency
distribution of haplotypes is sensitive to demographic
changes and selection (Depaulis et al. 2005). Gene
diversity (H ¼ 1�PK
i¼1
p2i , where pi is the frequency of
the ith haplotype) summarizes the frequency distribu-
tion of haplotypes, and its expected value can be pre-
dicted through simulations for a neutral model with
constant population size (null model). An observed
value of gene diversity that is lower than expected
under the null model may indicate the decline of popu-
lation size or population structure (or balanced selec-
tion), whereas a higher value may indicate population
expansion (or a selective sweep, Depaulis et al. 2005).
To obtain the null distribution of the statistic, we esti-
mated the mutation rate scaled by effective population
size (h = 2Nl) of each of the five chloroplast microsatel-
lites. The parameter h was estimated with BATWING
(Wilson et al. 2003) using a model of constant popula-
tion size. SNPs and INDELs were included in this anal-
ysis only to constrain the trees to compatible topologies
in the case of E. suaveolens. However, a polymorphic
character (SNP4, Data S5, Supporting information) had
to be removed because it was not compatible with the
hypothesis of no recombination and no recurrent muta-
tion (in SNPs and INDELs) that is used by BATWING.
Inferences were obtained from a Markov chain of
� 2010 Blackwell Publishing Ltd

CpDNA SPECIES IDENTIFICATION AND PHYLOGE OGRAPHY 7
2 000 000 steps with a warm-up of 20 000 steps. The
prior for h was chosen to be uniform between 0 and ¥(results equivalent to a maximum-likelihood frame-
work). Then, 1000 data sets of five linked microsatellites
were simulated by a coalescent approach with SimCoal
2 (Laval & Excoffier 2004), using the estimates of hunder a model of constant population size, and the
gene diversity H was computed for each data set. The
value of H from the empirical data was compared with
the distribution of simulated values to estimate a
P-value (two-tailed tests). The same analyses were also
carried out for the sua-NE and sua-SE subgroups of
individuals to check for the existence of a more local
demographic signal.
Results
Morphological and phenology observations
Morphological observations of herbarium material. The
individuals sampled in coastal forests (Data S2, Sup-
porting information) displayed characters that were typ-
ical of Erythrophleum ivorense. The flowers had
persistent short, c. 0.5-mm-long, pedicels with a minute
bract; petals were lanate on their outer side. The mean
flower length was 5.3 mm (±0.8 mm) and mean pod
length was 9.9 cm (±2.8 cm). Leaflets were rather glossy
and turned brown upon drying. In contrast, the individ-
uals sampled inland (Data S2, Supporting information)
displayed characters that were typical of Erythrophleum
suaveolens with flowers having a pedicel up to 1 mm
long. The petals had sparser and shorter hairs than
individuals identified as E. ivorense on their outer side
and the hairs sometimes covered only the central part
or were only present at the margins. The mean flower
length was 7.2 mm (±0.6 mm) and mean pod length
was 11 cm (±1.8 cm). Leaflets were generally glossy and
turned green upon drying.
Seed weight. The mean seed weight per family displayed
a bimodal distribution (Data S3, Supporting informa-
tion). The first group comprised eight families from two
coastal populations (2, 26), whereas the second group
comprised 14 families from five inland populations (9, 16,
18, 20 and 21). In the former, the seed weights ranged
from 270 to 450 mg (mean ± SD = 336 ± 61 mg), and in
the second group, the seed weights ranged from 550 to
800 mg (mean ± SD = 696 ± 114 mg). On the assumption
that coastal populations belong to E. ivorense and inland
populations to E. suaveolens, nested ANOVA demonstrated
that 77% of the variation in seed weight was explained
by the species level, whereas the population and family
levels explained only 1.3% and 5.7% of the variation,
respectively (Data S4, Supporting information).
� 2010 Blackwell Publishing Ltd
Flowering periods. Populations in coastal forests flow-
ered from June to October. Populations in inland forests
flowered from February to May and from September to
November (personal observations and sampling dates
of herbarium vouchers of fertile material as described
in Data S2, Supporting information).
cpDNA polymorphism
Overall, 19 haplotypes (denoted H1–H19) were defined
for the trnC ⁄ petN1R sequences and 19 haplotypes
(denoted A to S) for the three ccmp loci (Data S5 and
S6, Supporting information). The combination of the
two types of marker resolved into 44 haplotypes
(Data S6, Supporting information).
The trnC ⁄ petN1R sequences displayed 17 polymor-
phic characters among the 281 individuals sampled (12
SNPs, 3 INDELs and 2 microsatellites with length varia-
tion, Data S5, Supporting information). Five haplotypes
had a frequency of >2.5% (Fig. 2, Data S5 and S7,
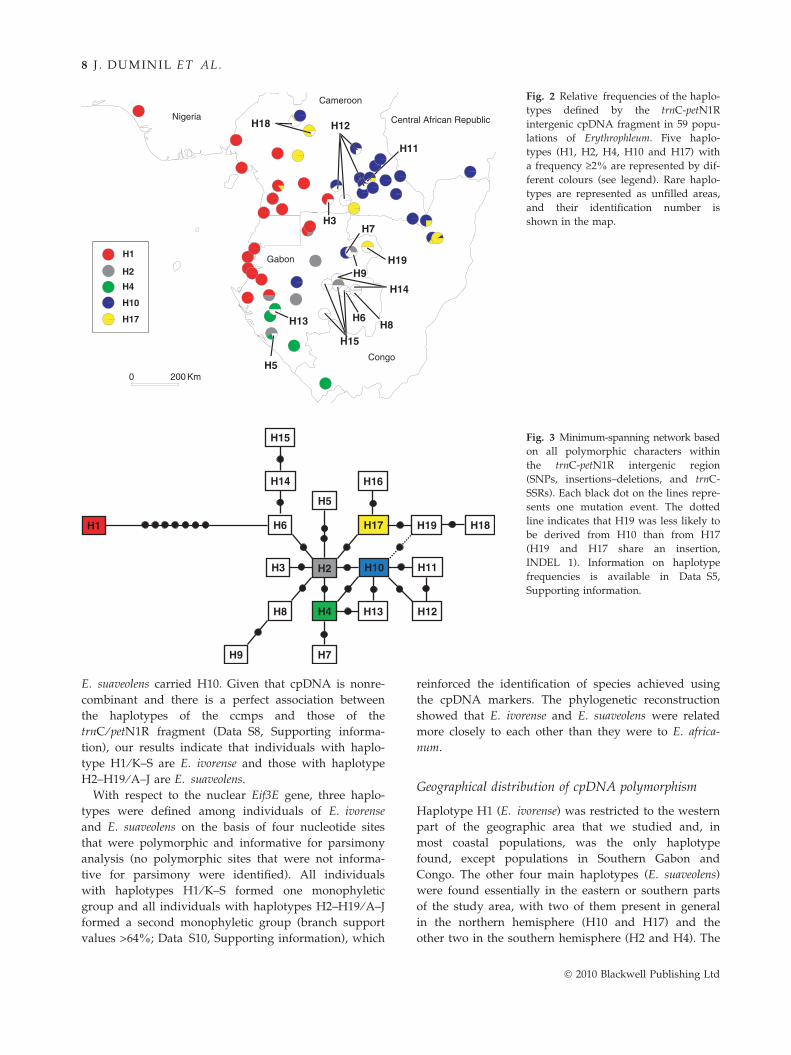
Supporting information). According to the phylogenetic
network (Fig. 3), H1 was separated clearly from all
other haplotypes (by seven mutations). The network
was not resolved fully, which indicates the presence of
homoplasious characters (SNP4 and trnC-SSRs, Data S5,
Supporting information). When H1 is omitted from the
network, the four most common haplotypes (H2, H4,
H10 and H17) are in central positions, which supports
the hypothesis that they are more ancestral.
There is a strict association among the haplotypes
defined by trnC ⁄ petN1R sequences and those defined
by ccmps (Data S8, Supporting information): H1 is
associated with K to S whereas H2–H19 are associated
with A to J. This association reinforces the phylogenetic
distance proposed in the phylogenetic network that
clearly separates H1 from all other haplotypes (Fig. 3).
The more common haplotypes are also dispersed over a
larger area, whereas the rarer haplotypes are located in
restricted areas and in general are not shared between
populations separated by the latitude of seasonal inver-
sion.
Identification of species using cpDNA and nrDNA
Herbarium vouchers that were identified morphologi-
cally as E. suaveolens (n = 26) always carried haplotype
A, E or G at the ccmp loci, whereas those identified
morphologically as E. ivorense (n = 19) always carried
haplotype K, M, N, O, P, Q or S (Data S2, Supporting
information). Haplotypes at the trnC ⁄ petN1R fragment
could only be characterized in the herbarium vouchers
that we collected, rather than those collected previously.
Samples that were identified morphologically as E. ivo-
rense carried haplotype H1, whereas those identified as
H6
H13H8
H5
H3
H4
H17
H2 H10
H9 H7
H12
H11
H19 H18
H14
H15
H1
H16
Fig. 3 Minimum-spanning network based
on all polymorphic characters within
the trnC-petN1R intergenic region
(SNPs, insertions–deletions, and trnC-
SSRs). Each black dot on the lines repre-
sents one mutation event. The dotted
line indicates that H19 was less likely to
be derived from H10 than from H17
(H19 and H17 share an insertion,
INDEL 1). Information on haplotype
frequencies is available in Data S5,
Supporting information.
H18 H12
H11
H3H7
H19H9
H14
H6
H15
H8H13
H5
H1
H2
H4
H10
H17
Nigeria Central African Republic
Gabon
Congo
0 200 Km
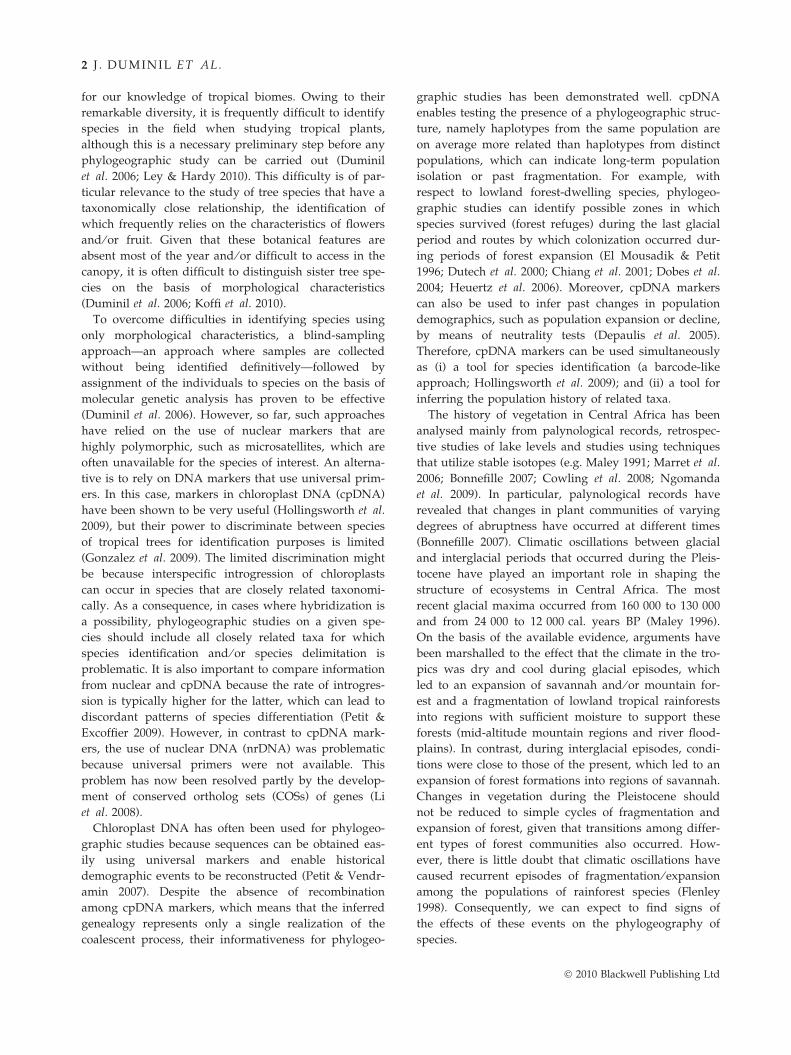
Cameroon Fig. 2 Relative frequencies of the haplo-
types defined by the trnC-petN1R
intergenic cpDNA fragment in 59 popu-
lations of Erythrophleum. Five haplo-
types (H1, H2, H4, H10 and H17) with
a frequency ‡2% are represented by dif-
ferent colours (see legend). Rare haplo-
types are represented as unfilled areas,
and their identification number is
shown in the map.
8 J . DUM INIL ET AL.
E. suaveolens carried H10. Given that cpDNA is nonre-
combinant and there is a perfect association between
the haplotypes of the ccmps and those of the
trnC ⁄ petN1R fragment (Data S8, Supporting informa-
tion), our results indicate that individuals with haplo-
type H1 ⁄ K–S are E. ivorense and those with haplotype
H2–H19 ⁄ A–J are E. suaveolens.
With respect to the nuclear Eif3E gene, three haplo-
types were defined among individuals of E. ivorense
and E. suaveolens on the basis of four nucleotide sites
that were polymorphic and informative for parsimony
analysis (no polymorphic sites that were not informa-
tive for parsimony were identified). All individuals
with haplotypes H1 ⁄ K–S formed one monophyletic
group and all individuals with haplotypes H2–H19 ⁄ A–J
formed a second monophyletic group (branch support
values >64%; Data S10, Supporting information), which
reinforced the identification of species achieved using
the cpDNA markers. The phylogenetic reconstruction
showed that E. ivorense and E. suaveolens were related
more closely to each other than they were to E. africa-
num.
Geographical distribution of cpDNA polymorphism
Haplotype H1 (E. ivorense) was restricted to the western
part of the geographic area that we studied and, in
most coastal populations, was the only haplotype
found, except populations in Southern Gabon and
Congo. The other four main haplotypes (E. suaveolens)
were found essentially in the eastern or southern parts
of the study area, with two of them present in general
in the northern hemisphere (H10 and H17) and the
other two in the southern hemisphere (H2 and H4). The
� 2010 Blackwell Publishing Ltd

NS
T,
RS
T)
esti
mat
edfo
ru
no
rder
ed(H
,G
ST)
and
s.A
nal
yse
sw
ere
per
form
edat
the
gen
us
lev
elo
r
icro
sate
llit
es(c
cmp
s)
GS
Tm S
m TR
ST
0.41
7
(0.0
485)
0.07
3
(0.0
303)
0.75
6
(0.1
063)
0.90
3***
(0.0
381)
0.26
4
(0.0
683)
0.46
5
(0.1
017)
0.73
0
(0.1
242)
0.36
2NS
(0.0
452)
0.17
9
(0.0
625)
0.15
8
(0.0
419)
0.19
4
(0.0
564)
0.18
7NS
(0.0
857)
CpDNA SPECIES IDENTIFICATION AND PHYLOGE OGRAPHY 9
other 14 trnC ⁄ petN1R haplotypes (E. suaveolens) were
rare and usually found in restricted geographic areas
(Fig. 2). Ten of these rare haplotypes were localized in
Gabon and four in Cameroon.
With respect to the three ccmp loci, haplotypes A to J
(E. ivorense) occurred in the eastern part of the study
area, although they were not found in Southern Gabon
and Congo, whereas haplotypes K to S (E. suaveolens)
occurred in the western and southern parts (Data S9,
Supporting information).
The two groups of haplotypes (H1 ⁄ K–S and H2–H19 ⁄A–J), and hence the two species, were not usually found
in sympatry, with the exception of a few populations
that were restricted to transition zones (see Data S1
and S7, Supporting information and Fig. 2).
ith
inp
op
ula
tio
ns
(HS,
m S)
and
ov
eral
lp
op
ula
tio
ns
(HT,
m T)
and
po
pu
lati
on
dif
fere
nti
atio
n(G
ST,
pes
inac
cord
ance
wit
hP
on
s&
Pet
it(1
996)
.N
um
ber
sin
par
enth
eses
corr
esp
on
dto
stan
dar
der
ror
sin
gth
eS
NP
san
dIN
DE
Ls
of
the
trn
C-p
etN
1Rcp
DN
Ain
terg
enic
reg
ion
or
usi
ng
thre
ech
loro
pla
stm
trn
C-p
etN
1Rcc
mp
s
HS
HT
GS
Tm S
m TN
ST
HS
HT
0.24
2
(0.0
488)
0.77
2
(0.0
396)
0.68
7
(0.0
540)
0.17
7
(0.0
531)
1.39
9
(0.1
304)
0.87
3***
(0.0
383)
0.38
4
(0.0
538)
0.65
8
(0.0
687)
—†
—†
——
——
0.55
3
(0.0
857)
0.75
2
(0.0
781)
0.29
4
(0.0
618)
0.71
2
(0.0
795)
0.58
8
(0.0
712)
0.16
9
(0.0
463)
0.56
0
(0.0
834)
0.69
9**
(0.0
793)
0.27
0
(0.0
605)
0.32
9
(0.0
776)
no
tsi
gn
ifica
nt.
,in
sert
ion
s–d
elet
ion
s.
Genetic structure and diversity analyses for cpDNA
A phylogeographic signal was detected when all indi-
viduals from both species were considered (GST = 0.69,
NST = 0.87 > GST, P < 0.001 for trnC ⁄ petN1R sequences;
see Table 1 for ccmps), namely that haplotypes present
within the same population were related more closely
on average than haplotypes found in different popula-
tions. E. suaveolens displayed a phylogeographic signal
at the trnC ⁄ petN1R sequences (GST = 0.59, NST =
0.699 > GST, P < 0.01). In contrast, E. ivorense was
monomorphic with respect to the trnC ⁄ petN1R
sequences. At the ccmp loci within species, a stronger
among-population structure appeared for E. ivorense
than for E. suaveolens (GST = 0.264 and 0.179, respec-
tively) and no phylogeographic signal was detected.
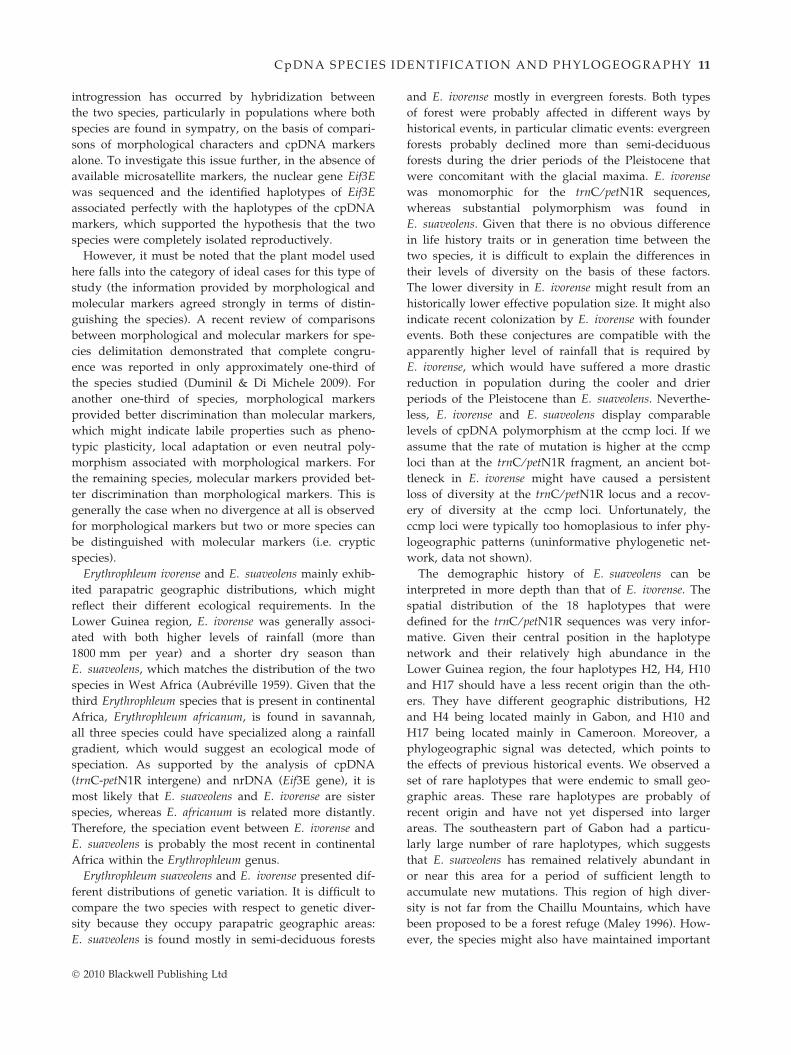
For both species, the combination of trnC ⁄ petN1R
sequences and ccmp loci revealed a higher genetic
diversity in the southern part of the area studied
(Gabon) than in the northern part (Cameroon; Fig. 4).
For E. suaveolens, the highest genetic diversity was
found in southeastern populations (He = 0.94). The
genetic differentiation between east and west was
GST = 0.130, NST = 0.144 and that between north and
south was GST = 0.210, NST = 0.130, with no significant
phylogeographic signal detected. For E. ivorense, the
genetic differentiation between north and south was
GST = 0.130 and NST = 0.200 (test of phylogeographic
structure, NST > GST, P > 0.05).
Tab
le1
Gen
etic
div
ersi
tyw
ord
ered
(m,
NS
T,
RS
T)
hap
loty
wit
hin
each
spec
ies,
eith
eru
Ery
thro
phle
um
ivor
ense
⁄E
ryth
roph
leu
msu
aveo
len
s
E.
ivor
ense
E.
suav
eole
ns
***P
<0.
001;
**P
<0.
01;
NS
,
†No
po
lym
orp
his
m.
IND
EL
s
Test of demographic stability
In the test of the neutral model, the observed values of
genetic diversity were significantly lower than the simu-
lated values for both taxa (E. ivorense: h = 0.5 (95% CI:
0.20–1.05), H = 0.766, P-value = 0.032; E. suaveolens:
h = 1.7 (95% CI: 1.06–2.70), H = 0.469, P-value < 0.0001),
which suggested population decline or genetic substructure
� 2010 Blackwell Publishing Ltd

E
N
S
W
iv-N
iv-S
sua-SWsua-SE
He = 0.60Na = 1/5n = 39
He = 0.82Na = 4/8n = 47
He = 0.83Na = 9/12n = 16
He = 0.94Na = 14/17n = 32
sua-NW sua-NE
He = 0.65Na = 3/4n = 16
He = 0.59Na = 1/8n = 133
Fig. 4 Diversity (He) and number of
haplotypes (Na = number of unique
haplotypes ⁄ total number of haplotypes)
within each of four areas for Erythroph-
leum suaveolens (four zones within the
dashed line; two with a grey back-
ground, sua-NE and sua-SE, and two
with a white background, sua-NW and
sua-SW) and two areas for Erythroph-
leum ivorense (dotted lines, iv-N and
iv-S). N indicates the number of individ-
uals per zone. The areas are separated
by latitude 1.20�N, which corresponds to
seasonal inversion, and ⁄ or by longitude
12.70�E. The haplotypes are defined
by the combination of trnC ⁄ petN1R
sequences and three cpSSR loci.
10 J . DUM INIL ET AL.
within each taxon. Analyses on sua-SE and sua-NE
were also significant (sua-SE: h = 1.0, 95% CI: 0.42–2.20,
H = 0.75, P-value < 0.0001; sua-NE: h = 0.5, 95% CI:
0.21–1.00, H = 0.35, P-value = 0.0004), which suggested
population decline.
Discussion
The cpDNA-based approach presented here (Table 2)
was effective for the classification of blind-sampled
individuals of Erythrophleum as E. ivorense or Erythroph-
leum suaveolens. Indeed, morphological traits as well as
chloroplast and nuclear markers converged to classify
individuals near the coast as E. ivorense and individuals
located inland as E. suaveolens. The two species were
confirmed to be morphologically distinct (on the basis
Table 2 Available information by type of plant material used
in this study
n† Morphology
Short DNA
sequence
Long DNA
sequence
Herbaria from
herbarium
collection
31 + + )
Herbaria collected
during
recent field trips
14 + + +
Silica gel-dried
leaves or
cambium
281 ) + +
†Number of specimens.
of diagnostic characteristics observed in herbarium
specimens and weights of seeds gathered in the field)
and were shown to display clear genetic differentiation.
The use of herbarium vouchers proved to be a very use-
ful approach to complement blind-sampling because it
enabled morphological observations to be linked with
DNA classification of the individuals. The herbaria that
were used in this study were composed of new samples
collected in a few localities and herbaria from herbar-
ium collections from a wider geographical area. As
summarized in Table 2, the herbaria from herbarium
collections were very valuable for the study of morpho-
logical characters, but DNA degradation is often a limit-
ing factor for molecular analyses: short cpDNA
fragments (100–250 bp for the ccmps studied here)
could be amplified, but longer and more informative
sequences could not (�1000 bp for trnC ⁄ petN1R
sequences or �650 bp for Eif3E sequences). However,
the fact that cpDNA does not undergo recombination
should ensure a strong association between haplotypes
identified at different loci; indeed, we identified two
matching categories of haplotypes using trnC ⁄ petN1R
sequences and ccmp loci that were shown to distin-
guish the two species. Hence, our strategy of using both
short and long cpDNA fragments allowed us to deter-
mine taxonomic links between herbaria from herbarium
collections and blind-sampled individuals (Table 2).
This DNA barcode-like approach is very useful in cases
where it is difficult to identify individuals in tropical
forest taxa. Choloroplast DNA markers appeared to be
informative to distinguish E. ivorense and E. suaveolens.
However, one cannot exclude the possibility that
� 2010 Blackwell Publishing Ltd
Cp DNA SPECIES IDENTIFICATION AND PHYLOGE OGRAPHY 11
introgression has occurred by hybridization between
the two species, particularly in populations where both
species are found in sympatry, on the basis of compari-
sons of morphological characters and cpDNA markers
alone. To investigate this issue further, in the absence of
available microsatellite markers, the nuclear gene Eif3E
was sequenced and the identified haplotypes of Eif3E
associated perfectly with the haplotypes of the cpDNA
markers, which supported the hypothesis that the two
species were completely isolated reproductively.
However, it must be noted that the plant model used
here falls into the category of ideal cases for this type of
study (the information provided by morphological and
molecular markers agreed strongly in terms of distin-
guishing the species). A recent review of comparisons
between morphological and molecular markers for spe-
cies delimitation demonstrated that complete congru-
ence was reported in only approximately one-third of
the species studied (Duminil & Di Michele 2009). For
another one-third of species, morphological markers
provided better discrimination than molecular markers,
which might indicate labile properties such as pheno-
typic plasticity, local adaptation or even neutral poly-
morphism associated with morphological markers. For
the remaining species, molecular markers provided bet-
ter discrimination than morphological markers. This is
generally the case when no divergence at all is observed
for morphological markers but two or more species can
be distinguished with molecular markers (i.e. cryptic
species).
Erythrophleum ivorense and E. suaveolens mainly exhib-
ited parapatric geographic distributions, which might
reflect their different ecological requirements. In the
Lower Guinea region, E. ivorense was generally associ-
ated with both higher levels of rainfall (more than
1800 mm per year) and a shorter dry season than
E. suaveolens, which matches the distribution of the two
species in West Africa (Aubreville 1959). Given that the
third Erythrophleum species that is present in continental
Africa, Erythrophleum africanum, is found in savannah,
all three species could have specialized along a rainfall
gradient, which would suggest an ecological mode of
speciation. As supported by the analysis of cpDNA
(trnC-petN1R intergene) and nrDNA (Eif3E gene), it is
most likely that E. suaveolens and E. ivorense are sister
species, whereas E. africanum is related more distantly.
Therefore, the speciation event between E. ivorense and
E. suaveolens is probably the most recent in continental
Africa within the Erythrophleum genus.
Erythrophleum suaveolens and E. ivorense presented dif-
ferent distributions of genetic variation. It is difficult to
compare the two species with respect to genetic diver-
sity because they occupy parapatric geographic areas:
E. suaveolens is found mostly in semi-deciduous forests
� 2010 Blackwell Publishing Ltd
and E. ivorense mostly in evergreen forests. Both types
of forest were probably affected in different ways by
historical events, in particular climatic events: evergreen
forests probably declined more than semi-deciduous
forests during the drier periods of the Pleistocene that
were concomitant with the glacial maxima. E. ivorense
was monomorphic for the trnC ⁄ petN1R sequences,
whereas substantial polymorphism was found in
E. suaveolens. Given that there is no obvious difference
in life history traits or in generation time between the
two species, it is difficult to explain the differences in
their levels of diversity on the basis of these factors.
The lower diversity in E. ivorense might result from an
historically lower effective population size. It might also
indicate recent colonization by E. ivorense with founder
events. Both these conjectures are compatible with the
apparently higher level of rainfall that is required by
E. ivorense, which would have suffered a more drastic
reduction in population during the cooler and drier
periods of the Pleistocene than E. suaveolens. Neverthe-
less, E. ivorense and E. suaveolens display comparable
levels of cpDNA polymorphism at the ccmp loci. If we
assume that the rate of mutation is higher at the ccmp
loci than at the trnC ⁄ petN1R fragment, an ancient bot-
tleneck in E. ivorense might have caused a persistent
loss of diversity at the trnC ⁄ petN1R locus and a recov-
ery of diversity at the ccmp loci. Unfortunately, the
ccmp loci were typically too homoplasious to infer phy-
logeographic patterns (uninformative phylogenetic net-
work, data not shown).
The demographic history of E. suaveolens can be
interpreted in more depth than that of E. ivorense. The
spatial distribution of the 18 haplotypes that were
defined for the trnC ⁄ petN1R sequences was very infor-
mative. Given their central position in the haplotype
network and their relatively high abundance in the
Lower Guinea region, the four haplotypes H2, H4, H10
and H17 should have a less recent origin than the oth-
ers. They have different geographic distributions, H2
and H4 being located mainly in Gabon, and H10 and
H17 being located mainly in Cameroon. Moreover, a
phylogeographic signal was detected, which points to
the effects of previous historical events. We observed a
set of rare haplotypes that were endemic to small geo-
graphic areas. These rare haplotypes are probably of
recent origin and have not yet dispersed into larger
areas. The southeastern part of Gabon had a particu-
larly large number of rare haplotypes, which suggests
that E. suaveolens has remained relatively abundant in
or near this area for a period of sufficient length to
accumulate new mutations. This region of high diver-
sity is not far from the Chaillu Mountains, which have
been proposed to be a forest refuge (Maley 1996). How-
ever, the species might also have maintained important

12 J . DUM INIL ET AL.
populations in forest galleries. This conjecture is
supported by the current distribution of the species in
West Africa, where it is typically found as relic popula-
tions in forest galleries that are surrounded by savan-
nah. In Central Africa, it is possible that many refuge
zones were dispersed throughout the region at low-alti-
tude regions of mountains or along rivers and that the
history of fragmentation ⁄ recolonization involved fre-
quent admixture. Areas that display a high level of
genetic diversity might correspond to areas with
long-standing populations or to areas in which different
lineages from different refugia have mixed (as sug-
gested by the example of tree species in Europe, Petit
et al. 2003). In Gabon, the high level of diversity of
E. suaveolens is constituted mostly of endemic and
sometimes closely related haplotypes, which supports
the hypothesis of long-standing populations. In contrast
to the pattern found in Gabon, southeast Cameroon is
dominated by a single haplotype, which suggests that
colonization by E. suaveolens occurred much more
recently in this region. It might reflect a recent expan-
sion of forest cover in southeast Cameroon. Additional
data, especially phylogenetically informative data, are
needed to explore this issue in more depth.
For both E. ivorense and E. suaveolens, the level of
genetic diversity was much higher in Gabon than in
Cameroon, especially in terms of the number of ende-
mic haplotypes. The north–south divide observed for
E. suaveolens is also apparent for Greenwanyodendron
suaveolens (Dauby et al. 2010) at cpDNA and for
Distemonanthus benthamianus (Debout et al. 2010) at nuclear
markers, which suggests that similar factors might have
acted on different species of forest trees. In particular,
this divide can be related to physical conditions that
have been more favourable historically to tropical for-
ests in Gabon than in Cameroon. First, inland Camer-
oon and Gabon experience different climates, especially
during the main dry season (Nicolas 1977; Suchel 1990;
Leroux 1993; Makanga & Boko 2000). In Gabon, the dry
season in the south (June–August) is characterized by
constant cloud cover and the absence of rainfall, which
generate lower temperatures and higher levels of rela-
tive humidity than those in Cameroon. Low tempera-
tures, low levels of evapo-transpiration and the
existence of morning dew and fog reduce the poten-
tially negative effect of this dry season on vegetation. In
contrast, the dry season in Cameroon (December–
February) is more stressful for the vegetation, because it
is sunnier, with higher temperatures and lower levels
of relative humidity. Second, the influence of cooler and
drier masses of air from the northern hemisphere is
noticeable in Cameroon, but not in Gabon, and is
assumed to have had significant effects during the
Pleistocene (Leroux 1993). Finally, attempts to recon-
struct changes in vegetation on the basis of climate also
provide support for the hypothesis because they indi-
cate that the drier periods of the Pleistocene and Holo-
cene had less impact on the fragmentation of species of
forest trees in Gabon than in Cameroon (Anhuf et al.
2006). It is likely that all these patterns are related to
past climatic events in the Pleistocene era, whereas the
current poor recruitment observed in the two species is
probably related to more recent events.
The poor recruitment of E. ivorense and E. suaveolens
might well mirror the recent history of disturbance in
the tropical lowland forests of Lower Guinea. These
species are post-pioneer light-demanding species that
recruit poorly under dense forest cover (Kouadio 2009).
The high level of disturbance in the forests some centu-
ries ago might have favoured the spread of Erythroph-
leum species that have since begun to decline as the
forest has become re-established (van Gemerden et al.
2003). This conjecture is supported by the presence of
charcoal in southeast Cameroon that dates back to
between 2000 and 200 BP (region of Mindourou,
J.-L. Doucet, data not shown), which could indicate ear-
lier slash-and-burn farming. For both species, signs of a
historic decline in population size are apparent, which
is somewhat surprising given the relative abundance of
individuals with a trunk of large diameter. It is not
obvious whether these findings reflect the poor recruit-
ment of the species after past disturbances (climatic
and ⁄ or human) of the forests during the last few thou-
sand years (van Gemerden et al. 2003), because only
relatively drastic changes in population size would be
detectable over only a few tens of generations, and the
population density is still relatively high. Given the risk
that our model is flawed because of the effects of natu-
ral selection or nonconventional modes of mutation on
the molecular markers used, evidence from multiple
nuclear markers is needed to confirm whether these
populations have been in decline.
Conclusion
We have shown that the approach proposed herein is
effective for the classification of blindly sampled indi-
viduals into two species. The approach is only feasible
if fertile herbaria are available, which highlights the
importance of herbarium collections and the need for
new collections in tropical zones in which limited pros-
pecting has been undertaken, and where new species
might well be found. Our analysis of cpDNA polymor-
phism in Erythrophleum revealed that different factors
shaped the geographic distribution of diversity in these
species. First, an ecological (rainfall) gradient seemed to
be the main factor that explained the distribution of the
cpDNA haplotypes, because the two species, which had
� 2010 Blackwell Publishing Ltd

Cp DNA SPECIES IDENTIFICATION AND PHYLOGE OGRAPHY 13
different ecological requirements, bore distinct haplo-
types and showed essentially parapatric distributions
along an east–west axis. Second, it is likely that histori-
cal demographic changes explain the unequal north–
south distribution of diversity within each species and
the detection of a phylogeographic signal in Erythroph-
leum suaveolens. In particular, the much higher levels of
diversity and the prevalence of allelic endemism in the
south (essentially Gabon) might be indicative of popula-
tions with a less recent origin in this region, which
could be related to the presence of Pleistocene forest
refuges. The low diversity in southeast Cameroon might
indicate relatively recent colonization, which could indi-
cate a concomitant expansion of the forest cover during
the Holocene. The signal of population decline, which
is difficult to interpret and potentially subject to meth-
odological flaws, must be confirmed using nuclear
genes. The role of past human disturbance on forest
dynamics requires further analyses, particularly using
highly polymorphic nuclear markers.
Acknowledgements
JD and OJH are employed by the Fund for Scientific
Research of Belgium (F.R.S.-FNRS) as a postdoctoral
researcher and research associate, respectively. JD was also
funded by the Gembloux Agricultural University (FUSAGx,
Belgium) via project PPR 10.000. MH holds a postdoctoral
research position funded by the FNRS and acknowledges a
scientific visit to the Royal Botanic Gardens, Kew, funded by
the EU Synthesys programme (GB-TAF-1305). This work was
funded by the FNRS (grants FRFC 2.4.576.07.F and MIS
F.4.519.10.F) and by the IFORA (Iles Forestieres Africaines)
project financed by the French ANR (Agence Nationale de la
Recherche) under the ANR-BIODIV program. We thank
Remy Petit and three anonymous referees for their construc-
tive comments on a previous version of the manuscript. For
their help with sampling, we also thank Tariq Stevart, Ingrid
Parmentier, Michel Arbonnier, Jean Francois Gillet, Kasso
Dainou, Guillaume Koffi, Gilles Dauby, Gabriel Debout,
Patrice Ipandi, Mambo Peter, Olivier Lachenaud, ‘equipe
Nature+ Pallisco’, Victor Nana, Raoul Niangadouma, Pulche-
rie Bissiengou, Yves Issembe, Gilbert Todou and Geo
Coppens. We thank the following institutions for providing
logistic support: the National Botanical Garden of Belgium,
IRD (Institut pour la Recherche et le Developpement, France),
IRET (Institut de Recherche en Ecologie Tropicale, Gabon)
and MBG (Missouri Botanical Garden, US). We also thank
the logging companies: Pallisco, Wijma, GIB, CIB, SFID ⁄ Rou-
gier, Alpicam-Grumcam, CUF, TRC, EMP, SIM, EFMK,
CEB ⁄ Precious Woods, CBG, Rimbunan Ijau, Mont Pele Bois,
GWT for allowing access to their concessions.
References
Anhuf D, Ledru M-P, Behling H et al. (2006) Paleo-
environmental change in Amazonian and African rainforest
� 2010 Blackwell Publishing Ltd
during the LGM. Palaeogeography, Palaeoclimatology, Palaeo-
ecology, 239, 510–527.
Aubreville A (1959) La flore forestiere de la Cote d’Ivoire,
Tome 1. Nogent-sur-Marne, Centre technique forestier
tropical (Ctft). Vol. 1, 370 p.
Aubreville A (1970) Legumineuses-Caesalpinioidees. In: Flore
du Cameroun 9 (eds Aubreville A, Leroy J-F). pp. 1–339,
Museum national d’Histoire naturelle, Paris.
Bonnefille R (2007) Rainforest responses to past climatic
changes in tropical Africa. In: Tropical Rainforest Responses to
Climatic Change (eds Bush MB, Flenley JR). pp. 117–170,
Springer, Chichester, UK.
Chiang TY, Chiang YC, Chen YJ et al. (2001) Phylogeography
of Kandelia candel in East Asiatic mangroves based on
nucleotide variation of chloroplast and mitochondrial DNAs.
Molecular Ecology, 10, 2697–2710.
Cowling SA, Cox PM, Jones CD et al. (2008) Simulated glacial
and interglacial vegetation across Africa: implications for
species phylogenies and trans-African migration of plants
and animals. Global Change Biology, 14, 827–840.
Dauby G, Duminil J, Heuertz M, Hardy OJ (2010) Chloroplast
DNA polymorphism and phylogeography of a Central
African tree species widespread in mature rainforests:
Greenwayodendron suaveolens (Annonaceae). Tropical Plant
Biology, 3, 4–13.
Debout GDG, Doucet JL, Hardy OJ (2010) Population history
and gene dispersal inferred from spatial genetic structure of
a Central African timber tree, Distemonanthus benthamianus
(Caesalpinioideae). Heredit, 104, 1–12.
Demesure B, Sodzi N, Petit RJ (1995) A set of universal
primers for amplification of polymorphic non-coding regions
of mitochondrial and chloroplast DNA in plants. Molecular
Ecology, 4, 129–131.
Depaulis F, Mousset S, Veuille M (2005) Detecting selective
sweeps with haplotype tests: hitchhiking and selective tests.
In: Selective Sweep (ed Nurminsky). pp. 34–54, Landes
Bioscience, Georgetown.
Dobes CH, Mitchell-Olds T, Koch MA (2004) Extensive
chloroplast haplotype variation indicates Pleistocene
hybridization and radiation of North American Arabis
drummondii, A. x divaricarpa, and A-holboellii (Brassicaceae).
Molecular Ecology, 13, 349–370.
Duminil J, Di Michele M (2009) Plant species delimitation: a
comparison of morphological and molecular markers. Plant
Biosystems, 143, 528–542.
Duminil J, Caron H, Scotti I, Cazal S-O, Petit RJ (2006) Blind
population genetics survey of tropical rainforest trees.
Molecular Ecology, 15, 3505–3513.
Duminil J, Hardy OJ, Petit RJ (2009) Plant traits correlated with
generation time directly affect inbreeding depression and
mating system and indirectly genetic structure. BMC
Evolutionary Biology, 9, 177.
Dutech C, Maggia L, Joly HI (2000) Chloroplast diversity in
Vouacapoua americana (Caesalpiniaceae), a neotropical forest
tree. Molecular Ecology, 9, 1427–1432.
El Mousadik A, Petit RJ (1996) Chloroplast DNA
phylogeography of the argan tree of Morocco. Molecular
Ecology, 5, 547–555.
Flenley JR (1998) Tropical forests under the climates of the last
30,000 years. Climatic Change, 39, 177–197.

14 J . DUM INIL ET AL.
van Gemerden BS, Olff H, Parren MPE, Bongers F (2003) The
pristine rain forest? Remnants of historical human impacts
on current tree species composition and diversity. Journal of
Biogeography, 30, 1381–1390.
Gonzalez MA, Baraloto C, Engel J et al. (2009) Identification of
Amazonian trees with DNA barcodes. PLoS ONE, 4(10):
e7483.
Hardy OJ, Vekemans X (2002) SPAGeDI: a versatile computer
program to analyse spatial genetic structure at the
individual or population levels. Molecular Ecology Notes, 2,
618–620.
Hawthorne WD, Jongkind C (2006) Guide to the Woody Plants of
Western Africa. Royal Botanic Gardens, Kew, U.K.
Heuertz M, Carnevale S, Fineschi S et al. (2006) Chloroplast
DNA phylogeography of European ashes, Fraxinus sp
(Oleaceae): roles of hybridization and life history traits.
Molecular Ecology, 15, 2131–2140.
Hollingsworth ML, Clark AA, Forrest LL et al. (2009) Selecting
barcoding loci for plants: evaluation of seven candidate loci
with species-level sampling in three divergent groups of
land plants. Molecular Ecology Resources, 9, 439–457.
Koffi KG, Heuertz M, Doumenge C et al. (2010) A combined
analysis of morphological traits, chloroplast and nuclear
DNA sequences with Santiria trimera (Burseraceae) suggest
several species following the biological species concept. Plant
Ecology and Evolution, 143, 160–169.
Kone I, Lambert JE, Refisch J, Bakayoko A (2008) Primate seed
dispersal and its potential role in maintaining useful tree
species in the Taı region, Cote-d’Ivoire: implications for the
conservation of forest fragments. Tropical Conservation
Science, 1, 293–306.
Kouadio L (2009) Mesures sylvicoles en vue d’ameliorer la gestion
des populations d’essences forestieres commerciales de l’Est du
Cameroun. PhD Dissertation, Faculte Universitaire des
Sciences Agronomiques de Gembloux, Gembloux, Belgium.
Kress WJ, Wurdack KJ, Zimmer EA, Weigt LA, Janzen DH
(2005) Use of DNA barcodes to identify flowering plants.
Proceedings of the National Academy of Sciences of the United
States of America, 102, 8369–8374.
Kunz BK, Linsenmair KE (2008) The role of the olive baboon
(Papio anubis, Cercopithecidae) as seed disperser in a
savanna forest mosaic of West Africa. Journal of Tropical
Ecology, 24, 235–246.
Laval G, Excoffier L (2004) SIMCOAL 2.0: a program to
simulate genomic diversity over large recombining regions
in a subdivided population with a complex history.
Bioinformatics, 20, 2485–2487.
Lee C, Wen J (2004) Phylogeny of Panax using chloroplast
trnC-trnD intergenic region and the utility of trnC-trnD in
interspecific studies of plants. Molecular Phylogenetics and
Evolution, 31, 894–903.
Leroux M (1993) The mobile polar high: a new concept
explaining present mechanisms of meridional air-mass and
energy exchanges and global propagation of palaeoclimatic
changes. Global and Planetary Change, 7, 69–93.
Letouzey R (1979) Vegetation. In: Atlas de la Republique Unie du
Cameroun, London (ed. Laclavere G). pp. 20–24, Groupe J.A,
Paris.
Ley AC, Hardy OJ (2010) Species delimitation in the Central
African herbs Haumania (Marantaceae) using georeferenced
nuclear and chloroplastic DNA sequences. Molecular
Phylogenetics and Evolution, 57, 859–867.
Li MG, Wunder J, Bissoli G et al. (2008) Development of COS
genes as universally amplifiable markers for phylogenetic
reconstructions of closely related plant species. Cladistics, 24,
727–745.
Makanga M, Boko M (2000) Nebulosite-precipitations et
facteurs geographiques en Afrique equatoriale atlantique
durant les saisons juin-aout et decembre-fevrier. Secheresse,
11, 11–17.
Maley J (1991) The African rain-forest vegetation and
paleoenvironments during late quaternary. Climatic Change,
19, 79–98.
Maley J (1992) Mise en evidence d’une pejoration climatique
entre ca 2500 et 2000 ans BP en Afrique tropicale humide.
Bulletin de la Societe Geologique de France, 163, 363–365.
Maley J (1996) Le cadre paleoenvironnemental des refuges
forestiers africains: quelques donnees et hypotheses. In: The
Biodiversity of African Plants. Proceedings of the XIVth AETFAT
Congress, Wagenningen, The Netherlands (eds Van der Maesen
LJG, Van der Burgt XM, Van Medenbach de Rooy JM) pp.
519–535, Kluwer Academic Publishers, The Netherlands.
Marret F, Maley J, Scourse J (2006) Climatic instability in west
equatorial Africa during the Mid- and Late Holocene.
Quaternary International, 150, 71–81.
Ngomanda A, Neumann K, Schweizer A, Maley J (2009)
Seasonality change and the third millennium BP rainforest
crisis in southern Cameroon (Central Africa). Quaternary
Research, 71, 307–318.
Nicolas P (1977) Contribution a l’etude phytogeographique de la
foret du Gabon. Th. Doct. 3� Cycle, Univ. Paris, France. 1: 389
P.
Olson DM, Dinerstein E, Wikramanayake ED et al. (2001)
Terrestrial ecoregions of the worlds: a new map of life on
Earth. BioScience, 51, 933–938.
Petit RJ, Excoffier L (2009) Gene flow and species delimitation.
Trends in Ecology & Evolution, 24, 386–393.
Petit RJ, Vendramin GG (2007) Plant phylogeography based on
organelle genes: an introduction. In: Phylogeography of
Southern European Refugia: Evolutionary Perspectives on the
Origins and Conservation of European Biodiversity (eds Weiss S,
Ferrand N). pp. 23–101, Springer, Heidelberg, Germany.
Petit RJ, Aguinagalde I, de Beaulieu JL et al. (2003) Glacial
refugia: hotspots but not melting pots of genetic diversity.
Science, 300, 1563–1565.
Pons O, Petit RJ (1996) Measuring and testing genetic
differentiation with ordered versus unordered alleles. Genetics,
144, 1237–1245.
Provan J, Powell W, Hollingsworth PM (2001) Chloroplast
microsatellites: new tools for studies in plant ecology and
evolution. Trends in Ecology & Evolution, 16, 142–147.
Suchel J-B (1990) Les modalites du passage du regime
climatique boreal au regime climatique austral dans le sud-
ouest camerounais. Cahier du Centre de Recherches de
Climatologie, 13, 63–76.
Vivien J, Faure JJ (1985) Arbres et forets denses d’Afrique Centrale.
Ministere des Relations Exterieures. Cooperation et
Developpement, ACT, Paris.
Weising K, Gardner RC (1999) A set of conserved PCR primers
for the analysis of simple sequence repeat polymorphisms in
� 2010 Blackwell Publishing Ltd

Cp DNA SPECIES IDENTIFICATION AND PHYLOGE OGRAPHY 15
chloroplast genomes of dicotyledonous angiosperms.
Genome, 42, 9–19.
White F (1979) The Guineo-Congolian region and its
relationships to other phytochoria. Bulletin du jardin botanique
nationale de Belgique, 49, 11–55.
Wilson IJ, Weale ME, Balding DJ (2003) Inferences from DNA
data: population histories, evolutionary processes and
forensic match probabilities. Journal of the Royal Statistical
Society. Series A, (Statistics in Society), 166, 155–188.
Zhu P, Ye WH, Wang ZF et al. (2009) Isolation and
characterization of ten polymorphic microsatellite in the
endangered tree Erythrophleum fordii oliv. Conservation
Genetics, 10, 1017–1019.
The researchers involved in this publication have collaborated
for many years in studying the ecology and population genet-
ics of tropical tree species from tropical African rainforests.
This collaboration provides an important contribution to the
understanding of tropical rainforest history in Africa according
to climate changes and anthropogenic influence. Results will
allow fundamental application in biodiversity conservation
and management.
Supporting information
Additional supporting information may be found in the online
version of this article.
Data S1 Characteristics of the 59 populations of Erythrophleum
ivorense (iv) and E. suaveolens (sua) sampled in the Lower-
Guinea phytogeographic domain.
� 2010 Blackwell Publishing Ltd
Data S2 Morphological and genetic identification of fertile
herbarium vouchers.
Data S3 Distribution of mean seed weight per family for 22
trees.
Data S4 Nested ANOVA and variance component estimation for
mean seed weight per family.
Data S5 Description and frequencies of the 19 haplotypes iden-
tified in Erythrophleum by sequencing the chloroplast
trnC ⁄ petN1R intergenic region.
Data S6 Description and frequencies of the 19 haplotypes iden-
tified in Erythrophleum by genotyping the chloroplast microsat-
ellites ccmp 2, 4 and 6.
Data S7 Color figure that integrates Figs 2 and 3 of the manu-
script.
Data S8 Number of Erythrophleum individuals bearing each
possible combination of trnC-petN1R and ccmp haplotypes.
Data S9 Distribution map of genetic diversity in Erythrophleum
at ccmp loci. Seven haplotypes with a frequency of at least 2%
are represented by different colours (legend).
Data S10 Phylogenetic analyses of the nuclear Eif fragment.
Please note: Wiley-Blackwell are not responsible for the content
or functionality of any supporting information supplied by the
authors. Any queries (other than missing material) should be
directed to the corresponding author for the article.
Copyright © 2022 FDOKUMEN