Phylogeography of Microtus longicaudus in the Tectonically and Glacially Dynamic Central Rocky...
14
PHYLOGEOGRAPHY OF MICROTUS LONGICAUDUS IN THE TECTONICALLY AND GLACIALLY DYNAMIC CENTRAL ROCKY MOUNTAINS P. A. SPAETH,* M. VAN TUINEN, Y. L. CHAN, D. TERCA, AND E. A. HADLY Department of Biology, Stanford University, Stanford, CA 94305, USA (PAS, MvT, YLC, DT, EAH) Department of Biology and Marine Biology, University of North Carolina–Wilmington, Wilmington, NC 28403, USA (MvT) Department of Zoology, University of Hawaii, Honolulu, HI 96822, USA (YLC) Present address of PAS: NESCent, Suite A200, 2024 W Main Street, Durham, NC 27705, USA The central Rocky Mountain region of North America lies at the biogeographic crossroads of the Rocky Mountains, Great Plains, and Great Basin. Here, we examine genetic patterns in an abundant, widely distributed, and ecologically important rodent species, the long-tailed vole (Microtus longicaudus), across this climatically and tectonically dynamic landscape. We examine patterns of genetic diversity in relation to the species’ overall phylogeographic distribution using mitochondrial cytochrome-b sequences from modern, historic, ancient, and published samples. Our analyses reveal extensive genetic diversity in the central Rockies, a lack of population structure, and a lack of concordance between genetic and morphological subspecies distributions. Patterns of genetic variation in late-Holocene and modern populations are similar. We conclude that geographical features such as the Continental Divide, previously isolated glacial cover, and major rivers do not result in persistent genetic structure within the long-tailed vole. We also conclude that the central Rocky Mountain region is a zone of secondary contact for divergent mitochondrial lineages of the long-tailed vole. Key words: ancient DNA (aDNA), cytochrome b, dispersal, Greater Yellowstone Ecosystem, Microtus longicaudus, phylogeography, Rocky Mountains The impacts of Quaternary glacial–interglacial cycles on genetic variation in north temperate mammal species have been extensively documented. Emerging patterns from the literature show that past climatic events have left signatures on the modern distribution of genetic diversity within species (Avise 2000; Brunsfeld et al. 2001; Carstens et al. 2005; Jaarola and Searle 2002; Rowe et al. 2004; Taberlet et al. 1998; Zheng et al. 2003), and that postglacial colonization can create variable patterns of genetic diversity. In areas that were completely glaciated by large ice sheets (Waltari et al. 2007), postglacial recovery generally leads to low levels of within- population genetic diversity because of the colonization founder effect (Hayes and Harrison 1992; Hewitt 2004; Sage and Wolff 1986) followed by rapid population expansion (Dale ´n et al. 2007; Lessa et al. 2003; Runck and Cook 2005). However, studies from the biogeographically complex Rocky Mountains have revealed high-diversity zones of secondary contact that have arisen since the last glacial maximum (Brunsfeld et al. 2001; Demboski and Sullivan 2003; Good and Sullivan 2001; Hafner et al. 1998; Knowles 2001; Swenson and Howard 2005). The impacts of glacial disturbances on genetic diversity reflect both the geological history of the region and the ecological character of the taxon in question (DeChaine and Martin 2005). On a landscape scale, the effects of deglaciation and climatic warming on the distributions of mammalian species differ in timing and magnitude, according to local conditions (Lessa et al. 2003). The central Rocky Mountains region is a topographically complex, tectonically active landscape that has been heavily influenced by Quaternary glacial cycles. One of North America’s hot spots of modern vertebrate species diversity, the Greater Yellowstone Ecosystem (GYE) is located in the heart of the central Rockies. The GYE refers to a geographic area including parts of Montana, Wyoming, and Idaho, encompassing about 30,000 km 2 centered around the high- elevation Yellowstone Plateau (Bruzgul and Hadly 2007). This central, high-elevation area was glaciated until approx- imately 14,000 years ago (Gennett and Baker 1986; Pierce * Correspondent: [email protected] E 2009 American Society of Mammalogists www.mammalogy.org Journal of Mammalogy, 90(3):571–584, 2009 571
-
Upload
independent -
Category
Documents
-
view
0 -
download
0
Transcript of Phylogeography of Microtus longicaudus in the Tectonically and Glacially Dynamic Central Rocky...

PHYLOGEOGRAPHY OF MICROTUS LONGICAUDUS IN THETECTONICALLY AND GLACIALLY DYNAMIC CENTRALROCKY MOUNTAINS
P. A. SPAETH,* M. VAN TUINEN, Y. L. CHAN, D. TERCA, AND E. A. HADLY
Department of Biology, Stanford University, Stanford, CA 94305, USA (PAS, MvT, YLC, DT, EAH)Department of Biology and Marine Biology, University of North Carolina–Wilmington, Wilmington, NC 28403, USA(MvT)Department of Zoology, University of Hawaii, Honolulu, HI 96822, USA (YLC)Present address of PAS: NESCent, Suite A200, 2024 W Main Street, Durham, NC 27705, USA
The central Rocky Mountain region of North America lies at the biogeographic crossroads of the Rocky
Mountains, Great Plains, and Great Basin. Here, we examine genetic patterns in an abundant, widely
distributed, and ecologically important rodent species, the long-tailed vole (Microtus longicaudus), across this
climatically and tectonically dynamic landscape. We examine patterns of genetic diversity in relation to the
species’ overall phylogeographic distribution using mitochondrial cytochrome-b sequences from modern,
historic, ancient, and published samples. Our analyses reveal extensive genetic diversity in the central Rockies,
a lack of population structure, and a lack of concordance between genetic and morphological subspecies
distributions. Patterns of genetic variation in late-Holocene and modern populations are similar. We conclude
that geographical features such as the Continental Divide, previously isolated glacial cover, and major rivers do
not result in persistent genetic structure within the long-tailed vole. We also conclude that the central Rocky
Mountain region is a zone of secondary contact for divergent mitochondrial lineages of the long-tailed vole.
Key words: ancient DNA (aDNA), cytochrome b, dispersal, Greater Yellowstone Ecosystem, Microtus longicaudus,
phylogeography, Rocky Mountains
The impacts of Quaternary glacial–interglacial cycles on
genetic variation in north temperate mammal species have
been extensively documented. Emerging patterns from the
literature show that past climatic events have left signatures on
the modern distribution of genetic diversity within species
(Avise 2000; Brunsfeld et al. 2001; Carstens et al. 2005;
Jaarola and Searle 2002; Rowe et al. 2004; Taberlet et al.
1998; Zheng et al. 2003), and that postglacial colonization can
create variable patterns of genetic diversity. In areas that were
completely glaciated by large ice sheets (Waltari et al. 2007),
postglacial recovery generally leads to low levels of within-
population genetic diversity because of the colonization
founder effect (Hayes and Harrison 1992; Hewitt 2004; Sage
and Wolff 1986) followed by rapid population expansion
(Dalen et al. 2007; Lessa et al. 2003; Runck and Cook 2005).
However, studies from the biogeographically complex Rocky
Mountains have revealed high-diversity zones of secondary
contact that have arisen since the last glacial maximum
(Brunsfeld et al. 2001; Demboski and Sullivan 2003; Good
and Sullivan 2001; Hafner et al. 1998; Knowles 2001;
Swenson and Howard 2005). The impacts of glacial
disturbances on genetic diversity reflect both the geological
history of the region and the ecological character of the taxon
in question (DeChaine and Martin 2005). On a landscape
scale, the effects of deglaciation and climatic warming on the
distributions of mammalian species differ in timing and
magnitude, according to local conditions (Lessa et al. 2003).
The central Rocky Mountains region is a topographically
complex, tectonically active landscape that has been heavily
influenced by Quaternary glacial cycles. One of North
America’s hot spots of modern vertebrate species diversity,
the Greater Yellowstone Ecosystem (GYE) is located in the
heart of the central Rockies. The GYE refers to a geographic
area including parts of Montana, Wyoming, and Idaho,
encompassing about 30,000 km2 centered around the high-
elevation Yellowstone Plateau (Bruzgul and Hadly 2007).
This central, high-elevation area was glaciated until approx-
imately 14,000 years ago (Gennett and Baker 1986; Pierce
* Correspondent: [email protected]
E 2009 American Society of Mammalogistswww.mammalogy.org
Journal of Mammalogy, 90(3):571–584, 2009
571
1979; Whitlock and Bartlein 1993; Fig. 1, inset). The ice cap
that covered this area was up to 1.6 km thick and 40–80 km
wide (Fig. 1, inset). It was an isolated glacial feature,
separated by 240 km from the southern edge of the continental
ice sheets and surrounded by lower, open, unglaciated terrain
(Pierce 1979). Pollen data from the GYE document a rapid
colonization of the deglaciated terrain by plants beginning
14,000 years ago. Modern plant communities in the area were
established by approximately 4,000 years ago (Gennett and
Baker 1986; Whitlock and Bartlein 1993).
Despite the extensive Pleistocene glacial cover throughout
this region, Rocky Mountain endemic species persisted in
glacial refugia (Brunsfield and Sullivan 2005; Good and
Sullivan 2001; Knowles 2001). Information from the distri-
bution of chloroplast lineages of a highly restricted endemic
plant (Constance’s bittercress [Cardamine constancei]) con-
firms the existence of Pleistocene refugia for plant species in
the central Rocky Mountains (Brunsfield and Sullivan 2005).
Knowles (2001) and DeChaine and Martin (2005) suggest that
repeated glaciation promoted divergence in some alpine insect
species. High genetic diversity also has been documented in
the endemic red-tailed chipmunk (Tamias ruficaudus—Good
and Sullivan 2001). In this species, the Bitterroot Range of the
central Rockies represents a zone of secondary contact
between highly divergent modern subclades. Introgression
between the red-tailed chipmunk and another montane
chipmunk species also occurs in this region (Good et al.
2003). High genetic diversity and complex phylogeographic
patterns also were found in the endemic Uinta ground squirrel
(Spermophilus armatus—van Tuinen et al. 2008).
In contrast to the attention received by endemic species,
phylogenetic investigation of widespread species occurring in
the central Rockies has been less frequent. Here, we examine
patterns of postglacial genetic diversity and biogeographic
connectivity in a wide-ranging generalist, the long-tailed vole
(Microtus longicaudus). M. longicaudus is a small-bodied
(,100-g), granivorous rodent with broad habitat tolerances.
Long-tailed voles are capable of rapid long-distance dispersal
(males have been observed to travel up to 1 km during
summer [Jenkins 1948]). Long-tailed voles currently occupy
large areas of previously glaciated North America (Hall 1981;
Smolen and Keller 1987; Fig. 1) and are among the 1st
colonizers of disturbed habitats in montane ecosystems (Hall
1981; Smolen and Keller 1987). The species is found in a
variety of habitat types, ranging from closed canopies (spruce–
fir forests, aspen groves, willow stands, and alder stands) to
open grasslands (Smolen and Keller 1987). The broad
physiological tolerances, high rates of reproduction, and
generalist ecological niche of the long-tailed vole may
contribute to its high local abundance and large geographic
range.
The modern geographic range of M. longicaudus stretches
along the Rocky Mountains from southern Arizona to northern
Canada (including areas previously covered by the Laurentide,
FIG. 1.—Western North America and the southern portion of the range of Microtus longicaudus. Circles represent localities sampled for this
study. Circle size corresponds to sample size. Colors correspond to haplogroup designations: blue represents individuals from the Northwest
Clade; yellow represents individuals from the Central Clade; red represents individuals from the Southern Rockies Clade (see text for a
description of the clade designations). The previous sampling across the species range performed by Conroy and Cook (2000a) is represented by
the colored areas. Inset shows sampling localities of long-tailed voles in the Greater Yellowstone Ecosystem. Circles represent samples of
different sizes at each locality (for details, see appendices): blue represents individuals from the Northwest Clade; yellow represents individuals
from the Central Clade. The boundary of the Yellowstone ice cap is shown in red. The fossil localities are designated by ‘‘x’’ symbols.
572 JOURNAL OF MAMMALOGY Vol. 90, No. 3
Cordilleran, and isolated Rocky Mountain ice sheets) and
extends east to South Dakota and west to the Pacific Ocean
(Fig. 1; Hall 1981). Of the 14 described morphological
subspecies, only 1 (M. l. longicaudus—Smolen and Keller
1987; Tamarin 1985) is found in the central Rocky Mountains,
including the GYE. This morphological homogeneity suggests
that the central Rocky Mountain region is home to an
interbreeding, homogeneous population of long-tailed voles
(Hall 1981), distinct morphologically from long-tailed voles in
adjacent parts of the range (M. l. halli 400 km to the west and
M. l. latus 400 km to the south [Smolen and Keller 1987;
Tamarin 1985]).
A previous phylogeographic investigation of this species
(Conroy and Cook 2000a) focused on populations in the
Pacific Northwest, but also contained sampling from else-
where in the species’ range, with the notable exception of the
central Rocky Mountains. Conroy and Cook (2000a) docu-
mented rapid postglacial recolonization of the northwestern
portion of the species’ range by 1 of 4 allopatric lineages of M.longicaudus. They proposed that the deep genetic divergences
among these haplogroups reflect the cumulative effects of
older Quaternary glacial–interglacial cycles (Conroy and Cook
2000a). Each of the 4 geographically disjunct mitochondrial
cytochrome-b (Cytb) clades (Island, Northwest, Central, and
Southern Rockies) was found in a different biogeographic
province of western North American (Conroy and Cook
2000a), suggesting that the Continental Divide (dividing
eastern and western populations) and the Green River
(dividing northern and southern populations) may be historical
or current barriers to gene flow, or both. Conroy and Cook
(2000a) described the distribution of haplogroups based on
their sampling (Fig. 1), but they did not sample the middle of
the species’ range. The degree of Cytb divergence among the 4
lineages (6% uncorrected sequence divergence) was not
unusually high for a vole or lemming species (Conroy and
Cook 2000a, 2000b; Fedorov et al. 2003; Fink et al. 2004;
Galbreath and Cook 2004; Hadly et al. 2004; Jaarola et al.
2004; Jaarola and Searle 2002).
We combined mitochondrial data from recent and subfossil
specimens collected in the recently glaciated center of the
GYE. The data enable us to describe several thousand years of
population dynamics of M. longicaudus in the region. Genetic
data from recent specimens were collected in order to draw
conclusions about past evolutionary processes via phyloge-
netic inference (Avise 2000). By adding prehistoric population
samples, we built an even more complete picture of these
historical patterns and processes (Anderson et al. 2005; Hadly
et al. 2004). Ancient data may uncover evolutionary patterns
that could not have been observed in modern data (Leonard
et al. 2000). Alternatively, ancient data may be concordant
with modern data, demonstrating temporal stability of
population processes (Hadly et al. 1998, 2004; Leonard et al.
2000).
The integration of modern and subfossil data has already
contributed to our understanding of complex patterns of
genetic variation in other small mammals of the central Rocky
Mountains. In a study of the closely related montane vole (M.montanus), a combined modern and ancient DNA data set
revealed changing patterns of haplotype diversity over time
(Hadly et al. 2004). These results were interpreted to reflect
past pulses of immigration that would not have been
detectable via modern sampling alone. We examined several
aspects of the genetic structure of long-tailed voles in the
central Rocky Mountains. First, we described phylogeographic
patterns within the central (previously unsampled) part of the
long-tailed vole’s range and related them to the larger
phylogeographic structure of the species. Second, we exam-
ined genetic diversity in ancient and modern populations of
long-tailed voles with respect to population structure and size.
Third, we tested the hypothesis that genetic diversity within
the GYE arose since the last deglaciation (approximately
14,000 years ago).
We had several expectations based on previous phylogeo-
graphic investigations in this region and our knowledge of the
target species. The central Rocky Mountains is a biogeo-
graphic crossroads that has been patchily disturbed by
Pleistocene glaciation. Therefore, we expected that the
phylogeography of the long-tailed vole in this region would
be complex and variable, as is the case with other local
species. The initial phylogeographic description of this species
suggests that the Central, Northwest, and Southern Rockies
clades that abut the study area may contribute to genetic
diversity in the area.
Similarly, we anticipated high genetic diversity in modern
populations, paralleling what has been seen in other species in
the area (Good and Sullivan 2001). We expected examination
of the ancient DNA data to reveal genetic patterns that are
concordant with the modern observations, reflecting the
operation of similar population processes over millennial
timescales. In particular, we expected that frequent, long-
distance dispersal that is characteristic of long-tailed voles
would result in populations with similar levels of genetic
diversity across all sampled time points. Finally, we expected
that the genetic divergence of mitochondrial DNAs (mtDNAs)
from modern voles in this region would predate the last glacial
maximum.
MATERIALS AND METHODS
Sampling.—We used data from a variety of specimens to
thoroughly sample modern and late-Holocene diversity. Our
sampling of M. longicaudus in the GYE region consisted of 46
modern tissues, 3 specimens from owl pellets, 35 museum
skins, and 29 subfossils from the GYE and surrounding areas
(Appendices I and II).
Modern tissues.—We collected genetic samples from 46
modern specimens collected with Sherman live traps (H. B.
Sherman Traps, Inc., Tallahassee, Florida) and 3 specimens
from owl pellets in the central Rocky Mountains. We collected
specimens from locations within the GYE that were not
previously glaciated (Beaverhead County and Gallatin Coun-
ty, Montana; Appendix I), locations in the GYE that were
June 2009 SPAETH ET AL.—PHYLOGEOGRAPHY OF MICROTUS LONGICAUDUS 573

previously glaciated (specimens from Teton County, Park
County, and Sublette County, Wyoming; and Park County and
Beaverhead County, Montana; Appendix I), and from loca-
tions in the central Rocky Mountains outside the GYE proper
(specimens from Lake County and Fergus County, Montana;
Appendix I). Trapping was performed in accordance with
guidelines approved by the American Society of Mammalo-
gists (Gannon et al. 2007). Several voles were collected and
vouchered at the University of California Museum of
Vertebrate Zoology; however, many of the animals were
trapped during ongoing ecological experiments (Spaeth 2009)
and were therefore not vouchered.
Complete Cytb sequences (1,143 base pairs [bp]) were
obtained from modern samples by extraction from liver tissue
or skin clips and amplification via the previously published
primer pairs MVZ05–Micro06 and Arvic07–Vole14 (Hadly
et al. 2004). Owl pellet material was amplified and sequenced
following the protocols used on the late-Holocene specimens
(below). New DNA sequences have been deposited in
GenBank under accession numbers EF028803–EF028912.
Museum specimens.—We also included samples of skin
clips from museum specimens. These specimens were
collected in the central Rocky Mountains (n 5 28) and
northern Rocky Mountains (n 5 7; Appendix I: specimens
listed from the MVZ, CRCM, and KU). These specimens were
collected at various times in the 20th and 21st centuries
(Appendix I).
Mitochondrial DNA from museum specimens was extracted
in the same building that houses our ancient DNA facility, but
museum specimens were processed in a separate room with
designated reagents, ensuring spatial separation from modern
and ancient specimens. Additionally, museum specimens were
extracted by researchers who had not worked in the modern
laboratory for at least 1 year. Small (,1-cm2) pieces of skin
were clipped from the venter of the museum specimens and
the fur was removed with a sterile razor blade. The extraction
procedure was performed using a Qiagen DNEasy Tissue Kit
(Qiagen, Valencia, California), with overnight incubation at
55uC in a Proteinase-K buffer solution. After extraction, DNA
was amplified with primers previously used for ancient
specimens of M. montanus (see ‘‘Amplification and authen-tication of ancient mitochondrial sequences’’ below [Hadly
et al. 2004]).
Late-Holocene specimens.—We obtained ancient DNA from
teeth identified morphologically as Microtus from 2 Holocene,
bushy-tailed woodrat (Neotoma cinerea) midden sites in the
central GYE, Lamar Cave (Fig. 1, inset; Hadly 1996; Porder
et al. 2003) and Waterfall Locality (Fig. 1, inset; Porder et al.
2003). Remarkable preservation combined with the well-
studied stratigraphy in both deposits allows for genetic
sampling of individuals of Microtus from well-dated sediment
layers.
The collection radius (the area surrounding the paleonto-
logical site from which the fossil remains originated) has been
calculated for each site based on stable isotope signatures of
the fossil remains and local bedrock (Feranec et al. 2007;
Porder et al. 2003). The collection radii for Lamar Cave and
Waterfall Locality are 7 km and 15 km, respectively (Feranec
et al. 2007; Porder et al. 2003). The radii are small, suggesting
that the paleontological sites accurately record local commu-
nity compositions over the last several millennia (Feranec et
al. 2007; Porder et al. 2003).
Isolated teeth of M. longicaudus are morphologically
indistinguishable from the teeth of another locally abundant
vole, M. montanus. A total of 75 teeth of Microtus from 15
levels (dating from 0 to 2,000 years ago [Feranec et al. 2007;
Hadly 1996; Porder et al. 2003]) of Lamar Cave were sampled
for the Cytb extractions. We genetically identified 17 teeth
from 6 time intervals from Lamar Cave as M. longicaudus (the
majority were found to be M. montanus [n 5 46—Hadly et al.
2004]). Fifteen teeth of Microtus from 4 time intervals (dating
from 0 to 2,400 years ago [Feranec et al. 2007; Hadly 1996;
Porder et al. 2003]) from Waterfall Locality were sampled,
yielding 12 M. longicaudus. To avoid resampling the same
individual, all teeth we analyzed from temporal units and
surface deposits were right upper 1st molars (Appendix II).
Amplification and authentication of ancient mitochondrialsequences.—Ancient DNA was successfully extracted from
teeth (n 5 29) and amplified according to polymerase chain
reaction protocols described by Hadly et al. (2003, 2004),
which were designed to prevent contamination of ancient
samples. For each ancient DNA specimen, a 312-bp portion of
the Cytb gene was amplified in 2 or 3 overlapping fragments
according to protocols described by Hadly et al. (2004). We
targeted a region of Cytb gene previously shown to be
informative in phylogeographic reconstruction of closely
related Microtus species (Hadly et al. 2004). We used the
following primer pairs: forward primer CLETH 37L (start
position: Cytb 311) and reverse primer ARVIC 08L (start
position: Cytb 471); and forward primer MMONT 1
(start position: Cytb 452) and reverse primer MMONT 2L
(start position: Cytb 653). If the 2nd, larger fragment failed to
amplify, we obtained shorter fragments using the following
internal primers: forward primer MMONT 3 (start position:
Cytb 485) and reverse primer MMONT 4 (start position: Cytb595). Ancient DNA sequences from both strands were used to
assemble 312-bp contigs. Polymerase chain reactions were run
on a Gene Amp PCR system 9700 thermal cycler (Perkin-
Elmer, Waltham, Massachusetts) using the following program:
initial step of 95uC for 10 min; 45 cycles of 95uC for 30 s,
45uC for 30 s, and 72uC for 30 s; and a final 10-min 72uCextension.
Ancient sequencing was performed on an ABI PRISM 310
sequencer (Perkin-Elmer) in our ancient DNA facility.
Modern sequencing reactions were run on an ABI PRISM
377 sequencer at a separate sequencing facility at Stanford
University. A full description of our extraction, controls, and
sequencing protocols has been previously published (Hadly
et al. 2003, 2004).
Confirmation of sequence data was performed via cloning
of representative ancient samples (n 5 3) following the
protocol of Hadly et al. (2003). Fifteen to 20 transformed
574 JOURNAL OF MAMMALOGY Vol. 90, No. 3
colonies per individual were sequenced with M13 primers.
Clones were compared to the original sequence obtained for
the individual, and the differences among the clones and the
original sequence were scored. We checked for the presence of
additional, viable mtDNA sequences among the cloned
sequences that might indicate contamination of the specimen.
We also examined patterns of variation across the codon
positions to determine the level of degradation of the specimen
(Appendix III).
We checked for the presence of nuclear inserts and DNA
damage in all of our sampled individuals by examining
patterns of substitution. Specifically, we checked for the
accumulation of stop codons, 1st and 2nd position changes
that are indicative of nuclear insertion, and an overabundance
of A:T pairs indicative of cytosine deamination (Hadly et al.
2003; Hofreiter et al. 2001; Paabo et al. 2004).
Statistical analysis.—Phylogenetic relationships among
sequences were examined through maximum-likelihood
analysis in PAUP* 4.0b10 (Swofford 2002), using a
neighbor-joining topology as the starting tree, a heuristic
search, and tree-bisection-reconnection branch swapping. The
best model of molecular evolution under Akaike’s information
criterion was determined using Modeltest 3.0 (Posada and
Crandall 1998). Trees were rooted using the closely related
outgroup vole species M. montanus and M. pennsylvanicus(Conroy and Cook 2000b). Previously published sequences (1
representative of each haplotype identified by Conroy and
Cook [2000a]) were used in phylogenetic analyses.
We built a tree based on the entire Cytb gene for the subset
of voles from our field-trapped specimens and previously
published sequences. This expansive data set enabled us to
ascertain more precisely the degree of monophyly and
geographic reach of the clades described by Conroy and Cook
(2000a). We also built a tree based on the 312-bp region of the
Cytb gene from all ancient and modern specimens. We used
this analysis to identify possible source populations of GYE
voles.
Additionally, we generated a statistical parsimony haplo-
type network in TCS version 1.21 (Clement et al. 2000), using
the 312-bp region we obtained from all ancient and modern
GYE specimens (n 5 96). We examined the distances among
haplotypes and their frequencies in the modern and ancient
populations. We performed analyses of molecular variance
(AMOVAS) in ARLEQUIN version 3.0 (Schneider et al. 1999)
and estimated FST-values and their significance by running
1,000 permutations of haplotypes between populations. We
calculated Tajima’s D for the modern and ancient populations
in order to examine patterns of nonneutral evolution.
We explored temporal genetic patterns using a variety of
techniques. We used the program BEAST (Drummond and
Rambaut 2003; Drummond et al. 2005) to perform a Bayesian
skyline analysis that enabled us to examine population size
fluctuations over the last 3,500 years based on our subfossil
samples from different points in the past (‘‘heterochronous
samples’’; Drummond et al. 2005). We ran BEAST 4 times
independently for 200 million iterations using a separate
substitution model for each codon position. This enabled us to
estimate overall demographic patterns and potential fluctua-
tions in the effective population size (Ne) that would indicate
population decline or expansion.
We used an AMOVA approach to examine the distribution
of genetic variation between modern and ancient populations
in the GYE and among serial samples from the fossil
localities. We implemented this test in ARLEQUIN version 3.0
(Schneider et al. 1999) and estimated FST-values and their
significance by running 1,000 permutations of haplotypes
between populations. We used the temporal AMOVA to
determine whether significant changes in genetic structure
have occurred over the recent evolutionary history of the long-
tailed vole. We interpreted temporal genetic structure
(differences in haplotypes and their frequencies) as the
signature of temporally explicit changes in population
connectivity over the fossil time span. A lack of temporal
genetic structure implies that the populations are genetically
homogenous and similar over time.
We tested whether genetic divergences of lineages within
the GYE coincided with the relatively recent time of
deglaciation of the GYE (14,000 years ago). We used a
conservative approach in estimation of divergence times from
our data because molecular estimates of divergence times may
carry extensive errors (Conroy and van Tuinen 2003; van
Tuinen and Hadly 2004). A conservative approach is
particularly useful for examining the correlation of haplotype
divergence with the timing of Pleistocene ice ages. We set the
divergence between the Southern Rockies Clade and all
remaining clades in M. longicaudus to 0.34 6 0.07 SE million
years ago (mya), following Conroy and Cook (2000a). We
used corrected genetic distances based on the same model
previously used (Kimura 2-parameter—Conroy and Cook
2000a) and hierarchical likelihood-ratio tests to confirm that
the data did not deviate significantly from a molecular clock.
We then calibrated average genetic distances to estimate the
average divergence time. We also estimated a minimum
divergence time using the minimum (younger) value of the
95% confidence interval surrounding the calibration point.
Minimum divergence estimates .0.014 mya were interpreted
as rejection of the hypothesis that the diversity of voles in the
GYE arose since deglaciation.
RESULTS
Authentication of mitochondrial sequence.—We obtained
complete Cytb sequences (1,143 bp) from 49 modern
specimens and partial Cytb sequences (312 bp) from 35 skin
and 31 subfossil specimens. Nucleotide base composition was
similar to previously reported values for other Microtusspecies (26.9% cytosine, 28.35% thymine, 29.18% adenine,
and 16.38% guanine [Conroy and Cook 2000b; Hadly et al.
2004]). The variation across codon positions for the modern
and ancient mitochondrial sequences (3rd position: 82% of
variable sites; 2nd position: 4% of variable sites; and 1st
position: 14% of variable sites) was consistent with the
June 2009 SPAETH ET AL.—PHYLOGEOGRAPHY OF MICROTUS LONGICAUDUS 575
expected pattern of variation in the mammalian Cytb gene and
voles in particular (Conroy and Cook 2000a; Hadly et al.
2004). There were 78 variable sites total. Sixty-six of 78
pairwise base-pair differences were synonymous 3rd-position
changes and 73 of 78 pairwise base-pair differences were
transitions, consistent with the expectations of mitochondrial
evolution in rodents (Irwin et al. 1991). The transition : trans-
version ratios of the modern and ancient data sets were 7.4 and
7.0, respectively.
Divergent sequences that appeared to be nuclear mitochon-
drial inserts (numts) were amplified in 6 modern specimens,
using a primer pair spanning 312 bp of Cytb. Phylogenetic
analyses revealed that these sequences (GenBank accession
numbers FJ457016–FJ457021) were numts that were mono-
phyletic and sister to the rest of our samples of M.longicaudus. Subsequent amplifications with different primers
spanning a longer fragment (600 bp) yielded the true
mitochondrial Cytb sequence for 3 of these samples (clustering
them within the Central Clade), confirming that the shorter
fragments were indeed numts. The remaining 3 samples did
not yield any sequence, leading us to suspect that they were
highly degraded.
Interestingly, the numt sequences had not accumulated stop
codons and were not significantly different from mitochon-
drial GC content and substitution bias. We conclude that a
single recent insertion (close to the origination of the species)
into the nuclear genome likely underlies this pattern.
Phylogeography.—We constructed a maximum-likelihood
tree from 111 complete Cytb sequences, including 71
complete sequences published by Conroy and Cook (2000a)
and 40 sequences from our modern sampling in and around the
GYE. The best-fit model (TVM+G+I) for this data set
accounted for separate mutation rate categories for each
transitional substitution type, for the proportion of invariant
sites (Pinv 5 0.66) and for among-site rate heterogeneity
(alpha 5 2.03). In agreement with Conroy and Cook (2000a),
the maximum-likelihood phylogeny under this model indicat-
ed monophyly with intermediate bootstrap support for
Northwest, Island, Central, and Southern Rockies clades
(Fig. 2), with the Southern Rockies Clade sister to the Central
and Northwest + Island clades. Most livetrapped voles from
Montana and Wyoming were assigned to the Central Clade.
This result is expected based on the proximity of the central
Rockies to the previously described limits of this clade in
southern Montana and Idaho (Fig. 1). However, voles from the
Wind River Range (Wyoming) and the Beartooth Plateau
(Montana) were most closely related to members of the
Northwest Clade, in particular to voles from Utah and
Arizona. Previously, intermediate support (56% bootstrap
support) was found for placing these latter individuals in a
monophyletic sister group to the Northwest + Island group,
which includes individuals from Alaska, British Columbia
(Canada), northern Oregon, and Washington (Conroy and
Cook 2000a). Instead, we found moderate bootstrap support
for placement of the Arizona, Utah, Wind River, and
Beartooth individuals within the Northwest Clade, most
closely related to a group of Oregon, Washington, and British
Columbia voles.
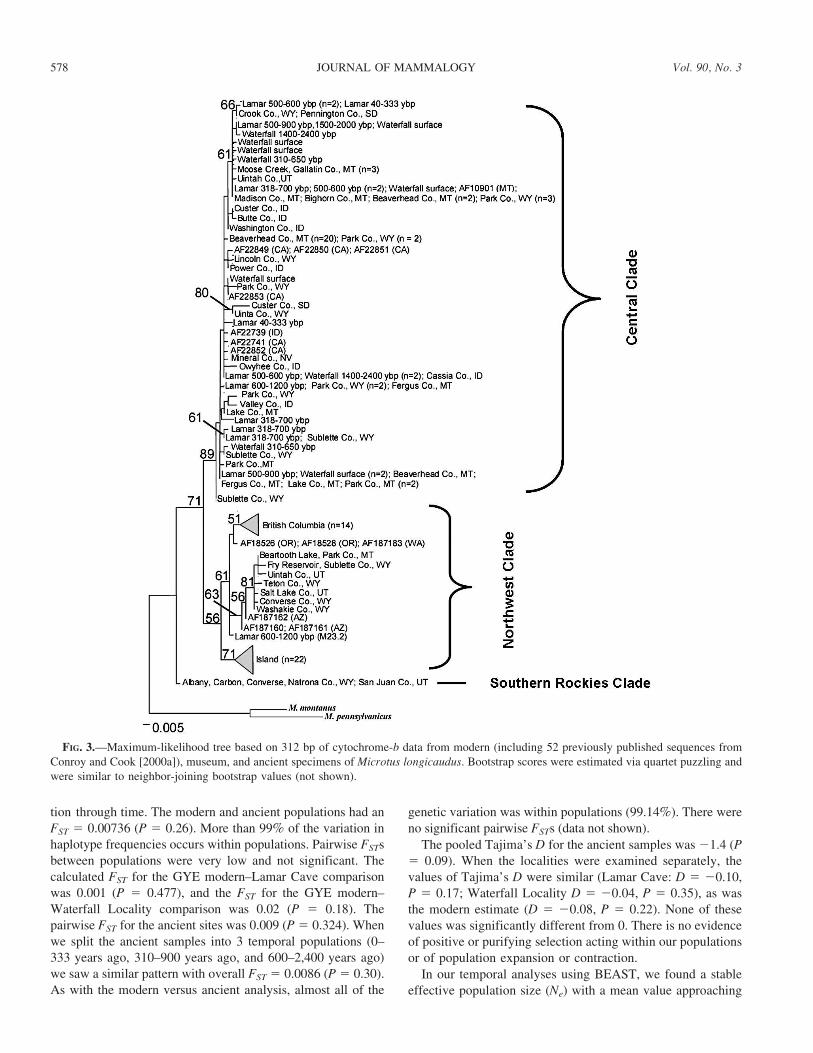
We supplemented our sampling in Wyoming, Montana,
Idaho, and Utah with museum specimens, owl pellet samples,
and late-Holocene subfossils. Because of the older age of these
specimens, we used the 312-bp fragment of the Cytb gene that
was sequenced for all specimens. We constructed a maximum-
likelihood tree using a HKY+I+G model of molecular
evolution (Fig. 3). In this 2nd analysis, monophyly for the
major clades was again confirmed (Northwest, Island, and
Central) with the exception of the Southern Rockies Clade,
which appeared as a paraphyletic group. Because none of the
voles found in the GYE fell within the Southern Rockies
Clade, we collapsed the latter to a single branch. For the same
reason, the Island Clade and mainland Alaska voles were
represented by single branches in Fig. 3. The majority of GYE
and the central Rocky Mountain specimens were part of the
Central Clade, including all of the Idaho samples and all but 1
of the ancient DNA samples. Museum specimens from the
Black Hills extended the geographic extent of the Central
Clade into South Dakota.
Concordant with the modern samples, museum specimens
from Utah and Wyoming expanded the geographic range of
the unique grouping of Arizona, Utah, Montana, and
Wyoming voles as far east as Medicine Bow National Forest,
Wyoming. We again found intermediate bootstrap support for
the expanded Arizona and Utah group within the Northwest
Clade (61% bootstrap support), closest to a weakly supported
group of voles from British Columbia, Washington, and
northern Oregon (51% bootstrap support). One unusual
subfossil sample from Lamar Cave, found in a 600- to
1,200-year-old unit, constituted a unique haplotype not found
in other modern or ancient samples. This specimen also fell
within the Northwest Clade (61% bootstrap support) and
formed a polytomy with voles from British Columbia, Alaska,
Washington, and Oregon (51% bootstrap support monophyly),
and the expanded Arizona and Utah Clade (63% bootstrap
support monophyly). Despite the inability to place this
individual among specimens of the Northwest Clade with
stronger bootstrap support, our analyses revealed that it was
not a member of the Central or Southern Rockies clades.
Neither the grouping of individuals from the 2 fossil localities
together nor from each locality alone was monophyletic.
Levels of gene and haplotype diversity were similar between
modern and ancient samples (see below), which were time-
averaged over several thousand generations. Thus, modern,
museum, and subfossil samples all reflect evidence of
dispersal and genetic admixture in the central portion of the
species’ range.
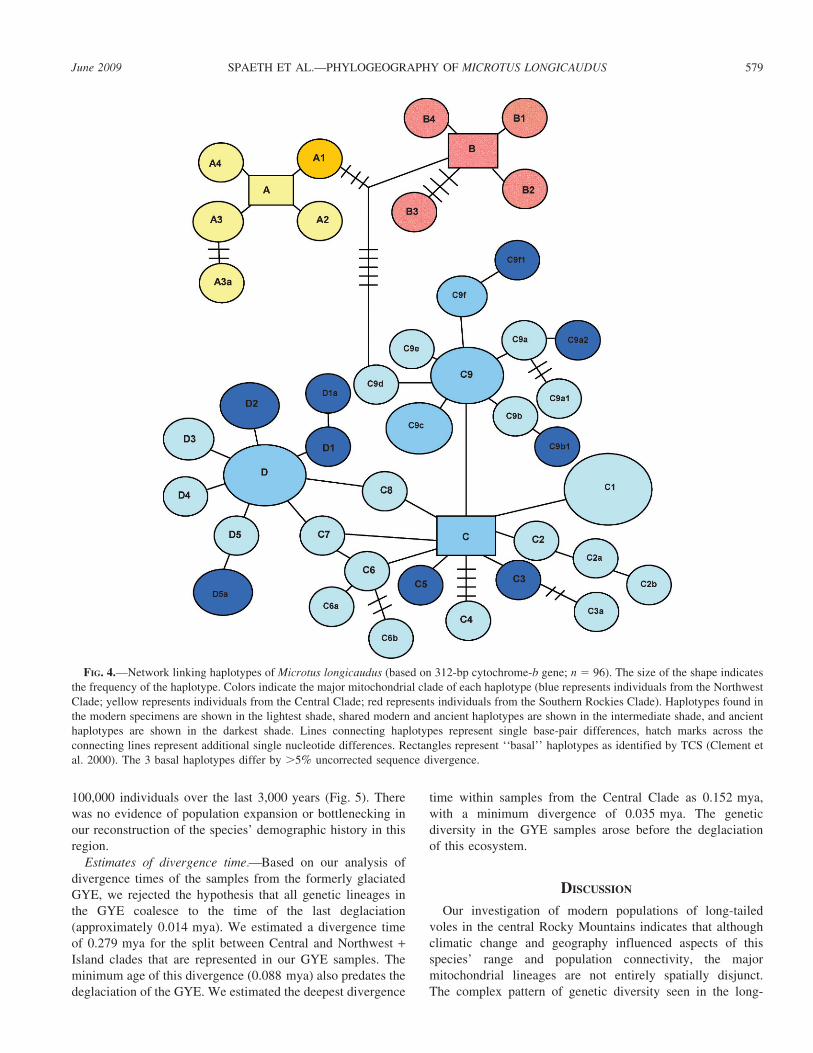
Patterns of diversity.—We identified a total of 44 haplo-
types in our samples from all locations and temporal intervals
(from 96 voles). We present a haplotype network of the
modern and ancient haplotypes in Fig. 4. Of the 44
haplotypes, 5 were shared by both modern and ancient
populations, 12 were exclusively ancient, and 27 were
exclusively modern. Twelve of the ancient haplotypes were
576 JOURNAL OF MAMMALOGY Vol. 90, No. 3

unique, and the remaining 17 were shared with modern
individuals from the central Rockies. One ancient sample was
a member of the Northwest Clade (haplotype A1) and the
remainder were members of the Central Clade (Fig. 4).
Modern specimens were found in all 3 haplogroups. All
haplotypes shared by modern and museum specimens were
found within the Central Clade (Fig. 4).
Genetic diversity was high and variation was distributed
uniformly among sampled groups over the last several
millennia. The gene diversity seen in modern GYE voles
was high (0.88) and similar to the values seen in the pooled
ancient voles (0.95). The AMOVA in which we examined
patterns of haplotype variation in modern GYE and ancient
populations did not reveal significant population differentia-
FIG. 2.—Maximum-likelihood tree of complete cytochrome-b data of Microtus longicaudus with bootstrap scores based on quartet puzzling.
Previously published sequences are combined with our new samples (denoted by geographic locale).
June 2009 SPAETH ET AL.—PHYLOGEOGRAPHY OF MICROTUS LONGICAUDUS 577
tion through time. The modern and ancient populations had an
FST 5 0.00736 (P 5 0.26). More than 99% of the variation in
haplotype frequencies occurs within populations. Pairwise FSTs
between populations were very low and not significant. The
calculated FST for the GYE modern–Lamar Cave comparison
was 0.001 (P 5 0.477), and the FST for the GYE modern–
Waterfall Locality comparison was 0.02 (P 5 0.18). The
pairwise FST for the ancient sites was 0.009 (P 5 0.324). When
we split the ancient samples into 3 temporal populations (0–
333 years ago, 310–900 years ago, and 600–2,400 years ago)
we saw a similar pattern with overall FST 5 0.0086 (P 5 0.30).
As with the modern versus ancient analysis, almost all of the
genetic variation was within populations (99.14%). There were
no significant pairwise FSTs (data not shown).
The pooled Tajima’s D for the ancient samples was 21.4 (P5 0.09). When the localities were examined separately, the
values of Tajima’s D were similar (Lamar Cave: D 5 20.10,
P 5 0.17; Waterfall Locality D 5 20.04, P 5 0.35), as was
the modern estimate (D 5 20.08, P 5 0.22). None of these
values was significantly different from 0. There is no evidence
of positive or purifying selection acting within our populations
or of population expansion or contraction.
In our temporal analyses using BEAST, we found a stable
effective population size (Ne) with a mean value approaching
FIG. 3.—Maximum-likelihood tree based on 312 bp of cytochrome-b data from modern (including 52 previously published sequences from
Conroy and Cook [2000a]), museum, and ancient specimens of Microtus longicaudus. Bootstrap scores were estimated via quartet puzzling and
were similar to neighbor-joining bootstrap values (not shown).
578 JOURNAL OF MAMMALOGY Vol. 90, No. 3
100,000 individuals over the last 3,000 years (Fig. 5). There
was no evidence of population expansion or bottlenecking in
our reconstruction of the species’ demographic history in this
region.
Estimates of divergence time.—Based on our analysis of
divergence times of the samples from the formerly glaciated
GYE, we rejected the hypothesis that all genetic lineages in
the GYE coalesce to the time of the last deglaciation
(approximately 0.014 mya). We estimated a divergence time
of 0.279 mya for the split between Central and Northwest +Island clades that are represented in our GYE samples. The
minimum age of this divergence (0.088 mya) also predates the
deglaciation of the GYE. We estimated the deepest divergence
time within samples from the Central Clade as 0.152 mya,
with a minimum divergence of 0.035 mya. The genetic
diversity in the GYE samples arose before the deglaciation
of this ecosystem.
DISCUSSION
Our investigation of modern populations of long-tailed
voles in the central Rocky Mountains indicates that although
climatic change and geography influenced aspects of this
species’ range and population connectivity, the major
mitochondrial lineages are not entirely spatially disjunct.
The complex pattern of genetic diversity seen in the long-
FIG. 4.—Network linking haplotypes of Microtus longicaudus (based on 312-bp cytochrome-b gene; n 5 96). The size of the shape indicates
the frequency of the haplotype. Colors indicate the major mitochondrial clade of each haplotype (blue represents individuals from the Northwest
Clade; yellow represents individuals from the Central Clade; red represents individuals from the Southern Rockies Clade). Haplotypes found in
the modern specimens are shown in the lightest shade, shared modern and ancient haplotypes are shown in the intermediate shade, and ancient
haplotypes are shown in the darkest shade. Lines connecting haplotypes represent single base-pair differences, hatch marks across the
connecting lines represent additional single nucleotide differences. Rectangles represent ‘‘basal’’ haplotypes as identified by TCS (Clement et
al. 2000). The 3 basal haplotypes differ by .5% uncorrected sequence divergence.
June 2009 SPAETH ET AL.—PHYLOGEOGRAPHY OF MICROTUS LONGICAUDUS 579

tailed vole in the central Rocky Mountains is similar to
observations in locally endemic species (Brunsfeld and
Sullivan 2005; Good and Sullivan 2001; Knowles 2001).
However, the phylogeography of the long-tailed vole differs
from the genetic patterns seen in endemic species in 1 major
way: in the central Rocky Mountains, genetic diversity is high
because of the presence of haplogroups that had previously
been detected hundreds of miles away, in different portions of
this wide-ranging species’ distribution.
Examination of our GYE data reveals the co-occurrence of
the Central and Northern mitochondrial haplogroups. Addi-
tional analysis of museum specimens from a 500-km-radius
area surrounding the GYE suggests that the presence of
individuals from the Northwest and Central haplogroups and
correspondingly high levels of genetic diversity are charac-
teristic of the larger geographic region of the central Rockies.
Additionally, the Southern Rockies haplogroup occurs in this
region in parts of Wyoming. Given the previous findings of
Conroy and Cook (2000a), we could not have predicted this
pattern.
The regional data lead us to conclude that long-tailed voles
have dispersed across prominent geographic features. Individ-
uals from the Northwest and Central clades can be found on
both sides of the Continental Divide, as well as the Snake
River, Green River, and Missouri River. Intensive sampling
has enabled us to determine that these major rivers and
mountain ranges are not complete barriers to dispersal in this
species.
At the center of our study area lies the GYE. Within-
population genetic diversity in the GYE is high, paralleling the
high diversity in the entire region. Our late-Holocene
specimens from the GYE harbor at least 2 mitochondrial
lineages (Central and Northwest clades). The most common
haplogroup (the Central Clade) in the ancient population also
is the most common group in the region today. Furthermore,
haplotypes from the Northwest Clade, previously identified in
populations north of 45u latitude, were represented in Lamar
Cave from 600 to 1,200 years ago and also were found in
modern populations in the Beartooth Mountains, Montana, and
Jackson Hole and the Wind River Mountains, Wyoming. The
pattern of co-occurrence of these haplogroups in ancient and
modern populations suggests stable millennial-scale coexis-
tence of multiple mitochondrial lineages in this ecosystem.
Postglacial colonizers of the GYE are from at least 2 genetic
clades with potentially different geographic origins. The
phylogenetic analyses suggest that passage from the northern
Rockies or the Great Plains, or both, and the Great Basin onto
the previously glaciated Yellowstone Plateau was possible for
this small mammal species.
In combination with the regional central Rocky Mountain
data, we conclude that although dispersal from outside this
region may have been possible, our data can be most
parsimoniously interpreted to suggest that diverse populations
containing several mitochondrial lineages were present in the
vicinity of the GYE during the last glacial maximum. This
would have enabled the rapid colonization of the central GYE
by several haplogroups, as we have observed. Adjacent parts
of the central Rocky Mountains in areas of southern Montana,
Idaho, and Wyoming were not under glacial ice cover during
the last glacial maximum and may have been home to
genetically diverse populations of M. longicaudus. The lack of
structure across the larger region of the central Rocky
Mountains prevents us from ascertaining more about the
precise source population of the postglacial colonizers. This
same lack of structure illustrates a very important aspect of the
species’ biology: M. longicaudus in this area does not exhibit
population-level spatial or temporal genetic differentiation.
We extend our understanding of this species’ geographic
distribution in this region during the last glacial maximum via
analysis of spatially and temporally sampled mtDNA. We
build upon the fossil data that are available to expand the
probable prior distribution of the species. The distribution of
fossil M. longicaudus since the last glacial maximum shows
the species present in the southern extent of its current range,
central Nevada and Utah, eastern Montana, Colorado, and
Wyoming, and a few extralimital southern sites (Graham et al.
1996). The high diversity across the region in the modern and
recent past (last 3,000 years) strongly suggests regional
persistence of this species through the last glacial maximum.
We conclude that the central Rocky Mountains are a zone of
secondary contact for long-tailed voles. The diversity of
haplogroups in this region is higher than has been previously
detected (Conroy and Cook 2000a). We found more support
for this area as a zone of secondary contact from our molecular
clock analysis. We recovered deep divergence-time estimates
among our sampled populations. The haplotypes coalesced to
an ancestral population that is older than the most recent
glacial maximum. Therefore, we conclude that the GYE
genetic diversity indicates that this area is a zone of secondary
contact, although our sampling indicates that it is part of a
larger area of admixture. This zone of admixture spans the
central part of this species’ range, which is at the
biogeographic crossroads of several ecological biomes
FIG. 5.—Bayesian Skyline plot showing estimated effective
population size (Ne) of populations of Microtus longicaudus in the
Greater Yellowstone Ecosystem estimated from temporal samples
(Appendix II) over the last 3,000 years.
580 JOURNAL OF MAMMALOGY Vol. 90, No. 3

(Bruzgul and Hadly 2007). The high-diversity populations that
have arisen since deglaciation in this region are an interesting
counterexample to previously described low levels of genetic
variation found in other populations occupying areas disturbed
by continental ice sheets (Conroy and Cook 2000a).
The results of the Tajima’s D and the Bayesian skyline
analyses were concordant and present a picture of populations
of long-tailed voles that have consistently maintained high
effective population sizes temporally and spatially. In order to
put the results of our temporal AMOVA into context, we
performed the same analysis on previously published se-
quences (Hadly et al. 2004) of M. montanus from the same
fossil localities examined in the same temporal units. In
contrast to the lack of structure seen in M. longicaudus,
significant FST-values occur in all temporal comparisons
conducted on M. montanus (pairwise FST-values range from
0.199 to 0.245 [all P-values , 0.01]; n 5 53), reflecting
pulses of gene flow that occurred in this species between 1,200
and 600 years ago (Hadly et al. 2004).
High levels of genetic diversity and lack of population
structure in this region indicate that the single subspecies
found in this region (M. l. longicaudus) is not genetically
distinct from other morphologically defined subspecies. The
Central mitochondrial haplogroup has been found in individ-
uals from M. l. longicaudus, M. l. halli, M. l. abditus, M. l.angusticeps, and M. l. sierrae; the Northwest haplogroup
overlaps with the distributions of M. l. longicaudus, M. l.littoralis, M. l. macrurus, and M. l. vellerosus. A more detailed
morphological analysis may provide insight into the relation-
ship between evolutionary lineages and morphotypes in this
species.
Several modern studies of genetic connectivity within the
central Rocky Mountains have yielded quantitatively similar
phylogeographic results. Good and Sullivan (2001) reported
high levels of genetic diversity among red-tailed chipmunks in
areas north of the GYE. The researchers detected a zone of
secondary contact (Good and Sullivan 2001) of highly
divergent mitochondrial lineages. Similarly, Knowles (2001)
found that glacial and postglacial processes led to the mixing
of lineages within the grasshopper Melanoplus oregonensis in
montane regions around the GYE. These studies and our
results suggest that postglacial movement in the central Rocky
Mountains may foster the assembly of populations with high
genetic diversity.
The large zone of admixture also resembles patterns seen
elsewhere. Using ancient DNA, Hofreiter et al. (2004)
observed that mobile species have dynamic phylogeographic
patterns. Over intermediate timescales of hundreds to
thousands of years, against a background of glacial–intergla-
cial cycles, dispersal exerts a strong influence on population
structure. This pattern has been seen in large- and small-
bodied mammals in the Americas and Eurasia (Dalen et al.
2007; Hadly et al. 2004; Hofreiter et al. 2004; Leonard et al.
2000; Matheus et al. 2004; Vila et al. 1999).
When examined at the continental scale, M. longicaudusappeared to display the genetic structure of a ‘‘typical’’
postglacial colonizer: genetically diverse in the south and
genetically homogeneous in the north (Conroy and Cook
2000a). Our modern, museum, and subfossil data supplement
these findings and reveal a geographically complex pattern in
the central portion of this species’ range. Collectively, these
results illustrate how landscape and life-history traits result in
unique patterns of postglacial recovery in different parts of a
species’ range.
ACKNOWLEDGMENTS
We thank J. Payne, R. Dirzo, S. Palumbi, T. Root, N. Anich, S.
Price, P. Durst, V. L. Roth, T. Roberts, members of the Hadly Lab,
editor C. Krajewski, and 2 anonymous reviewers for insightful
comments on this manuscript. We thank C. J. Conroy for laboratory
work during the initial phase of this project, J. E. Bruzgul for
assistance with the figures, and D. Petrov for use of his laboratory for
processing modern DNA. We appreciate the specimen loans provided
by C. J. Conroy at the University of California Museum of Vertebrate
Zoology, N. Slade at the Kansas University Natural History Museum
and Biodiversity Research Center, R. Johnston of the Charles R.
Conner Museum, and J. P. Sullivan at the University of Idaho. Funds
for this project were provided by National Science Foundation grant
DEB 0108541 to EAH; and by the American Society of Mammal-
ogists, the American Museum of Natural History Roosevelt Memorial
Grant, and the Center for Evolutionary Studies at Stanford University
to PAS.
LITERATURE CITED
ANDERSON, C. N. K., U. RAMAKRISHNAN, Y. L. CHAN, AND E. A. HADLY.
2005. Serial SimCoal: a population genetic model for data from
multiple populations and points in time. Bioinformatics 21:1733–
1734.
AVISE, J. C. 2000. Phylogeography. Harvard University Press,
Cambridge, Massachusetts.
BRUNSFELD, S. J., AND J. SULLIVAN. 2005. A multi-compartmented
glacial refugium in the northern Rocky Mountains: evidence from
the phylogeography of Cardamine constancei (Brassicaceae).
Conservation Genetics 6:895–904.
BRUNSFELD, S. J., J. SULLIVAN, D. E. SOLTIS, AND P. S. SOLTIS. 2001.
Comparative phylogeography of northwestern North America: a
synthesis. Pp. 319–339 in Integrating ecology and evolution in a
spatial context (J. Silvertown and J. Antonovics, eds.). Blackwell
Science, London, United Kingdom.
BRUZGUL, J. E., AND E. A. HADLY. 2007. Non-random patterns in the
Yellowstone Ecosystem: inferences from mammalian body size,
order, and biogeographic affinity. Global Ecology and Biogeog-
raphy 2:139–148.
CARSTENS, B. C., S. J. BRUNSFELD, J. R. DEMBOSKI, J. M. GOOD, AND J.
SULLIVAN. 2005. Investigating the evolutionary history of the
Pacific Northwest mesic forest ecosystem: hypothesis testing
within a comparative phylogeographic framework. Evolution
59:1639–1652.
CLEMENT, M., D. POSADA, AND K. A. CRANDALL. 2000. TCS: a
computer program to estimate gene genealogies. Molecular
Ecology 9:1657–1659.
CONROY, C. J., AND J. A. COOK. 2000a. Phylogeography of a post-
glacial colonizer: Microtus longicaudus (Rodentia: Muridae).
Molecular Ecology 9:165–175.
June 2009 SPAETH ET AL.—PHYLOGEOGRAPHY OF MICROTUS LONGICAUDUS 581

CONROY, C. J., AND J. A. COOK. 2000b. Molecular systematics of a
Holarctic rodent (Microtus: Muridae). Journal of Mammalogy
81:344–359.
CONROY, C. J., AND M. VAN TUINEN. 2003. Extracting time from
phylogenies: positive interplay between fossil and genetic data.
Journal of Mammalogy 84:444–455.
DALEN, L., ET AL. 2007. Ancient DNA reveals lack of postglacial
habitat tracking in the arctic fox. Proceedings of the National
Academy of Sciences 104:6726–6729.
DECHAINE, E. G., AND A. P. MARTIN. 2005. Historical biogeography of
two alpine butterflies in the Rocky Mountains: broad-scale
concordance and local-scale discordance. Journal of Biogeography
32:1943–1956.
DEMBOSKI, J. R., AND J. SULLIVAN. 2003. Extensive mtDNA variation
within the yellow-pine chipmink, Tamias amoenus (Rodentia:
Sciuridae), and phylogeographic inferences for northwest North
America. Molecular Phylogenetics and Evolution 26:389–408.
DRUMMOND, A. J., AND A. RAMBAUT. 2003. BEAST v. 1.4.5. http://
best.bio.ed.as.uk/main_page. Accessed July 2008.
DRUMMOND, A. J., A. RAMBAUT, B. SHAPIRO, AND O. G. PYBUS. 2005.
Bayesian coalescent inference of past population dynamics from
molecular sequences. Molecular Biology and Evolution 22:1185–
1192.
FEDOROV, V. B., A. V. GOROPASHNAYA, M. JAAROLA, AND J. A. COOK.
2003. Phylogeography of lemmings (Lemmus): no evidence for
postglacial colonization of the Arctic from the Beringian refugium.
Molecular Ecology 12:725–731.
FERANEC, R. S., E. A. HADLY, AND A. PAYTAN. 2007. Determining
landscape use of Holocene mammals using strontium isotopes.
Oecologia 153:943–950.
FINK, S., L. EXCOFFIER, AND G. HECKEL. 2004. Mitochondrial gene
diversity in the common vole Microtus arvalis shaped by historical
divergence and local adaptation. Molecular Ecology 13:3501–3514.
GALBREATH, K. E., AND J. A. COOK. 2004. Genetic consequences of
Pleistocene glaciations for the tundra vole (Microtus oeconomus) in
Beringia. Molecular Ecology 13:135–148.
GANNON, W. L., R. S. SIKES, AND THE ANIMAL CARE AND USE COMMITTEE
OF THE AMERICAN SOCIETY OF MAMMALOGISTS. 2007. Guidelines of
the American Society of Mammalogists for the use of wild
mammals in research. Journal of Mammalogy 88:809–823.
GENNETT, J. A., AND R. G. BAKER. 1986. A late-Quaternary pollen
sequence from Blacktail Pond, Yellowstone National Park,
Wyoming, USA. Palynology 10:61–72.
GOOD, J. M., J. R. DEMBOSKI, D. W. NAGORSEN, AND J. SULLIVAN. 2003.
Phylogeography and introgressive hybridization: chipmunks (ge-
nus Tamias) in the northern Rocky Mountains. Evolution 57:1900–
1916.
GOOD, J. M., AND J. SULLIVAN. 2001. Phylogeography of the red-tailed
chipmunk (Tamias ruficaudus), a northern Rocky Mountain
endemic. Molecular Ecology 10:2683–2695.
GRAHAM, R. W., ET AL. 1996. Spatial response of mammals to late
Quaternary environmental fluctuations. Science 272:1601–1606.
HADLY, E. A. 1996. Influence of late-Holocene climate on northern
Rocky Mountain mammals. Quaternary Research 46:298–310.
HADLY, E. A., M. H. KOHN, J. A. LEONARD, AND R. K. WAYNE. 1998. A
genetic record of population isolation in pocket gophers during
Holocene climatic change. Proceedings of the National Academy
of Sciences 95:6893–6896.
HADLY, E. A., ET AL. 2004. Genetic response to climatic change:
insights from ancient DNA and phylochronology. PLoS Biology
2:e290.
HADLY, E. A., M. VAN TUINEN, Y. CHAN, AND K. HEIMAN. 2003. Ancient
DNA evidence of prolonged population persistence with negligible
genetic diversity in an endemic tuco-tuco (Ctenomys sociabilis).
Journal of Mammalogy 84:403–417.
HAFNER, M. S., J. W. DEMASTES, D. J. HAFNER, T. A. SPRADLING, P. A.
SUDMAN, AND S. A. NADLER. 1998. Age and movement of a hybrid
zone: implications for dispersal distance in pocket gophers and
their chewing lice. Evolution 52:278–282.
HALL, E. R. 1981. The mammals of North America. Wiley, New York.
HAYES, J. P., AND R. G. HARRISON. 1992. Variation in mitochondrial
DNA and the biogeographic histories of woodrats (Neotoma) of the
eastern United States. Systematic Biology 41:331–344.
HEWITT, G. M. 2004. Genetic consequences of climatic oscillations in
the Quaternary. Philosophical Transactions of the Royal Society of
London, B. Biological Sciences 359:183–195.
HOFREITER, M., V. JAENICKE, D. SERRE, A. vON HAESELER, AND S.
PAABO. 2001. DNA sequences from multiple amplifications reveal
artifacts induced by cytosine deamination in ancient DNA. Nucleic
Acids Research 29:4793–4799.
HOFREITER, M., ET AL. 2004. Lack of phylogeography in European
mammals before the last glaciation. Proceedings of the National
Academy of Sciences 101:12963–12968.
IRWIN, D. M., T. D. KOCHER, AND A. C. WILSON. 1991. Evolution of the
cytochrome b gene of mammals. Journal of Molecular Evolution
32:128–144.
JAAROLA, M., ET AL. 2004. Molecular phylogeny of the speciose vole
genus Microtus (Arvicolinae: Rodentia) inferred from mitochondrial
DNA sequences. Molecular Phylogenetics and Evolution 33:647–663.
JAAROLA, M., AND J. B. SEARLE. 2002. Phylogeography of field voles
(Microtus agrestis) in Eurasia inferred from mitochondrial DNA
sequences. Molecular Ecology 11:2613–2621.
JENKINS, H. O. 1948. A population study of the meadow mice
(Microtus) in three Sierra Nevada Meadows. Proceedings of the
California Academy of Sciences 26:43–67.
KNOWLES, L. L. 2001. Did the Pleistocene glaciations promote
divergence? Tests of explicit refugial models in montane
grasshoppers. Molecular Ecology 10:691–701.
LEONARD, J. A., R. K. WAYNE, AND A. COOPER. 2000. Population
genetics of Ice Age brown bears. Proceedings of the National
Academy of Sciences 97:1651–1654.
LESSA, E. P., J. A. COOK, AND J. L. PATTON. 2003. Genetic footprints of
demographic expansion in North America, but not in Amazonia,
during the late Quaternary. Proceedings of the National Academy
of Sciences 100:10331–10334.
MATHEUS, P., J. BURNS, J. WEINSTOCK, AND M. HOFREITER. 2004.
Pleistocene brown bears in the mid-continent of North America.
Science 306:1150.
PAABO, S., ET AL. 2004. Genetic analysis from ancient DNA. Annual
Review of Genetics 38:645–679.
PIERCE, K. L. 1979. History and dynamics of glaciation in the northern
Yellowstone National Park area. United States Geological Survey
Professional Paper 79F:1–90.
PORDER, S., A. PAYTAN, AND E. A. HADLY. 2003. Mapping the origin of
faunal assemblages using strontium isotopes. Paleobiology
29:197–204.
POSADA, D., AND K. A. CRANDALL. 1998. Modeltest: testing the model
of DNA substitution. Bioinformatics 14:817–818.
ROWE, K. C., E. J. HESKE, P. W. BROWN, AND K. N. PAIGE. 2004.
Surviving the ice: northern refugia and post-glacial colonization.
Proceedings of the National Academy of Sciences 101:10355–
10359.
582 JOURNAL OF MAMMALOGY Vol. 90, No. 3
RUNCK, A. M., AND J. A. COOK. 2005. Postglacial expansion of the
southern red-backed vole (Clethrionomys gapperi) in North
America. Molecular Ecology 14:1445–1456.
SAGE, R. D., AND J. O. WOLFF. 1986. Pleistocene glaciations,
fluctuations, and low genetic diversity in a large mammal (Ovisdalli). Evolution 40:1092–1095.
SCHNEIDER, S., D. ROESSLI, AND L. EXCOFFIER. 1999. ARLEQUIN: a
software for population genetics data analysis. Version 2.0.
Genetics and Biometry Laboratory, Department of Anthropology,
University of Geneva, Geneva, Switzerland.
SMOLEN, M. J., AND B. L. KELLER. 1987. Microtus longicaudus.
Mammalian Species 271:1–7.
SPAETH, P. A. 2009. Morphological convergence and coexistence in
three sympatric North American species of Microtus (Rodentia:
Arvicolinae). Journal of Biogeography 36:350–361.
SWENSON, N. G., AND D. J. HOWARD. 2005. Clustering of contact zones,
hybrid zones and phylogeographic breaks in North America.
American Naturalist 166:581–591.
SWOFFORD, D. L. 2002. PAUP*: phylogenetic analysis using
parsimony (*and other methods), version 4. Sinauer Associates,
Inc., Publishers, Sunderland, Massachusetts.
TABERLET, P., L. FUMAGALLI, A. G. WUST-SAUCY, AND J. F. COSSON.
1998. Comparative phylogeography and postglacial colonization
routes in Europe. Molecular Ecology 7:453–464.
TAMARIN, R. H. 1985. Biology of the New World Microtus. Special
Publication 8, The American Society of Mammalogists.
VAN TUINEN, M., AND E. A. HADLY. 2004. Calibration and error in
placental molecular clocks: a conservative approach using the
cetartiodactyl fossil record. Journal of Heredity 95:200–208.
VAN TUINEN, M., K. O’KEEFE, U. RAMAKRISHNAN, AND E. A. HADLY.
2008. Fire and ice: genetic structure of the Uinta ground squirrel
(Spermophilus armatus) across the Yellowstone Hotspot. Molec-
ular Ecology 17:1776–1788.
VILA, C., ET AL. 1999. Mitochondrial DNA phylogeography and
population history of the grey wolf Canis lupus. Molecular
Ecology 8:2089–2103.
WALTARI, E., R. J. HIJMANS, A. T. PETERSON, A. S. NYARI, S. L.
PERKINS, AND R. P. GURALNICK. 2007. Locating Pleistocene refugia:
comparing phylogeographic and ecological niche model predic-
tions. PLoS ONE 2:e563.
WHITLOCK, C., AND P. J. BARTLEIN. 1993. Spatial variations of
Holocene climatic change in the Yellowstone region. Quaternary
Research 39:231–238.
ZHENG, X., B. S. ARBOGAST, AND G. J. KENAGY. 2003. Historical
demography and genetic structure of sister species: deermice
(Peromyscus) in the North American temperate rain forest.
Molecular Ecology 12:711–724.
Submitted 30 June 2008. Accepted 25 November 2008.
Associate Editor was Carey W. Krajewski.
APPENDIX ISpecimen records of modern and museum individuals used in our
analyses. Field number acronyms are: PAS: specimens collected by P.
A. Spaeth; YC: specimens collected by Y. L. Chan; EH and EB:
specimens collected by E. A. Hadly; MVZ: University of California
Museum of Vertebrate Zoology; KU: Kansas University Natural
History Museum and Biodiversity Research Center; CRCM:
Washington State University Conner Museum. Field specimens were
handled according to guidelines of the American Society of
Mammalogists (Gannon et al. 2007) and Stanford University’s
Institutional Animal Care and Use Ccommittee protocol 10284. Field
numbers are followed by the extraction numbers and year of
collection (in parentheses). All specimens from the Greater Yellow-
stone Ecosystem and adjacent regions of the central Rocky
Mountains were assigned a haplotype via network analysis (Fig. 4).
Modern owl pellets.—Park County, Wyoming: Lamar Valley: EB-
93-204B, M 17.1 (1993), C1; EB-93-204, M 17.2 (1993), C9a1; EH-
92-132, M 9.4 (1992), C3a.
Modern tissues.—Madison County, Montana: Black Butte: MVZ
202797, M 43.1 (2002), C10; Beaverhead County, Montana: Red
Rock Lakes National Wildlife Refuge: PAS-03-M39, M 153.3
(2003), C1; PAS-03-BL2, M 155.4 (2003), C1; PAS-03-BL3, M
155.5 (2003), C1; PAS-03-BL8, M 155.6 (2003), C1; PAS-03-ALB,
M 158.1 (2003), C1; PAS-03-AL3, M 158.2 (2003), C1; PAS-03-
AL4, M 158.3 (2003), C1; PAS-03-AL6, M 158.4 (2003), C1; PAS-
03-AL7, M 158.5 (2003), C9; PAS-03-AL11, M 158.6 (2003), C10;
PAS-03-AL13, M 158.7 (2003), C1; PAS-04-01, M 87.1 (2004), C1;
PAS-04-10, M 87.2 (2004), C1; PAS-04-11, M 87.3 (2004), C1; PAS-
04-21, M 87.6 (2004), C10; PAS-04-27, M 88.1 (2004), C1; PAS-04-
44, M 88.10 (2004), C1; PAS-04-48, M 88.11 (2004), C1; PAS-04-
29, M 88.2 (2004), C1; PAS-04-33, M 88.4 (2004), C1; PAS-04-35,
M 88.5 (2004), C1; PAS-04-36, M 88.6 (2004), C1; PAS-04-37, M
88.7 (2004), C1. Fergus County, Montana: Little Snowy Mountains:
YC-03-064, M 71.2 (2003), C9c. Gallatin County, Montana: Moose
Creek: YC-04-007, M 61.7 (2004), C8; YC-04-008, M 61.8 (2004),
C8; YC-04-009, M 61.9 (2004), C8. Lake County, Montana: Swan
Valley: EH-02-07, M 38.2 (2002), C9; EH-02-08, M 38.3 (2002),
C9a. Park County, Montana: Beartooth Lake: YC-03-095, M 56.6
(2003), A3; Eagle Creek: YC-03-103, M 51.2 (2003), C9e; Hensley
Creek: YC-03-044, M 57.1 (2003), C9; YC-03-056, M 57.4 (2003),
C9; YC-03-084, M 71.3 (2003), C9; YC-03-068, M 79.10 (2003), C9.
Park County, Wyoming: Little America: YC-04-078, M 74.2 (2004),
C1; Ojo Caliente: YC-04-029, M 70.5 (2004), C10; YC-04-030, M
71.4 (2004), C10; YC-04-032, M 71.5 (2004), C10; Slough Creek:
YC-04-127, M 71.8 (2004), C9c; YC-04-022, M 70.2 (2004), C9c.
Sublette County, Wyoming: YC-04-185, M 72.8 (2004), A3a; Big
Sandy: YC-04-189, M 76.6 (2004), C9f; Fry Reservoir: MVZ
202803, M 44.4 (2002), C9d; Trail’s End: YC-04-212, M 77.4
(2004), C9f.
Museum skins.—British Columbia, Canada: Atlin: MVZ 34451, M
66.3 (1924); MVZ 34452, M 66.4 (1924); Desolation Sound: MVZ
129359, M 68.3 (1960); MVZ 129360, M 68.4 (1960); Kingcome
Inlet: MVZ 129362, M 68.5 (1960); Stikine River: MVZ 30810, M
67.1 (1919); MVZ 30812, M 67.3 (1919). Butte County, Idaho:
Oakley: CRCM-041330, M 82.8 (1949), C6. Cassia County, Idaho:
Mt. Harrison: CRCM-041329, M 82.7 (1949), C. Owyhee County,
Idaho: Silver City: CRCM-041310, M 82.5 (1950), C4. Power
County, Idaho: Heglar Pass: CRCM-041345, M 82.4 (1949), C2.
Valley County, Idaho: Little Payette Lake: CRCM-041307, M 82.3
(1949), C6b. Washington County, Idaho: Brownlee R.S.: CRCM-
041304, M 82.2 (1954), C7. Big Horn County, Montana: Custer: KU
18407, M 90.3 (1946), C10. Custer County, South Dakota: Bear
Creek: CRCM-041318, M 82.6 (1949), C6a; Custer: KU 87871, M
90.4 (1961). Pennington County, South Dakota: Hill City: KU
101484, M 90.5 (1965). Salt Lake County, Utah: Solitude Ski Resort:
CRCM-04608, M 82.1 (1967). San Juan County, Utah: Monticello:
KU 63312, M 90.1 (1954); KU 63313, M 90.2 (1954). Uintah County,
Utah: Vernal: KU 38082, M 91.1 (1950); KU 38083, M 91.2 (1950).
Albany County, Wyoming: Brown’s Peak: KU 17393, M 91.3 (1946),
June 2009 SPAETH ET AL.—PHYLOGEOGRAPHY OF MICROTUS LONGICAUDUS 583
B3; Class Lake: KU 91251, M 91.4 (1947), B1. Carbon County,
Wyoming: Rawlins: KU 20632, M 92.1 (1947), B. Converse County,
Wyoming: Glenrock: KU 81805, M 92.3 (1959), A4; Orin: KU
42124, M 92.2 (1951), B4. Crook County, Wyoming: Moorcroft: KU
87873, M 92.4 (1961), C10e. Lincoln County, Wyoming: Alpine: KU
37807, M 92.6 (1950), C2a. Natrona County, Wyoming: Casper: KU
42149, M 92.7 (1951), B2; KU 42150, M 92.8 (1951), B. Sweetwater
County, Wyoming: Rock Springs: KU 42153, M 93.3 (1951), A3. Teton
County, Wyoming: MVZ 136903, M 20.4 (1928), A2. Uinta County,
Wyoming: Robertson: KU 26272, M 93.4 (1948), C2b. Washakie
County, Wyoming: Tensleep: KU 20666, M 93.5 (1947), A.
APPENDIX IISubfossil specimens used in analyses. For each site, all specimens
are listed by their extraction number. Age (years ago) appears in
parentheses, followed by the haplotype designated via network
analysis (Fig. 4).
Waterfall Locality.—M 30.3 (0), C9; M 30.4 (0), C10b; M 31.1 (0),
C3; M 31.2 (0), C10; M 31.3 (0), C10d; M 32.1 (0), C10c; M 32.2 (0),
C9; M 32.4 (310–650), C10a; M 3.3 (310–650), C9b1; M 32.3
(1,400–2,400), C10a1; M 3.1 (1,400–2,400), C; M 3.2 (.2,400),
C10b.
Lamar Cave.—M 29.2 (40–333), C10e1; M 29.3 (40–333), C5; M
37.1 (318–700), C10; M 24.2 (318–700), C9a2; M 25.1 (318–700),
C9f1; M 34.3 (318–700), C9f; M 24.3 (500–600), C10; M 25.3 (500–
600), C10e1; M 35.1 (500–600), C; M 35.5 (500–600), C10e1; M
16.2 (500–600), C10; M 13.1 (500–900), C9; M 13.2 (500–900), C10;
M 8.1 (500–900), C10b; M 23.1 (600–1,200), C9c; M 23.2 (600–
1,200), A1; M 5.2 (1,500–2,000), C10b.
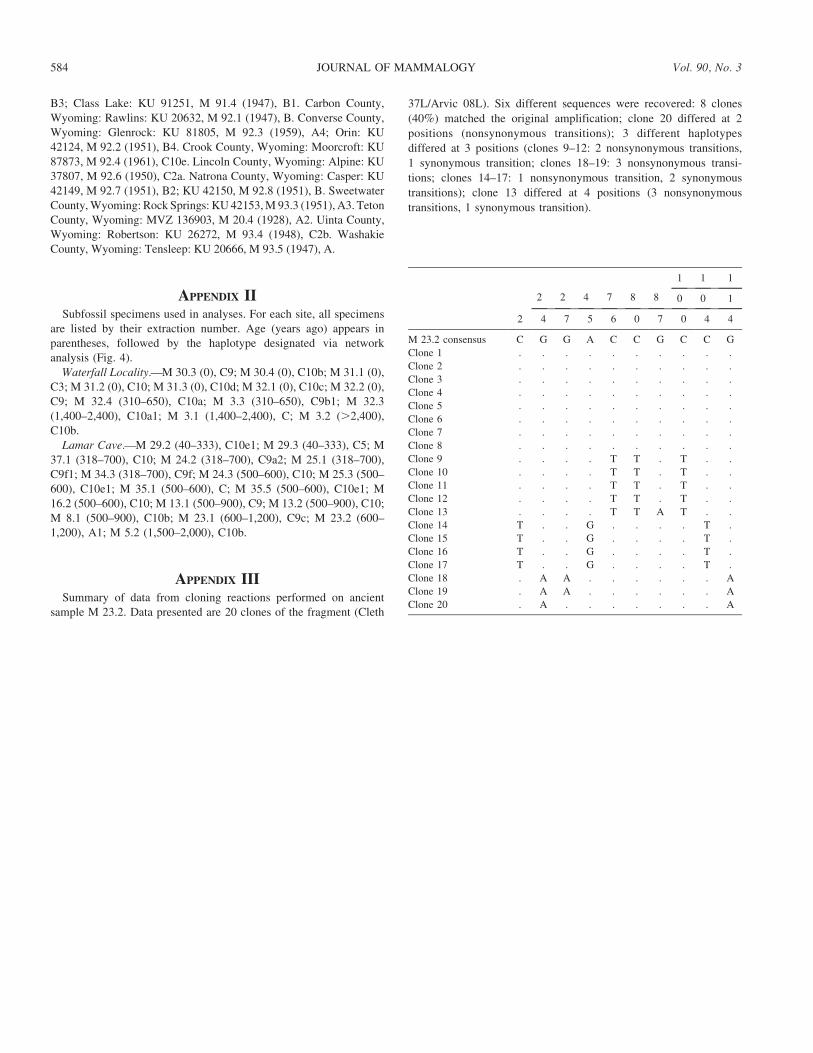
APPENDIX IIISummary of data from cloning reactions performed on ancient
sample M 23.2. Data presented are 20 clones of the fragment (Cleth
37L/Arvic 08L). Six different sequences were recovered: 8 clones
(40%) matched the original amplification; clone 20 differed at 2
positions (nonsynonymous transitions); 3 different haplotypes
differed at 3 positions (clones 9–12: 2 nonsynonymous transitions,
1 synonymous transition; clones 18–19: 3 nonsynonymous transi-
tions; clones 14–17: 1 nonsynonymous transition, 2 synonymous
transitions); clone 13 differed at 4 positions (3 nonsynonymous
transitions, 1 synonymous transition).
2
2 2 4 7 8 8
1 1 1
0 0 1
4 7 5 6 0 7 0 4 4
M 23.2 consensus C G G A C C G C C G
Clone 1 . . . . . . . . . .
Clone 2 . . . . . . . . . .
Clone 3 . . . . . . . . . .
Clone 4 . . . . . . . . . .
Clone 5 . . . . . . . . . .
Clone 6 . . . . . . . . . .
Clone 7 . . . . . . . . . .
Clone 8 . . . . . . . . . .
Clone 9 . . . . T T . T . .
Clone 10 . . . . T T . T . .
Clone 11 . . . . T T . T . .
Clone 12 . . . . T T . T . .
Clone 13 . . . . T T A T . .
Clone 14 T . . G . . . . T .
Clone 15 T . . G . . . . T .
Clone 16 T . . G . . . . T .
Clone 17 T . . G . . . . T .
Clone 18 . A A . . . . . . A
Clone 19 . A A . . . . . . A
Clone 20 . A . . . . . . . A
584 JOURNAL OF MAMMALOGY Vol. 90, No. 3