Rocky shore taphonomy—A comparative study of modern and Late Cretaceous analogues
Upload
havforskningsinstituttetCategory
view
4download
0
Nutrient Addition to ExperimentalRocky Shore Communities Revisited:Delayed Responses, Rapid Recovery
Patrik Kraufvelin,1* Frithjof E. Moy,2 Hartvig Christie,2 and Tor L. Bokn2
1Environmental and Marine Biology, Abo Akademi University, Akademigatan 1, FIN-20500, Turku/Abo, Finland; 2Norwegian
Institute for Water Research (NIVA), P.O. Box 173 Kjelsaas N-0411 Oslo, Norway
ABSTRACT
Coastal eutrophication may alter the dominance
patterns of marine macroalgae, with potential con-
sequences for the associated fauna and the entire
ecosystem. Benthic macroalgae and animals in
control and nutrient-enriched mesocosms were
monitored to investigate eutrophication-induced
changes in rocky shore communities. During a
3-year project, nutrient addition had only minor
effects on the community structure, such as in-
creased cover and biomass of green Ulva spp. and
increased abundance of certain animal species at
high nutrient levels. This study is a 4-year extension
of a previously reported project, with 2 extra years
of effect studies (altogether 5 years) and a sub-
sequent 2 years for recovery. During the 4th year of
nutrient enrichment, the cover of Fucus vesiculosus
and Fucus serratus started to decline. In the 5th year,
these canopy species crashed and there was an
evident take-over by green algae at high nutrient
addition levels. The previously observed abundance
stimulation for fauna disappeared later in the time
series, probably due to the loss of the macroalgal
canopy. After less than 2 years on regular seawater,
the algal and animal communities had returned to
within the range of normal variability. The results
indicate that established rocky shore communities
of perennial algae with associated fauna are able to
persist for several years, even at very high nutrient
levels, but that community shifts may suddenly
occur if eutrophication continues. They also indi-
cate that rocky shore communities have the ability
to return rapidly to natural undisturbed conditions
after the termination of nutrient enhancement.
Key words: mesocosm; coastal eutrophication;
intertidal communities; canopy algae; green tides;
marine biodiversity; nutrient enrichment;
long-term experiment.
INTRODUCTION
During the 20th century, urban and industrial
effluents, together with the intensified use of fer-
tilizers, dramatically increased the transport of
essential plant nutrients to the Sea (Gray 1992;
Nixon 1995; Vitousek and others 1997; Cloern
2001), leading to widespread anthropogenic
eutrophication of the coastal zone. Typical
problems related to marine eutrophication include
blooms of nuisance algae, anoxia events, loss of
habitats and ecosystem functions, and impaired use
of marine resources (Rosenberg 1985; Gray and
others 2002; Karlson and others 2002). Although
our understanding of responses to increased
nutrient levels is generally adequate for the pelagic
zone and seagrass systems (Duarte 1995; Valiela
and others 1997; Vidal and others 1999), current
knowledge of responses in rocky shore ecosystems
is limited. Rocky intertidal habitats have charac-
teristic traits that may render them partly resistant
to nutrient enrichment. Dense populations of
perennial macroalgae (Rhodophyceae/Phaeophy-
ceae/Cholorophyceae) typically dominate intertidal
Received 15 December 2005; accepted 16 December 2005; published
online 17 November 2006.
*Corresponding author; e-mail: [email protected]
Ecosystems (2006) 9: 1076–1093DOI: 10.1007/s10021-005-0188-1
1076
rocky shore communities, arising in an intense
competition among individuals for space and light
(Dayton 1971; Mann 1982; Worm and others
2001). The rocky intertidal is a highly energetic
environment due to wave and tidal action, which
may moderate the accumulation of excessive algal
biomass through intense export (Lewis 1964; Ka-
utsky 1991; Kiirikki 1996; Thompson and others
2002). Finally, large efficient herbivores, capable of
inducing strict top-down control, are often abun-
dant in the intertidal zone of rocky coasts (Hawkins
and Hartnoll 1983; Duffy 1990; Lotze and
others 2001). All of these factors may modify pri-
mary eutrophication responses by reducing the
development and dominance of opportunistic
algae.
Conceptual eutrophication models (Cloern 2001)
predict a stimulation of opportunistic algae by
nutrient enrichment (Duarte 1995; Valiela and
others 1997), and high loads of ephemeral algae are
often observed at eutrophic sites (Ronnberg and
others 1992; Middelboe and Sand-Jensen 2000;
Diaz and others 2002). On rocky shores, eutro-
phication increases the growth of annual filamen-
tous algae, thereby retarding perennial species,
which are known to be important habitats for
macrofauna (Weaver and others 1997; Schramm
1999; Benedetti-Cecchi and others 2001), but see
also Kraufvelin and Salovius (2004) and Edgar and
others (2004). Although increased nutrient supply
also will affect the species composition of such
systems (Valiela 1995; Worm and Sommer 2000),
remarkably few experimental studies on the effects
of nutrient enrichment have been conducted on
intertidal rocky shores. In rocky littoral communi-
ties, high nutrient levels are generally considered to
be responsible for stimulating the growth rates of
photosynthetic organisms and for increasing the
primary production of the ecosystem. Increased
production will, however, not only manifest as an
increased growth rate of the existing algae, but also
as the replacement of slow-growing species by
faster-growing opportunistic ones (Pedersen and
Borum 1996; Valiela and others 1997). This change
in the species composition of benthic algae (pri-
mary effect) may result in changes in the abun-
dance and quality of food (species type and
nutrient content), as well as habitat changes (Edgar
1990; Karez and others 2004; Salovius and Kra-
ufvelin 2004), thereby causing changes in the
animal community (secondary effects). However,
the time scales required to exceed any buffering
capacity of rocky shore ecosystems and cause either
increased production or effects that are more
undesirable remain unknown.
Recently, a high degree of resistance to distur-
bance caused by excessive nutrients has been
documented in long-term mesocosm (Bokn and
others 2002, 2003; Kraufvelin and others 2002;
Barron and others 2003) and field/whole-ecosys-
tem experiments (Kraufvelin and others 2002).
This phenomenon has several explanations. For
negative changes, such as the loss of canopy algae,
to occur in established communities, Kraufvelin
and others (2002) and Bokn and others (2003)
proposed that inadequately short time scale—that
is, less than three years—was an important factor,
together with a lack of sufficient light and free
space for the settlement of opportunistic algae.
Other explanations include an intense export from
the macroalgal beds (Barron and others 2003; Bokn
and others 2003; Christie and Kraufvelin 2004) and
intense grazing by macrofauna (Bokn and others
2003; Karez and others 2004; Kraufvelin and oth-
ers 2006). Wave action, relevant in the present
mesocosms due to the presence of continuously
operating wave machines, may also modulate the
impact of nutrient loading on intertidal community
structure by increasing the rate of algal detachment
and export. An inefficient experimental design
with low statistical power (Kraufvelin 1998) as well
as insufficiently low nutrient addition levels at the
lower part of the gradient may be other explana-
tions for the restricted response. Finally, the gen-
erally restricted realism of mesocosms may have
interfered with the results (Kraufvelin 1999; Bokn
and others 2003).
After the termination of the initial mesocosm
experiment in August 2000, an opportunity to
study temporal effects arose due to 2 additional
years of nutrient dosing in 2001–02. At the end of
nutrient enhancement in September 2002, a 2-year
(2003–04) recovery survey of undisturbed meso-
cosms was conducted. This paper has therefore
emerged as a long-term data synthesis covering
macroalgal and macrofaunal community develop-
ment in littoral rocky shore mesocosms over a
period of 7 years. However, here the emphasis is
placed on the last 2 years of effect studies (the 4th
and 5th year) and the subsequent 2 recovery years,
for which the data are previously unpublished. For
the first years spanning 1997–2000, we refer
mainly to Bokn and others (2002, 2003) and Kra-
ufvelin and others (2002, 2006), although data
from the year 2000 are included in this paper to
illustrate the rapid changes in 2001–02. The main
objective of this paper was to outline the impor-
tance of temporal effects for the occurrence and
disappearance of eutrophication responses in rocky
littoral macroalgal and macrofaunal assemblages.
Nutrient Addition to Rocky Shore Communities 1077
MATERIALS AND METHODS
Solbergstrand Rocky Littoral Mesocosms
All measurements were made in eight rocky littoral
mesocosms at the Marine Research Station Sol-
bergstrand by the Oslofjord (59�37¢N, 10�39¢E) in
southeast Norway. In 1997, all mesocosms received
background fjord water and served as preexperi-
mental controls. During the period from April 1998
to September 2001, nutrients were added to six
mesocosms along a geometrical gradient corre-
sponding to 1, 2, 4, 8, 16, and 32 lM of inorganic
nitrogen (N) as well as 0.06, 0.12, 0.25, 0.5, 1.0,
and 2.0 lM of inorganic phosphorus (P) above
background levels. Two basins continued to serve
as controls without extra nutrient addition. The
highest nutrient addition level is similar to con-
centrations recorded in eutrophic areas locally
(Kristiansen and Paasche 1982) and globally (Clo-
ern 2001). During the period from March to Sep-
tember 2002, the four highest nutrient addition
levels from the previous period (that is, 4–32 lM N
and 0.25–2 lM P above background) were treated
with 32 lM N and 2 lM P, respectively. In addi-
tion, the two previously lowest nutrient addition
levels (that is, 1–2 lMN and 0.06–0.12 lM P above
background) together with the two former controls
became the new zero additions/controls. We
changed the nutrient addition scheme to get real
replicates under the same nutrient regime for
analyses of variance (ANOVA) and to increase the
relative differences in nutrient addition between
treatments and controls, because these differences
were often small at the lower end of the gradient
due to large fluctuations in background ‘‘fjord’’
nutrient levels, thereby increasing the statistical
power (Kraufvelin 1998). Nutrients were added as
a mixture, which for the highest nutrient addition
level consisted of 14.3 mol N as NH4NO3 and
0.9 mol P as H3PO4 with an N:P mol ratio of 16:1.
Nutrient addition was stopped in September 2002
after 5 years of treatment; for the next 2 years
(2003–04), all basins were fed with untreated
seawater from the fjord to study recovery.
The Solbergstrand mesocosms (Figure 1) had a
water volume of 6–12 m3, depending on tidal level,
and received water from a depth of 1 m in the
Oslofjord at a rate of 5 m3 h)1 (mean water resi-
dence time: 2 h). A tidal regime simulated natural
changes in water level, reflecting the local tidal
amplitude of 36 cm and comprising two high tides
and two low tides diurnally, whereas a wave ma-
chine generated constant wave action (17 strokes/
min). Apart from two incidents in 2003 with bro-
ken tide -regulators, which temporarily destroyed
some of the upper intertidal algae in two control
systems, the mesocosms worked well during the
entire sampling period.
Rocky shore communities were introduced in
1996 by transplanting small boulders from the
Oslofjord, with macroalgae and associated animals
attached, onto concrete steps in each mesocosm.
These steps represented different water depths on a
shoreline and consisted of two intertidal and two
subtidal steps per mesocosm (Figure 1). After the
initiation phase, natural community development
was allowed to contribute to the flora and fauna
assemblages. Over the experimental period, over 40
species of macroalgae and 80 species of macrofauna
were identified in the mesocosms. Green algal
species—that is, Ulva lactuca L. and Ulva intestinalis
L., as well as brown algae, Fucus serratus L., Fucus
vesiculosus L., and Ascophyllum nodosum (L.) Le Jol,
and some seasonal red algae dominated the mac-
roalgal assemblages. The green alga U. intestinalis
consisted of several species formerly known as
Enteromorpha (see Hayden and others 2003),
among which Enteromorpha intestinalis was most
common. Bigger amphipods such as Gammarus spp.
and Hyale nilssoni (Rathke), smaller amphipod taxa
like Corophiidae, Stenothoidae, Ischyroceridae and
Aoridae, isopods such as Jaera spp. and Idotea spp.,
gastropods such as Littorina littorea L. and Rissoa
spp., and blue mussels were the most important
animal groups.
Sampling and Measurements
Macroalgal cover and animal abundance were
measured one to five times each year, but for
comparative purposes (to decrease the effects of
seasonality), only measurements from late sum-
mer/autumn each year were used. The abundance
of macroalgae was measured as percentage cover
in 16 quadrats (42 · 42 cm, adjusted to the size of
the steps) in each basin. Each quadrat was divided
into 25 subquadrats to enable reliable estimaties of
the algal cover, Murray and others 2006). The
sum of species abundance in each quadrat may
exceed 100% due to a multilayered community
structure of primary cover, understory species,
canopy, and epiphytes (algal cover was estimated
in understory and canopy layers when present).
Algal cover may be converted into biomass values
using parallel biomass estimations (Bokn and
others 2003), but in this study, nondestructive
percentage cover was used, which is a straight-
forward and reliable estimate for macroalgal
occurrence (Murray and others 2006). At each
1078 Kraufvelin and others
sampling, the average macroalgal cover was cal-
culated for each basin. Large motile and sessile
animals were counted inside a grid covering the
steps of the basins and additionally on the walls
and bottom of each basin. The abundance of
smaller motile animals was estimated by their
colonization of artificial substrates. These sub-
strates consisted of three 80-cm–long ropes, one
stone, and one petri dish tied together. The sub-
strates were able to collect an intermediate frac-
tion of the animals normally present in the most
dominant green, red, and brown algae (Kraufvelin
and others 2002). These subtrates were used to
provide for nondestructive sampling and to get
samples of similar conditions from all meso-
cosms—that is, to counteract differences in faunal
colonization due to differences in algal nutrient
content and possible differences in algal mor-
phology between controls and nutrient treatments
(Kraufvelin and others 2006). Two substrates
were placed into each mesocosm, one on an
intertidal and one on a subtidal step, and exposed
for 2 days in each basin, after which the animals
were preserved in ethanol for later analysis. Be-
cause the main interest of this study lay in making
comparisons between mesocosms, the two sub-
strates were pooled and treated as one mesocosm
measurement.
Statistical Analysis
Algal cover and animal abundance versus nutrient
addition level were analyzed by Pearson’s correla-
tion analysis for 2000–01 (Sokal and Rohlf 1995).
From 2002 on, the data were analyzed by two-way
ANOVAs with the factors N = Nutrient (two levels,
fixed and orthogonal) and Y = Year (three levels,
fixed and orthogonal) and the basic intention of
looking for significant interactions, with 2002 rep-
resenting extended/intensified dosing and 2003–04
representing possibilities for recovery from dosing.
The model describing the data is: Xijk = l + Ni + Yj +
NYij + ek(ij). Before running the parametric tests, it
was checked for normality with Kolmogorov-
Smirnov’s test and homogeneity of variances with
Cochran’s C-test. To homogenize heterogeneous
variances, arcsine transformations were used for
algal data (percentages) and square-root-transfor-
mations, �(x + 1), for animal data (counts). When
appropriate, Student-Neuman-Keuls (SNK) tests
were applied for a posteriori comparisons of the
means. Hochberg’s sequential Bonferroni (Hoch-
berg 1988) was finally used to adjust the overall
significance levels to the number of tests performed.
For all significance tests, alpha was set at 0.05.
It may seem spurious that the four formerly
highest-nutrient treatments were treated as real
replicates in an ANOVA from 2002 onward—that
is, that 4, 8, and 16 lM N all became 32 lM N
during the last year of dosing, given that the ob-
tained ‘‘replicated’’ mesocosms for this analysis
were far from homogeneous in the past (Kraufvelin
and others 2002; Bokn and others 2003). However,
this solution was judged to be appropriate for effect
detection and for testing a new research hypothe-
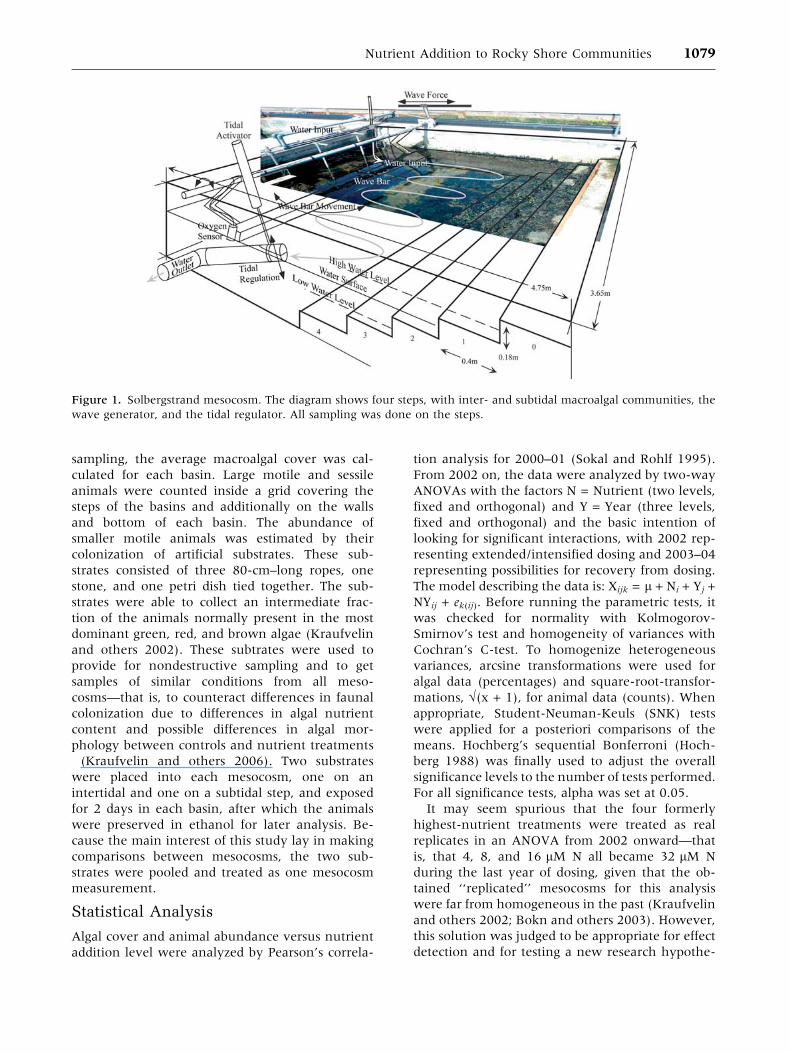
Figure 1. Solbergstrand mesocosm. The diagram shows four steps, with inter- and subtidal macroalgal communities, the
wave generator, and the tidal regulator. All sampling was done on the steps.
Nutrient Addition to Rocky Shore Communities 1079

sis, because it actually made it more difficult to
reveal significant differences—that is, it implied a
decreased risk of type I errors and increased the risk
of type II errors (Kraufvelin 1998).
Multivariate nonmetric multidimensional scaling
(NMDS) based on Bray-Curtis similarities was used
to obtain a graphical overview of the temporal
development in algal and animal communities in
each mesocosm. In addition, one-way analysis of
similarity (ANOSIM) was used to test for differ-
ences in algal and faunal community development
between treatment and control mesocosms within
and among years, as well as the similarity per-
centage breakdown procedure (SIMPER) for sort-
ing species that contributed most to observed
dissimilarities between mesocosms (Clarke 1993).
The macroalgal data were analyzed untransformed
due to rather small differences between the more
common and the more rare algal groups, but the
data were standardized prior to the multivariate
analyses to deal with a total cover sometimes
exceeding 100%. The macrofaunal data were
transformed by the square root to balance the
relative influences of dominant and rare species.
Finally, a correlation analysis between the
abundance of the dominating macrofauna taxa
(amphipods, Jaera spp., and Littorina littorea) and
green, red, and brown macroalgal cover was carried
out across all mesocosms over the years 2000–04.
RESULTS
Changes in Algal Populations Examinedby Univariate Techniques
Changes in the percentage cover of Ulva spp. along
the nutrient gradient (2000–01) for each N addition
level (controls pooled) and year are presented in
Figure 2ab; the results of Pearson’s correlation
analysis are shown in Table 1. Mean cover values
(± SE) of Ulva lactuca and Ulva intestinalis in repli-
cated controls and treatments in 2002 and during
the recovery period 2003–04 are presented in
(Figure 3) and analyzed by two-way ANOVA in
(Table 2). Although green algae, as Ulva spp. and as
U. lactuca, have been reported to be significantly
stimulated by the nutrient addition since the initial
years of dosing (Bokn and others 2003), the sig-
nificant relationships 2000–01 disappeared when
we corrected for the number of comparisons by the
sequential Bonferroni (Figure 2 and Table 1). In
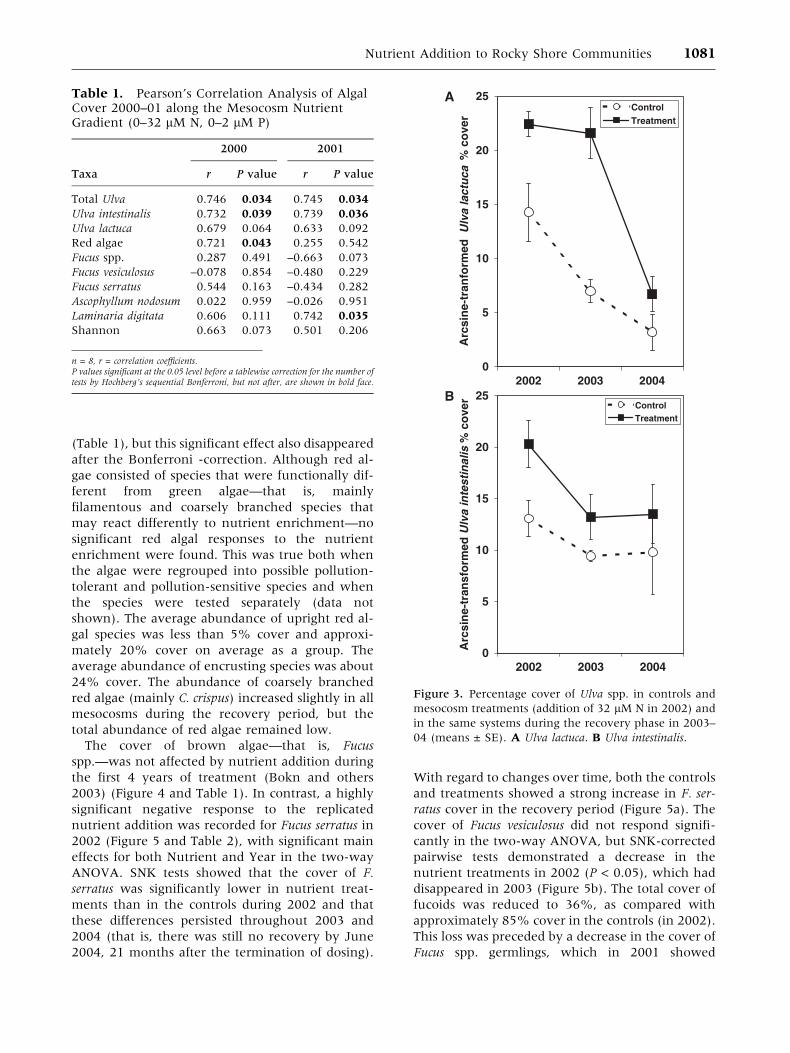
the two-way ANOVA 2002–04, U. lactuca re-
sponded with a significant interaction of Nutrient ·Year Table 2. A posteriori SNK tests revealed that
the percentage cover of U. lactuca was significantly
stimulated by nutrients both during 2002 and
during the first recovery year, 2003; whereas the
cover in the nutrient treatments had decreased to
the same level as in the controls by 2004, indicating
recovery (Figure 3a and Table 2). For U. intestinalis,
higher percentage cover in the treatments 2002–04
disappeared after Bonferroni- correction (Figure 3b
and Table 2).
Red algae, comprised mainly of Ceramium spp.,
Polysiphonia spp., Rhodomela confervoides (Huds.)
P.C. Silva, and Chondrus crispus Stackh, were sig-
nificantly stimulated by nutrient addition in 2000
0
10
20
30
40
50
0 1 2 4 8 16 32
U. lactucaU. intestinalisUlva total
0
10
20
30
40
50
0 1 2 4 8 16 32
U. lactuca
U. intestinalis
Ulva total
A
B
Figure 2. Percentage cover of Ulva lactuca and Ulva in-
testinalis and total Ulva along the nutrient-enrichment
gradient (concentration in lM N; the two controls were
pooled) in A 2000 and B 2001.
1080 Kraufvelin and others
(Table 1), but this significant effect also disappeared
after the Bonferroni -correction. Although red al-
gae consisted of species that were functionally dif-
ferent from green algae—that is, mainly
filamentous and coarsely branched species that
may react differently to nutrient enrichment—no
significant red algal responses to the nutrient
enrichment were found. This was true both when
the algae were regrouped into possible pollution-
tolerant and pollution-sensitive species and when
the species were tested separately (data not
shown). The average abundance of upright red al-
gal species was less than 5% cover and approxi-
mately 20% cover on average as a group. The
average abundance of encrusting species was about
24% cover. The abundance of coarsely branched
red algae (mainly C. crispus) increased slightly in all
mesocosms during the recovery period, but the
total abundance of red algae remained low.
The cover of brown algae—that is, Fucus
spp.—was not affected by nutrient addition during
the first 4 years of treatment (Bokn and others
2003) (Figure 4 and Table 1). In contrast, a highly
significant negative response to the replicated
nutrient addition was recorded for Fucus serratus in
2002 (Figure 5 and Table 2), with significant main
effects for both Nutrient and Year in the two-way
ANOVA. SNK tests showed that the cover of F.
serratus was significantly lower in nutrient treat-
ments than in the controls during 2002 and that
these differences persisted throughout 2003 and
2004 (that is, there was still no recovery by June
2004, 21 months after the termination of dosing).
With regard to changes over time, both the controls
and treatments showed a strong increase in F. ser-
ratus cover in the recovery period (Figure 5a). The
cover of Fucus vesiculosus did not respond signifi-
cantly in the two-way ANOVA, but SNK-corrected
pairwise tests demonstrated a decrease in the
nutrient treatments in 2002 (P < 0.05), which had
disappeared in 2003 (Figure 5b). The total cover of
fucoids was reduced to 36%, as compared with
approximately 85% cover in the controls (in 2002).
This loss was preceded by a decrease in the cover of
Fucus spp. germlings, which in 2001 showed
Table 1. Pearson’s Correlation Analysis of AlgalCover 2000–01 along the Mesocosm NutrientGradient (0–32 lM N, 0–2 lM P)
2000 2001
Taxa r P value r P value
Total Ulva 0.746 0.034 0.745 0.034
Ulva intestinalis 0.732 0.039 0.739 0.036
Ulva lactuca 0.679 0.064 0.633 0.092
Red algae 0.721 0.043 0.255 0.542
Fucus spp. 0.287 0.491 –0.663 0.073
Fucus vesiculosus –0.078 0.854 –0.480 0.229
Fucus serratus 0.544 0.163 –0.434 0.282
Ascophyllum nodosum 0.022 0.959 –0.026 0.951
Laminaria digitata 0.606 0.111 0.742 0.035
Shannon 0.663 0.073 0.501 0.206
n = 8, r = correlation coefficients.P values significant at the 0.05 level before a tablewise correction for the number oftests by Hochberg’s sequential Bonferroni, but not after, are shown in bold face.
0
5
10
15
20
25
2002 2003 2004
Arc
sin
e-tr
anfo
rmed
Ulv
a la
ctu
ca %
co
ver
ControlTreatment
0
5
10
15
20
25
2002 2003 2004
Arc
sin
e-tr
ansf
orm
ed U
lva
inte
stin
alis
% c
ove
r
ControlTreatment
A
B
Figure 3. Percentage cover of Ulva spp. in controls and
mesocosm treatments (addition of 32 lM N in 2002) and
in the same systems during the recovery phase in 2003–
04 (means ± SE). A Ulva lactuca. B Ulva intestinalis.
Nutrient Addition to Rocky Shore Communities 1081
significantly lower mean percentage cover
(1.31 ± 0.41%) in treatment mesocosms than
in the controls (3.46 ± 0.41%) (one-way ANOVA:
F-ratio =13.82, P = 0.010, df =1, 6).
During 2000–02, the abundance of Fucus spp.
and Ulva spp. were significantly negatively corre-
lated with each other (r = )0.513, P = 0.010,
n = 24), which is indicative of strong competition.
After 2 years of recovery, total fucoid cover in the
previously treated basins showed no significant
difference from the controls (approximately 60%
compared to 75%), mainly due to regrowth of Fu-
cus serratus. The other common species of perennial
brown algae in the mesocosms, Ascophyllum nodo-
sum and Laminaria digitata (Huds.) J.V. Lamour, did
not respond negatively to the nutrient additions.
L. digitata was even significantly stimulated along
the nutrient gradient, before the Bonferroni cor-
rection (Table 1).
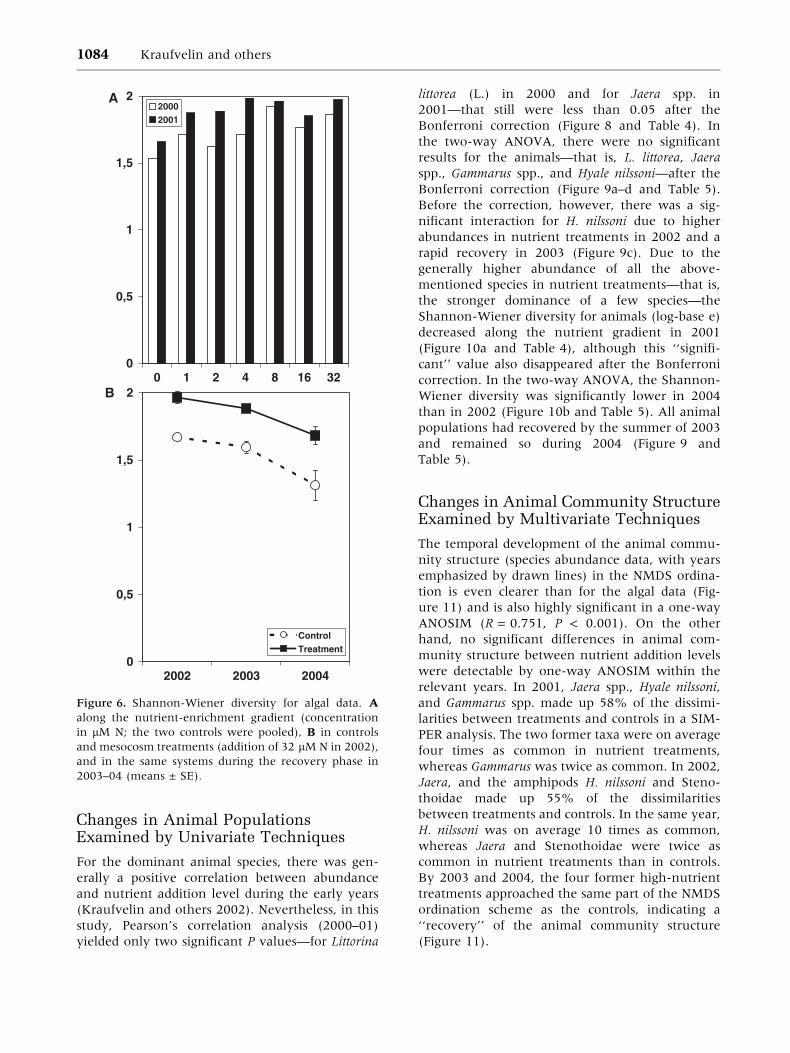
Shannon-Wiener diversity indices calculated on
algal data (log-base e) did not show any significant
differences in the correlations 2000–01 (Figure 6a
and Table 1), but in the two-way factorial ANOVA,
there were significant main effects for both the
factors Nutrient and Year (Figure 6b and Table 2).
As shown in Figure 6b, these differences were due
to higher diversity values in the nutrient treat-
ments and lower values in 2004 compared to 2002
and 2003, but this could not be verified by SNK
tests because these tests could not be computed for
this variable.
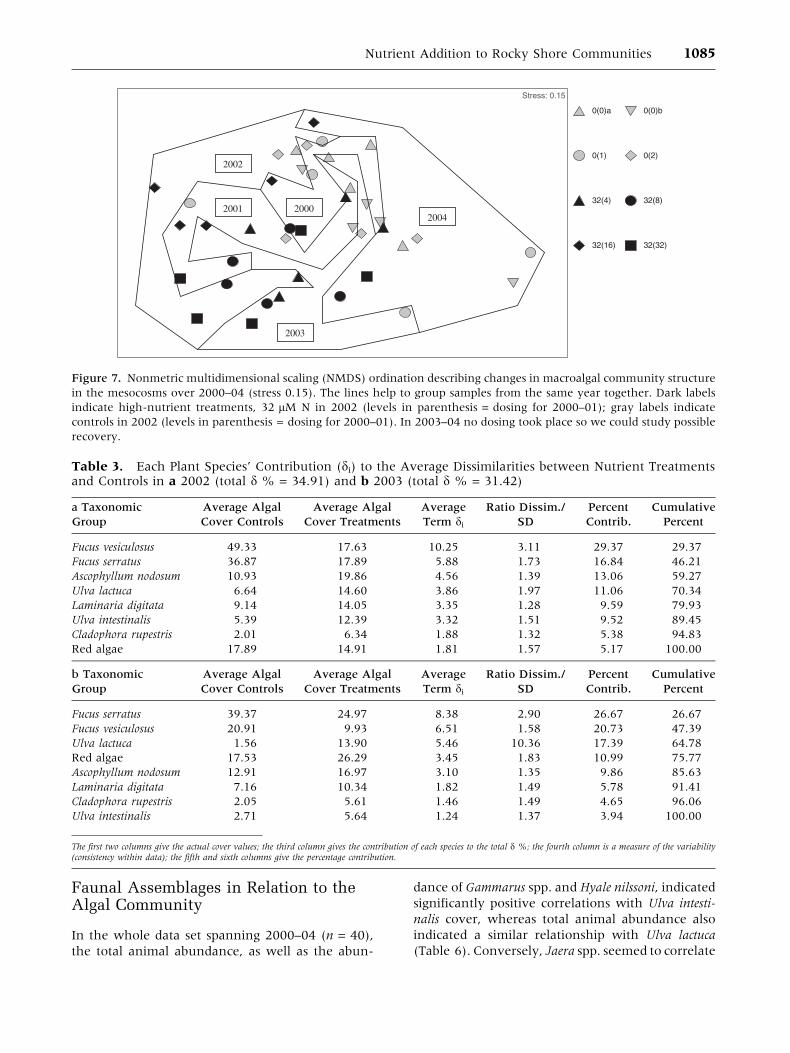
Changes in Algal Community StructureExamined by Multivariate Techniques
Temporal changes in the algal community structure
(species/percentage cover) in both nutrient treat-
ments and controls are illustrated by an NMDS
ordination, in which lines have been drawn to
group together samples of the same year (Figure 7).
In this figure, the years (2000–04) cluster out as
significantly different in a one-way ANOSIM (glo-
bal R = 0.267, P < 0.001), which demonstrates that
a natural ecological succession seems to be oper-
ating independently of the responses to and
recovery from nutrient addition. Differences be-
tween ‘‘controls’’ (gray symbols) and high nutrient
treatments (black symbols) increased steadily each
year from 2000 through 2001, to 2002, which can
be seen by the two groups diverging each year. In
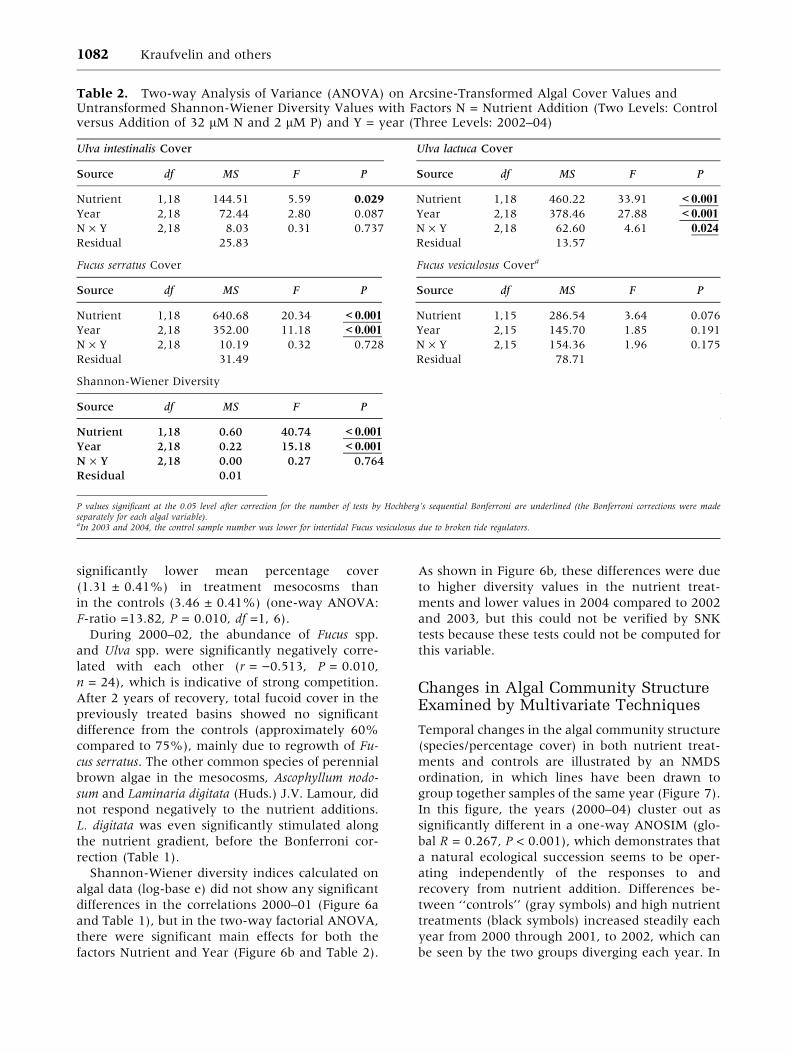
Table 2. Two-way Analysis of Variance (ANOVA) on Arcsine-Transformed Algal Cover Values andUntransformed Shannon-Wiener Diversity Values with Factors N = Nutrient Addition (Two Levels: Controlversus Addition of 32 lM N and 2 lM P) and Y = year (Three Levels: 2002–04)
Ulva intestinalis Cover Ulva lactuca Cover
Source df MS F P Source df MS F P
Nutrient 1,18 144.51 5.59 0.029 Nutrient 1,18 460.22 33.91 <0.001
Year 2,18 72.44 2.80 0.087 Year 2,18 378.46 27.88 <0.001
N · Y 2,18 8.03 0.31 0.737 N · Y 2,18 62.60 4.61 0.024
Residual 25.83 Residual 13.57
Fucus serratus Cover Fucus vesiculosus Covera
Source df MS F P Source df MS F P
Nutrient 1,18 640.68 20.34 <0.001 Nutrient 1,15 286.54 3.64 0.076
Year 2,18 352.00 11.18 <0.001 Year 2,15 145.70 1.85 0.191
N · Y 2,18 10.19 0.32 0.728 N · Y 2,15 154.36 1.96 0.175
Residual 31.49 Residual 78.71
Shannon-Wiener Diversity
Source df MS F P
Nutrient 1,18 0.60 40.74 <0.001
Year 2,18 0.22 15.18 <0.001
N · Y 2,18 0.00 0.27 0.764
Residual 0.01
P values significant at the 0.05 level after correction for the number of tests by Hochberg’s sequential Bonferroni are underlined (the Bonferroni corrections were madeseparately for each algal variable).aIn 2003 and 2004, the control sample number was lower for intertidal Fucus vesiculosus due to broken tide regulators.
1082 Kraufvelin and others
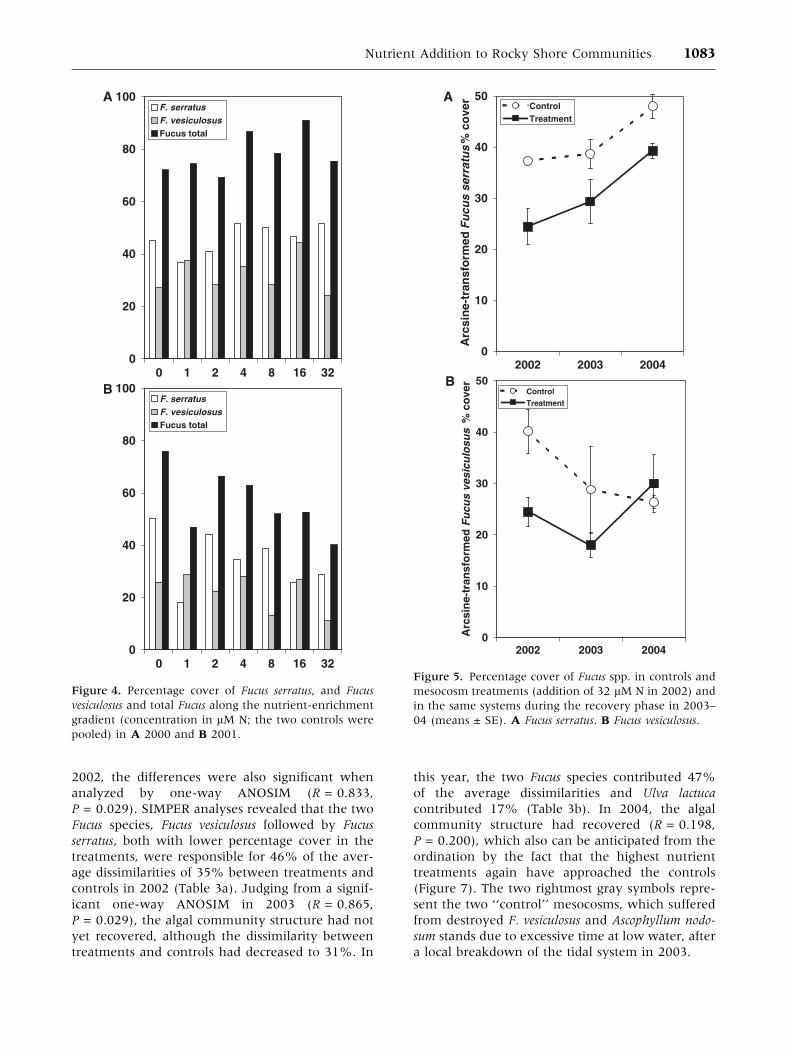
2002, the differences were also significant when
analyzed by one-way ANOSIM (R = 0.833,
P = 0.029). SIMPER analyses revealed that the two
Fucus species, Fucus vesiculosus followed by Fucus
serratus, both with lower percentage cover in the
treatments, were responsible for 46% of the aver-
age dissimilarities of 35% between treatments and
controls in 2002 (Table 3a). Judging from a signif-
icant one-way ANOSIM in 2003 (R = 0.865,
P = 0.029), the algal community structure had not
yet recovered, although the dissimilarity between
treatments and controls had decreased to 31%. In
this year, the two Fucus species contributed 47%
of the average dissimilarities and Ulva lactuca
contributed 17% (Table 3b). In 2004, the algal
community structure had recovered (R = 0.198,
P = 0.200), which also can be anticipated from the
ordination by the fact that the highest nutrient
treatments again have approached the controls
(Figure 7). The two rightmost gray symbols repre-
sent the two ‘‘control’’ mesocosms, which suffered
from destroyed F. vesiculosus and Ascophyllum nodo-
sum stands due to excessive time at low water, after
a local breakdown of the tidal system in 2003.
0
20
40
60
80
100
0 1 2 4 8 16 32
F. serratusF. vesiculosusFucus total
0
20
40
60
80
100
0 1 2 4 8 16 32
F. serratusF. vesiculosusFucus total
A
B
Figure 4. Percentage cover of Fucus serratus, and Fucus
vesiculosus and total Fucus along the nutrient-enrichment
gradient (concentration in lM N; the two controls were
pooled) in A 2000 and B 2001.
0
10
20
30
40
50
2002 2003 2004
Arc
sin
e-tr
ansf
orm
edF
ucu
s se
rrat
us
% c
ove
r
ControlTreatment
0
10
20
30
40
50
2002 2003 2004
Arc
sin
e-tr
ansf
orm
edF
ucu
s ve
sicu
losu
s %
co
ver
ControlTreatment
A
B
Figure 5. Percentage cover of Fucus spp. in controls and
mesocosm treatments (addition of 32 lM N in 2002) and
in the same systems during the recovery phase in 2003–
04 (means ± SE). A Fucus serratus. B Fucus vesiculosus.
Nutrient Addition to Rocky Shore Communities 1083
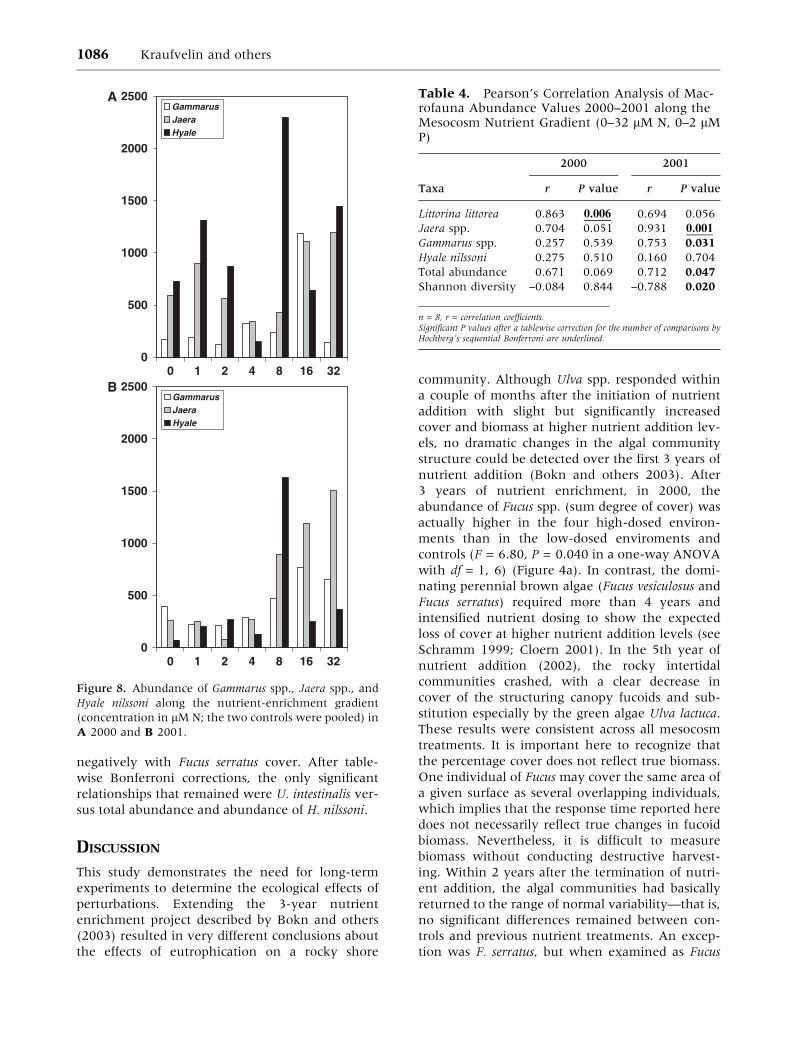
Changes in Animal PopulationsExamined by Univariate Techniques
For the dominant animal species, there was gen-
erally a positive correlation between abundance
and nutrient addition level during the early years
(Kraufvelin and others 2002). Nevertheless, in this
study, Pearson’s correlation analysis (2000–01)
yielded only two significant P values—for Littorina
littorea (L.) in 2000 and for Jaera spp. in
2001—that still were less than 0.05 after the
Bonferroni correction (Figure 8 and Table 4). In
the two-way ANOVA, there were no significant
results for the animals—that is, L. littorea, Jaera
spp., Gammarus spp., and Hyale nilssoni—after the
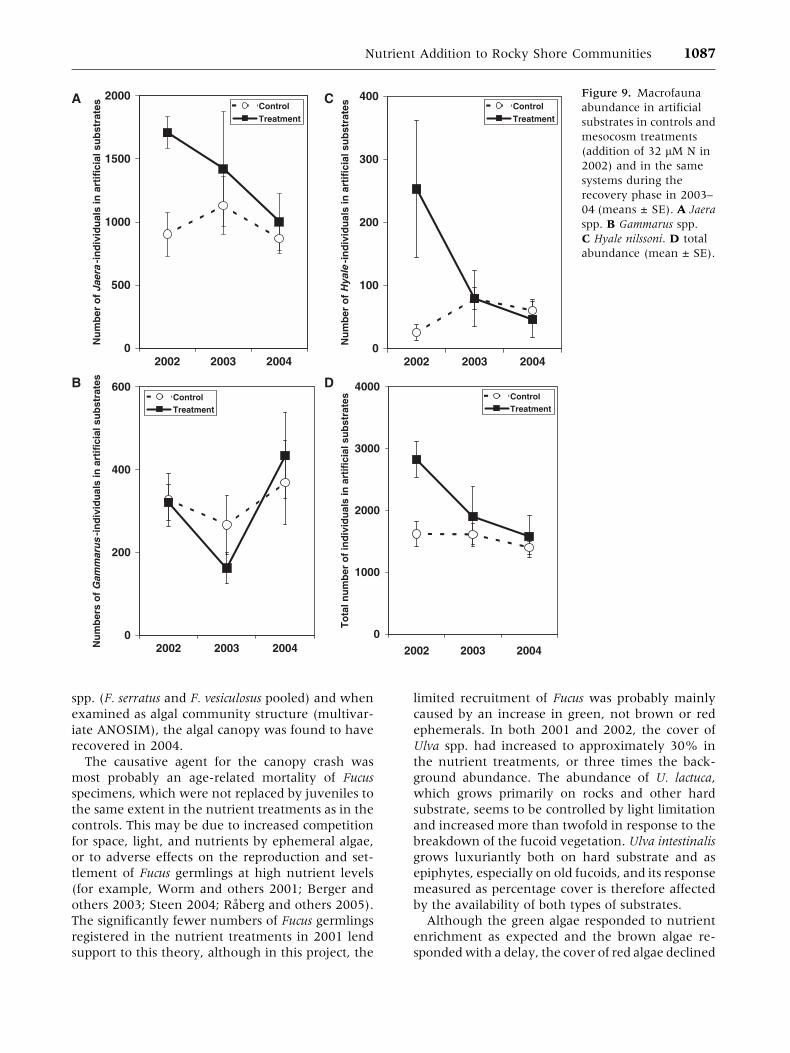
Bonferroni correction (Figure 9a–d and Table 5).
Before the correction, however, there was a sig-
nificant interaction for H. nilssoni due to higher
abundances in nutrient treatments in 2002 and a
rapid recovery in 2003 (Figure 9c). Due to the
generally higher abundance of all the above-
mentioned species in nutrient treatments—that is,
the stronger dominance of a few species—the
Shannon-Wiener diversity for animals (log-base e)
decreased along the nutrient gradient in 2001
(Figure 10a and Table 4), although this ‘‘signifi-
cant’’ value also disappeared after the Bonferroni
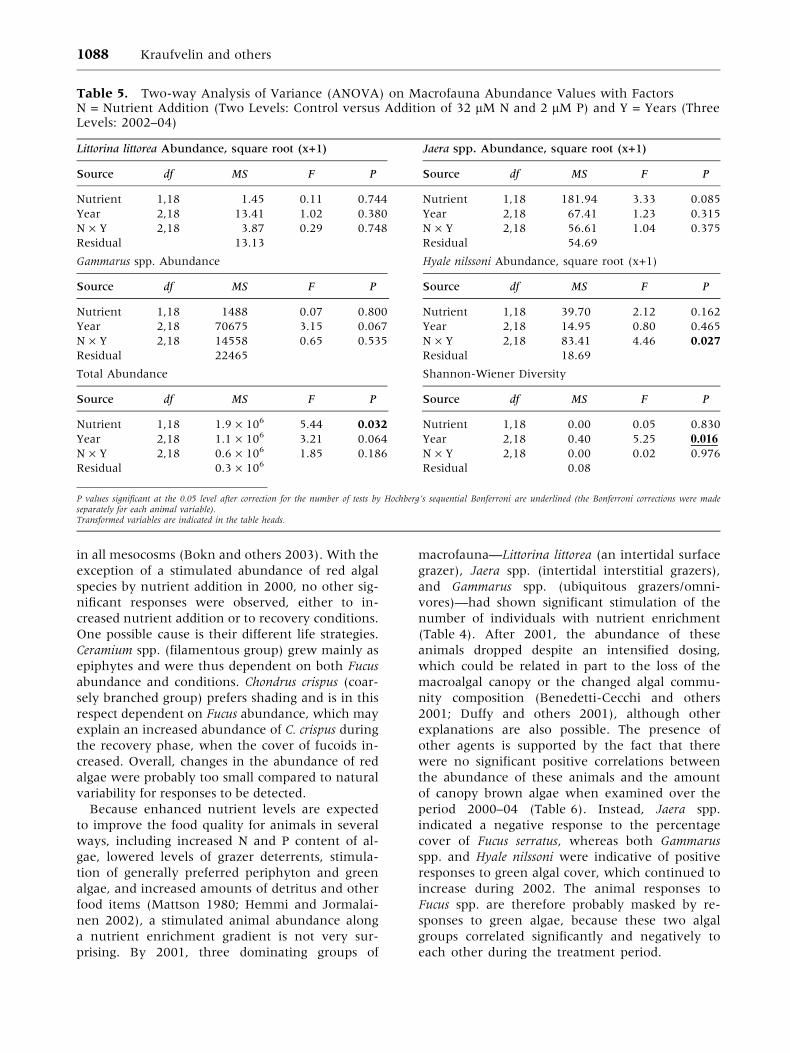
correction. In the two-way ANOVA, the Shannon-
Wiener diversity was significantly lower in 2004
than in 2002 (Figure 10b and Table 5). All animal
populations had recovered by the summer of 2003
and remained so during 2004 (Figure 9 and
Table 5).
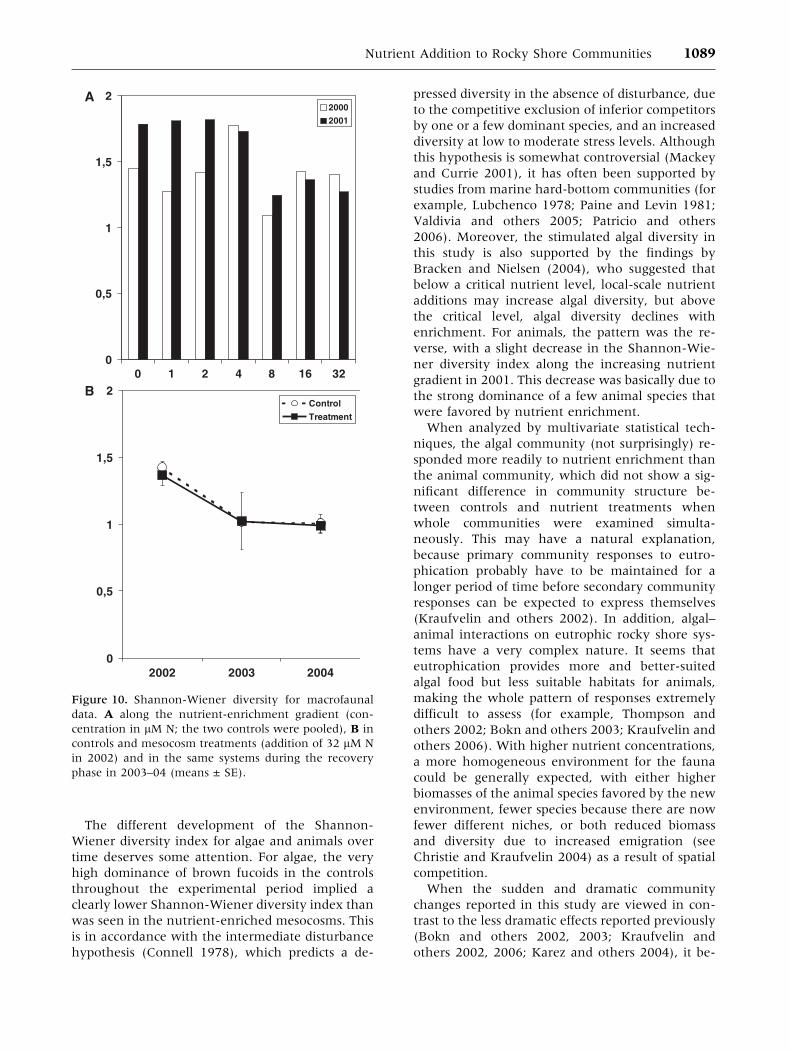
Changes in Animal Community StructureExamined by Multivariate Techniques
The temporal development of the animal commu-
nity structure (species abundance data, with years
emphasized by drawn lines) in the NMDS ordina-
tion is even clearer than for the algal data (Fig-
ure 11) and is also highly significant in a one-way
ANOSIM (R = 0.751, P < 0.001). On the other
hand, no significant differences in animal com-
munity structure between nutrient addition levels
were detectable by one-way ANOSIM within the
relevant years. In 2001, Jaera spp., Hyale nilssoni,
and Gammarus spp. made up 58% of the dissimi-
larities between treatments and controls in a SIM-
PER analysis. The two former taxa were on average
four times as common in nutrient treatments,
whereas Gammarus was twice as common. In 2002,
Jaera, and the amphipods H. nilssoni and Steno-
thoidae made up 55% of the dissimilarities
between treatments and controls. In the same year,
H. nilssoni was on average 10 times as common,
whereas Jaera and Stenothoidae were twice as
common in nutrient treatments than in controls.
By 2003 and 2004, the four former high-nutrient
treatments approached the same part of the NMDS
ordination scheme as the controls, indicating a
‘‘recovery’’ of the animal community structure
(Figure 11).
0
0,5
1
1,5
2
0 1 2 4 8 16 32
20002001
0
0,5
1
1,5
2
2002 2003 2004
ControlTreatment
A
B
Figure 6. Shannon-Wiener diversity for algal data. A
along the nutrient-enrichment gradient (concentration
in lM N; the two controls were pooled), B in controls
and mesocosm treatments (addition of 32 lMN in 2002),
and in the same systems during the recovery phase in
2003–04 (means ± SE).
1084 Kraufvelin and others
Faunal Assemblages in Relation to theAlgal Community
In the whole data set spanning 2000–04 (n = 40),
the total animal abundance, as well as the abun-
dance of Gammarus spp. and Hyale nilssoni, indicated
significantly positive correlations with Ulva intesti-
nalis cover, whereas total animal abundance also
indicated a similar relationship with Ulva lactuca
(Table 6). Conversely, Jaera spp. seemed to correlate
0(0)a 0(0)b
0(1) 0(2)
32(4) 32(8)
32(16) 32(32)
Stress: 0.15
20002001
2002
2003
2004
Figure 7. Nonmetric multidimensional scaling (NMDS) ordination describing changes in macroalgal community structure
in the mesocosms over 2000–04 (stress 0.15). The lines help to group samples from the same year together. Dark labels
indicate high-nutrient treatments, 32 lM N in 2002 (levels in parenthesis = dosing for 2000–01); gray labels indicate
controls in 2002 (levels in parenthesis = dosing for 2000–01). In 2003–04 no dosing took place so we could study possible
recovery.
Table 3. Each Plant Species’ Contribution (di) to the Average Dissimilarities between Nutrient Treatmentsand Controls in a 2002 (total d % = 34.91) and b 2003 (total d % = 31.42)
a Taxonomic
Group
Average Algal
Cover Controls
Average Algal
Cover Treatments
Average
Term di
Ratio Dissim./
SD
Percent
Contrib.
Cumulative
Percent
Fucus vesiculosus 49.33 17.63 10.25 3.11 29.37 29.37
Fucus serratus 36.87 17.89 5.88 1.73 16.84 46.21
Ascophyllum nodosum 10.93 19.86 4.56 1.39 13.06 59.27
Ulva lactuca 6.64 14.60 3.86 1.97 11.06 70.34
Laminaria digitata 9.14 14.05 3.35 1.28 9.59 79.93
Ulva intestinalis 5.39 12.39 3.32 1.51 9.52 89.45
Cladophora rupestris 2.01 6.34 1.88 1.32 5.38 94.83
Red algae 17.89 14.91 1.81 1.57 5.17 100.00
b Taxonomic
Group
Average Algal
Cover Controls
Average Algal
Cover Treatments
Average
Term di
Ratio Dissim./
SD
Percent
Contrib.
Cumulative
Percent
Fucus serratus 39.37 24.97 8.38 2.90 26.67 26.67
Fucus vesiculosus 20.91 9.93 6.51 1.58 20.73 47.39
Ulva lactuca 1.56 13.90 5.46 10.36 17.39 64.78
Red algae 17.53 26.29 3.45 1.83 10.99 75.77
Ascophyllum nodosum 12.91 16.97 3.10 1.35 9.86 85.63
Laminaria digitata 7.16 10.34 1.82 1.49 5.78 91.41
Cladophora rupestris 2.05 5.61 1.46 1.49 4.65 96.06
Ulva intestinalis 2.71 5.64 1.24 1.37 3.94 100.00
The first two columns give the actual cover values; the third column gives the contribution of each species to the total d %; the fourth column is a measure of the variability(consistency within data); the fifth and sixth columns give the percentage contribution.
Nutrient Addition to Rocky Shore Communities 1085
negatively with Fucus serratus cover. After table-
wise Bonferroni corrections, the only significant
relationships that remained were U. intestinalis ver-
sus total abundance and abundance of H. nilssoni.
DISCUSSION
This study demonstrates the need for long-term
experiments to determine the ecological effects of
perturbations. Extending the 3-year nutrient
enrichment project described by Bokn and others
(2003) resulted in very different conclusions about
the effects of eutrophication on a rocky shore
community. Although Ulva spp. responded within
a couple of months after the initiation of nutrient
addition with slight but significantly increased
cover and biomass at higher nutrient addition lev-
els, no dramatic changes in the algal community
structure could be detected over the first 3 years of
nutrient addition (Bokn and others 2003). After
3 years of nutrient enrichment, in 2000, the
abundance of Fucus spp. (sum degree of cover) was
actually higher in the four high-dosed environ-
ments than in the low-dosed enviroments and
controls (F = 6.80, P = 0.040 in a one-way ANOVA
with df = 1, 6) (Figure 4a). In contrast, the domi-
nating perennial brown algae (Fucus vesiculosus and
Fucus serratus) required more than 4 years and
intensified nutrient dosing to show the expected
loss of cover at higher nutrient addition levels (see
Schramm 1999; Cloern 2001). In the 5th year of
nutrient addition (2002), the rocky intertidal
communities crashed, with a clear decrease in
cover of the structuring canopy fucoids and sub-
stitution especially by the green algae Ulva lactuca.
These results were consistent across all mesocosm
treatments. It is important here to recognize that
the percentage cover does not reflect true biomass.
One individual of Fucus may cover the same area of
a given surface as several overlapping individuals,
which implies that the response time reported here
does not necessarily reflect true changes in fucoid
biomass. Nevertheless, it is difficult to measure
biomass without conducting destructive harvest-
ing. Within 2 years after the termination of nutri-
ent addition, the algal communities had basically
returned to the range of normal variability—that is,
no significant differences remained between con-
trols and previous nutrient treatments. An excep-
tion was F. serratus, but when examined as Fucus
0
500
1000
1500
2000
2500
0 1 2 4 8 16 32
GammarusJaeraHyale
0
500
1000
1500
2000
2500
0 1 2 4 8 16 32
GammarusJaeraHyale
A
B
Figure 8. Abundance of Gammarus spp., Jaera spp., and
Hyale nilssoni along the nutrient-enrichment gradient
(concentration in lMN; the two controls were pooled) in
A 2000 and B 2001.
Table 4. Pearson’s Correlation Analysis of Mac-rofauna Abundance Values 2000–2001 along theMesocosm Nutrient Gradient (0–32 lM N, 0–2 lMP)
2000 2001
Taxa r P value r P value
Littorina littorea 0.863 0.006 0.694 0.056
Jaera spp. 0.704 0.051 0.931 0.001
Gammarus spp. 0.257 0.539 0.753 0.031
Hyale nilssoni 0.275 0.510 0.160 0.704
Total abundance 0.671 0.069 0.712 0.047
Shannon diversity –0.084 0.844 –0.788 0.020
n = 8, r = correlation coefficients.Significant P values after a tablewise correction for the number of comparisons byHochberg’s sequential Bonferroni are underlined.
1086 Kraufvelin and others
spp. (F. serratus and F. vesiculosus pooled) and when
examined as algal community structure (multivar-
iate ANOSIM), the algal canopy was found to have
recovered in 2004.
The causative agent for the canopy crash was
most probably an age-related mortality of Fucus
specimens, which were not replaced by juveniles to
the same extent in the nutrient treatments as in the
controls. This may be due to increased competition
for space, light, and nutrients by ephemeral algae,
or to adverse effects on the reproduction and set-
tlement of Fucus germlings at high nutrient levels
(for example, Worm and others 2001; Berger and
others 2003; Steen 2004; Raberg and others 2005).
The significantly fewer numbers of Fucus germlings
registered in the nutrient treatments in 2001 lend
support to this theory, although in this project, the
limited recruitment of Fucus was probably mainly
caused by an increase in green, not brown or red
ephemerals. In both 2001 and 2002, the cover of
Ulva spp. had increased to approximately 30% in
the nutrient treatments, or three times the back-
ground abundance. The abundance of U. lactuca,
which grows primarily on rocks and other hard
substrate, seems to be controlled by light limitation
and increased more than twofold in response to the
breakdown of the fucoid vegetation. Ulva intestinalis
grows luxuriantly both on hard substrate and as
epiphytes, especially on old fucoids, and its response
measured as percentage cover is therefore affected
by the availability of both types of substrates.
Although the green algae responded to nutrient
enrichment as expected and the brown algae re-
spondedwith a delay, the cover of red algae declined
0
500
1000
1500
2000
2002 2003 2004
Nu
mb
er o
fJa
era
-in
div
idu
als
in a
rtif
icia
l su
bst
rate
s ControlTreatment
0
200
400
600
2002 2003 2004Nu
mb
ers
of
Gam
mar
us
-in
div
idu
als
in a
rtif
icia
l su
bst
rate
s
ControlTreatment
0
100
200
300
400
2002 2003 2004
Nu
mb
er o
f H
yale
-in
div
idu
als
in a
rtif
icia
l su
bst
rate
s ControlTreatment
0
1000
2000
3000
4000
2002 2003 2004
To
tal n
um
ber
of
ind
ivid
ual
s in
art
ific
ial s
ub
stra
tes Control
Treatment
A
B
C
D
Figure 9. Macrofauna
abundance in artificial
substrates in controls and
mesocosm treatments
(addition of 32 lM N in
2002) and in the same
systems during the
recovery phase in 2003–
04 (means ± SE).A Jaera
spp. B Gammarus spp.
C Hyale nilssoni. D total
abundance (mean ± SE).
Nutrient Addition to Rocky Shore Communities 1087
in all mesocosms (Bokn and others 2003). With the
exception of a stimulated abundance of red algal
species by nutrient addition in 2000, no other sig-
nificant responses were observed, either to in-
creased nutrient addition or to recovery conditions.
One possible cause is their different life strategies.
Ceramium spp. (filamentous group) grew mainly as
epiphytes and were thus dependent on both Fucus
abundance and conditions. Chondrus crispus (coar-
sely branched group) prefers shading and is in this
respect dependent on Fucus abundance, which may
explain an increased abundance of C. crispus during
the recovery phase, when the cover of fucoids in-
creased. Overall, changes in the abundance of red
algae were probably too small compared to natural
variability for responses to be detected.
Because enhanced nutrient levels are expected
to improve the food quality for animals in several
ways, including increased N and P content of al-
gae, lowered levels of grazer deterrents, stimula-
tion of generally preferred periphyton and green
algae, and increased amounts of detritus and other
food items (Mattson 1980; Hemmi and Jormalai-
nen 2002), a stimulated animal abundance along
a nutrient enrichment gradient is not very sur-
prising. By 2001, three dominating groups of
macrofauna—Littorina littorea (an intertidal surface
grazer), Jaera spp. (intertidal interstitial grazers),
and Gammarus spp. (ubiquitous grazers/omni-
vores)—had shown significant stimulation of the
number of individuals with nutrient enrichment
(Table 4). After 2001, the abundance of these
animals dropped despite an intensified dosing,
which could be related in part to the loss of the
macroalgal canopy or the changed algal commu-
nity composition (Benedetti-Cecchi and others
2001; Duffy and others 2001), although other
explanations are also possible. The presence of
other agents is supported by the fact that there
were no significant positive correlations between
the abundance of these animals and the amount
of canopy brown algae when examined over the
period 2000–04 (Table 6). Instead, Jaera spp.
indicated a negative response to the percentage
cover of Fucus serratus, whereas both Gammarus
spp. and Hyale nilssoni were indicative of positive
responses to green algal cover, which continued to
increase during 2002. The animal responses to
Fucus spp. are therefore probably masked by re-
sponses to green algae, because these two algal
groups correlated significantly and negatively to
each other during the treatment period.
Table 5. Two-way Analysis of Variance (ANOVA) on Macrofauna Abundance Values with FactorsN = Nutrient Addition (Two Levels: Control versus Addition of 32 lM N and 2 lM P) and Y = Years (ThreeLevels: 2002–04)
Littorina littorea Abundance, square root (x+1) Jaera spp. Abundance, square root (x+1)
Source df MS F P Source df MS F P
Nutrient 1,18 1.45 0.11 0.744 Nutrient 1,18 181.94 3.33 0.085
Year 2,18 13.41 1.02 0.380 Year 2,18 67.41 1.23 0.315
N · Y 2,18 3.87 0.29 0.748 N · Y 2,18 56.61 1.04 0.375
Residual 13.13 Residual 54.69
Gammarus spp. Abundance Hyale nilssoni Abundance, square root (x+1)
Source df MS F P Source df MS F P
Nutrient 1,18 1488 0.07 0.800 Nutrient 1,18 39.70 2.12 0.162
Year 2,18 70675 3.15 0.067 Year 2,18 14.95 0.80 0.465
N · Y 2,18 14558 0.65 0.535 N · Y 2,18 83.41 4.46 0.027
Residual 22465 Residual 18.69
Total Abundance Shannon-Wiener Diversity
Source df MS F P Source df MS F P
Nutrient 1,18 1.9 · 106 5.44 0.032 Nutrient 1,18 0.00 0.05 0.830
Year 2,18 1.1 · 106 3.21 0.064 Year 2,18 0.40 5.25 0.016
N · Y 2,18 0.6 · 106 1.85 0.186 N · Y 2,18 0.00 0.02 0.976
Residual 0.3 · 106 Residual 0.08
P values significant at the 0.05 level after correction for the number of tests by Hochberg’s sequential Bonferroni are underlined (the Bonferroni corrections were madeseparately for each animal variable).Transformed variables are indicated in the table heads.
1088 Kraufvelin and others
The different development of the Shannon-
Wiener diversity index for algae and animals over
time deserves some attention. For algae, the very
high dominance of brown fucoids in the controls
throughout the experimental period implied a
clearly lower Shannon-Wiener diversity index than
was seen in the nutrient-enriched mesocosms. This
is in accordance with the intermediate disturbance
hypothesis (Connell 1978), which predicts a de-
pressed diversity in the absence of disturbance, due
to the competitive exclusion of inferior competitors
by one or a few dominant species, and an increased
diversity at low to moderate stress levels. Although
this hypothesis is somewhat controversial (Mackey
and Currie 2001), it has often been supported by
studies from marine hard-bottom communities (for
example, Lubchenco 1978; Paine and Levin 1981;
Valdivia and others 2005; Patricio and others
2006). Moreover, the stimulated algal diversity in
this study is also supported by the findings by
Bracken and Nielsen (2004), who suggested that
below a critical nutrient level, local-scale nutrient
additions may increase algal diversity, but above
the critical level, algal diversity declines with
enrichment. For animals, the pattern was the re-
verse, with a slight decrease in the Shannon-Wie-
ner diversity index along the increasing nutrient
gradient in 2001. This decrease was basically due to
the strong dominance of a few animal species that
were favored by nutrient enrichment.
When analyzed by multivariate statistical tech-
niques, the algal community (not surprisingly) re-
sponded more readily to nutrient enrichment than
the animal community, which did not show a sig-
nificant difference in community structure be-
tween controls and nutrient treatments when
whole communities were examined simulta-
neously. This may have a natural explanation,
because primary community responses to eutro-
phication probably have to be maintained for a
longer period of time before secondary community
responses can be expected to express themselves
(Kraufvelin and others 2002). In addition, algal–
animal interactions on eutrophic rocky shore sys-
tems have a very complex nature. It seems that
eutrophication provides more and better-suited
algal food but less suitable habitats for animals,
making the whole pattern of responses extremely
difficult to assess (for example, Thompson and
others 2002; Bokn and others 2003; Kraufvelin and
others 2006). With higher nutrient concentrations,
a more homogeneous environment for the fauna
could be generally expected, with either higher
biomasses of the animal species favored by the new
environment, fewer species because there are now
fewer different niches, or both reduced biomass
and diversity due to increased emigration (see
Christie and Kraufvelin 2004) as a result of spatial
competition.
When the sudden and dramatic community
changes reported in this study are viewed in con-
trast to the less dramatic effects reported previously
(Bokn and others 2002, 2003; Kraufvelin and
others 2002, 2006; Karez and others 2004), it be-
0
0,5
1
1,5
2
0 1 2 4 8 16 32
2000
2001
0
0,5
1
1,5
2
2002 2003 2004
Control
Treatment
A
B
Figure 10. Shannon-Wiener diversity for macrofaunal
data. A along the nutrient-enrichment gradient (con-
centration in lM N; the two controls were pooled), B in
controls and mesocosm treatments (addition of 32 lM N
in 2002) and in the same systems during the recovery
phase in 2003–04 (means ± SE).
Nutrient Addition to Rocky Shore Communities 1089
comes clear that our understanding of eutrophica-
tion responses in rocky shore communities is far
from complete. Rocky intertidal communities may
have a high resistance to disturbance caused by
excessive availability of nutrients as long as the
communities are not seriously stressed or perturbed
by other chemical, physical, or biological processes
(Connell 1985; Thompson and others 2002). For
every new factor added, numerous new uncer-
tainties and questions arise, some of which are
interrelated. The results from our mesocosm studies
highlight three factors relevant in the context of
community resistance: (a) grazing by animals, (b)
wave exposure and the export of matter, and (c)
the successional stage of the algal community and
the longevity of the key algal species. These factors
have already been discussed by Pihl and others
(1999), Schramm (1999), Bokn and others (2003),
and Kraufvelin and others (2006).
The results indicated that rocky shore commu-
nities are able to resist a loss of brown algal canopy
and a shift to dominance of bloom-forming oppor-
tunistic algae for several years. Nevertheless, com-
munity shifts may ultimately occur if the high
nutrient levels persist over longer periods. Dramatic
shifts to contrasting states are not uncommon in
ecosystems subjected to gradual change (Scheffer
and others 2001; Scheffer and Carpenter 2003),
0(0)a 0(0)b
0(1) 0(2)
32(4) 32(8)
32(16) 32(32)
Stress: 0.2
2001
2000
2002
2003
2004
Figure 11. Nonmetric multidimensional scaling (NMDS) ordination describing changes in macrofaunal community
structure in the mesocosms from 2000–04 (stress 0.20). The lines help to group samples from the same year together. Dark
labels indicate high-nutrient treatments, 32 lM N in 2002 (levels in parenthesis = dosing for 2000–01); gray labels
indicate controls in 2002 (levels in parenthesis = dosing for 2000–01). In 2003–04, no dosing took place so we could study
possible recovery.
Table 6. Pearson’s Correlation Analysis between Algal Degree of Cover and Macrofaunal Abundance Datawithin Treatment Mesocosms from 2000 to 2004 (n = 40)
Taxa Statistics Ulva intestinalis Ulva lactuca Red algae Fucus vesiculosus Fucus serratus
Jaera spp. r 0.117 0.155 0.126 –0.204 –0.327
P value 0.473 0.338 0.438 0.207 0.039
Gammarus spp. r 0.362 0.001 0.020 0.157 0.125
P value 0.022 0.997 0.901 0.334 0.442
Hyale nilssoni r 0.527 0.285 0.166 0.082 0.172
P value < 0.001 0.074 0.307 0.615 0.288
Total r 0.605 0.404 0.266 –0.004 –0.151
P value < 0.001 0.010 0.097 0.979 0.353
Significant P values after a tablewise correction for the number of comparisons by Hochberg’s sequential Bonferroni are underlined.
1090 Kraufvelin and others
especially in situations where interspecific compe-
tition exceeds intraspecific competition (van Nes
and Scheffer 2004)—that is, in this case, green Ulva
spp. versus brown canopy Fucus spp. This study
further indicates that rocky shore communities
have a high degree of resilience—that is, an ability
to rapidly return to natural undisturbed conditions
after termination of the disturbance, as long as the
communities are situated within the range of nat-
ural spore and larval dispersion. In this sense, it
must be pointed out that the mesocosms were al-
ways fed with untreated seawater from adjacent
relatively undisturbed rocky shore areas, which
may affect both the responses (delay) and the
recovery (speedup). The responses and recovery
patterns presented here have also only been dem-
onstrated for moderately wave-exposed mesocosm
communities with established macroalgal domi-
nance. Because the realism of mesocosm studies
and other experiments is open to debate (for
example, Perez 1995), the types and timing of ef-
fects and recovery in natural ecosystems may differ
from these findings depending on geographical
location, site history, distance to unaffected areas,
and specific additional chemical, physical, and bio-
logical stressors (natural or human-induced).
However, the consistency within control and
treatment mesocosms and the fact that the meso-
cosm communities have persisted like natural rocky
shore communities throughout the 7-year study
period further argue for the validity of our results.
Different species showed different recovery pat-
terns; the recovery for green algae implied a de-
creased cover, whereas the opposite was true for
fucoids. Green algae recovered faster than the
brown algae; this difference can be attributed to
differences in the lifespans of the two groups, but
also to the fact that green algal growth was stim-
ulated more directly by, and dependent on the
actual nutrient-enrichment levels than the peren-
nial brown algae, which are capable of nutrient
storage. Without any nutrient addition and with a
low availability of substrates (that is, fucoids), the
abundance of Ulva intestinalis was already reduced
to normal by the first summer of the recovery
phase. Conversely, the abundance of Ulva lactuca
did not decrease before the 2nd year of recovery,
when the canopy of fucoids again had been estab-
lished, because U. lactuca probably benefited from a
lower density of fucoids. Fucus vesiculosus and Fucus
serratus do compete for space in the lower littoral
zone, and the conditions seemed to favor the
growth of F. serratus during the recovery phase,
which here was expressed as a strong increase in
abundance both in controls and treated mesocosms
during the 2nd year of recovery (Figure 5a). The
faster recovery of the animal populations as com-
pared to that the algae, may be due to less intense
changes (only stimulation), but also to the stronger
seasonality of the animal assemblages that had very
low abundances in late autumn, winter, and
spring, after which time community development
begins again (Kraufvelin and others 2002; Christie
and Kraufvelin 2004).
Nutrient enrichment on rocky shores cannot be
expected to occur as a simple dose response (for
example, Dye 1998; Lopez-Rodriguez and others
1999; Kraufvelin and others 2002; Karez and oth-
ers 2004). The degree of wave exposure, water
exchange rates, water currents, weather condi-
tions, shore profiles, successional stage of the algal
community, and amount of grazers and predators
also affect eutrophication processes (Worm and
Sommer, 2000; Duggins and others 2001; Bokn and
others 2003; Kraufvelin and others 2006), making
the resulting community difficult to predict. At the
same times the impact of nutrient loading on top-
down and bottom-up processes must not be for-
gotten (Worm and Sommer 2000; Lotze and others
2001; Bracken 2004; Nielsen and Navarrete 2004).
This paper has demonstrated the significance of
time for the occurrence and detection of eutro-
phication responses (at least 5 years for a canopy
crash), and has shown that recovery after termi-
nation of nutrient enrichment can be relatively
rapid (1 to 2 years) despite dramatic effects. It is
noteworthy that both processes (effects and
recovery) expressed themselves similarly in all the
replicated mesocosm basins. The large time lag
before the effects of eutrophication were reflected
in these artificial rocky shore communities needs
also to be mentioned in the context of investiga-
tions and monitoring. Such time lags underscore
the need for more long-term experiments, partic-
ularly when dealing with larger and longer-lived
organisms, subtle community stressors, and
creeping change (Kraufvelin and others 2006).
ACKNOWLEDGEMENTS
The European Commission (through MAST III
program MAS3–CT97-0153), MARICULT, and
Norsk Hydro financed the first part of this work.
From May 2001 on, the project was supported by a
financial contribution from Abo Akademi Univer-
sity, Carl Cedercreutz stipendiefond at Svenska
Kulturfonden, Ella och Georg Ehrnrooths Stiftelse,
Svenska Litteratursallskapet i Finland (Ingrid,
Margit och Henrik Hoijers donationsfond II), Oskar
Oflunds Stiftelse, Societas pro Fauna et Flora Fen-
Nutrient Addition to Rocky Shore Communities 1091
nica, Letterstedska Foreningen, and the Academy
of Finland (P.K.). K. O’Brien kindly served as edi-
tor. This study could never have been completed
without the aid of the Norwegian Institute for
Water Research, which agreed to keep the meso-
cosms running over the 4 extra years despite a lack
of external funding. The paper is contribution
number 54 from Marine Research Station Sol-
bergstrand. The Solbergstrand mesocosms and the
Oslofjord can be viewed live at the following
Web-cam link: http://151.157.160.150/view/in-
dex.shtml (user name and password = mfs).
REFERENCES
Barron C, Marba N, Duarte CM, Pedersen MF, Lindblad C,
Kersting K, Moy F, et al. 2003. High organic carbon export
precludes eutrophication responses in experimental rocky
shore communities. Ecosystems 6:144–53.
Benedetti-Cecchi L, Pannacciulli F, Bulleri F, Moschella PS,
Airoldi L, Relini G, Cinelli F. 2001. Predicting the conse-
quences of anthropogenic disturbance: large-scale loss of
canopy algae on rocky shores. Mar Ecol Prog Ser 214:137–50.
Berger R, Henriksson E, Kautsky L, Malm T. 2003. Effects of
filamentous algae and deposited matter on the survival of
Fucus vesiculosus L. germlings in the Baltic Sea. Aquat Ecol
37:1–11.
Bokn TL, Moy FE, Christie H, Engelbert S, Karez R, Kersting K,
Kraufvelin P, et al. 2002. Are rocky shore ecosystems affected
by nutrient enriched seawater? Some preliminary results from
a mesocosm experiment. Hydrobiologia 484:167–75.
Bokn TL, Duarte CM, Pedersen MF, Marba N, Moy FE, Barron C,
Bjerkeng B, et al. 2003. The response of experimental rocky
shore communities to nutrient additions. Ecosystems 6:577–
94.
Bracken MES. 2004. Invertebrate-mediated nutrient loading
increases growth of an intertidal macroalga. J Phycol 40:1032–
41.
Bracken MES, Nielsen K. 2004. Diversity of intertidal macroal-
gae increases with nutrient loading by invertebrates. Ecology
85:2828–36.
Christie H, Kraufvelin P. 2004. Mechanisms regulating amphi-
pod population density within macroalgal communities with
restricted predator impact. Sci Mar 68:(Suppl 1)189–98.
Clarke KR. 1993. Non-parametric multivariate analyses of
changes in community structure. Aust J Ecol 18:117–43.
Cloern JE. 2001. Our evolving conceptual model of the coastal
eutrophication problem. Mar Ecol Progr Ser 210:223–53.
Connell JH. 1978. Diversity in tropical rain forests and coral
reefs. Science 199:1302–10.
Connell JH. 1985. Variation and persistence of rocky shore
populations. In: Moore PG, Seed R, Eds. The ecology of rocky
coasts. Kent, (UK): Hodder & Stoughton. p 57–69.
Dayton PK. 1971. Competition, disturbance and community
organization: the provision and subsequent utilization of space
in a rocky intertidal community. Ecol Monogr 41:351–89.
Diaz P, Gappa JJL, Piriz ML. 2002. Symptoms of eutrophication
in intertidal macroalgal assemblages of Nuevo Gulf (Pata-
gonia, Argentina). Bot Mar 45:267–73.
Duarte CM. 1995. Submerged aquatic vegetation in relation to
different nutrient regimes. Ophelia 41:87–112.
Duffy JE. 1990. Amphipods on seaweeds: partners or pests?
Oecologia 83:267–76.
Duffy JE, Macdonald KS, Rhode JM, Parker JD. 2001. Grazer
diversity, functional redundancy, and productivity in seagrass
beds: an experimental test. Ecology 82:2417–34.
Duggins D, Eckman JE, Siddon CE, Klinger T. 2001. Interactive
roles of mesograzers and current flow in survival of kelps. Mar
Ecol Progr Ser 223:143–55.
Dye AH. 1998. Dynamics of rocky intertidal communities:
analyses of long time series from South African shores. Estuar
Coast Shelf Sci 46:287–305.
Edgar GJ. 1990. The influence of plant structure on the species
richness, biomass and secondary production of macroalgal
assemblages associated with western Australian seagrass beds.
J Exp Mar Eco Biol 137:215–40.
Edgar GJ, Barrett NS, Morton AJ, Samson CR. 2004. Effects of
algal canopy clearance on plant, fish and macroinvertebrate
communities on eastern Tasmanian reefs. J Exp Mar Ecol Biol
312:67–87.
Gray J. 1992. Eutrophication in the sea. In: Colombo G, Ferrari I,
Ceccherelli VU, Rossi R, Eds. Marine eutrophication and
population dynamics. 25th European Marine Biology Sym-
posium. Fredensborg (Denmark): Olsen & Olsen. p 1–15.
Gray JS, Wu RS, Or YY. 2002. Effects of hypoxia and organic
enrichment on the coastal marine environment. Mar Ecol
Progr Ser 238:249–79.
Hawkins SJ, Hartnoll RG. 1983. Grazing on intertidal algae by
marine invertebrates. Oceanogr Mar Biol Annu Rev 21:195–
282.
Hayden HS, Blomster J, Maggs CA, Silva PC, Stanhope MJ,
Waaland JR. 2003. Linnaeus was right all along: Ulva and
Enteromorpha are not distinct genera. Eur J Phycol 38:277–
94.
Hemmi A, Jormalainen V. 2002. Nutrient enhancement in-
creases fecundity and growth of a marine herbivore via
quality of its food alga. Ecology 83:1052–64.
Hochberg Y. 1988. A sharper Bonferroni procedure for multiple
tests of significance. Biometrika 75:800–2.
Karez R, Engelbert S, Kraufvelin P, Pedersen MF, Sommer U.
2004. Biomass response and changes in composition of
ephemeral macroalgal assemblages along an experimental
gradient of nutrient enrichment. Aquat Bot 78:103–17.
Karlson K, Rosenberg R, Bonsdorff E. 2002. Temporal and spatial
large-scale effects of eutrophication and oxygen deficiency on
benthic fauna in Scandinavian and Baltic waters. Oceanogr
Mar Biol 40:427–89.
Kautsky H. 1991. Influence of eutrophication on the distribution
of phytobenthic plant and animal communities. Int Rev Ge-
samt Hydrobiol 76:423–32.
Kiirikki M. 1996. Experimental evidence that Fucus vesiculosus
(Phaeophyta) controls filamentous algae by means of the
whiplash effect. Eur J Phycol 31:61–6.
Kraufvelin P. 1998. Model ecosystem replicability challenged by
the ‘‘soft’’ reality of a hard bottom mesocosm. J Exp Mar Biol
Ecol 222:247–67.
Kraufvelin P. 1999. Baltic hard bottom mesocosms unplugged:
replicability, repeatability and ecological realism examined by
non-parametric multivariate techniques. J Exp Mar Biol Ecol
240:229–58.
1092 Kraufvelin and others
Kraufvelin P, Salovius S. 2004. Animal diversity in Baltic
rocky shore macroalgae: can Cladophora glomerata compen-
sate for lost Fucus vesiculosus?. Estuar Coast Shelf Sci
61:369–78.
Kraufvelin P, Christie H, Olsen M. 2002. Littoral macrofauna
(secondary) responses to experimental nutrient addition to
rocky shore mesocosms and a coastal lagoon. Hydrobiologia
484:149–66.
Kraufvelin P, Salovius S, Christie H, Moy FE, Karez R, Pedersen
MF. 2006. Eutrophication-induced changes in benthic algae
affect the behavior and fitness of the marine amphipod
Gammarus locusta. Aquat Bot. 84:199–209.
Kristiansen S, Paasche E. 1982. Nitrogen nutrition of the phy-
toplankton in the Oslofjord. Estuar Coast Shelf Sci 14:237–
49.
Lewis JR. 1964. The ecology of rocky shores. London: English
Universities Press, 323.
Lopez-Rodriguez MC, Barbara I, Perez-Cirera JL. 1999. Effects of
pollution on Fucus vesiculosus communities on the northwest
Iberian Atlantic coast. Ophelia 51:129–41.
Lotze HK, Worm B, Sommer U. 2001. Strong bottom-up and
top-down control of early life stages of macroalgae. Limnol
Oceanogr 46:749–57.
Lubchenco J. 1978. Plant species diversity in a marine intertidal
community: importance of herbivore food preference and al-
gal competitive abilities. Am Nat 112:23–39.
Mackey RL, Currie DJ. 2001. The diversity-disturbance rela-
tionship: is it generally strong and peaked? Ecology 82:3479–
92.
Mann KH. 1982. Ecology of coastal waters: a system approach.
Oxford (UK): Blackwell, 322.
Mattson WJ Jr. 1980. Herbivory in relation to plant nitrogen
content. Annu Rev Ecol System 12:405–37.
Middelboe AL, Sand-Jensen K. 2000. Long-term changes in
macroalgal communities in a Danish estuary. Phycologia
39:245–57.
Murray SN, Ambrose RF, Dethier MN. 2006. Monitoring rocky
shores. Berkeley University of California Press, 220.
Nielsen KJ, Navarrete SA. 2004. Mesoscale regulation comes
from the bottom-up: intertidal interactions between con-
sumers and upwelling. Ecol Lett 7:31–41.
Nixon SW. 1995. Coastal marine eutrophication: a definition,
social causes, and future concerns. Ophelia 41:199–220.
Paine R, Levin SA. 1981. Intertidal landscapes: disturbance and
the dynamics of pattern. Ecol Monogr 51:145–78.
Patricio J, Salas F, Pardal MA, Jørgensen SE, Marques JC. 2006.
Ecological indicators performance during a re-colonisation
field experiment and its complience with ecosystem theories.
Ecol Indi. 6:43–57.
Pedersen MF, Borum J. 1996. Nutrient control of algal growth in
estuarine waters: nutrient limitation and the importance of
nitrogen requirements and nitrogen storage among phyto-
plankton and species of macroalgae. Mar Ecol Progr Ser
142:261–72.
Perez KA. 1995. Role and significance of scale to ecotoxicology.
In: Cairns J, Niederlehner BR, Eds. Ecological toxicity testing
— scale, complexity and relevance. Boca Raton (FL): Lewis,
CRC Press. p 49–72.
Pihl L, Svenson A, Moksnes PO, Wennehage H. 1999. Distri-
bution of green algal mats throughout shallow soft bottoms of
the Swedish Skagerrak archipelago in relation to nutrient
sources and wave exposure. J Sea Res 41:281–95.
Raberg S, Berger-Jonsson R, Bjorn A, Graneli E, Kautsky L.
2005. Effects of Pilayella littoralis on Fucus vesiculosus recruit-
ment: implications for community composition. Mar Ecol
Progr Ser 289:131–9.
Ronnberg O, Adjers K, Ruokolahti C, Bondestam M. 1992. Ef-
fects of fish farming on growth, epiphytes and nutrient con-
tents of Fucus vesiculosus L. in the Aland archipelago, northern
Baltic Sea. Aquat Bot 42:109–20.
Rosenberg R. 1985. Eutrophication — the future marine coastal
nuisance?. Mar Pollut Bullet 16:227–31.
Salovius S, Kraufvelin P. 2004. Filamentous green alga Clado-
phora glomerata as a habitat for littoral macrofauna in the
northern Baltic Sea. Ophelia 58:65–78.
Scheffer M, Carpenter SR. 2003. Catastrophic regime shifts in
ecosystems: linking theory to observation. Trends Ecol Evol
18:648–56.
Scheffer M, Carpenter S, Foley JA, Folke C, Walker B. 2001.
Catastrophic shifts in ecosystems. Nature 413:591–6.
Schramm W. 1999. Factors influencing seaweed responses to
eutrophication: some results from EU-project EUMAC. J Appl
Phycol 11:69–78.
Sokal RR, Rohlf FJ. 1995. Biometry. 3rd edn. New York: WH
Freeman, 887.
Steen H. 2004. Interspecific competition between Enteromorpha
(Ulvales: Chlorophyceae) and Fucus (Fucales: Phaeophyceae)
germlings: effects of nutrient concentration, temperature, and
settlement density. Mar Ecol Progr Ser 278:89–101.
Thompson RC, Crowe TP, Hawkins SJ. 2002. Rocky intertidal
communities, past environmental changes, present status and
predictions for the next 25 years. Environ Conserv 29:168–91.
Valdivia N, Heidemann A, Thiel M, Molis M, Wahl M. 2005.
Effects of disturbance on the diversity of hard-bottom mac-
robenthic communities on the coast of Chile. Mar Ecol Progr
Ser 299:45–54.
Valiela I. 1995. Marine ecological processes. New York: Springer-
Verlag, 686.
Valiela I, McClelland J, Hauxwell J, Behr PJ, Hersh D, Foreman
K. 1997. Macroalgal blooms in shallow estuaries: controls and
ecophysiological and ecosystem consequences. Limnol Ocea-
nogr 42:1105–18.
van Nes EH, Scheffer M. 2004. Large species shifts triggered by
small forces. Am Nat 164:255–66.
Vidal M, Duarte CM, Sanches MC. 1999. Coastal eutrophication
research in Europe: progress and imbalances. Mar Pollut
Bullet 38:851–4.
Vitousek PM, Aber JD, Howarth RH, Likens GE, Matson PE,
Schindler DW, Schlesinger WH, et al. 1997. Human alteration
of the global nitrogen cycle: source and consequences. Ecol
Appl 7:737–50.
Weaver MJ, Magnuson JJ, Clayton MK. 1997. Distribution of
littoral fishes in structurally complex macrophytes. Can J Fish
Aquat Sci 54:2277–89.
Worm B, Sommer U. 2000. Rapid direct and indirect effects of a
single nutrient pulse in a seaweed-epiphyte-grazer system.
Mar Ecol Progr Ser 202:282–8.
Worm B, Lotze H, Sommer U. 2001. Algal propagule banks
modify competition, consumer and resource control on Baltic
rocky shores. Oecologia 128:281–93.
Nutrient Addition to Rocky Shore Communities 1093
Copyright © 2022 FDOKUMEN