Phylogeography and Population dynamics of Dengue viruses in the Americas
11
Phylogeography and Population Dynamics of Dengue Viruses in the Americas Orchid M. Allicock, 1 Philippe Lemey, 2 Andrew J. Tatem, 3,4 Oliver G. Pybus, 5 Shannon N. Bennett, 6 Brandi A. Mueller, 6 Marc A. Suchard, 7,8 Jerome E. Foster, 1 Andrew Rambaut, 4,9 and Christine V. F. Carrington* ,1 1 Department of Preclinical Sciences, Faculty of Medical Sciences, University of the West Indies, St Augustine, Trinidad and Tobago 2 Department of Microbiology and Immunology, Katholieke Universiteit Leuven, Leuven, Belgium 3 Department of Geography and Emerging Pathogens Institute, University of Florida 4 Fogarty International Center, National Institutes of Health, Bethesda, Maryland 5 Department of Zoology, University of Oxford, Oxford, United Kingdom 6 Department of Tropical Medicine, Medical Microbiology, and Pharmacology, John A. Burns School of Medicine, University of Hawaii at Manoa 7 Departments of Biomathematics and Human Genetics, David Geffen School of Medicine, University of California, Los Angeles 8 Department of Biostatistics, School of Public Health, University of California, Los Angeles 9 Institute of Evolutionary Biology, University of Edinburgh, Ashworth Laboratories, Edinburgh, United Kingdom *Corresponding author: E-mail: [email protected]. Associate editor: Daniel Falush Abstract Changes in Dengue virus (DENV) disease patterns in the Americas over recent decades have been attributed, at least in part, to repeated introduction of DENV strains from other regions, resulting in a shift from hypoendemicity to hyperendemicity. Using newly sequenced DENV-1 and DENV-3 envelope (E) gene isolates from 11 Caribbean countries, along with sequences available on GenBank, we sought to document the population genetic and spatiotemporal transmission histories of the four main invading DENV genotypes within the Americas and investigate factors that influence the rate and intensity of DENV transmission. For all genotypes, there was an initial invasion phase characterized by rapid increases in genetic diversity, which coincided with the first confirmed cases of each genotype in the region. Rapid geographic dispersal occurred upon each genotype’s introduction, after which individual lineages were locally maintained, and gene flow was primarily observed among neighboring and nearby countries. There were, however, centers of viral diversity (Barbados, Puerto Rico, Colombia, Suriname, Venezuela, and Brazil) that were repeatedly involved in gene flow with more distant locations. For DENV-1 and DENV-2, we found that a ‘‘distance-informed’’ model, which posits that the intensity of virus movement between locations is inversely proportional to the distance between them, provided a better fit than a model assuming equal rates of movement between all pairs of countries. However, for DENV-3 and DENV-4, the more stochastic ‘‘equal rates’’ model was preferred. Key words: dengue virus, gene flow, Bayesian phylogeography, Americas, population dynamics, evolution, coalescent. Introduction Dengue virus (DENV) is the most widely distributed flavivirus species, found in almost all tropical and subtropical regions where the mosquito vectors Aedes aegypti and Ae- des albopictus thrive (Halstead 1992). This distribution pla- ces approximately 2.5 billion people at risk of infection (Guzman et al. 2010). DENV exists as four antigenically dis- tinct serotypes (DENV-1 to DENV-4) that are further sub- divided into numerous phylogenetically distinct genotypes. All four serotypes are known to be the causative agents of dengue fever and of the more severe dengue hemorrhagic fever (DHF) and dengue shock syndrome (DSS). Dengue is perhaps the most important emerging vector-borne dis- ease of the 21st century. Recent figures estimate that there are 50 million infections annually, including 500,000 hospi- talizations due to DHF alone (Guzman et al. 2010), and since the 1980s, there has been a 4.5-fold increase in the number of reported cases Americas alone (San Martin et al. 2010). Phylogenetic analyses suggest that currently circulating serotypes diverged from their sylvatic ancestors approxi- mately 1,000 years ago (Twiddy et al. 2003); however, the geographic origins of DENV remain unclear and have been alternatively attributed to Africa or Asia (Smith 1956; Christophers 1960; Powell et al. 1980; Wang et al. 2000; Diallo et al. 2005). Currently, the greatest genetic diversity is found in Southeast Asia where all four serotypes have been cocirculating since World War II (Gubler 2006). This region has been identified as a source population for the rapid and dramatic reemergence of DENV globally over the last half-century, initially facilitated by the movement of ships and goods during the Second World War (Gubler © The Author 2012. Published by Oxford University Press on behalf of the Society for Molecular Biology and Evolution. All rights reserved. For permissions, please e-mail: [email protected] Mol. Biol. Evol. 29(6):1533–1543. 2012 doi:10.1093/molbev/msr320 Advance Access publication January 6, 2012 1533 Research article at National Institutes of Health Library on July 13, 2012 http://mbe.oxfordjournals.org/ Downloaded from
Transcript of Phylogeography and Population dynamics of Dengue viruses in the Americas
Phylogeography and Population Dynamics of Dengue Virusesin the Americas
Orchid M. Allicock,1 Philippe Lemey,2 Andrew J. Tatem,3,4 Oliver G. Pybus,5 Shannon N. Bennett,6
Brandi A. Mueller,6 Marc A. Suchard,7,8 Jerome E. Foster,1 Andrew Rambaut,4,9 andChristine V. F. Carrington*,1
1Department of Preclinical Sciences, Faculty of Medical Sciences, University of the West Indies, St Augustine, Trinidad and Tobago2Department of Microbiology and Immunology, Katholieke Universiteit Leuven, Leuven, Belgium3Department of Geography and Emerging Pathogens Institute, University of Florida4Fogarty International Center, National Institutes of Health, Bethesda, Maryland5Department of Zoology, University of Oxford, Oxford, United Kingdom6Department of Tropical Medicine, Medical Microbiology, and Pharmacology, John A. Burns School of Medicine, University ofHawaii at Manoa7Departments of Biomathematics and Human Genetics, David Geffen School of Medicine, University of California, Los Angeles8Department of Biostatistics, School of Public Health, University of California, Los Angeles9Institute of Evolutionary Biology, University of Edinburgh, Ashworth Laboratories, Edinburgh, United Kingdom
*Corresponding author: E-mail: [email protected].
Associate editor: Daniel Falush
Abstract
Changes in Dengue virus (DENV) disease patterns in the Americas over recent decades have been attributed, at least inpart, to repeated introduction of DENV strains from other regions, resulting in a shift from hypoendemicity tohyperendemicity. Using newly sequenced DENV-1 and DENV-3 envelope (E) gene isolates from 11 Caribbean countries,along with sequences available on GenBank, we sought to document the population genetic and spatiotemporaltransmission histories of the four main invading DENV genotypes within the Americas and investigate factors thatinfluence the rate and intensity of DENV transmission. For all genotypes, there was an initial invasion phase characterizedby rapid increases in genetic diversity, which coincided with the first confirmed cases of each genotype in the region. Rapidgeographic dispersal occurred upon each genotype’s introduction, after which individual lineages were locally maintained,and gene flow was primarily observed among neighboring and nearby countries. There were, however, centers of viraldiversity (Barbados, Puerto Rico, Colombia, Suriname, Venezuela, and Brazil) that were repeatedly involved in gene flowwith more distant locations. For DENV-1 and DENV-2, we found that a ‘‘distance-informed’’ model, which posits that theintensity of virus movement between locations is inversely proportional to the distance between them, provided a betterfit than a model assuming equal rates of movement between all pairs of countries. However, for DENV-3 and DENV-4, themore stochastic ‘‘equal rates’’ model was preferred.
Key words: dengue virus, gene flow, Bayesian phylogeography, Americas, population dynamics, evolution, coalescent.
IntroductionDengue virus (DENV) is the most widely distributedflavivirus species, found in almost all tropical and subtropicalregions where the mosquito vectors Aedes aegypti and Ae-des albopictus thrive (Halstead 1992). This distribution pla-ces approximately 2.5 billion people at risk of infection(Guzman et al. 2010). DENV exists as four antigenically dis-tinct serotypes (DENV-1 to DENV-4) that are further sub-divided into numerous phylogenetically distinct genotypes.All four serotypes are known to be the causative agents ofdengue fever and of the more severe dengue hemorrhagicfever (DHF) and dengue shock syndrome (DSS). Dengue isperhaps the most important emerging vector-borne dis-ease of the 21st century. Recent figures estimate that thereare 50 million infections annually, including 500,000 hospi-talizations due to DHF alone (Guzman et al. 2010), and
since the 1980s, there has been a 4.5-fold increase in thenumber of reported cases Americas alone (San Martinet al. 2010).
Phylogenetic analyses suggest that currently circulatingserotypes diverged from their sylvatic ancestors approxi-mately 1,000 years ago (Twiddy et al. 2003); however,the geographic origins of DENV remain unclear and havebeen alternatively attributed to Africa or Asia (Smith 1956;Christophers 1960; Powell et al. 1980; Wang et al. 2000;Diallo et al. 2005). Currently, the greatest genetic diversityis found in Southeast Asia where all four serotypes havebeen cocirculating since World War II (Gubler 2006). Thisregion has been identified as a source population for therapid and dramatic reemergence of DENV globally over thelast half-century, initially facilitated by the movement ofships and goods during the Second World War (Gubler
© The Author 2012. Published by Oxford University Press on behalf of the Society for Molecular Biology and Evolution. All rights reserved. For permissions, pleasee-mail: [email protected]
Mol. Biol. Evol. 29(6):1533–1543. 2012 doi:10.1093/molbev/msr320 Advance Access publication January 6, 2012 1533
Research
article at N
ational Institutes of Health L
ibrary on July 13, 2012http://m
be.oxfordjournals.org/D
ownloaded from
1997) and more recently by rapid increases in human pop-ulation size, uncontrolled urbanization, and the advent ofrapid mass human movement (Gubler 1998; Kroeger andNathan 2006).
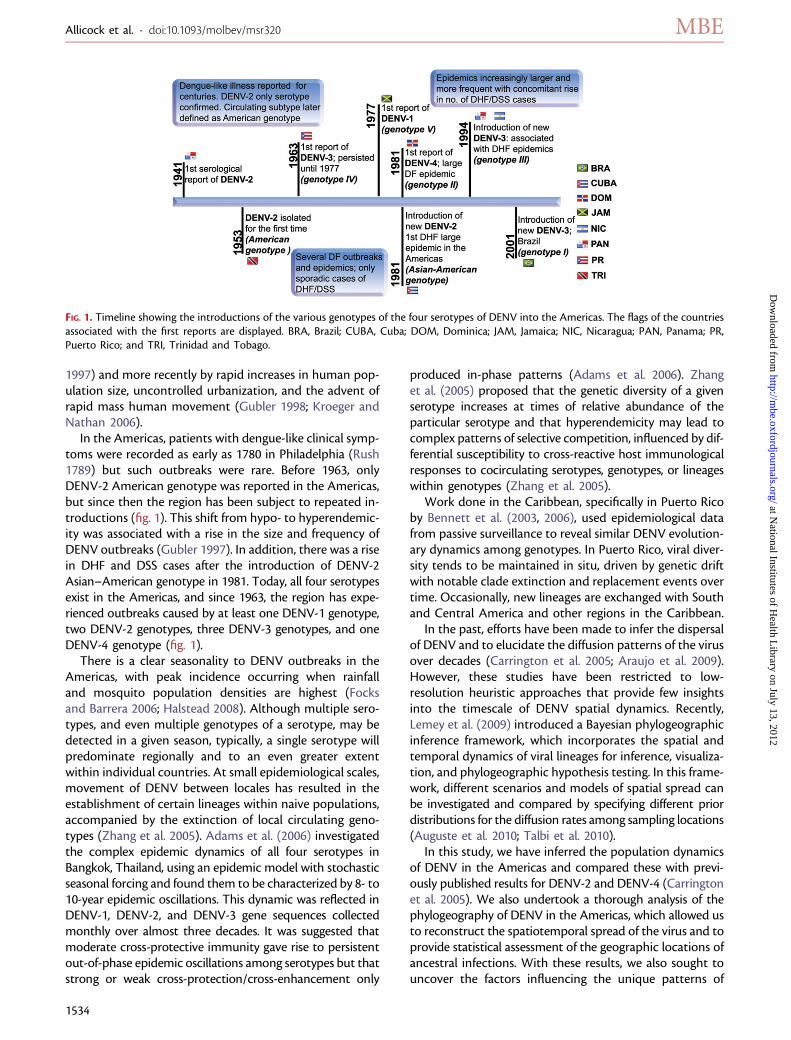
In the Americas, patients with dengue-like clinical symp-toms were recorded as early as 1780 in Philadelphia (Rush1789) but such outbreaks were rare. Before 1963, onlyDENV-2 American genotype was reported in the Americas,but since then the region has been subject to repeated in-troductions (fig. 1). This shift from hypo- to hyperendemic-ity was associated with a rise in the size and frequency ofDENV outbreaks (Gubler 1997). In addition, there was a risein DHF and DSS cases after the introduction of DENV-2Asian–American genotype in 1981. Today, all four serotypesexist in the Americas, and since 1963, the region has expe-rienced outbreaks caused by at least one DENV-1 genotype,two DENV-2 genotypes, three DENV-3 genotypes, and oneDENV-4 genotype (fig. 1).
There is a clear seasonality to DENV outbreaks in theAmericas, with peak incidence occurring when rainfalland mosquito population densities are highest (Focksand Barrera 2006; Halstead 2008). Although multiple sero-types, and even multiple genotypes of a serotype, may bedetected in a given season, typically, a single serotype willpredominate regionally and to an even greater extentwithin individual countries. At small epidemiological scales,movement of DENV between locales has resulted in theestablishment of certain lineages within naive populations,accompanied by the extinction of local circulating geno-types (Zhang et al. 2005). Adams et al. (2006) investigatedthe complex epidemic dynamics of all four serotypes inBangkok, Thailand, using an epidemic model with stochasticseasonal forcing and found them to be characterized by 8- to10-year epidemic oscillations. This dynamic was reflected inDENV-1, DENV-2, and DENV-3 gene sequences collectedmonthly over almost three decades. It was suggested thatmoderate cross-protective immunity gave rise to persistentout-of-phase epidemic oscillations among serotypes but thatstrong or weak cross-protection/cross-enhancement only
produced in-phase patterns (Adams et al. 2006). Zhanget al. (2005) proposed that the genetic diversity of a givenserotype increases at times of relative abundance of theparticular serotype and that hyperendemicity may lead tocomplex patterns of selective competition, influenced by dif-ferential susceptibility to cross-reactive host immunologicalresponses to cocirculating serotypes, genotypes, or lineageswithin genotypes (Zhang et al. 2005).
Work done in the Caribbean, specifically in Puerto Ricoby Bennett et al. (2003, 2006), used epidemiological datafrom passive surveillance to reveal similar DENV evolution-ary dynamics among genotypes. In Puerto Rico, viral diver-sity tends to be maintained in situ, driven by genetic driftwith notable clade extinction and replacement events overtime. Occasionally, new lineages are exchanged with Southand Central America and other regions in the Caribbean.
In the past, efforts have been made to infer the dispersalof DENV and to elucidate the diffusion patterns of the virusover decades (Carrington et al. 2005; Araujo et al. 2009).However, these studies have been restricted to low-resolution heuristic approaches that provide few insightsinto the timescale of DENV spatial dynamics. Recently,Lemey et al. (2009) introduced a Bayesian phylogeographicinference framework, which incorporates the spatial andtemporal dynamics of viral lineages for inference, visualiza-tion, and phylogeographic hypothesis testing. In this frame-work, different scenarios and models of spatial spread canbe investigated and compared by specifying different priordistributions for the diffusion rates among sampling locations(Auguste et al. 2010; Talbi et al. 2010).
In this study, we have inferred the population dynamicsof DENV in the Americas and compared these with previ-ously published results for DENV-2 and DENV-4 (Carringtonet al. 2005). We also undertook a thorough analysis of thephylogeography of DENV in the Americas, which allowed usto reconstruct the spatiotemporal spread of the virus and toprovide statistical assessment of the geographic locations ofancestral infections. With these results, we also sought touncover the factors influencing the unique patterns of
FIG. 1. Timeline showing the introductions of the various genotypes of the four serotypes of DENV into the Americas. The flags of the countriesassociated with the first reports are displayed. BRA, Brazil; CUBA, Cuba; DOM, Dominica; JAM, Jamaica; NIC, Nicaragua; PAN, Panama; PR,Puerto Rico; and TRI, Trinidad and Tobago.
Allicock et al. · doi:10.1093/molbev/msr320 MBE
1534
at National Institutes of H
ealth Library on July 13, 2012
http://mbe.oxfordjournals.org/
Dow
nloaded from
population dynamics and spatial diffusion of DENV in theAmericas (Minin et al. 2008; Lemey et al. 2009).
Materials and Methods
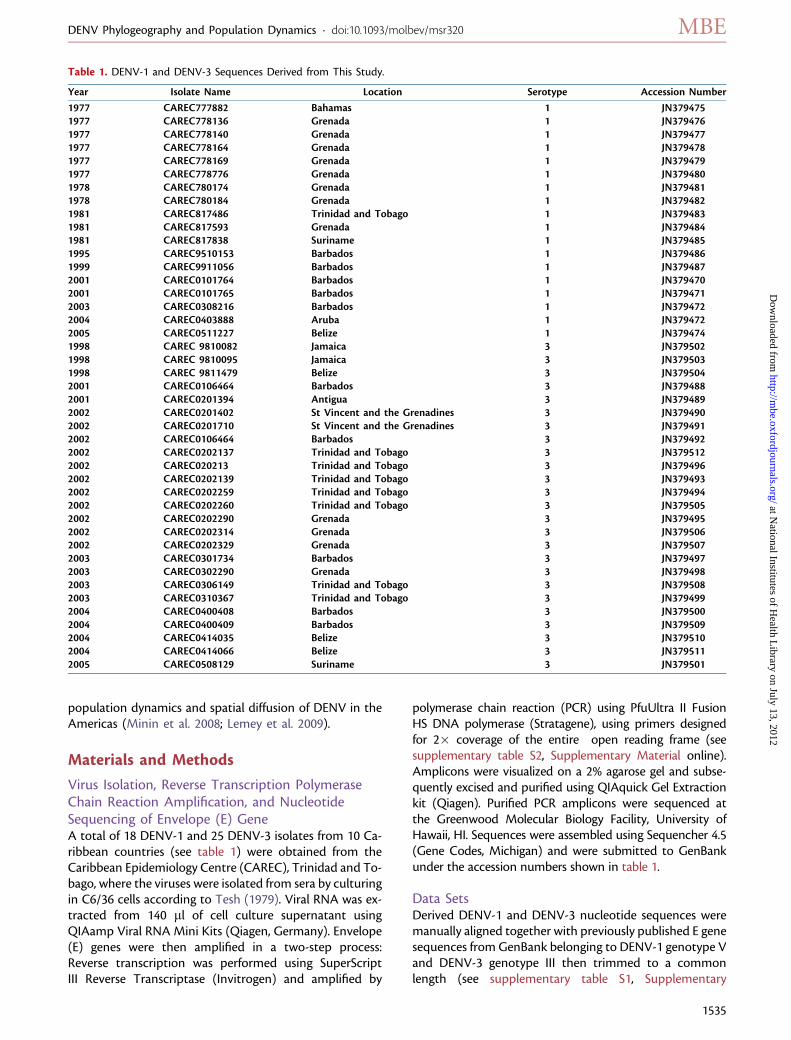
Virus Isolation, Reverse Transcription PolymeraseChain Reaction Amplification, and NucleotideSequencing of Envelope (E) GeneA total of 18 DENV-1 and 25 DENV-3 isolates from 10 Ca-ribbean countries (see table 1) were obtained from theCaribbean Epidemiology Centre (CAREC), Trinidad and To-bago, where the viruses were isolated from sera by culturingin C6/36 cells according to Tesh (1979). Viral RNA was ex-tracted from 140 ll of cell culture supernatant usingQIAamp Viral RNA Mini Kits (Qiagen, Germany). Envelope(E) genes were then amplified in a two-step process:Reverse transcription was performed using SuperScriptIII Reverse Transcriptase (Invitrogen) and amplified by
polymerase chain reaction (PCR) using PfuUltra II FusionHS DNA polymerase (Stratagene), using primers designedfor 2� coverage of the entire open reading frame (seesupplementary table S2, Supplementary Material online).Amplicons were visualized on a 2% agarose gel and subse-quently excised and purified using QIAquick Gel Extractionkit (Qiagen). Purified PCR amplicons were sequenced atthe Greenwood Molecular Biology Facility, University ofHawaii, HI. Sequences were assembled using Sequencher 4.5(Gene Codes, Michigan) and were submitted to GenBankunder the accession numbers shown in table 1.
Data SetsDerived DENV-1 and DENV-3 nucleotide sequences weremanually aligned together with previously published E genesequences from GenBank belonging to DENV-1 genotype Vand DENV-3 genotype III then trimmed to a commonlength (see supplementary table S1, Supplementary
Table 1. DENV-1 and DENV-3 Sequences Derived from This Study.
Year Isolate Name Location Serotype Accession Number
1977 CAREC777882 Bahamas 1 JN3794751977 CAREC778136 Grenada 1 JN3794761977 CAREC778140 Grenada 1 JN3794771977 CAREC778164 Grenada 1 JN3794781977 CAREC778169 Grenada 1 JN3794791977 CAREC778776 Grenada 1 JN3794801978 CAREC780174 Grenada 1 JN3794811978 CAREC780184 Grenada 1 JN3794821981 CAREC817486 Trinidad and Tobago 1 JN3794831981 CAREC817593 Grenada 1 JN3794841981 CAREC817838 Suriname 1 JN3794851995 CAREC9510153 Barbados 1 JN3794861999 CAREC9911056 Barbados 1 JN3794872001 CAREC0101764 Barbados 1 JN3794702001 CAREC0101765 Barbados 1 JN3794712003 CAREC0308216 Barbados 1 JN3794722004 CAREC0403888 Aruba 1 JN3794722005 CAREC0511227 Belize 1 JN3794741998 CAREC 9810082 Jamaica 3 JN3795021998 CAREC 9810095 Jamaica 3 JN3795031998 CAREC 9811479 Belize 3 JN3795042001 CAREC0106464 Barbados 3 JN3794882001 CAREC0201394 Antigua 3 JN3794892002 CAREC0201402 St Vincent and the Grenadines 3 JN3794902002 CAREC0201710 St Vincent and the Grenadines 3 JN3794912002 CAREC0106464 Barbados 3 JN3794922002 CAREC0202137 Trinidad and Tobago 3 JN3795122002 CAREC020213 Trinidad and Tobago 3 JN3794962002 CAREC0202139 Trinidad and Tobago 3 JN3794932002 CAREC0202259 Trinidad and Tobago 3 JN3794942002 CAREC0202260 Trinidad and Tobago 3 JN3795052002 CAREC0202290 Grenada 3 JN3794952002 CAREC0202314 Grenada 3 JN3795062002 CAREC0202329 Grenada 3 JN3795072003 CAREC0301734 Barbados 3 JN3794972003 CAREC0302290 Grenada 3 JN3794982003 CAREC0306149 Trinidad and Tobago 3 JN3795082003 CAREC0310367 Trinidad and Tobago 3 JN3794992004 CAREC0400408 Barbados 3 JN3795002004 CAREC0400409 Barbados 3 JN3795092004 CAREC0414035 Belize 3 JN3795102004 CAREC0414066 Belize 3 JN3795112005 CAREC0508129 Suriname 3 JN379501
DENV Phylogeography and Population Dynamics · doi:10.1093/molbev/msr320 MBE
1535
at National Institutes of H
ealth Library on July 13, 2012
http://mbe.oxfordjournals.org/
Dow
nloaded from
Material online). DENV-2 Asian-American genotype andDENV-4 genotype II sequences (the genotypes currentlycirculating in the Americas) were also obtained fromGenBank and similarly prepared. In order to prevent over-representation of come countries, data sets were down-sampled to no more than five sequences per countryper year. Sequence genotypes were confirmed throughmaximum likelihood tree estimation using a genotype ref-erence alignment (data not shown). All sequences wereconfirmed as nonrecombinant using the RecombinationDetection Program (RDP) v3 (Martin et al. 2005) and Ge-netic algorithms for recombination detection program(Pond and Frost 2005). Additionally, using the programsDatamonkey and HyPhy v0.99 (Pond et al. 2005), we con-firmed that there was no evidence for site-specific positiveselection in the data sets (at the P5 0.05 significance level).Together, the four data sets represent 35 countries anda time period covering 1977–2009 (available from the au-thors on request).
Evolutionary Rates, Population Dynamics, andSpatial DiffusionNucleotide substitution rates, divergence times, spatial dif-fusion rates (i.e., rate at which viral lineages move amongsampled locations), and demographic histories were jointlyestimated from the date- and location-stamped DENV se-quences using a Bayesian approach implemented in theMarkov chain Monte Carlo (MCMC) inference frameworkof the BEAST v1.6.1 software package (Drummond andRambaut 2007; Lemey et al. 2009), This program usesBayesian MCMC methods to integrate across all plausibletree topologies and thereby estimate evolutionary param-eters while taking into account statistical uncertaintyarising from both phylogenetic inference and the spatialdiffusion process. Analyses were carried out using a generaltime reversible (GTR) model with a discretized gamma-distributed across-site rate variation (GTR þ C4) substitu-tion model, a Bayesian skyride plot (BSP) coalescent model(Drummond et al. 2005) and both a strict molecular clockmodel and a relaxed (uncorrelated lognormal) molecularclock model (Drummond et al. 2006).
Demographic histories were illustrated using BSPs (Mininet al. 2008), which show temporal changes in the meanestimate for relative genetic diversity (Nes, where Ne isthe effective population size and s is the generation time).
To determine the viral transmission network within theAmericas, a nonreversible discrete phylogeography modelwas applied to all the data sets individually, with eachcountry used as discrete states. To ensure statistical effi-ciency, we employed a Bayesian stochastic search variableselection procedure (Lemey et al. 2009), which imposesa prior distribution on the spatial model that favors a lim-ited number of nonzero movement rates among pairs oflocations, thus reducing the number of estimated param-eters and identifying only those rates that are required toexplain the observed data. A truncated Poisson prior witha mean of log 2 and an offset of K� 1 (where K5 number
of discretized location states) was used. In order to ensureadequate sampling of the parameters of the model (witheffective sample sizes for all parameters . 200), MCMCchain was run for 100 million states, with a 10% burn-inperiod (to remove nonstationarity samples), and data werethen subsampled every 10,000 states. Model comparisonswere performed using Bayes factors (BFs) (Suchard et al.2001), which are estimated using harmonic mean estimatesof the model marginal likelihood (Newton and Raftery1994; Suchard et al. 2003; Redelings and Suchard 2005).
Hypothesis TestingThe Bayesian phylogeographic inference framework incor-porated into BEAST allows for testing of scenarios aboutthe evolutionary and phylogeographic history. We createpairwise location matrices representing the different diffu-sion predictors, which are used as priors for the relative rateparameters (Talbi et al. 2010). The different diffusionpredictors explored were
� Equal rates: spatial diffusion model that assumes equalrates of virus movement between all countries a priori.
� Distance-informed rates: formalizes a model of moreintense virus movement between nearby locations (�ratesof movement being inversely proportional to the dis-tance between locations). Two different measures ofdistance were used: GeoDistance (log of the great-circledistance between centroids of each pair of countries) andPopDistance (log of the great-circle distance between thelargest and closest population centres between each pairof countries).
� Air traffic informed rates: formalizes a model of moreintense virus movement between countries with more airtraffic between them (;rates of movement being pro-portional to the number of airline seats available betweeneach pair of countries). Data for this model were obtainedfrom OAG Max database and represent the airline seatcapacity in 2007.
The fit of the scenarios were assessed using BF compar-ison, which allows for the comparison of the predictors oneach data set.
Results
Population Genetic History and SerotypePrevalenceFigure 2 depicts the estimates of relative genetic diversityfor each genotype on the same timescale as a histogramshowing the percentage of infections confirmed by virusisolation for each serotype in each year. The latter was de-rived from records of virus isolations performed by theCAREC and is used as a proxy for relative serotype preva-lence in the absence of reliable data from all of the countriessurveyed. The census data indicate that DENV-1, which wasfirst reported in 1977 (fig. 1), predominated until 1979. Itwas then quickly replaced in 1981 by DENV-4, which wasfirst reported in the region in that same year. DENV-2Asian–American genotype, which was also first reportedin 1981, was slower to become established (Carrington
Allicock et al. · doi:10.1093/molbev/msr320 MBE
1536
at National Institutes of H
ealth Library on July 13, 2012
http://mbe.oxfordjournals.org/
Dow
nloaded from
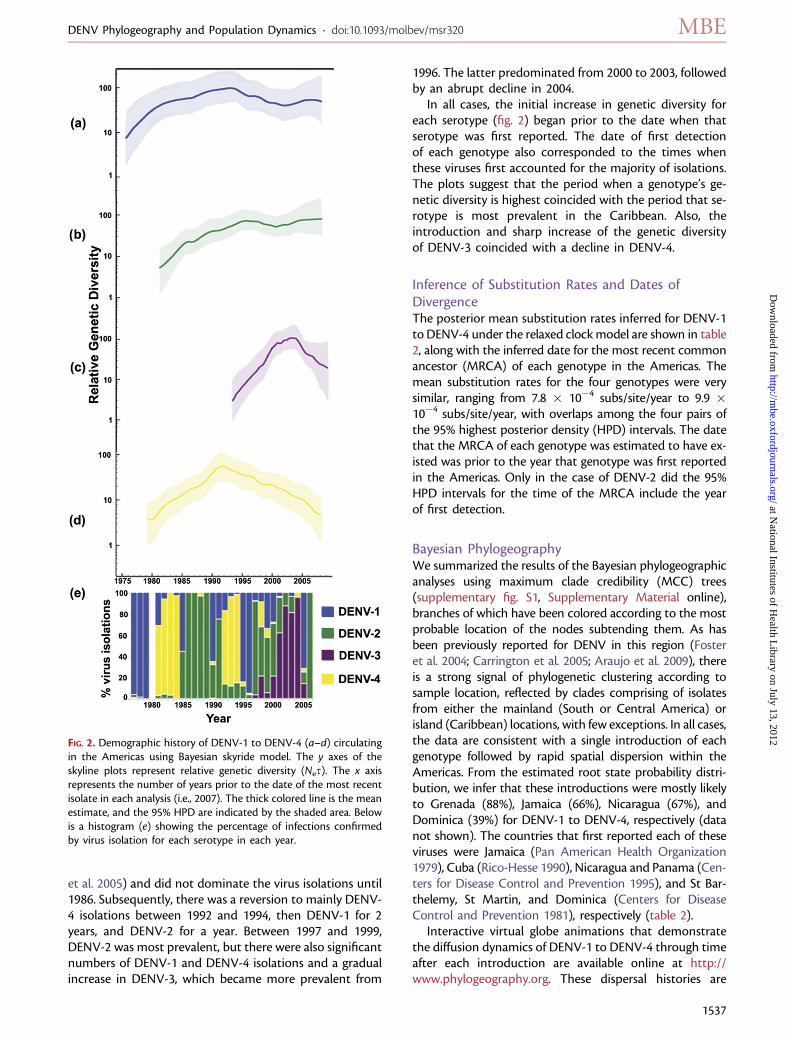
et al. 2005) and did not dominate the virus isolations until1986. Subsequently, there was a reversion to mainly DENV-4 isolations between 1992 and 1994, then DENV-1 for 2years, and DENV-2 for a year. Between 1997 and 1999,DENV-2 was most prevalent, but there were also significantnumbers of DENV-1 and DENV-4 isolations and a gradualincrease in DENV-3, which became more prevalent from
1996. The latter predominated from 2000 to 2003, followedby an abrupt decline in 2004.
In all cases, the initial increase in genetic diversity foreach serotype (fig. 2) began prior to the date when thatserotype was first reported. The date of first detectionof each genotype also corresponded to the times whenthese viruses first accounted for the majority of isolations.The plots suggest that the period when a genotype’s ge-netic diversity is highest coincided with the period that se-rotype is most prevalent in the Caribbean. Also, theintroduction and sharp increase of the genetic diversityof DENV-3 coincided with a decline in DENV-4.
Inference of Substitution Rates and Dates ofDivergenceThe posterior mean substitution rates inferred for DENV-1to DENV-4 under the relaxed clockmodel are shown in table2, along with the inferred date for the most recent commonancestor (MRCA) of each genotype in the Americas. Themean substitution rates for the four genotypes were verysimilar, ranging from 7.8 � 10�4 subs/site/year to 9.9 �10�4 subs/site/year, with overlaps among the four pairs ofthe 95% highest posterior density (HPD) intervals. The datethat the MRCA of each genotype was estimated to have ex-isted was prior to the year that genotype was first reportedin the Americas. Only in the case of DENV-2 did the 95%HPD intervals for the time of the MRCA include the yearof first detection.
Bayesian PhylogeographyWe summarized the results of the Bayesian phylogeographicanalyses using maximum clade credibility (MCC) trees(supplementary fig. S1, Supplementary Material online),branches of which have been colored according to the mostprobable location of the nodes subtending them. As hasbeen previously reported for DENV in this region (Fosteret al. 2004; Carrington et al. 2005; Araujo et al. 2009), thereis a strong signal of phylogenetic clustering according tosample location, reflected by clades comprising of isolatesfrom either the mainland (South or Central America) orisland (Caribbean) locations, with few exceptions. In all cases,the data are consistent with a single introduction of eachgenotype followed by rapid spatial dispersion within theAmericas. From the estimated root state probability distri-bution, we infer that these introductions were mostly likelyto Grenada (88%), Jamaica (66%), Nicaragua (67%), andDominica (39%) for DENV-1 to DENV-4, respectively (datanot shown). The countries that first reported each of theseviruses were Jamaica (Pan American Health Organization1979), Cuba (Rico-Hesse 1990), Nicaragua and Panama (Cen-ters for Disease Control and Prevention 1995), and St Bar-thelemy, St Martin, and Dominica (Centers for DiseaseControl and Prevention 1981), respectively (table 2).
Interactive virtual globe animations that demonstratethe diffusion dynamics of DENV-1 to DENV-4 through timeafter each introduction are available online at http://www.phylogeography.org. These dispersal histories are
FIG. 2. Demographic history of DENV-1 to DENV-4 (a–d) circulatingin the Americas using Bayesian skyride model. The y axes of theskyline plots represent relative genetic diversity (Nes). The x axisrepresents the number of years prior to the date of the most recentisolate in each analysis (i.e., 2007). The thick colored line is the meanestimate, and the 95% HPD are indicated by the shaded area. Belowis a histogram (e) showing the percentage of infections confirmedby virus isolation for each serotype in each year.
DENV Phylogeography and Population Dynamics · doi:10.1093/molbev/msr320 MBE
1537
at National Institutes of H
ealth Library on July 13, 2012
http://mbe.oxfordjournals.org/
Dow
nloaded from
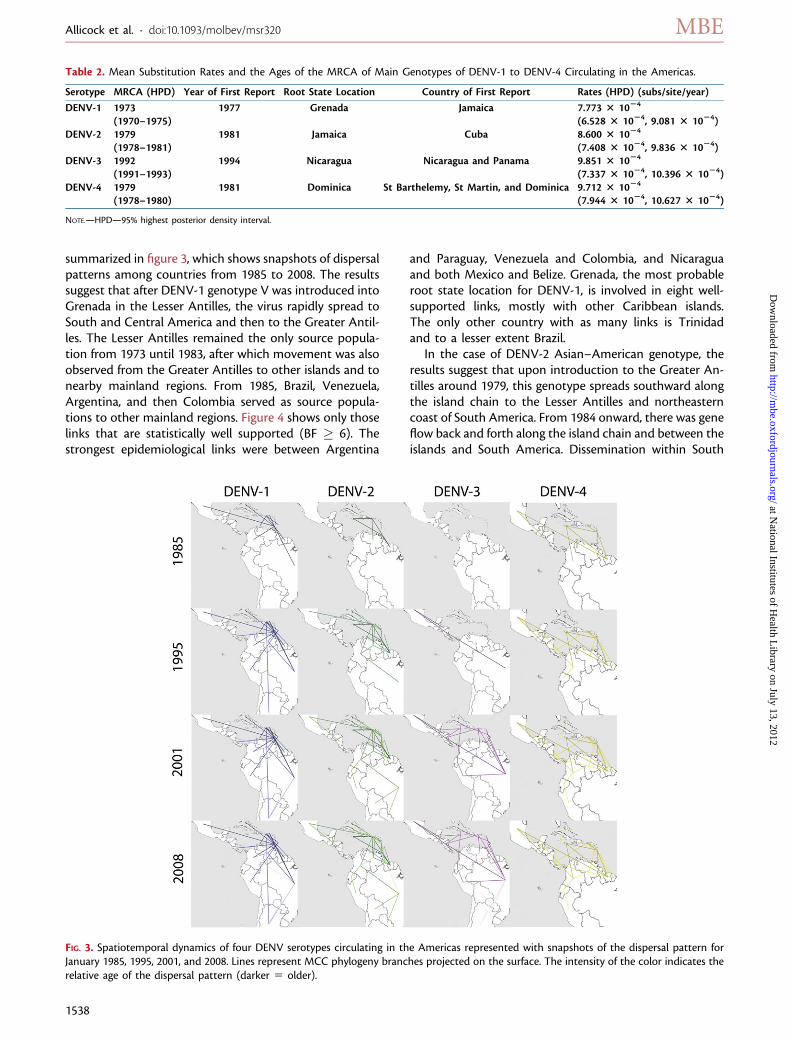
summarized in figure 3, which shows snapshots of dispersalpatterns among countries from 1985 to 2008. The resultssuggest that after DENV-1 genotype V was introduced intoGrenada in the Lesser Antilles, the virus rapidly spread toSouth and Central America and then to the Greater Antil-les. The Lesser Antilles remained the only source popula-tion from 1973 until 1983, after which movement was alsoobserved from the Greater Antilles to other islands and tonearby mainland regions. From 1985, Brazil, Venezuela,Argentina, and then Colombia served as source popula-tions to other mainland regions. Figure 4 shows only thoselinks that are statistically well supported (BF � 6). Thestrongest epidemiological links were between Argentina
and Paraguay, Venezuela and Colombia, and Nicaraguaand both Mexico and Belize. Grenada, the most probableroot state location for DENV-1, is involved in eight well-supported links, mostly with other Caribbean islands.The only other country with as many links is Trinidadand to a lesser extent Brazil.
In the case of DENV-2 Asian–American genotype, theresults suggest that upon introduction to the Greater An-tilles around 1979, this genotype spreads southward alongthe island chain to the Lesser Antilles and northeasterncoast of South America. From 1984 onward, there was geneflow back and forth along the island chain and between theislands and South America. Dissemination within South
Table 2. Mean Substitution Rates and the Ages of the MRCA of Main Genotypes of DENV-1 to DENV-4 Circulating in the Americas.
Serotype MRCA (HPD) Year of First Report Root State Location Country of First Report Rates (HPD) (subs/site/year)
DENV-1 1973 1977 Grenada Jamaica 7.773 3 1024
(1970–1975) (6.528 3 1024, 9.081 3 1024)DENV-2 1979 1981 Jamaica Cuba 8.600 3 1024
(1978–1981) (7.408 3 1024, 9.836 3 1024)DENV-3 1992 1994 Nicaragua Nicaragua and Panama 9.851 3 1024
(1991–1993) (7.337 3 1024, 10.396 3 1024)DENV-4 1979 1981 Dominica St Barthelemy, St Martin, and Dominica 9.712 3 1024
(1978–1980) (7.944 3 1024, 10.627 3 1024)
NOTE.—HPD—95% highest posterior density interval.
FIG. 3. Spatiotemporal dynamics of four DENV serotypes circulating in the Americas represented with snapshots of the dispersal pattern forJanuary 1985, 1995, 2001, and 2008. Lines represent MCC phylogeny branches projected on the surface. The intensity of the color indicates therelative age of the dispersal pattern (darker 5 older).
Allicock et al. · doi:10.1093/molbev/msr320 MBE
1538
at National Institutes of H
ealth Library on July 13, 2012
http://mbe.oxfordjournals.org/
Dow
nloaded from
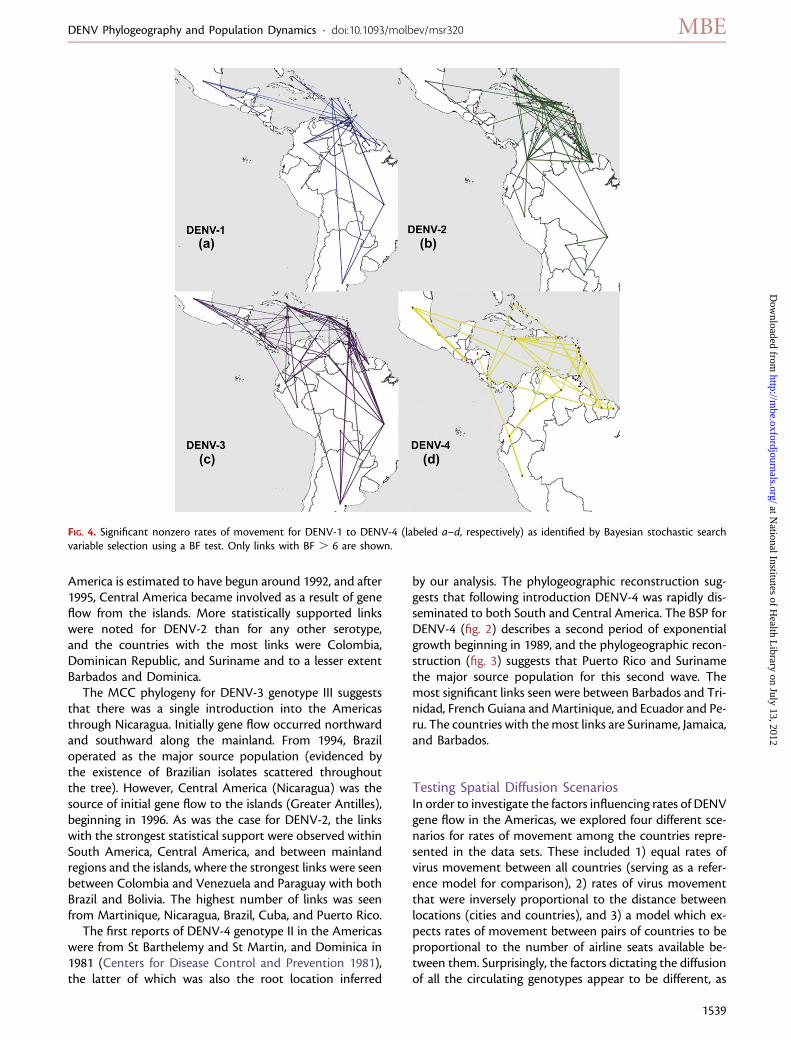
America is estimated to have begun around 1992, and after1995, Central America became involved as a result of geneflow from the islands. More statistically supported linkswere noted for DENV-2 than for any other serotype,and the countries with the most links were Colombia,Dominican Republic, and Suriname and to a lesser extentBarbados and Dominica.
The MCC phylogeny for DENV-3 genotype III suggeststhat there was a single introduction into the Americasthrough Nicaragua. Initially gene flow occurred northwardand southward along the mainland. From 1994, Braziloperated as the major source population (evidenced bythe existence of Brazilian isolates scattered throughoutthe tree). However, Central America (Nicaragua) was thesource of initial gene flow to the islands (Greater Antilles),beginning in 1996. As was the case for DENV-2, the linkswith the strongest statistical support were observed withinSouth America, Central America, and between mainlandregions and the islands, where the strongest links were seenbetween Colombia and Venezuela and Paraguay with bothBrazil and Bolivia. The highest number of links was seenfrom Martinique, Nicaragua, Brazil, Cuba, and Puerto Rico.
The first reports of DENV-4 genotype II in the Americaswere from St Barthelemy and St Martin, and Dominica in1981 (Centers for Disease Control and Prevention 1981),the latter of which was also the root location inferred
by our analysis. The phylogeographic reconstruction sug-gests that following introduction DENV-4 was rapidly dis-seminated to both South and Central America. The BSP forDENV-4 (fig. 2) describes a second period of exponentialgrowth beginning in 1989, and the phylogeographic recon-struction (fig. 3) suggests that Puerto Rico and Surinamethe major source population for this second wave. Themost significant links seen were between Barbados and Tri-nidad, French Guiana and Martinique, and Ecuador and Pe-ru. The countries with themost links are Suriname, Jamaica,and Barbados.
Testing Spatial Diffusion ScenariosIn order to investigate the factors influencing rates of DENVgene flow in the Americas, we explored four different sce-narios for rates of movement among the countries repre-sented in the data sets. These included 1) equal rates ofvirus movement between all countries (serving as a refer-ence model for comparison), 2) rates of virus movementthat were inversely proportional to the distance betweenlocations (cities and countries), and 3) a model which ex-pects rates of movement between pairs of countries to beproportional to the number of airline seats available be-tween them. Surprisingly, the factors dictating the diffusionof all the circulating genotypes appear to be different, as
FIG. 4. Significant nonzero rates of movement for DENV-1 to DENV-4 (labeled a–d, respectively) as identified by Bayesian stochastic searchvariable selection using a BF test. Only links with BF . 6 are shown.
DENV Phylogeography and Population Dynamics · doi:10.1093/molbev/msr320 MBE
1539
at National Institutes of H
ealth Library on July 13, 2012
http://mbe.oxfordjournals.org/
Dow
nloaded from
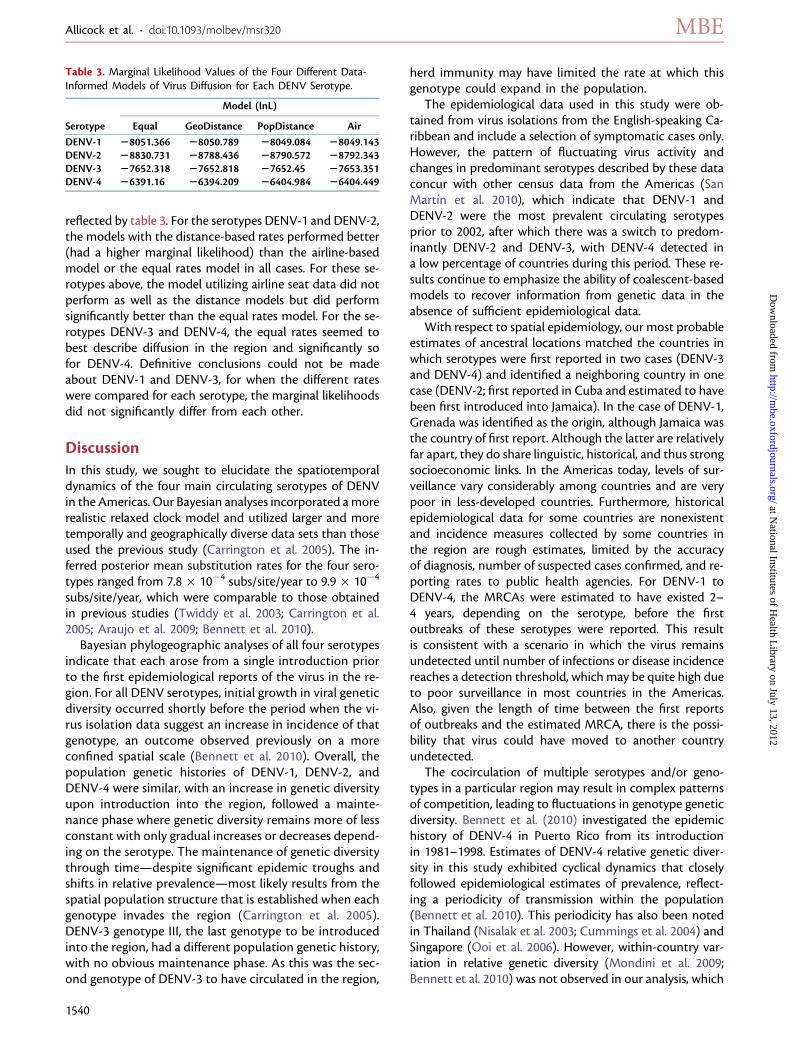
reflected by table 3. For the serotypes DENV-1 and DENV-2,the models with the distance-based rates performed better(had a higher marginal likelihood) than the airline-basedmodel or the equal rates model in all cases. For these se-rotypes above, the model utilizing airline seat data did notperform as well as the distance models but did performsignificantly better than the equal rates model. For the se-rotypes DENV-3 and DENV-4, the equal rates seemed tobest describe diffusion in the region and significantly sofor DENV-4. Definitive conclusions could not be madeabout DENV-1 and DENV-3, for when the different rateswere compared for each serotype, the marginal likelihoodsdid not significantly differ from each other.
DiscussionIn this study, we sought to elucidate the spatiotemporaldynamics of the four main circulating serotypes of DENVin the Americas. Our Bayesian analyses incorporated amorerealistic relaxed clock model and utilized larger and moretemporally and geographically diverse data sets than thoseused the previous study (Carrington et al. 2005). The in-ferred posterior mean substitution rates for the four sero-types ranged from 7.8 � 10�4 subs/site/year to 9.9 � 10�4
subs/site/year, which were comparable to those obtainedin previous studies (Twiddy et al. 2003; Carrington et al.2005; Araujo et al. 2009; Bennett et al. 2010).
Bayesian phylogeographic analyses of all four serotypesindicate that each arose from a single introduction priorto the first epidemiological reports of the virus in the re-gion. For all DENV serotypes, initial growth in viral geneticdiversity occurred shortly before the period when the vi-rus isolation data suggest an increase in incidence of thatgenotype, an outcome observed previously on a moreconfined spatial scale (Bennett et al. 2010). Overall, thepopulation genetic histories of DENV-1, DENV-2, andDENV-4 were similar, with an increase in genetic diversityupon introduction into the region, followed a mainte-nance phase where genetic diversity remains more of lessconstant with only gradual increases or decreases depend-ing on the serotype. The maintenance of genetic diversitythrough time—despite significant epidemic troughs andshifts in relative prevalence—most likely results from thespatial population structure that is established when eachgenotype invades the region (Carrington et al. 2005).DENV-3 genotype III, the last genotype to be introducedinto the region, had a different population genetic history,with no obvious maintenance phase. As this was the sec-ond genotype of DENV-3 to have circulated in the region,
herd immunity may have limited the rate at which thisgenotype could expand in the population.
The epidemiological data used in this study were ob-tained from virus isolations from the English-speaking Ca-ribbean and include a selection of symptomatic cases only.However, the pattern of fluctuating virus activity andchanges in predominant serotypes described by these dataconcur with other census data from the Americas (SanMartı́n et al. 2010), which indicate that DENV-1 andDENV-2 were the most prevalent circulating serotypesprior to 2002, after which there was a switch to predom-inantly DENV-2 and DENV-3, with DENV-4 detected ina low percentage of countries during this period. These re-sults continue to emphasize the ability of coalescent-basedmodels to recover information from genetic data in theabsence of sufficient epidemiological data.
With respect to spatial epidemiology, our most probableestimates of ancestral locations matched the countries inwhich serotypes were first reported in two cases (DENV-3and DENV-4) and identified a neighboring country in onecase (DENV-2; first reported in Cuba and estimated to havebeen first introduced into Jamaica). In the case of DENV-1,Grenada was identified as the origin, although Jamaica wasthe country of first report. Although the latter are relativelyfar apart, they do share linguistic, historical, and thus strongsocioeconomic links. In the Americas today, levels of sur-veillance vary considerably among countries and are verypoor in less-developed countries. Furthermore, historicalepidemiological data for some countries are nonexistentand incidence measures collected by some countries inthe region are rough estimates, limited by the accuracyof diagnosis, number of suspected cases confirmed, and re-porting rates to public health agencies. For DENV-1 toDENV-4, the MRCAs were estimated to have existed 2–4 years, depending on the serotype, before the firstoutbreaks of these serotypes were reported. This resultis consistent with a scenario in which the virus remainsundetected until number of infections or disease incidencereaches a detection threshold, which may be quite high dueto poor surveillance in most countries in the Americas.Also, given the length of time between the first reportsof outbreaks and the estimated MRCA, there is the possi-bility that virus could have moved to another countryundetected.
The cocirculation of multiple serotypes and/or geno-types in a particular region may result in complex patternsof competition, leading to fluctuations in genotype geneticdiversity. Bennett et al. (2010) investigated the epidemichistory of DENV-4 in Puerto Rico from its introductionin 1981–1998. Estimates of DENV-4 relative genetic diver-sity in this study exhibited cyclical dynamics that closelyfollowed epidemiological estimates of prevalence, reflect-ing a periodicity of transmission within the population(Bennett et al. 2010). This periodicity has also been notedin Thailand (Nisalak et al. 2003; Cummings et al. 2004) andSingapore (Ooi et al. 2006). However, within-country var-iation in relative genetic diversity (Mondini et al. 2009;Bennett et al. 2010) was not observed in our analysis, which
Table 3. Marginal Likelihood Values of the Four Different Data-Informed Models of Virus Diffusion for Each DENV Serotype.
Model (lnL)
Serotype Equal GeoDistance PopDistance Air
DENV-1 28051.366 28050.789 28049.084 28049.143DENV-2 28830.731 28788.436 28790.572 28792.343DENV-3 27652.318 27652.818 27652.45 27653.351DENV-4 26391.16 26394.209 26404.984 26404.449
Allicock et al. · doi:10.1093/molbev/msr320 MBE
1540
at National Institutes of H
ealth Library on July 13, 2012
http://mbe.oxfordjournals.org/
Dow
nloaded from
is a broader region-wide study. Instead, as noted above, ge-netic diversity in our study is maintained despite apparentfluctuations in epidemic activity (as measured by the per-centage of virus isolations by CAREC), a pattern previouslydescribed for DENV-2 and DENV-4 in the Americas(Carrington et al. 2005) by population subdivision amonglocations. Clearly, the phylodynamic behavior of DENV—aswith other viruses—depends on the scale at which it isbeing studied (Pybus and Rambaut 2009). With additionalsampling among the locations and over time, more fine-scale patterns may emerge.
One would generalize that the strongest supported mi-gration events occur mainly between neighboring coun-tries, but several countries (i.e., Barbados, Puerto Rico,Colombia, Suriname, Venezuela, and Brazil) had signifi-cantly more linkages than the others and as such possiblyplay the role of hubs for the dissemination of this virus ona seasonal basis. The possibility of other confounding fac-tors dictating the diffusion of DENV (e.g., linguistic and/orsocioeconomic relations) has been previously suggested(Carrington et al. 2005).
The ability to integrate useful geographic and epidemi-ological information with viral gene sequences offers newopportunities for hypothesis testing (Lemey et al. 2009). Inour analyses, we compared four different scenarios in anattempt to explain the level of DENV gene flow withinthe Americas. Given the nature of the anthropophilic na-ture of the urban-dwelling vector species Ae. aegypti, theassumption one would make is that gene flow between ad-jacent or nearby countries is more likely than between dis-tant locales, and as a result, the distance models wouldperform better. More specifically, that the PopDistancemodel (which considered distances between the closestand largest population centers) would be a better fit thanthe GeoDistance model. However, the distance modelswere preferred only for DENV-1 and DENV-2 and withoutstatistical support in the case of DENV-1.
DENV can be disseminated by infected mosquitoes orinfected humans. Ae. aegypti typically travel relatively shortdistances of about 100 m, although there are reports of in-dividuals moving up to 800m (Reiter et al. 1995; Harringtonet al. 2005). In an attempt to distinguish between humanand mosquito movement, we formalized an air-trafficmodel that incorporates airline seat capacity between eachpair of countries. This model did not perform as well as thedistance-informed models but was better than the equalrates model for DENV-1 and DENV-2. However, a majorlimitation here was the fact that the seat capacity data werefrom a single year, that is, 2007, whereas the genetic dataspanned 32 years. With increasing air traffic and globaliza-tion, flight patterns will have changed considerably overthis period. Also this analysis does not consider the roleof other methods of long-distance travel in the dissemina-tion of infected mosquitoes and humans between coun-tries (e.g., shipping or travel by road on the mainland).Given the historical importance of shipping in the intro-duction of Ae. aegypti, DENV, and other arboviruses tothe Americas (Soper 1967; Halstead 1992), it would be use-
ful to investigate the role of shipping traffic in DENV dis-semination on a hemispheric scale. However, for most ofthe Caribbean islands in our data set, sufficient shippingdata were unavailable.
The marginal likelihood estimation for the majority ofthe serotypes indicated either that the equal rates modelwas the best fit or that no other model was a significantlybetter fit than the equal rates model. The harmonic meanapproach was used for estimating the marginal likelihoods.Although this approach is currently one of the more com-mon approaches, there are some major limitations, whereit can lead to a strong overestimation of the marginal like-lihood when more complex models are analyzed. To thisend, we are investigating more effective methods ofBayesian model comparison, along with the developmentof models that allow estimating and testing differentcontributions of these predictors simultaneously.
Airline traffic is an important parameter that deservesfurther investigation, as the air transport network hasplayed a key role in the global dissemination of other acuteinfections, such as influenza and severe acute respiratorysyndrome (SARS) (Colizza et al. 2006; Baker et al. 2010).Although it would not be surprising to find that air trafficis important in the case of DENV, this approach warrantsdevelopment as it could be applied to viruses that are lesswell understood in terms of the nature of their transmis-sion cycles. Further exploration of the historical role of hu-man movement versus mosquito movement within theAmericas, and differences between the Americas andSoutheast Asia, is essential in gaining better insights intoDENV transmission patterns and evolutionary dynamics.
Supplementary MaterialSupplementary tables S1 and S2 and figure S1 are availableat Molecular Biology and Evolution online (http://www.mbe.oxfordjournals.org/).
AcknowledgmentsThis work was supported by grants from the CaribbeanHealth Research Council to C.V.F.C. O.M.A. is a member ofthe Tropical Medicine Cluster (University of the WestIndies) and was supported by grants and scholarshipsfrom the University of the West Indies, St AugustineCampus Research and Publications Fund, and the Com-monwealth Scholarship Commission. P.L., M.A.S., and A.R.acknowledge support from the European Research Council(ERC) under the European Community’s Seventh Frame-work Programme (FP7/2007-2013)/ERC Grant agreementno. 260864. S.B. and B.M. acknowledge support fromNIH-RR018727 COBRE Bioinformatics Facility, NIH-AI065359, NIH-RR003061, DOD-06187000, and NSF-IGERT 0549514. A.J.T. acknowledges support from the RAPIDD pro-gram of the Science & Technology Directorate, Departmentof Homeland Security, and the Fogarty International Center,National Institutes of Health. The authors would like to ac-knowledge the CAREC for providing the viral isolates in-cluded in the study, and the National Institute of Allergy
DENV Phylogeography and Population Dynamics · doi:10.1093/molbev/msr320 MBE
1541
at National Institutes of H
ealth Library on July 13, 2012
http://mbe.oxfordjournals.org/
Dow
nloaded from
and InfectiousDiseases-fundedGenomic SequencingCenterat the Broad Institute, for permission to use sequences gen-erated under Dengue Virus Portal.
ReferencesAdams B, Holmes EC, Zhang C, Mammen MP Jr, Nimmannitya S,
Kalayanarooj S, Boots M. 2006. Cross-protective immunity canaccount for the alternating epidemic pattern of dengue virusserotypes circulating in Bangkok. Proc Natl Acad Sci U S A.103(38):14234–14239.
Araujo JM, Nogueira RM, Schatzmayr HG, Zanotto PM, Bello G.2009. Phylogeography and evolutionary history of dengue virustype 3. Infect Genet Evol. 9(4):716–725.
Auguste AJ, Lemey P, Pybus OG, Suchard MA, Salas RA,Adesiyun AA, Barrett AD, Tesh RB, Weaver SC,Carrington CVF. 2010. Yellow fever virus maintenance inTrinidad and its dispersal throughout the Americas. J Virol.84(19):9967.
Baker MG, Thornley CN, Mills C, Roberts S, Perera S, Peters J,Kelso A, Barr I, Wilson N. 2010. Transmission of pandemic A/H1N1 2009 influenza on passenger aircraft: retrospective cohortstudy. BMJ 340:c2424.
Bennett SN, Drummond AJ, Kapan DD, Suchard MA, Munoz-Jordan JL, Pybus OG, Holmes EC, Gubler DJ. 2010. Epidemicdynamics revealed in dengue evolution. Mol Biol Evol.27(4):811–818.
Bennett SN, Holmes EC, Chirivella M, Rodriguez DM, Beltran M,Vorndam V, Gubler DJ, McMillan WO. 2003. Selection-drivenevolution of emergent dengue virus. Mol Biol Evol.20(10):1650–1658.
Bennett SN, Holmes EC, Chirivella M, Rodriguez DM, Beltran M,Vorndam V, Gubler DJ, McMillan WO. 2006. Molecularevolution of dengue 2 virus in Puerto Rico: positive selectionin the viral envelope accompanies clade reintroduction. J GenVirol. 87(Pt 4):885–893.
Carrington CV, Foster JE, Pybus OG, Bennett SN, Holmes EC. 2005.Invasion and maintenance of dengue virus type 2 and type 4 inthe Americas. J Virol. 79(23):14680–14687.
Centers for Disease Control and Prevention. 1981. Dengue type 4infections in U.S. travelers to the Caribbean. MMWR MorbMortal Wkly Rep. 30(21):249–250.
Centers for Disease Control and Prevention. 1995. Dengue type 3infection—Nicaragua and Panama, October-November 1994.MMWR Morb Mortal Wkly Rep. 44(2):21–24.
Christophers S. 1960. Aedes aegypti (L.) the yellow fever mosquito:its life history, bionomics and structure. London: CambridgeUniversity Press.
Colizza V, Barrat A, Barthelemy M, Vespignani A. 2006. The role ofthe airline transportation network in the prediction andpredictability of global epidemics. Proc Natl Acad Sci U S A.103(7):2015–2020.
Cummings DAT, Irizarry RA, Huang NE, Endy TP, Nisalak A,Ungchusak K, Burke DS. 2004. Travelling waves in theoccurrence of dengue haemorrhagic fever in Thailand. Nature427(6972):344–347.
Diallo M, Sall AA, Moncayo AC, Ba Y, Fernandez Z, Ortiz D,Coffey LL, Mathiot C, Tesh RB, Weaver SC. 2005. Potential role ofsylvatic and domestic African mosquito species in dengueemergence. Am J Trop Med Hyg. 73(2):445–449.
Drummond AJ, Ho SY, Phillips MJ, Rambaut A. 2006. Relaxedphylogenetics and dating with confidence. PLoS Biol. 4(5):e88.
Drummond AJ, Rambaut A. 2007. BEAST: Bayesian evolutionaryanalysis by sampling trees. BMC Evol Biol. 7:214.
Drummond AJ, Rambaut A, Shapiro B, Pybus OG. 2005. Bayesiancoalescent inference of past population dynamics frommolecular sequences. Mol Biol Evol. 22(5):1185–1192.
Focks DA, Barrera R. Dengue transmission dynamics: assessment andimplications for control. Report of the Scientific Working GroupMeeting on Dengue. Geneva (Switzerland): WHO. p. 92–108.
Foster JE, Bennett SN, Carrington CV, Vaughan H, McMillan WO.2004. Phylogeography and molecular evolution of dengue 2 inthe Caribbean basin, 1981-2000. Virology 324(1):48–59.
Gubler DJ. 1997. Dengue and dengue hemorrhagic fever: its historyand resurgence as a global public health problem. In: Gubler DJ,Kuno G, editors. Dengue and dengue hemorrhagic fever.London: CAB International. p. 1–22.
Gubler DJ. 1998. Dengue and dengue hemorrhagic fever. ClinMicrobiol Rev. 11(3):480–496.
Gubler DJ. 2006. Dengue/dengue haemorrhagic fever: historyand current status. Novartis Found Symp. 277:3–16; discussion16–22, 71–3, 251–3.
Guzman MG, Halstead SB, Artsob H, et al. (11 co-authors). 2010.Dengue: a continuing global threat. Nat Rev Microbiol. 8(Suppl12):S7–S16.
Halstead SB. 1992. The XXth century dengue pandemic: need forsurveillance and research. World Health Stat Q. 45(2–3):292.
Halstead SB. 2008. Dengue virus-mosquito interactions. Annu RevEntomol. 53:273–291.
Harrington LC, Scott TW, Lerdthusnee K, et al. (11 co-authors).2005. Dispersal of the dengue vector Aedes aegypti within andbetween rural communities. Am J Trop Med Hyg. 72(2):209–220.
Kroeger A, Nathan MB. 2006. Dengue: setting the global researchagenda. Lancet 368(9554):2193.
Lemey P, Rambaut A, Drummond AJ, Suchard MA. 2009. Bayesianphylogeography finds its roots. PLoS Comput Biol. 5(9):e1000520.
Martin DP, Williamson C, Posada D. 2005. RDP2: recombinationdetection and analysis from sequence alignments. Bioinformatics21(2):260.
Minin VN, Bloomquist EW, Suchard MA. 2008. Smooth skyridethrough a rough skyline: Bayesian coalescent-based inference ofpopulation dynamics. Mol Biol Evol. 25(7):1459.
Mondini A, de Moraes Bronzoni RV, Nunes SHP, ChiaravallotiNeto F, Massad E. 2009. Spatio-temporal tracking andphylodynamics of an urban dengue 3 outbreak in Sao Paulo,Brazil. PLoS Negl Trop Dis. 3:e448.
Newton MA, Raftery AE. 1994. Approximate Bayesian inference withthe weighted likelihood bootstrap. J R Stat Soc B Met. 56(1):3–48.
Nisalak A, Endy TP, Nimmannitya S, Kalayanarooj S, Thisayakorn U,Scott RM, Burke DS, Hoke CH, Innis BL, Vaughn DW. 2003.Serotype-specific dengue virus circulation and dengue disease inBangkok, Thailand from 1973 to 1999. Am J Trop Med Hyg.68(2):191–202.
Ooi EE, Goh KT, Gubler DJ. 2006. Dengue prevention and 35 years ofvector control in Singapore. Emerg Infect Dis. 12(6):887–893.
Pan American Health Organization. 1979. Dengue in the Caribbean,1977. In: Proceedings of a workshop held in Montego Bay,Jamaica, 8–11 May, 1978. PAHO scientific publication 375.Washington (DC): Pan American Health Organization.
Pond K, Sergei L, Frost SDW. 2005. Not so different after all:a comparison of methods for detecting amino acid sites underselection. Mol Biol Evol. 22(5):1208.
Pond SL, Frost SD. 2005. Datamonkey: rapid detection of selectivepressure on individual sites of codon alignments. Bioinformatics21(10):2531–2533.
Powell JR, Tabachnick WJ, Arnold J. 1980. Genetics and the origin ofa vector population: Aedes aegypti, a case study. Science208(4450):1385–1387.
Pybus OG, Rambaut A. 2009. Evolutionary analysis of the dynamicsof viral infectious disease. Nat Rev Genet. 10(8):540–550.
Allicock et al. · doi:10.1093/molbev/msr320 MBE
1542
at National Institutes of H
ealth Library on July 13, 2012
http://mbe.oxfordjournals.org/
Dow
nloaded from
Redelings BD, Suchard MA. 2005. Joint Bayesian estimation ofalignment and phylogeny. Syst Biol. 54(3):401.
Reiter P, Amador MA, Anderson RA, Clark GG. 1995. Short report:dispersal of Aedes aegypti in an urban area after blood feedingas demonstrated by rubidium-marked eggs. Am J Trop Med Hyg.52(2):177–179.
Rico-Hesse R. 1990. Molecular evolution and distribution of dengueviruses type 1 and 2 in nature. Virology 174(2):479–493.
Rush AB. 1789. An account of the bilious remitting fever, as itappeared in Philadelphia in the summer and autumn of the year1780. In: Medical inquiries and observations. Philadelphia (PA):Prichard and Hall. p. 89–100.
San Martı́n JL, Brathwaite O, Zambrano B, Solorzano JO,Bouckenooghe A, Dayan GH, Guzman MG. 2010. Theepidemiology of dengue in the americas over the lastthree decades: a worrisome reality. Am J Trop Med Hyg. 82(1):128–135.
Smith CE. 1956. The history of dengue in tropical Asia and itsprobable relationship to the mosquito Aedes aegypti. J TropMed Hyg. 59(10):243–251.
Soper FL. 1967. Aedes aegypti and yellow fever. Bull World HealthOrgan. 36(4):521–527.
Suchard MA, Kitchen CMR, Sinsheimer JS, Weiss RE. 2003.Hierarchical phylogenetic models for analyzing multipartitesequence data. Syst Biol. 52(5):649.
Suchard MA, Weiss RE, Sinsheimer JS. 2001. Bayesian selection ofcontinuous-time Markov chain evolutionary models. Mol BiolEvol. 18(6):1001.
Talbi C, Lemey P, Suchard MA, et al. (11 co-authors). 2010.Phylodynamics and human-mediated dispersal of a zoonoticvirus. PLoS Pathog. 6(10):e1001166.
Tesh RB. 1979. A method for the isolation and identification ofdengue viruses, using mosquito cell cultures. Am J Trop MedHyg. 28(6):1053–1059.
Twiddy SS, Holmes EC, Rambaut A. 2003. Inferring the rate and time-scale of dengue virus evolution. Mol Biol Evol. 20(1):122–129.
Wang E, Ni H, Xu R, Barrett AD, Watowich SJ, Gubler DJ, Weaver SC.2000. Evolutionary relationships of endemic/epidemic andsylvatic dengue viruses. J Virol. 74(7):3227–3234.
Zhang C, Mammen MP Jr, Chinnawirotpisan P, Klungthong C,Rodpradit P, Monkongdee P, Nimmannitya S, Kalayanarooj S,Holmes EC. 2005. Clade replacements in dengue virus serotypes1 and 3 are associated with changing serotype prevalence.J Virol. 79(24):15123–15130.
DENV Phylogeography and Population Dynamics · doi:10.1093/molbev/msr320 MBE
1543
at National Institutes of H
ealth Library on July 13, 2012
http://mbe.oxfordjournals.org/
Dow
nloaded from