Phylogeography of the
11
Phylogeography of the Atlantic bonito (Sarda sarda) in the northern Mediterranean: the combined effects of historical vicariance, population expansion, secondary invasion, and isolation by distance Jordi Vi ~ nas, a, * Jaime Alvarado Bremer, a and Carles Pla b a Department of Marine Biology, Texas A&M University at Galveston, 5007 Ave U, Galveston, TX 77551, USA b Laboratori dÕIctiologia Gen etica, Universitat de Girona, Campus Montilivi, E-17071, Girona, Spain Received 20 January 2004; revised 24 March 2004 Available online 14 May 2004 Abstract Sequence analysis of the mtDNA control region of four samples ðn ¼ 195Þ of Atlantic bonito (Sarda sarda) collected along the northern Mediterranean reveals two clades about 8.1% divergent distributed in an east-west cline that fits an isolation by distance (IBD) model. The vicariant origin of this genetic discontinuity is proposed, supported in addition to the cline, by evidence of distinct historical demographic factors affecting each clade. Variation in Clade I suggests a large stable population, whereas Clade II displays a star-like phylogeny indicative of a population bottleneck followed by sudden expansion. The historical demography and bioge- ographic scenario is as follows: (1) Allopatric isolation during the Pleistocene give rise to Clade I (Atlantic) and Clade II (Medi- terranean); (2) Population collapse followed by sudden expansion gives rise to the characteristic star-like phylogeny of Clade II; (3) Secondary contact as Clade I enters from the Atlantic, and (4) An east-west cline is maintained by IBD. Ó 2004 Elsevier Inc. All rights reserved. Keywords: Atlantic bonito; Sarda sarda; Mitochondrial DNA control region; Stock structure; Isolation by distance; Phylogeography; Vicariance; Mismatch distribution; Mediterranean Sea 1. Introduction Atlantic Bonito (Sarda sarda Bloch, 1793)—the only member of the genus Sarda distributed along the trop- ical and temperate coasts of the Atlantic Ocean, the Mediterranean Sea, and the Black Sea (Collette and Chao, 1975)—inhabits pelagic neritic waters about 200 m deep (Yoshida, 1980). Although little is known about its reproductive biology, based on the distribution of eggs, larvae, and mature individuals, two main spawning ar- eas have been defined both geographically and tempo- rally within the Mediterranean. The first area located in the western Mediterranean include the Alboran Sea, the waters south of the Balearic Islands and the waters off the Algerian coast where spawning occurs during the early summer (Rey et al., 1984; see Fig. 1 in Pujolar et al., 2001). The second area is located at the eastern extreme of the Mediterranean and includes the coastal waters of the Sea of Marmara and the Black Sea with spawning occurring from June and July (Yoshida, 1980). A tag-recapture study of Atlantic bonito in the Mediterranean detected no exchange of fish between the east and west, and thus putatively between the two known reproductive areas. Based on all this informa- tion, Rey et al. (1984) hypothesized that two isolated sub-populations exist in the Mediterranean. However, recently an additional spawning area has been identified in northern Balearic Sea (Sabat es and Recasens, 2001) suggesting the possibility that additional spawning areas exist. The proposed population subdivision of Atlantic bonito in Mediterranean has been partially corrobo- rated by the molecular genetic studies of Roberti et al. * Corresponding author. Fax: 1-409-740-5002. E-mail address: [email protected] (J. Vi~ nas). 1055-7903/$ - see front matter Ó 2004 Elsevier Inc. All rights reserved. doi:10.1016/j.ympev.2004.04.009 Molecular Phylogenetics and Evolution 33 (2004) 32–42 MOLECULAR PHYLOGENETICS AND EVOLUTION www.elsevier.com/locate/ympev
Transcript of Phylogeography of the
MOLECULARPHYLOGENETICSAND
Molecular Phylogenetics and Evolution 33 (2004) 32–42
EVOLUTION
www.elsevier.com/locate/ympev
Phylogeography of the Atlantic bonito (Sarda sarda) in thenorthern Mediterranean: the combined effects of historicalvicariance, population expansion, secondary invasion,
and isolation by distance
Jordi Vi~nas,a,* Jaime Alvarado Bremer,a and Carles Plab
a Department of Marine Biology, Texas A&M University at Galveston, 5007 Ave U, Galveston, TX 77551, USAb Laboratori d�Ictiologia Gen�etica, Universitat de Girona, Campus Montilivi, E-17071, Girona, Spain
Received 20 January 2004; revised 24 March 2004
Available online 14 May 2004
Abstract
Sequence analysis of the mtDNA control region of four samples ðn ¼ 195Þ of Atlantic bonito (Sarda sarda) collected along the
northern Mediterranean reveals two clades about 8.1% divergent distributed in an east-west cline that fits an isolation by distance
(IBD) model. The vicariant origin of this genetic discontinuity is proposed, supported in addition to the cline, by evidence of distinct
historical demographic factors affecting each clade. Variation in Clade I suggests a large stable population, whereas Clade II displays
a star-like phylogeny indicative of a population bottleneck followed by sudden expansion. The historical demography and bioge-
ographic scenario is as follows: (1) Allopatric isolation during the Pleistocene give rise to Clade I (Atlantic) and Clade II (Medi-
terranean); (2) Population collapse followed by sudden expansion gives rise to the characteristic star-like phylogeny of Clade II; (3)
Secondary contact as Clade I enters from the Atlantic, and (4) An east-west cline is maintained by IBD.
� 2004 Elsevier Inc. All rights reserved.
Keywords: Atlantic bonito; Sarda sarda; Mitochondrial DNA control region; Stock structure; Isolation by distance; Phylogeography; Vicariance;
Mismatch distribution; Mediterranean Sea
1. Introduction
Atlantic Bonito (Sarda sarda Bloch, 1793)—the only
member of the genus Sarda distributed along the trop-
ical and temperate coasts of the Atlantic Ocean, theMediterranean Sea, and the Black Sea (Collette and
Chao, 1975)—inhabits pelagic neritic waters about 200m
deep (Yoshida, 1980). Although little is known about its
reproductive biology, based on the distribution of eggs,
larvae, and mature individuals, two main spawning ar-
eas have been defined both geographically and tempo-
rally within the Mediterranean. The first area located in
the western Mediterranean include the Alboran Sea, thewaters south of the Balearic Islands and the waters off
the Algerian coast where spawning occurs during the
* Corresponding author. Fax: 1-409-740-5002.
E-mail address: [email protected] (J. Vi~nas).
1055-7903/$ - see front matter � 2004 Elsevier Inc. All rights reserved.
doi:10.1016/j.ympev.2004.04.009
early summer (Rey et al., 1984; see Fig. 1 in Pujolar
et al., 2001). The second area is located at the eastern
extreme of the Mediterranean and includes the coastal
waters of the Sea of Marmara and the Black Sea with
spawning occurring from June and July (Yoshida,1980). A tag-recapture study of Atlantic bonito in the
Mediterranean detected no exchange of fish between the
east and west, and thus putatively between the two
known reproductive areas. Based on all this informa-
tion, Rey et al. (1984) hypothesized that two isolated
sub-populations exist in the Mediterranean. However,
recently an additional spawning area has been identified
in northern Balearic Sea (Sabat�es and Recasens, 2001)suggesting the possibility that additional spawning areas
exist.
The proposed population subdivision of Atlantic
bonito in Mediterranean has been partially corrobo-
rated by the molecular genetic studies of Roberti et al.

J. Vi~nas et al. / Molecular Phylogenetics and Evolution 33 (2004) 32–42 33
(1993) and Pujolar et al. (2001). However, these studiesdisagree on the placement of a putative barrier that
prevents gene flow between eastern and western popu-
lations. Roberti et al. (1993) conducted an analysis of
300 bp segment of the mitochondrial DNA (mtDNA)
Cytochrome b (Cytb) gene. A small but significant dif-
ference in haplotype frequency was found between a
sample from the Sea of Marmara and two Mediterra-
nean samples, one from the Aegean Sea and the otherfrom the Ionian Sea, which in turn were not different
from each other. Roberti et al. (1993) concluded that a
barrier prevents gene flow between the Sea of Marmara
and Aegean Sea. Interestingly, these two regions are
considered, respectively, spawning and feeding areas for
the eastern population. In the protein electrophoresis
study of Pujolar et al. (2001), a small but significant
differentiation between the Aegean Sea and two westernsamples, namely the Ionian Sea and the Ligurian Sea
was found. Although a sample from the Sea of Marmara
was not included, Pujolar et al. (2001) argued that the
barrier to gene flow between east and west is located in
the region that separates the Ionian and the Aegean
seas. Thus, allozyme data would appear concordant
with the interpretation of Rey et al. (1984) about an
eastern and western subdivision, but not concordantwith the mitochondrial data of Roberti et al. (1993).
The low level of geographic genetic differentiation
reported for Atlantic bonito in the Mediterranean at
both nuclear and mtDNA loci is concordant with the
expected weak signals of genetic differentiation for ma-
rine species due to the high gene flow potential (Waples,
1998). Conversely, substantial levels of genetic differen-
tiation can be expected for small epibenthic marine fish.Recently, profound levels of genetic differentiation were
reported for the sand goby (Pomatoschistus minutus)
between two Mediterranean populations (Stefanni and
Thorley, 2003). However, substantial genetic differenti-
ation has been reported for the highly vagile European
anchovy (Engraulis encrasicolus) within the Mediterra-
nean (Magoulas et al., 1996). In both examples, histor-
ical vicariance and barriers to gene flow are invoked asthe primary mechanism to explain the observed patterns
of differentiation. However, vicariance and gene flow
barriers are not the only mechanism capable of gener-
ating genetic differentiation, and recently isolation by
distance (IBD) has been used to explain the population
structure at both nuclear and mtDNA levels for several
Table 1
Sampling details, locations, and number of individuals ðnÞ
Sampling locality ðnÞ Location
Balearic Sea 54 41�51N–3�10ELigurian Sea 58 43�30N–9�EIonian Sea 30 39�30N–17�30EAegean Sea 53 39�N–25�30E
marine species that possess free living larval and/oradult stages (Nesbø et al., 2000; Pogson et al., 2001;
Reeb et al., 2000; Wirth and Bernatchez, 2001). In these
studies, the genetic differentiation arises from the re-
duction of the gene flow as geographic distance increases
rather than the presence of a barrier to gene flow.
In the present study, we examined the genetic basis of
the population structure of Atlantic bonito in the
northern Mediterranean, from the DNA nucleotide se-quence analysis of 405 bp of the mtDNA control region
(CR). We show that there is a significant correlation
between geographical distance and genetic distance re-
sulting from the asymmetric distribution of two highly
divergent mtDNA clades with very distinct demographic
histories.
2. Materials and methods
Genetic analyses were conducted on 195 Atlantic
bonito collected in the following northern Mediterra-
nean locations: Balearic Sea ðn ¼ 54Þ, Ligurian Sea
ðn ¼ 58Þ, Ionian Sea ðn ¼ 36Þ, and Aegean Sea ðn ¼ 53Þ.Sample details are included in Table 1. In addition,
DNA sequences of Australian bonito S. australis ðn ¼ 3Þand striped bonito S. orientalis ðn ¼ 2Þ were character-
ized and included as outgroups. Skeletal muscle or fin
clips of caudal fin from each individual were collected
and either preserved in 96% ethanol or frozen at )30 �Cuntil assayed in the laboratory. Methods for DNA iso-
lation, PCR amplification, and DNA sequencing fol-
lowed Vi~nas et al., 2004. Sequences of all haplotypes
were submitted to GenBank and assigned AccessionNos. AY526910–AY527037.
Sequence alignments were optimized by eye in BIO-
EDIT (Hall, 1999). The orthologous sequences of At-
lantic bluefin tuna (Thunnus thynnus) (GenBank
Accession No. X81563) and Atlantic bonito (GenBank
Accession No. AF390212) were used as reference to
facilitate the alignment. The multiple sequence align-
ment of Atlantic bonito and the outgroup revealed thatone set of lineages of the former contained a pentamer
insertion at the 50-end of the control region. This in-
sertion was weighed as one substitution in ensuing
analyses. The HKY (Hasegawa et al., 1985) model with
a ¼ 0:813; i ¼ 0:434, transition transversion ratio (ti/tv)
of 2.456 and base frequency of A: 0.343, C: 0.233, G:
Mean FL (cm) Collection dates
54.1 13/11/2002
57.5 13/6/1993–6/1994
52.0 2–10/1994
56.4 1–31/10/1993
34 J. Vi~nas et al. / Molecular Phylogenetics and Evolution 33 (2004) 32–42
J. Vi~nas et al. / Molecular Phylogenetics and Evolution 33 (2004) 32–42 35
0.147, and T: 0.277 was identified as the appropriatemodel of substitution using a hierarchical series of
likelihood ratio tests as implemented in MODEL TEST
3.06 (Posada and Crandall, 1998).
Phylogenetic analyses were performed in PAUP*
4.0b10 (Swofford, 2000). The large number of haplo-
types prohibited a search for the maximum likelihood
tree, so the more computationally efficient method
neighbor-joining (NJ) method (Saitou and Nei, 1987)was used to construct a tree with the best-fit model of
DNA evolution. Additionally, a maximum-parsimony
(MP) (Fitch, 1971; Kluge and Farris, 1969) analysis
conducting heuristic searches with the default options
was carried out. Evaluation of statistical confidence in
nodes was based in 1000 non-parametric bootstrap
replicates (Felsenstein, 1985). In all phylogenetic anal-
yses, the mtDNA CR sequences of Australian bonitoand striped bonito were used as outgroups to root the
tree.
The number of segregating sites (K), mean sequence
divergence between groups corrected by within-group
divergence ðDAÞ and values of haplotypic diversity (h)
(Nei and Tajima, 1981) and of nucleotide diversity (p)(Nei, 1987) were computed with ARLEQUIN 2.000
(Schneider et al., 2000). Because the best-fit model is notimplemented in ARLEQUIN, the Tamura-Nei (Tamura
and Nei, 1993) model with the gamma parameter pre-
viously estimated was used to calculate the genetic dis-
tance between pairs of haplotypes. The proportion of
variance distributed among samples was tested using the
hierarchical analysis of the molecular variance proce-
dure (AMOVA) (Excoffier et al., 1992) as implemented
in ARLEQUIN. The haplotypic correlation measureðUstÞ was examined considering all four samples as be-
longing to one population. Additionally, the haplotypic
correlation measure ðUstÞ between each possible sample
pair was estimated. Significance levels were determined
by conducting a non-parametric permutation procedure
1000 times. The extent of geographic heterogeneity in
allele-frequency distribution was analyzed through
Monte Carlo randomizations, as described by Roff andBentzen (1989), using the MONTE in REAP (McElroy
et al., 1992). The sequential Bonferroni test (Holm, 1979;
Rice, 1989) was used to correct for multiple testing.
Demographic history was examined by two ap-
proaches. First, Tajima�s test of neutrality (Tajima,
1989) which compares the average number of pairwise
nucleotide differences (k) between haplotypes in a sam-
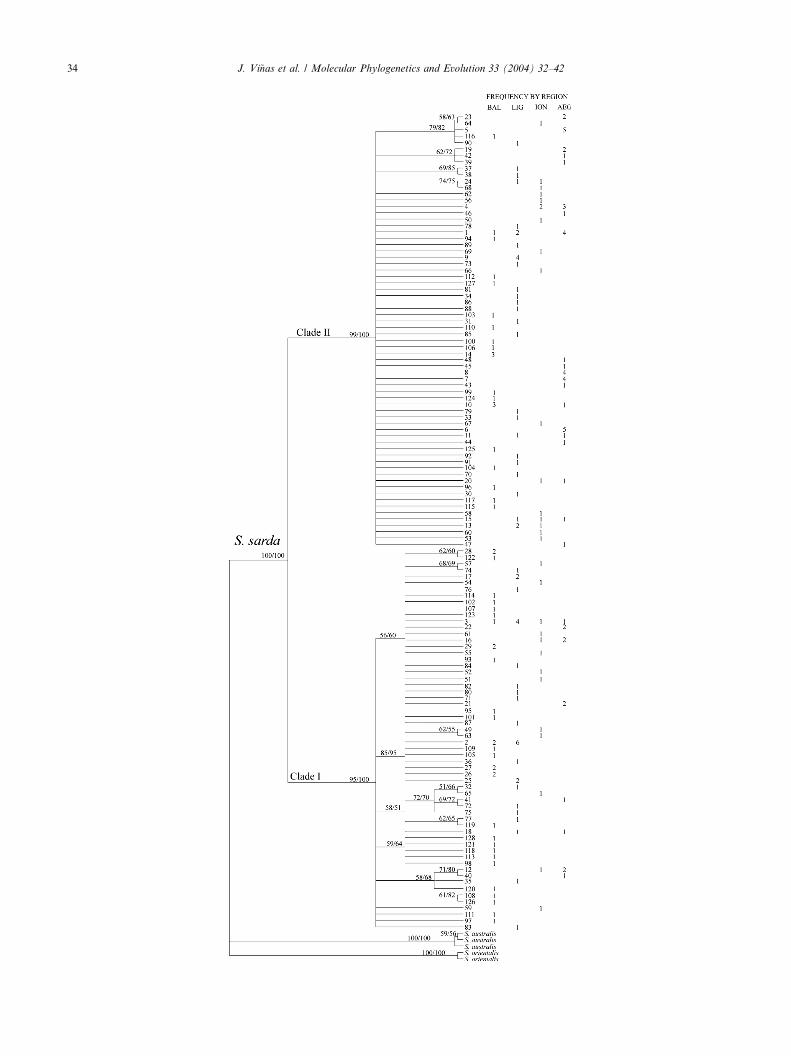
Fig. 1. Maximum-Parsimony bootstrap (MP) tree of the 128 Atlantic bonito
value were less than 50%. Tree was rooted using Australian bonito (S. austral
the same topology was obtained using neighbor-joining (NJ) and HKY (H
transition transversion ratio (ti/tv) of 2.456. Bootstrap support for branchin
haplotypes and their frequency is shown in the right margin. Abbreviations
Ionian Sea (ION), and Aegean Sea (AEG).
b
ple (M) expected from the number of segregating sites(K) was used to infer the population history. A popu-
lation that has been experienced population expansion
may result in a rejection of the null hypothesis of neu-
trality. Alternatively, mismatch distribution analyses
were used to evaluate possible events of population ex-
pansion and decline (Rogers, 1995; Rogers and Har-
pending, 1992). A population that has experienced a
rapid expansion or bottleneck in the recent past shows asmooth wave-like mismatch distribution with a star-like
genealogy (Rogers and Harpending, 1992; Slatkin and
Hudson, 1991). All demographic analyses were com-
puted in ARLEQUIN.
The null hypothesis of no correlation between genetic
differentiation and geographic distances was tested by
permuting the Mantel�s non-parametric test (Mantel,
1967) 1000 times in ARLEQUIN. Alternatively, thematrix of pairwise populations Ust values generated with
AMOVA was linearized (Slatkin, 1991) and regressed
against the matrix of geographic distances between lo-
cations (Rousset, 1997). Geographic distances were
calculated as the shortest line paths that follow the
200m bathymetric contour based on the known spatial
distribution of Atlantic bonito in the Mediterranean (see
Section 1).
3. Results
Approximately 405 bp of nucleotide sequence of the
mtDNA CR was determined for 195 Atlantic bonito.
About 305 bp corresponded to the hypervariable first
domain with the remaining 100 bp to the second orcentral domain of the CR. The transition/transversion
ratio ðr ¼ 2:456Þ in Atlantic bonito�s CR is the lowest
reported to date in scombroid fishes (Alvarado Bremer
et al., 1995; Alvarado Bremer et al., 1997). A total of 127
segregating sites (K), of which 80 were parsimony in-
formative, defined 128 distinct Atlantic bonito mtDNA
types. Inclusion of the outgroup sequences, S. australis
ðn ¼ 3Þ and S. orientalis ðn ¼ 2Þ, increased K to 158, andparsimony sites to 120. The mutation rate among sites
along the CR segment characterized in Atlantic bonito
was heterogeneous yielding a low alpha value
ða ¼ 0:813Þ. Molecular diversity indices for all sampling
locations were very similar, but the lowest value
consistently corresponded to the Aegean Sea sample
(Table 2).
(Sarda sarda) haplotypes. Branches were collapsed when the bootstrap
is) and striped bonito (S. orientalis) as outgroup. A tree with essentially
asegawa et al., 1985) model of substitution with a ¼ 0:813; i ¼ 0:434,
g is shown above branches (MP/NJ). The geographic distribution of
of localities are as follows: Balearic Sea (BAL), Ligurian Sea (LIG),
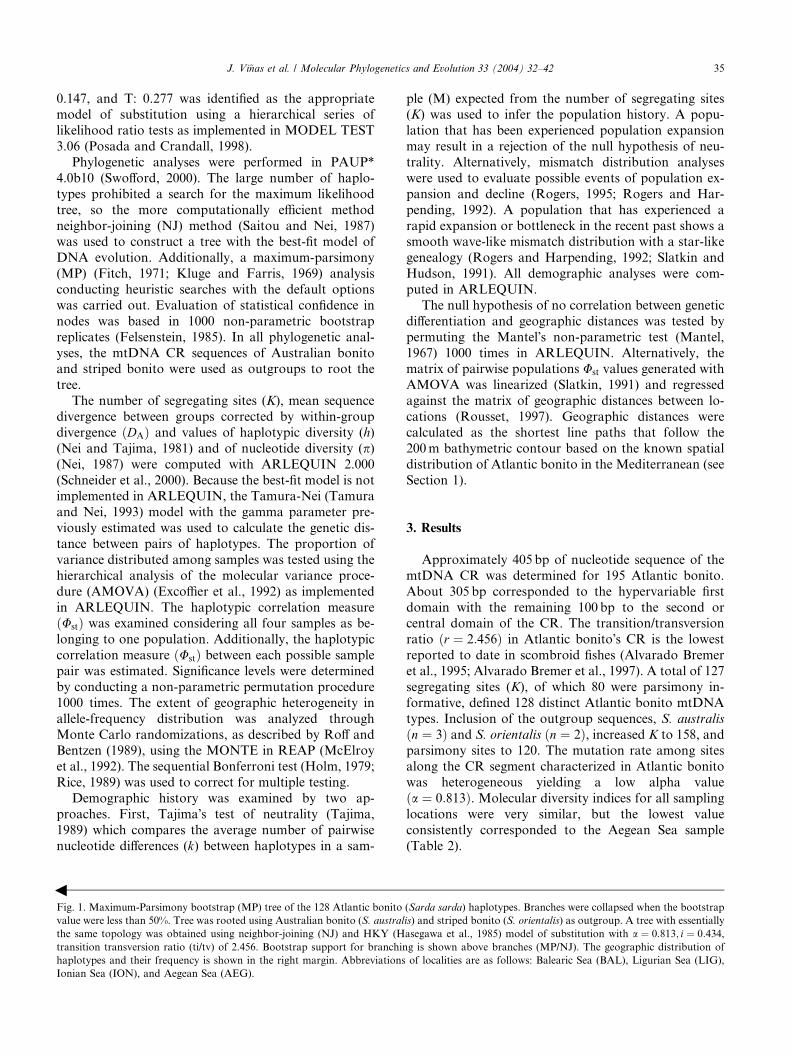
Fig. 2. Unrooted neighbor-joining (NJ) tree of the 128 Atlantic bonito
haplotypes using HKY (Hasegawa et al., 1985) model of substitution
with a ¼ 0:813; i ¼ 0:434, transition/transversion ratio (ti/tv) of 2.456.
Bootstrap values above 50% is shown by the nodes.
Table 2
Number of individuals ðnÞ, number of haplotypes ðMÞ, and molecular
diversity indices for the four localities
Locality n M Molecular diversity indices
h p
Balearic Sea 54 45 0.992 (0.005) 0.071 (0.035)
Ligurian Sea 58 43 0.981 (0.009) 0.063 (0.031)
Ionian Sea 30 29 0.997 (0.009) 0.067 (0.034)
Aegean Sea 53 28 0.966 (0.010) 0.051 (0.025)
Total 195 128 0.993 (0.002) 0.063 (0.031)
h, haplotypic diversity (SD); p, nucleotide diversity (SD).
36 J. Vi~nas et al. / Molecular Phylogenetics and Evolution 33 (2004) 32–42
The topology of the gene trees obtained using MP
and NJ analyses were concordant with the most robust
branches supported by similar values of bootstrap
(Fig. 1). The MP tree was 419 steps long and had a high
retention index (RI ¼ 0.895). The high level of homo-
plasy resulting from the large values of haplotypic di-
versity and autoapomorphies translated to a lowconsistency index (CI ¼ 0.384). The most obvious fea-
tures of the gene-tree is that S. sarda haplotypes can be
assigned to one of two highly divergent and extremely
well supported clades, hereafter referred as Clade I and
Clade II. Eighteen fixed differences comprising two in-
dels, nine transitions and seven transversions distin-
guished these two clades. One synapomorphy of the
Clade II haplotypes is the presence of the indel pentamer50-RYACA-30 (R purine, A or G; Y Pyrimidine, C or T)
at 50-end of the light strand of the CR. The two clades
are separated by DA value of 8.1%� 1.3. The origin of
these two Atlantic bonito clades appear to be mono-
phyletic relative to the outgroup (Fig. 1), however, no
conclusions about their relationship can be reached in
the absence of Atlantic samples of Atlantic bonito as
well as of specimens of the congeneric S. chiliensis.Clade I includes 60 haplotypes belonging to 86 indi-
viduals collected in all localities sampled with a haplo-
typic diversity of h ¼ 0:985� 0:006. This clade has 70
segregating sites and a value nucleotide diversity of
p ¼ 0:029� 0:014. Thus, the average difference betweena random pair of Clade I fish is about 12 changes. The
tree topology of Clade I is well structured with 14 nodes
being supported by at least one synapomorphy resultingin those branches receiving bootstrap values >50%.
Clade II included 68 haplotypes among 109 individuals,
and was remarkably similar to Clade I in the number of
segregating sites (K¼ 71) and in the value of haplotypic
diversity ðh ¼ 0:986� 0:004Þ. However, the nucleotide
diversity in Clade II ðp ¼ 0:016� 0:008Þ is significantlylower (t Student, p < 0:05) than that in Clade I. Such
disparity translates into striking differences in thebranching pattern of each clade, with Clade II haplo-
types characterized by star-like branching topology
(Fig. 2). Accordingly, there is large uncertainty regard-
ing the relationship of haplotypes within the sub-tree of
Clade II.
The mismatch distribution for the entire sample de-
viated significantly from the expected distribution under
the sudden expansion model (Fig. 3). This outcome issupported by lack of significance of the Tajima�s D test.
However, independent demographic histories for each
clade are suggested by the mismatch distributions and
the Tajima�s D of neutrality. In the case of Clade I, the
bimodal distribution and a non-significant value of
Tajima�s D rejects the hypothesis of population bottle-
neck. In contrast, the mismatch distribution of Clade II
together with rejection of neutrality (Fig. 3), and thestar-like phylogeny (Fig. 2) suggest a recent demo-
graphic expansion.
The distribution of the two clades was highly hetero-
geneous among the four localities sampled (v2,p ¼ 0:001� 0:001). An east-west cline was observed,
with Clade I decreasing in abundance towards the east-
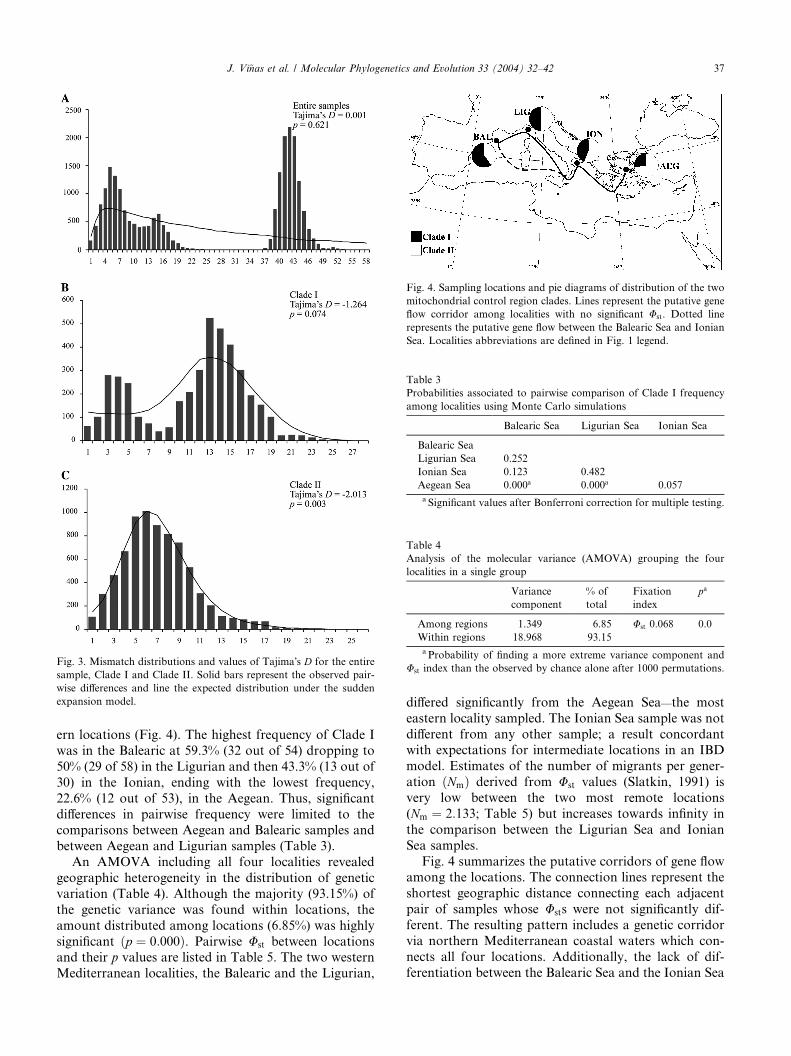
Fig. 3. Mismatch distributions and values of Tajima�s D for the entire
sample, Clade I and Clade II. Solid bars represent the observed pair-
wise differences and line the expected distribution under the sudden
expansion model.
Fig. 4. Sampling locations and pie diagrams of distribution of the two
mitochondrial control region clades. Lines represent the putative gene
flow corridor among localities with no significant Ust. Dotted line
represents the putative gene flow between the Balearic Sea and Ionian
Sea. Localities abbreviations are defined in Fig. 1 legend.
Table 3
Probabilities associated to pairwise comparison of Clade I frequency
among localities using Monte Carlo simulations
Balearic Sea Ligurian Sea Ionian Sea
Balearic Sea
Ligurian Sea 0.252
Ionian Sea 0.123 0.482
Aegean Sea 0.000a 0.000a 0.057
a Significant values after Bonferroni correction for multiple testing.
Table 4
Analysis of the molecular variance (AMOVA) grouping the four
localities in a single group
Variance
component
% of
total
Fixation
index
pa
Among regions 1.349 6.85 Ust 0.068 0.0
Within regions 18.968 93.15
a Probability of finding a more extreme variance component and
Ust index than the observed by chance alone after 1000 permutations.
J. Vi~nas et al. / Molecular Phylogenetics and Evolution 33 (2004) 32–42 37
ern locations (Fig. 4). The highest frequency of Clade I
was in the Balearic at 59.3% (32 out of 54) dropping to
50% (29 of 58) in the Ligurian and then 43.3% (13 out of
30) in the Ionian, ending with the lowest frequency,
22.6% (12 out of 53), in the Aegean. Thus, significant
differences in pairwise frequency were limited to thecomparisons between Aegean and Balearic samples and
between Aegean and Ligurian samples (Table 3).
An AMOVA including all four localities revealed
geographic heterogeneity in the distribution of genetic
variation (Table 4). Although the majority (93.15%) of
the genetic variance was found within locations, the
amount distributed among locations (6.85%) was highly
significant ðp ¼ 0:000Þ. Pairwise Ust between locationsand their p values are listed in Table 5. The two western
Mediterranean localities, the Balearic and the Ligurian,
differed significantly from the Aegean Sea—the most
eastern locality sampled. The Ionian Sea sample was not
different from any other sample; a result concordantwith expectations for intermediate locations in an IBD
model. Estimates of the number of migrants per gener-
ation ðNmÞ derived from Ust values (Slatkin, 1991) is
very low between the two most remote locations
(Nm ¼ 2:133; Table 5) but increases towards infinity in
the comparison between the Ligurian Sea and Ionian
Sea samples.
Fig. 4 summarizes the putative corridors of gene flowamong the locations. The connection lines represent the
shortest geographic distance connecting each adjacent
pair of samples whose Usts were not significantly dif-
ferent. The resulting pattern includes a genetic corridor
via northern Mediterranean coastal waters which con-
nects all four locations. Additionally, the lack of dif-
ferentiation between the Balearic Sea and the Ionian Sea
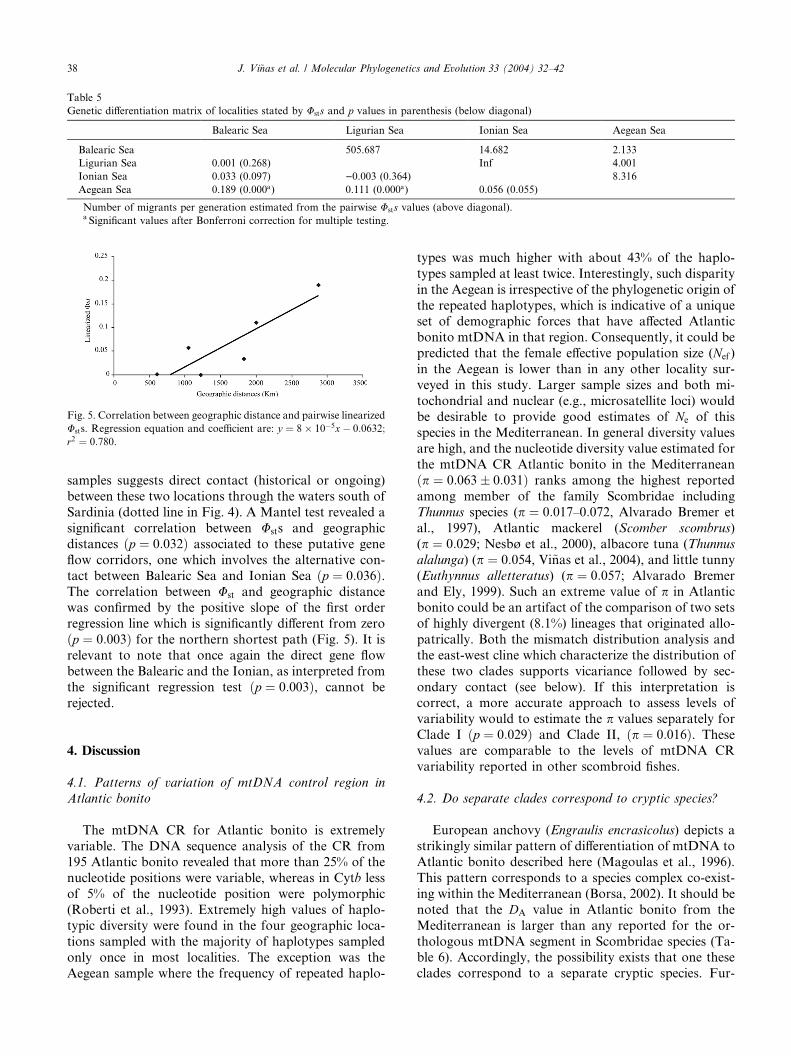
Table 5
Genetic differentiation matrix of localities stated by Usts and p values in parenthesis (below diagonal)
Balearic Sea Ligurian Sea Ionian Sea Aegean Sea
Balearic Sea 505.687 14.682 2.133
Ligurian Sea 0.001 (0.268) Inf 4.001
Ionian Sea 0.033 (0.097) )0.003 (0.364) 8.316
Aegean Sea 0.189 (0.000a) 0.111 (0.000a) 0.056 (0.055)
Number of migrants per generation estimated from the pairwise Usts values (above diagonal).a Significant values after Bonferroni correction for multiple testing.
Fig. 5. Correlation between geographic distance and pairwise linearized
Usts. Regression equation and coefficient are: y ¼ 8� 10�5x� 0:0632;
r2 ¼ 0:780.
38 J. Vi~nas et al. / Molecular Phylogenetics and Evolution 33 (2004) 32–42
samples suggests direct contact (historical or ongoing)
between these two locations through the waters south of
Sardinia (dotted line in Fig. 4). A Mantel test revealed a
significant correlation between Usts and geographic
distances ðp ¼ 0:032Þ associated to these putative gene
flow corridors, one which involves the alternative con-
tact between Balearic Sea and Ionian Sea ðp ¼ 0:036Þ.The correlation between Ust and geographic distancewas confirmed by the positive slope of the first order
regression line which is significantly different from zero
ðp ¼ 0:003Þ for the northern shortest path (Fig. 5). It is
relevant to note that once again the direct gene flow
between the Balearic and the Ionian, as interpreted from
the significant regression test ðp ¼ 0:003Þ, cannot be
rejected.
4. Discussion
4.1. Patterns of variation of mtDNA control region in
Atlantic bonito
The mtDNA CR for Atlantic bonito is extremely
variable. The DNA sequence analysis of the CR from195 Atlantic bonito revealed that more than 25% of the
nucleotide positions were variable, whereas in Cytb less
of 5% of the nucleotide position were polymorphic
(Roberti et al., 1993). Extremely high values of haplo-
typic diversity were found in the four geographic loca-
tions sampled with the majority of haplotypes sampled
only once in most localities. The exception was the
Aegean sample where the frequency of repeated haplo-
types was much higher with about 43% of the haplo-
types sampled at least twice. Interestingly, such disparity
in the Aegean is irrespective of the phylogenetic origin of
the repeated haplotypes, which is indicative of a uniqueset of demographic forces that have affected Atlantic
bonito mtDNA in that region. Consequently, it could be
predicted that the female effective population size (Nef )
in the Aegean is lower than in any other locality sur-
veyed in this study. Larger sample sizes and both mi-
tochondrial and nuclear (e.g., microsatellite loci) would
be desirable to provide good estimates of Ne of this
species in the Mediterranean. In general diversity valuesare high, and the nucleotide diversity value estimated for
the mtDNA CR Atlantic bonito in the Mediterranean
ðp ¼ 0:063� 0:031Þ ranks among the highest reported
among member of the family Scombridae including
Thunnus species (p ¼ 0:017–0:072, Alvarado Bremer et
al., 1997), Atlantic mackerel (Scomber scombrus)
(p ¼ 0:029; Nesbø et al., 2000), albacore tuna (Thunnus
alalunga) (p ¼ 0:054, Vi~nas et al., 2004), and little tunny(Euthynnus alletteratus) (p ¼ 0:057; Alvarado Bremer
and Ely, 1999). Such an extreme value of p in Atlantic
bonito could be an artifact of the comparison of two sets
of highly divergent (8.1%) lineages that originated allo-
patrically. Both the mismatch distribution analysis and
the east-west cline which characterize the distribution of
these two clades supports vicariance followed by sec-
ondary contact (see below). If this interpretation iscorrect, a more accurate approach to assess levels of
variability would to estimate the p values separately for
Clade I ðp ¼ 0:029Þ and Clade II, ðp ¼ 0:016Þ. These
values are comparable to the levels of mtDNA CR
variability reported in other scombroid fishes.
4.2. Do separate clades correspond to cryptic species?
European anchovy (Engraulis encrasicolus) depicts a
strikingly similar pattern of differentiation of mtDNA to
Atlantic bonito described here (Magoulas et al., 1996).
This pattern corresponds to a species complex co-exist-
ing within the Mediterranean (Borsa, 2002). It should be
noted that the DA value in Atlantic bonito from the
Mediterranean is larger than any reported for the or-
thologous mtDNA segment in Scombridae species (Ta-ble 6). Accordingly, the possibility exists that one these
clades correspond to a separate cryptic species. Fur-
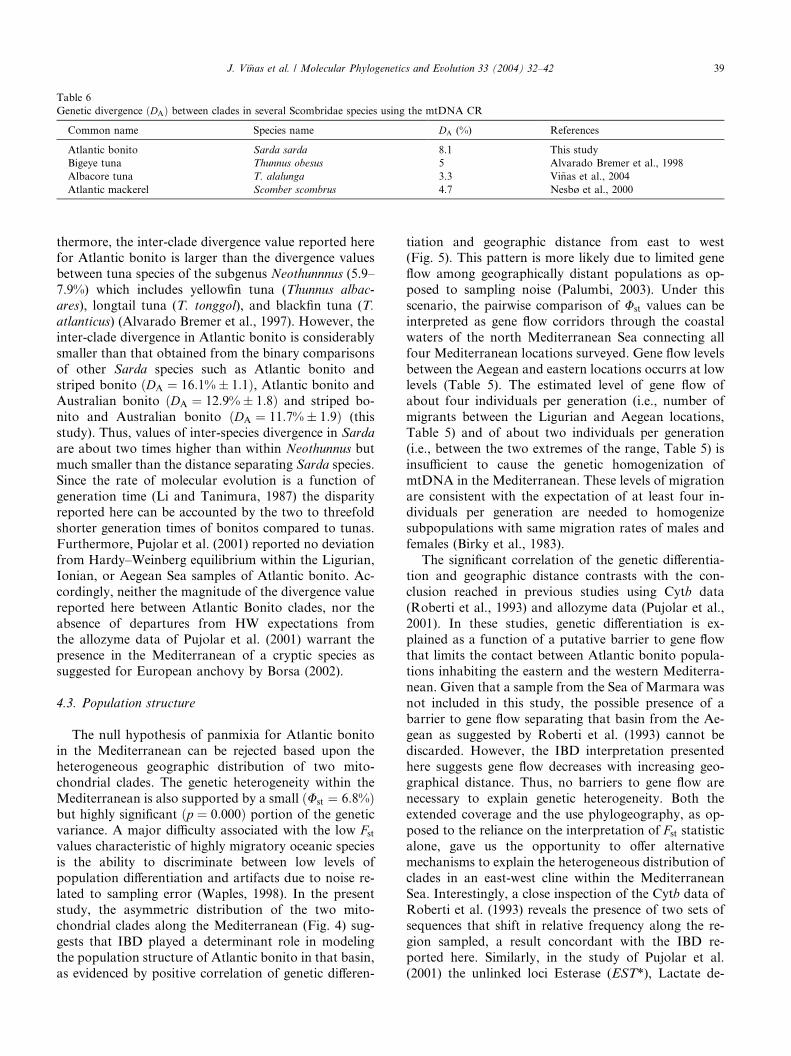
Table 6
Genetic divergence ðDAÞ between clades in several Scombridae species using the mtDNA CR
Common name Species name DA (%) References
Atlantic bonito Sarda sarda 8.1 This study
Bigeye tuna Thunnus obesus 5 Alvarado Bremer et al., 1998
Albacore tuna T. alalunga 3.3 Vi~nas et al., 2004
Atlantic mackerel Scomber scombrus 4.7 Nesbø et al., 2000
J. Vi~nas et al. / Molecular Phylogenetics and Evolution 33 (2004) 32–42 39
thermore, the inter-clade divergence value reported herefor Atlantic bonito is larger than the divergence values
between tuna species of the subgenus Neothunnnus (5.9–
7.9%) which includes yellowfin tuna (Thunnus albac-
ares), longtail tuna (T. tonggol), and blackfin tuna (T.
atlanticus) (Alvarado Bremer et al., 1997). However, the
inter-clade divergence in Atlantic bonito is considerably
smaller than that obtained from the binary comparisons
of other Sarda species such as Atlantic bonito andstriped bonito ðDA ¼ 16:1%� 1:1Þ, Atlantic bonito and
Australian bonito ðDA ¼ 12:9%� 1:8Þ and striped bo-
nito and Australian bonito ðDA ¼ 11:7%� 1:9Þ (this
study). Thus, values of inter-species divergence in Sarda
are about two times higher than within Neothunnus but
much smaller than the distance separating Sarda species.
Since the rate of molecular evolution is a function of
generation time (Li and Tanimura, 1987) the disparityreported here can be accounted by the two to threefold
shorter generation times of bonitos compared to tunas.
Furthermore, Pujolar et al. (2001) reported no deviation
from Hardy–Weinberg equilibrium within the Ligurian,
Ionian, or Aegean Sea samples of Atlantic bonito. Ac-
cordingly, neither the magnitude of the divergence value
reported here between Atlantic Bonito clades, nor the
absence of departures from HW expectations fromthe allozyme data of Pujolar et al. (2001) warrant the
presence in the Mediterranean of a cryptic species as
suggested for European anchovy by Borsa (2002).
4.3. Population structure
The null hypothesis of panmixia for Atlantic bonito
in the Mediterranean can be rejected based upon theheterogeneous geographic distribution of two mito-
chondrial clades. The genetic heterogeneity within the
Mediterranean is also supported by a small ðUst ¼ 6:8%Þbut highly significant ðp ¼ 0:000Þ portion of the genetic
variance. A major difficulty associated with the low Fstvalues characteristic of highly migratory oceanic species
is the ability to discriminate between low levels of
population differentiation and artifacts due to noise re-lated to sampling error (Waples, 1998). In the present
study, the asymmetric distribution of the two mito-
chondrial clades along the Mediterranean (Fig. 4) sug-
gests that IBD played a determinant role in modeling
the population structure of Atlantic bonito in that basin,
as evidenced by positive correlation of genetic differen-
tiation and geographic distance from east to west(Fig. 5). This pattern is more likely due to limited gene
flow among geographically distant populations as op-
posed to sampling noise (Palumbi, 2003). Under this
scenario, the pairwise comparison of Ust values can be
interpreted as gene flow corridors through the coastal
waters of the north Mediterranean Sea connecting all
four Mediterranean locations surveyed. Gene flow levels
between the Aegean and eastern locations occurrs at lowlevels (Table 5). The estimated level of gene flow of
about four individuals per generation (i.e., number of
migrants between the Ligurian and Aegean locations,
Table 5) and of about two individuals per generation
(i.e., between the two extremes of the range, Table 5) is
insufficient to cause the genetic homogenization of
mtDNA in the Mediterranean. These levels of migration
are consistent with the expectation of at least four in-dividuals per generation are needed to homogenize
subpopulations with same migration rates of males and
females (Birky et al., 1983).
The significant correlation of the genetic differentia-
tion and geographic distance contrasts with the con-
clusion reached in previous studies using Cytb data
(Roberti et al., 1993) and allozyme data (Pujolar et al.,
2001). In these studies, genetic differentiation is ex-plained as a function of a putative barrier to gene flow
that limits the contact between Atlantic bonito popula-
tions inhabiting the eastern and the western Mediterra-
nean. Given that a sample from the Sea of Marmara was
not included in this study, the possible presence of a
barrier to gene flow separating that basin from the Ae-
gean as suggested by Roberti et al. (1993) cannot be
discarded. However, the IBD interpretation presentedhere suggests gene flow decreases with increasing geo-
graphical distance. Thus, no barriers to gene flow are
necessary to explain genetic heterogeneity. Both the
extended coverage and the use phylogeography, as op-
posed to the reliance on the interpretation of Fst statisticalone, gave us the opportunity to offer alternative
mechanisms to explain the heterogeneous distribution of
clades in an east-west cline within the MediterraneanSea. Interestingly, a close inspection of the Cytb data of
Roberti et al. (1993) reveals the presence of two sets of
sequences that shift in relative frequency along the re-
gion sampled, a result concordant with the IBD re-
ported here. Similarly, in the study of Pujolar et al.
(2001) the unlinked loci Esterase (EST*), Lactate de-
40 J. Vi~nas et al. / Molecular Phylogenetics and Evolution 33 (2004) 32–42
hydrogenase (LDH-1*), and mannose-6-phosphateisomerase (MPI*) depict an east-west cline. Interest-
ingly, EST* and MPI* are two of the three loci that
showed significant differentiation in allele frequencies
between the Aegean Sea relative to the Ligurian Sea and
the Ionian Sea, and which were used by Pujolar et al.
(2001) to place a barrier to gene flow separating the
putative eastern and western populations.
The significant association between gene flow andgeographic distance observed in a vagile species such as
the Atlantic bonito within a relatively small region was
unexpected. Examples of IBD in marine species with
large dispersal capabilities have been typically docu-
mented over large geographic areas (Palumbi, 1994).
The observed pattern of population structure is sur-
prising, particularly when compared to other Scombri-
dae species with similar neritic distribution. In Atlanticmackerel (Scomber scombrus), Nesbø et al. (2000) de-
tected IBD only when comparing the most distant
samples, namely Canadian Atlantic coast and the
Adriatic Sea. In chub mackerel (Scomber japonicus), the
distribution of mtDNA haplotypes among collections
from the Mediterranean Sea, Ivory Coast, and South
Africa was not heterogeneous (Graves, 1998). Further-
more, both Spanish mackerel (Scomberomorus macula-
tus) and king mackarel (S. cavalla) showed no genetic
differentiation in the comparison of samples from the
Gulf of Mexico and US Atlantic coast (Buonaccorsi
et al., 2001; Gold and Richardson, 1998) separated by a
geographic distance comparable to that between the two
most extreme geographic locations surveyed in this
study. Furthermore, Gold and Richardson (1998) re-
viewed studies of mitochondrial variation in severalfishes distributed along the northwestern Atlantic and
the Gulf of Mexico. Population subdivision, following
IBD, was only documented in species that are estuarine-
dependent during the larval and juvenile stages. Since
Atlantic bonito displays no association to estuaries
during its lifetime, other mechanisms must be involved
to maintain genetic differentiation in this vagile species.
Two alternative mechanisms can be invoked to ex-plain the presence of genetic heterogeneity in Atlantic
bonito at the small spatial scales of the Mediterranean
Sea. First, larval retention (Sinclair and Iles, 1985) could
play an important role in establish genetic heterogeneity
in species with pelagic larvae (Gold and Richardson,
1998; Taylor and Hellberg, 2003). The patterns of sur-
face current in the Mediterranean Sea could limit larval
dispersal, provided that adults do not disperse amongregions. Such influence has been invoked by Magoulas
et al. (1996) to account the observed patterns of differ-
entiation in European anchovy, particularly with regard
to the distinctiveness of the Aegean Sea and the Adriatic
Sea sub-populations. Second, adult individuals may
observe a natal philopatric behavior towards respective
spawning grounds. Atlantic bonito in the Mediterranean
observe annual migratory movement between feedingand spawning grounds independently in the east and
west Mediterranean. One group is known to spawn in
the early summer in the western Mediterranean between
Gibraltar, Balearic Islands, and Algeria. After spawn-
ing, individuals return to the feeding areas, which in-
clude Atlantic waters adjacent to the Strait of Gibraltar,
and the Spanish and Moroccan Mediterranean coasts
(Rey et al., 1984). At about the same time, a very similarpattern of migration has been described in the eastern
Mediterranean Sea connecting the feeding grounds of
the Aegean Sea and the spawning areas of the Sea of
Marmara with Black Sea (Yoshida, 1980). The clinal
pattern of variation documented in this study may
suggests that each of the locations sampled represents
one smaller deme with some gene flow between them
leading to the observed genetic differentiation gradient.The recent characterization of a new reproductive area
in north of the Balearic Islands (Sabat�es and Recasens,
2001) supports the possible presence of additional
spawning areas along the Mediterranean coast.
4.4. Phylogeographic origin of genetic mitochondrial
discontinuity
The presence of highly divergent broadly sympatric
mtDNA clades within species (category II; Avise, 2000)
has been interpreted as evidence of vicariance followed
by reinvasion in highly migratory species such as bigeye
tuna, blue marlin, sailfish, and swordfish (Alvarado
Bremer et al., 1995; Alvarado Bremer et al., 1996; Al-
varado Bremer et al., 1998; Finnerty and Block, 1992;
Graves, 1998; Graves and Mcdowell, 1995). It can beargued that one possible way to account for the absence
of intermediate lineages in an apparent genetic discon-
tinuity is the omission of sampling of geographically
intermediate locations (Templeton, 1998) where inter-
mediate lineages may be found. However, the longitu-
dinal sampling of the Mediterranean conducted in this
study was adequate and no intermediate haplotypes
were found. Alternatively, phylogenetic discontinuitiescan be caused by demographic factors as predicted from
expectations of large stable populations under the neu-
tral coalescence theory (Harpending et al., 1998; Slatkin
and Hudson, 1991). Recently, Nesbø et al. (2000) and
Vi~nas et al. (2004) invoked this model to explain the
topology of the mtDNA CR tree in Atlantic mackerel
and albacore tuna, respectively. For Atlantic bonito in
the Mediterranean the bimodal mismatch distribution ofthe entire data set and the acceptance of neutrality
(Fig. 3A) suggest the presence of a large stable popula-
tion for Atlantic bonito in the Mediterranean. A
detailed inspection of the mismatch distribution, re-
spectively, for each clade reveals a bimodal distribution
for Clade I (Fig. 3B), consistent with a large stable
population, particularly since there is no phylogenetic
J. Vi~nas et al. / Molecular Phylogenetics and Evolution 33 (2004) 32–42 41
association of groups of lineages (Fig. 1), and alsosupported by the non-significant Tajima�s D value.
However, for Clade II there is a close correspondence
between observed and predicted mismatch distributions,
as corroborated by the significant negative values of
Tajima�s D test (Fig. 3C) and the star-like phylogeny of
this clade (Fig. 2). This implies that in the recent past a
portion of the Atlantic bonito population experienced a
bottleneck followed by a sudden population expansion.Consequently, the bimodal mismatch distribution ob-
tained from the combined analysis of both clades should
be not be interpreted as evidence of a large stable pop-
ulation for this species. Star-like phylogenies can also
result from the selective sweep of a phenotypically ad-
vantageous allele followed by accumulation of neutral
variants (Maruyama and Birky, 1991). A selective
sweep, at one locus reduces variation at linked loci, butnot at unlinked loci (Brookfield, 2001). However, in
Atlantic bonito low levels of genetic variation were also
observed at most allozyme loci (Pujolar et al., 2001).
Thus, it seems unlikely that selection would affect the
variation of unlinked mtDNA and nuclear loci at the
same time.
Alvarado Bremer et al. (1995) associated the division
of two clades in swordfish mtDNA CR to the isolationof the Mediterranean and Atlantic populations due to
drop in sea level caused by Pleistocene eustatic events. In
Atlantic bonito in the Mediterranean, the increase in
frequency of Clade I fish towards the Atlantic may in-
dicate that this clade originated in that ocean basin.
Evidence of ongoing migratory movement across Gi-
braltar (Rey and Cort, 1981) supports that notion. If
this interpretation is correct, Atlantic fish should havehaplotypes belonging primarily or exclusively to Clade I.
The morphometric analysis of western Atlantic and
Mediterranean samples indicates potential differences
between these two populations (Collette and Chao,
1975) which may coincide with the documented genetic
differences. Currently, samples from these areas are be-
ing procured as part of more extensive study of Atlantic
bonito.The results of this study can be summarized as fol-
lows. Two very distinct clades in Atlantic bonito origi-
nated in vicariance during the Pleistocene. Clade II
suffered a substantial population collapse, followed by
sudden expansion. The observed east-west cline is the
result of secondary contact of formerly allopatric pop-
ulations, and the observed pattern of differentiation
along this gradient is maintained by IBD.
Acknowledgments
We thank B. Ward, S. Chow, L. Orsi, G. De Metrio,
and P. Megalonofou for the collection of samples. We
appreciate the comments of B. Collette and S. Chow on
an earlier version of this manuscript. Expert technicalassistance was provided by L. du Sordo and V. Oliveras.
Part of this work was funded by the EEC DG XIV. J.V.
is a post-doctoral fellow funded by the Texas Institute of
Oceanography (TIO). This manuscript was improved
through the suggestions of two anonymous reviewers.
References
Alvarado Bremer, J.R., Mejuto, J., Baker, A.J., 1995. Mitochondrial
DNA control region sequences indicate extensive mixing of
swordfish (Xiphias gladius) populations in the Atlantic Ocean.
Can. J. Fish. Aquatic Sci. 52, 1720–1732.
Alvarado Bremer, J.R., Mejuto, J., Greig, T.W., Ely, B., 1996. Global
population structure of the swordfish (Xiphias gladius L.) as
revealed by analysis of the mitochondrial DNA control region. J.
Exp. Mar. Biol. Ecol. 197, 295–310.
Alvarado Bremer, J.R., Naseri, I., Ely, B., 1997. Orthodox and
unorthodox phylogenetic relationships among tunas revealed by
the nucleotide sequence analysis of the mitochondrial control
region. J. Fish. Biol. 50, 540–554.
Alvarado Bremer, J.R., Stequert, B., Robertson, N.W., Ely, B., 1998.
Genetic evidence for inter-oceanic subdivision of bigeye tuna
(Thunnus obesus) populations. Mar. Biol. 132, 547–557.
Alvarado Bremer, J.R., Ely, B., 1999. Pronounced levels of genetic
differentiation between two trans-atlantic samples of little tunny
(Euthynnus alletteratus). ICCAT Coll. Vol. Sci. Pap. 49, 236–242.
Avise, J.C., 2000. Phylogeography: The History and Formation of
Species. Harvard University Press, Cambridge.
Birky, C.W., Maruyama, T., Fuerst, P., 1983. An approach to
population and evolutionary genetic theory for genes in mitochon-
dria and chloroplasts, and some results. Genetics 103, 513–527.
Borsa, P., 2002. Allozyme, mitochondrial-DNA, and morphometric
variability indicate cryptic species of anchovy (Engraulis encrasic-
olus). Biol. J. Linn. Soc. 75, 261–269.
Brookfield, J.F., 2001. Population genetics: the signature of selection.
Curr. Biol. 11, R388–390.
Buonaccorsi, V.P., Starkey, E., Graves, J.E., 2001. Mitochondrial and
nuclear DNA analysis of population subdivision among young-of-
the-year Spanish mackerel (Scomberomorus maculatus) from the
western Atlantic and Gulf of Mexico. Mar. Biol. 138, 37–45.
Collette, B.B., Chao, L.N., 1975. Systematica and morphology of the
bonitos (Sarda) and their relatives (Scombridae, sardini). Fish.
Bull. 73, 515–625.
Excoffier, L., Smouse, P.E., Quattro, J.M., 1992. Analysis of molecular
variance inferred from metric distances among DNA haplotypes:
application to human mitochondrial DNA restriction data. Ge-
netics 131, 479–491.
Felsenstein, J., 1985. Confidence limits on phylogenies: an approach
using the bootstrap. Evolution 39, 783–791.
Finnerty, J.R., Block, B.A., 1992. Direct sequencing of mitochondrial
DNA detects highly divergent haplotypes in blue marlin (Makaira
nigricans). Mol. Mar. Biol. Biotechnol. 1, 206–214.
Fitch, W.M., 1971. Towards defining the course of evolution: minimal
change for a specific tree topology. Syst. Zool. 20, 406–410.
Gold, J., Richardson, L., 1998. Mitochondrial DNA diversification
and population structure in fishes from the Gulf of Mexico and
Western Atlantic. J. Hered. 89, 404–414.
Graves, J.E., 1998. Molecular insights into the population structures of
cosmopolitan marine fishes. J. Hered. 89, 427–437.
Graves, J.E., Mcdowell, J.R., 1995. Inter-ocean genetic-divergence of
istiophorid billfishes. Mar. Biol. 122, 193–203.
42 J. Vi~nas et al. / Molecular Phylogenetics and Evolution 33 (2004) 32–42
Hall, T.A., 1999. BioEdit: a user-friendly biological sequence align-
ment editor and analysis program for Windows 95/98/NT. Nucleic
Acids Symp. Ser. 41, 95–98.
Harpending, H.C., Batzer, M.A., Gurven, M., Jorde, L.B., Rogers,
A.R., Sherry, S.T., 1998. Genetic traces of ancient demography.
Proc. Natl. Acad. Sci. USA 95, 1961–1967.
Hasegawa, M., Kishino, H., Yano, T.A., 1985. Dating of the human
ape splitting by a molecular clock of mitochondrial-DNA. J. Mol.
Evol. 22, 160–174.
Holm, S., 1979. A simple sequentially rejective multiple test procedure.
J. Stat. Scand. 6, 65–70.
Kluge, A.G., Farris, J.S., 1969. Quantitative phyletics and the
evolution of anurans. Syst. Zool. 18, 1–32.
Li, W.H., Tanimura, M., 1987. The molecular clock runs more slowly
in man than in apes and monkeys. Nature 326, 93–96.
Magoulas, A., Tsimenides, N., Zouros, E., 1996. Mitochondrial DNA
phylogeny and the reconstruction of the population history of a
species: the case of the European anchovy (Engraulis encrasicolus).
Mol. Biol. Evol. 13, 178–190.
Mantel, N., 1967. The detection of disease clustering and a generalized
regression approach. Cancer Res. 27, 209–220.
Maruyama, T., Birky Jr., C.W., 1991. Effects of periodic selection on
gene diversity in organelle genomes and other systems without
recombination. Genetics 127, 449–451.
McElroy, D., Moran, P., Bermingham, E., Kornfield, I., 1992. REAP:
the restriction analysis package. J. Hered. 83, 157–158.
Nei, M., 1987. Molecular Evolutionary Genetics. Columbia University
Press, New York.
Nei, M., Tajima, F., 1981. DNA polymorphism detectable by
restriction endonucleases. Genetics 97, 145–163.
Nesbø, C.L., Rueness, E.K., Iversen, S.A., Skagen, D.W., Jakobsen,
K.S., 2000. Phylogeography and population history of Atlantic
mackerel (Scomber scombrus L.): a genealogical approach reveals
genetic structuring among the eastern Atlantic stocks. Proc. R. Soc.
Lond. B Biol. 267, 281–292.
Palumbi, S.R., 1994. Genetic-divergence, reproductive isolation, and
marine speciation. Ann. Rev. Ecol. Sys. 25, 547–572.
Palumbi, S.R., 2003. Population genetics, demographic connectiv-
ity, and the design of marine reserves. Ecol. Appl. 13, S146–
S158.
Pogson, G.H., Taggart, C.T., Mesa, K.A., Boutilier, R.G., 2001.
Isolation by distance in the Atlantic cod, Gadus morhua, at large
and small geographic scales. Evolution 55, 131–146.
Posada, D., Crandall, K., 1998. MODELTEST: testing the model of
DNA substitution. Bioinformatics 14, 817–818.
Pujolar, J.M., Rold�an, M.I., Pla, C., 2001. Allozyme differentiation of
bonito in the Mediterranean sea. J. Fish. Biol. 59, 169–174.
Reeb, C.A., Arcangeli, L., Block, B.A., 2000. Structure and migration
corridors in Pacific populations of the Swordfish Xiphius gladius, as
inferred through analyses of mitochondrial DNA. Mar. Biol. 136,
1123–1131.
Rey, J.C., A lot, E., Ramos, A., 1984. Sinopsis biol�ogica del bonito
(Sarda sarda) del Mediterr�aneo y Atl�antico este. ICCAT Coll. Vol.
Sci. Pap. 20, 469–502.
Rey, J.C., Cort, J.L., 1981. Migraci�on de bonitos (Sarda sarda) y
bacoreta (Euthynnus alletterratus) entre el Mediterr�aneo y Atl�anti-
co. ICCAT Coll. Vol. Sci. Pap. 15, 346–347.
Rice, W.R., 1989. Analyzing tables of statistical test. Evolution 43,
223–225.
Roberti, M., Yannopoulos, G., de Metrio, G., Ludovico, A., Milella,
F., Carone, P., Megalofonou, P., Bingel, F., Unluata, U., Canta-
tore, P., Gadaleta, M.N., 1993. Polimorfismo del DNA mitochon-
driale in stock di palamita, Sarda sarda, del Mar Mediterraneo.
Biol. Mar. suppl. Notiz. SIBM 1, 349–353.
Roff, D.A., Bentzen, P., 1989. The statistical analysis of mitochondrial
DNA polymorphism: v2 and the problem of small sample sizes.
Mol. Biol. Evol. 6, 539–545.
Rogers, A.R., 1995. Genetic evidence for a Pleistocene explosion.
Evolution 49, 608–615.
Rogers, A.R., Harpending, H., 1992. Population growth makes waves
in the distribution of pairwise genetic differences. Mol. Biol. Evol.
9, 552–569.
Rousset, F., 1997. Genetic differentiation and estimation of gene flow
from F-statistics under isolation by distance. Genetics 145, 1219–
1228.
Sabat�es, A., Recasens, L., 2001. Seasonal distribution and spawning of
small tunas (Auxis rochei and Sarda sarda) in the northwestern
Mediterranean. Sci. Mar. 65, 95–100.
Saitou, N., Nei, M., 1987. The neighbor-joining method: a new method
for reconstructing phylogenetic trees. Mol. Biol. Evol. 4, 406–425.
Schneider, S., Roessli, D., Excoffier, L., 2000. Arlequin: A Software for
Population Genetics Data Analysis. Genetics and Biometry Lab-
oratory, University of Geneve, Switzerland.
Sinclair, M., Iles, T.D., 1985. Atlantic Herring (Clupea-Harengus)
distributions in the Gulf of Maine scotian shelf area in relation to
oceanographic features. Can. J. Fish. Aquat. Sci. 42, 880–887.
Slatkin, M., 1991. Inbreeding coefficients and coalescence times.
Genet. Res. 58, 167–175.
Slatkin, M., Hudson, R., 1991. Pairwise comparisons of mitochondrial
DNA sequences in stable and exponentially growing populations.
Genetics 129, 555–562.
Stefanni, S., Thorley, J.L., 2003. Mitochondrial DNA phylogeography
reveals the existence of an Evolutionarily Significant Unit of the
sand goby Pomatoschistus minutus in the Adriatic (Eastern Med-
iterranean). Mol. Phylogenet. Evol. 28, 601–609.
Swofford, D.L., 2000. PAUP*. Phylogenetic Analysis using Parsimony
(* and other methods). Sinauer Associates, Sunderland, MA.
Tajima, F., 1989. The effect of change in population size on DNA
polymorphism. Genetics 123, 597–601.
Tamura, K., Nei, M., 1993. Estimation of the number of nucleotide
substitutions in the control region of mitochondrial DNA in
humans and chimpanzees. Mol. Biol. Evol. 10, 512–526.
Taylor, M.S., Hellberg, M.E., 2003. Genetic evidence for local
retention of pelagic larvae in a Caribbean reef fish. Science 299,
107–109.
Templeton, A.R., 1998. Nested clade analyses of phylogeographic
data: testing hypotheses about gene flow and population history.
Mol. Ecol. 7, 381–397.
Vi~nas, J., Alvarado Bremen, J., Pla C., 2004. Inter-oceanic genetic
differentiation among albacore (Thunnus alalunga) populations.
Mar. Biol. (in press).
Waples, R., 1998. Separating the wheat from the chaff: patterns of
genetic differentiation in high gene flow species. J. Hered. 89, 438–
450.
Wirth, T., Bernatchez, L., 2001. Genetic evidence against panmixia in
the European eel. Nature 409, 1037–1040.
Yoshida, H.O., 1980. Synopsis of biological data on bonito of the
genus Sarda. NOAATech. Rept. NMFS Circ. 432, 50.