Phylogeography of Agkistrodon piscivorus with Emphasis on the Western Limit of Its Range
11
Phylogeography of Agkistrodon piscivorus with Emphasis on the Western Limit of Its Range Jason L. Strickland 1,2 , Christopher L. Parkinson 2 , J. Kelly M c Coy 1,3 , and Loren K. Ammerman 1 The Cottonmouth, Agkistrodon piscivorus, is a semi-aquatic pitviper that occupies the southeastern U.S. west into Texas. Several previous studies have investigated the biogeographic history of A. piscivorus. It has been hypothesized that A. piscivorus was split into two separate populations during the last glacial maximum and climate change has impacted its distribution. Additionally, a geographically isolated population of A. piscivorus occurs at the western limit of the species’ range in the Concho Valley of Texas. To investigate biogeography and population structure within A. piscivorus in Texas and throughout its range, we utilized amplified fragment length polymorphism (AFLP) and sequence data from cytochrome b (cyt-b). The AFLP data indicate a lack of gene flow between the population of A. piscivorus in the Concho Valley and other nearby populations. However, based on cyt-b, there is no genetic differentiation. The AFLP data for the entire species show a signature of two historic populations that have recently come into secondary contact. Finding two historic populations is consistent with previously published data based on mitochondrial DNA analyses; however, due to the rapid evolution rate of AFLP data, we were able to detect a high level of gene flow between these populations. We conclude that it is possible Texas and Florida served as refugia for A. piscivorus during the last glacial maximum, and, as the glaciers receded, the two populations expanded, coming into secondary contact. The subsequent gene flow has resulted in shared loci across the two populations. The difference between the conclusions drawn between our two markers and previous research is due to the different time scales that AFLP and cyt-b markers measure. The AFLP data provided a contemporary marker and cyt-b indicated historic separation. T HE Cottonmouth, Agkistrodon piscivorus, is a semi- aquatic pitviper that occurs in the southeastern United States into Texas (Fig. 1). Within the last 500 years, the western limit of its distribution has been contracting due to the drying and desertification of west Texas (Brune, 1975; Werler and Dixon, 2000). This has led to a geographically isolated peripheral population in the Concho River Valley (Werler and Dixon, 2000). Historically, the species distribution has expanded and contracted due to the advancement and retreat of the Laurentide ice sheet during Pleistocene glaciation (Gloyd and Conant, 1990; Guiher and Burbrink, 2008; Douglas et al., 2009). Previous research, using mitochondrial DNA (mtDNA), has suggested that fluctuations in the distribution resulted in two distinct lineages of Cottonmouths. This hypothesis does not reflect the currently accepted taxonomy that there is one species with three subspecies: Agkistrodon piscivorus piscivorus (Eastern Cottonmouth), A. piscivorus leucostoma (Western Cotton- mouth), and A. piscivorus conanti (Florida Cottonmouth; Gloyd and Conant, 1990; Knight et al., 1992; Castoe and Parkinson, 2006; Fig. 1). Guiher and Burbrink (2008) and Douglas et al. (2009) concluded that additional genetic markers, particularly nuclear loci, were needed before taxonomy can be addressed. Using range-wide sampling with emphasis on populations in Texas, we sought to determine if the remote peripheral population in Texas is genetically isolated and if there are two lineages within A. piscivorus using amplified fragment length polymorphisms (AFLPs) supple- mented with additional mtDNA cyt-b sequences. AFLP markers are advantageous because they are repre- sentative of the nuclear genome and it is easy generate a large number of polymorphic loci with enough power to differentiate populations (Bensch and Akesson, 2005). AFLPs can be applied to populations sampled throughout the range of a species to determine overall population structure. Additionally, AFLPs have been used to differentiate sister taxa and determine relationships among species (Creer et al., 2004; Mendelson and Simons, 2006; Althoff et al., 2007; Makowsky et al., 2009). Another marker that has been used traditionally to distinguish species-level relationships in a variety of taxa is mitochondrial DNA (mtDNA; Rosenberg et al., 2002; Jacobsen et al., 2010). Results from AFLP markers and mtDNA sequence data such as cyt-b have been compared for a variety of taxa. When analyzing small portions of a species’ distribution or examining population structure within an entire species, AFLP markers yield more fine-scale information compared to cyt-b sequence data (Mendelson and Simons, 2006; Egger et al., 2007; Phillips et al., 2007; Garcı ´a-Pereira et al., 2011). Given the geographic isolation of the peripheral Concho Valley population on the western edge of the species’ range, we would expect genetic isolation. Thus, the initial goal of our study was to evaluate the fine-scale population structure in Texas, and we hypothesized that the population in the Concho Valley is genetically distinct and would have a lower level of genetic variation than other populations throughout Texas. The second goal of our study was to test the hypothesis proposed by Guiher and Burbrink (2008) and Douglas et al. (2009) that the Florida population of A. piscivorus is genetically isolated. We expected to see genetic separation between the Florida population and other populations in our sample consistent with the presence of 1 Department of Biology, Angelo State University, 2601 W. Avenue N., San Angelo, Texas 76909; E-mail: (LKA) Loren.Ammerman@ angelo.edu. 2 Department of Biology, University of Central Florida, 4000 Central Florida Blvd., Orlando, Florida 32816; E-mail: (JLS) jason.strickland@ knights.ucf.edu; and (CLP) [email protected]. Send reprint requests to JLS. 3 College of Arts and Sciences, Georgia Southwestern State University, 800 Georgia Southwestern State University Drive, Americus, Georgia 31709; E-mail: [email protected]. Submitted: 5 October 2013. Accepted: 3 June 2014. Associate Editor: D. S. Siegel. F 2014 by the American Society of Ichthyologists and Herpetologists DOI: 10.1643/CG-13-123 Published online: November 19, 2014 Copeia 2014, No. 4, 639–649
-
Upload
southalabama -
Category
Documents
-
view
1 -
download
0
Transcript of Phylogeography of Agkistrodon piscivorus with Emphasis on the Western Limit of Its Range

Phylogeography of Agkistrodon piscivorus with Emphasis on the Western
Limit of Its Range
Jason L. Strickland1,2, Christopher L. Parkinson2, J. Kelly McCoy1,3, andLoren K. Ammerman1
The Cottonmouth, Agkistrodon piscivorus, is a semi-aquatic pitviper that occupies the southeastern U.S. west intoTexas. Several previous studies have investigated the biogeographic history of A. piscivorus. It has been hypothesizedthat A. piscivorus was split into two separate populations during the last glacial maximum and climate change hasimpacted its distribution. Additionally, a geographically isolated population of A. piscivorus occurs at the westernlimit of the species’ range in the Concho Valley of Texas. To investigate biogeography and population structurewithin A. piscivorus in Texas and throughout its range, we utilized amplified fragment length polymorphism (AFLP)and sequence data from cytochrome b (cyt-b). The AFLP data indicate a lack of gene flow between the population ofA. piscivorus in the Concho Valley and other nearby populations. However, based on cyt-b, there is no geneticdifferentiation. The AFLP data for the entire species show a signature of two historic populations that have recentlycome into secondary contact. Finding two historic populations is consistent with previously published data based onmitochondrial DNA analyses; however, due to the rapid evolution rate of AFLP data, we were able to detect a highlevel of gene flow between these populations. We conclude that it is possible Texas and Florida served as refugia forA. piscivorus during the last glacial maximum, and, as the glaciers receded, the two populations expanded, cominginto secondary contact. The subsequent gene flow has resulted in shared loci across the two populations. Thedifference between the conclusions drawn between our two markers and previous research is due to the differenttime scales that AFLP and cyt-b markers measure. The AFLP data provided a contemporary marker and cyt-b indicatedhistoric separation.
THE Cottonmouth, Agkistrodon piscivorus, is a semi-aquatic pitviper that occurs in the southeasternUnited States into Texas (Fig. 1). Within the last
500 years, the western limit of its distribution has beencontracting due to the drying and desertification of westTexas (Brune, 1975; Werler and Dixon, 2000). This has led toa geographically isolated peripheral population in theConcho River Valley (Werler and Dixon, 2000). Historically,the species distribution has expanded and contracted due tothe advancement and retreat of the Laurentide ice sheetduring Pleistocene glaciation (Gloyd and Conant, 1990;Guiher and Burbrink, 2008; Douglas et al., 2009). Previousresearch, using mitochondrial DNA (mtDNA), has suggestedthat fluctuations in the distribution resulted in two distinctlineages of Cottonmouths. This hypothesis does not reflectthe currently accepted taxonomy that there is one specieswith three subspecies: Agkistrodon piscivorus piscivorus (EasternCottonmouth), A. piscivorus leucostoma (Western Cotton-mouth), and A. piscivorus conanti (Florida Cottonmouth;Gloyd and Conant, 1990; Knight et al., 1992; Castoe andParkinson, 2006; Fig. 1). Guiher and Burbrink (2008) andDouglas et al. (2009) concluded that additional geneticmarkers, particularly nuclear loci, were needed beforetaxonomy can be addressed. Using range-wide sampling withemphasis on populations in Texas, we sought to determine ifthe remote peripheral population in Texas is geneticallyisolated and if there are two lineages within A. piscivorus usingamplified fragment length polymorphisms (AFLPs) supple-mented with additional mtDNA cyt-b sequences.
AFLP markers are advantageous because they are repre-sentative of the nuclear genome and it is easy generate a
large number of polymorphic loci with enough power todifferentiate populations (Bensch and Akesson, 2005). AFLPscan be applied to populations sampled throughout therange of a species to determine overall population structure.Additionally, AFLPs have been used to differentiate sistertaxa and determine relationships among species (Creer et al.,2004; Mendelson and Simons, 2006; Althoff et al., 2007;Makowsky et al., 2009). Another marker that has been usedtraditionally to distinguish species-level relationships in avariety of taxa is mitochondrial DNA (mtDNA; Rosenberg etal., 2002; Jacobsen et al., 2010). Results from AFLP markersand mtDNA sequence data such as cyt-b have beencompared for a variety of taxa. When analyzing smallportions of a species’ distribution or examining populationstructure within an entire species, AFLP markers yield morefine-scale information compared to cyt-b sequence data(Mendelson and Simons, 2006; Egger et al., 2007; Phillipset al., 2007; Garcıa-Pereira et al., 2011).
Given the geographic isolation of the peripheral ConchoValley population on the western edge of the species’ range,we would expect genetic isolation. Thus, the initial goal ofour study was to evaluate the fine-scale population structurein Texas, and we hypothesized that the population in theConcho Valley is genetically distinct and would have alower level of genetic variation than other populationsthroughout Texas. The second goal of our study was to testthe hypothesis proposed by Guiher and Burbrink (2008) andDouglas et al. (2009) that the Florida population of A.piscivorus is genetically isolated. We expected to see geneticseparation between the Florida population and otherpopulations in our sample consistent with the presence of
1 Department of Biology, Angelo State University, 2601 W. Avenue N., San Angelo, Texas 76909; E-mail: (LKA) [email protected].
2 Department of Biology, University of Central Florida, 4000 Central Florida Blvd., Orlando, Florida 32816; E-mail: (JLS) [email protected]; and (CLP) [email protected]. Send reprint requests to JLS.
3 College of Arts and Sciences, Georgia Southwestern State University, 800 Georgia Southwestern State University Drive, Americus, Georgia31709; E-mail: [email protected].
Submitted: 5 October 2013. Accepted: 3 June 2014. Associate Editor: D. S. Siegel.F 2014 by the American Society of Ichthyologists and Herpetologists DOI: 10.1643/CG-13-123 Published online: November 19, 2014
Copeia 2014, No. 4, 639–649
two lineages. To test our predictions, we generated AFLPdata for the entire distribution of A. piscivorus and addedmtDNA sequence data to a previously published mtDNAmatrix (Guiher and Burbrink, 2008). We discuss our resultsin the context of the biogeographic history of Texas and thesoutheastern United States as well as to previous studies onAgkistrodon.
MATERIALS AND METHODS
Taxon sampling and DNA extraction.—Through collectionand tissue loans, we sampled 75 A. piscivorus from 24separate localities as our ingroup (Fig. 1; Appendix 1). Wealso sampled 24 A. contortrix, two A. bilineatus, two A. taylori,one Crotalus atrox, and one C. molossus for our analysis asoutgroups (Appendix 1; Castoe and Parkinson, 2006). Forsamples we collected, blood was taken from the caudal veinusing an insulin syringe, and stored in modified Tris-EDTALongmire lysis buffer which increased DNA yield (Longmireet al., 1997; removed NaCl and increased sodium dodecylsulfate from 0.5% to 1.0%.). We deposited voucher speci-mens in the Angelo State Natural History Collection atAngelo State University in San Angelo, Texas (Appendix 1).
We extracted whole genomic DNA using a Qiagen DNAextraction kit (Valencia, CA) following the kit protocol forblood or tissue samples stored in lysis buffer or 95% ethanol.
Amplified fragment length polymorphism (AFLP) protocol.—Wefollowed the AFLP protocols of Phillips et al. (2007) and Leeet al. (2010) based on modifications of Vos et al. (1995) whoinitially described the method. Restriction enzymes (EcoRI,AseI, and TaqI) were used to digest approximately 200 ng ofgenomic DNA into fragments of different lengths. General-ly, only two restriction enzymes are used and all primercombinations are created based on those. In this study, eachsample underwent two separate protocols to increase thenumber of polymorphic loci scored. We used a total of nineprimer combinations in the analyses of A. piscivorus andeight in the analysis with all taxa (Table 1). All reactionsused 20 units of EcoRI (New England Biolabs [NEB], Ipswich,MA). One treatment used 20 units of AseI (NEB) as the
second enzyme and the other treatment used 20 units ofTaqI (NEB) as the second enzyme. For all restrictiondigestions, 1X enzyme buffer was added to the reactionand the restriction digest was placed at 37uC for three hours.Next, 75 pmoles of the appropriate enzyme adapter(Table 1) were ligated to the ends of the fragments thatwere created by the restriction digest using T4 DNA ligaseand 4 mL of 10X ligase buffer (NEB).
The pre-selective PCR decreased the number of fragmentsbecause of an additional base pair on the primer (Table 1).With the additional base, the number of fragments werereduced to approximately 1/16 of those that were initiallycreated in the restriction digest (Meudt and Clarke, 2007).The second PCR, the selective step, lowered the number offragments even more depending on how many bases wereadded to the primer (Table 1). This step also attached afluorescent dye onto each fragment for detection by Beck-man-Coulter CEQ 8000 Genetic Analysis System (Beckman-Coulter, Inc., Fullerton, CA).
Nine primer combinations were used to yield a largenumber of fragments, giving a representative measure ofpolymorphic loci in the genome. Bonin et al. (2007)suggested that at least 200 total fragments be used in anAFLP analysis to show population structure and to getenough polymorphic loci to differentiate populations. Themore total fragments that are scored, the higher theresolution and the better statistical support for analysis(Albertson et al., 1999; Ogden and Thorpe, 2002; Benschand Akesson, 2005). The fragments in the selective PCRreactions were separated by loading 0.8 mL of the reactionwith 0.25 mL of 400 base pair (bp) size standard in theCEQ8000. Fragments greater than 80 bp were scored aspresent (1) or absent (0) using software available on theCEQ8000, which created a binary matrix. Once the initialscoring was complete, fragments were evaluated by eye toensure proper scoring. Any fragments scored inconsistentlyor that were too close to other fragments were removed fromthe analysis, leaving only unambiguous fragments. Allindividuals were scored in random order to minimize biasin results (Bonin et al., 2005, 2007).
Population genetic analysis.—GenAlEx ver. 6.41 was used toanalyze the data and visualize population structure (Peakalland Smouse, 2006). GenAlEx initially created a geneticdistance matrix based on Nei-Li distances from the binarymatrix (Nei and Li, 1979). Both inter- and intraspecific Nei-Li genetic distances were calculated for all four species ofAgkistrodon. That information was used in Principal Coordi-nate Analysis (PCoA) to visualize population divergence(Orloci, 1975). This analysis does not require groupsassigned a priori and makes it possible to examine relation-ships in space (usually two or three dimensional) dependingon how many eigenvectors are used. PCoA was performedfirst on all samples, then on only A. piscivorus, and finally onpopulations of A. piscivorus from Texas to visualize thepattern at different geographic scales. Average heterozygos-ity was calculated for each population using Hickory ver. 1.1which relaxes Hardy-Weinberg assumptions and uses Bayes-ian statistics to calculate heterozygosity from dominantmarkers (Holsinger et al., 2002). The genetic distance matrixwas analyzed via Analysis of Molecular Variance (AMOVA)to compare variation between and within populations todetermine if there was population differentiation. Wecalculated Fpt which is an analogous measure of Fst
Fig. 1. Distribution map of the Cottonmouth, Agkistrodon piscivorus,showing the two current views on its taxonomy. The patterns designatethe subspecies view and the dashed line splits the Florida andcontinental groups discussed in text. Shapes indicate sampling localitiesand correspond to the shapes in Figure 4.
640 Copeia 2014, No. 4
specifically for binary data. Both are measures of geneticdifferentiation between populations (Andrade et al., 2007).The Fpt values were calculated based on 1000 replicates (a 5
0.05). This estimate gave a statistical measure of gene flowamong the populations and made it possible to examinevariation in Agkistrodon.
To test for isolation by distance (IBD), a Mantel test,which is a pairwise comparison to determine correlationbetween geographic and genetic distances, was used toexamine population structure in all A. piscivorus sampled(Mantel, 1967; Jensen et al., 2005). The data matrix wasformatted for the program STRUCTURE ver. 2.3.3 (Pritchardet al., 2000; Falush et al., 2003, 2007) using the programAFLP-SURV ver. 1.0 (Vekemans, 2002). STRUCTURE esti-mated the highest degree of genetic structure between thepopulations and calculated the number of populations (K)in the entire sample based on genetic distance. For theSTRUCTURE analysis, the admixture model was used with aburn in of 30,000 followed by 100,000 iterations. Thisprocess was applied for K values of 1–10 with tenreplications at each K value. The resulting log likelihoodscores were averaged for each K. The admixture model waschosen because we did not want to bias the results towardfinding a lack of gene flow. With the log likelihood scores,
we determined DK and then used that to find the truenumber of groups, K* (Evanno et al., 2005).
To determine the phylogenetic position of A. piscivorus,we created a neighbor joining phylogram from the Nei-Ligenetic distances (Saitou and Nei, 1987) in PAUP* (phylo-genetic analysis using parsimony) ver. 4.0b10 (Swofford,2003). The two rattlesnakes were used as outgroup taxa andnodal support was calculated with 1000 bootstrap pseudo-replicates. Parsimony methods were not used because theyare not appropriate for binary AFLP data according toRobinson and Harris (1999) and Sullivan et al. (2004). ForAFLP analysis, bands may be lost independently in morethan one lineage and could result in poorly resolved trees ifparsimony is used (Dasmahapatra et al., 2009). Moreover,analysis of discrete characters could result in the situationwhere a few markers determine the phylogenetic pattern,whereas the neighbor-joining analysis takes into accountoverall similarity (Dasmahapatra et al., 2009).
DNA sequencing and analysis.—To test for isolation in westTexas and to compare AFLP to mtDNA data, eight cyt-bsequences from A. piscivorus in Texas were generated(GenBank accession KC431019–KC431026) and added tothe previously published tree of Guiher and Burbrink (2008).
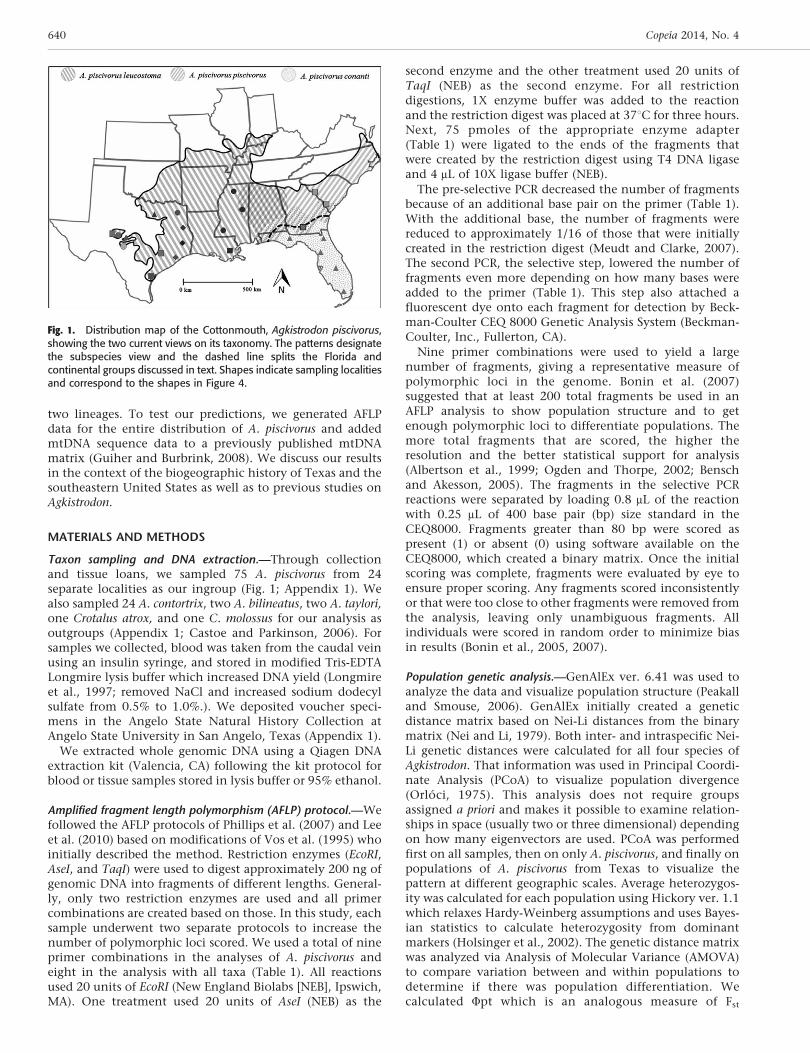
Table 1. List of restriction enzymes, adapters, pre-selective primer, and selective primer sequences for the PCR used in the AFLP analysis ofAgkistrodon piscivorus and outgroup taxa. Asterisk (*) indicates the primer with the fluorescent label attached. Primers used in combination withEcoRI-CAC are indicated with { and those used with EcoRI-CAT are indicated by {. TaqI-TTG was only used in the analysis of A. piscivorus.
Name Sequence
Restriction enzymes
EcoRI 59-- . . . G|AATTC . . . --39
AseI 59-- . . . AT|TAAT . . . --39
TaqI 59-- . . . T|CGA . . . --39
Adapters
EcoRI 59--CTCGTAGACTGCGTACC--39
39--CATCTGACGCATGGTTAA--59
AseI 59--GACGATGAGTCCTGA--39
39--TACTCAGGACTCAT--59
TaqI 59--CGGTCAGGACTCAT--39
39--AGTCCTGAGTAGCAG--59
Pre-selective primers
EcoRI 59--ACTGCGTACCAATTCC--39
AseI 59--GATGAGTCCTGAGTAATT--39
TaqI 59--ATGAGTCCTGACCGAT--39
Selective primers
EcoRI-CAC* 59--ACTGCGTACCAATTCCAC--39
EcoRI-CAT* 59--ACTGCGTACCAATTCCAT--39
AseI-TAG{ 59--GATGAGTCCTGAGTAATTAG--39
AseI-TCC{ 59--GATGAGTCCTGAGTAATTCC--39
AseI-TGA{ 59--GATGAGTCCTGAGTAATTGA--39
AseI-TGC{ 59--GATGAGTCCTGAGTAATTGC--39
AseI-TCT{ 59--GATGAGTCCTGAGTAATTCT--39
AseI-TAT{ 59--GATGAGTCCTGAGTAATTAT--39
TaqI-TCA{ 59--ATGAGTCCTGACCGATCA--39
TaqI-TTC{ 59--ATGAGTCCTGACCGATTC--39
TaqI-TTG{ 59--ATGAGTCCTGACCGATTG--39
Cyt-b sequencing primers (Burbrink et al., 2000)
L14910 (Forward) 59--GACCTGTGATMTGAAAAACCCAYCGTT--39
H16064 (Reverse) 59--CTTTGGTTTACAAGAACAATGCTTTA--39
Strickland et al.—Phylogeography of Cottonmouths 641
These samples included seven individuals from the isolatedpopulation in the Concho Valley and one from south Texas.One additional sequence of A. piscivorus from southernGeorgia and one from South Carolina were also added toensure accuracy of sequence comparison (GenBank acces-sion KC431027 and KC431028). PCR amplification wasaccomplished using primers L14910 and H16064 designedby Burbrink et al. (2000; Table 1), following the protocoldescribed by Castoe and Parkinson (2006). PCR product wassequenced in both directions at Arizona Research Laborato-ries, Division of Biotechnology, University of ArizonaGenetics Core Facility (http://uagc.arl.arizona.edu/). Se-quences were edited using Sequencher ver. 4.2 (Gene Codes)and novel sequences were aligned with those from Guiherand Burbrink (2008; GenBank accession EU483411–EU483493) in GeneDoc ver. 2.7.0 (Nicholas et al., 1997).
To determine phylogenetic position of the samples fromTexas, we used the same parameters for Bayesian inference(BI) as Guiher and Burbrink (2008). For BI, the GTR + I + C
model was used in MrBayes ver. 3.1.2 with defaultparameters (Huelsenbeck and Ronquist, 2001). Chains wererun for 53106 generations with a burn-in period of 53105
generations and sampling every 1000th generation. Tracer v1.4 (Ronquist and Huelsenbeck, 2003) was used to ensurestationarity was reached during the burn-in period.
RESULTS
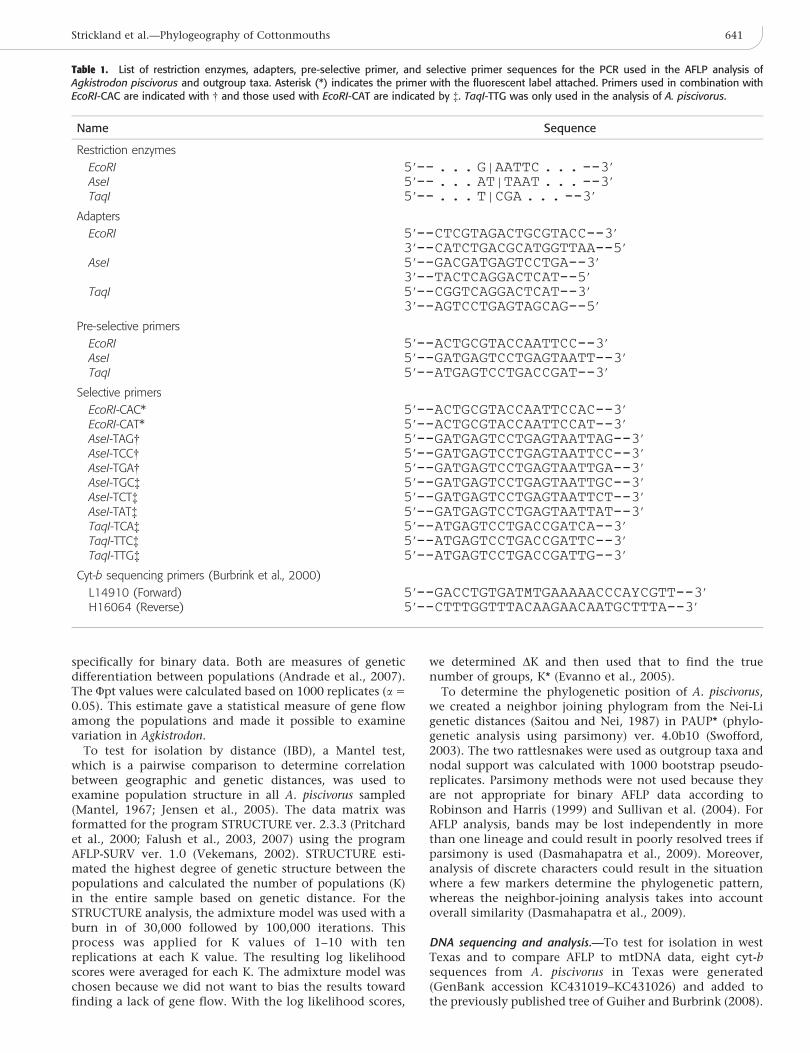
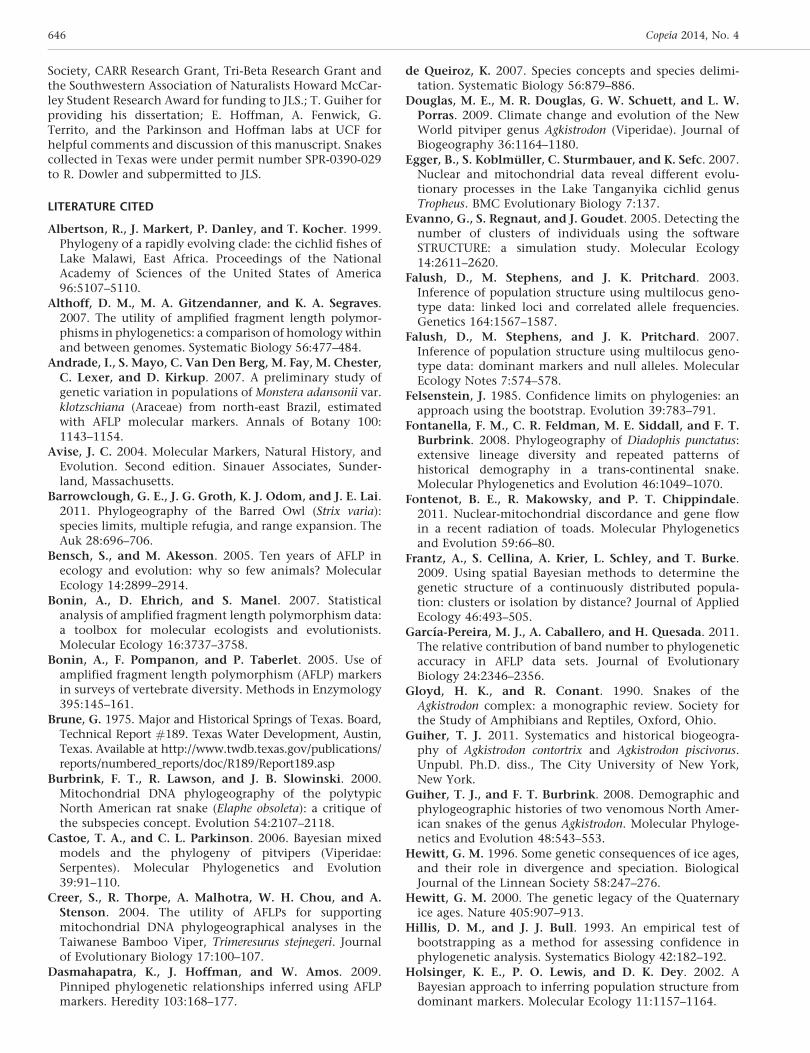
Eight primer combinations were used to create 622 AFLPfragments for all taxa (Table 2). Of these, 498 (80%) werepolymorphic and between 59 and 102 fragments werescored from each primer combination. In the PCoA for all105 individuals, the first three axes explained 83.7% of thevariation (Fig. 2). In this PCoA, the two rattlesnake species(Crotalus) were separated from Agkistrodon along the thirdaxis. Agkistrodon piscivorus had the largest number ofpolymorphic loci (44.5%) which can be visualized by theamount of spread in the A. piscivorus cluster. Agkistrodoncontortrix (32.53%) collected from throughout their rangeand Texas A. piscivorus (31.36%) had a similar level ofpolymorphism as indicated by the similarity in shape oftheir clusters in Figure 2. Because there were only twosamples from each of the two cantils (A. bilineatus and A.taylori), it was not possible to determine the amount ofvariation seen in each of those species. For the neighbor-joining analysis, a 50% majority rule consensus tree wascreated (Fig. 3). Branches with over 70% support wereconsidered to be significantly supported (Felsenstein, 1985;Hillis and Bull, 1993). When Nei-Li genetic distances werecalculated, A. piscivorus had the highest amount of intra-specific variation (6.4%) and the two cantil species had theclosest genetic distance between any two species (9.5%).
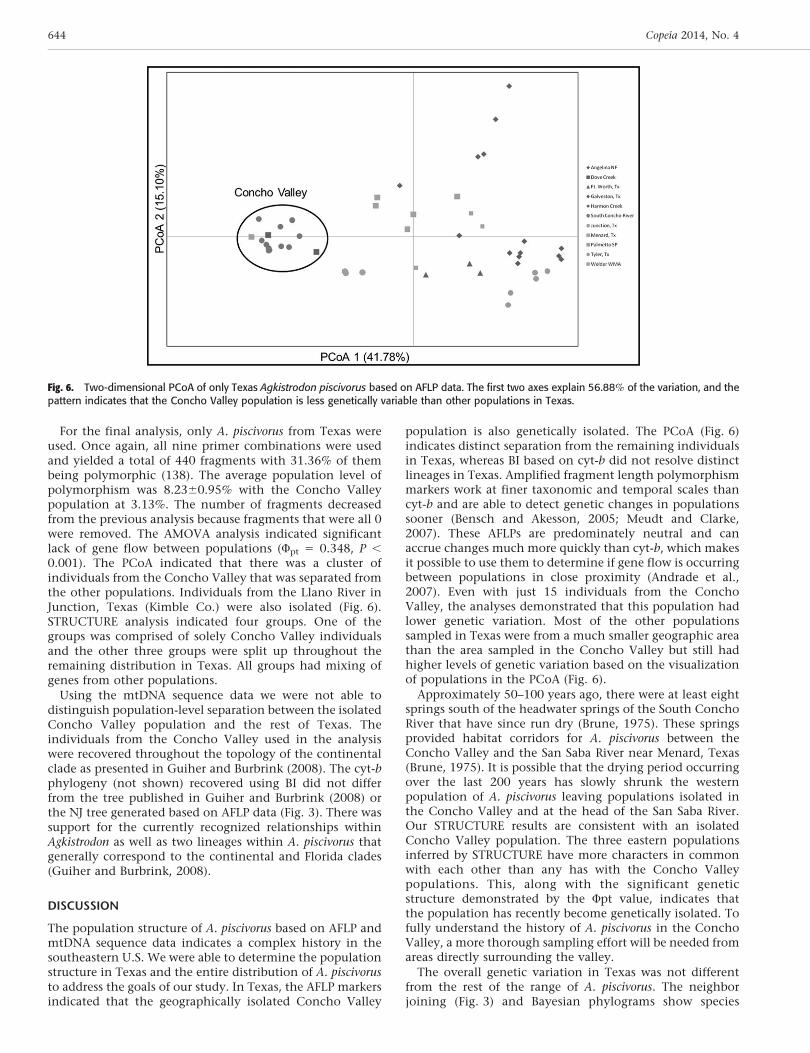
After outgroups were removed, nine primer combinationswere used and all A. piscivorus were analyzed (Table 2). Therewere 479 fragments used in the analysis with 44.9% (215)polymorphic. The average amount of polymorphism withina population was 10.0761.42%. The AMOVA indicated asignificant lack of gene flow among A. piscivorus across theirentire range (Fpt 5 0.466, P , 0.001). For this PCoA, onlythe first two axes were used (73.4% variation explained); thisordination did not show any clustering and there was aneast to west pattern for all A. piscivorus (Fig. 4). The Mantel
Fig. 2. Three-dimensional principal coordinate analysis (PCoA) of allsamples used in the analysis. Rattlesnakes fall out on the third axis awayfrom the four species within Agkistrodon. Ellipses were used to helpdelineate groups.
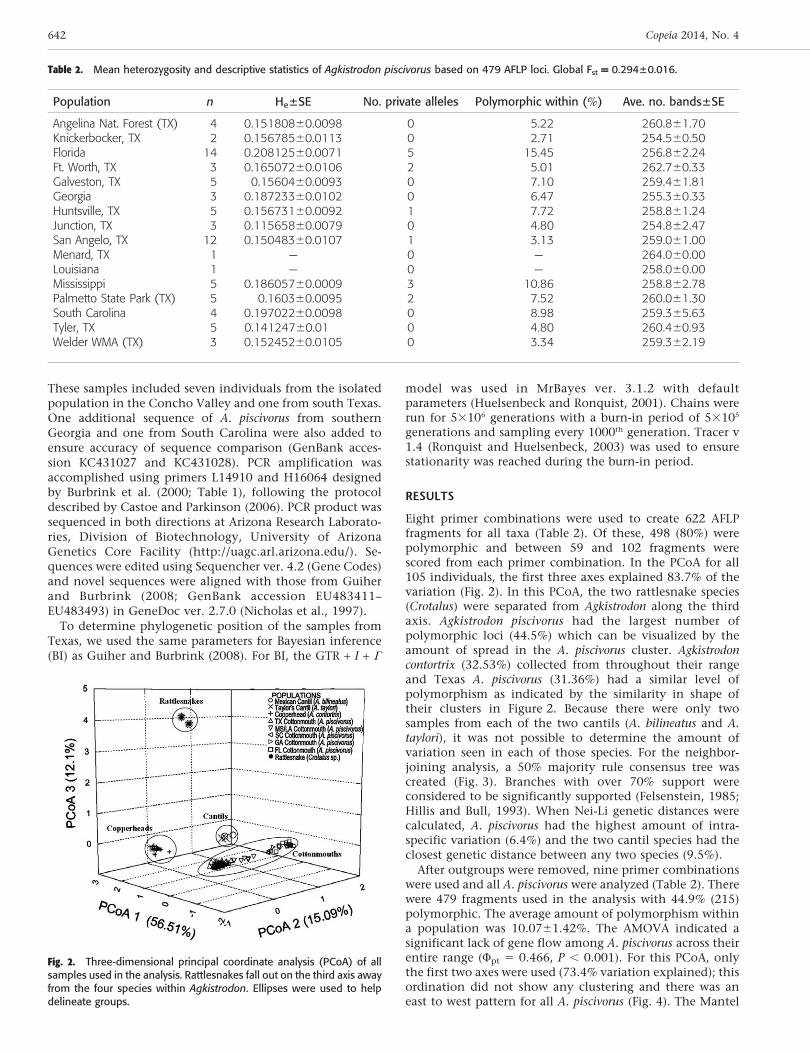
Table 2. Mean heterozygosity and descriptive statistics of Agkistrodon piscivorus based on 479 AFLP loci. Global Fst = 0.294±0.016.
Population n He±SE No. private alleles Polymorphic within (%) Ave. no. bands±SE
Angelina Nat. Forest (TX) 4 0.15180860.0098 0 5.22 260.861.70Knickerbocker, TX 2 0.15678560.0113 0 2.71 254.560.50Florida 14 0.20812560.0071 5 15.45 256.862.24Ft. Worth, TX 3 0.16507260.0106 2 5.01 262.760.33Galveston, TX 5 0.1560460.0093 0 7.10 259.461.81Georgia 3 0.18723360.0102 0 6.47 255.360.33Huntsville, TX 5 0.15673160.0092 1 7.72 258.861.24Junction, TX 3 0.11565860.0079 0 4.80 254.862.47San Angelo, TX 12 0.15048360.0107 1 3.13 259.061.00Menard, TX 1 — 0 — 264.060.00Louisiana 1 — 0 — 258.060.00Mississippi 5 0.18605760.0009 3 10.86 258.862.78Palmetto State Park (TX) 5 0.160360.0095 2 7.52 260.061.30South Carolina 4 0.19702260.0098 0 8.98 259.365.63Tyler, TX 5 0.14124760.01 0 4.80 260.460.93Welder WMA (TX) 3 0.15245260.0105 0 3.34 259.362.19
642 Copeia 2014, No. 4
IBD test indicated that genetic distance was significantlycorrelated with geographic distance (R2 5 0.731, P ,
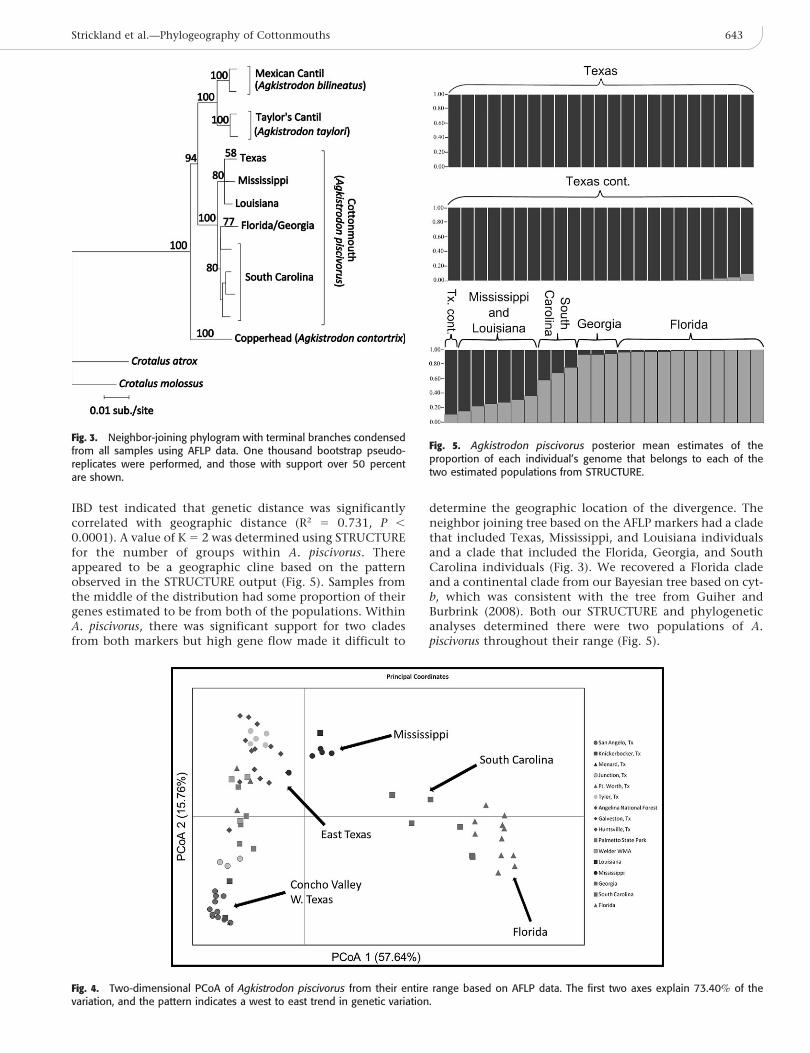
0.0001). A value of K 5 2 was determined using STRUCTUREfor the number of groups within A. piscivorus. Thereappeared to be a geographic cline based on the patternobserved in the STRUCTURE output (Fig. 5). Samples fromthe middle of the distribution had some proportion of theirgenes estimated to be from both of the populations. WithinA. piscivorus, there was significant support for two cladesfrom both markers but high gene flow made it difficult to
determine the geographic location of the divergence. Theneighbor joining tree based on the AFLP markers had a cladethat included Texas, Mississippi, and Louisiana individualsand a clade that included the Florida, Georgia, and SouthCarolina individuals (Fig. 3). We recovered a Florida cladeand a continental clade from our Bayesian tree based on cyt-b, which was consistent with the tree from Guiher andBurbrink (2008). Both our STRUCTURE and phylogeneticanalyses determined there were two populations of A.piscivorus throughout their range (Fig. 5).
Fig. 4. Two-dimensional PCoA of Agkistrodon piscivorus from their entire range based on AFLP data. The first two axes explain 73.40% of thevariation, and the pattern indicates a west to east trend in genetic variation.
Fig. 3. Neighbor-joining phylogram with terminal branches condensedfrom all samples using AFLP data. One thousand bootstrap pseudo-replicates were performed, and those with support over 50 percentare shown.
Fig. 5. Agkistrodon piscivorus posterior mean estimates of theproportion of each individual’s genome that belongs to each of thetwo estimated populations from STRUCTURE.
Strickland et al.—Phylogeography of Cottonmouths 643
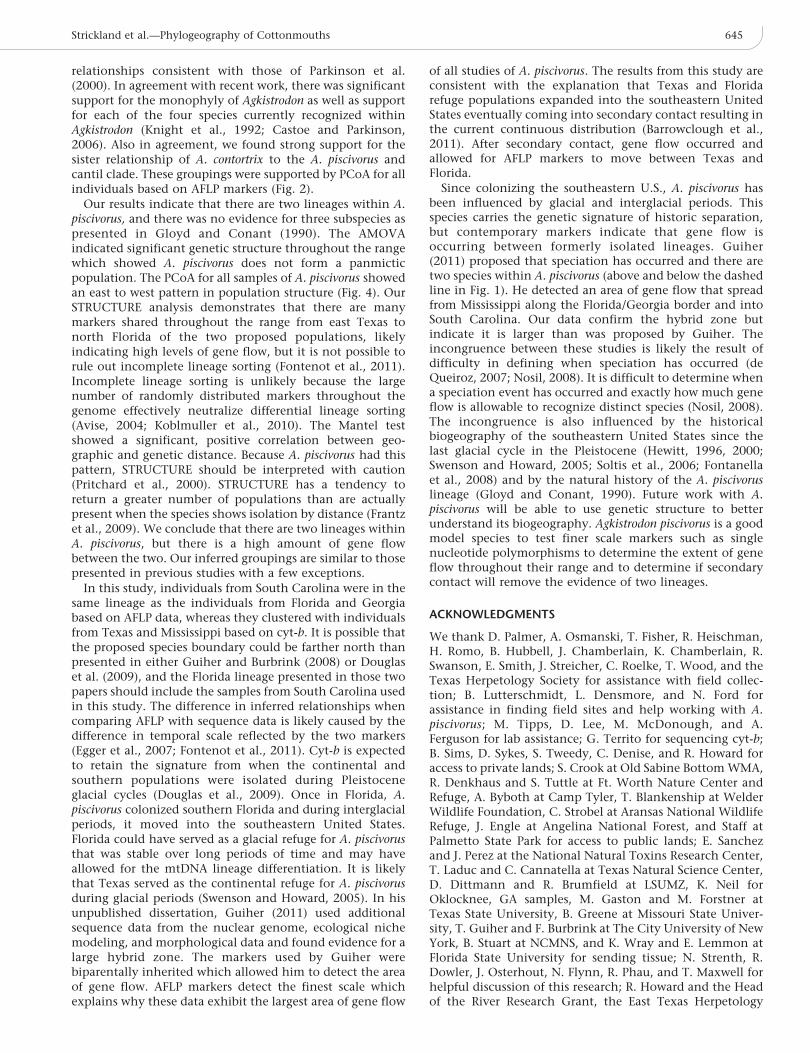
For the final analysis, only A. piscivorus from Texas wereused. Once again, all nine primer combinations were usedand yielded a total of 440 fragments with 31.36% of thembeing polymorphic (138). The average population level ofpolymorphism was 8.2360.95% with the Concho Valleypopulation at 3.13%. The number of fragments decreasedfrom the previous analysis because fragments that were all 0were removed. The AMOVA analysis indicated significantlack of gene flow between populations (Fpt 5 0.348, P ,
0.001). The PCoA indicated that there was a cluster ofindividuals from the Concho Valley that was separated fromthe other populations. Individuals from the Llano River inJunction, Texas (Kimble Co.) were also isolated (Fig. 6).STRUCTURE analysis indicated four groups. One of thegroups was comprised of solely Concho Valley individualsand the other three groups were split up throughout theremaining distribution in Texas. All groups had mixing ofgenes from other populations.
Using the mtDNA sequence data we were not able todistinguish population-level separation between the isolatedConcho Valley population and the rest of Texas. Theindividuals from the Concho Valley used in the analysiswere recovered throughout the topology of the continentalclade as presented in Guiher and Burbrink (2008). The cyt-bphylogeny (not shown) recovered using BI did not differfrom the tree published in Guiher and Burbrink (2008) orthe NJ tree generated based on AFLP data (Fig. 3). There wassupport for the currently recognized relationships withinAgkistrodon as well as two lineages within A. piscivorus thatgenerally correspond to the continental and Florida clades(Guiher and Burbrink, 2008).
DISCUSSION
The population structure of A. piscivorus based on AFLP andmtDNA sequence data indicates a complex history in thesoutheastern U.S. We were able to determine the populationstructure in Texas and the entire distribution of A. piscivorusto address the goals of our study. In Texas, the AFLP markersindicated that the geographically isolated Concho Valley
population is also genetically isolated. The PCoA (Fig. 6)indicates distinct separation from the remaining individualsin Texas, whereas BI based on cyt-b did not resolve distinctlineages in Texas. Amplified fragment length polymorphismmarkers work at finer taxonomic and temporal scales thancyt-b and are able to detect genetic changes in populationssooner (Bensch and Akesson, 2005; Meudt and Clarke,2007). These AFLPs are predominately neutral and canaccrue changes much more quickly than cyt-b, which makesit possible to use them to determine if gene flow is occurringbetween populations in close proximity (Andrade et al.,2007). Even with just 15 individuals from the ConchoValley, the analyses demonstrated that this population hadlower genetic variation. Most of the other populationssampled in Texas were from a much smaller geographic areathan the area sampled in the Concho Valley but still hadhigher levels of genetic variation based on the visualizationof populations in the PCoA (Fig. 6).
Approximately 50–100 years ago, there were at least eightsprings south of the headwater springs of the South ConchoRiver that have since run dry (Brune, 1975). These springsprovided habitat corridors for A. piscivorus between theConcho Valley and the San Saba River near Menard, Texas(Brune, 1975). It is possible that the drying period occurringover the last 200 years has slowly shrunk the westernpopulation of A. piscivorus leaving populations isolated inthe Concho Valley and at the head of the San Saba River.Our STRUCTURE results are consistent with an isolatedConcho Valley population. The three eastern populationsinferred by STRUCTURE have more characters in commonwith each other than any has with the Concho Valleypopulations. This, along with the significant geneticstructure demonstrated by the Fpt value, indicates thatthe population has recently become genetically isolated. Tofully understand the history of A. piscivorus in the ConchoValley, a more thorough sampling effort will be needed fromareas directly surrounding the valley.
The overall genetic variation in Texas was not differentfrom the rest of the range of A. piscivorus. The neighborjoining (Fig. 3) and Bayesian phylograms show species
Fig. 6. Two-dimensional PCoA of only Texas Agkistrodon piscivorus based on AFLP data. The first two axes explain 56.88% of the variation, and thepattern indicates that the Concho Valley population is less genetically variable than other populations in Texas.
644 Copeia 2014, No. 4
relationships consistent with those of Parkinson et al.(2000). In agreement with recent work, there was significantsupport for the monophyly of Agkistrodon as well as supportfor each of the four species currently recognized withinAgkistrodon (Knight et al., 1992; Castoe and Parkinson,2006). Also in agreement, we found strong support for thesister relationship of A. contortrix to the A. piscivorus andcantil clade. These groupings were supported by PCoA for allindividuals based on AFLP markers (Fig. 2).
Our results indicate that there are two lineages within A.piscivorus, and there was no evidence for three subspecies aspresented in Gloyd and Conant (1990). The AMOVAindicated significant genetic structure throughout the rangewhich showed A. piscivorus does not form a panmicticpopulation. The PCoA for all samples of A. piscivorus showedan east to west pattern in population structure (Fig. 4). OurSTRUCTURE analysis demonstrates that there are manymarkers shared throughout the range from east Texas tonorth Florida of the two proposed populations, likelyindicating high levels of gene flow, but it is not possible torule out incomplete lineage sorting (Fontenot et al., 2011).Incomplete lineage sorting is unlikely because the largenumber of randomly distributed markers throughout thegenome effectively neutralize differential lineage sorting(Avise, 2004; Koblmuller et al., 2010). The Mantel testshowed a significant, positive correlation between geo-graphic and genetic distance. Because A. piscivorus had thispattern, STRUCTURE should be interpreted with caution(Pritchard et al., 2000). STRUCTURE has a tendency toreturn a greater number of populations than are actuallypresent when the species shows isolation by distance (Frantzet al., 2009). We conclude that there are two lineages withinA. piscivorus, but there is a high amount of gene flowbetween the two. Our inferred groupings are similar to thosepresented in previous studies with a few exceptions.
In this study, individuals from South Carolina were in thesame lineage as the individuals from Florida and Georgiabased on AFLP data, whereas they clustered with individualsfrom Texas and Mississippi based on cyt-b. It is possible thatthe proposed species boundary could be farther north thanpresented in either Guiher and Burbrink (2008) or Douglaset al. (2009), and the Florida lineage presented in those twopapers should include the samples from South Carolina usedin this study. The difference in inferred relationships whencomparing AFLP with sequence data is likely caused by thedifference in temporal scale reflected by the two markers(Egger et al., 2007; Fontenot et al., 2011). Cyt-b is expectedto retain the signature from when the continental andsouthern populations were isolated during Pleistoceneglacial cycles (Douglas et al., 2009). Once in Florida, A.piscivorus colonized southern Florida and during interglacialperiods, it moved into the southeastern United States.Florida could have served as a glacial refuge for A. piscivorusthat was stable over long periods of time and may haveallowed for the mtDNA lineage differentiation. It is likelythat Texas served as the continental refuge for A. piscivorusduring glacial periods (Swenson and Howard, 2005). In hisunpublished dissertation, Guiher (2011) used additionalsequence data from the nuclear genome, ecological nichemodeling, and morphological data and found evidence for alarge hybrid zone. The markers used by Guiher werebiparentally inherited which allowed him to detect the areaof gene flow. AFLP markers detect the finest scale whichexplains why these data exhibit the largest area of gene flow
of all studies of A. piscivorus. The results from this study areconsistent with the explanation that Texas and Floridarefuge populations expanded into the southeastern UnitedStates eventually coming into secondary contact resulting inthe current continuous distribution (Barrowclough et al.,2011). After secondary contact, gene flow occurred andallowed for AFLP markers to move between Texas andFlorida.
Since colonizing the southeastern U.S., A. piscivorus hasbeen influenced by glacial and interglacial periods. Thisspecies carries the genetic signature of historic separation,but contemporary markers indicate that gene flow isoccurring between formerly isolated lineages. Guiher(2011) proposed that speciation has occurred and there aretwo species within A. piscivorus (above and below the dashedline in Fig. 1). He detected an area of gene flow that spreadfrom Mississippi along the Florida/Georgia border and intoSouth Carolina. Our data confirm the hybrid zone butindicate it is larger than was proposed by Guiher. Theincongruence between these studies is likely the result ofdifficulty in defining when speciation has occurred (deQueiroz, 2007; Nosil, 2008). It is difficult to determine whena speciation event has occurred and exactly how much geneflow is allowable to recognize distinct species (Nosil, 2008).The incongruence is also influenced by the historicalbiogeography of the southeastern United States since thelast glacial cycle in the Pleistocene (Hewitt, 1996, 2000;Swenson and Howard, 2005; Soltis et al., 2006; Fontanellaet al., 2008) and by the natural history of the A. piscivoruslineage (Gloyd and Conant, 1990). Future work with A.piscivorus will be able to use genetic structure to betterunderstand its biogeography. Agkistrodon piscivorus is a goodmodel species to test finer scale markers such as singlenucleotide polymorphisms to determine the extent of geneflow throughout their range and to determine if secondarycontact will remove the evidence of two lineages.
ACKNOWLEDGMENTS
We thank D. Palmer, A. Osmanski, T. Fisher, R. Heischman,H. Romo, B. Hubbell, J. Chamberlain, K. Chamberlain, R.Swanson, E. Smith, J. Streicher, C. Roelke, T. Wood, and theTexas Herpetology Society for assistance with field collec-tion; B. Lutterschmidt, L. Densmore, and N. Ford forassistance in finding field sites and help working with A.piscivorus; M. Tipps, D. Lee, M. McDonough, and A.Ferguson for lab assistance; G. Territo for sequencing cyt-b;B. Sims, D. Sykes, S. Tweedy, C. Denise, and R. Howard foraccess to private lands; S. Crook at Old Sabine Bottom WMA,R. Denkhaus and S. Tuttle at Ft. Worth Nature Center andRefuge, A. Byboth at Camp Tyler, T. Blankenship at WelderWildlife Foundation, C. Strobel at Aransas National WildlifeRefuge, J. Engle at Angelina National Forest, and Staff atPalmetto State Park for access to public lands; E. Sanchezand J. Perez at the National Natural Toxins Research Center,T. Laduc and C. Cannatella at Texas Natural Science Center,D. Dittmann and R. Brumfield at LSUMZ, K. Neil forOklocknee, GA samples, M. Gaston and M. Forstner atTexas State University, B. Greene at Missouri State Univer-sity, T. Guiher and F. Burbrink at The City University of NewYork, B. Stuart at NCMNS, and K. Wray and E. Lemmon atFlorida State University for sending tissue; N. Strenth, R.Dowler, J. Osterhout, N. Flynn, R. Phau, and T. Maxwell forhelpful discussion of this research; R. Howard and the Headof the River Research Grant, the East Texas Herpetology
Strickland et al.—Phylogeography of Cottonmouths 645
Society, CARR Research Grant, Tri-Beta Research Grant andthe Southwestern Association of Naturalists Howard McCar-ley Student Research Award for funding to JLS.; T. Guiher forproviding his dissertation; E. Hoffman, A. Fenwick, G.Territo, and the Parkinson and Hoffman labs at UCF forhelpful comments and discussion of this manuscript. Snakescollected in Texas were under permit number SPR-0390-029to R. Dowler and subpermitted to JLS.
LITERATURE CITED
Albertson, R., J. Markert, P. Danley, and T. Kocher. 1999.Phylogeny of a rapidly evolving clade: the cichlid fishes ofLake Malawi, East Africa. Proceedings of the NationalAcademy of Sciences of the United States of America96:5107–5110.
Althoff, D. M., M. A. Gitzendanner, and K. A. Segraves.2007. The utility of amplified fragment length polymor-phisms in phylogenetics: a comparison of homology withinand between genomes. Systematic Biology 56:477–484.
Andrade, I., S. Mayo, C. Van Den Berg, M. Fay, M. Chester,C. Lexer, and D. Kirkup. 2007. A preliminary study ofgenetic variation in populations of Monstera adansonii var.klotzschiana (Araceae) from north-east Brazil, estimatedwith AFLP molecular markers. Annals of Botany 100:1143–1154.
Avise, J. C. 2004. Molecular Markers, Natural History, andEvolution. Second edition. Sinauer Associates, Sunder-land, Massachusetts.
Barrowclough, G. E., J. G. Groth, K. J. Odom, and J. E. Lai.2011. Phylogeography of the Barred Owl (Strix varia):species limits, multiple refugia, and range expansion. TheAuk 28:696–706.
Bensch, S., and M. Akesson. 2005. Ten years of AFLP inecology and evolution: why so few animals? MolecularEcology 14:2899–2914.
Bonin, A., D. Ehrich, and S. Manel. 2007. Statisticalanalysis of amplified fragment length polymorphism data:a toolbox for molecular ecologists and evolutionists.Molecular Ecology 16:3737–3758.
Bonin, A., F. Pompanon, and P. Taberlet. 2005. Use ofamplified fragment length polymorphism (AFLP) markersin surveys of vertebrate diversity. Methods in Enzymology395:145–161.
Brune, G. 1975. Major and Historical Springs of Texas. Board,Technical Report #189. Texas Water Development, Austin,Texas. Available at http://www.twdb.texas.gov/publications/reports/numbered_reports/doc/R189/Report189.asp
Burbrink, F. T., R. Lawson, and J. B. Slowinski. 2000.Mitochondrial DNA phylogeography of the polytypicNorth American rat snake (Elaphe obsoleta): a critique ofthe subspecies concept. Evolution 54:2107–2118.
Castoe, T. A., and C. L. Parkinson. 2006. Bayesian mixedmodels and the phylogeny of pitvipers (Viperidae:Serpentes). Molecular Phylogenetics and Evolution39:91–110.
Creer, S., R. Thorpe, A. Malhotra, W. H. Chou, and A.Stenson. 2004. The utility of AFLPs for supportingmitochondrial DNA phylogeographical analyses in theTaiwanese Bamboo Viper, Trimeresurus stejnegeri. Journalof Evolutionary Biology 17:100–107.
Dasmahapatra, K., J. Hoffman, and W. Amos. 2009.Pinniped phylogenetic relationships inferred using AFLPmarkers. Heredity 103:168–177.
de Queiroz, K. 2007. Species concepts and species delimi-tation. Systematic Biology 56:879–886.
Douglas, M. E., M. R. Douglas, G. W. Schuett, and L. W.Porras. 2009. Climate change and evolution of the NewWorld pitviper genus Agkistrodon (Viperidae). Journal ofBiogeography 36:1164–1180.
Egger, B., S. Koblmuller, C. Sturmbauer, and K. Sefc. 2007.Nuclear and mitochondrial data reveal different evolu-tionary processes in the Lake Tanganyika cichlid genusTropheus. BMC Evolutionary Biology 7:137.
Evanno, G., S. Regnaut, and J. Goudet. 2005. Detecting thenumber of clusters of individuals using the softwareSTRUCTURE: a simulation study. Molecular Ecology14:2611–2620.
Falush, D., M. Stephens, and J. K. Pritchard. 2003.Inference of population structure using multilocus geno-type data: linked loci and correlated allele frequencies.Genetics 164:1567–1587.
Falush, D., M. Stephens, and J. K. Pritchard. 2007.Inference of population structure using multilocus geno-type data: dominant markers and null alleles. MolecularEcology Notes 7:574–578.
Felsenstein, J. 1985. Confidence limits on phylogenies: anapproach using the bootstrap. Evolution 39:783–791.
Fontanella, F. M., C. R. Feldman, M. E. Siddall, and F. T.Burbrink. 2008. Phylogeography of Diadophis punctatus:extensive lineage diversity and repeated patterns ofhistorical demography in a trans-continental snake.Molecular Phylogenetics and Evolution 46:1049–1070.
Fontenot, B. E., R. Makowsky, and P. T. Chippindale.2011. Nuclear-mitochondrial discordance and gene flowin a recent radiation of toads. Molecular Phylogeneticsand Evolution 59:66–80.
Frantz, A., S. Cellina, A. Krier, L. Schley, and T. Burke.2009. Using spatial Bayesian methods to determine thegenetic structure of a continuously distributed popula-tion: clusters or isolation by distance? Journal of AppliedEcology 46:493–505.
Garcıa-Pereira, M. J., A. Caballero, and H. Quesada. 2011.The relative contribution of band number to phylogeneticaccuracy in AFLP data sets. Journal of EvolutionaryBiology 24:2346–2356.
Gloyd, H. K., and R. Conant. 1990. Snakes of theAgkistrodon complex: a monographic review. Society forthe Study of Amphibians and Reptiles, Oxford, Ohio.
Guiher, T. J. 2011. Systematics and historical biogeogra-phy of Agkistrodon contortrix and Agkistrodon piscivorus.Unpubl. Ph.D. diss., The City University of New York,New York.
Guiher, T. J., and F. T. Burbrink. 2008. Demographic andphylogeographic histories of two venomous North Amer-ican snakes of the genus Agkistrodon. Molecular Phyloge-netics and Evolution 48:543–553.
Hewitt, G. M. 1996. Some genetic consequences of ice ages,and their role in divergence and speciation. BiologicalJournal of the Linnean Society 58:247–276.
Hewitt, G. M. 2000. The genetic legacy of the Quaternaryice ages. Nature 405:907–913.
Hillis, D. M., and J. J. Bull. 1993. An empirical test ofbootstrapping as a method for assessing confidence inphylogenetic analysis. Systematics Biology 42:182–192.
Holsinger, K. E., P. O. Lewis, and D. K. Dey. 2002. ABayesian approach to inferring population structure fromdominant markers. Molecular Ecology 11:1157–1164.
646 Copeia 2014, No. 4

Huelsenbeck, J. P., and F. Ronquist. 2001. MRBAYES:Bayesian inference of phylogenetic trees. Bioinformatics17:754–755.
Jacobsen, F., N. R. Friedman, and K. E. Omland. 2010.Congruence between nuclear and mitochondrial DNA:combination of multiple nuclear introns resolves a well-supported phylogeny of New World Orioles (Icterus).Molecular Phylogenetics and Evolution 56:419–427.
Jensen, J. L., A. J. Bohonak, and S. T. Kelley. 2005.Isolation by distance, web service. BMC Genetics 6:13 ver.3.15 Available at http://ibdws.sdsu.edu/. Archived byWebCite at http://www.webcitation.org/6E07xm29k on28 January 2013.
Knight, A., L. D. Densmore, and E. D. Rael. 1992.Molecular systematics of the Agkistrodon complex,p. 49–69. In: Biology of the Pitvipers. J. A.Campbell andE. D. Brodie, Jr. (eds.). Selva, Tyler, Texas.
Koblmuller, S., B. Egger, C. Sturmbauer, and K. M. Sefc.2010. Rapid radiation, ancient incomplete lineage sortingand ancient hybridization in the endemic Lake Tangan-yika cichlid tribe Tropheini. Molecular Phylogenetics andEvolution 55:318–334.
Lee, D. N., R. S. Pfau, and L. K. Ammerman. 2010.Taxonomic status of the Davis Mountains Cottontail,Sylvilagus robustus, revealed by amplified fragment lengthpolymorphism. Journal of Mammalogy 91:1473–1483.
Longmire, J. L., M. Maltbie, and R. J. Baker. 1997. Use of‘‘lysis buffer’’ in DNA isolation and its implications formuseum collections. Occasional Papers 163, Museum ofTexas Tech University.
Makowsky, R., J. Chesser, and L. J. Rissler. 2009. A strikinglack of genetic diversity across the wide-ranging amphib-ian Gastrophryne carolinensis (Anura: Microhylidae). Ge-netica 135:169–183.
Mantel, N. 1967. The detection of disease clustering and ageneralized regression approach. Cancer Research 27:209.
Mendelson, T. C., and J. N. Simons. 2006. AFLPs resolvecytonuclear discordance and increase resolution amongBarcheek Darters (Percidae: Etheostoma: Catonotus). Mo-lecular Phylogenetics and Evolution 41:445–453.
Meudt, H. M., and A. C. Clarke. 2007. Almost forgotten orlatest practice? AFLP applications, analyses and advances.Trends in Plant Science 12:106–117.
Nei, M., and W. H. Li. 1979. Mathematical model forstudying genetic variation in terms of restriction endonu-cleases. Proceedings of the National Academy of Sciencesof the United States of America 76:5269–5273.
Nicholas, K. B., H. B. Nicholas, Jr., and D. W. Deerfield, II.1997. GeneDoc: analysis and visualization of geneticvariation. EMBNEW. NEWS 4:14. Available at http://www.nrbsc.org/gfx/genedoc/ Archived by WebCite athttp://www.webcitation.org/6DNViNfqT on 2 January2013.
Nosil, P. 2008. Speciation with gene flow could be common.Molecular Ecology 17:2103–2106.
Ogden, R., and R. Thorpe. 2002. The usefulness ofamplified fragment length polymorphism markers fortaxon discrimination across graduated fine evolutionarylevels in Caribbean Anolis lizards. Molecular Ecology11:437–445.
Orloci, L. 1975. Multivariate Analysis in Vegetation Re-search. Second edition. Junk, The Hague.
Parkinson, C. L., K. R. Zamudio, and H. W. Greene. 2000.Phylogeography of the pitviper clade Agkistrodon: histor-ical ecology, species status, and conservation of Cantils.Molecular Ecology 9:411–420.
Peakall, R., and P. E. Smouse. 2006. GENALEX 6: geneticanalysis in Excel. Population genetic software for teachingand research. Molecular Ecology Notes 6:288–295.
Phillips, C. D., C. A. Henard, and R. S. Pfau. 2007.Amplified fragment length polymorphism and mitochon-drial DNA analyses reveal patterns of divergence andhybridization in the Hispid Cotton Rat (Sigmodon hispi-dus). Journal of Mammalogy 88:351–359.
Pritchard, J. K., M. Stephens, and P. Donnelly. 2000.Inference of population structure using multilocus geno-type data. Genetics 155:945.
Robinson, J. P., and S. A. Harris. 1999. Amplified fragmentlength polymorphisms and microsatellites: a phylogeneticperspective. In: Which DNA Marker for Which Purpose?Final Compendium of the Research Project Development,optimisation and validation of molecular tools forassessment of biodiversity in forest trees in the EuropeanUnion DGXII Biotechnology FW IV Research ProgrammeMolecular Tools for Biodiversity. E. M. Gillet (ed.).Germany. Available at http://webdoc.sub.gwdg.de/ebook/y/1999/whichmarker/index.htm. Archived by WebCite athttp://www.webcitation.org/6DNWI71ED.
Ronquist, F., and J. P. Huelsenbeck. 2003. MrBayes 3:Bayesian phylogenetic inference under mixed models.Bioinformatics 19:1572–1574.
Rosenberg, N. A., J. K. Pritchard, J. L. Weber, H. M. Cann,K. K. Kidd, L. A. Zhivotovsky, and M. W. Feldman. 2002.Genetic structure of human populations. Science 298:2381–2385.
Saitou, N., and M. Nei. 1987. The neighbor-joining method:a new method for reconstructing phylogenetic trees.Molecular Biology and Evolution 4:406–425.
Soltis, D. E., A. B. Morris, J. S. Mclachlan, P. S. Manos,and P. S. Soltis. 2006. Comparative phylogeography ofunglaciated eastern North America. Molecular Ecology15:4261–4293.
Sullivan, J. P., S. Lavoue, M. E. Arnegard, and C. D.Hopkins. 2004. AFLPs resolve phylogeny and revealmitochondrial introgression within a species flock ofAfrican electric fish (Mormyroidea: Teleostei). Evolution58:825–841.
Swenson, N. G., and D. J. Howard. 2005. Clustering ofcontact zones, hybrid zones, and phylogeographic breaksin North America. The American Naturalist 166:581–591.
Swofford, D. L. 2003. PAUP*. Phylogenetic analysis usingparsimony (*and other methods). Version 4. SinauerAssociates, Sunderland, Massachusetts.
Vekemans, X. 2002. AFLP-surv version 1.0. Distributed bythe author. Laboratoire de Genetique et Ecologie Vegetale,Universite Libre de Bruxelles, Belgium. Available at http://www.ulb.ac.be/sciences/lagev/aflp-surv.html.
Vos, P., R. Hogers, M. Bleeker, M. Reijans, T. Van De Lee,M. Hornes, A. Freiters, J. Pot, J. Peleman, M. Kuiper,and M. Zabeau. 1995. AFLP: a new concept for DNAfingerprinting. Nucleic Acids Research 23:4407–4414.
Werler, J. E., and J. R. Dixon. 2000. Texas Snakes:Identification, Distribution, and Natural History. Univer-sity of Texas Press, Austin, Texas.
Strickland et al.—Phylogeography of Cottonmouths 647
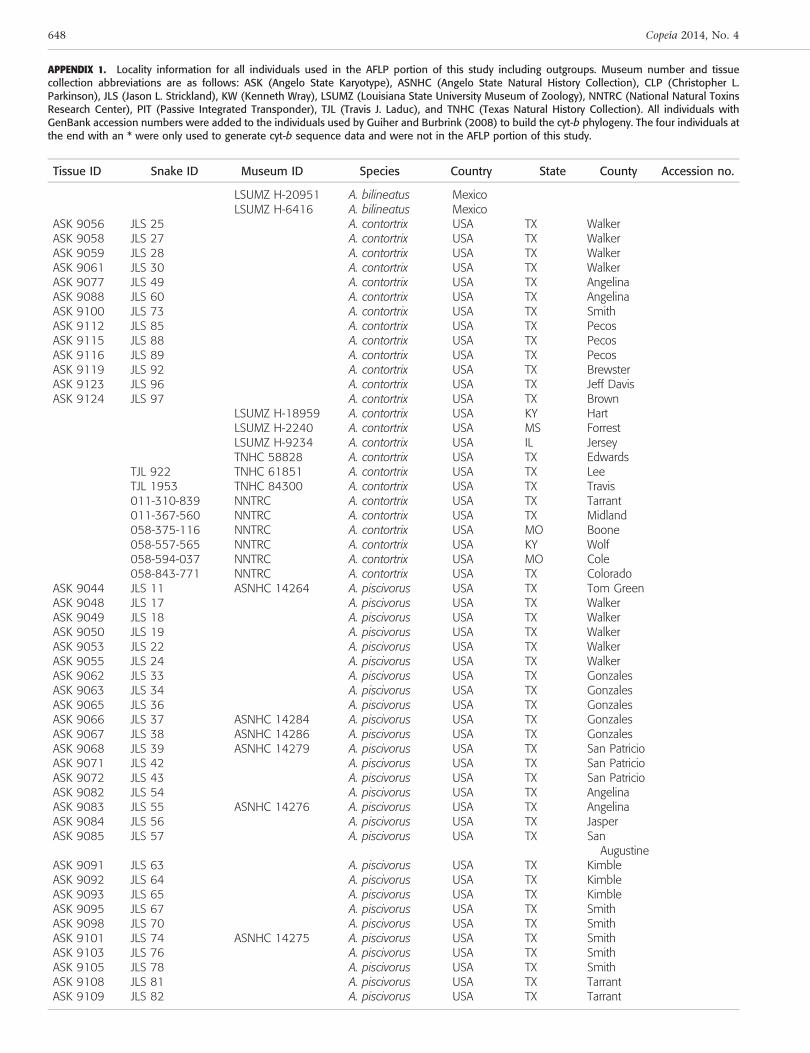
APPENDIX 1. Locality information for all individuals used in the AFLP portion of this study including outgroups. Museum number and tissuecollection abbreviations are as follows: ASK (Angelo State Karyotype), ASNHC (Angelo State Natural History Collection), CLP (Christopher L.Parkinson), JLS (Jason L. Strickland), KW (Kenneth Wray), LSUMZ (Louisiana State University Museum of Zoology), NNTRC (National Natural ToxinsResearch Center), PIT (Passive Integrated Transponder), TJL (Travis J. Laduc), and TNHC (Texas Natural History Collection). All individuals withGenBank accession numbers were added to the individuals used by Guiher and Burbrink (2008) to build the cyt-b phylogeny. The four individuals atthe end with an * were only used to generate cyt-b sequence data and were not in the AFLP portion of this study.
Tissue ID Snake ID Museum ID Species Country State County Accession no.
LSUMZ H-20951 A. bilineatus MexicoLSUMZ H-6416 A. bilineatus Mexico
ASK 9056 JLS 25 A. contortrix USA TX WalkerASK 9058 JLS 27 A. contortrix USA TX WalkerASK 9059 JLS 28 A. contortrix USA TX WalkerASK 9061 JLS 30 A. contortrix USA TX WalkerASK 9077 JLS 49 A. contortrix USA TX AngelinaASK 9088 JLS 60 A. contortrix USA TX AngelinaASK 9100 JLS 73 A. contortrix USA TX SmithASK 9112 JLS 85 A. contortrix USA TX PecosASK 9115 JLS 88 A. contortrix USA TX PecosASK 9116 JLS 89 A. contortrix USA TX PecosASK 9119 JLS 92 A. contortrix USA TX BrewsterASK 9123 JLS 96 A. contortrix USA TX Jeff DavisASK 9124 JLS 97 A. contortrix USA TX Brown
LSUMZ H-18959 A. contortrix USA KY HartLSUMZ H-2240 A. contortrix USA MS ForrestLSUMZ H-9234 A. contortrix USA IL JerseyTNHC 58828 A. contortrix USA TX Edwards
TJL 922 TNHC 61851 A. contortrix USA TX LeeTJL 1953 TNHC 84300 A. contortrix USA TX Travis011-310-839 NNTRC A. contortrix USA TX Tarrant011-367-560 NNTRC A. contortrix USA TX Midland058-375-116 NNTRC A. contortrix USA MO Boone058-557-565 NNTRC A. contortrix USA KY Wolf058-594-037 NNTRC A. contortrix USA MO Cole058-843-771 NNTRC A. contortrix USA TX Colorado
ASK 9044 JLS 11 ASNHC 14264 A. piscivorus USA TX Tom GreenASK 9048 JLS 17 A. piscivorus USA TX WalkerASK 9049 JLS 18 A. piscivorus USA TX WalkerASK 9050 JLS 19 A. piscivorus USA TX WalkerASK 9053 JLS 22 A. piscivorus USA TX WalkerASK 9055 JLS 24 A. piscivorus USA TX WalkerASK 9062 JLS 33 A. piscivorus USA TX GonzalesASK 9063 JLS 34 A. piscivorus USA TX GonzalesASK 9065 JLS 36 A. piscivorus USA TX GonzalesASK 9066 JLS 37 ASNHC 14284 A. piscivorus USA TX GonzalesASK 9067 JLS 38 ASNHC 14286 A. piscivorus USA TX GonzalesASK 9068 JLS 39 ASNHC 14279 A. piscivorus USA TX San PatricioASK 9071 JLS 42 A. piscivorus USA TX San PatricioASK 9072 JLS 43 A. piscivorus USA TX San PatricioASK 9082 JLS 54 A. piscivorus USA TX AngelinaASK 9083 JLS 55 ASNHC 14276 A. piscivorus USA TX AngelinaASK 9084 JLS 56 A. piscivorus USA TX JasperASK 9085 JLS 57 A. piscivorus USA TX San
AugustineASK 9091 JLS 63 A. piscivorus USA TX KimbleASK 9092 JLS 64 A. piscivorus USA TX KimbleASK 9093 JLS 65 A. piscivorus USA TX KimbleASK 9095 JLS 67 A. piscivorus USA TX SmithASK 9098 JLS 70 A. piscivorus USA TX SmithASK 9101 JLS 74 ASNHC 14275 A. piscivorus USA TX SmithASK 9103 JLS 76 A. piscivorus USA TX SmithASK 9105 JLS 78 A. piscivorus USA TX SmithASK 9108 JLS 81 A. piscivorus USA TX TarrantASK 9109 JLS 82 A. piscivorus USA TX Tarrant
648 Copeia 2014, No. 4
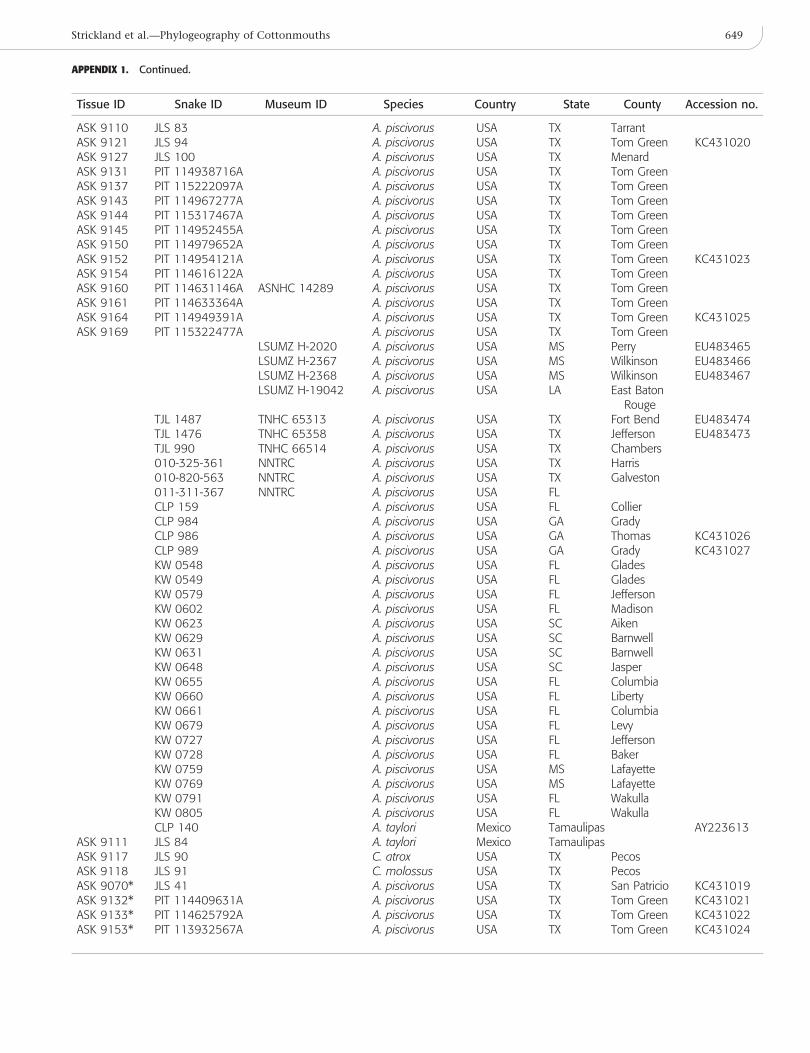
Tissue ID Snake ID Museum ID Species Country State County Accession no.
ASK 9110 JLS 83 A. piscivorus USA TX TarrantASK 9121 JLS 94 A. piscivorus USA TX Tom Green KC431020ASK 9127 JLS 100 A. piscivorus USA TX MenardASK 9131 PIT 114938716A A. piscivorus USA TX Tom GreenASK 9137 PIT 115222097A A. piscivorus USA TX Tom GreenASK 9143 PIT 114967277A A. piscivorus USA TX Tom GreenASK 9144 PIT 115317467A A. piscivorus USA TX Tom GreenASK 9145 PIT 114952455A A. piscivorus USA TX Tom GreenASK 9150 PIT 114979652A A. piscivorus USA TX Tom GreenASK 9152 PIT 114954121A A. piscivorus USA TX Tom Green KC431023ASK 9154 PIT 114616122A A. piscivorus USA TX Tom GreenASK 9160 PIT 114631146A ASNHC 14289 A. piscivorus USA TX Tom GreenASK 9161 PIT 114633364A A. piscivorus USA TX Tom GreenASK 9164 PIT 114949391A A. piscivorus USA TX Tom Green KC431025ASK 9169 PIT 115322477A A. piscivorus USA TX Tom Green
LSUMZ H-2020 A. piscivorus USA MS Perry EU483465LSUMZ H-2367 A. piscivorus USA MS Wilkinson EU483466LSUMZ H-2368 A. piscivorus USA MS Wilkinson EU483467LSUMZ H-19042 A. piscivorus USA LA East Baton
RougeTJL 1487 TNHC 65313 A. piscivorus USA TX Fort Bend EU483474TJL 1476 TNHC 65358 A. piscivorus USA TX Jefferson EU483473TJL 990 TNHC 66514 A. piscivorus USA TX Chambers010-325-361 NNTRC A. piscivorus USA TX Harris010-820-563 NNTRC A. piscivorus USA TX Galveston011-311-367 NNTRC A. piscivorus USA FLCLP 159 A. piscivorus USA FL CollierCLP 984 A. piscivorus USA GA GradyCLP 986 A. piscivorus USA GA Thomas KC431026CLP 989 A. piscivorus USA GA Grady KC431027KW 0548 A. piscivorus USA FL GladesKW 0549 A. piscivorus USA FL GladesKW 0579 A. piscivorus USA FL JeffersonKW 0602 A. piscivorus USA FL MadisonKW 0623 A. piscivorus USA SC AikenKW 0629 A. piscivorus USA SC BarnwellKW 0631 A. piscivorus USA SC BarnwellKW 0648 A. piscivorus USA SC JasperKW 0655 A. piscivorus USA FL ColumbiaKW 0660 A. piscivorus USA FL LibertyKW 0661 A. piscivorus USA FL ColumbiaKW 0679 A. piscivorus USA FL LevyKW 0727 A. piscivorus USA FL JeffersonKW 0728 A. piscivorus USA FL BakerKW 0759 A. piscivorus USA MS LafayetteKW 0769 A. piscivorus USA MS LafayetteKW 0791 A. piscivorus USA FL WakullaKW 0805 A. piscivorus USA FL WakullaCLP 140 A. taylori Mexico Tamaulipas AY223613
ASK 9111 JLS 84 A. taylori Mexico TamaulipasASK 9117 JLS 90 C. atrox USA TX PecosASK 9118 JLS 91 C. molossus USA TX PecosASK 9070* JLS 41 A. piscivorus USA TX San Patricio KC431019ASK 9132* PIT 114409631A A. piscivorus USA TX Tom Green KC431021ASK 9133* PIT 114625792A A. piscivorus USA TX Tom Green KC431022ASK 9153* PIT 113932567A A. piscivorus USA TX Tom Green KC431024
APPENDIX 1. Continued.
Strickland et al.—Phylogeography of Cottonmouths 649