Phylogeography of Anastrepha obliqua Inferred With mtDNA ...
14
MOLECULAR ENTOMOLOGY Phylogeography of Anastrepha obliqua Inferred With mtDNA Sequencing RAUL RUIZ–ARCE, 1,2,3 NORMAN B. BARR, 1 CHRISTOPHER L. OWEN, 2,4 DONALD B. THOMAS, 5 AND BRUCE A. MCPHERON 2 J. Econ. Entomol. 105(6): 2147Ð2160 (2012); DOI: http://dx.doi.org/10.1603/EC12211 ABSTRACT Anastrepha obliqua (Macquart) (Diptera: Tephritidae), the West Indian fruit ßy, is a frugivorous pest that occasionally Þnds its way to commercial growing areas outside its native distribution. It inhabits areas in Mexico, Central and South America, and the Caribbean with occasional infestations having occurred in the southern tier states (California, Florida, and Texas) of the United States. This ßy is associated with many plant species and is a major pest of mango and plum. We examine the genetic diversity of the West Indian fruit ßy based on mitochondrial COI and ND6 DNA sequences. Our analysis of 349 individuals from 54 geographic collections from Mexico, Central America, the Caribbean, and South America detected 61 haplotypes that are structured into three phylogenetic clades. The distribution of these clades among populations is associated with geography. Six populations are identiÞed in this analysis: Mesoamerica, Central America, Caribbean, western Mexico, Andean South America, and eastern Brazil. In addition, substantial differences exist among these genetic types that warrants further taxonomic review. KEY WORDS Anastrepha obliqua, mitochondrial DNA, West Indian fruit ßy, sequencing, COI Fruit ßies in the genus Anastrepha Schiner are among the most widespread and economically important pests in tropical and subtropical areas in the New World (Aluja 1994, White and ElsonÐHarris 1992). Anastrepha obliqua (Macquart), the West Indian fruit ßy, is regarded as one of the most important economic pest species in the genus. It occurs from northern Mexico to southern Brazil and throughout the Carib- bean (Foote et al. 1993, Herna ´ ndezÐOrtiz and Aluja 1993, Aluja 1994, Steck 2001). It has been recorded in California, Texas, and Florida (Foote et al. 1993, Herna ´ ndezÐOrtiz and Aluja 1993) but these incur- sions are outside its natural range. It infests at least 60 plant species belonging to 24 plant families in tropical and subtropical areas (Norrbom and Kim 1988, Herna ´ ndezÐOrtiz and Aluja 1993, Aluja et al. 1996). This species is a member of the fraterculus taxonomic group that contains several other signiÞcant pests, including A. fraterculus (Wiedmann) (the South American fruit ßy) that is itself considered a cryptic species complex (Lutz and Lima 1918, Stone 1942, HernandezÐOrtiz et al. 2004, Segura et al. 2011). The question of population structure within A. obli- qua has not been formally addressed. Previous anal- yses of the cytochrome oxidase subunit one (COI) by SmithÐCaldas et al. (2001) to estimate the phylogeny and detect cryptic species indicated a high diversity within A. obliqua. SmithÐCaldas et al. (2001) report the separation of A. obliqua into two clades. One clade with strong support contains four samples of A. obli- qua, two gathered in Mexico (Veracruz), one in Co- lombia (Sevilla), and one in Brazil (BA, Bahia). The second clade shows A. obliqua gathered from four states (ES, Espirito Santo; SP, Sao Paulo; RN, Rio Grande do Norte; MG, Minas Gerais; and SC, Santa Catarina) in Brazil grouped along with two A. soror- cula gathered in Brazil (SP and RN) and four A. frater- culus also gathered in Brazil (BA, ES, MG, and SC). It is possible that A. obliqua represents multiple repro- ductively isolated populations. Prior work on another Anastrepha species, the South American fruit ßy, A. fraterculus, presented strong evidence of cryptic spe- cies (reviewed by Silva and Barr 2008). Mitochondrial DNA (mtDNA) sequences have been used successfully on tephritids for resolving in- ter-speciÞc relationships (Han and McPheron 1999, McPheron et al. 1999, SmithÐCaldas et al. 2001, Barr et al. 2005, Barr and McPheron 2006, Boykin et al. 2006), intra-speciÞc structure (McPheron et al. 1994, Alberti et al. 2008, Lanzavecchia et al. 2008), and to develop diagnostic methods for species ID (Barr et al. 2006) and pathway analysis of populations (Barr 2009, Lan- zavecchia et al. 2008). Additionally, studies on evolu- tionary processes that examine nucleic acid variation 1 Center for Science and Technology, Mission Laboratory, USDAÐ APHIS, Moore Air Base, Edinburg, TX 78541. 2 The Pennsylvania State University, Department of Entomology, 501 ASI Building, University Park, PA 16801. 3 Corresponding author, e-mail: [email protected]. 4 University of Connecticut, Department of Ecology and Evolu- tionary Biology, 75 N. Eagleville Rd., Unit 3043, Storrs, CT 06268. 5 Kika de la Garza Subtropical Agricultural Research Center, USDAÐARS, 2413 E. Highway 83, Weslaco, TX 78596. Downloaded from https://academic.oup.com/jee/article/105/6/2147/797704 by guest on 28 May 2022
-
Upload
khangminh22 -
Category
Documents
-
view
1 -
download
0
Transcript of Phylogeography of Anastrepha obliqua Inferred With mtDNA ...
MOLECULAR ENTOMOLOGY
Phylogeography of Anastrepha obliqua Inferred WithmtDNA Sequencing
RAUL RUIZ–ARCE,1,2,3 NORMAN B. BARR,1 CHRISTOPHER L. OWEN,2,4 DONALD B. THOMAS,5
AND BRUCE A. MCPHERON2
J. Econ. Entomol. 105(6): 2147Ð2160 (2012); DOI: http://dx.doi.org/10.1603/EC12211
ABSTRACT Anastrepha obliqua (Macquart) (Diptera: Tephritidae), the West Indian fruit ßy, is afrugivorous pest that occasionally Þnds its way to commercial growing areas outside its nativedistribution. It inhabits areas inMexico,Central andSouthAmerica, and theCaribbeanwithoccasionalinfestations having occurred in the southern tier states (California, Florida, and Texas) of the UnitedStates. This ßy is associated with many plant species and is a major pest of mango and plum. Weexamine the genetic diversity of the West Indian fruit ßy based on mitochondrial COI and ND6 DNAsequences. Our analysis of 349 individuals from 54 geographic collections from Mexico, CentralAmerica, the Caribbean, and South America detected 61 haplotypes that are structured into threephylogenetic clades. The distribution of these clades among populations is associated with geography.Six populations are identiÞed in this analysis: Mesoamerica, Central America, Caribbean, westernMexico, Andean South America, and eastern Brazil. In addition, substantial differences exist amongthese genetic types that warrants further taxonomic review.
KEY WORDS Anastrepha obliqua, mitochondrial DNA, West Indian fruit ßy, sequencing, COI
Fruit ßies in the genus Anastrepha Schiner are amongthe most widespread and economically importantpests in tropical and subtropical areas in the NewWorld (Aluja 1994, White and ElsonÐHarris 1992).Anastrepha obliqua (Macquart), the West Indian fruitßy, is regarded as one of the most important economicpest species in the genus. It occurs from northernMexico to southern Brazil and throughout the Carib-bean (Foote et al. 1993, HernandezÐOrtiz and Aluja1993, Aluja 1994, Steck 2001). It has been recorded inCalifornia, Texas, and Florida (Foote et al. 1993,HernandezÐOrtiz and Aluja 1993) but these incur-sions are outside its natural range. It infests at least 60plant species belonging to 24 plant families in tropicaland subtropical areas (Norrbom and Kim 1988,HernandezÐOrtiz and Aluja 1993, Aluja et al. 1996).This species is a member of the fraterculus taxonomicgroup that contains several other signiÞcant pests,including A. fraterculus (Wiedmann) (the SouthAmerican fruit ßy) that is itself considered a crypticspecies complex (Lutz and Lima 1918, Stone 1942,HernandezÐOrtiz et al. 2004, Segura et al. 2011).
The question of population structure withinA. obli-qua has not been formally addressed. Previous anal-yses of the cytochrome oxidase subunit one (COI) bySmithÐCaldas et al. (2001) to estimate the phylogenyand detect cryptic species indicated a high diversitywithin A. obliqua. SmithÐCaldas et al. (2001) reportthe separation ofA. obliqua into two clades. One cladewith strong support contains four samples of A. obli-qua, two gathered in Mexico (Veracruz), one in Co-lombia (Sevilla), and one in Brazil (BA, Bahia). Thesecond clade shows A. obliqua gathered from fourstates (ES, Espirito Santo; SP, Sao Paulo; RN, RioGrande do Norte; MG, Minas Gerais; and SC, SantaCatarina) in Brazil grouped along with two A. soror-cula gathered in Brazil (SP and RN) and fourA. frater-culus also gathered in Brazil (BA, ES, MG, and SC). Itis possible that A. obliqua represents multiple repro-ductively isolated populations. Prior work on anotherAnastrepha species, the South American fruit ßy, A.fraterculus, presented strong evidence of cryptic spe-cies (reviewed by Silva and Barr 2008).
Mitochondrial DNA (mtDNA) sequences havebeen used successfully on tephritids for resolving in-ter-speciÞc relationships (Han and McPheron 1999,McPheron et al. 1999, SmithÐCaldas et al. 2001, Barr etal. 2005, Barr and McPheron 2006, Boykin et al. 2006),intra-speciÞc structure (McPheron et al. 1994, Albertiet al. 2008, Lanzavecchia et al. 2008), and to developdiagnostic methods for species ID (Barr et al. 2006)and pathway analysis of populations (Barr 2009, Lan-zavecchia et al. 2008). Additionally, studies on evolu-tionary processes that examine nucleic acid variation
1 Center for Science and Technology, Mission Laboratory, USDAÐAPHIS, Moore Air Base, Edinburg, TX 78541.
2 The Pennsylvania State University, Department of Entomology,501 ASI Building, University Park, PA 16801.
3 Corresponding author, e-mail: [email protected] University of Connecticut, Department of Ecology and Evolu-
tionary Biology, 75 N. Eagleville Rd., Unit 3043, Storrs, CT 06268.5 Kika de la Garza Subtropical Agricultural Research Center,
USDAÐARS, 2413 E. Highway 83, Weslaco, TX 78596.
Dow
nloaded from https://academ
ic.oup.com/jee/article/105/6/2147/797704 by guest on 28 M
ay 2022
have expanded our knowledge of phylogenetic rela-tionships among sibling and cryptic species (Feder etal. 2003, Xie et al. 2008) providing insight on diversityand evolutionary pathways. Constructing genetic datasets for A. obliqua should assist in developing newways to analyze the ecology and evolution of thespecies.
In this study, we use mitochondrial DNA from theCOI and the NADH subunit six (ND6) genes to inferthe population genetic structure of A. obliqua col-lected in Mexico, Central America, the Caribbean, andSouth America. Our objectives are to 1) estimate ge-netic variation within the species and determine if themarkers are suitable for population genetic studies; 2)test for evidence of reproductive isolation among geo-graphic populations; and 3) evaluate the data for ev-idence of ßy movement between regions or popula-tion expansion within geographic regions. In addition,we consider the taxonomic signiÞcance of geneticvariation for the species and comment on the signif-icance of the results for improving pest managementprograms.
Materials and Methods
Samples Analyzed. A. obliqua used in this studywere collected in traps (adults) and from host fruitmaterial (larvae) between 1995 and 2006. The 54 sam-pling sites, with ecological information and geo-graphic distribution, are described in Table 1 and Fig.1. Specimens were collected from multiple hostsÐmango (Mangifera sp.), plum (Spondias spp.), andcarambola (Averrhoa carambola L.). Before analysis,specimens were captured live, identiÞed then eitherfrozen or placed in ethanol and shipped to the U.S.Department of Agriculture (USDA) Center for PlantHealth Science and Technology, Mission Lab in Ed-inburg, TX, or Penn State University (PSU), Depart-ment of Entomology, University Park, PA. Entire bod-ies from adult and larvae specimens were maintainedat �80�C at both locations before analysis.DNA Extraction, Polymerase Chain Reaction, andSequencing. DNA was isolated using the DNeasyBlood and Tissue Kit (Qiagen, Valencia, CA) follow-ing standard DNeasy guidelines for animal tissues.Extractions were stored at �20�C for the duration ofthe study. Whenever possible, DNA from one speci-men per collection was isolated via a nondestructivemethod (Barr et al. 2006) to save the tissue as voucher.Samples were ampliÞed for the mitochondrial COIregion using tRNA-cys2 5�-ACTCCTTTAGAATTG-CAGTCTAAT-3� and COld-r 5�-GGGCTCATACA-ATAAATCCTAAT-3� designed from the Bactroceraabdominalis (GenBank accession number DQ917577)sequence, generating a fragment of �1,050 bp. Thisfragment included partial coverage of the cysteinetRNA and the entire tyrosine tRNA and partial cov-erage of the 5� cytochrome oxidase subunit I. The mi-tochondrial NADH dehydrogenase subunit six (ND6)region was ampliÞed using TT-J-9886 5�-TAAAAA-CATTGGTCTTGTAA-3� (Barr et al. 2006) and ND6r5�-TTATGATCCAAAATTTCATCA-3� primers and
yielded fragments of �800 bp. This fragment includeda portion of the threonine tRNA, the entire prolinetRNA, the entire NADH subunit six codon, and partialcoverage of the cytochrome B codon. Additionally, weused an alternate reverse primer, COlc-r 5�-GCTAT-TATTGCATAGATTATTCC-3� designed from A.ludens (R.R.-A., unpublished data) for this work.
Polymerase Chain Reaction (PCR) was performedin 25 �l reactions containing 1 �l of template, 16.875�l of water, 2.5 �l of buffer (10� concentration, Qia-gen), 1.5 �l of 25 mM of MgCl2 (Qiagen), 1.25 �l ofeach primer (5 �M, EuroÞns MWG Operon, Hunts-ville, AL), 0.5 �l of 10 mM dNTP mix (Promega,Madison, WI), and 0.125 �l of TaqDNA polymerase(Qiagen). AmpliÞcations were performed in AppliedBiosystems GeneAmp PCR System 9700 thermal cy-clers. Cycling conditions for ampliÞcation of COI andND6 fragments were 3 min at 94�C followed by 39cycles of 1 min at 94�C, 1 min at 50�C, 1 min at 72�C,and a Þnal extension of 10 min at 72�C. PCR productswere stained with Sybr Green (Invitrogen, Carlsbad,CA) ßuorescent dye at 1/10,000� and 3/10,000� andvisualized on 1.5% electrophoresis agarose gels. Doc-umentation of these gels was via Gel Doc (Bio-Rad,Hercules, CA) imaging system using Quantity Onesoftware. AmpliÞcation products were puriÞed withExoSAP-IT (Affymetrix, Santa Clara, CA) before se-quencing. PCR products were sequenced asymmetri-cally using 3� BigDye-labeled dideoxynucleotidetriphosphates (v 3.1 dye terminators, Applied Biosys-tems, Foster City, CA) and run on an ABI 3730XLDNA Analyzer with the ABI Data Collection Program(v 2.0) at the Huck InstituteÕs Nucleic Acid Facility atPenn State University.
Sequences were edited with QScreen (PSU: HuckInstitute) designed in collaboration with the McPheronLab (PSU: Department of Entomology), and Se-quencher 4.8 (Gene Codes Corp., Ann Arbor, MI). Allsequences were aligned with Mega four (Tamura et al.2007) using Clustal W (Thompson et al. 1994) andtrimmed to a length of 812 and 736 bp for COI andND6, respectively. We trimmed �250 bp from theÞve-prime end of the tRNA-cys2-COI PCR fragmentto avoid ambiguous alignment of observed insertions/deletions in the tRNA region (data not shown). Se-quences were concatenated using DnaSP 4.10 (Rozaset al. 2003), and subsequent analyses were carried outon the 1,548 bp fragment.Phylogenetic Analyses andDivergenceEstimates ofHaplotypes. Phylogenetic reconstruction was esti-mated using Bayesian and maximum-likelihood (ML)approaches. The Bayesian and ML analyses were per-formed using models that recognize seven data par-titions in the sequence alignment. The Þrst and secondcodon positions were treated as one partition and thethird positions as a separate partition of each gene.This resulted in two partitions for COI and two par-titions for ND6. The two tRNA sequences (threonineand proline) and cytochrome B were each treated asa separate partition. The appropriate model of se-quence evolution for each partition was selectedbased on Akaike information criterion (AIC) using
2148 JOURNAL OF ECONOMIC ENTOMOLOGY Vol. 105, no. 6
Dow
nloaded from https://academ
ic.oup.com/jee/article/105/6/2147/797704 by guest on 28 M
ay 2022
jModeltest v.0.1.1 (Guindon and Gascuel 2003, Posada2008). Bayesian analyses were performed using Mr-Bayes 3.1.2 (Ronquist and Huelsenbeck 2003) using aMonte Carlo Markov Chain (MCMC) method withfour MCMC chains run simultaneously for 10,000,000generations, sampling from the posterior every 1,000
generations. Because posterior probabilities and treelength estimates have been shown to be sensitive tomisspeciÞcation of the branch length (Lemmon et al.2009, Marshall 2010), we ran MrBayes with defaultpriors by setting the branch length prior according tothe average branch length estimated from the ML
Table 1. Geographical origins and information on collections of Anastrepha obliqua and other related species of Anastrepha includedin this study
Siteno.
PopulationPop n Latitude Longitude Year coll. Host
Site Site code
1 Barbados BAR1 Car 2 13.193 N �59.543 W 20042 Belize, Dangriga BEL1 Mes 2 17.183333 N �88.583333 W 2006 Mango3 Belize, Stann Creek BEL2 Mes 1 16.99 N �88.323 W 2006 Mango4 Brazil, Acu, RGN BRA1 EBra 9 5.345968 S �36.34938 W 2005 Trap5 Brazil, Atibaia, Sao Paulo BRA2 EBra 2 23.116096 S �46.552861 W6 Brazil, ES BRA3 EBra 9 19.596027 S �40.772472 W 19987 Brazil, Janauba, Minas G BRA4 EBra 6 15.803693 S �43.317366 W 1997 Trap8 Brazil, Patrocinio Paulista, SP BRA5 EBra 1 20.639 S �47.282 W9 Brazil, Laranjal Paulista, SP BRA6 EBra 9 23.053499 S �47.834049 W 1997 Averrhoa carambola10 Brazil, Linhares, ES BRA7 EBra 8 19.390915 S �40.071503 W 1998 Trap11 Brazil, Mossoro, RGN BRA8 EBra 9 5.188036 S �37.344131 W 1999 Trap12 Brazil, Presidente Prudente, SP BRA9 EBra 1 22.127596 S �51.385616 W Hobo13 Colombia, Bucaramanga COL1 And 7 7.105 N �73.116 W 2006 Mango14 Colombia, Caldas COL2 And 4 5.28265 N �75.302 W 2006 McPhail trap15 Colombia, Giron COL3 And 1 7.0718 N �73.175 W 2006 mango16 Colombia, Tolima COL4 And 5 4.129 N �75.302 W 2006 Spondia sp.17 Costa Rica, Alajuela Province CR1 CAm 4 10.45041 N �84.794076 W 2005 McPhail trap18 Costa Rica, Puntarenas
ProvinceCR2 CAm 10 9.18525 N �84.005369 W 2005 Mango
19 Dominican Republic, Bonao delTanque
DR1 Car 8 18.94 N �70.409 W 2003
20 Dominican Republic, Moca DR2 Car 10 19.400086 N �70.51996 W 2004 Hobo21 El Salvador, Pipil ES1 CAm 9 13.426 N �88.951 W McPhail trap22 Guatemala, Yepocapa GT1 CAm 5 14.500008 N �90.950017 W 2001 Trap23 Honduras, Comayaqua HON1 CAm 9 14.561852 N �87.672394 W 2004 Mango24 Honduras, F Morazan HON2 CAm 12 15.32395 N �87.599274 W 2004 Mango25 Jamaica JAM1 Car 15 18.2 N �78.01 W 2004 Mango26 Jamaica, Kingston JAM2 Car 9 17.989999 N �76.800003 W 1996 Spondias purpurea27 Mexico, Campeche, Aguacatal MX1 Mes 10 18.624809 N �90.740992 W 2006 Multi-lure trap28 Mexico, Campeche, Escarcega MX2 Mes 9 18.624809 N �90.740992 W 2001 Mango29 Mexico, Morelos, Michipan MX3 WMx 8 18.91666667 N �99.06666667 W 1999 Mango30 Mexico, Oaxaca, Zacatepec MX4 Mes 5 17.191278 N �95.885536 W 2001 Mango31 Mexico, Tabasco, Agua Blanca MX5 Mes 4 17.944 N �92.583 W 2006 Mango32 Mexico, Tabasco, Huemanguillo MX6 Mes 8 17.827141 N �93.399399 W33 Mexico, Tamaulipas, Ciudad
ManteMX7 Mes 3 22.744555 N �98.970428 W Mango
34 Mexico, Veracruz, Los Tuxtlas MX8 Mes 1 18.560344 N �95.204088 W 1995 Spondias mobin35 Mexico, Colima, Tecoman MX9 WMx 5 18.91423 N �103.875198 W Mango36 Mexico, Guerrero, Acahuizotla MX10 WMx 9 17.405868 N �99.446206 W 2005 Mango37 Mexico, Guerrero, La Palma MX11 WMx 4 20.2312 N �102.781631 W 2006 Mango38 Mexico, Jalisco, Mezquitlan MX12 WMx 2 19.817 N �104.34 W 2005 Mango39 Mexico, Michoacan, Nueva
ItaliaMX13 WMx 6 19.017 N �102.1 W 2005/2006 Mango
40 Mexico, Michoacan, Sta Amate MX14 WMx 10 19.162 N �101.901 W 2000 Mango41 Mexico, Morelos, Cuatla MX15 WMx 7 18.863498 N �98.86302 W Mango42 Mexico, Nayarit, El Jigote MX16 WMx 9 21.708699 N �105.064329 W Mango43 Mexico, Nayarit, Valle de
LermaMX17 WMx 10 21.8154 N �105.084169 W 2000 Mango
44 Mexico, Sinaloa, Concordia MX18 WMx 6 23.278907 N �106.076797 W 2004 Mango45 Mexico, Sinaloa, Escuinapa MX19 WMx 10 22.84561 N �105.901299 W 2000 Mango46 Mexico, Sinaloa, Malpica MX20 WMx 5 23.233333 N �106.153643 W 2004 Mango47 Panama, Altos de Pacora PAN1 CAm 7 9.081758 N �79.290819 W 2006 McPhail trap48 Panama, Cerro Azul PAN2 CAm 6 9.166669 N �79.416669 W 2006 Mango49 Panama, Chiriqui PAN3 CAm 7 8.131187 N �83.348255 W 2006 Mango50 Peru, San Martin Province PER1 And 4 6.14 S �77.09 W 2005 Spondias sp.51 Puerto Rico, Hormiguoros PR1 Car 6 18.221315 N �66.430649 W 2006 Trap52 Puerto Rico, Maricae PR2 Car 3 18.221315 N �66.430649 W 2006 Trap53 Puerto Rico, San Juan PR3 Car 8 18.46616 N �66.10666 W McPhail trap54 St. Vincent STV1 Car 5 13.212 N �61.192 W 2004 Unknown
n, no. of individual specimens analyzed. Blank Þelds indicate missing information.
December 2012 RUIZÐARCE ET AL.: PHYLOGEOGRAPHY OF Anastrepha obliqua 2149
Dow
nloaded from https://academ
ic.oup.com/jee/article/105/6/2147/797704 by guest on 28 M
ay 2022
analysis. Posterior probabilities were then determinedfrom a 50% majority-rule consensus tree generatedafter a burn-in of 2,500 trees. MrBayes was run threeindependent times from random starting trees to en-sure convergence on the same posterior of trees. Toensure the MCMC chains converged in each analysis,tree Þles were compared in AWTY (are we there yet?)(Nylander et al. 2008) to check log likelihood station-arity and correlation of split frequencies.
Because MrBayes3.1.2 assigns zero probability topolytomies in tree proposals, we also ran Þve inde-pendent Bayesian analyses in Phycas 1.2 (http://www.phycas.org) tocomparemajority-ruleconsensustrees and posterior probabilities. Lewis et al. (2005)have shown not considering polytomies in tree pro-posals can lead to short branch lengths with inßatedposteriorprobabilities.Phycasanalyseswere runusingdefault priors for 400,000 cycles and sampling every400 cycles, where one cycle is nearly equivalent to 100generations in MrBayes. The data set was partitionedaccording to the MrBayes analyses and convergenceof the MCMC chains was assessed using AWTY (Ny-lander et al. 2008) using a burn-in of 200 trees.
MLanalyseswere run inGARLI-PART0.97(Zwickl2006)using thepartitionsaboveanddefaultparametersettings. Garli was run three independent times fromrandom starting trees to assess convergence on thesame ML tree. In addition, a nonparametric bootstrapanalysis (Felsenstein 1985) with 100 pseudo replicateswas run to obtain branch support values.
Haplotypes were identiÞed from concatenated se-quences with DnaSP. Our haplotype Þle was con-
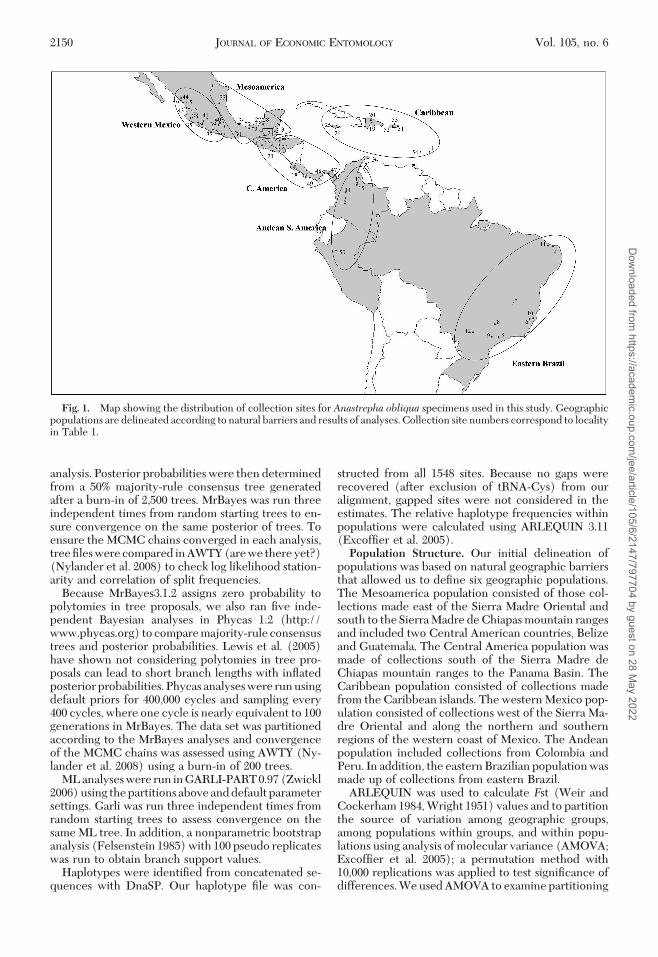
structed from all 1548 sites. Because no gaps wererecovered (after exclusion of tRNA-Cys) from ouralignment, gapped sites were not considered in theestimates. The relative haplotype frequencies withinpopulations were calculated using ARLEQUIN 3.11(ExcofÞer et al. 2005).Population Structure. Our initial delineation of
populations was based on natural geographic barriersthat allowed us to deÞne six geographic populations.The Mesoamerica population consisted of those col-lections made east of the Sierra Madre Oriental andsouth to the Sierra Madre de Chiapas mountain rangesand included two Central American countries, Belizeand Guatemala. The Central America population wasmade of collections south of the Sierra Madre deChiapas mountain ranges to the Panama Basin. TheCaribbean population consisted of collections madefrom the Caribbean islands. The western Mexico pop-ulation consisted of collections west of the Sierra Ma-dre Oriental and along the northern and southernregions of the western coast of Mexico. The Andeanpopulation included collections from Colombia andPeru. In addition, the eastern Brazilian population wasmade up of collections from eastern Brazil.
ARLEQUIN was used to calculate Fst (Weir andCockerham 1984, Wright 1951) values and to partitionthe source of variation among geographic groups,among populations within groups, and within popu-lations using analysis of molecular variance (AMOVA;ExcofÞer et al. 2005); a permutation method with10,000 replications was applied to test signiÞcance ofdifferences. We used AMOVA to examine partitioning
Fig. 1. Map showing the distribution of collection sites for Anastrepha obliqua specimens used in this study. Geographicpopulations are delineated according to natural barriers and results of analyses. Collection site numbers correspond to localityin Table 1.
2150 JOURNAL OF ECONOMIC ENTOMOLOGY Vol. 105, no. 6
Dow
nloaded from https://academ
ic.oup.com/jee/article/105/6/2147/797704 by guest on 28 M
ay 2022
of mtDNA genetic diversity within and among thegeographic collections.InferredHistoryUsingSummaryStatistics andPhy-logeographic Analyses. Basic molecular summary sta-tistics, genetic distances, and mismatch distributionswere estimated with DnaSP. Mismatch distributionswere used to examine the data for evidence of demo-graphic population expansions that can result in uni-modal, wave-like patterns (Rogers and Harpening1992). Demographic parameters TajimaÕs D (Tajima1989) and Fu and LiÕs D & F (Fu and Li 1993) wereestimated for the sampled collections (and groups ofcollections), and their CIs were assessed by 10,000coalescent simulations to test the hypothesis that allmutations are selectively neutral (Kimura 1983) withDnaSP.
Results
Sequence Variation. In total, 61 composite (COI �ND6) haplotypes were observed among the 349 indi-
vidualA. obliqua specimens sequenced. There were 82(5.3%) polymorphic sites, 57 (3.7%) parsimoniouslyinformative sites, and no indels (gaps) observed(Supp. Table 1 [online only]) in the 1,548 bp concat-enated fragment. The COI (812 bp) and ND6 (736 bp)fragments contributed 35 and 47 polymorphic sites,respectively. This resulted in 44 private haplotypesamong the 54 geographic collections. The mean num-ber of haplotypes per geographic location was 2.5 andranged between 1 and 7. The haplotype and nucleo-tide diversities were 0.9022 and 0.01153, respectively,for the entire West Indian fruit ßy dataset.Phylogenetic Reconstruction and Divergence Esti-mates. The HKY � I � G substitution model wasselected as the best model for the concatenated COI,alignment of tRNAs, ND6, and cytochrome B based onthe AIC ranking (Akaike 1974). jModeltest revealed aproportion of invariable sites (I) of 0.7217, transitionto transversion ratio of 5.38, and the gamma (�) shapedistribution shape parameter of 0.3210. Phylogeneticreconstructions with Bayesian (Fig. 2) and ML (Supp.
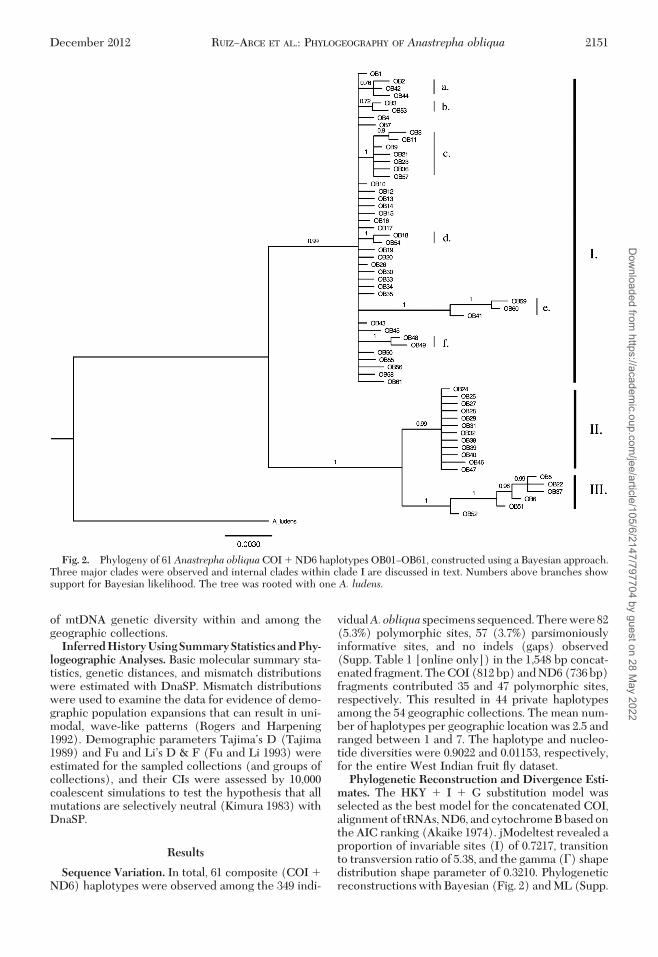
Fig. 2. Phylogeny of 61 Anastrepha obliquaCOI � ND6 haplotypes OB01ÐOB61, constructed using a Bayesian approach.Three major clades were observed and internal clades within clade I are discussed in text. Numbers above branches showsupport for Bayesian likelihood. The tree was rooted with one A. ludens.
December 2012 RUIZÐARCE ET AL.: PHYLOGEOGRAPHY OF Anastrepha obliqua 2151
Dow
nloaded from https://academ
ic.oup.com/jee/article/105/6/2147/797704 by guest on 28 M
ay 2022
Fig. 4 [online only]) methods provide concordantresults. The Bayesian search reveals three major phy-logenetic clades labeled as I, II, and III (PP �0.99).The ML tree topology supports clades II and III, butit does not recover clade I as reciprocally monophy-letic to the other two clades. The ML tree does supportgenetic similarity, however, among the haplotypespresent in clade I of the Bayesian tree.
We see strong branch support for most cladeswithin the Bayesian and ML trees. Clade II is sister toclade III based on both tree building methods and thisrelationship is supported by high Bayesian posteriorprobability (1.00) and ML bootstrap (97%) values.Neither method identiÞed subclade structure amongclade II haplotypes. In contrast, both methods iden-tiÞed structure within clade III with strong branchsupport (PP �0.96, bootstrap �77%).
In the Bayesian tree, some clade I haplotypes formsubclades (labeled IaÐIf) with moderate to strongbranch support (PP 0.72Ð1.00). Most of these branchessupport shared ancestry of just two or three haplo-types but these subclades often associate with geo-graphic patterns (described below). Of these, sub-clade Ie is notable because it is well supported (PP 1.00; ML bootstrap 96%) with a relatively longbranch. Consequently, we estimate the genetic diver-gence of this subclade with respect to other haplo-types in clades I-III.
We see that clade I (Fig. 2) contains ßies mainlyfrom collections east of the Sierra Madre Oriental andsouth of the Mexican trans-volcanic belt, the CentralAmerican countries sampled here (excluding Pan-ama), the Andean region, and all Caribbean Islandssampled (Table 2; Supp. Figs. 1Ð3 [online only]). Wealso see that subclade Ic contains haplotypes exclu-sively of specimens from various Caribbean islands.Subclade Ia, which is strongly supported by the Bayes-ian method only, consists of haplotypes from CentralAmerican collections. Subclade Ib, supported only byBayesian analysis, contains various collections fromCentral America and one ßy from Mexico (MX6).Subclade Id haplotypes were seen only in southernMexico collections. Subclade If consists of specimensfrom Colombia collections. Subclade Ie containsmostly individuals from the Andean region of SouthAmerica with the exception of one individual fromCosta Rica (CR2) (Table 2; Supp. Figs. 1 and 2 [onlineonly]). All Andean ßies are within clade I where thelarge portion (69%) are in subclade Ie.
Clade II contains 85% of the collections from Mex-ico found west of the Sierra Madre Oriental and northof the trans-volcanic belt (Fig. 2; Supp. Figs. 1 and 3[online only]). Clade II is entirely represented byindividuals from western Mexico except for one ßyfrom the southeastern Mexican state of Tabasco(MX5) that has the OB24 haplotype, more commonlyseen in western Mexico.
Clade III was made up of individuals gathered inBrazil, Colombia, and Panama (Supp. Figs. 1 and 2[online only]). Haplotypes in clades I and II were notsampled from Brazil and Panama. Eighty two percent
of the Colombian samples were in clade III; the re-maining haplotypes were seen in clade I.
The average gamma-corrected genetic distancewithin a clade was 0.33, 0.13, and 0.22% for clades I, II,and III, respectively. When treated separately, sub-clade Ie had a genetic distance of 0.26% and the otherclade I haplotypes 0.22%. The average gamma-cor-rected genetic distance between clades II and III was1.1%. The average distances between clade I (includ-ing subclade Ie) and clades II and III were 2.1 and2.3%, respectively. The greatest average distanceswere seen between subclade Ie and clades II (2.5%)and III (2.4%).
In comparison, the range of distances between hap-lotypes within clades was similar to average distancesbetween clades. Variation between haplotypes occur-ring within any one of the four phylogenetic clades (I,Ie, II, and III) mentioned above ranged from 0.06 to0.53%. In contrast, variation between two haplotypesselected from different clades was relatively high (1.1Ð2.5%).Population Structure.We observed from the phy-
logenetic analysis that clades show an association togeography. Additional structure, however, could bepresent based on frequency differences of closely re-lated haplotypes. To examine for additional geo-graphic structure,wepartitioned thedataaccording toMesoamerica, Caribbean, and Central America col-lections. Haplotypes from these collections form amonophyletic group (Fig. 2, clade I) but upon closerinspection are geographically separated by eithermountain ranges or a large body of water. We exam-ined this set of collections using AMOVA and con-ducted pairwise comparisons. AMOVA revealed thata total of 14.40% of the variation in mtDNA was be-cause of differences among these three groups (Table3). Additionally, estimates for Fst were signiÞcant atthe P 0.05 level for pairwise comparisons of thesethree populations. The overall level of differentiationfor Mesoamerican, Caribbean, and Central Americanpopulations ranged from 0.153 to 0.258. The results ofthese analyses suggest that these three groups repre-sent distinct populations. In total, the results of phy-logenetic tree reconstruction and AMOVA revealedsix populations occurring within our entire sampling(Table 3). Herewith we refer to these geographicpopulations as Mesoamerica, Central America, Carib-bean, western Mexico, Andean, and eastern Brazil.
The AMOVA rejected the null hypothesis that thesix studied populations are homogenous. The greatermajority (63.78%) of the total variation in the mtDNAdata were attributed to the differences among thegroups (Table 3) when we consider six geographicpopulations. A signiÞcant proportion of variation wasalso seen among populations (24.93%) and within pop-ulations (11.30%).Population Summary Statistics and Inferred His-tory for the Six Populations. Mesoamerica Population.We documented 14 haplotypes from the 43 individualscollected from nine geographic sites in Mesoamerica(Table 2; Supp. Fig. 1 [online only]). Eleven of thesehaplotypes were unique (i.e., private) to a site and
2152 JOURNAL OF ECONOMIC ENTOMOLOGY Vol. 105, no. 6
Dow
nloaded from https://academ
ic.oup.com/jee/article/105/6/2147/797704 by guest on 28 M
ay 2022
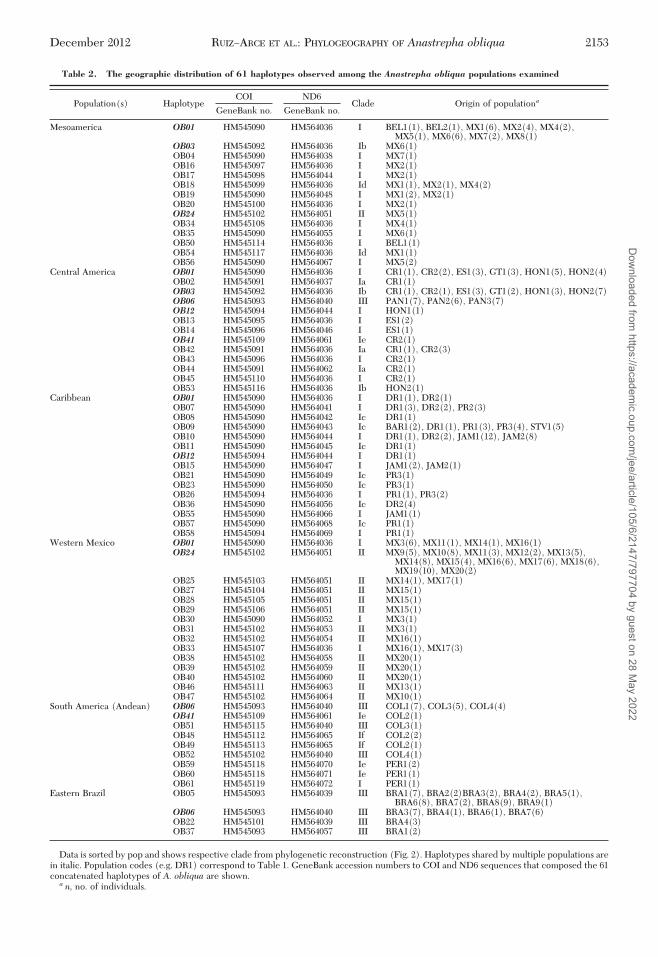
Table 2. The geographic distribution of 61 haplotypes observed among the Anastrepha obliqua populations examined
Population(s) HaplotypeCOI ND6
Clade Origin of populationaGeneBank no. GeneBank no.
Mesoamerica OB01 HM545090 HM564036 I BEL1(1), BEL2(1), MX1(6), MX2(4), MX4(2),MX5(1), MX6(6), MX7(2), MX8(1)
OB03 HM545092 HM564036 Ib MX6(1)OB04 HM545090 HM564038 I MX7(1)OB16 HM545097 HM564036 I MX2(1)OB17 HM545098 HM564044 I MX2(1)OB18 HM545099 HM564036 Id MX1(1), MX2(1), MX4(2)OB19 HM545090 HM564048 I MX1(2), MX2(1)OB20 HM545100 HM564036 I MX2(1)OB24 HM545102 HM564051 II MX5(1)OB34 HM545108 HM564036 I MX4(1)OB35 HM545090 HM564055 I MX6(1)OB50 HM545114 HM564036 I BEL1(1)OB54 HM545117 HM564036 Id MX1(1)OB56 HM545090 HM564067 I MX5(2)
Central America OB01 HM545090 HM564036 I CR1(1), CR2(2), ES1(3), GT1(3), HON1(5), HON2(4)OB02 HM545091 HM564037 Ia CR1(1)OB03 HM545092 HM564036 Ib CR1(1), CR2(1), ES1(3), GT1(2), HON1(3), HON2(7)OB06 HM545093 HM564040 III PAN1(7), PAN2(6), PAN3(7)OB12 HM545094 HM564044 I HON1(1)OB13 HM545095 HM564036 I ES1(2)OB14 HM545096 HM564046 I ES1(1)OB41 HM545109 HM564061 Ie CR2(1)OB42 HM545091 HM564036 Ia CR1(1), CR2(3)OB43 HM545096 HM564036 I CR2(1)OB44 HM545091 HM564062 Ia CR2(1)OB45 HM545110 HM564036 I CR2(1)OB53 HM545116 HM564036 Ib HON2(1)
Caribbean OB01 HM545090 HM564036 I DR1(1), DR2(1)OB07 HM545090 HM564041 I DR1(3), DR2(2), PR2(3)OB08 HM545090 HM564042 Ic DR1(1)OB09 HM545090 HM564043 Ic BAR1(2), DR1(1), PR1(3), PR3(4), STV1(5)OB10 HM545090 HM564044 I DR1(1), DR2(2), JAM1(12), JAM2(8)OB11 HM545090 HM564045 Ic DR1(1)OB12 HM545094 HM564044 I DR1(1)OB15 HM545090 HM564047 I JAM1(2), JAM2(1)OB21 HM545090 HM564049 Ic PR3(1)OB23 HM545090 HM564050 Ic PR3(1)OB26 HM545094 HM564036 I PR1(1), PR3(2)OB36 HM545090 HM564056 Ic DR2(4)OB55 HM545090 HM564066 I JAM1(1)OB57 HM545090 HM564068 Ic PR1(1)OB58 HM545094 HM564069 I PR1(1)
Western Mexico OB01 HM545090 HM564036 I MX3(6), MX11(1), MX14(1), MX16(1)OB24 HM545102 HM564051 II MX9(5), MX10(8), MX11(3), MX12(2), MX13(5),
MX14(8), MX15(4), MX16(6), MX17(6), MX18(6),MX19(10), MX20(2)
OB25 HM545103 HM564051 II MX14(1), MX17(1)OB27 HM545104 HM564051 II MX15(1)OB28 HM545105 HM564051 II MX15(1)OB29 HM545106 HM564051 II MX15(1)OB30 HM545090 HM564052 I MX3(1)OB31 HM545102 HM564053 II MX3(1)OB32 HM545102 HM564054 II MX16(1)OB33 HM545107 HM564036 I MX16(1), MX17(3)OB38 HM545102 HM564058 II MX20(1)OB39 HM545102 HM564059 II MX20(1)OB40 HM545102 HM564060 II MX20(1)OB46 HM545111 HM564063 II MX13(1)OB47 HM545102 HM564064 II MX10(1)
South America (Andean) OB06 HM545093 HM564040 III COL1(7), COL3(5), COL4(4)OB41 HM545109 HM564061 Ie COL2(1)OB51 HM545115 HM564040 III COL3(1)OB48 HM545112 HM564065 If COL2(2)OB49 HM545113 HM564065 If COL2(1)OB52 HM545102 HM564040 III COL4(1)OB59 HM545118 HM564070 Ie PER1(2)OB60 HM545118 HM564071 Ie PER1(1)OB61 HM545119 HM564072 I PER1(1)
Eastern Brazil OB05 HM545093 HM564039 III BRA1(7), BRA2(2)BRA3(2), BRA4(2), BRA5(1),BRA6(8), BRA7(2), BRA8(9), BRA9(1)
OB06 HM545093 HM564040 III BRA3(7), BRA4(1), BRA6(1), BRA7(6)OB22 HM545101 HM564039 III BRA4(3)OB37 HM545093 HM564057 III BRA1(2)
Data is sorted by pop and shows respective clade from phylogenetic reconstruction (Fig. 2). Haplotypes shared by multiple populations arein italic. Population codes (e.g. DR1) correspond to Table 1. GeneBank accession numbers to COI and ND6 sequences that composed the 61concatenated haplotypes of A. obliqua are shown.a n, no. of individuals.
December 2012 RUIZÐARCE ET AL.: PHYLOGEOGRAPHY OF Anastrepha obliqua 2153
Dow
nloaded from https://academ
ic.oup.com/jee/article/105/6/2147/797704 by guest on 28 M
ay 2022
three were shared among collection sites (Table 2).Fst values were relatively low (0Ð0.18145) and notsigniÞcant for most pairwise comparisons of siteswithin the Mesoamerican population. This is consis-tent with the low average genetic diversity (2.4 bases)and prevalence of a common haplotype (OB01)within the population.
The only site with evidence of population structurewas the Agua Blanca, Tabasco (MX5; site 31) collec-tion. Comparison with four other sites (MX1, MX2,MX3, and MX4) resulted in signiÞcant Fst values(0.1599Ð0.31214; P 0.05).Within this collection, oneindividual possessed the unique haplotype OB24. Thishaplotype varies by 26Ð30 bases (1.7Ð1.9%) whencompared with all other haplotypes sampled fromMesoamerica. We note that OB24 was seen in higherfrequency in collections from western Mexico andclusters among haplotypes belonging to clade II (Fig.2). As a point of reference, when we discounted hap-lotype OB24, the remaining haplotypes differed by anaverage of 1.3 bases. Additional haplotypes that wereshared with other populations included OB01 andOB03. The OB01 haplotype was seen in the Caribbean(n 2), Central America (n 18), and westernMexico (n 9) populations, and OB03 was present inonly one individual within the Mesoamerica popula-tion but was seen in 17 ßies gathered from the CentralAmerica population.
Within Mesoamerica there is an abundance of lowfrequency haplotypes (Table 2) that are closely re-lated (Fig. 2) to the common haplotype (OB01). Thepresence of one dominant haplotype and many lowfrequency haplotypes is typical for species that haveundergone a bottleneck event and subsequent expan-sion. We investigated this hypothesis by testing fordeparture from neutrality via demographic analyses
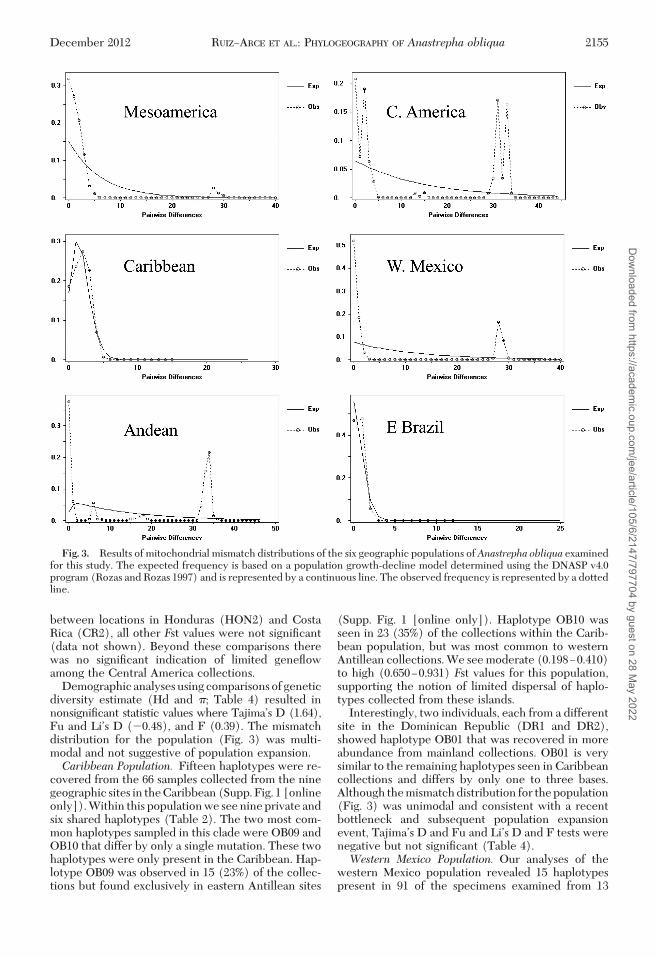
and examining the mismatch distribution of these hap-lotypes. Demographic analyses for this population us-ing haplotype (Hd) and nucleotide (�) diversity es-timates revealed signiÞcant values for TajimaÕs D(�2.52; P 0.001), Fu and LiÕs D (�4.47; P 0.02),and Fu and LiÕs F (�4.51; P 0.02) tests (Table 4).These signiÞcantnegativevalues support anexpansionhypothesis. Sequences within this population pro-vided a mismatch distribution that is for the most partunimodal (Fig. 3) and would be consistent with thedistribution under a model of sudden population ex-pansion (Slatkin and Hudson 1991), further support-ing demographic results. One small peak at �30 baseswas the mismatch produced by the very differenthaplotype (OB24) discussed earlier.Central America Population. There were 13 haplo-
types in the 69 individuals sampled from the ninegeographic sites (Table 2; Supp. Fig. 1 [online only])in Central America. Nine of the 13 haplotypes wereprivate to a site and the remaining four were sharedamong sites. Similar to the Mesoamerican population,haplotype OB01 was common in Central America,occurring in 18 (26%) of the samples examined andrepresented in all of the geographic sites sampled fromthis population except Panama.
Among Central American sites, only comparisonsbetween the Panamanian and non-Panamanian col-lections produced very high (0.91407Ð0.98487) andsigniÞcant Fst values (P 0.05). The OB06 haplotypesampled from Panama (Table 2) is characteristic ofeastern Brazil and present in the Andean population.This OB06 haplotype differs from other haplotypessampled in Panama by 30 (1.9%) to 34 (2.2%) bases.On average, haplotypes within Panama differ by 2.1bases when OB06 is excluded. With the exception ofa signiÞcant but relatively low Fst value (0.17025)
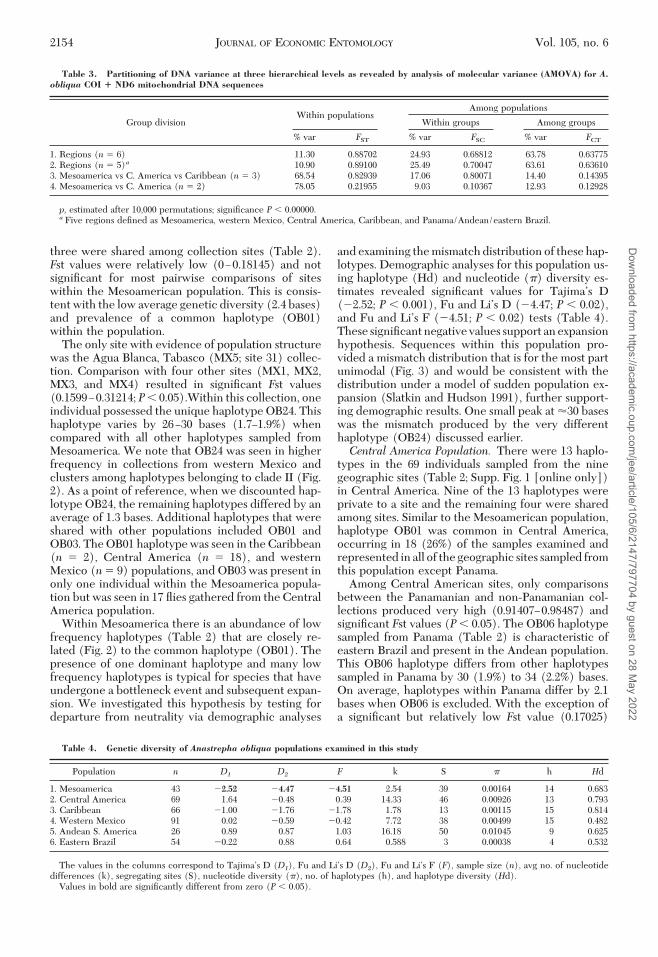
Table 3. Partitioning of DNA variance at three hierarchical levels as revealed by analysis of molecular variance (AMOVA) for A.obliqua COI � ND6 mitochondrial DNA sequences
Group divisionWithin populations
Among populations
Within groups Among groups
% var FST % var FSC % var FCT
1. Regions (n 6) 11.30 0.88702 24.93 0.68812 63.78 0.637752. Regions (n 5)a 10.90 0.89100 25.49 0.70047 63.61 0.636103. Mesoamerica vs C. America vs Caribbean (n 3) 68.54 0.82939 17.06 0.80071 14.40 0.143954. Mesoamerica vs C. America (n 2) 78.05 0.21955 9.03 0.10367 12.93 0.12928
p, estimated after 10,000 permutations; signiÞcance P 0.00000.a Five regions deÞned as Mesoamerica, western Mexico, Central America, Caribbean, and Panama/Andean/eastern Brazil.
Table 4. Genetic diversity of Anastrepha obliqua populations examined in this study
Population n D1 D2 F k S � h Hd
1. Mesoamerica 43 �2.52 �4.47 �4.51 2.54 39 0.00164 14 0.6832. Central America 69 1.64 �0.48 0.39 14.33 46 0.00926 13 0.7933. Caribbean 66 �1.00 �1.76 �1.78 1.78 13 0.00115 15 0.8144. Western Mexico 91 0.02 �0.59 �0.42 7.72 38 0.00499 15 0.4825. Andean S. America 26 0.89 0.87 1.03 16.18 50 0.01045 9 0.6256. Eastern Brazil 54 �0.22 0.88 0.64 0.588 3 0.00038 4 0.532
The values in the columns correspond to TajimaÕs D (D1), Fu and LiÕs D (D2), Fu and LiÕs F (F), sample size (n), avg no. of nucleotidedifferences (k), segregating sites (S), nucleotide diversity (�), no. of haplotypes (h), and haplotype diversity (Hd).
Values in bold are signiÞcantly different from zero (P 0.05).
2154 JOURNAL OF ECONOMIC ENTOMOLOGY Vol. 105, no. 6
Dow
nloaded from https://academ
ic.oup.com/jee/article/105/6/2147/797704 by guest on 28 M
ay 2022
between locations in Honduras (HON2) and CostaRica (CR2), all other Fst values were not signiÞcant(data not shown). Beyond these comparisons therewas no signiÞcant indication of limited geneßowamong the Central America collections.
Demographicanalysesusingcomparisonsofgeneticdiversity estimate (Hd and �; Table 4) resulted innonsigniÞcant statistic values where TajimaÕs D (1.64),Fu and LiÕs D (�0.48), and F (0.39). The mismatchdistribution for the population (Fig. 3) was multi-modal and not suggestive of population expansion.Caribbean Population. Fifteen haplotypes were re-
covered from the 66 samples collected from the ninegeographic sites in the Caribbean (Supp. Fig. 1 [onlineonly]). Within this population we see nine private andsix shared haplotypes (Table 2). The two most com-mon haplotypes sampled in this clade were OB09 andOB10 that differ by only a single mutation. These twohaplotypes were only present in the Caribbean. Hap-lotype OB09 was observed in 15 (23%) of the collec-tions but found exclusively in eastern Antillean sites
(Supp. Fig. 1 [online only]). Haplotype OB10 wasseen in 23 (35%) of the collections within the Carib-bean population, but was most common to westernAntillean collections. We see moderate (0.198Ð0.410)to high (0.650Ð0.931) Fst values for this population,supporting the notion of limited dispersal of haplo-types collected from these islands.
Interestingly, two individuals, each from a differentsite in the Dominican Republic (DR1 and DR2),showed haplotype OB01 that was recovered in moreabundance from mainland collections. OB01 is verysimilar to the remaining haplotypes seen in Caribbeancollections and differs by only one to three bases.Although the mismatch distribution for the population(Fig. 3) was unimodal and consistent with a recentbottleneck and subsequent population expansionevent, TajimaÕs D and Fu and LiÕs D and F tests werenegative but not signiÞcant (Table 4).Western Mexico Population. Our analyses of the
western Mexico population revealed 15 haplotypespresent in 91 of the specimens examined from 13
Fig. 3. Results of mitochondrial mismatch distributions of the six geographic populations ofAnastrepha obliqua examinedfor this study. The expected frequency is based on a population growth-decline model determined using the DNASP v4.0program (Rozas and Rozas 1997) and is represented by a continuous line. The observed frequency is represented by a dottedline.
December 2012 RUIZÐARCE ET AL.: PHYLOGEOGRAPHY OF Anastrepha obliqua 2155
Dow
nloaded from https://academ
ic.oup.com/jee/article/105/6/2147/797704 by guest on 28 M
ay 2022
geographic sites (Table 2; Supp. Fig. 3 [online only]).Haplotype OB24, the most common haplotype, wasseen in all 13 geographic collections and in 65 (72%)of the individuals sampled from this region. OB24 wasdistributed evenly among northern and southern re-gions within western Mexico collections. The majorityof pairwise comparisons for this population yieldedrelatively low and insigniÞcant Fst values (0.22727).The collection from Michipan, Morelos (MX3, site 29)in southern Mexico generated signiÞcant Fst values(0.4322Ð0.87452) for all pairwise comparisons in thepopulation. The signiÞcant and high estimates aremost likely because of the presence of haplotypesOB01 and OB30 in Michipan that differed to otherhaplotypes by as much as 27 (1.7%) to 30 (1.9%) bases.Of the eight ßies examined from Michipan, six showedthe OB01 haplotype and one showed OB30. As seenearlier, OB01 is characteristic of haplotypes occurringin a greater abundance in Mesoamerica and CentralAmerica. Three additional ßies, each from a differentsite (MX11, 14, 16) within the western Mexico pop-ulation also showed OB01.
The only other comparison within western Mexicothat yielded a signiÞcant Fst value (0.24528) was be-tween MX11 (site 37) and MX19 (site 45). OB01 wasseen in one of the four individuals collected in LaPalma,Guerrero(MX11)andmayhavecontributed tothe signiÞcant result. While both OB01 and OB30share a high degree of similarity to each other and toOB33 (present in MX16 and 17) all three differ sub-stantially from the remaining haplotypes recovered inwestern Mexico. Additionally, these three haplotypescluster among those pertaining to clade I (Fig. 2) thatis populated mostly by sequences from individualsgathered in Mesoamerica, Central America, and Ca-ribbean. The remaining haplotypes for the westernMexico population are in clade II. The overall lowdiversity estimates, low Fst values for a majority of thecollections, and the presence of one abundant haplo-type would thus suggest that this population ishighly homogeneous. Like the Central Americanpopulation, there was no evidence of populationexpansion in this region because of a multi-modalmismatch distribution (Fig. 3) and genetic diversityestimates that are consistent with expectations un-der neutral theory (Table 4).Andean South America Population. Twenty-six
specimens from Þve geographic sites were analyzedfor this population (Supp. Fig. 2 [online only]). Werecovered nine haplotypes from these individuals (Ta-ble 2). Seven of these nine haplotypes were private toa site in the Andean population. Both OB06 and OB41haplotypes are shared among different populationsbut only OB06 is shared among sites within the An-dean population. The nine haplotypes represent twoof the three major clades (I and III). Genetic diver-gence between two haplotypes sampled in the Andescan be as great as 35 (2.3%) bases.
Haplotype OB06 was seen in 16 (62%) specimenscollected from three sites in Colombia: COL1, COL3,and COL4. The Fst values were relatively low amongthese three sites (Fst 0.07285; P � 0.05) suggesting
little or no population structure. Pairwise comparisonsbetween these three sites and either COL2 or COL5,however, resulted in high Fst values (0.83871Ð0.91704;P 0.05). Haplotype OB06, sharing a high degree ofsimilarity to OB51 and OB52, was present at highfrequencies in Panama and eastern Brazil populationsand clusters among haplotypes within clade III.
Only one other haplotype was shared among dif-ferent populations. Haplotype OB41, showing a sim-ilarity to OB59 and OB60, was present in samples fromColombia and Central America as previously men-tioned. These last three haplotypes form subclade Ie.Haplotypes OB48, OB49, [co-occurring at one site inColombia (COL2)] and OB61 [originating in Peru(PER1)] all cluster among haplotypes belonging toclade I. The mismatch distribution is multi-modal forthe population and values for TajimaÕs D (0.89), Fuand LiÕs F (1.03), and Fu and LiÕs D (0.87) werepositive and not signiÞcant (Table 4).Eastern Brazil Population. Four haplotypes were
observed from the 54 Brazilian individuals examinedin our study. Only two haplotypes (OB22 and OB37)were private to a site (Table 2). In eastern Brazil,haplotypeOB05was seen in34(63%)of the specimensand present at all sites. OB06 was found in 15 (28%)of the ßies examined in eastern Brazil. This haplotypewas also seen in the Andean and Central Americapopulations, as mentioned previously. No other hap-lotype from this population was shared.
Pairwise comparisons for the nine sampled sitesrevealed moderate to high Fst values (0.27095Ð0.75000). Eleven out of 36 Fst values were signiÞcant,supporting population structure in eastern Brazil(Data not shown). Geographically similar sites (e.g.,sites 4 and 11, sites 6 and 10, and sites 5, 8, and 9) werenot signiÞcantly different based on Fst values. Moredistant sites tended to be genetically different (e.g.,sites 4 and 10) but this was not always true (e.g., sites4 and 5). Like the Caribbean population, there wasevidence of a bottleneck and population expansionbased on the mismatch distribution (Fig. 3). However,the analyses used to detect the demographic historywere positive and not signiÞcant (Table 4).
Discussion
This study provides the Þrst substantial look into theanalysis of West Indian fruit ßy mtDNA diversity andreveals information on the genetic structure of pop-ulations throughout its geographic range. We havedemonstrated that the two mtDNA regions used in ourstudy provide sufÞcient data to measure variationwithin and between populations of the species. Usingour concatenated COI � ND6 marker, we sampled 61haplotypes and identiÞed relatively large genetic dif-ferences among haplotypes. Phylogenetic analysis ofthe mtDNA variation resulted in topologies that sug-gest strong barriers to movement within the species.
The phylogenies from the dataset suggest three dis-tinct clades within A. obliqua. These three clades canbe summarized as containing collections from Meso-america, Central America, Andean South America,
2156 JOURNAL OF ECONOMIC ENTOMOLOGY Vol. 105, no. 6
Dow
nloaded from https://academ
ic.oup.com/jee/article/105/6/2147/797704 by guest on 28 M
ay 2022
and Caribbean (clade I), western Mexico (clade II),and South America and Panama (clade III) regions.Clade I includes a subclade (Ie) that is important forunderstanding an Andean South American popula-tion. The haplotype lineages are not entirely diagnos-tic of A. obliqua geographies because we see sharedhaplotypes among populations and presence of mul-tiple populations in these clades. The imperfect rela-tionship between geography and genetics is mostlikely because of either the overlapping distribution ofpopulations or from introductions among populationsrecovered through our sampling. This is a pest insectinfesting cultivated fruits, so human-mediated disper-sal is certainly possible.
Our investigation of population structure within A.obliqua supports six distinct populations: Mesoamer-ica, Central America, Caribbean, western Mexico, An-dean South America, and eastern Brazil. We observeda large portion of the haplotypes having geographicassociation and thereby providing evidence for pop-ulation genetic structure. Many of the haplotypes wesampled are private, being present only at one site orregion. We must, however, mention that our delinea-tion of populations according to broad geography ismerely one view and other spatial, ecological, andtemporal characters could be important for deÞningpopulations. It is unclear if the genotypes we sampledreßect ecological or taxonomic boundaries within A.obliqua. It may be that ßies with more closely relatedgenotypes (clades II and III) behave more similar thanother ßies, but additional data are required to evaluatethat hypothesis.
Our data supports close association among the Me-soamerican, Central American, Andean, and Carib-bean populations. If we concern our focus on theMesoamerica and Central America populations, wesee the predominance of one haplotype, OB01 thatwas recovered from 83% of the sites sampled. Onepossible explanation for this high frequency is that thishaplotype is associated with a range expansion. Thismay be supported in Mesoamerica collections by pop-ulation demographic analyses where unimodal mis-match distributions (when we consider that a secondpeak is represented by individuals from the westernMexico population) and the general topological na-ture in the phylogenetic reconstruction of haplotypeshelp to explain the large presence of OB01.
Furthermore, among those haplotypes characteris-tic to Central America we see the large presence ofOB06 in Panama. This considerably different haplo-type (to others recovered in Central America) wasfound in collections that were made in Panama duringthe 2006 season. Additional sampling is needed to helpreveal the movement of this and other haplotypes overtime in this area. This haplotype was also seen inColombia and found in greater abundance in easternBrazil.
The haplotypes occurring in the Caribbean differonly slightly to haplotypes from Mesoamerica andCentral America populations. Our analyses show thatthe genetic diversity (Hd) among island populationsis slightly higher than in mainland, and do not thereby
refute the hypothesis that this species originated in theWest Indies. Although our results on haplotype diver-sity suggest that the origin of this ßy may be centeredin the Caribbean, most likely in the Greater Antilles,we detect structure within the islands that suggestreproductive isolation between east and west collec-tion sites (Supp. Fig. 1 [online only]). Additionalsampling is needed in the Lesser Antilles and Hispan-iola and throughout mainland populations to test thishypothesis using character-based and molecularmethods.
Haplotypes recovered from the Andean SouthAmerica population cluster among clades I and III andrepresent substantially different genetic types, someco-occurring among sites sampled. Thus, diversity es-timates and population structure were justiÞablyhigh. This area may represent a hub or intersection ofdistinct populations resulting in high diversity. Hap-lotypes having a high degree of similarity to Meso-america and the Caribbean and shared among CentralAmerica and eastern Brazil populations would supportthis scenario. We have insufÞcient information here toproperly determine whether an individual should beconsidered as an introduction and may be part of thenatural distribution for this or other populations, fur-ther studies are needed.
Collections from the western Mexico populationyielded a considerably lower haplotype and nucleo-tide diversity when compared with other populationsexamined in this study. The presence of one abundanthaplotype (OB24) results in a high degree of homo-geneity among collections. The remaining low fre-quency, closely related haplotypes occurred in both ofthe northern and southern regions of western Mexico.Demographic statistics and mismatch distribution donot support a recent bottleneck event in the history ofthis ßy yet the arrangement of haplotypes sampledfrom this region suggests a recent population expan-sion. A rapid population expansion during the 20thcentury would be consistent with the recent intro-duction of mango, a primary host for this ßy, into theregion (Baker et al. 1944). This population expansionhypothesis does not mean that the presence of A.obliqua in the area is the result of a 20th centuryintroduction of the ßy. It is possible that the ßy wasintroduced into the region after the introduction ofmango and exploited the new resource. Alternatively,this population could have persisted in low frequen-cies and began to ßourish after additional host materialwas introduced into the region and habitats in westernMexico became more suitable for expansion. We donote that this western Mexico population was quitedistinct from others identiÞed in this study (�15bases), thereby supporting the hypothesis of a resi-dent population before the introduction of mango.
A few haplotypes in western Mexico were private toa site (that could be a sample size phenomenon) butwe did not see any distribution pattern or signiÞcantassociation with geography for this population. Thelack of genetic diversity shown by individuals withinthe western Mexico population may be because of theisolation provided by the physical barriers imposed to
December 2012 RUIZÐARCE ET AL.: PHYLOGEOGRAPHY OF Anastrepha obliqua 2157
Dow
nloaded from https://academ
ic.oup.com/jee/article/105/6/2147/797704 by guest on 28 M
ay 2022
the east by the Sierra Madre Occidental and Oriental,Mexican trans-volcanic belt as well as the shifts inhabitat because of recent climate change (Axelrod1979, Graham 1999). Over the last 50,000 yr ecologicalchanges in this region were because of expansion ofSonoran vegetation (Axelrod 1979). This has resultedin fragmentation to woodlands and dry forests char-acteristically inhabited by hosts of this species. Thehabitats have fragmented thus limiting gene ßowamong these populations reducing their diversities.
Of particular importance to management of thisspecies and to regulatory agencies is the level of ge-netic variation among populations this study revealed.The considerable genetic difference observed maytranslate to variation in pestiferous behavior. The dis-parity among populations may even correlate to vari-ation in characteristics key to managing this pest suchas host preference and mating behavior. Aluja andBirke (1993) reported that mating time was during themorning hours for this species in Central Americawhile A. Malavasi (personal communication) has de-termined that the mating activities from this species inBrazil occurs in the afternoon. The current manage-ment strategies for this ßy include the sterile insecttechnique (SIT) that relies greatly on the competi-tiveness of the mass-reared ßies (Hernandez et al.2007). Variation in mating behavior and genotypecould translate into a mass-reared ßy whose matingschedule is not synchronized or Þt to compete withthe feral population. It then becomes critically impor-tant to match according to genetic types and thusmore information is needed to assess the variationseen among the populations we identiÞed.
Although not explicitly stated, previous work bySmithÐCaldas et al. (2001) suggested that A. obliquacould be a genetically diverse lineage or even a speciescomplex like A. fraterculus. That study, however, didnot examine this possibility with sufÞcient samplesand markers. The magnitude of the genetic diver-gences amongA. obliqua clades in our study exceededthose previously reported and raises the question ofthe taxonomic status of this species. Divergence valuescalculated between other species in the fraterculusspecies group using a concatenated COI and ND6 dataset generated values similar to divergences betweenhaplotypes of A. obliqua clades (not shown). Whilethese differences are substantial and raise importantquestions that merit additional research, we have notsuggested that our genetic data alone justify speciÞcstatus for these clades. Rather, our data generate hy-potheses that should now be tested using a variety ofmorphologic, behavioral, and additional genetic traitsto clarify the evolutionary history ofA.obliqua.We arecontinuing to examine this issue using additional sam-ples and markers to speciÞcally test species limits forA. obliqua.
The volume of geographic sites sampled and se-quences yielded from this study are substantial. Thepotential for this information having a major impact inthe development of diagnostic tools for this and otherclosely related species is considerably high given the44 haplotypes that are unique to sites and the strong
association of genetic clades with geographic regions.Use of informative mtDNA regions such as these havebeen the foundation for various studies that result inthe development of genetic markers that can be usedto discriminate among geographic collections (Bon-izzoni et al. 2000, Gasparich et al. 1994, McPheron etal. 1994). Additional work is needed to properly assessthe biology behind these lineages. At this time, thereare no morphological analyses that can correlate thedistinctions seen in this study. An in-depth compre-hensive review of discriminating taxonomic charac-ters from these groups plus additional unlinked loci isneeded and may provide further evidence as to theidentity of individuals within these six populations.This information would test the hypotheses of long-term isolation of these groups within the regions andmay provide further clariÞcation into the history ofthis ßy.
Acknowledgments
We thank Roxanne E. GarzaÐFarris, Rosita De Leon, JuanD. Vasquez, Lisa A. Ledezma, and Oscar Obregon for pro-viding DNA extracts from the USDAÐAPHISÐCPHST Mis-sion Laboratory in Edinburg, TX; Samuel Gum and OraliaRuiz for technical assistance at Penn State University; Deb-orah S. Grove, Director of the Genomics Core Facility; andAshley Price and Sheila Plock, The Pennsylvania State Uni-versity-Huck Institute Nucleic Acid Facility. We also thankWilliam Dombro at Worthington Biochemical. We are alsograteful to the two anonymous colleagues from this journalthat reviewed our manuscript. Funding for this study camefrom the USDAÐAPHISÐCPHST, PIC#M6M02, USDA/PennState cooperative agreement 07-8100-1051-CA, and the Al-fred P. Sloan Foundation. The use or mention of a trademarkor proprietary product does not constitute an endorsement,guarantee, or warranty of the product and does not imply itsapproval to the exclusion of other suitable products by theU.S. Department of Agriculture, an equal opportunity em-ployer.
References Cited
Akaike, H. 1974. New look at statistical-model identiÞca-tion. IEEE Trans. Automatic Cont. AC 19: 716Ð723.
Alberti, A. C., V. A. Confalonieri, R. O. Zandomeni, and J. C.Vilardi. 2008. Phylogeographic studies on natural pop-ulations of the South American fruit ßy,Anastrepha frater-culus (Diptera: Tephritidae). Genetica 132: 1Ð8.
Aluja, M., H. Celedonio–Hurtado, P. Liedo, M. Cabrera, F.Castillo, J. Guill, and E. Rios. 1996. Seasonal populationßuctuations and ecological implications for managementof Anastrepha fruit ßies (Diptera: Tephritidae) in com-mercial mango orchards in southern Mexico. J. Econ.Entomol. 89: 654Ð667.
Aluja, M. 1994. Bionomics and management of Anastrepha.Annu. Rev. Entomol. 39: 155Ð178.
Aluja, M., and B. Birke. 1993. Habitat use by adults of Anas-trepha obliqua (Diptera: Tephritidae) in a mixed mangoand tropical plum orchard. Ann. Entomol. Soc. Am. 86:799Ð812.
Axelrod, D. I. 1979. Age and origin of Sonoran Desert veg-etation. Occas. Pap. Calif. Acad. Sci. 132: 1Ð74.
Baker, A. C., W. E. Stone, C. C. Plummer, and M. McPhail.1944. A review of studies on the Mexican fruit ßy and
2158 JOURNAL OF ECONOMIC ENTOMOLOGY Vol. 105, no. 6
Dow
nloaded from https://academ
ic.oup.com/jee/article/105/6/2147/797704 by guest on 28 M
ay 2022
related Mexican species. U.S. Dep. Agric. Misc. Publ. 531:1Ð155.
Barr,N. B. 2009. Pathway analysis ofCeratitis capitata (Dip-tera: Tephritidae) using mitochondrial DNA. J. Econ.Entomol. 102: 401Ð411.
Barr, N. B., R. S. Copeland, M. De Meyer, D. Masiga, H. G.Kibogo, M. K. Billah, E. Osir, R. A. Wharton, and B. A.McPheron. 2006. Molecular diagnostics of economicallyimportant Ceratitis fruit ßy species (Diptera: Tephriti-dae) in Africa using PCR and RFLP analyses. Bull. En-tomol. Res. 96: 505Ð521.
Barr, N. B., and B. A. McPheron. 2006. Molecular phyloge-netics of the genus Ceratitis (Diptera: Tephritidae). Mol.Phylogenet. Evol. 38: 216Ð230.
Barr, N. B., L.W.Cui, andB.A.McPheron. 2005. Molecularsystematics of nuclear gene period in genus Anastrepha(Tephritidae). Ann. Entomol. Soc. Am. 98: 173Ð180.
Bonizzoni, M., A. R. Malacrida, C. R. Guglielmino, L. M.Gomulski, G. Gasperi, and L. Zheng. 2000. Microsatel-lite polymorphism in the Mediterranean fruit ßy,Ceratitiscapitata. Insect Mol. Biol. 9: 251Ð261.
Boykin,L.M.,R.G.Shatters,D.G.Hall,R.E.Burns, andR.A.Franqui. 2006. Analysis of host preference and geo-graphical distribution of Anastrepha suspensa (Diptera:Tephritidae) using phylogenetic analyses of mitochon-drial cytochrome oxidase I DNA sequence data. Bull.Entomol. Res. 96: 457Ð469.
Excoffier,L., P.E. Smouse, and J.M.Quattro. 1992. Analysisof molecular variance inferred from metric distancesamong DNA haplotypes: application to human mitochon-drial-DNA restriction data. Genetics 131: 479Ð491.
Feder, J. L., S. H. Berlocher, J. B. Roethele, H. Dambrowski,J. J. Smith, W. L. Perry, V. Gavrilovic, K. E. Filchak, J.Rull, and M. Aluja. 2003. Allopatric genetic origins forsympatric host-plant shifts and race formation in Rhago-letis. Proc. Nat. Acad. Sci. U.S.A. 100: 10314Ð10319.
Felsenstein, J. 1985. Phylogenies from gene-frequencies: astatistical problem. Syst. Zool. 34: 300Ð311.
Foote, R. H., F. L. Blanc, and A. L. Norrbom. 1993. Hand-book of the fruit ßies (Diptera: Tephritidae) of AmericaNorth of Mexico. Comstock, Ithaca, NY.
FU, Y. X., and W. H. LI. 1993. Statistical tests of neutralityof mutations. Genetics 133: 693Ð709.
Gasparich, G. E.,W. S. Sheppard,H-Y.Han, B. A.McPheron,and G. J. Steck. 1994. Analysis of mitochondrial DNAand development of PCR-based diagnostic markers forMediterranean fruit ßy (Ceratitis capitata) populations.Insect Mol. Biol. 4: 61Ð67.
Graham, A. 1999. The tertiary history of the northern tem-perate element in the northern Latin American biota.Am. J. Bot. 86: 32Ð38.
Guindon, S., and O. Gascuel. 2003. A simple, fast, and ac-curate algorithm to estimate large phylogenies by maxi-mum likelihood. Syst. Biol. 52: 696Ð704.
Han, H-Y., and B. A. McPheron. 1999. Molecular data as atool to test phylogenetic relationships among highergroups of Tephritidae: a case study using mitochondrialribosomal DNA sequences, pp. 115Ð132. InM. Aluja andA. L. Norrbom (eds.), Fruit Flies (Tephritidae): Phylog-eny and Evolution of Behavior. CRC, Boca Raton, FL.
Hernandez, E., D. Orozco, S. F. Breceda, and J. Dominguez.2007. Dispersal and longevity of wild and mass-rearedAnastrepha ludens and Anastrepha obliqua (Diptera: Te-phritidae). Fla. Entomol. 90: 123Ð135.
Hernandez–Ortiz, V., J. A. Gomez–Anaya, A. Sanchez, B. A.McPheron, and M. Aluja. 2004. Morphometric analysisof Mexican and South American populations of theAnas-trepha fraterculus complex (Diptera: Tephritidae) and
recognition of a distinct Mexican morphotype. Bull. En-tomol. Res. 94: 487Ð499.
Hernandez–Ortiz, V., and M. Aluja. 1993. Lista preliminarde especies del genero Neotropical Anastrepha (Dip-tera: Tephritidae) con notas sobre su distribucion yplantas hospederas. Folia Entomol. Mex. (Mexico). 88:89Ð105.
Kimura, M. 1983. Rare variant alleles in the light of theneutral theory. Mol. Biol. Evol. 1: 84Ð93.
Lanzavecchia, S. B., J. L. Cladera, P. Faccio, M. N. Petit, J. C.Vilardi, and R. O. Zandomeni. 2008. Origin and distri-bution of Ceratitis capitata mitochondrial DNA haplo-types in Argentina. Ann. Entomol. Soc. Am. 101: 627Ð638.
Lemmon, A. R., J. M. Brown, K. Stanger–Hall, and E. M.Lemmon. 2009. The effect of ambiguous data on phy-logenetic estimates obtained by maximum likelihood andBayesian inference. Syst. Biol. 58: 130Ð145.
Lewis, P. O., M. T. Holder, and K. E. Holsinger. 2005. Poly-tomies and Bayesian phylogenetic inference. Syst. Biol.54: 241Ð253.
Lutz, A., and A. M. Lima da Costa. 1918. Contribucao parao estudo das Tripaneidas (moscas de frutas) brazileiras.Mem. Inst. Oswaldo Cruz 10: 5Ð15.
Marshall,D.C. 2010. Cryptic failure of partitioned Bayesianphylogenetic analyses: lost in the land of long trees. Syst.Biol. 59: 108Ð117.
McPheron, B. A., H-Y. Han, J. G. Silva, and A. L. Norrbom.1999. Phylogeny of Anastrepha and Toxotrypana basedupon 16S rRNA mitochondrial DNA sequences, pp. 343Ð361. In M. Aluja and A. L. Norrbom (eds.), Fruit Flies(Tephritidae): Phylogeny and Evolution of Behavior.CRC, Oxford, London, United Kingdom.
McPheron, B. A., G. E. Gasparich, H-Y. Han, G. J. Steck, andW. S. Sheppard. 1994. Mitochondrial-DNA restrictionmap for the Mediterranean fruit ßy, Ceratitis capitata.Biochem. Genet. 32: 25Ð33.
Norrbom,A. L., andK.C. Kim. 1988. Revision of the schausigroup ofAnastrepha Schiner (Diptera, Tephritidae), witha discussion of the terminology of the female terminaliain the Tephritoidea. Ann. Entomol. Soc. Am. 81: 164Ð173.
Nylander, J.A.A., J. C.Wilgenbusch, D. L.Warren, andD. L.Swofford. 2008. AWTY (are we there yet?): a system forgraphical exploration of MCMC convergence in Bayesianphylogenetic inference. Bioinformatics 24: 581Ð583.
Posada, D. 2008. jModelTest: phylogenetic model averag-ing. Mol. Biol. Evol. 25: 1253Ð1256.
Rogers, A. R., and H. Harpending. 1992. Population growthmakes waves in the distribution of pairwise genetic dif-ferences. Mol. Biol. Evol. 9: 552Ð569.
Ronquist, F., and J. P. Huelsenbeck. 2003. MrBayes 3:Bayesian phylogenetic inference under mixed models.Bioinformatics 19: 1572Ð1574.
Rozas, J., J. C. Sanchez–DelBarrio, X. Messeguer, and R.Rozas. 2003. DnaSP, DNA polymorphism analyses bythe coalescent and other methods. Bioinformatics 19:2496Ð2497.
Segura, D. F., M. T. Vera, J. Rull, V. Wornoayporn, A. Islam,and A. S. Robinson. 2011. Assortative mating amongAnastrepha fraterculus (Diptera: Tephritidae) hybrids asa possible route to radiation of the fraterculus crypticspecies complex. Biol. J. Linn. Soc. 102: 346Ð354.
Sliva, J. G., and N. B. Barr. 2008. Recent advances in mo-lecular systematics of Anastrepha (Schiner). Fruit ßies ofeconomic importance: from basic to applied knowledge,pp. 13Ð28. Proceedings of the 7th International Sympo-sium on Fruit Flies of Economic Importance 10Ð15 Sep-tember 2006, Salvador, Brazil.
December 2012 RUIZÐARCE ET AL.: PHYLOGEOGRAPHY OF Anastrepha obliqua 2159
Dow
nloaded from https://academ
ic.oup.com/jee/article/105/6/2147/797704 by guest on 28 M
ay 2022
Slatkin, M., and R. R. Hudson. 1991. Pairwise comparisonsof mitochondrial-DNA sequences in stable and exponen-tially growing populations. Genetics 129: 555Ð562.
Smith–Caldas, M.R.B., B. A. McPheron, J. G. Silva, and R. A.Zucchi. 2001. Phylogenetic relationships among spe-cies of the fraterculus group (Anastrepha: Diptera:Tephritidae) inferred from DNA sequences of mitochon-drial cytochrome oxidase I. Neotrop. Entomol. 30: 565Ð573.
Steck, G. J. 2001. Concerning the occurrence of Anastrephaobliqua (Diptera: Tephritidae,) in Florida. Fla. Entomol.84: 320Ð321.
Stone, A. 1942. The fruit ßies of the genus Anastrepha. U.S.Dep. Agric. Misc. Publ. 439: 1Ð112.
Tajima, F. 1989. Statistical-method for testing the neutralmutation hypothesis by DNA polymorphism. Genetics123: 585Ð595.
Tamura, K., J.Dudley,M.Nei, and S.Kumar. 2007. MEGA4:molecular evolutionary genetics analysis (MEGA) soft-ware version 4.0. Mol. Biol. Evol. 24: 1596Ð1599.
Thompson, J. D., D. G. Higgins, and T. J. Gibson. 1994.Clustal-w improving the sensitivity of progressive multi-
ple sequence alignment through sequence weighting, po-sition-speciÞc gap penalties and weight matrix choice.Nucleic Acids Res. 22: 4673Ð4680.
Weir, B. S., and C. C. Cockerham. 1984. Estimating F-sta-tistics for the analysis of population-structure. Evolution38: 1358Ð1370.
White, I. M., and M. Elson–Harris. 1992. Fruit ßies of eco-nomic signiÞcance: their identiÞcation and bionomics.International Institute of Entomology, London, UnitedKingdom.
Wright, S. 1951. The genetical structure of populations.Ann. Eugenics 15: 323Ð354.
Xie, X., A. P. Michel, D. Schwarz, J. Rull, S. Velez, A. A.Forbes, and J. L. Feder. 2008. Radiation and divergencein the Rhagoletis pomonella species complex: inferencesfrom DNA sequence data. J. Evol. Biol. 21: 900Ð913.
Zwickl, D. J. 2006. Garli: genetic algorithm for rapid likeli-hood inference. (http://www.bio.utexas.edu/faculty/antisense/garli/Garli.html).
Received 23 May 2012; accepted 9 September 2012.
2160 JOURNAL OF ECONOMIC ENTOMOLOGY Vol. 105, no. 6
Dow
nloaded from https://academ
ic.oup.com/jee/article/105/6/2147/797704 by guest on 28 M
ay 2022