Human mtDNA site-specific variability values can act as haplogroup markers
10
HUMAN MUTATION 27(9), 965^974, 2006 METHODS Human mtDNA Site-Specific Variability Values Can Act as Haplogroup Markers Matteo Accetturo, 1 Monica Santamaria, 1 Daniela Lascaro, 1 Francesco Rubino, 1 Alessandro Achilli, 2 Antonio Torroni, 2 Mila Tommaseo-Ponzetta, 3 and Marcella Attimonelli 1 1 Dipartimento di Biochimica e Biologia Molecolare, Universita ` degli Studi di Bari, Bari, Italy; 2 Dipartimento di Genetica e Microbiologia, Universita ` di Pavia, Pavia, Italy; 3 Dipartimento di Zoologia, Universita ` degli Studi di Bari, Bari, Italy Communicated by Pui-Yan Kwok Sequencing of entire human mtDNA genomes has become rapid and efficient, leading to the production of a great number of complete mtDNA sequences from a wide range of human populations. We introduce here a new statistical approach for classifying mtDNA nucleotide sites, simply by comparing the mean simple deviation (MSD) of their specific variability values estimated on continent-specific dataset sequences, without the need for any reference sequence. Excellent correspondence was observed between sites with the highest MSD values and those marking known mtDNA haplogroups. This in turn supports the classification of 81 sites (23 in Africa, eight in Asia, eight in Europe, 34 in Oceania, and eight in America) as novel markers of 47mtDNA haplogroups not yet identified by phylogeographic studies. Not only does this approach allow refinement of mtDNA phylogeny, an essential requirement also for mitochondrial disease studies, but may greatly facilitate the discrimination of candidate disease-causing mutations from haplogroup-specific polymorphisms in mtDNA sequences of patients affected by mitochondrial disorders. Hum Mutat 27(9), 965–974, 2006. r r 2006 Wiley-Liss, Inc. KEY WORDS: mtDNA; site-specific variability; haplogroup markers; mtDNA mutations INTRODUCTION Due to the peculiar features of mitochondrial DNA (mtDNA) (maternal inheritance, absence of recombination, role in cellular energy production, and lack of an efficient repair system), analysis of mtDNA sequence variations has proven to be a powerful tool for investigating human origins and dispersals [Macaulay et al., 2005; Thangaraj et al., 2005; Forster and Matsumura, 2005] and identifying single mutations (or combinations of mutations) that either cause human diseases or play an important role in their expression [Howell et al., 2005; Wallace, 2005]. As regards evolutionary studies, the earliest mtDNA work began by digesting entire mtDNA with a number of restriction enzymes [Denaro et al., 1981; Johnson et al., 1983; Cann et al., 1987], sequencing the hypervariable segments (HVS-I and HVS-II) [Vigilant et al., 1991; Richards et al., 1998] of the D-loop, the main regulatory region of metazoan mitochondrial DNA, or using a combination of the two approaches [Torroni et al., 1993a,b, 1996; Macaulay et al., 1999; Richards et al., 2000; Quintana-Murci et al., 2004]. In the last few years, the advent of more advanced molecular techniques has allowed rapid and efficient sequencing of the entire human mitochondrial genome, leading to the production of a great number of mtDNA sequences from a wide range of human populations [Ingman et al., 2000; Finnila ¨ et al., 2001; Herrnstadt et al., 2002; Ingman and Gyllensten, 2003; Kong et al., 2003; Achilli et al., 2004, 2005; Palanichamy et al., 2004; Tanaka et al., 2004; Friedlaender et al., 2005; Kivisild et al., 2006; Macaulay et al., 2005; Merriwether et al., 2005; Thangaraj et al., 2005; Trejaut et al., 2005]. This massive amount of sequence data provides the opportunity of analyzing sequence variations of human mtDNA with new approaches, with results which may be considered significant and reliable only now that the ‘‘raw’’ data are sufficiently plentiful. These analyses contribute to a more accurate definition of mtDNA haplogroups, defined by a unique set of variations acquired from the same ancient common female ancestor. Here, we introduce a novel statistical approach, based on site-specific variability estimates, i.e., a measure of how variable a site is, in the multialigned set of considered sequences. The method allows identification of nucleotide sites, which are mtDNA haplogroup Published online 24 July 2006 in Wiley InterScience (www. interscience.wiley.com). DOI 10.1002/humu.20365 Received 11 January 2006; accepted revised manuscript 14 April 2006. Grant sponsor: Ministero Italiano dell’Universita Ø e Ricerca, Fondo Investimenti Ricerca di Base 2001,‘‘Bioinformatica per la Genomica e la Proteomica’’; Grant sponsor: Progetti Ricerca Interesse Nazionale 2003; Grant sponsor: Progetti Ricerca Interesse Nazionale 2005; Grant sponsor: Progetti Ricerca Interesse Nazionale Fondazione Cariplo; Grant sponsor: Progetti Ricerca Interesse Nazionale ESF (P.O.P. 2000^2006); Grant sponsor: Fondazione Cariplo; Grant sponsor: ESF (European Science Foundation) P.O.P. Piano Operativo Puglia 2006. MatteoAccetturo, Monica Santamaria, and Daniela Lascaro contrib- uted equally to this work. Correspondence to: Prof. Marcella Attimonelli, Dipartimento di Biochimica e Biologia Molecolare, Universita Ø degli Studi di Bari,Via E. Orabona 4,70126 Bari, Italy. E-mail: [email protected] r r 2006 WILEY-LISS, INC.
-
Upload
vegajournal -
Category
Documents
-
view
2 -
download
0
Transcript of Human mtDNA site-specific variability values can act as haplogroup markers

HUMANMUTATION 27(9),965^974,2006
METHODS
Human mtDNA Site-Specific Variability Values CanAct as Haplogroup Markers
Matteo Accetturo,1 Monica Santamaria,1 Daniela Lascaro,1 Francesco Rubino,1 Alessandro Achilli,2
Antonio Torroni,2 Mila Tommaseo-Ponzetta,3 and Marcella Attimonelli1�
1Dipartimento di Biochimica e Biologia Molecolare, Universita degli Studi di Bari, Bari, Italy; 2Dipartimento di Genetica e Microbiologia,Universita di Pavia, Pavia, Italy; 3Dipartimento di Zoologia, Universita degli Studi di Bari, Bari, Italy
Communicated by Pui-Yan Kwok
Sequencing of entire human mtDNA genomes has become rapid and efficient, leading to the production of a greatnumber of complete mtDNA sequences from a wide range of human populations. We introduce here a newstatistical approach for classifying mtDNA nucleotide sites, simply by comparing the mean simple deviation(MSD) of their specific variability values estimated on continent-specific dataset sequences, without the need forany reference sequence. Excellent correspondence was observed between sites with the highest MSD values andthose marking known mtDNA haplogroups. This in turn supports the classification of 81 sites (23 in Africa, eightin Asia, eight in Europe, 34 in Oceania, and eight in America) as novel markers of 47 mtDNA haplogroups notyet identified by phylogeographic studies. Not only does this approach allow refinement of mtDNA phylogeny, anessential requirement also for mitochondrial disease studies, but may greatly facilitate the discrimination ofcandidate disease-causing mutations from haplogroup-specific polymorphisms in mtDNA sequences of patientsaffected by mitochondrial disorders. Hum Mutat 27(9), 965–974, 2006. rr 2006 Wiley-Liss, Inc.
KEY WORDS: mtDNA; site-specific variability; haplogroup markers; mtDNA mutations
INTRODUCTION
Due to the peculiar features of mitochondrial DNA (mtDNA)(maternal inheritance, absence of recombination, role in cellularenergy production, and lack of an efficient repair system), analysisof mtDNA sequence variations has proven to be a powerful toolfor investigating human origins and dispersals [Macaulay et al.,2005; Thangaraj et al., 2005; Forster and Matsumura, 2005] andidentifying single mutations (or combinations of mutations) thateither cause human diseases or play an important role in theirexpression [Howell et al., 2005; Wallace, 2005].
As regards evolutionary studies, the earliest mtDNA workbegan by digesting entire mtDNA with a number of restrictionenzymes [Denaro et al., 1981; Johnson et al., 1983; Cann et al.,1987], sequencing the hypervariable segments (HVS-I andHVS-II) [Vigilant et al., 1991; Richards et al., 1998] of theD-loop, the main regulatory region of metazoan mitochondrialDNA, or using a combination of the two approaches [Torroniet al., 1993a,b, 1996; Macaulay et al., 1999; Richardset al., 2000; Quintana-Murci et al., 2004]. In the last fewyears, the advent of more advanced molecular techniques hasallowed rapid and efficient sequencing of the entire humanmitochondrial genome, leading to the production of a greatnumber of mtDNA sequences from a wide range of humanpopulations [Ingman et al., 2000; Finnila et al., 2001; Herrnstadtet al., 2002; Ingman and Gyllensten, 2003; Kong et al., 2003;Achilli et al., 2004, 2005; Palanichamy et al., 2004; Tanaka et al.,2004; Friedlaender et al., 2005; Kivisild et al., 2006; Macaulayet al., 2005; Merriwether et al., 2005; Thangaraj et al., 2005;Trejaut et al., 2005].
This massive amount of sequence data provides the opportunityof analyzing sequence variations of human mtDNA with newapproaches, with results which may be considered significant andreliable only now that the ‘‘raw’’ data are sufficiently plentiful.These analyses contribute to a more accurate definition ofmtDNA haplogroups, defined by a unique set of variationsacquired from the same ancient common female ancestor. Here,we introduce a novel statistical approach, based on site-specificvariability estimates, i.e., a measure of how variable a site is, in themultialigned set of considered sequences. The method allowsidentification of nucleotide sites, which are mtDNA haplogroup
Published online 24 July 2006 in Wiley InterScience (www.interscience.wiley.com).
DOI10.1002/humu.20365
Received 11 January 2006; accepted revised manuscript 14April 2006.
Grant sponsor: Ministero Italiano dell’UniversitaØ e Ricerca, FondoInvestimenti Ricerca di Base 2001,‘‘Bioinformatica per la Genomica ela Proteomica’’; Grant sponsor: Progetti Ricerca Interesse Nazionale2003; Grant sponsor: Progetti Ricerca Interesse Nazionale 2005;Grant sponsor: Progetti Ricerca Interesse Nazionale FondazioneCariplo; Grant sponsor: Progetti Ricerca Interesse NazionaleESF (P.O.P. 2000^2006); Grant sponsor: Fondazione Cariplo; Grantsponsor: ESF (European Science Foundation) P.O.P. Piano OperativoPuglia 2006.
MatteoAccetturo, Monica Santamaria, andDaniela Lascaro contrib-uted equally to this work.
�Correspondence to: Prof. Marcella Attimonelli, Dipartimento diBiochimica e Biologia Molecolare, UniversitaØ degli Studi di Bari,Via E.Orabona 4,70126 Bari, Italy. E-mail: [email protected]
rr 2006 WILEY-LISS, INC.

FIGURE 1. a: Number of continent-speci¢c variant sites (site-speci¢c variability value 40) in coding part of mitochondrial genome.b: Number of variant sites with MSD values greater than zero. c: Number of unique continent-speci¢c sites with MSD values greaterthan zero. d: Number of variant siteswithMSDvalues greater than threshold. e: Number of unique continent-speci¢c siteswithMSDvalues greater than threshold. f: Numberof ‘‘haplogroup de¢ning’’variant sites (with/without thosewith recurrent or raremutations)not ‘‘new’’with values greater than threshold.
FIGURE 2. Site-speci¢c variability trends in various continents obtained by application of Site_Var approach.
966 HUMANMUTATION 27(9),965^974,2006
Human Mutation DOI 10.1002/humu

markers, and their discrimination from disease-causing mutations,thus greatly facilitating identification of the latter in patientsaffected by mitochondrial disorders. Indeed, all disease-causing
mutations are either rare or recurrent mutations (ones which areless rare and are thus found in mtDNAs belonging to differenthaplogroups). Instead, haplogroup-specific polymorphisms are
TABLE 1. Mean SimpleDeviation (MSD) of mtDNASite Variability Values inAfricaWith Respect toOther Continents
MSDNucleotideposition
Con¢rmedhaplogroup(s)a MSD
Nucleotideposition
Con¢rmedhaplogroup(s)a MSD
Nucleotideposition
Con¢rmedhaplogroup(s)a
1.000 825 L0-L1-L5 0.267 6587 L3e1 0.157 921 L3d1-L3d30.805 7521 (Lw/o L3-L4) 0.267 15942 New 0.156 11899 L1c10.802 7256 (Lw/o L3-L4) 0.264 14152 L3e1 0.156 5442 L00.792 769 (Lw/o L3) 0.261 10086 L3b 0.156 13886 L3d0.792 3594 (Lw/o L3-L4) 0.252 13101 L3e3 0.154 7424 L3d0.792 13650 (Lw/o L3-L4) 0.247 5773 L3b 0.154 4454 L1c1a0.791 4104 (Lw/o L3-L4) 0.239 6071 L1c 0.153 750 L3e30.791 1018 (Lw/o L3) 0.239 9072 L1c 0.151 8618 L3d0.728 13105 L0-L1-L3b-
L3d-New0.239 14911 L1c 0.151 14034 New
0.683 2352 L1b-L3e-U6b1 0.238 10373 New 0.150 10920 L0k0.655 9221 L2 0.238 5951 L1c 0.147 15217 L2b-L2c0.655 10115 L2 0.237 12810 L1c 0.146 3843 L1c10.647 8206 L2 0.233 10586 L1c 0.146 9540 L/M0.632 11944 L2a-L2b-L2c 0.232 5581 New 0.145 10873 L/M0.597 2416 L2 0.232 3693 L1b-L2d 0.143 1048 L00.577 15784 L2a1 0.221 5046 L1b 0.139 1442 L2b-L2c0.570 2789 L0f-L2a 0.219 10321 L1c1-L1c2 0.139 3200 L2c0.570 7771 L2a 0.218 5036 L1b 0.138 8701 L/M0.570 12693 L2a1 0.218 5393 New 0.136 13958 L2c0.570 13803 L2a 0.218 5655 L1b 0.135 5366 Raremutation0.569 7175 L2a 0.218 8248 L1b 0.135 5603 L0a-L0f0.569 7274 L2a 0.218 14203 L1b 0.135 6875 Raremutation0.562 14566 L2a 0.217 1738 L1b 0.135 8428 L0a0.553 13590 L2-L0k 0.216 3308 L1b 0.135 15136 L0a-L0f0.542 10819 L3e-L3i 0.213 6827 L1b 0.134 14182 L0k0.540 14212 L3e 0.211 15115 L1b 0.134 12720 L0a-L0d0.536 13914 L3b 0.210 9449 L3b 0.133 11641 L0a-L0f0.513 11914 L0-L2a 0.210 7867 L1b 0.132 5656 U5b1-New0.500 8655 L0-L1-L5 0.209 14179 New 0.131 5237 L0a2b0.500 13506 L0-L1-L5 0.205 15670 New 0.131 12630 L3w-New0.499 2758 L0-L1 0.203 14769 L1b-L3f1 0.130 1692 Raremutation0.499 2885 L0-L1 0.202 14905 L3e2 0.128 2000 L3e30.498 7146 L0-L1 0.202 6548 L1b 0.128 15431 L0a-L0f0.498 8468 L0-L1 0.202 6989 L1b 0.127 10667 L3e30.494 6221 L1c3-L3b 0.195 8650 New 0.126 7768 U5b0.483 10688 L0-L1-L5 0.190 15110 L2b-L2c 0.126 6524 L3e30.479 14000 L1c 0.190 8566 L0a 0.123 3438 L0d10.472 10810 L0-L1-L5 0.188 11800 New 0.122 6680 L3d1-M10.404 13880 L1b 0.186 7805 U6a 0.121 8087 L1c1a0.399 13789 L1 0.184 10915 L0 0.119 15099 Raremutation0.397 7389 L1 0.184 12519 L1b 0.118 14180 Recurrent0.395 14178 L1 0.182 9554 L3e3-New 0.117 6150 New0.382 7055 L1 0.179 12236 L2b-L2c 0.116 15391 Raremutation0.381 15301 L0-L1-L5 0.175 5331 L2b 0.115 5471 Recurrent0.377 3666 L1 0.172 2245 L0a-L0f 0.115 7385 U5b1b0.375 14560 L1 0.172 2768 L1b1 0.113 14088 L1c1a0.358 15244 New 0.172 15229 New 0.111 5231 L0a0.345 5285 New 0.170 4312 L0 0.111 10927 U5b1b0.342 15629 New 0.170 4586 L0a-L0k-L0f 0.106 9098 Raremutation0.340 3516 Lo 0.170 9042 L0 0.106 9755 L00.339 3918 L2a1a 0.170 9347 L0 0.105 14571 Raremutation0.319 3796 L1c1 0.170 9818 L0a-L0k-L0f 0.104 3197 U50.316 12308 U(U6) 0.170 10664 L0 0.104 13617 U50.315 11467 U(U6) 0.170 13276 L0 0.104 9477 U50.311 3348 U6 0.167 6185 L0 0.104 6164 Raremutation0.305 7624 L2b-L2c 0.167 11002 New 0.103 12618 U5b1b0.291 3495 New 0.166 5147 L0a2-L3d 0.103 13980 New0.281 12372 U(U6) 0.165 10589 L0 0.103 6152 Raremutation0.270 2332 L2b-L2c 0.162 710 L1b 0.101 12930 New0.268 3450 L3b 0.162 11176 L0a 0.100 9438 U6b0.268 13485 L1c 0.159 14148 L1c1 0.100 11204 Raremutation0.268 15311 L3b 0.157 4655 L3e3 0.100 11257 New0.268 15824 L3b 0.157 14284 L3d
aThe‘‘New’’nucleotide position is a marker of a new predicted haplogroup (see Table 6). The‘‘Rare mutation’’was observed only in one or two haplo-types in HmtDB,without de¢ning any speci¢c haplogroup.The‘‘Recurrent’’mutation at that nucleotide position is paraphyletic.
HUMANMUTATION 27(9),965^974,2006 967
Human Mutation DOI 10.1002/humu

generally quite common in at least one geographic area/ethnicgroup, have a deep location in the phylogenetic tree, and havebeen subjected to selective pressure for tens of thousands of years.Therefore, haplogroup markers cannot be disease-causing muta-tions, at most, they may play a secondary role in disease expression[Carelli et al., 2006].
The main idea underlying our hypothesis is that mtDNA siteswith high variability values found only in a particular geographicarea may be considered good haplogroup markers of that area.Variability values satisfying these features are defined here as‘‘discriminating variability values.’’ A major requirement of thisapproach is that, due to the structure of the algorithm used toestimate variability values, the sample must be sufficiently large forstatistically significant results to be obtained, and sufficientlyheterogeneous to be sufficiently representative of the populationsliving in the geographic area of interest. This spurred for the
research group to perform a random simulation samplingprocedure, starting from the original sequence datasets, in orderto assess to what extent the method is dependent on samplecharacteristics.
MATERIALSANDMETHODS
The method is based on the Site_Var algorithm [Pesole andSaccone, 2001], extensively modified in collaboration with theauthors in order to adapt it to human mtDNA data and to obtainmore precise site-specific variability values. The original versionof the algorithm starts from N nucleotide multialigned sequencesand for each i-th site in each j-th pair of sequences estimates thedij score, which is 1 or 0, depending on the presence or absence ofthe substitution event in the site, divided by the j-th geneticdistance calculated according to the stationary Markov model
TABLE 2. Mean SimpleDeviation (MSD) of mtDNASiteVariabilityValues inAsiaWith Respect toOther Continents
MSDNucleotideposition
Con¢rmedhaplogroup(s)a MSD
Nucleotideposition
Con¢rmedhaplogroup(s)a
0.757 5178 D 0.083 6962 F10.552 9824 M7-D4b2 0.083 8563 A10.375 4883 D 0.081 2766 D4d10.356 1382 D4b2 0.081 5351 M7b0.344 8414 D4 0.081 9950 B2-B5-M110.327 14668 D4-Z2 0.080 12406 F10.273 13928 R9 0.080 10345 M7b20.259 10400 M 0.079 5601 G20.259 14783 M 0.079 5301 D50.233 8020 D4b-F4b-M7b2 0.079 1107 D50.216 6455 M7 0.078 13563 G20.213 15043 M-I 0.076 7853 M7b0.171 14569 New-G-B4b1b 0.076 15524 D4b2a0.166 10310 F-B4c1a 0.075 11017 M7a1a0.151 5108 B4c2 0.075 15518 New0.140 8701 L/M-D4g@ 0.075 4343 New0.135 3970 R9 0.075 14200 G2a0.132 5417 N9 0.074 9180 D5a-D5b0.131 3206 D4a 0.074 7600 G2a0.131 14979 D4a 0.073 11969 B4f-C4-M110.131 6392 F 0.073 12358 N9a-New0.130 4386 M7a-N9a1 0.073 11084 M7a1a0.130 4071 M7b-M7c 0.072 15346 B4c0.124 4833 G 0.068 14944 A1a1a0.122 10873 L/M 0.066 9575 G2a0.120 9540 L/M 0.064 1119 B4c0.119 9296 D4b2b 0.064 15874 D4e20.116 10410 New 0.064 10397 D50.114 2626 M7a 0.062 8594 R50.114 4958 M7a 0.056 10104 D4b2a0.110 2772 M7a 0.055 15851 B5b0.105 8473 D4a 0.055 15662 B5b0.101 11536 A1 0.054 15508 B5b0.100 12771 M7a 0.054 827 B4b-B4d-New0.098 11215 D4e-F1a1a1 0.054 15301 L/M0.097 709 Recurrent 0.053 10801 A1a10.096 10609 F1 0.053 10754 R50.095 12405 M7b 0.053 14544 R50.095 7684 M7b 0.052 9377 G2a0.095 13104 D4g-U1 0.052 6026 C4-U1a0.093 12882 F1 0.051 8684 M8a0.093 8584 M8-B5-R30 0.051 15954 U1-F1b1a0.092 14605 New 0.051 13759 F1a-F1c0.089 4048 M7b 0.051 12811 M7b0.088 4164 M7b 0.050 15223 B5b0.087 11647 A1a 0.050 13635 New0.087 8964 D4b2 0.050 8829 B5b
aThe ‘‘New’’ nucleotide position is a marker of a new predicted haplogroup (see Table 6). The ‘‘Recurrent’’ mutation at that nucleotide positionis paraphyletic.
968 HUMANMUTATION 27(9),965^974,2006
Human Mutation DOI 10.1002/humu

[Lanave et al., 1984; Saccone et al., 1990], also known as thegeneral time reversible (GTR model, PAUP package) [Swofford,2002]. The variability values are then obtained by summingthese ratios along N(N�1)/2 pairwise sequences in the multi-alignment
ni ¼XNðN�1Þ=2
j¼1
dij
Kjð1Þ
In the revised version of the algorithm, the dij score is 1 for atransition, 2 for a transversion, and 0 if the site is unchanged.Moreover, in sites where an insertion or deletion is present in someof the multialigned genomes (gapped sites), to variability ui isadded a score of 2/Kj (mean), where Kj (mean) is the mean distancealong all the N(N�1)/2 pairs of sequences.
The genetic distance is now estimated through the Kimuramodel [Kimura, 1980], which is more suitable than GTR for
intraspecies analyses and in cases in which different weights areassigned to transitions and transversions.
Last, site-specific variability values are also normalized (Eq. 2),relative to the number of all possible pair-wise comparisons, anddivided by the maximum ni value, nmax, thus producing relativevariability gi (Eq. 3), with values ranging between 0 and 1;
niðnormÞ ¼ ni=½NðN� 1Þ=2� ð2Þ
gi ¼ niðnormÞ=niðmaxÞ: ð3Þ
The starting point of our approach is thus a sample of multialignedmtDNA sequences grouped according to their continental origin,on which site-specific variability is estimated.
Data resulting from the application of Site_Var are thenautomatically processed by introducing the mean simple deviation(MSD) parameter in order to quantify the concept of ‘‘discrimi-
TABLE 3. Mean SimpleDeviation (MSD) of mtDNASiteVariability Values in EuropeWith Respect toOther Continents
MSD Nucleotide position Con¢rmed haplogroup(s)a MSD Nucleotide position Con¢rmed haplogroup(s)a
0.937 15452 J-T 0.118 15833 H5a10.892 2706 H 0.118 7864 W10.887 7028 H 0.114 1888 T0.798 11719 pre-HV 0.099 6365 New0.768 14766 HV 0.099 14793 U5a0.520 3010 H1-J1 0.092 930 T2b0.468 4216 J-T 0.090 4769 H20.467 11251 J-T 0.087 1719 N1-X2-New0.461 14798 K-J1c 0.087 15924 I-New0.337 12308 U 0.086 5004 H40.334 11467 U 0.084 14582 H40.314 15904 pre�V2-V 0.084 4024 H40.303 12372 U 0.084 4793 H70.301 4580 V 0.084 3992 H40.290 12612 J 0.082 9150 New0.283 6776 H3 0.081 8869 V10.251 709 Recurrent 0.080 14365 H40.250 1811 U2-U3-U4-U9-U7-U8 0.080 5495 W1a-New0.249 9698 U8 0.078 7768 U5b0.243 9055 U8b-K 0.077 14470 H10-X0.242 8697 T 0.074 13780 I0.239 14167 U8b-K 0.073 12669 W1a0.236 15928 T 0.073 4639 V0.236 15884 W 0.070 5046 N20.236 10463 T 0.069 9899 T1a0.235 4917 T 0.068 9716 K20.234 3480 K 0.065 11377 J2a0.213 11299 K 0.065 4561 K2a0.211 13368 T 0.064 8271 New0.211 10550 K 0.061 12501 N10.185 12633 T1 0.061 5263 V1a0.183 1189 K1 0.060 15218 U5a1-HV10.174 11812 T2 0.060 10034 I0.173 14905 T 0.058 8269 J1b-H4a0.164 14233 T2 0.057 8705 X2c0.159 3197 U5 0.056 10044 New0.158 8251 W-I 0.055 13966 X0.155 13708 J-X2b 0.055 5656 U5b10.153 13617 U5 0.054 10394 New0.153 9477 U5 0.054 9380 H6a10.146 4529 I 0.053 3915 H6a0.140 4336 H5a 0.050 9066 H1f0.138 3505 W 0.050 7309 H1f0.137 11674 N2 0.050 4452 H1f0.135 11947 W 0.050 15223 B5b0.128 8994 W 0.050 13635 New0.121 1243 W 0.050 8829 B5b
aThe ‘‘New’’ nucleotide position is a marker of a new predicted haplogroup (see Table 6). The ‘‘Recurrent’’ mutation at that nucleotide positionis paraphyletic.
HUMANMUTATION 27(9),965^974,2006 969
Human Mutation DOI 10.1002/humu

nating variability values’’ of the starting hypothesis. MSD isdefined as:
MSDi;k ¼X5
j¼1
ðgki � gj
iÞ=4 for j 6¼ k; ð4Þ
where MSDi,k is the discriminating value of the i-th site incontinent k, gk
i indicates the variability value of the i-th site incontinent k, and gj
i is the variability value of the other fourcontinents (indicated as j, for j6¼k) in the same nucleotide position.
The MSD values—estimated for each site in each continent—are a measure of the degree of difference in variability values
TABLE 4. Mean SimpleDeviation (MSD) of mtDNASiteVariabilityValues inOceaniaWith Respect toOther Continents
MSD Nucleotide position Con¢rmed haplogroup(s)a MSD Nucleotide position Con¢rmed haplogroup(s)a
0.967 6719 B4a1a 0.168 3203 P20.949 5465 B4a 0.167 15300 New0.927 9123 B4a 0.166 15852 New0.919 12239 B4a1a 0.166 12879 New0.918 15746 B4a1a 0.166 1438 P20.883 10238 B4a 0.165 4122 P20.862 15607 P 0.164 15885 New0.832 14022 B4a1a1 0.162 8577 Raremutation0.584 8404 S 0.161 13479 Raremutation0.489 12705 N/M/L 0.160 14070 Raremutation0.472 5843 Q 0.159 5086 Raremutation0.466 4117 Q 0.159 5483 Raremutation0.464 13500 Q 0.159 6083 Raremutation0.462 6366 P1a 0.159 5563 New0.457 10118 P1 0.157 10700 New0.456 6077 P1 0.156 7681 Q1a0.453 12940 Q 0.155 9103 Raremutation0.438 8790 Q 0.153 2263 Raremutation0.404 15937 P3 0.152 10786 New0.380 5460 Q1-Q2-New 0.152 15664 New0.366 14025 Q1 0.150 5302 New0.322 8964 Q1 0.150 9938 New0.320 6167 New 0.149 591 Raremutation0.319 2380 New 0.147 4025 Raremutation0.274 6905 New 0.145 13135 Raremutation0.274 13641 Recurrent 0.144 8269 New0.263 3438 New 0.144 5105 Raremutation0.245 593 Raremutation 0.143 15172 Q30.234 9140 New 0.142 11151 New0.234 14502 New 0.141 10914 P40.234 4733 New 0.141 11288 P40.233 12346 New 0.140 5492 New0.230 6755 New 0.140 8152 Raremutation0.229 13145 New 0.140 10933 Raremutation0.208 9812 B4a2 0.140 15204 New0.207 8842 Raremutation 0.137 15663 New0.202 3645 P3 0.137 15317 New0.202 15748 P3 0.137 10192 Raremutation0.202 13269 Raremutation 0.134 12750 Raremutation0.196 4823 B4a2a 0.133 5177 M27a-Q3b0.196 14338 P3 0.131 2768 Q30.192 5330 Raremutation 0.130 14385 Raremutation0.191 6734 P3 0.129 8525 Raremutation0.189 14384 Raremutation 0.129 14449 Raremutation0.189 12519 New 0.129 14954 Raremutation0.188 3351 Raremutation 0.128 14290 Raremutation0.185 4335 Q3 0.127 13681 Q3b0.183 15924 New 0.125 11963 Q3b0.183 6620 B4a2 0.123 4769 Raremutation0.180 11016 P4-New 0.123 5894 Raremutation0.179 3394 Raremutation 0.121 15043 M0.179 6878 Raremutation 0.121 4023 Raremutation0.179 14890 P2 0.115 1692 M27c0.179 15443 Raremutation 0.114 11992 Raremutation0.178 8859 P2 0.113 12366 Raremutation0.178 1375 New 0.112 9254 Q3a0.174 3882 P2 0.110 13651 New0.171 8572 New 0.107 6131 Raremutation0.170 13927 Raremutation 0.103 4892 Raremutation0.170 3699 New 0.100 5090 Raremutation0.169 10400 M 0.100 9866 Raremutation0.169 14783 M
aThe‘‘New’’nucleotide position is a marker of a new predicted haplogroup (see Table 6). The‘‘Rare mutation’’was observed only in one or two haplo-types in HmtDB,without de¢ning any speci¢c haplogroup.The‘‘Recurrent’’mutation at that nucleotide position is paraphyletic.
970 HUMANMUTATION 27(9),965^974,2006
Human Mutation DOI 10.1002/humu
necessary to identify a site as a defined continent associated site.Data with MSD values higher than a certain threshold are mostprobably haplogroup markers.
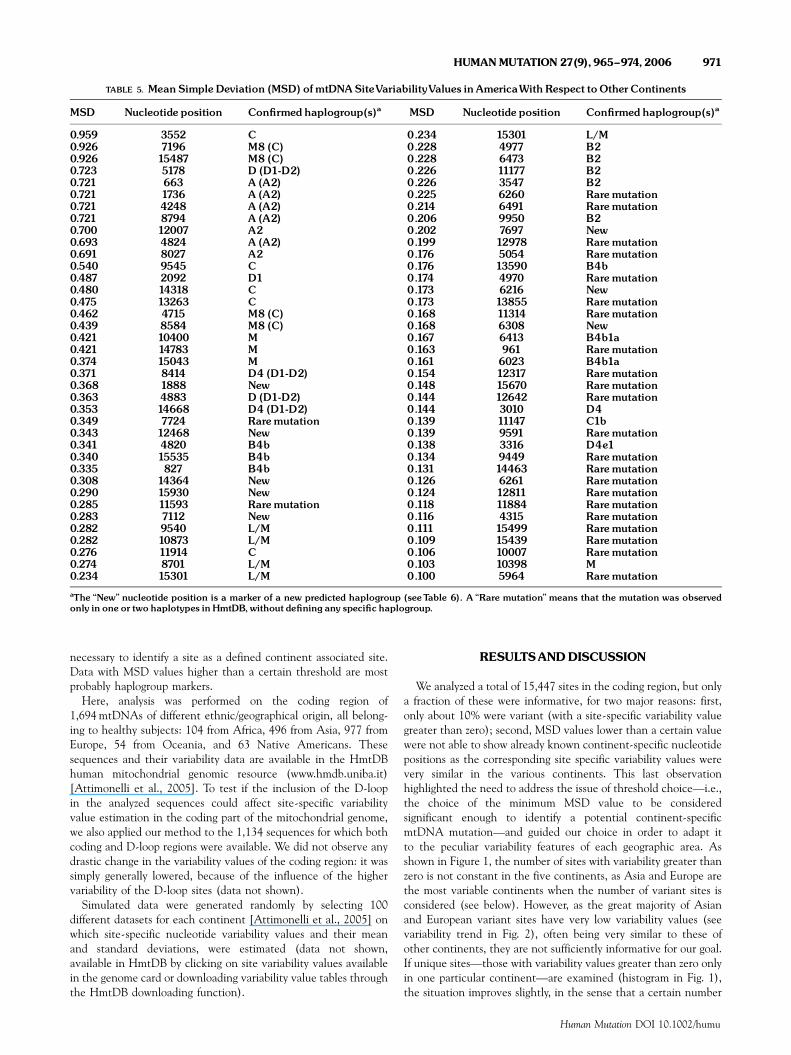
Here, analysis was performed on the coding region of1,694 mtDNAs of different ethnic/geographical origin, all belong-ing to healthy subjects: 104 from Africa, 496 from Asia, 977 fromEurope, 54 from Oceania, and 63 Native Americans. Thesesequences and their variability data are available in the HmtDBhuman mitochondrial genomic resource (www.hmdb.uniba.it)[Attimonelli et al., 2005]. To test if the inclusion of the D-loopin the analyzed sequences could affect site-specific variabilityvalue estimation in the coding part of the mitochondrial genome,we also applied our method to the 1,134 sequences for which bothcoding and D-loop regions were available. We did not observe anydrastic change in the variability values of the coding region: it wassimply generally lowered, because of the influence of the highervariability of the D-loop sites (data not shown).
Simulated data were generated randomly by selecting 100different datasets for each continent [Attimonelli et al., 2005] onwhich site-specific nucleotide variability values and their meanand standard deviations, were estimated (data not shown,available in HmtDB by clicking on site variability values availablein the genome card or downloading variability value tables throughthe HmtDB downloading function).
RESULTSANDDISCUSSION
We analyzed a total of 15,447 sites in the coding region, but onlya fraction of these were informative, for two major reasons: first,only about 10% were variant (with a site-specific variability valuegreater than zero); second, MSD values lower than a certain valuewere not able to show already known continent-specific nucleotidepositions as the corresponding site specific variability values werevery similar in the various continents. This last observationhighlighted the need to address the issue of threshold choice—i.e.,the choice of the minimum MSD value to be consideredsignificant enough to identify a potential continent-specificmtDNA mutation—and guided our choice in order to adapt itto the peculiar variability features of each geographic area. Asshown in Figure 1, the number of sites with variability greater thanzero is not constant in the five continents, as Asia and Europe arethe most variable continents when the number of variant sites isconsidered (see below). However, as the great majority of Asianand European variant sites have very low variability values (seevariability trend in Fig. 2), often being very similar to these ofother continents, they are not sufficiently informative for our goal.If unique sites—those with variability values greater than zero onlyin one particular continent—are examined (histogram in Fig. 1),the situation improves slightly, in the sense that a certain number
TABLE 5. Mean SimpleDeviation (MSD) of mtDNASiteVariabilityValues inAmericaWith Respect toOtherContinents
MSD Nucleotide position Con¢rmed haplogroup(s)a MSD Nucleotide position Con¢rmed haplogroup(s)a
0.959 3552 C 0.234 15301 L/M0.926 7196 M8 (C) 0.228 4977 B20.926 15487 M8 (C) 0.228 6473 B20.723 5178 D (D1-D2) 0.226 11177 B20.721 663 A (A2) 0.226 3547 B20.721 1736 A (A2) 0.225 6260 Raremutation0.721 4248 A (A2) 0.214 6491 Raremutation0.721 8794 A (A2) 0.206 9950 B20.700 12007 A2 0.202 7697 New0.693 4824 A (A2) 0.199 12978 Raremutation0.691 8027 A2 0.176 5054 Raremutation0.540 9545 C 0.176 13590 B4b0.487 2092 D1 0.174 4970 Raremutation0.480 14318 C 0.173 6216 New0.475 13263 C 0.173 13855 Raremutation0.462 4715 M8 (C) 0.168 11314 Raremutation0.439 8584 M8 (C) 0.168 6308 New0.421 10400 M 0.167 6413 B4b1a0.421 14783 M 0.163 961 Raremutation0.374 15043 M 0.161 6023 B4b1a0.371 8414 D4 (D1-D2) 0.154 12317 Raremutation0.368 1888 New 0.148 15670 Raremutation0.363 4883 D (D1-D2) 0.144 12642 Raremutation0.353 14668 D4 (D1-D2) 0.144 3010 D40.349 7724 Raremutation 0.139 11147 C1b0.343 12468 New 0.139 9591 Raremutation0.341 4820 B4b 0.138 3316 D4e10.340 15535 B4b 0.134 9449 Raremutation0.335 827 B4b 0.131 14463 Raremutation0.308 14364 New 0.126 6261 Raremutation0.290 15930 New 0.124 12811 Raremutation0.285 11593 Raremutation 0.118 11884 Raremutation0.283 7112 New 0.116 4315 Raremutation0.282 9540 L/M 0.111 15499 Raremutation0.282 10873 L/M 0.109 15439 Raremutation0.276 11914 C 0.106 10007 Raremutation0.274 8701 L/M 0.103 10398 M0.234 15301 L/M 0.100 5964 Raremutation
aThe ‘‘New’’ nucleotide position is a marker of a new predicted haplogroup (seeTable 6). A ‘‘Rare mutation’’ means that the mutation was observedonly in one or two haplotypes inHmtDB,without de¢ning any speci¢c haplogroup.
HUMANMUTATION 27(9),965^974,2006 971
Human Mutation DOI 10.1002/humu

of sites certainly not involved in continent-specific site variabilitycan be ignored, but there are still many of sites whose variability isnot sufficiently ‘‘discriminating.’’ Overall, when deciding the MSDthreshold, it is necessary to take into account the generalvariability trend of the continent in question, thus avoiding over-or underestimation of the number of continent-specific nucleotidepositions. For this purpose, we decided to fix the threshold valueby taking into account the general variability trend observed ineach continent. The Asian case is explicative. Variability values inAsia are generally low (although numerous) and only a very siteshave a high MSD value, so that, if a given prefixed threshold is
chosen, only a few will exceed it. This would obviously lead tounderestimation of the number of continent-specific sites, missingthe large majority of them. As a guide for fixing the threshold inthe case of the Asian-specific variability trend we used thepublished haplogroup classification (and thus the number ofalready defined haplogroup-specific sites). On this basis, athreshold value of 0.05 was chosen for Asian and European dataand 0.1 for the other continents.
The results are shown in five continent-specific tables (Tables1–5), built using MSDgen script. This script was developed in ourlaboratory and, after estimating MSD values, allows sorting ofnucleotide sites by their MSD value, and thus by their capacity todiscriminate one geographic area from the rest of the world. Afterapplication of the MSDgen script, the resulting sites are searchedin the haplogroup classification of HmtDB; if the search producespositive results, the site is assigned to the corresponding mostsuitable haplogroup.
The continent tables show that those sites with the highestMSD values generally match the already known continent-specificmtDNA haplogroup defining sites [Finnila et al., 2001; Herrnstadtet al., 2002; Ingman and Gyllensten, 2003; Kong et al., 2003;Achilli et al., 2004, 2005; Palanichamy et al., 2004; Friedlaenderet al., 2005; Kivisild et al., 2004, 2006; Macaulay et al., 2005;Merriwether et al., 2005; Salas et al., 2004; Thangaraj et al., 2005;Trejaut et al., 2005]. This finding is supported by the observationthat ‘‘real’’ and ‘‘simulated’’ variability values are generallycomparable, indicating that the quality of the dataset is goodenough to obtain statistically significant results. Consequently, wemay assume that the frequency of substitutions and the final resulthave not been influenced. For instance, Table 2 shows thedistribution of haplogroups in Africa, obtained by the applicationof MSDgen script. Of the 188 sites classified in the analysis(stopping at an MSD value of 0.1), 165 mark known African-specific haplogroups, and 23 were defined as ‘‘novel’’ because theyhave not yet been reported in the literature as haplogroup-definingsites. Evaluation of the five continents revealed a total of 81variant nucleotide positions (23 in Africa, eight in Asia, eight inEurope, 34 in Oceania, and eight in America) with a high MSDvalue, despite the fact that they were not reported in the literatureas haplogroup-defining sites. Therefore, they represent very goodcandidate markers of novel mtDNA haplogroups or subha-plogroups (Table 6). It is worth pointing out that all the newhaplogroup markers detected in this study had not been previouslyrevealed by a classic phylogeographic approach [Finnila et al.,2001; Herrnstadt et al., 2002; Ingman and Gyllensten, 2003; Konget al., 2003; Achilli et al., 2004, 2005; Palanichamy et al., 2004;Friedlaender et al., 2005; Kivisild et al., 2004, 2006; Macaulayet al., 2005; Merriwether et al., 2005; Salas et al., 2004; Thangarajet al., 2005; Trejaut et al., 2005], although the analyzed sequencedatasets were the same. In fact, the possibility of analyzing such agreat number of genomes all together is one of the intrinsicadvantages of our approach (and thus of this study), revealinginformation which would otherwise be hidden in the data.Obviously, the new predicted sites were less abundant in thosecontinents where mtDNA phylogeny has recently been studied ingreater detail, such as Asia [Kong et al., 2003; Tanaka et al., 2004;Palanichamy et al., 2004] and Europe [Herrnstadt et al., 2002;Achilli et al., 2004, 2005; Palanichamy et al., 2004]. In addition,taking into account the shared patterns of mutations observed inthe available complete sequences of these new 81 sites and thealready defined phylogeny reported in the literature, we proposethat these sites define a total of 47 mtDNA haplogroups (16 inAfrica, seven in Asia, seven in Europe, 11 in Oceania, and six in
TABLE 6. Novel PredictedHaplogroups on EachContinent
Haplogroupcode Nucleotide position(s)
AfricaL0a2a1 9554L1b1a 5393L1b1a1 13980L1c1a1 11257,12930,14034L1c2a 6150L2a1a 5285,15244,15629L2a1d 5581,15229L2a1e 3495,12630L3b1 10373L3b1a 11002L3b1a1 11800L3e1c 15670,15942L3e1c1 8650L3e2a 13105L5a1a 5656U6a1 14179
AsiaU7a 14569D4a1 10410D4b2b1 14605D4b2b2 12358D4g1 4343,15518G1a1a 827R5a 13635
EuropeH1a1 6365H1a2 8271H1c1 9150H4a1 10044H7a 1719H16 10394U5a1a1 5495,15924
OceaniaP1a1 3699,8269,12346,12879P2a 1375,8572P3a 13651N23 6755,9140N23a 5460,5563,10700,15300,15852,15885,15924S2 2380,3438,6167S2a 14502S3 5302,5492,9938,10786,11151,15204,15317,
15663,15664B4a1a2 4733,12519B4a1a1a 6905M42a 11016,13145
AmericaA2a 6308A2b 7112A2c 12468,14364B4b1a2 6216C1a 7697C1c 1888,15930
972 HUMANMUTATION 27(9),965^974,2006
Human Mutation DOI 10.1002/humu

America) which have not been previously identified by phylogeo-graphic studies (Table 6).
In conclusion, this study provides a new method for discrimi-nating geographic-specific patterns of mtDNA mutations byemploying nucleotide continent-specific variability values andwithout having to examine any reference sequence. We found anextremely good fit between our results and the mtDNAhaplogroup classification currently reported in the literature. Ouralgorithm was able to identify totally about half all the knownhaplogroups, although the current literature classification is theresult of years of research on a great variety of samples.This supports the reliability of prediction method in reco-gnizing geographically defined patterns of mutations, andvalidates the identification of a large number of new variantsites which are most probably markers of mtDNA haplogroups notyet identified by phylogeographic studies. This information notonly allows refinement of mtDNA phylogeny, an essentialrequirement for mitochondrial disease studies [Bandelt et al.,2005; Salas et al., 2005], but also facilitates discrimination ofcandidate disease-causing mutations from haplogroup-specificpolymorphisms in mtDNAs from patients affected by mitochon-drial diseases.
ACKNOWLEDGMENTS
We thank Dr. David Horner (Dipartmento di ScienzeBiomolecolari e Biotecnologie, Universita di Milano) for his adviceand support in the production of the new version of the Site_Varalgorithm. This work was supported by the Ministero Italianodell’Universita e Ricerca: Fondo Investimenti Ricerca di Base2001, ‘‘Bioinformatica per la Genomica e la Proteomica’’; ProgettiRicerca Interesse Nazionale 2003 (to M.T.-P.) and 2005 (to A.T.),and Fondazione Cariplo (to A.T.).
REFERENCES
Achilli A, Rengo C, Magri C, Battaglia V, Olivieri A, Scozzari R,Cruciani F, Zeviani M, Briem E, Carelli V, Moral P, DugoujonJM, Roostalu U, Loogvali EL, Kivisild T, Bandelt HJ, RichardsM, Villems R, Santachiara-Benerecetti AS, Semino O, TorroniA. 2004. The molecular dissection of mtDNA haplogroup Hconfirms that the Franco-Cantabrian glacial refuge was a majorsource for the European gene pool. Am J Hum Genet 75:910–918.
Achilli A, Rengo C, Battaglia V, Pala M, Olivieri A, Fornarino S,Magri C, Scozzari R, Babudri N, Santachiara-Benerecetti AS,Bandelt HJ, Semino O, Torroni A. 2005. Saami and Berbers—anunexpected mitochondrial DNA link. Am J Hum Genet 76:883–886.
Attimonelli M, Accetturo M, Santamaria M, Lascaro D, SciosciaG, Pappada G, Russo L, Zanchetta L, Tommaseo-Ponzetta M.2005. HmtDB, a human mitochondrial genomic resource basedon variability studies supporting population genetics andbiomedical research. BMC Bioinformatics 6:S4.
Bandelt HJ, Achilli A, Kong QP, Salas A, Lutz-Bonengel S, Sun C,Zhang YP, Torroni A, Yao YG. 2005. Low ‘‘penetrance’’ ofphylogenetic knowledge in mitochondrial disease studies.Biochem Biophys Res Commun 333:122–130.
Cann RL, Stoneking M, Wilson AC. 1987. Mitochondrial DNAand human evolution. Nature 325:31–36.
Carelli V, Achilli A, Valentino ML, Rengo C, Semino O, Pala M,Olivieri A, Mattiazzi M, Pallotti F, Carrara F, Zeviani M, LeuzziV, Carducci C, Valle G, Simionati B, Mendieta L, Salomao S,
Belfort R, Sadun AA, Torroni A. 2006. Haplogroup effects andrecombination of mitochondrial DNA: novel clues from theanalysis of Leber hereditary optic neuropathy pedigrees. Am JHum Genet 78:564–574.
Denaro M, Blanc H, Johnson MJ, Chen KH, Wilmsen E, Cavalli-Sforza LL, Wallace DC. 1981. Ethnic variation in Hpa 1endonuclease cleavage patterns of human mitochondrial DNA.Proc Natl Acad Sci USA 78:5768–5772.
Finnila S, Lehtonen MS, Majamaa K. 2001. Phylogenetic networkfor European mtDNA. Am J Hum Genet 68:1475–1484.
Forster P, Matsumura S. 2005. Evolution. Did early humans gonorth or south? Science 308:965–966.
Friedlaender J, Schurr T, Gentz F, Koki G, Friedlaender F, HorvatG, Babb P, Cerchio S, Kaestle F, Schanfield M, Deka R,Yanagihara R, Merriwether DA. 2005. Expanding SouthwestPacific mitochondrial haplogroups P and Q. Mol Biol Evol 22:1506–1517.
Herrnstadt C, Elson JL, Fahy E, Preston G, Turnbull DM,Anderson C, Ghosh SS, Olefsky JM, Beal MF, Davis RE, HowellN. 2002. Reduced-median-network analysis of complete mito-chondrial DNA coding-region sequences for the major African,Asian, and European haplogroups. Am J Hum Genet 70:1152–1171 [Erratum in Am J Hum Genet 2002;71:448–449].
Howell N, Elson JL, Chinnery PF, Turnbull DM. 2005. mtDNAmutations and common neurodegenerative disorders. TrendsGenet 11:583–586.
Ingman M, Kaessmann H, Paabo S, Gyllensten U. 2000.Mitochondrial genome variation and the origin of modernhumans. Nature 408:708–713 [Erratum in Nature 2001;410:611].
Ingman M, Gyllensten U. 2003. Mitochondrial genome variationand evolutionary history of Australian and New Guineanaborigines. Genome Res 13:1600–1606.
Johnson MJ, Wallace DC, Ferris SD, Rattazzi MC, Cavalli-SforzaLL. 1983. Radiation of human mitochondria DNA typesanalyzed by restriction endonuclease cleavage patterns. J MolEvol 19:255–271.
Kimura M. 1980. A simple method for estimating evolutionaryrates of base substitutions through comparative studies ofnucleotide sequences. J Mol Evol 16:111–120.
Kivisild T, Reidla M, Metspalu E, Rosa A, Brehm A, Pennarun E,Parik J, Geberhiwot T, Usanga E, Villems R. 2004. Ethiopianmitochondrial DNA heritage: tracking gene flow across andaround the gate of tears. Am J Hum Genet 75:752–770.
Kivisild T, Shen P, Wall DP, Do B, Sung R, Davis KK, Passarino G,Underhill PA, Scharfe C, Torroni A, Scozzari R, Modiano D,Coppa A, de Knjiff P, Feldman MW, Cavalli Sforza LL, OefnerPJ. 2006. The role of selection in the evolution of humanmitochondrial genomes. Genetics 172:373–387.
Kong QP, Yao YG, Sun C, Bandelt HJ, Zhu CL, Zhang YP. 2003.Phylogeny of East Asian mitochondrial DNA lineages inferredfrom complete sequences. Am J Hum Genet 73:671–676[Erratum in Am J Hum Genet 2004;75:157].
Lanave C, Preparata G, Saccone C, Serio G. 1984. A new methodfor calculating evolutionary substitution rates. J Mol Evol 20:86–93.
Macaulay V, Richards M, Hickey E, Vega E, Cruciani F, Guida V,Scozzari R, Bonne-Tamir B, Sykes B, Torroni A. 1999. Theemerging tree of west Eurasian mtDNAs: a synthesis of control-region sequences and RFLPs. Am J Hum Genet 64:232–249.
Macaulay V, Hill C, Achilli A, Rengo C, Clarke D, Meehan W,Blackburn J, Semino O, Scozzari R, Cruciani F, Taha A, ShaariNK, Raja JM, Ismail P, Zainuddin Z, Goodwin W, Bulbeck D,
HUMAN MUTATION 27(9), 965^974,2006 973
Human Mutation DOI 10.1002/humu

Bandelt HJ, Oppenheimer S, Torroni A, Richards M. 2005.Single, rapid coastal settlement of Asia revealed by analysis ofcomplete mitochondrial genomes. Science 308:1034–1036.
Merriwether DA, Hodgson JA, Friedlaender FR, Allaby R, CerchioS, Koki G, Friedlaender JS. 2005. Ancient mitochondrial Mhaplogroups identified in the Southwest Pacific. Proc Natl AcadSci USA 102:13034–13039.
Palanichamy MG, Sun C, Agrawal S, Bandelt HJ, Kong QP, KhanF, Wang CY, Chaudhuri TK, Palla V, Zhang YP. 2004. Phylogenyof mitochondrial DNA macrohaplogroup N in India, based oncomplete sequencing: implications for the peopling of SouthAsia. Am J Hum Genet 75:966–978.
Pesole G, Saccone C. 2001. A novel method for estimatingsubstitution rate variation among sites in a large dataset ofhomologous DNA sequences. Genetics 157:859–865.
Quintana-Murci L, Chaix R, Wells RS, Behar DM, Sayar H,Scozzari R, Rengo C, Al-Zahery N, Semino O, Santachiara-Benerecetti AS, Coppa A, Ayub Q, Mohyuddin A, Tyler-SmithC, Qasim Mehdi S, Torroni A, McElreavey K. 2004. WhereWest meets East: the complex mtDNA landscape of theSouthwest and Central Asian corridor. Am J Hum Genet 74:827–845.
Richards M, Oppenheimer S, Sykes B. 1998. MtDNA suggestsPolynesian origins in Eastern Indonesia. Am J Hum Genet 63:1234–1236.
Richards M, Macaulay V, Hickey E Vega E, Sykes B, Guida V,Rengo C, Sellitto D, Cruciani F, Kivisild T, Villems R, ThomasM, Rychkov S, Rychkov O, Rychkov Y, Golge M, Dimitrov D,Hill E, Bradley D, Romano V, Cali F, Vona G, Demaine A,Papiha S, Triantaphyllidis C, Stefanescu G, Hatina J, Belledi M,Di Rienzo A, Novelletto A, Oppenheim A, Norby S, Al-ZaheriN, Santachiara-Benerecetti S, Scozari R, Torroni A, Bandelt HJ.2000. Tracing European founder lineages in the Near EasternmtDNA pool. Am J Hum Genet 67:1251–1276.
Saccone C, Lanave C, Pesole G, Preparata G. 1990. Influence ofbase composition on quantitative estimates of gene evolution.Methods Enzymol 183:570–583.
Salas A, Richards M, Lareu MV, Scozzari R, Coppa A, Torroni A,Macaulay V, Carracedo A. 2004. The African diaspora:
mitochondrial DNA and the Atlantic slave trade. Am J HumGenet 74:454–465.
Salas A, Yao YG, Macaulay V, Vega A, Carracedo A, Bandelt HJ.2005. A critical reassessment of the role of mitochondria intumorigenesis. PLoS Med 2:296.
Swofford DL. 2002. PAUP*: phylogenetic analysis using parsimony(and other methods) 4.0 beta, Available at: www.sinauer.com/detail.php?id 5 8060. Last accessed: 21 May 2006.
Tanaka M, Cabrera VM, Gonzalez AM, Larruga JM, Takeyasu T,Fuku N, Guo LJ, Hirose R, Fujita Y, Kurata M, Shinoda K,Umetsu K, Yamada Y, Oshida Y, Sato Y, Hattori N, Mizuno Y,Arai Y, Hirose N, Ohta S, Ogawa O, Tanaka Y, Kawamori R,Shamoto-Nagai M, Maruyama W, Shimokata H, Suzuki R,Shimodaira H. 2004. Mitochondrial genome variation in easternAsia and the peopling of Japan. Genome Res 14:1832–1850.
Thangaraj K, Chaubey G, Kivisild T, Reddy AG, Singh VK,Rasalkar AA, Singh L. 2005. Reconstructing the origin ofAndaman Islanders. Science 308:996.
Torroni A, Schurr TG, Cabell MF, Brown MD, Neel JV, Larsen M,Smith DG, Vullo CM, Wallace DC. 1993a. Asian affinities andcontinental radiation of the four founding Native AmericanmtDNAs. Am J Hum Genet 53:563–590.
Torroni A, Sukernik RI, Schurr TG, Starikorskaya YB, Cabell MF,Crawford MH, Comuzzie AG, Wallace DC. 1993b. MtDNAvariation of Aboriginal Siberians reveals distinct geneticaffinities with Native Americans. Am J Hum Genet 53:591–608.
Torroni A, Huoponen K, Francalacci P, Petrozzi M, Morelli L,Scozzari R, Obinu D, Savontaus ML, Wallace DC. 1996.Classification of European mtDNAs from an analysis of threeEuropean populations. Genetics 144:1835–1850.
Trejaut JA, Kivisild T, Loo JH, Lee CL, He CL, Hsu CJ, Li ZY, LinM. 2005. Traces of archaic mitochondrial lineages persist inAustronesian-speaking Formosan populations. PLoS Biol 3:247.
Vigilant L, Stoneking M, Harpending H, Hawkes K, Wilson AC.1991. African population and the evolution of humanmitochondrial DNA. Science 253:1503–1507.
Wallace DC. 2005. A mitochondrial paradigm of metabolic anddegenerative diseases, aging, and cancer: a dawn for evolu-tionary medicine. Annu Rev Genet 39:359–407.
974 HUMAN MUTATION 27(9),965^974,2006
Human Mutation DOI 10.1002/humu