
Identification of palearctic coregonid fish species using mtDNA and allozyme genetic markers

RESEARCH ARTICLE
High Connectivity in Rastrelliger kanagurta:Influence of Historical Signatures andMigratory Behaviour Inferred from mtDNACytochrome bNoor Adelyna Mohammed Akib1*, Bui Minh Tam2, Preeda Phumee3, MuchlisinZainal Abidin4, Saied Tamadoni5, Peter B. Mather6☯, Siti Azizah Mohd Nor7,8☯
1 Centre for Global Sustainability Studies, Universiti Sains Malaysia, Penang, Malaysia, 2 College ofAquaculture and Fisheries, Can Tho University, Can Tho city, Vietnam, 3 Faculty of Science and Fisheriesand Technology, Rajamangala University of Technology Srivijaya Trang Campus, Trang, Thailand, 4Department of Aquaculture, Faculty of Marine and Fishery, Universitas Syiah Kuala, Jl. T. Nyak AriefDarussalam, Banda Aceh, Indonesia, 5 Persian Gulf and Oman Sea Ecological Research Institute, BandarAbbass, Iran, 6 Earth, Environmental and Biological Sciences, Queensland University of Technology,Brisbane, Queensland, Australia, 7 School of Biological Sciences, Universiti Sains Malaysia, Penang,Malaysia, 8 Centre for Marine & Coastal Studies, Universiti Sains Malaysia, Penang, Malaysia
☯ These authors contributed equally to this work.* [email protected]
AbstractPhylogeographic patterns and population structure of the pelagic Indian mackerel, Rastrelli-ger kanagurta were examined in 23 populations collected from the Indonesian-Malaysian
Archipelago (IMA) and the West Indian Ocean (WIO). Despite the vast expanse of the IMA
and neighbouring seas, no evidence for geographical structure was evident. An indication
that R. kanagurta populations across this region are essentially panmictic. This study also
revealed that historical isolation was insufficient for R. kanagurta to attain migration drift
equilibrium. Two distinct subpopulations were detected between the WIO and the IMA (and
adjacent populations); interpopulation genetic variation was high. A plausible explanation
for the genetic differentiation observed between the IMA andWIO regions suggest historical
isolation as a result of fluctuations in sea levels during the late Pleistocene. This occurrence
resulted in the evolution of a phylogeographic break for this species to the north of the Anda-
man Sea.
IntroductionIn the marine realm, fish are abundant and ubiquitous and observed levels of genetic differenti-ation among populations are often low [1]. This pattern results from combined effects of largespawning population sizes that limit genetic drift effects, the apparent absence of physical bar-riers to dispersal for many species in their environment and presence of highly dispersive lifehistory stages that contribute to high rates of gene flow among populations [2]. With no
PLOSONE | DOI:10.1371/journal.pone.0119749 March 18, 2015 1 / 18
OPEN ACCESS
Citation: Akib NAM, Tam BM, Phumee P, Abidin MZ,Tamadoni S, Mather PB, et al. (2015) HighConnectivity in Rastrelliger kanagurta: Influence ofHistorical Signatures and Migratory BehaviourInferred from mtDNA Cytochrome b. PLoS ONE 10(3): e0119749. doi:10.1371/journal.pone.0119749
Academic Editor: Peng Xu, Chinese Academy ofFishery Sciences, CHINA
Received: June 4, 2014
Accepted: February 3, 2015
Published: March 18, 2015
Copyright: © 2015 Akib et al. This is an open accessarticle distributed under the terms of the CreativeCommons Attribution License, which permitsunrestricted use, distribution, and reproduction in anymedium, provided the original author and source arecredited.
Data Availability Statement: All relevant data arewithin the paper and its Supporting Information files.
Funding: Universiti Sains Malaysia funded thisproject under the Research University Grant (1001/PBIOLOGI/815051) and the Postgraduate ResearchGrant Scheme (1001/PPANTAI/844103).
Competing Interests: The authors have declaredthat no competing interests exist.
obvious major physical barriers to gene flow in the marine environment, genetic homogeneityor absence of spatial patterns in allele or haplotype distributions among geographical popula-tions of marine species is expected and is often confirmed in genetics studies [3–4].
However, despite an apparent lack of any physical barriers to gene flow, many marine taxahave often been reported to show population structure [5–11]. Where structured populationsare detected, this has been attributed to a number of factors including; historical and contem-porary interplay among a complex set of ecological, demographic, behavioural, genetic, ocean-ographic, climatic and/or tectonic processes [12]. Evidence for population structure in severalmarine species has been reported in this region. A study of Plectorhinchus flavomaculatus, acoral reef fish sampled from the South China Sea in the Xisha, Zhongsha and Nansha archipel-agos examined variation in the mtDNA control region and identified two discrete lineages[11]. A population pattern of ‘isolation by distance’ was observed in this species. The authorshypothesized that populations may have diverged in different glacial refuges during the Pleisto-cene at times of lower sea levels. Genetic relationships among northern populations of the sixbar wrasse, Thallasoma hardwicki were examined from six localities in the South China Seaand three localities from the Solomon Islands in the South Pacific Ocean [13]. Three majorgroups were detected; a north-central group comprised of northwestern Taiwan and northernVietnam; a southwestern group in southern Vietnam; and a southern group that included thecentral Philippines. Differentiations among these regions were attributed to limitations ongene flow that result from the impacts of sea surface currents. In addition, a study of the crim-son snapper, Lutjanus erythropterus [8] reported that populations in East Asia were dividedinto two major clades: an eastern group that included populations in the western Pacific Oceanand the East Sea, and a South China Sea group that included populations from northern Ma-laysia extending to the South China Sea. The study suggested that limited gene flow betweenthe eastern region and the South China Sea contributed to the observed geographical subdivi-sion. Significant population structure was also evident in the white pomfret, Pampus argenteus,with three distinct clades (the South China Sea, the Arabian Sea and the Bay of Bengal) acrossthe Indo-West Pacific region [14]. Late Pleistocene population expansions were hypothesizedto have contributed to the reported population structure in this species.
The Indian mackerel, Rastrelliger kanagurta is an epipelagic Scombrid that occurs widelyacross the Indo-West Pacific from South Africa, the Seychelles and the Red Sea, east to Indone-sia and northern Australia to Melanesia, Micronesia, Samoa, China and the Ryukyu Islands ofsouthern Japan. It is also believed to have entered the eastern Mediterranean Sea via the SuezCanal [15]. It is one of three species in the genus Rastrelliger that also includes R. brachysomaand R. faughni. In the seas surrounding Malaysia, R. kanagurta is widespread across the north-west and east peninsular Malaysia, Sabah and Sarawak [16] where it is one of the most com-mercially important marine resources [17]. This species is a fast swimmer because of afusiform and streamlined body and therefore highly migratory [18].
To date, there has only been limited study of the population genetics of R. kanagurta. Thesehave included investigations of west peninsular populations employing RAPDmarkers [19]and mtDNA D-loop region [20]. A similar study, also based on RAPD markers examined threepopulations of R. kanagurta from the Indian Peninsular [21] while in another study allozymemarkers (five enzymes and a single sarcoplasmic protein) were employed to investigate popula-tion structuring along the coastal waters of India and the Andaman Sea [22]. All studies [20–22] reported essentially panmixia among sampled populations, although weak populationstructure was detected between northern and southern populations of R. kanagurta in the Straitof Malacca off the coast of Perak [19].
Genetic markers including; allozymes, mtDNA and microsatellites have been employedwidely as markers to investigate the population structures of many marine fish taxa [23–25].
High Connectivity in Rastrelliger kanagurta
PLOSONE | DOI:10.1371/journal.pone.0119749 March 18, 2015 2 / 18
Different types of markers however, can sometimes produce patterns of population structurethat are not concordant [23]. In the current study, mtDNA cytochrome b (Cyt b) was utilisedto assess population structure in R. kanagurta. This marker was chosen because Cyt b containsboth slowly evolving codon positions, which are useful in phylogenetic studies and rapidlyevolving codon positions that are useful for population studies [4, 26–27]. These characteristicsmake mtDNA Cyt b a suitable marker for studies of both phylogenetic and population geneticstudies of fish [27–28].
The current study focused on examining genetic variation in R. kanagurta populations in wa-ters that form part of a major marine biodiversity hotspot in the Indonesian—Malay Archipelago(IMA). These include the Strait of Malacca (an extension of the Indian Ocean), the South ChinaSea, the Sulu Sea and the Celebes Sea. In addition, four populations outlying this area were in-cluded as reference populations and to provide a wider coverage of the species natural distribu-tion. These were from Can Tho, Vietnam, represented the northern South China Sea and twopopulations from Trang, Thailand and Banda Acheh, Indonesia represented the East IndianOcean (Andaman Sea). The fourth population from Bandar Abbas, Iran represented the WestIndian Ocean and served as the outgroup. Variation in the complete Cyt b gene was utilized toexamine genetic structure in R. kanagurta across this vast expanse of waters.
Materials and Methods
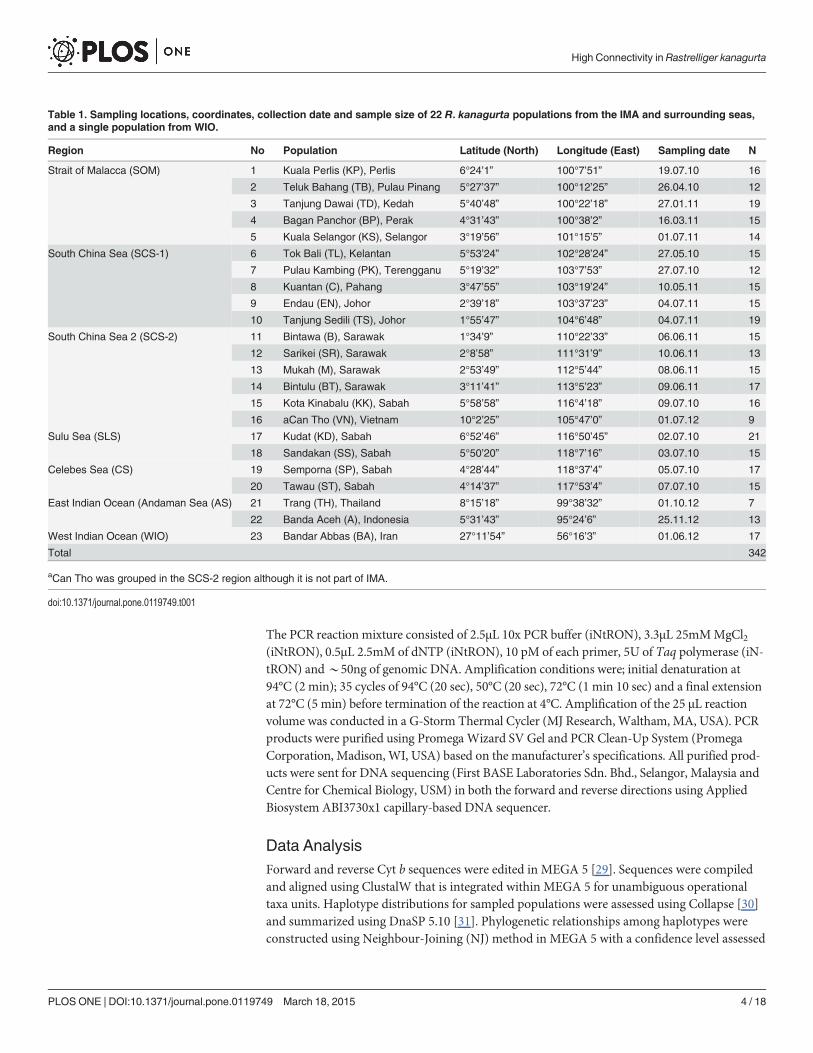
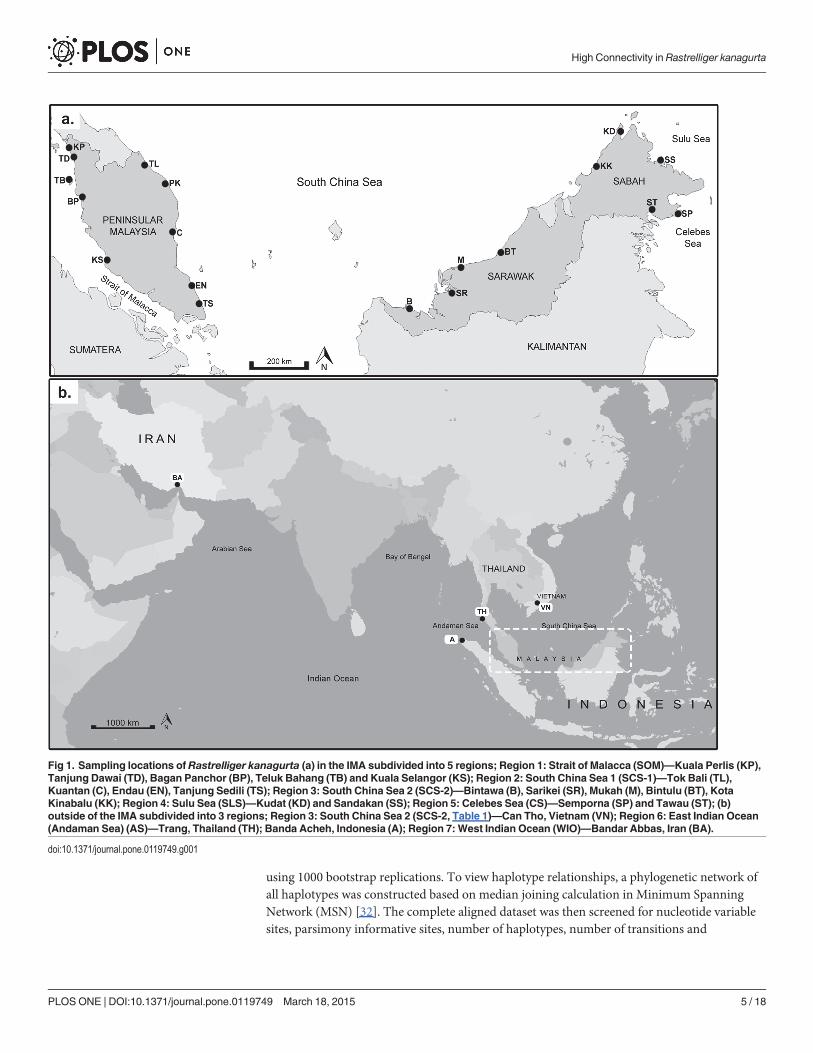
Sampling and DNA sequencingA total of 296 R. kanagurta individuals were collected from 19 locations within the IMA; Straitof Malacca (SOM), South China Sea (SCS), Sulu Sea and Celebes Sea between 2010 to 2011(Table 1, Fig. 1A). In addition, three populations outlying this region, namely Banda Acheh,and Trang (both in the Andaman Sea) and Can Tho (South China Sea but outside of the IMA)were included. AWest Indian Ocean (WIO), Bandar Abbas was also included. These addition-al populations to the IMA provided reference populations and a better geographical coverage,making in total, 342 individuals sampled from 23 locations (Fig. 1B). Populations were subdi-vided into seven geographical regions according to the seas for the analysis (refer Table 1). TheSouth China Sea (SCS1 and SCS 2) was further subdivided due to its extensive wide geographi-cal area. For the Malaysian samples, the samples were either obtained from fishing vessels oper-ating in Zone A (from the shoreline to 5 nautical miles) or Zone B (from 5 to 12 nautical miles)at predetermined landing sites where catches do not overlap due to regulatory enforcement.Therefore, overlapping of populations from various landing sites could be disregarded. We getthe fish samples throughout Malaysia with the help from Department of Fisheries through outMalaysia—Perlis, Kedah, Pulau Pinang, Perak, Selangor, Kelantan, Terengganu, Pahang, Johor,Sabah and Sarawak. For samples outside Malaysia, fin clips preserved in 99% ethanol were ob-tained through the assistance of local collaborators with permission from the respective author-ities. All fishermen have the appropriate permits to fish. The field studies did not involveendangered or protected species. This study does not require an ethics statement because thesesamples are sea food product that can be found in the market.
In all sampling sites where they were physically collected, none of the samples were aliveupon collection and they were not sacrificed for the purposes of this study. Fin clips were re-moved from the right pectoral fin from the dead samples and then preserved in 99% ethanol.
Extraction of DNA template was done using the Aqua Genomic DNA isolation kit (MultiTar-get Pharmaceuticals, Salt Lake City, Utah 84116) as according to the manufacturer’s protocol.Isolated DNA template was PCR amplified for the complete mitochondrial Cyt b. Primer pairused for amplification was; L14317 (5’-CAGGAT TTT AAC CAG GAC TAA TGG CTT GAA-3’) and H15630 (5’-TTA ATT TAG AAT CCT AGC TTT GG-3’) (Takashima, unpublished).
High Connectivity in Rastrelliger kanagurta
PLOSONE | DOI:10.1371/journal.pone.0119749 March 18, 2015 3 / 18
The PCR reaction mixture consisted of 2.5μL 10x PCR buffer (iNtRON), 3.3μL 25mMMgCl2(iNtRON), 0.5μL 2.5mM of dNTP (iNtRON), 10 pM of each primer, 5U of Taq polymerase (iN-tRON) and*50ng of genomic DNA. Amplification conditions were; initial denaturation at94°C (2 min); 35 cycles of 94°C (20 sec), 50°C (20 sec), 72°C (1 min 10 sec) and a final extensionat 72°C (5 min) before termination of the reaction at 4°C. Amplification of the 25 μL reactionvolume was conducted in a G-Storm Thermal Cycler (MJ Research, Waltham, MA, USA). PCRproducts were purified using Promega Wizard SV Gel and PCR Clean-Up System (PromegaCorporation, Madison, WI, USA) based on the manufacturer’s specifications. All purified prod-ucts were sent for DNA sequencing (First BASE Laboratories Sdn. Bhd., Selangor, Malaysia andCentre for Chemical Biology, USM) in both the forward and reverse directions using AppliedBiosystem ABI3730x1 capillary-based DNA sequencer.
Data AnalysisForward and reverse Cyt b sequences were edited in MEGA 5 [29]. Sequences were compiledand aligned using ClustalW that is integrated within MEGA 5 for unambiguous operationaltaxa units. Haplotype distributions for sampled populations were assessed using Collapse [30]and summarized using DnaSP 5.10 [31]. Phylogenetic relationships among haplotypes wereconstructed using Neighbour-Joining (NJ) method in MEGA 5 with a confidence level assessed
Table 1. Sampling locations, coordinates, collection date and sample size of 22 R. kanagurta populations from the IMA and surrounding seas,and a single population from WIO.
Region No Population Latitude (North) Longitude (East) Sampling date N
Strait of Malacca (SOM) 1 Kuala Perlis (KP), Perlis 6°24’1” 100°7’51” 19.07.10 16
2 Teluk Bahang (TB), Pulau Pinang 5°27’37” 100°12’25” 26.04.10 12
3 Tanjung Dawai (TD), Kedah 5°40’48” 100°22’18” 27.01.11 19
4 Bagan Panchor (BP), Perak 4°31’43” 100°38’2” 16.03.11 15
5 Kuala Selangor (KS), Selangor 3°19’56” 101°15’5” 01.07.11 14
South China Sea (SCS-1) 6 Tok Bali (TL), Kelantan 5°53’24” 102°28’24” 27.05.10 15
7 Pulau Kambing (PK), Terengganu 5°19’32” 103°7’53” 27.07.10 12
8 Kuantan (C), Pahang 3°47’55” 103°19’24” 10.05.11 15
9 Endau (EN), Johor 2°39’18” 103°37’23” 04.07.11 15
10 Tanjung Sedili (TS), Johor 1°55’47” 104°6’48” 04.07.11 19
South China Sea 2 (SCS-2) 11 Bintawa (B), Sarawak 1°34’9” 110°22’33” 06.06.11 15
12 Sarikei (SR), Sarawak 2°8’58” 111°31’9” 10.06.11 13
13 Mukah (M), Sarawak 2°53’49” 112°5’44” 08.06.11 15
14 Bintulu (BT), Sarawak 3°11’41” 113°5’23” 09.06.11 17
15 Kota Kinabalu (KK), Sabah 5°58’58” 116°4’18” 09.07.10 16
16 aCan Tho (VN), Vietnam 10°2’25” 105°47’0” 01.07.12 9
Sulu Sea (SLS) 17 Kudat (KD), Sabah 6°52’46” 116°50’45” 02.07.10 21
18 Sandakan (SS), Sabah 5°50’20” 118°7’16” 03.07.10 15
Celebes Sea (CS) 19 Semporna (SP), Sabah 4°28’44” 118°37’4” 05.07.10 17
20 Tawau (ST), Sabah 4°14’37” 117°53’4” 07.07.10 15
East Indian Ocean (Andaman Sea (AS) 21 Trang (TH), Thailand 8°15’18” 99°38’32” 01.10.12 7
22 Banda Aceh (A), Indonesia 5°31’43” 95°24’6” 25.11.12 13
West Indian Ocean (WIO) 23 Bandar Abbas (BA), Iran 27°11’54” 56°16’3” 01.06.12 17
Total 342
aCan Tho was grouped in the SCS-2 region although it is not part of IMA.
doi:10.1371/journal.pone.0119749.t001
High Connectivity in Rastrelliger kanagurta
PLOSONE | DOI:10.1371/journal.pone.0119749 March 18, 2015 4 / 18
using 1000 bootstrap replications. To view haplotype relationships, a phylogenetic network ofall haplotypes was constructed based on median joining calculation in Minimum SpanningNetwork (MSN) [32]. The complete aligned dataset was then screened for nucleotide variablesites, parsimony informative sites, number of haplotypes, number of transitions and
Fig 1. Sampling locations ofRastrelliger kanagurta (a) in the IMA subdivided into 5 regions; Region 1: Strait of Malacca (SOM)—Kuala Perlis (KP),Tanjung Dawai (TD), Bagan Panchor (BP), Teluk Bahang (TB) and Kuala Selangor (KS); Region 2: South China Sea 1 (SCS-1)—Tok Bali (TL),Kuantan (C), Endau (EN), Tanjung Sedili (TS); Region 3: South China Sea 2 (SCS-2)—Bintawa (B), Sarikei (SR), Mukah (M), Bintulu (BT), KotaKinabalu (KK); Region 4: Sulu Sea (SLS)—Kudat (KD) and Sandakan (SS); Region 5: Celebes Sea (CS)—Semporna (SP) and Tawau (ST); (b)outside of the IMA subdivided into 3 regions; Region 3: South China Sea 2 (SCS-2, Table 1)—Can Tho, Vietnam (VN); Region 6: East Indian Ocean(Andaman Sea) (AS)—Trang, Thailand (TH); Banda Acheh, Indonesia (A); Region 7: West Indian Ocean (WIO)—Bandar Abbas, Iran (BA).
doi:10.1371/journal.pone.0119749.g001
High Connectivity in Rastrelliger kanagurta
PLOSONE | DOI:10.1371/journal.pone.0119749 March 18, 2015 5 / 18
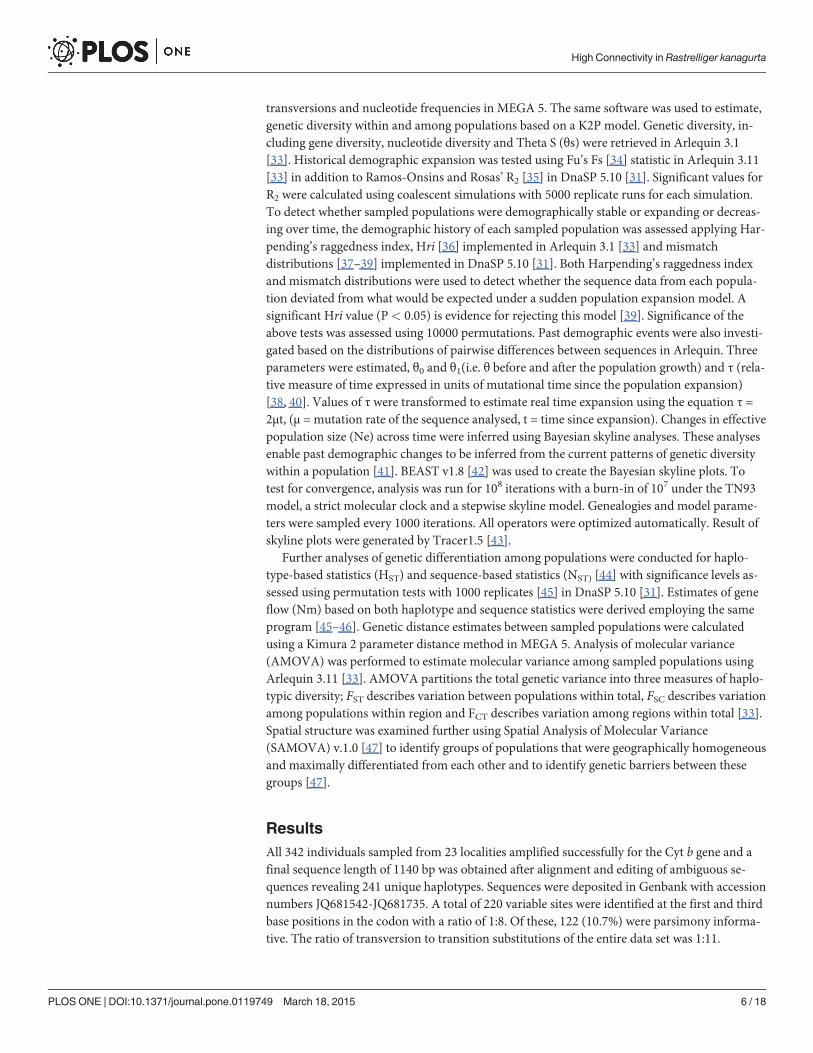
transversions and nucleotide frequencies in MEGA 5. The same software was used to estimate,genetic diversity within and among populations based on a K2P model. Genetic diversity, in-cluding gene diversity, nucleotide diversity and Theta S (θs) were retrieved in Arlequin 3.1[33]. Historical demographic expansion was tested using Fu’s Fs [34] statistic in Arlequin 3.11[33] in addition to Ramos-Onsins and Rosas’ R2 [35] in DnaSP 5.10 [31]. Significant values forR2 were calculated using coalescent simulations with 5000 replicate runs for each simulation.To detect whether sampled populations were demographically stable or expanding or decreas-ing over time, the demographic history of each sampled population was assessed applying Har-pending’s raggedness index, Hri [36] implemented in Arlequin 3.1 [33] and mismatchdistributions [37–39] implemented in DnaSP 5.10 [31]. Both Harpending’s raggedness indexand mismatch distributions were used to detect whether the sequence data from each popula-tion deviated from what would be expected under a sudden population expansion model. Asignificant Hri value (P< 0.05) is evidence for rejecting this model [39]. Significance of theabove tests was assessed using 10000 permutations. Past demographic events were also investi-gated based on the distributions of pairwise differences between sequences in Arlequin. Threeparameters were estimated, θ0 and θ1(i.e. θ before and after the population growth) and τ (rela-tive measure of time expressed in units of mutational time since the population expansion)[38, 40]. Values of τ were transformed to estimate real time expansion using the equation τ =2μt, (μ = mutation rate of the sequence analysed, t = time since expansion). Changes in effectivepopulation size (Ne) across time were inferred using Bayesian skyline analyses. These analysesenable past demographic changes to be inferred from the current patterns of genetic diversitywithin a population [41]. BEAST v1.8 [42] was used to create the Bayesian skyline plots. Totest for convergence, analysis was run for 108 iterations with a burn-in of 107 under the TN93model, a strict molecular clock and a stepwise skyline model. Genealogies and model parame-ters were sampled every 1000 iterations. All operators were optimized automatically. Result ofskyline plots were generated by Tracer1.5 [43].
Further analyses of genetic differentiation among populations were conducted for haplo-type-based statistics (HST) and sequence-based statistics (NST) [44] with significance levels as-sessed using permutation tests with 1000 replicates [45] in DnaSP 5.10 [31]. Estimates of geneflow (Nm) based on both haplotype and sequence statistics were derived employing the sameprogram [45–46]. Genetic distance estimates between sampled populations were calculatedusing a Kimura 2 parameter distance method in MEGA 5. Analysis of molecular variance(AMOVA) was performed to estimate molecular variance among sampled populations usingArlequin 3.11 [33]. AMOVA partitions the total genetic variance into three measures of haplo-typic diversity; FST describes variation between populations within total, FSC describes variationamong populations within region and FCT describes variation among regions within total [33].Spatial structure was examined further using Spatial Analysis of Molecular Variance(SAMOVA) v.1.0 [47] to identify groups of populations that were geographically homogeneousand maximally differentiated from each other and to identify genetic barriers between thesegroups [47].
ResultsAll 342 individuals sampled from 23 localities amplified successfully for the Cyt b gene and afinal sequence length of 1140 bp was obtained after alignment and editing of ambiguous se-quences revealing 241 unique haplotypes. Sequences were deposited in Genbank with accessionnumbers JQ681542-JQ681735. A total of 220 variable sites were identified at the first and thirdbase positions in the codon with a ratio of 1:8. Of these, 122 (10.7%) were parsimony informa-tive. The ratio of transversion to transition substitutions of the entire data set was 1:11.
High Connectivity in Rastrelliger kanagurta
PLOSONE | DOI:10.1371/journal.pone.0119749 March 18, 2015 6 / 18
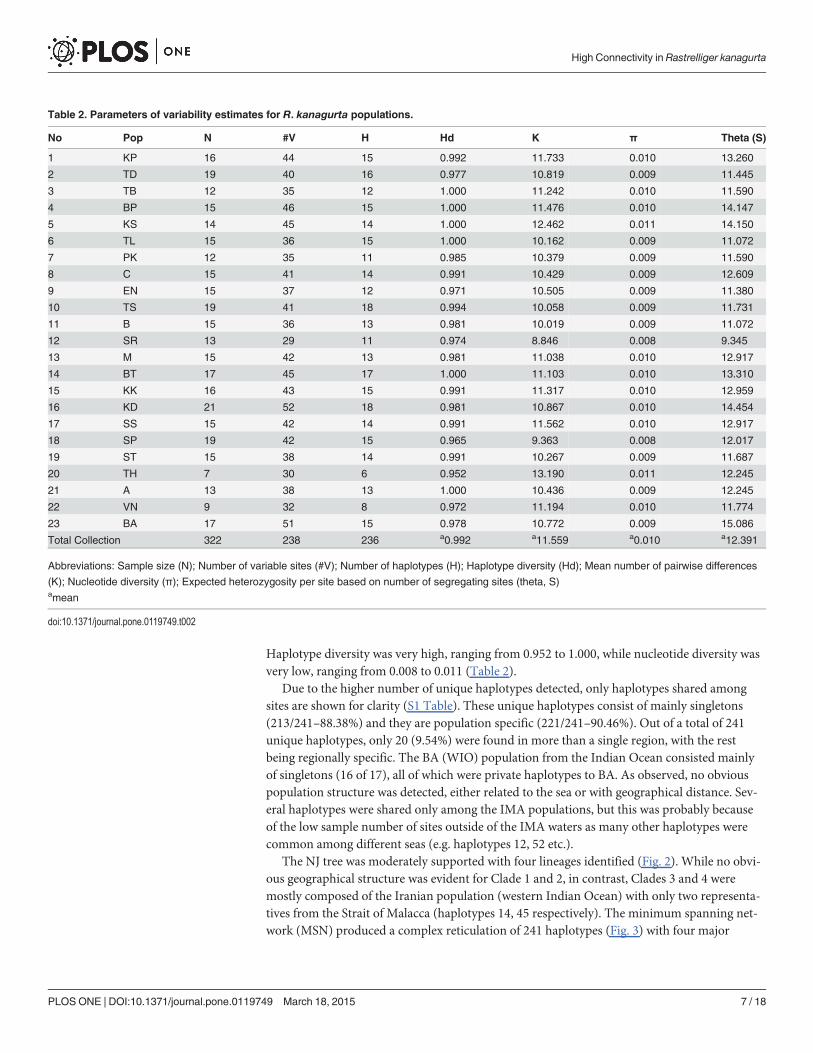
Haplotype diversity was very high, ranging from 0.952 to 1.000, while nucleotide diversity wasvery low, ranging from 0.008 to 0.011 (Table 2).
Due to the higher number of unique haplotypes detected, only haplotypes shared amongsites are shown for clarity (S1 Table). These unique haplotypes consist of mainly singletons(213/241–88.38%) and they are population specific (221/241–90.46%). Out of a total of 241unique haplotypes, only 20 (9.54%) were found in more than a single region, with the restbeing regionally specific. The BA (WIO) population from the Indian Ocean consisted mainlyof singletons (16 of 17), all of which were private haplotypes to BA. As observed, no obviouspopulation structure was detected, either related to the sea or with geographical distance. Sev-eral haplotypes were shared only among the IMA populations, but this was probably becauseof the low sample number of sites outside of the IMA waters as many other haplotypes werecommon among different seas (e.g. haplotypes 12, 52 etc.).
The NJ tree was moderately supported with four lineages identified (Fig. 2). While no obvi-ous geographical structure was evident for Clade 1 and 2, in contrast, Clades 3 and 4 weremostly composed of the Iranian population (western Indian Ocean) with only two representa-tives from the Strait of Malacca (haplotypes 14, 45 respectively). The minimum spanning net-work (MSN) produced a complex reticulation of 241 haplotypes (Fig. 3) with four major
Table 2. Parameters of variability estimates for R. kanagurta populations.
No Pop N #V H Hd K π Theta (S)
1 KP 16 44 15 0.992 11.733 0.010 13.260
2 TD 19 40 16 0.977 10.819 0.009 11.445
3 TB 12 35 12 1.000 11.242 0.010 11.590
4 BP 15 46 15 1.000 11.476 0.010 14.147
5 KS 14 45 14 1.000 12.462 0.011 14.150
6 TL 15 36 15 1.000 10.162 0.009 11.072
7 PK 12 35 11 0.985 10.379 0.009 11.590
8 C 15 41 14 0.991 10.429 0.009 12.609
9 EN 15 37 12 0.971 10.505 0.009 11.380
10 TS 19 41 18 0.994 10.058 0.009 11.731
11 B 15 36 13 0.981 10.019 0.009 11.072
12 SR 13 29 11 0.974 8.846 0.008 9.345
13 M 15 42 13 0.981 11.038 0.010 12.917
14 BT 17 45 17 1.000 11.103 0.010 13.310
15 KK 16 43 15 0.991 11.317 0.010 12.959
16 KD 21 52 18 0.981 10.867 0.010 14.454
17 SS 15 42 14 0.991 11.562 0.010 12.917
18 SP 19 42 15 0.965 9.363 0.008 12.017
19 ST 15 38 14 0.991 10.267 0.009 11.687
20 TH 7 30 6 0.952 13.190 0.011 12.245
21 A 13 38 13 1.000 10.436 0.009 12.245
22 VN 9 32 8 0.972 11.194 0.010 11.774
23 BA 17 51 15 0.978 10.772 0.009 15.086
Total Collection 322 238 236 a0.992 a11.559 a0.010 a12.391
Abbreviations: Sample size (N); Number of variable sites (#V); Number of haplotypes (H); Haplotype diversity (Hd); Mean number of pairwise differences
(K); Nucleotide diversity (π); Expected heterozygosity per site based on number of segregating sites (theta, S)amean
doi:10.1371/journal.pone.0119749.t002
High Connectivity in Rastrelliger kanagurta
PLOSONE | DOI:10.1371/journal.pone.0119749 March 18, 2015 7 / 18
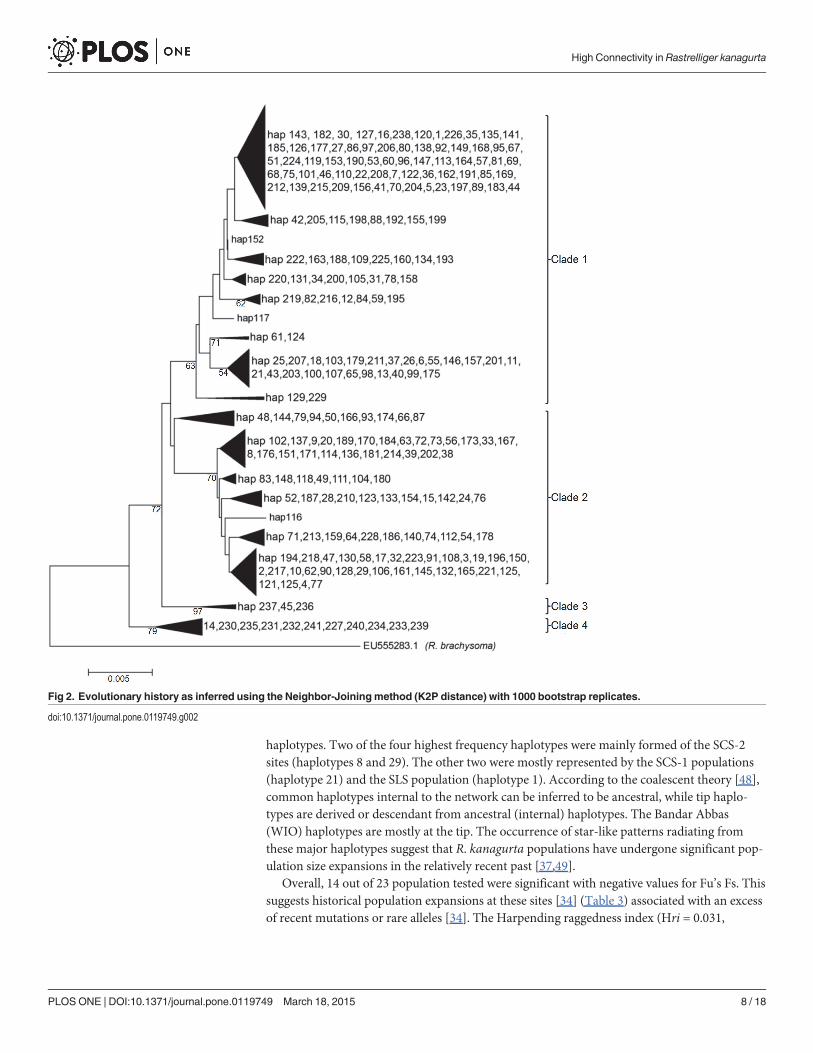
haplotypes. Two of the four highest frequency haplotypes were mainly formed of the SCS-2sites (haplotypes 8 and 29). The other two were mostly represented by the SCS-1 populations(haplotype 21) and the SLS population (haplotype 1). According to the coalescent theory [48],common haplotypes internal to the network can be inferred to be ancestral, while tip haplo-types are derived or descendant from ancestral (internal) haplotypes. The Bandar Abbas(WIO) haplotypes are mostly at the tip. The occurrence of star-like patterns radiating fromthese major haplotypes suggest that R. kanagurta populations have undergone significant pop-ulation size expansions in the relatively recent past [37,49].
Overall, 14 out of 23 population tested were significant with negative values for Fu’s Fs. Thissuggests historical population expansions at these sites [34] (Table 3) associated with an excessof recent mutations or rare alleles [34]. The Harpending raggedness index (Hri = 0.031,
Fig 2. Evolutionary history as inferred using the Neighbor-Joiningmethod (K2P distance) with 1000 bootstrap replicates.
doi:10.1371/journal.pone.0119749.g002
High Connectivity in Rastrelliger kanagurta
PLOSONE | DOI:10.1371/journal.pone.0119749 March 18, 2015 8 / 18

p>0.05) corroborated results from Fu’s Fs analysis indicating that some populations hadexpanded recently.
Past population demographic of R. kanagurtamatched the bimodal mismatch distributionfor all four clades. Comparison between observed frequencies of pairwise differences withthose expected under various demographic models [50] (Fig. 4) added support for a spatial ex-pansion followed by a recent demographic expansion [50–51]. Bayesian skyline plot revealedan episode of abrupt demographic expansion around 100 to 120 thousand years (kyr) beforepresent, which also falls into the Pleistocene period (Fig. 5). The flat skyline plot also indicatesthat the population has remained at a constant size over time before the expansion. Time sincethe population expansion was estimated to be 7.816/2u generations. Given a mutation rate ofperciform Cyt b of 1–2% per million years [52–53], the R. kanagurta population expansion wasestimated to have taken place 171,403 to 342,807 years bp.
AMOVA analysis performed on the 23 populations, subdivided into seven geographicalgroups according to the seas (group 1: SOM; group 2: SCS-1; group 3:SCS-2; group 4:SS; group5: CS; group 6: AS; group 7: WIO). The South China Sea (SCS1 and SCS 2) was further subdi-vided due to its extensive wide geographical area. AMOVA analysis showed that among groupvariation was less than 1% (FCT = 0.0023, p<0.05) but significant genetic differentiation was
Fig 3. Minimum spanning network (MSN) inferred from complete mtDNACyt b. Coloured close circles represent different regions (refer to legend).mv = median vectors. The red circle in the figure represents the BA tip haplotypes.
doi:10.1371/journal.pone.0119749.g003
High Connectivity in Rastrelliger kanagurta
PLOSONE | DOI:10.1371/journal.pone.0119749 March 18, 2015 9 / 18

present between at least two groups. Genetic differentiation among populations within groupswas 0.41% and significant (FSC = 0.0041, p>0.05). Presumably this results from the divergenceof the BA population from all other sampled sites when site BA was included in the analysis.Genetic variation within populations was high at 99.36% revealing that most of the variationwas present within populations, while FST were low and not significant (FST = 0.0064, p<0.05).The analysis was repeated with the Iranian (BA) population (WIO) excluded to test. The test isto discover whether genetic differentiation was evident at finer spatial scales across the IMAand the surrounding seas (Trang, Banda Aceh—Andaman Sea of east Indian Ocean; Can Tho-South China Sea). The samples were divided into 6 groups; group 1: SOM; group 2: SCS-1;group 3: SCS-2; group 4: SS; group 5: CS, group 6:AS. The FCT value for this additional analysiswas not significant (p>0.05).
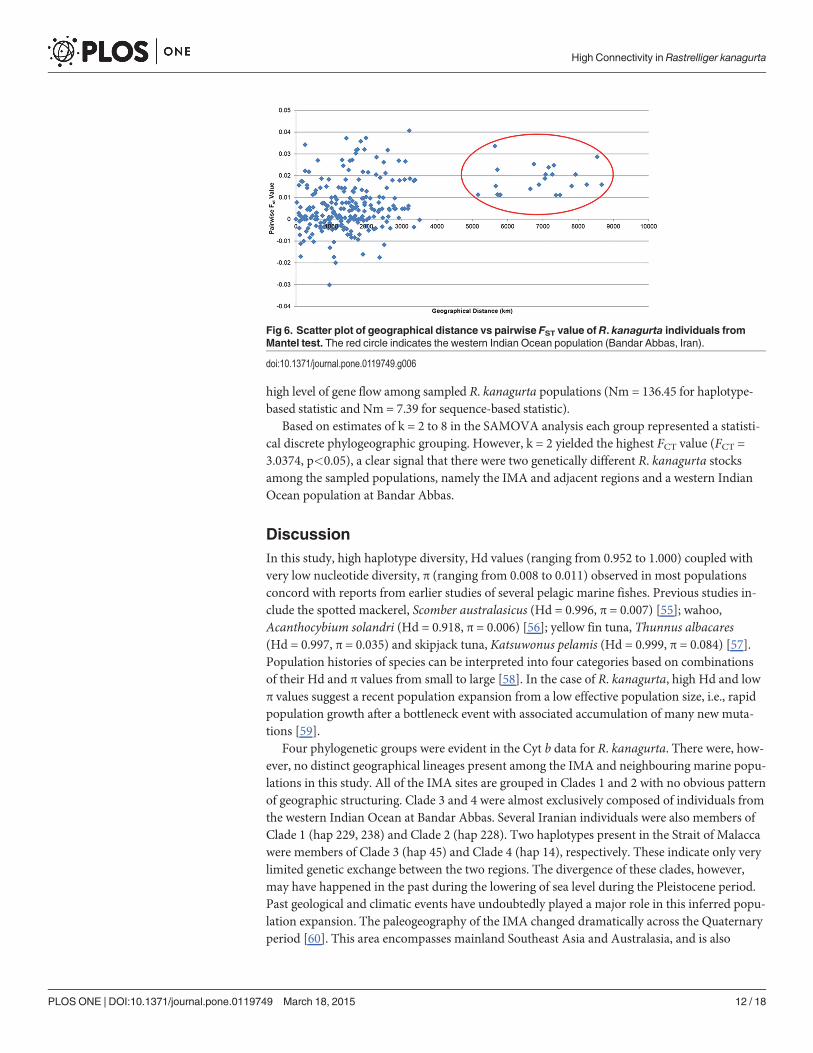
Results of a Mantel test [54] supported previous outcomes showing no significant correla-tion between genetic differentiation (pairwise FST value) and geographical distance (r = 0.370,p>0.05, 1000 permutations) among the sampled populations (Fig. 6). The graph, however, didshow two distinct clusters. The first cluster comprised all samples from the Strait of Malacca,South China Sea, Sulu Sea and Celebes Sea and the Andaman Sea (eastern Indian Ocean-Banda Aceh and Trang), while the second contained the western Indian Ocean population ofBandar Abbas. The Cyt b FST values were close to 0 (-0.030–0.042) (data not shown) and were
Table 3. Statistical tests of neutrality (Fu’s Fs) and demographic parameter estimates for R. kanagurta.
No. Population Tau Hri index Fu’s Fs θ0 θ1 R2
1 KP 16.313 0.017 -4.997* 0.004 47.031 0.110
2 TD 15.430 0.022 -4.219 0.000 26.746 0.111
3 TB 15.023 0.030 -4.503* 0.004 30.371 0.128
4 BP 14.117 0.045 -6.710* 0.002 96.719 0.092
5 KS 15.711 0.034 -5.543* 0.007 42.937 0.106
6 TL 15.375 0.025 -7.355* 0.002 21.696 0.116
7 PK 15.600 0.042 -2.748 0.000 57.979 0.107
8 C 13.566 0.013 -4.802* 0.334 25.820 0.092
9 EN 13.830 0.023 -1.834 0.002 34.377 0.118
10 TS 13.336 0.013 -8.401* 0.000 30.527 0.092
11 B 15.059 0.025 -3.280 0.000 24.166 0.110
12 SR 0.607 0.026 -2.410 11.333 99999.000 0.124
13 M 15.434 0.043 -2.917 0.000 30.079 0.105
14 BT 16.342 0.015 -8.629* 0.000 37.477 0.094
15 KK 15.732 0.016 -5.710* 0.000 29.941 0.106
16 KD 16.113 0.010 -5.670* 0.002 26.795 0.079
17 SS 16.637 0.020 -4.350* 0.005 25.251 0.115
18 SP 4.104 0.037 -3.583 6.572 89.023 0.009
19 ST 14.736 0.011 -4.874* 0.000 23.730 0.107
20 TH 18.781 0.0930 0.627 0.005 40.437 0.157
21 A 3.240 0.036 -5.547* 10.593 99999.000 0.104
22 VN 15.762 0.086 -0.809 0.000 37.510 0.126
23 BA 0.854 0.021 -4.347 12.734 99999.000 0.0780
TOTAL 7.816 a0.031(0.662) a-4.437* a1.809 a13077.201 0.024(0.0002)*
Significant value p<0.05 (*) after FDR procedure α = 0.05.aMean
doi:10.1371/journal.pone.0119749.t003
High Connectivity in Rastrelliger kanagurta
PLOSONE | DOI:10.1371/journal.pone.0119749 March 18, 2015 10 / 18
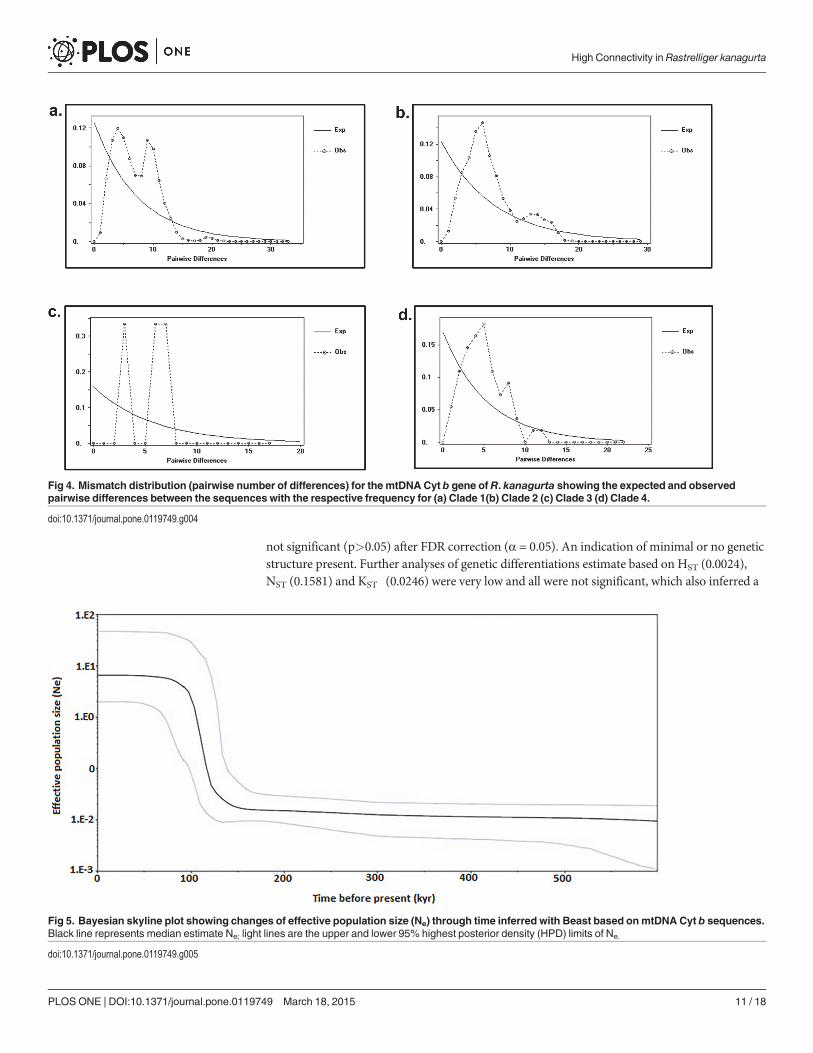
not significant (p>0.05) after FDR correction (α = 0.05). An indication of minimal or no geneticstructure present. Further analyses of genetic differentiations estimate based on HST (0.0024),NST (0.1581) and KST
� (0.0246) were very low and all were not significant, which also inferred a
Fig 4. Mismatch distribution (pairwise number of differences) for the mtDNA Cyt b gene of R. kanagurta showing the expected and observedpairwise differences between the sequences with the respective frequency for (a) Clade 1(b) Clade 2 (c) Clade 3 (d) Clade 4.
doi:10.1371/journal.pone.0119749.g004
Fig 5. Bayesian skyline plot showing changes of effective population size (Ne) through time inferred with Beast based onmtDNA Cyt b sequences.Black line represents median estimate Ne; light lines are the upper and lower 95% highest posterior density (HPD) limits of Ne.
doi:10.1371/journal.pone.0119749.g005
High Connectivity in Rastrelliger kanagurta
PLOSONE | DOI:10.1371/journal.pone.0119749 March 18, 2015 11 / 18
high level of gene flow among sampled R. kanagurta populations (Nm = 136.45 for haplotype-based statistic and Nm = 7.39 for sequence-based statistic).
Based on estimates of k = 2 to 8 in the SAMOVA analysis each group represented a statisti-cal discrete phylogeographic grouping. However, k = 2 yielded the highest FCT value (FCT =3.0374, p<0.05), a clear signal that there were two genetically different R. kanagurta stocksamong the sampled populations, namely the IMA and adjacent regions and a western IndianOcean population at Bandar Abbas.
DiscussionIn this study, high haplotype diversity, Hd values (ranging from 0.952 to 1.000) coupled withvery low nucleotide diversity, π (ranging from 0.008 to 0.011) observed in most populationsconcord with reports from earlier studies of several pelagic marine fishes. Previous studies in-clude the spotted mackerel, Scomber australasicus (Hd = 0.996, π = 0.007) [55]; wahoo,Acanthocybium solandri (Hd = 0.918, π = 0.006) [56]; yellow fin tuna, Thunnus albacares(Hd = 0.997, π = 0.035) and skipjack tuna, Katsuwonus pelamis (Hd = 0.999, π = 0.084) [57].Population histories of species can be interpreted into four categories based on combinationsof their Hd and π values from small to large [58]. In the case of R. kanagurta, high Hd and lowπ values suggest a recent population expansion from a low effective population size, i.e., rapidpopulation growth after a bottleneck event with associated accumulation of many new muta-tions [59].
Four phylogenetic groups were evident in the Cyt b data for R. kanagurta. There were, how-ever, no distinct geographical lineages present among the IMA and neighbouring marine popu-lations in this study. All of the IMA sites are grouped in Clades 1 and 2 with no obvious patternof geographic structuring. Clade 3 and 4 were almost exclusively composed of individuals fromthe western Indian Ocean at Bandar Abbas. Several Iranian individuals were also members ofClade 1 (hap 229, 238) and Clade 2 (hap 228). Two haplotypes present in the Strait of Malaccawere members of Clade 3 (hap 45) and Clade 4 (hap 14), respectively. These indicate only verylimited genetic exchange between the two regions. The divergence of these clades, however,may have happened in the past during the lowering of sea level during the Pleistocene period.Past geological and climatic events have undoubtedly played a major role in this inferred popu-lation expansion. The paleogeography of the IMA changed dramatically across the Quaternaryperiod [60]. This area encompasses mainland Southeast Asia and Australasia, and is also
Fig 6. Scatter plot of geographical distance vs pairwise FST value of R. kanagurta individuals fromMantel test. The red circle indicates the western Indian Ocean population (Bandar Abbas, Iran).
doi:10.1371/journal.pone.0119749.g006
High Connectivity in Rastrelliger kanagurta
PLOSONE | DOI:10.1371/journal.pone.0119749 March 18, 2015 12 / 18

known as the Indo-Australian Archipelago or East Indies. During the Pleistocene glacial peri-ods, lowering of ocean levels periodically exposed the Sunda Shelf and Sahul Shelf within thisarchipelago. The former is an extension of the coastal shelf of Southeast Asia, including theMalay-Peninsula, Sumatra, Java and Borneo to Palawan. Fluctuations in sea levels during thePleistocene epoch would have resulted in a significant impact on the dispersal of marine andterrestrial species. Thus shaping the modern genetic structures of many species that inhabitthis region as we see it today [61–64]. This scenario had been hypothesized for many marinespecies including the redlip mullet, Chelon haematocheilus [65] and Japanese sea bass, Lateo-labrax japonicas [66].
During the last Interglacial Period, there were marine connections between the IndianOcean and the South China Sea via the Straits of Singapore [64]. These connections wouldhave permitted extensive population expansion by R. kanagurta where previously they wouldhave been isolated. Estimation of the time since expansion of R. kanagurta suggests that thetiming of this event ranged from 171,403 to 342,807 years bp. The timing of the event is consis-tent with the occurrence of sea level rises cyclically during the late Pleistocene between1,600,000 to 10,000 years ago [8,67]. Land bridges that were exposed during periodic declinesin sea level prior to the last Interglacial period were likely to have hampered dispersal of R.kanagurta and led to smaller isolated populations. During that time, no barriers to dispersal bysea were present, at least between Peninsular Malaysia and the islands of the Riau Archipelagoand Sumatra. Thus consequently permitting free migration of R. kanagurta populations acrossthe region. The last glacial maximum (LGM), 30,000 to 19,000 years ago led to the final declinein sea levels to modern times [67–68]. A substantial area of the Sunda and Sahul shelves wereexposed periodically as sea levels associated with glaciations declined up to 200m below theirpresent level [69]. This process would also have hindered dispersal by many marine taxa. Atthis time, the adjacent South China Sea was significantly reduced in size and formed a semi-closed marginal sea and this exposed a large low gradient on the Sundaland craton[67]. Duringthis time, the modern Malayan Peninsula, Borneo and Sumatra formed highlands to the South[70] producing a potential barrier to population migration.
Isolated marine populations at this time would have been subjected to increased levels of in-breeding. Potentially leading to declines in population levels of genetic variation and geneticstructuring of populations during this short period of the LGM. There are also possibilities ofindividuals that may have dispersed to the east or west of the adjacent flooded basins. This pat-tern is not concordant however, with the pattern observed in R. kanagurta. They experiencedalmost complete panmixia evident in modern populations in SE Asia over a vast expanse oftwo oceans. It can be conjectured therefore, that the brief duration of LGM, followed by a riseof sea level approximately 18000 years ago until the present modern sea levels were reached,was insufficient for R. kanagurta to attain migration drift equilibrium. This would be mani-fested in low genetic differentiation and low genetic structuring among extant populationsuntil the present time.
Similar scenarios have been hypothesized for many marine species present across this re-gion. Examples include the Indo-Pacific butterfly fishes [71], pelagic scads, Decapterus macro-soma and D.macarellus [72] and Eastern little tuna, Euthynnus affinis [73]. Based on theresults of the MSN analysis (Fig. 3) it is postulated that this expansion probably occurred fromeast to west as evidenced by the Sundaland origin of the four major haplotypes (ancestral)while all unique WIO haplotypes were tip haplotypes (descendant). Detailed examination ofthe MSN analysis revealed that two of the four putative ancestral haplotypes in the SCS-1 andSCS-2, based on the highest frequency suggest that the centre of origin for modern R. kana-gurta populations were in the South China Sea from which populations could have radiatedboth eastwards and westwards.
High Connectivity in Rastrelliger kanagurta
PLOSONE | DOI:10.1371/journal.pone.0119749 March 18, 2015 13 / 18
Marine fishes with high dispersal potential typically display low levels of population geneticstructure and associated high levels of ongoing gene flow [74]. This would produce shallowevolutionary trajectories and, potentially, limit or reduce adaptive divergence among local pop-ulations [7]. The overall low and non-significant FST values reported here among the 23 R.kanagurta populations are concordant with a pattern of Cyt b homogeneity and high gene flow(Nm = 136.45). The level of genetic differentiation among populations has a predictable rela-tionship with rates of important evolutionary processes (migration, mutation, drift) [75]. Thus,a highly migratory species with large populations should show limited population differentia-tion. This is in contrast to species with small populations and reduced migration rates, wherewe might expect greater differentiation [75].
Several other investigations have also reported relative panmixia in marine species acrossthis region. For example, an apparent lack of genetic structure in marine species present in theCoral Triangle region of Southeast Asia has also been reported in several marine taxa including;pelagic scads, Decapterus macrosoma and D.macarellus [72] and the eastern little tuna,Euthynnus affinis [73]. Slight population differentiation was observed between the IMA (andadjacent populations) with the WIO Bandar Abbas population. Moderate to high rates of geneflow among populations can prevent sub-population isolation, hence maintaining genetic vari-ation levels and reducing inbreeding [76–77]. This, however, not always a simple relationship.The hierarchical AMOVA results here showed low but significant FST and FCT outcomes. Anindication of shallow genetic structure among populations of R. kanagurta. This was confirmedby spatial genetic heterogeneity (k = 2 in SAMOVA) between groups comprising populationsin the IMA and surrounding seas vs a second group in the western Indian Ocean (BandarAbbas, Iran). The Mantel test results did not support an ‘isolation by distance’model. Thus amore plausible explanation for population differentiation between the two distinct groups of R.kanagurta was a result compounded by co-effects of various factors, including historical physi-cal isolation during the Pleistocene epoch, larval dispersal factors and ocean currents.
Historical isolation would suggest the genetic differentiation evident between the IMA andWIO regions may have resulted from fluctuations in sea levels during the late Pleistocene. Thisled to a phylogeographic break for this species to the north of the Andaman Sea. Studies ofother marine taxa across this region have reported co-effects on population differentiation ofvarious factors. This was observed in the orange-spotted grouper, Epinephelus coiodes fromChina (South China Sea) and Malaysia through Indonesia (Southeast Asia) [78].
Ocean surface currents can also play an important role in marine larval dispersal. The sur-face current of the Indian Ocean is mainly under the influence of monsoon currents, also re-ferred to as monsoon drift. It flows between the Bay of Bengal and the Arabian Sea [79]. Incontrast, the seas surrounding Malaysia are affected by the Kuroshio current, the major surfacecurrent in the South China Sea [14]. These two sea surface currents could potentially contrib-ute to population differentiation of eastern and western populations of R. kanagurta.
The Cyt b analysis of R. Kanagurta populations in the current study provide strong evidencefor two discrete R. kanagurta stocks comprising western Indian Ocean and Southeast Asianpopulations. The two clades should therefore be considered different management units. Whilethe patterns are clear, results need to be validated because they are based on evidence from asingle maternal lineage gene that may not necessarily reflect the complete story.
ConclusionsThe sampled R. kanagurta populations in Malaysian waters showed only weak spatial differen-tiation with high genetic variation as inferred from mtDNA Cyt b. The study did reveal howev-er, two discrete populations of R. kanagurta, the Southeast Asian populations (South China
High Connectivity in Rastrelliger kanagurta
PLOSONE | DOI:10.1371/journal.pone.0119749 March 18, 2015 14 / 18
Sea, Strait of Malacca, Sulu Sea, Celebes Sea, Andaman Sea) and an Iranian population (west-ern Indian Ocean). In general, however, the data here suggest that R. kanagurta populations inthe IMA and adjacent waters can be regarded as a single stock unit for management purposes.Their inferred demographic history also suggests that R. kanagurta populations potentially ex-panded in the late Pleistocene and that gene flow appears to be ongoing among extantpopulations today.
Supporting InformationS1 Table. Distribution of regionally shared haplotypes for 23 populations of R. kanagurta.(DOCX)
AcknowledgmentsWe would like to thank Universiti Sains Malaysia for providing doctoral fellowship under theAcademic Staff Higher Education Scholarship (ASHES) to Noor Adelyna Mohammed Akib.We also would like to thank Universiti Sains Malaysia for funding this project under the Re-search University Grant (1001/PBIOLOGI/815051) and the Postgraduate Research GrantScheme (1001/PPANTAI/844103). We are grateful to the Institute of Fisheries, Penang, Malay-sia and Department of Fisheries throughout Malaysia for assisting us with the sampling.Thanks are also due to many colleagues and their respective institutions: Jamsari Amirul Fir-daus Jamaluddin, Dr. Tan Min Pau, Mohd Lutfi Abdullah, Danial Hariz Zainal Abidin, AhmadFaisal Ghani, Dr. Chee Su Yin, Lim Hong Chiun (USM) and Abdul Rahman Abdul Majid(Fisheries Research Institute, Penang, Malaysia).
Author ContributionsConceived and designed the experiments: NAMA PBM SAMN. Performed the experiments:NAMA. Analyzed the data: NAMA PBM SAMN. Contributed reagents/materials/analysistools: PBM SAMN. Wrote the paper: NAMA PBM SAMN. Contributed samples for this re-search: BMT PPMZA ST.
References1. O'Reilly PT, Canino MF, Bailey KM, Bentzen P (2004) Inverse relationship between FST and microsat-
ellite polymorphism in the marine fish, walleye pollock (Theragra chalcogramma): implications for re-solving weak population structure. Mol Ecol 13(7): 1799–1814. PMID: 15189204
2. Ward RD, Grewe PM (1994) Appraisal of molecular genetic techniques in fisheries. Rev Fish Biol Fish-er 4: 300–325.
3. Scoles DR, Graves JE (1993) Genetic analysis of the population structure of yellowfin tuna, Thunnus al-bacores, from the Pacific ocean. Fish B-NOAA 91: 690–698.
4. Baker CS, Perry A, Bannister JL, Weinrich MT, Abernethy RB (1993) Abundant mitochondrial DNA vari-ation and world-wide population structure in humpback whales. PNAS 90(17): 8239–8243. PMID:8367488
5. Roques S, Sévigny JM, Bernatchez L (2002) Genetic structure of deep-water redfish, Sebastes men-tella, populations across the North Atlantic. Mar Biol 140(2): 297–307.
6. Ward RD (2002) Genetics of fish populations. In: Hart PJB, Reynolds JD, editors. Handbook of Fish Bi-ology and Fisheries Vol. 1. Blackwell Publishing, Oxford. pp. 200–224.
7. Nielsen EE, Nielsen PH, Meldrup D, Hansen MM (2004) Genetic population structure of turbot(Scophthalmus maximus L.) supports the presence of multiple hybrid zones for marine fishes in thetransition zone between the Baltic Sea and the North Sea. Mol Ecol 3(3): 585–595.
8. Zhang J, Cai Z, Huang L (2006) Population genetic structure of crimson snapper Lutjanus erythropterusin East Asia, revealed by analysis of the mitochondrial control region. ICES J Mar Sci 63(4): 693–704.
High Connectivity in Rastrelliger kanagurta
PLOSONE | DOI:10.1371/journal.pone.0119749 March 18, 2015 15 / 18
9. O’Leary DB, Coughlan J, Dillane E, McCarthy TV, Cross TF (2007) Microsatellite variation in codGadus morhua throughout its geographic range. J Fish Biol 70: 310–335.
10. Reiss H, Hoarau G, Dickey‐Collas M, Wolff WJ (2009) Genetic population structure of marine fish: mis-match between biological and fisheries management units. Fish Fish 10(4): 361–395.
11. Han ZQ, Li YZ, Chen GB, Gao TX (2008) Population genetic structure of coral reef species Plector-hinchus flavomaculatus in South China Sea. Afr J Biotechnol 7(11): 1774–1781.
12. Grosberg R, Cunningham CW (2001) Genetic structure in the sea. In: Bertness MD, Gaines S, Hay ME,editors. Marine Community Ecology. Sinauer, Sunderland, MA. pp. 61–84.
13. Chen CA, Ablan MCA, McManus JW, Bell JD, Tuan VS, Cabanban, et al. (2004). Population structureand genetic variability of six bar wrasse (Thallasoma hardwicki) in northern South China Sea revealedby mitochondrial control region sequences. Mar Biotechnol 6(4): 312–326. PMID: 15129326
14. Sun P, Shi Z, Yin F, Peng S (2012) Population genetic structure and demographic history of Pampusargenteus in the Indo-West Pacific inferred frommitochondrial cytochrome b sequences. BiochemSysEcol 43: 54–63.
15. Collette BB, Nauen CE (1983) FAO species catalogue. v. 2: Scombrids of the world. An annotated andillustrated catalogue of tunas, mackerels, bonitos, and related species known to date. FAO FisheriesSynopsis125. New York: United Nations Food and Agriculture Organization. 137 p.
16. Mansor MI (1989) Tumbesaran, kematian dan corak pengrekrutan Ikan Kembung Rastrelliger kana-gurta (Cuvier) di Pantai Barat Semenanjung Malaysia. Fisheries Bulletin no. 59. Jabatan Perikanan:Kementerian Pertanian Malaysia. 22 p.
17. Mansor MI, Syed Abdullah, Abdul Hamid Y (1996) Population structure of small pelagic fishes off theEast Coast of Peninsular Malaysia. Fisheries Bulletin no. 99. Jabatan Perikanan: Kementerian Perta-nian Malaysia. 30 p.
18. Collette BB, Russo JL (1984) Morphology, systematics, and biology of the Spanish mackerels (Scom-beromorus, Scombridae). Fish Bull US 82: 545–692.
19. Darlina MN, Masazurah AR, Jayasankar P, Jamsari AF, Siti Azizah MN (2011) Morphometric and mo-lecular analysis of mackerel (Rastrelliger spp) from the west coast of Peninsular Malaysia. GMR 10:2078–2092. doi: 10.4238/vol10-3gmr1249 PMID: 21968625
20. Ahmad Faisal G, Danial Hariz ZA, Siti Azizah M.N Darlina MN (2012) Genetic variation of Indian Mack-erel (Rastrelliger kanagurta) (Cuvier, 1816) of Sabah waters based on mitochondrial D-loop region: Apreliminary study. AJBB 1: e100.
21. Jayasankar P, Thomas PC, Paulton MP, Mathew J (2004) Morphometric and genetic analysis of Indianmackerel (Rastrelliger kanagurta) from Peninsular India. Asian Fish Sci 17: 201–215.
22. Menezes MR, Nair S, Martins M (1993) Genetic divergence in the Indian Mackerel Rastrelliger kana-gurta (Cuv) from the coastal waters of Peninsular India and the Andaman sea. Indian J Fish 40 (3):135–141.
23. Ward RD (2000) Genetics in fisheries management. Hydrobiologia 420: 191–201
24. Pogson GH, Mesa KA, Boutilier RG (1995) Genetic population structure and gene flow in the Atlanticcod Gadus morhua: a comparison of allozyme and nuclear RFLP loci. Genetics 139(1): 375–385.PMID: 7705638
25. O’Reilly PT, Hebinger C, Wright JM (1998) Analysis of parentage determination in Atlantic salmon(Salmo salar) using microsatellites. Anim Genet 29: 363–370.
26. Árnason Ú, Gullberg A (1996) Cytochrome b nucleotide sequences and the identification of five primarylineages of extant cetaceans. Mol Biol Evol 13(2): 407–417. PMID: 8587505
27. Farias IP, Ortí G, Sampaio I, Schneider H, Meyer A (2001) The cytochrome b gene as a phylogeneticmarker: the limits of resolution for analyzing relationships among cichlid fishes. J Mol Evol 53(2): 89–103. PMID: 11479680
28. Aboim MA, Menezes GM, Schlitt T, Rogers AD (2005) Genetic structure and history of populations ofthe deep‐sea fish Helicolenus dactylopterus (Delaroche, 1809) inferred frommtDNA sequence analy-sis. Mol Ecol 14(5): 1343–1354. PMID: 15813775
29. Tamura K, Peterson D, Peterson N, Stecher G, Nei M, Kumar S (2011) MEGA5: Molecular EvolutionaryGenetics Analysis using Maximum Likelihood, Evolutionary Distance, and Maximum Parsimony Meth-ods. Mol Biol Evol 28: 2731–2739. doi: 10.1093/molbev/msr121 PMID: 21546353
30. Posada D (2004) Collapse ver. 1.2. A tool for collapsing sequences to haplotypes. Available: http://darwin.uvigo.es/software/collapse.html. Accessed 1 June 2012.
31. Librado P, Rozas J (2009) DnaSP v5: a software for comprehensive analysis of DNA polymorphismdata. Bioinformatics 25(11): 1451–1452. doi: 10.1093/bioinformatics/btp187 PMID: 19346325
High Connectivity in Rastrelliger kanagurta
PLOSONE | DOI:10.1371/journal.pone.0119749 March 18, 2015 16 / 18

32. Bandelt HJ, Forster P, Rohl A (1999) Median-joining networks for inferring intraspecific phylogenies.Mol Biol Evol 16: 37–48. PMID: 10331250
33. Excoffier L, Laval G, Schneider S (2005) Arlequin ver. 3.0: An integrated software package for popula-tion genetics data analysis. Evol Bioinform Online 1:47–50.
34. Fu YX (1997) Statistical tests of neutrality of mutations against population growth, hitchhiking and back-ground selection. Genetics 147(2): 915–925. PMID: 9335623
35. Ramos-Onsins SE, Rozas J (2002) Statistical properties of new neutrality tests against populationgrowth. Mol Biol Evol 19(12): 2092–2100. PMID: 12446801
36. Harpending HC (1994) Signature of ancient population growth in a low-resolution mitochondrial DNAmismatch distribution. Hum Biol 66(4): 591–600. PMID: 8088750
37. Slatkin M, Hudson RR (1991) Pairwise comparisons of mitochondrial DNA sequences in stable and ex-ponentially growing populations. Genetics 129(2): 555–562. PMID: 1743491
38. Rogers AR, Harpending H (1992) Population growth makes waves in the distribution of pairwise geneticdifferences. Mol Biol Evol 9(3): 552–569. PMID: 1316531
39. Schneider S, Excoffier L (1999) Estimation of past demographic parameters from the distribution ofpairwise differences when the mutation rates vary among sites: application to human mitochondrialDNA. Genetics 152(3): 1079–1089. PMID: 10388826
40. Rogers AR (1995) Genetic evidence for a Pleistocene population explosion. Evolution 49(4): 608–615.
41. Drummond AJ, Rambaut A, Shapiro B, Pybus OG (2005) Bayesian coalescent inference of past popu-lation dynamics frommolecular sequences. Mol Biol Evol 22: 1185–1192). PMID: 15703244
42. Drummond AJ, Suchard MA, Xie D, Rambaut A (2012) Bayesian phylogenetics with BEAUti and theBEAST 1.7. Mol Biol Evol 29: 1969–1973 doi: 10.1093/molbev/mss075 PMID: 22367748
43. Rambaut A, Drummond AJ (2007) Tracer v1.4. Available from http://beast.bio.ed.ac.uk/Tracer.
44. Lynch M, Crease TJ (1990) The analysis of population survey data on DNA sequence variation. MolBiol Evol 7(3): 377–394.
45. Hudson RR, Boos DD, Kaplan NL (1992) A statistical test for detecting geographic subdivision. Mol BiolEvol 9(1): 138–151. PMID: 1552836
46. Nei M (1973) Analysis of gene diversity in subdivided populations. PNAS 70: 3321–3323. PMID:4519626
47. Dupanloup I, Schneider S, Excoffier L (2002) A simulated annealing approach to define the geneticstructure of populations. Mol Ecol 11(12): 2571–2581. PMID: 12453240
48. Posada D, Crandall KA (2001) Intraspecific phylogenetics: Trees grafting into networks. Trends EcolEvol 16(1): 37–45. PMID: 11146143
49. Forster P, Torroni A, Renfrew C, Röhl A (2001) Phylogenetic star contraction applied to Asian and Pap-uan mtDNA evolution. Mol Biol Evol 18(10): 1864–1881. PMID: 11557793
50. Russell AL, Medellin RA, McCracken GF (2005) Genetic variation and migration in the Mexican free-tailed bat (Tadarida brasiliensis mexicana). Mol Ecol 14:2207–2222. PMID: 15910338
51. Ray N, Currat M, Excoffier L (2003) Intra-dememolecular diversity in spatially expanding populations.Mol Biol Evol 20:76–86. PMID: 12519909
52. Johns GC, Avise JC (1998) A comparative summary of genetic distances in the vertebrates from the mi-tochondrial cytochrome b gene. Mol Biol Evol 15(11): 1481–1490. PMID: 12572611
53. Cárdenas L, Hernández CE, Poulin E, Magoulas A, Kornfield I, Ojeda FP (2005) Origin, diversification,and historical biogeography of the genus Trachurus (Perciformes: Carangidae). Mol Phylogenet Evol35(2): 496–507. PMID: 15804418
54. Rousset F (1997) Genetic differentiation and estimation of gene flow from F-statistics under isolation bydistance. Genetics 145(4), 1219–1228. PMID: 9093870
55. Tzeng TD (2007) Population structure and historical demography of the spotted mackerel (Scomberaustralasicus) off Taiwan inferred frommitochondrial control region sequencing. Zool Stud 46(6): 656–663.
56. Theisen TC, Bowen BW, Lanier W, Baldwin JD (2008) High connectivity on a global scale in the pelagicwahoo, Acanthocybium solandri (tuna family Scombridae). Mol Ecol 7(19): 4233–4247.
57. Ely B, Viñas J, Bremer JRA, Black D, Lucas L, Covello K, et al. (2005) Consequences of the historicaldemography on the global population structure of two highly migratory cosmopolitan marine fishes: theyellowfin tuna (Thunnus albacares) and the skipjack tuna (Katsuwonus pelamis). BMC Evol Biol, 5(1),19. doi: 10.1186/1471–2148–5–19.
58. Grant WS, Bowen BW (1998) Shallow population histories in deep evolutionary lineages of marine fish-es: Insights from sardines and anchovies and lessons for conservation. J Hered 89(5): 415–426.
High Connectivity in Rastrelliger kanagurta
PLOSONE | DOI:10.1371/journal.pone.0119749 March 18, 2015 17 / 18
59. Avise JC, Neigel JE, Arnold J (1984) Demographic influences on mitochondrial DNA lineage survivor-ship in animal populations. J Mol Evol 20(2): 99–105. PMID: 6433037
60. Nelson JS, Hoddell RJ, Chou LM, ChanWK, Phang VPE (2000) Phylogeographic structure of falseclownfish, Amphipriono cellaris, explained by sea level changes on the Sunda shelf. Mar Biol 137(4):727–736.
61. Avise JC (2000) Phylogeography: the history and formation of species. Harvard University Press. 453p.
62. Hewitt G (2000) The genetic legacy of the Quaternary ice ages. Nature 405(6789): 907–913. PMID:10879524
63. Bird MI, Taylor D, Hunt C (2005) Palaeoenvironments of insular Southeast Asia during the Last GlacialPeriod: a savanna corridor in Sundaland? Quat Sci Rev 24(20): 2228–2242.
64. Bird MI, PangWC, Lambeck K (2006) The age and origin of the Straits of Singapore. PalaeogeogrPalaeocl 241(3), 531–538.
65. Liu JX, Gao TX, Wu SF, Zhang YP (2007). Pleistocene isolation in the Northwestern Pacific marginalseas and limited dispersal in a marine fish, Chelon haematocheilus (Temminck & Schlegel, 1845). MolEcol 16(2): 275–288. PMID: 17217344
66. Liu JX, Gao TX, Yokogawa K, Zhang YP (2006) Differential population structuring and demographichistory of two closely related fish species, Japanese sea bass (Lateolabrax japonicus) and spotted seabass (Lateolabrax maculatus) in Northwestern Pacific. Mol Phylogenet Evol 39(3): 799–811. PMID:16503171
67. Hanebuth T, Stattegger K, Grootes PM (2000) Rapid flooding of the Sunda Shelf: a late-glacial sea-level record. Science 288(5468): 1033–1035. PMID: 10807570
68. Lambeck K, Esat TM, Potter EK (2002) Links between climate and sea levels for the past three millionyears. Nature 419: 199–206. PMID: 12226674
69. Voris HK (2000) Maps of Pleistocene sea levels in Southeast Asia: shorelines, river systems and timedurations. J Biogeogr 27(5): 1153–1167.
70. Tjia HD, Liew KK (1996) Changes in tectonic stress field in northern Sunda Shelf basins. Geol Soc Lon-don Spec Publ 106(1): 291–306.
71. Mcmillan WO, Palumbi SR (1995) Concordant evolutionary patterns among Indo-West Pacific butterflyfishes. Proc R Soc B 260(1358): 229–236. PMID: 7784441
72. Arnaud S, Bonhomme F, Borsa P (1999) Mitochondrial DNA analysis of the genetic relationshipsamong populations of scad mackerel (Decapterus macarellus, D. macrosoma and D. russelli) in South-East Asia. Mar Biol 135(4): 699–707.
73. Santos MD, Lopez GV, Barut NC (2010) A pilot study on the genetic variation of eastern little tuna(Euthynnus affinis) in Southeast Asia. Philipp J Science 139(1): 43–50.
74. Palumbi SR (2003) Population genetics, demographic connectivity, and the design of marine reserves.Ecol Appl 13(sp1): 146–158.
75. Wright S (1931) Evolution in Mendelian populations. Genetics 16(2): 97–159. PMID: 17246615
76. Franklin IR (1980) Evolutionary change in small populations. In: Soule ME, Wilcox BA, editors. Conser-vation Biology: An Evolutionary-Ecological Perspective. Sinauer Associates, Massachusetts. pp.135–150.
77. Frankel OH, Soulé ME (1981) Conservation and evolution. Cambridge University Press. 329 p.
78. Wang L, Meng Z, Liu X, Zhang Y, Lin H (2011) Genetic diversity and differentiation of the orange-spot-ted grouper (Epinephelus coioides) between and within cultured stocks and wild populations inferredfrommicrosatellite DNA analysis. Int J Mol Sci 12(7): 4378–4394. doi: 10.3390/ijms12074378 PMID:21845084
79. Shankar D, Vinayachandran PN, Unnikrishnan AS (2002) The monsoon currents in the north Indianocean. Prog Oceanogr 52(1): 63–120.
High Connectivity in Rastrelliger kanagurta
PLOSONE | DOI:10.1371/journal.pone.0119749 March 18, 2015 18 / 18
Copyright © 2022 FDOKUMEN