Energetics of fattening and starvation in the long-distance migratory garden warbler, Sylvia borin,...
10
J Comp Physiol B (1994) 164:362-371 Journal of Comparative Sy~emlc, ~lysIo~y Springer-Verlag 1994 Energetics of fattening and starvation in the long-distance migratory garden warbler, Sylvia borin, during the migratory phase M. Kiaassen 1, 2, H. Biebach 1 1 Max-Planck-Institut ffir Verhaltensphysiologie, Vogelwarte, D-82346 Andechs, Germany 2 Zoological Laboratory, University of Groningen, P.O. Box 14, NL-9750 AA Haren, The Netherlands Accepted: 20May 1994 Abstract. Garden warblers (Sylvia borin) were subjected to starvation trials during their autumnal migratory phase in order to simulate a period of non-stop migra- tion. Before, during and after this treatment the energy expenditure, activity, food intake and body mass of the subjects were monitored. Assimilation efficiency was con- stant throughout the experiments. The catabolized (dur- ing starvation) and deposited body tissue (during recov- ery) consisted of 73% fat. Basal metabolic rate was de- creased during the starvation period and tended to a gradual increase during the recovery period. The reduced basal metabolic rate can possibly be attributed to a re- duced size/function of the digestive system, which is con- sistent with the sub-maximal food intake immediately after resuming the supply of food to the experimental birds. The observed reductions in basal metabolic rate during starvation and activity during recovery can be viewed as adaptations contributing to a higher econo- mization of energy supplies. The experimental birds were unable to eat large quantities of food directly after a peri- od of starvation leading to a comparatively low, or no increase in body mass. Such a slow mass increase is in agreement with observations of migratory birds on ar- rival at stop-over sites. Key words: Energetics - Migration - Fattening - Starva- tion - Garden warbler - Sylvia borin using their body reserves, which they have accumulated during the premigratory fattening period. This crossing is a dangerous event; they risk running out of energy while crossing the sea and the desert, which provide only few refuelling possibilities. Indeed, Biebach (1985), Biebach et al. (1986) and Bairlein (1985 a) showed that lean trans- Saharan migrant passerine birds forage in oases to refill their fat depots and continue their flight after some days. In contrast, they found that fat birds resting in habitats virtually void of vegetation were more or less inactive, foraging little or not at all during the day, continuing migratory flight the following night. Given the meagre possibilities for fuelling, it might be expected that in the course of evolution migratory birds would have devel- oped ways to economize the use of energy and to mini- mize the risk of shortage while en route. In order to test the hypothesis that metabolic adapta- tions exist in migratory passerines, one should ideally know the energy budget of birds during each stage of migration. We tried to simulate the energy loss during flight and energy gain during stopover by letting garden warblers go through a period of starvation while in mi- gratory disposition. They were then allowed to regain body mass. By compiling the daily energy budgets of these experimental birds before, during and after the star- vation period we attempted to trace metabolic alter- ations. Introduction When garden warblers (Sylvia borin) set off from southern Europe towards their wintering destinations in Africa, they have to cross the Mediterranean sea and the Sahara desert as do many other migratory passerines. The birds try to cover the 2500 km over these inhospitable areas Abbreviations: BM, body mass; BMR, basal metabolic rate; LBM, lean body mass; RQ, respiratory quotient Correspondence to: M. Klaassen Materials and methods Experimental design. We constructed energy budgets of six garden warblers during successive experimental runs consisting of three periods: control, starvation and recovery (Fig. 1). The birds had been caught in Wangen, Germany, (47o31 , N, 09o51 , E), between 15 and 20 September 1987; and transferred to Andechs where they were kept in captivity under ad libitum food conditions, constant air temperature of 20+2 ~ and constant photoperiod of LD 12 1/2:11 1/2 with fights on at 0900 hours. Only first-year birds, as determined by scull ossification (Svensson 1984), were used. Soon after capture the birds spontaneously started to increase their BM in preparation for autumnal migration and showed nocturnal mi- gratory restlessness (" Zugunruhe"). Prior to the experiments, which
Transcript of Energetics of fattening and starvation in the long-distance migratory garden warbler, Sylvia borin,...
J Comp Physiol B (1994) 164:362-371 Journal of Comparative Sy~emlc,
~ lys Io~y
�9 Springer-Verlag 1994
Energetics of fattening and starvation in the long-distance migratory garden warbler, Sylvia borin, during the migratory phase M. Kiaassen 1, 2, H. Biebach 1
1 Max-Planck-Institut ffir Verhaltensphysiologie, Vogelwarte, D-82346 Andechs, Germany 2 Zoological Laboratory, University of Groningen, P.O. Box 14, NL-9750 AA Haren, The Netherlands
Accepted: 20May 1994
Abstract. Garden warblers (Sylvia borin) were subjected to starvation trials during their autumnal migratory phase in order to simulate a period of non-stop migra- tion. Before, during and after this treatment the energy expenditure, activity, food intake and body mass of the subjects were monitored. Assimilation efficiency was con- stant throughout the experiments. The catabolized (dur- ing starvation) and deposited body tissue (during recov- ery) consisted of 73% fat. Basal metabolic rate was de- creased during the starvation period and tended to a gradual increase during the recovery period. The reduced basal metabolic rate can possibly be attributed to a re- duced size/function of the digestive system, which is con- sistent with the sub-maximal food intake immediately after resuming the supply of food to the experimental birds. The observed reductions in basal metabolic rate during starvation and activity during recovery can be viewed as adaptations contributing to a higher econo- mization of energy supplies. The experimental birds were unable to eat large quantities of food directly after a peri- od of starvation leading to a comparatively low, or no increase in body mass. Such a slow mass increase is in agreement with observations of migratory birds on ar- rival at stop-over sites.
Key words: Energetics - Migration - Fattening - Starva- tion - Garden warbler - Sylvia borin
using their body reserves, which they have accumulated during the premigratory fattening period. This crossing is a dangerous event; they risk running out of energy while crossing the sea and the desert, which provide only few refuelling possibilities. Indeed, Biebach (1985), Biebach et al. (1986) and Bairlein (1985 a) showed that lean trans- Saharan migrant passerine birds forage in oases to refill their fat depots and continue their flight after some days. In contrast, they found that fat birds resting in habitats virtually void of vegetation were more or less inactive, foraging little or not at all during the day, continuing migratory flight the following night. Given the meagre possibilities for fuelling, it might be expected that in the course of evolution migratory birds would have devel- oped ways to economize the use of energy and to mini- mize the risk of shortage while en route.
In order to test the hypothesis that metabolic adapta- tions exist in migratory passerines, one should ideally know the energy budget of birds during each stage of migration. We tried to simulate the energy loss during flight and energy gain during stopover by letting garden warblers go through a period of starvation while in mi- gratory disposition. They were then allowed to regain body mass. By compiling the daily energy budgets of these experimental birds before, during and after the star- vation period we attempted to trace metabolic alter- ations.
Introduction
When garden warblers (Sylvia borin) set off from southern Europe towards their wintering destinations in Africa, they have to cross the Mediterranean sea and the Sahara desert as do many other migratory passerines. The birds try to cover the 2500 km over these inhospitable areas
Abbreviations: BM, body mass; BMR, basal metabolic rate; LBM, lean body mass; RQ, respiratory quotient Correspondence to: M. Klaassen
Materials and methods
Experimental design. We constructed energy budgets of six garden warblers during successive experimental runs consisting of three periods: control, starvation and recovery (Fig. 1). The birds had been caught in Wangen, Germany, (47o31 , N, 09o51 , E), between 15 and 20 September 1987; and transferred to Andechs where they were kept in captivity under ad libitum food conditions, constant air temperature of 20+2 ~ and constant photoperiod of LD 12 1/2:11 1/2 with fights on at 0900 hours. Only first-year birds, as determined by scull ossification (Svensson 1984), were used. Soon after capture the birds spontaneously started to increase their BM in preparation for autumnal migration and showed nocturnal mi- gratory restlessness (" Zugunruhe"). Prior to the experiments, which
M. Klaassen, H. Biebach: Energetics of fattening and starvation in the migratory garden warbler 363
M I G R A T O R Y R E S T L E S S N E S S
23
v
,~ 21 69
E
O
17
9
"O
O3 6
(D
.E 3 13 O O
0
- - '2 .8 "10
t - O "=2.5 O..
E
c-
g 2.2 r
( 1 )
O 3
1.9
, i , i i i i i
i , ~ , i i i i i
3 4 8 3 5 0 3 5 2 3 5 4 3 5 6 3 5 8 3 6 0
day number
Fig. 1. Example of the experimental protocol. Migratory restless- ness and the daily mean body mass, food intake and oxygen con- sumption are plotted for the successive control (stage I), starvation (stage II) and recovery (stage III) periods for bird a
were conducted between 2 October and 26 December 1987, the birds were adapted to the experimental circumstances for at least 1 week. The control period (stage I), during which the birds were fed ad libitum and maintained a constant BM, lasted 3 days. The subse- quent starvation period (stage II) lasted 2-6 days depending on the time it took for the birds' BM to decrease to 17 g. During the recovery period (stage III), lasting 4-12 days, the birds were again fed ad libitum. From previous experiments with garden warblers under comparable circumstances (Biebach 1985; Gwinner etal. 1985) it was shown that during starvation and some time after refeeding the birds continue to show migratory restlessness. They then stop migratory restlessness and rapidly increase in weight, after which BM stabilizes and migratory restlessness is resumed. It was always at this point, where the bird had regained its high BM and showed nocturnal migratory restlessness, that we finished the experiment. Thus, the total experiment lasted between 10 and 21 days. During all three stages the experimental bird was housed in a metabolic chamber (volume 9.7 1; Fig. 2) from which O2 consump- tion (ml. h- l ) , CO2 production (ml. h- l ) , BM (g) and activity (switch counts - h - l) were recorded continuously and integrated per hour. Food intake, faeces production and BM change were mea- sured on a daily basis (starting 0900 hours).
Metabolizable energy intake. The food was a mixture of 36% hard boiled eggs (shells included), 15% cereal, 21% quark, 25% Eckrich
insect-food, and 3% meat. Energy density of food and faeces sam- ples were measured in a GaUenkamp Adiabatic Autobomb calorimeter after they had been oven dried at 70 ~ to constant mass. Mean wet mass energy content of the food when given to the birds at 0900 hours was 15.0 kJ - g-~ (SD =0.5, n=6) and changed over the next 24 h to 17.3 kJ �9 g-1 (SD = 0.5, n = 6) due to water loss. Daily gross energy intake was calculated from food-tray-weighings at the beginning and end of the experimental day (09004)900 hours), taking the energy density changes of the food into account. Alter each experimental day the droppings were collected. Daily metabolizable energy intake (kJ -day -z) was calculated by sub- tracting the energetic equivalent of daily excreta production from daily gross energy intake.
Energy expenditure. Air was drawn through the metabolic chamber with a flow rate of 201 �9 h - l (Brooks mass flow meter/controller) in an open-flow system. The air was dried over a 30-nm molecular filter. Oxygen consumption (ml 02 �9 h l) was measured with a para- magnetic oxygen analyser (Taylor, Servomex, OS 184) and CO2 pro- duction (ml CO 2 �9 h-1) with an infrared gas analyser (Binos). Both 02 consumption and CO 2 production were calculated following Hill (1972). Oxygen consumption was converted to energy expenditure (kJ - h -1) using a conversion factor of 19.6 kJ- 1 O2-: .
Energy expenditure can be subdivided into BMR, costs for ac- tivity, and energy costs of food processing, which is often referred to as the heat increment of feeding and the costs of synthesis [part of BMR is also a result of the basal turnover of proteins and these costs of synthesis are not included in the costs of food processing; cf. Muramatsu et al. (1987)]. The energy costs of thermoregulation were assumed to equal zero as the temperature at which the exper- iments were conducted ranged from 23 to 26 ~ and was assumed to be within the thermal neutral zone of the garden warbler [combining the expected BMR [1.04 kJ �9 h - 1] and thermal conduc- tance [0.053 kJ �9 h -1 �9 ~ - l ] for a 17-g passerine bird in the inactive phase results in an expected lower critical temperature of 20 ~ according to Aschoff and Pohl (1970) and Aschoff (1981), respective- ly].
Locomotor activity was measured using an infra-red-beam- switch which was placed diagonally across the metabolic chamber just above the perches. We defined nocturnal migratory restlessness as an activity score of at least 250 counts �9 h - 1 registered during a minimum of at least 2 h at night. Feeding activity was measured by a mechanic switch attached to a small swing door that the bird had to push open using its head before being able to eat. The feeding activity registrations showed that feeding occurred only during the light period of the day. Assuming that emptying of the digestive tract takes place within 2 1/2 h of the last feed (for support of this assumption see results), the experimental birds were post-absorp- tive between 0000 and 0900 hours the next day (lights off at 2130 hours and on at 0900 hours). Thus between 0000 and 0900 hours, total energy expenditure was the result of BMR and activity costs only, as the costs of food processing equalled zero for that period.
Data analysis. We assumed that the physiological condition of the subjects was more or less stable during stage I, whereas it continu- ally changed during stage II and III. Stage II and III were not equally long in all birds and for each of these stages the duration was standardized. The relative starvation time was calculated in percent, starting with 0% in stage ! and ending with 100% on the last day of stage II. Likewise the relative recovery time was calculat- ed, 100% being the last day of the experiment.
At low food intake levels the estimate of the assimilation effi- ciency (i.e. metabolizable energy intake divided by gross energy intake) is sensitive to small errors made in the estimation of faecal output and food intake. In addition, the effects of BM and energy loss on the assimilation efficiency become progressively more pro- nounced at low food intake levels (Guglielmo and Karasov 1993). Therefore, the assimilation efficiency was only calculated for exper- imental days for which gross energy intake was higher than 40 kJ - day 1. Due to technical failures some measurements were
364 M. Klaassen, H. Biebach: Energetics of fattening and starvation in the migratory garden warbler
water
i n f ra 2re'd" ]] ~'~:~ ~b ~a~-~ ~sw i t c h
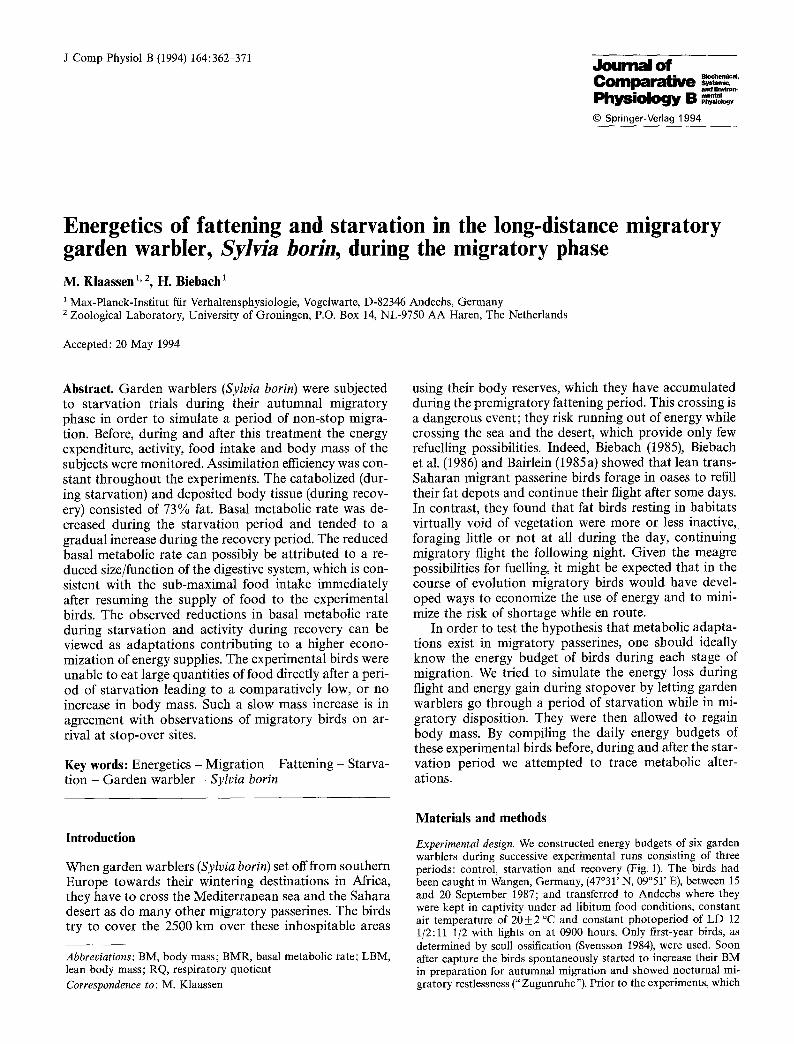
Fig. 2. Experimental set up. Body mass, feeding activity and locomotor activity were recorded on line continuously. Faeces were collected and gathered daily
lost. If the measurements were conducted over less than 75% of the time, they were excluded from the data set.
Multiple data points were collected for each of the six experi- mental birds. Hence, calculating ordinary variations for averages and regression lines was not possible for most of the data collected as within each set of data one had to do with six groups of clustered data. C.A.J. Klaassen of the Department of Mathematics of the University of Amsterdam, The Netherlands, provided us with very conservative parametric solutions to this problem (pers. comm.), which will briefly be outlined below. In the case of estimating the average g from observations with measurement error ~i over i mea- surements of variable Y one departs, in fact, from the model: Y~ = P + ei- In our case with c clusters of data on different individuals of birds this model had to be replaced with Yli = oc + e 1 + eti, where i = 1,.., ml, 1 = 1,..,e, and g + e 1 is the value of the average for bird 1. The parameter p in the latter model corresponds to the average g of the ordinary model but typically, the error term for p is larger (el + ~t~ versus ~0- The sample average still is an unbiased estimator of la, but its variance has to be estimated in a non-standard way resulting in an approximate t-distribution with n-c degrees of free- dom. Likewise the ordinary linear regression model Yi = ~ + 13Xi + E i needed to be replaced with Ylli=0[-t-ezti-l-([~-Fe21)Xli-}-Sli, where ~+el~ and 13+e2~ are the regression constant and the regression coefficient for bird 1, respectively. Also in this adjusted regression model the estimates we used for ct and 13 are identical to the least squares estimates in the ordinary linear regression model as well as the linear correlation coefficient, only the error terms being equal or larger and the number of degrees of freedom smaller. For all regres- sion lines and averages we indicated sample size (n) and the number of degrees of freedom (dJ). In addition, we provided for averages the standard deviation (SD) and for regression analyses the linear cor- relation coefficient (r) and the t-test for the regression coefficient (7) with its significance level (P).
R e s u l t s
B o d y mass
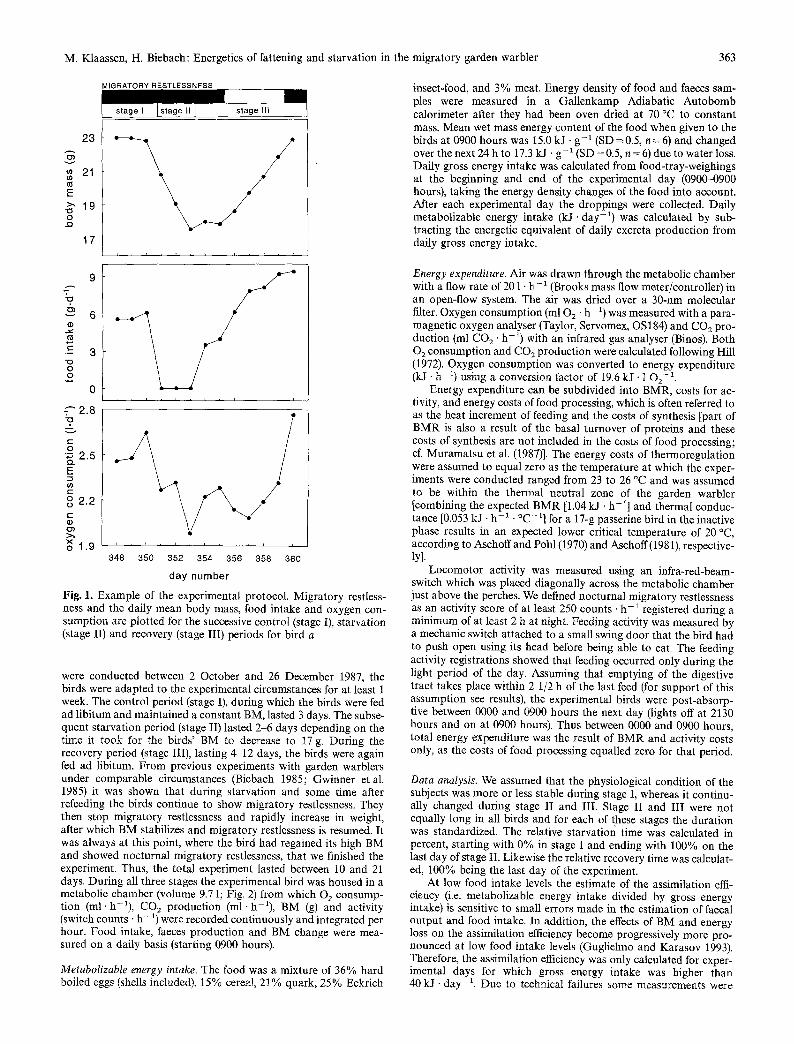
T h e gene ra l p a t t e r n o f B M t h r o u g h o u t t he e x p e r i m e n t (Fig. 3) was s tab le d u r i n g s t age I, an a l m o s t l i nea r de -
v 2 0
E > , 2 8
o 24
24
2O
1 6 L , , , ,
] 6 i F I I I I r I I F
24
, ~ , l i i i l i | 16 L , , ,
J 6 i i i t i I i i
2 0
r i r t i i 1 6 ' ' P
2 0
1 6 i t i I i F i i I
- 1 0 - 8 -6 -4 -2 0 2 4 6 8 10 12
days from onset of refeeding
Fig. 3. Daily mean body mass of the six garden warblers during the total experimental run, plotted relative to the onset of refeeding. For each bird the start and duration of the successive control (stage I), starvation (stage II) and recovery (stage III) periods are indicated at the top of each panel
M. Klaassen, H. Biebach: Energetics of fattening and starvation in the migratory garden warbler 365
"o 140 "-3
120
E~ 100 (3) (- 8O
-~ 6o N 40 -5 -Q 20
0 E
stage I stage [11 CONTR RECOVERY
i i I i i
0 20 40 60 80 100
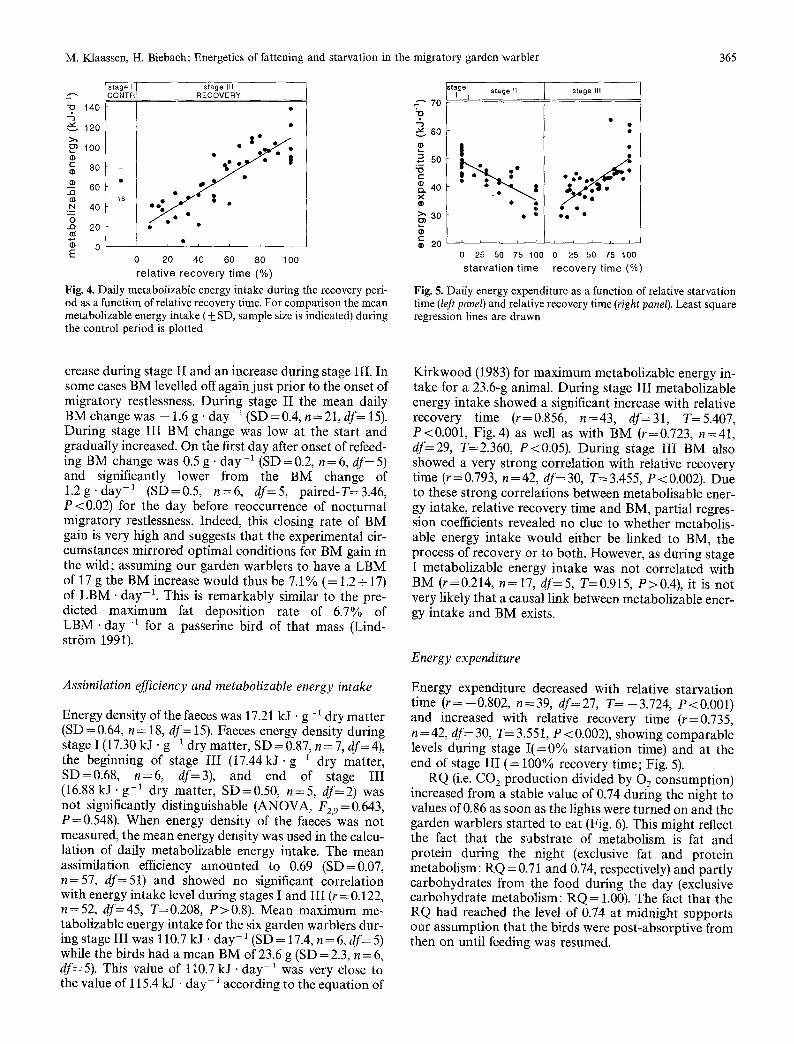
relative recovery time (%) Fig. 4. Daily metabolizable energy intake during the recovery peri- od as a function of relative recovery time. For comparison the mean metabolizable energy intake (+ SD, sample size is indicated) during the control period is plotted
v
"13 r
& X
g E |
[ ] stage II
7O
60
I 50 ~ |
4O
�9 t
3 0 �9 �9
stage ILl
e o �9
2 0 ~
0 25 50 75 100 0 25 50 75 100
starvation time recovery time (%)
Fig. 5. Daily energy expenditure as a function of relative starvation time (left panel) and relative recovery time (right panel). Least square regression lines are drawn
crease during stage II and an increase during stage III. In some cases BM levelled offagain just prior to the onset of migratory restlessness. During stage II the mean daily BM change was - 1.6 g. day -1 (SD =0.4, n=21, df= 15). During stage III BM change was low at the start and gradually increased. On the first day after onset of refeed- ing BM change was 0.5 g -day -~ (SD=0.2, n=6, df=5) and significantly lower from the BM change of 1 .2g 'day -1 (SD--0.5, n=6, df=5, paired-T=3.46, P<0.02) for the day before reoccurrence of nocturnal migratory restlessness. Indeed, this closing rate of BM gain is very high and suggests that the experimental cir- cumstances mirrored optimal conditions for BM gain in the wild; assuming our garden warblers to have a LBM of 17 g the BM increase would thus be 7.1% (= 1.2+ 17) of LBM .day-1. This is remarkably similar to the pre- dicted maximum fat deposition rate of 6.7% of LBM. day-1 for a passerine bird of that mass (Lind- str6m 1991).
Assimilation efficiency and metabolizable energy intake
Energy density of the faeces was 17.21 kJ �9 g-1 dry matter (SD =0.64, n= 18, df= 15). Faeces energy density during stage I (17.30 kJ - g-1 dry matter, SD =0.87, n=7, df= 4), the beginning of stage III (17.44kJ. g-1 dry matter, SD=0.68, n=6, df=3), and end of stage III (16.88 kJ. g-1 dry matter, SD=0.50, n=5, df=2) was not significantly distinguishable (ANOVA, F2.9--0.643 , P=0.548). When energy density of the faeces was not measured, the mean energy density was used in the calcu- lation of daily metabolizable energy intake. The mean assimilation efficiency amounted to 0.69 (SD=0.07, n=57, df=51) and showed no significant correlation with energy intake level during stages I and III (r = 0.122, n = 52, df= 45, T= 0.208, P > 0.8). Mean maximum me- tabolizable energy intake for the six garden warblers dur- ing stage III was 110.7 kJ �9 day -1 (SD= 17.4, n=6, df=5) while the birds had a mean BM of 23.6 g (SD = 2.3, n = 6, df=5). This value of 110.7 k J -day -1 was very close to the value of 115.4 kJ - day - 1 according to the equation of
Kirkwood (1983) for maximum metabolizable energy in- take for a 23.6-g animal. During stage III metabolizable energy intake showed a significant increase with relative recovery time (r=0.856, n=43, df=31, T=5.407, P<0.001, Fig. 4) as well as with BM (r=0.723, n=41, df=29, T=2.360, P<0.05). During stage III BM also showed a very strong correlation with relative recovery time (r--0.793, n=42, df=30, T=3.455, P<0.002). Due to these strong correlations between metabolisable ener- gy intake, relative recovery time and BM, partial regres- sion coefficients revealed no clue to whether metabolis- able energy intake would either be linked to BM, the process of recovery or to both. However, as during stage I metabolizable energy intake was not correlated with BM (r=0.214, n=17, df=5, T=0.915, P>0.4), it is not very likely that a causal link between metabolizable ener- gy intake and BM exists.
Energy expenditure
Energy expenditure decreased with relative starvation time (r=-0.802, n=39, df=27, T=-3.724, P<0.001) and increased with relative recovery time (r--0.735, n = 42, df= 30, T= 3.551, P < 0.002), showing comparable levels during stage I (=0% starvation time) and at the end of stage III (= 100% recovery time; Fig. 5).
RQ (i.e. CO a production divided by 02 consumption) increased from a stable value of 0.74 during the night to values of 0.86 as soon as the lights were turned on and the garden warblers started to eat (Fig. 6). This might reflect the fact that the substrate of metabolism is fat and protein during the night (exclusive fat and protein metabolism: RQ = 0.71 and 0.74, respectively) and partly carbohydrates from the food during the day (exclusive carbohydrate metabolism: RQ = 1.00). The fact that the RQ had reached the level of 0.74 at midnight supports our assumption that the birds were post-absorptive from then on until feeding was resumed.
366 M. Klaassen, H. Biebach: Energetics of fattening and starvation in the migratory garden warbler
1.0 E
o 0.9 :3 o-
b 0.B o
�9 --- 0.7 Q . 6 9 11)
" 0,6
~176176176176176176 ~ ~ oo+-ooo 2O~176 -
0 6 12 18
t i m e of d a y (h)
24
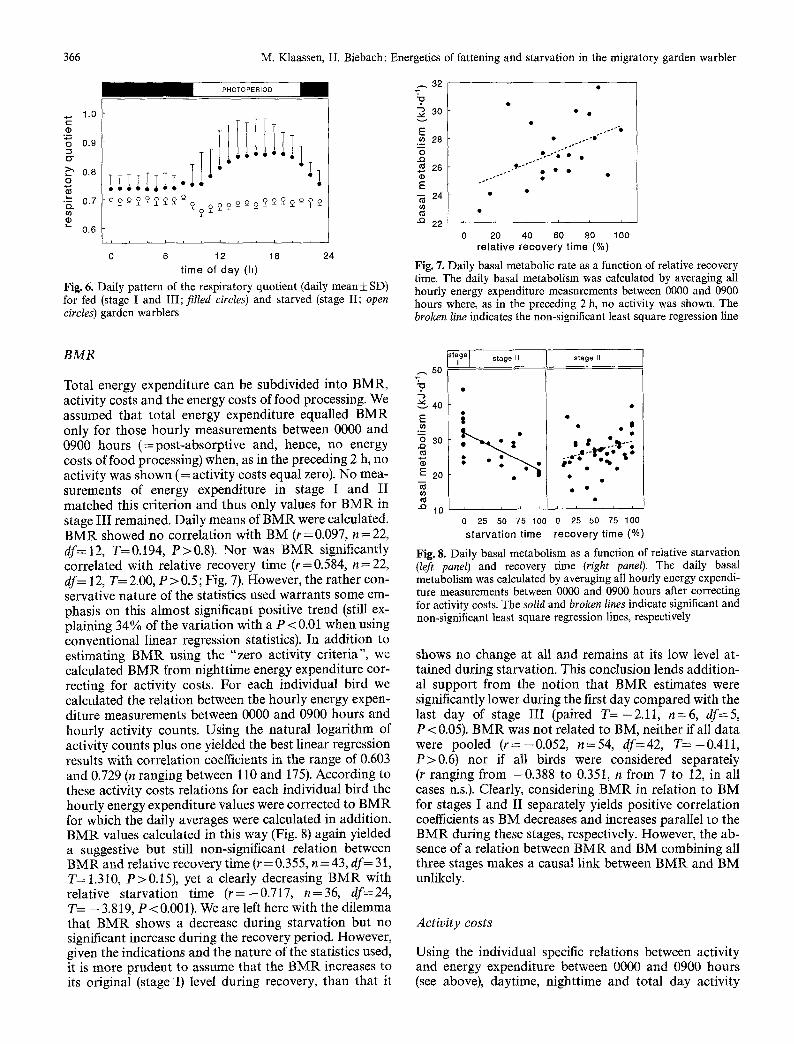
Fig. 6. Daily pattern of the respiratory quotient (daily mean +__ SD) for fed (stage I and III; filled circles) and starved (stage II; open circles) garden warblers
~ 32
"<3
3o
E 28
. . Q
N 26 (I)
E ~ 24 i f )
~ 22
.y.-- 'e �9 �9 9 - " �9 �9 �9
i i f i
20 40 60 80 100 r e l a t i v e r e c o v e r y t i m e (%)
Fig. 7. Daily basal metabolic rate as a function of relative recovery time. The daily basal metabolism was calculated by averaging all hourly energy expenditure measurements between 0000 and 0900 hours where, as in the preceding 2 h, no activity was shown. The broken line indicates the non-significant least square regression line
B M R
Total energy expenditure can be subdivided into BMR, activity costs and the energy costs of food processing. We assumed that total energy expenditure equalled BMR only for those hourly measurements between 0000 and 0900 hours (=post-absorptive and, hence, no energy costs of food processing) when, as in the preceding 2 h, no activity was shown (= activity costs equal zero). No mea- surements of energy expenditure in stage I and II matched this criterion and thus only values for BMR in stage III remained. Daily means of BMR were calculated. BMR showed no correlation with BM (r = 0.097, n = 22, df=12, T=0.194, P>0.8). Nor was BMR significantly correlated with relative recovery time ( r= 0.584, n=22, df= 12, T= 2.00, P > 0.5; Fig. 7). However, the rather con- servative nature of the statistics used warrants some em- phasis on this almost significant positive trend (still ex- plaining 34% of the variation with a P < 0.01 when using conventional linear regression statistics). In addition to estimating BMR using the "zero activity criteria", we calculated BMR from nighttime energy expenditure cor- recting for activity costs. For each individual bird we calculated the relation between the hourly energy expen- diture measurements between 0000 and 0900 hours and hourly activity counts. Using the natural logarithm of activity counts plus one yielded the best linear regression results with correlation coefficients in the range of 0.603 and 0.729 (n ranging between 110 and 175). According to these activity costs relations for each individual bird the hourly energy expenditure values were corrected to BMR for which the daily averages were calculated in addition. BMR values calculated in this way (Fig. 8) again yielded a suggestive but still non-significant relation between B MR and relative recovery time (r = 0.355, n = 43, df= 31, T= 1.310, P>0.15), yet a clearly decreasing BMR with relative starvation time ( r = - 0 . 7 1 7 , n=36, df=24, T-- -3.819, P < 0.001). We are left here with the dilemma that BMR shows a decrease during starvation but no significant increase during the recovery period. However, given the indications and the nature of the statistics used, it is more prudent to assume that the BMR increases to its original (stage I) level during recovery, than that it
5O
40
.~ 3o
20
o~ r
-Q 10
[+t]ge I stage, sta0~ m
0 25 50 75 100
s t a r v a t i o n t i m e
~ o e l l
e # ..-~--;,
, , i i ~ .
0 25 50 75 100
r e c o v e r y t i m e (%)
Fig. 8. Daily basal metabolism as a function of relative starvation (left panel) and recovery time (right panel). The daily basal metabolism was calculated by averaging all hourly energy expendi- ture measurements between 0000 and 0900 hours after correcting for activity costs. The solid and broken lines indicate significant and non-significant least square regression lines, respectively
shows no change at all and remains at its low level at- tained during starvation. This conclusion lends addition- al support from the notion that BMR estimates were significantly lower during the first day compared with the last day of stage III (paired T = - 2 . 1 1 , n=6, dr--5, P < 0.05). BMR was not related to BM, neither if all data were pooled ( r= -0 .052 , n=54, df=42, T=-0 .411 , P>0.6) nor if all birds were considered separately (r ranging from -0.388 to 0.351, n from 7 to 12, in all cases n.s.). Clearly, considering BMR in relation to BM for stages I and II separately yields positive correlation coefficients as BM decreases and increases parallel to the BMR during these stages, respectively. However, the ab- sence of a relation between BMR and BM combining all three stages makes a causal link between BMR and BM unlikely.
Activity costs
Using the individual specific relations between activity and energy expenditure between 0000 and 0900 hours (see above), daytime, nighttime and total day activity
M. Klaassen, H. Biebach: Energetics of fattening and starvation in the migratory garden warbler 367
1.4
1.2
1.0
~" 08 r -
--~ 0.6
0.4
o O
~" 1.0
"~o 0.8 0.6
0.4
0.2
0.0
[ s t a g e s t a g e II s t a g e I l l
DAY
�9 �9 8
! O " �9 �9 n i I i
N I G H T
�9 0 �9 �9 a �9
-:..;:;;i-.:.
0. : ' t " "
a
. , , , , : o t .%.. t �9 I I I I I I I I I i
0 25 50 75 100 0 25 50 75 100 s t a r v a t i o n t i m e r e c o v e r y t i m e (%)
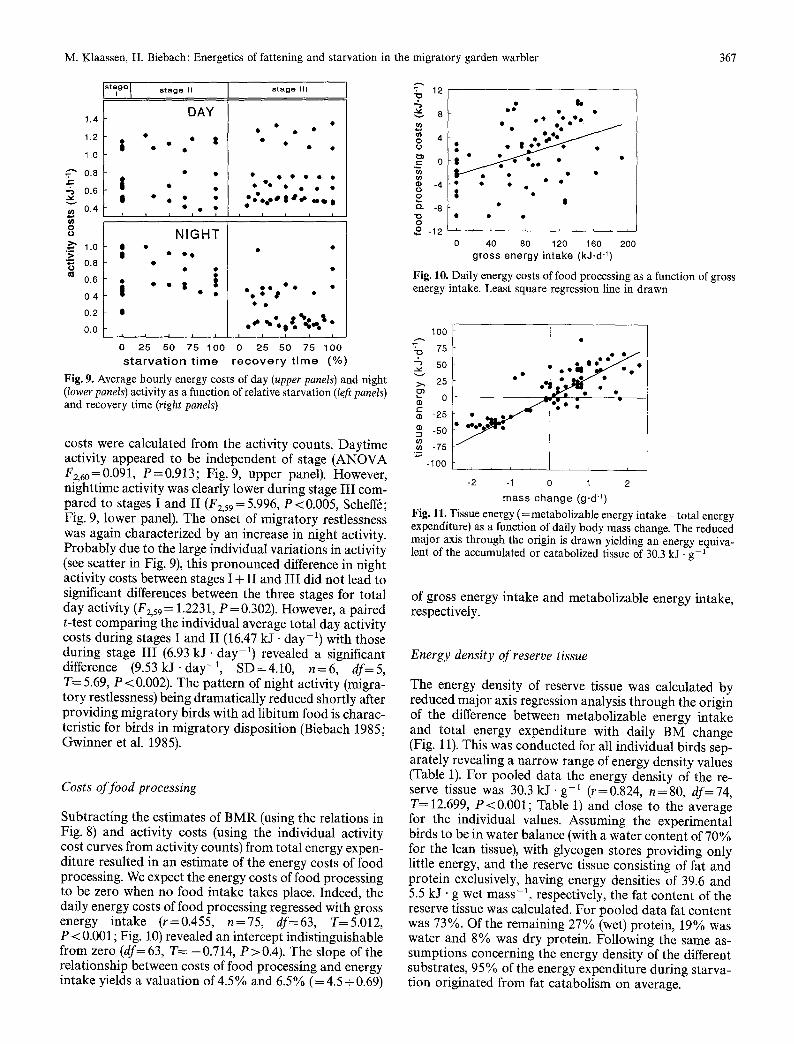
Fig. 9. Average hourly energy costs of day (upper panels) and night (lower panels) activity as a function of relative starvation (left panels) and recovery time (right panels)
costs were calculated from the activity counts. Daytime activity appeared to be independent of stage (ANOVA F2,6o=0.091, P=0.913; Fig. 9, upper panel). However, nighttime activity was clearly lower during stage III com- pared to stages I and II (F2,59 = 5.996, P <0.005, Scheffr; Fig. 9, lower panel). The onset of migratory restlessness was again characterized by an increase in night activity. Probably due to the large individual variations in activity (see scatter in Fig. 9), this pronounced difference in night activity costs between stages I + II and III did not lead to significant differences between the three stages for total day activity (F2,59 = 1.2231, P = 0.302). However, a paired t-test comparing the individual average total day activity costs during stages I and II (16.47 kJ - day -1) with those during stage III (6.93 k J - d a y -1) revealed a significant difference (9.53 kJ. day -1, SD=4.10, n=6, df=5, T= 5.69, P < 0.002). The pattern of night activity (migra- tory restlessness) being dramatically reduced shortly after providing migratory birds with ad libitum food is charac- teristic for birds in migratory disposition (Biebach 1985; Gwinner et al. 1985).
Costs of food processing
Subtracting the estimates of BMR (using the relations in Fig. 8) and activity costs (using the individual activity cost curves from activity counts) from total energy expen- diture resulted in an estimate of the energy costs of food processing. We expect the energy costs of food processing to be zero when no food intake takes place. Indeed, the daily energy costs of food processing regressed with gross energy intake (r=0.455, n=75, df=63, T=5.012, P<0.001 ; Fig. 10) revealed an intercept indistinguishable from zero (df= 63, T=-0 .714 , P>0.4). The slope of the relationship between costs of food processing and energy intake yields a valuation of 4.5% and 6.5% (-- 4.5-0.69)
12 r [ ~ . ~ �9
8 a �9 �9 o.
"~'mo~ 4 [ : ea" I ~ � 9 1 4 9 " +
0 �9 �9
-4 F " �9 �9 . " "
J 8
s �9 S Q- -8
"1~ �9 �9 �9
O o -12 . . . . . . . . . . . .
0 40 80 120 160 200 gross energy intake (kJ,d "1)
Fig. 10. Daily energy costs of food processing as a function of gross energy intake. Least square regression line in drawn
100
-o 75 "~ 50
>, 25 0 3
0
-25
-50
-75
-100
. .. le e'~-'. * �9 -.
':" :
-2 -1 0 1 2 mass change (g.d 4)
Fig. 11. Tissue energy (= metabolizable energy intake - total energy expenditure) as a function of daily body mass change. The reduced major axis through the origin is drawn yielding an energy equiva- lent of the accumulated or catabolized tissue of 30.3 kJ - g- 1
of gross energy intake and metabolizable energy intake, respectively.
Energy density of reserve tissue
The energy density of reserve tissue was calculated by reduced major axis regression analysis through the origin of the difference between metabolizable energy intake and total energy expenditure with daily BM change (Fig. 11). This was conducted for all individual birds sep- arately revealing a narrow range of energy density values (Table 1). For pooled data the energy density of the re- serve tissue was 30.3 k J - g - 1 (r=0.824, n=80, df--74, T= 12.699, P<0.001; Table 1) and close to the average for the individual values. Assuming the experimental birds to be in water balance (with a water content of 70% for the lean tissue), with glycogen stores providing only little energy, and the reserve tissue consisting of fat and protein exclusively, having energy densities of 39.6 and 5.5 kJ �9 g wet mass -1, respectively, the fat content of the reserve tissue was calculated. For pooled data fat content was 73%. Of the remaining 27% (wet) protein, 19% was water and 8% was dry protein. Following the same as- sumptions concerning the energy density of the different substrates, 95% of the energy expenditure during starva- tion originated from fat catabolism on average.
368 M. Klaassen, H. Biebach: Energetics of fattening and starvation in the migratory garden warbler
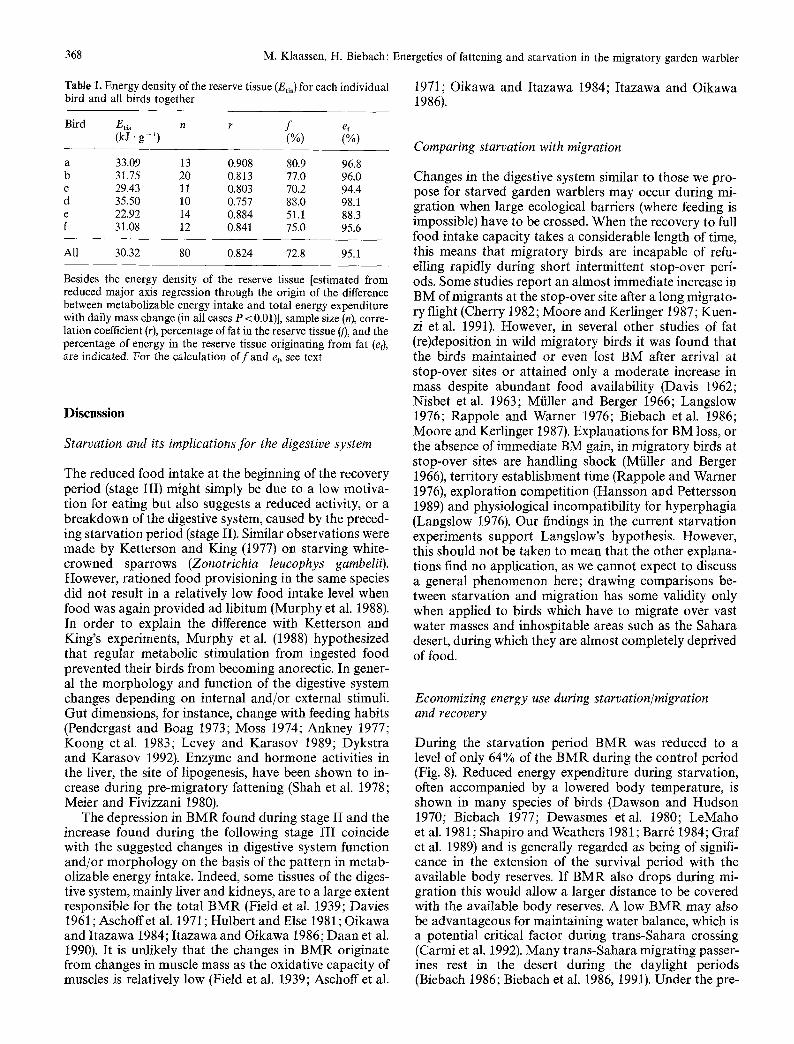
Table 1. Energy density of the reserve tissue (Etis) for each individual bird and all birds together
Bird E,i~ n r f ef (kJ. g-1) (%) (%)
a 33.09 13 0.908 80.9 96.8 b 31.75 20 0.813 77.0 96.0 c 29.43 11 0.803 70.2 94.4 d 35.50 10 0,757 88.0 98.1 e 22.92 14 0,884 51.1 88.3 f 31.08 12 0.841 75.0 95.6
All 30.32 80 0.824 72.8 95.1
Besides the energy density of the reserve tissue [estimated from reduced major axis regression through the origin of the difference between metabolizable energy intake and total energy expenditure with daily mass change (in all cases P < 0.01)], sample size (n), corre- lation coefficient (r), percentage of fat in the reserve tissue GO, and the percentage of energy in the reserve tissue originating from fat (e0, are indicated. For the calculation of f and el, see text
D i s c u s s i o n
Starvation and its implications for the digestive system
The reduced food intake at the beginning of the recovery period (stage III) might simply be due to a low motiva- tion for eating but also suggests a reduced activity, or a breakdown of the digestive system, caused by the preced- ing starvation period (stage II). Similar observations were made by Ketterson and King (1977) on starving white- crowned sparrows (Zonotrichia leucophys gambelii). However, rationed food provisioning in the same species did not result in a relatively low food intake level when food was again provided ad libitum (Murphy et al. 1988). In order to explain the difference with Ketterson and King's experiments, Murphy et al. (1988) hypothesized that regular metabolic stimulation from ingested food prevented their birds from becoming anorectic. In gener- al the morphology and function of the digestive system changes depending on internal and/or external stimuli. Gut dimensions, for instance, change with feeding habits (Pendergast and Boag 1973; Moss 1974; Ankney 1977; Koong et al. 1983; Levey and Karasov 1989; Dykstra and Karasov 1992). Enzyme and hormone activities in the liver, the site of lipogenesis, have been shown to in- crease during pre-migratory fattening (Shah et al. 1978; Meier and Fivizzani 1980).
The depression in BMR found during stage II and the increase found during the following stage III coincide with the suggested changes in digestive system function and/or morphology on the basis of the pattern in metab- olizable energy intake. Indeed, some tissues of the diges- tive system, mainly liver and kidneys, are to a large extent responsible for the total BMR (Field et al. 1939; Davies 1961 ; Aschoff et al. 1971 ; Hulbert and Else 1981 ; Oikawa and Itazawa 1984; Itazawa and Oikawa 1986; Daan et al. 1990). It is unlikely that the changes in BMR originate from changes in muscle mass as the oxidative capacity of muscles is relatively low (Field et al. 1939; Aschoff et al.
1971; Oikawa and Itazawa 1984; Itazawa and Oikawa 1986).
Comparing starvation with migration
Changes in the digestive system similar to those we pro- pose for starved garden warblers may occur during mi- gration when large ecological barriers (where feeding is impossible) have to be crossed. When the recovery to full food intake capacity takes a considerable length of time, this means that migratory birds are incapable of refu- elling rapidly during short intermittent stop-over peri- ods. Some studies report an almost immediate increase in BM of migrants at the stop-over site after a long migrato- ry flight (Cherry 1982; Moore and Kerlinger 1987; Kuen- zi et al. 1991). However, in several other studies of fat (re)deposition in wild migratory birds it was found that the birds maintained or even lost BM after arrival at stop-over sites or attained only a moderate increase in mass despite abundant food availability (Davis 1962; Nisbet et al. 1963; Mfiller and Berger 1966; Langslow 1976; Rappole and Warner 1976; Biebach et al. 1986; Moore and Kerlinger 1987). Explanations for BM loss, or the absence of immediate BM gain, in migratory birds at stop-over sites are handling shock (Mfiller and Berger 1966), territory establishment time (Rappole and Warner 1976), exploration competition (Hansson and Pettersson 1989) and physiological incompatibility for hyperphagia (Langslow 1976). Our findings in the current starvation experiments support Langslow's hypothesis. However, this should not be taken to mean that the other explana- tions find no application, as we cannot expect to discuss a general phenomenon here; drawing comparisons be- tween starvation and migration has some validity only when applied to birds which have to migrate over vast water masses and inhospitable areas such as the Sahara desert, during which they are almost completely deprived of food.
Economizing energy use during starvation~migration and recovery
During the starvation period BMR was reduced to a level of only 64% of the BMR during the control period (Fig. 8). Reduced energy expenditure during starvation, often accompanied by a lowered body temperature, is shown in many species of birds (Dawson and Hudson 1970; Biebach 1977; Dewasmes et al. 1980; LeMaho et al. 1981; Shapiro and Weathers 1981; Barr6 1984; Graf et al. 1989) and is generally regarded as being of signifi- cance in the extension of the survival period with the available body reserves. If BMR also drops during mi- gration this would allow a larger distance to be covered with the available body reserves. A low BMR may also be advantageous for maintaining water balance, which is a potential critical factor during trans-Sahara crossing (Carmi et al. 1992). Many trans-Sahara migrating passer- ines rest in the desert during the daylight periods (Biebach 1986; Biebach et al. 1986, 1991). Under the pre-

M. Klaassen, H. Biebach: Energetics of fattening and starvation in the migratory garden warbler 369
vailing high environmental temperatures a low endoge- nous heat production (i.e. a low BMR) will reduce water use for evaporative cooling. However, these potential ad- vantages of a reduced BMR are apparently associated with the inability to eat large quantities of food. Whether the 36% reduction in BRM during starvation is merely a result of the inability of maintaining the digestive appara- tus in its original state, due to an inappropriate protein supply, or a true mechanism aiming at economizing on energy use remains to be elucidated.
A proposed factor contributing to fat deposition is reduced activity (Blem 1980). Indeed, activity was re- duced during the recovery period and the energy thus saved could have been used to gain 0.38 g -day -1 (=9.5+25.0) BM, assuming 100% synthesis efficiency. Thus, energy savings from reduced activity can at most explain about 30% of the BM increase during recovery. Alternatively, the efficiency of nutrient utilization could be increased. Although we failed to show immediate changes in assimilation efficiency as a result of the exper- imental conditions, long-term experiments with garden warblers showed highest food assimilation efficiencies during the period of pre-migratory fattening (Bairlein 1985 b). However, in these experiments Bairlein (1985b) did not correct for the possible effect of endogenous ener- gy losses. Calculating assimilation efficiencies of foods in birds is confounded by the mixing of urinary wastes with the undigested food passing through the cloaca, as well as by continual loss of mass and energy from the alimentary tract in the form of sloughed epithelial cells, microbes, and digestive secretions. These endogenous urinary and faecal energy losses become proportionally larger when the food intake level decreases (Guglielmo and Karasov 1993). Thus, in Bairlein's (1985b) experiments low assim- ilation efficiency out of the pre-migratory period may have been caused by the sub-maintenance intake levels during these periods. Hence, no unequivocal evidence for an increased efficiency of nutrient utilization during the premigratory phase exists.
Another alternative to increase the speed of fattening is hyperphagia, which is regarded as the principal mecha- nism underlying fat deposition (Berthold 1975). The max- imum metabolizable energy intake level of the migratory garden warblers was found to be close to the expected value calculated according to Kirkwood (1983). Thus, garden warblers apparently do not possess a special mor- phological or physiological adaptation for hyperphagia. However, to fully elucidate this problem comparisons of maximum food intake capacity are needed between con- specifics in and out of migratory disposition.
Energy density of body reserves
In the past, body reserves of migratory birds were thought to consist almost entirely of fat (Connell et al. 1960; Odum et al. 1964, 1965). Studies on the composi- tion of reserve tissue for migration using carcass analyses may provide insight into the nature of these tissues. How- ever, many of these studies are flawed due to methodo- logical inconsistencies (Lindstr6m and Piersma 1993),
which all lead back to the impossibility of multiple killing of the same individual to see how its composition has changed over time. Nevertheless, after a scrupulous selec- tion of the available data, Lindstr6m and Piersma (1993) still found strong indications that, apart from some ex- ceptions, birds generally deposit protein before take-off. The method used in this study, yielding an estimate of 73% for the fat content of the reserve tissue, does not suffer from the methodological problems as outlined by Lindstr6m and Piersma (1993) for carcass analyses data. Nor did a detailed energy budget study on knots (Calidris canutus), which showed that towards the end of their pre- migratory BM gain the accumulated tissue consisted of 67% fat (Klaassen et al. 1990). Other support for reserve tissue containing protein comes from nitrogen balance studies during prolonged fasting in fat animals. These studies revealed that 4-10% of total energy expenditure during starvation originates from protein catabolism [Lindg~rd et al. (1992) and studies cited therein], which means that the fat content of reserve tissue ranged be- tween 62 and 81%. However, during all the experiments that gave a clue to the composition of the reserve tissue, daily energy expenditure was much lower than we would expect for an actively migrating bird. The question arises whether or not the level of energy expenditure could have an effect on the ratio in which endogenous fat and protein reserves are catabolized. This possibility was rejected in experiments on trush nightingales (Luscinia luscinia) starved for 3-8 days in the same set up as used in this study (M. Klaassen and H. Biebach, unpublished obser- vations). Trush nightingales are also long-distance migra- tory birds that put on huge body reserves (as much as 70% of their initial mass) during the pre-migratory peri- od. Under thermoneutral conditions we estimated a fat content of 79% (SD = 8, n = 5). By keeping them in the cold we almost doubled their energy expenditure from 52 to I00 kJ -day -1, but the fat content of the catabolized reserve tissue remained virtually unchanged at 80% (SD=5, n=5, paired-T-0.36, P>0.7). Clearly, energy expenditure will be even higher during migration. In this respect the work of Jenni-Eiermann and Jenni (1991) is reassuring; they found uric acid in the blood of passerines shortly after they were caught at a high mountain pass in the Swiss Alps in the act of migration. This shows unam- biguously that protein besides fat catabolism is not a phenomenon for starving animals exclusively, but also applies to migrating birds.
Studies of muscle mass in relation to the accumulation of body fat for migration show adaptive increased in muscle size while composition and function are similar on a mass-specific basis (Yablonkevich 1975; Mc Lan- dress and Raveling 1981; Marsh 1983, 1984). These in- creases in flight muscle mass for migration are generally thought to be necessary to carry the extra weight of body reserves (Dawson et al. 1983). It is possible that it is the extra carrying tissue in the garden warbler that is reflect- ed by the 11% dry protein in the extra-tissue.
Equations to calculate coverable distance from BM loss during migration [see Davidson (1984) for review] often assume that the body reserves consist completely of fat. However, the energy density of the tissue is overesti-

370 M. Klaassen, H. Biebach: Energefics of fattening and starvation in the migratory garden warbler
m a t e d by 31% if it is a s sumed tha t the ga rden warb le rs have b o d y reserves cons is t ing of 100% fat. L ikewise the cove rab le m i g r a t o r y d i s tance is also ove re s t ima ted by 31%.
Acknowledgements. We thank Josef Habersetzer and Karl-Heinz Siebenrock for catching the birds and for practical support during the study, Dick Visser for drawing Figure 2 and Miriam Hall for correcting our English. Chris Klaassen is thanked for providing us with new statistical methods at a time point we had almost given up hope of finding appropriate ways to analyse our data. We are grate- ful for the comments given by Serge Daan, ~ke Lindstr6m and two anonymous referees on earlier drafts of this manuscript.
References
Ankney CD (1977) Feeding and digestive organ size in breeding lesser snow geese. Auk 94:275-282
Aschoff J (1981) Thermal conductance in mammals and birds: its dependence on body size and circadian phase. Comp Biochem Physiol 69A:611-619
Aschoff J, Pohl H (1970) Der Ruheumsatz yon V6geln als Funktion der Tageszeit und der K6rpergrSBe. J Ornithol 111 : 38-47
Aschoff J, Guenther B, Kramer K (1971) Energiehaushalt und Tem- peraturregulation. Urban and Schwarzenberg, Mfinchen Berlin Wien
Bairlein F (1985a) Body weights and fat deposition of palaearctic passerine migrants in the central Sahara. Oecologia 66:141-146
Bairlein F (1985b) Efficiency of food utilization during fat deposi- tion in the long-distance migratory garden warbler, Sylvia borin. Oecologia 68:118-125
Barr6 H (1984) Metabolic and insulative changes in winter- and summer-acclimatized king penguin chicks. J Comp Physiol B 154:317-324
Berthold P (1975) Migration: control and metabolic physiology. In: Farner DS, King JR (eds) Avian biology. Academic Press, Lon- don New York, pp 77-128
Biebach H (1977) Reduktion des Energiestoffwechsels und der K6rpertemperatur hungernder Amseln (Turdus meruIa). J Or- nithol 118:294-300
Biebach H (1985) Sahara stopover in migratory flycatchers:fat and food affect the time program. Experientia 41:695-697
Biebach H (1986) Ecophysiology of resting willow warblers (Phyllo- scopus trochilus) crossing the Sahara. Proc 19th Int Ornithol Congr Ottawa: 2162-2168
Biebach H, Friedrich W, Heine G (1986) Interaction of body mass, fat foraging and stopover period in trans-Sahara migrating passerine birds. Oecologia 69: 370-379
Biebach H, Friedrich W, Heine G, Jenni L, Jenni-Eiermann S, Schmidl D (1991) The daily pattern of autumn bird migration in the northern Sahara. Ibis 133:414-422
Blem CR (1980) The energetics of migration. In: Gauthreaux SA Jr (ed) Animal migration, orientation, and navigation. Academic Press, New York London, pp 175-224
Carmi N, Pinshow B, Porter WP, Jaeger J (1992) Water and energy limitations on flight duration in small migratory birds. Auk 109:268-276
Cherry JD (1982) Eat deposition and length of stopover of migrant white-crowned sparrows. Auk 99:725-732
Connell CE, Odum EP, Kale H (1960) Fat-free weights of birds. Auk 77:1-9
Daan S, Masman D, Groenewold A (1990) Avian basal metabolic rates; their association with body composition and energy ex- penditure in nature. Am J Physiol 259:R333-R340
Davidson NC (1984) How valid are flight range estimates for waders? Ringing and Migration 5:4%64
Davies M (1961) On body size and tissue respiration. J Cell Comp Physiol 57:135-147
Davis P (1962) Robin recaptures on Fair Isle. Br Birds 55:225-229
Dawson WR, Hudson JW (1970) Birds. In: Whittow GC (ed) Com- parative physiology of thermoregulation, vol 1. Academic Press, New York London, pp 223-310
Dawson WR, Yacoe ME, Marsh RL (1983) Metabolic adjustments of small birds for migration and cold. Am J Physiol 245R:755- 767
Dewasmes G, LeMaho Y, Cornet A, Groscolas R (1980) Resting metabolic rate and cost of locomotion in long-term fasting em- peror penguins. J Appl Physiol 49:888-896
Dykstra CR, Karasov WH (1992) Changes in gut structure and function of house wrens (Troglodytes aedon) in response to in- creased energy demands. Physiol Zool 65:422-442
Field J, Belding HS, Martin AW (1939) An analysis of the relation between basal metabolism and summated tissue respiration in the rat. J Cell Comp Physiol 14:143-157
Graf R, Krishna S, Heller HC (1989) Regulated nocturnal hypother- mia induced in pigeons by food deprivation. Am J Physiol 256 :R733-R738
Guglielmo CG, Karasov WH (1993) Endogenous mass and energy losses in ruffed grouse. Auk 110:386-390
Gwinner E, Biebach H, Kries IV (1985) Food availability affects migratory restlessness in caged garden warblers (Sylvia borin). Naturwissenschaften 72:51-52
Hansson M, Pettersson J (1989) Competition and fat deposition in goldcrests (Regulus regulus) at a migratory stop-over site. Vogel- warte 35:21--31
Hill RW (1972) Determination of oxygen consumption by use of the paramagnetic oxygen analyser. J Appl Physiol 33:261-263
Hulbert A J, Else PL (1981) Comparison of the "mammal machine" and the "reptile machine": energy and thyroid activity. Am J Physiol 241 :R350.R365
Itazawa Y, Oikawa S (1986) A quantitative interpretation of the metabolism-size relationship in animals. Experientia 42:152- 153
Jenni-Eiermann S, Jenni L (1991) Metabolic responses to flight and fasting in night-migrating passerines. J Comp Physiol B 161:465-474
Ketterson ED, King JR (1977) Metabolic and behavioral responses to fasting in the white-crowned sparrow (Zonotrichia Ieucophrys gambelii). Physiol Zool 50:115-129
Kirkwood JK (1983) A limit to metabolisable energy intake in mammals and birds. Comp Biochem Physiol 75A:1-3
Klaassen M, Kersten M, Ens BJ (1990) Energetic requirements for maintenance and premigratory body mass gain of waders win- tering in Africa. Ardea 78:209-220
Koong LJ, Nienaber JA, Mersmann HJ (1983) Effects of plane of nutrition on organ size and fasting heat production in genetical- ly obese and lean pigs. J Nutr 113:1626-1631
Kuenzi AJ, Moore FR, Simons TR (1991) Stopover of neotropical landbird migrants on East Ship Island following trans-Gulf mi- gration. Condor 93:869-883
Langslow DR (1976) Weights of blackcap on migration. Ringing and Migration 1:78-91
LeMaho Y, VuVanKha H, Koubi H, Dewasmes G, Girard J, Ferre P, Cagnard M (1981) Body composition, energy expenditure, and plasma metabolites in long-term fasting geese. Am J Physiol 241 :E342-E354
Levey DJ, Karasov WH (1989) Digestive responses of temperate birds switched to fruit or insect diets. Auk 106:675-686
Lindg~rd K, Stokkan KA, LeMaho Y, Groscolas R (1992) Protein utilization during starvation in fat and lean Svalbard ptarmigan (Lagopus taurus hyperboreus). J Comp Physiol B 162:607-613
Lindstr6m A (1991) Maximum fat deposition rates in migrating birds. Ornis Scand 22:12-19
Lindstr6m A, Piersma T (1993) Mass changes in migrating birds: the evidence for fat and protein storage re-examined. Ibis 135:70-78
Marsh RL (1983) Adaptations of the gray catbird Dumetella caroli- nensis to long-distance migration: energy stores and blood sub- strates. Auk 100:170.179
M. Klaassen, H. Biebach: Energetics of fattening and starvation in the migratory garden warbler 371
Marsh RL (1984) Adaptations of the gray catbird Dumetella caroli- nensis to long distance migration: flight muscle hypertrophy associated with elevated body mass. Physiol Zool 57:105-117
McLandress MR, Raveling DG (1981) Changes in diet and body composition of Canada geese before spring migration. Auk 98: 65-79
Meier AH, Fivizzani AJ (1980) Physiology of migration. In: Gau- threaux SA Jr (ed) Animal migration, orientation and naviga- tion. Academic Press, New York London, pp 225-282
Moore F, Kerlinger P (1987) Stopover and fat deposition by North American wood-warblers (Parulinae) following spring migration over the Gulf of Mexico. Oecologia 74:47-54
Moss R (1974) Winter diets, gut lengths, and interspecific competi- tion in Alaskan ptarmigan. Condor 75:293-301
Murphy ME, King JR, Jianjian L (1988) Malnutrition during the postnuptial molt of white-crowned sparrows: feather growth and quality. Can J Zool 66:1403-1413
Muramatsu T, Aoyagi Y, Okumura J, Tasaki I (1987) Contribution of whole-body protein synthesis to basal metabolism in layer and broiler chickens. Br J Nutr 57:269-277
M/iller HC, Berger DD (1966) Analyses of weight and fat variations in transient swainson's trushes. Bird-Banding 37:83-111
Nisbet ICT, Drury WIt, Baird J (1963) Weight loss during migra- tion: part 1. Deposition and consumption of fat by the blackpoll warbler. Bird-Banding 34:107-138
Odum EP, Marshall SG, Marples TG (1965) The caloric content of migrating birds. Ecology 46:901-904
Odum EP, Rogers DT, Hicks DL (1964) Homeostasis of nonfat components of migrating birds. Science 143:1037-1039
Oikawa S, Itazawa Y (1984) Allometric relationship between tissue respiration and body mass in the carp. Comp Biochem Physiol 77A:415-418
Pendergast B, Boag D (1973) Seasonal changes in the internal anatomy of the spruce grouse in Alberta. Auk 90:307-317
Rappole JH, Warner DW (1976) Relationships between behavior, physiology and weather in avian transients at a migration stopover site. Oecologia 26:193-212
Shah RV, Patel ST, Pilo B (1978) Glucose-6-phosphate dehydroge- nase and "malic" enzyme activities during adaptive hyperlipo- genesis in migratory starling (Sturnus roseus) and white wagtail (Motacilla alba). Can J Zool 56:2083-2087
Shapiro CJ, Weathers WW (1981) Metabolic and behavioral re- sponses of American kestrels to food deprivation. Comp Biochem Physiol 68A:111-114
Svensson L (1984) Identification guide to European passerines. Svensson, Stockholm
Yablonkevich ML (1975) Annual and daily rhythms in the weight of the principal components of the flight muscles of the chaffinch (Fringilla coeIebs) (In Russian) Zool Zh 54:1213-1229