An implantable instrument for studying the long-term flight biology of migratory birds.
13
1 An implantable instrument for studying the long-term flight biology of migratory birds. Robin J. Spivey a & Charles M. Bishop b a [email protected]; b [email protected] a,b Department of Biological Sciences, Bangor University, Gwynedd, UK. LL57 2UW Abstract: The design of an instrument deployed in a project studying the high altitude Himalayan migrations of bar-headed geese (Anser indicus) is described. The electronics of this archival datalogger measured 22x14x6.5 mm, weighed 3g, was powered by a ½AA-sized battery weighing 10 g and housed in a transparent biocompatible tube sealed with titanium electrodes for electrocardiography (ECG). The combined weight of 32 g represented less than 2% of the typical bodyweight of the geese. The primary tasks of the instrument were to continuously record a digitised ECG signal for heart-rate determination and store 12-bit triaxial accelerations sampled at 100Hz with 15% coverage over each two minute period. Measurement of atmospheric pressure provided an indication of altitude and rate of ascent or descent during flight. Geomagnetic field readings allowed for latitude estimation. These parameters were logged twice per minute along with body temperature. Data were stored to a memory card of 8GB capacity. Instruments were implanted in geese captured on Mongolian lakes during the breeding season when the birds are temporarily flightless due to moulting. The goal was to collect data over a ten month period, covering both southward and northward migrations. This imposed extreme constraints on the design’s power consumption. Raw ECG can be post-processed to obtain heart-rate, allowing improved rejection of signal interference due to strenuous activity of locomotory muscles during flight. Accelerometry can be used to monitor wing-beat frequency and body kinematics, and since the geese continued to flap their wings continuously even during rather steep descents, act as a proxy for biomechanical power. The instrument enables detailed investigation of the challenges faced by the geese during these arduous migrations which typically involve flying at extreme altitudes through cold, low density air where oxygen availability is significantly reduced compared to sea level. Keywords: flapping flight, accelerometry, electrocardiography, magnetometry, heart-rate, altitude Introduction Obtaining detailed physiological and biomechanical measurements from free-ranging birds has become increasingly feasible in recent years due to advances in electronics and transducer technology [1-3]. Miniaturisation and power reductions have allowed instruments to be implanted into the abdominal cavity of birds, recording heart-rate for many months [4-5]. Real-time QRS detection from the electrocardiogram (ECG) signal is an error-prone process and notoriously challenging when weight, size and power consumption are prime considerations [6]. The present design successfully implemented an alternative approach which has only very recently become viable for year-long deployments: the storage of raw ECG and subsequent signal post- processing of arbitrary sophistication to obtain robust measures of heart-rate following recapture. Since immense amounts of memory are required, the possibility arises of simultaneously storing additional information from other high data-rate transducers such as accelerometers. For animals whose recapture is not impractical, this archival approach to data collection can collect vast biologically informative datasets, overcoming the data restrictions associated with remote download systems.
Transcript of An implantable instrument for studying the long-term flight biology of migratory birds.

1
An implantable instrument for studying the long-term flight biology of migratory birds.
Robin J. Spiveya & Charles M. Bishopb
a [email protected]; b [email protected]
a,b Department of Biological Sciences, Bangor University, Gwynedd, UK. LL57 2UW
Abstract: The design of an instrument deployed in a project studying the high altitude Himalayan migrations of
bar-headed geese (Anser indicus) is described. The electronics of this archival datalogger measured 22x14x6.5
mm, weighed 3g, was powered by a ½AA-sized battery weighing 10 g and housed in a transparent
biocompatible tube sealed with titanium electrodes for electrocardiography (ECG). The combined weight of 32
g represented less than 2% of the typical bodyweight of the geese. The primary tasks of the instrument were to
continuously record a digitised ECG signal for heart-rate determination and store 12-bit triaxial accelerations
sampled at 100Hz with 15% coverage over each two minute period. Measurement of atmospheric pressure
provided an indication of altitude and rate of ascent or descent during flight. Geomagnetic field readings
allowed for latitude estimation. These parameters were logged twice per minute along with body temperature.
Data were stored to a memory card of 8GB capacity. Instruments were implanted in geese captured on
Mongolian lakes during the breeding season when the birds are temporarily flightless due to moulting. The goal
was to collect data over a ten month period, covering both southward and northward migrations. This imposed
extreme constraints on the design’s power consumption. Raw ECG can be post-processed to obtain heart-rate,
allowing improved rejection of signal interference due to strenuous activity of locomotory muscles during
flight. Accelerometry can be used to monitor wing-beat frequency and body kinematics, and since the geese
continued to flap their wings continuously even during rather steep descents, act as a proxy for biomechanical
power. The instrument enables detailed investigation of the challenges faced by the geese during these
arduous migrations which typically involve flying at extreme altitudes through cold, low density air where
oxygen availability is significantly reduced compared to sea level.
Keywords: flapping flight, accelerometry, electrocardiography, magnetometry, heart-rate, altitude
Introduction
Obtaining detailed physiological and biomechanical measurements from free-ranging birds has become
increasingly feasible in recent years due to advances in electronics and transducer technology [1-3].
Miniaturisation and power reductions have allowed instruments to be implanted into the abdominal cavity of
birds, recording heart-rate for many months [4-5]. Real-time QRS detection from the electrocardiogram (ECG)
signal is an error-prone process and notoriously challenging when weight, size and power consumption are
prime considerations [6]. The present design successfully implemented an alternative approach which has only
very recently become viable for year-long deployments: the storage of raw ECG and subsequent signal post-
processing of arbitrary sophistication to obtain robust measures of heart-rate following recapture. Since
immense amounts of memory are required, the possibility arises of simultaneously storing additional
information from other high data-rate transducers such as accelerometers. For animals whose recapture is not
impractical, this archival approach to data collection can collect vast biologically informative datasets,
overcoming the data restrictions associated with remote download systems.

2
Bar-headed geese (Anser indicus) are evolutionarily adapted to flight at high altitudes owing to the geologically
recent formation of the Himalayas cutting directly across their annual migration routes [7]. Although evolution
could have tackled this problem by favouring longer migratory routes to the east of the Qinghai-Tibetan
plateau, natural selection has instead conferred on this species an extraordinary ability to tolerate hypoxia.
While Brent geese (Branta bernicla) apparently struggle to cross the ice-caps of Greenland at 2500m [8], bar-
headed geese are able to fly comfortably at twice (and possibly even three times) that altitude. Anecdotal
eyewitness accounts by mountaineers climbing the treacherous Annapurna massif, which forms a natural 23km
wide barrier to goose migration, have reported bar-headed geese circling overhead at altitudes of 7000-8000m
[9]. However, such events may be relatively infrequent and dependent upon favourable weather conditions.
General results and two record altitudes (6540m and 7290m) from GPS satellite tags suggest that Himalayan
crossings more typically involve maximum altitudes of between 5000m and 6000m, with flight tending to
follow the valleys [10].
The detailed study of the complex migrations of birds such as bar-headed geese demands sophisticated, high
performance instrumentation. This work describes the design of a compact, ultra-low power miniature archival
datalogger for abdominal implantation. The instrument was first deployed during the summer of 2010, the
design having been undertaken over the course of the previous twelve months. The system was capable of
monitoring body temperature, atmospheric pressure, the Earth’s geomagnetic field, recording ECG
continuously and triaxial accelerometry periodically. Since the flight corridor of the bar-headed geese between
Mongolia and the Himalayan crossing into India happens to run parallel to the horizontal projection of the
geomagnetic field, magnetometry could permit estimates of latitude, even for an implanted system. In
addition, several systems were mounted on neck collars and deployed on Whooper Swans (Cygnus cygnus) in a
pilot study intended to investigate the practicality of intelligently managing acceleration data collection during
flight.
Mechanical Considerations
GPS tracking devices communicating results in real-time via satellite telemetry had established by 2009 that
bar-headed geese do not all spend the winter in India with a minority content to settle into valleys in
southeastern Tibet [11-12]. However, the weight of the GPS backpacks may have contributed to the reluctance
of those birds to follow the main flocks into India. Therefore, at the outset of this project, there was a need to
attempt to keep the weight and volume of the instrument to a minimum. In order to reliably collect ECG so as
to permit heart-rate measurements, the logger had to be implantable. This imposed the additional need for a
biocompatible housing. An initial design request for a flashing LED was intended to confirm the continuing
functioning of the logger at the time of surgical implantation. To achieve both goals, transparent
perfluoroalkoxy (PFA) tubing was chosen (Polyflon, Stone, Staffordshire, UK). Cut to 56mm lengths, the ends of
the tubes were sealed by titanium electrodes providing ECG pick-up. Titanium is a low density metal and PFA is
a fluoropolymer similar to polytetrafluoroethylene (PTFE). These materials are highly inert and widely used in
medical implants. The design of a sealing mechanism between the PFA tubing and the electrodes was
conducted in collaboration with a company that machined the mechanical components for this project
(Beaumaris Instruments, Anglesey, UK). A small board incorporating a combined pressure and temperature
sensor was mounted on an external recess of one of the electrodes. This allowed the communication of
ambient atmospheric density which would not have been possible from within a rigid, sealed housing.
3
Design of Electronic Circuitry
Instrument design centred around a micro SD card for storage and a microcontroller (μC) programmed in C
making use of inline coding techniques and assembly language macros to optimise for speed and power
consumption. The first step during development was to assess whether to perform ECG beat detection in real-
time, as has been the traditional approach in the field study of animals [6], or whether the continuous logging
of raw ECG was feasible. Assembler code was used to program an 8-bit μC (PIC16LF872, Microchip, Chandler,
Arizona, USA) to control an SD card over a serial peripheral interface (SPI). This allowed its power requirements
to be investigated under a variety of operating conditions. Data could be stored with good energetic efficiency
but the standby current of the SD card during inactivity was sufficient to fully drain the preferred battery over
the course of a year. Specifications state that around half a second is required for initialisation of an SD card
following power-up. Since the initialisation current could be as high as 50mA, this posed another difficulty. As
the internal RAM of most μCs is rather limited, it was decided that an intermediate buffer would be required to
hold data, and power would be completely withdrawn from the micro SD card under the control of a P-channel
MOSFET when it was not in use. Dynamic RAM offered ample memory capacity but the complexity of the
interfacing and the need for refresh cycles was unnecessarily problematic. Serial memory devices were
considered but neither static RAM (SRAM) nor ferroelectric RAM was available with sufficient density, and
serial Flash and EEPROM drew relatively large currents. A parallel SRAM of 1MB capacity offered a good overall
compromise in terms of performance and power consumption, with a standby current of just 2μA and
operating current of less than 2mA at 1MHz (CY62158, Cypress, San Jose, California, USA). However, its control
required an 8-bit data bus and a 20-bit address bus, which was not easily driven using a low-end 8-bit μC. Thus,
Microchip’s 64 pin PIC24FJ128GA106 was selected for its enhanced I/O, superior processing throughput, low
power consumption, flexible sleep and standby modes, multiple SPI interfaces, 10-bit A/D conversion
capability, 128KB program memory and 16KB of internal RAM. This processor was capable of directly driving
the data bus and twelve of the address lines to the SRAM, along with handshaking lines. A commonly available
serial-in, parallel-out shift register (74HC164) was used to generate the remaining eight address lines. These
were assigned to the uppermost addresses so that they only needed to be changed as 4KB page boundaries
were crossed. ECG and accelerometry data had a high throughput and were asynchronously collected into 4KB
blocks of the internal RAM (one block for ECG and two for accelerometry) and flushed to pages in the external
RAM once filled. Due to the responsiveness of the parallel SRAM and the speed of the processor, this could be
accomplished without any pause or delay in either the ECG or the accelerometry sampling.
ECG amplifier
Due to the limited bandwidth of the ECG signal (2‒64Hz passband), it was possible to use ultra-low power
operational amplifiers drawing only 1μA per op-amp (AD8504, Analog Devices, Norwood, Massachusetts, USA).
Given the limited 7kHz gain-bandwidth product of these devices and the need for a high order filtering cut-off
so that the digitisation sample rate could be minimised, a two-stage approach was used for amplification with
gain set to 22 on the first stage and 43 on the second stage, resulting in an overall gain approaching 1V/mV. A
single pole high pass filter was implemented in the first stage and a third order low pass filter with a Q-factor of
2.7 was used on the second stage. The input impedance of the ECG amplifier was several MΩ and the output
signal was sampled at 32768/182≈180s/sec, just above the Nyquist rate required for a 64Hz signal and to
faithfully capture QRS complexes. The ECG amplifier circuit required only about 7μA when operating which was
easily driven by a port of the μC, an RC filter being added as a precaution against system noise.
4
Accelerometer
A “nano” triaxial accelerometer (LIS331DLH, ST Microelectronics, Geneva, Switzerland) with on-board 12 bit
digitiser supporting SPI output update rates as high as 1kHz and with a range of ±8g was chosen. Using
capacitive bridges as sensing elements, its current consumption was 250μA when active and 1μA in power-
down mode. This compared favourably with commercially available alternatives at the time but was expensive
to run compared to the ECG circuit, even including the burden on the processor due to regular interrupt driven
ECG sampling and data buffering. Continuous activation of the the accelerometer would have completely
discharged the battery in 3½ months. Though flight activity could have been intelligently detected in firmware,
it was felt that data on background activity of the geese was useful to collect. Therefore, the decision was
taken to collect data from the accelerometer every two minutes. Given the buffering arrangement with
internal RAM, approximately 18 seconds of data would fill 8KB or two pages in external RAM. This resulted in a
duty cycle of 15% which would only drain about half the battery.
Pressure and Temperature
A barometer was crucial to the study of the trans-Himalayan flights, allowing altimetry and rate of ascent
estimation. The transducer selected (MS5540-C, Intersema, Bevaix, Switzerland) was capable of measuring
absolute pressure to a resolution of 0.1mbar and an absolute accuracy of ±1.6mbar throughout the range 10 to
1100 mbar, encompassing all possible experimental changes in atmospheric pressure with altitude. Equipped
with a 16 bit ADC, it featured a built-in temperature sensor and calibration registers programmed at the factory
prior to shipping. The temperature sensor was needed to refine the calculation of atmospheric pressure and
also record the internal body temperature of the goose, providing insights into episodes of intense flight and
environmental changes such as sudden changes in wind conditions, as for instance might occur due to ridge
soaring. The sensing element was supplied coated in a layer of gel claimed to be waterproof to a depth of
100m which was covered in a layer of protective medical grade silicone. The standby current of the device was
less than 0.1μA. Its serial output was multiplexed with the SPI bus used by the accelerometer since pressure
and temperature measurements were only required every 30 seconds so simultaneous collection of
accelerometry with barometry could be avoided. The processor was required to actively generate a 32kHz
square wave for clocking the barometer. This was possible using the built-in output compare module but
meant the processor could not enter sleep mode during the 35msec needed for each temperature or pressure
reading. To conserve power, the processor clock was reduced from 8MHz to 1MHz at these times.
Magnetometer
The intensity of the Earth’s geomagnetic field ranges between 0.25 and 0.65 Gauss. Along the migratory route
of the bar-headed geese it varies from 0.43 Gauss in central India to 0.6 Gauss in Mongolia. It is quite possible
that the birds are more sensitive to changes in field inclination than intensity. Inclination varies considerably
over the same route, between about 20 and 70 degrees. The datalogger was designed to accept a triaxial
digital magnetometer (HMC5843, Honeywell, Morristown, New Jersey, USA), however, its performance proved
somewhat erratic on some loggers during trials and so only a minority of instruments were fitted with it during
manufacture. A ferromagnetic spring within the latching mechanism of the micro SD connector or magnetic
fields generated by the logger itself could also have interfered with measurements. Being cylindrical in shape,
the dataloggers were free to rotate within the abdominal cavity which may have resulted in some internal

5
movement of the battery wires in the vicinity of the sensor. The combined influence of these factors may have
caused the readings obtained to vary according to changes in orientation of the instrument.
Power
A 3.7 Volt, ½ AA sized Lithium Thionyl Chloride battery (ER14250, Omnicel, Phoenixville, Philadelphia, USA) was
used as an energy source. Tests determined its capacity to be somewhere between 800 and 1000 mAh at a
typical operating currents. Linear regulators (TPS78228 and TPS78223, Texas Instruments, Dallas, Texas, USA)
rated at 150mA output current and 1μA quiescent current were used to generate voltage rails of 2.8V and 2.3V.
The latter provided core power to the μC, avoiding the need to enable the built-in voltage regulator which
would either have drawn a high current during sleep or incurred an unacceptably lengthy start-up delay as it
was re-enabled on waking up. Provision was made for the processor to monitor the battery voltage. The output
current capability of the battery varied according to pulse duration but was capable of sustaining 20mA until
deeply discharged. Mean currents were kept below this level by episodically pausing in sleep mode as contents
of external SRAM were being transferred to the micro SD card.
Figure 1. Mechanical assembly of the logger showing the three PCBs (4 layer boards, FR4 substrate, thickness
0.8mm), their interconnections, the locations of the sensors and circuit elements and their physical positions
relative to one another. Programming of firmware was achieved via five prominent pins of the primary
interconnect using a PicKit3. Internal boards were protected by dipping in wax. Putty was used to prevent the
battery from sliding back and forth within the PFA tubing which might otherwise cause spurious impacts to be
transmitted to the accelerometer.
Circuit Layout and Mechanical Assembly
Electronic circuitry was laid out on three printed circuit boards (PCBs). One was a small circular board of
diameter 10mm mounting the pressure/temperature transducer and a decoupling capacitor. This was
externally mounted at a right angle to the other boards within a recess inside one of the titanium electrodes
and connected via a 6-way, 0.05” pitch connector passing through a slot in the electrode to one of the other
6
two boards, see Fig.1. Once soldered into position, the slot was sealed against ingress using epoxy resin
adhesive. The other two boards were of the same rectangular shape and size (22mmx14mm) and were stacked
above one another with the micro SD card connector sandwiched in between. A 22 position 0.05” pitch
connector in a dual-row 2x11 arrangement was used to join the two boards electrically, running width-wise
along the edge of the board opposite the end to which the electrode board attached. The width of the
assembly was intended to match the diameter of the battery so that all components could fit tightly within a
tube to reduce space and weight. The uppermost board was used to mount the 64 pin μC, the 48-pin external
SRAM and the 14-pin address register, components sharing many interconnections. Oscillator-related
components were positioned underneath this board. The high density of this PCB required manual tracking on
four layers taking several days. An initial solution was found using a slightly enlarged PCB area with the design
progressively reduced in size until further space savings became very difficult. This took several weeks and the
outcome was used to determine the dimensions of the second board which, like the first board, was populated
with components on both sides. On the innermost surface was placed the micro SD card connector, its high-
side switching MOSFET, glue logic for the barometer and some passive components. The ECG circuit,
accelerometer, magnetometer, linear regulators and the majority of the passive components were placed on
the underside. This second board was not quite as dense as the first but also required manual tracking on four
layers. It was to this board that the barometer was soldered. The titanium electrodes could not be soldered to
directly so metal pegs were tapped into drilled holes. This provided a reliable interference fit which required no
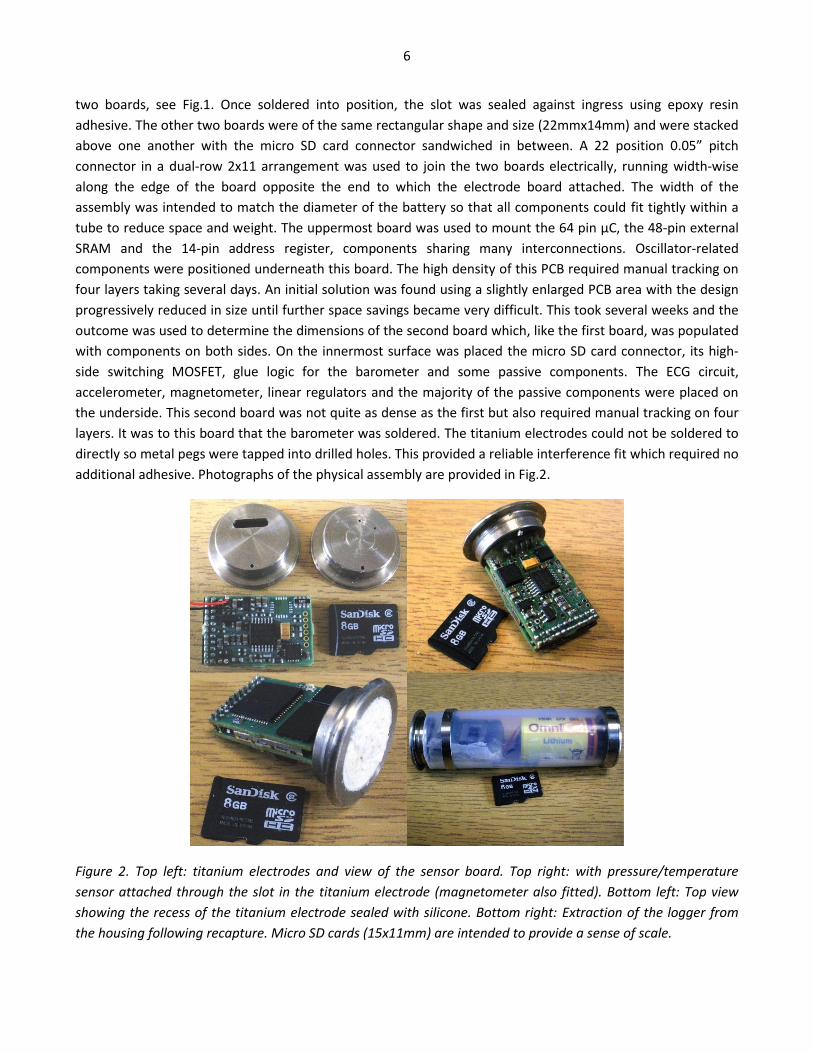
additional adhesive. Photographs of the physical assembly are provided in Fig.2.
Figure 2. Top left: titanium electrodes and view of the sensor board. Top right: with pressure/temperature
sensor attached through the slot in the titanium electrode (magnetometer also fitted). Bottom left: Top view
showing the recess of the titanium electrode sealed with silicone. Bottom right: Extraction of the logger from
the housing following recapture. Micro SD cards (15x11mm) are intended to provide a sense of scale.
7
Firmware Design
The PIC24FJ128GA106 μC contains a wide range of peripheral modules which can be individually enabled and
disabled to save power. An in-built RC oscillator runs at approximately 8MHz and allows the execution of code
to be resumed rapidly after waking from sleep without needing to wait for a phase-locked-loop (PLL) to settle.
In order to achieve extremely low power consumption during ECG sampling, low latency sleep recovery was
required. This particular design consideration featured prominently in the selection of this μC. An external
32kHz crystal oscillator was used to provide accurate timing, generating interrupts at the ECG sampling rate.
This oscillator consumed very little power but sometimes required several seconds to stabilise after application
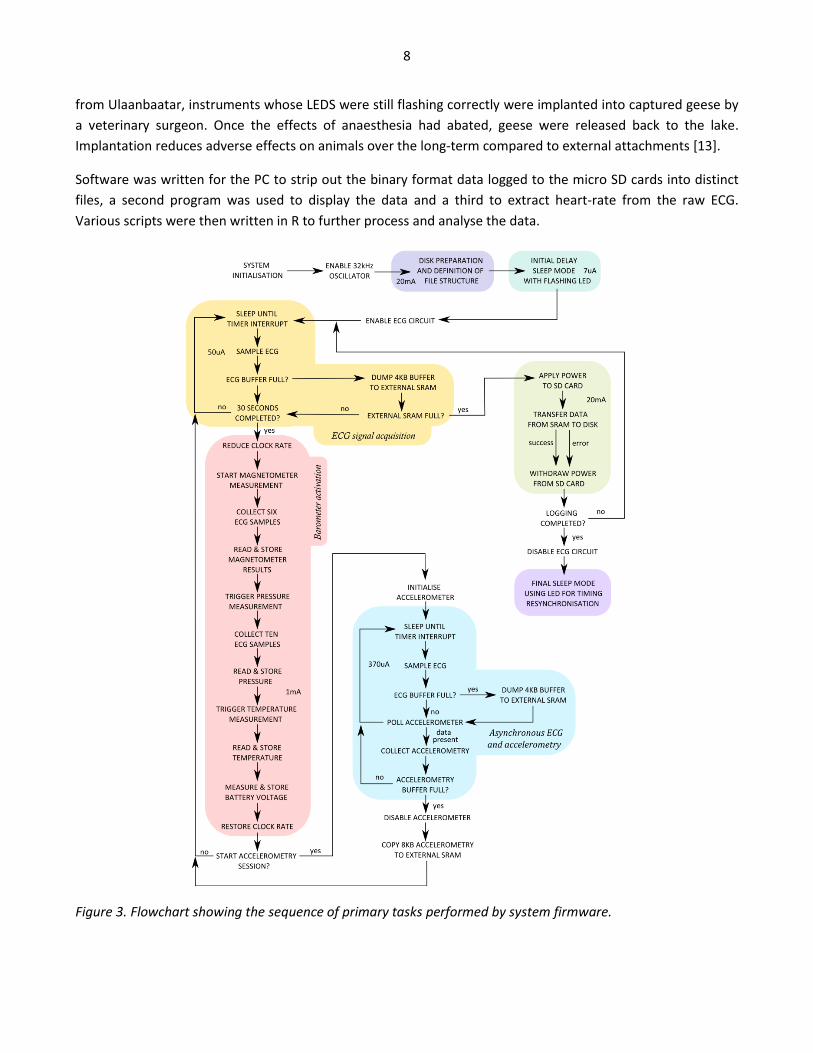
of power. A flowchart for the firmware is provided in Fig.3. Accelerometry was collected when a hardware line
signalled the availability of a new sample. Other measurements were synchronised to the ECG sampling with
various flags and status registers being used to coordinate background operations.
Once the processor was brought out of reset, pin functions and mappings were configured, peripherals were
initialised and time was allowed for the 32kHz oscillator to stabilise. The firmware then proceeded to establish
communications with the micro SD card by first activating the MOSFET powering the card, allowing time for it
to power-up then engaging in preamble. The SD card was then interrogated via an SPI link to ensure that it was
functioning correctly and of the expected type etc. Initial transactions were carried out at a μC clock rate of
1MHz but once the SD card was properly initialised, the μC clock rate was raised to 16MHz using the PLL
allowing the SPI data rate to be increased from 256kb/s to 8Mb/s. The boot records were then read and the
contents of their registers used to determine such things as the number of bytes per sector, sectors per cluster
and number of entries in the root directory. This provided sufficient information to access the file allocation
table (FAT), two copies of which are usually present. Errors can easily arise when one copy is being modified
and power is interrupted, as might happen due to the card being ejected. This sensible precaution, however, is
not true of the root directory, only one copy of which exists. In order to streamline the logging of data,
minimise battery drain and reduce the risk of programming errors, the simplest possible storage arrangement
was used involving writing fresh data to consecutive sectors on the SD card starting from the first available data
sector. This resulted in a particularly simple FAT structure involving a consecutive sequence of incrementing
cluster references until the last cluster of each file was reached. The file organisation in the root directory
reflected this simplicity with a distinct file name being assigned to each consecutive gigabyte of logged data
and no other files, folders or directories being present. For a typical 8GB card (which actually contains 8 billion
bytes rather than 8GB, not all of which is available for data storage) this resulted in seven files of exactly one
GB and an eighth file of size 388 MB. This reduction in capacity was acceptable as the memory requirement for
a full year’s data storage was slightly less than 7GB. In this way, data recovery was extremely straightforward,
involving only removal of the SD card from its holder and insertion into a PC which could directly access the
data in each of the seven relevant files. Disk preparation typically took 60 seconds, including deliberately
inserted delays to reduce the mean current draw from the battery to an acceptable level. This would only
consume approximately 0.04% of the total battery charge.
After the preparation of the SD card, a sleep mode lasting 25 days was entered where the battery drain was
typically reduced to about 6μA. This allowed time for the instruments to be assembled, shipped to Mongolia
and transported 400km to a remote lake. Geese were ushered ashore using a flotilla of kayaks, and corralled
into a net. After ethylene oxide sterilisation and travelling over rough terrain to the catch site 400km remote
8
from Ulaanbaatar, instruments whose LEDS were still flashing correctly were implanted into captured geese by
a veterinary surgeon. Once the effects of anaesthesia had abated, geese were released back to the lake.
Implantation reduces adverse effects on animals over the long-term compared to external attachments [13].
Software was written for the PC to strip out the binary format data logged to the micro SD cards into distinct
files, a second program was used to display the data and a third to extract heart-rate from the raw ECG.
Various scripts were then written in R to further process and analyse the data.
Figure 3. Flowchart showing the sequence of primary tasks performed by system firmware.

9
A speed-optimised subroutine was used to transfer 4KB pages of data quickly to external SRAM. This involved
briefly increasing the μC clock rate from 8MHz to 32MHz and utilising the Parallel Master Port of the μC which
automatically performed the data transfer and the strobing of control signals. Whenever the external RAM
became full, data was written to the SD card in sector bursts by specifying the address of the first sector and
using the write_multiple_sector command. Firmware also kept track of the current sector number for the next
cycle of writing. In this way there was no need to call on library routines for opening, accessing and closing
files, which have additional overheads, and no need to access the FAT or the root directory again after the
initial preparation of the SD card.
Three seconds were typically required to write 1026 KB of data to the SD card, including inserted delays to
reduce mean current drawn from the battery. A μC clock rate of 16MHz was used during data transfer as it
offered superior energy efficiency to the alternative of 32MHz. If any error condition was detected, data
transfer was immediately aborted and logging resumed. This provided a safeguard against momentary loss of
electrical contact due to the mechanical bounce of the fingers within the SD card and also allowed some data
collection to continue when batteries were so discharged as to be incapable of sustaining an output current of
20mA for very long. The external SRAM buffer would refill in 4231.5 seconds (70.525 minutes), collecting
744KB of ECG digitised at 8 bits/sample along with 280KB of 12-bit triaxial accelerometry collected at a nominal
rate of 100Hz in 35 blocks of 8KB spanning approximately 18 seconds each. To conserve memory and reduce
power, pairs of 12 bit triaxial accelerometry samples were packed into packets of 9 bytes prior to being
buffered within internal RAM. Since the sample rate of the accelerometer was not accurately set by the
transducer itself, and drifted a little with time and temperature, the duration of each block of accelerometry in
ECG samples was appended to the accelerometry in the two spare bytes left over after 910 packets of data had
been placed in the 8KB accelerometry buffer. In this way, the true accelerometer sample rate could be
determined to an accuracy of 0.016%. In addition to the data in external SRAM, a 2KB internal RAM allocation
was used to hold raw barometer readings (pressure and temperature) along with magnetometer
measurements. These results were collected every 30 seconds, data being manually clocked out under
firmware control. The μC clock rate was dropped to 1MHz at this time, and fresh measurements took less than
0.1 seconds to collect. This internal buffer also stored calibration registers for the barometer, a battery reading
and an absolute time stamp in units of ECG sampling interruptions since logging began (these interrupts were
always enabled and were assigned a high priority so that they were never skipped, even though the ECG signal
was not sampled during disk writes). This internal RAM buffer was written to the SD card immediately after the
data from external SRAM had been written. A write_multiple_end command then instructed the SD card to
transfer its buffer contents to non-volatile memory. Once this was accomplished, power was withdrawn from
the card whereupon datalogging was resumed.
Discussion
The earliest trans-Himalayan flight recorded by this instrument occurred in late 2010. This system may well
have been the first implantable datalogger design capable of collecting year-round continuous ECG from a
flying animal. To the best of our knowledge, the archival recording of ECG for a full year has never been
attempted before on any animal, although a system relaying beat intervals telemetrically was capable of
operating for several years [14]. The data collected from the present instrument design will allow the long-term
study of avian migration in unprecedented detail. Comparisons will be possible between power estimated from
10
heart-rate combined with knowledge of body and/or heart mass [15] and power estimates obtained purely
from measurements of bodyweight and RMS vibrations collected from a body-mounted accelerometer [16].
Results and findings are currently being prepared for publication elsewhere.
As oxygen consumption is generally proportional to the square of the heart-rate [15], and bar-headed geese
exhibit a large variation in this physiological variable [17], see also Fig.4, their metabolic rate could vary
considerably. The pronghorn antelope (Antilocarpa americana) is adapted to outrun feline predators such as
the now extinct sabre-tooth cat and, to date, has the largest experimentally measured aerobic scope of any
animal [18]. Though a cheetah might be capable of catching this species, it is a specialist sprinter and no match
for the pronghorn on stamina. However, the bar-headed goose may rival the pronghorn both in terms of its
range of metabolic rate and its endurance.
During the first 2009 field trip when GPS systems were first deployed, a preliminary study involved the
implantation of a different instrument recording only body temperature and averages of fifty heart-rate
intervals. Several of those previous generation units were recovered in 2010. Although their ECG electrodes
were of a protruding, silicone-shafted flying-lead design (see [1]), allowing insertion closer to the heart, the
real-time beat detection algorithm was insufficiently robust to reject occasional interference from motion
artefacts and strong electromyographic production during bouts of intense flapping. Performing beat detection
`on the fly’ required the μC to draw a mean current of 100μA or less, severely restricting the sophistication of
real-time signal processing algorithms. Power limitations also prohibited alternative approaches, such as hybrid
processing via some combination of analog and digital circuitry. The recording of raw ECG for extended periods
overcomes any uncertainty regarding the reliability of heart-rate estimates, whether beat-by-beat or time-
averaged [19]. It can therefore enhance the practicality of using heart-rate as the basis for metabolic rate
estimation [6] by allowing heart-rate to be confidently determined even during intense and biologically
interesting episodes of flight, see Fig.4 & Fig.5. It also improves opportunities for beat-by-beat heart-rate
variability assessment [20] and identification of pathological heart conditions/cardiac arrhythmia.
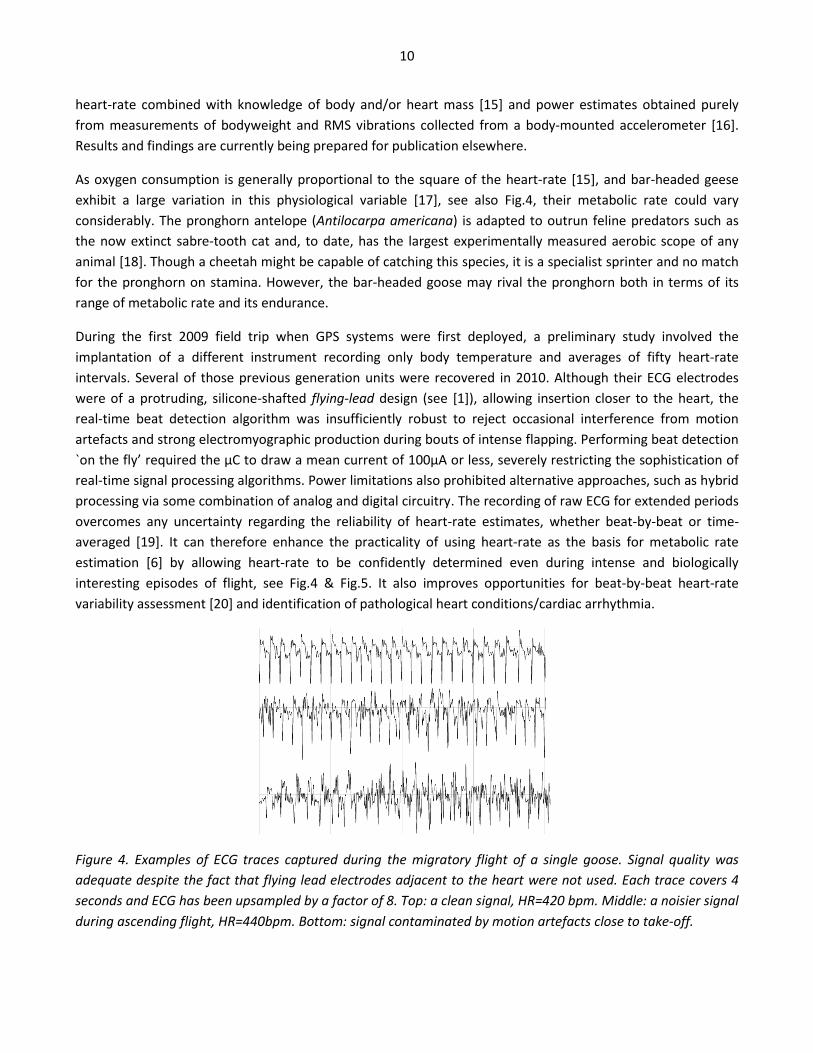
Figure 4. Examples of ECG traces captured during the migratory flight of a single goose. Signal quality was
adequate despite the fact that flying lead electrodes adjacent to the heart were not used. Each trace covers 4
seconds and ECG has been upsampled by a factor of 8. Top: a clean signal, HR=420 bpm. Middle: a noisier signal
during ascending flight, HR=440bpm. Bottom: signal contaminated by motion artefacts close to take-off.
11
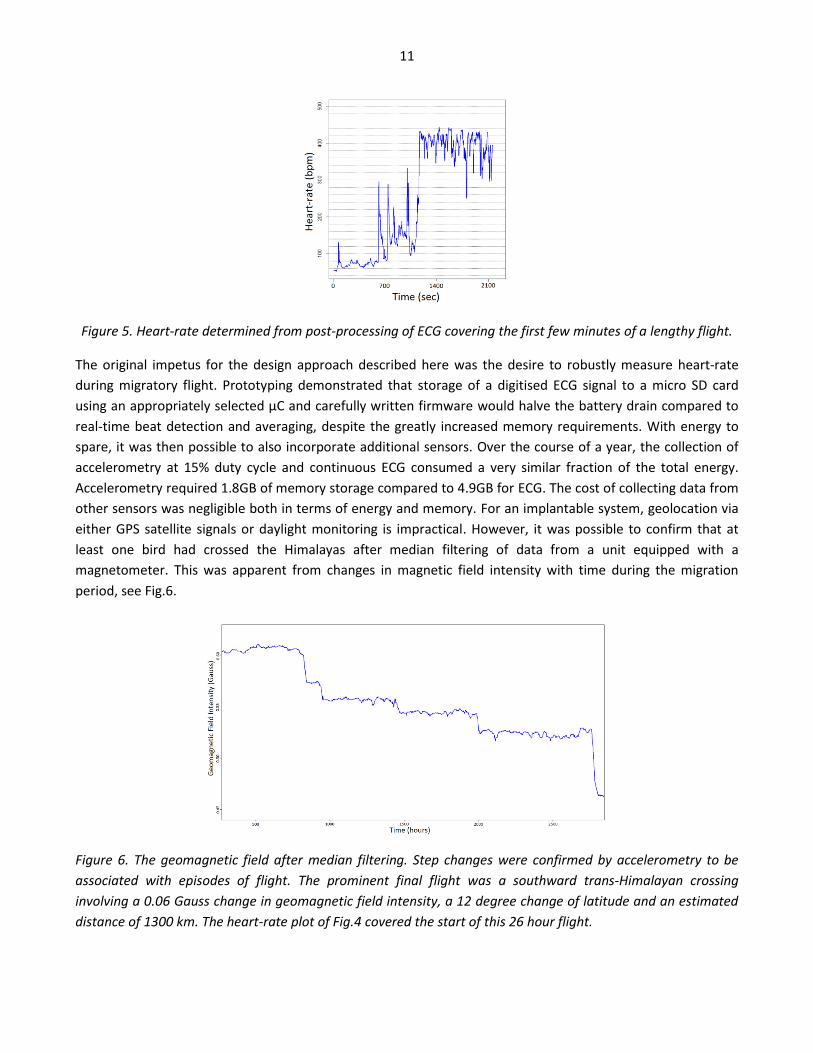
Figure 5. Heart-rate determined from post-processing of ECG covering the first few minutes of a lengthy flight.
The original impetus for the design approach described here was the desire to robustly measure heart-rate
during migratory flight. Prototyping demonstrated that storage of a digitised ECG signal to a micro SD card
using an appropriately selected μC and carefully written firmware would halve the battery drain compared to
real-time beat detection and averaging, despite the greatly increased memory requirements. With energy to
spare, it was then possible to also incorporate additional sensors. Over the course of a year, the collection of
accelerometry at 15% duty cycle and continuous ECG consumed a very similar fraction of the total energy.
Accelerometry required 1.8GB of memory storage compared to 4.9GB for ECG. The cost of collecting data from
other sensors was negligible both in terms of energy and memory. For an implantable system, geolocation via
either GPS satellite signals or daylight monitoring is impractical. However, it was possible to confirm that at
least one bird had crossed the Himalayas after median filtering of data from a unit equipped with a
magnetometer. This was apparent from changes in magnetic field intensity with time during the migration
period, see Fig.6.
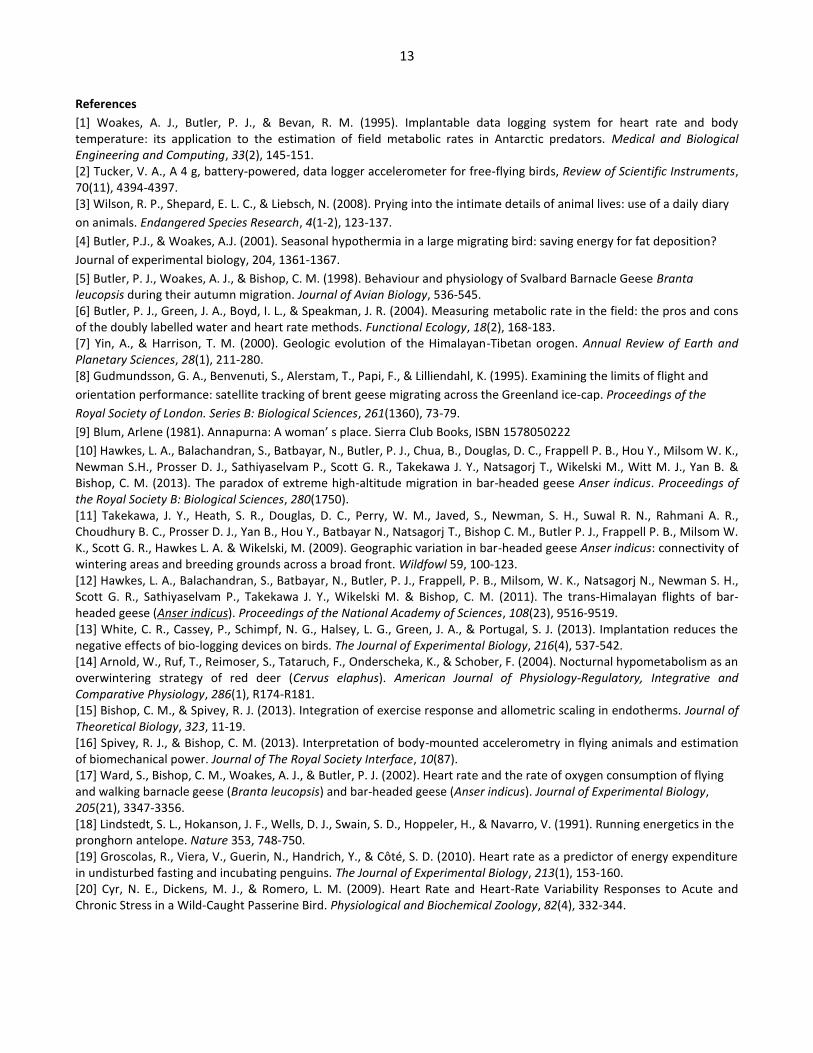
Figure 6. The geomagnetic field after median filtering. Step changes were confirmed by accelerometry to be
associated with episodes of flight. The prominent final flight was a southward trans-Himalayan crossing
involving a 0.06 Gauss change in geomagnetic field intensity, a 12 degree change of latitude and an estimated
distance of 1300 km. The heart-rate plot of Fig.4 covered the start of this 26 hour flight.

12
A conscious decision was taken early on to monitor the year-round activity of bar-headed geese as opposed to
focusing only on episodes of flight. However, the acceleration spectrum of flight and non-flight exhibits a
strong dichotomy. In principle, this could have allowed for the intelligent collection of data during flight only.
Indeed, the firmware of this instrument has already been modified to do so and successfully deployed on
several neck collars for Mongolian Swans in the 2012/2013 season. For strength and UV resistance, a durable
opaque thermoplastic was used for the housing, Fig.7. Power at frequencies associated with the flapping of the
wings was estimated using a computationally efficient time-domain technique operating on short bursts of
accelerometry spanning several wing-beats. This proved very effective, enabling accelerometry to be collected
during flights with an acceptably small latency at the commencement of flight activity. The potential
advantages are apparent since, when flight can be efficiently discerned, both memory storage and battery
requirements can be reduced by an order of magnitude or more, dependent on the species under study. This
offers a very promising approach towards the reduction of size, weight and power requirements whilst
collecting high resolution flight data with improved coverage, thus minimising the burden and potential impact
to free-ranging birds during long-term experimental work.
Figure 7. Loggers within rugged housings were strapped and bonded to neck collars, internally lined here with
foam strips in an attempt to improve coupling of flight movements from the neck to the accelerometer. These
units were deployed on swans to collect accelerometry, temperature and altitude measurements.
Acknowledgements
We would like to thank our Mongolian colleagues who participated in the fieldwork and in particular
Nyambayar Batbayar and Tseveenmyaday Natsagdorj for securing the necessary authorisation. The support of
various colleagues from the University of British Columbia, the United Nations Food and Agriculture Program,
the US Geological Survey, the University of Tasmania and the University of Birmingham is gratefully
appreciated. Particular thanks are due to Bev Chua DVM, who led the surgical team.
Funding.
This work was supported by Bangor University and BBSRC grant BB/F015615/1 awarded to Dr C. M. Bishop and
Prof P. J. Butler.
13
References
[1] Woakes, A. J., Butler, P. J., & Bevan, R. M. (1995). Implantable data logging system for heart rate and body temperature: its application to the estimation of field metabolic rates in Antarctic predators. Medical and Biological Engineering and Computing, 33(2), 145-151. [2] Tucker, V. A., A 4 g, battery-powered, data logger accelerometer for free-flying birds, Review of Scientific Instruments, 70(11), 4394-4397. [3] Wilson, R. P., Shepard, E. L. C., & Liebsch, N. (2008). Prying into the intimate details of animal lives: use of a daily diary
on animals. Endangered Species Research, 4(1-2), 123-137.
[4] Butler, P.J., & Woakes, A.J. (2001). Seasonal hypothermia in a large migrating bird: saving energy for fat deposition?
Journal of experimental biology, 204, 1361-1367.
[5] Butler, P. J., Woakes, A. J., & Bishop, C. M. (1998). Behaviour and physiology of Svalbard Barnacle Geese Branta leucopsis during their autumn migration. Journal of Avian Biology, 536-545. [6] Butler, P. J., Green, J. A., Boyd, I. L., & Speakman, J. R. (2004). Measuring metabolic rate in the field: the pros and cons of the doubly labelled water and heart rate methods. Functional Ecology, 18(2), 168-183. [7] Yin, A., & Harrison, T. M. (2000). Geologic evolution of the Himalayan-Tibetan orogen. Annual Review of Earth and Planetary Sciences, 28(1), 211-280. [8] Gudmundsson, G. A., Benvenuti, S., Alerstam, T., Papi, F., & Lilliendahl, K. (1995). Examining the limits of flight and
orientation performance: satellite tracking of brent geese migrating across the Greenland ice-cap. Proceedings of the
Royal Society of London. Series B: Biological Sciences, 261(1360), 73-79.
[9] Blum, Arlene (1981). Annapurna: A woman’ s place. Sierra Club Books, ISBN 1578050222
[10] Hawkes, L. A., Balachandran, S., Batbayar, N., Butler, P. J., Chua, B., Douglas, D. C., Frappell P. B., Hou Y., Milsom W. K., Newman S.H., Prosser D. J., Sathiyaselvam P., Scott G. R., Takekawa J. Y., Natsagorj T., Wikelski M., Witt M. J., Yan B. & Bishop, C. M. (2013). The paradox of extreme high-altitude migration in bar-headed geese Anser indicus. Proceedings of the Royal Society B: Biological Sciences, 280(1750). [11] Takekawa, J. Y., Heath, S. R., Douglas, D. C., Perry, W. M., Javed, S., Newman, S. H., Suwal R. N., Rahmani A. R., Choudhury B. C., Prosser D. J., Yan B., Hou Y., Batbayar N., Natsagorj T., Bishop C. M., Butler P. J., Frappell P. B., Milsom W. K., Scott G. R., Hawkes L. A. & Wikelski, M. (2009). Geographic variation in bar-headed geese Anser indicus: connectivity of wintering areas and breeding grounds across a broad front. Wildfowl 59, 100-123. [12] Hawkes, L. A., Balachandran, S., Batbayar, N., Butler, P. J., Frappell, P. B., Milsom, W. K., Natsagorj N., Newman S. H., Scott G. R., Sathiyaselvam P., Takekawa J. Y., Wikelski M. & Bishop, C. M. (2011). The trans-Himalayan flights of bar-headed geese (Anser indicus). Proceedings of the National Academy of Sciences, 108(23), 9516-9519. [13] White, C. R., Cassey, P., Schimpf, N. G., Halsey, L. G., Green, J. A., & Portugal, S. J. (2013). Implantation reduces the negative effects of bio-logging devices on birds. The Journal of Experimental Biology, 216(4), 537-542. [14] Arnold, W., Ruf, T., Reimoser, S., Tataruch, F., Onderscheka, K., & Schober, F. (2004). Nocturnal hypometabolism as an overwintering strategy of red deer (Cervus elaphus). American Journal of Physiology-Regulatory, Integrative and Comparative Physiology, 286(1), R174-R181. [15] Bishop, C. M., & Spivey, R. J. (2013). Integration of exercise response and allometric scaling in endotherms. Journal of Theoretical Biology, 323, 11-19. [16] Spivey, R. J., & Bishop, C. M. (2013). Interpretation of body-mounted accelerometry in flying animals and estimation of biomechanical power. Journal of The Royal Society Interface, 10(87). [17] Ward, S., Bishop, C. M., Woakes, A. J., & Butler, P. J. (2002). Heart rate and the rate of oxygen consumption of flying and walking barnacle geese (Branta leucopsis) and bar-headed geese (Anser indicus). Journal of Experimental Biology, 205(21), 3347-3356. [18] Lindstedt, S. L., Hokanson, J. F., Wells, D. J., Swain, S. D., Hoppeler, H., & Navarro, V. (1991). Running energetics in the pronghorn antelope. Nature 353, 748-750. [19] Groscolas, R., Viera, V., Guerin, N., Handrich, Y., & Côté, S. D. (2010). Heart rate as a predictor of energy expenditure in undisturbed fasting and incubating penguins. The Journal of Experimental Biology, 213(1), 153-160. [20] Cyr, N. E., Dickens, M. J., & Romero, L. M. (2009). Heart Rate and Heart‐Rate Variability Responses to Acute and Chronic Stress in a Wild‐Caught Passerine Bird. Physiological and Biochemical Zoology, 82(4), 332-344.