Ancient Local Evolution of African mtDNA Haplogroups in Tunisian Berber Populations
19
Ancient Local Evolution of African mtDNA Haplogroups in Tunisian Berber Populations Sabeh Frigi Lotfi Cherni Karima Fadhlaoui-zid Amel Benammar-Elgaaied Human Biology, Volume 82, Number 4, August 2010, pp. 367-384 (Article) Published by Wayne State University Press For additional information about this article Access Provided by your local institution at 03/21/11 3:07PM GMT http://muse.jhu.edu/journals/hub/summary/v082/82.4.frigi.html
-
Upload
independent -
Category
Documents
-
view
1 -
download
0
Transcript of Ancient Local Evolution of African mtDNA Haplogroups in Tunisian Berber Populations

Ancient Local Evolution of African mtDNA Haplogroups in TunisianBerber Populations
Sabeh FrigiLotfi CherniKarima Fadhlaoui-zidAmel Benammar-Elgaaied
Human Biology, Volume 82, Number 4, August 2010, pp. 367-384 (Article)
Published by Wayne State University Press
For additional information about this article
Access Provided by your local institution at 03/21/11 3:07PM GMT
http://muse.jhu.edu/journals/hub/summary/v082/82.4.frigi.html
Ancient Local Evolution of African mtDNA Haplogroups in Tunisian Berber Populations
Sabeh Frigi,1 Lotfi Cherni,1 Karima Fadhlaoui-zid,1 and Amel Benammar-Elgaaied1
Abstract Our objective is to highlight the age of sub-Saharan gene flows in North Africa and particularly in Tunisia. Therefore we analyzed in a broad phylogeographic context sub-Saharan mtDNA haplogroups of Tunisian Ber-ber populations considered representative of ancient settlement. More than 2,000 sequences were collected from the literature, and networks were con-structed. The results show that the most ancient haplogroup is L3*, which would have been introduced to North Africa from eastern sub-Saharan pop-ulations around 20,000 years ago. Our results also point to a less ancient western sub-Saharan gene flow to Tunisia, including haplogroups L2a and L3b. This conclusion points to an ancient African gene flow to Tunisia before 20,000 BP. These findings parallel the more recent findings of both archaeol-ogy and linguistics on the prehistory of Africa. The present work suggests that sub-Saharan contributions to North Africa have experienced several com-plex population processes after the occupation of the region by anatomically modern humans. Our results reveal that Berber speakers have a foundational biogeographic root in Africa and that deep African lineages have continued to evolve in supra-Saharan Africa.
Modern human settlement in North Africa has been suggested by different in-vestigators. The early culture identified by paleontologists, the Aterian, is an industry based mostly on flakes, with Levallois operative systems, plus scrap-ers and denticulated and racloir tools. The Aterian culture also has some Upper Paleolithic–like tools: some scraper types, burins, biface leaf-like pieces, and the characteristic back-tipped tools. The Aterian industry was named after the type site, Bir el Ater, located in northwestern Africa in Tunisia. The earliest Aterian sites are believed to be well over 40,000 years old.
During the terminal Paleolithic period, North Africa experienced the Ibero-Maurusian culture, which was characterized by a great many small-backed blades and, unlike the Capsian culture, an absence of burins (a sort of chisel, probably used
1Laboratory of Molecular Genetics, Immunology, and Human Pathology, Faculty of Sciences of Tunis, Uni-versity El Manar, 2092 Tunis, Tunisia.
The first two authors contributed equally to this paper.
Human Biology, August 2010, v. 82, no. 4, pp. 367–384.Copyright © 2010 Wayne State University Press, Detroit, Michigan 48201–1309
Key words: North Africa, Tunisian Berbers, sub-Saharan haplo-groups, mtDNA.
368 / frigi et al.
for working wood). The Ibero-Maurusian culture was thought to have emerged either as a result of the migration of Cro-Magnon people from the Iberian Penin-sula, hence the name, or from the local Aterian culture. Ibero-Maurusian culture existed between 10,120 and 8,550 BC. Subsequent study suggests that the Ibero-Maurusian industry is derived from a Nile River valley culture known as Halfan, which dates from about 17,000 BC. The Ibero-Maurusian people belonged to the Mechtoid anthropological type. The Mechta-Afalou, or Mechtoid, are an extinct people of North Africa. Mechtoids inhabited northern Africa during the late Pa-leolithic and Mesolithic (Ibero-Maurusian archaeological culture).
In the Holocene, North Africa is characterized by Capsian culture, which is a culture of the eastern Maghreb (eastern Algeria and west-central Tunisia). This culture is developed in situ in the Maghreb. It was defined in 1909 with the ex-cavation of the site of El-Mekta, located near Gafsa (formerly Capsa) in Tunisia. Typological studies have highlighted two principal subdivisions: the Typical Cap-sian and the Upper Capsian. The Typical Capsian is characterized by large tools; the bone industry is poor and fragmentary. The Upper Capsian is characterized by a reduced number of large tools, the development of geometric microliths (sca-lene triangles and trapezoids), and a rich bone industry. Rahmani (2004) studied the controversy surrounding the chronological interpretation of the two subdivi-sions of a North African epi-Paleolithic culture. Although originally defined as two evolutionary phases on the basis of stratigraphy, with the development of absolute dating methods, the two subdivisions are now considered contemporane-ous. A new approach to the lithic technology of collections from the “classic” sites of Bortal Fakher, El-Mekta, Relilai, and Ain Dokkara allowed Rahmani to rede-fine the industry and the traditional chronology. Around 8000 BP, a technological change occurred, corresponding to an environmental shift, and this change called into question the contemporaneity of the Typical and Upper Capsian.
In North Africa the presence of Berbers since the Capsian (10,000–6,000 years ago) has been well described (Rahmani 2004). They are considered the pu-tative descendants of the early inhabitants of northwest Africa (Newman 1995). The social structure of the Berbers is tribal. Most Berber tribes currently have men as heads of the tribe. Their main activity is sedentary agriculture, which they carry out in mountains and valleys. But their long-recorded influence in trading in the region is also well known. They were the first to open the commercial routes be-tween Western Africa and sub-Saharan Africa. They were responsible for bringing goods from beyond the Sahara Desert to northern African cities.
Anatomically modern humans arose first in Africa (Crevecoeur et al. 2009). Craniometric studies in North Africa have revealed several more or less complete crania of modern type that date to between about 40,000 and 20,000 years (from Dar es Soltan, Morocco; and Nazlet Khater and Wadi Kubbaniya). The specimens from Nazlet Khater studied by Crevecoeur et al. (2009) were shown to be different from those of Pestera Cu Oase (Romania) and Hofmeyer (South Africa). But this obser-vation provides a glimpse into late Pleistocene human phenotypic diversity. The study of Crevecoeur et al. (2009) is compatible with the suggestion from genetic

mtDNA Haplogroups in Tunisian Berbers / 369
studies that living humans represent only a restricted part of past modern human variation (Excoffier 2002; Fagundes et al. 2007; Marth et al. 2003; Underhill et al. 2000). Certainly the European and North African Upper Paleolithic samples appear to exhibit greater craniometric variability than recent human samples.
Furthermore, historical sources and archaeological data predict significant population variability in mid-Holocene northern Africa. Multivariate analyses of crania demonstrate wide variation but also suggest an indigenous craniometric pattern common to both Late Dynastic northern Egypt and the coastal Maghreb region (Keita 1990). Both tropical African and European metric phenotypes as well as intermediate patterns are found in mid-Holocene Maghreb sites. Early southern Predynastic Egyptian crania show tropical African affinities, displaying craniometric trends that differ notably from the coastal northern African pattern. The various craniofacial patterns discernible in northern Africa are attributable to the agents of microevolution and migration.
Data obtained during an ongoing dental investigation of African popula-tions address two long-standing, hotly debated questions. First, was there genetic continuity between late Pleistocene Ibero-Maurusians and later northwest Afri-cans (e.g., Capsians, Berbers, Guanche)? Second, were skeletally robust Ibero- Maurusians and northeast African Nubians variants of the same population? Irish (2000) statistically compared Ibero-Maurusians from Taforalt in Morocco and Afalou-Bou-Rhummel in Algeria, Nubians from Jebel Sahaba in Sudan, post-Pleistocene Capsians from Algeria and Tunisia, and a series of other samples using 29 discrete dental traits to help estimate diachronic local and regional affinities. The results revealed a relationship between the Ibero-Maurusians, particularly those from Taforalt, and later Maghreb and other North African samples. The re-sults also demonstrated a divergence among contemporaneous Ibero-Maurusians and Nubian samples. Thus some measure of long-term population continuity in the Maghreb and surrounding region is supported.
Moreover, the origin of the Berber people has not been clearly established. Many studies have attempted to describe the genetic structure of Tunisian Ber-ber populations using mitochondrial DNA (mtDNA) (Cherni et al. 2005, 2008; Ennafaa et al. 2009; Fadhlaoui-Zid et al. 2004; Frigi et al. 2006; Yacoubi et al. 2006). These studies have demonstrated a significant component of wider Asian and European distribution, particularly haplogroups H and T. The first large-scale fine characterization of Tunisian H lineages clarifies that the post–Last Glacial Maximum expansion based in Iberia led to Berber settlement not only in Europe but also in North Africa (Cherni et al. 2008; Ennafaa et al. 2009). Thus given the geographic proximity of Iberia and the Maghreb and given additional archaeolog-ical evidence for closeness between some cultures, such as the Ibero-Maurusian and Capsian (Newman 1995), Iberia could have contributed some lineages to the North African pool during the post–Last Glacial Maximum expansion or later.
Interestingly, these studies have also brought out the presence at significant frequencies of African mtDNA haplogroups in Tunisian Berbers. Based on these observations, the purpose of this study is to analyze for the first time African

370 / frigi et al.
haplogroups in Berber populations in a broad phylogeographic context, in particu-lar, through a comparison with population groups from the Saharan areas (Table 1), in order to determine their age and their local evolution. Our objective is to date the African contribution to Tunisian Berbers and to North African popula-tions by analyzing mtDNA sequences of isolated Berber populations who could be considered representative of ancient Berber populations. Our results should be compared with archaeological, linguistic, and ecological data to determine the African background of North African populations.
Materials and Methods
On the basis of the HVSI sequences of mtDNA corresponding to nucleotide positions 16024–16383 and established for different African populations (Table 1 and Figure 1), sub-Saharan haplogroups have been identified by taking into account characteristic polymorphic sites for each haplogroup (Côrte-Réal et al. 1996; Macaulay et al. 1999; Torroni et al. 2000). The number and the sequences of the different haplotypes within each haplogroup have been established in the Tunisian Berber populations. For sub-Saharan haplogroups displaying several haplotypes in Tunisia, we performed a phylogenetic analysis.
Relationships between haplotypes belonging to the same haplogroup were estimated using median-joining networks (http:www.fluxus-engineering.com). We used network methods based on parsimony to display the variation within specific mtDNA clusters, compiled from the worldwide mtDNA database. To this end, we generated the median-joining network from the sequences of each cluster. In all analyses, transversions were twice as frequent (2 times the weight versus unit weight for all other mutations).
The age of clusters or expansions was calculated as the mean divergence φ from inferred ancestral sequence types (Morral et al. 1994) and was converted into time by assuming that one transition within nucleotide positions 16090–16365 corresponds to 20,180 years (Forster et al. 1996).
Results
Frequency and Diversity of Sub-Saharan Haplogroups in Tunisian Berber Populations. The mtDNA data of Tunisian Berber populations shows a mosaic composition of sub-Saharan haplogroups, especially for the Kesra, Sned, and Sej-nane populations (Table 2). The Sned population presents the highest number and most diversified sub-Saharan haplogroups (Table 3). It is remarkable that the Tak-rouna population bears a lower mtDNA frequency of sub-Saharan haplogroups and presents a lower diversity than the other Berber populations of Tunisia.
Some haplotypes in haplogroups L1b1, L3b1, M1, and N1b are shared be-tween some Tunisian Berber populations. This result indicates ancestral relation-ships between these communities. All the sub-Saharan haplogroups found present unique haplotypes. Among the studied haplogroups, 10 present only 1 haplotype
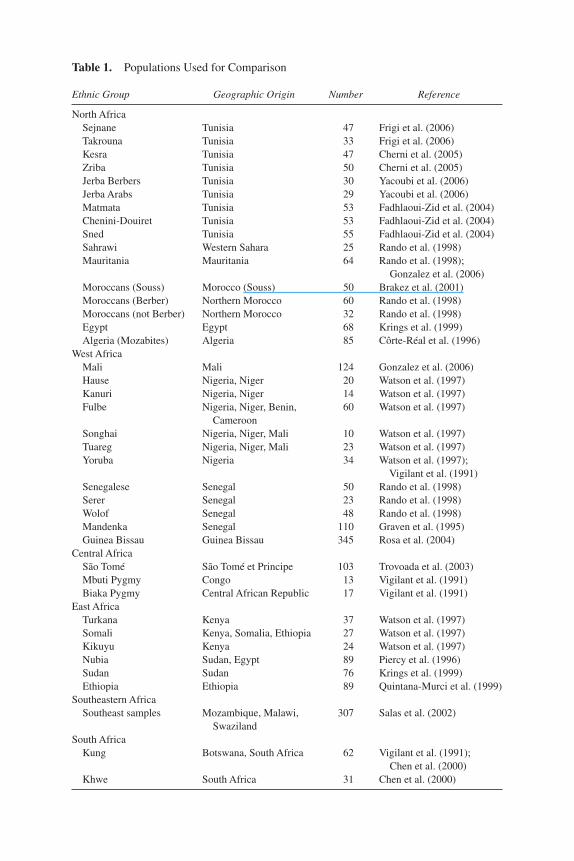
Table 1. Populations Used for Comparison
Ethnic Group Geographic Origin Number Reference
North AfricaSejnane Tunisia 47 Frigi et al. (2006)Takrouna Tunisia 33 Frigi et al. (2006)Kesra Tunisia 47 Cherni et al. (2005)Zriba Tunisia 50 Cherni et al. (2005)Jerba Berbers Tunisia 30 Yacoubi et al. (2006)Jerba Arabs Tunisia 29 Yacoubi et al. (2006)Matmata Tunisia 53 Fadhlaoui-Zid et al. (2004)Chenini-Douiret Tunisia 53 Fadhlaoui-Zid et al. (2004)Sned Tunisia 55 Fadhlaoui-Zid et al. (2004)Sahrawi Western Sahara 25 Rando et al. (1998)Mauritania Mauritania 64 Rando et al. (1998); Gonzalez et al. (2006)Moroccans (Souss) Morocco (Souss) 50 Brakez et al. (2001)Moroccans (Berber) Northern Morocco 60 Rando et al. (1998)Moroccans (not Berber) Northern Morocco 32 Rando et al. (1998)Egypt Egypt 68 Krings et al. (1999)Algeria (Mozabites) Algeria 85 Côrte-Réal et al. (1996)
West AfricaMali Mali 124 Gonzalez et al. (2006)Hause Nigeria, Niger 20 Watson et al. (1997)Kanuri Nigeria, Niger 14 Watson et al. (1997)Fulbe Nigeria, Niger, Benin, 60 Watson et al. (1997) CameroonSonghai Nigeria, Niger, Mali 10 Watson et al. (1997)Tuareg Nigeria, Niger, Mali 23 Watson et al. (1997)Yoruba Nigeria 34 Watson et al. (1997); Vigilant et al. (1991)Senegalese Senegal 50 Rando et al. (1998)Serer Senegal 23 Rando et al. (1998)Wolof Senegal 48 Rando et al. (1998)Mandenka Senegal 110 Graven et al. (1995)Guinea Bissau Guinea Bissau 345 Rosa et al. (2004)
Central Africa São Tomé São Tomé et Principe 103 Trovoada et al. (2003)Mbuti Pygmy Congo 13 Vigilant et al. (1991)Biaka Pygmy Central African Republic 17 Vigilant et al. (1991)
East Africa Turkana Kenya 37 Watson et al. (1997)Somali Kenya, Somalia, Ethiopia 27 Watson et al. (1997)Kikuyu Kenya 24 Watson et al. (1997)Nubia Sudan, Egypt 89 Piercy et al. (1996)Sudan Sudan 76 Krings et al. (1999)Ethiopia Ethiopia 89 Quintana-Murci et al. (1999)
Southeastern AfricaSoutheast samples Mozambique, Malawi, 307 Salas et al. (2002) Swaziland
South AfricaKung Botswana, South Africa 62 Vigilant et al. (1991); Chen et al. (2000)Khwe South Africa 31 Chen et al. (2000)
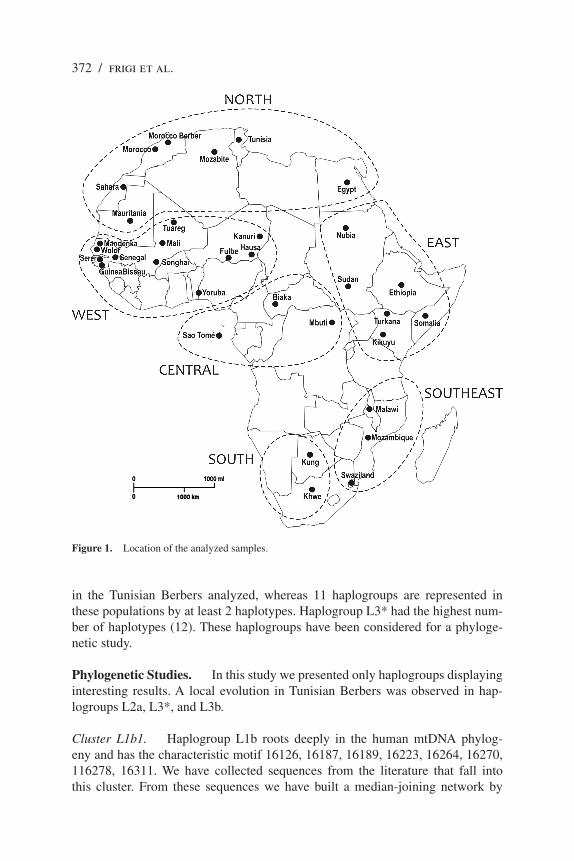
372 / frigi et al.
in the Tunisian Berbers analyzed, whereas 11 haplogroups are represented in these populations by at least 2 haplotypes. Haplogroup L3* had the highest num-ber of haplotypes (12). These haplogroups have been considered for a phyloge-netic study.
Phylogenetic Studies. In this study we presented only haplogroups displaying interesting results. A local evolution in Tunisian Berbers was observed in hap-logroups L2a, L3*, and L3b.
Cluster L1b1. Haplogroup L1b roots deeply in the human mtDNA phylog-eny and has the characteristic motif 16126, 16187, 16189, 16223, 16264, 16270, 116278, 16311. We have collected sequences from the literature that fall into this cluster. From these sequences we have built a median-joining network by
Figure 1. Location of the analyzed samples.
mtDNA Haplogroups in Tunisian Berbers / 373
specifying the transversion at np 16114 and the deletion at np 16166 (Rando et al. 1998). The populations are scattered over the network; six nodes are shared be-tween sub-Saharan and northwest African populations. The structure of the net-work can roughly be described as a double star with one of the centers being the ancestral haplotype. These nodes are separated at np 16293 (transition), testifying to an expansion event that involved both central sequence types. The age of this expansion is calculated as 16,000 years.
Haplogroup L1b1 was observed in three populations in Tunisia (Sejnane, Kesra, and Sned) with frequencies ranging from 5.7 in Sned to 8.51 in Kesra. There are three different haplotypes. Two unique haplotypes were found in the Sejnane population, and the other haplotype had the motif 126, 187, 189, 223, 264, 270, 278, 293, 311 shared between the Sejnane, Kesra, and Sned populations. This haplotype is also shared with a Moroccan and a Mauritanian. Among the two haplotypes that were unique in Tunisia, the one having the motif 187, 189, 223, 264, 270, 278, 293, 311 is shared with a Mauritanian and constitutes an intermedi-ate evolutionary form between the ancestral haplotype and a haplotype found in western Africa.
The three haplotypes encountered in Tunisia are highly divergent, indicat-ing the lack of a local evolution of haplogroup L1b1 in Tunisia and North Africa in general.
Haplogroup L2a. Haplogroup L2 is commonly subdivided into four main clades, L2a through L2d (Chen et al. 2000; Pereira et al. 2000; Torroni et al. 2000). Most Tunisian sequences belong to haplogroup L2a, the most frequent and wide-spread mtDNA cluster in Africa. The network reveals five nodes that are shared between West African and northwest African populations. The L2a haplogroup was observed in five populations in Tunisia (Sejnane, Kesra, Sned, Matmata, and Chenini-Douiret) with frequencies varying from 1.9 in Sned and Chenini-Douiret to 16.96 in Kesra. There were eight different haplotypes, and all were unique. Most of these haplotypes are phylogenetically divergent, indicating unrelated in-troduction to Tunisian populations from western or eastern sub-Saharan popula-tions. Indeed, taking into account the Tunisian sequences belonging to haplogroup L2a from Sejnane, Zriba, Kesra, Matmata, Sned, and Chenini-Douiret, we obtain a divergence age of about 28,000 ± 8,900 years, which is the same age calculated for this haplogroup including all the described sequences. However, we noticed two pairs of related haplotypes in the Kesra population, where we detected a local evolution of the L2a cluster, suggesting that this haplogroup could have been in-troduced earlier in Kesra.
Haplogroup L3*. The lineages within haplogroup L3* represent 20% of all L3A types in Africa (Salas et al. 2002). Although they are distributed throughout the continent, they reach the highest frequencies in East Africa, where they ac-count for about half of all types from this region. Haplogroup L3* is widespread in Tunisian populations—Sejnane, Kesra, Sned, and Matmata—with frequencies

374 / frigi et al.
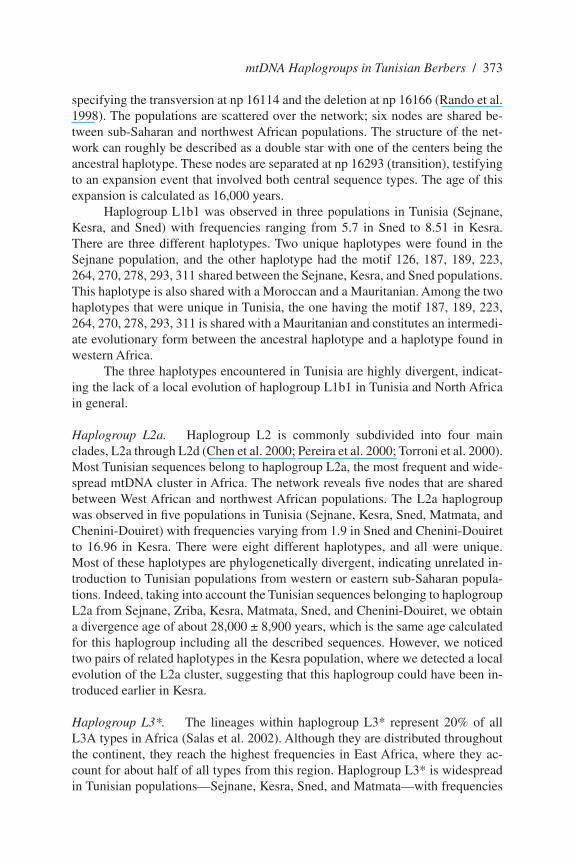
Table 2. Distribution and Frequencies of Sub-Saharan Haplogroups in Tunisian Berber Populations
Haplogroup Frequency Haplotype Number per Haplogroup
Shared Shared Chenini- Jerba Haplotypes Haplotypes Total Sejnane Takrouna Sned Douiret Matmata Kesra Berbers Unique Between Two Between Three Number of Haplogroup (N = 47) (N = 33) (N = 53) (N = 53) (N = 49) (N = 47) (N = 30) Haplotypes Populations Populations Haplotypes
L1b* – – – – 2 – – 1 (Matmata) – – 1L1b1 6.4 – 5.7 – – 8.51 – 2 (Sejnane) – 1 (Sejnane, Kesra, Sned) 3L1c1 – – – 3.8 – – – 1 (Chenini-Douiret) – – 1L2* – – 1.9 – – – – 1 (Sned) – – 1L1a – – – – 2.1 – 1 (Kesra) – – 1L2a 2.2 – 1.9 1.9 2 16.96 – 1 (Sejnane) – – 8 4 (Kesra) 1 (Chenini-Douiret) 1 (Sned) 1 (Matmata)L2a1 8.5 – 3.8 – – – – 1 (Sned) – – 4 3 (Sejnane)L2a1a – – 3.8 1.9 2 – – 2 (Sned) 1 (Matmata, Chenini-Douiret) – 3 L2d2 – – – – – 1 1 (Jerba Berber) – – 1L3* 8.5 – 1.9 – 16.3 6.38 – 1 (Kesra) – – 12 4 (Sejnane) 6 (Matmata) 1 (Sned)L3b – – 3.8 3.8 – – – 2 (Sned) – – 3 1 (Chenini-Douiret)L3b1 – – 1.9 – – – 1 1 (Sned) – – 2 1 (Jerba Berber)L3d – – – – 2 – – 1 (Matmata) – – 1L3d1 2.2 – – – – – 1 (Sejnane) – – 1L3e1a – – – – – 1 1 (Jerba Berber) – – 1L3e1b – 3.1 – – – – 1 (Takrouna) – – 1L3e2 – – 1.9 – – 10.63 – 1 (Sned) – – 3 2 (Kesra)L3f 4.2 – – 1.9 – – 1 1 (Sejnane) – 1 (Sejnane, Chenini-Douiret, 2 Jerba Berber)M 1 1 (Jerba Berber) – – 1M1 – – 11.3 – 2 4.2 – 1 (Kesra) – 1 (Kesra, Sned, Matmata) 2N1b – – – 1.9 8.2 – – 1 (Matmata) 1 (Matmata, Chenini-Douiret) – 2I2 – – 7.5 – – – – 2 (Sned) – – 2H1 – – – – – 2.1 – 1 (Kesra) – – 2H 23.4 72.7 – – – 27.5 7 5 (Sejnane) – 1 (Sejnane, Takrouna, Kesra, 17 Jerba Berber) 3 (Takrouna) 4 (Kesra) 4 (Jerba Berber)Pre-HV – – 5.7 – – – – 2 (Sned) – – 2HV – – – 15.1 – – – 4 (Chenini-Douiret) – – 4
mtDNA Haplogroups in Tunisian Berbers / 375
Table 2. Distribution and Frequencies of Sub-Saharan Haplogroups in Tunisian Berber Populations
Haplogroup Frequency Haplotype Number per Haplogroup
Shared Shared Chenini- Jerba Haplotypes Haplotypes Total Sejnane Takrouna Sned Douiret Matmata Kesra Berbers Unique Between Two Between Three Number of Haplogroup (N = 47) (N = 33) (N = 53) (N = 53) (N = 49) (N = 47) (N = 30) Haplotypes Populations Populations Haplotypes
L1b* – – – – 2 – – 1 (Matmata) – – 1L1b1 6.4 – 5.7 – – 8.51 – 2 (Sejnane) – 1 (Sejnane, Kesra, Sned) 3L1c1 – – – 3.8 – – – 1 (Chenini-Douiret) – – 1L2* – – 1.9 – – – – 1 (Sned) – – 1L1a – – – – 2.1 – 1 (Kesra) – – 1L2a 2.2 – 1.9 1.9 2 16.96 – 1 (Sejnane) – – 8 4 (Kesra) 1 (Chenini-Douiret) 1 (Sned) 1 (Matmata)L2a1 8.5 – 3.8 – – – – 1 (Sned) – – 4 3 (Sejnane)L2a1a – – 3.8 1.9 2 – – 2 (Sned) 1 (Matmata, Chenini-Douiret) – 3 L2d2 – – – – – 1 1 (Jerba Berber) – – 1L3* 8.5 – 1.9 – 16.3 6.38 – 1 (Kesra) – – 12 4 (Sejnane) 6 (Matmata) 1 (Sned)L3b – – 3.8 3.8 – – – 2 (Sned) – – 3 1 (Chenini-Douiret)L3b1 – – 1.9 – – – 1 1 (Sned) – – 2 1 (Jerba Berber)L3d – – – – 2 – – 1 (Matmata) – – 1L3d1 2.2 – – – – – 1 (Sejnane) – – 1L3e1a – – – – – 1 1 (Jerba Berber) – – 1L3e1b – 3.1 – – – – 1 (Takrouna) – – 1L3e2 – – 1.9 – – 10.63 – 1 (Sned) – – 3 2 (Kesra)L3f 4.2 – – 1.9 – – 1 1 (Sejnane) – 1 (Sejnane, Chenini-Douiret, 2 Jerba Berber)M 1 1 (Jerba Berber) – – 1M1 – – 11.3 – 2 4.2 – 1 (Kesra) – 1 (Kesra, Sned, Matmata) 2N1b – – – 1.9 8.2 – – 1 (Matmata) 1 (Matmata, Chenini-Douiret) – 2I2 – – 7.5 – – – – 2 (Sned) – – 2H1 – – – – – 2.1 – 1 (Kesra) – – 2H 23.4 72.7 – – – 27.5 7 5 (Sejnane) – 1 (Sejnane, Takrouna, Kesra, 17 Jerba Berber) 3 (Takrouna) 4 (Kesra) 4 (Jerba Berber)Pre-HV – – 5.7 – – – – 2 (Sned) – – 2HV – – – 15.1 – – – 4 (Chenini-Douiret) – – 4
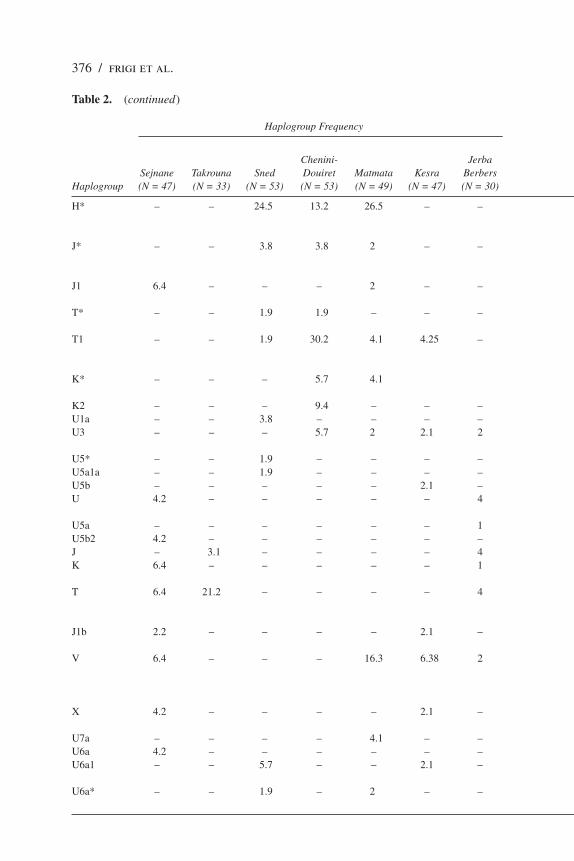
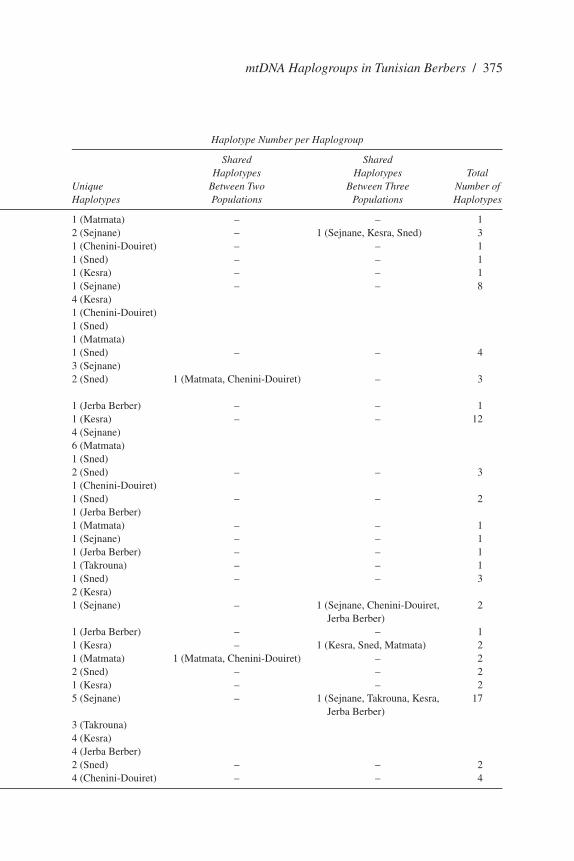
376 / frigi et al.
Table 2. (continued)
Haplogroup Frequency Haplotype Number per Haplogroup
Shared Shared Chenini- Jerba Haplotypes Haplotypes Total Sejnane Takrouna Sned Douiret Matmata Kesra Berbers Unique Between Two Between Three Number of Haplogroup (N = 47) (N = 33) (N = 53) (N = 53) (N = 49) (N = 47) (N = 30) Haplotypes Populations Populations Haplotypes
H* – – 24.5 13.2 26.5 – – 7 (Sned) – 1 (Sned, Chenini-Douiret, 16 Matmata) 8 (Matmata)J* – – 3.8 3.8 2 – – 3 (Chenini-Douiret) 1 (Sned, Matmata) – 6 1 (Sned) 1 (Matmata)J1 6.4 – – – 2 – – 2 (Sejnane) – – 3 1 (Matmata)T* – – 1.9 1.9 – – – 1 (Sned) – – 2 1 (Chenini-Douiret)T1 – – 1.9 30.2 4.1 4.25 – 1 (Kesra) 1 (Chenini-Douiret, Matmata) – 7 1 (Sned) 4 (Chenini-Douiret)K* – – – 5.7 4.1 1 (Chenini-Douiret) – – 2 1 (Matmata)K2 – – – 9.4 – – – 3 (Chenini-Douiret) – – 3U1a – – 3.8 – – – – 2 (Sned) – – 2U3 – – – 5.7 2 2.1 2 1 (Chenini-Douiret) 1 (Jerba Berber, Chenini-Douiret) – 3 1 (Matmata)U5* – – 1.9 – – – – 1 (Sned) – – 1U5a1a – – 1.9 – – – – 1 (Sned) – – 1U5b – – – – – 2.1 – 1 (Kesra) – – 1U 4.2 – – – – – 4 2 (Sejnane) – – 6 4 (Jerba Berber)U5a – – – – – – 1 1 (Jerba Berber) – – 1U5b2 4.2 – – – – – – 1 (Sejnane) – – 1J – 3.1 – – – – 4 3 (Jerba Berber) 1 (Takrouna, Jerba Berber) – 4K 6.4 – – – – – 1 2 (Sejnane) – – 3 1 (Jerba Berber)T 6.4 21.2 – – – – 4 2 (Sejnane) – – 5 2 (Takrouna) 1 (Jerba Berber)J1b 2.2 – – – – 2.1 – 1 (Sejnane) – – 2 1 (Kesra)V 6.4 – – – 16.3 6.38 2 1 (Sejnane) 1 (Jerba Berber) 3 (Matmata) – 1 (Sejnane, Matmata, Kesra, 6 Jerba Berber)X 4.2 – – – – 2.1 – 2 (Sejnane) – – 3 1 (Kesra)U7a – – – – 4.1 – – 1 (Matmata) – – 1U6a 4.2 – – – – – – 1 (Sejnane) – – 1U6a1 – – 5.7 – – 2.1 – 3 (Kesra) – – 6 3 (Sned)U6a* – – 1.9 – 2 – – 1 (Matmata) – – 2 1 (Sned)
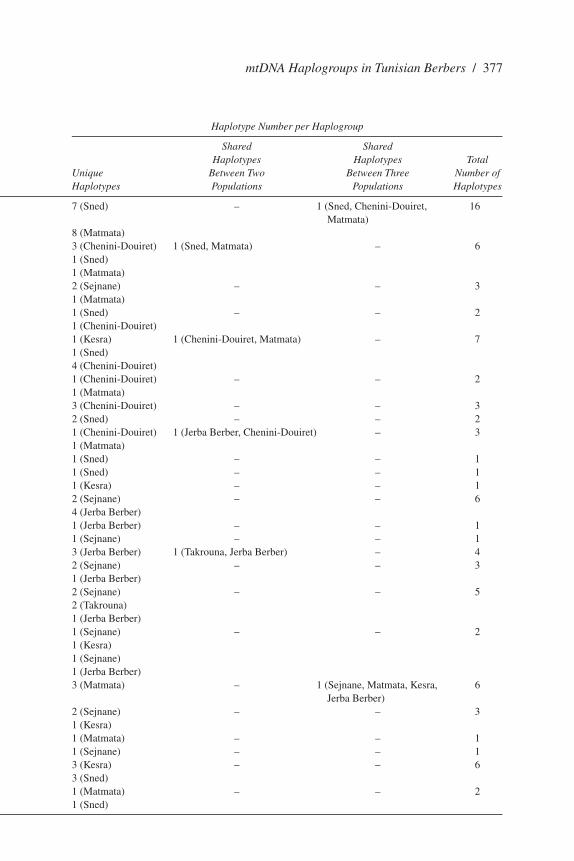
mtDNA Haplogroups in Tunisian Berbers / 377
Table 2. (continued)
Haplogroup Frequency Haplotype Number per Haplogroup
Shared Shared Chenini- Jerba Haplotypes Haplotypes Total Sejnane Takrouna Sned Douiret Matmata Kesra Berbers Unique Between Two Between Three Number of Haplogroup (N = 47) (N = 33) (N = 53) (N = 53) (N = 49) (N = 47) (N = 30) Haplotypes Populations Populations Haplotypes
H* – – 24.5 13.2 26.5 – – 7 (Sned) – 1 (Sned, Chenini-Douiret, 16 Matmata) 8 (Matmata)J* – – 3.8 3.8 2 – – 3 (Chenini-Douiret) 1 (Sned, Matmata) – 6 1 (Sned) 1 (Matmata)J1 6.4 – – – 2 – – 2 (Sejnane) – – 3 1 (Matmata)T* – – 1.9 1.9 – – – 1 (Sned) – – 2 1 (Chenini-Douiret)T1 – – 1.9 30.2 4.1 4.25 – 1 (Kesra) 1 (Chenini-Douiret, Matmata) – 7 1 (Sned) 4 (Chenini-Douiret)K* – – – 5.7 4.1 1 (Chenini-Douiret) – – 2 1 (Matmata)K2 – – – 9.4 – – – 3 (Chenini-Douiret) – – 3U1a – – 3.8 – – – – 2 (Sned) – – 2U3 – – – 5.7 2 2.1 2 1 (Chenini-Douiret) 1 (Jerba Berber, Chenini-Douiret) – 3 1 (Matmata)U5* – – 1.9 – – – – 1 (Sned) – – 1U5a1a – – 1.9 – – – – 1 (Sned) – – 1U5b – – – – – 2.1 – 1 (Kesra) – – 1U 4.2 – – – – – 4 2 (Sejnane) – – 6 4 (Jerba Berber)U5a – – – – – – 1 1 (Jerba Berber) – – 1U5b2 4.2 – – – – – – 1 (Sejnane) – – 1J – 3.1 – – – – 4 3 (Jerba Berber) 1 (Takrouna, Jerba Berber) – 4K 6.4 – – – – – 1 2 (Sejnane) – – 3 1 (Jerba Berber)T 6.4 21.2 – – – – 4 2 (Sejnane) – – 5 2 (Takrouna) 1 (Jerba Berber)J1b 2.2 – – – – 2.1 – 1 (Sejnane) – – 2 1 (Kesra)V 6.4 – – – 16.3 6.38 2 1 (Sejnane) 1 (Jerba Berber) 3 (Matmata) – 1 (Sejnane, Matmata, Kesra, 6 Jerba Berber)X 4.2 – – – – 2.1 – 2 (Sejnane) – – 3 1 (Kesra)U7a – – – – 4.1 – – 1 (Matmata) – – 1U6a 4.2 – – – – – – 1 (Sejnane) – – 1U6a1 – – 5.7 – – 2.1 – 3 (Kesra) – – 6 3 (Sned)U6a* – – 1.9 – 2 – – 1 (Matmata) – – 2 1 (Sned)
378 / frigi et al.
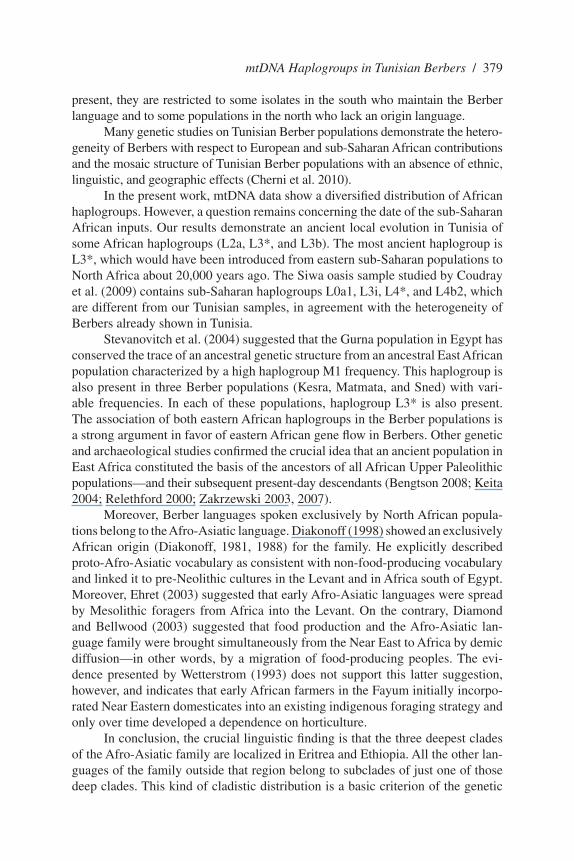
ranging from 1.9% in Sned to 16.3% in Matmata. There are 12 different haplo-types, and all are unique.
Interestingly, we note a local evolution of this cluster in Tunisia, starting from a haplotype found in the Matmata population. This regional evolution in-cludes the Sejnane, Matmata, and Sned populations. The age of this divergence is 20,180 ± 7,134 years. This age indicates an introgression of haplogroup L3* in Tunisia around 20,000 years ago.
Haplogroup L3b. Haplogroup L3b is predominantly West African. It has spilled over into North Africa and into the Near East. It is weakly spread in East Africa and Central Africa, but several derived types are present in southeastern Africa (Salas et al. 2002). In North Africa haplogroup L3b is observed in Tuni-sia, Mauritania, and Morocco (Souss). Haplogroup L3b is present in the Tunisian populations of Sned and Chenini-Douiret with a frequency of 3.8%. There are three different haplotypes, and all are unique. Two directly related haplotypes are found in the Sned population, which would be in agreement with a local evolution of this haplogroup.
Discussion
In this study we attempted to better elucidate the ancient African genetic background in the northwest African area, particularly in Tunisia. To this aim, we focused our study on Berber populations that are considered representative of the ancient North African populations that probably derived from Neolithic Capsians. During historic times, Berbers experienced a long and complicated history with many invasions, conquests, and migrations by Phoenicians, Romans, Vandals, Byzantines, Arabs, Bedouins, Spanish, Turks, Andalusians, sub-Saharans (com-munities settled in Jerba and Gabes in the 16th–19th centuries), and French (Brett and Fentress 1996). During these invasions, Berbers were forced back to the moun-tains and to certain villages in southern Tunisia (Fadhlaoui-Zid et al. 2004). At
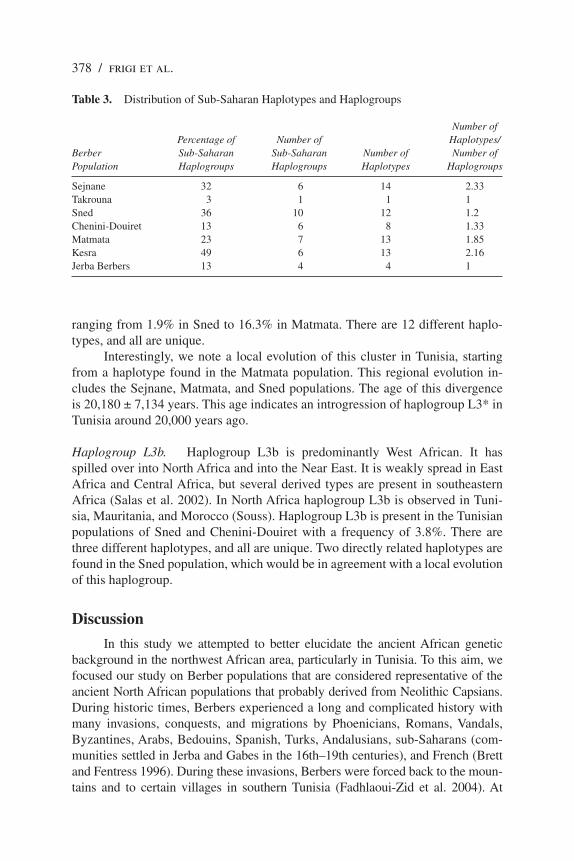
Table 3. Distribution of Sub-Saharan Haplotypes and Haplogroups
Number of Percentage of Number of Haplotypes/ Berber Sub-Saharan Sub-Saharan Number of Number of Population Haplogroups Haplogroups Haplotypes Haplogroups
Sejnane 32 6 14 2.33Takrouna 3 1 1 1Sned 36 10 12 1.2Chenini-Douiret 13 6 8 1.33Matmata 23 7 13 1.85Kesra 49 6 13 2.16Jerba Berbers 13 4 4 1
mtDNA Haplogroups in Tunisian Berbers / 379
present, they are restricted to some isolates in the south who maintain the Berber language and to some populations in the north who lack an origin language.
Many genetic studies on Tunisian Berber populations demonstrate the hetero-geneity of Berbers with respect to European and sub-Saharan African contributions and the mosaic structure of Tunisian Berber populations with an absence of ethnic, linguistic, and geographic effects (Cherni et al. 2010).
In the present work, mtDNA data show a diversified distribution of African haplogroups. However, a question remains concerning the date of the sub-Saharan African inputs. Our results demonstrate an ancient local evolution in Tunisia of some African haplogroups (L2a, L3*, and L3b). The most ancient haplogroup is L3*, which would have been introduced from eastern sub-Saharan populations to North Africa about 20,000 years ago. The Siwa oasis sample studied by Coudray et al. (2009) contains sub-Saharan haplogroups L0a1, L3i, L4*, and L4b2, which are different from our Tunisian samples, in agreement with the heterogeneity of Berbers already shown in Tunisia.
Stevanovitch et al. (2004) suggested that the Gurna population in Egypt has conserved the trace of an ancestral genetic structure from an ancestral East African population characterized by a high haplogroup M1 frequency. This haplogroup is also present in three Berber populations (Kesra, Matmata, and Sned) with vari-able frequencies. In each of these populations, haplogroup L3* is also present. The association of both eastern African haplogroups in the Berber populations is a strong argument in favor of eastern African gene flow in Berbers. Other genetic and archaeological studies confirmed the crucial idea that an ancient population in East Africa constituted the basis of the ancestors of all African Upper Paleolithic populations—and their subsequent present-day descendants (Bengtson 2008; Keita 2004; Relethford 2000; Zakrzewski 2003, 2007).
Moreover, Berber languages spoken exclusively by North African popula-tions belong to the Afro-Asiatic language. Diakonoff (1998) showed an exclusively African origin (Diakonoff, 1981, 1988) for the family. He explicitly described proto-Afro-Asiatic vocabulary as consistent with non-food-producing vocabulary and linked it to pre-Neolithic cultures in the Levant and in Africa south of Egypt. Moreover, Ehret (2003) suggested that early Afro-Asiatic languages were spread by Mesolithic foragers from Africa into the Levant. On the contrary, Diamond and Bellwood (2003) suggested that food production and the Afro- Asiatic lan-guage family were brought simultaneously from the Near East to Africa by demic diffusion—in other words, by a migration of food-producing peoples. The evi-dence presented by Wetterstrom (1993) does not support this latter suggestion, however, and indicates that early African farmers in the Fayum initially incorpo-rated Near Eastern domesticates into an existing indigenous foraging strategy and only over time developed a dependence on horticulture.
In conclusion, the crucial linguistic finding is that the three deepest clades of the Afro-Asiatic family are localized in Eritrea and Ethiopia. All the other lan-guages of the family outside that region belong to subclades of just one of those deep clades. This kind of cladistic distribution is a basic criterion of the genetic
380 / frigi et al.
argument for the genetic lineage origins well understood by geneticists. It applies to linguistic history as well.
Our results also point to a less ancient western African gene flow to Tunisia involving haplogroups L2a and L3b. Thus the sub-Saharan contribution to north-ern Africa starting from the east would have taken place before the Neolithic. The western African contribution to North Africa should have occurred before the Sahara’s formation (15,000 BP). It seems likely that an expansion would have taken place in the Sahel zone starting about the time of a gradual climatic return to wetter conditions, when the Senegal River cut through the dunes (Burke et al. 1971). For subhaplogroup L2a1 (data not shown) we found some haplotypes that the Tunisian Berbers shared with Mauritanians and western sub-Saharan popula-tions speaking a Niger-Congo language (studied by Salas et al. 2002). This sug-gests that the people who brought these markers to the Berber populations most likely came from West African populations that spoke languages belonging to the Niger-Congo family when the Sahara became drier. However, this contribution of West African haplotypes and of other haplotypes, such as those belonging to haplogroup L1b1, could have been introduced to North Africa more recently.
Indeed, this West African contribution was difficult to date, because few haplotypes belonging to western African haplogroups have been observed, most of them being divergent. This result can be interpreted in different ways. Ancient western African mtDNA contributions could have disappeared from North Africa as a result of recent flows, or the situation observed now could be the result of a strong drift effect on ancient western African lineages, particularly those belong-ing to haplogroups L2a and L3b. A strong Iberian gene flow may have contrib-uted to the decrease in African haplogroups. Indeed, most of the older hypotheses about North African population settlement used to suppose an Iberian or an east-ern origin. The dates for subhaplogroups H1 and H3 (13,000 and 10,000 years, respectively) in Iberian and North African populations allow for this possibility. Kefi et al.’s (2005) data on ancient DNA could be viewed as being in agreement with such a presence in North Africa in ancient times (about 15,000–6,000 years ago) and with the fact that the North African populations are considered by most scholars as having their closest relations with European and Asian populations (Cherni et al. 2008; Ennafaa et al. 2009; Kefi et al. 2005; Rando et al. 1998). How-ever, considering the general understanding nowadays that human settlement of the rest of the world emerged from eastern northern Africa less than 50,000 years ago, a better explanation of these haplogroups might be that their frequencies re-flect the original modern human population of these parts of Africa as much as or more than intrusions from outside the continent. The ways that gene frequencies may increase or decrease based on adaptive selection, gene flow, and/or social processes is under study and would benefit from the results of studies on autoso-mal and Y-chromosome markers.
Since the end of the extreme Saharan desiccation, lasting from before 25,000 years ago up to about 15,000 years ago, the Sahara has had post- and pre-Holocene cyclical climatic changes (Street and Grove 1976), and corresponding
mtDNA Haplogroups in Tunisian Berbers / 381
increases and decreases in population are probable. Wetter phases with better hab-itats perhaps allowed for increased colonization and gene and cultural exchange. Desiccation would have encouraged the emigration and segmentation of popu-lations, with resultant genetic consequences secondary to drift producing more variation. During the last glacial period, the Sahara was even bigger than it is today, extending south beyond its current boundaries (Ehret 2002). About 13,000 years ago, large parts of the Sahara were as dry as the desert is now (White and Mattingly 2006). The end of the glacial period brought more rain to the Sahara, especially from about 8500 to 6000 BC (Fezzan Project 2006). By around 3400 BC, the monsoon retreated south to approximately where it is today, leading to the gradual desertification of the region (Kröpelin 2008). Thus the Sahara, through its cyclical environmental changes, might be seen as a microevolutionary “proces-sor” and/or “pump” of African people that “ejected” groups to the circum-Saharan regions in times of increasing aridity.
Indeed, it must be noted that the high frequencies of cDe, P, and V antigens and low frequencies of FY antigens in some Berber-speaking groups (Chamla 1980; Mourant et al. 1976) indicate affinities with tropical Africans. These data may indicate recent or ancient gene flow from sub-Saharan Africa, a common im-mediate pre-Holocene ancestral group, or chance resemblance.
Our findings are in accordance with other studies on Y-chromosome mark-ers that have shown that the predominant Y-chromosome lineage in Berber com-munities is the subhaplogroup E1b1b1b (E-M81), which emerged in Africa, is specific to North African populations, and is almost absent in Europe, except in Iberia (Spain and Portugal) and Sicily. Molecular studies on the Y chromosome in North Africa are interpreted as indicating that the southern part of Africa, namely, the Horn/East Africa, was a major source of population in the Nile Valley and northwest Africa after the Last Glacial Maximum, with some migration into the Near East and southern Europe (Bosch et al. 2001; Underhill et al. 2001).
Hence, contrary to the suggestion that mtDNA haplogroups were intro-duced mostly from Iberia, it seems that Y-chromosome markers have an eastern African origin with an ancient local evolution in North Africa. These observa-tions are in agreement with the proposal that the ancient communities ancestral in language to more recent Berber communities absorbed a lot of females from the existing pre-Holocene populations. This would indicate that the North Afri-can populations arose from admixture rather than from local evolution, leading to an intermediate genetic structure between eastern sub-Saharan Africans and Eurasians. Rock paintings in North Africa that show people of different pheno-types living together are a strong argument for our hypothesis (Hachid 1982, 1992, 1998).
In conclusion, our findings parallel the more recent findings of both archae-ology and linguistics on the prehistory of Africa. The present study suggests that sub-Saharan contributions to North Africa have experienced several complex pop-ulation processes after the occupation of the region by anatomically modern hu-mans. Our results reveal that Berber speakers have a foundational biogeographic
382 / frigi et al.
root in Africa and that deep African lineages have continued to evolve in supra-Saharan Africa.
Acknowledgments We gratefully acknowledge the anonymous reviewers, whose com-ments improved the presentation of this manuscript.
Received 16 January 2010; final revision accepted for publication 2 June 2010.
Literature CitedBengtson, J. D. (ed.). 2008. In Hot Pursuit of Language in Prehistory: Essays in the Four Fields of
Anthropology. Amsterdam: John Benjamins, 3–16.Bosch, E., J. Clarimo, A. Perez-Lezaun et al. 2001. STR data for 21 loci in northwestern Africa. Fo-
rensic Sci. Intl. 116:41–51.Brakez, Z., E. Bosch, A. Isabel et al. 2001. Human mitochondrial DNA sequence variation in the Mo-
roccan population of the Souss area. Ann. Hum. Biol. 28(3):295–307. Brett, M., and E. Fentress. 1996. The Berbers. Oxford: Blackwell.Burke, K., A. B. Durotoye, and A. J. Whiteman. 1971. A dry phase south of the Sahara 20,000 years
ago. W. Afr. J. Archaeol. 1:1–8.Chamla, M. C. 1980. The settlement of non-Saharan Algeria from the epi-Paleolithic to modern times.
In The Physical Anthropology of European Populations, I. Schwidetsky, B. Chairelli, and N. Necrosov, eds. The Hague: Mouton.
Chen, Y. S., A. Olckers, T. G. Schurr et al. 2000. mtDNA variation in the South African Kung and Khwe and their genetic relationship to other African populations. Am. J. Hum. Genet. 66:1362–1383.
Cherni, L., V. Fernandes, B. Pereira et al. 2008. Post–Last Glacial Maximum expansion from Iberia to North Africa revealed by fine characterization of mtDNA H haplogroup in Tunisia. Am. J. Phys. Anthropol. 139(2):253–260.
Cherni, L., S. Frigi, K. Fadhlaoui et al. 2010. Mosaic structure of the Tunisian population revealed by analysis of mitochondrial DNA pool. Unpublished.
Cherni, L., B. Yacoubi, L. Pereira et al. 2005. Female gene pools of Berber and Arab neighboring communities in central Tunisia: Microstructure of mtDNA variation in North Africa. Hum. Biol. 77:61–70.
Côrte-Réal, H. B., V. Macaulay, M. B. Richards et al. 1996. Genetic diversity in the Iberian Peninsula determined from mitochondrial sequences analysis. Ann. Hum. Genet. 60:331–350.
Coudray, C., A. Olivieri, A. Achilli et al. 2009. The complex and diversified mitochondrial gene pool of Berber populations. Ann. Hum. Genet. 73:196–214.
Crevecoeur, I., H. Rougier, F. Grine et al. 2009. Modern human cranial diversity in the late Pleistocene of Africa and Eurasia: Evidence from Nazlet Khater, Pestera cu Oase, and Hofmeyr. Am. J. Phys. Anthropol. 140(2):347–358.
Diakonoff, I. M. 1981. Earliest Semites in Asia. Altorient Forsch. 8:23–74.Diakonoff, I. M. 1988. Afrasian Languages. Moscow: Nauka.Diakonoff, I. M. 1998. The earliest Semitic society: Linguistic data. J. Semit. Stud. 4:209–219.Diamond, J., and P. Bellwood. 2003. Farmers and their languages: The first expansions. Science
300(5619):597–603.Ehret, C. 2002. The Civilizations of Africa. Charlottesville: University of Virginia Press.Ehret, C. 2003. Broadening our understandings of cause from an African perspective. In Examining
the Farming/Language Dispersal Hypothesis, P. Bellwood and C. Renfrew, eds. Cambridge, U.K.: McDonald Institute for Archaeological Research, 163–176.
Ennafaa, H., V. M. Cabrera, K. K. Abu-Amero et al. 2009. Mitochondrial DNA haplogroup H structure in North Africa. BMC Genet. 10:1–10.
mtDNA Haplogroups in Tunisian Berbers / 383
Excoffier, L. 2002. Human demographic history: Refining the recent African origin model. Curr. Opin. Genet. Dev. 12:675–682.
Fadhlaoui-Zid, K., S. Plaza, F. Calafell et al. 2004. Mitochondrial DNA heterogeneity in Tunisian Berbers. Ann. Hum. Genet. 68:222–233.
Fagundes, N. J. R., N. Ray, M. Beaumont et al. 2007. Statistical evaluation of alternative models of human evolution. Proc. Natl. Acad. Sci. USA 104:17,614–17,619.
Fezzan Project. 2006. Paleoclimate and environment. http://www.cru.uea.ac.uk/~e118/Fezzan/ fezzan_palaeoclim.html, accessed March 22, 2010.
Forster, P., R. Harding, A. Torroni et al. 1996. Origin and evolution of Native American mtDNA varia-tion: A reappraisal. Am. J. Hum. Genet. 59(4):935–945.
Frigi, S., B. Yacoubi, F. Pereira et al. 2006. mtDNA lineages in two Tunisian Berber communities: Comparing diversities between villages and towns. Intl. Congr. Ser. 1288:121–123.
Gonzalez, A. M., V. M. Cabrera, J. M. Larruga et al. 2006. Mitochondrial DNA variation in Mauritania and Mali and their genetic relationship to other western Africa populations. Ann. Hum. Genet. 70:631–657.
Graven, L., G. Passarino, O. Semino et al. 1995. Evolutionary correlation between control region sequence and restriction polymorphisms in the mitochondrial genome of a large Senegalese Mandenka sample. Mol. Biol. Evol. 12:334–345.
Hachid, M. 1982. Recherche méthodologiques sur l’Art rupestre de l’Atlas saharien: Etude de deux stations de la région de Djefla (sud-Algerois. Algerie). Ph.D. dissertation, Université de Provence, Ronéoté, France.
Hachid, M. 1992. El-Hadjra el-Mektouba: Les pierres écrites de l’Atlas sahariens. Alger, Algeria: Ed. Enag.
Hachid, M. 1998. Le Tassili des Ajjer: Aux sources de l’Afrique, 50 siecles avant les pyramides. Paris: Paris-Méditeranée.
Irish, D. J. 2000. The Iberomaurusian enigma: North African progenitor or dead end? J. Hum. Evol. 39(4):393–410.
Kefi, R., A. Stevanovitch, E. Bouzaid et al. 2005. Diversité mitochondriale de la population de Taforalt (12,000 ans BP-Maroc): Une approche génétique à l’étude du peuplement de l’Afrique du Nord. Anthropologie 43(1):1–11.
Keita, S. O. Y. 1990. Studies of ancient crania from northern Africa. Am. J. Phys. Anthropol. 83:35–48.Keita, S. O. Y. 2004. Exploring northeast African metric craniofacial variation at the individual level: A
comparative study using principal component analysis. Am. J. Hum. Biol. 16:679–689.Krings, M., A. H. Salem, K. Bauer et al. 1999. mtDNA analysis of Nile River valley populations: A
genetic corridor or a barrier to migration. Am. J. Hum. Genet. 64:1166–1176. Kröpelin, S. 2008. Climate-driven ecosystem succession in the Sahara: The past 6,000 years. Science
320(5877):765–768. Macaulay, V., M. Richards, E. Hickey et al. 1999. The emerging tree of west Eurasian mtDNAs: A
synthesis of control region sequences and RFLPs. Am. J. Hum. Genet. 64:232–249.Marth, G., G. Schuler, R. Yeh et al. 2003. Sequence variations in the public human genome data reflect
a bottlenecked population history. Proc. Natl. Acad. Sci. USA 100:376–381.Morral, N., J. Bertranpetit, X. Estivill et al. 1994. The origin of the major cystic fibrosis mutation
(delta F508) in European populations. Nat. Genet. 7(2):169–175.Mourant, K. E., A. C. Kopec, and A. Domaniewska-Sobczak. 1976. The Distribution of Human Blood
Groups. New York: Oxford University Press.Newman, J. L. 1995. The Peopling of Africa: A Geographic Interpretation. New Haven, CT: Yale
University Press.Pereira, L., M. J. Prata, and A. Amorim. 2000. Diversity of mtDNA lineage in Portugal not a genetic
edge of European variation. Ann. Hum. Genet. 64:491–506. Piercy, R., K. M. Sullivan, N. B. Benson et al. 1996. The application of mitochondrial DNA typing to
the study of white Caucasian genetic identification. Int. J. Leg. Med. 106:85–90.Quintana-Murci, L., O. Semino, H.-J., Bandelt et al. 1999. Genetic evidence for an early exit of Homo
sapiens sapiens from Africa through Eastern Africa. Nat. Genet. 23:437–441.
384 / frigi et al.
Rahmani, N. 2004. Technological and cultural change among the last hunter-gatherers of the Maghreb: The Capsian (10,000–6000 B.P.) J. World Prehist. 18(1):57–106.
Rando, J. C., F. Pinto, A. M. Gonzalez et al. 1998. Mitochondrial DNA analysis of northwest African populations reveals genetic exchanges with European, Near Eastern, and sub-Saharan popula-tions. Ann. Hum. Genet. 62:531–550.
Relethford, J. H. 2000. Human skin color diversity is highest in sub-Saharan African populations. Hum. Biol. 72(5):773–780.
Rosa, A., A. Brehm, T. Kivisild et al. 2004. mtDNA profile of West Africa Guineans: Towards a better understanding of the Senegambia region. Ann. Hum. Genet. 68:340–352.
Salas, A., M. Richards, M. V. Lareu et al. 2002. The making of the African mtDNA landscape. Am. J. Hum. Genet. 71:1082–1111.
Stevanovitch, A., A. Gilles, E. Bouzaid et al. 2004. Mitochondrial DNA sequence diversity in a seden-tary population from Egypt. Ann. Hum. Genet. 68(1):23–39.
Street, F., and A. Grove. 1976. Environmental and climatic implication of late Quaternary lake-level fluctuations in Africa. Nature 261:385–390.
Torroni, A., M. B. Richards, V. Macaulay et al. 2000. mtDNA haplogroups and frequency pattern in Europe. Am. J. Hum. Genet. 66:1173–1177.
Trovoada, M. J., L. Pereira, L. Gusmao et al. 2003. Pattern of mtDNA variation in three populations from Sao Tomé e Principe. Ann. Hum. Genet. 68:40–54.
Underhill, P. A., G. Passarino, A. Lin et al. 2001. The phylogeography of Y chromosome binary haplo-types and the origins of modern human populations. Ann. Hum. Genet. 65:43–62.
Underhill, P. A., P. D. Shen, A. A. Lin et al. 2000. Y chromosome sequence variation and the history of human populations. Nat. Genet. 26:358–361.
Vigilant, L., M. Stoneking, H. Harpending et al. 1991. African populations and the evolution of human mitochondrial DNA. Science 253:1503–1507.
Watson, E., P. Forster, M. Richards et al. 1997. Mitochondrial footprints of human expansions in Af-rica. Am. J. Hum. Genet. 61:691–704.
Wetterstrom, W. 1993. Foraging and farming in Egypt: The transition from hunting and gathering to horticulture in the Nile Valley. In The Archaeology of Africa: Food, Metal, and Towns, T. Shaw, P. Sinclair, B. Andah et al., eds. New York: Routledge, 165–226.
White, K., and D. J. Mattingly. 2006. Ancient lakes of the Sahara. Am. Sci. 94:58–65.Yacoubi, B., L. Cherni, H. Ennafaa et al. 2006. Islands inside an island: Reproductive isolates in Jerba
Island. Am. J. Hum. Biol. 18:149–153.Zakrzewski, S. R. 2003. Variation in ancient Egyptian stature and body proportions. Am. J. Phys.
Anthropol. 121(3):219–229. Zakrzewski, S. R. 2007. Population continuity or population change: Formation of the ancient Egyp-
tian state. Am. J. Phys. Anthropol. 132:501–509.