Trading Genes along the Silk Road: mtDNA Sequences and the Origin of Central Asian Populations
15
Am. J. Hum. Genet. 63:1824–1838, 1998 1824 Trading Genes along the Silk Road: mtDNA Sequences and the Origin of Central Asian Populations David Comas, 1,2,* Francesc Calafell, 1,3,* Eva Mateu, 1 Anna Pe ´rez-Lezaun, 1,4 Elena Bosch, 1 Rosa Martı ´nez-Arias, 1 Jordi Clarimon, 1 Fiorenzo Facchini, 5 Giovanni Fiori, 5 Donata Luiselli, 5 Davide Pettener, 5 and Jaume Bertranpetit 1 1 Unitat de Biologia Evolutiva, Facultat de Cie `ncies de la Salut i de la Vida, Universitat Pompeu Fabra, Barcelona; 2 Department of Forensic Medicine, University of Helsinki, Helsinki; 3 Department of Genetics, Yale University School of Medicine, New Haven; 4 Center for Human Genetics, Edith Cowan University, Joondalup, Western Australia; and 5 Dipartimento di Biologia e.s., Unita ` di Antropologia, Universita ` di Bologna, Bologna Summary Central Asia is a vast region at the crossroads of different habitats, cultures, and trade routes. Little is known about the genetics and the history of the population of this region. We present the analysis of mtDNA control- region sequences in samples of the Kazakh, the Uighurs, the lowland Kirghiz, and the highland Kirghiz, which we have used to address both the population history of the region and the possible selective pressures that high altitude has on mtDNA genes. Central Asian mtDNA sequences present features intermediate between Euro- pean and eastern Asian sequences, in several parame- ters—such as the frequencies of certain nucleotides, the levels of nucleotide diversity, mean pairwise differences, and genetic distances. Several hypotheses could explain the intermediate position of central Asia between Europe and eastern Asia, but the most plausible would involve extensive levels of admixture between Europeans and eastern Asians in central Asia, possibly enhanced during the Silk Road trade and clearly after the eastern and western Eurasian human groups had diverged. Lowland and highland Kirghiz mtDNA sequences are very similar, and the analysis of molecular variance has revealed that the fraction of mitochondrial genetic variance due to altitude is not significantly different from zero. Thus, it seems unlikely that altitude has exerted a major selective pressure on mitochondrial genes in central Asian populations. Received December 12, 1997; accepted for publication September 25, 1998; electronically published December 2, 1998. Address for correspondence and reprints: Dr. Jaume Bertranpetit, Unitat de Biologia Evolutiva, Facultat de Cie `ncies de la Salut i de la Vida, Universitat Pompeu Fabra, Doctor Aiguader 80, 08003 Barce- lona, Catalonia, Spain. E-mail: [email protected] * These two authors contributed equally to this work. q 1998 by The American Society of Human Genetics. All rights reserved. 0002-9297/98/6306-0029$02.00 Introduction Central Asia is a vast territory very poorly known ge- netically, although it has played a crucial role in the history of humankind and has been an area where cul- tural and linguistic changes are known to have been of key importance. It is often regarded as a borderland between East and West, without a unique, particular history, which is not the case (Bowles 1977; Sellier and Sellier 1993). Central Asia, as defined by Soviet scholars, encom- passes the territories east of the Caspian Sea to the cur- rent boundaries of China along the Pamir, the Hindu Kush and farther to the northeast, and it comprises the republics of Uzbekistan, Tajikistan, Turkmenistan, Kirghizstan, and part of Kazakhstan; in Western liter- ature, Mongolia, Tibet, and Sinkiang (pinyin Xinjiang, western China) sometimes are included. It is a territory of vast contrasts, with most of the land occupied by high- altitude tracts or vast cold deserts, both unfavorable for large and stable human settlements. However, the river basins have been occupied since early times, and the steppes have offered a good land for an itinerant pastoral economy. A territory located at the edge of the western Asian empires, crossed by the Silk Road, with long-lasting con- tacts with India yet open to the steppes of the north, it is a case in point when one is trying to understand the genetic consequences of complex cultural phenomena such as acculturation, assimilation, and syncretism; overlapping of economies, languages, and ways of life; and migrations, expansions, and conquests. The role of central Asia in early human evolution and history is not well established. According to an old, long- dismissed hypothesis, the nearby Altai region could have been the origin of humankind. It is known that the re- gion was populated during the lower Paleolithic, and there is ample evidence of settlement during the middle Paleolithic, including Teshik-Tash, the easternmost site from which Neanderthal remains have been recovered.
Transcript of Trading Genes along the Silk Road: mtDNA Sequences and the Origin of Central Asian Populations
Am. J. Hum. Genet. 63:1824–1838, 1998
1824
Trading Genes along the Silk Road: mtDNA Sequences and the Origin ofCentral Asian PopulationsDavid Comas,1,2,* Francesc Calafell,1,3,* Eva Mateu,1 Anna Perez-Lezaun,1,4 Elena Bosch,1Rosa Martınez-Arias,1 Jordi Clarimon,1 Fiorenzo Facchini,5 Giovanni Fiori,5 Donata Luiselli,5Davide Pettener,5 and Jaume Bertranpetit1
1Unitat de Biologia Evolutiva, Facultat de Ciencies de la Salut i de la Vida, Universitat Pompeu Fabra, Barcelona; 2Department of ForensicMedicine, University of Helsinki, Helsinki; 3Department of Genetics, Yale University School of Medicine, New Haven; 4Center for HumanGenetics, Edith Cowan University, Joondalup, Western Australia; and 5Dipartimento di Biologia e.s., Unita di Antropologia, Universita diBologna, Bologna
Summary
Central Asia is a vast region at the crossroads of differenthabitats, cultures, and trade routes. Little is knownabout the genetics and the history of the population ofthis region. We present the analysis of mtDNA control-region sequences in samples of the Kazakh, the Uighurs,the lowland Kirghiz, and the highland Kirghiz, whichwe have used to address both the population history ofthe region and the possible selective pressures that highaltitude has on mtDNA genes. Central Asian mtDNAsequences present features intermediate between Euro-pean and eastern Asian sequences, in several parame-ters—such as the frequencies of certain nucleotides, thelevels of nucleotide diversity, mean pairwise differences,and genetic distances. Several hypotheses could explainthe intermediate position of central Asia between Europeand eastern Asia, but the most plausible would involveextensive levels of admixture between Europeans andeastern Asians in central Asia, possibly enhanced duringthe Silk Road trade and clearly after the eastern andwestern Eurasian human groups had diverged. Lowlandand highland Kirghiz mtDNA sequences are very similar,and the analysis of molecular variance has revealed thatthe fraction of mitochondrial genetic variance due toaltitude is not significantly different from zero. Thus, itseems unlikely that altitude has exerted a major selectivepressure on mitochondrial genes in central Asianpopulations.
Received December 12, 1997; accepted for publication September25, 1998; electronically published December 2, 1998.
Address for correspondence and reprints: Dr. Jaume Bertranpetit,Unitat de Biologia Evolutiva, Facultat de Ciencies de la Salut i de laVida, Universitat Pompeu Fabra, Doctor Aiguader 80, 08003 Barce-lona, Catalonia, Spain. E-mail: [email protected]
∗ These two authors contributed equally to this work.q 1998 by The American Society of Human Genetics. All rights reserved.
0002-9297/98/6306-0029$02.00
Introduction
Central Asia is a vast territory very poorly known ge-netically, although it has played a crucial role in thehistory of humankind and has been an area where cul-tural and linguistic changes are known to have been ofkey importance. It is often regarded as a borderlandbetween East and West, without a unique, particularhistory, which is not the case (Bowles 1977; Sellier andSellier 1993).
Central Asia, as defined by Soviet scholars, encom-passes the territories east of the Caspian Sea to the cur-rent boundaries of China along the Pamir, the HinduKush and farther to the northeast, and it comprisesthe republics of Uzbekistan, Tajikistan, Turkmenistan,Kirghizstan, and part of Kazakhstan; in Western liter-ature, Mongolia, Tibet, and Sinkiang (pinyin Xinjiang,western China) sometimes are included. It is a territoryof vast contrasts, with most of the land occupied by high-altitude tracts or vast cold deserts, both unfavorable forlarge and stable human settlements. However, the riverbasins have been occupied since early times, and thesteppes have offered a good land for an itinerant pastoraleconomy.
A territory located at the edge of the western Asianempires, crossed by the Silk Road, with long-lasting con-tacts with India yet open to the steppes of the north, itis a case in point when one is trying to understand thegenetic consequences of complex cultural phenomenasuch as acculturation, assimilation, and syncretism;overlapping of economies, languages, and ways of life;and migrations, expansions, and conquests.
The role of central Asia in early human evolution andhistory is not well established. According to an old, long-dismissed hypothesis, the nearby Altai region could havebeen the origin of humankind. It is known that the re-gion was populated during the lower Paleolithic, andthere is ample evidence of settlement during the middlePaleolithic, including Teshik-Tash, the easternmost sitefrom which Neanderthal remains have been recovered.
Comas et al.: mtDNA Sequences in Central Asian Populations 1825
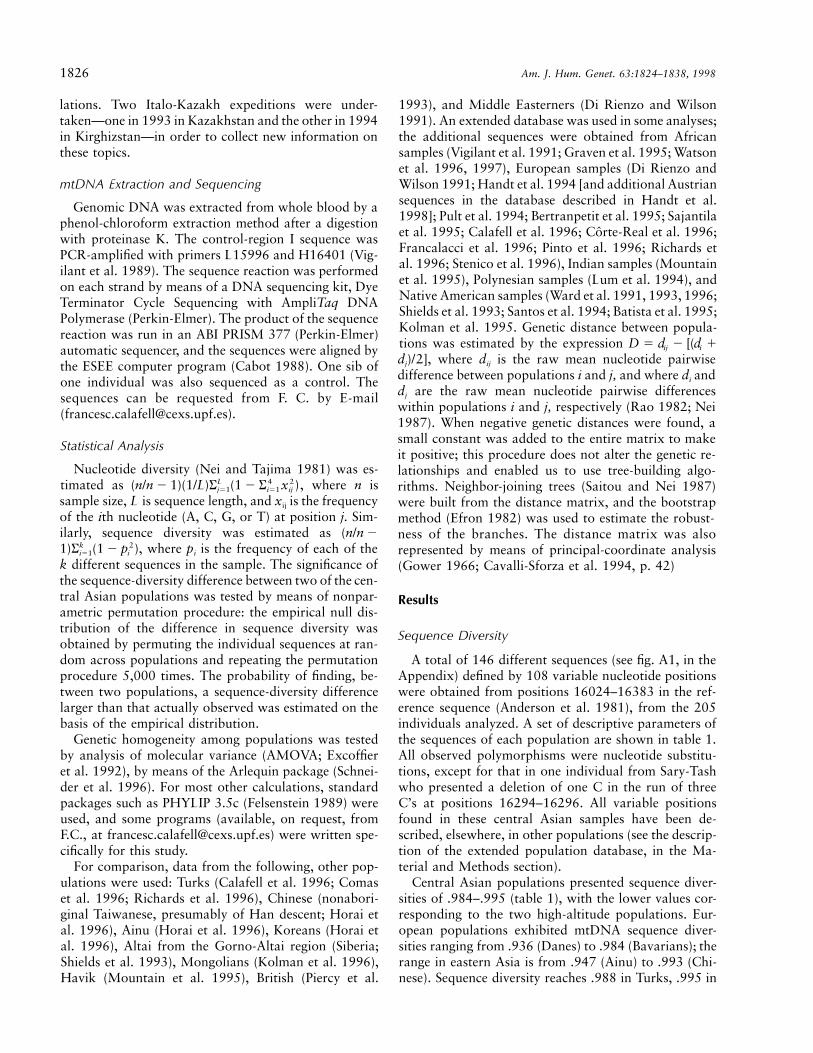
Figure 1 Geographic map of sampled area. The four centralAsian samples are in boldface. KIR-TALAS 5 Kirghiz from Talas, andKIR-SARYTASH 5 Kirghiz from Sary-Tash. The Kazakhs and theSary-Tash Kirghiz live at elevations 12,000 m above sea level.
It is not clear, however, whether the region was part ofa “maturation” phase of anatomically modern humans,a thruway in the colonization of Europe and easternAsia, or a place where Asian and European groups metafter their expansion (Bowles 1977).
The advent of the Neolithic seems to have been a localdevelopment without significant external population in-puts. The domestication of the horse in the steppes (An-thony and Brown 1991) and, subsequently, the devel-opment of wheeled vehicles (Anthony and Vinogradov1995) had a major impact on world history, as mobilityincreased dramatically and warfare was profoundlychanged. The human history of central Asia has beendetermined by the crudeness of the physical geography,which has not allowed stable human settlements. TheScythians are the first people in the historic record ofcentral Asia, around the 7th century B.C., and they aredescribed as having European morphological traits, bothby ancient Chinese texts and the Greek historian He-rodotus in the 5th century B.C. In the 2d century B.C.,the Chinese established a trade route from the Mediter-ranean Sea to eastern Asia (the Silk Road), which con-nected the East and the West of the continent during116 centuries, until it was replaced by safer ocean traderoutes. During the 3d and 4th centuries A.D., Turkichordes of Siberian origin replaced the Indo-Europeanpeoples in central Asia and created a great empire fromMongolia to the Black Sea, revived by Genghis Khanduring the 13th century. Later, the Chinese and Russianempires established their rule over the vast territories ofcentral Asia.
Genetically, central Asia is one of the least-studiedmajor regions of the world. The analysis of classicalgenetic markers has been done mainly by Soviet scholars,and, in the global revision by Cavalli-Sforza et al. (1994),little is added to the idea that central Asia is intermediatebetween Asia and Europe.
We have sequenced mtDNA hypervariable region I insamples of the Uighurs, the Kazakhs, and the Kirghiz,three ethnic groups of central Asia, in order to investi-gate the origins and evolution of central Asian popu-lations and to address several hypotheses concerning thepopulation history of Eurasia. Furthermore, we have col-lected samples from high- and low-altitude populationsand have investigated the possibility that selective pres-sures on mtDNA genes have been caused by low oxygenpressure.
Material and Methods
Population Samples
A 360-nucleotide sequence in hypervariable regionI of the mitochondrial control region (positions 16024–16383 in the reference sequence; Anderson et al. 1981)
was analyzed in 55 Uighurs, 55 Kazakhs, 47 Kirghizfrom Sary-Tash, and 48 Kirghiz from Talas (fig. 1). Eachsample comprises ethnically homogeneous, autochtho-nous, unrelated, healthy male donors, from whom ap-propriate informed consent was obtained. The Uighurswere sampled in the village of Penjim (600 m above sealevel) in the Panfilov district, Taldy-Corgan region, inthe easternmost section of Kazakhstan, only 18 km fromthe boundary with China. This region is inhabitedmostly by Uighurs, who emigrated from Sinkiang (pinyinXinjiang; Chinese Uighur autonomous region) duringrecent decades. The Kazakh samples were collected inthe villages of the Kegen valley (2,100 m above sea level;Almaty region, Kazakhstan), a high plain a few kilo-meters from the northern slopes of the Tien Shan range.Two Kirghiz samples, one each from Sary-Tash in thePamir and from Bakai Ata in the Talas Valley, were an-alyzed. Sary-Tash is an isolated high-altitude village(3,200 m above sea level) a few kilometers from theborder with Tajikistan and China, in the heartland ofthe Pamir mountains. The village of Bakai Ata (900 mabove sea level) is located in the Talas valley in the north-ernmost section of Kirghizstan, along the ancient SilkRoad trade routes to Kazakhstan and Uzbekistan.
Blood samples were collected by the Italian team (F.F.,G.F., D.L., and D.P.) within the CAHAP (Central AsiaHigh Altitude People) research program, which is pro-moted jointly by the Laboratory of Anthropology of theAcademy of Science of Kazakhstan and the Anthropol-ogy Unit of the University of Bologna. The objective ofCAHAP is the study of (a) human adaptability to highaltitude (Pettener et al. 1997), (b) body composition(Battistini et al. 1995; Bedogni et al. 1997; Facchini etal. 1998), and (c) genetic variability (Facchini et al. 1997;Pettener et al. 1997), in central Asian mountain popu-
1826 Am. J. Hum. Genet. 63:1824–1838, 1998
lations. Two Italo-Kazakh expeditions were under-taken—one in 1993 in Kazakhstan and the other in 1994in Kirghizstan—in order to collect new information onthese topics.
mtDNA Extraction and Sequencing
Genomic DNA was extracted from whole blood by aphenol-chloroform extraction method after a digestionwith proteinase K. The control-region I sequence wasPCR-amplified with primers L15996 and H16401 (Vig-ilant et al. 1989). The sequence reaction was performedon each strand by means of a DNA sequencing kit, DyeTerminator Cycle Sequencing with AmpliTaq DNAPolymerase (Perkin-Elmer). The product of the sequencereaction was run in an ABI PRISM 377 (Perkin-Elmer)automatic sequencer, and the sequences were aligned bythe ESEE computer program (Cabot 1988). One sib ofone individual was also sequenced as a control. Thesequences can be requested from F. C. by E-mail([email protected]).
Statistical Analysis
Nucleotide diversity (Nei and Tajima 1981) was es-timated as , where n isL 4 2(n/n 2 1)(1/L)S (1 2 S x )j51 i51 ij
sample size, L is sequence length, and xij is the frequencyof the ith nucleotide (A, C, G, or T) at position j. Sim-ilarly, sequence diversity was estimated as (n/n 2
, where pi is the frequency of each of thek 21)S (1 2 p )i51 i
k different sequences in the sample. The significance ofthe sequence-diversity difference between two of the cen-tral Asian populations was tested by means of nonpar-ametric permutation procedure: the empirical null dis-tribution of the difference in sequence diversity wasobtained by permuting the individual sequences at ran-dom across populations and repeating the permutationprocedure 5,000 times. The probability of finding, be-tween two populations, a sequence-diversity differencelarger than that actually observed was estimated on thebasis of the empirical distribution.
Genetic homogeneity among populations was testedby analysis of molecular variance (AMOVA; Excoffieret al. 1992), by means of the Arlequin package (Schnei-der et al. 1996). For most other calculations, standardpackages such as PHYLIP 3.5c (Felsenstein 1989) wereused, and some programs (available, on request, fromF.C., at [email protected]) were written spe-cifically for this study.
For comparison, data from the following, other pop-ulations were used: Turks (Calafell et al. 1996; Comaset al. 1996; Richards et al. 1996), Chinese (nonabori-ginal Taiwanese, presumably of Han descent; Horai etal. 1996), Ainu (Horai et al. 1996), Koreans (Horai etal. 1996), Altai from the Gorno-Altai region (Siberia;Shields et al. 1993), Mongolians (Kolman et al. 1996),Havik (Mountain et al. 1995), British (Piercy et al.
1993), and Middle Easterners (Di Rienzo and Wilson1991). An extended database was used in some analyses;the additional sequences were obtained from Africansamples (Vigilant et al. 1991; Graven et al. 1995; Watsonet al. 1996, 1997), European samples (Di Rienzo andWilson 1991; Handt et al. 1994 [and additional Austriansequences in the database described in Handt et al.1998]; Pult et al. 1994; Bertranpetit et al. 1995; Sajantilaet al. 1995; Calafell et al. 1996; Corte-Real et al. 1996;Francalacci et al. 1996; Pinto et al. 1996; Richards etal. 1996; Stenico et al. 1996), Indian samples (Mountainet al. 1995), Polynesian samples (Lum et al. 1994), andNative American samples (Ward et al. 1991, 1993, 1996;Shields et al. 1993; Santos et al. 1994; Batista et al. 1995;Kolman et al. 1995. Genetic distance between popula-tions was estimated by the expression D 5 d 2 [(d 1ij i
, where dij is the raw mean nucleotide pairwised )/2]j
difference between populations i and j, and where di anddj are the raw mean nucleotide pairwise differenceswithin populations i and j, respectively (Rao 1982; Nei1987). When negative genetic distances were found, asmall constant was added to the entire matrix to makeit positive; this procedure does not alter the genetic re-lationships and enabled us to use tree-building algo-rithms. Neighbor-joining trees (Saitou and Nei 1987)were built from the distance matrix, and the bootstrapmethod (Efron 1982) was used to estimate the robust-ness of the branches. The distance matrix was alsorepresented by means of principal-coordinate analysis(Gower 1966; Cavalli-Sforza et al. 1994, p. 42)
Results
Sequence Diversity
A total of 146 different sequences (see fig. A1, in theAppendix) defined by 108 variable nucleotide positionswere obtained from positions 16024–16383 in the ref-erence sequence (Anderson et al. 1981), from the 205individuals analyzed. A set of descriptive parameters ofthe sequences of each population are shown in table 1.All observed polymorphisms were nucleotide substitu-tions, except for that in one individual from Sary-Tashwho presented a deletion of one C in the run of threeC’s at positions 16294–16296. All variable positionsfound in these central Asian samples have been de-scribed, elsewhere, in other populations (see the descrip-tion of the extended population database, in the Ma-terial and Methods section).
Central Asian populations presented sequence diver-sities of .984–.995 (table 1), with the lower values cor-responding to the two high-altitude populations. Eur-opean populations exhibited mtDNA sequence diver-sities ranging from .936 (Danes) to .984 (Bavarians); therange in eastern Asia is from .947 (Ainu) to .993 (Chi-nese). Sequence diversity reaches .988 in Turks, .995 in
Comas et al.: mtDNA Sequences in Central Asian Populations 1827
Table 1
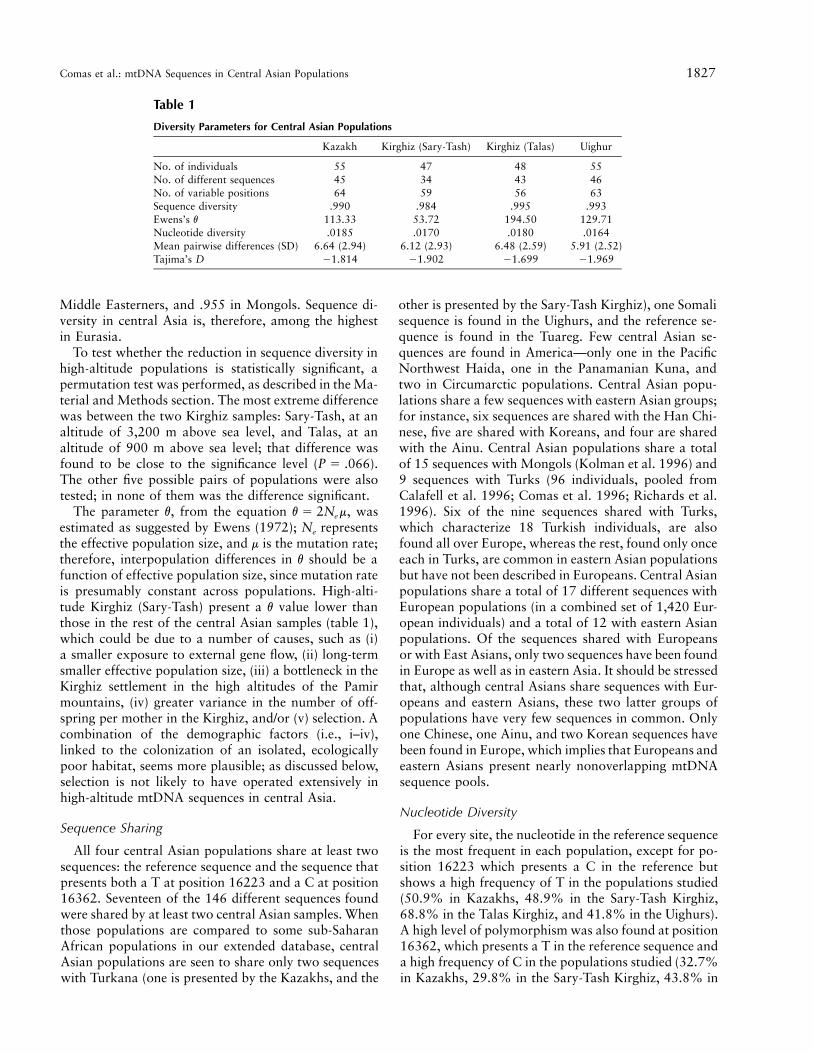
Diversity Parameters for Central Asian Populations
Kazakh Kirghiz (Sary-Tash) Kirghiz (Talas) Uighur
No. of individuals 55 47 48 55No. of different sequences 45 34 43 46No. of variable positions 64 59 56 63Sequence diversity .990 .984 .995 .993Ewens’s v 113.33 53.72 194.50 129.71Nucleotide diversity .0185 .0170 .0180 .0164Mean pairwise differences (SD) 6.64 (2.94) 6.12 (2.93) 6.48 (2.59) 5.91 (2.52)Tajima’s D 21.814 21.902 21.699 21.969
Middle Easterners, and .955 in Mongols. Sequence di-versity in central Asia is, therefore, among the highestin Eurasia.
To test whether the reduction in sequence diversity inhigh-altitude populations is statistically significant, apermutation test was performed, as described in the Ma-terial and Methods section. The most extreme differencewas between the two Kirghiz samples: Sary-Tash, at analtitude of 3,200 m above sea level, and Talas, at analtitude of 900 m above sea level; that difference wasfound to be close to the significance level ( ).P 5 .066The other five possible pairs of populations were alsotested; in none of them was the difference significant.
The parameter v, from the equation , wasv 5 2N me
estimated as suggested by Ewens (1972); Ne representsthe effective population size, and m is the mutation rate;therefore, interpopulation differences in v should be afunction of effective population size, since mutation rateis presumably constant across populations. High-alti-tude Kirghiz (Sary-Tash) present a v value lower thanthose in the rest of the central Asian samples (table 1),which could be due to a number of causes, such as (i)a smaller exposure to external gene flow, (ii) long-termsmaller effective population size, (iii) a bottleneck in theKirghiz settlement in the high altitudes of the Pamirmountains, (iv) greater variance in the number of off-spring per mother in the Kirghiz, and/or (v) selection. Acombination of the demographic factors (i.e., i–iv),linked to the colonization of an isolated, ecologicallypoor habitat, seems more plausible; as discussed below,selection is not likely to have operated extensively inhigh-altitude mtDNA sequences in central Asia.
Sequence Sharing
All four central Asian populations share at least twosequences: the reference sequence and the sequence thatpresents both a T at position 16223 and a C at position16362. Seventeen of the 146 different sequences foundwere shared by at least two central Asian samples. Whenthose populations are compared to some sub-SaharanAfrican populations in our extended database, centralAsian populations are seen to share only two sequenceswith Turkana (one is presented by the Kazakhs, and the
other is presented by the Sary-Tash Kirghiz), one Somalisequence is found in the Uighurs, and the reference se-quence is found in the Tuareg. Few central Asian se-quences are found in America—only one in the PacificNorthwest Haida, one in the Panamanian Kuna, andtwo in Circumarctic populations. Central Asian popu-lations share a few sequences with eastern Asian groups;for instance, six sequences are shared with the Han Chi-nese, five are shared with Koreans, and four are sharedwith the Ainu. Central Asian populations share a totalof 15 sequences with Mongols (Kolman et al. 1996) and9 sequences with Turks (96 individuals, pooled fromCalafell et al. 1996; Comas et al. 1996; Richards et al.1996). Six of the nine sequences shared with Turks,which characterize 18 Turkish individuals, are alsofound all over Europe, whereas the rest, found only onceeach in Turks, are common in eastern Asian populationsbut have not been described in Europeans. Central Asianpopulations share a total of 17 different sequences withEuropean populations (in a combined set of 1,420 Eur-opean individuals) and a total of 12 with eastern Asianpopulations. Of the sequences shared with Europeansor with East Asians, only two sequences have been foundin Europe as well as in eastern Asia. It should be stressedthat, although central Asians share sequences with Eur-opeans and eastern Asians, these two latter groups ofpopulations have very few sequences in common. Onlyone Chinese, one Ainu, and two Korean sequences havebeen found in Europe, which implies that Europeans andeastern Asians present nearly nonoverlapping mtDNAsequence pools.
Nucleotide Diversity
For every site, the nucleotide in the reference sequenceis the most frequent in each population, except for po-sition 16223 which presents a C in the reference butshows a high frequency of T in the populations studied(50.9% in Kazakhs, 48.9% in the Sary-Tash Kirghiz,68.8% in the Talas Kirghiz, and 41.8% in the Uighurs).A high level of polymorphism was also found at position16362, which presents a T in the reference sequence anda high frequency of C in the populations studied (32.7%in Kazakhs, 29.8% in the Sary-Tash Kirghiz, 43.8% in
1828 Am. J. Hum. Genet. 63:1824–1838, 1998
the Talas Kirghiz, and 32.7% in Uighurs). Nucleotidediversity in central Asia ranges from .0164 in the Uighursto .0185 in the Kazakhs. Those values are similar tothose in Mongolians (.0180) and slightly smaller thanthose in eastern Asian populations, which present nu-cleotide diversities from .0173 in Koreans to .0195 inthe Ainu. European populations present nucleotide di-versities that are less than those found in central Asia;they range from .0082 in Basques (pooled from datareported by Bertranpetit et al. [1995] and Corte-Real etal. [1996]) to .0140 in Tuscany. Turks present a nucle-otide diversity of .0155, smaller than that of centralAsian populations, and Middle Easterners present thehighest value (.0197) observed in European and Asianpopulations. Therefore, nucleotide polymorphism inmtDNA sequences in central Asian populations is in-termediate between those reported for Europe and thosereported for eastern Asia. We cannot exclude, though,that such values are due to the effect of one or a fewnucleotide positions. If the most polymorphic position(i.e., position 16223) is excluded from the analysis, nu-cleotide diversities become .0151–.0171 in central Asia,.0166–.0185 in eastern Asia, .0186 in the Middle East,.0142 in Turkey, and .0081–.0133 in Europe. Although,when position 16223 is removed from the analysis, theabsolute values of nucleotide diversity in central Asiadecrease and approach those found in Turkey, both thegeneral trend of nucleotide diversity in Eurasia and therelative position of central Asia in it remain. This is alsotrue when the second most polymorphic position, po-sition 16362, is also removed: with both position 16223and position 16362 excluded, nucleotide diversities are.0139–.0159 in central Asia, .0152–.0173 in easternAsia, .0180 in the Middle East, .0139 in Turkey, and.0079–.0131 in Europe.
Pairwise Differences
The mean pairwise differences in central Asian pop-ulations (table 1) range from 5.91 in the Uighurs to 6.64in the Kazakhs. When these values are compared withthose in other populations, it is apparent that, on onehand, central Asian populations have slightly lower val-ues than the eastern Asian groups, whose mean valuesrange from 6.68 in Koreans to 7.51 in the Ainu, and,on the other hand, the values found in central Asia arehigher than the mean pairwise differences found in Eur-opeans (range 3.15–5.03; Comas et al. 1997) and Turks(5.45). Again, our results show an intermediate positionof central Asia, between Europe and eastern Asia.
Pairwise-difference distributions of the four centralAsia populations are clearly bell-shaped, with peaks atfive (Uighur), six (Kazakh and Sary-Tash Kirghiz), andseven (Talas Kirghiz) differences. The distribution de-rived by Rogers and Harpending (1992) for pairwise
differences could be fitted to the distributions observedin all four central Asian populations. All four centralAsian samples presented low, negative Tajima’s (1989)D statistics, and, except for the Talas Kirghiz, those Dstatistics were significantly lower than the values thatwould be expected under equilibrium. Even with mu-tation rates varying across nucleotide positions, low Ta-jima’s D statistics and bell-shaped pairwise-differencedistributions can be interpreted as the hallmark of anancient population expansion (Aris-Brosou and Excof-fier 1996). However, given the uncertainty about themutation-rate estimates for the hypervariable region ofhuman mtDNA (Howell et al. 1996; Parsons et al.1997), there is some controversy about which expansionevent is reflected in human mtDNA (Paabo 1996; How-ell and Mackey 1997; Macaulay et al. 1997). Thus, Har-pending et al. (1993) point to the Pleistocene expansion(∼100,000 years ago) as being linked to the spread ofanatomically modern humans out of Africa, whereasWatson et al. (1996) favor a later date (10,000–2,000years ago) and associate bell-shaped pairwise distribu-tions with populations that have undergone the ecolog-ical and demographic transition from food gathering tofood production. Nonetheless, it seems difficult to acceptsuch recent dates, even in light of high mutation rates(Bandelt and Foster 1997).
Genetic Structure of Central Asian Populations
The genetic structure of the four central Asian sampleswas investigated by AMOVA (Excoffier et al. 1992).When the four populations were treated as single groups,we found that 99.54% of the genetic variation remainedwithin populations, whereas the remaining 0.46%(which is not significantly different from 0 [ ;P 5 .094910,000 iterations]) of the variance could be attributedto differences between populations. Next, we subdividedthe populations into mountain dwellers (the Kazakhsand Sary-Tash Kirghiz, both from localities at an altitudeof 2,000 m above sea level) and plains dwellers (theUighurs and Talas Kirghiz). The fraction of genetic var-iance that could be apportioned to this partition was,according to AMOVA, 20.52% ( ), indicatingP 5 .6635that genetic variance within any ecological group waslarger than that between groups and, therefore, that thedivision by altitude is not reflected in mtDNA variation.Similarly, when populations were grouped by language(three groups—Kirghiz, Kazakh, and Uighur, all be-longing to the Turkic branch of the Altaic family), lin-guistic affiliation did not contribute to the genetic var-iance (20.47%; ). In summary, mtDNAP 5 .8325sequence variation in these central Asian samples ap-pears to be homogeneous among populations, with(within the statistical power of AMOVA) no discernible
Comas et al.: mtDNA Sequences in Central Asian Populations 1829
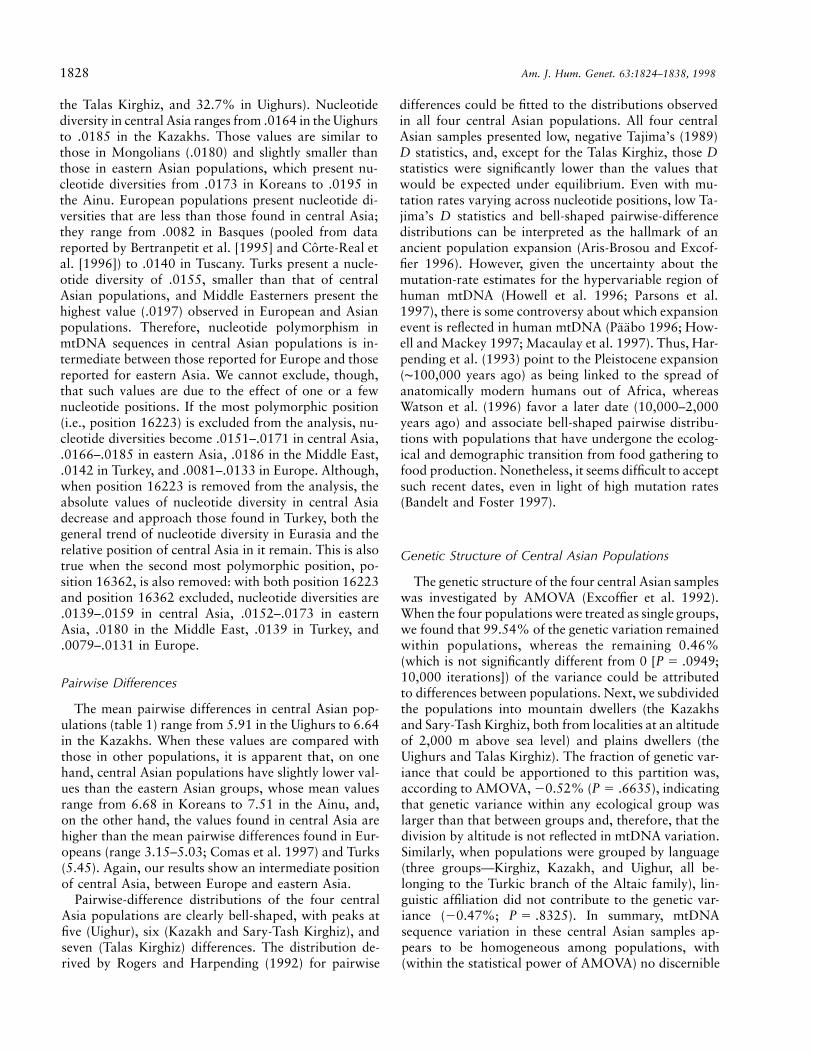
Figure 2 Neighbor-joining tree of several European and Asianpopulations. For the references to the original data, see the Materialand Methods section. Bootstraps supports 150% are shown in thenodes of the tree. The arrow points to the segment from which anAfrican outgroup (!Kung San) would branch.
differentiation according to altitudinal habitat or lin-guistic group.
Genetic Distances
Genetic distances (not shown) between central Asianpopulations and eastern Asian, Indian, western Asian,and European populations were calculated as describedin the Material and Methods section. The four centralAsian populations presented the shortest genetic dis-tances among themselves, and Mongolians are the pop-ulation genetically closest to these central Asian groups.If African populations are added to the analysis, theypresent large genetic distances to all other populations.It is interesting to note that Turks present shorter geneticdistances to the British than to central Asians, eventhough the central Asian populations’ samples in thepresent study speak Turkic languages. A neighbor-join-ing tree was built as described in the Material and Meth-ods section, with the genetic distances estimated on thebasis of the mismatch-intermatch distance. The robust-ness of the tree was assessed by means of 1,000 bootstrapreplicates (Efron 1982; Felsenstein 1985), a consensustree was built, and bootstrap supports 150% have beenrepresented on its nodes (fig. 2). It is evident that centralAsian populations occupy a position intermediate be-tween the eastern Asian (Chinese, Korean, and Ainu)and the Western (Middle Eastern, British, and Turk)populations. Not surprisingly, the most robust nodes arethose that cluster together the eastern Asian populationson one end and the Western populations on the otherend. No robust branches subdivided the central Asianpopulations.
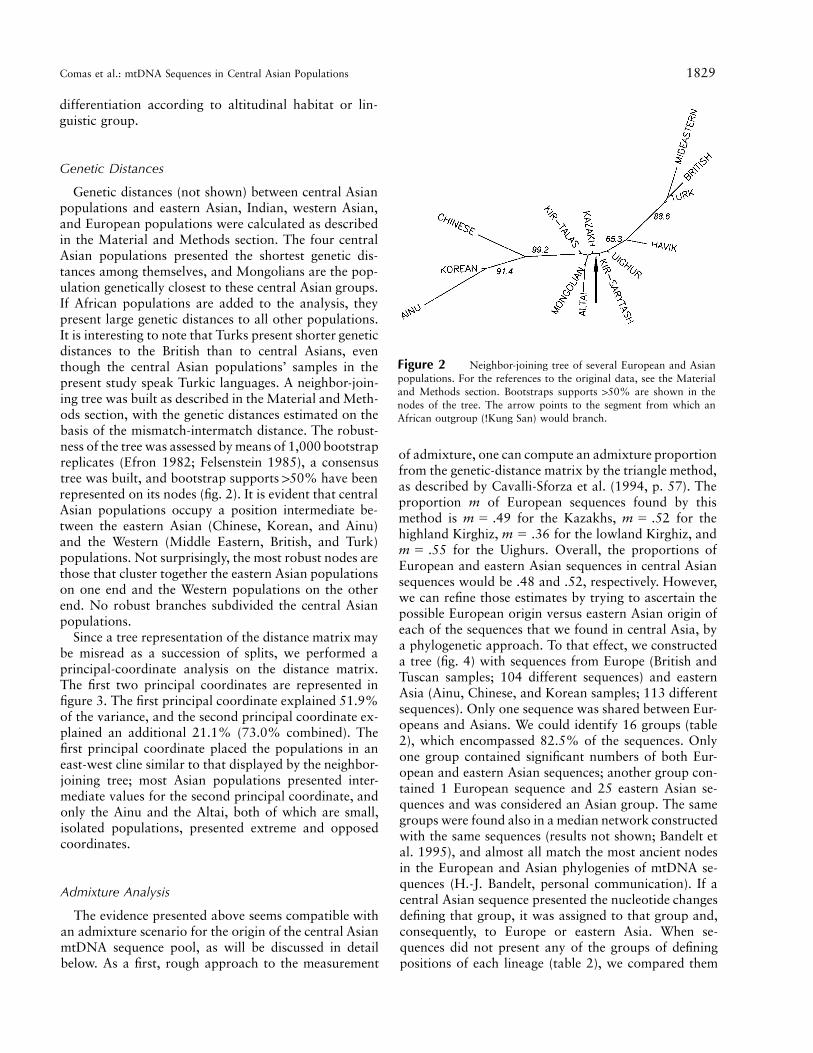
Since a tree representation of the distance matrix maybe misread as a succession of splits, we performed aprincipal-coordinate analysis on the distance matrix.The first two principal coordinates are represented infigure 3. The first principal coordinate explained 51.9%of the variance, and the second principal coordinate ex-plained an additional 21.1% (73.0% combined). Thefirst principal coordinate placed the populations in aneast-west cline similar to that displayed by the neighbor-joining tree; most Asian populations presented inter-mediate values for the second principal coordinate, andonly the Ainu and the Altai, both of which are small,isolated populations, presented extreme and opposedcoordinates.
Admixture Analysis
The evidence presented above seems compatible withan admixture scenario for the origin of the central AsianmtDNA sequence pool, as will be discussed in detailbelow. As a first, rough approach to the measurement
of admixture, one can compute an admixture proportionfrom the genetic-distance matrix by the triangle method,as described by Cavalli-Sforza et al. (1994, p. 57). Theproportion m of European sequences found by thismethod is for the Kazakhs, for them 5 .49 m 5 .52highland Kirghiz, for the lowland Kirghiz, andm 5 .36
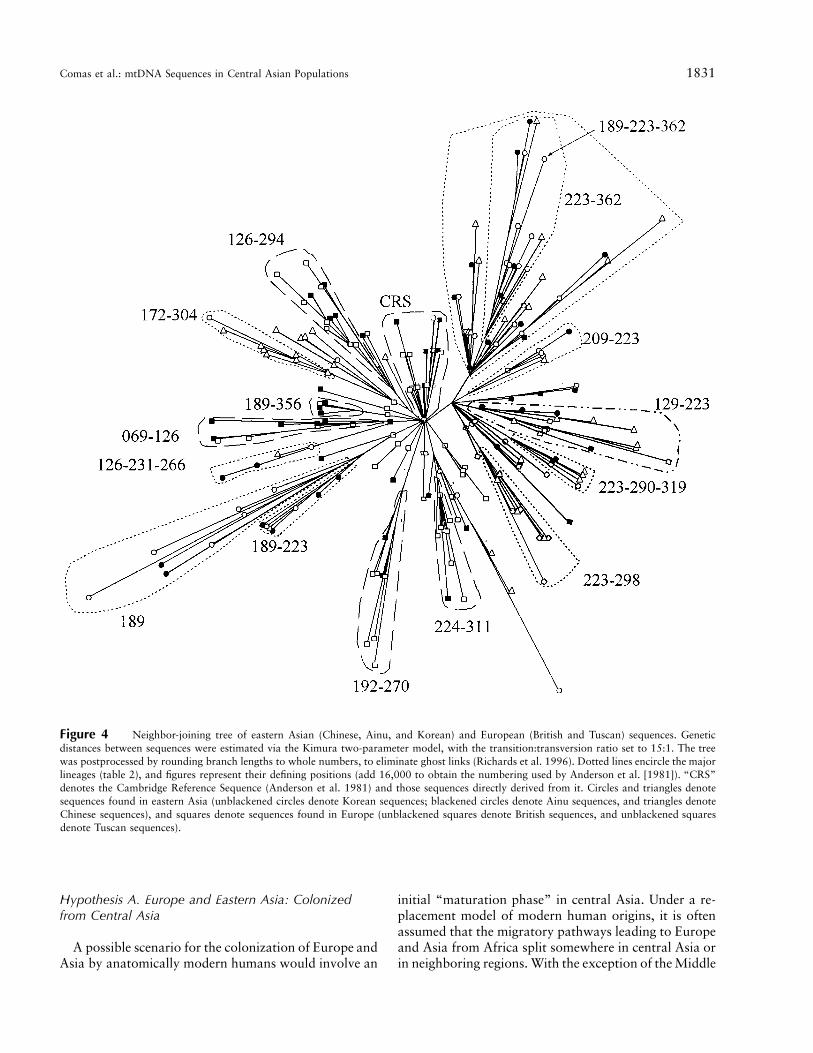
for the Uighurs. Overall, the proportions ofm 5 .55European and eastern Asian sequences in central Asiansequences would be .48 and .52, respectively. However,we can refine those estimates by trying to ascertain thepossible European origin versus eastern Asian origin ofeach of the sequences that we found in central Asia, bya phylogenetic approach. To that effect, we constructeda tree (fig. 4) with sequences from Europe (British andTuscan samples; 104 different sequences) and easternAsia (Ainu, Chinese, and Korean samples; 113 differentsequences). Only one sequence was shared between Eur-opeans and Asians. We could identify 16 groups (table2), which encompassed 82.5% of the sequences. Onlyone group contained significant numbers of both Eur-opean and eastern Asian sequences; another group con-tained 1 European sequence and 25 eastern Asian se-quences and was considered an Asian group. The samegroups were found also in a median network constructedwith the same sequences (results not shown; Bandelt etal. 1995), and almost all match the most ancient nodesin the European and Asian phylogenies of mtDNA se-quences (H.-J. Bandelt, personal communication). If acentral Asian sequence presented the nucleotide changesdefining that group, it was assigned to that group and,consequently, to Europe or eastern Asia. When se-quences did not present any of the groups of definingpositions of each lineage (table 2), we compared them
1830 Am. J. Hum. Genet. 63:1824–1838, 1998
Figure 3 Principal-coordinate analysis of distance matrix, among Asian and European populations. The first principal coordinate explains51.9% of the variation, and the second explains 21.1%, for a combined percentage of 73.0%. Population abbreviations are as in figure 1.
with our extended database. For a sequence to be as-signed either to eastern Asia or to Europe, it had to beidentical to, or to differ in no more than two nucleotidesfrom, a sequence found exclusively in Europe or easternAsia. That approach allowed us to identify 93.7% ofcentral Asian sequences as belonging to an already se-quenced eastern Asian or European lineage (table 3). Anaverage of 33.2% of the individuals in our central Asiansamples bore a sequence belonging to a European line-age. This fraction became 35.4% when the unassignedsequences were not taken into account. The proportionof eastern Asian, European, and unassigned sequenceswas not significantly different across central Asian pop-ulations ( , 6 df, ).2x 5 7.67 P 5 .264
Discussion
Torroni et al. (1994) did not find, in mtDNA RFLPsin Tibetans, any selective effects attributable to high al-titude; we can reach similar conclusions with control-region sequences when comparing lowland and highlandcentral Asian populations. As stated above, the geneticvariance attributable to altitude is not significantly dif-ferent from 0. Moreover, Fu’s (1997) Fs-test presents verysimilar values in the highland and the lowland Kirghiz(220.249 and 220.627, respectively, both of which aresignificantly negative [ ]). Such an excess of low-P ! .005frequency segregating nucleotides could be produced bya population expansion, selection, or both. It is unlikelythat selection would have acted to almost exactly thesame extent that a population expansion did in lowlandpopulations, as would be indicated by Fu’s Fs, and that,
after selection, mutation would have regenerated, at highaltitudes, a sequence pool that resembles so closely thatof low-altitude populations. Therefore, we are unable todetect any effects of selection in the mtDNA controlregion (and, given the absence of recombination inmtDNA, that is true for the whole molecule). Never-theless, this does not preclude the existence of selectivechanges in one or more of the multiple nuclear genescoding for respiratory-chain proteins.
The results of the present study consistently show thatthe central Asia mtDNA sequences present features thatare intermediate between those found in Europe andeastern Asia. This is especially patent in the following:(i) the cline of the frequency of certain nucleotides inspecific positions, such as those found at positions 16223and 16362; (ii) polymorphism at the nucleotide level, asmeasured by nucleotide diversity—even when the effectsof clinal nucleotide positions are discounted; (iii) theaverage pairwise-difference values, which are interme-diate between those of Europe and those of eastern Asia;and (iv) genetic distances, which locate the central Asianpopulations between Europe and eastern Asia. Severalpopulation history scenarios could have produced theintermediate genetic features of central Asian mtDNAsequences; some hypotheses that could be put forth—such as an Asian colonization of Europe, or viceversa—find no support in archaeological knowledge andwould contradict other mtDNA evidence (Ballinger etal. 1992). However, some of the analyses that we per-formed will allow us to assess the degree to which other,more plausible hypotheses are supported by mtDNAevidence.
Comas et al.: mtDNA Sequences in Central Asian Populations 1831
Figure 4 Neighbor-joining tree of eastern Asian (Chinese, Ainu, and Korean) and European (British and Tuscan) sequences. Geneticdistances between sequences were estimated via the Kimura two-parameter model, with the transition:transversion ratio set to 15:1. The treewas postprocessed by rounding branch lengths to whole numbers, to eliminate ghost links (Richards et al. 1996). Dotted lines encircle the majorlineages (table 2), and figures represent their defining positions (add 16,000 to obtain the numbering used by Anderson et al. [1981]). “CRS”denotes the Cambridge Reference Sequence (Anderson et al. 1981) and those sequences directly derived from it. Circles and triangles denotesequences found in eastern Asia (unblackened circles denote Korean sequences; blackened circles denote Ainu sequences, and triangles denoteChinese sequences), and squares denote sequences found in Europe (unblackened squares denote British sequences, and unblackened squaresdenote Tuscan sequences).
Hypothesis A. Europe and Eastern Asia: Colonizedfrom Central Asia
A possible scenario for the colonization of Europe andAsia by anatomically modern humans would involve an
initial “maturation phase” in central Asia. Under a re-placement model of modern human origins, it is oftenassumed that the migratory pathways leading to Europeand Asia from Africa split somewhere in central Asia orin neighboring regions. With the exception of the Middle

1832 Am. J. Hum. Genet. 63:1824–1838, 1998
Table 2
Sequence Groups Identified in a Sequence Tree Built with 113Eastern Asian (Han Chinese, Korean, and Ainu) and 104 European(British and Tuscan) Sequences
GROUP-DEFINING
POSITION(S)
NO. OF SEQUENCES IN
Eastern Asian European
16189C 8 016189C/16223T 7 016126C/16231C/16266T 4 016172C/16304C 9 016223T/16298C 9 016223T/16290T/16319A 7 016223T/16209C 6 016223T/16362C 25 116223C/16362C/16189 C 8 016223T/16129A 9 616126C/16294T 0 1116126C/16069T 0 1016224C/16311C 0 1216189C/16356C 0 616192T/16270 T 0 8CRSa 0 26Unassigned 14 24
a Cambridge reference sequence and those stemming directly fromit.
Table 3
Frequency of Sequences Identified as Eastern Asian or European, inFour Central Asian Populations
NO. (%) OF SEQUENCES
Eastern Asian European Unassigned
Kazakh 31 (56.4%) 22 (40.0%) 2 (3.6%)Talas Kirghiz 35 (72.9%) 12 (25.0%) 1 (2.1%)Sary-Tash Kirghiz 28 (59.6%) 15 (31.9%) 4 (8.5%)Uighur 30 (54.5%) 19 (34.5%) 6 (10.9%)
Total 124 (60.5%) 68 (33.2%) 13 (6.3%)
NOTE.—The assignment of sequences was based, first, on the pres-ence of the defining positions for eastern Asian and European groups(see table 2) and, second, on direct comparison with an extended setof eastern Asian and European mtDNA sequences.
East, central Asian populations have higher mean pair-wise differences than are seen in European and westernAsian populations, which would lend support to thishypothesis. However, an expansion from central to east-ern Asia does not seem compatible with the higher meanpairwise differences and nucleotide polymorphism.Moreover, the simultaneous colonization of Europe andeastern Asia from central Asia might have implied over-lapping mtDNA sequence pools between the two colo-nized regions, which is not the case.
Hypothesis B. Central Asian mtDNA Sequences: TheResult of Admixture between European and EasternAsian Sections
Intermediate nucleotide diversity, pairwise-differencemeans, and genetic distances, as well as a slightly ele-vated sequence diversity, are compatible with the centralAsian mtDNA pool being an admixture of eastern Asianand European lineages. As shown in the Results section,Europe and eastern Asia share very few mtDNA se-quences, whereas central Asia shares sequences withboth groups of populations; the sequences found in oursample as well as in eastern Asia are different than thesequences shared by Europeans and central Asians.Moreover, of the two sequences shared by all four centralAsian samples, one (identical to the Cambridge referencesequence) is the most frequent in Europe, whereas theother (bearing 16223T and 16362C) is the most frequentin eastern Asia. We found control-region sequences incentral Asia that bear the motifs that are often associated
with Asian RFLP haplotypes A–D (Torroni et al. 1993)and with European haplogroups H, J, K, T, V, and W(Torroni et al. 1996, 1998). However, it is extremelydifficult to associate control-region sequences with theAsian superhaplogroup M (A. Torroni, personal com-munication). If central Asian mtDNA sequences are as-sumed to have a mixed origin, then the proportionof European sequences can be estimated as being35%–48%, depending on the method, with the lowerlimit presumably being the more accurate estimate.
The dynamics of the process that generated the mix-ture of eastern Asian and European mtDNA sequencesin central Asia is less clear. The same end result couldbe achieved through gene flow from the East and theWest along the main trade routes during many genera-tions, by migrations of whole groups during a shortertime span, or by a combination of both processes. Ge-netic distances and their representation by principal-co-ordinate analysis point to Mongols and/or Chinese asthe possible source of eastern Asian sequences in centralAsia. The Silk Road crossed the region, and it couldhave channeled migration along the east-west axis ofEurasia. However, we cannot exclude that admixturetook place either before the establishment of the SilkRoad or after its demise. Both the fact that an extinctIndo-European language, Tocharian, was spoken in thearea during the latter half of the 1st millennium A.D.(Ruhlen 1991, pp. 35–36) and the recent discovery ofmummified bodies with European facial traits point tothe presence of Western peoples in central Asia. Theanalysis of mtDNA in those mummies could add addi-tional support to the admixture hypothesis. Thus, al-though it is not possible to pinpoint the process thatgenerated the central Asian peoples, it is clear that thedifferent gene pools that merged in their formation hadalready diverged in the outer reaches of the Eurasiancontinent.
A further issue that can be investigated with the resultsthat we have presented is the relation between the Turksand central Asian populations. Both the Turks and the

Comas et al.: mtDNA Sequences in Central Asian Populations 1833
populations that we have studied speak languages be-longing to the Turkic branch of the Altaic family. Duringthe 11th century A.D., Turkic nomads (such as the Seljuqsand the Ottomans, among others) occupied the grass-land in the interior of Asia Minor, imposing their lan-guage and replacing Anatolian, an extinct branch of theIndo-European family (Ruhlen 1991, pp. 35–36), by anelite dominance process (Renfrew 1987, pp. 131–133).Whereas the historical and cultural consequences of theTurkic invasion of Anatolia were profound, the geneticcontribution of the Turkic peoples to the modern Turkishpopulation seems less significant. Previous studies (Cal-afell et al. 1996; Comas et al. 1996) have shown thatthe mtDNA pool found in Turkey can be interpreted asthe result of upper Paleolithic and/or Neolithic expan-sions from the Middle East to Europe, with a small con-tribution by Asian sequences. The present results showthat those sequences were found in the Turkic centralAsian peoples, whose ancestors may have brought theAsian mtDNA sequences to Anatolia. Nevertheless, itshould be stressed that, in the study of mtDNA se-quences, only the female lineages are taken into account,whereas processes such as invasions by nomadic peoplesmight have been carried out basically by male warriors.Therefore, although, in the present study, we found ev-idence for a small influx of female lineages from centralAsia to Turkey, a more complete picture of the history
of Turkic populations could emerge if nuclear and Y-chromosome markers were analyzed.
Acknowledgments
This research was supported by Direccion General de In-vestigacion Cientıfico Tecnica (Spain) grants PB92-0722 andPB95-0267-C02-01, by Human Capital and Mobility con-tracts (networks ERC-CRHX-CT920032 and ERB-CHRX-CT920090) to J.B., by Direccio General de Recerca,Generalitat de Catalunya grants 1995SGR00205 and1996SGR00041, and by the Institut d’Estudis Catalans. Thiswork was also made possible thanks to Spanish Ministry ofEducation and Science fellowship FI/93-1151 to D.C., FP93to A.P.-L., and AP96 to R.M.-A.; Comissionat per a Univer-sitats i Recerca, Generalitat de Catalunya fellowship FI/96-1153 to E.B. and postdoctoral fellowship to F.C.; and the Uni-versity of Barcelona fellowships to E.M. and J.C. We are alsothankful for the help and technical assistance offered by thestaff of the Unitat de Sequenciacio, Servei Cientıfico-Tecnic,Universitat de Barcelona. The Laboratory of Anthropology ofthe Academy of Sciences of Kazakhstan (Prof. O. Ismagulovand Dr. A Ismagulova) is gratefully acknowledged for helpwith the fieldwork. The CAHAP research project was partiallysupported by MURST grants to F.F. and D.P. and by privategrants from AGIP SpA (Milano). We also thank the people ofSary-Tash, Talas, Keghen, and Penjim for their hospitality andcooperation.
Appendix
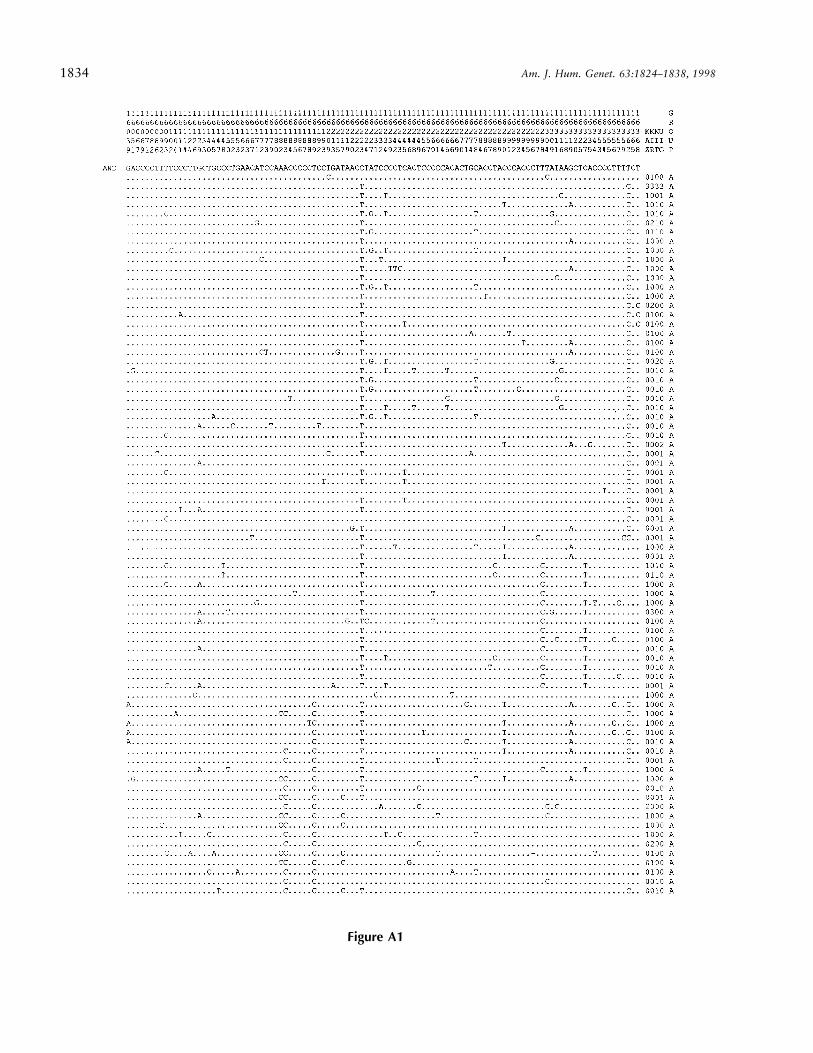
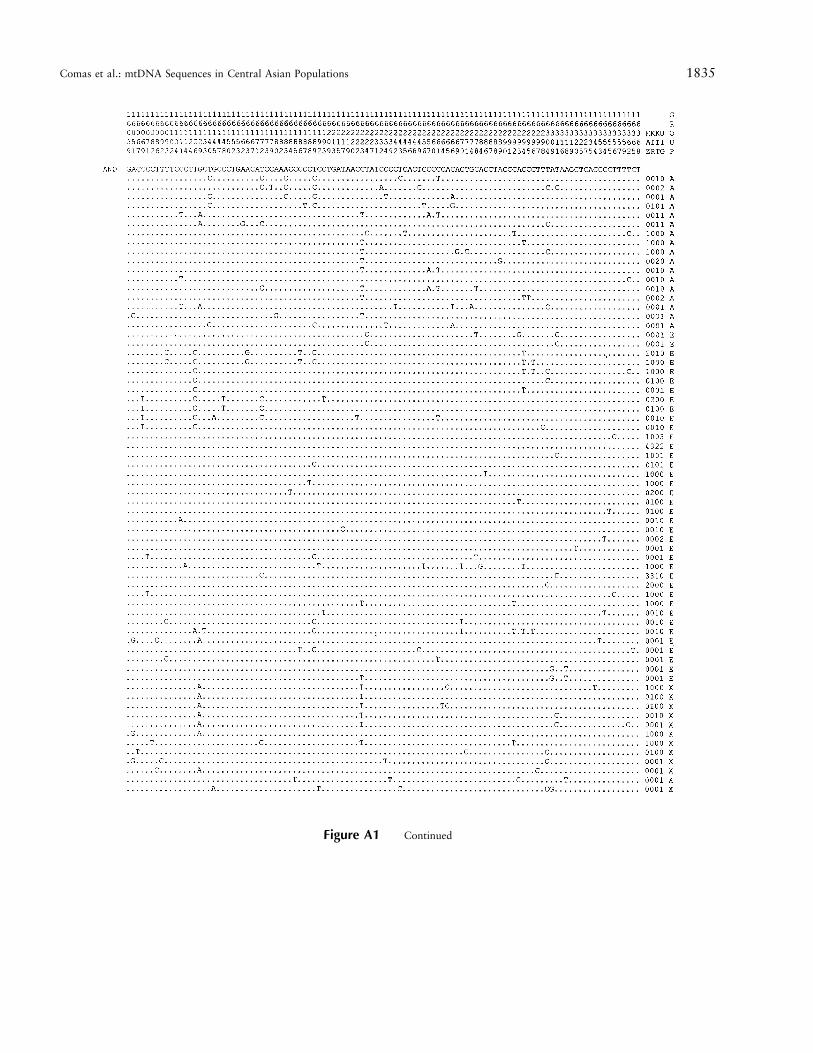
mtDNA Control-Region Segment I Sequences in Central Asian Populations
In the Appendix figure (displayed on the following two pages), dots (.) denote identity with the reference sequence(AND [Anderson et al. 1981]), and numbers at the end of each sequence indicate the absolute frequencies of eachsequence in the Kazakhs (KAZ), the highland Kirghiz (KIR), the lowland Kirghiz (KIT), and the Uighurs (UIG).Each sequence either has been considered to be of eastern Asian origin (denoted by an “A” at the end of the line)or European origin (denoted by an “E” at the end of the line) or has been left unassigned (denoted by an “X” atthe end of the line).
1834 Am. J. Hum. Genet. 63:1824–1838, 1998
Figure A1
Comas et al.: mtDNA Sequences in Central Asian Populations 1835
Figure A1 Continued
1836 Am. J. Hum. Genet. 63:1824–1838, 1998
References
Anderson S, Bankier AT, Barrell BG, de Bruijn MHL, CoulsonAR, Drouin J, Eperon IC, et al (1981) Sequence and organ-ization of the human mitochondrial genome. Nature 290:457–465
Anthony DW, Brown DR (1991) The origins of horsebackriding. Antiquity 65:22–38
Anthony DW, Vinogradov (1995) Birth of the chariot. Ar-chaeology 28(2): 36–41
Aris-Brosou S, Excoffier L (1996) The impact of populationexpansion and mutation rate heterogeneity on DNA se-quence polymorphism. Mol Biol Evol 13:494–504
Ballinger SW, Schurr TG, Torroni A, Gan YY, Hodge JA, Has-san K, Chen K-H, et al (1992) Southeast Asian mitochon-drial DNA analysis reveals genetic continuity of ancientMongoloid migrations. Genetics 130:139–152
Bandelt H-J, Forster P (1997) The myth of bumpy hunter-gatherer mismatch distributions. Am J Hum Genet 61:980–983
Bandelt H-J, Forster P, Sykes B, Richards MB (1995) Mito-chondrial portraits of human populations using median net-works. Genetics 141:743–753
Batista O, Kolman CJ, Bermingham E (1995) MitochondrialDNA diversity in the Kuna Amerinds of Panama. Hum MolGenet 4:921–929
Battistini N, Facchini F, Bedogni G, Severi S, Fiori G, PettenerD (1995) The prediction of extracellular and total bodywater from bioelectric impedance in a non-Caucasian pop-ulation from central Asia. Ann Hum Biol 22:315–320
Bedogni G, Battistini N, Severi S, Facchini F, Pettener D, FioriG (1997) Body water distribution in Kirghiz highlandersversus lowlanders. Ann Hum Biol 24:533–538
Bertranpetit J, Sala J, Calafell F, Underhill PA, Moral P, ComasD (1995) Human mitochondrial DNA variation and the or-igin of the Basques. Ann Hum Genet 59:63–81
Bowles GT (1977) The peoples of Asia. Weidenfeld & Nic-olson, London
Cabot EL (1988) ESEE: the eyeball sequence editor, version1.06. University of British Columbia, Burnaby
Calafell F, Underhill PA, Tolun A, Angelicheva D, KalaydjievaL (1996) From Asia to Europe: mitochondrial DNA se-quence variability in Bulgarians and Turks. Ann Hum Genet60:35–49
Cavalli-Sforza LL, Menozzi P, Piazza A (1994) The history andgeography of human genes. Princeton University Press,Princeton
Comas D, Calafell F, Mateu E, Perez-Lezaun A, BertranpetitJ (1996) Geographic variation in human mitochondrialDNA control region sequence: the population history of Tur-key and its relationship to the European populations. MolBiol Evol 13:1067–1077
Comas D, Calafell F, Mateu E, Perez-Lezaun A, Bosch E, Ber-tranpetit J (1997) Mitochondrial DNA variation and theorigin of the Europeans. Hum Genet 99:443–449
Corte-Real HBSM, Macaulay VA, Richards MB, Hariti G,Issad MS, Cambon-Thomsen A, Papiha S, et al (1996)Genetic diversity in the Iberian Peninsula determined
from mitochondrial sequence analysis. Ann Hum Genet60:331–350
Di Rienzo A, Wilson AC (1991) Branching pattern in the ev-olutionary tree for human mitochondrial DNA. Proc NatlAcad Sci USA 88:1597–1601
Efron B (1982) The jackknife, the bootstrap and other resam-pling plans. Society for Industrial and Applied Mathematics,Philadelphia
Excoffier L, Smouse PE, Quattro JM (1992) Analysis of mo-lecular variance inferred from metric distances among DNAhaplotypes: application to human mitochondrial DNA re-striction data. Genetics 131:479–491
Ewens WJ (1972) The sampling theory of selectively neutralalleles. Theor Popul Biol 3:87–112
Facchini F, Pettener D, Rimondi A, Sichimbaeva K, Riva P,Salvi P, Pretolani E, et al (1997) Taste sensitivity to PTC andthyroid function (FT4 and TSH) in high- and low-altitudeKirgiz populations in the Pamir. Hum Biol 69:97–106
Facchini F, Toselli S, Ismagulov O, Fiori G, Ismagulova A,Pettener D (1998) Body composition in central Asian pop-ulations: I. Fat patterning variation in the Kazakhs of theTien Shan mountains (2,100 m) and the Uighurs of the Se-mericia. Am J Hum Biol 10:241–247
Felsenstein J (1985) Confidence limits on phylogenies: an ap-proach using the bootstrap. Evolution 35:785–791
——— Felsenstein J (1989) PHYLIP: phylogeny inferencepackage, version 3.2. Cladistics 5:164–166
Francalacci P, Bertranpetit J, Calafell F, Underhill PA (1996)Sequence diversity of the control region of mitochondrialDNA in Tuscany and its implications for the peopling ofEurope. Am J Phys Anthropol 100:443–460
Fu Y-X (1997) Statistical tests of neutrality of mutationsagainst population growth, hitchhiking and background se-lection. Genetics 147:915–925
Gower JC (1966) Some distance properties of latent root andvector methods used in multivariate analysis. Biometrika 53:325–338
Graven L, Passarino G, Semino O, Boursot P, Santachiara-Benerecetti S, Langaney A, Excoffier L (1995) Evolutionarycorrelation between control region sequence and restrictionpolymorphisms in the mitochondrial genome of a large Sene-galese Mandenka sample. Mol Biol Evol 12:334–345
Handt O, Meyer S, von Haeseler A (1998) Compilation ofhuman mtDNA control region sequences. Nucleic Acids Res26:126–129
Handt O, Richards M, Trommsdorff M, Kilger C, SimanainenJ, Georgiev O, Bauer K, et al (1994) Molecular genetic anal-yses of the Tyrolean Ice Man. Science 264:1775–1778
Harpending H, Sherry ST, Rogers AR, Stoneking M (1993)The genetic structure of ancient human populations. CurrAnthropol 34:483–496
Horai S, Murayama K, Hayasaka K, Matsubayashi S, HattoriY, Fucharoen G, Harihara S, et al (1996) mtDNA poly-morphism in East Asian populations, with special referenceto the peopling of Japan. Am J Hum Genet 59:579–590
Howell N, Kubacha I, Mackey DA (1996) How rapidly doesthe human mitochondrial genome evolve? Am J Hum Genet59:501–509

Comas et al.: mtDNA Sequences in Central Asian Populations 1837
Howell N, Mackey D (1997) Reply to Macaulay et al. Am JHum Genet 61:986–990
Kolman CJ, Bermingham E, Cooke R, Ward RH, Arias TD,Guionneau-Sinclair F (1995) Reduced mtDNA diversity inthe Ngobe Amerinds of Panama. Genetics 140:275–283
Kolman CJ, Sambuughin N, Bermingham E (1996) Mito-chondrial DNA analysis of Mongolian populations and im-plications for the origin of New World founders. Genetics142:1321–1334
Lum JK, Rickards O, Ching C, Cann RL (1994) Polynesianmitochondrial DNAs reveal three deep maternal lineageclusters. Hum Biol 66:567–590
Macaulay VA, Richards MB, Forster P, Bendall KE, WatsonE, Sykes B, Bandelt H-J (1997) mtDNA mutation rates: noneed to panic. Am J Hum Genet 61:983–986
Mountain JL, Hebert JM, Bhattacharyya S, Underhill PA, Ot-tolenghi C, Gadgil M, Cavalli-Sforza LL (1995) Demo-graphic history of India and mtDNA-sequence diversity. AmJ Hum Genet 56:979–992
Nei M (1987) Molecular evolutionary genetics. Columbia Uni-versity Press, New York
Nei M, Tajima F (1981) DNA polymorphism detectable byrestriction endonucleases. Genetics 97:145–163
Paabo S (1996) Mutational hot spots in the mitochondrialmicrocosm. Am J Hum Genet 59:493–496
Parsons TJ, Muniec DS, Sullivan K, Woodyatt N, Alliston-Greiner R, Wilson MR, Berry DL, et al (1997) A high ob-served substitution rate in the human mitochondrial DNAcontrol region. Nat Genet 15:363–368
Pettener D, Facchini F, Luiselli D, Toselli S, Rimondi A, Is-magulova A, Sichimbaeva K, et al (1997) Physiologicaladaptability, thyroid function, body composition and geneticvariability in central Asia high altitude populations. ActaAndina 6:217–226
Piercy R, Sullivan KM, Benson N, Gill P (1993) The ap-plication of mitochondrial DNA typing to the study ofwhite Caucasian genetic identification. Int J Legal Med106:85–90
Pinto F, Gonzalez AM, Hernandez M, Larruga JM, CabreraVM (1996) Genetic relationship between the Canary Is-landers and their African and Spanish ancestors inferredfrom mitochondrial DNA sequences. Ann Hum Genet 60:321–330
Pult I, Sajantila A, Simanainen J, Georgiev O, Schaffner W,Paabo S (1994) Mitochondrial DNA sequences from Swit-zerland reveal striking homogeneity of European popula-tions. Biol Chem Hoppe Sayler 375:837–840
Rao CR (1982) Diversity and dissimilarity coefficients: a uni-fied approach. Theor Popul Biol 21:24–43
Renfrew C (1987) Archaeology and language: the puzzle ofIndoeuropean origins. Jonathan Cape, London
Richards M, Corte-Real H, Forster P, Macaulay V, Wilkinson-Herbots H, Demaine A, Papiha S, et al (1996) Paleolithicand Neolithic lineages in the European mitochondrial genepool. Am J Hum Genet 59:185–203
Rogers AR, Harpending H (1992) Population growth makeswaves in the distribution of pairwise genetic differences. MolBiol Evol 9:552–569
Ruhlen M (1991) A guide to the world’s languages. StanfordUniversity Press, Stanford
Saitou N, Nei M (1987) The neighbor-joining method: a newmethod for reconstructing phylogenetic trees. Mol Biol Evol4:406–425
Sajantila A, Lahermo P, Anttinen T, Lukka M, Sistonen P,Savontaus ML, Aula P, et al (1995) Genes and languages inEurope: an analysis of mitochondrial lineages. Genome Res5:42–52
Santos M, Ward RH, Barrantes R (1994) mtDNA variationin the Chibcha Amerindian Huetar from Costa Rica. HumBiol 66:963–977
Schneider S, Kueffer JM, Roessli D, Excoffier L (1996) Arle-quin: a software environment for the analysis of populationgenetics data, version 1.0. Genetics and Biometry Lab, Uni-versity of Geneva, Geneva
Sellier J, Sellier A (1993) Atlas des peuples d’Orient. Editionsde la Decouverte, Paris
Shields GF, Schmiechen AM, Frazier BL, Redd A, VoevodaMI, Reed JK, Ward RH (1993) mtDNA sequences sug-gest a recent evolutionary divergence for Beringian andnorthern North American populations. Am J Hum Ge-net 53:549–562
Stenico M, Nigro L, Bertorelle G, Calafell F, Capitanio M,Corrain C, Barbujani G (1996) High mitochondrial se-quence diversity in linguistic isolates of the Alps. Am J HumGenet 59:1363–1375
Tajima F (1989) Statistical method for testing the neutral mu-tation hypothesis by DNA polymorphism. Genetics 123:585–595
Torroni A, Bandelt H-J, D’Urbano L, Lahermo P, Moral P,Sellitto D, Rengo C, et al (1998) mtDNA analysis reveal amajor late paleolithic population expansion from south-western to northeastern Europe. Am J Hum Genet 62:1137–1152
Torroni A, Huoponen K, Francalacci P, Petrozzi M, MorelliL, Scozzari R, Obinu D, et al (1996) Classification of Eur-opean mtDNAs from an analysis of three European popu-lations. Genetics 144:1835–1850
Torroni A, Miller JA, Moore LG, Zamudio S, Zhuang J,Droma T, Wallace DC (1994) Mitochondrial DNA analysisin Tibet: implications for the origin of the Tibetan popu-lation and its adaptation to high altitude. Am J Phys An-thropol 93:189–199
Torroni A, Sukernik, RI, Schurr TG, Starikovskaya YB,Cabell MF, Crawford MF, Comuzzie AG, et al (1993)mtDNA variation of aboriginal Siberians reveals distinctgenetic affinities with Native Americans. Am J Hum Ge-net 53:591–608
Vigilant L, Pennington R, Harpending H, Kocher TD, WilsonAC (1989) Mitochondrial DNA sequences in single hairsfrom a southern African population. Proc Natl Acad Sci USA86:9350–9354
Vigilant L, Stoneking M, Harpending H, Hawkes K, WilsonAC (1991) African populations and the evolution of humanmitochondrial DNA. Science 253:1503–1507
Ward RH, Frazier BL, Dew-Jager K, Paabo S (1991) Extensivemitochondrial diversity within a single Amerindian tribe.Proc Natl Acad Sci USA 88:8720–8724
Ward RH, Redd A, Valencia D, Frazier BL, Paabo S (1993)Genetic and linguistic differentiation in the Americas. ProcNatl Acad Sci USA 90:10663–10667

1838 Am. J. Hum. Genet. 63:1824–1838, 1998
Ward RH, Salzano FM, Bonatto SL, Hutz MH, CoimbraCEA, Santos RV (1996) Mitochondrial DNA polymor-phism in three Brazilian Indian tribes. Am J Hum Biol8:317–323
Watson E, Bauer K, Aman R, Weiss G, von Haeseler A, Paabo
S (1996) mtDNA sequence diversity in Africa. Am J HumGenet 59:437–444
Watson E, Forster P, Richards M, Bandelt H-J (1997) Mito-chondrial footprints of human expansions in Africa. Am JHum Genet 61:691–704