Plasma levels of matrix metalloproteinase-9 in a normal ...
148
Linköping University Medical Dissertations No. 1072 Plasma levels of matrix metalloproteinase‐9 in a normal population ‐ a psychoneuroendocrinological approach Peter Garvin Division of Community Medicine Department of Medical and Health Sciences Linköping University, Sweden Linköping 2008
-
Upload
khangminh22 -
Category
Documents
-
view
1 -
download
0
Transcript of Plasma levels of matrix metalloproteinase-9 in a normal ...
Linköping University Medical Dissertations No. 1072
Plasma levels of matrix metalloproteinase‐9 in a normal
population
‐ a psychoneuroendocrinological approach
Peter Garvin
Division of Community Medicine Department of Medical and Health Sciences
Linköping University, Sweden
Linköping 2008
© Peter Garvin, 2008 Cover picture/illustration: The drawing “Stress” (ink on paper 148 mm x 105 mm, 2002) is used with kind permission from Dr Hugo Heyrman. Source: Museums of the Mind, www.doctorhugo.org. A digital file of the drawing was provided by personal communication. Published articles have been reprinted with permission from the copyright holder. Paper I is an open access article distributed under the terms of the Creative Commons Attribution License, which permits unrestricted use, distribution, and reproduction in any medium. Paper III has been reprinted with permission from the editorial office of Scandinavian Journal of Clinical and Laboratory Investigation. Printed in Sweden by LiU‐Tryck, Linköping, Sweden, 2008. Linköping University medical dissertations No. 1072 ISBN 978‐91‐7393‐831‐0 ISSN 0345‐0082

In memory of Olav Axelson; 1937‐2004
Read not to contradict and confute, nor to believe and take for granted…
…but to weigh and consider. (Sir Francis Bacon; 1552‐1626)

Preface
PREFACE
To understand any work that has been done, one will find many clues in the background of the conductor. My undergraduate background and interests put me academically somewhere in the interface between physiology and epidemiology. Thus, it came as a natural continuation in my academic training to further explore this interface. My post‐graduate training has been focused on how to plan, implement, and conduct a study in a normal population. Even though I would like to think that I once was able to conduct laboratory work with fair efficiency and accuracy, and hopefully will be able to update those skills one day, this dissertation is mainly a desktop product from my perspective. It has been performed without the need of a lab coat. It is my personal belief that the use of observational studies in normal populations is a crucial component in medical research as a whole, elucidating the findings from clinical and experimental designs. The sections regarding biomarkers and pathophysiological pathways are kept to introductory overviews in this dissertation. I am well aware that simplifications have been made throughout those sections, which might appear somewhat incomplete for those dedicated to natural science and medicine. On the other hand, only a small fraction of researchers in the field of social medicine and public health science (the field comprising this dissertation) have a background in biology and chemistry. They are by far outnumbered by those with a background in sociology and behavioral sciences. For the latter group, this dissertation may be considered to be too detailed regarding its content on physiological mechanisms. It is an inevitable clinch that has to be dealt with, a necessary price to pay whenever exploring the interface between adjacent disciplines. I have tried to balance both standings in this dissertation, being stuck in the circular reasoning that there is no point in studying mechanisms without studying the determinants and equally pointless to study determinants without caring for the mechanisms. The attempt to balance these two throughout the dissertation is fuelled by the perhaps somewhat optimistic but sincere aim that both natural science reductionists as well as those that prefer qualitative data will find the dissertation to be of relevance. It should be noted that this dissertation is just one piece in the puzzle. It is the first dissertation based on data from the Life conditions, Stress, and Health
Preface
(LSH)‐study, but there are many more in the making from this rich data set. The analyses are for now limited to cross‐sectional. Hopefully, even more intriguing results are yet to come, when prospective data on cardiovascular outcome are merged into the data set. I was recruited in 2002 to the LSH‐project, in the planning phase of the study, and have been working on it ever since. Thus, even though the dissertation as such is a big step in my academic development, since the beginning of my post‐graduate training my concerns have included not only these few studies, but also the progress of the LSH‐study as a whole. During my research training, I have attended the multidisciplinary Graduate school of Health, Care, and Society, Linköping University and the seminar series held by Cardiovascular Inflammation Research Centre (CIRC), Linköping University, for students in post‐graduate training. My research training is now reaching its end. My research as such however, has just begun. This dissertation is dedicated to the memory of Olav Axelson (1937‐2004), late professor in epidemiology at Linköping University. With his sharp intellect, warmth, and caring support, he had a tremendous influence on me during my time as a Master’s student in public health. Professor Axelson was without a doubt the most influential person who inspired my choice to pursue post‐graduate training.
Contents
1
CONTENTS
ABSTRACT........................................................................................................................................................... 5
LIST OF PAPERS ................................................................................................................................................ 6
WORD LIST AND ABBREVIATIONS.............................................................................................................. 7
1. INTRODUCTION........................................................................................................................................... 11 1.1 RATIONALE FOR THE DISSERTATION ........................................................................................................... 11 1.2 CORONARY ARTERY DISEASE...................................................................................................................... 14
1.2.1 Atherosclerosis – an inflammatory disease ....................................................................................... 15 1.3 TRADITIONAL RISK FACTORS FOR CORONARY ARTERY DISEASE ................................................................. 16
1.3.1 Physiological characteristics............................................................................................................. 17 Hypertension ........................................................................................................................................................... 17 Dyslipidemia ........................................................................................................................................................... 18 Diabetes mellitus..................................................................................................................................................... 19 Obesity .................................................................................................................................................................... 20 C-reactive protein.................................................................................................................................................... 21
1.3.2 Behavioral risk factors....................................................................................................................... 21 Smoking .................................................................................................................................................................. 22 Alcohol intake ......................................................................................................................................................... 22 Physical activity ...................................................................................................................................................... 22 Fruit and vegetable intake ....................................................................................................................................... 23
1.3.3 Population attributable risk............................................................................................................... 23 1.4 PSYCHOSOCIAL FACTORS AND CORONARY ARTERY DISEASE ...................................................................... 25
1.4.1 Psychosocial factors and the link to stress ........................................................................................ 26 The general adaptation syndrome............................................................................................................................ 26 The concept of allostasis ......................................................................................................................................... 28 The cognitive activation theory of stress................................................................................................................. 29
1.4.2 Psychosocial factors – positive and negative aspects........................................................................ 31 Social support.......................................................................................................................................................... 32 Psychosocial resources............................................................................................................................................ 33 Psychosocial risk factors ......................................................................................................................................... 34
1.5 CORTISOL ................................................................................................................................................... 35 1.6 MATRIX METALLOPROTEINASE-9................................................................................................................ 37
1.6.1 Plausibility of MMP-9 in coronary artery disease ............................................................................ 39 1.6.2 MMP-9 in other conditions and diseases........................................................................................... 40
1.7 A PSYCHONEUROENDOCRINOLOGICAL MODEL............................................................................................ 40 1.8 OUTLINE OF THE DISSERTATION.................................................................................................................. 43
2. AIMS ................................................................................................................................................................ 45 2.1 GENERAL AIM ............................................................................................................................................. 45 2.2 SPECIFIC AIMS............................................................................................................................................. 45
3. MATERIAL AND METHODS...................................................................................................................... 47 3.1 THE LSH-STUDY......................................................................................................................................... 47
3.1.1 Aims and model of the LSH-study...................................................................................................... 47 3.1.2 Study design ....................................................................................................................................... 49 3.1.3 Study population ................................................................................................................................ 49 3.1.4 Random sample procedure ................................................................................................................ 50 3.1.5 Data collection................................................................................................................................... 51 3.1.6 Ethical considerations ....................................................................................................................... 51
3.2 PRIMARY HEALTH CARE CENTER VISIT........................................................................................................ 52 3.2.1 Physiological characteristics............................................................................................................. 52
3.3 QUESTIONNAIRES........................................................................................................................................ 53 3.3.1 Behavioral risk factors for cardiovascular disease ........................................................................... 53
Smoking .................................................................................................................................................................. 53
Contents
2
Alcohol.................................................................................................................................................................... 53 Physical activity ...................................................................................................................................................... 54 Fruit and vegetable intake ....................................................................................................................................... 54
3.3.2 Psychosocial instruments................................................................................................................... 55 Availability of attachment....................................................................................................................................... 56 Availability of social integration............................................................................................................................. 56 Mastery ................................................................................................................................................................... 57 Self-esteem.............................................................................................................................................................. 57 Sense of coherence.................................................................................................................................................. 58 Hostile affect ........................................................................................................................................................... 58 Cynicism ................................................................................................................................................................. 59 Depression............................................................................................................................................................... 59 Vital exhaustion ...................................................................................................................................................... 60
3.3.3 Ongoing medication and previous diagnoses .................................................................................... 60 3.4 MEASUREMENTS OF BIOMARKERS .............................................................................................................. 61
3.4.1 Matrix metalloproteinase-9 ............................................................................................................... 61 Tissue inhibitor of metalloproteinases-1 ................................................................................................................. 61
3.4.2 Cortisol .............................................................................................................................................. 61 3.4.3 C-reactive protein .............................................................................................................................. 63
3.5 SPECIFIC STUDY DESIGNS............................................................................................................................ 63 3.6 STATISTICAL METHODS............................................................................................................................... 64
4. RESULTS IN BRIEF...................................................................................................................................... 69 4.1 GENERAL FINDINGS ON MMP-9.................................................................................................................. 69 4.2 SPECIFIC FINDINGS...................................................................................................................................... 70
4.2.1 Paper I, MMP-9 and cardiovascular risk factors.............................................................................. 70 4.2.2 Paper II, MMP-9 and psychosocial factors ....................................................................................... 72 4.2.3 Paper III, Reliability of pooling cortisol............................................................................................ 74 4.2.4 Paper IV, MMP-9 and cortisol .......................................................................................................... 75
5. GENERAL DISCUSSIONS ........................................................................................................................... 77 5.1 THE CHOICE OF MMP-9 AS A BIOMARKER .................................................................................................. 77 5.2 ON GENERAL FINDINGS OF MMP-9............................................................................................................. 78 5.3 ON SPECIFIC FINDINGS ................................................................................................................................ 80
5.3.1 Paper I, MMP-9 and cardiovascular risk factors.............................................................................. 80 5.3.2 Paper II, MMP-9 and psychosocial factors ....................................................................................... 81 5.3.3 Paper III, Reliability of pooling cortisol............................................................................................ 82 5.3.4 Paper IV, MMP-9 and cortisol .......................................................................................................... 82
5.4 IMPLICATIONS OF THE FINDINGS ................................................................................................................. 83 5.4.1 The psychoneuroendocrinological model revisited ........................................................................... 83 5.4.2 Specificity of cardiovascular disease?............................................................................................... 85
5.5 METHODOLOGICAL CONSIDERATIONS......................................................................................................... 86 5.5.1 Participation rate and possibility to generalize................................................................................. 87 5.5.2 Exclusions in the analyses ................................................................................................................. 87 5.5.3 Assessment of MMP-9........................................................................................................................ 88
Plasma versus serum ............................................................................................................................................... 88 Effect of storage in the freezer ................................................................................................................................ 88 Outliers.................................................................................................................................................................... 88 Assessment of TIMP-1............................................................................................................................................ 89
5.5.4 Assessment of cortisol........................................................................................................................ 90 Pooling samples – misclassification of information? .............................................................................................. 90 Outliers.................................................................................................................................................................... 91
5.5.5 Assessment of psychosocial factors ................................................................................................... 92 Unique entities or overlapping constructs? ............................................................................................................. 92
5.5.6 Assessment of traditional risk factors ................................................................................................ 94 Total risk load ......................................................................................................................................................... 94 Reversed causation for smoking and alcohol intake................................................................................................ 94
6. FUTURE RESEARCH ................................................................................................................................... 96
7. CONCLUDING REMARKS.......................................................................................................................... 97
8. SUMMARY IN SWEDISH ............................................................................................................................ 98
Contents
3
9. ACKNOWLEDGEMENTS............................................................................................................................ 99 9.1 GRANTS ...................................................................................................................................................... 99 9.2 PERSONNEL INVOLVED IN THE LSH-STUDY .............................................................................................. 100
9.2.1 Staff at participating Primary health care centers .......................................................................... 100 9.2.2 Laboratory assistants....................................................................................................................... 101 9.2.3 Other functions ................................................................................................................................ 102
9.3 PARTICIPANTS IN THE LSH-STUDY ........................................................................................................... 102 9.4 PERSONAL GRATITUDES............................................................................................................................ 102
10. REFERENCES............................................................................................................................................ 107
APPENDIX............................................................................................................................................................. I INVITATIONAL LETTER TO THE LSH-STUDY (IN SWEDISH) .................................................................................. I ORTH-GOMÉR’S AVAILIBILITY OF EMOTIONAL SUPPORT ................................................................................... II ORTH-GOMÉR’S AVAILABILITY OF SOCIAL INTEGRATION................................................................................. III PEARLIN’S MASTERY SCALE.............................................................................................................................. IV PEARLIN’S SELF-ESTEEM SCALE ......................................................................................................................... V ANTONOVSKY’S SENSE OF COHERENCE............................................................................................................. VI COOK MEDLEY’S HOSTILE AFFECT SCALE........................................................................................................ VII COOK-MEDLEY’S CYNICISM SCALE................................................................................................................. VIII CENTRE FOR EPIDEMIOLOGICAL STUDIES DEPRESSION SCALE .......................................................................... IX MAASTRICHT QUESTIONNAIRE OF VITAL EXHAUSTION...................................................................................... X

4
Abstract
5
ABSTRACT
Several large‐scale epidemiological studies have demonstrated the prognostic significance of psychosocial factors and stress for coronary artery disease (CAD). Observations of sudden changes in CAD incidence have led to the proposal of mechanisms regarding atherosclerotic plaque vulnerability. The collagen‐degrading enzyme matrix metalloproteinase‐9 (MMP‐9) is increased in rupture‐prone plaques with high inflammatory activity, and circulating levels of MMP‐9 are raised in patients with acute coronary syndrome. However, the distribution of MMP‐9 levels and its relations to psychosocial factors and the stress hormone cortisol have not been previously explored in a normal population. The aim of this dissertation was to examine in a normal population the association of circulating levels of MMP‐9 with traditional cardiovascular risk factors including levels of C‐reactive protein (CRP), with psychosocial factors, and with saliva levels of cortisol. In addition, the reliability of a new method of ambulatory saliva sampling for assessment of cortisol levels was evaluated. A sub‐sample of the Life conditions, Stress, and Health (LSH)‐study, a population based study exploring psychoneuroendocrinological pathways mediating the differences in CAD incidence over socioeconomic status, was used. Plasma levels of MMP‐9 were examined in a sample randomly drawn from the LSH‐study (n=400), aged 45 to 69 years at enrollment. The main findings were: 1) there was a positive association between plasma MMP‐9 levels and total risk load of cardiovascular risk factors. The findings were persistent after adjusting for CRP and could not be attributed to a single risk factor. 2) After adjusting for traditional cardiovascular risk factors and CRP, MMP‐9 levels were positively associated with psychosocial risk factors and negatively associated with psychosocial resources. 3) Pooling saliva samples prior to laboratory analysis were as reliable as arithmetic means for assessment of diurnal cortisol variation in a field research setting. 4) There was a positive association between circulating levels of MMP‐9 and saliva levels of cortisol, both diurnal peak level and evening level of cortisol. The observed associations between MMP‐9 and traditional cardiovascular risk factors, psychosocial factors, and saliva cortisol levels suggest a psychoneuroendocrinological pathway linking stress to plaque vulnerability and provide increased understanding of the association between psychosocial factors and CAD.
List of papers
6
LIST OF PAPERS
Roman letters (I‐IV) are used when referring to any of the four papers that constitute the base of this dissertation. I. Circulating matrix metalloproteinase‐9 is associated with
cardiovascular risk factors in a middle aged normal population. Garvin P, Nilsson L, Carstensen J, Jonasson L, Kristenson M. PLoS ONE 2008;3: e1774. doi: 10.1371/journalpone/.0001774 running title: MMP‐9 and cardiovascular risk factors
II. Plasma levels of matrix metalloproteinase‐9 are independently
associated with psychosocial factors in a middle aged normal population. Garvin P, Nilsson L, Jonasson L, Carstensen J, Kristenson M. submitted April 2008. running title: MMP‐9 and psychosocial factors
III. Pooling ambulatory saliva cortisol samples over consecutive days –
as reliable as arithmetic means. Garvin P, Carstensen J, Kristenson M. Scandinavian Journal of Clinical and Laboratory Investigation, 2008 Feb 11:1‐5 [Epub ahead of print]. running title: Reliability of pooling cortisol
IV. Association between circulating levels of matrix metalloproteinase‐9
and cortisol in a normal population. Garvin P, Carstensen J Jonasson L, Nilsson L, Kristenson M. Manuscript. running title: MMP‐9 and cortisol

Word list and abbreviations
7
WORD LIST AND ABBREVIATIONS
The following words used in the dissertation may require explanation for those not academically skilled in natural science or medicine: allostasis Greek for “to stand in variability”, denoting stability
through change. Term used for a system that responds to requirements by an adequate temporary physiological shift.
anabolic Greek for “to build up”. A physiological process promoting growth and cellular synthesis.
angiogenesis Greek for “to originate vessel”. Growth and formation of new blood vessels from pre‐existing vessels.
atherosclerosis Greek for “porridge hardening”, referring to accumulation of lipids and macrophages surrounded by fibrous caps in the artery walls.
basal lamina A thin layer of connective tissue in the vessel wall, anchoring the endothelial cells that are in contact with the blood stream.
catabolic Greek for “to break down”. A physiological process, promoting release of energy by breaking down large molecular structures in smaller units.
collagen The main protein of connective tissue in animals. endogenous Greek for “arising from within”, referring to an internal
process or synthesis in the body. endothelial cells A thin layer of cells in the interior surface of a blood
vessel, serving as the interface between lumen and the vessel wall.
exogenous Greek for “outside production”, referring to something that is not synthesized in the body.
extracellular matrix The complex network of supporting and connective tissue that is not part of any cell.
homeostasis Greek for “to stand equally”, denoting stability through constancy. Term used for a system that remains stable despite shifts in the environment.
in vivo Latin for “within the living”, referring to an experiment or observed phenomenon in a living organism.
Word list and abbreviations
8
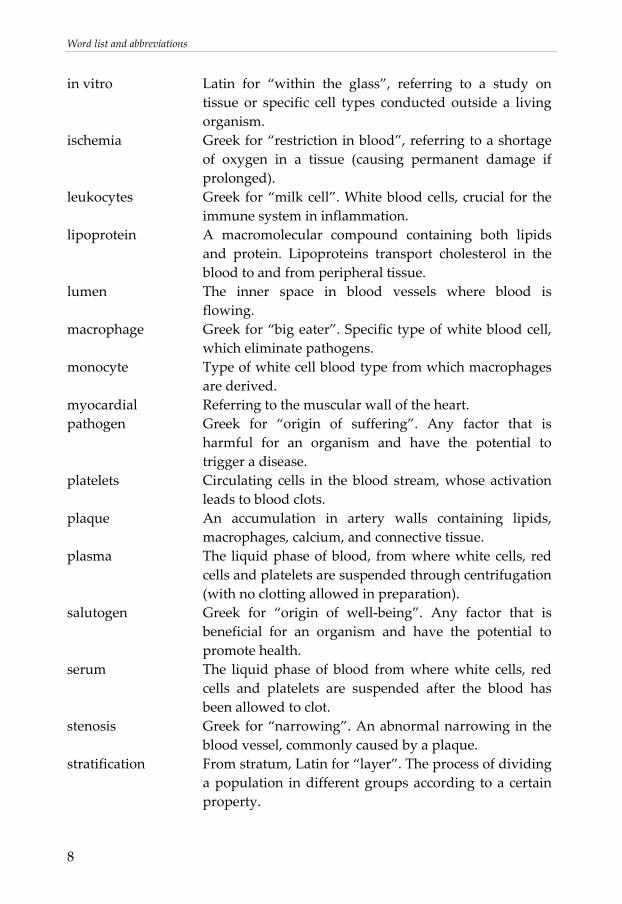
in vitro Latin for “within the glass”, referring to a study on tissue or specific cell types conducted outside a living organism.
ischemia Greek for “restriction in blood”, referring to a shortage of oxygen in a tissue (causing permanent damage if prolonged).
leukocytes Greek for “milk cell”. White blood cells, crucial for the immune system in inflammation.
lipoprotein A macromolecular compound containing both lipids and protein. Lipoproteins transport cholesterol in the blood to and from peripheral tissue.
lumen The inner space in blood vessels where blood is flowing.
macrophage Greek for “big eater”. Specific type of white blood cell, which eliminate pathogens.
monocyte Type of white cell blood type from which macrophages are derived.
myocardial Referring to the muscular wall of the heart. pathogen Greek for “origin of suffering”. Any factor that is
harmful for an organism and have the potential to trigger a disease.
platelets Circulating cells in the blood stream, whose activation leads to blood clots.
plaque An accumulation in artery walls containing lipids, macrophages, calcium, and connective tissue.
plasma The liquid phase of blood, from where white cells, red cells and platelets are suspended through centrifugation (with no clotting allowed in preparation).
salutogen Greek for “origin of well‐being”. Any factor that is beneficial for an organism and have the potential to promote health.
serum The liquid phase of blood from where white cells, red cells and platelets are suspended after the blood has been allowed to clot.
stenosis Greek for “narrowing”. An abnormal narrowing in the blood vessel, commonly caused by a plaque.
stratification From stratum, Latin for “layer”. The process of dividing a population in different groups according to a certain property.
Word list and abbreviations
9
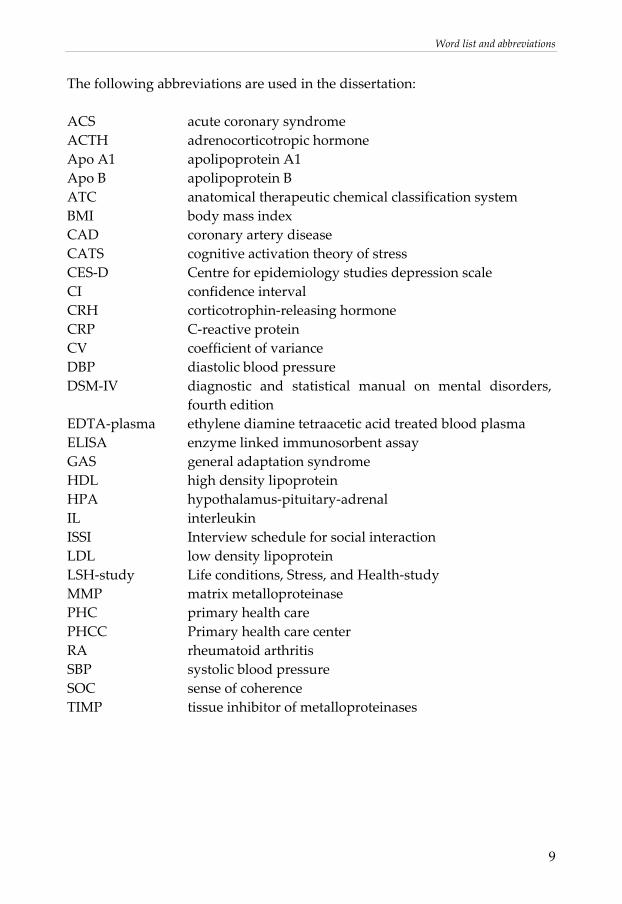
The following abbreviations are used in the dissertation: ACS acute coronary syndrome ACTH adrenocorticotropic hormone Apo A1 apolipoprotein A1 Apo B apolipoprotein B ATC anatomical therapeutic chemical classification system BMI body mass index CAD coronary artery disease CATS cognitive activation theory of stress CES‐D Centre for epidemiology studies depression scale CI confidence interval CRH corticotrophin‐releasing hormone CRP C‐reactive protein CV coefficient of variance DBP diastolic blood pressure DSM‐IV diagnostic and statistical manual on mental disorders,
fourth edition EDTA‐plasma ethylene diamine tetraacetic acid treated blood plasma ELISA enzyme linked immunosorbent assay GAS general adaptation syndrome HDL high density lipoprotein HPA hypothalamus‐pituitary‐adrenal IL interleukin ISSI Interview schedule for social interaction LDL low density lipoprotein LSH‐study Life conditions, Stress, and Health‐study MMP matrix metalloproteinase PHC primary health care PHCC Primary health care center RA rheumatoid arthritis SBP systolic blood pressure SOC sense of coherence TIMP tissue inhibitor of metalloproteinases

10
Introduction
11
1. INTRODUCTION
1.1 Rationale for the dissertation
When the outline was drawn for this dissertation, it was based on the following four main arguments: 1. The inverse gradient in incidence of coronary artery disease over socioeconomic position can not be explained by lifestyle alone.
A number of studies from more than eight decades has shown that there is an inverse gradient between socioeconomic position and health [1]. Life expectancy differs several years when stratified over socioeconomic position [2‐6]. The differences in health are consistent regardless of how socioeconomic position is measured (in terms of income, education, occupation, employment, or immigrant status) [2,7,8]. The inverse gradient is apparent for a number of outcomes, with coronary artery disease (CAD) as one of the more prominent [1,2,7‐9]. A clustering of cardiovascular risk factors has been reported in several studies, where people in lower socioeconomic position tend to smoke more, have a higher alcohol intake, a lower fruit and vegetable intake, and less physical activity [10]. However, the difference in CAD incidence can not be fully attributed to lifestyle [11‐14]. Further, it has been shown that the widening of inequalities of CAD incidence over time had little or no relation to changes in social distribution of traditional cardiovascular risk factors [11]. It has therefore been suggested that psychosocial factors, at least in part, could explain the gradient in cardiovascular incidence over socioeconomic position [8‐10,12]. 2. There are a number of epidemiological studies which have shown an association between psychosocial factors and CAD.
There are a considerable number of epidemiologic studies pointing out the prognostic significance of psychosocial factors for CAD [15‐24]. In particular, depression at clinical or sub‐clinical levels has been shown to predict CAD in prospective studies [15‐19]. The INTERHEART‐study, the largest case‐control
Introduction
12
study conducted so far on myocardial infarction (n=15,152+14,820), points out that psychosocial factors is the third most influential risk factor next to smoking and dyslipidemia [25]. The independent association between psychosocial factors and CAD is however not widely recognized, as the suggested mechanisms as yet are tentative and not fully empirically verified [19,26,27]. Further studies on plausible mechanisms are needed to better understand and evaluate the epidemiological findings. 3. There are changes in CAD incidence that cannot be explained by changes in lifestyle.
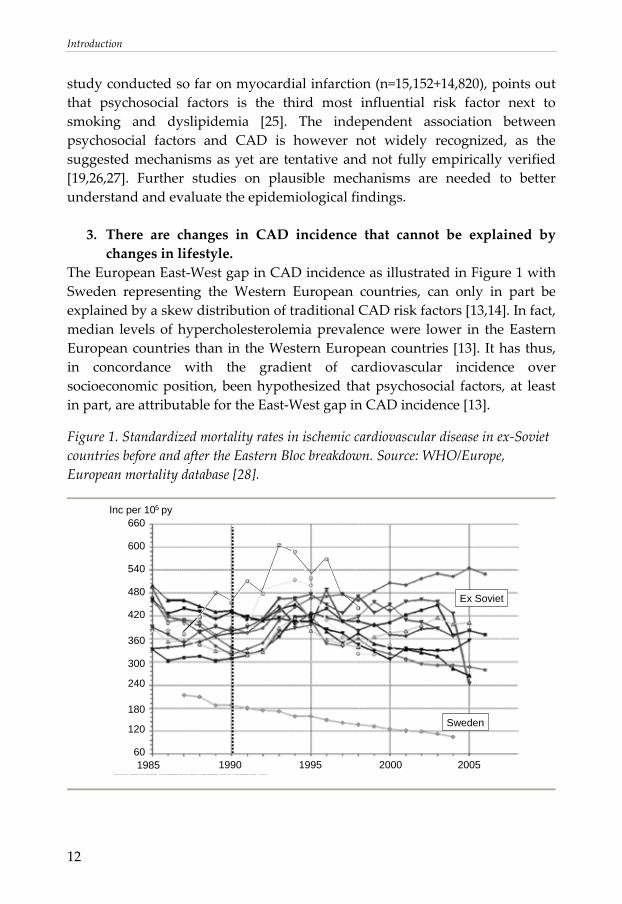
The European East‐West gap in CAD incidence as illustrated in Figure 1 with Sweden representing the Western European countries, can only in part be explained by a skew distribution of traditional CAD risk factors [13,14]. In fact, median levels of hypercholesterolemia prevalence were lower in the Eastern European countries than in the Western European countries [13]. It has thus, in concordance with the gradient of cardiovascular incidence over socioeconomic position, been hypothesized that psychosocial factors, at least in part, are attributable for the East‐West gap in CAD incidence [13].
Figure 1. Standardized mortality rates in ischemic cardiovascular disease in ex‐Soviet countries before and after the Eastern Bloc breakdown. Source: WHO/Europe, European mortality database [28].
Sweden
Ex Soviet
60
120
180
240
300
360
420
480
540
600
660
1985 1990 1995 2000 2005
Inc per 10 py5
Introduction
13
Further, official statistics reveal that many ex‐Soviet countries experienced an increased mortality in CAD shortly after the Eastern Bloc breakdown in 1990, accompanied by a rapid decline a few years later [28]. Lifestyle factors such as excessive alcohol intake, poor diet, and smoking are an insufficient explanation to the observations, since progression of atherosclerosis is considered to be a slow process, which would be reflected by a less dramatic fluctuation. It has been suggested that stress induced by the transition into a market economy, at least in part can be responsible for the rapid changes in incidence [29‐31]. A similar pattern has been demonstrated in other settings, where dramatic societal or environmental changes of different origins, e.g. caused by political turbulence, caused by earth quakes, and caused by warfare, are accompanied by a sudden rise in CAD [29,32‐35]. 4. The number of unexpected sudden cardiac deaths each year is high.
Even though there are a number of risk factors for CAD that are well‐established both clinically and epidemiologically, the risk factors identified so far still have poor predictive value on an individual basis [36‐38]. Furthermore, even though the presence of at least one risk factor is common in individuals developing CAD [39] and that at least one stenosis are reported in many fatal events [40,41], a large proportion of acute coronary events are unexpected and strike many apparently healthy individuals, free from any of the major established risk factors [42] and with seemingly normal coronary arteries [43]. It is suggested that every year, up to 10,000 deaths in Sweden occur due to unexpected cardiac events [42]. This has led to suggestions of mechanisms affecting vulnerability in the circulatory system e.g. plaque vulnerability, where some individuals are more likely to develop future acute coronary syndrome (ACS) than others, despite having the seemingly same risk load [44]. Taken the four arguments together, it becomes strikingly clear that there are challenges which remain in risk stratification for ACS. Based on the arguments, it was hypothesized that there is a physiological pathway linking stress to plaque vulnerability. Such a pathway could at least in part explain the phenomena described in the arguments. Thus, the conceptual purpose of this dissertation was to investigate a novel marker of plausible relevance for plaque vulnerability using a psychoneuroendocrinological approach. The long‐term goal with the underlying work is to increase the understanding on mechanisms and pathways that could explain the dramatic differences in
Introduction
14
CAD incidence over time or between groups in a society and that could be prevented by intervening on determinants.
1.2 Coronary artery disease
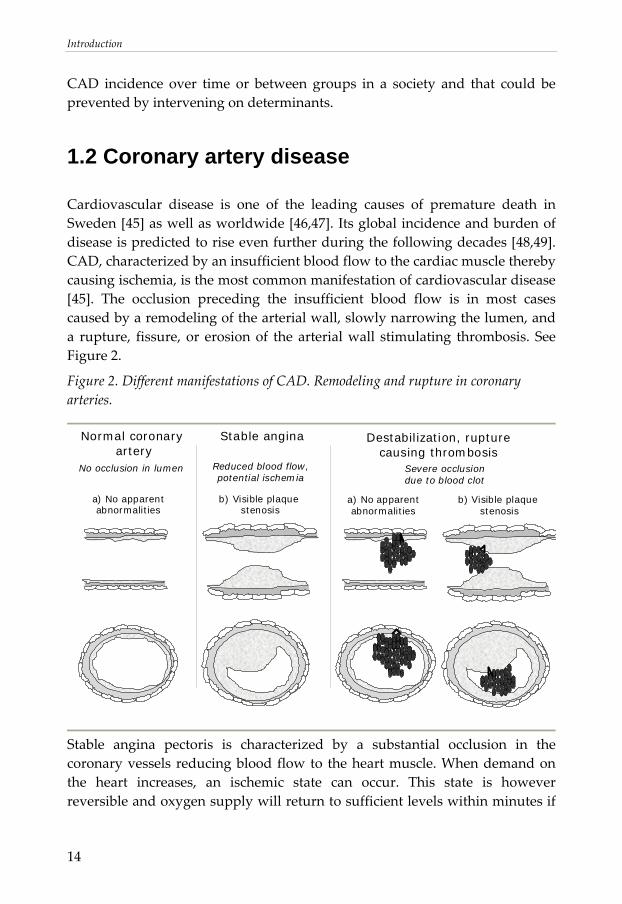
Cardiovascular disease is one of the leading causes of premature death in Sweden [45] as well as worldwide [46,47]. Its global incidence and burden of disease is predicted to rise even further during the following decades [48,49]. CAD, characterized by an insufficient blood flow to the cardiac muscle thereby causing ischemia, is the most common manifestation of cardiovascular disease [45]. The occlusion preceding the insufficient blood flow is in most cases caused by a remodeling of the arterial wall, slowly narrowing the lumen, and a rupture, fissure, or erosion of the arterial wall stimulating thrombosis. See Figure 2.
Figure 2. Different manifestations of CAD. Remodeling and rupture in coronary arteries.
Normal coronary
arteryStable angina
No occlusion in lumen Reduced blood flow,potential ischemia
Severe occlusiondue to blood clot
Destabilization, rupturecausing thrombosis
a) No apparentabnormalities
b) Visible plaque stenosis
a) No apparentabnormalities
b) Visible plaque stenosis
Stable angina pectoris is characterized by a substantial occlusion in the coronary vessels reducing blood flow to the heart muscle. When demand on the heart increases, an ischemic state can occur. This state is however reversible and oxygen supply will return to sufficient levels within minutes if
Introduction
15
the heart is allowed to rest. Typically, the plaques causing occlusions in stable angina pectoris are embedded in thick collagen‐rich fibrous caps. This manifestation is not lethal in itself. Patients with stable angina pectoris can live with an occlusion for many years (although restricted to avoid vigorous physical activity). A more serious event occurs if there is a destabilization of the vessel wall and an atherosclerotic plaque ruptures. When collagen from a ruptured fibrous cap comes in direct contact with the blood stream, platelets become highly activated, causing a blood clot. This reaction may cause a luminal occlusion, leading to a persistently impaired oxygen supply and a life‐threatening ACS. Cardiac cells will die due to the oxygen deficit, causing an eventual myocardial necrosis, which defines a myocardial infarction. For survivors, the damage to the myocardium is permanent after a necrosis has occurred, leaving a collagen scar in the tissue and possibly permanently impaired function of the cardiac muscle. Notably, as depicted in Figure 2, plaque instability is not necessarily connected to the size of the atherosclerotic plaque but may occur also in relatively small plaques.
1.2.1 Atherosclerosis – an inflammatory disease
For years the ruling paradigm has been that atherosclerosis is essentially promoted and maintained by an accumulation of lipids in the walls of large‐ and medium‐sized arteries [50,51]. Over the last decade or so, advances in research have led to a shift in the paradigm, with the establishment of atherosclerosis as an inflammatory process [52‐54]. Inflammation (Latin inflammatio, “to set on fire”) is a complex response to minimize damaging effects of potentially harmful stimuli. In the acute phase of inflammation, the stimulus and damaged tissue are removed and remaining tissue remodeled or regenerated. The inflammatory response is mainly regulated by leukocytes, in particular monocyte‐derived macrophages, which migrate from the lumen of the blood vessels into the tissues. If the inflammation is prolonged, the acute state will be shifted towards a chronic state, characterized by simultaneous and persistent destruction and regeneration of the tissue. Whereas the acute inflammatory response is of utter importance to protect an organism from pathogens, chronic inflammation may be a double‐edged sword. Due to double messages in local signaling
Introduction
16
(stimulating both tissue destruction and repair), there is a risk for breakdown of the vital tissue, further impairing its function. In a simplified model, inflammation in atherosclerosis can be described as an inflammatory response to any kind of harmful stimuli invading or adhering to an arterial wall. If the stimulus is eliminated during the acute phase, the inflammatory process will regress eventually. If the stimulus is persistent, a chronic state will develop with constant inflammatory activity at the local site. The accumulation of lipids is still considered to be a central component of the etiology of CAD, but attention is focused on the role of lipids in inflammation rather than the accumulation in itself. Modified lipoproteins, in particular oxidized low density lipoproteins (LDL), have been pointed out as a main trigger of inflammation in atherosclerosis [55‐57]. A number of other inflammatory stimuli have been suggested as well, including bacterial infection [58,59], exogenous particles from air pollution [60,61], and adherent platelets [62,63]. It has been somewhat debated if the inflammatory activity is centered locally in a culprit plaque causing the subsequent occlusion preceding ACS, or if the inflammatory process is more widespread in the arterial tree. Recent findings have suggested that an ischemic event is not a matter of “one bad atherosclerotic plaque”, but rather a consequence of ongoing inflammatory processes at multiple sites in the arteries [64‐66]. This ongoing inflammation in atherosclerotic plaques may be reflected in circulating blood. Thus, measurements of inflammatory markers in serum or plasma may be used to predict the risk of future risk for ACS [67‐69].
1.3 Traditional risk factors for coronary artery disease
Going back in history six or seven decades, mortality due to infectious disease came under control in the United States and Europe. There was a transition towards a new mortality pattern. Mortality rates for CAD had been steadily increasing in the Unites States since the beginning of the 20th century, and CAD became the leading cause of death around World War II. At that time, little was known about the etiology of CAD. Thus, there were few possibilities to reverse the continuously rising incidence. In 1948, the Framingham Heart Study was initiated by the American National Heart, Lung, and Blood Institute [70]. It was conducted on men and women aged 35 to 62 at enrollment and free from any apparent CAD. The study was conducted on the
Introduction
17
normal population living in the small town of Framingham, Massachusetts (n=5 209). The participants were followed prospectively to outline risk factors for CAD. The study came to be a major contribution to CAD etiology as we know it today, and the project is still running, now following the third generation of participants from Framingham, Massachusetts. Studies on the first generation identified five major risk factors for CAD apart from age, namely hypertension, dyslipidemia, diabetes, obesity and smoking [70]. Today, there are numerous epidemiological, clinical, and experimental studies that strongly support the significance of these risk factors, but others have since then been added. Having the INTERHEART‐study as a benchmark, nine main risk factors have been identified, estimated to attribute to more than 90% of the variance in incidence between groups categorized by exposure [25]. Each of the nine risk factors is described in more detail below. The first eight include hypertension, dyslipidemia, diabetes, obesity, smoking, alcohol intake, low physical exercise, and low fruit and vegetable consumption. These factors are only described briefly, as they are well established in cardiovascular epidemiology and clinical practice. As this thesis is based on a psychoneuroendocrinological approach, the ninth risk factor from the INTERHEART‐study, psychosocial factors, is given a section of its own. A more in‐depth explanation is needed to understand psychosocial factors as a risk factor for CAD as well as to provide adequate background for the results and discussion in this dissertation. In addition, one inflammatory marker, C‐reactive protein (CRP) is presented briefly (apart from the risk factors studied in the INTERHEART‐study), as it has been shown that CRP is a predictor of future coronary events [36,71].
1.3.1 Physiological characteristics
Hypertension
Hypertension refers to an abnormally high arterial pressure, where the systolic blood pressure (SBP) is defined as the peak pressure in the arteries, and the diastolic blood pressure (DBP) is the lowest pressure, just before the new pulse wave in the cardiac cycle. Estimated prevalence of hypertension varies with criteria defined, but regardless of definition, the prevalence is high. In Sweden, it is estimated that at least 10% of the population are hypertensive [72].
Introduction
18
Primary (or essential) hypertension constitutes about 95% of all diagnosed patients with hypertension [73]. The etiology for primary hypertension is not yet known (while secondary hypertension may be caused by for example kidney disease or excessive amounts of endogenous or exogenous steroids or stress hormones) [73]. Notably, the prevalence of primary hypertension increases markedly with age in Western populations [74] which is not the case in traditional societies [35,75]. In normal physiology, central arteries have an important buffering function by dampening pulse waves following cardiac output, reducing the potential damage that a harsh pulse wave would cause due to turbulent shear stress in more peripheral arteries. Subjects with hypertension are characterized by having stiff central arteries which limits this buffering function [76]. Thus, it has been suggested that more peripheral vessels adapt to the harsh pulse waves by becoming more stiff, further limiting the buffering function. The system will by this action adapt to a chronic state of hypertension [35]. The assumption of a chronic state is further strengthened by the fact that there are as of yet no medications that can reverse the hypertensive state. Pharmacological interventions are limited to reducing blood pressure by lifelong treatments.
Dyslipidemia
For almost a century, blood lipids have been suggested to play a crucial role in the development of CAD. In 1913, Antischkow fed rabbits with purified cholesterol and thereafter observed typical atherosclerotic lesions in the walls of the blood vessels. Hypotheses have changed throughout the years and mechanisms have been debated, but the central concept of the predictive value of dyslipidemia, i.e. a lipid imbalance, for future CAD events has remained [77‐81]. Concordant with Antisckow’s early work, total cholesterol was long considered to be the driving force behind atherosclerosis. This was also recognized in the pioneering Framingham study [70]. Later, based on the density of lipoproteins carrying cholesterol, it was discovered that different lipoproteins have different physiological functions and different impacts on the etiology of CAD. A distinction between “bad cholesterol”, low density lipoprotein (LDL) and “good cholesterol”, high density lipoprotein (HDL), was made. A rule of thumb when distinguishing LDL from HDL is that LDL transports cholesterol and fatty acids from the liver to the peripheral tissues i.e. increase the fat content in peripheral tissues. HDL on the other hand transports cholesterol and fatty acids from the peripheral tissues back to the
Introduction
19
liver for excretion or utilization elsewhere i.e. decreases the fat content in peripheral tissues. In concordance with this, high LDL has been shown to be positively associated with CAD incidence [82], whereas HDL is suggested to be protective and negatively associated with CAD incidence [83]. The ratio LDL/HDL has often been used to indicate a dyslipidemia where a high ratio is associated with cardiovascular disease. The distinction of LDL and HDL has had a tremendous impact on clinical work, including pharmacological and other interventions targeting the bad cholesterol, trying to lower LDL levels. In refined analysis, it has been shown that lipoproteins (including both LDL and HDL) are constituted by different types of apolipoproteins (apo) [84,85] as well as other proteins [86], with an inter‐individual variation [86]. Two of these apolipoproteins, apo B and apo A1, have been shown to be better prognostic markers than LDL and HDL, respectively [87‐89]. In the INTERHEART‐study, the apo B/apo A1 ratio was superior to any of the cholesterol measurements for estimation of the risk of acute myocardial infarction [88]. In addition to cholesterol, levels of triglycerides are also taken into account when blood lipid profiles are estimated. Triglycerides are an important source of energy, transporting dietary fat as easy accessible fatty acids. Excessive levels of triglycerides are associated with CAD in univariate analysis. The strong association with obesity and invert relationship with HDL makes it however hard to disentangle the predictive value of triglycerides as a single risk factor [90].
Diabetes mellitus
Insulin is a hormone that has an anabolic effect, causing most of the body’s cells to take up available glucose from the blood stream, use it or store it intracellularly as an energy resource. A poor production of insulin in the pancreas (which is the case in diabetes mellitus type I), or insensitive receptors for insulin at a cellular level (which is the case in diabetes type II), causes high circulating levels of glucose and leads to the use of fat as an energy resource instead of glucose. In brief, apart from increase the susceptibility for dyslipidemia, obesity, and hypertension, the consequences of dysfunctional insulin signaling are suggested to be directly linked to inflammation and CAD, acting in multiple pathways. High glucose content in the blood may lead to a higher glucose uptake than normal in endothelial cells in the vessel wall, one of the few cell types where glucose uptake is not dependent by
Introduction
20
insulin. This in turn, leads to a higher production of glycoproteins in the extracellular matrix, making the vessel wall more prone to rupture [91]. The hyperglycemia in the blood stream also leads to a general glycation of many circulating proteins (e.g. LDL amongst others). The increased glycation leads to an increased vascular inflammatory burden [92,93]. Further, the uptake of fat by tissues normally using glucose as the primary energy source, is likely to cause accumulation of modified LDL, triggering peripheral inflammation as mentioned in section 1.2 [55‐57]. In itself, diabetes is a strong risk factor for CAD, independent of the often co‐varying risk factors of obesity, dyslipidemia, and hypertension. The risk for diabetic subjects to have an acute coronary event has been reported to be two‐fold or higher [25]. However, the prevalence of diabetes is rather low in a normal population. According to WHO, the prevalence in the global population was 2.8% in 2000 [94]. Even though the prevalence is predicted to rise, and that the prevalence rises markedly with age [94], it is still low in comparison to other cardiovascular risk factors. The population attributable risk for CAD is therefore fairly low in comparison to other cardiovascular risk factors [25], see further section 1.3.3.
Obesity
A simple explanation why obesity is a risk factor for CAD is that a larger body requires more oxygen and forces the heart to constantly work harder. As an effect of increased blood volume and cardiac output, obesity is associated with abnormal cardiac function and hypertension [95,96]. Adipose tissue has in itself an important endocrine function, releasing pro‐inflammatory cytokines, and triggers an inflammatory response. It has been suggested that the number of macrophages in adipose tissue is higher in obese persons [97]. The inflammatory activity in adipose tissue is not only a risk factor for CAD, but also associated with increased insulin resistance [98,99], and therefore links obesity with an increased risk for diabetes, providing an indirect pathway between obesity and CAD. In addition, its strong association with high triglycerides and low HDL bring further attribution to obesity as a risk factor for CAD. According to existing guidelines, both body mass index (BMI) and waist circumference should be taken account when estimating obesity as risk factor for disease [100]. The prevalence of obesity is rapidly increasing worldwide. In Sweden, it is estimated that 45% of middle aged women (45‐65 years) and 60% of middle aged men (45‐65 years) are overweight. Further, approximately 12%
Introduction
21
of the women and 15 % of the men in this age span were classified as obese [101].
C-reactive protein
CRP was discovered about eight decades ago in blood from patients with acute fever and illness [102]. When exposing the blood for Streptococcus Pneumoniae, a precipitation with a serum component was observed. The serum reaction could be seen in the acute phase of the disease and diminished as the patients recovered. From a biochemical perspective, the bacterial constituent causing the reaction could be identified as C‐polysaccharides, hence the name C‐reactive. Later on, it was discovered that CRP is not produced specifically in response to S. Pneumoniae, but is rather an acute phase protein that can be triggered by a large variety of stimuli in the early phases of an inflammatory reaction. Like other acute phase proteins, CRP is essentially derived from the liver after induction by pro‐inflammatory cytokines, predominantly interleukin‐6 [103]. CRP is considered to be a central component of the immune system, by activating and regulating the complement pathway [104]. It binds to microbial surfaces, oxidized lipids, and apoptotic cells, facilitating clearance by phagocytosis [105]. In principle, the circulating level of CRP can be described as a marker indicating that some potentially harmful agent is present that the immune system wants to eliminate. It is clinically used to detect ongoing inflammatory processes. Even slight elevations of CRP in serum or plasma, reflecting a low‐grade systemic inflammation are associated with several cardiovascular risk factors [106], but have also been shown to independently predict future coronary events [36,71]. Thus, CRP has been suggested to be a clinically useful biomarker in conjunction with the well‐established cardiovascular risk factors, to increase accuracy in risk stratification.
1.3.2 Behavioral risk factors
In cardiovascular epidemiology, behavioral risk factors are often reduced to include smoking, alcohol intake, physical activity, and fruit and vegetable consumption. Even though there may be other factors of relevance denoting “behavior”, it has been demonstrated in epidemiological studies that these four risk factors, in combination with SBP, dyslipidemia, diabetes and obesity, account for a large part of the risk load regarding CAD [25].

Introduction
22
Smoking
Smoking is without controversy a risk factor for CAD. Numerous epidemiological studies show consistent findings of premature CAD mortality among smokers [25,107‐109]. Smoking acts in multiple pathways to trigger a coronary event. It leads to an impaired ability to carry oxygen in the blood, thereby forcing the heart to work harder. It exerts an oxidative stress thereby damaging blood vessels, and it is strongly thrombotic causing platelet aggregation [110,111]. Further, smoking is tightly associated with inflammation, as the toxicity in the inhaled smoke triggers an acute inflammatory response [110,111]. Accordingly, long‐term smoking has been associated with systemic inflammation in numerous studies [110,111].
Alcohol intake
The association between alcohol intake and CAD, on the other hand, has been more debated, for multiple reasons. First, alcohol intake was not identified as a risk factor in the high impact Framingham study [70]. Second, there is as of yet no consensus regarding mechanisms linking alcohol intake with CAD (although a variety have been suggested) [112]. In addition, several epidemiological studies have reported a phenomenon of J‐shaped or U‐shaped curves in mortality over dose‐curves [113‐115], further pointing out the complexity when studying alcohol as a risk factor for CAD. A non‐linear relationship has also been shown between alcohol intake and inflammatory markers, where a frequent (but relatively low) consumption is associated with a lower grade of inflammation in comparison to those reporting a lower alcohol intake, and excessive intake is associated with a higher grade of inflammation [116,117]. In the INTERHEART‐study, moderate drinking was considered to be a protective factor for CAD [25]. Thus, the critical issue in the association between alcohol intake and CAD is to establish a cut‐off point where the alcohol intake turns from beneficial to deleterious [112,115].
Physical activity
The impact of physical activity on CAD is more evident than the effects of alcohol intake, although some controversy remains. This is likely due to some uncertainties regarding how long time physiological effects remain of regular
Introduction
23
physical exercise. The importance to separate the effects of being habitually physically active from having sporadic vigorous activity should be emphasized. Regular exercise has been shown to have a strong protective effect for future cardiovascular events in a number of epidemiological studies using different follow‐up periods [118] whereas sporadic vigorous activity has been shown to trigger acute events, particular in otherwise sedentary people [119,120]. In randomized trials, physical activity interventions have been shown to increase levels of HDL [121], and reduce inflammation [122].
Fruit and vegetable intake
The predictive value of fruit and vegetables consumption on CAD is also somewhat debated. In theory, a high intake would be beneficial as the antioxidants would have a reducing impact on oxidative stress, limiting the damaging effect of free radical oxygen species in inflammatory processes. Several epidemiological studies have demonstrated an inverse association between intake of dietary antioxidants and cardiovascular risk [123‐125]. However, there are some contradicting results from randomized trials studying the effect of vitamin supplements on future disease or mortality [126]. In fact, it has been suggested that excessive supplements of vitamins may increase mortality rather than reducing it [127]. It has been pointed out though, that doses in supplements often are substantially higher than normally found in a balanced diet, which could interfere with the functional use of free radicals as a part of the defense mechanism in the immune system [127]. Thus, an excessive intake of supplements should not be confused with potential effects of fruit and vegetable intake [127]. Evaluation of the findings in the observational studies [123‐125] should rather concern the substantial co‐variation with dietary pattern as a whole, as well as with other cardiovascular risk factors [123‐125,128].
1.3.3 Population attributable risk
The issue of how much different risk factors contribute to the total CAD incidence is a matter of discussion. The reason for this is that cardiovascular risk factors can not be isolated and studied one by one in population studies. Several risk factors are not only clustered, as is the case in a sedentary lifestyle and dietary intake, but also, at least to some extent, share the same
Introduction
24
pathophysiological pathways. This is discussed in literature on the metabolic syndrome in particular, a state characterized by hypertension, dyslipidemia, high levels of blood glucose, and a large waist circumference [129,130]. Three things determine how much of the total CAD incidence that can be attributed to a single cardiovascular risk factor:
• How common the risk factor is in the population. • How strongly the risk factor is associated with future events. • How large a proportion of the total incidence that is attributed to all
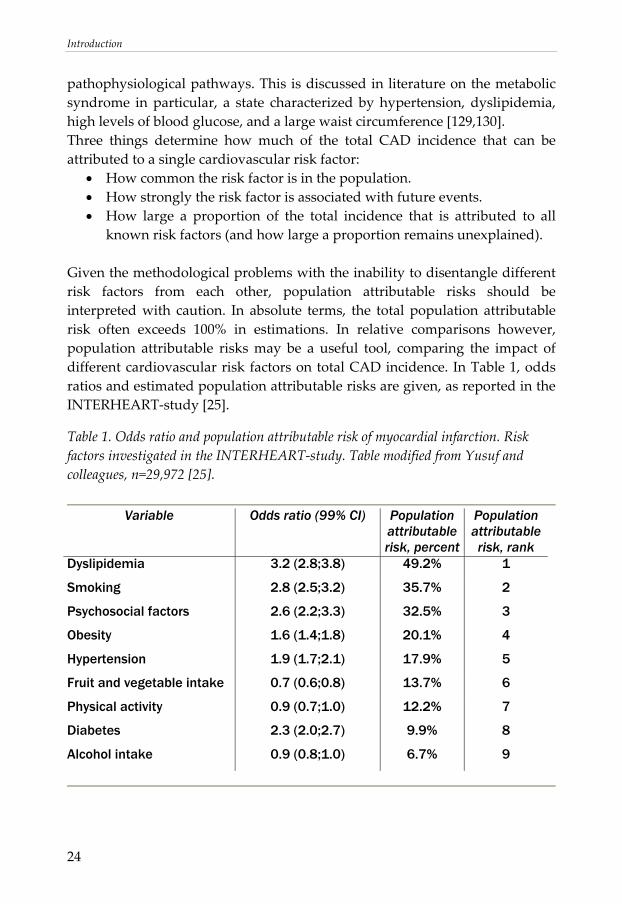
known risk factors (and how large a proportion remains unexplained). Given the methodological problems with the inability to disentangle different risk factors from each other, population attributable risks should be interpreted with caution. In absolute terms, the total population attributable risk often exceeds 100% in estimations. In relative comparisons however, population attributable risks may be a useful tool, comparing the impact of different cardiovascular risk factors on total CAD incidence. In Table 1, odds ratios and estimated population attributable risks are given, as reported in the INTERHEART‐study [25].
Table 1. Odds ratio and population attributable risk of myocardial infarction. Risk factors investigated in the INTERHEART‐study. Table modified from Yusuf and colleagues, n=29,972 [25].
Variable Odds ratio (99% CI) Population
attributable risk, percent
Population attributable risk, rank
Dyslipidemia 3.2 (2.8;3.8) 49.2% 1
Smoking 2.8 (2.5;3.2) 35.7% 2
Psychosocial factors 2.6 (2.2;3.3) 32.5% 3
Obesity 1.6 (1.4;1.8) 20.1% 4
Hypertension 1.9 (1.7;2.1) 17.9% 5
Fruit and vegetable intake 0.7 (0.6;0.8) 13.7% 6
Physical activity 0.9 (0.7;1.0) 12.2% 7
Diabetes 2.3 (2.0;2.7) 9.9% 8
Alcohol intake 0.9 (0.8;1.0) 6.7% 9
Introduction
25
1.4 Psychosocial factors and coronary artery disease
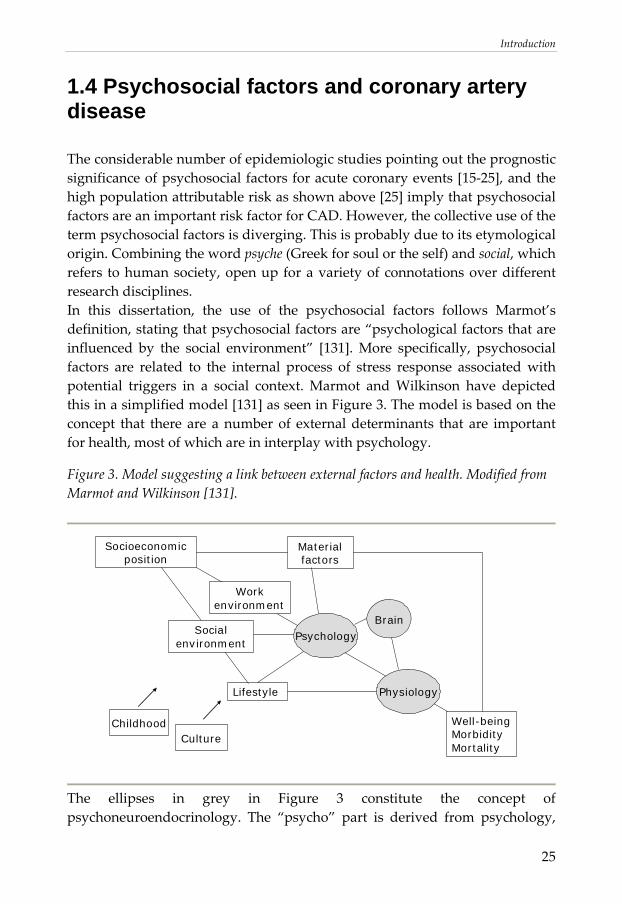
The considerable number of epidemiologic studies pointing out the prognostic significance of psychosocial factors for acute coronary events [15‐25], and the high population attributable risk as shown above [25] imply that psychosocial factors are an important risk factor for CAD. However, the collective use of the term psychosocial factors is diverging. This is probably due to its etymological origin. Combining the word psyche (Greek for soul or the self) and social, which refers to human society, open up for a variety of connotations over different research disciplines. In this dissertation, the use of the psychosocial factors follows Marmot’s definition, stating that psychosocial factors are “psychological factors that are influenced by the social environment” [131]. More specifically, psychosocial factors are related to the internal process of stress response associated with potential triggers in a social context. Marmot and Wilkinson have depicted this in a simplified model [131] as seen in Figure 3. The model is based on the concept that there are a number of external determinants that are important for health, most of which are in interplay with psychology.
Figure 3. Model suggesting a link between external factors and health. Modified from Marmot and Wilkinson [131].
Brain
Well-beingMorbidityMortality
ChildhoodCulture
Socioeconomic position
Material factors
Lifestyle
Workenvironment
Physiology
PsychologySocialenvironment
The ellipses in grey in Figure 3 constitute the concept of psychoneuroendocrinology. The “psycho” part is derived from psychology,
Introduction
26
the “neuro” part derived from conscious and unconscious activity in the brain, and the “endocrine” part from the secretion of hormones in normal and patho‐physiology. By unifying these parts in one concept, it is acknowledged that hormone secretion is highly influenced by psychological states and that an external load of stimuli is filtered by the brain before a physiological response is induced. The psychological state may be influenced by heredity [132] and may be altered by different diseases [133]. However, in a normal population, it is thought that this psychological state can be modified, and is primarily attributed to psychosocial factors. The concept of psychosocial factors will be discussed more in detail in section 1.4.2. Before doing this, three basic frameworks in stress theory (the general adaptation syndrome, the concept of allostasis and the cognitive activation theory of stress) are introduced to further understand the role of psychosocial factors.
1.4.1 Psychosocial factors and the link to stress
Hans Selye is often claimed to be the father of the stress concept, referring to his pioneering work in the late 30s. Notably, Selye did not use the term “stress” himself in his early work. This is possibly because the medical establishment at the time regarded the term to be too unspecific [134]. Instead, Selye conceptualized stress as the general adaptation syndrome (GAS).
The general adaptation syndrome
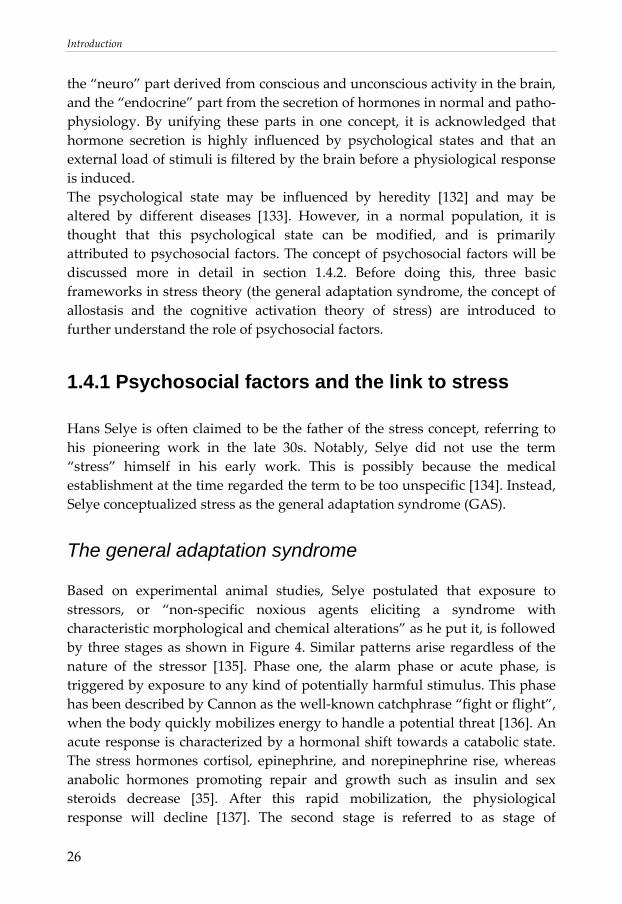
Based on experimental animal studies, Selye postulated that exposure to stressors, or “non‐specific noxious agents eliciting a syndrome with characteristic morphological and chemical alterations” as he put it, is followed by three stages as shown in Figure 4. Similar patterns arise regardless of the nature of the stressor [135]. Phase one, the alarm phase or acute phase, is triggered by exposure to any kind of potentially harmful stimulus. This phase has been described by Cannon as the well‐known catchphrase “fight or flight”, when the body quickly mobilizes energy to handle a potential threat [136]. An acute response is characterized by a hormonal shift towards a catabolic state. The stress hormones cortisol, epinephrine, and norepinephrine rise, whereas anabolic hormones promoting repair and growth such as insulin and sex steroids decrease [35]. After this rapid mobilization, the physiological response will decline [137]. The second stage is referred to as stage of
Introduction
27
resistance, or stage of adaptation, when the physiological response is high in order to meet the demands of the prolonged stressor at hand. If the duration of exposure is further prolonged, the body will eventually reach the third stage, the stage of exhaustion. The exposure to stressors has now triggered a dysfunctional state and hormonal imbalance, where the physiological response is weak, despite being exposed to a stressor normally triggering a strong response.
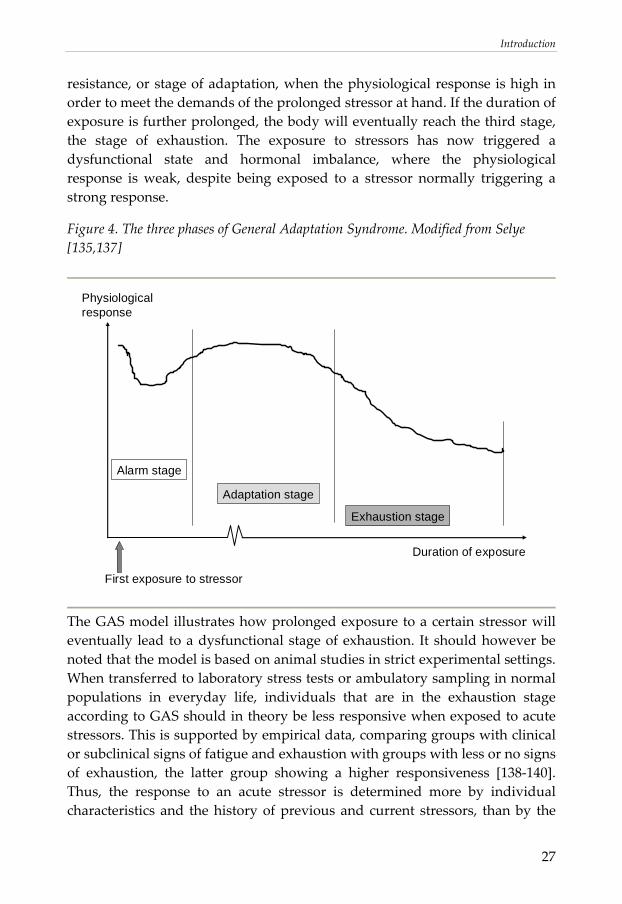
Figure 4. The three phases of General Adaptation Syndrome. Modified from Selye [135,137]
Duration of exposure
First exposure to stressor
Physiological response
Alarm stage
Adaptation stage
Exhaustion stage
The GAS model illustrates how prolonged exposure to a certain stressor will eventually lead to a dysfunctional stage of exhaustion. It should however be noted that the model is based on animal studies in strict experimental settings. When transferred to laboratory stress tests or ambulatory sampling in normal populations in everyday life, individuals that are in the exhaustion stage according to GAS should in theory be less responsive when exposed to acute stressors. This is supported by empirical data, comparing groups with clinical or subclinical signs of fatigue and exhaustion with groups with less or no signs of exhaustion, the latter group showing a higher responsiveness [138‐140]. Thus, the response to an acute stressor is determined more by individual characteristics and the history of previous and current stressors, than by the

Introduction
28
actual tested acute stressor itself. It is well established that different individuals will have different responses to the same stressor, dependent on earlier experiences from similar situations [134]. These observations have led to the incorporation of cognitive function in stress theory, an important contribution, not originally included in Selye’s early work.
The concept of allostasis
In 1988, Sterling and Eyer introduced the concept of allostasis in stress theory. The coined term allostasis literately means “to stand in variability”, denoting stability through change. It was introduced as an antonym to the well‐spread term homeostasis meaning “to stand equally”, denoting stability through constancy. Allostasis is based on the observation that most physiological variables have a diurnal variation, determined by specific behavioral states and environmental events [35]. Sterling and Eyer argue that the term homeostasis may be misleading as it wrongly implies that different systems are kept constant at a “normal level”. They claim that more important for maintaining health is the ability to respond thereby causing an appropriate arousal when facing an environmental challenge. Therefore, a more adequate terminology, according to Sterling and Eyer, should address the variation rather than the chronic state that homeostasis implies. In their allostatic model, health is defined as a state of responsiveness. [35] It is thus suggested that detrimental effects of stress occur only when the ability to respond is lost. A key concept in the allostasis model is the ability to restitute. An insufficient restitution leads to a sustained arousal which in turn inevitably leads to the inability to respond appropriately. Thus, according to Sterling and Eyer, in order to remain or regain allostasis people should be encouraged to “rest and play in proportion to their work and striving to increase predictability, control, and feedback in their lives” [35]. As pointed out by McEwen (widely known for having introduced the concept of allostasis in medicine), homeostasis applies to a limited number of systems essential for life such as maintenance of body temperature, pH, and oxygen tension [141]. According to McEwen, allostasis is a necessary process to support homeostasis in the mentioned systems [141].

Introduction
29
The cognitive activation theory of stress
There are a number of existing stress theories, somewhat overlapping, which incorporate cognitive function in frameworks to understand stress and how a stimulus is translated into a physiological response. One of the more wide‐spread is the cognitive activation theory of stress (CATS), formalized by Ursin and Eriksen [134]. In their theory, they divide the term stress into four different entities, as seen in Table 2.
Table 2. Four formal definitions of stress according to Ursin and Eriksen [134].
Entities of stress • The exposure (stressor, stimulus) • The experience and feelings of the situation (based on self-reports) • The psychoneuroendocrinological activation • The experience and feelings of the somatic response
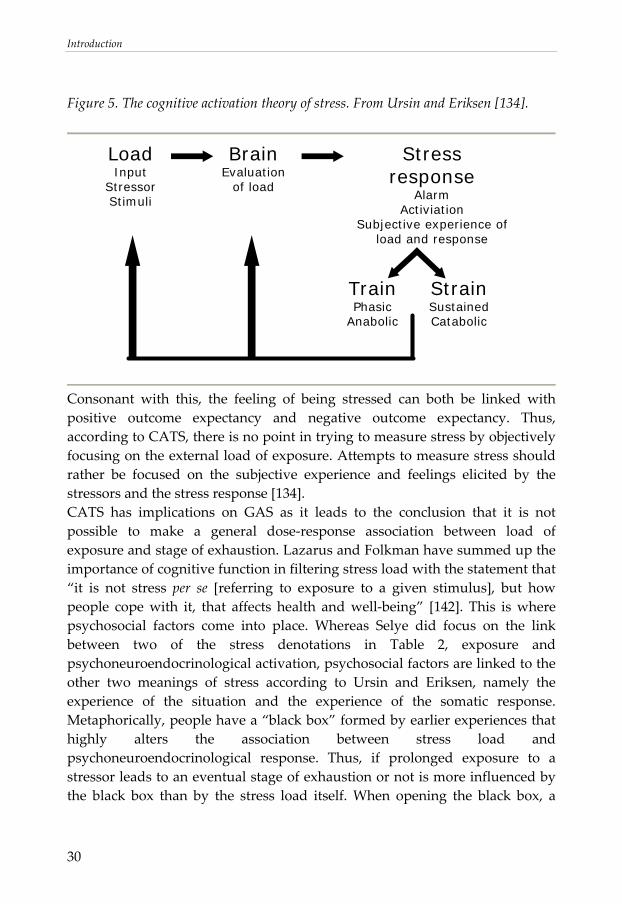
These four meanings of stress could and should, according to Ursin and Eriksen, be measured separately to further understand the concept of stress and the role of psychoneuroendocrinology in health and disease [134]. The main component in CATS is the feedback to the brain from the outcome of the response, which will alter both the exposure to the stimulus and the perception of the stimulus in similar situations henceforth. See Figure 5. In other words, whether a stimulus is considered pleasant or threatening depends on previous experiences and expectations of the outcome [134]. The process is dynamic, where the stressor and outcome are evaluated and re‐evaluated in similar situations to come.
Introduction
30
Figure 5. The cognitive activation theory of stress. From Ursin and Eriksen [134].
LoadInput
StressorStimuli
BrainEvaluation
of load
Stress response
AlarmActiviation
Subjective experience of load and response
TrainPhasic
Anabolic
StrainSustainedCatabolic
Consonant with this, the feeling of being stressed can both be linked with positive outcome expectancy and negative outcome expectancy. Thus, according to CATS, there is no point in trying to measure stress by objectively focusing on the external load of exposure. Attempts to measure stress should rather be focused on the subjective experience and feelings elicited by the stressors and the stress response [134]. CATS has implications on GAS as it leads to the conclusion that it is not possible to make a general dose‐response association between load of exposure and stage of exhaustion. Lazarus and Folkman have summed up the importance of cognitive function in filtering stress load with the statement that “it is not stress per se [referring to exposure to a given stimulus], but how people cope with it, that affects health and well‐being” [142]. This is where psychosocial factors come into place. Whereas Selye did focus on the link between two of the stress denotations in Table 2, exposure and psychoneuroendocrinological activation, psychosocial factors are linked to the other two meanings of stress according to Ursin and Eriksen, namely the experience of the situation and the experience of the somatic response. Metaphorically, people have a “black box” formed by earlier experiences that highly alters the association between stress load and psychoneuroendocrinological response. Thus, if prolonged exposure to a stressor leads to an eventual stage of exhaustion or not is more influenced by the black box than by the stress load itself. When opening the black box, a
Introduction
31
complex web of psychosocial factors folds out. These are described more in detail in section 1.4.2.
1.4.2 Psychosocial factors – positive and negative aspects
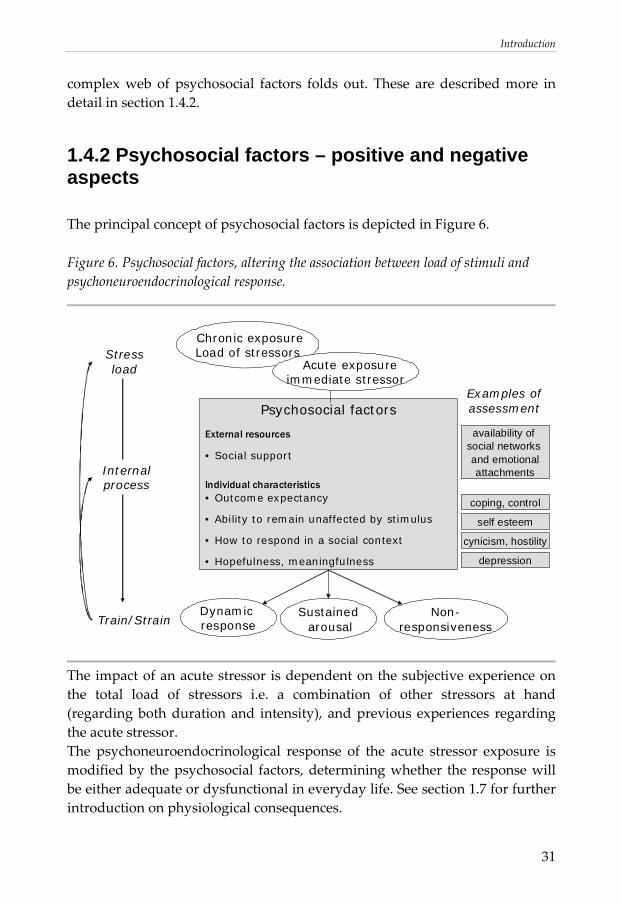
The principal concept of psychosocial factors is depicted in Figure 6.
Figure 6. Psychosocial factors, altering the association between load of stimuli and psychoneuroendocrinological response.
Stressload
SustainedarousalTrain/Strain
Chronic exposureLoad of stressors
Dynamic response
Psychosocial factors
External resources
• Social support
Individual characteristics• Outcome expectancy
• Ability to remain unaffected by stimulus
• How to respond in a social context
• Hopefulness, meaningfulness
Internal process
Examples of assessment
cynicism, hostility
depression
coping, control
self esteem
availability of social networks and emotionalattachments
Non-responsiveness
Acute exposureimmediate stressor
The impact of an acute stressor is dependent on the subjective experience on the total load of stressors i.e. a combination of other stressors at hand (regarding both duration and intensity), and previous experiences regarding the acute stressor. The psychoneuroendocrinological response of the acute stressor exposure is modified by the psychosocial factors, determining whether the response will be either adequate or dysfunctional in everyday life. See section 1.7 for further introduction on physiological consequences.
Introduction
32
The person’s individual characteristics regarding psychosocial factors are formed in interplay with the social environment in dynamic processes. In addition, as pointed out in CATS, the feed‐back from the outcome leading to positive or negative outcome expectancy has a further impact on psychosocial factors. An important distinction is whether the psychosocial factors swaying the stress response are influenced mainly by a state, i.e. a temporary condition (that may be triggered by a recent positive or negative event in everyday life), or a trait, i.e. a more long‐term personality feature (reflected by long‐term learning processes and life conditions). In general, all psychosocial factors can be influenced by both state and trait components. When assessing psychosocial factors, most instruments (typically structured questionnaires or interviews) are designed to minimize the impact of a temporary state in favor of capturing more stable trait properties. Questionnaires compiled to assess psychosocial factors can be divided into those focusing on external factors such as exposure in work environment, those focusing on external social resources, and those focusing on individual psychosocial characteristics. As argued for in CATS [134], focusing on exposure does not add much in psychoneuroendocrinology. Thus, the following introduction includes social support, individual psychosocial resources, and individual psychosocial risk factors.
Social support
The role of social ties in health and disease has long been discussed. Explanatory models span from the macro level such as theories of social capital, to the micro level such as group psychology to facilitate changed or maintained habits. Several observational studies have linked various indicators of social isolation with increased mortality [143,144]. The associations with all‐cause mortality are accompanied by an increased CAD incidence in groups with low social support [145,146]. These findings remain after adjustment for other risk factors, suggesting that differences in health behavior in groups with different social activity can not explain the increased risk of CAD in socially isolated groups [145,146]. It is generally agreed that external resources in terms of functional social ties are beneficial when dealing with acute or chronic stressors. Hawkley and Cappicio have suggested that it is not the stress response per se that differs, but rather the perception of the load, where lonely individuals appear to be more likely to perceive events in daily life as stressful events [147].

Introduction
33
Commonly a separation is made between the quantity of social ties and the quality of social ties. In other words, the size of your social network should not be confused with the emotional support provided by someone who truly cares for you. This separation is based on the observation that a large social network with many social contacts does not necessarily provide the availability of someone close to confide in. Both the quantity, i.e. the social network, and the quality, i.e. the emotional support, have been shown to be associated with reduced risk of CAD [145].
Psychosocial resources
Psychosocial resources are defined as factors that have a positive impact on how a person copes with prolonged exposure to stressors. In other words, psychosocial resources can be said to be resilience factors, providing a buffering function when exposed to stressors, and modifying the person’s perception of the situation. Key concepts such as coping, self‐esteem, and perceived control have been established in a number of theories when describing psychosocial resources [148]. These concepts, with overlapping constructs, are highly a function from cognition, characterized by a sense of meaningfulness, predictability, and free will. Psychosocial resources are generally considered to be personality traits, formed by long‐term learning. The driving force for both building up and maintaining psychosocial resources is the ability to handle a stressor. By mastering a challenge, the perceived control of similar situations to come is increased, knowing that everything went well the last time the stressor occurred. The success of resolving a potentially threatening situation builds up the self‐esteem and affects the free will to face other upcoming equal or even more demanding challenges. Taken together, coping with stressors result in positive outcome expectancy. In this way, success breeds success. Psychosocial resources are preserved, as mastering a challenge once increases the ability to master it again (with less effort required). On the other hand, if the positive expectation is lost, reduced psychosocial resources can also be negatively preserved in vicious circles. Failure to master a situation leads to an eventual reduction of self‐esteem. The persistence of different situations that not are resolved leads to an up‐load of stressors, bringing more failures to come. This will lead to an eventual state of hopelessness, characterized by negative outcome expectancy, knowing that it is no point of trying as it probably just will lead to another failure. Thus, both meaningfulness, and free will are affected by loss of psychosocial resources.
Introduction
34
Even though there are a number of epidemiological studies linking different aspects of psychosocial resources with health in general, prospective studies that study the association between psychosocial resources and reduced risk for ACS are few (not counting those studying social support as a psychosocial resource). However, two independent major epidemiological studies have demonstrated such an association. In the EPIC‐Norfolk study(n=20,425) coping as assessed by Pearlin’s mastery scale (described more in detail in section 3.3.2) were independently associated with a reduced cardiovascular mortality [24]. In the INTERHEART‐study, there was a statistically significant inverted association between risk for ACS and perceived control, an instrument assessing one’s perception of control over circumstances in everyday life [22,149].
Psychosocial risk factors
In contrast to the more closely inter‐related psychosocial resources, psychosocial risk factors are in principle derived from two more distinct domains. The domain of vital exhaustion and depression is tightly linked with the negative emotions accompanying long‐term exposure to stressors that can not be resolved. In other words, this domain represent a state where total stress load has for some time been exceeding the individual’s ability to master them, and is characterized by a sense of helplessness, and loss of meaningfulness. The other domain of anger, hostility and cynical distrust are linked to negative emotions that may evolve in a social interplay. In cardiology, this was first acknowledged by Friedman and Rosenman in the late 50s, coining the widely spread expression “Type A behavior pattern”. They observed that there was unproportionally high number of CAD‐patients having a personality trait characterized as competitive, overt aggressive, and with difficulties to relax. [150]. Friedman and Rosenman spent the following decades to find out the pathophysiological mechanisms explaining this high over‐representation in CAD‐patients. The impatience when things take longer time than it should, and hostility that may be triggered also by minor events, have implications in stress research. An individual showing a Type A behavioral pattern is more likely to regard events in everyday life as stressors, and more likely to respond with a sustained arousal. Both the domain of depression [15‐19] as well as the domain of hostility and cynical distrust [16,20,21,23] have been shown in extensive literature to have predictive value for future CAD events.
Introduction
35
In the INTERHEART‐study, a questionnaire was used aiming to measure clinical depression according to the fourth edition of Diagnostic and statistical manual on mental disorders (DSM‐IV) [22]. An increased score on the questionnaire was positively associated with a higher risk for myocardial infarction. The domain of hostility was not assessed.
1.5 Cortisol
As mentioned in section 1.4, cortisol is one of the main stress hormones, essentially preparing peripheral organs for action. The release of cortisol is mediated by the so called hypothalamus‐pituitary‐adrenal (HPA)‐axis. In short, the principal stimulus of the HPA‐axis is the corticotrophin‐releasing hormone (CRH), first isolated and identified by Vale and colleagues in 1981 [151]. CRH is locally produced in hypothalamus. When facing an acute stressor, CRH increases markedly, stimulating a secretion of adrenocorticotropic hormone (ACTH) in the pituitary gland. As the name suggest, circulating ACTH stimulates the cortex of the adrenal glands, stimulating the cortisol production and release into circulation. In normal physiology, most individuals exhibit a typical pattern with a distinct diurnal variation in cortisol levels, peaking approximately 30 to 45 minutes after awakening and declining throughout the day, with lowest levels in the night, around 4.00 AM [152,153]. However, the intra‐individual diurnal variation is considerable. The correlation between cortisol levels over consecutive days has been reported to be around r=0.5 in several studies [139,154,155]. This intra‐individual variation are thought to, at least in part, be explained by fluctuations throughout the day when exposed for physical or emotional stressors, i.e. are influenced by temporary states which may vary from day to day [139,155,156]. Given the rise of CRH by acute stressors, a dysregulation of the HPA‐axis with cortisol as the end‐point, have been suggested to be closely linked with psychosocial factors [157‐159]. More specifically, individuals with a poor score on psychosocial instruments tend to have a higher baseline of cortisol levels and/or poorer response to laboratory stress test [138], a higher diurnal total output of cortisol, and/or a more flattened diurnal variation of cortisol throughout the day, with lower peaks and higher levels in the evenings [139,159]. Cortisol acts on intracellular nuclear receptors found in most cell types throughout the body and regulating the transcription of target genes [160].
Introduction
36
Thus, in contrast to the other stress hormones epinephrine and norepinephrine, which exert immediate actions, the effects of cortisol are generally slower but more persistent [161]. The discovery in the late 40s that a synthesized cortisol derivate could reverse inflammation in rheumatoid arthritis (RA) [162] have rendered a Nobel Prize. The anti‐inflammatory properties have led to the wide‐spread clinical use of exogenous cortisol (or hydrocortisone as the synthetic form is named). However, while pharmacological doses (much higher than physiological doses) indeed are anti‐inflammatory, the role of endogenous cortisol is far more complex. It has been suggested that cortisol modulate the expression in approximately 10% of our genes [161]. This enormous palette has puzzled scientists for many years. From an evolutionary perspective, it has been suggested that the effects that cortisol exert have evolved to minimize effects of water losing intestinal diseases. In other words, all effects of cortisol converge to prevent a certain death due to cholera or other infections causing severe diarrhea [163]. The multi‐facetted role of cortisol has been demonstrated by numerous studies, associating a dysfunction in the HPA‐axis with a number of pathophysiological conditions. These include studies on e.g. autoimmune diseases [164], cancer [165], and psychiatric disorders [159]. Focusing on CAD, imbalance in energy regulation as a consequence as a of a dysregulated HPA‐axis has been suggested to lead to obesity, diabetes, and hypertension [35,141,161,166]. Further a dysregulation of the HPA‐axis, and a high total cortisol output have been associated with arterial stiffness [167‐169]. Moreover, it has been suggested that the ability of cortisol to dampen effects of inflammatory processes and keep them from spreading [170‐172] could be lost if the HPA‐axis is dysregulated. Insufficiency to suppress ongoing inflammation by expressing “inappropriately low cortisol levels” has accordingly been suggested as an additional mechanism linking a dysregulation of cortisol with CAD [173,174]. Nijm and colleagues have given some empirical support to the suggestions, demonstrating that CAD patients had a significantly higher total diurnal output of cortisol as well as a lower possibility to respond with a rise in cortisol levels to a stressor in a laboratory stress test [174]. There is however a lack of prospective population studies, why the long‐term effects of a dysregulated HPA‐axis on CAD incidence as of yet are unclear. Taken together, although the entire chain has not been demonstrated in the same study, altered cortisol levels due to stress has been suggested as a strong
Introduction
37
candidate mechanism when explaining the observed link between psychosocial factors and CAD.
1.6 Matrix metalloproteinase-9
The MMP enzyme family was originally described in 1962 by Gross and Lapiere [175]. In their work, they studied the metamorphosis in frogs with the underlying assumption that such a rapid and yet precise remodeling requires a tightly regulated enzyme system. In their experiments, they found a collagenolytic factor, simply referred to as “the tadpole collagenase” [176]. Further research revealed that this was just one of several enzymes with a common protein domain structure and with similar specificity. In humans, there are 23 different enzymes in the family [177]. In the current nomenclature [178], the name of the enzyme family is derived from the following:
• Matrix, referring to the network of supporting tissues that is not part of any cell. It is mainly constituted by fibrils of different types of collagen.
• Metallo, referring to the metal ion (typically the zinc ion Zn2+) on which the enzyme is dependent to form a functional active site of catalyzation.
• Proteinase, referring to the enzymatic function which catalyses the breakdown of proteins.
All of the MMPs have the ability to breakdown different collagens and thereby have the potential to degrade most extracellular and connective tissues [177,179,180]. Since MMPs are the only known enzyme family capable of degrading collagens in mammals, they are of importance in virtually any process that involves remodeling, ranging from angiogenesis and cell proliferation to wound healing and degradation of dysfunctional tissue [177,179,180]. To prevent misdirected degradation of vital tissue, the activity of MMPs requires tight regulation at different levels. As a first regulating step, all MMPs are synthesized as inactive forms and released as pro‐enzymes. To function as degrading enzymes, all MMPs require activation from other MMPs or other regulatory agents [180]. As a next step in the control of MMP activity, humans have four different endogenous MMP inhibitors, the so called tissue inhibitor of metalloproteinases (TIMPs) 1, 2, 3, and 4. It has been postulated that the ratio of MMP/TIMP may provide information on whether the overall activity leans towards degradation or vegetative growth, respectively. In theory a higher ratio would speak for a high extent of degradation [181‐183]). However, TIMPs not only inhibit MMP activity, but also act as transporters and carriers
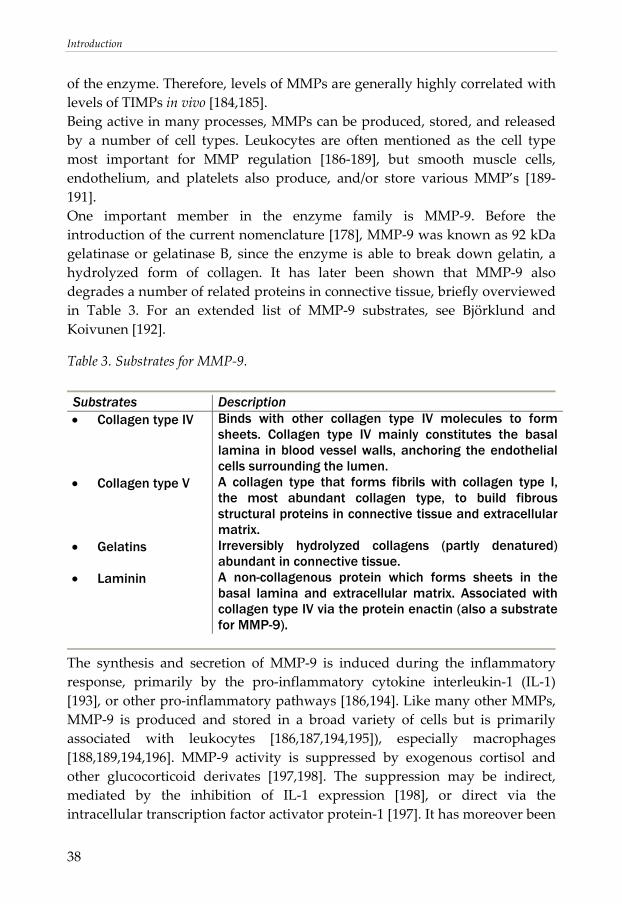
Introduction
38
of the enzyme. Therefore, levels of MMPs are generally highly correlated with levels of TIMPs in vivo [184,185]. Being active in many processes, MMPs can be produced, stored, and released by a number of cell types. Leukocytes are often mentioned as the cell type most important for MMP regulation [186‐189], but smooth muscle cells, endothelium, and platelets also produce, and/or store various MMP’s [189‐191]. One important member in the enzyme family is MMP‐9. Before the introduction of the current nomenclature [178], MMP‐9 was known as 92 kDa gelatinase or gelatinase B, since the enzyme is able to break down gelatin, a hydrolyzed form of collagen. It has later been shown that MMP‐9 also degrades a number of related proteins in connective tissue, briefly overviewed in Table 3. For an extended list of MMP‐9 substrates, see Björklund and Koivunen [192].
Table 3. Substrates for MMP‐9.
Substrates Description • Collagen type IV Binds with other collagen type IV molecules to form
sheets. Collagen type IV mainly constitutes the basal lamina in blood vessel walls, anchoring the endothelial cells surrounding the lumen.
• Collagen type V A collagen type that forms fibrils with collagen type I, the most abundant collagen type, to build fibrous structural proteins in connective tissue and extracellular matrix.
• Gelatins Irreversibly hydrolyzed collagens (partly denatured) abundant in connective tissue.
• Laminin A non-collagenous protein which forms sheets in the basal lamina and extracellular matrix. Associated with collagen type IV via the protein enactin (also a substrate for MMP-9).
The synthesis and secretion of MMP‐9 is induced during the inflammatory response, primarily by the pro‐inflammatory cytokine interleukin‐1 (IL‐1) [193], or other pro‐inflammatory pathways [186,194]. Like many other MMPs, MMP‐9 is produced and stored in a broad variety of cells but is primarily associated with leukocytes [186,187,194,195]), especially macrophages [188,189,194,196]. MMP‐9 activity is suppressed by exogenous cortisol and other glucocorticoid derivates [197,198]. The suppression may be indirect, mediated by the inhibition of IL‐1 expression [198], or direct via the intracellular transcription factor activator protein‐1 [197]. It has moreover been
Introduction
39
suggested that glucocorticoids up‐regulate the MMP‐9 inhibitor TIMP‐1, thereby further reducing the effect of MMP‐9 activity [199].
1.6.1 Plausibility of MMP-9 in coronary artery disease
Patients with acute cardiac events have been shown to have elevated plasma levels of MMP‐9 in a number of studies [177,189,200‐202]. Most studies so far have compared levels of MMP‐9 in ACS patients with those in stable angina patients. It has also been shown that circulating MMP‐9 is an independent predictor of new cardiac events in patients with stable CAD [200], but little is known about MMP‐9 before onset of disease. There are a few cross‐sectional studies in selected populations linking increased levels of MMP‐9 with hypertension [181,203], diabetes [204], smoking [205], and excessive alcohol intake [206] but due to a lack of prospective data before onset of disease, the predictive value of MMP‐9 is merely speculative at this point. Of the ones mentioned, the link to hypertension is the most outlined. It has been suggested that MMP‐9 is up‐regulated in stiffened central arteries [203,207], in order to remodel the stiff, collagen‐rich vessel walls into more flexible structures with an increased buffering capacity. Further, when a vessel wall is remodeled, there is a need for neovascularization within the vessel wall as it grows to supply oxygen to all the cells within the wall. Hence, MMPs are activated to facilitate new microvascular growth [208]. Most literature regarding MMP‐9 and CAD is focused on the destabilization of atherosclerotic plaques. The basic concept is that MMP‐9 facilitates the plaque rupture or erosion by attacking the collagen‐rich fibrous cap and basal lamina which surrounds it [55,189,209,210]. It has been shown that unstable plaques rich in macrophage‐derived foam cells, have a higher MMP‐9 activity than stable plaques with a lower grade of inflammation [211‐213]. To sum up, there are an extensive number of both observational and experimental studies that associates increased levels of MMP‐9 with CAD. Further, the impact of stress hormones on MMP‐9 regulation make MMP‐9 a prime candidate marker when studying the relation between stress and ACS.
Introduction
40
1.6.2 MMP-9 in other conditions and diseases
Even though the number of studies on MMP‐9 in cardiovascular disease is growing rapidly, these studies are by far outnumbered by those linking MMP‐9 to cancer. MMPs are known to play several important roles in cancer development. In tumor‐induced angiogenesis , there is an up‐regulation of MMP‐9 and other MMPs in the extracellular matrix to facilitate neovascularization and thereby provide oxygen to the growing tumor [214‐216]. MMPs also promote tumor growth and invasion, partly by stimulating the release of growth factors such as fibroblast growth factor and vascular endothelial growth factor, partly by degrading the stroma surrounding the tumor [192,217]. Thus, various cancer treatment strategies have focused on how to inhibit the activity of MMPs and thereby reduce the growth of malignancies. Another common group of diseases where MMP‐9 has been shown to be of relevance is autoimmune diseases such as RA [218], where it is thought that MMP‐9 activity increases the degradation of cartilage and joint tissues [219]. Further, the ability to degrade different collagens brings implications to different surgical and orthopedic settings. Activation and inhibition of MMPs have been linked to a number of different applications, e.g. tendon ruptures, tissue ulcers, and wound healing [220,221]. It has also been suggested that MMP‐9 could be a marker in diabetes, as MMP‐9 has been shown to be up‐regulated in hyperglycemia in vitro [222] and up‐regulated by insulin in an animal experiment in vivo [223]. There is however a lack of consistency in human observational studies where some studies show significant differences between diabetic subjects and controls [204,224], while other report no difference between the groups [225,226].
1.7 A psychoneuroendocrinological model
A central assumption when studying the etiology of CAD is that the cardiovascular risk factors do not operate in isolation, but acts in conjunction with one another. Indeed the physiological response that follows takes the same pathway regardless if the stressor is of physical or emotional nature. In this sense, there is no existing binary opposition of a “physio“ and a “psycho” pathway, they should be viewed upon in an integrative system.
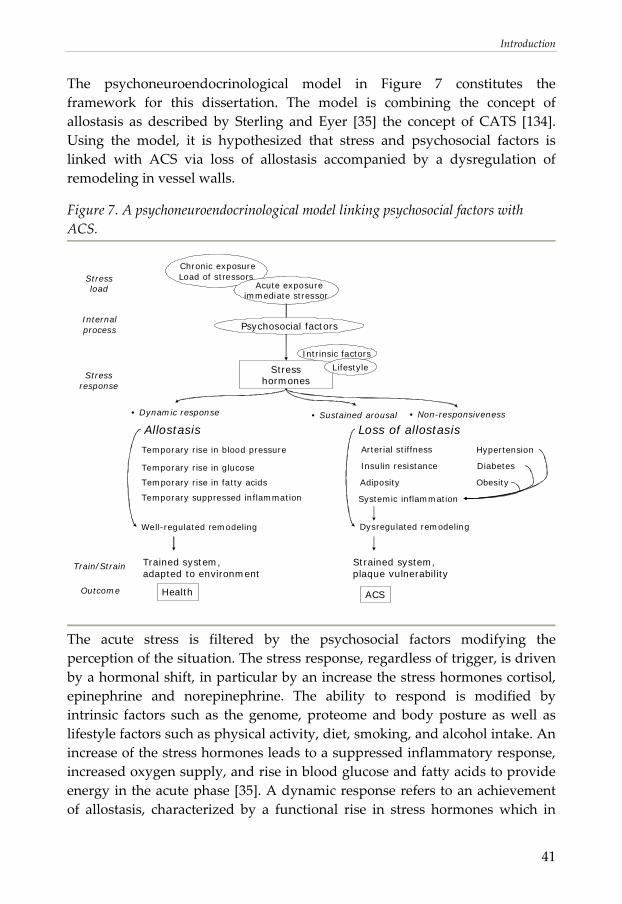
Introduction
41
The psychoneuroendocrinological model in Figure 7 constitutes the framework for this dissertation. The model is combining the concept of allostasis as described by Sterling and Eyer [35] the concept of CATS [134]. Using the model, it is hypothesized that stress and psychosocial factors is linked with ACS via loss of allostasis accompanied by a dysregulation of remodeling in vessel walls.
Figure 7. A psychoneuroendocrinological model linking psychosocial factors with ACS.
ACS
Stresshormones
Intrinsic factors
Lifestyle
• Dynamic response
Loss of allostasis
Temporary rise in blood pressure
Temporary rise in glucose
Temporary rise in fatty acids
Temporary suppressed inflammation
Stressload
Stressresponse
Outcome
Arterial stiffness
Insulin resistance
Adiposity
Systemic inflammation
Hypertension
Diabetes
Obesity
Internal process
Chronic exposureLoad of stressors
Acute exposureimmediate stressor
Psychosocial factors
Train/Strain
Health
Strained system,plaque vulnerability
• Sustained arousal • Non-responsiveness
Trained system,adapted to environment
Allostasis
Dysregulated remodelingWell-regulated remodeling
The acute stress is filtered by the psychosocial factors modifying the perception of the situation. The stress response, regardless of trigger, is driven by a hormonal shift, in particular by an increase the stress hormones cortisol, epinephrine and norepinephrine. The ability to respond is modified by intrinsic factors such as the genome, proteome and body posture as well as lifestyle factors such as physical activity, diet, smoking, and alcohol intake. An increase of the stress hormones leads to a suppressed inflammatory response, increased oxygen supply, and rise in blood glucose and fatty acids to provide energy in the acute phase [35]. A dynamic response refers to an achievement of allostasis, characterized by a functional rise in stress hormones which in
Introduction
42
turn leads to a mastered challenge and a period of restitution. This is beneficial for the individual as a psychophyisological learning process will lead to positive expectancy, control and predictability of the stress load, i.e. will strengthen the psychosocial resources. In addition, a possibility to rest after a mastered challenge will lead to restitution and beneficial training for the physiological systems. As part of an adaptation to the environment, a well‐regulated remodeling occurs, preparing the system for similar situations to come. If the initial response of the stress hormones is not sufficient to meet the demand of the situation, a higher stress response will be induced in order to master the situation. The sustained arousal following a situation like that may be a double‐edged sword. On one hand, a sustained elevation of stress hormones provides the ability to respond functionally to a prolonged stressor. On the other hand, a sustained arousal can only be functional for a given time. If not followed by restitution, a state of sustained arousal will eventually lead to a state of non‐responsiveness, and to a stage of fatigue and exhaustion. One explanation for this transition is the receptors at a cellular level, which will eventually be down‐regulated in sustained arousal to slow down the effects of the stress hormones [227,228]. This leads to an increased hormone secretion in an attempt to reach an adequate physiologic response, which in turn, leads to a further down‐regulation of receptors. By these vicious circles, the ability to achieve allostasis is lost in a maladaptive system due to sustained arousal. If this state is prolonged, it has been suggested that excessive cortisol secretion leads to manifestations of the cardiovascular risk factors hypertension, diabetes and obesity [35]. When allostasis is lost, the link between cortisol and inflammation and remodeling may be of particular relevance, as the suggested links to hypertension, diabetes and obesity can not explain the rapid fluctuations in CAD incidence and a high incidence of unexpected cardiac deaths as described in the rationale. Importantly, the association between a dysregulated HPA‐axis and inflammation are not limited to markers in circulating blood. It has also been demonstrated that cortisol has direct effects on macrophages, which becomes maladaptive when the HPA‐axis is dysregulated [228‐231]. This interplay between sustained arousal and inflammation provides a plausible mechanism where stress may interact with other pathogens and thereby modify inflammation in atherosclerosis. In other words, regardless of what triggers inflammation in the first place, it is plausible that sustained arousal may cause a situation where invaded macrophages do not respond properly to the endogenous stress hormones, thus making it harder to dampen
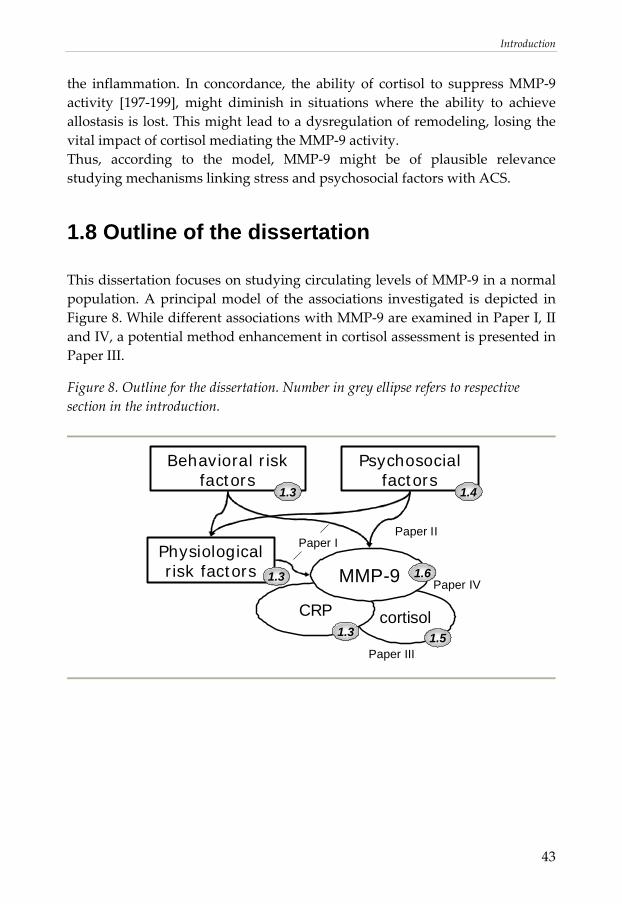
Introduction
43
the inflammation. In concordance, the ability of cortisol to suppress MMP‐9 activity [197‐199], might diminish in situations where the ability to achieve allostasis is lost. This might lead to a dysregulation of remodeling, losing the vital impact of cortisol mediating the MMP‐9 activity. Thus, according to the model, MMP‐9 might be of plausible relevance studying mechanisms linking stress and psychosocial factors with ACS.
1.8 Outline of the dissertation
This dissertation focuses on studying circulating levels of MMP‐9 in a normal population. A principal model of the associations investigated is depicted in Figure 8. While different associations with MMP‐9 are examined in Paper I, II and IV, a potential method enhancement in cortisol assessment is presented in Paper III.
Figure 8. Outline for the dissertation. Number in grey ellipse refers to respective section in the introduction.
cortisol
Psychosocialfactors
CRP
MMP-9Physiologicalrisk factors
Paper IPaper II
Paper III
Paper IV1.3
1.4
1.3
1.6
1.5
Behavioral risk factors
1.3

44
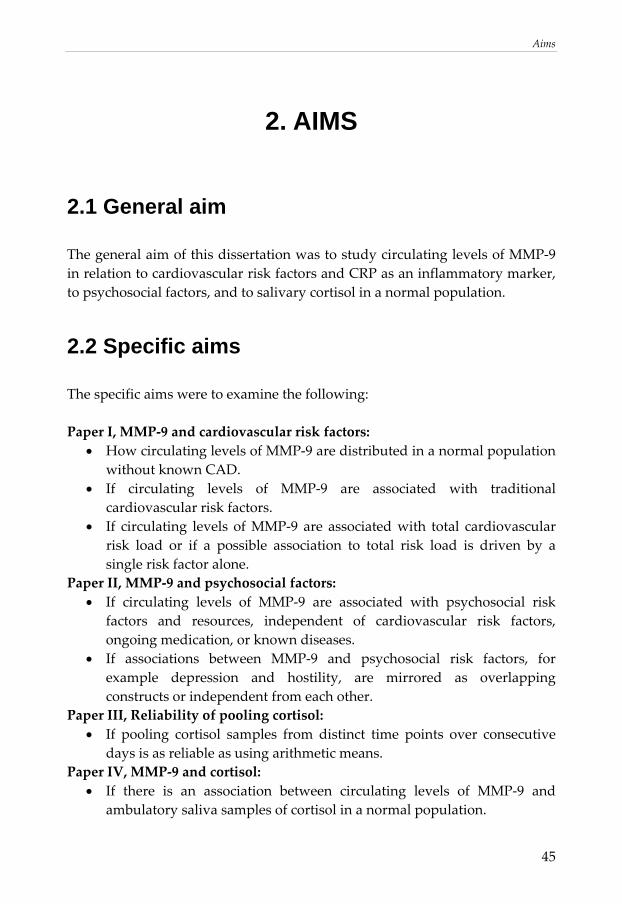
Aims
45
2. AIMS
2.1 General aim
The general aim of this dissertation was to study circulating levels of MMP‐9 in relation to cardiovascular risk factors and CRP as an inflammatory marker, to psychosocial factors, and to salivary cortisol in a normal population.
2.2 Specific aims
The specific aims were to examine the following: Paper I, MMP‐9 and cardiovascular risk factors:
• How circulating levels of MMP‐9 are distributed in a normal population without known CAD.
• If circulating levels of MMP‐9 are associated with traditional cardiovascular risk factors.
• If circulating levels of MMP‐9 are associated with total cardiovascular risk load or if a possible association to total risk load is driven by a single risk factor alone.
Paper II, MMP‐9 and psychosocial factors: • If circulating levels of MMP‐9 are associated with psychosocial risk
factors and resources, independent of cardiovascular risk factors, ongoing medication, or known diseases.
• If associations between MMP‐9 and psychosocial risk factors, for example depression and hostility, are mirrored as overlapping constructs or independent from each other.
Paper III, Reliability of pooling cortisol: • If pooling cortisol samples from distinct time points over consecutive
days is as reliable as using arithmetic means. Paper IV, MMP‐9 and cortisol:
• If there is an association between circulating levels of MMP‐9 and ambulatory saliva samples of cortisol in a normal population.
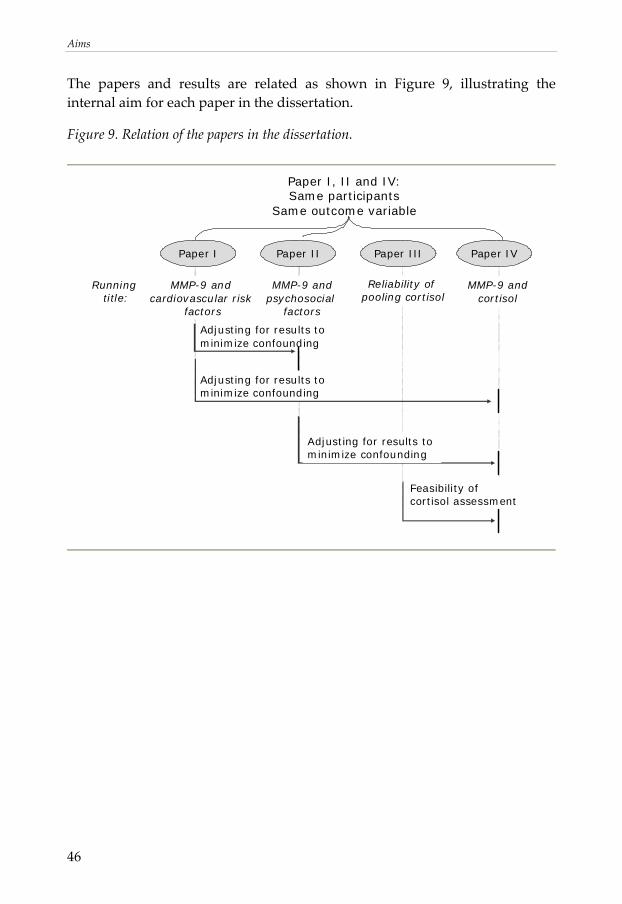
Aims
46
The papers and results are related as shown in Figure 9, illustrating the internal aim for each paper in the dissertation.
Figure 9. Relation of the papers in the dissertation.
Adjusting for results to minimize confounding
Adjusting for results to minimize confounding
Paper I, II and IV:Same participants
Same outcome variable
MMP-9 andcortisol
Running title:
MMP-9 and cardiovascular risk
factors
MMP-9 andpsychosocial
factors
Feasibility of cortisol assessment
Paper I Paper II Paper III Paper IV
Reliability of pooling cortisol
Adjusting for results to minimize confounding
Material and Methods
47
3. MATERIAL AND METHODS
3.1 The LSH-study
The LSH‐study is an abbreviation for the Life conditions, Stress, and Health‐study. It was designed to study a normal population, both in cross‐sectional analyses and later on in prospective analyses, with the possibility to incorporate register data on mortality and morbidity at an individual level. The work in this dissertation is based on a subset from the LSH‐study (see section 3.5). Thus, the aims and findings in this dissertation constitute some but not all of the pieces in the puzzle.
3.1.1 Aims and model of the LSH-study
The main aim of the LSH‐study is to test if psychoneuroendocrinological pathways mediate the association between socioeconomic status and incident cardiovascular disease. It is hypothesized that loss of allostasis lead to an increased general vulnerability in susceptible subjects. The study design is based on the assumption that life conditions as well as lifestyle and psychosocial factors have an impact on psychoneuroendocrinological mechanisms and inflammation. There are multiple analyses currently underway in the LSH‐study. The principal aims can be divided into six levels, illustrated in Figure 10.
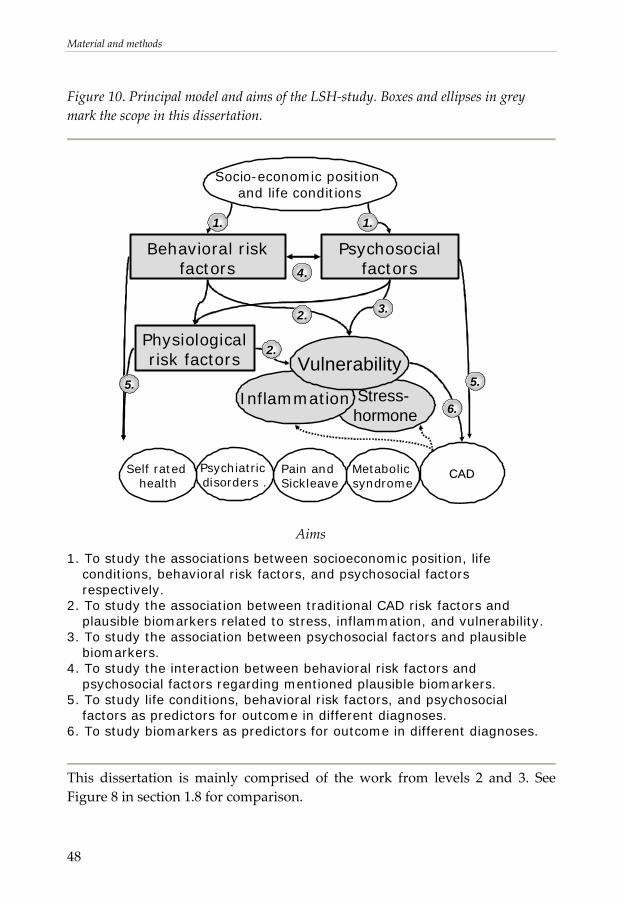
Material and methods
48
Figure 10. Principal model and aims of the LSH‐study. Boxes and ellipses in grey mark the scope in this dissertation.
Behavioral risk factors
Stress-hormone
CADCAD
Socio-economic position and life conditions
Psychosocialfactors
Metabolicsyndrome
Pain and Sickleave
Psychiatricdisorders .
Self ratedhealth
1.1.
3.
4.
5.Inflammation
VulnerabilityPhysiologicalrisk factors
2.
6.
5.
2.
Aims
1. To study the associations between socioeconomic position, life conditions, behavioral risk factors, and psychosocial factors respectively.
2. To study the association between traditional CAD risk factors and plausible biomarkers related to stress, inflammation, and vulnerability.
3. To study the association between psychosocial factors and plausible biomarkers.
4. To study the interaction between behavioral risk factors and psychosocial factors regarding mentioned plausible biomarkers.
5. To study life conditions, behavioral risk factors, and psychosocial factors as predictors for outcome in different diagnoses.
6. To study biomarkers as predictors for outcome in different diagnoses.
This dissertation is mainly comprised of the work from levels 2 and 3. See Figure 8 in section 1.8 for comparison.
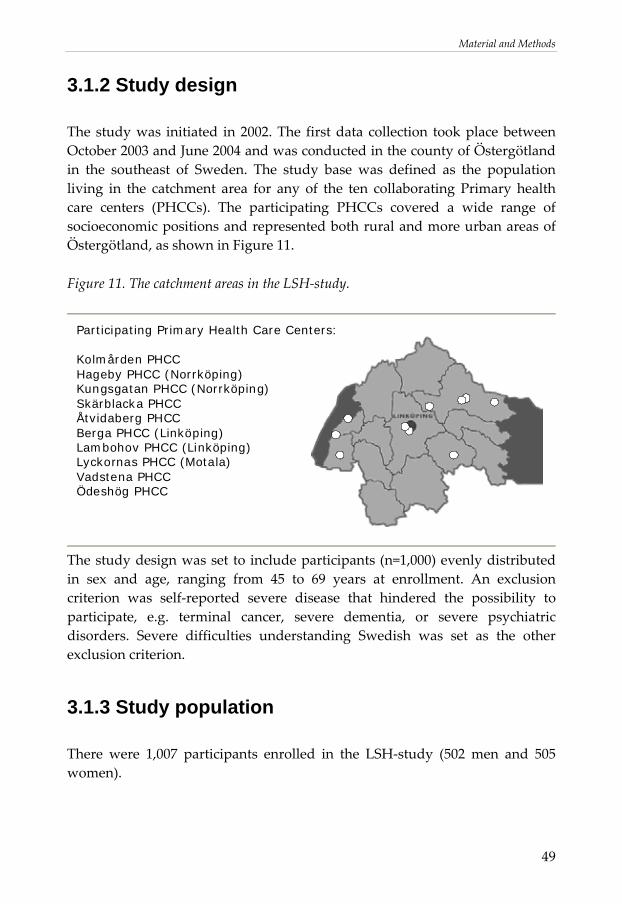
Material and Methods
49
3.1.2 Study design
The study was initiated in 2002. The first data collection took place between October 2003 and June 2004 and was conducted in the county of Östergötland in the southeast of Sweden. The study base was defined as the population living in the catchment area for any of the ten collaborating Primary health care centers (PHCCs). The participating PHCCs covered a wide range of socioeconomic positions and represented both rural and more urban areas of Östergötland, as shown in Figure 11.
Figure 11. The catchment areas in the LSH‐study.
Participating Primary Health Care Centers:
Kolmården PHCCHageby PHCC (Norrköping)Kungsgatan PHCC (Norrköping)Skärblacka PHCCÅtvidaberg PHCCBerga PHCC (Linköping)Lambohov PHCC (Linköping)Lyckornas PHCC (Motala)Vadstena PHCCÖdeshög PHCC
The study design was set to include participants (n=1,000) evenly distributed in sex and age, ranging from 45 to 69 years at enrollment. An exclusion criterion was self‐reported severe disease that hindered the possibility to participate, e.g. terminal cancer, severe dementia, or severe psychiatric disorders. Severe difficulties understanding Swedish was set as the other exclusion criterion.
3.1.3 Study population
There were 1,007 participants enrolled in the LSH‐study (502 men and 505 women).
Material and methods
50
The response rate for the initial baseline study was 62.5%. The sample was representative for the population in terms of educational attainment, employment rates, and immigrant status.
3.1.4 Random sample procedure
The LSH‐study was designed to examine a stratified random sample of the study population. The procedure was based on the methodology used in the HAPIEE‐study [232] and was performed in the following steps:
1) The catchment areas for each of the ten PHCC were defined, using geographical maps matched with corresponding postal codes.
2) The population that was living in any of the ten catchment areas, that is had a registered address within any of the listed postal codes on December 31, 2002 was identified using the official register of the total population.
3) All inhabitants born between January 1, 1933 and December 31, 1957 were selected.
4) All inhabitants were stratified by PHCC, sex, and 5‐year categories (born 1933 – 1937, 1938 ‐ 1942, 1943 ‐ 1947, 1948 ‐ 1952, and 1953 ‐ 1957 respectively), using the postal codes and the Swedish personal identity number.
5) Every person in each stratum was assigned an arbitrary decimal, astratum, in the interval between 0.000 000 and 1.000 000 by a random number generator. The participants in each stratum were sorted in ascending order according to astratum.
6) The design was set to include 10 persons from each stratum. By dividing by 20, the random sample procedure provided for a participation rate of 50%. The total number of persons in each stratum, nstratum, was thus divided by 20. The ratio was rounded to the nearest integer, xstratum, interpreted as “one out of xstratum persons in every stratum will be invited to the LSH‐study”.
7) An integer, istratum, within the interval of 1 to xstratum, was computed for each stratum using a random number generator.
8) Using the lists sorted by astratum, persons who were invited to the LSH‐study were selected by istratum + xstratum, where the additions of xstratum were iterated 19 times. Thus, the first person in each stratum invited to the
Material and Methods
51
LSH‐study had the post corresponding to istratum and the twentieth person the post corresponding to istratum + 19(xstratum).
9) Participants were invited consecutively, starting from the top of the list until there were ten participants that had accepted the invitation in each stratum.
10) There were a few strata in which the participation rate was lower than 50%. In those cases, the steps 7 to 9 above were repeated, using an altered istratum, to enable an inclusion of 10 participants in each stratum.
3.1.5 Data collection
The data collected were acquired from measurements of physiological characteristics (see section 3.2), an extensive set of questionnaires (see section 3.3) and biological samples in saliva, blood, and urine (see section 3.4). After the random sample procedure, invitations were sent out, together with the first set of questionnaires. If the respondent was willing to be a participant in the study, salivettes and a vial for a urine sample were sent out together with an appointed time for a PHCC visit. If there was no answer, a reminder was sent out after about two weeks.
3.1.6 Ethical considerations
Every participant in the study has given written consent stating that the data from the questionnaire, the measurements on physiological characteristics, and the biological samples can be used for research. The participants were informed that they, at anytime upon request and without any further explanation, can drop out of the study and ask to have their collected biological samples destroyed immediately. All data were treated with confidentiality. The code‐numbers used for the participants were not identifiable to a higher extent than age, sex, and catchment area. The study design was approved by the local ethics committee in Linköping (No. 02‐324).
Material and methods
52
3.2 Primary health care center visit
The participants came to the PHCCs in the morning. The participants’ first set of questionnaires (see section 3.3) and the saliva samples (see section 3.4.1) were submitted to the assistant nurses. Participants with clinical symptoms of infection were instructed to come back to the PHCC after recovery. All blood samples were taken between 6.30 and 9.00 AM in a fasting state. After the measurements and blood sampling, the participants were offered a complimentary breakfast. Based on the measurements, and the data from the questionnaires regarding smoking and physical activity, all participants were given direct feed‐back on their results. The nurses assisting in the study had specific guidelines regarding the discovery of abnormal measures on blood pressure, blood lipids and/or blood glucose. If abnormally high, the participants were scheduled to see a nurse or a physician for further check‐up. A modified version of the health profile developed in Habo PHC, Sweden [233] was used as an educational tool in a health dialogue between the nurse and the participant. When applicable, a brief intervention was conducted, in terms of a motivating interview focusing on diet, physical exercise, and smoking cessation. If the participant had multiple risk factors, well defined criteria according to existing guidelines (based on the SCORE‐system) [234] and the risk estimation algorithm developed in the software Precard (also based on the SCORE‐system) [235] were used as a golden standard for intervention recommendations. Feed‐back on blood lipids were sent to the participants when the results had returned from the laboratory. All nurses collecting data were trained together and the laboratory equipment used was calibrated to ensure standardization.
3.2.1 Physiological characteristics
Blood pressure (SBP and DBP) were measured in a sitting position in two minutes interval after five minutes of rest. The mean of second and the third measurement (Omron M5‐1 digital) were used as estimates for SBP and DBP. Weight, height, and waist‐hip measurements in standing position were collected. Plasma glucose (HemoCue), triglycerides, and lipids (ADVIA 1650) were analyzed directly after sample collection, and LDL‐cholesterol was calculated using Friedewald’s formula [236]. This formula is based on the
Material and Methods
53
assessment of total cholesterol, HDL, and triglycerides, using the approximation shown in Figure 12.
Figure 12. Friedewald’s formula used to estimate LDL concentrations (mmol/l) in blood.
[LDL] = [Total cholesterol] – [HDL] – (0.456 x [Triglycerides])
3.3 Questionnaires
All participants were asked to fill in an extensive set of questionnaires. The first set of questionnaires was sent by mail to the participant. The other set was distributed at the PHCC. The filled‐in questionnaires were collected either at the PHCCs or sent back by mail. The following sections (3.3.1 to 3.3.3) present the items that have been used in this dissertation. Data in the LSH‐study questionnaires not analyzed in this dissertation are omitted.
3.3.1 Behavioral risk factors for cardiovascular disease
Smoking
Smoking was addressed using the single item “Do you currently smoke?” with the four alternatives [No, never have] [No, I quit in the year….] [Yes, sometimes, less than a cigarette per day] and [Yes, on a regular basis], respectively. A dichotomy was generated, congregating the first two and the two latter alternatives.
Alcohol
Alcohol intake was based on a food frequency questionnaire adopted from the Swedish Mammography Cohort study [237] combining frequency and typical amounts of different beverages. By combining the frequency with the
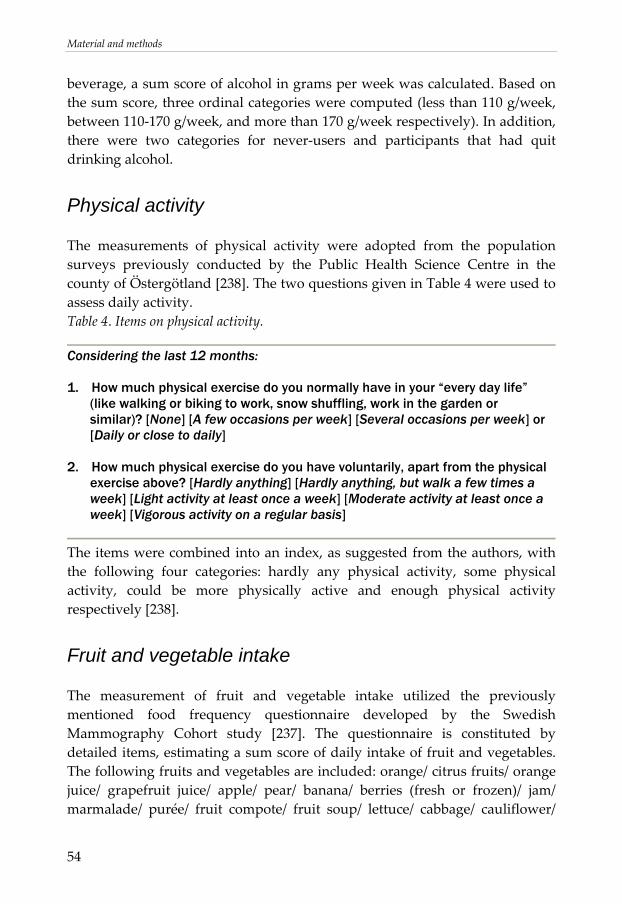
Material and methods
54
beverage, a sum score of alcohol in grams per week was calculated. Based on the sum score, three ordinal categories were computed (less than 110 g/week, between 110‐170 g/week, and more than 170 g/week respectively). In addition, there were two categories for never‐users and participants that had quit drinking alcohol.
Physical activity
The measurements of physical activity were adopted from the population surveys previously conducted by the Public Health Science Centre in the county of Östergötland [238]. The two questions given in Table 4 were used to assess daily activity. Table 4. Items on physical activity.
Considering the last 12 months: 1. How much physical exercise do you normally have in your “every day life”
(like walking or biking to work, snow shuffling, work in the garden or similar)? [None] [A few occasions per week] [Several occasions per week] or [Daily or close to daily]
2. How much physical exercise do you have voluntarily, apart from the physical
exercise above? [Hardly anything] [Hardly anything, but walk a few times a week] [Light activity at least once a week] [Moderate activity at least once a week] [Vigorous activity on a regular basis]
The items were combined into an index, as suggested from the authors, with the following four categories: hardly any physical activity, some physical activity, could be more physically active and enough physical activity respectively [238].
Fruit and vegetable intake
The measurement of fruit and vegetable intake utilized the previously mentioned food frequency questionnaire developed by the Swedish Mammography Cohort study [237]. The questionnaire is constituted by detailed items, estimating a sum score of daily intake of fruit and vegetables. The following fruits and vegetables are included: orange/ citrus fruits/ orange juice/ grapefruit juice/ apple/ pear/ banana/ berries (fresh or frozen)/ jam/ marmalade/ purée/ fruit compote/ fruit soup/ lettuce/ cabbage/ cauliflower/

Material and Methods
55
broccoli/ sprouts/ tomato/ tomato juice/ bell pepper/spinach/ green peas/ onion/ leek/ garlic/ mixed vegetables/ pea soup/ beans/ lentils/ soya products/ cooked potatoes/ fried potatoes/ French fries/ carrot/ beetroot. A sum score in grams per day was computed, using the algorithm designed for the instrument [237]. Data were used as ordinal categories, as attempts to quantify total intake more exactly would be based on assumptions that could not be validated in the LSH study. The participants were divided into three subgroups: Low intake (less than mean minus one SD), moderate (mean plus/minus one SD), and high intake (more than mean plus one SD), with the underlying assumption that such a stratification would discriminate individuals having a high daily consumption of fruit and vegetables from individuals having a low daily consumption.
3.3.2 Psychosocial instruments
The psychosocial instruments were chosen with the criteria that they should be validated and previously tested in a substantial number of studies. Furthermore, outcome on the instruments should have been associated with cardiovascular disease [15,16,23,24,146,239,240], and/or have been associated with inflammatory markers in previous studies [241,242]. Nine different instruments were used. None of them focus on the external load of stressors, but rather the experience of the stressful situation and the stress response. All but two (availability of attachment and availability of social integration) are constructed as Likert scales, that is based on a number of statements or questions on which the respondent is asked to agree or disagree in a fixed number of answer alternatives. Typically, there are both positive and negative statements and/or questions in the same instrument. The responses to the items are summed into a non‐weighted index where each of the items has the same proportional contribution to the summed score. In our analyses, there was an allowance for a partial loss with missing values on one item for instruments with less than 15 items, and missing values on two items for instruments with more than 15 items. Higher partial losses were regarded as missing data. An imputation process was performed for participants with an acceptable partial loss in the instruments tested, where an arithmetic mean of the items with data was computed on an individual basis and used as an approximate response in the items with missing values.
Material and methods
56
Availability of attachment
Orth‐Gomér’s instrument known as availability of attachment (also called emotional attachment or emotional support) has its origin in the comprehensive Interview schedule for social interaction (ISSI) [243]. Aiming at feasibility in self‐administered questionnaires to use in cohort studies (with CAD as the main outcome), ISSI was reduced to two subsets of items, one of which is availability of attachment [244]. The instrument is thought to measure what a person’s social network provide in terms of emotional support, e.g. if the respondent has someone close to confide in and to lean on in real hardships. In other words, it is thought to address the quality of social ties. Availability of attachment differs in construction from the other instruments used, as the answer alternatives are simply restricted to “yes” or “no” rather than a grading Likert scale. Six items are used. The number of positive answers is summed to an index, giving a range from 0 to 6. By construct, the distribution of scores will be highly skewed to the right in a normal population, as most respondents do at least have someone close to lean on in real hardships [145]. Availability of attachment is thought to be stable over time. Closely related instruments have demonstrated high test‐retest stability in various settings (r=0.7 to 0.9) [245]. The full instrument may be seen in Appendix II.
Availability of social integration
Availability of social integration is the other abbreviated subset derived from ISSI [244]. The items concern number of people that the respondent interacts with in daily life during a week e.g. that share interests or that can visit at any time. In other words, it is thought to address the quantity of social ties. Like availability of attachment, availability of social integration is not a Likert scale, but a summed index ranging from no social ties to a large amount of social ties. It has been pointed out by the constructors that availability of social integration should not be regarded as a continuous scale, as the change of one unit in the summed score is not the same at all points at the summed index [145]. Like availability of attachment, availability of social integration is thought to be stable over time. Closely related instruments have demonstrated high test‐retest stability in various settings (r=0.7 to 0.9) [245].
Material and Methods
57
The instrument is constituted by six items with six answer categories, giving a range in the sum score from 6 to 36. The full instrument may be seen in Appendix III.
Mastery
The questionnaire of mastery was constructed by Pearlin in 1978 [148]. It aims to capture ability to cope with potential stressors in everyday life. Pearlin emphasizes that mastery is a resource (as opposed to a strategy) which buffers “social experiences that adversely penetrate people’s emotional life”. A central concept is that mastery does not refer to what people do in a given situation but rather what people are regardless of context. In other words, mastery is based on the idea of general psychosocial resources that protects the individual from potential stressors that could cause a negative affect. Pearlin describes mastery as being one of three vital components of coping with stressors. The items in the questionnaire concern the extent to which one regards one’s life chances as being under one’s control in contrast to being fatalistically ruled [148]. Although the other two components (self‐esteem, see section below, and self‐denignation) are omitted, the mastery scale is frequently used in questionnaires as a proxy for the concept of coping. The test‐retest stability have been shown to be high, in concordance with the underlying theory of mastery as a stable trait (r=0.85 comparing a situation with acute stress with a supposedly non‐stressful situation 3 months afterwards) [246]. The instrument are constituted by seven items with four answer categories, giving a range in the sum score from 7 to 28. The full instrument may be seen in Appendix IV.
Self-esteem
The questionnaire of self‐esteem was also constructed by Pearlin in 1978 [148]. In Pearlin’s definition, self‐esteem is another aspect of coping besides mastery. The instrument aims to capture the positiveness of one’s attitudes towards one self. As with mastery, the questionnaire is designed to reflect what people are rather than what people do. The items were not invented by Pearlin himself, but are derived from a factor analysis from Rosenberg’s self‐esteem scale [148]. By definition, self‐esteem is linked to outcome expectancy following a stressor. As with mastery, the test‐retest stability has been shown to be high (r=0.85 comparing a situation with acute stress with a supposedly non‐stressful

Material and methods
58
situation 3 months afterwards) [246]. The instrument is constituted by ten items with four answer categories, giving a range in the sum score from 10 to 40. The full instrument may be seen in Appendix V.
Sense of coherence
The concept of sense of coherence (SOC) was presented by Antonovsky 1987 [247]. It is based on the idea that there are salutogene factors that contribute to good health despite harsh conditions in daily life. The idea is based on observations of Israeli women and men who survived concentration camps in World War II and, despite the experiences there, managed to maintain apparent mental and physical health. Antonovsky proposed that the salutogenic SOC is based on three interrelated concepts of meaningfulness, comprehensibility and manageability. SOC is defined as a stable trait in theory. Its stable properties can be confirmed in test‐retest stability performed in various settings (being around r=0.5 in a ten year follow‐up) [248], even though its pointed out that SOC is less stable than initially proposed [248]. The SOC‐scale differs somewhat in principle from the other Likert scales used. Whereas the others are constructed with the same fixed answer alternatives for every item, typically stating a number of days per week, or ranging from minor to major extent, the answer alternatives in SOC vary. The possible answers are constructed based on opposable pairs (such as very often versus never) which give the highest versus and the lowest score on the specific item. The categories in between are not defined but are treated as a continuous scale between lowest to highest score on each item. Several versions of the questionnaire have been used in studies with different purposes [248]. In this study, we have the used the widespread 13‐item version with seven answer categories, giving a range in the sum score from 13 to 91. The full instrument may be seen in Appendix VI.
Hostile affect
The Cook‐Medley hostility scale was developed in 1954 [240]. It was originally designed to identify teachers who had difficulties getting along with their students. Over the years, the instrument has been refined for use as a more general instrument to capture attitudes towards others. In 1988, Barefoot and colleagues suggested a categorization of six subsets of items, that could be used as predictors in survival analyses, where poor outcome was associated
Material and Methods
59
with higher mortality [240]. Hostile affect is one of those six subsets, referring to the experience of negative emotions associated with social contacts. The items aim to capture an admittance of anger, impatience, and reluctance when facing other people. It is a questionnaire focusing on the affect and frustration in silence rather than the aggression, as it does not imply that the respondent actually acts on the basis of these emotions (there is another subscale in the original measurement, hostile aggression that captures overt aggression) [240]. Hostile affect is supposed to be a trait. A high test‐retest stability (r=0.84 in a follow‐up period of four years) has been demonstrated [249]. The instrument is constituted by five items with five answer categories, giving a range in the sum score from 5 to 25. The full instrument may be seen in Appendix VII.
Cynicism
Cynicism, like hostile affect, is one of the subsets that Barefoot and colleagues derived from the Cook‐Medley hostility scale [240]. The items are focused on perception of other’s behavior in everyday life and aim to capture a negative view of mankind, beholding people in general as unworthy, deceitful, and selfish. Like hostile affect, cynicism is considered to be a stable trait formed under a considerable amount of time (r=0.84 for the entire Cook‐Medley hostility scale for a four‐year period, r=0.76 for a ten‐year period) [250,251]. The correlation with Hostile affect has been shown to be around r=0.4 [240] The instrument is constituted by twelve items with five answer categories, giving a range in the sum score from 12 to 60. The full instrument may be seen in Appendix VIII.
Depression
Centre for Epidemiological Studies Depression Scale (CES‐D) was developed by Radloff in 1977 [252]. It was designed to measure depressive symptoms in a normal population by condensing items from a pool of previously validated depression scales. The aim of the instrument was to provide a useful tool for epidemiological studies, capturing the major components in depressive symptomatology. It was not designed to capture a clinical depression per se, by using a discriminating cut‐off value, but rather to compare the current level of depressed mood between different groups, with emphasis on the affective component i.e. on diffuse and unspecific state of sadness, worthlessness and hopelessness. Despite being designed to measure symptoms at a given short
Material and methods
60
time point, thereby asking for a temporary state, CES‐D has been shown to have a acceptable test‐retest stability (r=0.54 in a normal population without any severe life events between assessments) [252]. The instrument is constituted by twenty items with four answer categories, giving a range in the sum score from 0 to 60. The full instrument may be seen in Appendix IX.
Vital exhaustion
The Maastricht questionnaire of vital exhaustion was developed by Appels in 1987 [239]. It was designed to measure mental and physical fatigue as a risk factor for myocardial infarction, based on clinical observations that many patients report “a lack of energy” prior to a cardiac event. It is thought to measure a state following a long‐standing problem that the respondent has not been able to resolve. In other words, it is tightly linked to a state of chronic stress, and has been described as a minor depression or a state of demoralization [239]. As with CES‐D, even though the questionnaire items are focused to capture a temporary state, the test‐retest stability is generally high (r=0.85 over a follow‐up time of 4 years) [253]. A slight modification of the original scale was used, based on 19 items instead of the original 21, with a somewhat modified phrasing in a few items. Three answer categories were used, giving a range in the sum score from 19 to 57. The full instrument may be seen in Appendix X.
3.3.3 Ongoing medication and previous diagnoses
To capture any previous events of myocardial infarction, the question “Have you ever had any event of myocardial infarction diagnosed by a medical doctor? [Yes][No][Don’t know]” was used. Questions regarding angina pectoris, stroke, diabetes, and cancer were constructed similarly. The diagnosis of RA and other chronic inflammatory diseases was captured using the question “Have you ever had any other chronic or long‐term disease diagnosed by a medical doctor? [Yes] [No] [Don’t know] If yes, please specify”. The participants were further asked to specify any ongoing medication, taken on a regular basis. All medications were listed and grouped by the Anatomical Therapeutic Chemical (ATC) classification system.
Material and Methods
61
3.4 Measurements of biomarkers
Aliquots (0.5 ml) of plasma for analysis of MMP‐9 and serum for analyses of CRP were stored in ‐70o C approximately 16 to 22 months before laboratory analysis. Aliquots of saliva for analysis of cortisol were stored in –70o C approximately six months before analysis.
3.4.1 Matrix metalloproteinase-9
The concentrations of MMP‐9 were measured in EDTA‐plasma. All analyses were conducted by the same laboratory assistant using an ELISA method with human Biotrak ELISA systems (Amersham Biosciences, Uppsala, Sweden). The assay for MMP‐9 measures MMP‐9, Pro‐MMP‐9 and the ProMMP‐9/TIMP‐1 complex. The lower detection limit was 0.6 ng/ml. The interassay coefficient of variance (CV) was 7.2 to 7.9%. The analyses of MMP‐9 were performed in two runs, where preliminary statistical analyses were performed on half of the participants (n=201), before deciding if analysis should be performed on the entire sub‐sample. The same batch of the kit was however used in both runs. The mean difference of storage time prior to analyses between the two runs was estimated to be around six months.
Tissue inhibitor of metalloproteinases-1
TIMP‐1 was measured in half of the participants (n=201) using the same EDTA‐plasma samples as for analysis of MMP‐9. An ELISA method with human Biotrak ELISA systems (Amersham Biosciences, Uppsala, Sweden) was used. The assay recognizes free TIMP‐1, and TIMP‐1 complexed with MMPs and has a lower detection limit of 1.25 ng/ml and a CV of 6.8%.
3.4.2 Cortisol
The assessment of cortisol was designed to capture an average diurnal variation in everyday life. As cortisol in saliva has been shown to reflect concentrations in serum with good precision [254,255], the assessment of cortisol was performed using a non‐invasive procedure. Cortisol was sampled at home, using specific salivettes designed for the purpose.
Material and methods
62
Study design was set to include sample collection during three consecutive days, with sampling three times a day (9 samples in total). The participants were instructed to start sampling preferably on a Tuesday and end on a Thursday (with the exception of night‐shift workers who were instructed to start any day of convenience, collecting samples three days in a row with the same working hours). Samples were collected immediately after awakening (t1), thirty minutes after awakening before breakfast (t2), and just before going to bed in the evening (t3), aiming to sample in proximity to the highest (t1 + t2) and lowest (t3) cortisol levels in the diurnal variation. The participants were instructed to avoid physical exercise, food intake, and smoking one hour prior to sampling. Each participant was asked to fill in a protocol for the samples collected, giving information on the estimated time point for sampling. There was also a space for the participant to write comments (e.g. “been smoking” or “recently been eating”) regarding circumstances that could affect the interpretation of the results. To minimize the risk of participants taking the salivettes in the wrong order, the salivettes were marked with a unique number for t1, t2, and t3, respectively, and different colors were used to indicate day 1 to 3. If salivettes nonetheless were taken in the wrong order, there was a given space on the sampling protocol where this could be indicated. It was thus possible to take non‐compliance to the protocol into account. Further, the participants reported normal awakening time, making it possible to adjust for deviation from normal awakening time in the analyses. The participants were instructed to keep the salivettes in a refrigerator as soon as a saliva sample had been collected. The samples were thereafter brought to the closest PHC centre (typically on the first Friday following the days of sampling), where they were centrifuged. 150 μl from each salivette (or as much as the salivette with least content if less than 150 μl), were pooled into cryogenic vials as follows: one vial for awakening samples (pool‐ t1), one for samples taken thirty minutes after awakening (pool‐ t2), and one for evening samples (pool‐ t3). If one salivette was empty, equal volumes of saliva from the other two were pooled together. Remaining saliva in each salivette was transferred to separate vials, giving in total 12 vials per participant. These were kept in a freezer (–70o C) until analysis. The duration in the freezer prior to analysis have been suggested not to affect cortisol levels to any major extent [256]. All samples were thawed and analyzed in duplicate using a radioimmunoassay method (Diagnostic Products Corporation, Los Angeles. CA). The intra‐assay coefficient of variation was 9.4% at 5 nmol/l and 9.8% at 12 nmol/l. The analysis of cortisol was performed in one run.
Material and Methods
63
3.4.3 C-reactive protein
CRP was measured in serum according to standard accredited laboratory routines. All samples were analyzed in the same laboratory, using a highly sensitive latex‐enhanced turbidimetric immunoassay (Roche Diagnostics GmbH, Vienna, Austria) with a lower detection limit of 0.03 mg/l and CV of 1.7%.
3.5 Specific study designs
In an initial phase, it was decided that MMP‐9 should be explored in a subset of the LSH‐study. Applying basic assumptions regarding the prevalence of CAD risk factors and MMP‐9 distribution in a normal population, power calculation yielded an estimation of 400 participants to be sufficient in order to show significant associations between CAD risk factors and MMP‐9. Plasma samples from 402 participants were randomly drawn from the first 1,007 participants in the LSH‐study, without any given criteria for stratification such as sex or age. All ten participating PHCCs were represented in the subset in an even distribution. Paper I, II, and IV are based on this drawn sub‐sample (n=402). Depending on the specific study aims, the subset was treated somewhat differently in the different papers. In Paper I, as we wanted to explore the distribution of MMP‐9 in relation to cardiovascular risk factors before onset of disease in a normal population, participants with a self‐reported history of CAD and participants unsure of diagnosis were excluded from the analyses. Participants using cholesterol lowering medication were excluded as well, further pushing the healthy selection towards a population free from known CAD. In Paper II and IV, all participants were included in the crude analyses, with the exception of two outliers on MMP‐9 (>200 ng/ml) discussed in section 5.5.3. Exclusions were made in specific sub‐analyses to minimize possible confounding from disease and ongoing medication. In Paper III, a pilot study aiming at enhancing methodology of ambulatory saliva cortisol assessments, a smaller sub‐sample was drawn from the LSH‐study (n=30). Again, there were no criteria given for stratification. The participants were drawn from eight of the ten collaborating PHCCs. The conceptual purpose differs from that of the other three papers, as the others
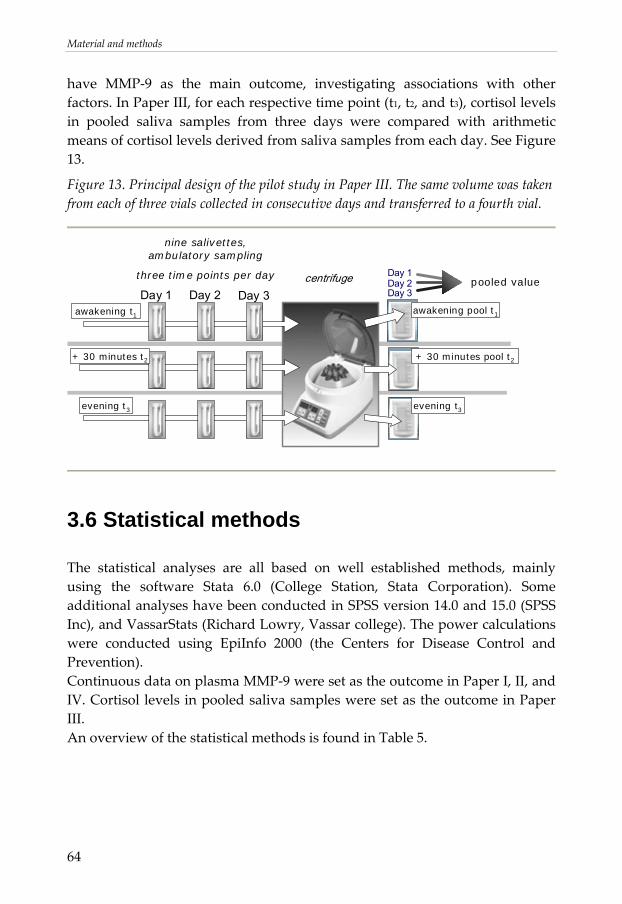
Material and methods
64
have MMP‐9 as the main outcome, investigating associations with other factors. In Paper III, for each respective time point (t1, t2, and t3), cortisol levels in pooled saliva samples from three days were compared with arithmetic means of cortisol levels derived from saliva samples from each day. See Figure 13.
Figure 13. Principal design of the pilot study in Paper III. The same volume was taken from each of three vials collected in consecutive days and transferred to a fourth vial.
Day 3
Day 1Day 2Day 3
pooled value
awakening t1
evening t3
nine salivettes, ambulatory sampling
three time points per day
Day 2Day 1centrifuge
+ 30 minutes t2
awakening pool t1
+ 30 minutes pool t2
evening t3
3.6 Statistical methods
The statistical analyses are all based on well established methods, mainly using the software Stata 6.0 (College Station, Stata Corporation). Some additional analyses have been conducted in SPSS version 14.0 and 15.0 (SPSS Inc), and VassarStats (Richard Lowry, Vassar college). The power calculations were conducted using EpiInfo 2000 (the Centers for Disease Control and Prevention). Continuous data on plasma MMP‐9 were set as the outcome in Paper I, II, and IV. Cortisol levels in pooled saliva samples were set as the outcome in Paper III. An overview of the statistical methods is found in Table 5.
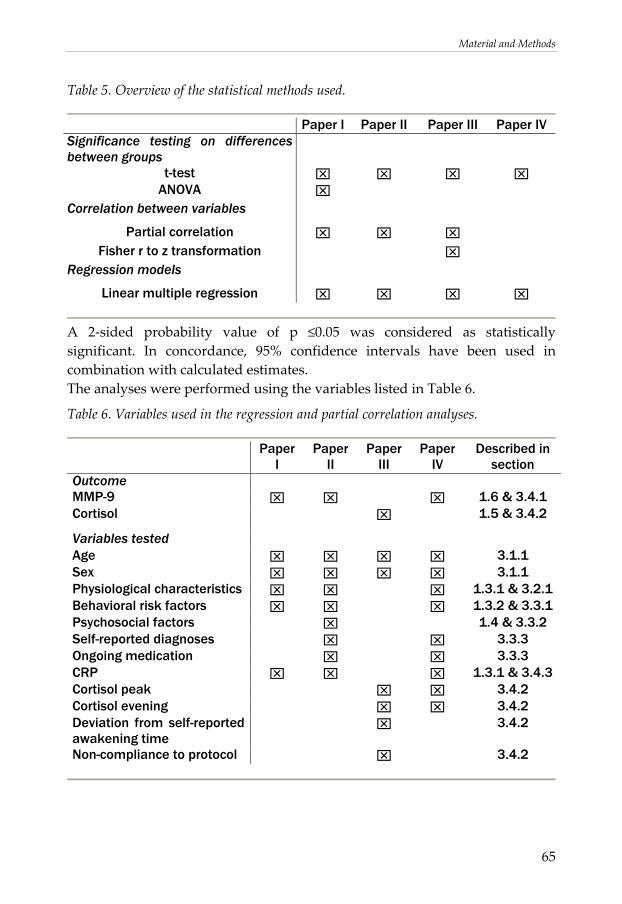
Material and Methods
65
Table 5. Overview of the statistical methods used.
Paper I Paper II Paper III Paper IV Significance testing on differences between groups
t-test ⌧ ⌧ ⌧ ⌧ ANOVA ⌧
Correlation between variables
Partial correlation ⌧ ⌧ ⌧ Fisher r to z transformation ⌧
Regression models
Linear multiple regression ⌧ ⌧ ⌧ ⌧
A 2‐sided probability value of p ≤0.05 was considered as statistically significant. In concordance, 95% confidence intervals have been used in combination with calculated estimates. The analyses were performed using the variables listed in Table 6.
Table 6. Variables used in the regression and partial correlation analyses.
Paper I
Paper II
Paper III
Paper IV
Described in section
Outcome MMP-9 ⌧ ⌧ ⌧ 1.6 & 3.4.1 Cortisol ⌧ 1.5 & 3.4.2
Variables tested Age ⌧ ⌧ ⌧ ⌧ 3.1.1 Sex ⌧ ⌧ ⌧ ⌧ 3.1.1 Physiological characteristics ⌧ ⌧ ⌧ 1.3.1 & 3.2.1 Behavioral risk factors ⌧ ⌧ ⌧ 1.3.2 & 3.3.1 Psychosocial factors ⌧ 1.4 & 3.3.2 Self-reported diagnoses ⌧ ⌧ 3.3.3 Ongoing medication ⌧ ⌧ 3.3.3 CRP ⌧ ⌧ ⌧ 1.3.1 & 3.4.3 Cortisol peak ⌧ ⌧ 3.4.2 Cortisol evening ⌧ ⌧ 3.4.2 Deviation from self-reported awakening time
⌧ 3.4.2
Non-compliance to protocol ⌧ 3.4.2
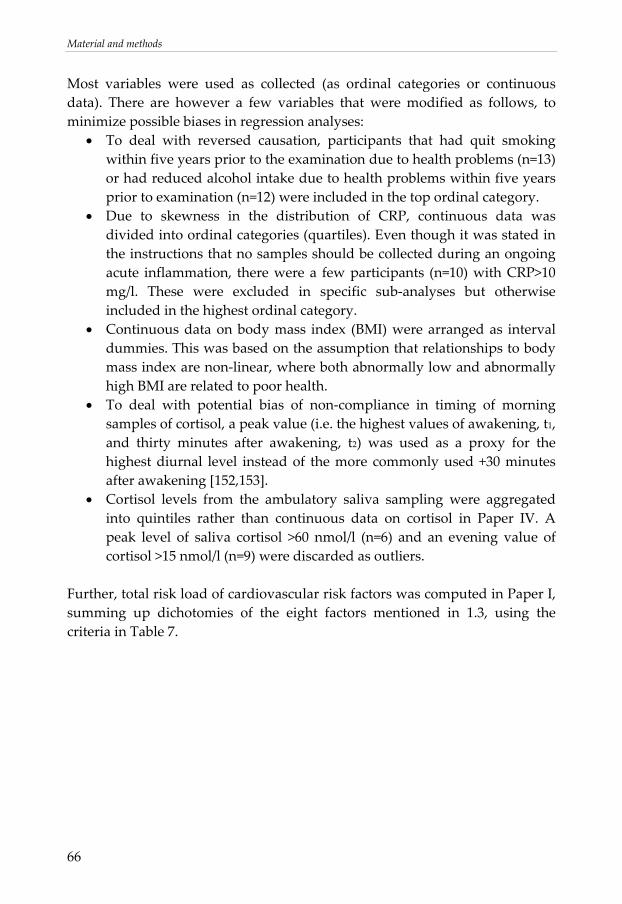
Material and methods
66
Most variables were used as collected (as ordinal categories or continuous data). There are however a few variables that were modified as follows, to minimize possible biases in regression analyses:
• To deal with reversed causation, participants that had quit smoking within five years prior to the examination due to health problems (n=13) or had reduced alcohol intake due to health problems within five years prior to examination (n=12) were included in the top ordinal category.
• Due to skewness in the distribution of CRP, continuous data was divided into ordinal categories (quartiles). Even though it was stated in the instructions that no samples should be collected during an ongoing acute inflammation, there were a few participants (n=10) with CRP>10 mg/l. These were excluded in specific sub‐analyses but otherwise included in the highest ordinal category.
• Continuous data on body mass index (BMI) were arranged as interval dummies. This was based on the assumption that relationships to body mass index are non‐linear, where both abnormally low and abnormally high BMI are related to poor health.
• To deal with potential bias of non‐compliance in timing of morning samples of cortisol, a peak value (i.e. the highest values of awakening, t1, and thirty minutes after awakening, t2) was used as a proxy for the highest diurnal level instead of the more commonly used +30 minutes after awakening [152,153].
• Cortisol levels from the ambulatory saliva sampling were aggregated into quintiles rather than continuous data on cortisol in Paper IV. A peak level of saliva cortisol >60 nmol/l (n=6) and an evening value of cortisol >15 nmol/l (n=9) were discarded as outliers.
Further, total risk load of cardiovascular risk factors was computed in Paper I, summing up dichotomies of the eight factors mentioned in 1.3, using the criteria in Table 7.
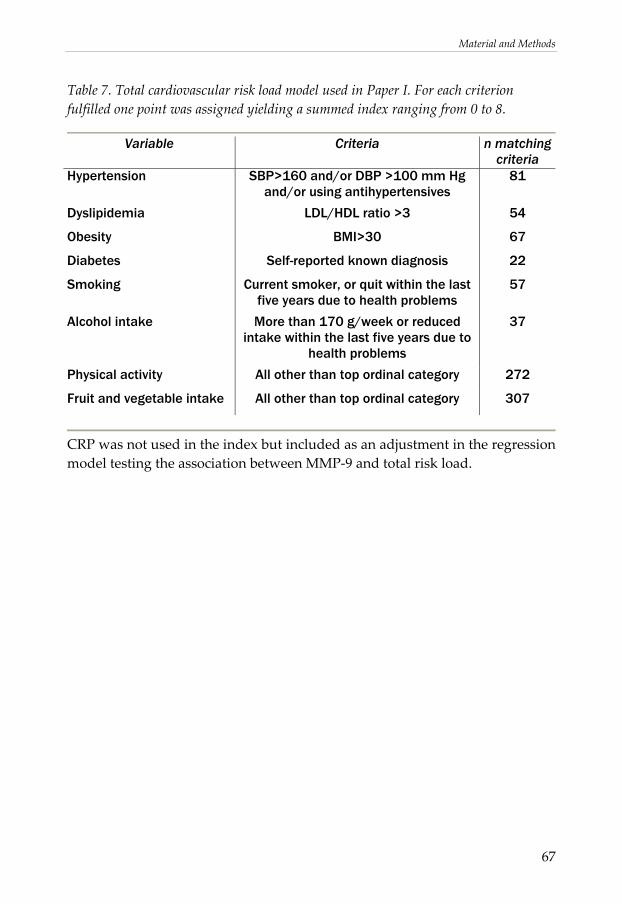
Material and Methods
67
Table 7. Total cardiovascular risk load model used in Paper I. For each criterion fulfilled one point was assigned yielding a summed index ranging from 0 to 8.
Variable Criteria n matching
criteria Hypertension SBP>160 and/or DBP >100 mm Hg
and/or using antihypertensives 81
Dyslipidemia LDL/HDL ratio >3 54
Obesity BMI>30 67
Diabetes Self-reported known diagnosis 22
Smoking Current smoker, or quit within the last five years due to health problems
57
Alcohol intake More than 170 g/week or reduced intake within the last five years due to
health problems
37
Physical activity All other than top ordinal category 272
Fruit and vegetable intake All other than top ordinal category 307
CRP was not used in the index but included as an adjustment in the regression model testing the association between MMP‐9 and total risk load.

68
Results
69
4. RESULTS IN BRIEF
4.1 General findings on MMP-9
Results from Paper I, Paper II, and Paper IV yielded findings on circulating levels of MMP‐9 as follows:
• MMP‐9 could be detected in plasma in all participants. The mean and standard deviation (n=400) were 39.2 ng/ml (SD 22.8 ng/ml), ranging from 2.9 to 143.9 ng/ml.
• Circulating levels of MMP‐9 were significantly higher in participants with a prior myocardial infarction and/or angina pectoris.
In a univariate analysis (n=381), the difference between mean levels for the group with self‐reported myocardial infarction and/or angina pectoris (n=16) and the other participants was 14.0 ng/ml (mean: 52.7 (SD 34.5) vs. 38.7 (SD 22.1) ng/ml, p=0.015).
• Circulating levels of MMP‐9 were significantly lower in women than in men.
In a univariate analysis (n=400), the difference between mean levels for men and women was 8.3 ng/ml (mean: 43.4 (SD 24.5) vs. 35.1 (SD 20.3) ng/ml p<0.001).
• There was a significant but rather weak correlation between MMP‐9 and CRP.
The partial correlation between MMP‐9 and CRP (adjusting for age and sex) was r=0.12 (n=389, p<0.001). After exclusion of individuals with CRP>10 mg/l the coefficient was still fairly low, r=0.19 (n=379, p<0.001.
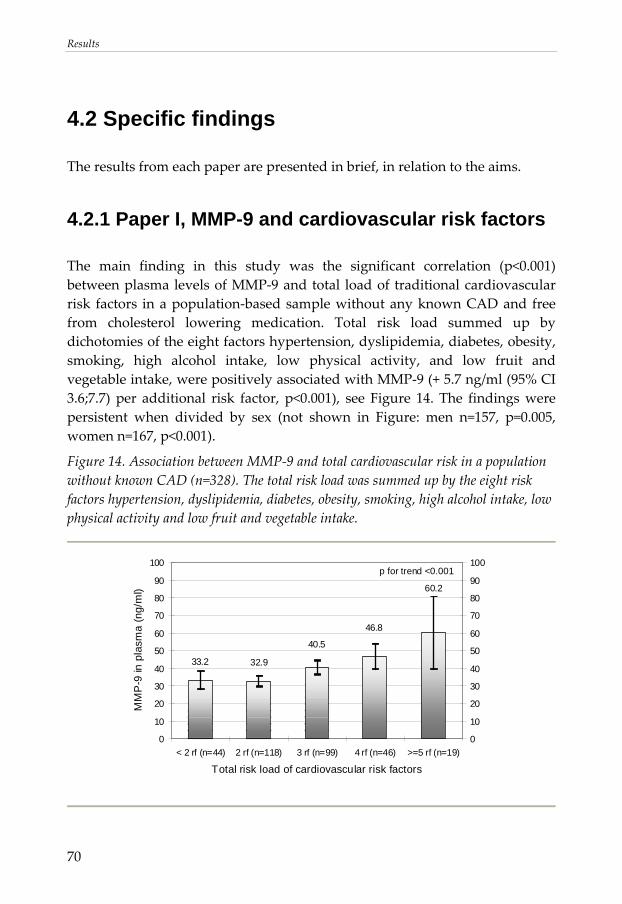
Results
70
4.2 Specific findings
The results from each paper are presented in brief, in relation to the aims.
4.2.1 Paper I, MMP-9 and cardiovascular risk factors
The main finding in this study was the significant correlation (p<0.001) between plasma levels of MMP‐9 and total load of traditional cardiovascular risk factors in a population‐based sample without any known CAD and free from cholesterol lowering medication. Total risk load summed up by dichotomies of the eight factors hypertension, dyslipidemia, diabetes, obesity, smoking, high alcohol intake, low physical activity, and low fruit and vegetable intake, were positively associated with MMP‐9 (+ 5.7 ng/ml (95% CI 3.6;7.7) per additional risk factor, p<0.001), see Figure 14. The findings were persistent when divided by sex (not shown in Figure: men n=157, p=0.005, women n=167, p<0.001).
Figure 14. Association between MMP‐9 and total cardiovascular risk in a population without known CAD (n=328). The total risk load was summed up by the eight risk factors hypertension, dyslipidemia, diabetes, obesity, smoking, high alcohol intake, low physical activity and low fruit and vegetable intake.
33.2 32.9
40.5
46.8
60.2
0
10
20
30
40
50
60
70
80
90
100
< 2 rf (n=44) 2 rf (n=118) 3 rf (n=99) 4 rf (n=46) >=5 rf (n=19)
Total risk load of cardiovascular risk factors
MM
P-9
in p
lasm
a (n
g/m
l)
0
10
20
30
40
50
60
70
80
90
100p for trend <0.001
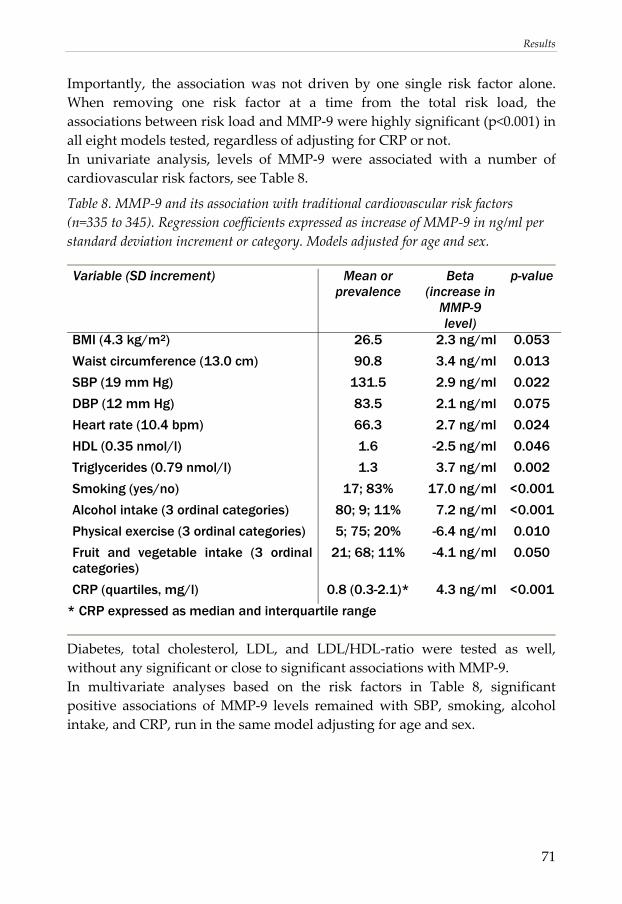
Results
71
Importantly, the association was not driven by one single risk factor alone. When removing one risk factor at a time from the total risk load, the associations between risk load and MMP‐9 were highly significant (p<0.001) in all eight models tested, regardless of adjusting for CRP or not. In univariate analysis, levels of MMP‐9 were associated with a number of cardiovascular risk factors, see Table 8.
Table 8. MMP‐9 and its association with traditional cardiovascular risk factors (n=335 to 345). Regression coefficients expressed as increase of MMP‐9 in ng/ml per standard deviation increment or category. Models adjusted for age and sex.
Variable (SD increment) Mean or
prevalence Beta
(increase in MMP-9 level)
p-value
BMI (4.3 kg/m2) 26.5 2.3 ng/ml 0.053
Waist circumference (13.0 cm) 90.8 3.4 ng/ml 0.013
SBP (19 mm Hg) 131.5 2.9 ng/ml 0.022
DBP (12 mm Hg) 83.5 2.1 ng/ml 0.075
Heart rate (10.4 bpm) 66.3 2.7 ng/ml 0.024
HDL (0.35 nmol/l) 1.6 -2.5 ng/ml 0.046
Triglycerides (0.79 nmol/l) 1.3 3.7 ng/ml 0.002
Smoking (yes/no) 17; 83% 17.0 ng/ml <0.001
Alcohol intake (3 ordinal categories) 80; 9; 11% 7.2 ng/ml <0.001
Physical exercise (3 ordinal categories) 5; 75; 20% -6.4 ng/ml 0.010
Fruit and vegetable intake (3 ordinal categories)
21; 68; 11% -4.1 ng/ml 0.050
CRP (quartiles, mg/l) 0.8 (0.3-2.1)* 4.3 ng/ml <0.001
* CRP expressed as median and interquartile range
Diabetes, total cholesterol, LDL, and LDL/HDL‐ratio were tested as well, without any significant or close to significant associations with MMP‐9. In multivariate analyses based on the risk factors in Table 8, significant positive associations of MMP‐9 levels remained with SBP, smoking, alcohol intake, and CRP, run in the same model adjusting for age and sex.
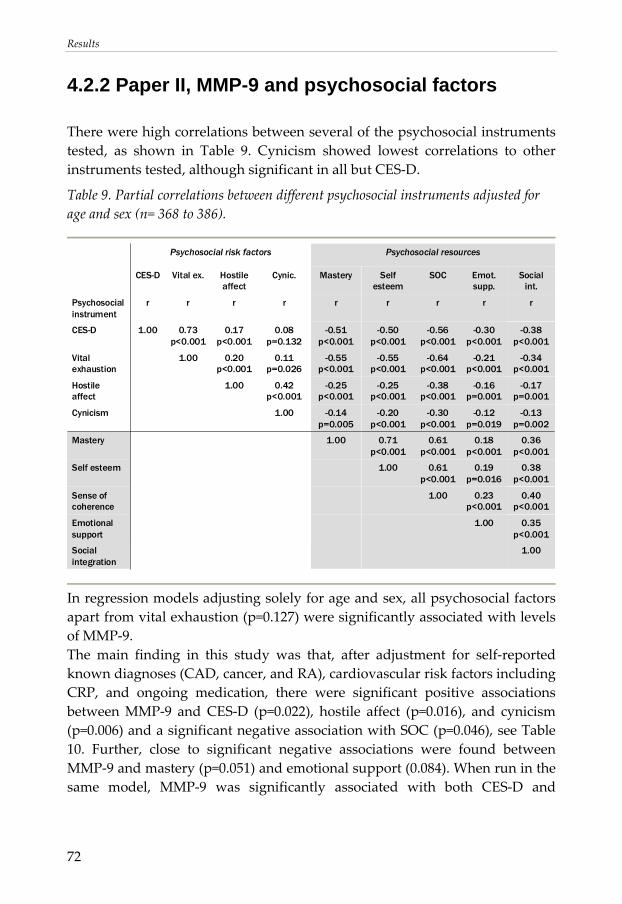
Results
72
4.2.2 Paper II, MMP-9 and psychosocial factors
There were high correlations between several of the psychosocial instruments tested, as shown in Table 9. Cynicism showed lowest correlations to other instruments tested, although significant in all but CES‐D.
Table 9. Partial correlations between different psychosocial instruments adjusted for age and sex (n= 368 to 386).
Psychosocial resourcesPsychosocial risk factors
1.00Social integration
0.35 p<0.001
1.00Emotional support
0.40 p<0.001
0.23 p<0.001
1.00Sense of coherence
0.38 p<0.001
0.19 p=0.016
0.61 p<0.001
1.00Self esteem
0.36 p<0.001
0.18 p<0.001
0.61 p<0.001
0.71 p<0.001
1.00Mastery
-0.13 p=0.002
-0.12 p=0.019
-0.30 p<0.001
-0.20 p<0.001
-0.14 p=0.005
1.00Cynicism
-0.17 p=0.001
-0.16 p=0.001
-0.38 p<0.001
-0.25 p<0.001
-0.25 p<0.001
0.42 p<0.001
1.00Hostile affect
-0.34 p<0.001
-0.21 p<0.001
-0.64 p<0.001
-0.55 p<0.001
-0.55 p<0.001
0.11 p=0.026
0.20 p<0.001
1.00Vital exhaustion
-0.38 p<0.001
-0.30 p<0.001
-0.56 p<0.001
-0.50 p<0.001
-0.51 p<0.001
0.08 p=0.132
0.17 p<0.001
0.73 p<0.001
1.00CES-D
rrrrrrrrrPsychosocial instrument
Social int.
Emot. supp.
SOCSelf esteem
MasteryCynic.Hostile affect
Vital ex.CES-D
In regression models adjusting solely for age and sex, all psychosocial factors apart from vital exhaustion (p=0.127) were significantly associated with levels of MMP‐9. The main finding in this study was that, after adjustment for self‐reported known diagnoses (CAD, cancer, and RA), cardiovascular risk factors including CRP, and ongoing medication, there were significant positive associations between MMP‐9 and CES‐D (p=0.022), hostile affect (p=0.016), and cynicism (p=0.006) and a significant negative association with SOC (p=0.046), see Table 10. Further, close to significant negative associations were found between MMP‐9 and mastery (p=0.051) and emotional support (0.084). When run in the same model, MMP‐9 was significantly associated with both CES‐D and
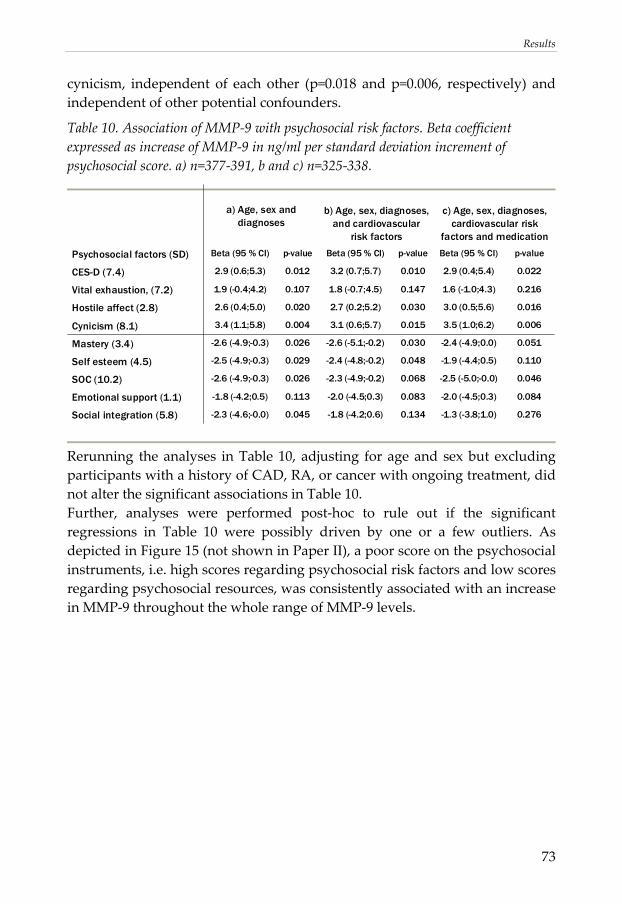
Results
73
cynicism, independent of each other (p=0.018 and p=0.006, respectively) and independent of other potential confounders.
Table 10. Association of MMP‐9 with psychosocial risk factors. Beta coefficient expressed as increase of MMP‐9 in ng/ml per standard deviation increment of psychosocial score. a) n=377‐391, b and c) n=325‐338.
0.276-1.3 (-3.8;1.0)0.134-1.8 (-4.2;0.6)0.045-2.3 (-4.6;-0.0)Social integration (5.8)
0.084-2.0 (-4.5;0.3)0.083-2.0 (-4.5;0.3)0.113-1.8 (-4.2;0.5)Emotional support (1.1)
0.046-2.5 (-5.0;-0.0)0.068-2.3 (-4.9;-0.2)0.026-2.6 (-4.9;-0.3)SOC (10.2)
0.110-1.9 (-4.4;0.5)0.048-2.4 (-4.8;-0.2)0.029-2.5 (-4.9;-0.3)Self esteem (4.5)
0.051-2.4 (-4.9;0.0)0.030-2.6 (-5.1;-0.2)0.026-2.6 (-4.9;-0.3)Mastery (3.4)
0.0063.5 (1.0;6.2)0.0153.1 (0.6;5.7)0.0043.4 (1.1;5.8)Cynicism (8.1)
0.0163.0 (0.5;5.6)0.0302.7 (0.2;5.2)0.0202.6 (0.4;5.0)Hostile affect (2.8)
0.2161.6 (-1.0;4.3)0.1471.8 (-0.7;4.5)0.1071.9 (-0.4;4.2)Vital exhaustion, (7.2)
0.0222.9 (0.4;5.4)0.0103.2 (0.7;5.7)0.0122.9 (0.6;5.3)CES-D (7.4)
p-valueBeta (95 % CI)p-valueBeta (95 % CI)p-valueBeta (95 % CI)Psychosocial factors (SD)
c) Age, sex, diagnoses, cardiovascular risk
factors and medication
b) Age, sex, diagnoses, and cardiovascular
risk factors
a) Age, sex and diagnoses
Rerunning the analyses in Table 10, adjusting for age and sex but excluding participants with a history of CAD, RA, or cancer with ongoing treatment, did not alter the significant associations in Table 10. Further, analyses were performed post‐hoc to rule out if the significant regressions in Table 10 were possibly driven by one or a few outliers. As depicted in Figure 15 (not shown in Paper II), a poor score on the psychosocial instruments, i.e. high scores regarding psychosocial risk factors and low scores regarding psychosocial resources, was consistently associated with an increase in MMP‐9 throughout the whole range of MMP‐9 levels.
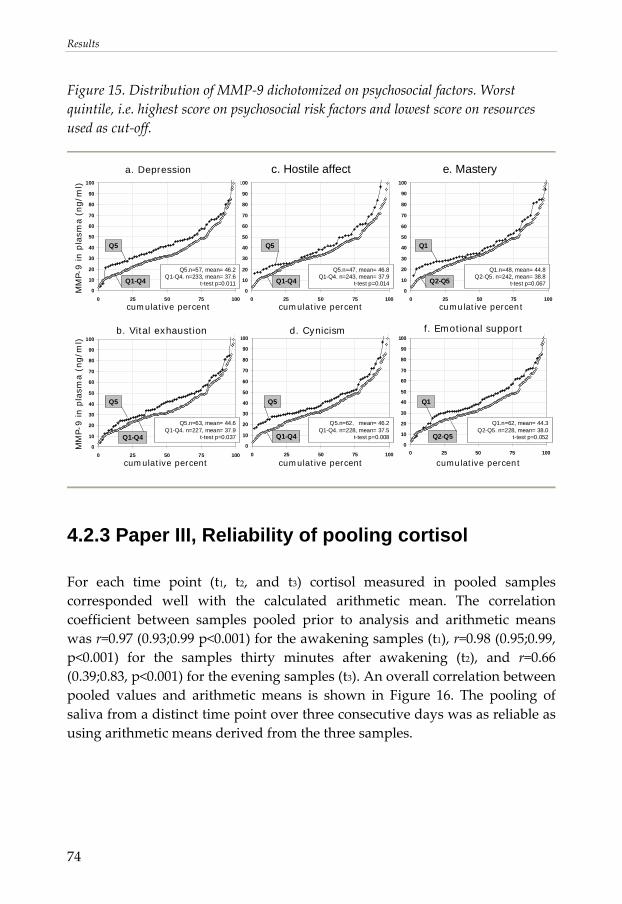
Results
74
Figure 15. Distribution of MMP‐9 dichotomized on psychosocial factors. Worst quintile, i.e. highest score on psychosocial risk factors and lowest score on resources used as cut‐off.
0
10
20
30
40
50
60
70
80
90
100
0 25 50 75 100
0
10
20
30
40
50
60
70
80
90
100
0 25 50 75 100
0
10
20
30
40
50
60
70
80
90
100
0 25 50 75 100
0
10
20
30
40
50
60
70
80
90
100
0 25 50 75 100
0
10
20
30
40
50
60
70
80
90
100
0 25 50 75 100
a. Depression
MM
P-9 in p
lasm
a (
ng/m
l)
c. Hostile affect e. Mastery
b. Vital exhaustion f. Emotional support
MM
P-9 in p
lasm
a (n
g/m
l)
cumulative percent cumulative percent
cumulative percentcumulative percent cumulative percent
d. Cynicism
Q5.n=47, mean= 46.8Q1-Q4. n=243, mean= 37.9
t-test p=0.014
Q5.n=62, mean= 46.2Q1-Q4. n=228, mean= 37.5
t-test p=0.008
Q5.n=63, mean= 44.6Q1-Q4. n=227, mean= 37.9
t-test p=0.037
Q1.n=62, mean= 44.3Q2-Q5. n=228, mean= 38.0
t-test p=0.052
Q1.n=48, mean= 44.8Q2-Q5. n=242, mean= 38.8
t-test p=0.067
Q5 Q1
Q5 Q5 Q1
Q1-Q4 Q2-Q5
Q2-Q5Q1-Q4Q1-Q4
0
10
20
30
40
50
60
70
80
90
100
0 25 50 75 100
Q5.n=57, mean= 46.2Q1-Q4. n=233, mean= 37.6
t-test p=0.011Q1-Q4
Q5
cumulative percent
4.2.3 Paper III, Reliability of pooling cortisol
For each time point (t1, t2, and t3) cortisol measured in pooled samples corresponded well with the calculated arithmetic mean. The correlation coefficient between samples pooled prior to analysis and arithmetic means was r=0.97 (0.93;0.99 p<0.001) for the awakening samples (t1), r=0.98 (0.95;0.99, p<0.001) for the samples thirty minutes after awakening (t2), and r=0.66 (0.39;0.83, p<0.001) for the evening samples (t3). An overall correlation between pooled values and arithmetic means is shown in Figure 16. The pooling of saliva from a distinct time point over three consecutive days was as reliable as using arithmetic means derived from the three samples.
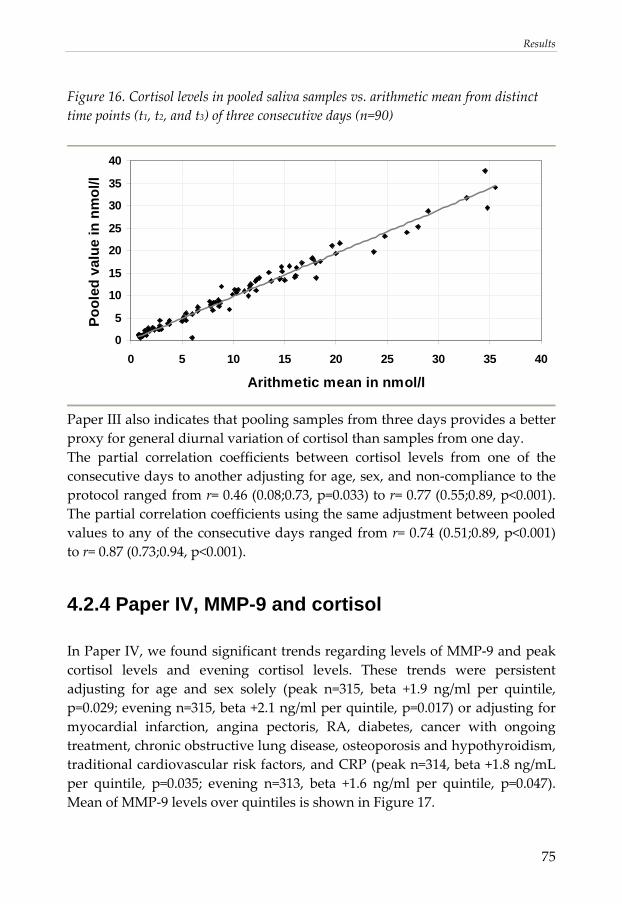
Results
75
Figure 16. Cortisol levels in pooled saliva samples vs. arithmetic mean from distinct time points (t1, t2, and t3) of three consecutive days (n=90)
0
5
10
15
20
25
30
35
40
0 5 10 15 20 25 30 35 40
Arithmetic mean in nmol/l
Pool
ed v
alue
in n
mol
/l
Paper III also indicates that pooling samples from three days provides a better proxy for general diurnal variation of cortisol than samples from one day. The partial correlation coefficients between cortisol levels from one of the consecutive days to another adjusting for age, sex, and non‐compliance to the protocol ranged from r= 0.46 (0.08;0.73, p=0.033) to r= 0.77 (0.55;0.89, p<0.001). The partial correlation coefficients using the same adjustment between pooled values to any of the consecutive days ranged from r= 0.74 (0.51;0.89, p<0.001) to r= 0.87 (0.73;0.94, p<0.001).
4.2.4 Paper IV, MMP-9 and cortisol
In Paper IV, we found significant trends regarding levels of MMP‐9 and peak cortisol levels and evening cortisol levels. These trends were persistent adjusting for age and sex solely (peak n=315, beta +1.9 ng/ml per quintile, p=0.029; evening n=315, beta +2.1 ng/ml per quintile, p=0.017) or adjusting for myocardial infarction, angina pectoris, RA, diabetes, cancer with ongoing treatment, chronic obstructive lung disease, osteoporosis and hypothyroidism, traditional cardiovascular risk factors, and CRP (peak n=314, beta +1.8 ng/mL per quintile, p=0.035; evening n=313, beta +1.6 ng/ml per quintile, p=0.047). Mean of MMP‐9 levels over quintiles is shown in Figure 17.
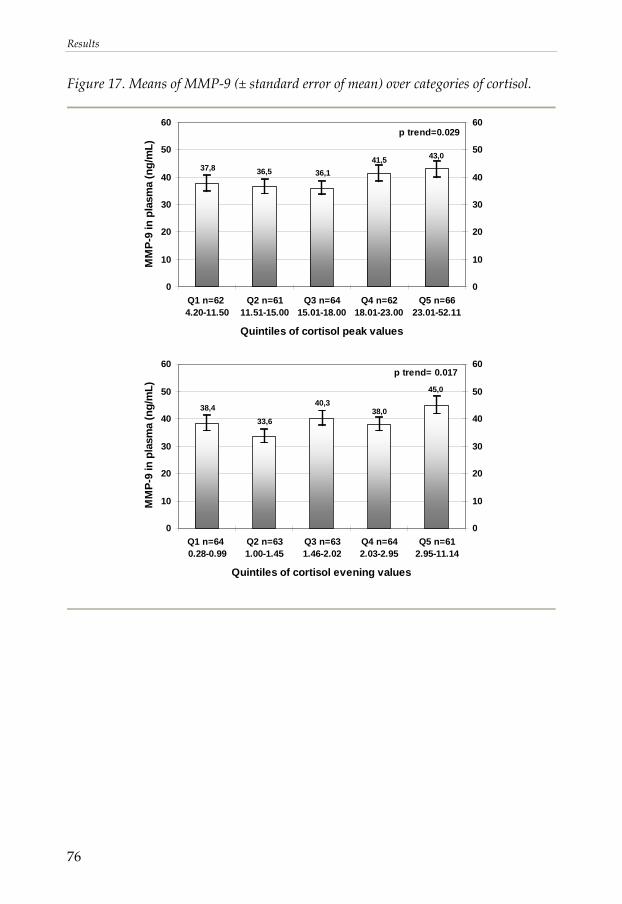
Results
76
Figure 17. Means of MMP‐9 (± standard error of mean) over categories of cortisol.
p trend=0.029
37,8 36,5 36,141,5 43,0
0
10
20
30
40
50
60
Q1 n=62 4.20-11.50
Q2 n=6111.51-15.00
Q3 n=6415.01-18.00
Q4 n=6218.01-23.00
Q5 n=6623.01-52.11
Quintiles of cortisol peak values
MM
P-9
in p
lasm
a (n
g/m
L)
0
10
20
30
40
50
60
p trend= 0.017
45,0
38,040,3
33,638,4
0
10
20
30
40
50
60
Q1 n=64 0.28-0.99
Q2 n=631.00-1.45
Q3 n=631.46-2.02
Q4 n=642.03-2.95
Q5 n=612.95-11.14
Quintiles of cortisol evening values
MM
P-9
in p
lasm
a (n
g/m
L)
0
10
20
30
40
50
60
General discussions
77
5. GENERAL DISCUSSIONS
5.1 The choice of MMP-9 as a biomarker
There are a number of biomarkers that could be of relevance when studying the role of psychoneuroendocrinology in ACS. A cornerstone in the reasoning when choosing a plausible marker in this dissertation was that the marker should have been associated with plaque vulnerability. Five additional requirements as shown in Table 11 were set prior to the analyses to identify a plausible marker.
Table 11. Requirements stated to find a plausible marker.
Requirement Supported in reference • Plausible to have a direct impact on plaque
vulnerability [55,189,209,210,257,258]
• Associated with patients diagnosed with angina or myocardial infarction
[177,189,200‐202,258]
• Associated with cardiovascular risk factors before onset of disease
[181,203,205,206]
• Associated with inflammation [186,188,189,193‐196,259]
• Associated with stress hormones [197,198,260] • Possible to measure after thawing frozen samples [261]
When matching requirements with a literature search over theories and empirical data, the enzyme family of matrix metalloproteinases (MMPs) emerged as a group of relevance. See section 1.6 for further details. The choice of MMP‐9 as the main outcome was based on the fulfilling of each of the requirements in Table 11. Moreover, the substrate specificity to collagen type IV and other proteins in the basal lamina hinted at a potential proximal role in plaque rupture.
General discussions
78
5.2 On general findings of MMP-9
It is noticeable that earlier studies investigating levels of MMP‐9 in a normal population are sparse. The design and analyses conducted in the LSH‐study, contributes with information from a middle‐aged normal population, which might be a fruitful addition to existing knowledge, otherwise to a large extent based on experimental and clinical designs. In some earlier studies there has been a large proportion of participants with undetectable levels of MMP‐9 [184,262]. It is an undesirable situation to have a biomarker that is not detectable in some participants, as it is not possible to disentangle if the lack of this marker is a proper reflection of a functional (or dysfunctional) physiology, if samples have been treated differently, or if it is due to insensitivity in the laboratory analyses. A detection rate of 100% of the study population, as was the case in these studies, implies that a sensitive laboratory method was used, and that MMP‐9 has a vital and important function. The full detection rate in this study is a noteworthy difference from earlier population based studies. This could possibly be due to a relatively short period of time passing between sample date and analysis, where results in other studies may be biased by the degradation of MMP‐9 in a prolonged storage, even at low temperatures [261]. Although the ELISA technique were slightly different, a comparison of our results with the Framingham study [16] is appropriate as the population characteristics according to traditional risk factors, age, and sex were in the same range in both studies. As MMP‐9 could be detected in only 20% of the participants in the Framingham study [16] (using a 2‐site sandwich ELISA assay with a detection level of 4 ng/ml), the authors concluded that MMP‐9 was unlikely to be an informative biomarker in a low‐risk population. Our detection rate of 100% rejects this argument suggested in the Framingham material as invalid. The significant difference of MMP‐9 levels between the CAD‐patients and participants free of known disease is previously described and well established [177,189,200‐202]. The finding as such does not add much in terms of novel knowledge, but serves as an important validation tool of the data in this study. The significant difference of MMP‐9 levels between women and men goes together with the CAD incidence, which is substantially lower for women than men in this age‐span. Thus, our data reveals an ecological association between MMP‐9 and CAD incidence.
General discussions
79
As CRP has been shown to induce production of MMP‐9 in several experimental studies [263‐265] we were expecting a stronger correlation between MMP‐9 and CRP than we found in the material. However, it has been argued for that measurement of CRP is not sufficient as an adequate proxy for inflammatory processes [266], being to reductionistic in its simplification of a complex inflammatory response. Kaysen and colleagues argue that the release of CRP and other hepatic acute phase proteins is one pathway in inflammation, but not the only one. Other activation may contribute separately to outcomes [266]. The surprisingly weak correlation in our findings support that CRP and MMP‐9, at least to some extent, could be markers of different physiological pathways, or different stages in an inflammatory process. The low correlation between MMP‐9 and CRP led to some post‐hoc analyses in the material, not presented in any of the papers. The association between CRP and psychosocial factors were examined. Using the same regression model as in Table 10c (Paper II, section 4.2.2,) setting continuous data on CRP levels <10 mg/l as the outcome instead of MMP‐9 levels, there were no significant associations between CRP and any of the nine psychosocial factors tested (p=0.153 to p=0.956). It may be noted that this in coherence with some large‐scale observational studies which recently have concluded that no association between psychosocial factors and inflammatory markers can be found [267,268]. In a recent study from the Whitehall II study on civil servants free from clinically validated coronary heart disease (n=6,396), CRP was investigated together with other markers of inflammation. Nabo and colleagues state that “Our findings suggest that psychological factors do not affect inflammation although they predict incident coronary heart disease” [267]. In that light, the weak correlation between CRP and MMP‐9 in our data might be of particular interest to further understand the role of inflammation and/or remodeling in the link between psychosocial factors and CAD. See section 5.4.2 for further discussions. The association between CRP and cortisol levels was examined as well on our data. Using the same fully adjusted regression model as in Paper IV (section 4.2.4) with CRP <10 mg/l as the outcome instead of MMP‐9, the associations between CRP and peak levels of cortisol (n=302, beta‐0.1 mg/l per quintile, p=0.053), and between CRP and evening levels of cortisol (n=303, beta‐0.1 mg/l per quintile, p=0.069) were marginally significant, pointing at the opposite direction than associations with MMP did. The absolute difference of CRP
General discussions
80
levels between the top quintile versus the bottom were however low, about 0.5 mg/l for both peak and evening levels of saliva cortisol. The post‐hoc analyses on cortisol brought further support that CRP and MMP‐9, at least to some extent, could be markers of different physiological processes.
5.3 On specific findings
5.3.1 Paper I, MMP-9 and cardiovascular risk factors
As most previous studies have examined ACS patients [177,189,200‐202], it has not been possible to outline whether raised levels of MMP‐9 are a primary phenomenon, reflecting ongoing remodelling involved in the pathogenesis of ACS, or if the raised levels are a second phenomenon, reflecting remodeling triggered by the damage caused by an ischemic state. Our data demonstrating a significant association with total risk in a normal population free from known CAD implies that elevation of MMP‐9 levels may occur prior to a cardiac event. The multiple linear regressions positively associating MMP‐9 with SBP, smoking, alcohol intake, and CRP alcohol intake, confirm earlier findings, as all independent variables have been suggested to be associated with MMP‐9 levels before [181,186,193,194,203‐206]. However, most of the previous studies showing these associations were performed either in patient groups or in cross‐sectional analyses on selected high‐risk study populations. By our study, these findings have been confirmed in a normal population. One possible controversy is the positive association between MMP‐9 and alcohol intake. The reported mean alcohol intake in the top ordinal category was 270 g/week. This equals approximately three drinks or glasses of wine per day, a level usually considered to be high but not extreme in cardiovascular epidemiology [112,115]. On one hand, our data points towards a dose‐depending gradient between alcohol intake and MMP‐9 levels rather than a U‐shaped association that is implied in other studies on inflammatory markers [116,117]. On the other hand, a note of caution should be at place as smoking and alcohol intake, the behavioral factors that remained significant in a multivariate analysis, were highly clustered to other risk factors. Only a handful of participants (n=5) had smoking or alcohol intake as the only present
General discussions
81
behavioral risk factor. In most of the participants, these factors appeared in combination with at least one of the other tested risk factors. Hence, it cannot be excluded that an effect from e.g. low physical activity and/or low fruit and vegetable intake as found in the regression models solely adjusting for age and sex, would be hidden in a multivariate analysis due to co‐variation to alcohol and smoking. Further, in contrast to most variables tested, total cholesterol, LDL and LDL/HDL ratio did not reveal any statistically significant or close to significant association with MMP‐9 levels. On one hand, it has been suggested before that MMP‐9 does not relate to the lipid profile [195]. On the other hand the variation of the lipid profile variables was likely to be truncated by the exclusion criteria and the selection towards a healthy population.
5.3.2 Paper II, MMP-9 and psychosocial factors
To our knowledge, the association between psychosocial factors and MMP‐9 levels has not been described previously. The novel findings could be of relevance from a psychoneuroendocrinological view as the assumed pathway studied is in line with previous observations of rapid fluctuations of CAD incidence (described in the rationale, section 1.1). Due to the considerable correlations in Table 9, analyses were not performed to outline which psychosocial factor matters the most for an elevation of MMP‐9. Instead, the more important observation was that there seem to be a consistency when MMP‐9 was tested against psychosocial factors. All psychosocial resources (including social integration and emotional support) were pointing towards a negative association with levels of MMP‐9, and all psychosocial risk factors were pointing towards a positive association with levels of MMP‐9. As cynicism was not significantly correlated to CES‐D, they could be run in the same model. The persistent significant associations with both cynicism and CES‐D in the same model adjusted for other cardiovascular risk factors suggest that the positive association of MMP‐9 levels with cynicism, and depressive mood, are independent and not merely an effect of co‐variation or promotion of established cardiovascular risk factors.
General discussions
82
5.3.3 Paper III, Reliability of pooling cortisol
The correlation coefficients between pooled saliva samples and arithmetic means were extremely high. The evening cortisol levels (t3) had a lower correlation than had the other two time points for assessment (t1 and t2). This is likely explained by the low variation in the evening values (where even a small deviation between a pooled sample and its corresponding arithmetic mean will have a relatively high impact on the correlation coefficient). In absolute terms the agreement was high also for evening values. Intuitively, it is not perhaps a stunning surprise that pooling saliva from three samples days provide the same information as using arithmetic means derived from each of the samples. Therefore, the results need to be seen in its context. Internally, this study was performed to explore if it was feasible to pool samples instead of calculating arithmetic means, thereby reducing expenditure and allowing for analyses on more participants. As the LSH‐study was conducted in 10 PHCCs, and involved more than one laboratory assistant per PHC in several cases, a pilot study had to be performed to study if the implementation regarding pooling procedure was successful. The satisfactory findings in Paper III led to the use of the method throughout the LSH‐study, exemplified by Paper IV. In more general terms, the findings in this technical note imply that the method may be an attractive alternative for field research projects, where a high number of samples are required. There is at current an ongoing discussion in the field of psychoneuroendocrinology on how to gather information on diurnal cortisol variation in large scale clinical or population based studies, without spending a fortune on the laboratory analysis. The well‐known intra‐individual day‐to‐day variation [139,154,155] brings shortcomings to the use of single day measurements. The commonly used sampling from consecutive days calculating arithmetic means on the other hand multiplies the costs. Thus, in the debate on how to assess cortisol in large scale studies saving as much as possible of both information and expenditure, the idea of pooling saliva samples prior to laboratory analysis could be worth implementing.
5.3.4 Paper IV, MMP-9 and cortisol
The main finding in this study was that MMP‐9 was associated with a dysregulated secretion pattern of cortisol. With knowledge on the MMP‐9‐
General discussions
83
suppressive properties of exogenous cortisol, as demonstrated by suppressed MMP‐9 levels after one cortisol injection in a human experimental study [197], it might be suspected that high levels of cortisol in a population sample would be associated with lower levels of MMP‐9. However, and importantly, the paradox of high cortisol levels, supposed to be anti‐inflammatory, in combination with a ongoing chronic inflammatory process has been recognized in earlier studies, proposing a model where long‐term elevation of cortisol output eventually leads to a resistance to cortisol‐mediated signaling in monocytes [230,231]. The empirical findings in this study go well with the proposed psychoneuroendocrinological model (section 1.7), where a state of sustained levels of cortisol might lead to increased MMP‐9 levels in a dysregulated remodeling.
5.4 Implications of the findings
5.4.1 The psychoneuroendocrinological model revisited
Going back to the framework of this dissertation, the question is: Does the empirical data fit into the suggested model? To illustrate this, a modified version of the psychoneuroendocrinological model originally presented in Figure 7 (section 1.7), is depicted in Figure 18.
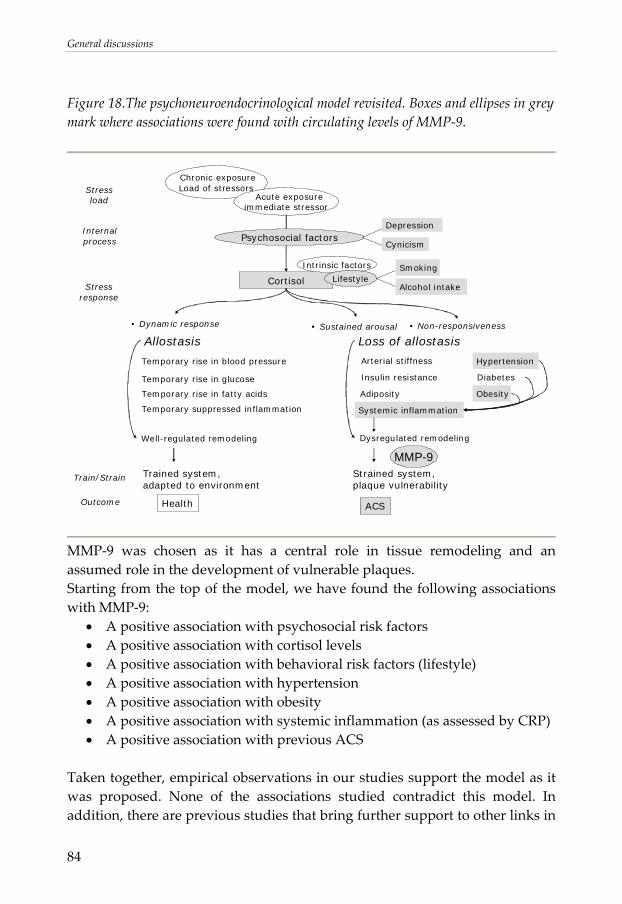
General discussions
84
Figure 18.The psychoneuroendocrinological model revisited. Boxes and ellipses in grey mark where associations were found with circulating levels of MMP‐9.
ACS
Cortisol
Intrinsic factors
Lifestyle
• Dynamic response
Loss of allostasis
Temporary rise in blood pressure
Temporary rise in glucose
Temporary rise in fatty acids
Temporary suppressed inflammation
Stressload
Stressresponse
Outcome
Arterial stiffness
Insulin resistance
Adiposity
Systemic inflammation
Hypertension
Diabetes
Obesity
Internal process
Chronic exposureLoad of stressors
Acute exposureimmediate stressor
Psychosocial factors
Train/Strain
Health
Strained system,plaque vulnerability
• Sustained arousal • Non-responsiveness
Trained system,adapted to environment
Allostasis
Dysregulated remodelingWell-regulated remodeling
MMP-9
Alcohol intake
Smoking
Depression
Cynicism
MMP‐9 was chosen as it has a central role in tissue remodeling and an assumed role in the development of vulnerable plaques. Starting from the top of the model, we have found the following associations with MMP‐9:
• A positive association with psychosocial risk factors • A positive association with cortisol levels • A positive association with behavioral risk factors (lifestyle) • A positive association with hypertension • A positive association with obesity • A positive association with systemic inflammation (as assessed by CRP) • A positive association with previous ACS
Taken together, empirical observations in our studies support the model as it was proposed. None of the associations studied contradict this model. In addition, there are previous studies that bring further support to other links in
General discussions
85
the model, not studied in this dissertation. The link between psychosocial factors and dysregulation in the HPA‐axis, as suggested in an extensive number of studies, is of crucial importance in the model [139,157‐159]. It is a possible drawback that the associations between psychosocial factors and cortisol in our data are as of yet not studied. For now, the model relies on the assumption that the empirical data others have reported on cortisol and psychosocial factors are valid also in this study material. It may be noted that the model was drawn in the context of stress as a risk factor for ACS. Lifestyle (i.e. behavioral risk factors for CAD) was set as a mediator of cortisol response. This should not be interpreted as the only pathway in which behavioral factors operate. It is acknowledged that behavioral risk factors act in multiple pathways converging in an increased risk for ACS. The psychoneuroendocrinological model, supported by our empirical data, suggests that a dysregulation of remodeling is not only mediated through acute phase inflammatory mediators, but also directly via a diminished impact of cortisol. The suggested mechanism that loss of allostasis leads to a dysregulated remodeling may be of relevance not only for ACS, but in psychoneuroendocrinology in general, as discussed below.
5.4.2 Specificity of cardiovascular disease?
MMP‐9 was measured as a plausible marker to further understand the underlying mechanisms in the association between psychosocial factors and CAD. However, even though our associations found in combination with previous empirical data support that MMP‐9 may be a marker of relevance in this context, it should be pointed out that it is unlikely that MMP‐9, as well as any biomarker involved in remodeling, would be a specific marker for cardiovascular disease. Allowing speculations beyond the findings in this dissertation, this has two main implications. 1) There are several diseases and medications that need to be taken into account as adjustments in cardiovascular epidemiology when further exploring levels of MMP‐9. 2) The non‐exclusive role of MMP‐9 in cardiovascular disease implies that stress leading to an eventual dysregulation in remodeling may have an impact in a number of diseases. There is an ongoing debate on the potential role of stress in the progression of tumors [269]. Interestingly, Sephton and colleagues have demonstrated that a
General discussions
86
dysregulation in the HPA‐axis (assessed as a flat diurnal variation of cortisol) is associated with a reduced survival in breast cancer patients [165]. As there is an up‐regulation of MMP‐9 levels in tumor‐induced angiogenesis [214‐216], the link between a dysregulated HPA‐axis and a diminished control of remodeling would also possibly be applicable for cancer. In parallel, dysfunction of the HPA‐axis in RA should be mentioned. Many patients with RA exhibit a low cortisol secretion, described as a relative adrenal insufficiency, not being able to dampen the ongoing inflammation [270]. MMP‐9 activity is thought to worsen the progress of RA, causing a degradation of cartilage and joint tissues [218,219]. Moreover, it has been suggested that psychosocial factors predict the long‐term course of disease activity in early RA [271]. In that light, although highly speculative, the associations found between psychosocial factors and levels of MMP‐9 fits well with its proposed role in the dysregulation in remodeling also in diseases and conditions other than ACS. This should be further studied as this notion, should it be confirmed, opens up for a number of hypotheses, shedding new light on the old ideas of general susceptibility to disease [272]. Going back to the rationale, the inverse gradient of morbidity and mortality over socioeconomic position applies in a number of outcomes [1,2,7‐9]. It is an intriguing thought that at least some of the observed differences in incidence are attributable to loss of allostasis and general susceptibility, as hinted at in the proposed psychoneuroendocrinological model.
5.5 Methodological considerations
It should be emphasized that all results are based on cross‐sectional analyses. It comes with the design that it is not possible to draw any conclusions on temporality or causality. Just by studying associations alone with the biological marker MMP‐9, it is not possible to elucidate the role of MMP‐9 in pathogenesis. However, as studies on normal populations are sparse, the approach in this dissertation adds to the existing knowledge derived from clinical and experimental studies.
General discussions
87
5.5.1 Participation rate and possibility to generalize
The participation rate of 62.5% is in the same range as other studies conducted at the time in Sweden, using extensive questionnaires [273,274]. The sample was representative for the population in Östergötland in terms of educational attainment, employment rate and immigrant status. However, it is likely that there was a healthy selection in the study, i.e. that invitations are rejected to a higher extent by individuals having a present disease or a high risk load [275]. Thus, it could be suspected that the inter‐individual variation is reduced by this bias. As a consequence, there is a risk that regression models fail to show any significant associations between the variables tested, even though such an association is true when studying the population as a whole. In other words, the supposed healthy selection is more likely to possibly reduce the true associations rather than introducing artifacts. Thus, it is not presumably critical in this dissertation, as it leads to a conservative interpretation of the analyses conducted. The associations found in this population are likely to be applicable in other similar populations as well.
5.5.2 Exclusions in the analyses
The original exclusion criteria for participation in the LSH‐study were drawn on hindrance of participation rather than medical reasons. For example, a cancer diagnosis was not an exclusion criterion per se, whereas a late stage terminal cancer was. Depending on the research question, specific exclusions were made (either in all analyses as in paper I or in specific sub‐analyses as in paper II and IV) on the basis on self‐reported diagnoses and medication. It has been argued that self‐reported data regarding CAD diagnosis has both high specificity and sensitivity [276], implicating that self‐reported diagnoses were feasible in this setting. However, no diagnoses were clinically verified in the LSH‐study, and therefore it can not be excluded that an unknown number of participants could have been misclassified in the stratifications regarding diagnoses (CAD or any other disease) or medication. On the other hand, as both self‐reported diagnosis and medications were reported, a participant had to be non‐compliant on both diagnosis and medication to be wrongly classified. Thus, it was concluded that a possible misclassification of diagnoses was not likely to be a major bias in this data set.
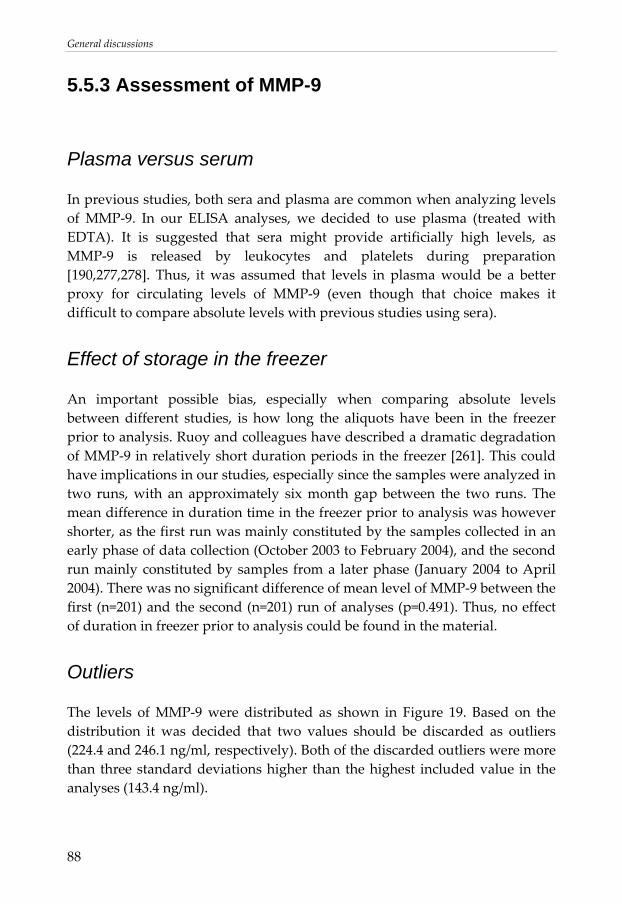
General discussions
88
5.5.3 Assessment of MMP-9
Plasma versus serum
In previous studies, both sera and plasma are common when analyzing levels of MMP‐9. In our ELISA analyses, we decided to use plasma (treated with EDTA). It is suggested that sera might provide artificially high levels, as MMP‐9 is released by leukocytes and platelets during preparation [190,277,278]. Thus, it was assumed that levels in plasma would be a better proxy for circulating levels of MMP‐9 (even though that choice makes it difficult to compare absolute levels with previous studies using sera).
Effect of storage in the freezer
An important possible bias, especially when comparing absolute levels between different studies, is how long the aliquots have been in the freezer prior to analysis. Ruoy and colleagues have described a dramatic degradation of MMP‐9 in relatively short duration periods in the freezer [261]. This could have implications in our studies, especially since the samples were analyzed in two runs, with an approximately six month gap between the two runs. The mean difference in duration time in the freezer prior to analysis was however shorter, as the first run was mainly constituted by the samples collected in an early phase of data collection (October 2003 to February 2004), and the second run mainly constituted by samples from a later phase (January 2004 to April 2004). There was no significant difference of mean level of MMP‐9 between the first (n=201) and the second (n=201) run of analyses (p=0.491). Thus, no effect of duration in freezer prior to analysis could be found in the material.
Outliers
The levels of MMP‐9 were distributed as shown in Figure 19. Based on the distribution it was decided that two values should be discarded as outliers (224.4 and 246.1 ng/ml, respectively). Both of the discarded outliers were more than three standard deviations higher than the highest included value in the analyses (143.4 ng/ml).
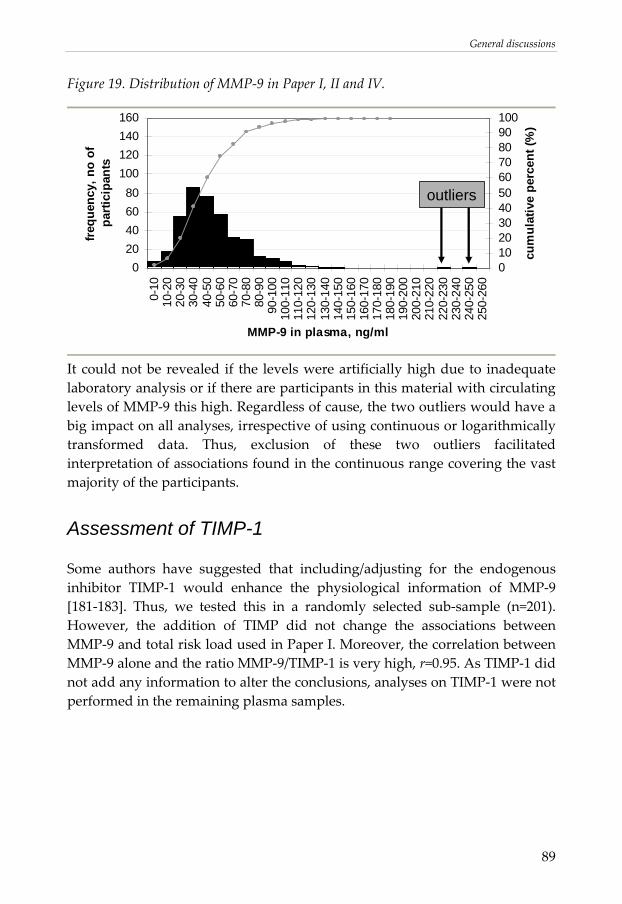
General discussions
89
Figure 19. Distribution of MMP‐9 in Paper I, II and IV.
020406080
100120140160
0-10
10-2
020
-30
30-4
040
-50
50-6
060
-70
70-8
080
-90
90-1
0010
0-11
011
0-12
012
0-13
013
0-14
014
0-15
015
0-16
016
0-17
017
0-18
018
0-19
019
0-20
020
0-21
021
0-22
022
0-23
023
0-24
024
0-25
025
0-26
0
MMP-9 in plasma, ng/ml
freq
uenc
y, n
o of
pa
rtici
pant
s
0102030405060708090100
cum
ulat
ive
perc
ent (
%)
outliers
It could not be revealed if the levels were artificially high due to inadequate laboratory analysis or if there are participants in this material with circulating levels of MMP‐9 this high. Regardless of cause, the two outliers would have a big impact on all analyses, irrespective of using continuous or logarithmically transformed data. Thus, exclusion of these two outliers facilitated interpretation of associations found in the continuous range covering the vast majority of the participants.
Assessment of TIMP-1
Some authors have suggested that including/adjusting for the endogenous inhibitor TIMP‐1 would enhance the physiological information of MMP‐9 [181‐183]. Thus, we tested this in a randomly selected sub‐sample (n=201). However, the addition of TIMP did not change the associations between MMP‐9 and total risk load used in Paper I. Moreover, the correlation between MMP‐9 alone and the ratio MMP‐9/TIMP‐1 is very high, r=0.95. As TIMP‐1 did not add any information to alter the conclusions, analyses on TIMP‐1 were not performed in the remaining plasma samples.
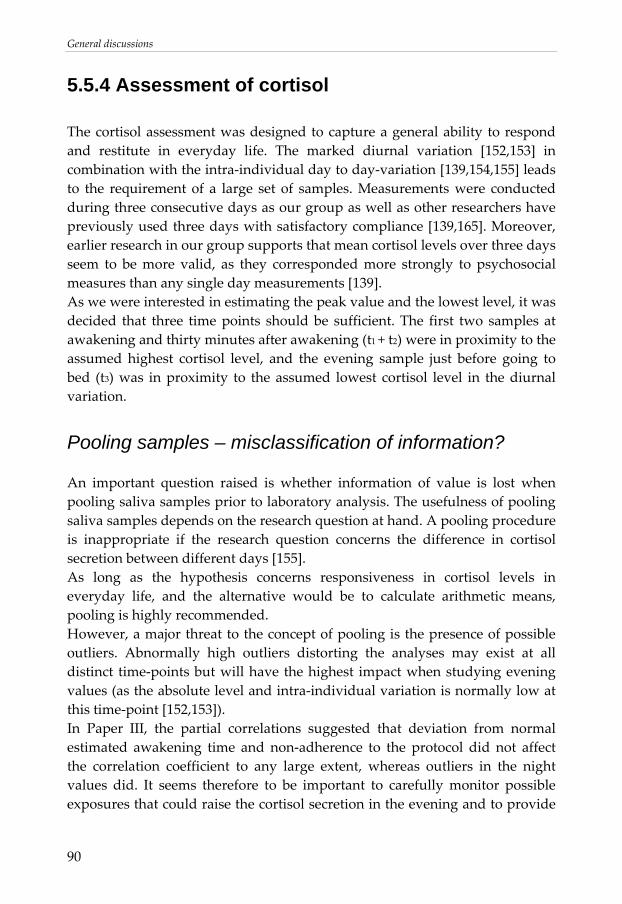
General discussions
90
5.5.4 Assessment of cortisol
The cortisol assessment was designed to capture a general ability to respond and restitute in everyday life. The marked diurnal variation [152,153] in combination with the intra‐individual day to day‐variation [139,154,155] leads to the requirement of a large set of samples. Measurements were conducted during three consecutive days as our group as well as other researchers have previously used three days with satisfactory compliance [139,165]. Moreover, earlier research in our group supports that mean cortisol levels over three days seem to be more valid, as they corresponded more strongly to psychosocial measures than any single day measurements [139]. As we were interested in estimating the peak value and the lowest level, it was decided that three time points should be sufficient. The first two samples at awakening and thirty minutes after awakening (t1 + t2) were in proximity to the assumed highest cortisol level, and the evening sample just before going to bed (t3) was in proximity to the assumed lowest cortisol level in the diurnal variation.
Pooling samples – misclassification of information?
An important question raised is whether information of value is lost when pooling saliva samples prior to laboratory analysis. The usefulness of pooling saliva samples depends on the research question at hand. A pooling procedure is inappropriate if the research question concerns the difference in cortisol secretion between different days [155]. As long as the hypothesis concerns responsiveness in cortisol levels in everyday life, and the alternative would be to calculate arithmetic means, pooling is highly recommended. However, a major threat to the concept of pooling is the presence of possible outliers. Abnormally high outliers distorting the analyses may exist at all distinct time‐points but will have the highest impact when studying evening values (as the absolute level and intra‐individual variation is normally low at this time‐point [152,153]). In Paper III, the partial correlations suggested that deviation from normal estimated awakening time and non‐adherence to the protocol did not affect the correlation coefficient to any large extent, whereas outliers in the night values did. It seems therefore to be important to carefully monitor possible exposures that could raise the cortisol secretion in the evening and to provide
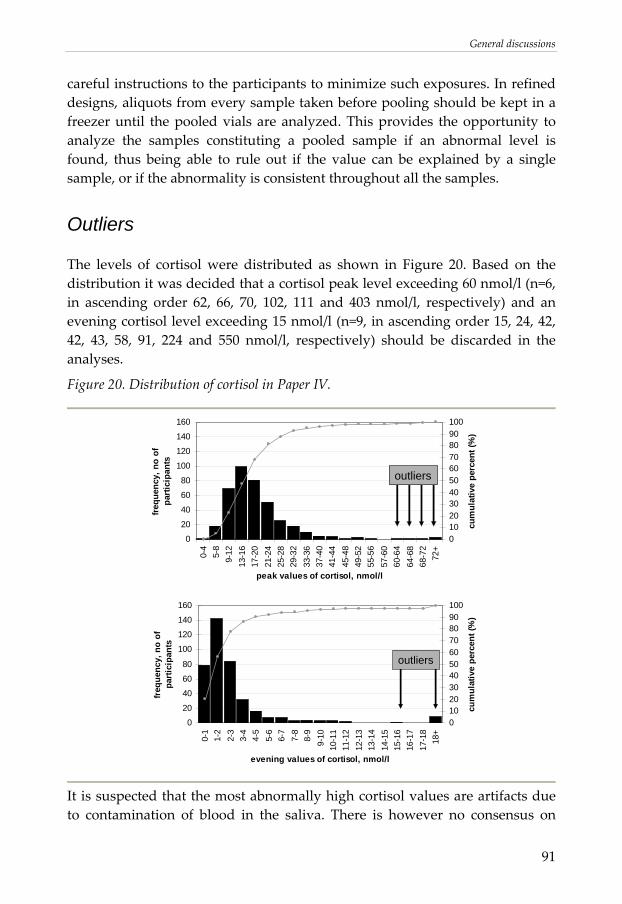
General discussions
91
careful instructions to the participants to minimize such exposures. In refined designs, aliquots from every sample taken before pooling should be kept in a freezer until the pooled vials are analyzed. This provides the opportunity to analyze the samples constituting a pooled sample if an abnormal level is found, thus being able to rule out if the value can be explained by a single sample, or if the abnormality is consistent throughout all the samples.
Outliers
The levels of cortisol were distributed as shown in Figure 20. Based on the distribution it was decided that a cortisol peak level exceeding 60 nmol/l (n=6, in ascending order 62, 66, 70, 102, 111 and 403 nmol/l, respectively) and an evening cortisol level exceeding 15 nmol/l (n=9, in ascending order 15, 24, 42, 42, 43, 58, 91, 224 and 550 nmol/l, respectively) should be discarded in the analyses.
Figure 20. Distribution of cortisol in Paper IV.
0
20
40
60
80
100
120
140
160
0-4
5-8
9-12
13-1
617
-20
21-2
425
-28
29-3
233
-36
37-4
041
-44
45-4
849
-52
55-5
657
-60
60-6
464
-68
68-7
272
+
peak values of cortisol, nmol/l
frequ
ency
, no
of
part
icip
ants
0102030405060708090100
cum
ulat
ive
perc
ent (
%)
outliers
0
20
40
60
80
100
120
140
160
0-1
1-2
2-3
3-4
4-5
5-6
6-7
7-8
8-9
9-10
10-1
111
-12
12-1
313
-14
14-1
515
-16
16-1
717
-18
18+
evening values of cortisol, nmol/l
freq
uenc
y, n
o of
pa
rtic
ipan
ts
0102030405060708090100
cum
ulat
ive
perc
ent (
%)
outliers
It is suspected that the most abnormally high cortisol values are artifacts due to contamination of blood in the saliva. There is however no consensus on
General discussions
92
where to draw the line for physiologically irrelevant saliva cortisol levels, making the cut‐offs discriminating outliers somewhat arbitrary. Moreover, there is a risk that ambulatory saliva sampling of cortisol in itself introduces some artifacts to the data, such as taking the samples in the wrong order, or being non‐compliant to the time point when you were supposed to collect saliva. If the participant had reported any type of non‐compliance to the protocol, they were excluded from the analyses in Paper IV. However, it was not possible to determine if more participants than those reporting it were non‐compliant.
5.5.5 Assessment of psychosocial factors
The instruments used for assessment of psychosocial factors were designed to capture one of the main categories of social support, psychosocial resources, or psychosocial risk factors. Work‐related psychosocial instruments, which have been frequently used when studying psychosocial factors, were deliberately omitted from the analyses. Many of the most frequently used work related instruments aim to capture load of stressors. As we wanted to capture the feelings related to the stressors rather than the stress load itself (see section 1.4.2) it was decided that no work‐related psychosocial instruments should be used in these analyses. In Paper II, social support was referred to as a psychosocial resource, although this factor is by definition not internal. However, as it is supposed that social support acts indirectly to improve psychosocial resources, being a “coping assistant”, it has been suggested that social support should also be included when studying psychosocial resources [279,280]. Moreover, social support may be a proxy for a personality trait regarding how one reacts and responds in a social context [280], further motivating the inclusion of social support when measuring psychosocial resources.
Unique entities or overlapping constructs?
There has for long been a discussion on the usefulness of dividing different psychosocial factors into separate concepts. Whereas they in theory can be described as different entities, e.g. how stressors are perceived and what the reaction to a prolonged stressor is, the entities may be hard to disentangle in statistical analyses, due to a considerable co‐variation.
General discussions
93
The complexity is derived from several levels. First, the temporality issue is critical, as poor coping with a stress load accompanied by an insufficient restitution will eventually lead to fatigue or exhaustion, as pointed out in CATS [134]. Second, there is the issue of construct validity, as there are a number of examples when comparing psychosocial instruments, where it appears that psychosocial risk factors are simply reflected by inverse psychosocial resources and vice versa. As an example, two items from two different psychosocial instruments are compared. The first item “At times I think I am no good at all” is taken from Pearlin’s self‐esteem scale (see Appendix V). The inverted score of the item is summed together with other items in an instrument aiming to assess self‐esteem, a psychosocial resource. The other item “I felt I was just as good as other people” is taken from Centre of Epidemiology Studies Depression Scale (see Appendix IX). The inverted score of the item is summed together with other items in an instrument aiming to assess depression, a psychosocial risk factor. The comparison is made to pin‐point difficulties in separating different domains of psychosocial factors. As psychosocial factors are defined by several tightly linked domains, it might be necessary to use instruments that cover more than one domain in the same instrument. The complexity calls however for an awareness when interpreting results where two or more psychosocial instruments are run in the same analysis, as there is a risk that the instruments are partly unique in construct and partly have an inter‐questionnaire overlap. This is further exemplified by a comparison between depression and vital exhaustion. From a clinical perspective, it could be argued that depression and vital exhaustion are different entities [281‐283]. However, in normal populations where most participants report sub‐clinical levels, correlations are generally high (around r=0.7) between questionnaires assessing depression and vital exhaustion [283‐285]. The conversion in depressive symptomatology makes it challenging to distinguish the entities when using questionnaires. Third, the raised question of unique entities or overlapping constructs is not only a matter of temporality or item compilation, but also further complicated by the fact that plausible psychoneuroendocrinological pathways are limited. Thus, if different psychosocial domains lead to the same pathways, it is a relevant discussion if different aspects of psychosocial strain have additive or shared contribution to cardiovascular risk. So far, the literature is inconclusive [286‐288], and further investigations are warranted to evaluate chronic stress and psychosocial factors as risk factors for CAD.
General discussions
94
The high correlations between different psychosocial instruments as shown in Table 9, is an inevitable challenge and calls on a cautiousness when trying to disentangle different effects that specific psychosocial entities may exert.
5.5.6 Assessment of traditional risk factors
The assessment of all traditional risk factors followed general guidelines as previously established either in epidemiological studies and/or in clinical practice. The protocol for the physiological risk factors followed the protocol in the HAPIEE‐study [232].
Total risk load
The total risk load algorithm was not based on an established index. It should be mentioned that it was not designed to be used in predictive models of ACS. It was nevertheless useful in this early phase of explorative analyses of MMP‐9 levels in normal populations. The major advantage using a sum score where each risk factor was equally weighted was that one risk factor at a time could easily be subtracted, providing the possibility to study if the association between MMP‐9 levels and total risk load was driven by one single risk factor or if multiple risk factors contributed to the MMP‐9 level.
Reversed causation for smoking and alcohol intake
There is always a risk in cross‐sectional analyses that results might be biased by reversed causation. In this dissertation, the possibility of reversed causation was taken into account regarding the variables smoking and alcohol intake. Participants that had recently quit smoking and/or recently reduced alcohol intake due to health problems were assigned to the top category (regardless of category assessed in the questionnaires). An arbitrary cut‐off for a behavioral change regarding smoking and/or alcohol intake was set as five years prior to examination. The choice of a relatively long period was motivated by the intention to capture a reversed causation for a number of outcomes in the LSH‐study and not only levels of MMP‐9. The mean level of MMP‐9 for participants that matched this criterion in regard to smoking was 55.8 ng/ml (n=13). The mean level of MMP‐9 for this group was in the same range as for current smokers (n=50, 55.4 ng/ml, p=0.96), and was
General discussions
95
significantly higher than the mean MMP‐9 level in non‐smokers (n=323, 36.4 ng/ml, p<0.001). The mean level of MMP‐9 for participants that matched this criterion in regard to alcohol intake was 59.4 ng/ml (n=12). The mean level of MMP‐9 for this group was in the same range as for other participants in the top category (n=38, 51.0 ng/ml, p=0.39), and was significantly higher than the mean MMP‐9 level in the lowest category (n=316, 36.8 ng/ml, p<0.001). The participants matching the criteria for reversed causation did not drive the associations between MMP‐9 and smoking and alcohol intake respectively. Excluding these participants in regressions on MMP‐9 adjusting for age and sex, there were still significant associations both with smoking (p<0.001) and with alcohol (p=0.004). Thus, adjusting for reversed causation seemed to be of relevance in the analyses.
Future research
96
6. FUTURE RESEARCH
The study of MMP‐9 in normal populations is in an early phase of exploration. Paper I, II, and IV present some promising results, but there are many studies that need to evolve in order to bring conclusions to a higher level. The findings in this dissertation carry a number of implications for future research, which taken together will increase the knowledge and outline the possible usefulness of MMP‐9 in cardiovascular epidemiology and in psychoneuroendocrinology in general. In particular, three issues have emerged which warrant further studies. These concern the intra‐individual stability over time of circulating levels of MMP‐9, the predictive value of MMP‐9 for ACS in a normal population, and perhaps the most intriguing, if circulating levels of MMP‐9 could be reduced by intervention programs on stress management and behavioral risk factors.
Concluding remarks
97
7. CONCLUDING REMARKS
Taken together, the studies performed in a normal population indicate that plasma MMP‐9 could be an informative biomarker when studying the association between stress and cardiovascular risk. The following conclusions were made:
• In a middle‐aged population without reported symptomatic CAD, MMP‐9 levels were associated with total cardiovascular risk load as well as with single risk factors. This was found also after adjustment for CRP levels.
• MMP‐9 levels were independently associated with psychosocial factors after adjustment for cardiovascular risk factors and circulating levels of CRP. All psychosocial resources (including social integration and emotional support) pointed towards a negative association with levels of MMP‐9, and all psychosocial risk factors pointed towards a positive association with levels of MMP‐9. In particular, depression and cynicism were associated with high levels of MMP‐9.
• Pooling saliva samples prior to laboratory analysis was as reliable as arithmetic means over consecutive days when assessing diurnal cortisol variation in a field research project.
• A dysregulated diurnal pattern of cortisol, in particular reflected by elevated evening values, was associated with elevated levels of MMP‐9.
The observed associations between MMP‐9 and traditional cardiovascular risk factors, psychosocial factors, and cortisol levels suggest a psychoneuroendocrinological pathway that may link stress to plaque vulnerability and increase the understanding of observed associations between psychosocial factors and CAD.
Summary in Swedish
98
8. SUMMARY IN SWEDISH
Ett flertal stora epidemiologiska studier har påvisat ett prediktivt värde av psykosociala faktorer och stress vad gäller insjuknande i hjärtinfarkt. Plötsliga förändringar i hjärtinfarktinsjuknande har lett till diskussioner om möjliga mekanismer som ökar sårbarheten i aterosklerotiska plack. Sedan tidigare vet man att nivåer av det kollagennedbrytande enzymet matrix metalloproteinas‐9 (MMP‐9) är förhöjda i sårbara plack med inflammatorisk aktivitet. Cirkulerande nivåer av MMP‐9 är förhöjda hos hjärtinfarktpatienter i jämförelse med kontrollgrupper. Hur MMP‐9 är fördelat i icke‐kliniska material vet man dock inte så mycket om än. Det är fram till denna avhandling inte studerat alls om och hur MMP‐9 är relaterat till psykosociala faktorer och till stresshormonet kortisol i en normalpopulation. Syftet med denna avhandling var att studera associationen mellan cirkulerande nivåer av MMP‐9 och etablerade riskfaktorer för hjärt‐ och kärlsjukdom, inklusive nivåer av C‐reaktivt protein (CRP), mellan MMP‐9 och psykosociala faktorer, samt mellan MMP‐9 och kortisol i saliv i en normalpopulation. Utöver detta testades tillförlitligheten i en nyutvecklad metod för att mäta kortisol i saliv. Ett slumpmässigt urval från LSH‐studien (Livsvillkor, stress och hälsa) användes (n=400). LSH‐studien är en populationsbaserad studie designad för att studera om psykoneuroendokrinologiska mekanismer kan mediera de skillnader som finns över en socioekonomisk gradient vad gäller insjuknande i hjärt‐ och kärlsjuklighet. Plasmanivåer av MMP‐9 studerades i urvalet som bestod av män och kvinnor som var 45‐69 år gamla när studien påbörjades. Huvudfynd i avhandlingen: 1) Plasma MMP‐9 ökade med antal riskfaktorer för hjärt‐ och kärlsjukdom också efter justering för CRP. Sambandet kan inte förklaras av associationen mellan MMP‐9 och någon enskild riskfaktor. 2) Efter justering för etablerade riskfaktorer kvarstod ett oberoende negativt samband mellan MMP‐9 och psykosociala resurser, och ett positivt samband till psykosociala riskfaktorer. 3) Att poola salivprover från tre dagar för mätning av kortisol var lika tillförlitligt som att mäta varje dag för sig och beräkna ett medelvärde på proverna. 4) MMP‐9 hade ett positivt samband med kortisol i saliv, vad gäller såväl höga morgonvärden som höga kvällsvärden. Sammantaget stöder fynden i avhandlingen att det kan finnas en psykoneuroendokrinologisk mekanism som medierar kopplingen mellan stress och hjärtinfarkt via en ökad risk för bristningar i kärlväggen.

Acknowledgements
99
9. ACKNOWLEDGEMENTS
There are a number of formal and informal institutions, structures and relationships that not only made this work possible, but also set the framework for an enjoyable and encouraging time as a Ph.D.‐student.
9.1 Grants
The work presented and discussed in this dissertation has been supported by grants and financial support from:
• The Swedish Research Council • The Swedish Heart and Lung Foundation • CIRC, Cardiovascular Inflammation Research Centre, a strategic joint
venture between Linköping University and Östergötland county council • ALF‐medel, an agreement between the Swedish state and the county
councils on the collaboration between undergraduate training in medical schools and academic research
During my post‐graduate training personal grants and financial support have, apart from the Department of Medical and Health Sciences been received from the following:
• CIRC, Cardiovascular Inflammation Research Centre, a strategic joint venture between Linköping University and Östergötland county council
• The Swedish Heart and Lung Foundation • The Anna Cederberg foundation • Lions research foundation for widespread diseases (Lions
forskningsfond för folksjukdomar) • Knut and Alice Wallenberg foundation for junior researchers (Knut och
Alice Wallenbergs stiftelse) • International Society of Behavioral Medicine’s biannual early career
award
Acknowledgements
100
9.2 Personnel involved in the LSH-study
There have been many people involved since the LSH‐study was initiated. The following persons have all had crucial roles in different phases of the LSH‐study. I owe a lot to every one of you.
9.2.1 Staff at participating Primary health care centers
The real heroes in the LSH‐study are all the nurses taking care of the participants, collecting data, and running the logistics with accuracy. I really enjoyed working with you, and hope that we’ll have another meeting at Villa Fridhem someday, in preparation of the next phase of the LSH‐study. Karin Johansson Magdalena Svahn Kolmårdens vårdcentral Hélène Emilsson Margareta Smedberg Hageby vårdcentral, Norrköping Lena Brusk Gisela Hardbro Kungsgatans vårdcentral, Norrköping Marie Matthys Anette Viktorsson Skärblacka vårdcentral Catherine Andersson Catarina Olsson Åtvidabergs vårdcentral Christina Ahlqvist Lisbeth Antonsson Berga vårdcentral, Linköping
Acknowledgements
101
Kristina Ahlgren Lena Widén Lambohovs vårdcentral, Linköping Inger Rosenqvist Anna Karin Schöld Lyckornas vårdcentral, Motala Ann‐Margret Ledström Christina Juberg Vadstena vårdcentral Ing‐Marie Nordahl Annette Johansson Ödeshögs vårdcentral
9.2.2 Laboratory assistants
I have had some essential help with the laboratory analyses. Thank you all for facilitating logistics, storing, and analyses of the biomarkers. Ylva Lindegårdh, for performing the analyses of MMP‐9. Agneta Berg, Iva Söderström, and Ewa Lönn‐Karlsson, for performing the analyses of cortisol. An extra thank you to Agneta Berg for advice when constructing the bar‐codes for sample identification. Mari‐Anne Åkesson, for struggling with the cytokines. They never came to be a part of this dissertation, but maybe one day we will have a breakthrough… Staff at the division of clinical chemistry, the university hospital in Linköping, in particular Malin Skala, for performing the analyses of CRP and blood lipids.
Acknowledgements
102
9.2.3 Other functions
There have been a number of situations where assistance has been needed working with the LSH‐study. In particular, I would like to show my appreciation to the following: Ove Löfman, for providing maps and time‐saving advice in preparation of the random sample procedure. Marie Jonsson, for scanning all the questionnaires. Birgitta Fingal, for always being there when the frozen biological samples arrived from the PHCCs, making sure none of the samples was thawed before being put in central storage. Elisabeth Wilhelm, for keeping an eye on the database and helping me discover a number of personal (sometimes very peculiar) mistakes in the syntax coding.
9.3 Participants in the LSH-study
I am deeply grateful to all participants who accepted to be a part of the LSH‐study. It was a lot to put up with; the seemingly ever‐growing cotton swabs used for saliva sampling, the never‐ending and repetitive questionnaires, and the visit to a PHCC on an empty stomach. Your contribution is priceless. Without participants, no studies can be conducted.
9.4 Personal gratitudes
There is a long list of persons who have contributed in different ways to my personal and academic development during this work. With a warm feeling of thankfulness and appreciation, I wish to express my sincere gratitudes to the following:

Acknowledgements
103
Margareta Kristenson, for recruiting me to this “high risk‐high potential” project, eventually becoming the LSH‐study. Thank you for putting your trust in me and letting me choose my own pathways. Thank you for letting me participate in settings and meetings most Ph.D.‐students only hear of. You have indeed been a great supervisor, allowing me to grow during these years. John Carstensen, for accepting my inquiry to become an assistant supervisor. I appreciate your belief in me when it comes to statistical analyses and have enjoyed learning how to interpret your subtle comments on regression models that preferably should be run in a completely different way. Lena Jonasson, for accepting my inquiry to become an assistant supervisor. Your state of the art‐competence in cardiology has indeed been vital in my research training. I appreciate that you had the time to be there, despite your well‐filled calendar. I also appreciate your honesty in discussions and in written comments. Your “nej usch, inte skriva så” is already a classic. Lennart Nilsson, for fruitful discussions and constructive feed‐back. Your contribution, especially in the early discussions on MMPs has had a substantial impact on this work. The LSH‐group as a whole. There is so much more to do with this rich data set. I do hope that our vivid and fruitful discussions will continue and that the multidisciplinary approach will render some inspiring publications henceforth. Johanna Lundberg, for helping me hang on to the roten troten. Keep up your good work; it is indeed not easy for a sociologist like you to struggle with all those crazy reductionists like the rest of us. Evalill Nilsson, for all inspiring discussions, especially in the early phase of our research training. It will happen someday, you know, that we’ll actually write that article together. Oskar Lundgren, for being a positive force, bringing new ideas into the LSH‐group. I hope that you will be the next Ph.D.‐student further exploring psychoneuroendocrinology in our research group.

Acknowledgements
104
Anders G. Olsson, for showing great interest in my work. Thank you for showing our data in various presentations. I enjoyed working with you in Rome and hope that we’ll do something similar someday. Jan Sundin, for trying to make something more out of me than a crazy reductionist. Holger Ursin, for inviting me to Bergen. Your great knowledge and experience is a great source of inspiration for me. Thank you for teaching me everything there is to know about big‐group‐tactics. Thank you for the “räkmacka” when we were out driving in the Norwegian countryside. I do hope that I can visit you again, even after you’ve seen what I’ve done to your model… Hege Eriksen, for providing office space and letting me participate in your seminars when I have visited Bergen. Your hospitality is warming. Thank you for the nachos! I can only hope that you’ll say “Va’ bra!” when reading this. Anette Harris for all your help in preparation of and during my stays in Bergen. Next time, I’ll try to avoid the “festspillene”, even though I really enjoyed the concerts nearby “den blå stein” last time. Scancort (Scandinavian cortisol and stress network) as a whole. It has truly been an inspiring time so far. We have something good going on here. CIRC (Cardiovascular Inflammation Research Centre), for initiating several high quality inspiring research projects. It has been worth a lot in my research training being a part of this constellation. I do hope that some of the ideas that I’ve discussed with Helen, Joakim, Per, and Ingemar will be actualized in the near future. The Ph.D.‐students and post‐docs joining the seminar series held by CIRC. Thank you for expanding my limited knowledge on physiological and pharmacological mechanisms. There are so many areas where I don’t have a clue… I am working on it. Thank you for helping me whenever there has been a freezer‐emergency. My special thanks go to Hanna, Liza, and Andreas. Hopefully, our initiated collaborations will render some new publications one day.

Acknowledgements
105
All personnel at the “SoF‐bordet i hörnet”, for creating a positive work environment. I’m still waiting for the next “stövelkastning” with great anticipation… I would especially like to thank Kajsa, for putting up with me when the music is pumping loud from my office. Theo Bodin, for always making things happen when it comes to things you care for and believe in. I’m grateful and honored by your decision to nominate me to become a board member in the Swedish Foundation for Strategic Research. The board of the Swedish Foundation for Strategic Research (SSF) 2006‐07, for teaching me a great deal about the academic world and showing me how a real professional board works. Karin Fälth Magnusson, for your work within the medical faculty board. You always treated us sometimes somewhat naïve student representatives with respect, encouraging us when we had something important to say, and dampening our efforts when we were just out in the blue. Martin Tondel, for not giving up when the wind was blowing. My research career has taken another path since I was working in your projects, but our friendship remains the same. Torben Wendt (Diorama), for making all that great music getting me through the different phases of writing. And most importantly: Stina, my beloved wife, for tender love and care. Thank you for taking care of me and Hanna when all the deadlines were closing in. I could not believe that writing this dissertation would require all that time…Thank you for always being there, despite my crankiness the latest couple of months. Thank you for your enormous effort, correcting my English and increasing readability throughout the dissertation. I did not realize it was that bad… Hanna, for all the kitchen dances getting me through the rough times. I will definitively have more time for you and your mother now, when this dissertation is complete. Yeay!

References
107
10. REFERENCES
[1] Kaplan GA, Keil JE. Socioeconomic factors and cardiovascular disease: a review of the literature. Circulation 1993;88:1973‐98.
[2] Socialstyrelsen (2005) Folkhälsorapport, 2005, pp. 395, Socialstyrelsen, Stockholm.
[3] Virtanen SV, Notkola V. Socioeconomic inequalities in cardiovascular mortality and the role of work: a register study of Finnish men. Int J Epidemiol 2002;31:614‐21.
[4] Hallqvist J, Lundberg M, Diderichsen F, Ahlbom A. Socioeconomic differences in risk of myocardial infarction 1971‐1994 in Sweden: time trends, relative risks and population attributable risks. Int J Epidemiol 1998;27:410‐5.
[5] Mackenbach JP, Howden‐Chapman P. New perspectives on socioeconomic inequalities in health. Perspect Biol Med 2003;46:428‐44.
[6] Engstrom G, Berglund G, Goransson M, Hansen O, Hedblad B, Merlo J, Tyden P, Janzon L. Distribution and determinants of ischaemic heart disease in an urban population. A study from the myocardial infarction register in Malmo, Sweden. J Intern Med 2000;247:588‐96.
[7] Erikson R, Torssander J. Social class and cause of death. Eur J Public Health 2008.
[8] Adler NE, Ostrove JM. Socioeconomic status and health: what we know and what we donʹt. Ann N Y Acad Sci 1999;896:3‐15.
[9] Marmot MG, Smith GD, Stansfeld S, Patel C, North F, Head J, White I, Brunner E, Feeney A. Health inequalities among British civil servants: the Whitehall II study. Lancet 1991;337:1387‐93.
[10] Lynch JW, Kaplan GA, Salonen JT. Why do poor people behave poorly? Variation in adult health behaviours and psychosocial characteristics by stages of the socioeconomic lifecourse. Soc Sci Med 1997;44:809‐19.
[11] Bartley M, Fitzpatrick R, Firth D, Marmot M. Social distribution of cardiovascular disease risk factors: change among men in England 1984‐1993. J Epidemiol Community Health 2000;54:806‐14.
[12] Bobak M, Hertzman C, Skodova Z, Marmot M. Own education, current conditions, parental material circumstances, and risk of myocardial infarction in a former communist country. J Epidemiol Community Health 2000;54:91‐6.
References
108
[13] Ginter E. Cardiovascular risk factors in the former communist countries. Analysis of 40 European MONICA populations. Eur J Epidemiol 1995;11:199‐205.
[14] Kristenson M, Zieden B, Kucinskiene Z, Elinder LS, Bergdahl B, Elwing B, Abaravicius A, Razinkoviene L, Calkauskas H, Olsson AG. Antioxidant state and mortality from coronary heart disease in Lithuanian and Swedish men: concomitant cross sectional study of men aged 50. Bmj 1997;314:629‐33.
[15] Frasure‐Smith N, Lesperance F. Reflections on depression as a cardiac risk factor. Psychosom Med 2005;67 Suppl 1:S19‐25.
[16] Everson‐Rose SA, Lewis TT. Psychosocial factors and cardiovascular diseases. Annu Rev Public Health 2005;26:469‐500.
[17] Glassman AH, Shapiro PA. Depression and the course of coronary artery disease. Am J Psychiatry 1998;155:4‐11.
[18] Hemingway H, Marmot M. Evidence based cardiology: psychosocial factors in the aetiology and prognosis of coronary heart disease. Systematic review of prospective cohort studies. Bmj 1999;318:1460‐7.
[19] Lett HS, Blumenthal JA, Babyak MA, Sherwood A, Strauman T, Robins C, Newman MF. Depression as a risk factor for coronary artery disease: evidence, mechanisms, and treatment. Psychosom Med 2004;66:305‐15.
[20] Chang PP, Ford DE, Meoni LA, Wang NY, Klag MJ. Anger in young men and subsequent premature cardiovascular disease: the precursors study. Arch Intern Med 2002;162:901‐6.
[21] Matthews KA, Gump BB, Harris KF, Haney TL, Barefoot JC. Hostile behaviors predict cardiovascular mortality among men enrolled in the Multiple Risk Factor Intervention Trial. Circulation 2004;109:66‐70.
[22] Rosengren A, Hawken S, Ounpuu S, Sliwa K, Zubaid M, Almahmeed WA, Blackett KN, Sitthi‐amorn C, Sato H, Yusuf S. Association of psychosocial risk factors with risk of acute myocardial infarction in 11119 cases and 13648 controls from 52 countries (the INTERHEART study): case‐control study. Lancet 2004;364:953‐62.
[23] Rozanski A, Blumenthal JA, Kaplan J. Impact of psychological factors on the pathogenesis of cardiovascular disease and implications for therapy. Circulation 1999;99:2192‐217.
[24] Surtees PG, Wainwright NW, Luben R, Khaw KT, Day NE. Mastery, sense of coherence, and mortality: evidence of independent associations from the EPIC‐Norfolk Prospective Cohort Study. Health Psychol 2006;25:102‐10.
References
109
[25] Yusuf S, Hawken S, Ounpuu S, Dans T, Avezum A, Lanas F, McQueen M, Budaj A, Pais P, Varigos J, Lisheng L. Effect of potentially modifiable risk factors associated with myocardial infarction in 52 countries (the INTERHEART study): case‐control study. Lancet 2004;364:937‐52.
[26] Carney RM, Freedland KE, Miller GE, Jaffe AS. Depression as a risk factor for cardiac mortality and morbidity: a review of potential mechanisms. J Psychosom Res 2002;53:897‐902.
[27] Krantz DS, McCeney MK. Effects of psychological and social factors on organic disease: a critical assessment of research on coronary heart disease. Annu Rev Psychol 2002;53:341‐69.
[28] World Health Organisation, Europe. Mortality data base (MDB). http://data.euro.who.int/hfamdb/ 2007.
[29] Weidner G, Kopp M, Kristenson M, ebrary Inc. (2002) Heart disease environment, stress, and gender (NATO science series. Series I, Life and behavioural sciences, v. 327, 2002, pp. xx, 384, IOS Press, Amsterdam ; Washington, DC.
[30] Kopp MS, Rethelyi J. Where psychology meets physiology: chronic stress and premature mortality‐‐the Central‐Eastern European health paradox. Brain Res Bull 2004;62:351‐67.
[31] Shteyn M, Schumm JA, Vodopianova N, Hobfoll SE, Lilly R. The impact of the Russian transition on psychosocial resources and psychological distress. Journal of Community Psychology 2003;31:113‐127.
[32] Leor J, Poole WK, Kloner RA. Sudden cardiac death triggered by an earthquake. N Engl J Med 1996;334:413‐9.
[33] Kloner RA, Leor J, Poole WK, Perritt R. Population‐based analysis of the effect of the Northridge Earthquake on cardiac death in Los Angeles County, California. J Am Coll Cardiol 1997;30:1174‐80.
[34] Meisel SR, Kutz I, Dayan KI, Pauzner H, Chetboun I, Arbel Y, David D. Effect of Iraqi missile war on incidence of acute myocardial infarction and sudden death in Israeli civilians. Lancet 1991;338:660‐1.
[35] Sterling P, Eyer J. Allostasis: A new paradigm to explain arousal pathology. In: Fisher, S. and Reason, J. (Ed) Handbook of Life Stress, Cognition and Health. John Wiley & Sons Ltd. New York, pp.629‐649. 1988.
[36] Zethelius B, Berglund L, Sundstrom J, Ingelsson E, Basu S, Larsson A, Venge P, Arnlov J. Use of multiple biomarkers to improve the prediction of death from cardiovascular causes. N Engl J Med 2008;358:2107‐16.
References
110
[37] Wilson PW, DʹAgostino RB, Levy D, Belanger AM, Silbershatz H, Kannel WB. Prediction of coronary heart disease using risk factor categories. Circulation 1998;97:1837‐47.
[38] Assmann G, Cullen P, Schulte H, Hense HW. Response to Conroy et al. SCORE Project. Eur Heart J 2003;24:2070‐1; author reply 2071.
[39] Greenland P, Knoll MD, Stamler J, Neaton JD, Dyer AR, Garside DB, Wilson PW. Major risk factors as antecedents of fatal and nonfatal coronary heart disease events. Jama 2003;290:891‐7.
[40] Prabhakaran S, Singh R, Zhou X, Ramas R, Sacco RL, Rundek T. Presence of calcified carotid plaque predicts vascular events: the Northern Manhattan Study. Atherosclerosis 2007;195:e197‐201.
[41] Johnsen SH, Mathiesen EB, Joakimsen O, Stensland E, Wilsgaard T, Lochen ML, Njolstad I, Arnesen E. Carotid atherosclerosis is a stronger predictor of myocardial infarction in women than in men: a 6‐year follow‐up study of 6226 persons: the Tromso Study. Stroke 2007;38:2873‐80.
[42] Tapio Neuwirth E, Hjärt‐Lungfonden Svenska nationalföreningen mot hjärt‐ och lungsjukdomar (2006) Plötslig hjärtdöd : en temaskrift från Hjärt‐lungfonden, 2006, pp. 33, Hjärt‐Lungfonden, Stockholm.
[43] Kardasz I, De Caterina R. Myocardial infarction with normal coronary arteries: a conundrum with multiple aetiologies and variable prognosis: an update. J Intern Med 2007;261:330‐48.
[44] Naghavi M, Libby P, Falk E, Casscells SW, Litovsky S, Rumberger J, Badimon JJ, Stefanadis C, Moreno P, Pasterkamp G, Fayad Z, Stone PH, Waxman S, Raggi P, Madjid M, Zarrabi A, Burke A, Yuan C, Fitzgerald PJ, Siscovick DS, de Korte CL, Aikawa M, Juhani Airaksinen KE, Assmann G, Becker CR, Chesebro JH, Farb A, Galis ZS, Jackson C, Jang IK, Koenig W, Lodder RA, March K, Demirovic J, Navab M, Priori SG, Rekhter MD, Bahr R, Grundy SM, Mehran R, Colombo A, Boerwinkle E, Ballantyne C, Insull W, Jr., Schwartz RS, Vogel R, Serruys PW, Hansson GK, Faxon DP, Kaul S, Drexler H, Greenland P, Muller JE, Virmani R, Ridker PM, Zipes DP, Shah PK, Willerson JT. From vulnerable plaque to vulnerable patient: a call for new definitions and risk assessment strategies: Part I. Circulation 2003;108:1664‐72.
[45] Socialstyrelsen (2004) Dödsorsaker (Hälsa och sjukdomar, 2004:5, 2004, pp. 227, Socialstyrelsen, Stockholm.
[46] Abegunde DO, Mathers CD, Adam T, Ortegon M, Strong K. The burden and costs of chronic diseases in low‐income and middle‐income countries. Lancet 2007;370:1929‐38.
References
111
[47] Bonow RO, Smaha LA, Smith SC, Jr., Mensah GA, Lenfant C. World Heart Day 2002: the international burden of cardiovascular disease: responding to the emerging global epidemic. Circulation 2002;106:1602‐5.
[48] Mathers CD, Loncar D. Projections of global mortality and burden of disease from 2002 to 2030. PLoS Med 2006;3:e442.
[49] Murray CJ, Lopez AD. Alternative projections of mortality and disability by cause 1990‐2020: Global Burden of Disease Study. Lancet 1997;349:1498‐504.
[50] Ross R, Glomset JA. The pathogenesis of atherosclerosis (second of two parts). N Engl J Med 1976;295:420‐5.
[51] Ross R, Glomset JA. The pathogenesis of atherosclerosis (first of two parts). N Engl J Med 1976;295:369‐77.
[52] Hansson GK. Inflammation, atherosclerosis, and coronary artery disease. N Engl J Med 2005;352:1685‐95.
[53] Libby P, Theroux P. Pathophysiology of coronary artery disease. Circulation 2005;111:3481‐8.
[54] Ross R. Atherosclerosis‐‐an inflammatory disease. N Engl J Med 1999;340:115‐26.
[55] Hallenbeck JM, Hansson GK, Becker KJ. Immunology of ischemic vascular disease: plaque to attack. Trends Immunol 2005;26:550‐6.
[56] Navab M, Ananthramaiah GM, Reddy ST, Van Lenten BJ, Ansell BJ, Fonarow GC, Vahabzadeh K, Hama S, Hough G, Kamranpour N, Berliner JA, Lusis AJ, Fogelman AM. The oxidation hypothesis of atherogenesis: the role of oxidized phospholipids and HDL. J Lipid Res 2004;45:993‐1007.
[57] Yla‐Herttuala S, Palinski W, Rosenfeld ME, Parthasarathy S, Carew TE, Butler S, Witztum JL, Steinberg D. Evidence for the presence of oxidatively modified low density lipoprotein in atherosclerotic lesions of rabbit and man. J Clin Invest 1989;84:1086‐95.
[58] Vercellotti GM. Microbes, inflammation and atherosclerosis: will old pathology lessons guide new therapies? Trans Am Clin Climatol Assoc 2001;112:215‐22; discussion 222‐3.
[59] Madjid M, Vela D, Khalili‐Tabrizi H, Casscells SW, Litovsky S. Systemic infections cause exaggerated local inflammation in atherosclerotic coronary arteries: clues to the triggering effect of acute infections on acute coronary syndromes. Tex Heart Inst J 2007;34:11‐8.
References
112
[60] Mills NL, Tornqvist H, Robinson SD, Gonzalez MC, Soderberg S, Sandstrom T, Blomberg A, Newby DE, Donaldson K. Air pollution and atherothrombosis. Inhal Toxicol 2007;19 Suppl 1:81‐9.
[61] Delfino RJ, Sioutas C, Malik S. Potential role of ultrafine particles in associations between airborne particle mass and cardiovascular health. Environ Health Perspect 2005;113:934‐46.
[62] Daub K, Lindemann S, Langer H, Seizer P, Stellos K, Siegel‐Axel D, Gawaz M. The evil in atherosclerosis: adherent platelets induce foam cell formation. Semin Thromb Hemost 2007;33:173‐8.
[63] Gawaz M, Langer H, May AE. Platelets in inflammation and atherogenesis. J Clin Invest 2005;115:3378‐84.
[64] Mauriello A, Sangiorgi G, Fratoni S, Palmieri G, Bonanno E, Anemona L, Schwartz RS, Spagnoli LG. Diffuse and active inflammation occurs in both vulnerable and stable plaques of the entire coronary tree: a histopathologic study of patients dying of acute myocardial infarction. J Am Coll Cardiol 2005;45:1585‐93.
[65] Buffon A, Biasucci LM, Liuzzo G, DʹOnofrio G, Crea F, Maseri A. Widespread coronary inflammation in unstable angina. N Engl J Med 2002;347:5‐12.
[66] Tanaka A, Shimada K, Sano T, Namba M, Sakamoto T, Nishida Y, Kawarabayashi T, Fukuda D, Yoshikawa J. Multiple plaque rupture and C‐reactive protein in acute myocardial infarction. J Am Coll Cardiol 2005;45:1594‐9.
[67] Lindmark E, Diderholm E, Wallentin L, Siegbahn A. Relationship between interleukin 6 and mortality in patients with unstable coronary artery disease: effects of an early invasive or noninvasive strategy. Jama 2001;286:2107‐13.
[68] Rossi E, Biasucci LM, Citterio F, Pelliccioni S, Monaco C, Ginnetti F, Angiolillo DJ, Grieco G, Liuzzo G, Maseri A. Risk of myocardial infarction and angina in patients with severe peripheral vascular disease: predictive role of C‐reactive protein. Circulation 2002;105:800‐3.
[69] Sabatine MS, Morrow DA, Jablonski KA, Rice MM, Warnica JW, Domanski MJ, Hsia J, Gersh BJ, Rifai N, Ridker PM, Pfeffer MA, Braunwald E. Prognostic significance of the Centers for Disease Control/American Heart Association high‐sensitivity C‐reactive protein cut points for cardiovascular and other outcomes in patients with stable coronary artery disease. Circulation 2007;115:1528‐36.
[70] Oppenheimer GM. Becoming the Framingham Study 1947‐1950. Am J Public Health 2005;95:602‐10.
References
113
[71] Ridker PM, Hennekens CH, Buring JE, Rifai N. C‐reactive protein and other markers of inflammation in the prediction of cardiovascular disease in women. N Engl J Med 2000;342:836‐43.
[72] Wirehn AB, Karlsson HM, Carstensen JM. Estimating disease prevalence using a population‐based administrative healthcare database. Scand J Public Health 2007;35:424‐31.
[73] Beevers G, Lip GY, OʹBrien E. ABC of hypertension: The pathophysiology of hypertension. Bmj 2001;322:912‐6.
[74] Fagard RH. Epidemiology of hypertension in the elderly. Am J Geriatr Cardiol 2002;11:23‐8.
[75] Dressler WW. Culture and the risk of disease. Br Med Bull 2004;69:21‐31. [76] Laurent S, Cockcroft J, Van Bortel L, Boutouyrie P, Giannattasio C,
Hayoz D, Pannier B, Vlachopoulos C, Wilkinson I, Struijker‐Boudier H. Expert consensus document on arterial stiffness: methodological issues and clinical applications. Eur Heart J 2006;27:2588‐605.
[77] Steinberg D. Thematic review series: the pathogenesis of atherosclerosis. An interpretive history of the cholesterol controversy: part I. J Lipid Res 2004;45:1583‐93.
[78] Steinberg D. Thematic review series: the pathogenesis of atherosclerosis. An interpretive history of the cholesterol controversy: part II: the early evidence linking hypercholesterolemia to coronary disease in humans. J Lipid Res 2005;46:179‐90.
[79] Steinberg D. Thematic review series: the pathogenesis of atherosclerosis: an interpretive history of the cholesterol controversy, part III: mechanistically defining the role of hyperlipidemia. J Lipid Res 2005;46:2037‐51.
[80] Steinberg D. The pathogenesis of atherosclerosis. An interpretive history of the cholesterol controversy, part IV: the 1984 coronary primary prevention trial ends it‐‐almost. J Lipid Res 2006;47:1‐14.
[81] Steinberg D. Thematic review series: the pathogenesis of atherosclerosis. An interpretive history of the cholesterol controversy, part V: the discovery of the statins and the end of the controversy. J Lipid Res 2006;47:1339‐51.
[82] Cui Y, Blumenthal RS, Flaws JA, Whiteman MK, Langenberg P, Bachorik PS, Bush TL. Non‐high‐density lipoprotein cholesterol level as a predictor of cardiovascular disease mortality. Arch Intern Med 2001;161:1413‐9.
[83] Shah PK. Focus on HDL: a new treatment paradigm for athero‐thrombotic vascular disease. Expert Opin Investig Drugs 2000;9:2139‐46.
References
114
[84] Karlsson H, Leanderson P, Tagesson C, Lindahl M. Lipoproteomics I: mapping of proteins in low‐density lipoprotein using two‐dimensional gel electrophoresis and mass spectrometry. Proteomics 2005;5:551‐65.
[85] Karlsson H, Leanderson P, Tagesson C, Lindahl M. Lipoproteomics II: mapping of proteins in high‐density lipoprotein using two‐dimensional gel electrophoresis and mass spectrometry. Proteomics 2005;5:1431‐45.
[86] Vaisar T, Pennathur S, Green PS, Gharib SA, Hoofnagle AN, Cheung MC, Byun J, Vuletic S, Kassim S, Singh P, Chea H, Knopp RH, Brunzell J, Geary R, Chait A, Zhao XQ, Elkon K, Marcovina S, Ridker P, Oram JF, Heinecke JW. Shotgun proteomics implicates protease inhibition and complement activation in the antiinflammatory properties of HDL. J Clin Invest 2007;117:746‐56.
[87] Walldius G, Jungner I, Aastveit AH, Holme I, Furberg CD, Sniderman AD. The apoB/apoA‐I ratio is better than the cholesterol ratios to estimate the balance between plasma proatherogenic and antiatherogenic lipoproteins and to predict coronary risk. Clin Chem Lab Med 2004;42:1355‐63.
[88] McQueen MJ, Hawken S, Wang X, Ounpuu S, Sniderman A, Probstfield J, Steyn K, Sanderson JE, Hasani M, Volkova E, Kazmi K, Yusuf S. Lipids, lipoproteins, and apolipoproteins as risk markers of myocardial infarction in 52 countries (the INTERHEART study): a case‐control study. Lancet 2008;372:224‐33.
[89] Sierra‐Johnson J, Fisher RM, Romero‐Corral A, Somers VK, Lopez‐Jimenez F, Ohrvik J, Walldius G, Hellenius ML, Hamsten A. Concentration of apolipoprotein B is comparable with the apolipoprotein B/apolipoprotein A‐I ratio and better than routine clinical lipid measurements in predicting coronary heart disease mortality: findings from a multi‐ethnic US population. Eur Heart J 2008.
[90] Bamba V, Rader DJ. Obesity and atherogenic dyslipidemia. Gastroenterology 2007;132:2181‐90.
[91] Paul RG, Bailey AJ. Glycation of collagen: the basis of its central role in the late complications of ageing and diabetes. Int J Biochem Cell Biol 1996;28:1297‐310.
[92] Hartge MM, Unger T, Kintscher U. The endothelium and vascular inflammation in diabetes. Diab Vasc Dis Res 2007;4:84‐8.
[93] Zhang L, Zalewski A, Liu Y, Mazurek T, Cowan S, Martin JL, Hofmann SM, Vlassara H, Shi Y. Diabetes‐induced oxidative stress and low‐grade inflammation in porcine coronary arteries. Circulation 2003;108:472‐8.
References
115
[94] Wild S, Roglic G, Green A, Sicree R, King H. Global prevalence of diabetes: estimates for the year 2000 and projections for 2030. Diabetes Care 2004;27:1047‐53.
[95] Yang R, Barouch LA. Leptin signaling and obesity: cardiovascular consequences. Circ Res 2007;101:545‐59.
[96] Klein S, Burke LE, Bray GA, Blair S, Allison DB, Pi‐Sunyer X, Hong Y, Eckel RH. Clinical implications of obesity with specific focus on cardiovascular disease: a statement for professionals from the American Heart Association Council on Nutrition, Physical Activity, and Metabolism: endorsed by the American College of Cardiology Foundation. Circulation 2004;110:2952‐67.
[97] Weisberg SP, McCann D, Desai M, Rosenbaum M, Leibel RL, Ferrante AW, Jr. Obesity is associated with macrophage accumulation in adipose tissue. J Clin Invest 2003;112:1796‐808.
[98] Xu H, Barnes GT, Yang Q, Tan G, Yang D, Chou CJ, Sole J, Nichols A, Ross JS, Tartaglia LA, Chen H. Chronic inflammation in fat plays a crucial role in the development of obesity‐related insulin resistance. J Clin Invest 2003;112:1821‐30.
[99] Dandona P, Aljada A, Bandyopadhyay A. Inflammation: the link between insulin resistance, obesity and diabetes. Trends Immunol 2004;25:4‐7.
[100] Aronne LJ. Classification of obesity and assessment of obesity‐related health risks. Obes Res 2002;10 Suppl 2:105S‐115S.
[101] Berg C, Rosengren A, Aires N, Lappas G, Toren K, Thelle D, Lissner L. Trends in overweight and obesity from 1985 to 2002 in Goteborg, West Sweden. Int J Obes (Lond) 2005;29:916‐24.
[102] Gotschlich EC. C‐reactive protein. A historical overview. Ann N Y Acad Sci 1989;557:9‐18.
[103] Li SP, Goldman ND. Regulation of human C‐reactive protein gene expression by two synergistic IL‐6 responsive elements. Biochemistry 1996;35:9060‐8.
[104] Tebo JM, Mortensen RF. Characterization and isolation of a C‐reactive protein receptor from the human monocytic cell line U‐937. J Immunol 1990;144:231‐8.
[105] Chang MK, Binder CJ, Torzewski M, Witztum JL. C‐reactive protein binds to both oxidized LDL and apoptotic cells through recognition of a common ligand: Phosphorylcholine of oxidized phospholipids. Proc Natl Acad Sci U S A 2002;99:13043‐8.
References
116
[106] Saito M, Ishimitsu T, Minami J, Ono H, Ohrui M, Matsuoka H. Relations of plasma high‐sensitivity C‐reactive protein to traditional cardiovascular risk factors. Atherosclerosis 2003;167:73‐9.
[107] Jacobs DR, Jr., Adachi H, Mulder I, Kromhout D, Menotti A, Nissinen A, Blackburn H. Cigarette smoking and mortality risk: twenty‐five‐year follow‐up of the Seven Countries Study. Arch Intern Med 1999;159:733‐40.
[108] Friedman GD, Dales LG, Ury HK. Mortality in middle‐aged smokers and nonsmokers. N Engl J Med 1979;300:213‐7.
[109] Burns DM. Epidemiology of smoking‐induced cardiovascular disease. Prog Cardiovasc Dis 2003;46:11‐29.
[110] Ambrose JA, Barua RS. The pathophysiology of cigarette smoking and cardiovascular disease: an update. J Am Coll Cardiol 2004;43:1731‐7.
[111] Yanbaeva DG, Dentener MA, Creutzberg EC, Wesseling G, Wouters EF. Systemic effects of smoking. Chest 2007;131:1557‐66.
[112] Kloner RA, Rezkalla SH. To drink or not to drink? That is the question. Circulation 2007;116:1306‐17.
[113] Britton A, Marmot M. Different measures of alcohol consumption and risk of coronary heart disease and all‐cause mortality: 11‐year follow‐up of the Whitehall II Cohort Study. Addiction 2004;99:109‐16.
[114] Doll R, Peto R, Hall E, Wheatley K, Gray R. Mortality in relation to consumption of alcohol: 13 yearsʹ observations on male British doctors. Bmj 1994;309:911‐8.
[115] OʹKeefe JH, Bybee KA, Lavie CJ. Alcohol and cardiovascular health: the razor‐sharp double‐edged sword. J Am Coll Cardiol 2007;50:1009‐14.
[116] Imhof A, Woodward M, Doering A, Helbecque N, Loewel H, Amouyel P, Lowe GD, Koenig W. Overall alcohol intake, beer, wine, and systemic markers of inflammation in western Europe: results from three MONICA samples (Augsburg, Glasgow, Lille). Eur Heart J 2004;25:2092‐100.
[117] Imhof A, Froehlich M, Brenner H, Boeing H, Pepys MB, Koenig W. Effect of alcohol consumption on systemic markers of inflammation. Lancet 2001;357:763‐7.
[118] Nocon M, Hiemann T, Muller‐Riemenschneider F, Thalau F, Roll S, Willich SN. Association of physical activity with all‐cause and cardiovascular mortality: a systematic review and meta‐analysis. Eur J Cardiovasc Prev Rehabil 2008;15:239‐46.
[119] Mittleman MA, Maclure M, Tofler GH, Sherwood JB, Goldberg RJ, Muller JE. Triggering of acute myocardial infarction by heavy physical
References
117
exertion. Protection against triggering by regular exertion. Determinants of Myocardial Infarction Onset Study Investigators. N Engl J Med 1993;329:1677‐83.
[120] Strike PC, Steptoe A. Behavioral and emotional triggers of acute coronary syndromes: a systematic review and critique. Psychosom Med 2005;67:179‐86.
[121] Holme I, Hostmark AT, Anderssen SA. ApoB but not LDL‐cholesterol is reduced by exercise training in overweight healthy men. Results from the 1‐year randomized Oslo Diet and Exercise Study. J Intern Med 2007;262:235‐43.
[122] Timmerman KL, Flynn MG, Coen PM, Markofski MM, Pence BD. Exercise training‐induced lowering of inflammatory (CD14+CD16+) monocytes: a role in the anti‐inflammatory influence of exercise? J Leukoc Biol 2008.
[123] Knekt P, Reunanen A, Jarvinen R, Seppanen R, Heliovaara M, Aromaa A. Antioxidant vitamin intake and coronary mortality in a longitudinal population study. Am J Epidemiol 1994;139:1180‐9.
[124] Stampfer MJ, Hennekens CH, Manson JE, Colditz GA, Rosner B, Willett WC. Vitamin E consumption and the risk of coronary disease in women. N Engl J Med 1993;328:1444‐9.
[125] Rimm EB, Stampfer MJ, Ascherio A, Giovannucci E, Colditz GA, Willett WC. Vitamin E consumption and the risk of coronary heart disease in men. N Engl J Med 1993;328:1450‐6.
[126] Clarke R, Armitage J. Antioxidant vitamins and risk of cardiovascular disease. Review of large‐scale randomised trials. Cardiovasc Drugs Ther 2002;16:411‐5.
[127] Bjelakovic G, Nikolova D, Gluud LL, Simonetti RG, Gluud C. Mortality in randomized trials of antioxidant supplements for primary and secondary prevention: systematic review and meta‐analysis. Jama 2007;297:842‐57.
[128] Rosenberg DE, Norman GJ, Sallis JF, Calfas KJ, Patrick K. Covariation of adolescent physical activity and dietary behaviors over 12 months. J Adolesc Health 2007;41:472‐8.
[129] Hollman G, Kristenson M. The prevalence of the metabolic syndrome and its risk factors in a middle‐aged Swedish population ‐ Mainly a function of overweight? Eur J Cardiovasc Nurs 2007.
[130] Grundy SM. Metabolic syndrome: connecting and reconciling cardiovascular and diabetes worlds. J Am Coll Cardiol 2006;47:1093‐100.
References
118
[131] Marmot MG, Wilkinson RG (1999) Social determinants of health, 1999, pp. xii, 291 p., Oxford University Press, Oxford ; New York.
[132] Hettema JM. What is the genetic relationship between anxiety and depression? Am J Med Genet C Semin Med Genet 2008;148:140‐6.
[133] Sukantarat K, Greer S, Brett S, Williamson R. Physical and psychological sequelae of critical illness. Br J Health Psychol 2007;12:65‐74.
[134] Ursin H, Eriksen HR. The cognitive activation theory of stress. Psychoneuroendocrinology 2004;29:567‐92.
[135] Browne JS, Karady S, Selye H. The effect of noxious agents on creatine, creatinine, chloride and water excretion. J Physiol 1939;97:1‐7.
[136] Cannon WB (1929) Bodily changes in pain, hunger, fear and rage; an account of recent researches into the function of emotional excitement, 1929, pp. xvi , 1 l., 404, D. Appleton and company, New York and London,.
[137] Selye H. Blood sugar and blood chloride changes in thyroidectomized rats following exposure to various damaging agents. Biochem J 1938;32:2071‐4.
[138] Kristenson M, Orth‐Gomer K, Kucinskiene Z, Bergdahl B, Calkauskas H, Balinkyniene I, Olsson AG. Attenuated cortisol response to a standardized stress test in Lithuanian versus Swedish men: the LiVicordia study. Int J Behav Med 1998;5:17‐30.
[139] Sjogren E, Leanderson P, Kristenson M. Diurnal saliva cortisol levels and relations to psychosocial factors in a population sample of middle‐aged Swedish men and women. Int J Behav Med 2006;13:193‐200.
[140] Lindeberg SI, Eek F, Lindbladh E, Ostergren PO, Hansen AM, Karlson B. Exhaustion measured by the SF‐36 vitality scale is associated with a flattened diurnal cortisol profile. Psychoneuroendocrinology 2008;33:471‐7.
[141] McEwen BS, Wingfield JC. The concept of allostasis in biology and biomedicine. Horm Behav 2003;43:2‐15.
[142] Folkman S, Lazarus RS, Pimley S, Novacek J. Age differences in stress and coping processes. Psychol Aging 1987;2:171‐84.
[143] Berkman LF, Syme SL. Social networks, host resistance, and mortality: a nine‐year follow‐up study of Alameda County residents. Am J Epidemiol 1979;109:186‐204.
[144] Blazer DG. Social support and mortality in an elderly community population. Am J Epidemiol 1982;115:684‐94.
References
119
[145] Rosengren A, Wilhelmsen L, Orth‐Gomer K. Coronary disease in relation to social support and social class in Swedish men. A 15 year follow‐up in the study of men born in 1933. Eur Heart J 2004;25:56‐63.
[146] Orth‐Gomer K, Rosengren A, Wilhelmsen L. Lack of social support and incidence of coronary heart disease in middle‐aged Swedish men. Psychosom Med 1993;55:37‐43.
[147] Hawkley LC, Cacioppo JT. Loneliness and pathways to disease. Brain Behav Immun 2003;17 Suppl 1:S98‐105.
[148] Pearlin LI, Schooler C. The structure of coping. J Health Soc Behav 1978;19:19.
[149] Bobak M, Pikhart H, Rose R, Hertzman C, Marmot M. Socioeconomic factors, material inequalities, and perceived control in self‐rated health: cross‐sectional data from seven post‐communist countries. Soc Sci Med 2000;51:1343‐50.
[150] Friedman M, Rosenman RH. Association of specific overt behavior pattern with blood and cardiovascular findings; blood cholesterol level, blood clotting time, incidence of arcus senilis, and clinical coronary artery disease. J Am Med Assoc 1959;169:1286‐96.
[151] Vale W, Spiess J, Rivier C, Rivier J. Characterization of a 41‐residue ovine hypothalamic peptide that stimulates secretion of corticotropin and beta‐endorphin. Science 1981;213:1394‐7.
[152] Ranjit N, Young EA, Raghunathan TE, Kaplan GA. Modeling cortisol rhythms in a population‐based study. Psychoneuroendocrinology 2005;30:615‐24.
[153] Kudielka BM, Buchtal J, Uhde A, Wust S. Circadian cortisol profiles and psychological self‐reports in shift workers with and without recent change in the shift rotation system. Biol Psychol 2007;74:92‐103.
[154] Ice GH, Katz‐Stein A, Himes J, Kane RL. Diurnal cycles of salivary cortisol in older adults. Psychoneuroendocrinology 2004;29:355‐70.
[155] Hellhammer J, Fries E, Schweisthal OW, Schlotz W, Stone AA, Hagemann D. Several daily measurements are necessary to reliably assess the cortisol rise after awakening: state‐ and trait components. Psychoneuroendocrinology 2007;32:80‐6.
[156] Adam EK, Hawkley LC, Kudielka BM, Cacioppo JT. Day‐to‐day dynamics of experience‐‐cortisol associations in a population‐based sample of older adults. Proc Natl Acad Sci U S A 2006;103:17058‐63.
[157] Theorell T, Åkerstedt T (2002) Biologiska stressmarkörer : konsensusmöte 12‐13/2 2002 (Stressforskningsrapporter, 302, 2002, pp. 82.
References
120
[158] Levine S. Influence of psychological variables on the activity of the hypothalamic‐pituitary‐adrenal axis. Eur J Pharmacol 2000;405:149‐60.
[159] Miller GE, Chen E, Zhou ES. If it goes up, must it come down? Chronic stress and the hypothalamic‐pituitary‐adrenocortical axis in humans. Psychol Bull 2007;133:25‐45.
[160] Tsigos C, Chrousos GP. Hypothalamic‐pituitary‐adrenal axis, neuroendocrine factors and stress. J Psychosom Res 2002;53:865‐71.
[161] Buckingham JC. Glucocorticoids: exemplars of multi‐tasking. Br J Pharmacol 2006;147 Suppl 1:S258‐68.
[162] Hench PS, Kendall EC, Slocumb CH, Polley HF. Effects of cortisone acetate and pituitary ACTH on rheumatoid arthritis, rheumatic fever and certain other conditions. Arch Med Interna 1950;85:545‐666.
[163] Weber C. Cortisolʹs purpose. Med Hypotheses 1998;51:289‐91. [164] Eijsbouts AM, van den Hoogen FH, Laan RF, Hermus AR, Sweep CG,
van de Putte LB. Hypothalamic‐pituitary‐adrenal axis activity in patients with rheumatoid arthritis. Clin Exp Rheumatol 2005;23:658‐64.
[165] Sephton SE, Sapolsky RM, Kraemer HC, Spiegel D. Diurnal cortisol rhythm as a predictor of breast cancer survival. J Natl Cancer Inst 2000;92:994‐1000.
[166] Whitworth JA, Williamson PM, Mangos G, Kelly JJ. Cardiovascular consequences of cortisol excess. Vasc Health Risk Manag 2005;1:291‐9.
[167] Matthews K, Schwartz J, Cohen S, Seeman T. Diurnal cortisol decline is related to coronary calcification: CARDIA study. Psychosom Med 2006;68:657‐61.
[168] Eller NH, Netterstrom B, Allerup P. Progression in intima media thickness‐‐the significance of hormonal biomarkers of chronic stress. Psychoneuroendocrinology 2005;30:715‐23.
[169] Dekker MJ, Koper JW, van Aken MO, Pols HA, Hofman A, de Jong FH, Kirschbaum C, Witteman JC, Lamberts SW, Tiemeier H. Salivary cortisol is related to atherosclerosis of carotid arteries. J Clin Endocrinol Metab 2008.
[170] Daun JM, Ball RW, Cannon JG. Glucocorticoid sensitivity of interleukin‐1 agonist and antagonist secretion: the effects of age and gender. Am J Physiol Regul Integr Comp Physiol 2000;278:R855‐62.
[171] Willenberg HS, Path G, Vogeli TA, Scherbaum WA, Bornstein SR. Role of interleukin‐6 in stress response in normal and tumorous adrenal cells and during chronic inflammation. Ann N Y Acad Sci 2002;966:304‐14.
References
121
[172] Besedovsky H, del Rey A, Sorkin E, Dinarello CA. Immunoregulatory feedback between interleukin‐1 and glucocorticoid hormones. Science 1986;233:652‐4.
[173] Fantidis P, Perez De Prada T, Fernandez‐Ortiz A, Carcia‐Touchard A, Alfonso F, Sabate M, Hernandez R, Escaned J, Bauelos C, Macaya C. Morning cortisol production in coronary heart disease patients. Eur J Clin Invest 2002;32:304‐8.
[174] Nijm J, Kristenson M, Olsson AG, Jonasson L. Impaired cortisol response to acute stressors in patients with coronary disease. Implications for inflammatory activity. J Intern Med 2007;262:375‐84.
[175] Gross J, Lapiere CM. Collagenolytic activity in amphibian tissues: a tissue culture assay. Proc Natl Acad Sci U S A 1962;48:1014‐22.
[176] Nagai Y, Lapiere CM, Gross J. Tadpole collagenase. Preparation and purification. Biochemistry 1966;5:3123‐30.
[177] Nagase H, Visse R, Murphy G. Structure and function of matrix metalloproteinases and TIMPs. Cardiovasc Res 2006;69:562‐73.
[178] Nagase H, Barrett AJ, Woessner JF, Jr. Nomenclature and glossary of the matrix metalloproteinases. Matrix Suppl 1992;1:421‐4.
[179] Bode W, Fernandez‐Catalan C, Tschesche H, Grams F, Nagase H, Maskos K. Structural properties of matrix metalloproteinases. Cell Mol Life Sci 1999;55:639‐52.
[180] Woessner JF, Jr. Matrix metalloproteinases and their inhibitors in connective tissue remodeling. Faseb J 1991;5:2145‐54.
[181] Tayebjee MH, Nadar S, Blann AD, Gareth Beevers D, MacFadyen RJ, Lip GY. Matrix metalloproteinase‐9 and tissue inhibitor of metalloproteinase‐1 in hypertension and their relationship to cardiovascular risk and treatment: a substudy of the Anglo‐Scandinavian Cardiac Outcomes Trial (ASCOT). Am J Hypertens 2004;17:764‐9.
[182] Orbe J, Fernandez L, Rodriguez JA, Rabago G, Belzunce M, Monasterio A, Roncal C, Paramo JA. Different expression of MMPs/TIMP‐1 in human atherosclerotic lesions. Relation to plaque features and vascular bed. Atherosclerosis 2003;170:269‐76.
[183] Holven KB, Halvorsen B, Bjerkeli V, Damas JK, Retterstol K, Morkrid L, Ose L, Aukrust P, Nenseter MS. Impaired inhibitory effect of interleukin‐10 on the balance between matrix metalloproteinase‐9 and its inhibitor in mononuclear cells from hyperhomocysteinemic subjects. Stroke 2006;37:1731‐6.
References
122
[184] Timms PM, Mannan N, Hitman GA, Noonan K, Mills PG, Syndercombe‐Court D, Aganna E, Price CP, Boucher BJ. Circulating MMP9, vitamin D and variation in the TIMP‐1 response with VDR genotype: mechanisms for inflammatory damage in chronic disorders? Qjm 2002;95:787‐96.
[185] Nanni S, Melandri G, Hanemaaijer R, Cervi V, Tomasi L, Altimari A, Van Lent N, Tricoci P, Bacchi L, Branzi A. Matrix metalloproteinases in premature coronary atherosclerosis: influence of inhibitors, inflammation, and genetic polymorphisms. Transl Res 2007;149:137‐44.
[186] Opdenakker G, Van den Steen PE, Dubois B, Nelissen I, Van Coillie E, Masure S, Proost P, Van Damme J. Gelatinase B functions as regulator and effector in leukocyte biology. J Leukoc Biol 2001;69:851‐9.
[187] Sopata I, Wize J. A latent gelatin specific proteinase of human leucocytes and its activation. Biochim Biophys Acta 1979;571:305‐12.
[188] Valleala H, Hanemaaijer R, Mandelin J, Salminen A, Teronen O, Monkkonen J, Konttinen YT. Regulation of MMP‐9 (gelatinase B) in activated human monocyte/macrophages by two different types of bisphosphonates. Life Sci 2003;73:2413‐20.
[189] Brown DL, Hibbs MS, Kearney M, Loushin C, Isner JM. Identification of 92‐kD gelatinase in human coronary atherosclerotic lesions. Association of active enzyme synthesis with unstable angina. Circulation 1995;91:2125‐31.
[190] Gerlach RF, Demacq C, Jung K, Tanus‐Santos JE. Rapid separation of serum does not avoid artificially higher matrix metalloproteinase (MMP)‐9 levels in serum versus plasma. Clin Biochem 2007;40:119‐23.
[191] Fernandez‐Patron C, Martinez‐Cuesta MA, Salas E, Sawicki G, Wozniak M, Radomski MW, Davidge ST. Differential regulation of platelet aggregation by matrix metalloproteinases‐9 and ‐2. Thromb Haemost 1999;82:1730‐5.
[192] Bjorklund M, Koivunen E. Gelatinase‐mediated migration and invasion of cancer cells. Biochim Biophys Acta 2005;1755:37‐69.
[193] Liang KC, Lee CW, Lin WN, Lin CC, Wu CB, Luo SF, Yang CM. Interleukin‐1beta induces MMP‐9 expression via p42/p44 MAPK, p38 MAPK, JNK, and nuclear factor‐kappaB signaling pathways in human tracheal smooth muscle cells. J Cell Physiol 2007;211:759‐70.
[194] Lu Y, Wahl LM. Production of matrix metalloproteinase‐9 by activated human monocytes involves a phosphatidylinositol‐3 kinase/Akt/IKKalpha/NF‐kappaB pathway. J Leukoc Biol 2005;78:259‐65.
References
123
[195] Kalela A, Ponnio M, Koivu TA, Hoyhtya M, Huhtala H, Sillanaukee P, Nikkari ST. Association of serum sialic acid and MMP‐9 with lipids and inflammatory markers. Eur J Clin Invest 2000;30:99‐104.
[196] Welgus HG, Campbell EJ, Cury JD, Eisen AZ, Senior RM, Wilhelm SM, Goldberg GI. Neutral metalloproteinases produced by human mononuclear phagocytes. Enzyme profile, regulation, and expression during cellular development. J Clin Invest 1990;86:1496‐502.
[197] Aljada A, Ghanim H, Mohanty P, Hofmeyer D, Tripathy D, Dandona P. Hydrocortisone suppresses intranuclear activator‐protein‐1 (AP‐1) binding activity in mononuclear cells and plasma matrix metalloproteinase 2 and 9 (MMP‐2 and MMP‐9). J Clin Endocrinol Metab 2001;86:5988‐91.
[198] Eberhardt W, Schulze M, Engels C, Klasmeier E, Pfeilschifter J. Glucocorticoid‐mediated suppression of cytokine‐induced matrix metalloproteinase‐9 expression in rat mesangial cells: involvement of nuclear factor‐kappaB and Ets transcription factors. Mol Endocrinol 2002;16:1752‐66.
[199] Forster C, Kahles T, Kietz S, Drenckhahn D. Dexamethasone induces the expression of metalloproteinase inhibitor TIMP‐1 in the murine cerebral vascular endothelial cell line cEND. J Physiol 2007;580:937‐49.
[200] Blankenberg S, Rupprecht HJ, Poirier O, Bickel C, Smieja M, Hafner G, Meyer J, Cambien F, Tiret L. Plasma concentrations and genetic variation of matrix metalloproteinase 9 and prognosis of patients with cardiovascular disease. Circulation 2003;107:1579‐85.
[201] Kai H, Ikeda H, Yasukawa H, Kai M, Seki Y, Kuwahara F, Ueno T, Sugi K, Imaizumi T. Peripheral blood levels of matrix metalloproteases‐2 and ‐9 are elevated in patients with acute coronary syndromes. J Am Coll Cardiol 1998;32:368‐72.
[202] Loftus IM, Goodall S, Crowther M, Jones L, Bell PR, Naylor AR, Thompson MM. Increased MMP‐9 activity in acute carotid plaques: therapeutic avenues to prevent stroke. Ann N Y Acad Sci 1999;878:551‐4.
[203] Yasmin, McEniery CM, Wallace S, Dakham Z, Pulsalkar P, Maki‐Petaja K, Ashby MJ, Cockcroft JR, Wilkinson IB. Matrix metalloproteinase‐9 (MMP‐9), MMP‐2, and serum elastase activity are associated with systolic hypertension and arterial stiffness. Arterioscler Thromb Vasc Biol 2005;25:372.
[204] Derosa G, DʹAngelo A, Scalise F, Avanzini MA, Tinelli C, Peros E, Fogari E, Cicero AF. Comparison between metalloproteinases‐2 and ‐9
References
124
in healthy subjects, diabetics, and subjects with acute coronary syndrome. Heart Vessels 2007;22:361‐70.
[205] Kang MJ, Oh YM, Lee JC, Kim DG, Park MJ, Lee MG, Hyun IG, Han SK, Shim YS, Jung KS. Lung matrix metalloproteinase‐9 correlates with cigarette smoking and obstruction of airflow. J Korean Med Sci 2003;18:821‐7.
[206] Sillanaukee P, Kalela A, Seppa K, Hoyhtya M, Nikkari ST. Matrix metalloproteinase‐9 is elevated in serum of alcohol abusers. Eur J Clin Invest 2002;32:225‐9.
[207] Kingwell BA, Medley TL, Waddell TK, Cole TJ, Dart AM, Jennings GL. Large artery stiffness: structural and genetic aspects. Clin Exp Pharmacol Physiol 2001;28:1040‐3.
[208] Newby AC. Dual role of matrix metalloproteinases (matrixins) in intimal thickening and atherosclerotic plaque rupture. Physiol Rev 2005;85:1‐31.
[209] Herrmann J, Lerman LO, Mukhopadhyay D, Napoli C, Lerman A. Angiogenesis in atherogenesis. Arterioscler Thromb Vasc Biol 2006;26:1948‐57.
[210] Newby AC. Do metalloproteinases destabilize vulnerable atherosclerotic plaques? Curr Opin Lipidol 2006;17:556‐61.
[211] Galis ZS, Sukhova GK, Lark MW, Libby P. Increased expression of matrix metalloproteinases and matrix degrading activity in vulnerable regions of human atherosclerotic plaques. J Clin Invest 1994;94:2493‐503.
[212] Galis ZS, Asanuma K, Godin D, Meng X. N‐acetyl‐cysteine decreases the matrix‐degrading capacity of macrophage‐derived foam cells: new target for antioxidant therapy? Circulation 1998;97:2445‐53.
[213] Nikkari ST, Hoyhtya M, Isola J, Nikkari T. Macrophages contain 92‐kd gelatinase (MMP‐9) at the site of degenerated internal elastic lamina in temporal arteritis. Am J Pathol 1996;149:1427‐33.
[214] Johansson N, Ahonen M, Kahari VM. Matrix metalloproteinases in tumor invasion. Cell Mol Life Sci 2000;57:5‐15.
[215] Hanemaaijer R, Sier CF, Visser H, Scholte L, van Lent N, Toet K, Hoekman K, Verheijen JH. MMP‐9 activity in urine from patients with various tumors, as measured by a novel MMP activity assay using modified urokinase as a substrate. Ann N Y Acad Sci 1999;878:141‐9.
[216] Folkman J. Angiogenesis. Annu Rev Med 2006;57:1‐18. [217] Westermarck J, Kahari VM. Regulation of matrix metalloproteinase
expression in tumor invasion. Faseb J 1999;13:781‐92.
References
125
[218] Ram M, Sherer Y, Shoenfeld Y. Matrix metalloproteinase‐9 and autoimmune diseases. J Clin Immunol 2006;26:299‐307.
[219] Tchetverikov I, Lard LR, DeGroot J, Verzijl N, TeKoppele JM, Breedveld FC, Huizinga TW, Hanemaaijer R. Matrix metalloproteinases‐3, ‐8, ‐9 as markers of disease activity and joint damage progression in early rheumatoid arthritis. Ann Rheum Dis 2003;62:1094‐9.
[220] Weckroth M, Vaheri A, Lauharanta J, Sorsa T, Konttinen YT. Matrix metalloproteinases, gelatinase and collagenase, in chronic leg ulcers. J Invest Dermatol 1996;106:1119‐24.
[221] Pilcher BK, Wang M, Qin XJ, Parks WC, Senior RM, Welgus HG. Role of matrix metalloproteinases and their inhibition in cutaneous wound healing and allergic contact hypersensitivity. Ann N Y Acad Sci 1999;878:12‐24.
[222] Uemura S, Matsushita H, Li W, Glassford AJ, Asagami T, Lee KH, Harrison DG, Tsao PS. Diabetes mellitus enhances vascular matrix metalloproteinase activity: role of oxidative stress. Circ Res 2001;88:1291‐8.
[223] Boden G, Song W, Pashko L, Kresge K. In vivo effects of insulin and free fatty acids on matrix metalloproteinases in rat aorta. Diabetes 2008;57:476‐83.
[224] Xue M, Thompson PJ, Clifton‐Bligh R, Fulcher G, Gallery ED, Jackson C. Leukocyte matrix metalloproteinase‐9 is elevated and contributes to lymphocyte activation in type I diabetes. Int J Biochem Cell Biol 2005;37:2406‐16.
[225] Sampson M, Davies I, Gavrilovic J, Sussams B, Brown J, Astley S, Hughes DA. Plasma matrix metalloproteinases, low density lipoprotein oxidisability and soluble adhesion molecules after a glucose load in Type 2 diabetes. Cardiovasc Diabetol 2004;3:7.
[226] Lee SW, Song KE, Shin DS, Ahn SM, Ha ES, Kim DJ, Nam MS, Lee KW. Alterations in peripheral blood levels of TIMP‐1, MMP‐2, and MMP‐9 in patients with type‐2 diabetes. Diabetes Res Clin Pract 2005;69:175‐9.
[227] Friedhoff AJ, Miller JC. Clinical implications of receptor sensitivity modification. Annu Rev Neurosci 1983;6:121‐48.
[228] Stark JL, Avitsur R, Padgett DA, Campbell KA, Beck FM, Sheridan JF. Social stress induces glucocorticoid resistance in macrophages. Am J Physiol Regul Integr Comp Physiol 2001;280:R1799‐805.
[229] Adams DO. Molecular biology of macrophage activation: a pathway whereby psychosocial factors can potentially affect health. Psychosom Med 1994;56:316‐27.
References
126
[230] Miller GE, Chen E, Sze J, Marin T, Arevalo JM, Doll R, Ma R, Cole SW. A Functional Genomic Fingerprint of Chronic Stress in Humans: Blunted Glucocorticoid and Increased NF‐kappaB Signaling. Biol Psychiatry 2008.
[231] Raison CL, Miller AH. When not enough is too much: the role of insufficient glucocorticoid signaling in the pathophysiology of stress‐related disorders. Am J Psychiatry 2003;160:1554‐65.
[232] Peasey A, Bobak M, Kubinova R, Malyutina S, Pajak A, Tamosiunas A, Pikhart H, Nicholson A, Marmot M. Determinants of cardiovascular disease and other non‐communicable diseases in Central and Eastern Europe: rationale and design of the HAPIEE study. BMC Public Health 2006;6:255.
[233] Persson LG, Lindstrom K, Lingfors H, Bengtsson C. A study of men aged 33‐42 in Habo, Sweden with special reference to cardiovascular risk factors. Design, health profile and characteristics of participants and non‐participants. Scand J Soc Med 1994;22:264‐72.
[234] De Backer G, Ambrosioni E, Borch‐Johnsen K, Brotons C, Cifkova R, Dallongeville J, Ebrahim S, Faergeman O, Graham I, Mancia G, Cats VM, Orth‐Gomer K, Perk J, Pyorala K, Rodicio JL, Sans S, Sansoy V, Sechtem U, Silber S, Thomsen T, Wood D. European guidelines on cardiovascular disease and prevention in clinical practice. Atherosclerosis 2003;171:145‐55.
[235] Thomsen TF, Davidsen M, Ibsen H, Jorgensen T, Jensen G, Borch‐Johnsen K. A new method for CHD prediction and prevention based on regional risk scores and randomized clinical trials; PRECARD and the Copenhagen Risk Score. J Cardiovasc Risk 2001;8:291‐7.
[236] Friedewald WT, Levy RI, Fredrickson DS. Estimation of the concentration of low‐density lipoprotein cholesterol in plasma, without use of the preparative ultracentrifuge. Clin Chem 1972;18:499‐502.
[237] Khani BR, Ye W, Terry P, Wolk A. Reproducibility and validity of major dietary patterns among Swedish women assessed with a food‐frequency questionnaire. J Nutr 2004;134:1541‐5.
[238] Kallings LV, Leijon M, Hellenius ML, Stahle A. Physical activity on prescription in primary health care: a follow‐up of physical activity level and quality of life. Scand J Med Sci Sports 2007.
[239] Appels A, Mulder P. Excess fatigue as a precursor of myocardial infarction. Eur Heart J 1988;9:758‐64.
References
127
[240] Barefoot JC, Dodge KA, Peterson BL, Dahlstrom WG, Williams RB, Jr. The Cook‐Medley hostility scale: item content and ability to predict survival. Psychosom Med 1989;51:46‐57.
[241] Sjogren E, Leanderson P, Kristenson M, Ernerudh J. Interleukin‐6 levels in relation to psychosocial factors: Studies on serum, saliva, and in vitro production by blood mononuclear cells. Brain Behav Immun 2005.
[242] Suarez EC. Plasma interleukin‐6 is associated with psychological coronary risk factors: moderation by use of multivitamin supplements. Brain Behav Immun 2003;17:296‐303.
[243] Henderson S, Duncan‐Jones P, Byrne DG, Scott R. Measuring social relationships. The Interview Schedule for Social Interaction. Psychol Med 1980;10:723‐34.
[244] Orth‐Gomer K, Unden AL. The measurement of social support in population surveys. Soc Sci Med 1987;24:83‐94.
[245] Sarason IG, Sarason BR (1985) Social support : theory, research and applications : proceedings of the NATO advanced research workshop on Social support ..., Chateau de Bonas, France, September 19‐23, 1983 (NATO Advanced Study Institutes series. Series D, Behavioural and social sciences, 24, 1985, pp. xiii, 519, Nijhoff in coop. with NATO scientific affairs division, Dordrecht.
[246] Hobfoll SE, Walfisch S. Coping with a threat to life: a longitudinal study of self‐concept, social support, and psychological distress. Am J Community Psychol 1984;12:87‐100.
[247] Antonovsky A (1987) Unraveling the mystery of health : how people manage stress and stay well, 1987, pp. xx, 218 p., Jossey‐Bass, San Francisco.
[248] Eriksson M, Lindstrom B. Validity of Antonovskyʹs sense of coherence scale: a systematic review. J Epidemiol Community Health 2005;59:460‐6.
[249] Barefoot JC, Dahlstrom WG, Williams RB, Jr. Hostility, CHD incidence, and total mortality: a 25‐year follow‐up study of 255 physicians. Psychosom Med 1983;45:59‐63.
[250] Barefoot JC, Larsen S, von der Lieth L, Schroll M. Hostility, incidence of acute myocardial infarction, and mortality in a sample of older Danish men and women. Am J Epidemiol 1995;142:477‐84.
[251] Shekelle RB, Gale M, Ostfeld AM, Paul O. Hostility, risk of coronary heart disease, and mortality. Psychosom Med 1983;45:109‐14.
References
128
[252] Radloff L. The CES‐D Scale. A Self‐Report Depression Scale for Research in the General Population. Applied Psychological Measures 1977;1:385‐401.
[253] Appels A, Hoppener P, Mulder P. A questionnaire to assess premonitory symptoms of myocardial infarction. Int J Cardiol 1987;17:15‐24.
[254] Kirschbaum C, Hellhammer DH. Salivary cortisol in psychoneuroendocrine research: recent developments and applications. Psychoneuroendocrinology 1994;19:313‐33.
[255] Aardal E, Holm AC. Cortisol in saliva‐‐reference ranges and relation to cortisol in serum. Eur J Clin Chem Clin Biochem 1995;33:927‐32.
[256] Garde AH, Hansen AM. Long‐term stability of salivary cortisol. Scand J Clin Lab Invest 2005;65:433‐6.
[257] Kovanen PT, Kaartinen M, Paavonen T. Infiltrates of activated mast cells at the site of coronary atheromatous erosion or rupture in myocardial infarction. Circulation 1995;92:1084‐8.
[258] Fukuda D, Shimada K, Tanaka A, Kusuyama T, Yamashita H, Ehara S, Nakamura Y, Kawarabayashi T, Iida H, Yoshiyama M, Yoshikawa J. Comparison of levels of serum matrix metalloproteinase‐9 in patients with acute myocardial infarction versus unstable angina pectoris versus stable angina pectoris. Am J Cardiol 2006;97:175‐80.
[259] Saren P, Welgus HG, Kovanen PT. TNF‐alpha and IL‐1beta selectively induce expression of 92‐kDa gelatinase by human macrophages. J Immunol 1996;157:4159‐65.
[260] Yang EV, Sood AK, Chen M, Li Y, Eubank TD, Marsh CB, Jewell S, Flavahan NA, Morrison C, Yeh PE, Lemeshow S, Glaser R. Norepinephrine up‐regulates the expression of vascular endothelial growth factor, matrix metalloproteinase (MMP)‐2, and MMP‐9 in nasopharyngeal carcinoma tumor cells. Cancer Res 2006;66:10357‐64.
[261] Rouy D, Ernens I, Jeanty C, Wagner DR. Plasma storage at ‐80 degrees C does not protect matrix metalloproteinase‐9 from degradation. Anal Biochem 2005;338:294‐8.
[262] Sundstrom J, Evans JC, Benjamin EJ, Levy D, Larson MG, Sawyer DB, Siwik DA, Colucci WS, Sutherland P, Wilson PW, Vasan RS. Relations of plasma matrix metalloproteinase‐9 to clinical cardiovascular risk factors and echocardiographic left ventricular measures: the Framingham Heart Study. Circulation 2004;109:2850‐6.
[263] Abe N, Osanai T, Fujiwara T, Kameda K, Matsunaga T, Okumura K. C‐reactive protein‐induced upregulation of extracellular matrix
References
129
metalloproteinase inducer in macrophages: inhibitory effect of fluvastatin. Life Sci 2006;78:1021‐8.
[264] Singh U, Dasu MR, Yancey PG, Afify A, Devaraj S, Jialal I. Human C‐reactive protein promotes oxidized low density lipoprotein uptake and matrix metalloproteinase‐9 release in Wistar rats. J Lipid Res 2008;49:1015‐23.
[265] Nabata A, Kuroki M, Ueba H, Hashimoto S, Umemoto T, Wada H, Yasu T, Saito M, Momomura S, Kawakami M. C‐reactive protein induces endothelial cell apoptosis and matrix metalloproteinase‐9 production in human mononuclear cells: Implications for the destabilization of atherosclerotic plaque. Atherosclerosis 2008;196:129‐35.
[266] Kaysen GA, Levin NW, Mitch WE, Chapman AL, Kubala L, Eiserich JP. Evidence that C‐reactive protein or IL‐6 are not surrogates for all inflammatory cardiovascular risk factors in hemodialysis patients. Blood Purif 2006;24:508‐16.
[267] Nabi H, Singh‐Manoux A, Shipley M, Gimeno D, Marmot MG, Kivimaki M. Do psychological factors affect inflammation and incident coronary heart disease: the Whitehall II Study. Arterioscler Thromb Vasc Biol 2008;28:1398‐406.
[268] Kuo HK, Yen CJ, Chang CH, Kuo CK, Chen JH, Sorond F. Relation of C‐reactive protein to stroke, cognitive disorders, and depression in the general population: systematic review and meta‐analysis. Lancet Neurol 2005;4:371‐80.
[269] Gidron Y, Ronson A. Psychosocial factors, biological mediators, and cancer prognosis: a new look at an old story. Curr Opin Oncol 2008;20:386‐92.
[270] Cutolo M, Sulli A, Pizzorni C, Craviotto C, Straub RH. Hypothalamic‐pituitary‐adrenocortical and gonadal functions in rheumatoid arthritis. Ann N Y Acad Sci 2003;992:107‐17.
[271] Evers AW, Kraaimaat FW, Geenen R, Jacobs JW, Bijlsma JW. Stress‐vulnerability factors as long‐term predictors of disease activity in early rheumatoid arthritis. J Psychosom Res 2003;55:293‐302.
[272] Kunitz SJ. Holism and the idea of general susceptibility to disease. Int J Epidemiol 2002;31:722‐9.
[273] Västra Götalandsregionen (2006) Hälsa på lika villkor i Västra Götaland 2005? : resultat från den nationella folkhälsoenkäten, 2006, pp. 69, 15, Västra Götalandsregionen, Sverige.
References
130
[274] Wenemark M, Folkhälsovetenskapligt centrum (2007) Östgötens hälsa 2006 : metodrapport, 2007, pp. 36, Folkhälsovetenskapligt centrum i Östergötland, Linköping.
[275] Tolonen H, Dobson A, Kulathinal S. Effect on trend estimates of the difference between survey respondents and non‐respondents: results from 27 populations in the WHO MONICA Project. Eur J Epidemiol 2005;20:887‐98.
[276] Okura Y, Urban LH, Mahoney DW, Jacobsen SJ, Rodeheffer RJ. Agreement between self‐report questionnaires and medical record data was substantial for diabetes, hypertension, myocardial infarction and stroke but not for heart failure. J Clin Epidemiol 2004;57:1096‐103.
[277] Thrailkill K, Cockrell G, Simpson P, Moreau C, Fowlkes J, Bunn RC. Physiological matrix metalloproteinase (MMP) concentrations: comparison of serum and plasma specimens. Clin Chem Lab Med 2006;44:503‐4.
[278] Jung K. Serum or plasma: what kind of blood sample should be used to measure circulating matrix metalloproteinases and their inhibitors? J Neuroimmunol 2005;162:1‐2.
[279] Thoits PA. Social support as coping assistance. J Consult Clin Psychol 1986;54:416‐23.
[280] McColl MA, Lei H, Skinner H. Structural relationships between social support and coping. Soc Sci Med 1995;41:395‐407.
[281] Irvine J, Basinski A, Baker B, Jandciu S, Paquette M, Cairns J, Connolly S, Roberts R, Gent M, Dorian P. Depression and risk of sudden cardiac death after acute myocardial infarction: testing for the confounding effects of fatigue. Psychosom Med 1999;61:729‐37.
[282] van Diest R, Appels A. Vital exhaustion and depression: a conceptual study. J Psychosom Res 1991;35:535‐44.
[283] Kopp MS, Falger PR, Appels A, Szedmak S. Depressive symptomatology and vital exhaustion are differentially related to behavioral risk factors for coronary artery disease. Psychosom Med 1998;60:752‐8.
[284] Spijkerman TA, van den Brink RH, Jansen JH, Crijns HJ, Ormel J. Who is at risk of post‐MI depressive symptoms? J Psychosom Res 2005;58:425‐32; discussion 433‐4.
[285] McGowan L, Dickens C, Percival C, Douglas J, Tomenson B, Creed F. The relationship between vital exhaustion, depression and comorbid illnesses in patients following first myocardial infarction. J Psychosom Res 2004;57:183‐8.

References
131
[286] Raynor DA, Pogue‐Geile MF, Kamarck TW, McCaffery JM, Manuck SB. Covariation of psychosocial characteristics associated with cardiovascular disease: genetic and environmental influences. Psychosom Med 2002;64:191‐203; discussion 204‐5.
[287] Suarez EC. Joint effect of hostility and severity of depressive symptoms on plasma interleukin‐6 concentration. Psychosom Med 2003;65:523‐7.
[288] Kubzansky LD, Cole SR, Kawachi I, Vokonas P, Sparrow D. Shared and unique contributions of anger, anxiety, and depression to coronary heart disease: a prospective study in the normative aging study. Ann Behav Med 2006;31:21‐9.

132
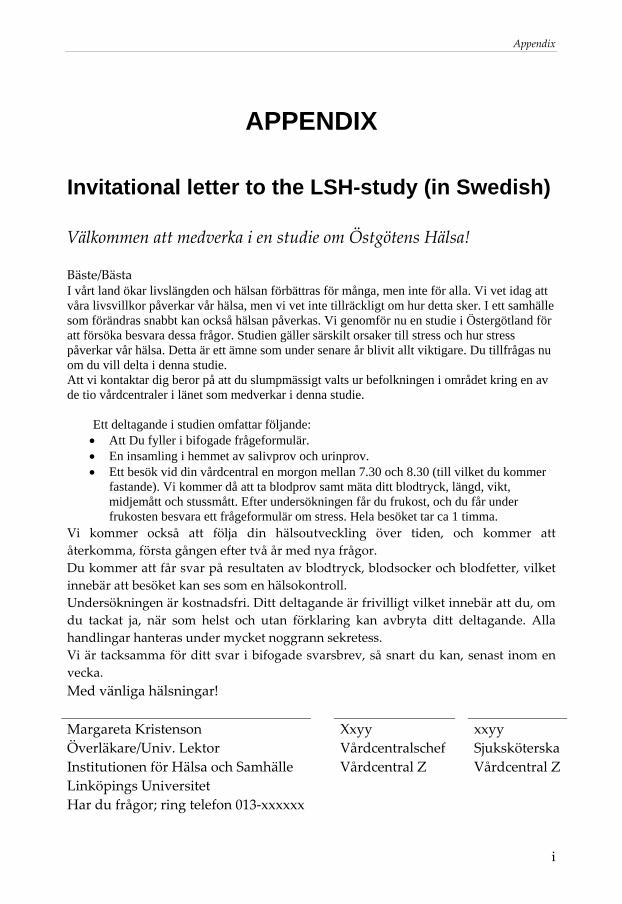
Appendix
i
APPENDIX
Invitational letter to the LSH-study (in Swedish)
Välkommen att medverka i en studie om Östgötens Hälsa! Bäste/Bästa I vårt land ökar livslängden och hälsan förbättras för många, men inte för alla. Vi vet idag att våra livsvillkor påverkar vår hälsa, men vi vet inte tillräckligt om hur detta sker. I ett samhälle som förändras snabbt kan också hälsan påverkas. Vi genomför nu en studie i Östergötland för att försöka besvara dessa frågor. Studien gäller särskilt orsaker till stress och hur stress påverkar vår hälsa. Detta är ett ämne som under senare år blivit allt viktigare. Du tillfrågas nu om du vill delta i denna studie. Att vi kontaktar dig beror på att du slumpmässigt valts ur befolkningen i området kring en av de tio vårdcentraler i länet som medverkar i denna studie.
Ett deltagande i studien omfattar följande: • Att Du fyller i bifogade frågeformulär. • En insamling i hemmet av salivprov och urinprov. • Ett besök vid din vårdcentral en morgon mellan 7.30 och 8.30 (till vilket du kommer
fastande). Vi kommer då att ta blodprov samt mäta ditt blodtryck, längd, vikt, midjemått och stussmått. Efter undersökningen får du frukost, och du får under frukosten besvara ett frågeformulär om stress. Hela besöket tar ca 1 timma.
Vi kommer också att följa din hälsoutveckling över tiden, och kommer att återkomma, första gången efter två år med nya frågor. Du kommer att får svar på resultaten av blodtryck, blodsocker och blodfetter, vilket innebär att besöket kan ses som en hälsokontroll. Undersökningen är kostnadsfri. Ditt deltagande är frivilligt vilket innebär att du, om du tackat ja, när som helst och utan förklaring kan avbryta ditt deltagande. Alla handlingar hanteras under mycket noggrann sekretess. Vi är tacksamma för ditt svar i bifogade svarsbrev, så snart du kan, senast inom en vecka. Med vänliga hälsningar! Margareta Kristenson Överläkare/Univ. Lektor Institutionen för Hälsa och Samhälle Linköpings Universitet
Xxyy Vårdcentralschef Vårdcentral Z
xxyy Sjuksköterska Vårdcentral Z
Har du frågor; ring telefon 013‐xxxxxx

Appendix
ii
Orth-Gomér’s Availibility of Emotional support
Principal construct of instrument: No Yes
Item 1 to 6
Scoring of positive statements with two alternatives (all items)
0 1
Items in questionnaire: Do you have
1. Someone special whom you can lean on? 2. Someone who feels very close to you? 3. Someone to share your feelings with? 4. Someone to confide in? 5. Someone to hold and comfort you? 6. Someone at home who really appreciates what you do for him/her?

Appendix
iii
Orth-Gomér’s Availability of Social integration
Principal construct of instrument: None 1‐2 3‐5 6‐10 11‐15 More
than 15 Item 1 to 6
Scoring of positive statements (all items)
1 2 3 4 5 6
Items in questionnaire: 1. Number of people with whom you share interests. 2. Number of people met during an ordinary week. 3. Number of friend who at anytime can come and visit your
home who would not embarrassed if it were untidy. 4. Number of friends or family members with whom you can
talk frankly. 5. Someone available whom you can ask small favors. 6. Someone available – apart from family‐ to whom you can turn
in times of difficulties.

Appendix
iv
Pearlin’s Mastery scale
Principal construct of instrument: Not at
all To a minor extent
To some extent
To a major extent
Item 1 to 7
Scoring of positive statements (2 items)
1 2 3 4
Scoring of negative statements (5 items)
4 3 2 1
Items in questionnaire: To what extent are the following statements accurate for you?
1. There is really no way I can solve some of the problems I have. 2. Sometimes I feel that I’m being pushed around in life. 3. I have little control over the things that happen to me. 4. .I can do just about anything I really set my mind to do. 5. I often feel helpless in dealing with the problems of life. 6. What happens to me in the future mostly depends on me. 7. There is little I can do to change many of the important things in my
life.

Appendix
v
Pearlin’s Self-esteem scale
Principal construct of instrument: Not at
all To a minor extent
To some extent
To a major extent
Item 1 to 7
Scoring of positive statements (5 items)
1 2 3 4
Scoring of negative statements (5 items)
4 3 2 1
Items in questionnaire: To what extent do you agree to the following statements?
1. I feel that I’m a person of worth, at least on an equal plane with others.
2. I feel that I have a number of good qualities. 3. All in all, I am inclined to feel that I’m a failure. 4. I am able to do things as well as most other people. 5. I feel I do not have much to be proud of. 6. I take a positive attitude toward myself. 7. On the whole, I am satisfied with myself. 8. I certainly feel useless at times. 9. I wish I could have more respect for myself. 10. At times I think I am no good at all.

Appendix
vi
Antonovsky’s Sense of coherence
Principal construct of instrument: Lowest
alternative Highest
alternative Item 1 to 13
Scoring of positive statements (8 items)
1 2 3 4 5 6 7
Scoring of negative statements (5 items)
7 6 5 4 3 2 1
Items in questionnaire: Considering the last couple of months::
1. Do you have the feeling that you don’t really care about what goes around on you? [Very seldom or Never] vs. [All the time]
2. Has it happened in the past that you were surprised by the behaviour of people whom you thought you knew well? [ It has never happened] vs. [Many times]
3. Has it happened that people whom you counted on disappointed you? [ It has never happened] vs. [Many times]
4. Until now your life has had… [no clear goals or purpose at all] vs. [very clear goals and purposes]
5. Do you have the feeling that you are treated unfairly? [All the time] vs. [Very seldom or Never]
6. Do you have the feeling that you are in an unfamiliar situation and don’t know what to do? [All the time] vs. [Very seldom or Never]
7. Doing the things you do every day is… [A source of deep pleasure and satisfaction] vs. [A source of pain and boredom]
8. Do you have very mixed‐up feelings and ideas? [All the time] vs. [Very seldom or Never]
9. Does it happen that you have feelings inside you would rather not feel? [All the time] vs. [Very seldom or Never]
10. Many people – even those with a strong character – sometimes feel like sad sacks (losers) in certain situations. How often have you felt this way in the past? [Never] vs. [All the time]
11. When something happened, have you generally found that…? [You overestimated or underestimated its importance] vs. [You saw the things in its right proportions] continued on next page
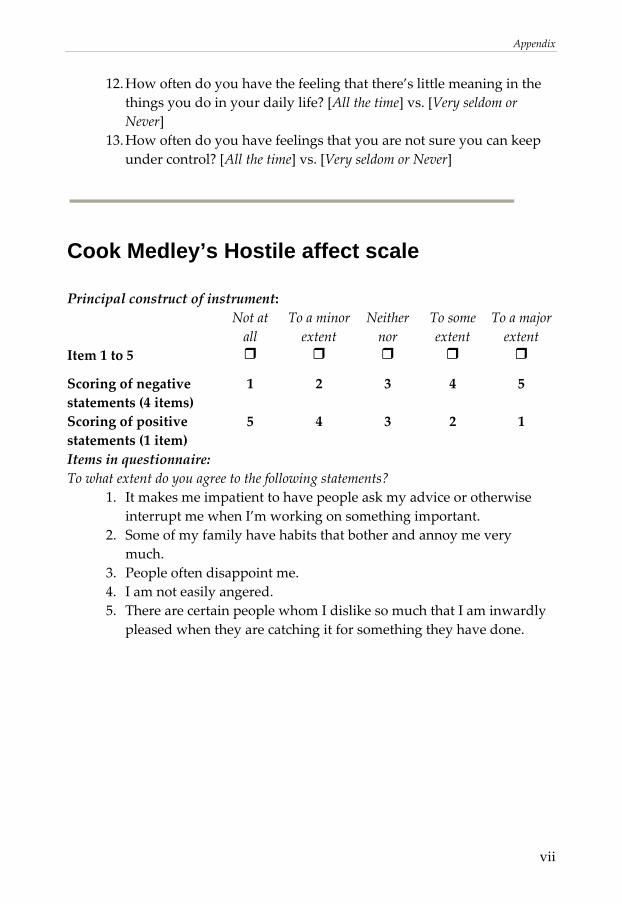
Appendix
vii
12. How often do you have the feeling that there’s little meaning in the things you do in your daily life? [All the time] vs. [Very seldom or Never]
13. How often do you have feelings that you are not sure you can keep under control? [All the time] vs. [Very seldom or Never]
Cook Medley’s Hostile affect scale
Principal construct of instrument: Not at
all To a minor extent
Neither nor
To some extent
To a major extent
Item 1 to 5
Scoring of negative statements (4 items)
1 2 3 4 5
Scoring of positive statements (1 item)
5 4 3 2 1
Items in questionnaire: To what extent do you agree to the following statements?
1. It makes me impatient to have people ask my advice or otherwise interrupt me when I’m working on something important.
2. Some of my family have habits that bother and annoy me very much.
3. People often disappoint me. 4. I am not easily angered. 5. There are certain people whom I dislike so much that I am inwardly
pleased when they are catching it for something they have done.

Appendix
viii
Cook-Medley’s Cynicism scale
Principal construct of instrument: Not at
all To a minor extent
Neither nor
To some extent
To a major extent
Item 1 to 12
Scoring of negative statements (all items)
1 2 3 4 5
Items in questionnaire: To what extent do you agree to the following statements?
1. I have often had to take orders from someone who did not know as much as I did.
2. I think a great many people exaggerate their misfortunes in order to gain the sympathy and help of others.
3. It takes a lot of argument to convince most people of the truth. 4. I think most people would lie to get ahead. 5. Most people are honest chiefly through fear of being caught. 6. Most people will use somewhat unfair means to get profit or an
advantage rather than to lose it. 7. No one cares much what happens to you. 8. It is safer to trust nobody. 9. Most people make friends because friends are likely to be useful to
them. 10. Most people inwardly dislike putting themselves out to help other
people. 11. I have often met people who were supposed to be experts who were
no better than I. 12. People generally demand more respect for their own rights than
they are willing to allow for others.

Appendix
ix
Centre for Epidemiological Studies Depression scale
Principal construct of instrument: Less than
one day 1‐2 days
3‐4 days
5‐7 days
Item 1 to 20
Scoring of negative statements (16 items): 0 1 2 3
Scoring of positive statements (4 items): 3 2 1 0
Items in questionnaire: During the past week:
1. I was bothered by things that do not usually bother me. 2. I did not feel like eating; my appetite was poor. 3. I felt that I could not shake off the blues even with help from my family
or friends. 4. I felt I was just as good as other people. 5. I had trouble keeping my mind on what I was doing. 6. I felt depressed. 7. I felt that everything I did was an effort. 8. I felt hopeful about the future. 9. I thought my life had been a failure. 10. I felt fearful. 11. My sleep was restless. 12. I was happy. 13. I talked less than usual. 14. I felt lonely. 15. People were unfriendly. 16. I enjoyed life. 17. I had crying spells. 18. I felt sad. 19. I felt that people dislike me. 20. I could not get “going”.

Appendix
x
Maastricht Questionnaire of Vital exhaustion
Principal construct of instrument: Never Sometimes Often
Item 1 to 19
Scoring of negative statements (all items) 1 2 3 Items in questionnaire: Considering the last couple of months:
1. Do you often feel tired? 2. Have you felt less confident lately? 3. Do you have a feeling that you haven’t accomplished much lately? 4. Do you believe that you have come to a “dead end”? 5. Do you feel more listless recently than before? 6. Do you have the feeling that you can’t cope with everyday problems as
well as you used to? 7. Do you sometimes feel like your body is like a battery losing its power? 8. Do you feel cast down? 9. Do you feel like you are losing your self‐restraint? 10. Have you ever had e feeling lately, like “I do not achieve enough, I
could achieve more if only I were healthier, not so weak, not so limp? 11. Have you noticed lately that it takes a longer time than before to “get
going”? 12. Do you lately think more often about acquaintances or relatives that are
deceased? 13. Do you have e feeling that nobody can help you with those problems
deep inside? 14. Are you becoming less satisfied with yourself? 15. Do you feel less capable of doing something useful these days? 16. Do minor hassles irritate you easily in these days? 17. Would you want to be dead at times? 18. Can you bring yourself less and less to leave the house and go for a
visit? 19. Do you have the feeling these days that you don’t have what it takes
anymore?