A Biochemical Model of Matrix Metalloproteinase 9 Activation and Inhibition * □ S
13
A Biochemical Model of Matrix Metalloproteinase 9 Activation and Inhibition * □ S Received for publication, December 15, 2006, and in revised form, September 7, 2007 Published, JBC Papers in Press, September 11, 2007, DOI 10.1074/jbc.M611500200 Prakash Vempati 1 , Emmanouil D. Karagiannis, and Aleksander S. Popel From the Department of Biomedical Engineering, School of Medicine, The Johns Hopkins University, Baltimore, Maryland 21205 Matrix metalloproteinases (MMPs) are a class of extracellular and membrane-bound proteases involved in an array of physio- logical processes, including angiogenesis. We present a detailed computational model of MMP9 activation and inhibition. Our model is validated to existing biochemical experimental data. We determine kinetic rate constants for the processes of MMP9 activation by MMP3, MMP10, MMP13, and trypsin; inhibition by the tissue inhibitors of metalloproteinases (TIMPs) 1 and 2; and MMP9 deactivation. This computational approach allows us to investigate discrepancies in our understanding of the inter- action of MMP9 with TIMP1. Specifically, we find that inhibi- tion due to a single binding event cannot describe MMP9 inhi- bition by TIMP1. Temporally accurate biphasic inhibition requires either an additional isomerization step or a second lower affinity isoform of MMP9. We also theoretically charac- terize the MMP3/TIMP2/pro-MMP9 and MMP3/TIMP1/pro- MMP9 systems. We speculate that these systems differ signifi- cantly in their time scales of activation and inhibition such that MMP9 is able to temporarily overshoot its final equilibrium value in the latter. Our numerical simulations suggest that the ability of pro-MMP9 to complex TIMP1 increases this over- shoot. In all, our analysis serves as a summary of existing kinetic data for MMP9 and a foundation for future models utilizing MMP9 or other MMPs under physiologically well defined microenvironments. Matrix metalloproteinase 9 (MMP9) 2 is a zinc-dependent endopeptidase that participates in a variety of physiological and biochemical processes (1, 2). In angiogenesis, MMP9 has been shown to play a part in the degradation of basement mem- branes through its type IV collagenase activity (3), creation of bioactive molecules such as angiostatin by cleavage of plasmin- ogen (4), and the release of growth factors such as vascular endothelial growth factor-A sequestered on extracellular matrix heparin sulfate proteoglycans (5–7). To quantify the existing biochemical data and help understand properties of MMP activation cascades, we have constructed a biochemically accurate numerical model of the post-secretional regulation of MMP9. Specifically, we have used existing experimental data to kinetically characterize mechanistic models of the MMP9 reac- tion network (e.g. Fig. 1). MMP9 enters this model (post-secretion) as a glycosylated latent enzyme (pro-MMP9) at a molecular mass of 92 kDa. From experimental studies, MMP9 is known to undergo acti- vation, inhibition by tissue inhibitors of metalloproteinases (TIMPs), and possibly post-activation processing, including C-terminal processing and deactivation. In this approach, we have not studied the proteolytic action elicited by MMP9. A vast quantity of literature exists to create detailed models of activation and inhibition; however, C-terminal processing and MMP9 deactivation are less studied or accepted. In general, MMP latency is maintained by an N-terminal prodomain that masks the Zn 2 -dependent active site. The structure of the active molecule and the specific rate of activa- tion depend on the exact mode of activation, but in all cases they require conformational unwinding in the catalytic domain. By far, the most studied mode of MMP9 activation is enzyme proteolysis of the pro-MMP9 prodomain. Confirmed in vitro activators of MMP9 include MMP2 (8), MMP3 (9), MMP7 (10), MMP10 (11), MMP13 (12), and the serine protease trypsin (13). MMP3 is generally regarded as the most potent activator of MMP9. Here, MMP9 is processed via an interme- diate of 86 kDa (processing at Glu 59 –Met 60 ), which relaxes to expose the second processing site (Arg 106 –Phe 107 ) leading to the well established 82-kDa isoform. Evidence also supports nonproteolytic modes of activation, e.g. via conformational changes contingent on substrate binding (14). Post-activation processing for MMP9 can further involve removal of the C-ter- minal hemopexin-like domain, leading to an 65-kDa species (MMP9C), or can involve direct cleavage in the active domain producing an 50 – 60-kDa inactive species (15). Thus, MMP9 is typically processed from 92 to 86 kDa and 82, 65, and 50 – 60 kDa. A distinct feature of MMP9 is its ability to form proenzyme complexes with TIMP1 (pro-MMP9TIMP1) and to form dimers with other MMPs, including the MMP9MMP1 heterodimer (16) and MMP9MMP9 homodimer (17). Once activated, MMP9 is subject to inhibition by TIMPs resulting from binding of the N-terminal domain of a TIMP to the active site cleft in MMP9. Our understanding of MMP9 inhibition is incomplete. First, MMP9 is found as active iso- forms at both 82 and 65 kDa, but the 65-kDa isoform lacks the hemopexin-like domain, which is generally recognized to increase the rate of MMP9 inhibition by TIMP1 (18). We do not * This work was supported by NHLBI Grants RO1 HL079653 and R33 HL087351 from the National Institutes of Health. The costs of publication of this article were defrayed in part by the payment of page charges. This article must therefore be hereby marked “advertisement” in accordance with 18 U.S.C. Section 1734 solely to indicate this fact. □ S The on-line version of this article (available at http://www.jbc.org) contains supplemental text, Figs. S1–S3, and additional references. 1 To whom correspondence should be addressed: Dept. of Biomedical Engi- neering, School of Medicine, The Johns Hopkins University, 613 Traylor Bldg., 720 Rutland Ave., Baltimore, MD 21205. Tel.: 410-955-1787; Fax: 410- 614-8796; E-mail: [email protected]. 2 The abbreviations used are: MMP9, matrix metalloproteinase 9; TIMP, tissue inhibitors of metalloproteinase. THE JOURNAL OF BIOLOGICAL CHEMISTRY VOL. 282, NO. 52, pp. 37585–37596, December 28, 2007 © 2007 by The American Society for Biochemistry and Molecular Biology, Inc. Printed in the U.S.A. DECEMBER 28, 2007 • VOLUME 282 • NUMBER 52 JOURNAL OF BIOLOGICAL CHEMISTRY 37585 by guest on January 28, 2015 http://www.jbc.org/ Downloaded from
-
Upload
independent -
Category
Documents
-
view
0 -
download
0
Transcript of A Biochemical Model of Matrix Metalloproteinase 9 Activation and Inhibition * □ S

A Biochemical Model of Matrix Metalloproteinase 9Activation and Inhibition*□S
Received for publication, December 15, 2006, and in revised form, September 7, 2007 Published, JBC Papers in Press, September 11, 2007, DOI 10.1074/jbc.M611500200
Prakash Vempati1, Emmanouil D. Karagiannis, and Aleksander S. PopelFrom the Department of Biomedical Engineering, School of Medicine, The Johns Hopkins University, Baltimore, Maryland 21205
Matrixmetalloproteinases (MMPs) are a class of extracellularand membrane-bound proteases involved in an array of physio-logical processes, including angiogenesis.We present a detailedcomputational model of MMP9 activation and inhibition. Ourmodel is validated to existing biochemical experimental data.We determine kinetic rate constants for the processes ofMMP9activation by MMP3, MMP10, MMP13, and trypsin; inhibitionby the tissue inhibitors of metalloproteinases (TIMPs) 1 and 2;and MMP9 deactivation. This computational approach allowsus to investigate discrepancies inourunderstandingof the inter-action of MMP9 with TIMP1. Specifically, we find that inhibi-tion due to a single binding event cannot describe MMP9 inhi-bition by TIMP1. Temporally accurate biphasic inhibitionrequires either an additional isomerization step or a secondlower affinity isoform of MMP9. We also theoretically charac-terize the MMP3/TIMP2/pro-MMP9 and MMP3/TIMP1/pro-MMP9 systems. We speculate that these systems differ signifi-cantly in their time scales of activation and inhibition such thatMMP9 is able to temporarily overshoot its final equilibriumvalue in the latter. Our numerical simulations suggest that theability of pro-MMP9 to complex TIMP1 increases this over-shoot. In all, our analysis serves as a summary of existing kineticdata for MMP9 and a foundation for future models utilizingMMP9 or other MMPs under physiologically well definedmicroenvironments.
Matrix metalloproteinase 9 (MMP9)2 is a zinc-dependentendopeptidase that participates in a variety of physiological andbiochemical processes (1, 2). In angiogenesis, MMP9 has beenshown to play a part in the degradation of basement mem-branes through its type IV collagenase activity (3), creation ofbioactive molecules such as angiostatin by cleavage of plasmin-ogen (4), and the release of growth factors such as vascularendothelial growth factor-A sequestered on extracellularmatrix heparin sulfate proteoglycans (5–7). To quantify the
existing biochemical data and help understand properties ofMMP activation cascades, we have constructed a biochemicallyaccurate numerical model of the post-secretional regulation ofMMP9. Specifically, we have used existing experimental data tokinetically characterizemechanisticmodels of theMMP9 reac-tion network (e.g. Fig. 1).MMP9 enters this model (post-secretion) as a glycosylated
latent enzyme (pro-MMP9) at a molecular mass of 92 kDa.From experimental studies, MMP9 is known to undergo acti-vation, inhibition by tissue inhibitors of metalloproteinases(TIMPs), and possibly post-activation processing, includingC-terminal processing and deactivation. In this approach, wehave not studied the proteolytic action elicited by MMP9. Avast quantity of literature exists to create detailed models ofactivation and inhibition; however, C-terminal processing andMMP9 deactivation are less studied or accepted.In general, MMP latency is maintained by an N-terminal
prodomain that masks the Zn2�-dependent active site. Thestructure of the active molecule and the specific rate of activa-tion depend on the exact mode of activation, but in all casesthey require conformational unwinding in the catalytic domain.By far, the most studied mode of MMP9 activation is enzymeproteolysis of the pro-MMP9 prodomain. Confirmed in vitroactivators of MMP9 include MMP2 (8), MMP3 (9), MMP7(10), MMP10 (11), MMP13 (12), and the serine proteasetrypsin (13). MMP3 is generally regarded as the most potentactivator of MMP9. Here, MMP9 is processed via an interme-diate of 86 kDa (processing at Glu59–Met60), which relaxes toexpose the second processing site (Arg106–Phe107) leading tothe well established 82-kDa isoform. Evidence also supportsnonproteolytic modes of activation, e.g. via conformationalchanges contingent on substrate binding (14). Post-activationprocessing forMMP9 can further involve removal of the C-ter-minal hemopexin-like domain, leading to an �65-kDa species(MMP9�C), or can involve direct cleavage in the active domainproducing an �50–60-kDa inactive species (15). Thus, MMP9is typically processed from 92 to 86 kDa and 82, 65, and�50–60 kDa. A distinct feature of MMP9 is its ability to formproenzyme complexes with TIMP1 (pro-MMP9�TIMP1) andto form dimers with otherMMPs, including theMMP9�MMP1heterodimer (16) and MMP9�MMP9 homodimer (17).Once activated, MMP9 is subject to inhibition by TIMPs
resulting from binding of the N-terminal domain of a TIMP tothe active site cleft in MMP9. Our understanding of MMP9inhibition is incomplete. First, MMP9 is found as active iso-forms at both 82 and 65 kDa, but the 65-kDa isoform lacks thehemopexin-like domain, which is generally recognized toincrease the rate ofMMP9 inhibition byTIMP1 (18).Wedonot
* This work was supported by NHLBI Grants RO1 HL079653 and R33HL087351 from the National Institutes of Health. The costs of publicationof this article were defrayed in part by the payment of page charges. Thisarticle must therefore be hereby marked “advertisement” in accordancewith 18 U.S.C. Section 1734 solely to indicate this fact.
□S The on-line version of this article (available at http://www.jbc.org) containssupplemental text, Figs. S1–S3, and additional references.
1 To whom correspondence should be addressed: Dept. of Biomedical Engi-neering, School of Medicine, The Johns Hopkins University, 613 TraylorBldg., 720 Rutland Ave., Baltimore, MD 21205. Tel.: 410-955-1787; Fax: 410-614-8796; E-mail: [email protected].
2 The abbreviations used are: MMP9, matrix metalloproteinase 9; TIMP, tissueinhibitors of metalloproteinase.
THE JOURNAL OF BIOLOGICAL CHEMISTRY VOL. 282, NO. 52, pp. 37585–37596, December 28, 2007© 2007 by The American Society for Biochemistry and Molecular Biology, Inc. Printed in the U.S.A.
DECEMBER 28, 2007 • VOLUME 282 • NUMBER 52 JOURNAL OF BIOLOGICAL CHEMISTRY 37585
by guest on January 28, 2015http://w
ww
.jbc.org/D
ownloaded from

know what role enzymatic cleavage of the C-terminal domainof MMP9 plays in MMP9 inhibition. In addition, althoughMMP TIMP pairs such as MMP9 and TIMP2 or MMP2 andTIMP1 exhibit monophasic inhibition kinetics, MMP TIMPcombinations capable of forming pro-MMP�TIMP complexes(e.g. pro-MMP9�TIMP1 and pro-MMP2�TIMP2) seem toexhibit biphasic inhibition kinetics (18, 19). An importantproblem in our current understanding of MMP9 inhibition byTIMP1 is the large discrepancy in the reported Ki valuesbetween various groups. Assuming simple bimolecular kinet-ics, O’Connell et al. (18) reported values of Ki �50 pM, with anassociation rate constant (kon) of 1.11 � 107 M�1 s�1. In con-trast, Olson et al. (19) reported lower affinity kinetics withnanomolar Ki � 8.5 nM and kon equal to 2.48 � 105 M�1 s�1.Furthermore, resonance biosensor analyses between MMPsand TIMPs consistently indicate binding kinetics with Ki in thelow and intermediate nanomolar range across a wide range ofMMP and TIMP combinations (19, 20). An important goal ofthis study is to examine the existing relationships and usenumerical simulations to determine models capable of accu-rately reproducing observed behavior.In the physiological setting, TIMPs play amajor role in inhib-
iting MMPs, and thus pro-MMP9 activation will never trulyoccur in isolation of an inhibitor. Experiments indicate that therate of pro-MMP9 activation is reduced in the presence ofTIMPs (15, 21) because of either TIMP1 inhibition of the acti-vators or TIMP1 stabilization of pro-MMP9 by forming thepro-MMP9�TIMP1 complex. TIMP1 can bind pro-MMP9through its C-terminal domain, leaving its active site availableto inhibit other MMPs, e.g. MMP3. This is responsible for theimportance of the MMP3 to TIMP1 ratio on pro-MMP9�TIMP1 complex activation.In all, our computational approach allowed us to test various
hypotheses regarding MMPs and TIMPs against previouslyobserved behavior. Using similar methodology, we previouslyconfirmed the nonmonotonic dependence ofMMP2 activationon MT1-MMP and TIMP2 ratios in the MT1-MMP/TIMP2/MMP2 system and showed the importance of membrane-bound MMPs over diffusible MMPs in type 1 collagen degra-dation (22).
MATERIALS AND METHODS
Based on the mechanisms proposed in the literature, we for-mulated a network of reactions in which MMP9 and its activa-tors and inhibitors are likely to participate (Figs. 1 and 3). Toform a numerical model of MMP9 behavior, these reactionswere converted to a systemof ordinary differential equations by
applying mass action kinetics.These equations express the rate ofchange in concentration of eachspecies based on the production ofeach species or consumption ratesbecause of the listed reactions.Specifying the initial concentrationsof all species allows calculation ofthe concentration of each species ata later time. For the simulated reac-tions, we assume well stirred and
cell-free conditions allowing us to neglect spatial gradients ofthe species.Next, kinetic parameters for these reactions were either
obtained from values calculated by other groups or were inde-pendently determined using data from the experimental litera-ture (we did not carry out our own biochemical experiments).To determine kinetic parameters, we employed a grid searchalgorithm to minimize normalized error (1 � R2 � sum ofsquared residuals normalized to the total sum of squares)between the simulated results of ourmodel and the experimen-tal data (usually of time courses or dose-response curves).The specific reactions and equations, and the methodology
used in estimating unknown kinetic parameters for these reac-tions, are detailed in the Supplemental Material. The resultingsystem of ordinary differential equations was solved with theMatlab software package (Mathworks, Inc.) using their ode23sstiff ordinary differential equation solver. Numerical precisionwas double floating point, and the time step size was automat-ically selected to have a relative error tolerance less than 10�3
and an absolute error tolerance less than 10�15.
RESULTS AND DISCUSSION
Estimates for Pro-MMP9 Activation in the Absence of TIMPs—Pro-MMP9 activation is a sequential processing event involvingthe conversion of the latent 92-kDa form to an 82-kDa species byan 86-kDa inactive intermediate (9). We treated activation as asingle step event leading from a 92- to an 82-kDa form. Thisassumption is valid because the 92- to 86-kDa conversion usu-ally occurs fairly rapidly (several seconds) compared with acti-vation to the 82-kDa species, which takes hours (18).First, we numerically estimated pro-MMP9 activation by
MMP3 (Fig. 2A) using data from an experiment byO’Connell etal. (18). For the case of pro-MMP9 activation by MMP3, aMichaelis-Menten activation constant kact was previouslydetermined to be 0.0019 s�1 (23). By performing a numericalsensitivity analysis, we estimated different kon and koff valuesthat fit the experimental time course to within experimentaluncertainty as shown by the contour plot in Fig. 2B. Theserange from the relatively slow binding kinetics at kon � 6 � 103M�1 s�1 and koff � 0 s�1 to relatively rapid kinetics at kon � 6�105 M�1 s�1 and koff � 0.1 s�1. The absolute minimum for konassuming that kact is infinity is 2.5 � 103 M�1 s�1. With kact �0.0019 s�1, we could restrict kon to being at least 6 � 103 M�1
s�1.We found that our later simulationswere not very sensitiveto different parameter combinations; thus we adopted one setof parameters for the rest of this study chosen as the medianvalues of the estimated binding kinetics: kon � 1� 104 M�1 s�1,
FIGURE 1. Biochemical reaction network for MMP9 activation and inhibition spanning MMP9, MMP3,TIMP1, and TIMP2. Dots indicate complexes between species. pM9, pro-MMP9; M3, MMP3; M9, MMP9; T1,TIMP1; T2, TIMP2.
Biochemical Model of MMP9 Activation and Inhibition
37586 JOURNAL OF BIOLOGICAL CHEMISTRY VOLUME 282 • NUMBER 52 • DECEMBER 28, 2007
by guest on January 28, 2015http://w
ww
.jbc.org/D
ownloaded from

koff � 1.0 � 10�3 s�1, and kact � 0.0019 s�1 (kact/Km � 8840M�1 s�1). The entire family of optimal parameters leads toeffective kact/Km in the range of 6 � 103 M�1 s�1 to 1.1 � 104M�1 s�1, which is almost 10 times lower than that determinedpreviously byOlson et al. (23).We also carried out similar anal-yses forMMP10 (Fig. 2C), MMP13, and trypsin. The results are
presented in Table 1. Our calcula-tions indicate that MMP13 andMMP3 are equally competentMMP9 activators, followed by tryp-sin, then MMP10. To show this, wesimulated a test experiment where200 nM pro-MMP9 was separatelycombinedwith 30 nMof each activa-tor (Fig. 2D).MMP9 Interaction with TIMP1
Cannot Be Described by a SingleStep Binding Inhibition Reaction—To study the interaction of MMP9and TIMP1, we numerically testedseveral previously suggested reac-tion mechanisms against the pro-gress curve data of Olson et al. (19).These progress curves (Fig. 3) fol-lowed the onset of inhibitionbetween free MMP9 and bothTIMP1 andTIMP2 and the resump-tion of MMP9 activity following thedissociation of the MMP9�TIMPcomplex.The experimental data show a
clear difference between the inhibi-tory behavior of TIMP1 and TIMP2for MMP9. For example, similarincreases of TIMP1 or TIMP2 elicit
a larger loss of MMP9 activity within the first 100 s and asmaller loss of activity past 100 s for TIMP1. This indicates thatTIMP1 causes a biphasic pattern of inhibition with an initialphase of relatively rapid inhibition followed by a phase of slowerinhibition.The four mechanisms we tested include a single step bind-
ing inhibition (scheme I), a single step binding inhibitionfollowed by isomerization into a second inhibited complex(scheme II), a noninhibitory initial binding followed byisomerization to an inhibited complex (scheme III), and atwo-isoform MMP9 model with each MMP9 isoform havingdifferent binding properties (scheme IV). The reactionmechanisms for these schemes are displayed in Fig. 3. Foreach case, we present the predicted progress curves for theinhibition of MMP9 by TIMP (Fig. 3, panel i) and the disso-ciation of the MMP9�TIMP complex (Fig. 3, panel ii) againstthe experimental data. The kinetic parameters that we deter-mined are tabulated in Table 2.Schemes II and III were motivated by characterization of the
62-kDa MMP2 interaction with TIMP2 as shown by Hutton etal. (25). A similar mechanism was also previously consideredbetweenMMP1 andTIMP1wherein the intermediate complexrepresented TIMP1 bound to the hemopexin domain ofMMP1(26). Scheme III is a variation of scheme II in that the inter-mediate is considered as fully active as the 82-kDa MMP9.Jointly, schemes II and III represent the extremes of the gen-eral binding � isomerization model, which we consider asscheme III*. Scheme IV was suggested by O’Connell et al.
FIGURE 2. Activation of pro-MMP9 in the absence of TIMPs. The panels display the time courses of MMP9activity following the mixing of pro-MMP9 and activators. Points indicate data taken from experimental stud-ies, and lines indicate our simulated comparisons. Activations were performed using [pro-MMP9] � 1.0 �M and[pro-MMP9]:[MMP3] � 15:1 (18) (A) and [pro-MMP9] � 350 nM and [MMP10] � 350, 175, and 35 nM (11) (C).B displays a contour plot of the error (1 � R2) in the activation of pro-MMP9 by MMP3 between experimentaldata and our simulations for different choices of kon and koff with kact � 0.0019 s�1. The point in circle is ourchoice of activation parameters for this study (kon � 1 � 104
M�1 s�1 and koff � 0.001 s�1). D compares the
activation of 200 nM pro-MMP9 with either of MMP3, MMP10, MMP13, or trypsin at 30 nM.
TABLE 1Kinetic parameters of activationThe activation of pro-MMP9 by various activators was modeled using a Michaelis-Menten reaction scheme. The kinetic parameters are listed in the 1st column for therespective proenzyme and activators. The on- and off- rates of activator towards thevarious pro-MMP9�TIMP�MMPX complexes were assumed equal to that towardspro-MMP9. (f indicates fitted parameter; A indicates assumed parameter based oncomparison to similar reactions.)
Kinetic parameters of activation at 37 °C(pro-species in parentheses) Ref.
Pro-MMP9 activation by MMP3kon � 1.0 � 104 M�1 s�1 18fkoff � 0.001 s�1 18fkact � 0.0019 s�1 (pro-MMP9) 23kact � 0.0006 s�1 (pro-MMP9�TIMP1)(�xxx) 29f
Pro-MMP9 activation by trypsinkon � 1.0 � 104 M�1 s�1 Akoff � 0.007 s�1 13fkact � 0.002 s�1 (pro-MMP9) Akact � 0.0007 s�1 (pro-MMP9�TIMP1)(�xxx) 29f
Pro-MMP9 activation by MMP13kon � 1.0 � 104 M�1 s�1 Akoff � 0.0005 s�1 12fkact � 0.0022 s�1 (pro-MMP9) 12f
Pro-MMP9 activation by MMP10kon � 7 � 103 M�1 s�1 11fkoff � 0.01 s�1 11fkact � 0.001 s�1 (pro-MMP9) 11f
Biochemical Model of MMP9 Activation and Inhibition
DECEMBER 28, 2007 • VOLUME 282 • NUMBER 52 JOURNAL OF BIOLOGICAL CHEMISTRY 37587
by guest on January 28, 2015http://w
ww
.jbc.org/D
ownloaded from

(18) in noting two subpopulations of MMP9, with one capa-ble of significantly stronger inhibition.We found that scheme I can accurately characterize the inhi-
bition of 82-kDa MMP9 by TIMP2 (and of 62-kDa MMP2 byTIMP1; data not shown) (Fig. 3A) but not by TIMP1 (Fig. 3B).
The differences between MMP9 inhibition by TIMP1 andTIMP2 cannot be accounted for simply by altering the kineticparameters used in a scheme I reaction mechanism. On theother hand, we found that schemes III* and IV seem capable ofcharacterizing inhibition between bothMMP9 and TIMP1 and
FIGURE 3. Inhibition of MMP9 by TIMP1 and TIMP2. The interactions of 1 nM MMP9 with TIMP1 and TIMP2 were studied by measuring the proteolysisof the fluorescence quenching substrate MOAcPLGLA2pr(Dnp)-AR-NH2. Experimental data (markers) were obtained from Olson et al. (19). A–F, panel i,measures the onset of inhibition upon mixing 1 nM active MMP9 and 0, 1, 5, or 30 nM TIMP. A–F, panel ii measures the onset of activity followingdissociation of the MMP9�TIMP complex by dilution (final [MMP9] � 1 nM) of a 1-h incubation of 300 nM MMP9 and 360 nM TIMP (see note below). Thepanels are as follows: MMP9 � TIMP2 using scheme I (A) and MMP9 � TIMP1 using schemes I (B), II (C), III (D), III* (E), and IV (F). Note: for MMP9 inhibitionwith TIMP2, we find that the experimental data in A, panel ii, displays an onset of activity that appears more linear than the scheme I produced fit. Wefound that schemes II and III can approximate this linearity; however, the improvement was deemed indicative of overfitting and was also found to beunimportant to later conclusions in Fig. 5.
Biochemical Model of MMP9 Activation and Inhibition
37588 JOURNAL OF BIOLOGICAL CHEMISTRY VOLUME 282 • NUMBER 52 • DECEMBER 28, 2007
by guest on January 28, 2015http://w
ww
.jbc.org/D
ownloaded from

MMP2 and TIMP2 (latter not shown). The results for TIMP1can also be seen by comparing the normalized errors for each ofthe schemes in Table 2.Scheme II (see Fig. 3C) does not significantly improve upon
the results of scheme I and does not also seem capable ofdescribing the MMP9/TIMP1 interaction. We searched thespace of parameters for k1II between 1 � 103 and 1 � 108 M�1
s�1, and for k2II, k3II, and k4II between 1� 10�8 and 1� 102 s�1;the approximate error-minimizing fit is shown in Fig. 3C, usinga k1II � 2 � 106 M�1 s�1, k2II � 4 � 10�3 s�1, k3II � 6 � 10�4
s�1, and k4II � 3 � 10�5 s�1, with an overall Ki of k2II/k1II �k4II/(k3II � k4II) equal to 96 pM. This is expected because theinitial binding provides inhibition, and the subsequent isomer-ization to another inhibited state can only increase the rate ofthe initial binding inhibition.Scheme III and more so schemes III* and IV come closer to
approximating the MMP9/TIMP1 interaction. In the case ofscheme III (Fig. 3D), the model produced a biphasic approxi-mation of the data; however, the proper active MMP9 concen-tration dependence on TIMP1 could not be reproduced. TheeffectiveKi � k4III/k3III � k2III/k1III of 1.4 pM is well in the rangeapproximated by O’Connell et al. (18) at Ki � 50 pM. Usingscheme III* (Fig. 3E), we determined that setting the activity ofthe intermediate complex to�35% that of freeMMP9providedoptimal fitting for the isomerization type schemes. For schemeIII*, the other parameters were determined at k1III* � 5.6 � 106M�1 s�1, k2III* � 1.6 � 10�5 s�1, k3III* � 6.3 � 10�4 s�1, andk4III* � 2.5 � 10�4 s�1. Thus, the effective Ki � k2III*/k1III* �k4III*/(k3III* � (1 � 0.35) � k4III*) or 0.9 pM.
Similar to scheme III*, scheme IV is also able to reproducethe biphasic behavior and the proper TIMP1 concentrationdependence (Fig. 3F). However, this occurred only when theratio of the slowly inhibited (low affinity MMP9L) to totalMMP9 (MMP9L � MMP9H) species was set to �0.31. Thestudy ofO’Connell et al. (18) determined that the rapidly inhib-ited MMP9 form had a k1IV � 1.11 � 107 M�1 s�1. We esti-mated the parameters of this model to be k1IV � 4.6 � 106 M�1
s�1 and k2IV� 6.3� 10�6 s�1 for the rapidly inhibited form (Ki�
1.4 pM) and k3IV � 2.9 � 103 M�1 s�1, k4IV � 2.5 � 10�5 s�1
for the slowly inhibited form (Ki � 8.6 nM). We note that therapidly inhibited form also was consistent with the strong inhibi-tion strength seen byO’Connell et al. (18) and that the low affinityisoform in the range noted by Olson et al. (19) (Ki � 8.5 nM).The previous estimates are the optimal sets of parameters
produced by our grid-search algorithm. However, as with anynonlinear parameter estimation algorithm, we have no guaran-tee for finding the absolute “global” errorminimizing set of rateparameters. Furthermore, although there may be only one bestfit, theremay be a family of nearlywell fitting curves that cannotbe distinguished both on the basis of experimental uncertaintyand the inability of experimental data to confer values forparameters of a specifiedmodel. Thus, similar to our attempt inFig. 2B, we attempted to specify ranges of parameters (moreaccurately, the region traversed by the error-minimizing man-ifold). We only did this for schemes III* and IV because theywere the only models consistent with the experimental data.We found that the error-minimizing manifold for scheme IVtraversed over the following ranges: k1IV (3–7 � 106 M�1 s�1),k2IV (1–9 � 10�6 s�1), k3IV (3–20 � 103 M�1 s�1), and k4IV(2–8 � 10�5 s�1). The ratio of the low affinity isoform to totalMMP9 was relatively defined at 0.3–0.35. For these parameters,the effective Ki value forMMP9H varied from 0.2 to 1.5 pM. Simi-larly for MMP9L, the Ki value ranged from 0.4 to 15 nM. Thescheme III* error-minimizing manifold traverses a wider range ofparameter combinations: k1III* (3–9 � 106 M�1 s�1), k2III*(2–2000 � 10�6 s�1), k3III* (2–20 � 10�4 s�1), k4III* (1–600 �10�6 s�1), with the relative activity of the intermediate complexbetween 0.3 and 0.5. The range in viable effectiveKi is 0.05–30 pM.Accurate estimation of the parameters for this model requiresadditional biochemical experimentation. Despite the degeneracy,our later conclusions are relatively insensitive to the exact set ofparameters used forMMP9 inhibition by TIMP1.We also tested the 62-kDa MMP2/TIMP2 interaction using
the various inhibition schemes, again using data from Olson etal. (19). Our conclusions are similar to that found for theMMP9/TIMP1 interaction; schemes III, III*, and IV are muchbetter at characterizing the data than schemes I and II. Previousexperimental estimates by Hutton et al. (25) also characterizethis reaction. They used the reactions of scheme II/III to esti-mate on and off rates for the initial association at 5.9� 106 M�1
s�1 and 6.3 s�1, respectively, and forward and reverse isomer-ization rates at 33 and 2.0 � 10�8 s�1, respectively (effectiveKi � 0.6 fM) (25). These kinetic parameters were not able tosimulate the behavior found in Olson et al. (19).
Although scheme IV is theoretically interesting, experimen-tal work needs to be done to determinewhether two isoforms ofMMP9do exist in biochemical preparations. For this reason,weused scheme III* to describe the MMP9/TIMP1 interaction insubsequent results. One possibility is that the two isoformsarise because of differences at the time of protein synthesis (e.g.glycosylation or folding). The difference is TIMP1-specific(because scheme IV is not needed to model the MMP9/TIMP2interaction); it is probable that these differences are located inthe MMP9 C-terminal domain. It is also tempting to speculatethat post-secretion processes such as C-terminal truncationcan also result in these TIMP1-specific differences. This is cor-
TABLE 2Mechanisms of MMP9 inhibitionWe numerically fitted kinetic parameters for MMP9 inhibition by TIMP usingschemes I–IV and data from Olson et al. (19). Reaction diagrams of the inhibitionschemes are presented in Fig. 3. The chosen set of parameters was determined to beoptimal by our grid-search algorithm.The normalized (Norm.) errormeasure usedwas1 � R2. The ranges of parameter sets for schemes III* and IV are presented in the text.
Schemeno.
Norm.error
EffectiveKi
Kinetics ofMMP9 � TIMP
pMMMP9,TIMP2I 0.013 1.1 � 103 k1, 1.6 � 105 M�1 s�1 k2, 1.7 � 10�4 s�1
MMP9,TIMP1I 0.736 150 k1, 1.2 � 106 M�1 s�1 k2, 1.8 � 10�4 s�1
II 0.597 96 k1, 1.9 � 106 M�1 s�1 k2, 0.004 s�1
k3, 6.3 � 10�4 s�1 k4, 3 � 10�5 s�1
III 0.065 1.4 k1, 6.3 � 106 M�1 s�1 k2, 7.4 � 10�5 s�1
k3, 1 � 10�2 s�1 k4, 0.012 s�1
III* 0.022 0.90 k1, 5.6 � 106 M�1 s�1 k2, 1.6 � 10�5 s�1
k3, 6.3 � 10�4 s�1 k4, 2.5 � 10�4 s�1
IV 0.020 1.4 k1, 4.6 � 106 M�1 s�1 k2, 6.3 � 10�6 s�1
8.6 � 103 k3, 2.9 � 103 M�1 s�1 k4, 2.5 � 10�5 s�1
Biochemical Model of MMP9 Activation and Inhibition
DECEMBER 28, 2007 • VOLUME 282 • NUMBER 52 JOURNAL OF BIOLOGICAL CHEMISTRY 37589
by guest on January 28, 2015http://w
ww
.jbc.org/D
ownloaded from
roborated by experimental studies indicating that MMP9 issubject to C-terminal processing by MMP3 (13), which wasused in pro-MMP9 activation in the experimental setup ofOlson et al. (19), and data indicating that C-terminal truncatedforms of MMPs have reduced affinities to TIMPs (18, 19, 27).Based on scheme IV, we can also consider the influence of
C-terminal processing on MMP9 inhibition by TIMP1. Wefound that varying the ratio of the two forms of MMP9 inscheme IV produced drastically different progress curves forinhibition by TIMP1 (not shown). This implies that if C-termi-nal processing is biochemically relevant, then the experimentaldetermination of MMP9 inhibition by TIMP1 will also be verysensitive to the ratio between the 82- and 65-kDa MMP9 iso-forms, i.e. to the precise concentrations of activators and dura-tion over which MMP9 was activated.Homolytic Processing Produces Second-order MMP9 Decay
Kinetics—Thus far we have not included deactivation (loss ofMMP9 activity because of conversion to�50–60 kDa by proc-essing at theMMP9 active site) or C-terminal cleavage (conver-sion to 65-kDa MMP9) into the model as there have been con-flicting results in the literature on whether these processesoccur and how. Whether these processes are physiologicallyrelevant is another question because any existing TIMPs willsignificantly delay these processes (15). We analyzed the exist-ing data that support deactivation. We did not examine C-ter-minal processing because of a lack of quantifiable data.The existing experimental observations show conflicting
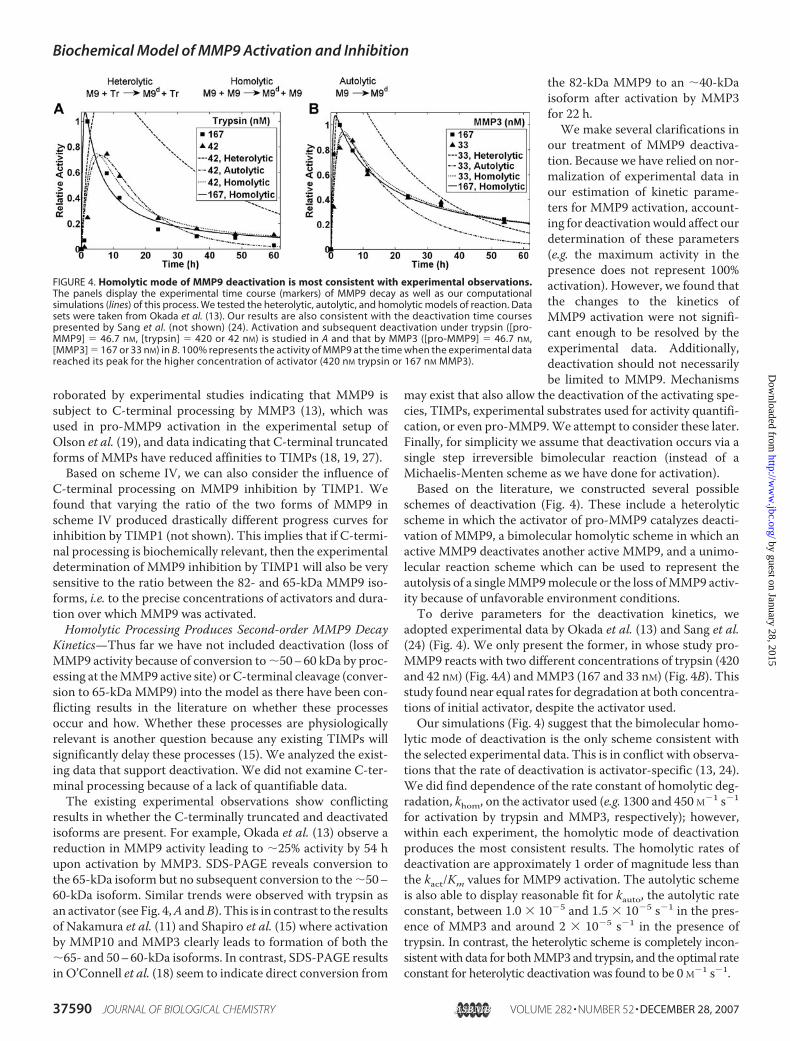
results in whether the C-terminally truncated and deactivatedisoforms are present. For example, Okada et al. (13) observe areduction in MMP9 activity leading to �25% activity by 54 hupon activation by MMP3. SDS-PAGE reveals conversion tothe 65-kDa isoform but no subsequent conversion to the�50–60-kDa isoform. Similar trends were observed with trypsin asan activator (see Fig. 4,A andB). This is in contrast to the resultsof Nakamura et al. (11) and Shapiro et al. (15) where activationby MMP10 and MMP3 clearly leads to formation of both the�65- and 50–60-kDa isoforms. In contrast, SDS-PAGE resultsin O’Connell et al. (18) seem to indicate direct conversion from
the 82-kDa MMP9 to an �40-kDaisoform after activation by MMP3for 22 h.We make several clarifications in
our treatment of MMP9 deactiva-tion. Because we have relied on nor-malization of experimental data inour estimation of kinetic parame-ters for MMP9 activation, account-ing for deactivationwould affect ourdetermination of these parameters(e.g. the maximum activity in thepresence does not represent 100%activation). However, we found thatthe changes to the kinetics ofMMP9 activation were not signifi-cant enough to be resolved by theexperimental data. Additionally,deactivation should not necessarilybe limited to MMP9. Mechanisms
may exist that also allow the deactivation of the activating spe-cies, TIMPs, experimental substrates used for activity quantifi-cation, or even pro-MMP9.We attempt to consider these later.Finally, for simplicity we assume that deactivation occurs via asingle step irreversible bimolecular reaction (instead of aMichaelis-Menten scheme as we have done for activation).Based on the literature, we constructed several possible
schemes of deactivation (Fig. 4). These include a heterolyticscheme in which the activator of pro-MMP9 catalyzes deacti-vation of MMP9, a bimolecular homolytic scheme in which anactive MMP9 deactivates another active MMP9, and a unimo-lecular reaction scheme which can be used to represent theautolysis of a singleMMP9molecule or the loss ofMMP9 activ-ity because of unfavorable environment conditions.To derive parameters for the deactivation kinetics, we
adopted experimental data by Okada et al. (13) and Sang et al.(24) (Fig. 4). We only present the former, in whose study pro-MMP9 reacts with two different concentrations of trypsin (420and 42 nM) (Fig. 4A) andMMP3 (167 and 33 nM) (Fig. 4B). Thisstudy found near equal rates for degradation at both concentra-tions of initial activator, despite the activator used.Our simulations (Fig. 4) suggest that the bimolecular homo-
lytic mode of deactivation is the only scheme consistent withthe selected experimental data. This is in conflict with observa-tions that the rate of deactivation is activator-specific (13, 24).We did find dependence of the rate constant of homolytic deg-radation, khom, on the activator used (e.g. 1300 and 450 M�1 s�1
for activation by trypsin and MMP3, respectively); however,within each experiment, the homolytic mode of deactivationproduces the most consistent results. The homolytic rates ofdeactivation are approximately 1 order of magnitude less thanthe kact/Km values for MMP9 activation. The autolytic schemeis also able to display reasonable fit for kauto, the autolytic rateconstant, between 1.0 � 10�5 and 1.5 � 10�5 s�1 in the pres-ence of MMP3 and around 2 � 10�5 s�1 in the presence oftrypsin. In contrast, the heterolytic scheme is completely incon-sistentwith data for bothMMP3 and trypsin, and the optimal rateconstant for heterolytic deactivation was found to be 0 M�1 s�1.
FIGURE 4. Homolytic mode of MMP9 deactivation is most consistent with experimental observations.The panels display the experimental time course (markers) of MMP9 decay as well as our computationalsimulations (lines) of this process. We tested the heterolytic, autolytic, and homolytic models of reaction. Datasets were taken from Okada et al. (13). Our results are also consistent with the deactivation time coursespresented by Sang et al. (not shown) (24). Activation and subsequent deactivation under trypsin ([pro-MMP9] � 46.7 nM, [trypsin] � 420 or 42 nM) is studied in A and that by MMP3 ([pro-MMP9] � 46.7 nM,[MMP3] � 167 or 33 nM) in B. 100% represents the activity of MMP9 at the time when the experimental datareached its peak for the higher concentration of activator (420 nM trypsin or 167 nM MMP3).
Biochemical Model of MMP9 Activation and Inhibition
37590 JOURNAL OF BIOLOGICAL CHEMISTRY VOLUME 282 • NUMBER 52 • DECEMBER 28, 2007
by guest on January 28, 2015http://w
ww
.jbc.org/D
ownloaded from

The three schemes reflect differences of the time course ofMMP9 decay in both the rate of decay of activity and thedependence on activator concentration. The autolytic and het-erolytic schemes both exhibit very rapid deactivation (after suf-ficient MMP9 is activated) that can be characterized by a first-order “exponential” decay (see Fig. 4B). On the other hand, theexperimental data display a slower rate of deactivation, whichcan be characterized by the second-order “hyperbolic” timedependence of homolytic deactivation. In terms of dependenceon the activator concentration, the experimental data showboth a relative insensitivity to changes in the activator concen-tration and positive correlation between the activator concen-tration and peak MMP9 activity. The autolytic and homolyticdeactivation schemes reflect this behavior. However, the oppo-site is true for the simulated heterolytic scheme. From Fig. 4, Aand B, we see that the heterolytic scheme results in normalizedactivity greater than 100% at the lower concentration of activa-tor. This surprising behavior occurs because of the fact thatdecreasing the activator concentration decreases the rate ofMMP9 activation, which further adds to the decreased rate ofMMP9 deactivation. This results in greater MMP9 accumula-tion at lower activator concentrations.Other mechanisms may also be at work. The presence of
nonspecific activity would result in final levels of activitygreater than zero. This would give the false appearance of aslower approach to the final equilibrium, suggesting that theobserved deactivation may indeed be autolytic and a result ofpoor storage conditions. However, this does not appear to bethe case as the activity of MMP3 was also measured in Ref. 13
and was shown to be negligible.Next, although we showed that theoverall decay was second order, weassumed this was entirely the resultof a second-order decay inMMP9. IfMMP9 was reacted in sub-optimalstorage conditions, other alterna-tives can be present yielding possi-bly overall second-order decay viathe following: 1) both the quantifi-cation substrate and MMP9 decay-ing with first-order kinetics; 2) bothMMP3 (or trypsin) and MMP9decaying with first-order kinetics inaddition to heterolytic deactivationof MMP9 by MMP3; and 3) bothpro-MMP9 andMMP9autolyticallydecaying with first-order kinetics.We tested these possibilities, but thefirst and third are only marginallybetter than the autolytic reactionand still result in exponential decayat the longer times of this experi-ment. An interesting possibility isthe second case. Deactivation ofboth MMP3 and MMP9 with astrong autolytic deactivation forMMP3 and a weak autolytic andstrong heterolytic deactivation for
MMP9 does produce second-order decay kinetics in MMP9;however, it still displays the same concentration dependence asthe original heterolytic scheme. Thus, the data we used are onlyconsistent with a homolytic bimolecular decay mechanism forMMP9.TIMPs Delay the Onset of MMP9 Activation; Importance of
the MMP:TIMP Ratio—Previous biochemical experimentsindicate that pro-MMP9 activation is severely limited whenTIMP concentrations exceed that of a matrix metalloprotein-ase pro-MMP9 activator. To determine how the competitiveinhibition by TIMPs influences the onset of MMP9 activation,we sought to characterize the dynamics of the MMP3/TIMP2/pro-MMP9 system. We did not take into account deactivationof MMP9.We simulated activation (Fig. 5, A and B) of 300 nM pro-
MMP9 by 50 nM MMP3 in the presence of 0, 20, 40, 50, 60, 75,and 100 nM TIMP2. As expected, the time required for com-plete MMP9 activation is increased as TIMP2 concentration isincreased.When TIMP2 reacts stoichiometrically withMMP3,both activity (Fig. 5A) and activation (Fig. 5B) profiles developan initial concavity, which increases in magnitude as the inhib-itor concentration is increased. At excess inhibitor, activationprofiles reveal a steady but greatly reduced rate of activation, atwhich time MMP9 activity is nearly completely inhibited. Thistrend is easily visible at 100 nMTIMP2, where activity is delayedby 18 h. These distinct behaviors were present because ourconcentrations were well above the Ki of the inhibition reac-tions. In our Supplemental Material, we tested a larger rangeof MMP3 and TIMP2 concentrations to determine the
FIGURE 5. MMP9 activator inhibition by TIMPs, lag, and the MMP:TIMP ratio. A and B compare the theo-retically predicted onset of activity and activation under various TIMP2 loads. In these simulations, 50 nM MMP3activated 300 nM pro-MMP9 at various concentrations of TIMP2, and the resulting activity (A) and activation (B)of MMP9 was plotted. We also elucidate the mechanism of the activity lag by computing the concentrations ofpro-MMP9, MMP9, free TIMP2, MMP3�TIMP2, and MMP9�TIMP2 (C) and comparing the rate of formation ofMMP9 by activation by MMP3 to the rate of inhibition of MMP9 by TIMP2 (D).
Biochemical Model of MMP9 Activation and Inhibition
DECEMBER 28, 2007 • VOLUME 282 • NUMBER 52 JOURNAL OF BIOLOGICAL CHEMISTRY 37591
by guest on January 28, 2015http://w
ww
.jbc.org/D
ownloaded from
effects of TIMP on the delay in MMP9 activation, activity,and deactivation.We can dissect themechanism of the lag inMMP9 activation
and activity by computing the concentrations of the major spe-cies (Fig. 5C) and the velocities of the reactions formingMMP9(Fig. 5D) for the case of 100 nM TIMP2. After an initial relax-ation between MMP3, TIMP2, and pro-MMP9 (Fig. 5D before1 h), the rate of production of MMP9 by MMP3 is almostequally balanced by the rate of inhibition of MMP9 by TIMP2for up to 18 h. This is because any MMP9 that is formed israpidly inhibited by the high concentration of TIMP2. Thus,the lag in activity is because of the low levels of free MMP3 andthe high levels of free TIMP2. In this period, the overall [MMP]:[TIMP] (measuring all activated and complexed species) isbetween 1⁄2 and 1. At 18–22 h, the depletion of TIMP2 byMMP9 (resulting in the dissociation of theMMP3�TIMP2 com-plex) frees MMP3 and results in an acceleration of MMP9 acti-vation. Thus, MMP9 activity sharply rises in this period as thetotalMMP overtakes total TIMPs, i.e.when the overall [MMP]:[TIMP] surpasses 1.Experimentally, many studies show lack ofMMP9 activation
for very long durations in conditions where TIMP1 exceedsMMP3 (15, 28). In Hahn-Dantona et al. (28) , an excess of 1.5nM TIMP1 over 2.5 nM MMP3 leads to no significant produc-tion of the 82-kDa MMP9, until up to 24 h after mixing. How-ever, our results show thatMMP9 should be slowly but steadilyactivated (but inactive because of inhibition by TIMP) becausea small fraction of MMP3 should exist in its free state. The fact
that activation is not readily observed may be due in part to atighter than expected MMP3�TIMP1 complex or to some suf-ficient level of deactivation.Pro-MMP9 Activation by MMP3 in the Presence of TIMP1
Possibly Leads to Overshoot in MMP9 Activity—Next, weattempted to extend the model to encompass pro-MMP9 acti-vation by MMP3 and trypsin in the presence of TIMP1. In thissystem, pro-MMP9 can bind TIMP1 leading to the pro-MMP9�TIMP1 and pro-MMP9�TIMP1�MMP3 intermediates.These complexes can remain intact through activation leadingto the active MMP9�TIMP1* and MMP9�TIMP1�MMP3 com-plexes (29). We consider that MMP9�TIMP1*, which is likely adifferent intermediate than that formed in the scheme IIIMMP9/TIMP1 reaction, can undergo reactions similar to thelatter. Uncertainties in ourmodel include the rates of activation(kon, koff, and kact) of the proenzyme intermediates and the levelof activity and the modes of dissociation of the activated com-plexes. As possibilities, we considered that the activated com-plexes could dissociate at either interaction site (see legend toFig. 6, D and E) or dissociate instantaneously following activa-tion (see legend to Fig. 6F). We have attempted to shed lighton these unknowns by attempting to simulate experimentaldata from three separate studies (Fig. 6, A–C) (28–30).Because of the increased complexity of the system, we makeseveral simplifications.First, we assume that activation of the pro-MMP9�TIMP1
and pro-MMP9�TIMP1�MMP3 complexes by MMP3 occurswith the same kinetic on and off rates.We lump any differences
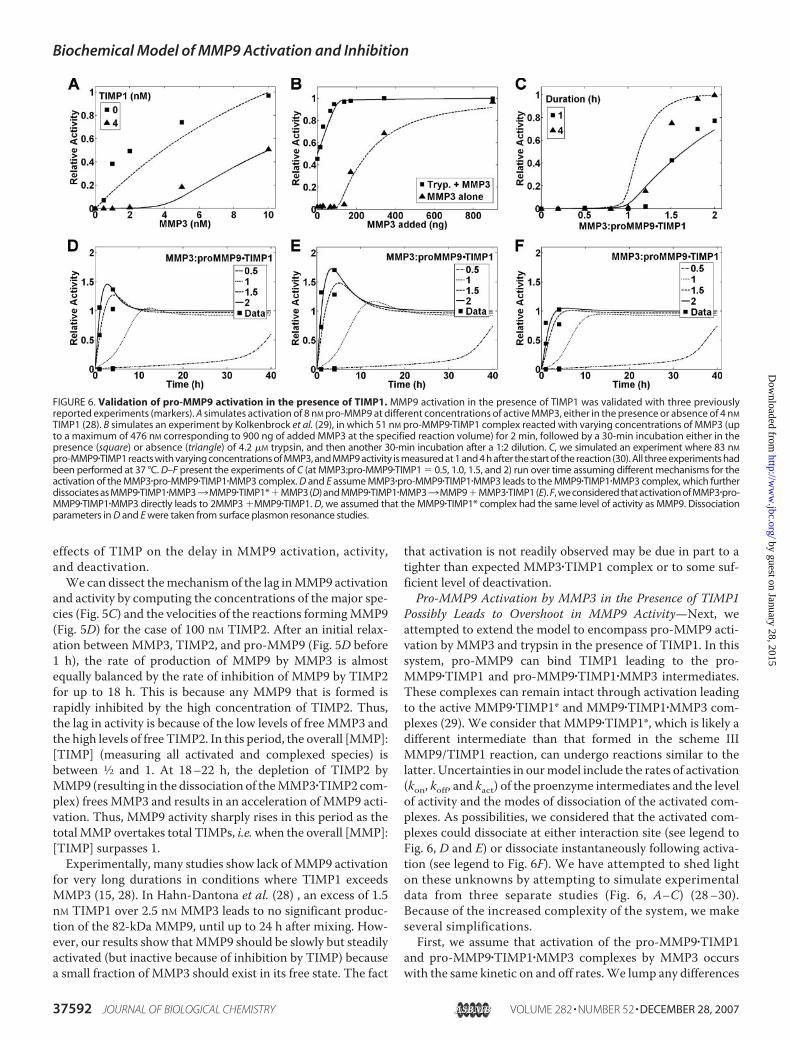
FIGURE 6. Validation of pro-MMP9 activation in the presence of TIMP1. MMP9 activation in the presence of TIMP1 was validated with three previouslyreported experiments (markers). A simulates activation of 8 nM pro-MMP9 at different concentrations of active MMP3, either in the presence or absence of 4 nM
TIMP1 (28). B simulates an experiment by Kolkenbrock et al. (29), in which 51 nM pro-MMP9�TIMP1 complex reacted with varying concentrations of MMP3 (upto a maximum of 476 nM corresponding to 900 ng of added MMP3 at the specified reaction volume) for 2 min, followed by a 30-min incubation either in thepresence (square) or absence (triangle) of 4.2 �M trypsin, and then another 30-min incubation after a 1:2 dilution. C, we simulated an experiment where 83 nM
pro-MMP9�TIMP1 reacts with varying concentrations of MMP3, and MMP9 activity is measured at 1 and 4 h after the start of the reaction (30). All three experiments hadbeen performed at 37 °C. D–F present the experiments of C (at MMP3:pro-MMP9�TIMP1 � 0.5, 1.0, 1.5, and 2) run over time assuming different mechanisms for theactivation of the MMP3�pro-MMP9�TIMP1�MMP3 complex. D and E assume MMP3�pro-MMP9�TIMP1�MMP3 leads to the MMP9�TIMP1�MMP3 complex, which furtherdissociates as MMP9�TIMP1�MMP33MMP9�TIMP1*�MMP3 (D) and MMP9�TIMP1�MMP33MMP9�MMP3�TIMP1 (E). F, we considered that activation of MMP3�pro-MMP9�TIMP1�MMP3 directly leads to 2MMP3 �MMP9�TIMP1. D, we assumed that the MMP9�TIMP1* complex had the same level of activity as MMP9. Dissociationparameters in D and E were taken from surface plasmon resonance studies.
Biochemical Model of MMP9 Activation and Inhibition
37592 JOURNAL OF BIOLOGICAL CHEMISTRY VOLUME 282 • NUMBER 52 • DECEMBER 28, 2007
by guest on January 28, 2015http://w
ww
.jbc.org/D
ownloaded from

in the net activation rate into kact. Specifically, we expect thatthe values of kact be smaller for the complexed intermediatesthan for free pro-MMP9 because of steric hindrance. We alsoassume that the reduction in kact is the same for bothcomplexes.Second, pro-MMP9�TIMP1 inhibits MMP3 to form pro-
MMP9�TIMP1�MMP3. Ogata et al. (30) have suggested thatthere is increased dissociation between pro-MMP9 and TIMP1when this happens. In contrast, Kolkenbrock et al. (29) haveshown remarkably stable MMP9�TIMP1�MMP3 complexes.Based on our analysis in the Supplemental Material (see Deter-mining Reaction Cycles), we expect either a strongly bound orweakly bound pro-MMP9�TIMP1�MMP3 complex. We con-sider the former case because the latter would resemble theMMP3/TIMP2/pro-MMP9 system. Thus, we would expect acti-vation to occur mainly through the pro-MMP9�TIMP1�MMP3complex.Finally, we can hypothesize that pro-MMP9�TIMP1 can also
inhibit active MMP9 just as it can MMP3. However, experi-mental results have demonstrated that MMP9 is weakly inhib-ited by pro-MMP9�TIMP1 despite its strong capacity to beinhibited byTIMP1 alone (29). Assumingweak binding kineticsbetween MMP9 and pro-MMP9�TIMP1, we have verified thatthis reaction is negligible (data not shown); thus, we do notconsider it further.The experimental results (28–30) and our simulations are
shown in Fig. 6, A–C. Fig. 6A describes MMP9 activity follow-ing activation of pro-MMP9 by increasing levels of MMP3 ineither the presence or absence of 4 nM TIMP1 (28). Similar tothe experimental data, we found that activation of MMP9 onlyoccurs for MMP3 in excess of TIMP1. In Fig. 6B, the pro-MMP9�TIMP1 complex was activated by trypsin for varyingamounts of MMP3 (29). This study also showed that withouttrypsin,MMP3 concentrationmust first exceed that of the pro-MMP9�TIMP1 complex for MMP9 activity to ensue. Anotherinteresting result from this study was the partial activity of thetrypsin-activated pro-MMP9�TIMP1 complex (see Fig. 6B, topcurve at added MMP3 � 0 ng). The final experiment we con-sidered (Fig. 6C) was adopted from Ogata et al. (30) and moni-tored the activity of MMP9 at 1 and 4 h following reaction ofpro-MMP9�TIMP1 by varying concentrations of MMP3. Allthree experiments showed that MMP3 needed to exceed theconcentration of TIMP1 for emergence of MMP9 activity. Thereaction mechanisms and kinetic parameters we found mostsuitable are presented in Fig. 1 and Tables 2 and 3.We find that the simulated results provide a reasonable
approximation of the experiments (Fig. 6, A–C). However, asignificant discrepancy is visible in Fig. 6C. The experimentaldata show close to zero activation when the initial [MMP3]equals the initial [pro-MMP9�TIMP1] and around 15% maxi-mal activity at 4 h for a [MMP3]:[pro-MMP9�TIMP1] � 1.2.However, our calculations produce significantly greater activityat these points, which we found was a result of dissociatedMMP3 activating pro-MMP9. This indicated that the experi-mental data require a stronger inhibition of MMP3 by TIMP1and pro-MMP9�TIMP1. However, to numerically achieve asstrong an MMP3 inhibition as possible, we have assumed that
pro-MMP9�TIMP1 inhibits MMP3 with the same kinetics asfree TIMP1.The different modes of dissociation of the activated pro-
MMP9�TIMP1 and pro-MMP9�TIMP1�MMP3 complexes thatwe considered (see Fig. 6, D–F, legend) were all capable of rea-sonably reproducing the observed data, albeit for slightly differ-ent kact values. Despite the similar appearance against theexperimental data, analysis of the time courses of the differentmechanisms revealed significantly different temporal phenom-ena (Fig. 6, D–F). When we considered that MMP9�TIMP1*andMMP9�TIMP1�MMP3 intermediateswere active, we foundthat MMP9 activity initially overshot its equilibrium level toreturn to it at later times (Fig. 6,D and E). This behavior has notbeen previously characterized for the MMP/TIMP systems. Aspresented in the Supplemental Material, the overshoot occursbecause the rate ofMMP9 activation exceeds the rate ofMMP9inhibition. This also implies a role for pro-MMP9/TIMP1 com-plexation in the persistence of overshoot. On the other hand, ifwe assume that either the activity of the activated complexes islimited or that the complexes dissociate rapidly to becomeinstantly inhibited inMMP9, then little or no overshoot occurs(Fig. 6F). We found that the presence of overshoot in this sys-tem was very sensitive to rates of MMP3 inhibition, MMP9inhibition, and MMP9 activation and to the structure of thereactions. We did not find overshoot behavior in the MMP3/TIMP2/pro-MMP9 system unless the kinetic parameters of thesystem were significantly altered (e.g. greater than a 10-foldreduction in rate of inhibition; data not shown).In the MMP3/TIMP1/pro-MMP9 system, our simulations
only indicate that overshoot is a possibility. The experimentalevidence that supports the notion of overshoot in the activationof pro-MMP9�TIMP1 byMMP3or trypsin is limited (21, 28). Incontrast, activation of pro-MMP9�TIMP1 by trypsin by Ogataet al. (30) reveals no noticeable overshoot. In addition, what issometimes observed as activation followed by deactivationmayin fact be activation followed by inhibition.An implication of this result is that the experimental data for
MMP9 activity in Fig. 6C does not necessarily have to bemono-tonically increasing in time, as shown in Fig. 6, D and E. Toachieve monotonicity in MMP9 activity between 1 and 4 h, wehad to delay the period of overshoot by lowering the effective
TABLE 3Parameters used in MMP interactions with TIMP1 and TIMP2We tabulated the kinetic parameters used in our simulations for the pro-MMP9/TIMP1, MMP9/MMP3�TIMP1, MMP3/TIMP1, and MMP3/TIMP2 interactions.Parameters were taken from the experimental literature. koff between MMP3 andTIMP2 was assumed equal to that between MMP3 and TIMP1.
Kinetic parameters of TIMP binding(25 °C unless indicated) Ref.
Pro-MMP9/TIMP1kon � 3.4 � 104 M�1 s�1 19Kd � 2.2 nM 14
MMP3/TIMP1 (37 °C)kon � 1.9 � 106 M�1 s�1 31koff � 1.3 � 10�4 s�1 20
MMP9/TIMP1�MMP3koff � 0.0012 s�1 19
MMP3/TIMP2 (37 °C)kon � 4.9 � 105 M�1 s�1 32koff � 1.3 � 10�4 s�1 A
Biochemical Model of MMP9 Activation and Inhibition
DECEMBER 28, 2007 • VOLUME 282 • NUMBER 52 JOURNAL OF BIOLOGICAL CHEMISTRY 37593
by guest on January 28, 2015http://w
ww
.jbc.org/D
ownloaded from

kact of the pro-MMP9�TIMP1 and pro-MMP9�TIMP1�MMP3complexes to less than 40% of the kact of pro-MMP9 alone.However, as this result is possibly a numerical artifact of ourassumptions, further biochemical studies would be required todetermine the significance of overshoot in pro-MMP9�TIMP1activation.Our simulation of the experimental procedure by Kolken-
brock et al. (29) (Fig. 6B) also suggests a different interpre-tation of its experimental results. In Fig. 6B, activation ofpro-MMP9�TIMP1 using trypsin and zero MMP3 results insome nonzero level of activity. However, the additionMMP3(up until an initial concentration equal to that of pro-MMP9�TIMP1) subsequently results in increased MMP9activity. The original conclusion that activation of pro-MMP9�TIMP1 (at zero addedMMP3) by trypsin yields a com-plex with less activity than activation of pro-MMP9�TIMP1�MMP3 (for addedMMP3) does not factor in the abilityof MMP3 to sequester TIMP1, effectively freeing MMP9 frominhibition. Thus numerically both MMP9�TIMP1* andMMP9�TIMP1�MMP3 can have equal activity and still providesimulation of experimental data.Conclusion—Construction of a biochemically detailedmodel
of MMP9 allowed us to revise and extend conclusions drawnfrom the previous literature. We were also able to providekinetic parameters for MMP9 activation, inhibition, and deac-tivation. We summarize our primary findings and predictionsin Table 4.We should note that in our parameter estimation, we often
found a range of acceptable sets of kinetic parameters thatallowed simulation of experimental data. Generally, this resultsfrom fitting a complex model with experimental data that can-not directly probe certain areas of the “kinetic parameter space”of themodel. However, our results were often insensitive to theexact parameters we used in our models. For example, if twodifferent sets of kinetic parameters for MMP9 inhibition pro-duced similar fits against progress curves of inhibition, then theresults remained similar when in the presence of pro-MMP9activators. Additional experiments would need to be under-taken to accurately confer values for the degenerate parame-
ters. Another problem typical in estimation of parameters isthat of over-fitting complex models. However, as all of ourschemes are biochemically reasonable and as we generallypicked the simplest scheme capable of providing “visual” accu-racy against experimental data, we do not expect severeoverfitting.Regarding MMP inhibition, we found two mechanisms
equally capable of describing biphasic inhibition. AlthoughHutton et al. (25) described a scheme similar to scheme III*, wealso found that scheme IV is capable of producing progresscurves exhibiting biphasic inhibition. Overall, our simulationsconfirm previous observations regarding the origins of thisinhibition (18, 25). An interesting correlation is that bothMMP9/TIMP1 and MMP2/TIMP2 form proenzyme inhibitorcomplexes. It would be interesting to determine whether thetemporal aspects of biphasic inhibition also are presentbetween MMP9/TIMP3, MMP2/TIMP3, and MMP2/TIMP4,which are also capable of proenzyme inhibitor complexes. Thismay help to further clarify the role of the C-terminal domainand answer which of schemes III* and IV is involved in theobserved dynamics of inhibition. Evidence for scheme IVwouldcome from simultaneous direct observation of two or moreisoforms ofMMP9 and a dependence of the temporal dynamicsof inhibition (at a fixed active MMP9 concentration) on theprotocol used for MMP9 activation.We should also note that despite using the progress curve
data of Olson et al. (19), our determination ofMMP9 inhibitionby TIMP1 produced Ki values that were at least 3 orders ofmagnitude smaller, consistent with the pM range of Ki foundpreviously (18, 20, 33). This may be a result of different meth-odology. Whereas Olson et al. (19) (and other experimentalstudies) have used estimates from kinetic theory derived forslow binding inhibitors (34), we have numerically integratedthe differential equations resulting from our various reactionmechanisms. Both methods depend on the assumptions usedbetween enzyme, inhibitor, and substrate binding. In ourmethod, we have no guarantee of finding the globally error-minimizing set of parameters. However, we were able to cometo within a factor of 1.3 of the error-minimizing manifold; thus
TABLE 4Conclusions and predictions
No. Novel?Robust conclusions1 MMP13 and MMP3 are equally competent activators of MMP9, followed by MMP10 Yes2 MMP9 inhibition by TIMP2 and MMP2 inhibition by TIMP1 can be sufficiently modeled using a single step binding reaction No3 MMP9 inhibition by TIMP1 and MMP2 inhibition by TIMP2 can be resolved using either a two-step binding isomerization
reaction with partially active intermediate complex or a two isoform MMP model. MMP9 inhibition by TIMP1 is verystrong with pM Ki
No
4 Experimentally observed cases of MMP9 deactivation cannot be solely due to heterolytic processing by an MMP9 activator YesSpeculative conclusions1 The dynamics of inhibition of some quantity of active MMP9 by TIMP1 is significantly influenced by the method of MMP9
activationYes
2 MMP9 deactivation occurs via homolytic processing Yes3 Pro-MMP9 activation in conditions where TIMP exceeds an MMP activator will display a lag in MMP9 activity followed by a
relatively sharp rise in the rate of activationNo
4 The intermediates of pro-MMP9�TIMP1 and pro-MMP9�TIMP1�MMP3 complex activation are active, but the relativeactivities of the two to TIMP-free MMP9 remain unknown
No
5 Pro-MMP9�TIMP1 complexes are activated at a reduced rate compared with free MMP9 No6 Pro-MMP9 TIMP1 complexation may provide two competing effects on MMP9 activity. It may result in reduced rates of
activation of complexes, but it may also lead to increased persistence of the active formsYes
7 The MMP3/TIMP2/pro-MMP9 system does not exhibit an overshoot in MMP9 activity, whereas the MMP3/TIMP1/pro-MMP9 system does
Yes
Biochemical Model of MMP9 Activation and Inhibition
37594 JOURNAL OF BIOLOGICAL CHEMISTRY VOLUME 282 • NUMBER 52 • DECEMBER 28, 2007
by guest on January 28, 2015http://w
ww
.jbc.org/D
ownloaded from
we do not expect our methodology to account for the largedifference in magnitude of Ki. At present, it is not clear whatother factors may have led to the different results.Next, we studied MMP9 deactivation, a process for which
little is known.Most of the kinetic studies we have encounteredshowed some degree of deactivation.Whether this is an artifactof experimental protocol or a feature of theMMP and activatorsystem can only be revealed by more accurate quantificationand reporting. Our simulations support homolytic deactiva-tion. This result is contrary to the typical assumption of het-erolytic deactivation when deactivation does occur. How-ever, the experimental data we studied, Okada et al. (13) andSang et al. (24), clearly show that this process cannot bepurely activator-driven, on the grounds that MMP9 deacti-vation seemed largely insensitive to the activator concentra-tion. Because of significant differences in deactivationbetween different studies, more detailed experimental workin this field is definitely needed.Finally, our attempt to characterize MMP9 activation by
MMP3 in the presence of MMP inhibitors revealed a noveltemporal behavior where the activity of MMP9 increasesbecause of activation but then decreases because of a slowerinhibition response. Despite TIMP1 being the stronger inhibi-tor of MMP9 than TIMP2, we found this overshoot behaviorprevalent in our numerical simulations (and sensitivity analy-ses) of the MMP3/TIMP1/pro-MMP9 system, but not in thoseof the MMP3/TIMP2/pro-MMP9 system. This overshoot isenabled when the process of inhibition occurs in series withthe process of activation (as opposed to in parallel). In ourcase, overshoot was mainly a result of the accumulation ofthe MMP9�TIMP1�MMP3 intermediate, which was assumedto be incapable of inhibition. However, this assumptionmight be accurate as quaternary complexes are not observedin the literature. On the other hand, this complex has alsobeen shown to be capable of substrate proteolysis, whichcould have also resulted from partial dissociation of theMMP9. If we naturally assume the activity of the complex isdiminished compared with free MMP9, the overshoot inMMP9 activity does indeed decrease and is delayed. Wefound similar behavior when we assumed decreased rates offormation or increased rates of dissociation of the intermedi-ates (or even a weakened MMP3/TIMP1 interaction allowingmoreTIMP1 to inhibitMMP9). Underlying these is the balancebetween the rates of MMP9 formation and inhibition.The data we analyzed can support overshoot, but this is not
necessary (Fig. 6,D–F). Direct experimental data showing over-shootmay also exist (14); however, they need to be confirmed inthe absence of MMP9 deactivation. Ultimately, this can lead tosimplification of complex systems such asMMP3/TIMP1/pro-MMP9 into the “effective” simpler systems such asMMP3/TIMP2/pro-MMP9.The cellular context in which the studied processes are
relevant is still being explored. These conclusions will hope-fully help guide future efforts to understand complex proteo-lytic systems, which we are pursuing in the context of angio-genesis. In this arena,MMP9 is hypothesized to play a varietyof functions from proteolyzing type IV collagen in basementmembranes surrounding activated endothelial cells to
releasing vascular endothelial growth factor sequestered onglycosaminoglycan chains of proteoglycans. Using computa-tional models, we can numerically study the effect of MMP9and other MMPs and TIMPs on growth factor-mediatedangiogenesis. Ultimately, MMP9 and TIMPs may have otheryet unknown functions. However, the importance of compu-tational models lies in their ability to verify if current bio-chemical understanding is physically realizable, especially indynamic and spatially complex cellular environments.
REFERENCES1. Fridman, R., Toth, M., Chvyrkova, I., Meroueh, S. O., and Mobashery, S.
(2003) Cancer Metastasis Rev. 22, 153–1662. Nguyen, M., Arkell, J., and Jackson, C. J. (2001) Int. J. Biochem. Cell Biol.
33, 960–9703. Wilhelm, S. M., Collier, I. E., Marmer, B. L., Eisen, A. Z., Grant, G. A., and
Goldberg, G. I. (1989) J. Biol. Chem. 264, 17213–172214. Patterson, B. C., and Sang, Q. A. (1997) J. Biol. Chem. 272, 28823–288255. Bergers, G., Brekken, R., McMahon, G., Vu, T. H., Itoh, T., Tamaki, K.,
Tanzawa, K., Thorpe, P., Itohara, S., Werb, Z., and Hanahan, D. (2000)Nat. Cell Biol. 2, 737–744
6. Engsig,M. T., Chen, Q. J., Vu, T. H., Pedersen, A. C., Therkidsen, B., Lund,L. R., Henriksen, K., Lenhard, T., Foged,N. T.,Werb, Z., andDelaisse, J.M.(2000) J. Cell Biol. 151, 879–889
7. Lee, S., Jilani, S. M., Nikolova, G. V., Carpizo, D., and Iruela-Arispe, M. L.(2005) J. Cell Biol. 169, 681–691
8. Fridman, R., Toth, M., Pena, D., andMobashery, S. (1995) Cancer Res. 55,2548–2555
9. Ogata, Y., Enghild, J. J., and Nagase, H. (1992) J. Biol. Chem. 267,3581–3584
10. Imai, K., Yokohama, Y., Nakanishi, I., Ohuchi, E., Fujii, Y., Nakai, N., andOkada, Y. (1995) J. Biol. Chem. 270, 6691–6697
11. Nakamura, H., Fujii, Y., Ohuchi, E., Yamamoto, E., and Okada, Y. (1998)Eur. J. Biochem. 253, 67–75
12. Knauper, V., Smith, B., Lopez-Otin, C., andMurphy, G. (1997) Eur. J. Bio-chem. 248, 369–373
13. Okada, Y., Gonoji, Y., Naka, K., Tomita, K., Nakanishi, I., Iwata, K., Ya-mashita, K., and Hayakawa, T. (1992) J. Biol. Chem. 267, 21712–21719
14. Bannikov, G. A., Karelina, T. V., Collier, I. E.,Marmer, B. L., andGoldberg,G. I. (2002) J. Biol. Chem. 277, 16022–16027
15. Shapiro, S. D., Fliszar, C. J., Broekelmann, T. J., Mecham, R. P., Senior,R. M., and Welgus, H. G. (1995) J. Biol. Chem. 270, 6351–6356
16. Goldberg,G. I., Strongin, A., Collier, I. E., Genrich, L. T., andMarmer, B. L.(1992) J. Biol. Chem. 267, 4583–4591
17. Cha, H., Kopetzki, E., Huber, R., Lanzendorfer, M., and Brandstetter, H.(2002) J. Mol. Biol. 320, 1065–1079
18. O’Connell, J. P., Willenbrock, F., Docherty, A. J., Eaton, D., and Murphy,G. (1994) J. Biol. Chem. 269, 14967–14973
19. Olson,M.W., Gervasi, D. C.,Mobashery, S., and Fridman, R. (1997) J. Biol.Chem. 272, 29975–29983
20. Troeberg, L., Tanaka, M., Wait, R., Shi, Y. E., Brew, K., and Nagase, H.(2002) Biochemistry 41, 15025–15035
21. Watanabe, H., Nakanishi, I., Yamashita, K., Hayakawa, T., and Okada, Y.(1993) J. Cell Sci. 104, 991–999
22. Karagiannis, E. D., and Popel, A. S. (2004) J. Biol. Chem. 279, 39105–3911423. Olson,M.W., Bernardo,M.M., Pietila,M., Gervasi, D. C., Toth,M., Kotra,
L. P.,Massova, I.,Mobashery, S., and Fridman, R. (2000) J. Biol. Chem. 275,2661–2668
24. Sang, Q. X., Birkedal-Hansen, H., and Van Wart, H. E. (1995) Biochim.Biophys. Acta 1251, 99–108
25. Hutton, M., Willenbrock, F., Brocklehurst, K., and Murphy, G. (1998)Biochemistry 37, 10094–10098
26. Taylor, K. B., Windsor, L. J., Caterina, N. C., Bodden, M. K., and Engler,J. A. (1996) J. Biol. Chem. 271, 23938–23945
27. Baragi, V. M., Fliszar, C. J., Conroy, M. C., Ye, Q. Z., Shipley, J. M., andWelgus, H. G. (1994) J. Biol. Chem. 269, 12692–12697
Biochemical Model of MMP9 Activation and Inhibition
DECEMBER 28, 2007 • VOLUME 282 • NUMBER 52 JOURNAL OF BIOLOGICAL CHEMISTRY 37595
by guest on January 28, 2015http://w
ww
.jbc.org/D
ownloaded from

28. Hahn-Dantona, E., Ramos-DeSimone, N., Sipley, J., Nagase, H., French,D. L., and Quigley, J. P. (1999) Ann. N. Y. Acad. Sci. 878, 372–387
29. Kolkenbrock, H., Orgel, D., Hecker-Kia, A., Zimmermann, J., and Ulbrich,N. (1995) Biol. Chem. Hoppe-Seyler 376, 495–500
30. Ogata, Y., Itoh, Y., andNagase, H. (1995) J. Biol. Chem. 270, 18506–1851131. Nguyen, Q., Willenbrock, F., Cockett, M. I., O’Shea, M., Docherty, A. J.,
and Murphy, G. (1994) Biochemistry 33, 2089–2095
32. Butler, G. S., Apte, S. S., Willenbrock, F., and Murphy, G. (1999) J. Biol.Chem. 274, 10846–10851
33. Willenbrock, F., Crabbe, T., Slocombe, P. M., Sutton, C. W., Docherty,A. J., Cockett, M. I., O’Shea, M., Brocklehurst, K., Phillips, I. R., and Mur-phy, G. (1993) Biochemistry 32, 4330–4337
34. Morrison, J. F., and Walsh, C. T. (1988) Adv. Enzymol Relat. Areas Mol.Biol. 61, 201–301
Biochemical Model of MMP9 Activation and Inhibition
37596 JOURNAL OF BIOLOGICAL CHEMISTRY VOLUME 282 • NUMBER 52 • DECEMBER 28, 2007
by guest on January 28, 2015http://w
ww
.jbc.org/D
ownloaded from
and Aleksander S. PopelPrakash Vempati, Emmanouil D. Karagiannis InhibitionMetalloproteinase 9 Activation and A Biochemical Model of MatrixBiomolecular Networks:
doi: 10.1074/jbc.M611500200 originally published online September 11, 20072007, 282:37585-37596.J. Biol. Chem.
10.1074/jbc.M611500200Access the most updated version of this article at doi:
.JBC Affinity SitesFind articles, minireviews, Reflections and Classics on similar topics on the
Alerts:
When a correction for this article is posted•
When this article is cited•
to choose from all of JBC's e-mail alertsClick here
Supplemental material:
http://www.jbc.org/content/suppl/2007/09/12/M611500200.DC1.html
http://www.jbc.org/content/282/52/37585.full.html#ref-list-1
This article cites 34 references, 20 of which can be accessed free at
by guest on January 28, 2015http://w
ww
.jbc.org/D
ownloaded from