Extract of Cordyceps militaris inhibits angiogenesis and ...
Upload
wilburwrightCategory
view
0download
0
Hindawi Publishing CorporationJournal of OncologyVolume 2010, Article ID 928628, 14 pagesdoi:10.1155/2010/928628
Research Article
Inhibition of Melanoma Angiogenesis byTelomere Homolog Oligonucleotides
Christina Coleman,1 Danielle Levine,1 Raj Kishore,2 Gangjian Qin,2 Tina Thorne,2
Erin Lambers,2 Sharath P. Sasi,3 Mina Yaar,1 Barbara A. Gilchrest,1
and David A. Goukassian1, 3
1 Department of Dermatology, Boston University School of Medicine, Boston, MA 02118, USA2 Feinberg Cardiovascular Research Institute, Feinberg School of Medicine, Chicago, IL 60611, USA3 Division of Cardiovascular Research, Department of Medicine, Center of Cancer Systems Biology,Caritas St. Elizabeth’s Medical Center of Boston, MA 02135, USA
Correspondence should be addressed to David A. Goukassian, [email protected], [email protected]
Received 13 November 2009; Revised 6 May 2010; Accepted 7 May 2010
Academic Editor: Arkadiusz Dudek
Copyright © 2010 Christina Coleman et al. This is an open access article distributed under the Creative Commons AttributionLicense, which permits unrestricted use, distribution, and reproduction in any medium, provided the original work is properlycited.
Telomere homolog oligonucleotides (T-oligos) activate an innate telomere-based program that leads to multiple anticancer effects.T-oligos act at telomeres to initiate signaling through the Werner protein and ATM kinase. We wanted to determine if T-oligoshave antiangiogenic effects. We found that T-oligo-treated human melanoma (MM-AN) cells had decreased expression of vascularendothelial growth factor (VEGF), VEGF receptor 2, angiopoeitin-1 and -2 and decreased VEGF secretion. T-oligos activatedthe transcription factor E2F1 and inhibited the activity of the angiogenic transcription factor, HIF-1α. T-oligos inhibited ECtubulogenesis and total tumor microvascular density matrix invasion by MM-AN cells and ECs in vitro. In melanoma SCIDxenografts, two systemic T-oligo injections decreased by 60% (P < .004) total tumor microvascular density and the functionalvessels density by 80% (P < .002). These findings suggest that restriction of tumor angiogenesis is among the host’s innatetelomere-based anticancer responses and provide further evidence that T-oligos may offer a powerful new approach for melanomatreatment.
1. Introduction
Angiogenesis, the formation of new blood vessels, is essentialfor tumor growth and metastasis [1] and inhibition ofangiogenesis is an important new approach for therapy ofmany cancers [1, 2]. A principal regulator of angiogenesis isvascular endothelial growth factor (VEGF) [3]. The VEGFfamily is comprised of at least five genes (VEGF A throughE), of which the most potent activators of angiogenesis areVEGF-A and VEGF-B [4]. Analysis of the VEGF-A (termedVEGF here and elsewhere in the text) gene promoter regionhas revealed numerous potential transcriptional activatorsites [4]. One of the best studied stimuli for VEGF synthesisand secretion is hypoxia, which acts by upregulating hypoxiainducible factor-1α (HIF-1α) [5]. Inhibition of HIF-1αmay therefore decrease angiogenesis by reducing VEGF
levels and potentially other proangiogenic factors, suchas angiopoeitin-1 and -2 (Ang-1 and Ang-2) [6–8], basicfibroblast growth factor (bFGF), and platelet derived growthfactor (PDGF), all well known regulators of angiogenesis [1].
The role of E2F1 in apoptosis is well recognized. It canact in concert with p53 or independent of p53 to induceapoptosis [9]. T-oligos, telomere homolog oligonucleotides,activate p53 and E2F1, resulting in apoptosis [10]. However,in p53 null cells like malignant melanoma AN cells (MM-AN), apoptosis is induced by the p53 homolog p73 [11],presumably acting coordinately with E2F1. Moreover, E2F1has also been reported to inhibit angiogenesis [9, 12]. WhileE2F1 decreases VEGF production in fibroblasts through p53activation [12], its effect on angiogenesis in cells that lackfunctional p53, such as MM-AN cells has not been studied[11, 13].
2 Journal of Oncology
Several lines of evidence suggest that normal cells havean integrated program of genome-protective responses,functionally analogous to the bacterial SOS response [14],that is based in the telomeres and appears to be abrogatedin malignancy [15]. Telomeres, the ends of chromosomes, aremaintained in a loop configuration by insertion of the single-stranded 3′ overhang into the proximal telomere duplex [16].Disruption of this loop structure by removal of the principalbinding protein TRF2 (telomere repeat binding factor 2)leads to exposure and digestion of the overhang and activa-tion of ATM (ataxia telangiectasia mutated) and its effectorprotein p53, followed by apoptosis or senescence, dependingon cell type [16]. Knockdown of another telomere-associatedprotein, the protection of telomeres-1 (POT-1), also expectedto expose the TTAGGG telomere repeat sequence, activatesATR (ataxia telangiectasia and Rad3-related), leading tosimilar downstream effects [16, 17]. Moreover, treatmentof malignant cells with RNAi to knockdown the expressionof TER, the RNA subunit of telomerase, rapidly alters theexpression of many genes in a pattern predicted to reducecancer cell proliferation and invasiveness [18], then leads toapoptosis in a time course far too rapid to be attributableto the expected loss of telomerase activity and consequenttelomere shortening, suggesting that other telomere-basedeffects are responsible [18].
Our laboratory has described several anticancer proper-ties of oligonucleotides homologous to the telomere repeatsequence TTAGGG (T-oligos) [10, 11, 13, 15, 19–28]. T-oligos provided to cultured cells rapidly accumulate inthe nucleus and mediate DNA damage responses withoutdigestion of the telomere overhang or other detectable effectson genomic DNA [10, 13, 15, 19, 23, 25, 26, 29]. T-oligos activate the ATM kinase [21, 27], upregulate andactivate p53 [30, 31], as well as upregulate and/or activate itshomolog p73, E2F1, p16INK4a, p33, p27, and p95/Nbs1, andphosphorylate the histone variant protein H2AX [11, 13, 21,22, 24, 25]. In addition, T-oligos promote differentiation ofmelanoma cells and downregulate the inhibitor of apoptosisprotein IAP/livin in these cells [13]. T-oligo effects requireWRN [22], the protein mutated in the progeroid cancer-prone Werner syndrome [32], and are associated withformation of classic DNA damage foci at telomeres [22].In combination, these signaling cascades result in inductionof apoptosis, autophagy, and/or senescence selectively incancer cells [13, 19, 27, 28]; while in normal cells theylead to transient cell cycle arrest, increased DNA repaircapacity and adaptive differentiation [19, 21, 23, 25–27, 30].Complementary, unrelated, or scrambled oligonucleotidescomparably accumulate in the nucleus, but do not causeDNA damage-like signaling or affect growth, differentiationor survival of malignant cells [11, 13, 15, 19, 21, 24, 27, 28].
Because the T-oligo-induced transcription factors p53,p73, and E2F1 are known to affect endothelial cell (EC)survival, differentiation, and proliferation during tumorangiogenesis [12, 33, 34] and because blocking angiogenesiswould be an additional anticancer mechanism of action forT-oligos, we asked whether T-oligo treatment inhibits tumorangiogenesis. We now report that T-oligo inhibits angiogen-esis in the aggressive human melanoma cell line MM-AN,
derived from a metastatic melanoma [35], by decreasingproduction and secretion of proangiogenic factors in bothtumor cells and ECs. As well, T-oligo treatment decreases thenumber of total and functional (perfused) vessels in flanktumors of MM-AN cells in SCID mice after two systemicinjections.
2. Materials and Methods
2.1. Cell Cultures. Human microvascular endothelial cells(HMVECs) and human umbilical vein endothelial cells(HUVECs) were obtained at passage 2 and used by passage4–6. Cells were maintained in EGM-2 medium with 2%FBS plus growth factors (bullet kit) (Cambrex Bio Sciences,Walkersville, MD). Human melanoma MM-AN and EP cells[35] were cultured in modified Eagle’s medium (MEM)(Mediatech, Inc., Herndon, VA) supplemented with fetalbovine serum (FBS 2%), calf serum (CS 8%), and antibiotic-antimicotic. Human breast adenocarcinoma (MCF-7) andovarian adenocarcinoma (OVCAR3) cells were cultured andmaintained according to ATCC recommendations. All cellswere incubated at 37◦ with 5% CO2.
2.2. Oligonucleotides. We used a 16-base 100% telomerehomolog with the sequence 5′-GTTAGGGTTAGGGTTA-3′ and phosphodiester backbone. The oligonucleotide wassynthesized by Midland Certified Reagent (Midland, TX) andthen diluted from a 2 mM stock in medium to obtain a finalconcentration of 40 μM.
2.3. Quantitative Real-Time Polymerase Chain Reaction (qRT-PCR). MM-AN, EP, MCF-7, and OVCAR3 cells were grownin their corresponding media and treated once with dilu-ent or 40 μM T-oligo. For qRT-PCR, we performed areverse transcription reaction then amplified specific genesas described [36]. mRNA expression levels were assessedfor E2F1, ANG-1, and ANG-2. The sequences used wereas follows: E2F1 forward: CGGTGTCGTCGACCTGAACT,E2F1 reverse: AGGACGTTGGTGATGTCATAGATG, E2F1probe: TGCCGAGGTGCTGAAGGTGCAG; ANG-1 for-ward: CAGAAAACAGTGGGAGAAGATATAACC, ANG-1 reverse: TGCCATCGTGTTCTGGAAGA, ANG-1 probe:CAACATGGGCAATGTGCCTACACTTTC; ANG-2 for-ward: GGCTGGGCAATGAGTTTGTC, ANG-2 reverse:CCCAGTCCTTCAGCTGGATCT; ANG-2 probe: ACC-GGTCAGCACCGCTACGTGC.
2.4. Electromobility Shift Assay (EMSA). Cells were treatedwith diluent or 40 μM T-oligo and harvested 0, 1, 16, and 32hours after treatment. EMSAs were carried out as described[10] using a total of 5 μg of nuclear protein per lane. Theassay was performed using consensus sequences of E2F1and HIF-1α transcription factors (Santa Cruz Biotechnology,CA). The specificity of the bands was confirmed by usingeither ×25 or ×50 excess of cold probe as competitor andmutant oligos as control. As an additional negative control,nuclear extracts were incubated with a specific competing

Journal of Oncology 3
E2F1 antibody before adding the radioactive (32P-labelled)consensus oligonucleotides.
2.5. Western Blot Analysis. Cells were treated with T-oligos,harvested at various times, snap-frozen, and stored at−70◦C.Total cellular protein was isolated and 50 μg of total proteinwas processed for western blot analysis as described [10].Antibody reactions were performed with the following anti-bodies: anti-E2F1 (Neomarkers, Inc., Fremont, CA), anti-VEGF-A (sc-507, Santa Cruz Biotechnology, Inc, Santa Cruz,CA) that recognizes all VEGF-A isoforms, and anti-VEGF-R2 (a kind gift from Dr. Nader Rahimi, Departments ofOphthalmology and Biochemistry, Boston University Schoolof Medicine).
2.6. VEGF Enzyme-Linked Immunosorbent Assay (ELISA).The Human VEGF Immunoassay kit (Quantikine, R&DSystems, Minneapolis, MN) was used to compare the releaseof VEGF into the medium by ECs and MM-AN cells. Eachcell type was cultured in its appropriate medium and treatedwith either diluent or T-oligo (40 μM). The conditionedmedium was collected at 24, 48, and 72 hours after treatmentand frozen at −70◦C until it processed for ELISA. The assaywas performed according to the manufacturer’s protocol(R&D Systems). The plate was read using the Tecan Spectramodel 96 Well Microplate Reader (MTX Lab Systems,Vienna, VA).
2.7. Tubulogenesis Assay. 200 μL of Matrigel basement mem-brane matrix (phenol-red free) (BD Biosciences, Bedford,MA) was added per 4-well chamber slide and allowed tosolidify for 1 hour at 37◦C. HUVECs (50,000 cells) were thenadded to each chamber in 500 μL of medium as described[37]. Cells were treated at the time of plating with diluent,40 μM, 80 μM, or 120 μM of T-oligo. Some of the cells treatedwith 40 μM of T-oligo were retreated a second time at 2hours postplating, at the time tube-formation could first bedetected by phase microscopy. Some cells that were treatedtwice with 40 μM of T-oligo received a third treatment6 hours after plating. Tube-formation was observed andphotographed at numerous time points starting from 2 hoursand up to 24 hours after treatment. Of note, after tubularstructures formed in control wells, they stayed intact up to72 hours (data not shown). Image-Tool (The University ofTexas Health Science Center in San Antonio, San Antonio,TX) software was used to quantify the length of tubularstructures.
2.8. Invasion Assay. The BioCoat Matrigel Invasion Chamber(BD Biosciences, Bedford, MA) was used for this assay.MM-AN cells were treated with diluent or 40 μM T-oligoand media were collected after 72 hours, based on ELISAdata (MM-AN conditioned media). Conditioned MM-ANmedium was then used as the chemoattractant for the assay.ECs and MM-AN cells were grown on the inserts (upperchambers) and allowed to invade through the Matrigel andattach to the membrane as described in the manufacturer’sprotocol. Invasion was assessed after 22 hours by staining
with Diff-Quick (Fisher, Atlanta, GA) bisected membranesfrom the bottom of the chambers (containing the invadingcells) as described in the manufacturer’s protocol. Of note,we believe that any effect on ECs or MM-AN invasion cannotbe attributed to residual active T-oligos in the conditionedmedium, diffusing into the upper chamber and killing MM-AN cells, because T-oligos are rapidly degraded in serum-containing medium. With a measured half-life for a 12-basetelomere homolog of 4–6 hours [38], the 16-base T-oligowould thus have been present in the medium after 72 hoursof conditioning at an estimated (1/2)12 or 107-fold less thanthe initial therapeutic concentration.
2.9. SCID Melanoma Flank Xenograft Model. All studieswere approved by Boston University’s IACUC Committee.2 × 106 MM-AN cells were injected subcutaneously into theflank of 6 week old SCID mice (Fox-Chase Cancer Center,Philadelphia, PA). Mice (5-6 per treatment group) wereinjected via tail vein with T-oligo or diluent alone whentumors were first palpable (2-3 mm diameter). Tumor sizeswere recorded every 2-3 days throughout the experimentusing electronic callipers and all animals were sacrificed 4weeks after tumor inoculation. The diagnosis of melanomawas confirmed histologically on sections of each nodule cutthrough the center of the clinical tumor.
2.10. Quantification of Tumor Microvessel Density. All studieswere approved by Boston University’s IACUC Committee.2 × 106 MM-AN cells were injected subcutaneously intothe flank of 6 week old SCID mice (Fox-Chase CancerCenter, Philadelphia, PA). Then mice (5-6 per treatmentgroup) were injected via the tail vein with T-oligo ordiluent alone (60 nmoles/injection, 15 mg/kg) when tumorswere first palpable (2-3 mm diameter). Microvascular density(MVD) in bisected tumors were assessed 24 hours aftertwo systemic injections of T-oligos by using two EC-specificmarkers CD31 (PECAM-1) [12] and Bandeurea simplicifolia(BS)-1 lectin conjugated to Rhodamine (Vector Laboratories,Burlingame, CA) [39]. To measure functional MVD inthe tumor tissue, 30 minutes before sacrifice a set ofmice (5 per treatment group) were anesthetized and wereperfused with 0.5 mg (in 100 μl of isotonic solution) ofRhodamine-conjugated BS-1 lectin as described [40, 41]. Tomeasure total MVD, 6 μm cross-sections of bisected tumortissue (of the same mice perfused with BS-1 lectin) werestained with CD31 primary antibody followed by FITC-labelled secondary antibody as described [12]. Samples werephotographed using a multicolour fluorescence microscope(Nikon, Nikon Instruments Inc, Melville, NY), and analyzedusing a digital image analysis system (Nikon). The diagnosisof melanoma was confirmed histologically in tumor sectionsof each nodule.
2.11. Statistical Analysis. ANOVA with post hoc analysisby Scheffe and Bonferroni-Dunn and unpaired t-Test wereperformed using StatView (SAS Institute, Inc., Version 5.0).Statistical significance was established at P < .05.

4 Journal of Oncology
+−+−0 4824
Hours after treatment
VEGF
Actin
T-oligo
(a)
+−+−0 4824
Hours after treatment
0
40
80
120
160
VE
GF
prot
ein
(tim
e0
(%))
P < .01
T-oligo
(b)
+−+−0 4824
Hours after treatment
0
50
100
150
250
200
300
AN
G-1
mR
NA
leve
l(ti
me
0(%
))
P < .01
T-oligo
(c)
+−+−0 4824
Hours after treatment
0
50
100
150
200
250
AN
G-2
mR
NA
leve
l(ti
me
0(%
))
P < .04
T-oligo
(d)
+−+−+−724824
Hours after treatment
0
200
400
600
800
VE
GF
rele
ase
over
72hr
(%)
P < .0008
T-oligo
(e)
Figure 1: T-oligo treatment down-regulates expression of VEGF, Ang-1, Ang-2 and decreases VEGF production in MM-AN cells. MM-ANcells were treated once at time 0 with either 40 μM T-oligo or diluent alone. (a) Western blot analysis of VEGF protein level. (b) Densitometricanalysis of VEGF protein levels (after loading adjustment against actin expression) represented as a percent of time 0 level. Graphs representpooled data (mean ± SEM) from three independent experiments. (c) and (d) Quantitative real time-PCR (qRT-PCR) of MM-AN cellstreated with either 40 μM T-oligo or diluent alone. Results are presented as percent of time 0 (set at 100%) and examined over 48 hours forboth control and T-oligo-treated cells. ANG-1 gene expression. (c) ANG-2 gene expression. (d) These experiments are repeated twice withsimilar results. (e) MM-AN cells were treated with 40 μM T-oligo or diluent alone. The culture medium was collected after 24, 48, and 72hours. Cumulative VEGF protein released into the medium was measured by ELISA. Results represent data pooled from triplicate dishes foreach time point and treatment condition. Changes over time are calculated as percent of the 24 hours values (set at 100%).
3. Results
3.1. T-oligo Treatment Decreases the Expression and Level ofAngiogenic Factors and Reduces VEGF Release into MM-ANCell Medium. MM-AN cells were treated once with T-oligoor diluent alone, provided in fresh medium, and processedfor western blot analysis. Compared to diluent, T-oligodecreased VEGF protein level at 24 hours (P < .01) by ∼41%and at 48 hours (P = NS) by ∼32% (Figures 1(a) and 1(b)).In addition, after 48 hours T-oligo treatment reduced ANG-1mRNA (P < .01) by ∼60% (Figure 1(c)) and ANG-2 mRNA
(P < .04) by ∼45% (Figure 1(d)). Similar decreases in VEGF(Supplemental Figures 1(a)–1(c) and ANG-1 (SupplementalFigures 2(a)–2(c)) mRNA were seen in a second humanmelanoma line EP, as well as in other malignant cell types.
Paired dishes of MM-AN and ECs were treated with40 μM T-oligo or diluent alone once. Medium was collectedafter 24, 48 and 72 hours and VEGF level in the mediumwas measured by ELISA. In ECs (HMVEC and HUVEC),there was a∼50%–75% variable and statistically insignificantdecrease in VEGF release into the medium over time inboth diluent- and T-oligo-treated cells (data not shown).

Journal of Oncology 5
In contrast, total VEGF release from MM-AN cells indiluent-treated dishes rose progressively over 72 hours to∼600% (of 24-hours VEGF levels), while VEGF release inT-oligo-treated dishes was decreased (P < .0008) by ∼30%over the 72-hours experiment after a single dosing at time0 (Figure 1(e)). Thus, T-oligo not only decreased VEGFprotein expression in tumor cells but also the release ofthis potent angiogenic factor into the surrounding culturemedium.
3.2. T-oligo Upregulates E2F1 Gene Expression, Protein Level,and DNA Binding Activity and Decreases the DNA BindingActivity of the Angiogenic Transcription Factor HIF-1α. E2F1mRNA expression was increased at 24 hours (P < .0001) by∼41% and at 48 hours (P < .0001) by ∼100% in T-oligo-treated MM-AN cells compared to control (Figure 2(a)).Similar increases in E2F1 mRNA were seen in a secondhuman melanoma line EP, as well as in other malignant celltypes (Supplemental Figures 3(a)–3(c)). T-oligo treatmentalso increased E2F1 protein level at 24 hours to ∼218% andat 48 hours to ∼286% (P < .02) of control values (Figures2(b) and 2(c)). In addition, there was a doubling in E2F1DNA binding activity 32 hours after treatment compared todiluent-treated cells (Figures 2(d) and 2(e), compare lane 3versus 4).
MM-AN cells were treated once with T-oligo or diluentalone and nuclear proteins were harvested up to 32 hoursafter treatment to evaluate DNA binding activities of theangiogenic transcription factor HIF-1α. There was ∼80%–95% decrease in HIF-1α DNA binding activity at 1 and 16hours after treatments (Figures 2(f) and 2(g), lanes 3 versus4, and 5 versus 6, respectively). These data suggest that T-oligo-mediated inhibition in DNA binding activity of HIF-1α transcription factor contributes to decreased expression ofthe angiogenic factors, VEGF and ANG-1, whose promoterscontain binding sites for HIF-1α [42].
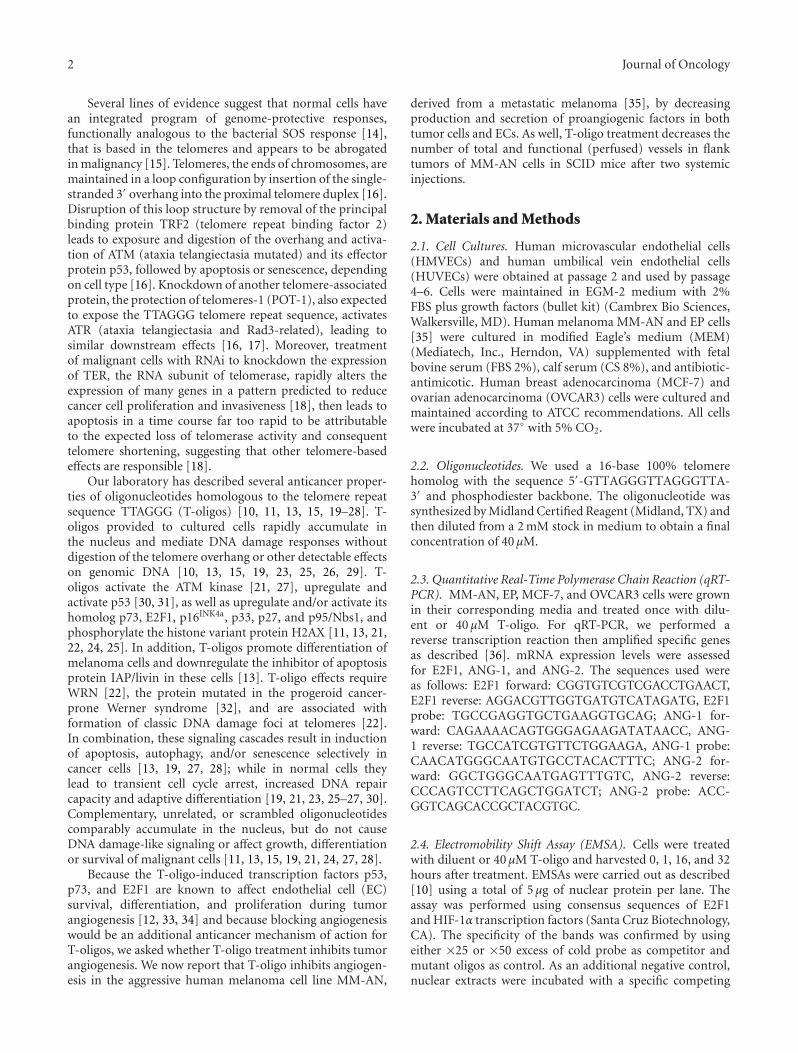
3.3. T-oligo Inhibits Matrigel Invasion by Melanoma Cells andECs. We used MM-AN medium collected 72 hours afteraddition of T-oligo or diluent alone (MM-AN conditionedmedia: T-oligo CM or diluent CM) as the chemoattractantfor an in vitro invasion assay [43]. MM-AN and HMVECswere both evaluated for invasion through Matrigel todetermine if T-oligo treatment reduces the chemoattractantproperties of MM-AN cells. As recommended by the man-ufacturer of the Matrigel invasion kit, after 22 hours ofincubation the invading cells were fixed, stained and countedfor each membrane. MM-AN cells plated above T-oligo CMhad a ∼96% decrease in invasion (P < .03) through Matrigel(Figures 3(a) and 3(b)). HMVECs plated on inserts coatedwith Matrigel and exposed to T-oligo CM had a ∼40%reduction in Matrigel invasion compared to controls, butthis did not reach statistical significance (P < .08) (Figures3(c) and 3(d)). These findings demonstrate that T-oligosreduce the migration/invasion of MM-AN cells towardschemoattractant stimuli and, possibly, to a lesser degreeaffect HMVECs. This is consistent with the observationthat MM-AN cells elaborate factors that promote migration
and invasion of tumor cells, like VEGF and ANG-1, andthat these factor(s) are reduced as a result of T-oligotreatment.
3.4. T-oligo Treatment Decreases the Expression of VEGFand VEGFR-2 in Endothelial Cells. Because VEGF signal-ing through VEGFR-2 is principally responsible for ECsurvival, proliferation, migration, and angiogenesis [44–47], we examined the effect of T-oligo treatment on theseproteins. HMVECs and HUVECs were grown and treatedwith 40 μM T-oligo or diluent alone. Compared to diluent-treated control cells there was a decrease (P < .004) of∼86% in VEGF expression at 24 hours and an insignificantdecrease of ∼50% at 48 hours in T-oligo-treated samples(Figures 4(a)–4(c)). In addition, in T-oligo-treated HMVECsand HUVECs there were ∼29% (P = NS) and ∼59% (P <.04) reduction in the protein level of VEGFR-2 at 24 and48 hours, respectively (Figures 4(d)–4(f)). Thus, T-oligo-mediated antiangiogenic effects on ECs may be, in part, dueto inhibition of VEGF-VEGR2 axis.
3.5. T-oligo Inhibits EC Function In Vitro in TubulogenesisAssay. HMVECs were plated on Matrigel in 4-well chamberslides in serum-containing medium and treated with diluentalone or increasing concentrations of T-oligo. Tube-likestructure formation was maximal in controls at 22 hoursand formal comparisons were made after 2–22 hours, ascustomary for this assay [39]. By 22 hours, in cells treatedonce with either 40 μM or 80 μM T-oligo there was a ∼19% reduction in average tube length compared to cellstreated with diluent alone (P = NS) (Figures 5(a) and5(b)). Cells treated with two separate doses of 40 μM T-oligo at plating and 2 hours after plating showed a ∼35%reduction in average tube length (P < .03). Cells treated onceat plating with 120 μM T-oligo showed a ∼58% reductionin average tube length compared to the diluent-treated cells(P < .001). A reduction of ∼83% (P < .0001) in tubelength was observed in cells treated with 3 separate dosesof 40 μM T-oligo (40 μM ×3) added to the medium at thetime of plating and then at 2 and 6 hours (Figures 5(a)and 5(b)). These results indicate that T-oligo inhibits ECfunction in a manner dependent on the dose and frequencyof administration, with the caveat that the very large amountof oligos administered, rather that specific telomere-based T-oligo initiated signalling may have contributed to the effectobserved. In our future experiments, we plan to examine theeffect of large and/or fractioned T-oligo doses on survival ofECs.
3.6. Systemic Administration of T-oligo Reduces Tumor Angio-genesis and Vessel Patency In Vivo in a SCID Mouse XenograftModel. In melanoma tumors inoculated into SCID mice,we determined the effect of systemic T-oligo injection onmelanoma angiogenesis by evaluating functional and totalvessel density in tumor tissue (5 mice per group). Whentumors became palpable (2-3 mm in diameter, day 5 to 14after inoculation) we injected T-oligo (60 nmoles/injection,15 mg/kg) via the tail vein (IV) and injected again after

6 Journal of Oncology
(a)
(b)
+−+−0 4824
Hours after treatment
0
50
100
150
200
250
E2F
1m
RN
A(t
ime
0(%
)) P < .0001 P < .0001
T-oligo
+−+−48240
Hours after treatment
E2F1
Actin
T-oligo
(c)
(d)
+−+−0 4824
Hours after treatment
0
100
200
300
E2F
1pr
otei
nex
pres
sion
P < .02
T-oligo
Ab-E2F1Cold+−+−32(+)3216
654321
E2F1/DNA/E2F1Ab supershift
E2F1/DNAcomplex
(e)
(f)
(g)
+−+−3216
Hours after treatment
0
1000
2000
3000
4000
RD
U
P < .05
T-oligo
+−+−1 16
Hours after treatment
0
1000
2000
3000
4000
RD
U
P < .01 P < .05
T-oligo
Cold mut.+−+−+−−pr
32(−)321610
10987654321
HIF-1α /DNAcomplex
Figure 2: T-oligo treatment increases E2F1 expression/activity and decreases HIF-1α DNA binding activity in MM-AN cells. Cells weretreated with 40 μM T-oligo or diluent alone and harvested at various times. (a) The pellets were examined by qRT-PCR for E2F1 mRNAlevel, shown as a percent of time 0 levels (mean ± SEM) for 2 separate experiments in triplicate. (b) The pellets were also examined bywestern blot analysis for E2F1 protein levels. Actin expression was used as an internal loading control. (c) Densitometric analysis of E2F1protein expression after loading adjustment by actin, represented as a percent of time 0 levels. Results are pooled data (mean ± SEM) fromthree independent experiments. (d) The DNA binding activity of E2F1 was analyzed by EMSA. No difference in E2F1 DNA binding activitywas detected between the treatment groups at 16 hours (lane 1 versus 2) but E2F1 DNA binding activity doubled in T-oligo treated cells at32 hours (lane 3 versus 4). Specificity of bands was confirmed by preincubating the nuclear protein of T-oligo-treated cells harvested at 32hours with ×25 cold probe (lane 4 versus 5) and by supershift of E2F1 protein/DNA and E2F1 competing antibody complex (lane 4 versus6). (e) Quantification of the band intensity of DNA binding activity is represented as relative density untis (RDU) for both treatment groupsat 16 and 32 hours after treatment. E2F1 EMSA was repeated 2 times with similar results. (f) Nuclear protein was isolated from cells andprocessed for electromobility shift assay (EMSA) for evaluation of HIF-1α DNA binding activity. Specificity of the bands was confirmedby preincubating the nuclear protein extract of cells treated with diluent for 32 hours with ×25 cold probe (not labelled with 32P) andmutant HIF-1α consensus sequence for 20 minutes before incubating the nuclear extracts with 32P-labeled consensus oligonucleotides. HIF-1α EMSA was repeated 2 times with similar results. (g) Densitometric analysis of the protein/DNA complex bands for HIF-1α is graphed asrelative densitometric units (RDU).

Journal of Oncology 7
MM-AN cell invasion assay (22 hr)
Diluent CM T-oligo CM
(a)
T-oligo CMDiluent CM0
100
200
300
400
Nu
mbe
rof
inva
din
gM
M-A
Nce
lls/m
embr
ane
P < .03
(b)
HMVEC invasion assay (22 hr)
Diluent CM T-oligo CM
(c)
T-oligo CMDiluent CM0
100
200
300
400
500
600
700
Nu
mbe
rof
inva
din
gE
Cce
lls/m
embr
ane
P < .08
(d)
Figure 3: T-oligo treatment inhibits Matrigel invasion by MM-AN cells and HMVECs. MM-AN cells were treated with 40 μM T-oligoor diluent alone. The culture medium was collected after 72 hours. The conditioned medium harvested after 72 hours was used as thechemoattractant for the invasion assay for MM-AN and HMVECs. MM-AN cells were plated on the inserts and allowed 22 hours to movethrough the pores on the membrane in the bottom of the inserts toward the medium in the lower chamber, interpreted as invasion of the gel.The experimental inserts had a layer of Matrigel, whereas control inserts (not shown) did not. After 22 hours cells that moved through thepores in the membrane were fixed, stained and photographed. (a) Representative images for MM-AN cells are shown. Small open circles arethe pores in the membrane, not cells. (b) The total number of cells was counted for 3 membranes for each treatment condition and graphedas a number of cells (mean± SEM) for both treatment groups. The assay was repeated twice with identical results. (c) Representative imagesfor HMVECs treated as described for MM-AN above are shown. Small open circles are the pores in the membrane, not cells. (d) The totalnumber of HMVECs were counted for 3 membranes for each treatment condition and graphed as an average number of cells for eachtreatment group (mean ± SD). The assay was repeated twice with identical results. Reductions approached but did not reach statisticalsignificance.
6 hours, then harvested tumors 24 hours after the secondT-oligo injections. Representative images of tumor cross-sections were immunostained to identify all vessels as wellas functional (patent) vessels 24 hours after T-oligo injection(Figure 6(a)). Compared to control-injected mice there wasmore than ∼80% decrease (P < .002) in functional vesselsin T-oligo-injected mice (Figure 6(b)). There was also morethan ∼60% decrease (P < .004) in total vessels in T-oligo-injected mice (Figure 6(c)). These data corroborateour in vitro findings (Figures 4 and 5) and demonstratethat two systemic administrations of T-oligo reduce tumorangiogenesis and vessel patency in vivo (Figures 6(a)–6(c)).
To determine the effect of systemic T-oligo treatmenton melanoma growth, in SCID xenograft model MM-AN cells were injected subcutaneously in the flank. When
tumors became palpable (2-3 mm in diameter, day 5 to14), the mice received daily systemic injections of T-oligo(60 nmoles/injection, 15 mg/kg BID) or vehicle for 5 daysonly. In control animals, tumors increased in volume from6.96 ± 2.9 mm3 on day 6 to 88.04 ± 19.72 mm3 on day27 (Figure 6(d), blue line). In contrast, in T-oligo treatedanimals, whose tumors were the same size as in controlson day 6 (6.48 ± 2.57) there was very little tumor growththrough day 15 (6.48 ± 2.57 versus 9.92 ± 3.8 mm3) andthereafter a slower and statistically insignificant increase involume to 29.65 ± 10.47 mm3 by day 27 (Figure 6(d), pinkline). Thereby, in T-oligo-treated mice tumor growth wasinhibited (P < .003) by ∼53% after ∼4 weeks, when theexperiment was terminated. These data demonstrate thatsystemic administration of T-oligo for only 5 days has apersistent inhibitory effect on melanoma growth. We have

8 Journal of Oncology
+−+−0 4824
Hours after treatment
HMVEC
VEGF
Actin
T-oligo
(a)
+−+−0 4824
Hours after treatment
HUVEC
VEGF
Actin
T-oligo
(b)
+−+−0 4824
Hours after treatment
0
50
100
150
200
250
300
350
VE
GF
prot
ein
(tim
e0
(%))
P < .004
T-oligo
(c)
+−+−0 4824
Hours after treatment
HMVEC
VEGFR-2
Actin
T-oligo
(d)
+−+−0 4824
Hours after treatment
HUVEC
VEGFR-2
Actin
T-oligo
(e)
+−+−0 4824
Hours after treatment
0
50
100
150
200
250
300
VE
GFR
-2pr
otei
n(t
ime
0(%
))
P < .04
T-oligo
(f)
Figure 4: T-oligo decreases VEGF and VEGFR-2 protein levels in normal endothelial cells. HMVEC and HUVEC were treated with 40 μMT-oligo or diluent alone and harvested for western blot analysis over 48 hours. (a) VEGF protein expression in HMVEC. Here and elsewhereactin expression was used to adjust the loading. (b) VEGF protein expression in HUVEC. (c) Combined densitometric analysis of VEGFexpression in HMVEC and HUVEC as a percent of time 0 levels, after loading adjustment. (d) VEGFR-2 protein expression in HMVEC. (e)VEGFR-2 protein expression and HUVEC, and (f) Combined densitometric analysis, as in (c).
also evaluated T-oligos toxicity in several internal organs ofSCID mice 24 hours after the last IV injections (15 mg/kgBID for 5 days). No systemic toxicity was observed in bonemarrow, liver, intestines, brain, lungs and kidneys of T-oligo-injected mice (Figures 7(a)–7(f)).
4. Discussion
Tumor angiogenesis is essential for tumor growth andmetastasis [1]. Without active angiogenesis tumor diameterrarely exceeds 2-3 mm [1, 48]. Angiogenesis is mediatedthrough release of angiogenic factors by tumor cells andcells in the tumor stroma and microenvironment including,but not limited to, endothelial cells [48]. We now reportthat telomere homolog oligonucleotides (T-oligos) decreasethe synthesis and release of angiogenic factors by ECsand melanoma cells, inhibit EC tubulogenesis and impedemelanoma cells and ECs from invading matrix (Matrigel).In addition, systemic administration of T-oligos decreasestumor vascularity in vivo.
EC migration, proliferation and differentiation are allessential processes for tumor angiogenesis [1]. EC prolifer-ation, in vitro tubulogenesis, and survival are all known tobe stimulated in large part by VEGF [49]. Decreased VEGFlevels or inhibition of receptor activation in ECs often corre-late with decrease in tumor size and metastatic potential [50].VEGF binds to the extracellular domain of the VEGFR-1 (Flt-1) and VEGFR-2 (Flk-1), inducing receptor dimerizationand activation of tyrosine kinases by autophosphorylation,leading to angiogenesis, increased vascular permeability, andEC proliferation and survival [49]. It is generally acceptedthat VEGFR-2 is the major mediator of these effects [51].We found that T-oligo decreases the expression of VEGFR-2 by HMVEC and HUVEC (Figures 4(c) and 4(f)). Otherinvestigators reported that receptor tyrosine kinase inhibitors(TKIs) such as sunitinib and dasatinib reduce signalingthrough the RAF/MEK/ERK pathway that is activated by lig-and binding to angiogenic receptors like VEGFR-2, PDGFR-β, FH-3 and c-kit [52], indirectly inhibiting tumor growthby affecting tumor angiogenesis [52]. By reducing VEGF-R2level, T-oligos appear to have similar effects.

Journal of Oncology 9
Diluent 40 μM ×1 80 μM ×1
120 μM ×1 40 μM ×2 40 μM ×3
(a)
40μ
M×3
120μ
M×1
40μ
M×2
80μ
M×1
40μ
M×1
Dilu
ent
0
5000
10000
15000
20000
Tube
len
gth
(pix
els)
P = NS P = NSP < .03 P < .001
P < .0001
P = NS
(b)
Figure 5: T-oligo treatment inhibits EC tubulogenesis in vitro. HMVEC cells were plated on Matrigel in four-well chamber slides and treatedin triplicate with T-oligo or diluent alone, as described in the text. (a) All representative images are taken 22 hours after plating cells intochambers, the time of biggest differences among treatment conditions. (b) The length of tube-like structures was quantified as total averagetube lengths per visual field from 3 separate chambers for each treatment condition. The differences in the length of tube-like structures werequantified (in pixels) in at least 3–5 representative photographs per chamber/treatment condition using computer-assisted image analysis.
VEGF also induces leakage within tumor vessels, allowingtumor cells to infiltrate blood vessels and migrate into theblood stream [53]. Hence, changes in angiogenic factorseven early in tumor formation can affect metastasis andspread [53] and inhibiting VEGF production by T-oligoswould be expected to reduce the metastatic potential oftumor cells [53]. Additionally, increased blood vessel per-meability within the tumor may interfere with adequatedelivery and retention of chemotherapeutic agents [54, 55].Indeed, certain antiangiogenic agents that prevent tumorvessel leakage (a phenomenon called “vessel normalization”)were shown to enhance the delivery of chemotherapeuticagents into tumors [56]. Thus, combination treatment with
antiangiogenic factors together with conventional chemo-therapeutic agents may be superior to using the latter alone.Furthermore, because VEGF is likely required for migrationand recruitment of ECs, T-oligo-me diated VEGF reductionwould also likely decrease the number of blood vessels inthe tumor [1, 6]. Our present findings suggest that T-oligosmay induce potent antiangiogenic effects, enhancing theirattractiveness as a therapeutic option for cancer.
In addition to VEGF and its receptors, angiopoietin 1 and2 (ANG-1 and ANG-2) and their tyrosine kinase receptorTie-2 have been identified as major players in the processesof growth and remodelling of tumor vasculature [57, 58].ANG-1 activates the Tie-2 signalling pathway [58]. Although

10 Journal of Oncology
BS-1 lectin-perfused CD-31-stained Merged
Vehicle
T-oligo
(a)
T-oligoVehicle0
40
80
120
Con
trol
fun
ctio
nal
vess
els
(BS1
-lec
tin
perf
usi
on(%
)) P < .002
(b)
T-oligoVehicle0
40
80
120
Con
trol
tota
lves
sels
(CD
-31
stai
nin
g(%
)) P < .004
(c)
2725222015131160
Days after tumor inoculation
ControlT-oligo
∗
∗∗∗ ∗∗∗ ∗∗∗∗∗∗P < .02
∗∗P < .003∗∗∗P < .0004
0
20
40
60
80
100
120
Flan
ktu
mor
volu
mes
(mm
3)
(d)
Figure 6: T-oligo decrease tumor angiogenesis and melanoma tumor volumes in mouse SCID xenografts. (a) Representative images of6 μm tumor cross-sections immunostained with CD31 (green) and TopRo-3 (blue-nuclei) and perfused in vivo with BS-1 lectin (red),to determine tumor microvascular density (MVD) per high power field (HPF) ×40 magnification. Both functional and total vessels wereexamined in 5 mice/group. Arrows indicate CD31 (+) vessels that are considered nonfunctional (not perfused) whereas arrowheads indicatedouble (+) BS-1 lectin/CD31 vessels that are considered functional (perfused in vivo). (b) Percent functional vessels (red-BS-1 lectin staining)in T-oligo injected mice, taking MVD in vehicle injected mice as 100%. (c) Percent total vessels (green-CD31 staining) in T-oligo injectedmice, taking MVD in vehicle injected mice as 100%. (d) SCID mice were injected with MMAN cells into the flank. T-oligo or vehicle wasinjected daily for up to 5 days when tumors were first palpable (2-3 mm diameter). Average tumor volume/animal was recorded over 4-weeksin 5-6 mice/group.

Journal of Oncology 11
Bone marrow
(a)
Liver
(b)
Small intestine
(c)
Brain
(d)
Lung
(e)
Kidney
(f)
Figure 7: Evaluation of T-oligos toxicity in internal organs of SCID mice 24 hours after the last IV injection (15 mg/kg BID for 5 days). (a)Bone marrow, displaying a mixture of myeloid and erythroid precursor cells as well as plasma cells. Scattered megakeryocytes are also present.There is no evidence of bone marrow suppression or toxicity. (b) Liver lobule with a central vein surrounded by hepatocytes. The cells displaya fixation artifact but otherwise appear normal. There is no evidence of cellular necrosis or apoptosis. (c) Jejunal mucosa displaying normalarrangement of villi lined by tall columnar cells. Both the mucosa and the submucosa appear normal. Fragments of normal pancreatic acinartissue are seen in the bottom left of the image. (d) Section of the brain showing normal brain architecture with typical neuronal ganglia andscattered small dark glial cells in a pink neuropil background. (e) Normal lung tissue displaying multiple alveoli as well as bronchioles linedwith cuboidal epithelial lining. (f) The kidney displays two normal glomeruli that are surrounded by tubules with cuboidal epithelium.
under certain conditions ANG-2 may inhibit ANG-1 effect,in an in vivo mouse model for melanoma [59] and inglioma cells [60] increased expression of ANG-2 is thoughtto stimulate angiogenesis. Another angiogenic factor, HIF-1α, a transcription factor that is activated by hypoxia, exertsits effect by upregulating VEGF levels. We found that T-oligo treatment inhibits HIF-1α activity and ANG-1 andANG-2 expression in melanoma cell line and decreases VEGFsynthesis secretion in these cells, strongly suggesting that T-oligo-mediated effects on tumor angiogenesis are transcrip-tional and ultimately affect several angiogenic molecules.
Our laboratory has previously shown that T-oligoincreases p73 level in the p53 null MM-AN cells andthat blocking p73 expression by RNAi decreases T-oligo-induced apoptosis in these cells [11]. Like p53, p73 isknown to inhibit angiogenesis, primarily through VEGFdown-regulation [34]. Therefore, we assume that in MM-AN cells T-oligo decreases VEGF production, in addition toits effect on HIF-1α, by activating p73 through inductionof E2F1. However, in cells with functional p53, we assumethat T-oligo-induced p53 and p73 would cooperate toinhibit angiogenesis. Furthermore, E2F1 is known to induceapoptosis in part by its effect on p73. Thus, inductionof E2F1 by T-oligos [11] also contributes to tumor cellapoptosis. E2F1 is reported to be upregulated by active(phosphorylated) ATM [61]. We have previously shown thatT-oligo treatment activates (phosphorylates) ATM [21, 27].Moreover, the E2F1 promoter contains binding sites forE2F1 [62]. We therefore suggest that T-oligo regulates E2F1
first via ATM-mediated phosphorylation of E2F1 [61] andthat E2F1 then further transcriptionally upregulates E2F1 bybinding to its own promoter. Indeed, we show that T-oligoincreases E2F1 mRNA and protein levels as well as its DNAbinding activity in human MM-AN melanoma cells, furtherconfirming our previous finding that E2F1contributes to T-oligo effects [11].
The T-oligos used in the present experiments have phys-iologic readily hydrolysable phosphodiester linkage, unlikefor example antisense DNA in which phosphorothioate orother nonhydrolyzable linkage is employed to increase themolecule’s half-life (T 1/2). Hydrolyzable linkage is requiredfor initiation of T-oligo signalling [22] and, despite theknown short T 1/2, approximately 4–6 hours in serum-containing medium for a 12-base 100% telomere homolog[38], nevertheless this allows for the cellular responsesobserved in the present and previous experiments to evolveover 3–5 days [11, 13, 19, 21, 22, 24–28]. This may reflectthe fact that at least in vitro T-oligos rapidly enter thenucleus [11, 22, 24, 27] and that, once in the nucleus,such oligos have a far longer T 1/2 [63]. The efficacy ofthese presumptively short-lived T-oligos may also reflectthe likelihood that, after interaction of the oligos with theWerner protein and formation of DNA damage-like foci attelomeres [22], signalling through the DNA damage responsepathways may continue even if the T-oligos have beenhydrolyzed, at least through 48 hours at which time the DNAdamage foci can still be observed by immunohistochemistry[22].

12 Journal of Oncology
In earlier studies, we have shown that T-oligos inhibittumor growth in SCID mouse models by inducing cell cyclearrest, differentiation, apoptosis, and senescence [13, 15, 27].We now show that T-oligos also inhibit angiogenesis. Angio-genesis inhibition encompassing both ECs and melanomacells, in combination with other T-oligo-mediated anti-tumor effects [11, 13, 22, 25, 27], likely combine tosignificantly decrease melanoma burden in established SCIDmouse models, as reported in our earlier publications[13, 27]. These multiple diverse responses are all mediatedthrough activation and/or upregulation of DNA damageresponse proteins. They are thus reminiscent of the lesscomplex but very well characterized bacterial SOS response,a genome-protective mechanism that enhances survival ofprokaryotic organisms in the face of DNA damage [14]. Thetelomere-based DNA damage-like signalling initiated by T-oligos may be viewed as an evolutionarily perfected parallelmechanism in mammalian cells that addresses the threat togenomic integrity posed by malignant transformation [64].
In summary, the present paper indicates that T-oligosexert multiple antiangiogenic effects. These data reinforceprior evidence that T-oligo therapy may offer a powerful newapproach to treatment of human primary melanoma andpossibly other human malignancies, with several conceptualadvantages over the currently lionized targeted therapyapproach [64].
Conflict of Interest
Aspects of this paper are patent-protected and licensed toSemaCo Inc., a for-profit company. Dr Gilchrest and Dr. Yaarare shareholders in SemaCo.
Acknowledgments
C. Coleman and D. Levine contributed equally to the paper.C. Coleman is currently affiliated with the University of NewEngland and Danielle Levine, M.D., is dermatology residentat Harvard Medical School. This work was supported bygrants from the NIH CA10515 (to BAG) and American SkinAssociation (to DL).
References
[1] J. Folkman, “Angiogenesis,” Annual Review of Medicine, vol.57, pp. 1–18, 2006.
[2] N. Weidner, “New paradigm for vessel intravasation by tumorcells,” American Journal of Pathology, vol. 160, no. 6, pp. 1937–1939, 2002.
[3] C.-H. Chen, W. Jiang, D. P. Via et al., “Oxidized low-densitylipoproteins inhibit endothelial cell proliferation by suppress-ing basic fibroblast growth factor expression,” Circulation, vol.101, no. 2, pp. 171–177, 2000.
[4] D. Bradbury, D. Clarke, C. Seedhouse, L. Corbettt, J. Stocks,and A. Knox, “Vascular endothelial growth factor inductionby prostaglandin E2 in human airway smooth muscle cellsis mediated by E prostanoid EP 2/EP4 receptors and SP-1 transcription factor binding sites,” Journal of BiologicalChemistry, vol. 280, no. 34, pp. 29993–30000, 2005.
[5] G. Pages and J. Pouyssegur, “Transcriptional regulation ofthe Vascular Endothelial Growth Factor gene—a concert ofactivating factors,” Cardiovascular Research, vol. 65, no. 3, pp.564–573, 2005.
[6] C. R. Tait and P. F. Jones, “Angiopoietins in tumours: theangiogenic switch,” Journal of Pathology, vol. 204, no. 1, pp.1–10, 2004.
[7] Y. S. Park, N. H. Kim, and I. Jo, “Hypoxia and vascularendothelial growth factor acutely up-regulate angiopoietin-1and Tie2 mRNA in bovine retinal pericytes,” MicrovascularResearch, vol. 65, no. 2, pp. 125–131, 2003.
[8] P. S. Ray, T. Estrada-Hernandez, H. Sasaki, L. Zhu, and N.Maulik, “Early effects of hypoxia/reoxygenation on VEGF,Ang-1, Ang-2 and their receptors in the rat myocardium:implications for myocardial angiogenesis,” Molecular andCellular Biochemistry, vol. 213, no. 1-2, pp. 145–153, 2000.
[9] J. Stanelle, T. Stiewe, C. C. Theseling, M. Peter, and B.M. Putzer, “Gene expression changes in response to E2F1activation,” Nucleic Acids Research, vol. 30, no. 8, pp. 1859–1867, 2002.
[10] V. Marwaha, Y.-H. Chen, E. Helms et al., “T-oligo treat-ment decreases constitutive and UVB-induced COX-2 levelsthrough p53- and NFκB-dependent repression of the COX-2promoter,” Journal of Biological Chemistry, vol. 280, no. 37, pp.32379–32388, 2005.
[11] M. S. Eller, N. Puri, I. M. Hadshiew, S. S. Venna, and B. A.Gilchrest, “Induction of apoptosis by telomere 3′ overhang-specific DNA,” Experimental Cell Research, vol. 276, no. 2, pp.185–193, 2002.
[12] G. Qin, R. Kishore, C. M. Dolan et al., “Cell cycle regulatorE2F1 modulates angiogenesis via p53-dependent transcrip-tional control of VEGF,” Proceedings of the National Academyof Sciences of the United States of America, vol. 103, no. 29, pp.11015–11020, 2006.
[13] N. Puri, M. S. Eller, H. R. Byers, S. Dykstra, J. Kubera, and B.A. Gilchrest, “Telomere-based DNA damage responses: a newapproach to melanoma,” FASEB Journal, vol. 18, no. 12, pp.1373–1381, 2004.
[14] M. Radman, “SOS repair hypothesis: phenomenology of aninducible DNA repair which is accompanied by mutagenesis,”Basic Life Sciences, vol. 5, pp. 355–367, 1975.
[15] B. A. Gilchrest and M. S. Eller, “The tale of the telomere: impli-cations for prevention and treatment of skin cancers,” TheJournal of Investigative Dermatology. Symposium Proceedings,vol. 10, no. 2, pp. 124–130, 2005.
[16] T. De Lange, “Protection of mammalian telomeres,” Oncogene,vol. 21, no. 4, pp. 532–540, 2002.
[17] E. L. Denchi and T. De Lange, “Protection of telomeresthrough independent control of ATM and ATR by TRF2 andPOT1,” Nature, vol. 448, no. 7157, pp. 1068–1071, 2007.
[18] S. Li, J. E. Rosenberg, A. A. Donjacour et al., “Rapid inhibitionof cancer cell growth induced by lentiviral delivery andexpression of mutant-template telomerase RNA and anti-telomerase short-interfering RNA,” Cancer Research, vol. 64,no. 14, pp. 4833–4840, 2004.
[19] H. Aoki, E. Iwado, M. S. Eller et al., “Telomere 3′ overhang-specific DNA oligonucleotides induce autophagy in malignantglioma cells,” FASEB Journal, vol. 21, no. 11, pp. 2918–2930,2007.
[20] S. Arad, N. Konnikov, D. A. Goukassian, and B. A. Gilchrest,“T-oligos augment UV-induced protective responses inhuman skin,” The FASEB Journal, vol. 20, no. 11, pp. 1895–1897, 2006.

Journal of Oncology 13
[21] M. S. Eller, G.-Z. Li, R. Firoozabadi, N. Puri, and B.A. Gilchrest, “Induction of a p95/Nbs1-mediated S phasecheckpoint by telomere 3′ overhang specific DNA,” FASEBJournal, vol. 17, no. 2, pp. 152–162, 2003.
[22] M. S. Eller, X. Liao, S. Liu et al., “A role for WRN in telomere-based DNA damage responses,” Proceedings of the NationalAcademy of Sciences of the United States of America, vol. 103,no. 41, pp. 15073–15078, 2006.
[23] D. A. Goukassian, S. Bagheri, L. el-Keeb, M. S. Eller, and B. A.Gilchrest, “DNA oligonucleotide treatment corrects the age-associated decline in DNA repair capacity,” The FASEB Journal,vol. 16, no. 7, pp. 754–756, 2002.
[24] G.-Z. Li, M. S. Eller, R. Firoozabadi, and B. A. Gilchrest,“Evidence that exposure of the telomere 3′ overhang sequenceinduces senescence,” Proceedings of the National Academy ofSciences of the United States of America, vol. 100, no. 2, pp. 527–531, 2003.
[25] G.-Z. Li, M. S. Eller, K. Hanna, and B. A. Gilchrest, “Signalingpathway requirements for induction of senescence by telomerehomolog oligonucleotides,” Experimental Cell Research, vol.301, no. 2, pp. 189–200, 2004.
[26] N. Ohashi, M. Yaar, M. S. Eller, F. Truzzi, and B. A. Gilchrest,“Features that determine telomere homolog oligonucleotide-induced therapeutic DNA damage-like responses in cancercells,” Journal of Cellular Physiology, vol. 210, no. 3, pp. 582–595, 2007.
[27] M. Yaar, M. S. Eller, I. Panova et al., “Telomeric DNA inducesapoptosis and senescence of human breast carcinoma cells,”Breast Cancer Research, vol. 9, no. 1, article R13, 2007.
[28] H. O. Longe, P. B. Romesser, A. M. Rankin et al., “Telomerehomolog oligonucleotides induce apoptosis in malignant butnot in normal lymphoid cells: mechanism and therapeuticpotential,” International Journal of Cancer, vol. 124, no. 2, pp.473–482, 2009.
[29] I. M. Hadshiew, M. S. Eller, F. P. Gasparro, and B. A. Gilchrest,“Stimulation of melanogenesis by DNA oligonucleotides:effect of size, sequence and 5′ phosphorylation,” Journal ofDermatological Science, vol. 25, no. 2, pp. 127–138, 2001.
[30] M. S. Eller, T. Maeda, C. Magnoni, D. Atwal, and B. A.Gilchrest, “Enhancement of DNA repair in human skin cells bythymidine dinucleotides: evidence for a p53-mediated mam-malian SOS response,” Proceedings of the National Academy ofSciences of the United States of America, vol. 94, no. 23, pp.12627–12632, 1997.
[31] D. A. Goukassian, M. S. Eller, M. Yaar, and B. A. Gilchrest,“Thymidine dinucleotide mimics the effect of solar simulatedirradiation on p53 and p53-regulated proteins,” Journal ofInvestigative Dermatology, vol. 112, no. 1, pp. 25–31, 1999.
[32] P. L. Opresko, M. Otterlei, J. Graakjær et al., “The wernersyndrome helicase and exonuclease cooperate to resolvetelomeric D loops in a manner regulated by TRF1 and TRF2,”Molecular Cell, vol. 14, no. 6, pp. 763–774, 2004.
[33] R. Kishore, C. Luedemann, E. Bord, D. Goukassian, and D. W.Losordo, “Tumor necrosis factor-mediated E2F1 suppressionin endothelial cells: differential requirement of c-Jun N-terminal kinase and p38 mitogen-activated protein kinasesignal transduction pathways,” Circulation Research, vol. 93,no. 10, pp. 932–940, 2003.
[34] B. Salimath, D. Marme, and G. Finkenzeller, “Expression of thevascular endothelial growth factor gene is inhibited by p73,”Oncogene, vol. 19, no. 31, pp. 3470–3476, 2000.
[35] H. R. Byers, T. Etoh, K. W. Lee, M. C. Mihm Jr., and S.Gattoni-Celli, “Organ-specific metastases in immunodeficient
mice injected with human melanoma cells: a quantitativepathological analysis,” Melanoma Research, vol. 3, no. 4, pp.247–253, 1993.
[36] K. F. Kusano, R. Pola, T. Murayama, et al., “Sonic hedgehogmyocardial gene therapy: tissue repair through transientreconstitution of embryonic signaling,” Nature Medicine, vol.11, no. 11, pp. 1197–1204, 2005.
[37] D. A. Goukassian, G. Qin, C. Dolan et al., “Tumor necrosisfactor-α receptor p75 is required in ischemia-induced neovas-cularization,” Circulation, vol. 115, no. 6, pp. 752–762, 2007.
[38] W. E. Wright, D. Brasiskyte, M. A. Piatyszek, and J. W. Shay,“Experimental elongation of telomeres extends the lifespan ofimmortal x normal cell hybrids,” EMBO Journal, vol. 15, no. 7,pp. 1734–1741, 1996.
[39] D. Goukassian, A. Diez-Juan, T. Asahara et al., “Overexpres-sion of p27Kip1 by doxycycline-regulated adenoviral vectorsinhibits endothelial cell proliferation and migration andimpairs angiogenesis,” FASEB Journal, vol. 15, no. 11, pp.1877–1885, 2001.
[40] J. Alroy, V. Goyal, and E. Skutelsky, “Lectin histochemistry ofmammalian endothelium,” Histochemistry, vol. 86, no. 6, pp.603–607, 1987.
[41] T. Asahara, D. Chen, T. Takahashi et al., “Tie2 receptor ligands,angiopoietin-1 and angiopoietin-2, modulate VEGF- inducedpostnatal neovascularization,” Circulation Research, vol. 83,no. 3, pp. 233–240, 1998.
[42] B. Enholm, K. Paavonen, A. Ristimaki et al., “Comparisonof VEGF, VEGF-B, VEGF-C and Ang-1 mRNA regulation byserum, growth factors, oncoproteins and hypoxia,” Oncogene,vol. 14, no. 20, pp. 2475–2483, 1997.
[43] A. Albini, R. Benelli, D. M. Noonan, and C. Brigati, “The“chemoinvasion assay”: a tool to study tumor and endothelialcell invasion of basement membranes,” International Journalof Developmental Biology, vol. 48, no. 5-6, pp. 563–571, 2004.
[44] S. Dias, K. Hattori, B. Heissig et al., “Inhibition of bothparacrine and autocrine VEGF/VEGFR-2 signaling pathwaysis essential to induce long-term remission of xenotransplantedhuman leukemias,” Proceedings of the National Academy ofSciences of the United States of America, vol. 98, no. 19, pp.10857–10862, 2001.
[45] B. Li, E. E. Sharpe, A. B. Maupin et al., “VEGF and PlGFpromote adult vasculogenesis by enhancing EPC recruitmentand vessel formation at the site of tumor neovascularization,”The FASEB Journal, vol. 20, no. 9, pp. 1495–1497, 2006.
[46] R. Zhang, Y. Xu, N. Ekman et al., “Etk/Bmx transactivatesvascular endothelial growth factor 2 and recruits phos-phatidylinositol 3-kinase to mediate the tumor necrosis factor-induced angiogenic pathway,” Journal of Biological Chemistry,vol. 278, no. 51, pp. 51267–51276, 2003.
[47] M. Detmar, L. F. Brown, K. P. Claffey et al., “Overexpressionof vascular permeability factor/vascular endothelial growthfactor and its receptors in psoriasis,” Journal of ExperimentalMedicine, vol. 180, no. 3, pp. 1141–1146, 1994.
[48] C.-C. Liu, Z. Shen, H.-F. Kung, and M. C. M. Lin, “Cancergene therapy targeting angiogenesis: an updated review,”World Journal of Gastroenterology, vol. 12, no. 43, pp. 6941–6948, 2006.
[49] Z. K. Otrock, J. A. Makarem, and A. I. Shamseddine, “Vascularendothelial growth factor family of ligands and receptors:review,” Blood Cells, Molecules, and Diseases, vol. 38, no. 3, pp.258–268, 2007.

14 Journal of Oncology
[50] J. Folkman, “Antiangiogenesis in cancer therapy—endostatinand its mechanisms of action,” Experimental Cell Research, vol.312, no. 5, pp. 594–607, 2006.
[51] K. Holmes, O. L. Roberts, A. M. Thomas, and M. J. Cross,“Vascular endothelial growth factor receptor-2: structure,function, intracellular signalling and therapeutic inhibition,”Cellular Signalling, vol. 19, no. 10, pp. 2003–2012, 2007.
[52] H. Zhong and J. P. Bowen, “Molecular design and clinicaldevelopment of VEGFR kinase inhibitors,” Current Topics inMedicinal Chemistry, vol. 7, no. 14, pp. 1379–1393, 2007.
[53] H.-P. Gerber and N. Ferrara, “Pharmacology and pharmaco-dynamics of bevacizumab as monotherapy or in combinationwith cytotoxic therapy in preclinical studies,” Cancer Research,vol. 65, no. 3, pp. 671–680, 2005.
[54] V. F. Casneuf, P. Demetter, T. Boterberg, L. Delrue, M.Peeters, and N. Van Damme, “Antiangiogenic versus cytotoxictherapeutic approaches in a mouse model of pancreaticcancer: an experimental study with a multitarget tyrosinekinase inhibitor (sunitinib), gemcitabine and radiotherapy,”Oncology Reports, vol. 22, no. 1, pp. 105–113, 2009.
[55] R. T. Tong, Y. Boucher, S. V. Kozin, F. Winkler, D. J.Hicklin, and R. K. Jain, “Vascular normalization by vascularendothelial growth factor receptor 2 blockade induces apressure gradient across the vasculature and improves drugpenetration in tumors,” Cancer Research, vol. 64, no. 11, pp.3731–3736, 2004.
[56] R. K. Jain, “Normalization of tumor vasculature: an emergingconcept in antiangiogenic therapy,” Science, vol. 307, no. 5706,pp. 58–62, 2005.
[57] P. C. Maisonpierre, C. Suri, P. F. Jones et al., “Angiopoietin-2, anatural antagonist for Tie2 that disrupts in vivo angiogenesis,”Science, vol. 277, no. 5322, pp. 55–60, 1997.
[58] S. Davis, T. H. Aldrich, P. F. Jones et al., “Isolation ofangiopoietin-1, a ligand for the TIE2 receptor, by secretion-trap expression cloning,” Cell, vol. 87, no. 7, pp. 1161–1169,1996.
[59] J. Pomyje, J. H. Zivny, T. Stopka, J. Simak, H. Vankova, and E.Necas, “Angiopoietin-1, angiopoietin-2 and Tie-2 in tumourand non-tumour tissues during growth of experimentalmelanoma,” Melanoma Research, vol. 11, no. 6, pp. 639–643,2001.
[60] K. Koga, T. Todaka, M. Morioka et al., “Expression ofangiopoietin-2 in human glioma cells and its role for angio-genesis,” Cancer Research, vol. 61, no. 16, pp. 6248–6254, 2001.
[61] W.-C. Lin, F.-T. Lin, and J. R. Nevins, “Selective inductionof E2F1 in response to DNA damage, mediated by ATM-dependent phosphorylation,” Genes and Development, vol. 15,no. 14, pp. 1833–1844, 2001.
[62] C. Y. Lin, Y. C. Liang, and B. Y.-M. Yung, “Nucleophos-min/B23 regulates transcriptional activation of E2F1 viamodulating the promoter binding of NF-κB, E2F1 and pRB,”Cellular Signalling, vol. 18, no. 11, pp. 2041–2048, 2006.
[63] Z. Cao, C.-C. Huang, and W. Tan, “Nuclease resistanceof telomere-like oligonucleotides monitored in live cells byfluorescence anisotropy imaging,” Analytical Chemistry, vol.78, no. 5, pp. 1478–1484, 2006.
[64] B. A. Gilchrest and M. S. Eller, “Cancer therapeutics: smartand smarter,” Drugs of the Future, vol. 34, no. 3, pp. 205–216,2009.
Copyright © 2022 FDOKUMEN