PLANNING MALAYSIA
371
© 2019 by MIP Advisor TPr. Hj Ihsan Zainal Mokhtar Editor-in-Chief Professor Dato’ Dr. Mansor Ibrahim International Islamic University Malaysia (IIUM) Local Editorial Board Members Professor Dato’ Dr. Alias Abdullah - International Islamic University Malaysia (IIUM) Professor Dr. Ho Chin Siong - Universiti Teknologi Malaysia (UTM) Professor Dr. Jamilah Mohamad - Universiti Malaya (UM) Professor Dr. Ruslan Rainis - Universiti Sains Malaysia (USM) Professor Dr. Ahmad Nazri Muhamad Ludin - Universiti Teknologi Malaysia (UTM) Professor Dr. Dasimah Omar - Universiti Teknologi Mara (UITM) Professor Dr. Suhana Shamsuddin – Malaysia Institute of Planner (MIP) Professor Dr. Jamalunlaili Abdullah - Universiti Teknologi Mara (UITM) Assoc. Prof. Dr. M. Zainora Asmawi - International Islamic University Malaysia (IIUM) Assoc. Prof. Dr. Nurwati Badarulzaman - Universiti Sains Malaysia (USM) Assoc. Prof. Dr. Mariana Mohamed Osman - International Islamic University Malaysia (IIUM) Assoc. Prof. Dr. Syahriah Bachok - International Islamic University Malaysia (IIUM) Datin Paduka Dr. Halimaton Saadiah Hashim - Malaysia Institute of Planner (MIP) Assoc. Prof. Dr. Oliver Ling Hoon Leh - Universiti Teknologi Mara (UiTM) Dr. Chua Rhan See - Jabatan Perancang Bandar dan Desa (JPBD) Khairiah Talha - Malaysia Institute of Planner (MIP) Ishak Ariffin - Malaysia Institute of Planner (MIP) Assoc. Prof. Dr. Azizan Marzuki - Universiti Sains Malaysia (USM) International Editorial Board Professor Emeritus Dr. Richard E. Klosterman - University of Akron / Whatif? Inc., USA Professor Dr. Stephen Hamnett - University of South Australia, Adelaide, Australia Professor Dr. Kiyoshi Kobayashi - University of Kyoto, Japan Assoc. Prof. Dr. Belinda Yuen - University of Singapore, Singapore Dr. Davide Geneletti - University of Trento, Italy Dr. Boy Kombaitan - Institut Teknologi Bandung, Indonesia PLANNING MALAYSIA Journal of the Malaysian Institute of Planners
-
Upload
khangminh22 -
Category
Documents
-
view
10 -
download
0
Transcript of PLANNING MALAYSIA
© 2019 by MIP
Advisor
TPr. Hj Ihsan Zainal Mokhtar
Editor-in-Chief
Professor Dato’ Dr. Mansor Ibrahim
International Islamic University Malaysia (IIUM)
Local Editorial Board Members
Professor Dato’ Dr. Alias Abdullah - International Islamic University Malaysia (IIUM)
Professor Dr. Ho Chin Siong - Universiti Teknologi Malaysia (UTM)
Professor Dr. Jamilah Mohamad - Universiti Malaya (UM)
Professor Dr. Ruslan Rainis - Universiti Sains Malaysia (USM)
Professor Dr. Ahmad Nazri Muhamad Ludin - Universiti Teknologi Malaysia (UTM)
Professor Dr. Dasimah Omar - Universiti Teknologi Mara (UITM)
Professor Dr. Suhana Shamsuddin – Malaysia Institute of Planner (MIP)
Professor Dr. Jamalunlaili Abdullah - Universiti Teknologi Mara (UITM)
Assoc. Prof. Dr. M. Zainora Asmawi - International Islamic University Malaysia (IIUM)
Assoc. Prof. Dr. Nurwati Badarulzaman - Universiti Sains Malaysia (USM)
Assoc. Prof. Dr. Mariana Mohamed Osman - International Islamic University Malaysia (IIUM)
Assoc. Prof. Dr. Syahriah Bachok - International Islamic University Malaysia (IIUM)
Datin Paduka Dr. Halimaton Saadiah Hashim - Malaysia Institute of Planner (MIP)
Assoc. Prof. Dr. Oliver Ling Hoon Leh - Universiti Teknologi Mara (UiTM)
Dr. Chua Rhan See - Jabatan Perancang Bandar dan Desa (JPBD)
Khairiah Talha - Malaysia Institute of Planner (MIP)
Ishak Ariffin - Malaysia Institute of Planner (MIP)
Assoc. Prof. Dr. Azizan Marzuki - Universiti Sains Malaysia (USM)
International Editorial Board
Professor Emeritus Dr. Richard E. Klosterman - University of Akron / Whatif? Inc., USA
Professor Dr. Stephen Hamnett - University of South Australia, Adelaide, Australia
Professor Dr. Kiyoshi Kobayashi - University of Kyoto, Japan
Assoc. Prof. Dr. Belinda Yuen - University of Singapore, Singapore
Dr. Davide Geneletti - University of Trento, Italy
Dr. Boy Kombaitan - Institut Teknologi Bandung, Indonesia
PLANNING MALAYSIA Journal of the Malaysian Institute of Planners
© 2019 by MIP ii
Editorial & Business Correspondence
PLANNING MALAYSIA
Journal of the Malaysian Institute of Planners
B-01-02, Jalan SS7/13B, Aman Seri, Kelana Jaya
47301, Petaling Jaya, Selangor Darul Ehsan, MALAYSIA
Tel: +603 78770637 Fax: +603 78779636 Email: [email protected]
www.planningmalaysia.org
Copyright © MIP, 2019
All rights reserved.
No part of this publication may be reproduced, stored in a retrieval system, or transmitted in any
form or by any means, electronic, mechanical, photocopying, or otherwise without the prior
permission of the publisher.
The views expressed in this publication are those of the author(s) and do not necessarily represent
the views of MIP.
This journal is a refereed journal.
All articles were reviewed by two or three unanimous referees identified by the Institute (MIP).
Published By
Malaysian Institute of Planners
ISSN Number
1675-6215
e-ISSN
0128-0945
iii © 2019 by MIP
CONTENTS
1. Cleanliness Inspection of the Ablution Spaces of the Federal Territory Mosque By: Hayder Jawad Shakir Haraty & Nangkula Utaberta
1 – 12
2. Income Inequality Across States in Malaysia By: Nai Peng Tey, Siow Li Lai, Sor Tho Ng, Kim Leng Goh, & Ahmad Farid Osman
12 – 26
3. The Quantification of Urban Litter Load at Gross Pollutant Trap along Sungai Batu, Selangor By: Nur Khaliesah Abdul Malik, Latifah Abd Manaf, Nor Rohaizah Jamil, Mohd Hafiz Rosli, Fasihah Mohd Yusof, & Zulfa Hanan Ash’aari
27 – 37
4. Urbanisation Beyond Its Core Boundary and Its Impact on the Communities in George Town Conurbation, Malaysia By: Narimah Samat, Mohd Amirul Mahamud, Siti Masayu Rosliah Abdul Rashid, Yasin Elhadary, & Norzailawati Mohd Noor
38 – 49
5. The Traffic Volume and Level of Service (LOS) of Universiti Putra Malaysia (UPM) Serdang Campus Main Access By: Zakiah Ponrahono, Noorain Mohd Isa, Ahmad Zaharin Aris, & Rosta Harun
50 – 61
6. Appraisal of Urbanisation, Township and Housing Trends for a Desired Future in Malaysia By: Ruhizal Roosli, Sana Malik, Julaihi Wahid, & Helen Nesadurai
62 – 73
7. Service Catchment Of Mass Rapid Transit (MRT) Feeder Bus: A Preliminary Study of T461 Route Taman Kajang Utama By: Chloe Aida Lim Jhin Lin & Zakiah Ponrahono
74 – 91
8. Vehicle – Pedestrian Conflict: A Case Study in Universiti Putra Malaysia By: Noorain Mohd Isa, Ahmad Zaharin Aris, Zakiah Ponrahono, & Rosta Harun
92 – 100
9. Evaluating Capacity Building of the Local Community Towards Environmental Conservation in an Estuarine Community, Kong Kong Laut, Johor By: Faradiella Mohd Kusin, Amirul Azuan Md Joni, Ferdaus Mohamat Yusuff, & Sharifah Nur Munirah Syed Hasan
101 – 111
10. Quantifying the Organic Waste Generated from the Fresh Market in Kundasang Town, Sabah By: Nurul Nadia Fatiha Yaacob, Latifah Abd Manaf & Zulfa Hanan Ash'aari
112 – 122
11. Water Footprint of Crop Production in Tehran Province By: Somayeh Rezaei Kalvani, Amir Hamzah Sharaai, Latifah Abd Manaf, & Amir Hossein Hamidian
123 – 132
© 2019 by MIP iv
12. The Behaviours and Job Positions of Citizens in Smart Cities’ Development By: Sengboon Lim, Jalaluddin Abdul Malek, Mohd Yusof Hussain, & Zurinah Tahir
133 – 145
13. The Need for the Improvement of Street Vendors Management in Public Spaces at Surakarta City By: Murtanti Jani Rahayu, Imam Buchori & Retno Widjajanti
146 – 157
14. Enhancing the Potential of Recyclables Waste Collection Through Waste Bank Programme: Experience from HEI in Malaysia By: Fatma Sabariah Alias, Latifah Abdul Manaf, Mariani Ariffin, & Sabrina Ho Abdullah
158 – 167
15. Source Water Protection from Pharmaceutical Contaminants: Assessment of Environmental Quality Act 1974 and its Regulations By: Adillah Othman & Mariani Ariffin
168 – 178
16. Quantifying the Aboveground Biomass and Carbon Storage of Urban Tree Species in Sokoto Metropolis, North-Western Nigeria By: Dangulla Murtala, Latifah Abd Manaf, Mohammed Firuz Ramli, Mohd Rusli Yacob, & Ahmad A. Makmom
179 – 190
17. Income Perspective on the Factors Influencing Households’ Recycling Intention: Implications From the Extended Theory of Planned Behaviour By: Muhammad Salisu Khalil, Ho Yuek Ming, Latifah Abd Manaf, Amir Hamzah Sharaai, & Aliyu Baba Nabegu
191 – 202
18. Children’s Direct and Indirect Experiences with Nature and Their Connectedness to Nature By: Nor Diyana Mustapa, Nor Zarifah Maliki, Nor Fadzila Aziz, & Aswati Hamzah
203 – 214
19. Social Impact Evaluation of Tea Production Using Social Life Cycle Assessment (S-LCA) Method In Cameron Highlands, Pahang, Malaysia By: Amir Hamzah Sharaai1, Khairul Izzuddin Muhammad & Yeoh Geok Wah
215 – 224
20. Planning of Private Gated Development: An Analysis of Gated vs Non-Gated Neighbourhoods, City of Gurugram, India By: Ajay Kaushik
225 – 236
21. Global Environmental Kuznet Curve Facts and Challenges for Thailand on Emission Reduction Plan By: Chantamon Potipituk
237 – 248
22. The Analysis of Vulnerability Faced by Gahai Agropolitan Participants By: Mohd Khairi Ismail, Chamhuri Siwar, Rospidah Ghazali, Nor Zuriati Amani Ab Rani, & Basri Abdul Talib
249 – 258
23. Concept of Privacy from Islamic Perspective in Flood Evacuation Centre By: Asiah Abdul Rahim & Wan Mohamad Amin W Seman
259 – 266
v © 2019 by MIP
24. Awareness and Knowledge of TPO (Act 172) Among Construction Industry Professionals and Local Planning Authority Personnel in Klang Valley By: Nik Adlin Nik Mohamed Sukri, Wan Tarmeze Wan Ariffin & Noriah Othman
267 – 279
25. Empowering Community Movement: Emprical Evidence By: Aisyah Abu Bakar, Mariana Mohamed Osman & Muhammad Faris Abdulla
280 – 289
26. Measuring Attributes and Behavioural Patterns of Street Liveliness in Urban Area By: Normah Sulaiman, Yusfida Ayu Abdullah & Raja Norashekin Raja Othman
290 – 301
27. Personal Empowerment as Determinants of Organisational Opportunity By: Aisyah Abu Bakar, Mariana Mohamed Osman & Muhammad Faris Abdullah
302 – 311
28. Predictability of Positive Relationships Through Personal Empowerment By: Aisyah Abu Bakar, Mariana Mohamed Osman & Muhammad Faris Abdullah
312 – 321
29. Users’ Perception on Children at Masjid – Planning for Children Friendly Masjid By: Aniza Abu Bakar, Zur Atiqa Zulkifely, Noor Hanita Abd. Majid, & Mohd. Burhan Ibrahim
322 – 333
30. An Assessment on Early Warning System: Initial Survey Analysis By: Mohd Ramzi Mohd Hussain, Noor Suzilawati Rabe, Ismawi Zen, Izawati Tukiman, Rahsidi Sabri Muda, & Ahmad Fadhli Mamat
334 – 342
31. Respondents’ Area of Preference When Disaster Strikes: A Case Study of Cameron Highland By: Noor Suzilawati Rabe, Mohd Ramzi Mohd Hussain, Izawati Tukiman, Ismawi Zen, Rahsidi Sabri Muda, & Ahmad Fadhli Mamat
343 – 351
32. Quality of Life Assessment Based on Economic Well-Being Perspective: A Case Study of Johor Bahru and Petaling, Selangor By: Mariana Mohamed Osman, Nur Farhanah Rosli & Noor Suzilawati Rabe
352 – 360
Notes to contributors and guidelines for manuscript submission 361
Ethics Statement 363
© 2019 by MIP vi
MIP Council Members
2019 - 2021 Session
President
TPr. Hj Ihsan Zainal Mokhtar (305/94)
Immediate Past President
TPr. Hj Md Nazri Mohd Noordin (301/94)
Vice President
TPr. Mohd Zamri Husin (430/01)
Datin TPr. Hjh Mazrina Dato' Abdul Khalid (559/09)
Honorary Secretary
Datin TPr. Hjh Noraida Saludin (468/02)
Honorary Treasury
TPr. Hj. Abdul Hamid Akub (450/01)
Council Members
TPr. Mohamad Nazri Jaafar (168/86)
TPr. Fathuddin Kamaruddin (656/16)
TPr. Wan Andery Wan Mahmood (572/10)
TPr. Mohammad Fauzi Ahmad (418/99)
Assoc Prof. TPr. Dr. Mariana Mohamed Osman (581/11)
TPr. Juwairiyah Ho Abdullah (453/02)
TPr. Hj Nik Mohd Ruiz Ahmad Fakhrul Razy (570/10)
TPr. Fu Swee Yun (553/99)
TPr. Abdul Halim Ali Hassan (407/98)
TPr. Saiful Azman Abd Rashid (474/03)
1Ph.D. Candidate at Universiti Putra Malaysia. Email: [email protected] 1
PLANNING MALAYSIA:
Journal of the Malaysian Institute of Planners
VOLUME 17 ISSUE 2 (2019), Page 1 – 12
CLEANLINESS INSPECTION OF THE ABLUTION SPACES OF THE
FEDERAL TERRITORY MOSQUE
Hayder Jawad Shakir Haraty1 & Nangkula Utaberta2
1,2Faculty of Design and Architecture
UNIVERSITI PUTRA MALAYSIA
Abstract
Muslims go to mosques to congregate in prayers; some Malaysian mosques carry
historical value, whereas some are simply fine works of art. The term "Iconic
Mosque" has been defined by the Islamic Tourism Centre in Malaysia as “having
a design which represents the modern architecture and the cultural identity of the
country”. Some evidence shows that the ablution spaces in Malaysian Mosques
encountered many issues regarding their cleanliness. Three methods of study
were used to analyse the Federal Territory Mosque ablution spaces: physical
observation, architectural drawing analysis, and interview. The research aims to
improve the cleanliness of the ablution areas by studying their design aspects.
The study’s significance is to evaluate the cleanliness of ablution spaces at the
Federal Territory Mosque. The findings of this research revealed that using a
natural ventilation system could significantly improve the cleanliness of the
ablution areas if accompanied by a mechanical system. The investigation analysis
discovered that a smaller ablution room design could result in an unhygienic
space. The users’ abuse is one of the crucial factors that impact the ablution room
cleanliness.
Keywords: Architectural drawing analysis, Federal Territory Mosque, Malaysian
iconic mosques, physical observation, space cleanliness and hygiene
Hayder Jawad Shakir Haraty & Nangkula Utaberta
Cleanliness Inspection of the Ablution Spaces of the Federal Territory Mosque
© 2019 by MIP 2
INTRODUCTION
Ablution is a ritual activity that requires a Muslim to clean specific parts of the
body in a sequence, and it is required before each prayer (Zakaria, Salleh, Harun,
& Rashid, 2015). Cleanliness is one of the essential aspects of Islam; it has
physical and mental attributes for the human being. The wholesome concept of
purity and cleanliness is one of the most important values that must be practised
in order to form a healthy and dynamic community and environment (Rahim,
2005). The research of Hamid, Taib, Wahab and Alias (2015) summarised that
Islam encourages environmental factors such as cleanliness, good hygiene, and
proper maintenance of prayer spaces. Neglecting any of these can result in
inadequate ventilation, bad odours, and in overall, unhealthy area. In any design
or facility, proper ventilation, which includes exposure to sunlight, significantly
improves a space’s hygiene and sanitation (Kumar, 2015). These qualities are
essential for any human environment, especially for spaces that include the use
of water (Sapri, Muin, Sipan, & Adjei Twum, 2014). An unclean space could be
created by a lack of designer's knowledge about users’ movement inside a mosque
and its facilities (Das, Qureshi, Chowdhury, & Alam, 2012). Therefore, the scope
of this study focusses on analysing the design layout of the Federal Territory
Mosque ablution rooms using three approaches: physical observation,
architectural drawing analysis and interview. The investigation helps to evaluate
the cleanliness of the ablution rooms in the case study. Understanding the drawing
layout assists with calculating the floor area and openings to be compared to
Uniformed Building By-Laws (UBBL). The interview provides enough
information from the management and the expertise to highlight the current issue
at the Federal Territory Mosque.
RESEARCH BACKGROUND
Zain et al. (2015) stated that Malaysian mosques require more attention in terms
of cleanliness; urgent improvements are needed to improve their facilities.
Moreover, environmental factors such as humidity and airflow are also
determining prayer-space space hygiene because they can cause bad smells,
fungi, and bacterial accumulation (Sapri et al., 2014). Another report by (Zulkifli,
2016) mentioned that Muslim communities should pay more attention to the
ablution room’s cleanliness and hygiene of mosques overall. There are several
factors such as inexperienced workers and users’ mistreatment that are also
affecting the hygiene of the religious spaces. Moist ventilation and space
accessibility have also been highlighted as an important factor of Malaysian
mosques hygiene (Zain et al., 2015). Additionally, more investigation of the
ablution rooms has found (Maher, 2016; Suhaimi, 2010) that the issue of
ventilation is epidemic in Malaysian’s mosques and has caused poor ventilation,
black footprints, and repulsive ablution rooms. These result in public concern.
Maher also stated that besides these issues, the location of the ablution room in a
PLANNING MALAYSIA
Journal of the Malaysia Institute of Planners (2019)
3 © 2019 by MIP
dingy basement, poor ventilation, and improper treatment of space have also been
reported by users. Other research (e.g. Haraty & Utaberta, 2018) depicted an
unclean ablution area during the peak of the congregational hour in one
Malaysian iconic mosque. However, most of the studies have dealt with smaller
ablution spaces and suraus1; there is a lack of research that investigates the
cleanliness of the ablution rooms in grand mosques in Malaysia. The study
recommends further inspection regarding the ablution areas in the Malaysian
iconic mosques.
METHODOLOGY This study uses a qualitative approach that involves physical observation,
architectural drawing analysis, and interviews. According to the Ministry of
Tourism, Art and Culture Malaysia (MOTAC) and the Islamic Tourism Centre
(ITC), there are 53 Malaysian mosques considered to be iconic mosques in
Malaysia (Islamic Tourism Centre, 2013). Yin (2013) explained that the way to
find proper case studies for any research is to have a sufficient amount of data
that can be accessible. The research sample was taken from this group. Capturing
visual records during fieldwork can provide rich information for the research.
Visual images can be part of the research and its method of data collection
sometimes (Payne & Payne, 2004). Architectural drawing analysis is the method
of extracting information from drawings that helps to analyse the shape and the
size of the sample (Dosch, Tombre, Ah-Soon, & Masini, 2000; Roosli, O’Keefe,
& Mydin, 2013).
Physical Observation
The researcher observed one iconic mosque in Malaysia, which is the Federal
Territory Mosque. The investigation included three ablution rooms, which were
at Gate-A, B, and C. The physical observation includes inspecting the condition
of the ablution areas’ cleanliness. It also involves investigating the type of
ventilation system used, which has a direct impact on hygiene.
Architectural Drawing Analysis
Architecture drawing analysis includes studying the design form by hand
sketching the selected ablution spaces. A software application AutoCAD was
used to demonstrate the spatial organisation of the ablution areas. Uniform
Building By-Laws (UBBL) are used to compare the findings from architectural
analysis to the Malaysian standards. Architectural drawing analysis is further
used to understand if the ablution spaces have achieved the minimum
requirement, which is not less than 10% of the total floor area for space with a
natural ventilation system as stipulated in the Uniform Building By-Law 1984
1surau is a small prayer space or a small building used for prayer. It does not have the same status as a mosque
Hayder Jawad Shakir Haraty & Nangkula Utaberta
Cleanliness Inspection of the Ablution Spaces of the Federal Territory Mosque
© 2019 by MIP 4
(UBBL). The following equation is used to compare the results from the
architectural drawing analysis to UBBL:
𝑇𝑜𝑡𝑎𝑙 𝑎𝑟𝑒𝑎 𝑜𝑓 𝑜𝑝𝑒𝑛𝑖𝑛𝑔𝑠 (𝑛𝑎𝑡𝑢𝑟𝑎𝑙 𝑣𝑒𝑛𝑡𝑖𝑙𝑎𝑡𝑖𝑜𝑛)
𝑇𝑜𝑡𝑎𝑙 𝑓𝑙𝑜𝑜𝑟 𝑎𝑟𝑒𝑎 𝑜𝑓 𝑡ℎ𝑒 𝑎𝑏𝑙𝑢𝑡𝑖𝑜𝑛 𝑎𝑟𝑒𝑎 ≥ 10% 𝑜𝑓 𝑡ℎ𝑒 𝑓𝑙𝑜𝑜𝑟 𝑎𝑟𝑒𝑎
Structured Interview Boyce & Neale (2006) stated that conducting structured interviews is usually
done with a small number of respondents to explore their perspectives regarding
an issue or situation. A structured interview is a qualitative type of research
technique, and it helps to generate understanding about an existing issue and
evaluate a specific phenomenon by transcribing, analysing, and planning a good
interview (Mason, 2002). An interview1 was conducted with the management
office of the Federal Territory Mosque to understand the obstacles and
complications regarding the ablution rooms.
FEDERAL TERRITORY MOSQUE
The construction of this mosque started in 1996 and was completed in 2000. It
has been serving Muslims as a community centre, research and educational
complex. It is located near the MATRADE building and Jalan Duta’s government
complex. The Sultan Ahmed Mosque in Turkey influences the mosque design. A
combination of traditional Malay and Middle East design elements are also
implemented in the design.
Physical Observation
The investigation was conducted on three different days: February 21st, and the
3rd and 5th of March 2018 and covered three ablution areas: Gate-A, Gate-B, and
Gate-C. The complexity of the design of this mosque was evident during the
physical observation. The ablution areas are scattered around four gates and
designed in smaller spaces.
During the usual hours, the mosque was not crowded. It was noticed that
all users are required to remove their shoes at the entrance gates to show their
respect and for cleanliness purposes. Worshippers must walk barefoot inside the
mosque and the ablution areas. Ablution Gate-A was the first one to be examined
in this research; the location of the ablution area is close to the women’s toilet
area, which has a direct impact on the smell of the ablution room. A person can
undoubtedly smell the odour coming from the toilet. According to the
observation, the ablution areas use both mechanical and natural ventilation.
Extractor fans have been installed on some sides of the walls. Although all
1The interview questions which were given to the participant are available upon request.
PLANNING MALAYSIA
Journal of the Malaysia Institute of Planners (2019)
5 © 2019 by MIP
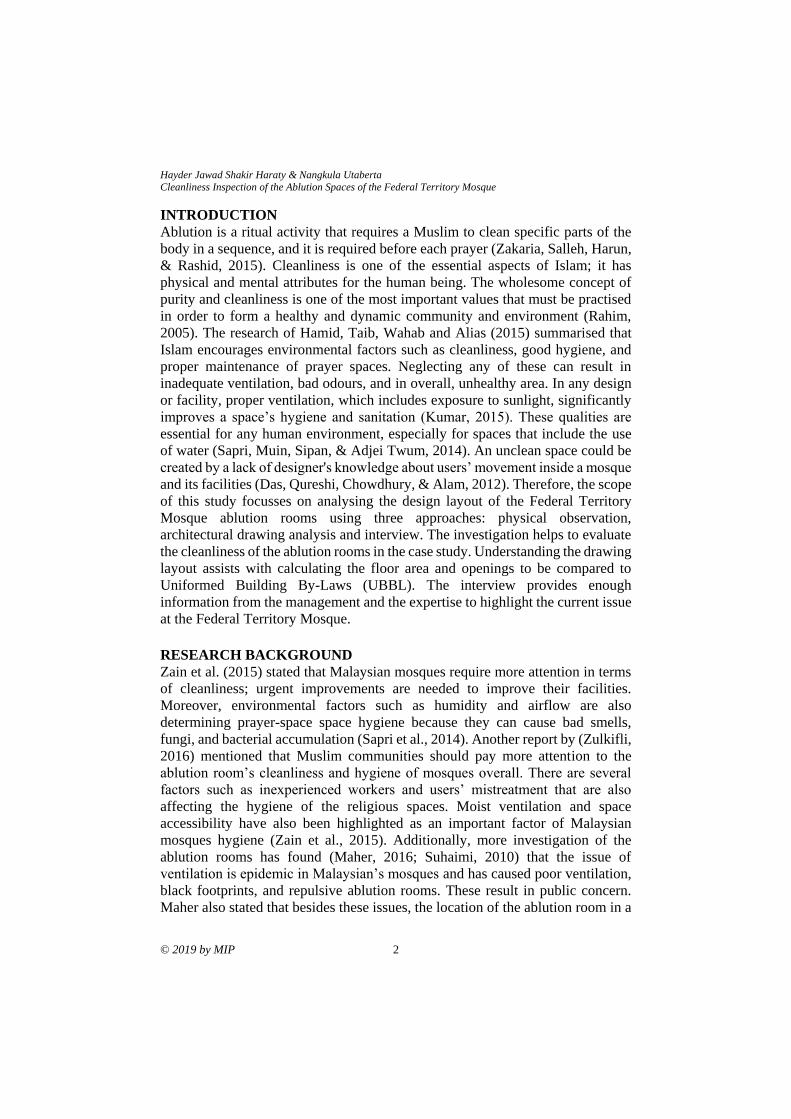
ablution rooms have artificial lighting, natural light during the day is sufficient.
Moreover, the Gate-A ablution room has 22 windows that provide the room with
natural sunlight and airflow. The ablution room also has a few ceiling fans and
extraction fans to maximize ventilation inside the space. The location of this
ablution room is important because it is very close to the prayer hall. The
researcher captured the following photographs during the physical observation of
the mosque. The photographs show the entrance of Gate-A ablution room and the
interior of the room.
Figure 1 Natural ventilation of Gate-A ablution room
Source: Author
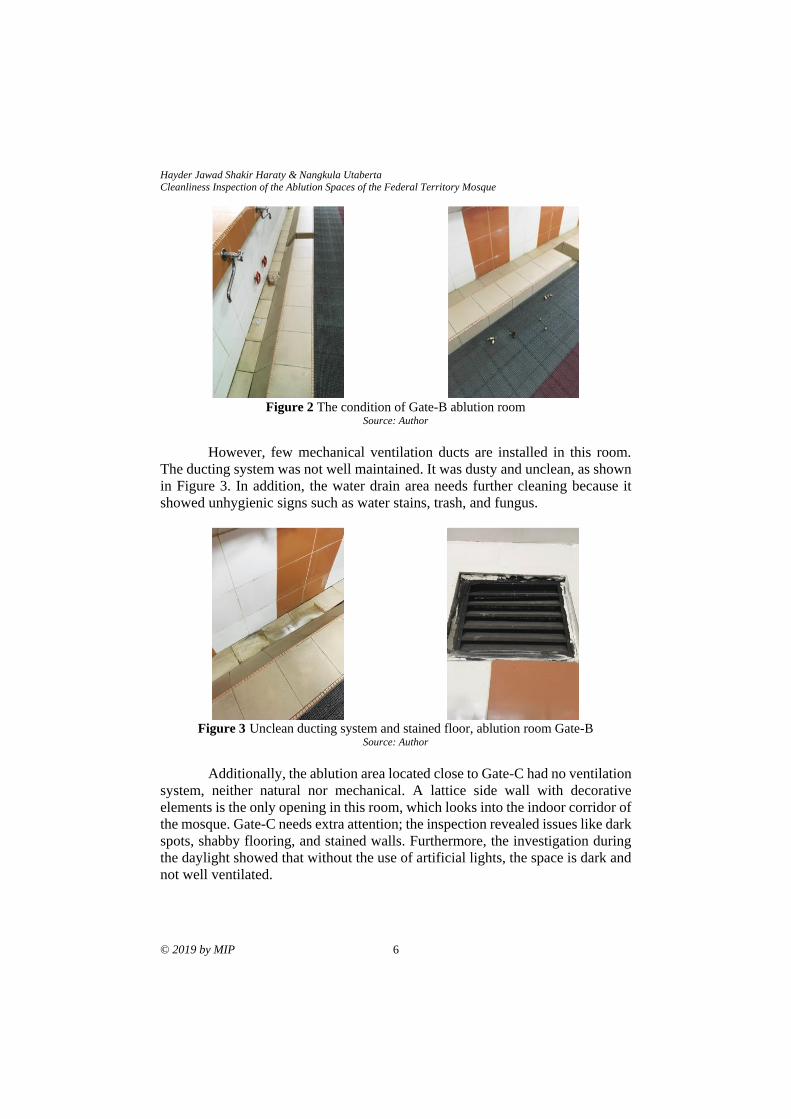
The Gate-B ablution room uses a natural ventilation system. During the
inspection, animal waste was spotted on the floor of the ablution room. The trash
bin was placed with no attention to its cleanliness; many insects such as flies, and
cockroaches were spotted. Additionally, the area was smelly, resulting from the
animal waste. There were dark spots on the floor of the ablution room which can
easily be traced. The design of the room and the location provides this space with
enough access to natural ventilation. This ablution area is close to the main
entrance, and the design of the walls are fully penetrating the exterior of the
mosque. No obstacles like a door on any other elements block the airflow inside
the space.
Hayder Jawad Shakir Haraty & Nangkula Utaberta
Cleanliness Inspection of the Ablution Spaces of the Federal Territory Mosque
© 2019 by MIP 6
Figure 2 The condition of Gate-B ablution room
Source: Author
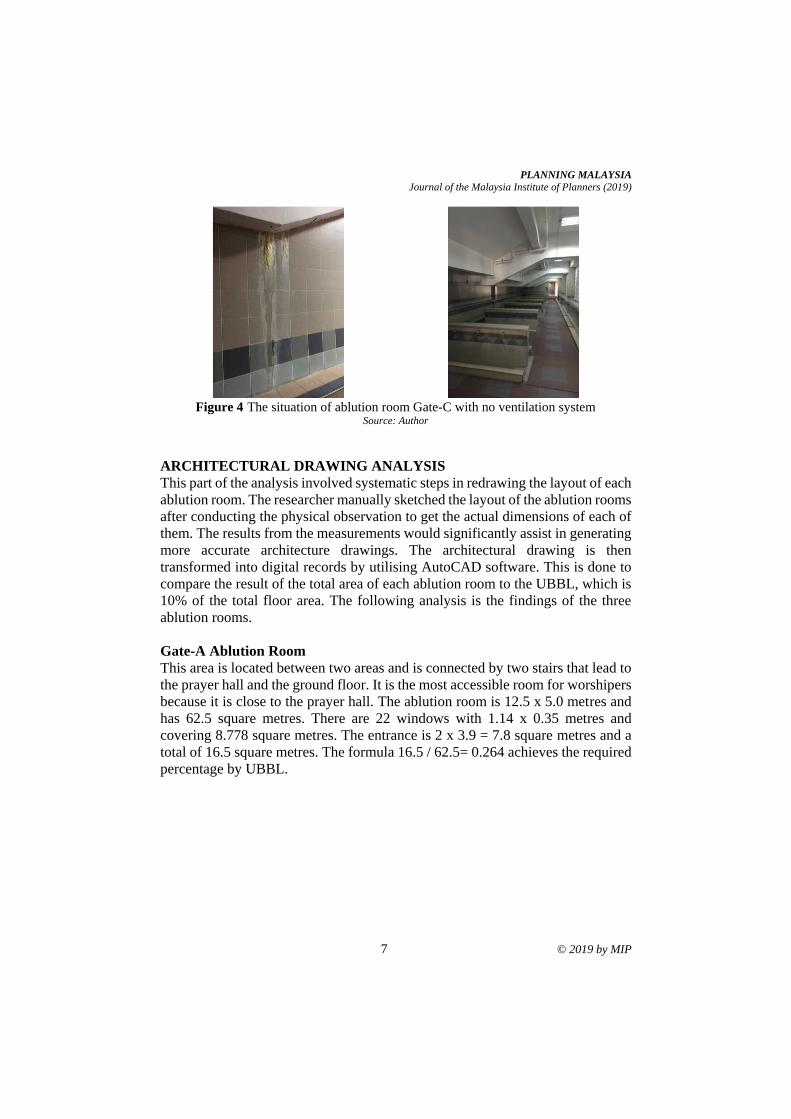
However, few mechanical ventilation ducts are installed in this room.
The ducting system was not well maintained. It was dusty and unclean, as shown
in Figure 3. In addition, the water drain area needs further cleaning because it
showed unhygienic signs such as water stains, trash, and fungus.
Figure 3 Unclean ducting system and stained floor, ablution room Gate-B
Source: Author
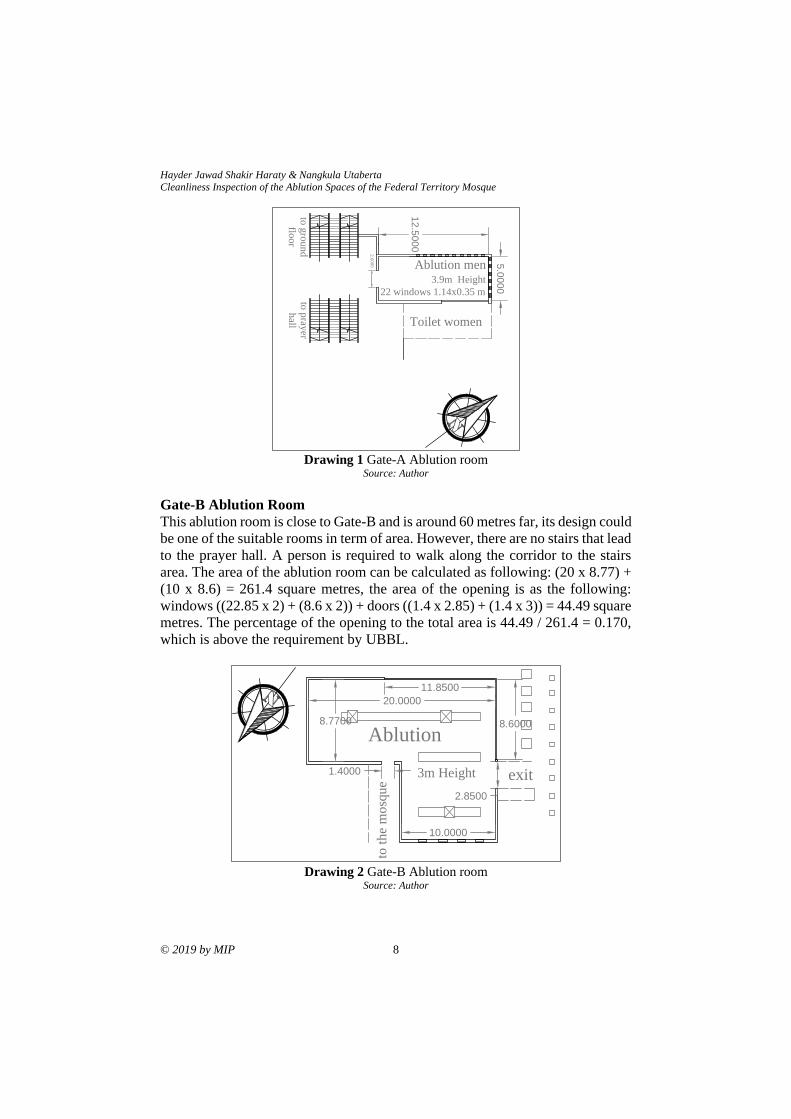
Additionally, the ablution area located close to Gate-C had no ventilation
system, neither natural nor mechanical. A lattice side wall with decorative
elements is the only opening in this room, which looks into the indoor corridor of
the mosque. Gate-C needs extra attention; the inspection revealed issues like dark
spots, shabby flooring, and stained walls. Furthermore, the investigation during
the daylight showed that without the use of artificial lights, the space is dark and
not well ventilated.
PLANNING MALAYSIA
Journal of the Malaysia Institute of Planners (2019)
7 © 2019 by MIP
Figure 4 The situation of ablution room Gate-C with no ventilation system
Source: Author
ARCHITECTURAL DRAWING ANALYSIS
This part of the analysis involved systematic steps in redrawing the layout of each
ablution room. The researcher manually sketched the layout of the ablution rooms
after conducting the physical observation to get the actual dimensions of each of
them. The results from the measurements would significantly assist in generating
more accurate architecture drawings. The architectural drawing is then
transformed into digital records by utilising AutoCAD software. This is done to
compare the result of the total area of each ablution room to the UBBL, which is
10% of the total floor area. The following analysis is the findings of the three
ablution rooms.
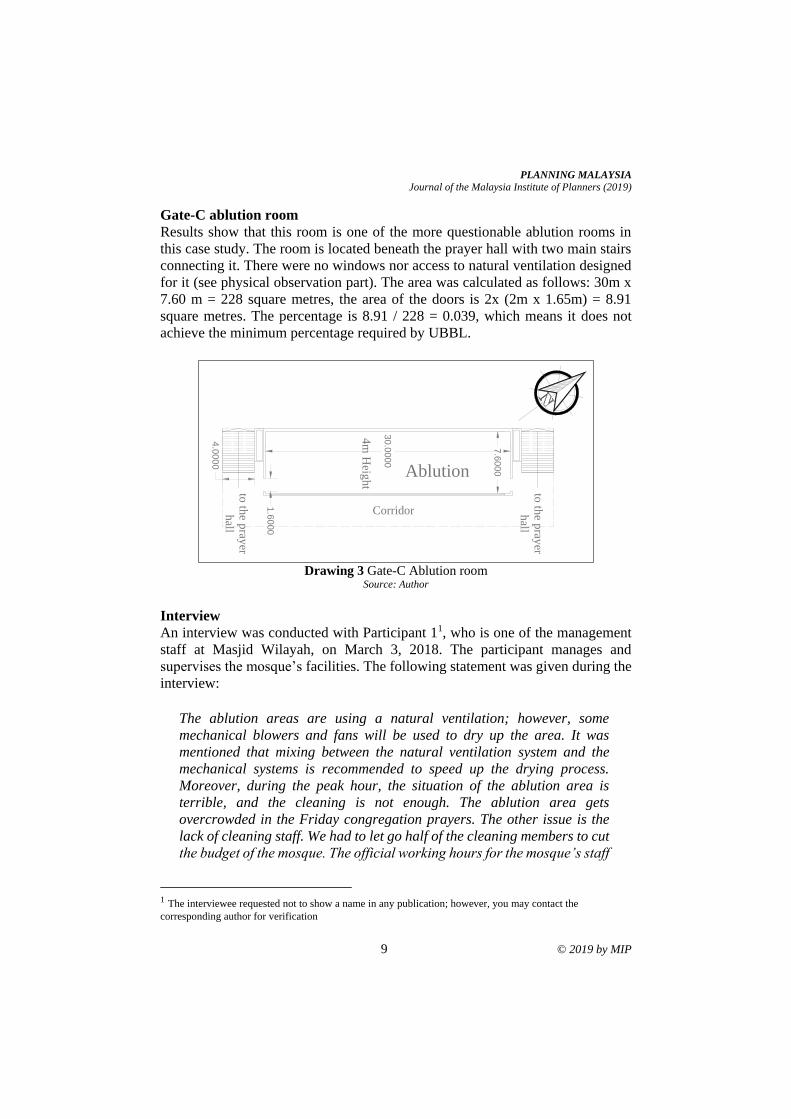
Gate-A Ablution Room
This area is located between two areas and is connected by two stairs that lead to
the prayer hall and the ground floor. It is the most accessible room for worshipers
because it is close to the prayer hall. The ablution room is 12.5 x 5.0 metres and
has 62.5 square metres. There are 22 windows with 1.14 x 0.35 metres and
covering 8.778 square metres. The entrance is 2 x 3.9 = 7.8 square metres and a
total of 16.5 square metres. The formula 16.5 / 62.5= 0.264 achieves the required
percentage by UBBL.
Hayder Jawad Shakir Haraty & Nangkula Utaberta
Cleanliness Inspection of the Ablution Spaces of the Federal Territory Mosque
© 2019 by MIP 8
Drawing 1 Gate-A Ablution room
Source: Author
Gate-B Ablution Room
This ablution room is close to Gate-B and is around 60 metres far, its design could
be one of the suitable rooms in term of area. However, there are no stairs that lead
to the prayer hall. A person is required to walk along the corridor to the stairs
area. The area of the ablution room can be calculated as following: (20 x 8.77) +
(10 x 8.6) = 261.4 square metres, the area of the opening is as the following:
windows ((22.85 x 2) + (8.6 x 2)) + doors ((1.4 x 2.85) + (1.4 x 3)) = 44.49 square
metres. The percentage of the opening to the total area is 44.49 / 261.4 = 0.170,
which is above the requirement by UBBL.
Drawing 2 Gate-B Ablution room
Source: Author
20
.00
00
8.7
70
0
1.4
00
0
2.8
50
0
10
.00
00
8.6
000
11
.85
00
Ab
lutio
n
to the mosque
exit
Ab
lutio
n ro
om
(Gate B
)
3m
Heig
ht
Corridor
4m
Heig
ht
to th
e pray
er
hall
to th
e pray
er
hall
30
.00
00
7.6
00
0
1.6
000
4.0
00
0
Ablution
Ab
lutio
n ro
om
(Gate C
)
Toilet women
12
.50
00
5.0
000
Ablution men3.9m Height
2.0
000
to g
rou
nd
floo
r
to p
rayer
hall
22 windows 1.14x0.35 m
Ab
lutio
n ro
om
(Gate A
)
20.0000
8.7700
1.4000
2.8500
10.0000
8.6000
11.8500
Ablution
to t
he
mo
squ
e
exit
Ablution room (Gate B)
3m Height
Co
rrid
or
4m Height
to the prayer
hall
to the prayer
hall
30.0000
7.6000
1.6000
4.0000
Ablu
tio
n
Ablution room (Gate C)
To
ilet
wo
men
12.5000
5.0000
Ab
luti
on
men
3.9
m
Hei
gh
t
2.0000
to ground
floor
to prayer
hall
22
win
do
ws
1.1
4x
0.3
5 m
Ablution room (Gate A)
PLANNING MALAYSIA
Journal of the Malaysia Institute of Planners (2019)
9 © 2019 by MIP
Gate-C ablution room
Results show that this room is one of the more questionable ablution rooms in
this case study. The room is located beneath the prayer hall with two main stairs
connecting it. There were no windows nor access to natural ventilation designed
for it (see physical observation part). The area was calculated as follows: 30m x
7.60 m = 228 square metres, the area of the doors is 2x (2m x 1.65m) = 8.91
square metres. The percentage is 8.91 / 228 = 0.039, which means it does not
achieve the minimum percentage required by UBBL.
Drawing 3 Gate-C Ablution room
Source: Author
Interview
An interview was conducted with Participant 11, who is one of the management
staff at Masjid Wilayah, on March 3, 2018. The participant manages and
supervises the mosque’s facilities. The following statement was given during the
interview:
The ablution areas are using a natural ventilation; however, some
mechanical blowers and fans will be used to dry up the area. It was
mentioned that mixing between the natural ventilation system and the
mechanical systems is recommended to speed up the drying process.
Moreover, during the peak hour, the situation of the ablution area is
terrible, and the cleaning is not enough. The ablution area gets
overcrowded in the Friday congregation prayers. The other issue is the
lack of cleaning staff. We had to let go half of the cleaning members to cut
the budget of the mosque. The official working hours for the mosque’s staff
1 The interviewee requested not to show a name in any publication; however, you may contact the
corresponding author for verification
20
.00
00
8.7
70
0
1.4
00
0
2.8
50
0
10
.00
00
8.6
000
11
.85
00
Ab
lutio
n
to the mosque
exit
Ab
lutio
n ro
om
(Gate B
)
3m
Heig
ht
Corridor
4m
Heig
ht
to th
e pray
er
hall
to th
e pray
er
hall
30
.00
00
7.6
00
0
1.6
000
4.0
00
0
Ablution
Ab
lutio
n ro
om
(Gate C
)
Toilet women
12
.50
00
5.0
000
Ablution men3.9m Height
2.0
00
0
to g
rou
nd
floo
r
to p
rayer
hall
22 windows 1.14x0.35 m
Ab
lutio
n ro
om
(Gate A
)
Hayder Jawad Shakir Haraty & Nangkula Utaberta
Cleanliness Inspection of the Ablution Spaces of the Federal Territory Mosque
© 2019 by MIP 10
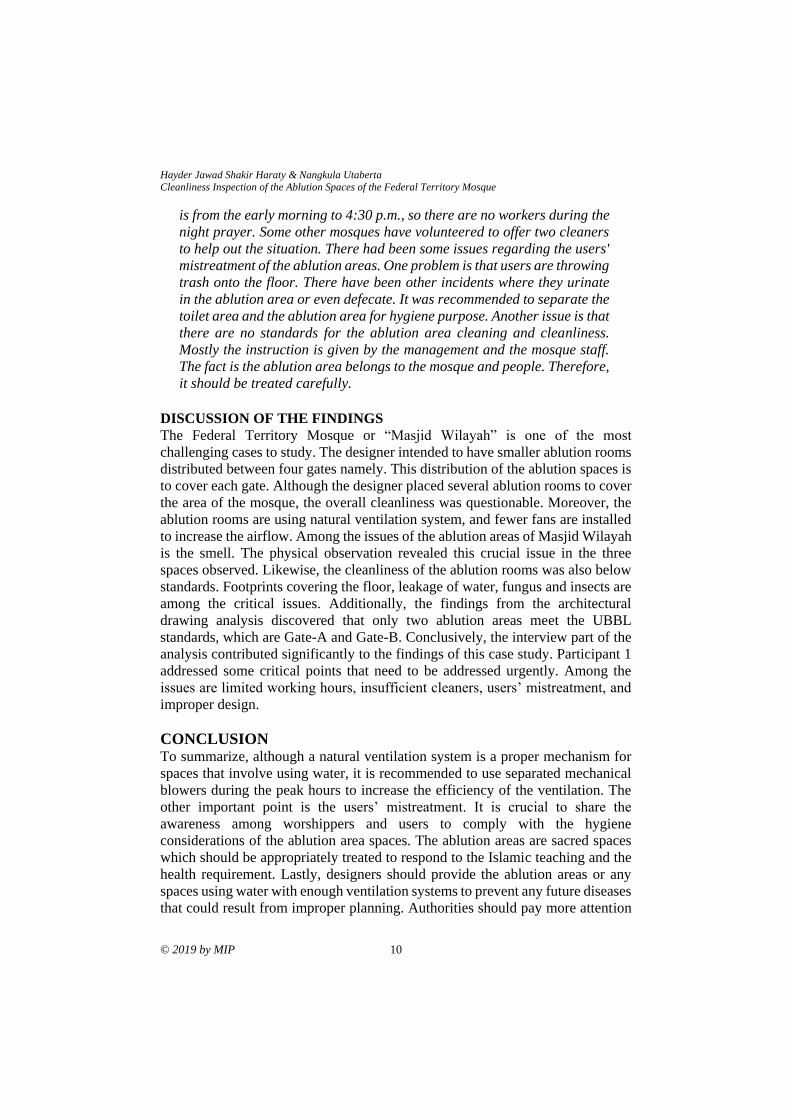
is from the early morning to 4:30 p.m., so there are no workers during the
night prayer. Some other mosques have volunteered to offer two cleaners
to help out the situation. There had been some issues regarding the users'
mistreatment of the ablution areas. One problem is that users are throwing
trash onto the floor. There have been other incidents where they urinate
in the ablution area or even defecate. It was recommended to separate the
toilet area and the ablution area for hygiene purpose. Another issue is that
there are no standards for the ablution area cleaning and cleanliness.
Mostly the instruction is given by the management and the mosque staff.
The fact is the ablution area belongs to the mosque and people. Therefore,
it should be treated carefully.
DISCUSSION OF THE FINDINGS
The Federal Territory Mosque or “Masjid Wilayah” is one of the most
challenging cases to study. The designer intended to have smaller ablution rooms
distributed between four gates namely. This distribution of the ablution spaces is
to cover each gate. Although the designer placed several ablution rooms to cover
the area of the mosque, the overall cleanliness was questionable. Moreover, the
ablution rooms are using natural ventilation system, and fewer fans are installed
to increase the airflow. Among the issues of the ablution areas of Masjid Wilayah
is the smell. The physical observation revealed this crucial issue in the three
spaces observed. Likewise, the cleanliness of the ablution rooms was also below
standards. Footprints covering the floor, leakage of water, fungus and insects are
among the critical issues. Additionally, the findings from the architectural
drawing analysis discovered that only two ablution areas meet the UBBL
standards, which are Gate-A and Gate-B. Conclusively, the interview part of the
analysis contributed significantly to the findings of this case study. Participant 1
addressed some critical points that need to be addressed urgently. Among the
issues are limited working hours, insufficient cleaners, users’ mistreatment, and
improper design.
CONCLUSION To summarize, although a natural ventilation system is a proper mechanism for
spaces that involve using water, it is recommended to use separated mechanical
blowers during the peak hours to increase the efficiency of the ventilation. The
other important point is the users’ mistreatment. It is crucial to share the
awareness among worshippers and users to comply with the hygiene
considerations of the ablution area spaces. The ablution areas are sacred spaces
which should be appropriately treated to respond to the Islamic teaching and the
health requirement. Lastly, designers should provide the ablution areas or any
spaces using water with enough ventilation systems to prevent any future diseases
that could result from improper planning. Authorities should pay more attention
PLANNING MALAYSIA
Journal of the Malaysia Institute of Planners (2019)
11 © 2019 by MIP
to provide enough regulations and standards to generate healthier spaces that
respond to users’ needs.
ACKNOWLEDGEMENTS This research was partially supported by Geran Universiti Putra Malaysia / Putra
Graduate Initiative (IPS). We thank anonymous reviewers for their comments on an
earlier version of the manuscript.
REFERENCES Boyce, C., & Neale, P. (2006). Conducting in-depth interview: A guide for designing and
conducting in-depth interviews. Pathfinder International Tool Series, Monitoring
and Evaluation-2.
Das, R., Qureshi, T., Chowdhury, M., & Alam, M. (2012). Health factors in Islamic
perspectives and its relation to sustainability with case study at traditional and
modern mosque. Journal of Environmental Science and Natural Resources, 5(1),
49-63.
Dosch, P., Tombre, K., Ah-Soon, C., & Masini, G. (2000). A complete system for the
analysis of architectural drawings. International Journal on Document Analysis and
Recognition, 3(2), 102-116.
Hamid, A.B.A., Taib, M. Z. M., Wahab, M. H. A., & Alias, A. (2015). The design and
environmental aspects of the prayer room. In R. Omar, H. Bahrom, & G. D. Mello
(Eds.), Islamic perspectives relating to business, arts, culture and communication:
Proceedings of the 1st ICIBACC 2014 (pp. 1–9). Basingstoke, England: Springer.
Haraty, H. J. S., & Utaberta, N. (2018). An inspection of the ablution room from
cleanliness perspective: Case study of Federal Territory Mosque. In 2nd Mini
Symposium on Islamic Tourism 2018. April 19-20, 2018, Kuala Lumpur, Malaysia.
Islamic Tourism Centre. (2013). Mosque trails in Malaysia: A showcase of 57 iconic
mosques from 14 states rich in history and majestic architecture. Kuala Lumpur:
Ministry of Tourism & Culture, Malaysia. Available at www.itc.gov.my
Kumar, G. (2015). Environment sanitation and building design. International Journal for
Innovative Research in Science & Technology, 2(07), 71-76.
Maher, H. (2016). Suraus in shopping malls: A holy place neglected by Malaysians.
Retrieved from http://www.malaysiandigest.com/frontpage/282-main-tile/639295-
suraus-in-shopping-malls-a-holy-place-neglected-by-malaysians.html
Mason, J. (2002). Qualitative researching (Second). London: SAGE Publications.
Payne, G., & Payne, J. (2004). Key concepts in social research. Thousand Oaks, CA:
SAGE.
Rahim, A. A. (2005). A concept of clean toilet from the Islamic perspective. Journal of
Islamic Built Environment, 1(1), 71-84.
Roosli, R., O’Keefe, P., & Mydin, A. O. (2013). Evolution of disaster planning and
housing in Malaysia: A reviews. World Applied Sciences Journal, 21(7), 945-959.
Sapri, M., Muin, Z. A., Sipan, I., & Adjei Twum, A. (2014). Barriers in managing mosque
facilities: Towards sustainable facilities management approach. International Real
Estate Research Symposium 2014 (IRERS 2014), 1-8.
Suhaimi, M. (2010). Kerja-kerja mencuci bilik wuduk & tandas surau. Retrieved from
https://www.jmbpks7.com.my/kerja-kerja-mencuci-bilik-wuduk-tandas-surau/
Hayder Jawad Shakir Haraty & Nangkula Utaberta
Cleanliness Inspection of the Ablution Spaces of the Federal Territory Mosque
© 2019 by MIP 12
Uniform Building By-Laws 1984 (Malaysia).
Yin, R. K. (2013). Case study research: Design and methods. Thousand Oaks, CA:
SAGE.
Zain, A. M., Saberi, N. E., Jaafar, F., Fauz, F. H. A., Ramli, W. N. R. W., & Lugiman, F.
A. (2015). International Colloquium of Art and Design Education Research (i-
CADER 2014). Singapore: Springer.
Zakaria, A. Z., Salleh, I. H., Harun, S. N., & Rashid, M. S. A. (2015). International
Colloquium of Art and Design Education Research (i-CADER 2014). Singapore:
Springer.
Zulkifli, H. Z. Z. (2016). Pakai sendal jepit, pegang sikat, Zola bersihkan tempat wudhu
Mesjid Agung Al-Falah. Retrieved from https://infojambi.com/zumi-zola-bersihkan-
mesjid-agung-al-falah/
Received: 12th January 2019. Accepted: 2nd August 2019
1Research Fellow at the University of Malaya. Email: [email protected] 13
PLANNING MALAYSIA:
Journal of the Malaysian Institute of Planners
VOLUME 17 ISSUE 2 (2019), Page 12 – 26
INCOME INEQUALITY ACROSS STATES IN MALAYSIA
Nai Peng Tey1, Siow Li Lai2, Sor Tho Ng3, Kim Leng Goh4,
& Ahmad Farid Osman5
1,2,3,4,5Faculty of Economics and Administration
UNIVERSITI MALAYA
Abstract
This paper examines income differentials across the 16 states/territories in
Malaysia, using quantile regression of income per capita on a nationally
representative sample of 24,463 households in 2014. The results show that the
vast differentials in income per capita across states are attenuated after taking into
account urban-rural and ethnic distribution, but remain significant. Income
differentials across states vary at different levels of income, being more
pronounced at the lower ends of the distributions. States and territory in the
central region had the highest income. The three states in the southern regions
fared better than those in the northern region (except Penang), and the eastern
region as well as East Malaysia. Other variables such as level of urbanisation, the
educational level, migration, employment structure, and female labour force
participation may also affect income differentials across states.
Keywords: Income, distribution, differentials, inequality, states, regions,
ethnicity, urban-rural, Malaysia, quantile regression
Nai Peng Tey, Siow Li Lai, Sor Tho Ng, Kim Leng Goh, & Ahmad Farid Osman
Income Inequality Across States in Malaysia
© 2019 by MIP 14
INTRODUCTION
Malaysia consists of 13 states (11 in Peninsular Malaysia, and two on the Borneo
Island across the South China Sea) and three Federal Territories. The Northern
region comprises Perlis, Kedah, Penang, and Perak, the Central region includes
Selangor and the Federal Territories of Kuala Lumpur and Putrajaya, the
Southern region comprises Negeri Sembilan, Malacca, and Johore, the Eastern
region comprises Pahang, Terengganu, and Kelantan, while East Malaysia
comprises Sabah, Sarawak and the Federal Territory of Labuan.
Since independence in 1957, rapid socio-economic development has
transformed Malaysia from a low-income rural agricultural society to an
increasing reliance on the manufacturing and services sectors, with three-quarters
of its population living in the urban areas. The economy was growing at around
8% per annum for more than three decades before the Asian Financial Crisis in
1997. Apart from the recessions in 2001 and 2008 due to the global financial
crisis, the Malaysian economy has been growing at between 4.5% and 6% per
annum since 2002.
The GDP per capita rose from Ringgit Malaysia (RM) 20,870 (US$6,480)
in 2005 to RM38,853 (US$9,721) in 2016 (DOSM, 2017c). Malaysia is an upper
middle-income high Human Development Index (HDI) country (ranked 59th in
the world). Between 1970 and 2014, development efforts had eradicated absolute
poverty and reduced general poverty from 49.3% in 1970 to just 0.4% in 2016.
The Gini coefficient has come down from 0.513 in 1970 to 0.401 in 2014
(Economic Planning Unit, 2015).
The Malaysian economic policies pursued since the 1970s have been
underpinned by the development philosophy of growth with distribution,
focussing on poverty eradication to reduce economic imbalances between ethnic
groups and across regions. While the development programmes have succeeded
in reducing the incidence of poverty, wide economic disparities persist to this
day. In pursuing a more balanced regional development, the government has
created five development corridors in the northern, southern and eastern regions
in Peninsular Malaysia, as well as Sabah and Sarawak during the 9th Malaysia
Plan period (2006-2010). However, these efforts at redirecting employment
opportunities have so far not resulted in significant population redistribution. The
population continues to grow much more rapidly in the central region than in the
regions with the development corridors. There are still wide variations in income
across states. In 2016, the median and mean monthly household income ranged
from RM3,037 and RM4,214 in Kelantan to RM9,073 and RM11,692 in Kuala
Lumpur respectively (DOSM, 2017a).
There is a rather sizeable literature on income distribution and inequality
in Malaysia (Jomo, 2004; Khalid, 2011; Milanovic, 2006; Ragayah, 1999, 2008,
2009; Saari, Dietzenbacher, & Los, 2014; Shari & Ragayah, 1990; Shireen,
1998). Most of these earlier studies had focussed on ethnic differentials in
PLANNING MALAYSIA
Journal of the Malaysia Institute of Planners (2019)
15 © 2019 by MIP
income, as it was the main objective of the New Economic Policy (1970-1990)
to reduce economic disparities between the ethnic groups. A few recent studies
have explored regional income inequalities (Abdullah, Doucouliagos, &
Manning, 2015; Ali & Ahmad, 2009; Habibullah, Dayang-Afizzah, & Puah,
2012; Habibullah, Smith, & Dayang-Afizzah, 2008; Hooi, Nguyen, & Jen, 2011).
A significant finding by Abdullah (2012) based on meta-regression analysis and
panel data econometrics, is that regional income inequality has a positive effect
on growth; and that while income inequality has declined in general, there is a
tendency to increasing inequality between Malaysian states.
Past studies on income distribution and poverty in Malaysia have
consistently found significant ethnic and urban-rural differentials in income, even
after adjusting for other socioeconomic variables (Ismail & Jajri, 2012; Khalid,
2011; Ragayah, 2008; Rodríguez‐Pose & Tselios, 2009; Saari, Dietzenbacher, &
Los, 2014). However, to our knowledge, no research has been done on the
moderating effects of these two variables on state differentials in income in
Malaysia. Hence, this article seeks to analyse income inequality across states,
taking into account the ethnic and urban-rural distribution. Because income data
are not normally distributed, and the income differentials across states may not
be the same at different income level, quantile regression was used in this analysis
instead of the ordinary least square (OLS) method used in previous local and
international studies (Estudillo, Sawada, & Otsuka, 2008; Ismail & Jajri, 2012;
Ismail & Noor, 2005; Kajisa & Palanichamy, 2006; Milanovic, 2006;
Onyebinama & Onyejelem, 2010; Ragayah, 2008; Schafgans, 2000).
An analysis of the income differentials across states at different income
level, and the relevant factors affecting income differentials are needed to provide
some inputs to inform policy on reducing regional income disparity. This article
also aims to contribute to the literature on relative poverty and income
distribution in developing countries.
METHODOLOGY
Data
Data for this article came from the Household Income and Basic Amenities
Survey conducted by the Department of Statistics, Malaysia (DOSM) in 2014.
The sampling frame for the selection of sample for this survey used the updated
Household Sampling Frame, making up of urban and rural Enumeration Blocks
(EBs) created for the 2010 Population and Housing Census. The two-stage
stratified sampling design was adopted to select 10,432 EBs in the first phase,
and then systematic sampling was used to select 81,632 living quarters, covering
81,137 households to produce a representative sample of all the households in the
country. The Department of Statistics Malaysia provided raw data for a sub-
sample of 24,463 households for this analysis. At the time of the writing of this
Nai Peng Tey, Siow Li Lai, Sor Tho Ng, Kim Leng Goh, & Ahmad Farid Osman
Income Inequality Across States in Malaysia
© 2019 by MIP 16
report, the Department of Statistics Malaysia has not released the sample data for
the latest round of survey conducted in 2016.
The survey collected information on household income for twelve months.
The sources of income comprise paid employment, self-employment, property,
and investment income and current transfers received, received by all members
of households, both in cash and in kinds which repeatedly occur within a year.
The mean monthly gross household income for the sample in this study was
RM6,141, with relative standard error (RSE) of 0.4% or a standard error of
RM25.
Methods
The dependent variable for this study is monthly income per capita (monthly
income divided by household size). The income per capita was found to be not
normally distributed, and hence the regression analysis used the logarithm term
of income. The urbanisation level and ethnic distribution vary across the states.
The regression analysis included urban-rural and ethnic distributions as these two
variables are closely associated with income. Other relevant variables such as
migration, education, urbanisation, and employment structure were not included
in the regression model, as these variables refer to the characteristics of the
individuals, while the dependent variable is at the household level. Instead, this
paper examines the median household income for each state by selected socio-
demographic and economic conditions.
The differentials in monthly income per capita across states, taking into
account the level of urbanisation and ethnic distribution, were estimated using
quantile regression. As compared to OLS that merely estimates the conditional
mean of income, quantile regression has the advantage of allowing the estimation
of the parameter differentials across quantiles of the income distribution. The
quantile regression model, adapted from Koenker and Basset (1978), is shown as
follows:
(1)
where yi is monthly income per capita for household i, i = 1, 2, …, n, xi is the
vector of independent variables, β is the parameter, and εi is the disturbance term.
The estimators for a quantile θ, 0<θ<1, is obtained by minimizing the objective
function F over βθ, as shown below:
(2)
Data were analysed using Eviews 9, based on the QREG method. The
standard errors of the estimators were estimated through bootstrapping, with 100
replications. The inverse variance-weighted average method was used to
𝑦𝑖 = 𝑥𝑖𝛽 + 𝜀𝑖
𝐹(𝛽𝜃) = 𝜃 𝑦𝑖 − 𝑥𝑖′𝛽𝜃
𝑁
𝑖𝜖 𝑖:𝑦𝑖≥𝑥𝑖′𝛽𝜃
+ (1 − 𝜃) 𝑦𝑖 − 𝑥𝑖′𝛽𝜃
𝑁
𝑖𝜖 𝑖:𝑦𝑖<𝑥𝑖′𝛽𝜃
PLANNING MALAYSIA
Journal of the Malaysia Institute of Planners (2019)
17 © 2019 by MIP
overcome under- or over-representation of each state, based on the "weight"
variable constructed for the 2014 Household Income and Amenities Survey.
RESULTS
Income Differentials across States
In 2014, the national mean and median monthly income per capita was estimated
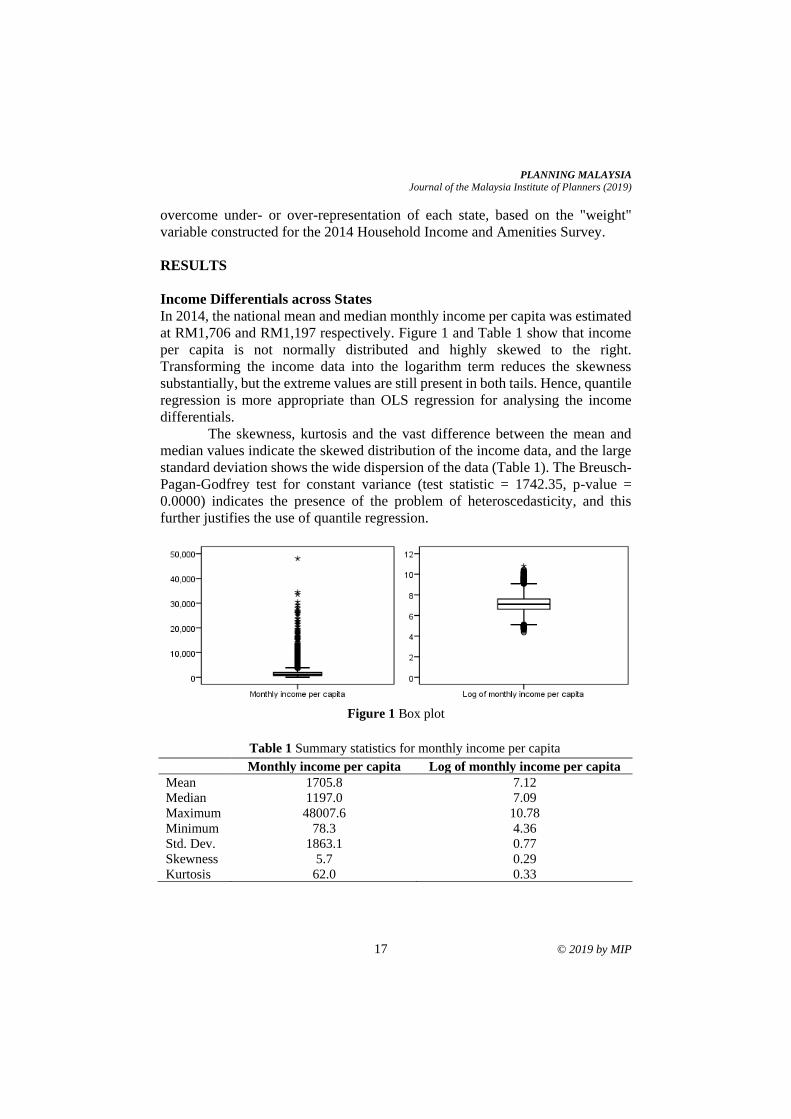
at RM1,706 and RM1,197 respectively. Figure 1 and Table 1 show that income
per capita is not normally distributed and highly skewed to the right.
Transforming the income data into the logarithm term reduces the skewness
substantially, but the extreme values are still present in both tails. Hence, quantile
regression is more appropriate than OLS regression for analysing the income
differentials.
The skewness, kurtosis and the vast difference between the mean and
median values indicate the skewed distribution of the income data, and the large
standard deviation shows the wide dispersion of the data (Table 1). The Breusch-
Pagan-Godfrey test for constant variance (test statistic = 1742.35, p-value =
0.0000) indicates the presence of the problem of heteroscedasticity, and this
further justifies the use of quantile regression.
Figure 1 Box plot
Table 1 Summary statistics for monthly income per capita
Monthly income per capita Log of monthly income per capita
Mean 1705.8 7.12
Median 1197.0 7.09
Maximum 48007.6 10.78
Minimum 78.3 4.36
Std. Dev. 1863.1 0.77
Skewness 5.7 0.29
Kurtosis 62.0 0.33
Nai Peng Tey, Siow Li Lai, Sor Tho Ng, Kim Leng Goh, & Ahmad Farid Osman
Income Inequality Across States in Malaysia
© 2019 by MIP 18
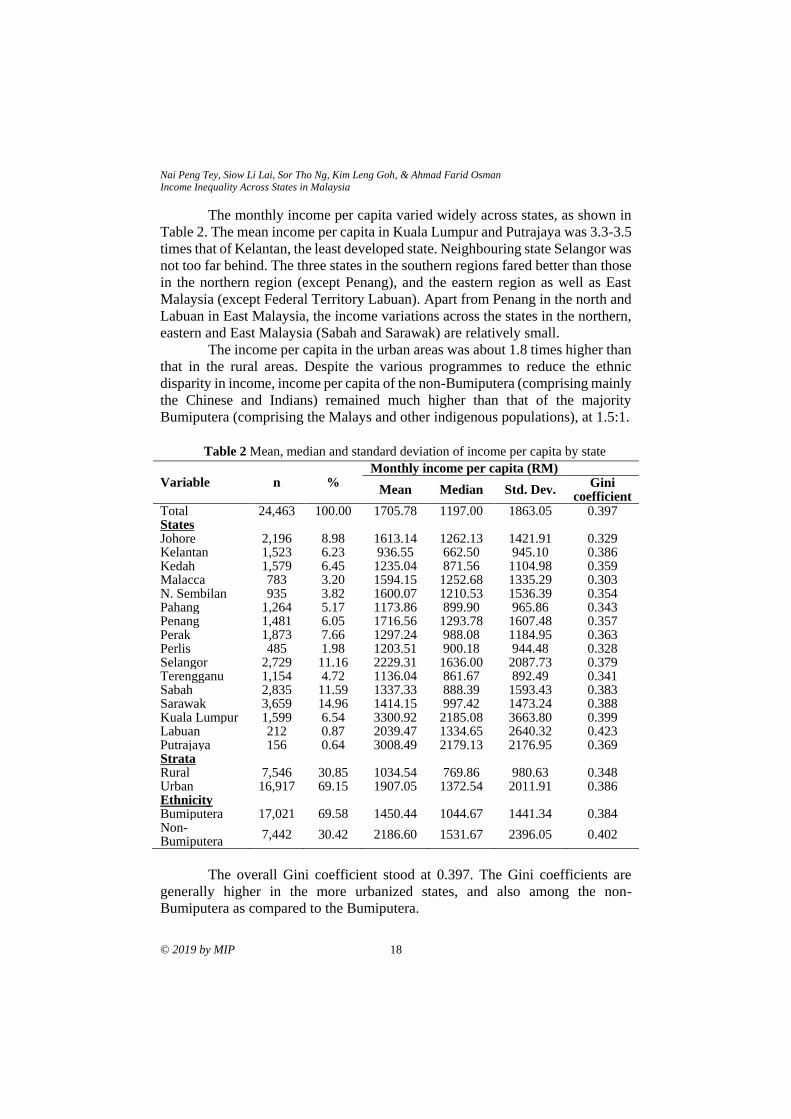
The monthly income per capita varied widely across states, as shown in
Table 2. The mean income per capita in Kuala Lumpur and Putrajaya was 3.3-3.5
times that of Kelantan, the least developed state. Neighbouring state Selangor was
not too far behind. The three states in the southern regions fared better than those
in the northern region (except Penang), and the eastern region as well as East
Malaysia (except Federal Territory Labuan). Apart from Penang in the north and
Labuan in East Malaysia, the income variations across the states in the northern,
eastern and East Malaysia (Sabah and Sarawak) are relatively small.
The income per capita in the urban areas was about 1.8 times higher than
that in the rural areas. Despite the various programmes to reduce the ethnic
disparity in income, income per capita of the non-Bumiputera (comprising mainly
the Chinese and Indians) remained much higher than that of the majority
Bumiputera (comprising the Malays and other indigenous populations), at 1.5:1.
Table 2 Mean, median and standard deviation of income per capita by state
Variable n % Monthly income per capita (RM)
Mean Median Std. Dev. Gini
coefficient Total 24,463 100.00 1705.78 1197.00 1863.05 0.397 States Johore 2,196 8.98 1613.14 1262.13 1421.91 0.329 Kelantan 1,523 6.23 936.55 662.50 945.10 0.386 Kedah 1,579 6.45 1235.04 871.56 1104.98 0.359 Malacca 783 3.20 1594.15 1252.68 1335.29 0.303 N. Sembilan 935 3.82 1600.07 1210.53 1536.39 0.354 Pahang 1,264 5.17 1173.86 899.90 965.86 0.343 Penang 1,481 6.05 1716.56 1293.78 1607.48 0.357 Perak 1,873 7.66 1297.24 988.08 1184.95 0.363 Perlis 485 1.98 1203.51 900.18 944.48 0.328 Selangor 2,729 11.16 2229.31 1636.00 2087.73 0.379 Terengganu 1,154 4.72 1136.04 861.67 892.49 0.341 Sabah 2,835 11.59 1337.33 888.39 1593.43 0.383 Sarawak 3,659 14.96 1414.15 997.42 1473.24 0.388 Kuala Lumpur 1,599 6.54 3300.92 2185.08 3663.80 0.399 Labuan 212 0.87 2039.47 1334.65 2640.32 0.423 Putrajaya 156 0.64 3008.49 2179.13 2176.95 0.369 Strata Rural 7,546 30.85 1034.54 769.86 980.63 0.348 Urban 16,917 69.15 1907.05 1372.54 2011.91 0.386 Ethnicity Bumiputera 17,021 69.58 1450.44 1044.67 1441.34 0.384 Non-Bumiputera
7,442 30.42 2186.60 1531.67 2396.05 0.402
The overall Gini coefficient stood at 0.397. The Gini coefficients are
generally higher in the more urbanized states, and also among the non-
Bumiputera as compared to the Bumiputera.
PLANNING MALAYSIA
Journal of the Malaysia Institute of Planners (2019)
19 © 2019 by MIP
Table 3 The estimated weighted least square (WLS) and quantile regression
WLS q10 q25 q50 q75 q90
States
Kelantan (ref.)
Johore 0.4387*** 0.5440*** 0.5606*** 0.4656*** 0.3182*** 0.2430***
Kedah 0.1835*** 0.1929*** 0.2400*** 0.1874*** 0.1676*** 0.1137**
Malacca 0.3899*** 0.4828*** 0.5294*** 0.3987*** 0.3228*** 0.2111***
Negeri Sembilan 0.4131*** 0.4362*** 0.5064*** 0.4311*** 0.3669*** 0.2417***
Pahang 0.2064*** 0.2530*** 0.3012*** 0.2233*** 0.1277** 0.0637
Penang 0.3735*** 0.4997*** 0.5117*** 0.3899*** 0.2923*** 0.2021***
Perak 0.1685*** 0.2035*** 0.2328*** 0.1819*** 0.1458*** 0.0659
Perlis 0.2529*** 0.3267*** 0.3711*** 0.2660*** 0.2323** 0.1668
Selangor 0.6340*** 0.6046*** 0.6509*** 0.6485*** 0.6160*** 0.6370***
Terengganu 0.1937*** 0.2081*** 0.2509*** 0.2455*** 0.1800*** 0.0604
Sabah 0.1966*** 0.0617 0.1547*** 0.2116*** 0.2469*** 0.2881***
Sarawak 0.3087*** 0.2746*** 0.3277*** 0.3010*** 0.2998*** 0.2863***
Kuala Lumpur 0.9146*** 0.8383*** 0.9232*** 0.9065*** 0.8996*** 0.9995***
Labuan 0.5128*** 0.4144*** 0.5348*** 0.5286*** 0.5697*** 0.5845***
Putrajaya 1.0809*** 1.2740*** 1.1706*** 1.0139*** 1.0386*** 1.0500***
Strata
Rural (ref.)
Urban 0.3347*** 0.3139*** 0.3210*** 0.3347*** 0.3484*** 0.3396***
Ethnicity
Bumiputera (ref.)
Non-Bumiputera 0.2274*** 0.2224*** 0.2146*** 0.2302*** 0.2171*** 0.2455***
Constant 6.3872*** 5.5642*** 5.8801*** 6.3331*** 6.8360*** 7.3279***
Pseudo R2 - 0.1322 0.1264 0.1172 0.1046 0.1068
Adj. R2 0.2082 0.1316 0.1258 0.1166 0.1040 0.1061
Notes:
(a) Dependent variable is log of monthly income per capita.
(b) *** p<0.001, ** p<0.01, * p<0.05.
(c) WLS was used instead of OLS to take into account the effect of the "weight" variable.
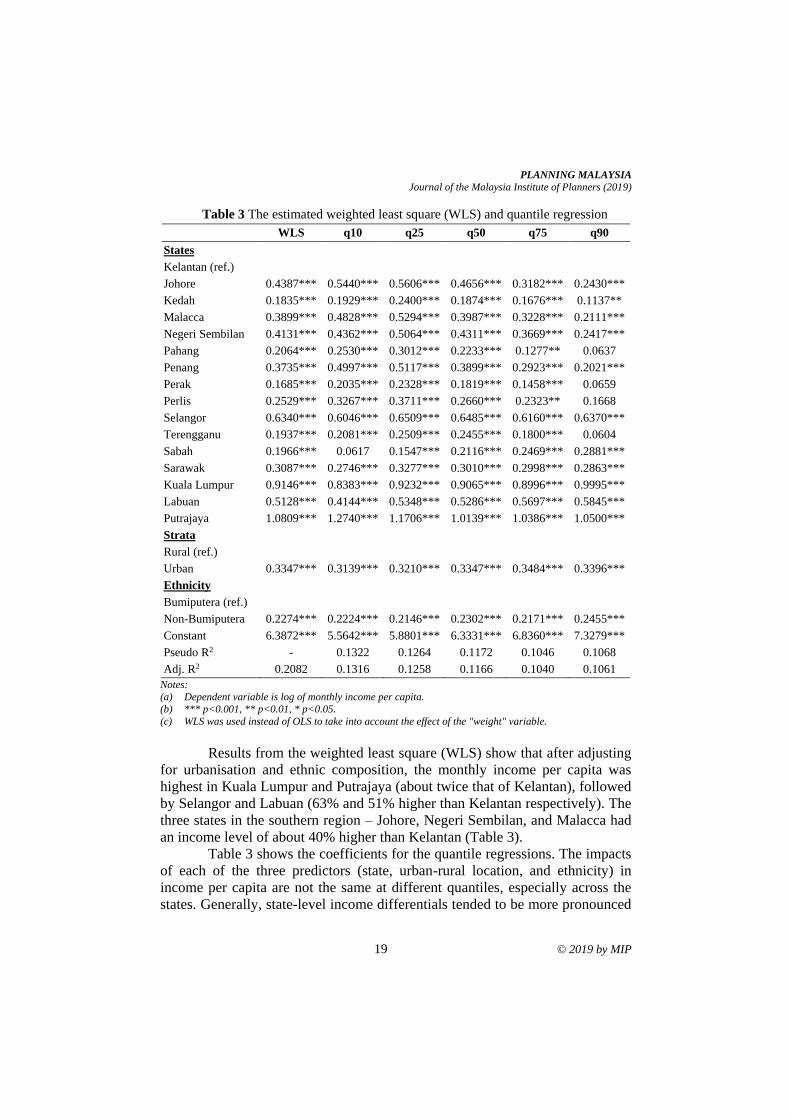
Results from the weighted least square (WLS) show that after adjusting
for urbanisation and ethnic composition, the monthly income per capita was
highest in Kuala Lumpur and Putrajaya (about twice that of Kelantan), followed
by Selangor and Labuan (63% and 51% higher than Kelantan respectively). The
three states in the southern region – Johore, Negeri Sembilan, and Malacca had
an income level of about 40% higher than Kelantan (Table 3).
Table 3 shows the coefficients for the quantile regressions. The impacts
of each of the three predictors (state, urban-rural location, and ethnicity) in
income per capita are not the same at different quantiles, especially across the
states. Generally, state-level income differentials tended to be more pronounced
Nai Peng Tey, Siow Li Lai, Sor Tho Ng, Kim Leng Goh, & Ahmad Farid Osman
Income Inequality Across States in Malaysia
© 2019 by MIP 20
at the lower income levels (q10 and q25), as compared to higher income levels,
except Sabah and Labuan where the income differentials with other states were
less pronounced at q10 and q25 than at upper quantiles. Except for Kuala Lumpur,
Labuan, Sabah, and Putrajaya, q25 provides the most significant income
differentials across the states in Malaysia.
There are significant income differentials between the different ethnic
groups (Table 3). The non-Bumiputera had a higher income than the Bumiputera
in all quantiles, and the differential was most notable at q90. The urban-rural
income disparity was even more pronounced. Households in urban areas had a
much higher income than those in the rural areas in all the quantiles, and the most
significant differential was at q75.
Explaining the Income Differentials across States
Several factors such as urbanisation, ethnic distribution, education level, internal
migration, employment structure, female labour force participation, and
household size may affect the income differentials across the states. Some of
these variables are closely associated with one another. For instance, the
propensity to migrate among the higher educated is much higher than those who
have fewer years of schooling, and the Bumiputera are much more likely than the
non-Bumiputera to reside in the rural areas. The following sections examine the
association between the median income per capita and these variables by states,
as shown in Table 4.
Urbanisation
The urbanisation level varies from 47% in Kelantan to over 93% in Penang and
Selangor and 100% in Kuala Lumpur and Putrajaya. The median income per
capita is higher in the more urbanized states (Table 4). The 2017 Salaries and
Wages Survey Report shows that the average earning of a worker in the rural
areas, at RM2,040 (median RM1,400), was much lower than that of their urban
counterparts at RM3,038 (median RM2,260) (DOSM, 2018). The large income
differentials between urban and rural areas were in turn due to other factors such
as higher educational level, the availability of higher paid jobs as well as higher
female labour force participation rate in the urban areas. There are two conflicting
policies concerning migration in the 11th Malaysia Plan. While propelling sectoral
migration towards high-value-added and knowledge-intensive activities in the
cities, the Government has also taken initiatives to enable the mobilisation of rural
youths in entrepreneurship activities to minimise migration to urban areas
(Economic Planning Unit, 2015).
PLANNING MALAYSIA
Journal of the Malaysia Institute of Planners (2019)
21 © 2019 by MIP
Education
The educational level of workers varies widely by states. Tabulation of the 2%
sample data from the 2010 Population Census shows that the proportion of
population aged 20-60 years who had a post-secondary education was lowest in
Sabah and Sarawak (at around 16%-17%) and highest in Putrajaya (63%),
followed by Kuala Lumpur (45%) (Table 4). The income per capita is strongly
associated with the proportion of prime working age population with post-
secondary education. Higher education has a substantial premium in the
remuneration of the workers. The 2017 Wages and Salary survey showed that the
mean earned income ranged from RM1,649 among those with primary education
to RM2,055 among those with secondary education and RM4,300 among those
with tertiary education (DOSM, 2018).
Internal Migration
Migration tends to be selective of the high-skill workers. Being the
administrative, commercial, business, the industrial and educational hub of the
country, the central region comprising Kuala Lumpur, Putrajaya and Selangor has
been the main destination of migrants from all over the country. Data from the
2010 Population Census show that more than 60% of the working population
aged 20 to 60 years in Kuala Lumpur and Selangor were born outside the state
(Table 4). In comparison, only 9% of the people in Kelantan and 14% in Sarawak
were born outside the state. The economic opportunities in the more developed
states have acted as a pull factor for migrants in the receiving states, and the
inflows of highly educated and trained migrants have contributed to the higher
income level of the receiving states. On the other hand, the sending states are
further disadvantaged by the outflow of the more resourceful segments of the
population, thus exacerbating the regional income inequality. Table 4 depicts the
close association between internal migration and income level.
Occupation
The managers/administrators and the professionals are among the highest paid
workers, with a mean salary of RM7,847 (median RM5,800) and RM5,084
(median RM4,467) respectively, as compared to the national average of RM2,880
(median RM2,160) as of 2017 (DOSM, 2018). Hence, the higher income level in
Kuala Lumpur, Putrajaya and Selangor can be explained by the much higher
proportion of managers/administrators and professionals, as shown in Table 4.
Nai Peng Tey, Siow Li Lai, Sor Tho Ng, Kim Leng Goh, & Ahmad Farid Osman
Income Inequality Across States in Malaysia
© 2019 by MIP 22
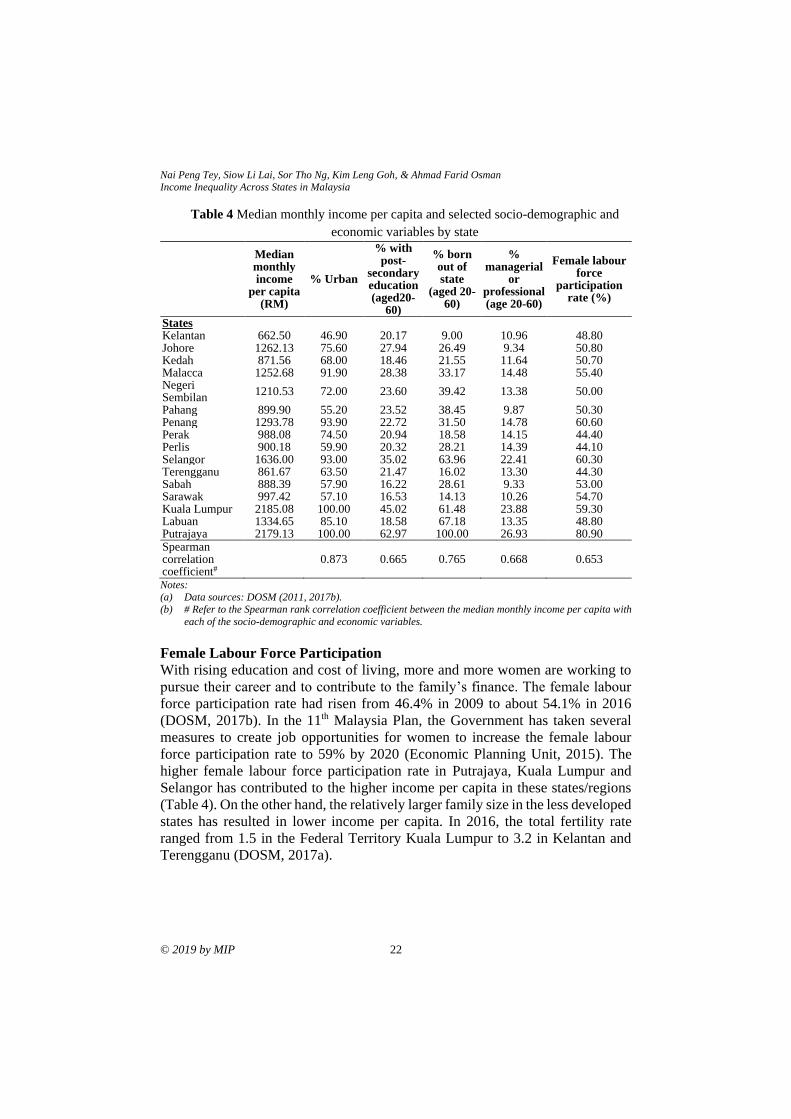
Table 4 Median monthly income per capita and selected socio-demographic and
economic variables by state
Median monthly income
per capita (RM)
% Urban
% with post-
secondary education (aged20-
60)
% born out of state
(aged 20-60)
% managerial
or professional (age 20-60)
Female labour force
participation rate (%)
States Kelantan 662.50 46.90 20.17 9.00 10.96 48.80 Johore 1262.13 75.60 27.94 26.49 9.34 50.80 Kedah 871.56 68.00 18.46 21.55 11.64 50.70 Malacca 1252.68 91.90 28.38 33.17 14.48 55.40 Negeri Sembilan
1210.53 72.00 23.60 39.42 13.38 50.00
Pahang 899.90 55.20 23.52 38.45 9.87 50.30 Penang 1293.78 93.90 22.72 31.50 14.78 60.60 Perak 988.08 74.50 20.94 18.58 14.15 44.40 Perlis 900.18 59.90 20.32 28.21 14.39 44.10 Selangor 1636.00 93.00 35.02 63.96 22.41 60.30 Terengganu 861.67 63.50 21.47 16.02 13.30 44.30 Sabah 888.39 57.90 16.22 28.61 9.33 53.00 Sarawak 997.42 57.10 16.53 14.13 10.26 54.70 Kuala Lumpur 2185.08 100.00 45.02 61.48 23.88 59.30 Labuan 1334.65 85.10 18.58 67.18 13.35 48.80 Putrajaya 2179.13 100.00 62.97 100.00 26.93 80.90 Spearman correlation coefficient#
0.873 0.665 0.765 0.668 0.653
Notes:
(a) Data sources: DOSM (2011, 2017b).
(b) # Refer to the Spearman rank correlation coefficient between the median monthly income per capita with
each of the socio-demographic and economic variables.
Female Labour Force Participation
With rising education and cost of living, more and more women are working to
pursue their career and to contribute to the family’s finance. The female labour
force participation rate had risen from 46.4% in 2009 to about 54.1% in 2016
(DOSM, 2017b). In the 11th Malaysia Plan, the Government has taken several
measures to create job opportunities for women to increase the female labour
force participation rate to 59% by 2020 (Economic Planning Unit, 2015). The
higher female labour force participation rate in Putrajaya, Kuala Lumpur and
Selangor has contributed to the higher income per capita in these states/regions
(Table 4). On the other hand, the relatively larger family size in the less developed
states has resulted in lower income per capita. In 2016, the total fertility rate
ranged from 1.5 in the Federal Territory Kuala Lumpur to 3.2 in Kelantan and
Terengganu (DOSM, 2017a).
PLANNING MALAYSIA
Journal of the Malaysia Institute of Planners (2019)
23 © 2019 by MIP
DISCUSSION
This analysis shows that the wide income differentials across states and regions
are attenuated after taking into account the urbanisation level and ethnic
composition of the states. Both the urbanisation and ethnic variables are closely
related to the employment structure and income. Jobs in the services and
manufacturing sectors in the urban labour market tend to command a higher pay
due to the higher skill required. Perrela-Tallo (2017) argued that the growing
income inequality is due to biased technological change, as it increases the
income share of the wealthy households at a faster rate than the poorer
households. The urban services sector, the driver of Malaysia’s economic growth,
has been transforming rapidly toward more capital intensive and knowledge-
based activities that yield a higher premium. In terms of ethnicity, the non-
Bumiputera, in particular, the Chinese community has dominated the businesses
in Malaysia. Hence, states with a higher concentration of Chinese tend to have a
more developed business sector, which generates more wealth.
Malaysia’s substantial investment in education and skills training and the
creation of high paying jobs have been the key factors behind the rapid economic
growth and social development. With the provision of free education up to the
upper secondary level, and the liberalization of the education policy since the late
1990s, tertiary enrolment ratio has exceeded 40%, and females have overtaken
the males in higher education (World Bank, 2018). The higher educated youths
tend to seek jobs in the capital cities in the central region, depleting the human
resources in the sending areas. While increased female labour force participation
rate will result in raising the household and national income, such an increase is
likely to concentrate in the big cities where there is a higher demand for skilled
workers. All these trends will exacerbate regional inequality.
With the eradication of absolute poverty, the focus is now on raising the
income level of the bottom 40% of the income categories. Since 2012, the
government has been providing annual cash assistance to the poor. In the 2019
Budget, the government provided a yearly cost of living assistance (BSH) of
RM1,000 to households with a monthly income of RM2,000 and below, RM700
to households with monthly income from RM2,001 to RM3,000, and RM500 to
households with monthly income from RM3,001 to RM4,000. Hakim (2000)
found that a large portion of the total inequality in Malaysia was attributable to
labour income. The adoption of a minimum wage of RM1,100 in 2019 would
reduce the income gap between the rich and the poor. Efforts such as the
development corridors have also been made to create jobs in the less developed
states/regions.
As regional inequality remains an important policy issue, there is a need
for an assessment of the effectiveness of the various policies and programmes in
narrowing the regional income disparity for appropriate intervention strategies to
be undertaken. This analysis has explored some plausible reasons for the
Nai Peng Tey, Siow Li Lai, Sor Tho Ng, Kim Leng Goh, & Ahmad Farid Osman
Income Inequality Across States in Malaysia
© 2019 by MIP 24
persistence of income inequality across the states. More detailed studies are
needed to find out the underlying causes, and more effective programmes need to
be formulated and implemented. The effectiveness of the development corridors
in population and labour redistribution remains to be seen. While Malaysia takes
pride in the full employment situation, there is a concern about the continued
influx of migrant workers, who make up about one-fifth of the workforce. There
is a need to provide the necessary support and assistance to enable more women
and men to have a work-life balance while pursuing their career to increase the
household income. Policymakers and employers may consider a more flexible
employment structure and greater use of technology.
In conclusion, income inequality across states remains wide despite
various efforts to bring about a more balanced regional growth and development.
This analysis has shown that state-level differentials in ethnic and urban-rural
population distribution, educational level, migration pattern, and employment
structure are closely associated with income per capita. More detailed analysis is
needed to assess the impact of individual characteristics on their earning, as data
become available.
ACKNOWLEDGEMENTS
We are grateful to the Centre of Poverty and Development Studies (CPDS),
Faculty of Economics and Administration, the University of Malaya for the
funding support. We are also grateful to the Department of Statistics, Malaysia
(DOSM) for the permission to use the data from the 2014 Household Income and
Basic Amenities Survey.
REFERENCES Abdullah, A. J. (2012). Inequality, education and growth in Malaysia (Doctorate
dissertation). Deakin University, Australia.
Abdullah, A. J., Doucouliagos, H., & Manning, E. (2015). Are regional incomes in
Malaysia converging? Papers in Regional Science, 94(S1), S69-S94.
Ali, H., & Ahmad, S. (2009). Why poor regions remain poor? Evidence from Malaysia.
International Review of Business Research Papers, 5(1), 340-351.
DOSM. (2011). 2010 Population and housing census of Malaysia (Census 2010).
Putrajaya.
DOSM. (2017a). Household income and basic amenities survey report 2016. Putrajaya.
DOSM. (2017b). Labour force survey, Malaysia, 2016. Putrajaya.
DOSM. (2017c). Malaysia economics statistics - time series. Putrajaya.
DOSM. (2018). Salaries and wages survey report, Malaysia, 2017. Putrajaya:
Department of Statistics, Malaysia.
Economic Planning Unit. (2015). Eleventh Malaysia plan, 2016-2020. Putrajaya:
Economic Planning Unit, Prime Minister's Department.
Estudillo, J. P., Sawada, Y., & Otsuka, K. (2008). income dynamics, schooling
investment, and poverty reduction in Philippine villages, 1985–2004. In K.
PLANNING MALAYSIA
Journal of the Malaysia Institute of Planners (2019)
25 © 2019 by MIP
Otsuka, J. P. Estudillo, & Y. Sawada (Eds.), Rural Poverty and Income
Dynamics in Asia and Africa (pp. 22–46). USA: Routledge.
Habibullah, M. S., Smith, P., & Dayang-Afizzah, A. M. (2008). Has Kelantan grown
faster than the other states in Malaysia? A panel data analysis. MPRA Paper No.
12109.
Habibullah, M. S., Dayang-Afizzah, A. M., & Puah, C.-H. (2012). Regional income
disparities in Malaysia: A stochastic convergence analysis. Geografia-
Malaysian Journal of Society and Space, 8(5), 100-111.
Hakim, R. A. (2000). Income inequality in Malaysia: A decomposition analysis by
income sources. Analisis, 7(1&2), 45-60.
Hooi, G., Nguyen, D. T., & Jen, J. S. (2011). Output and income disparities across the
states of Malaysia, 1972-2009. In T. Nguyen (Ed.), Discussion papers
economics no. 2011-07. Queensland: Griffith Business School.
Ismail, R., & Noor, Z. M. (2005). Gender wage differentials in the Malaysian
manufacturing sector. International Journal of Economics, Management, and
Accounting, 13(2), 119-137.
Ismail, R., & Jajri, I. (2012). Gender wage differentials and discrimination in Malaysian
labour market. World Applied Sciences Journal, 19(5), 719-728.
Jomo, K. S. (2004). The new economic policy and interethnic relations in Malaysia. New
York: United Nations Research Institute for Social Development.
Kajisa, K., & Palanichamy, N. V. (2006). Income dynamics in Tamil Nadu, India from
1971 to 2003: Changing roles of land and human capital. Agricultural
Economics, 35(s3), 437-448.
Khalid, M. A. (2011). Household wealth in Malaysia: Composition and inequality among
ethnic groups. Jurnal Ekonomi Malaysia, 45, 71-80.
Koenker, R. W., & Bassett, G. (1978). Regression quantiles. Econometrica, 46(1), 33-50.
Milanovic, B. (2006). Inequality and determinants of earnings in Malaysia, 1984-1997.
Asian Economic Journal, 20(2), 191-216.
Onyebinama, U. A. U., & Onyejelem, J. C. (2010). Comparative analysis of determinants
of income of cassava farmers in rural and urban areas of Abia State, Nigeria.
Agricultural Journal, 5(2), 57-62.
Perera-Tallo, F. (2017). Growing income inequality due to biased technological change.
Journal of Macroeconomics, 52, 23-38.
Ragayah, H. M. Z. (1999). Growth with equity: Policy lessons from the experience of
Malaysia. In United Nations Economic and Social Commission for Asia and the
Pacific (Ed.), Growth with equity: Policy lessons from the experiences of
selected asian countries (pp. 117-162). New York: United Nations Publications.
Ragayah, H. M. Z. (2008). Income inequality in Malaysia. Asian Economic Policy
Review, 3(1), 114-132.
Ragayah, H. M. Z. (2009). Growth with equity: Reality and aspiration. Bangi: Universiti
Kebangsaan Malaysia Press.
Rodríguez‐Pose, A., & Tselios, V. (2009). Education and income inequality in the regions
of the European Union. Journal of Regional Science, 49(3), 411-437.
Saari, M. Y., Dietzenbacher, E., & Los, B. (2014). Income distribution across ethnic
groups in Malaysia: Results from a new social accounting matrix. Asian
Economic Journal, 28(3), 259-278.

Nai Peng Tey, Siow Li Lai, Sor Tho Ng, Kim Leng Goh, & Ahmad Farid Osman
Income Inequality Across States in Malaysia
© 2019 by MIP 26
Schafgans, M. M. A. (2000). Gender wage differences in Malaysia: Parametric and
semiparametric estimation. Journal of Development Economics, 63(2), 351-378.
Shari, I., & Ragayah, H. M. Z. (1990). The patterns and trends of income distribution in
Malaysia, 1970-1987. The Singapore Economic Review, 35(1), 102-123.
Shireen, M. H. (1998). Income inequalities and poverty in Malaysia. Kuala Lumpur:
Lanham, Md Rowand & Littlefield Publishers.
World Bank. (2018). World development indicators. Washington D.C. USA
Received: 20th September 2018. Accepted: 17th June 2019
1Student at Universiti Putra Malaysia. Email: [email protected] 27
PLANNING MALAYSIA:
Journal of the Malaysian Institute of Planners
VOLUME 17 ISSUE 2 (2019), Page 27 – 37
THE QUANTIFICATION OF URBAN LITTER LOAD AT GROSS
POLLUTANT TRAP ALONG SUNGAI BATU, SELANGOR
Nur Khaliesah Abdul Malik1, Latifah Abd Manaf2, Nor Rohaizah Jamil3,
Mohd Hafiz Rosli4, Fasihah Mohd Yusof5, & Zulfa Hanan Ash’aari6
1,2,3,4,5,6Faculty of Environmental Studies
UNIVERSITI PUTRA MALAYSIA
Abstract
The massive amount of urban litter in Malaysia is influenced by rapid population
growth, development, economic growth and unsustainable lifestyles. Few studies
have assessed the amount of urban litter load and its composition at gross
pollutant trap (GPT), significantly contributing to lack of historical data. This
study is aimed to assess the amount of urban litter load in wet basis condition at
individual GPTs along Sungai Batu, Selangor in 2015. The urban litter collection
data at each GPT in 2015 were sourced from Department of Irrigation and
Drainage (DID). Samples were manually collected once a month, stored in plastic
bag and immediately weighed and recorded by following the ASCE standard
method. The result shows that the total amount of urban litter load in 2015 was
3761.72 kg/year (Mean ± SD; 313.4767 ± 141.9105 kg/year). In such situations,
further study on urban litter load and its composition trapped at GPTs is urgently
required as it is crucial to establish baseline data information during the decision
making process, holistically improving stormwater management and urban litter
management in Malaysia.
Keywords: Downstream defender; drainage; gross pollutant traps; quantification;
urban litter
Nur Khaliesah A.M., Latifah A.M., Nor Rohaizah J., Mohd Hafiz R., Fasihah M.Y., & Zulfa Hanan A.
The Quantification of Urban Litter Load at Gross Pollutant Trap along Sungai Batu, Selangor
© 2019 by MIP 28
INTRODUCTION
Urban litter is commonly known as the trash, debris, flotsam, jetsam, floatables,
gross pollutants, rubbish or solid waste (Armitage, 2007). The technical
definition of urban litter is a visible solid waste arising from urban environment
(Armitage, Rooseboom, Nel, & Townshend, 1998). In fact, the rising levels of
urban litter composition and quantity load are the most challenging
environmental issues to be addressed due to the various factors such as the growth
of the human population, type of development, anthropogenic activities through
littering; excessive of packaging; inefficient service of street sweeping; lack of
disposal facilities and lack of enforcement from authorities (Hall, 1996). The high
population and the areas with high levels of commercial activity produced
massive amount of urban litter in terms of quantity (Purcell & Magette, 2009).
The abundance of urban litter derived from residential and commercial areas have
a high tendency to be visible at the drainage and river that might be due to lack
number of disposal bins or individual behaviour in managing the waste. Ab Ghani
et al. (2011) stated that the rising urban population and developed areas also can
influence hydrological processes through stormwater runoff and characteristics
of peak flow. Impervious surfaces increase due to rapid development in urban
areas, which subsequently can generate more surface runoff which conveys urban
litter into receiving water bodies such as rivers.
Furthermore, the rising urban litter composition and quantity load at GPT
is also derived from the characteristics of catchment, management practices
including law enforcement and services, the efficiency and effectiveness of litter
removal by local authority (Marais, Armitage, & Pithey, 2001); environmental
awareness among the communities (Sidek, Basri, Lee, & Foo, 2016); types of
land use (Lariyah, Norazli, Nasir, Hidayah, & Zuleika, 2011); and climate
conditions and rainfall patterns (Mohd Shah et al., 2016; Alam, Anwar, Sarker,
Heitz, & Rothleitner, 2017). Therefore, in such a situation, the factors described
above contribute to the various types of litter composition in the stormwater
system, which encompasses plastic, paper, metal, glass, metal, vegetation,
sediment and others (Marais et al., 2001) illegally dumped nearby or directly into
the drainage system through the littering activities or transported by wind or
surface runoff.
GPT IN STORMWATER MANAGEMENT PRACTICES IN MALAYSIA
There are several types of GPTs available for urban stormwater management and
treatment applications in Malaysia, such as Type 1 (floating debris trap; trash
racks and litter control devices); Type 2 (sediment basin and trash rack (SBTR)
traps); and Type 3 (oil and grease interceptor) (Jabatan Pengairan dan Saliran,
2012).
In this study, the Department of Irrigation and Drainage (DID) has
introduced the GPTs with a downstream defender as a hydrodynamic deflective
PLANNING MALAYSIA
Journal of the Malaysia Institute of Planners (2019)
29 © 2019 by MIP
separation device (Fitzgerald & Bird, 2011) with hydrodynamic vortex separator
system for stormwater treatment applications (Faram, Lecornu, & Andoh, 2000)
to trap litter at the drainage conveyance along Sungai Batu, Selangor. The
mechanism of this device can be described as diverting the incoming flow and
associated pollutants away from the main flow stream of the pipe or waterway
into a pollutant separation and containment chamber. Generally, GPTs are vital
in stormwater management practices where GPTs act as devices to control water
quality by trapping and removing gross pollutants which commonly greater than
five millimetres (>5mm) such as urban litter washed into stormwater system and
reduce the effect of pollutants loads from entering the receiving water bodies
(Madhani & Brown, 2015). However, Alam et al. (2017) stated that the periodic
cleaning process of GPTs is challenging and ineffective for removal of pollutants
less than 5 millimetres (<5mm). The estimation performance of GPTs efficiency
to remove the urban litter is about 10% to 30% (Fletcher, Duncan, Poelsma, &
Lloyd, 2004). High proportions of pollutants including gross pollutants,
sediments, and nutrients will be transported from the contributing catchment area
to the receiving water bodies during the higher runoff volume.
In such situations, the size of catchment, pollutant load, type of drainage
system and cost are the main factors in operating the gross pollutant devices
(Sidek et al., 2016) prior to installation of GPT at the selected site. The installation
and maintenance costs, and costs of gross pollutant disposal can also affect the
efficiency of GPTs indirectly through the budget and capacity of the
management, as the conditions of gross pollutant vary during the different season
in terms of load and its composition. Generally, a trap with a dry load condition
is easier to operate and deliver to the landfill as compared to traps with wet load,
which are more expensive to operate due to difficulty in the cleaning process
(Fitzgerald & Bird, 2011).
There are limited studies in assessing the amount of urban litter load and
its composition at GPTs, and this significantly contributes to the lack of historical
data. Thus, this study is aimed to assess the amount (quantity) of urban litter load
on a wet basis condition at individual GPTs along Sungai Batu, Selangor in 2015.
The types of urban litter composition data were not tested and analysed in this
study. Further investigation on urban litter composition trapped at GPTs is
strongly required as it is crucial to providing baseline data and information for
stakeholder agencies. These data are one of the main environmental indicators for
improving the GPT performance and maintenance, which subsequently gives
informative input during the decision-making process and make a better
improvement in stormwater management practices.
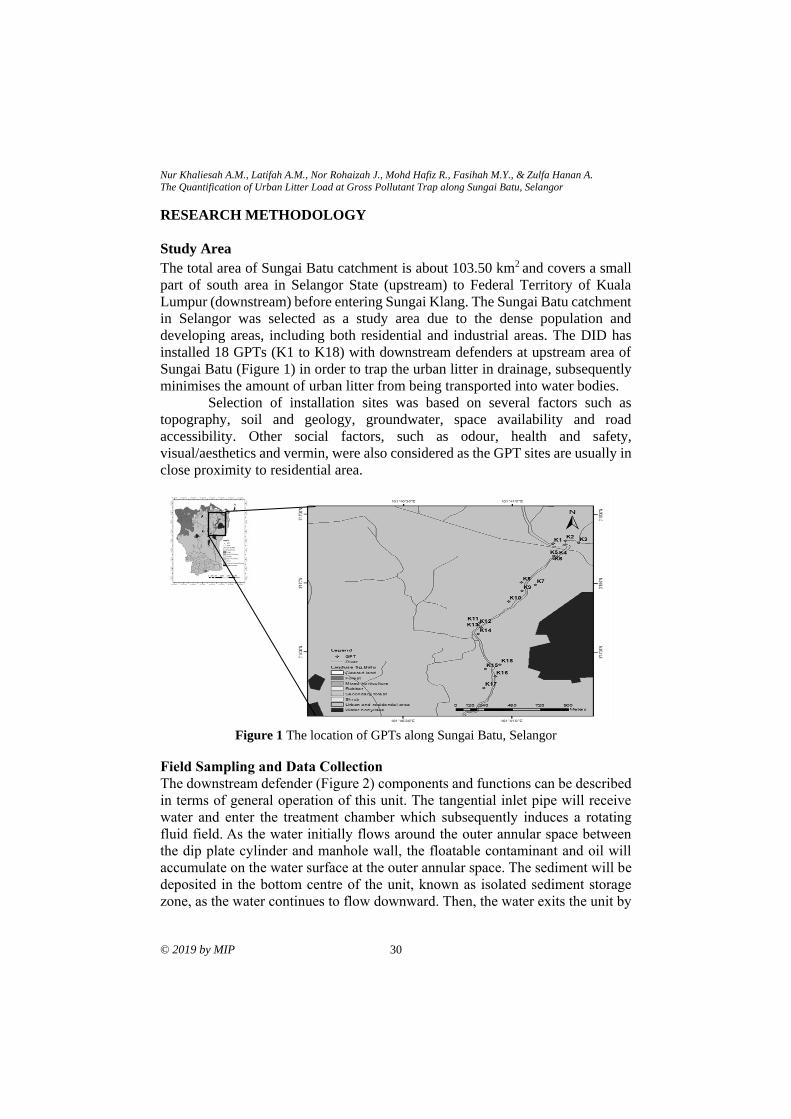
Nur Khaliesah A.M., Latifah A.M., Nor Rohaizah J., Mohd Hafiz R., Fasihah M.Y., & Zulfa Hanan A.
The Quantification of Urban Litter Load at Gross Pollutant Trap along Sungai Batu, Selangor
© 2019 by MIP 30
RESEARCH METHODOLOGY
Study Area
The total area of Sungai Batu catchment is about 103.50 km2 and covers a small
part of south area in Selangor State (upstream) to Federal Territory of Kuala
Lumpur (downstream) before entering Sungai Klang. The Sungai Batu catchment
in Selangor was selected as a study area due to the dense population and
developing areas, including both residential and industrial areas. The DID has
installed 18 GPTs (K1 to K18) with downstream defenders at upstream area of
Sungai Batu (Figure 1) in order to trap the urban litter in drainage, subsequently
minimises the amount of urban litter from being transported into water bodies.
Selection of installation sites was based on several factors such as
topography, soil and geology, groundwater, space availability and road
accessibility. Other social factors, such as odour, health and safety,
visual/aesthetics and vermin, were also considered as the GPT sites are usually in
close proximity to residential area.
Figure 1 The location of GPTs along Sungai Batu, Selangor
Field Sampling and Data Collection
The downstream defender (Figure 2) components and functions can be described
in terms of general operation of this unit. The tangential inlet pipe will receive
water and enter the treatment chamber which subsequently induces a rotating
fluid field. As the water initially flows around the outer annular space between
the dip plate cylinder and manhole wall, the floatable contaminant and oil will
accumulate on the water surface at the outer annular space. The sediment will be
deposited in the bottom centre of the unit, known as isolated sediment storage
zone, as the water continues to flow downward. Then, the water exits the unit by
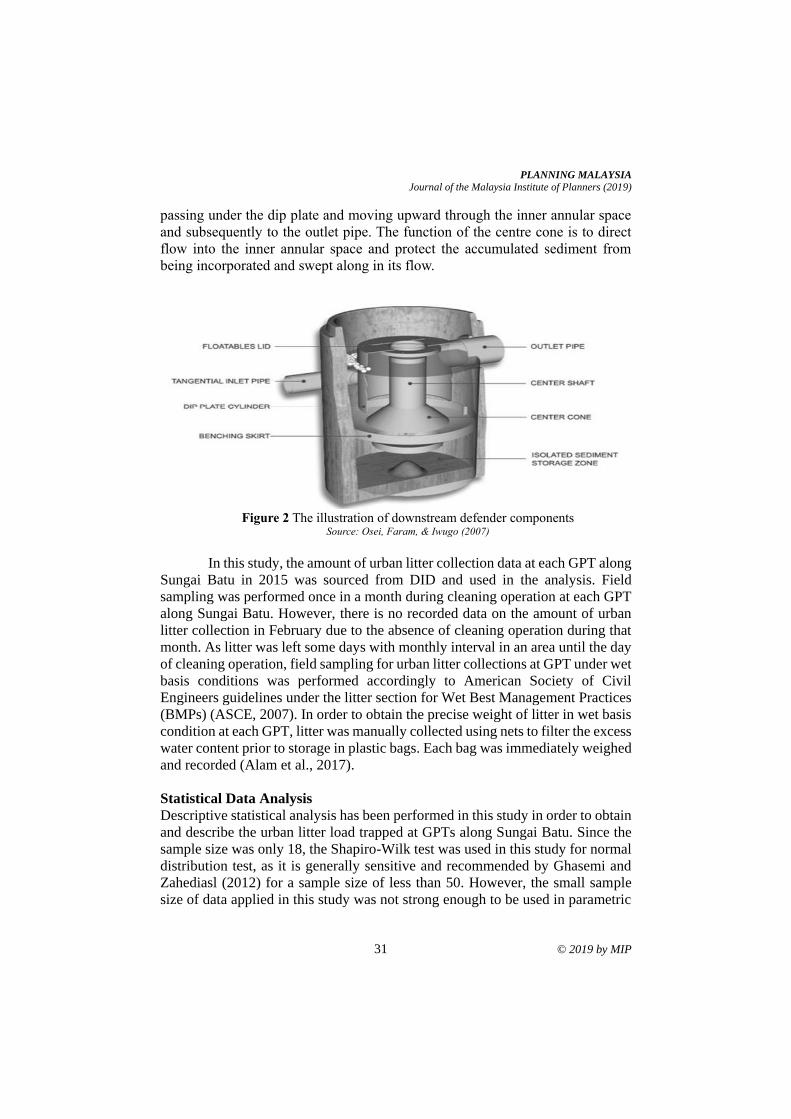
PLANNING MALAYSIA
Journal of the Malaysia Institute of Planners (2019)
31 © 2019 by MIP
passing under the dip plate and moving upward through the inner annular space
and subsequently to the outlet pipe. The function of the centre cone is to direct
flow into the inner annular space and protect the accumulated sediment from
being incorporated and swept along in its flow.
Figure 2 The illustration of downstream defender components
Source: Osei, Faram, & Iwugo (2007)
In this study, the amount of urban litter collection data at each GPT along
Sungai Batu in 2015 was sourced from DID and used in the analysis. Field
sampling was performed once in a month during cleaning operation at each GPT
along Sungai Batu. However, there is no recorded data on the amount of urban
litter collection in February due to the absence of cleaning operation during that
month. As litter was left some days with monthly interval in an area until the day
of cleaning operation, field sampling for urban litter collections at GPT under wet
basis conditions was performed accordingly to American Society of Civil
Engineers guidelines under the litter section for Wet Best Management Practices
(BMPs) (ASCE, 2007). In order to obtain the precise weight of litter in wet basis
condition at each GPT, litter was manually collected using nets to filter the excess
water content prior to storage in plastic bags. Each bag was immediately weighed
and recorded (Alam et al., 2017).
Statistical Data Analysis
Descriptive statistical analysis has been performed in this study in order to obtain
and describe the urban litter load trapped at GPTs along Sungai Batu. Since the
sample size was only 18, the Shapiro-Wilk test was used in this study for normal
distribution test, as it is generally sensitive and recommended by Ghasemi and
Zahediasl (2012) for a sample size of less than 50. However, the small sample
size of data applied in this study was not strong enough to be used in parametric
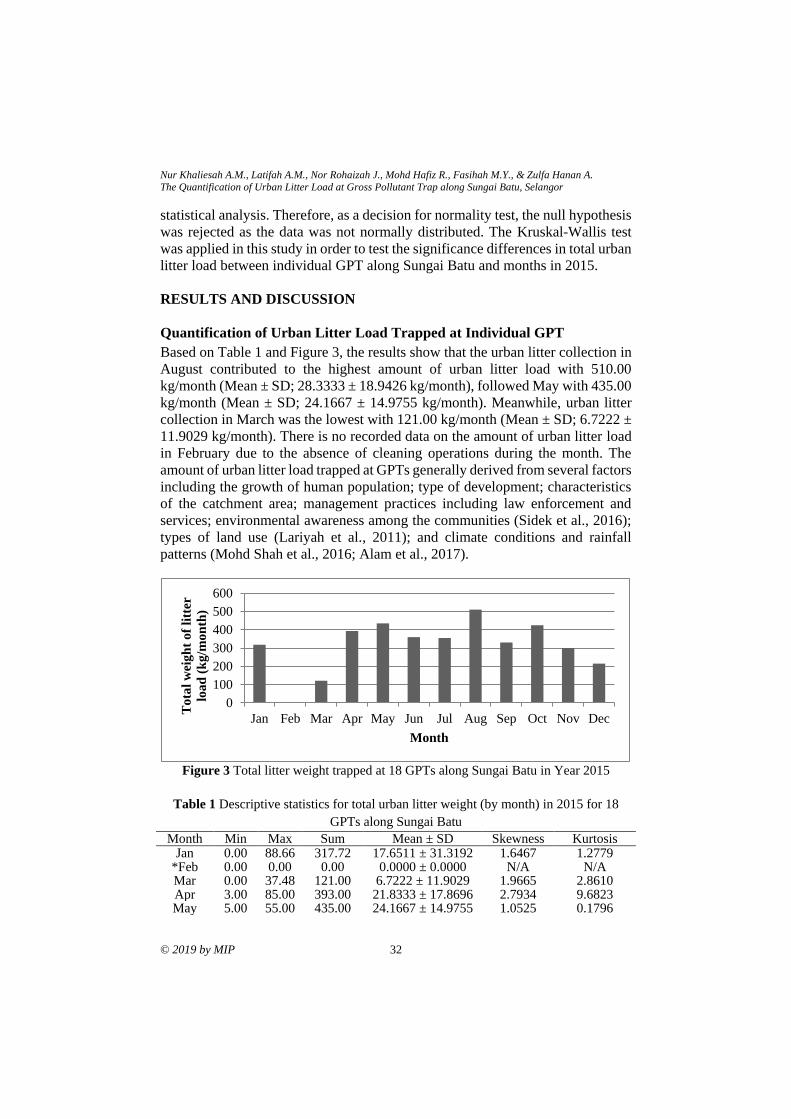
Nur Khaliesah A.M., Latifah A.M., Nor Rohaizah J., Mohd Hafiz R., Fasihah M.Y., & Zulfa Hanan A.
The Quantification of Urban Litter Load at Gross Pollutant Trap along Sungai Batu, Selangor
© 2019 by MIP 32
statistical analysis. Therefore, as a decision for normality test, the null hypothesis
was rejected as the data was not normally distributed. The Kruskal-Wallis test
was applied in this study in order to test the significance differences in total urban
litter load between individual GPT along Sungai Batu and months in 2015.
RESULTS AND DISCUSSION
Quantification of Urban Litter Load Trapped at Individual GPT
Based on Table 1 and Figure 3, the results show that the urban litter collection in
August contributed to the highest amount of urban litter load with 510.00
kg/month (Mean ± SD; 28.3333 ± 18.9426 kg/month), followed May with 435.00
kg/month (Mean ± SD; 24.1667 ± 14.9755 kg/month). Meanwhile, urban litter
collection in March was the lowest with 121.00 kg/month (Mean ± SD; 6.7222 ±
11.9029 kg/month). There is no recorded data on the amount of urban litter load
in February due to the absence of cleaning operations during the month. The
amount of urban litter load trapped at GPTs generally derived from several factors
including the growth of human population; type of development; characteristics
of the catchment area; management practices including law enforcement and
services; environmental awareness among the communities (Sidek et al., 2016);
types of land use (Lariyah et al., 2011); and climate conditions and rainfall
patterns (Mohd Shah et al., 2016; Alam et al., 2017).
Figure 3 Total litter weight trapped at 18 GPTs along Sungai Batu in Year 2015
Table 1 Descriptive statistics for total urban litter weight (by month) in 2015 for 18
GPTs along Sungai Batu
Month Min Max Sum Mean ± SD Skewness Kurtosis Jan 0.00 88.66 317.72 17.6511 ± 31.3192 1.6467 1.2779
*Feb 0.00 0.00 0.00 0.0000 ± 0.0000 N/A N/A Mar 0.00 37.48 121.00 6.7222 ± 11.9029 1.9665 2.8610 Apr 3.00 85.00 393.00 21.8333 ± 17.8696 2.7934 9.6823 May 5.00 55.00 435.00 24.1667 ± 14.9755 1.0525 0.1796
0
100
200
300
400
500
600
Jan Feb Mar Apr May Jun Jul Aug Sep Oct Nov Dec
To
tal
wei
gh
t o
f li
tter
loa
d (
kg
/mo
nth
)
Month
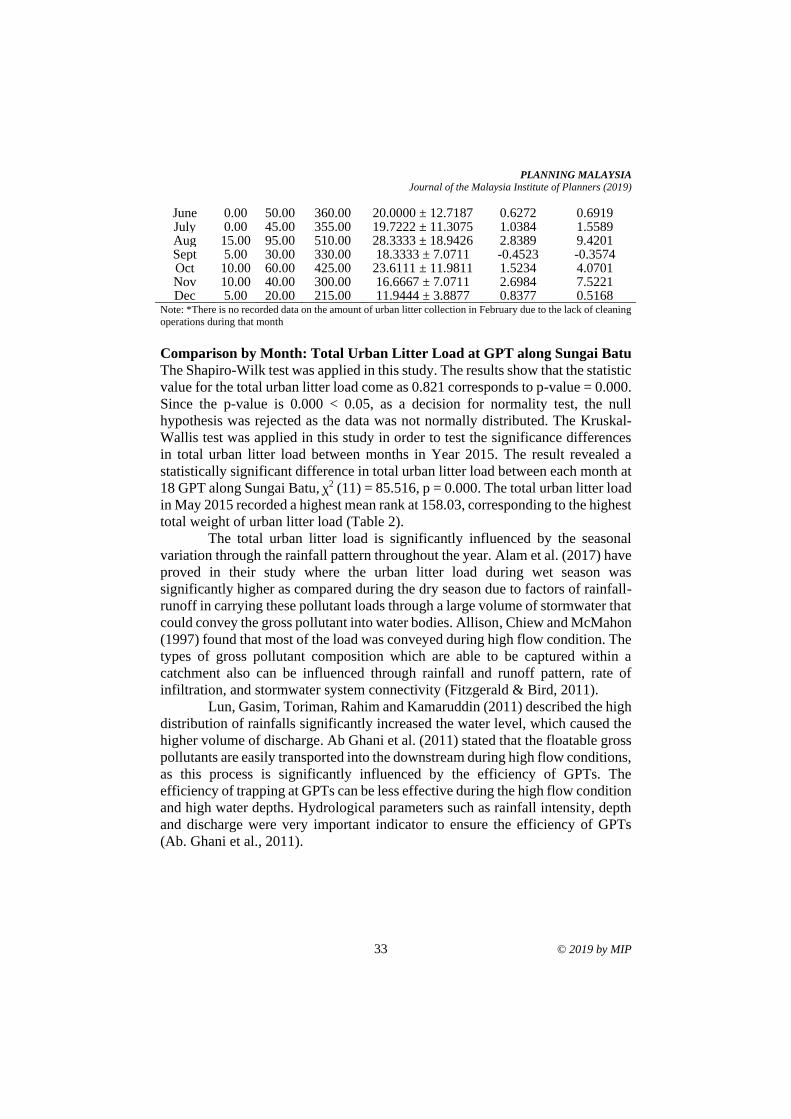
PLANNING MALAYSIA
Journal of the Malaysia Institute of Planners (2019)
33 © 2019 by MIP
June 0.00 50.00 360.00 20.0000 ± 12.7187 0.6272 0.6919 July 0.00 45.00 355.00 19.7222 ± 11.3075 1.0384 1.5589 Aug 15.00 95.00 510.00 28.3333 ± 18.9426 2.8389 9.4201 Sept 5.00 30.00 330.00 18.3333 ± 7.0711 -0.4523 -0.3574 Oct 10.00 60.00 425.00 23.6111 ± 11.9811 1.5234 4.0701 Nov 10.00 40.00 300.00 16.6667 ± 7.0711 2.6984 7.5221 Dec 5.00 20.00 215.00 11.9444 ± 3.8877 0.8377 0.5168
Note: *There is no recorded data on the amount of urban litter collection in February due to the lack of cleaning
operations during that month
Comparison by Month: Total Urban Litter Load at GPT along Sungai Batu
The Shapiro-Wilk test was applied in this study. The results show that the statistic
value for the total urban litter load come as 0.821 corresponds to p-value = 0.000.
Since the p-value is 0.000 < 0.05, as a decision for normality test, the null
hypothesis was rejected as the data was not normally distributed. The Kruskal-
Wallis test was applied in this study in order to test the significance differences
in total urban litter load between months in Year 2015. The result revealed a
statistically significant difference in total urban litter load between each month at
18 GPT along Sungai Batu, ꭕ2 (11) = 85.516, p = 0.000. The total urban litter load
in May 2015 recorded a highest mean rank at 158.03, corresponding to the highest
total weight of urban litter load (Table 2).
The total urban litter load is significantly influenced by the seasonal
variation through the rainfall pattern throughout the year. Alam et al. (2017) have
proved in their study where the urban litter load during wet season was
significantly higher as compared during the dry season due to factors of rainfall-
runoff in carrying these pollutant loads through a large volume of stormwater that
could convey the gross pollutant into water bodies. Allison, Chiew and McMahon
(1997) found that most of the load was conveyed during high flow condition. The
types of gross pollutant composition which are able to be captured within a
catchment also can be influenced through rainfall and runoff pattern, rate of
infiltration, and stormwater system connectivity (Fitzgerald & Bird, 2011).
Lun, Gasim, Toriman, Rahim and Kamaruddin (2011) described the high
distribution of rainfalls significantly increased the water level, which caused the
higher volume of discharge. Ab Ghani et al. (2011) stated that the floatable gross
pollutants are easily transported into the downstream during high flow conditions,
as this process is significantly influenced by the efficiency of GPTs. The
efficiency of trapping at GPTs can be less effective during the high flow condition
and high water depths. Hydrological parameters such as rainfall intensity, depth
and discharge were very important indicator to ensure the efficiency of GPTs
(Ab. Ghani et al., 2011).
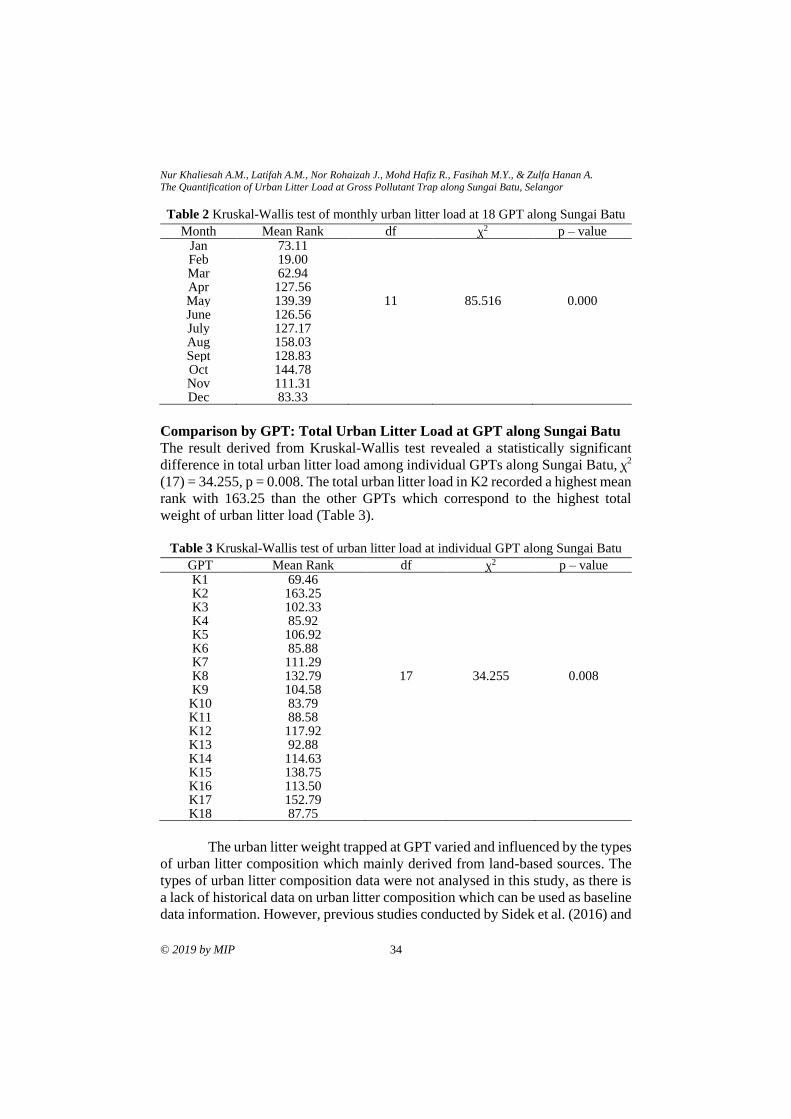
Nur Khaliesah A.M., Latifah A.M., Nor Rohaizah J., Mohd Hafiz R., Fasihah M.Y., & Zulfa Hanan A.
The Quantification of Urban Litter Load at Gross Pollutant Trap along Sungai Batu, Selangor
© 2019 by MIP 34
Table 2 Kruskal-Wallis test of monthly urban litter load at 18 GPT along Sungai Batu
Month Mean Rank df ꭕ2 p – value Jan 73.11 Feb 19.00 Mar 62.94 Apr 127.56 May 139.39 11 85.516 0.000 June 126.56 July 127.17 Aug 158.03 Sept 128.83 Oct 144.78 Nov 111.31 Dec 83.33
Comparison by GPT: Total Urban Litter Load at GPT along Sungai Batu
The result derived from Kruskal-Wallis test revealed a statistically significant
difference in total urban litter load among individual GPTs along Sungai Batu, ꭕ2
(17) = 34.255, p = 0.008. The total urban litter load in K2 recorded a highest mean
rank with 163.25 than the other GPTs which correspond to the highest total
weight of urban litter load (Table 3).
Table 3 Kruskal-Wallis test of urban litter load at individual GPT along Sungai Batu
GPT Mean Rank df ꭕ2 p – value K1 69.46 K2 163.25 K3 102.33 K4 85.92 K5 106.92 K6 85.88 K7 111.29 K8 132.79 17 34.255 0.008 K9 104.58 K10 83.79 K11 88.58 K12 117.92 K13 92.88 K14 114.63 K15 138.75 K16 113.50 K17 152.79 K18 87.75
The urban litter weight trapped at GPT varied and influenced by the types
of urban litter composition which mainly derived from land-based sources. The
types of urban litter composition data were not analysed in this study, as there is
a lack of historical data on urban litter composition which can be used as baseline
data information. However, previous studies conducted by Sidek et al. (2016) and
PLANNING MALAYSIA
Journal of the Malaysia Institute of Planners (2019)
35 © 2019 by MIP
Alam et al. (2017) on types of urban litter composition found at GPTs in different
regions in Klang River catchment and Gosnells Western, Australia, respectively,
show that both plastics and vegetation such as leaves are the most commonly
found in GPTs during the cleaning operation. The amount of urban litter
generation and its composition are fundamental information strongly required for
urban litter management systems in terms of planning, operation and optimization
(Beigl, Lebersorger, & Salhofer, 2008). The characteristics of litter differ with
time and are exaggerated by socio-economic conditions (Buenrostro, Bocco, &
Vence, 2001; Gómez, Meneses, Ballinas, & Castells, 2009). In addition to the
structural method applied in this study to filter the gross pollutants, including
urban litter, from flowing into water bodies, environmental education programs,
cleaning operations and law enforcement play crucial roles in mitigating the
urban litter management issue, which indirectly affects the stormwater quality.
CONCLUSION
This paper has demonstrated the quantification of urban litter load trapped at 18
GPTs along Sungai Batu, Selangor in 2015. The growing issue of urban litter in
drainage systems is mainly influenced by the growth of the human population,
lack of environmental awareness in waste disposal, littering, law enforcement and
policy, type of development, land use changes, and rainfall patterns. The result
shows that the total amount of urban litter load in 2015 was 3761.7200 kg/year
(Mean ± SD; 313.4767 ± 141.9105 kg/year). DID has installed GPTs with
downstream defender at selected sites along Sungai Batu which are functioning
as hydrodynamic vortex separator systems for stormwater treatment to trap litter
at drainage conveyances before it enters the main river. A significance difference
in total urban litter load between individual GPT along Sungai Batu obtained in
this study were mainly influenced by various type of urban litter composition
derived from land based sources including the human activities; consumption and
production; and types of development. The different types of development and
land use will generate different urban litter compositions. However, the urban
litter composition at individual GPT was not evaluated in this study due to
unavailability of baseline data. Moreover, a significant difference in total urban
litter load for each month at 18 GPTs along Sungai Batu also were mainly
influenced by seasonal condition through rainfall pattern throughout the year, as
the efficiency of trapping at GPTs can be less effective during the extreme storm
event and high flow conditions, and tend to be more effective during low-flow
conditions.
Due to the high amount of urban litter load in year 2015, this study
suggests that environmental education program encompasses the field of
knowledge, attitude and practices (KAP) is highly required as it can be a medium
to improve and enhance public awareness on how to dispose the urban litter in
proper way. Besides, urban litter compositions at GPTs also need to be studied as

Nur Khaliesah A.M., Latifah A.M., Nor Rohaizah J., Mohd Hafiz R., Fasihah M.Y., & Zulfa Hanan A.
The Quantification of Urban Litter Load at Gross Pollutant Trap along Sungai Batu, Selangor
© 2019 by MIP 36
this information is crucial for GPT efficiency in trapping urban litter and other
pollutants. This information will serve as baseline data for knowledge
contribution and informative input during the decision-making process,
subsequently improving stormwater management and urban litter management in
a comprehensive way.
ACKNOWLEDGEMENTS
The authors in this paper would like to thank the Department of Irrigation and
Drainage (DID) Malaysia for the informative input on GPT. The authors would
also like to express deep appreciation to the reviewers for spending time and
providing valuable comments for this paper.
REFERENCES Ab. Ghani, A., Azamathulla, H. M., Lau, T. L., Ravikanth, C. H., Zakaria, N. A., Leow,
C. S., & Yusof, M. A. M. (2011). Flow pattern and hydraulic performance of the
REDAC gross pollutant trap. Flow Measurement and Instrumentation, 22, 215-
224.
Alam, M. Z., Anwar, A. H. M. F., Sarker, D. C., Heitz, A., & Rothleitner, C. (2017).
Characterising stormwater gross pollutants captured in catch basin inserts.
Science of the Total Environment, 586, 76-86.
Allison, R., Chiew, F., & McMahon, T. (1997). Stormwater gross pollutants: Industry
report. Retrieved from https://clearwatervic.com.au/user-data/resource-
files/CRC-Gross-Pollutants-Industry-Report-2001.pdf
Armitage, N., Rooseboom A., Nel, C. & Townshend, P. (1998). The removal of urban
litter from stormwater conduits and streams. WRC Report No. TT 95/98,
Pretoria, South Africa.
Armitage, N. (2007). The reduction of urban litter in the stormwater drains of South
Africa. Urban Water Journal, 4(3), 151-172.
ASCE. (2007). Guideline for monitoring stormwater gross pollutants. Retrieved from
https://stormwater.ucf.edu/fileRepository/docs/conferences/9thstormwaterCD/
documents/ASCEguidelines.pdf on 25th April 2018.
Beigl, P., Lebersorger, S., & Salhofer, S. (2008). Modelling municipal solid waste
generation: A review. Waste Management, 28(1), 200-214.
Buenrostro, O., Bocco, G., & Vence, J. (2001). Forecasting generation of urban solid
waste in developing countries: A case study in Mexico. Journal of the Air &
Waste Management Association, 51(1), 86-93.
Faram, M. G., Lecornu, P., & Andoh, R. Y. G. (2000). The “Mk2” downstream defender TM for the removal of sediments and oils from urban runoff. In WaterTECH,
April 9-13, 2000, Sydney, Australia,.
Fitzgerald, B., & Bird, W. S. (2011). Literature Review: Gross Pollutant Traps as a
Stormwater Management Practice. Auckland Council Technical Report
2011/006.
PLANNING MALAYSIA
Journal of the Malaysia Institute of Planners (2019)
37 © 2019 by MIP
Fletcher, T., Duncan, H., Poelsma, P., & Lloyd, S. (2004). Stormwater flow and quality,
and the effectiveness of non-proprietary stormwater treatment measures : A
review and gap analysis. Technical Report, December, 1-171.
Ghasemi, A., & Zahediasl, S. (2012). Normality tests for statistical analysis: A guide for
non-statisticians. International Journal of Endocrinology and Metabolism,
10(2), 486-489.
Gómez, G., Meneses, M., Ballinas, L., & Castells, F. (2009). Seasonal characterization of
municipal solid waste (MSW) in the city of Chihuahua, Mexico. Waste
Management, 29(7), 2018-2024.
Hall, M. (1996). Litter traps in the stormwater drainage system (Master’s thesis).
Swinburne University of Technology, Melbourne, Australia.
Jabatan Pengairan dan Saliran. (2012). Urban stormwater management for Malaysia:
MSMA 2nd Edition. Kuala Lumpur: Author.
Lariyah, M. S., D, M. N. M., Norazli, O., Nasir, M. N., Hidayah, B., & Zuleika, Z. (2011).
Gross pollutants analysis in urban residential area for a tropical climate country.
In 12th International Conference on Urban Drainage. September 11–16, 2011,
Porto Alegre, Brazil.
Lun, P. I., Gasim, M. B., Toriman, M. E., Rahim, S. A., & Kamaruddin, K. A. (2011).
Hydrological pattern of Pahang river basin and their relation to flood historical
event. Jurnal E-Bangi, 6(1), 29-37.
Madhani, J. T., & Brown, R. J. (2015). The capture and retention evaluation of a
stormwater gross pollutant trap design. Ecological Engineering, 74, 56-59.
Marais, M., Armitage, N. & Pithey, S. (2001). A study of the litter loadings in urban
drainage systems – Methodology and objectives. Water Science and
Technology, 44(6), 99-108.
Mohd Shah, M. R., Zahari, N. M., Md Said, N. F., Sidek, L. M., Basri, H., … & Mohd
Dom, N. (2016). Gross pollutant traps: Wet load assessment at Sungai Kerayong,
Malaysia. In IOP Conference Series: Earth and Environmental Science, 32(1),
1-6.
Osei, K., Faram, M. G., & Iwugo, K. O. (2007). Physical and chemical characterization
of sediments captured by flow-through stormwater interceptors. In 6th North
American Surface Water Quality Conference and Exposition. August 20-23,
2007, Phoenix, Arizona, USA.
Purcell, M., & Magette, W. L. (2009). Prediction of household and commercial BMW
generation according to socio-economic and other factors for the Dublin region.
Waste Management, 29(4), 1237-1250.
Sidek, L., Basri, H., Lee, L. K., & Foo, K. Y. (2016). The performance of gross pollutant
trap for water quality preservation: A real practical application at the Klang
Valley, Malaysia. Desalination and Water Treatment, 57(52), 24733-24741
Received: 12th January 2019. Accepted: 2nd August 2019
1 Professor at Universiti Sains Malaysia. Email: [email protected] 38
PLANNING MALAYSIA:
Journal of the Malaysian Institute of Planners
VOLUME 17 ISSUE 2 (2019), Page 38 – 49
URBANISATION BEYOND ITS CORE BOUNDARY AND ITS IMPACT
ON THE COMMUNITIES IN GEORGE TOWN CONURBATION,
MALAYSIA
Narimah Samat1, Mohd Amirul Mahamud2, Siti Masayu Rosliah Abdul
Rashid3, Yasin Elhadary4, & Norzailawati Mohd Noor5
1,2,3School of Humanities
UNIVERSITI SAINS MALAYSIA 4Department of Geography and Environment
UNIVERSITY OF KHARTOUM SUDAN 5Kulliyyah of Architecture and Environmental Design
INTERNATIONAL ISLAMIC UNIVERSITY MALAYSIA
Abstract
Rapid urbanisation has raised major issues, especially in cities in developing
nations. In Malaysia, for example, the urbanisation rate is at 74%, but the size of
urban land is less than 10%. This phenomenon has caused urban expansion to
encroach on to its fringe areas. At present, although much has been said about the
economic benefits of urban expansion to the fringe areas, yet little is known about
its impact on the local communities. This paper aims to highlight the spatial
expansion of George Town Conurbation and to investigate how local inhabitants
perceive urban development. This study used satellite images and GIS techniques
to identify the spatial expansion of urbanisation in George Town. Quantitative
and qualitative approaches of data collection were employed to investigate the
impact of urbanisation on the communities. The findings indicated that the
inhabitants in less urbanized states welcome urban expansion, as they perceive
that urban growth generates more jobs and brings economic opportunities. On the
contrary, those who have experienced a longer period of urban development did
not fully welcome urbanisation. Therefore, inclusive development policies are
required to ensure that urban growth will benefit dwellers in the urban area as
well as in its surroundings. In addition, they are required to safeguard the
environment.
Keywords: conurbation, GIS, land use changes, urban economy, urbanisation,
Malaysia
PLANNING MALAYSIA
Journal of the Malaysia Institute of Planners (2019)
39 © 2019 by MIP
INTRODUCTION
Urban areas worldwide are experiencing rapid urbanisation. In 1950, the urban
population was less than one billion. Meanwhile, in 2009 it has increased to 3.4
billion, and is estimated to reach 5.0 billion and 6.4 billion in 2030 and 2050,
respectively (United Nations, 2014). According to Knieling (2014), the global
urban population is anticipated to increase by 1.5% per year, that is, increasing
roughly at 60 million per year between 2025 and 2030. These figures reflect not
only an increase in urban citizens, but also a shift in the relative share of people
living in urban versus rural areas. The share of the urban population grew from
just about 30% in 1950 to 54.4% in 2016 (UN-Habitat, 2016). Knieling predicted
that this growth rate is expected to reach 70% by 2050. Knieling also commented
that this extraordinary increase has led some scholars to name this century as
"urban age”. More important is that urbanisation is growing more rapidly in
developing countries than in developed nations (Jedwab & Vollrath, 2015;
McGee, 2009), with 95% of urban expansion in the next decades will be occurring
in the developing countries (UN-Habitat, 2016). It would be a huge challenge for
planners and urban managers to ensure that urbanisation and urban spatial
expansion will bring positive economic and developmental impact on the
communities, and to safeguard the environment (Elhadary, Samat, & Franklin,
2013).
Presently, however, the new trend of urban development in developing
countries is no more confined to the formal administrative borders of core cities;
the urban population is pushing towards urban fringe areas of neighbouring
communities (McGee, 2009; Samat, Ghazali, Hasni, & Elhadary, 2014). This
phenomenon can be explained by using the concept of conurbation and
agglomeration, as suggested by McGee (2009) when two spatial processes will
dominate the growth of urban places. First, the growth of central cities in mega-
urban regions, and second an ongoing process of horizontal urban expansion into
surrounding hinterlands creating peri-urban regions that will comprise up to 70%
of mega-urban region population by 2050. In the era of the "urban age" the
number of rapidly growing megacities or megaregions with population of 10 to
20 million people have emerged primarily in Africa, America and Asia (Knieling,
2014). Thus, addressing urban challenges require a broader spatial focus that
extends beyond the city limits.
Many have mentioned that urbanisation brings positive and negative
benefits to the communities as well as to the country. New developments brought
about by urbanisation have important implications for the livelihoods and
socioeconomic conditions of local communities (Elhadary et al., 2013). Through
good infrastructures and access to basic facilities and amenities, the urban areas
have become more productive economically than the rural areas. This implies that
the poor performance of the economy is linked to the increase in rural areas. In
addition to the economic benefits, urbanisation provides better access to basic
Narimah S., Mohd Amirul M., Siti Masayu Rosliah A.R., Yasin E., & Norzailawati M. N.
Urbanisation Beyond Its Core Boundary and Its Impact on the Communities in George Town Conurbation, Malaysia
© 2019 by MIP 40
facilities such as health, education, water, and electricity. Urbanisation brings
more employment opportunities and offers modern lifestyles in the city (Su,
Jiang, Zhang, & Zhang, 2011) and these facilities are positively correlated with
human development. For example, major cities become megacities which can
handle major international commercial activities (Cavallier, 1996).
Some empirical evidence has shown that there is a link between city size
and poverty eradication. According to Knieling (2014), poverty is more
widespread and deeper in very small and small towns than in large or very large
cities. For example, poverty in metropolitan cities, in particular, are considerably
lower than poverty in other urban areas. This claim is supported by UN-Habitat
(2016), which stated that cities have higher productivity, stronger economies and
more employment opportunities, and the rapid pace of urbanisation has helped
millions to escape from extreme poverty.
However, the abovementioned positive views are debatable and do not
always have a linear relationship. Urban conurbations pose a challenge to urban
planners and decision makers. Malaysia, for example, is classified as among the
most urbanized countries with the urban population rising rapidly, especially in
major urban centres of Kuala Lumpur, Johor Bahru and Georg Town. This
phenomenon has created major challenges to local authority in handling the
increasing number of urban population and in providing access to better services.
Regardless of the emphasis on whether urbanisation has positive or negative
outcomes, empirical research on urban conurbation is still lacking (Samat et al.,
2014).
This paper aims to identify and map out urban expansion in the George
Town Conurbation, and evaluate its impact on the communities living in this
conurbation. In addition, the paper seeks to understand the impacts of
urbanisation from the perspectives of the local communities.
BACKGROUND OF THE STUDY
Penang, along with Kuala Lumpur, Selangor and Johor, has experienced rapid
urbanisation since the 1970s, mostly due to industrial activities (Ghazali, 1999).
Penang has contributed 6.6% of Malaysia’s Gross Domestic Product (GDP) in
2015 after Selangor (22.6%), Kuala Lumpur (15.1%), Sarawak (10.0%), Johor
(9.3%) and Sabah (6.6%) (Department of Statistics Malaysia, 2016). Since the
1970s, Penang has focused on industrial and commercial activities to boost its
economy and has invested in improving public infrastructures that can attract
multinational corporations and international investors (Samat et al., 2014).
Industrialisation and commercial activities have provided wide
employment opportunities that consequently led to the migration of the rural
population into the Penang state (Ghazali, 1999). Thus, the demand for land for
housing and related activities has increased. Furthermore, Penang has the highest
urban population density in Malaysia with 4,800 people per square kilometre
PLANNING MALAYSIA
Journal of the Malaysia Institute of Planners (2019)
41 © 2019 by MIP
(Demographia World Urban Areas, 2017). Urbanisation in Penang has spilled
over to its neighbouring regions (Hasni & Samat, 2015). Good road network,
cheap land prices, peaceful environment and less densely populated areas are
among the major factors that have attracted new developments, especially
housing areas to the neighbouring regions. In addition, the North-South Highway
and Butterworth-Kulim Highway connecting Penang and its neighbouring
regions have attracted people to stay in the neighbouring regions and commute to
work daily. New constructions of residential and business units and
administrative complexes foster the economy in the regions. This development,
however, brought some consequences to the community living in the surrounding
regions (Su et al., 2011). The urbanisation experienced by George Town and its
neighbouring regions, has attracted this paper to examine the expansion of
George Town, besides the perception of its community on the development and
the consequences that arose in their surroundings.
MATERIALS AND METHODS
The Study Area
George Town Conurbation is located in the north of Peninsular Malaysia with
Pulau Pinang (George Town and Butterworth) as the centre. The Northern Region
urban conurbation stretches from Sungai Petani in the north to Kulim in the east
and Sg. Bakap in the south (Figure 1). The Census 2000 statistics estimated that
the Northern Region urban conurbation has a population of at least 1.2 million or
23% of the region’s total population (PlanMalaysia, 2016).
Spatial Data
Spatial data are mainly used to identify areas undergoing high development
pressure. This study used satellite images of the year 2002, 2006, 2010 from
Landsat 7, and year 2014 from Landsat 8, available from the United States
Geological Survey (USGS) website to locate urban expansion within the study
area (USGS, 2015). These images were processed using Erdas Imagine 2014
software and referenced on UTM-47N with Upper Left, X = 630210, Lower
Right, X = 706680, Upper Left, Y = 648900, Lower Right, Y = 550860 and have
a spatial resolution of 30 meters x 30 meters. The images were then classified
using maximum likelihood supervised classification into four major land covers,
namely Agriculture, Forest, Urban and Water Body. The overall accuracy of the
classified images was 80%. These classified images were exported into ArcGIS
10.1 shapefile and used to map land cover and identify urban development
pressure.
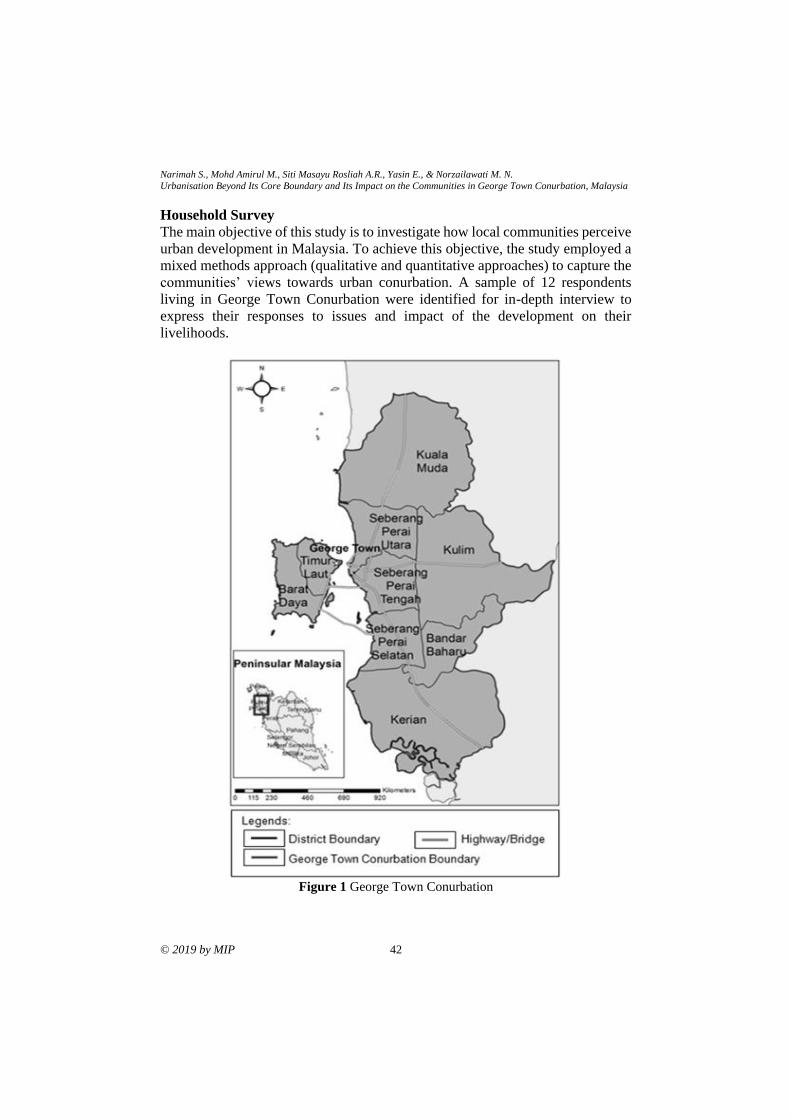
Narimah S., Mohd Amirul M., Siti Masayu Rosliah A.R., Yasin E., & Norzailawati M. N.
Urbanisation Beyond Its Core Boundary and Its Impact on the Communities in George Town Conurbation, Malaysia
© 2019 by MIP 42
Household Survey
The main objective of this study is to investigate how local communities perceive
urban development in Malaysia. To achieve this objective, the study employed a
mixed methods approach (qualitative and quantitative approaches) to capture the
communities’ views towards urban conurbation. A sample of 12 respondents
living in George Town Conurbation were identified for in-depth interview to
express their responses to issues and impact of the development on their
livelihoods.
Figure 1 George Town Conurbation
PLANNING MALAYSIA
Journal of the Malaysia Institute of Planners (2019)
43 © 2019 by MIP
A household survey involving 550 respondents clustered within three
districts were selected using convenience sampling. A questionnaire was
conducted on the sample to evaluate the perspective and impacts of urban
development on the local communities. Three neighbouring regions were
identified as the study areas, namely Kerian (in Perak), Kuala Muda (in Kedah),
and Bayan Lepas in Penang. Bayan Lepas was selected to evaluate the perspective
of Penang’s community about the Penang, and to assess if there are any
differences in views among the communities. The study was designed to
understand the views and situations experienced by the local communities. Of the
550 respondents, 208 or 41.6% were from Kerian, 214 or 42.8% from Kuala
Muda and 128 or 25.6% from Bayan Lepas. In addition, other key relevant data
such as meetings with city planners from Kerian (Kerian District Council) and
Kuala Muda (Majlis Perbandaran Sungai Petani) were also used to examine the
preparations and actions taken by local authorities to manage the rapid
development of the study areas.
LAND COVER CHANGES 2002 – 2016
Analysis on the time series satellite images (Table 1) showed that land cover in
the study areas has experienced significant changes during the observed period
(Figure 2). Built-up area has increased from 1,398.12km2 to 1,704.47km2,a total
increase of more than 300km2 during observed period. Similarly, agriculture area
has increased of more than 1500km2, while forest area experienced a reduction
of more than 1700km2. Furthermore, land cover changes indicated that urban
areas and agricultural are growing at the expanse of forested area. As stated by
FAO (2016), agriculture is still the major driver of deforestation globally. Based
on this observation, this study identified areas undergoing urban development
pressure namely south of Seberang Perai Selatan and North of Seberang Perai
Utara. Kerian District received spill-over demand for housing and other related
services from rapid urbanisation in the south of Seberang Perai Selatan. For
example, the development of Penang second bridge connecting Batu Kawan in
Seberang Perai Selatan and Batu Maung in Bayan Lepas has spurred urban
development around these regions (“Penang second bridge to spur”, 2012).
Although Bayan Lepas has experienced urban development pressure since 1970s,
it has become more intense as more infrastructure and industrial sites being
developed (Samat et al., 2014). Similarly, more development moved towards
Kuala Muda district due to spill over development of Sungai Petani area.
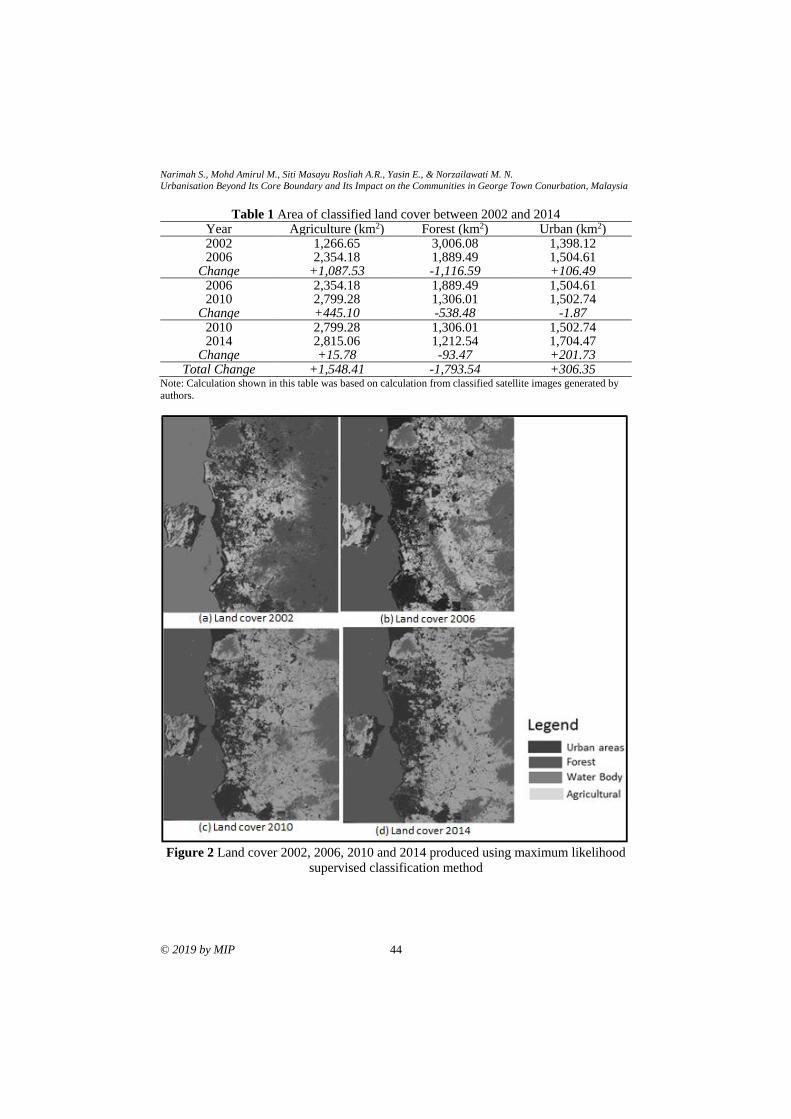
Narimah S., Mohd Amirul M., Siti Masayu Rosliah A.R., Yasin E., & Norzailawati M. N.
Urbanisation Beyond Its Core Boundary and Its Impact on the Communities in George Town Conurbation, Malaysia
© 2019 by MIP 44
Table 1 Area of classified land cover between 2002 and 2014 Year Agriculture (km2) Forest (km2) Urban (km2) 2002 1,266.65 3,006.08 1,398.12 2006 2,354.18 1,889.49 1,504.61
Change +1,087.53 -1,116.59 +106.49 2006 2,354.18 1,889.49 1,504.61 2010 2,799.28 1,306.01 1,502.74
Change +445.10 -538.48 -1.87 2010 2,799.28 1,306.01 1,502.74 2014 2,815.06 1,212.54 1,704.47
Change +15.78 -93.47 +201.73 Total Change +1,548.41 -1,793.54 +306.35
Note: Calculation shown in this table was based on calculation from classified satellite images generated by
authors.
Figure 2 Land cover 2002, 2006, 2010 and 2014 produced using maximum likelihood
supervised classification method
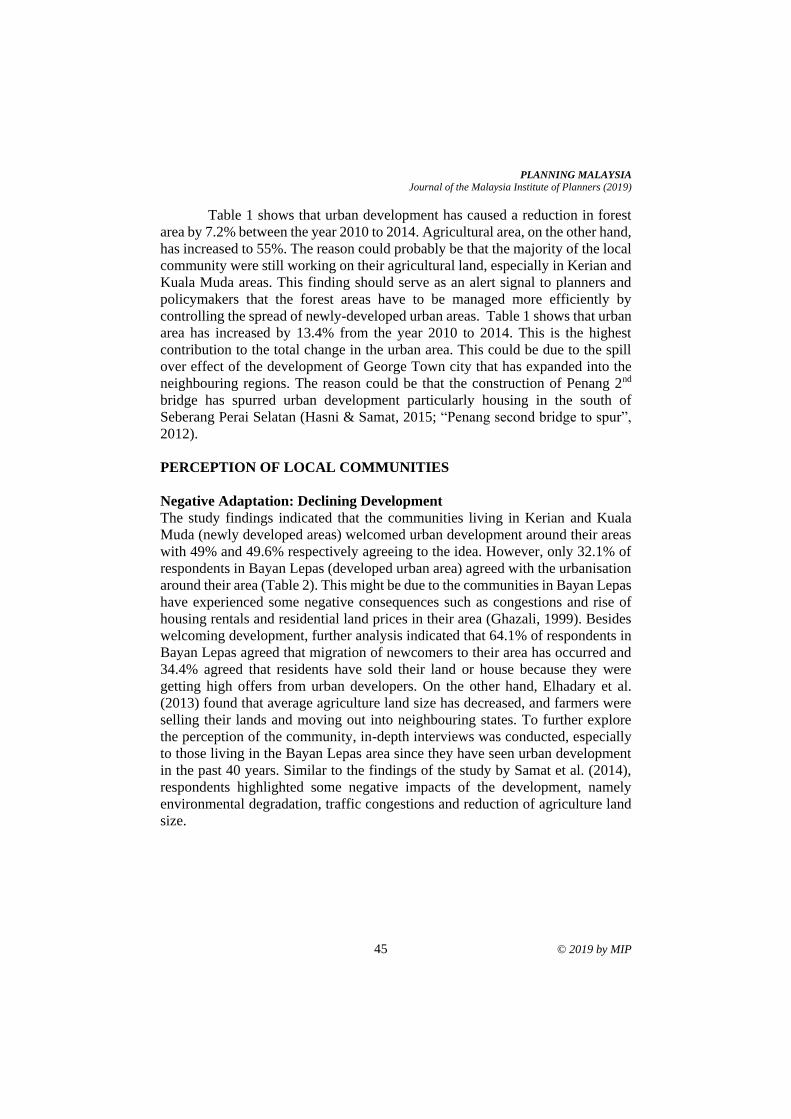
PLANNING MALAYSIA
Journal of the Malaysia Institute of Planners (2019)
45 © 2019 by MIP
Table 1 shows that urban development has caused a reduction in forest
area by 7.2% between the year 2010 to 2014. Agricultural area, on the other hand,
has increased to 55%. The reason could probably be that the majority of the local
community were still working on their agricultural land, especially in Kerian and
Kuala Muda areas. This finding should serve as an alert signal to planners and
policymakers that the forest areas have to be managed more efficiently by
controlling the spread of newly-developed urban areas. Table 1 shows that urban
area has increased by 13.4% from the year 2010 to 2014. This is the highest
contribution to the total change in the urban area. This could be due to the spill
over effect of the development of George Town city that has expanded into the
neighbouring regions. The reason could be that the construction of Penang 2nd
bridge has spurred urban development particularly housing in the south of
Seberang Perai Selatan (Hasni & Samat, 2015; “Penang second bridge to spur”,
2012).
PERCEPTION OF LOCAL COMMUNITIES
Negative Adaptation: Declining Development
The study findings indicated that the communities living in Kerian and Kuala
Muda (newly developed areas) welcomed urban development around their areas
with 49% and 49.6% respectively agreeing to the idea. However, only 32.1% of
respondents in Bayan Lepas (developed urban area) agreed with the urbanisation
around their area (Table 2). This might be due to the communities in Bayan Lepas
have experienced some negative consequences such as congestions and rise of
housing rentals and residential land prices in their area (Ghazali, 1999). Besides
welcoming development, further analysis indicated that 64.1% of respondents in
Bayan Lepas agreed that migration of newcomers to their area has occurred and
34.4% agreed that residents have sold their land or house because they were
getting high offers from urban developers. On the other hand, Elhadary et al.
(2013) found that average agriculture land size has decreased, and farmers were
selling their lands and moving out into neighbouring states. To further explore
the perception of the community, in-depth interviews was conducted, especially
to those living in the Bayan Lepas area since they have seen urban development
in the past 40 years. Similar to the findings of the study by Samat et al. (2014),
respondents highlighted some negative impacts of the development, namely
environmental degradation, traffic congestions and reduction of agriculture land
size.
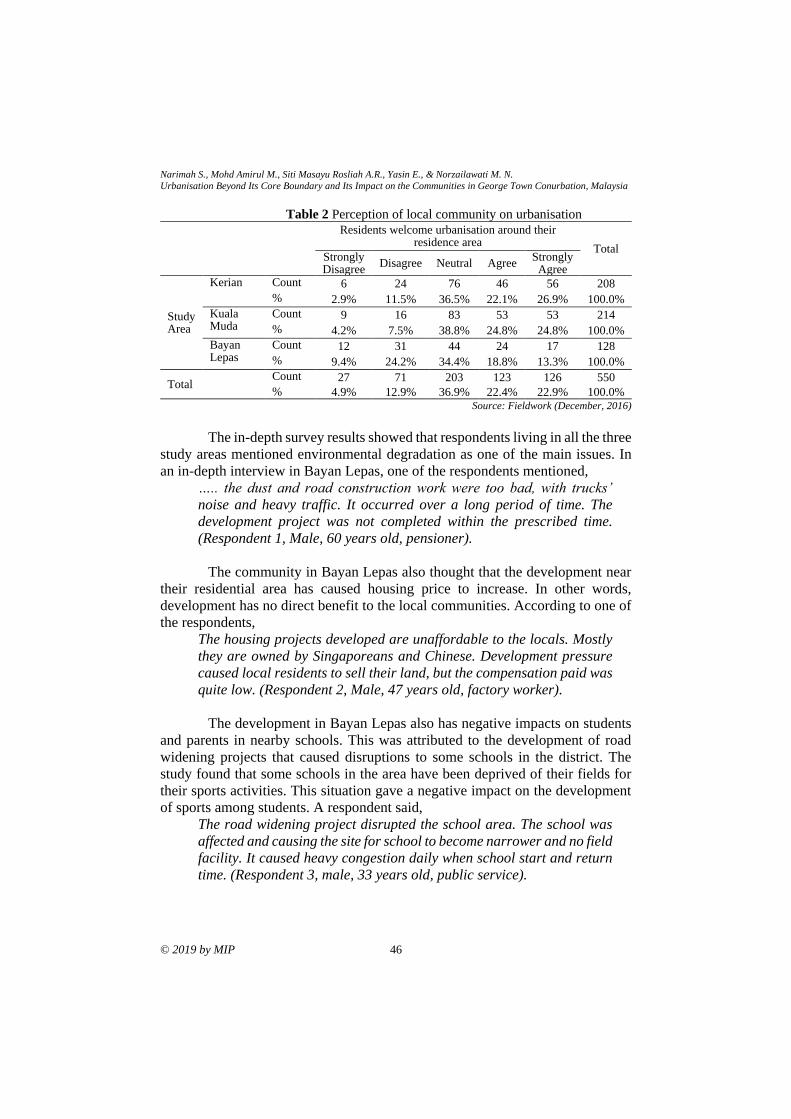
Narimah S., Mohd Amirul M., Siti Masayu Rosliah A.R., Yasin E., & Norzailawati M. N.
Urbanisation Beyond Its Core Boundary and Its Impact on the Communities in George Town Conurbation, Malaysia
© 2019 by MIP 46
Table 2 Perception of local community on urbanisation
Residents welcome urbanisation around their residence area
Total Strongly Disagree
Disagree Neutral Agree Strongly
Agree
Study Area
Kerian Count 6 24 76 46 56 208
% 2.9% 11.5% 36.5% 22.1% 26.9% 100.0%
Kuala Muda
Count 9 16 83 53 53 214
% 4.2% 7.5% 38.8% 24.8% 24.8% 100.0%
Bayan Lepas
Count 12 31 44 24 17 128
% 9.4% 24.2% 34.4% 18.8% 13.3% 100.0%
Total Count 27 71 203 123 126 550
% 4.9% 12.9% 36.9% 22.4% 22.9% 100.0% Source: Fieldwork (December, 2016)
The in-depth survey results showed that respondents living in all the three
study areas mentioned environmental degradation as one of the main issues. In
an in-depth interview in Bayan Lepas, one of the respondents mentioned,
….. the dust and road construction work were too bad, with trucks’
noise and heavy traffic. It occurred over a long period of time. The
development project was not completed within the prescribed time.
(Respondent 1, Male, 60 years old, pensioner).
The community in Bayan Lepas also thought that the development near
their residential area has caused housing price to increase. In other words,
development has no direct benefit to the local communities. According to one of
the respondents,
The housing projects developed are unaffordable to the locals. Mostly
they are owned by Singaporeans and Chinese. Development pressure
caused local residents to sell their land, but the compensation paid was
quite low. (Respondent 2, Male, 47 years old, factory worker).
The development in Bayan Lepas also has negative impacts on students
and parents in nearby schools. This was attributed to the development of road
widening projects that caused disruptions to some schools in the district. The
study found that some schools in the area have been deprived of their fields for
their sports activities. This situation gave a negative impact on the development
of sports among students. A respondent said,
The road widening project disrupted the school area. The school was
affected and causing the site for school to become narrower and no field
facility. It caused heavy congestion daily when school start and return
time. (Respondent 3, male, 33 years old, public service).

PLANNING MALAYSIA
Journal of the Malaysia Institute of Planners (2019)
47 © 2019 by MIP
The in-depth interviews also revealed that the community in Bayan Lepas
is less likely to welcome development projects around their residential area. The
reason is that they considered development as having a negative impact on the
local community, but not to outsiders. Only one of the respondents considered
that development in residential areas had a positive impact on those living outside
the Bayan Lepas area. The respondent said,
Development projects such as road widening, and second bridge are
good. But housing and hotel projects do not benefit the locals. Houses
are very expensive and it affected us as more people who moved here.
(Respondent 4, Female, 39 years old, factory worker).
Overall findings indicated that the development in the Bayan Lepas area
brought more negative than positive impacts on the local community. Similarly,
the study by Ghazali (1999) and Samat et al. (2014) in Penang State also indicated
that respondents experienced negative impacts from urban development. For
example, respondents were selling their agriculture land and moving to
neighbouring states due to the high land and housing prices, besides avoiding
congestion. Although development brought environmental problems, congestion
and high land price, few respondents have claimed that the development also had
a positive impact on the community. The positive effects identified are discussed
in the following section.
Positive Adaptation: Accepting Development
Even though most respondents felt that development had negative impacts on the
local community, there are also some positive impacts from development. Urban
development has brought positive impacts to the economy in terms generating
more job opportunities, enhanced transportation and communication systems, and
improved public amenities, and the living standards of the community. As one of
the respondents said,
Housing projects will increase the population. They will bring more
business to local food traders. They can create more job opportunities
and will increase the income among locals. (Respondent 5, Female, 46
years old, public service).
The findings are in line with the studies by Elhadary et al. (2013) and
Samat et al. (2014), that showed that residential development has caused middle-
income residents to move into the peri-urban areas and has brought new job
opportunities such as child care, tailoring services and other businesses to the
region. The findings also showed that development and urbanisation has brought
positive impacts to the local communities by bringing in more job opportunities
in the non-agricultural sector, enabling the locals to earn better incomes (Ghazali,
1999). One of the respondents said,
Narimah S., Mohd Amirul M., Siti Masayu Rosliah A.R., Yasin E., & Norzailawati M. N.
Urbanisation Beyond Its Core Boundary and Its Impact on the Communities in George Town Conurbation, Malaysia
© 2019 by MIP 48
...since the new road was constructed, access to our business has
increased. It also reduced traffic congestion, increased tourist
arrivals, and provided a greater market for local business.
(Respondent 6, Female, 21 years old, factory worker).
This study found that most of the respondents in Kuala Muda and Kerian
(less developed areas compared with Bayan Lepas) welcomed new development
into their areas. Ghazali (1999) found that women were able to earn income as
more middle-class workers moved to their neighbourhood. This has allowed the
local communities to provide childcare services, tailoring services and hawking
food by the roadside. The study by Elhadary et al. (2013) also emphasised on the
positive impacts that development has brought a market to the people living
within new residential areas being developed at the urban fringe. Analysis of the
study results shows that; well planned development is essential to ensure that
development brings more positive impact not only to the country but also to the
communities living within the areas.
CONCLUSION
As a conclusion, this study finds that the communities in Kerian and Kuala Muda
were quite positive with the spillover effects of rapid development from Penang
when compared with the community in Bayan Lepas. This study has shown that
the physical development of towns within George Town Conurbation has spilled
over to the neighbouring regions, affecting the communities. Therefore, a more
effective policy response to address the circumstances for Kerian and Kuala
Muda should be adopted such as an integrated policy approach to be implemented
by the City Council of Penang Island and Seberang Perai Municipal Council to
manage the rapid urban development. This finding should be further explored
with respect to policy formulation such that urbanisation can be planned and the
well-being of communities are safeguarded. More important is that conurbation
is essential for the economic growth of developed and developing countries.
ACKNOWLEDGMENT
This research was funded by the Fundamental Research Grant Scheme, Ministry
of Higher Education Malaysia, grant number [203/PHUMANITI/6711472] and
Universiti Sains Malaysia’s Research University Team Grant
[1001/PHUMANITI/856002]. Authors also acknowledged funding support for
Siti Masayu Rosliah Abdul Rashid through Universiti Sains Malaysia post-
doctoral fellowship program.
PLANNING MALAYSIA
Journal of the Malaysia Institute of Planners (2019)
49 © 2019 by MIP
REFERENCES Cavallier, G. (1996). Urbanization in developing countries. Urbanisme, 4-11.
Demographia World Urban Areas (2017). Built up urban areas or world agglomerations:
13th annual edition. Retrieved Jan 1, 2018 from www.demographia.com/db-
worldua.pdf
FAO (2016). State of the world’s forests 2016. Rome: (n.p.)
Department of Statistics Malaysia. (2016). Malaysia’s GDP by states, 2010-2015, Kuala
Lumpur, released on 30 September 2016.
Elhadary, Y., Samat, N., & Franklin, O.O. (2013). Development at the peri-urban area
and its impact on agricultural activities: An example from the Seberang Perai
Region, Penang State, Malaysia. Agroecology and Sustainable Food Systems,
37(7), 834-856.
Ghazali, S. (1999). Socio-economic changes in the peri urban villages in Penang,
Malaysia (Doctorate dissertation). University of Leeds, Leeds, UK.
Hasni, R., & Samat, N. (2015). Predicting Seberang Perai housing land pattern in 2017.
In Proceedings of International Conference on Development and Socio Spatial
Inequalities 2015, 216-223.
Jedwab, R., & Vollrath, D. (2015). Urbanization without growth in historical perspective.
Explorations in Economic History, 58, 1-21.
Knieling, J. (2014). Metropolitan regions definitions, typologies and recommendations
for development cooperation, Discussion Paper Series.
McGee, T. (2009). The spatiality of urbanization: the policy challenges of mega-urban
and Desakota Regions of Southeast Asia. UNU-IAS Working paper no. 161.
Retrieved from www.as.unu.edu/resource_centre/161%20Terry%20McGee.pdf
PlanMalaysia (2016) Dasar Perbandaran Negara 2. Kuala Lumpur: Author.
Samat, N., Ghazali, S., Hasni, R., & Elhadary, Y. (2014). Urban expansion and its impact
on local communities: A case study of Seberang Perai, Penang Malaysia.
Pertanika. Social Science & Humanities, 22(2), 349-367.
Su, S., Jiang, Z., Zhang, Q., & Zhang, Y. (2011). Transformation of agricultural
landscapes under rapid urbanization: A threat to sustainability in Hang-Jia-Hu
region, China. Applied Geography, 31, 439-449.
Penang second bridge to spur state’s economic development (2012). Retrieved from
https://www.thestar.com.my/news/nation/2012/07/05/penang-second-bridge-
to-spur-states economic-development/
United Nations (2014). World urbanization prospects: The 2014 revision. Retrieved from
http://esa.un.org/unpd/wup/
UN-Habitat. (2016). World cities report 2016. Urbanization and development: Emerging
futures. Retrieved from http://wcr.unhabitat.org/wp-content/
uploads/2017/02/WCR-2016
United States Geological Survey [USGS] (2015). Earth explorer: Maps, imagery and
publications. Retrieved from http://earthexplorer.usgs.gov/
Received: 13th November 2018. Accepted: 19th June 2019
1 Lecturer at Universiti Putra Malaysia. Email: [email protected] 50
PLANNING MALAYSIA:
Journal of the Malaysian Institute of Planners
VOLUME 17 ISSUE 2 (2019), Page 50 – 61
THE TRAFFIC VOLUME AND LEVEL OF SERVICE (LOS) OF
UNIVERSITI PUTRA MALAYSIA (UPM) SERDANG CAMPUS MAIN
ACCESS
Zakiah Ponrahono1, Noorain Mohd Isa2, Ahmad Zaharin Aris3, & Rosta Harun4
1,2,3,4Faculty of Environmental Studies
UNIVERSITI PUTRA MALAYSIA
Abstract
The inbound and outbound traffic flow characteristic of a campus is an important
physical component of overall university setting. The traffic circulation generated
may create indirect effects on the environment such as, disturbance to lecture-
time when traffic congestion occurs during peak-hours, loss of natural
environment and greenery, degradation of the visual environment by improper or
illegal parking, air pollution from motorized vehicles either moving or in idle
mode due to traffic congestion, noise pollution, energy consumption, land use
arrangement and health effects on the community of Universiti Putra Malaysia
(UPM) Serdang. A traffic volume and Level of Service (LOS) study is required
to facilitate better accessibility and improves the road capacity within the campus
area. The purpose of this paper is to highlight the traffic volume and Level of
Service of the main access the UPM Serdang campus. A traffic survey was
conducted over three (3) weekdays during an active semester to understand the
traffic flow pattern. The findings on traffic flow during peak hours are
highlighted. The conclusions of on-campus traffic flow patterns are also drawn.
Keywords: campus traffic, inbound-outbound traffic flow, motorized vehicle
PLANNING MALAYSIA
Journal of the Malaysia Institute of Planners (2019)
51 © 2019 by MIP
INTRODUCTION
The high concentration of people and traffic movement in university campus is
typically due to the growth of the campus population and the university’s physical
development (Singh & Goyal, 2015). UPM Serdang, as one of the leading higher
learning institution in Malaysia has unique transportation needs and a
comprehensive transportation plan to achieve greater sustainable campus
mobility. The number of vehicles that have travelled across the campus, and
consequently, their impact on the environment can be related to several
determining factors (Norzalwi & Ismail, 2011). These factors include (1) existing
road infrastructure capacity; (2) quality of transportation services and facilities
provisions on-campus (3) geographical setting of campus living and motor
vehicle use; and, (4) low participation of sustainable transportation programs
such as bus services (Abdul Azeez, 2011). Hence, a study on road capacity is
necessary as the improvement of road services is important to fulfil the travel
needs and reducing the impact of vehicle use to the environment setting of
campuses (Abd-Razak, Mustafa, Che-Ani, Abdullah, & Mohd-Nor, 2011; Azzali
& Abdel Sabour, 2018).
In addition, the existing transportation service system of a university may
also create indirect effects on the environment such as, disturbance to lecture-
time when traffic congestion occurs during peak-hours, loss of natural
environment and greenery, degradation of the visual environment by improper or
illegal parking, air pollution from motorized vehicles either moving or in idle
mode due to traffic congestion, noise pollution, energy consumption, land use
arrangement and health effects on the campus community (Lundberg & Weber,
2014; Soria-Lara, Marquet, & Miralles-Guasch, 2017).
Improper traffic control and management lead to the traffic congestion at
the main access of the campus, as well as illegal parking at busy locations, which
in turn are contributing factors to accidents and loss of road capacity as well as
increase of air pollutions within the university campus (Dontu, Maftei,
Barsanescu, Sachelarie, & Budeanu, 2016). Furthermore, the phenomenon of
increased vehicle travel induced by new parking spaces (added vehicle-storing
capacity) is similar to the phenomenon of increased vehicle travel induced by new
roads (added vehicle-carrying) capacity (Aoun, Abou-Zeid, Kaysi, & Myntti,
2013).
A proper study on transportation planning is required to provide better
accessibility and improves mobility within the campus area (Curtis & Scheurer,
2010). Besides this, critical planning towards a sustainable and green
transportation orientation campus should be on the forefront of each university
administrator’s blueprint (Gopikrishna & Shanmugapriyan, 2015). This paper
addresses the existing conditions of traffic flow in the Universiti Putra Malaysia
Serdang campus. A traffic survey was conducted to understand the pattern of
inbound and outbound of on-campus traffic flow. Findings on the existing
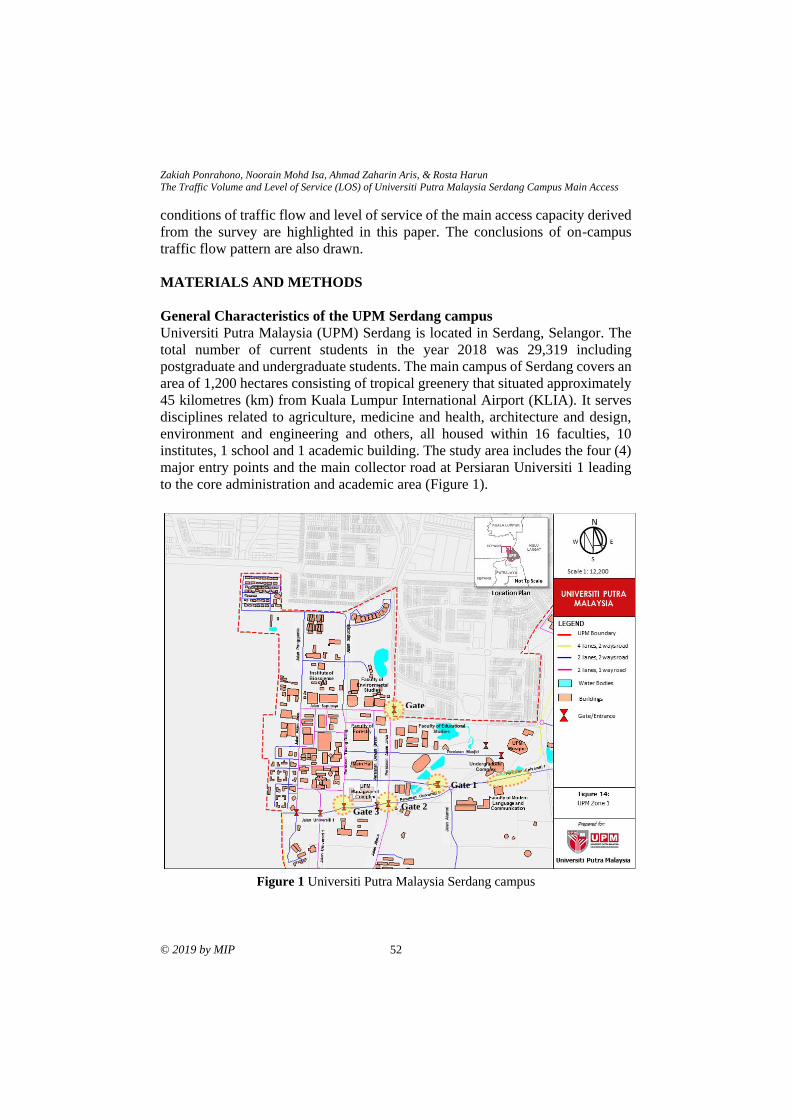
Zakiah Ponrahono, Noorain Mohd Isa, Ahmad Zaharin Aris, & Rosta Harun
The Traffic Volume and Level of Service (LOS) of Universiti Putra Malaysia Serdang Campus Main Access
© 2019 by MIP 52
conditions of traffic flow and level of service of the main access capacity derived
from the survey are highlighted in this paper. The conclusions of on-campus
traffic flow pattern are also drawn.
MATERIALS AND METHODS
General Characteristics of the UPM Serdang campus
Universiti Putra Malaysia (UPM) Serdang is located in Serdang, Selangor. The
total number of current students in the year 2018 was 29,319 including
postgraduate and undergraduate students. The main campus of Serdang covers an
area of 1,200 hectares consisting of tropical greenery that situated approximately
45 kilometres (km) from Kuala Lumpur International Airport (KLIA). It serves
disciplines related to agriculture, medicine and health, architecture and design,
environment and engineering and others, all housed within 16 faculties, 10
institutes, 1 school and 1 academic building. The study area includes the four (4)
major entry points and the main collector road at Persiaran Universiti 1 leading
to the core administration and academic area (Figure 1).
Figure 1 Universiti Putra Malaysia Serdang campus
Gate
9
Gate 1
Gate 2 Gate 3
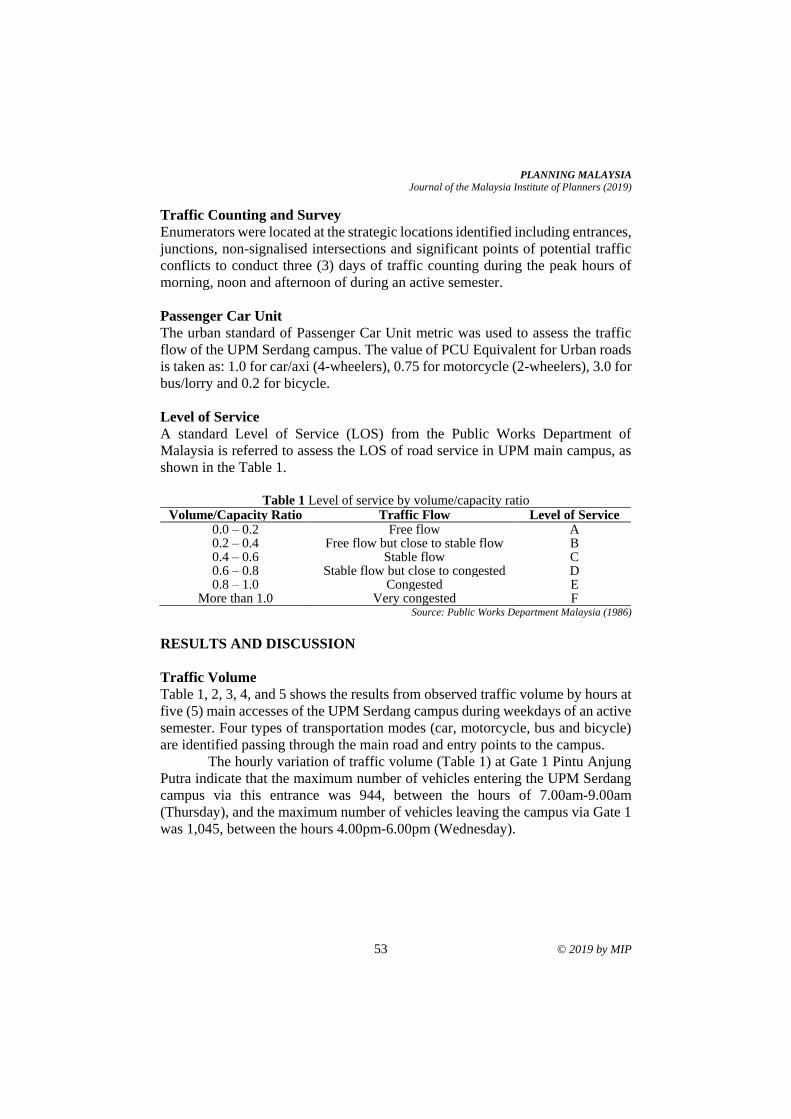
PLANNING MALAYSIA
Journal of the Malaysia Institute of Planners (2019)
53 © 2019 by MIP
Traffic Counting and Survey
Enumerators were located at the strategic locations identified including entrances,
junctions, non-signalised intersections and significant points of potential traffic
conflicts to conduct three (3) days of traffic counting during the peak hours of
morning, noon and afternoon of during an active semester.
Passenger Car Unit
The urban standard of Passenger Car Unit metric was used to assess the traffic
flow of the UPM Serdang campus. The value of PCU Equivalent for Urban roads
is taken as: 1.0 for car/axi (4-wheelers), 0.75 for motorcycle (2-wheelers), 3.0 for
bus/lorry and 0.2 for bicycle.
Level of Service
A standard Level of Service (LOS) from the Public Works Department of
Malaysia is referred to assess the LOS of road service in UPM main campus, as
shown in the Table 1.
Table 1 Level of service by volume/capacity ratio
Volume/Capacity Ratio Traffic Flow Level of Service 0.0 – 0.2 Free flow A 0.2 – 0.4 Free flow but close to stable flow B 0.4 – 0.6 Stable flow C 0.6 – 0.8 Stable flow but close to congested D 0.8 – 1.0 Congested E
More than 1.0 Very congested F Source: Public Works Department Malaysia (1986)
RESULTS AND DISCUSSION
Traffic Volume
Table 1, 2, 3, 4, and 5 shows the results from observed traffic volume by hours at
five (5) main accesses of the UPM Serdang campus during weekdays of an active
semester. Four types of transportation modes (car, motorcycle, bus and bicycle)
are identified passing through the main road and entry points to the campus.
The hourly variation of traffic volume (Table 1) at Gate 1 Pintu Anjung
Putra indicate that the maximum number of vehicles entering the UPM Serdang
campus via this entrance was 944, between the hours of 7.00am-9.00am
(Thursday), and the maximum number of vehicles leaving the campus via Gate 1
was 1,045, between the hours 4.00pm-6.00pm (Wednesday).
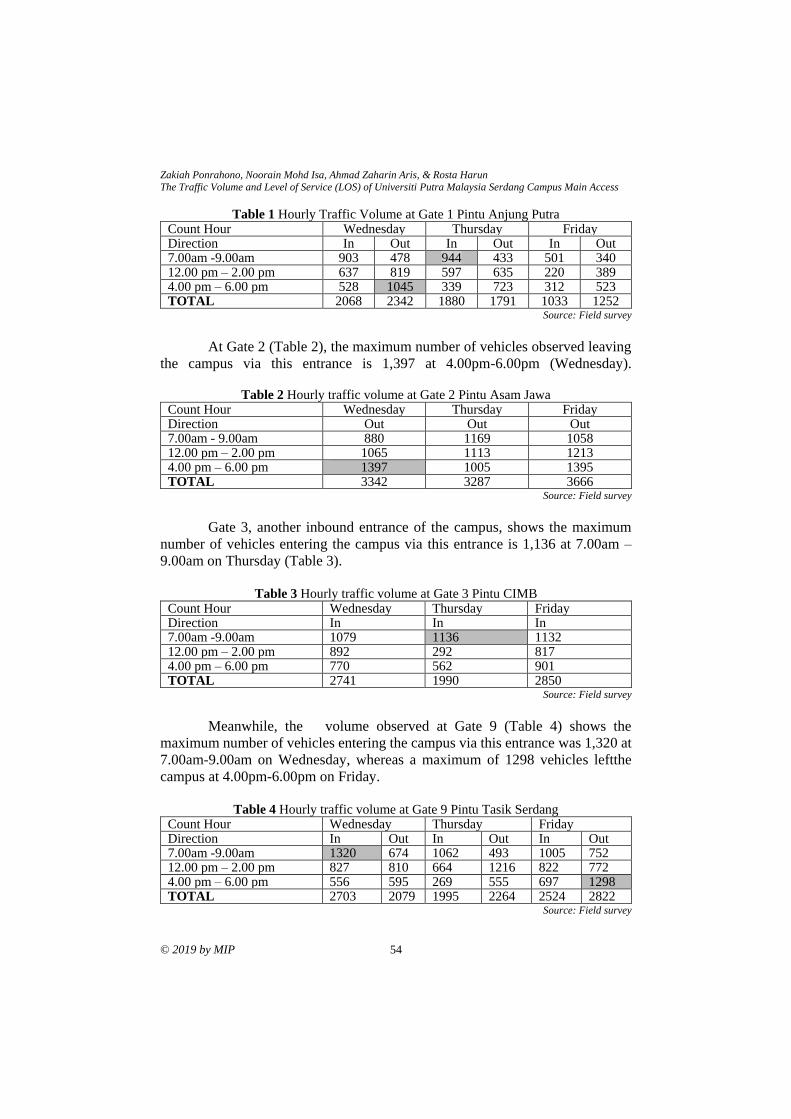
Zakiah Ponrahono, Noorain Mohd Isa, Ahmad Zaharin Aris, & Rosta Harun
The Traffic Volume and Level of Service (LOS) of Universiti Putra Malaysia Serdang Campus Main Access
© 2019 by MIP 54
Table 1 Hourly Traffic Volume at Gate 1 Pintu Anjung Putra Count Hour Wednesday Thursday Friday Direction In Out In Out In Out 7.00am -9.00am 903 478 944 433 501 340 12.00 pm – 2.00 pm 637 819 597 635 220 389 4.00 pm – 6.00 pm 528 1045 339 723 312 523 TOTAL 2068 2342 1880 1791 1033 1252
Source: Field survey
At Gate 2 (Table 2), the maximum number of vehicles observed leaving
the campus via this entrance is 1,397 at 4.00pm-6.00pm (Wednesday).
Table 2 Hourly traffic volume at Gate 2 Pintu Asam Jawa Count Hour Wednesday Thursday Friday Direction Out Out Out 7.00am - 9.00am 880 1169 1058 12.00 pm – 2.00 pm 1065 1113 1213 4.00 pm – 6.00 pm 1397 1005 1395 TOTAL 3342 3287 3666
Source: Field survey
Gate 3, another inbound entrance of the campus, shows the maximum
number of vehicles entering the campus via this entrance is 1,136 at 7.00am –
9.00am on Thursday (Table 3).
Table 3 Hourly traffic volume at Gate 3 Pintu CIMB
Count Hour Wednesday Thursday Friday Direction In In In 7.00am -9.00am 1079 1136 1132 12.00 pm – 2.00 pm 892 292 817 4.00 pm – 6.00 pm 770 562 901 TOTAL 2741 1990 2850
Source: Field survey
Meanwhile, the volume observed at Gate 9 (Table 4) shows the
maximum number of vehicles entering the campus via this entrance was 1,320 at
7.00am-9.00am on Wednesday, whereas a maximum of 1298 vehicles leftthe
campus at 4.00pm-6.00pm on Friday.
Table 4 Hourly traffic volume at Gate 9 Pintu Tasik Serdang
Count Hour Wednesday Thursday Friday Direction In Out In Out In Out 7.00am -9.00am 1320 674 1062 493 1005 752 12.00 pm – 2.00 pm 827 810 664 1216 822 772 4.00 pm – 6.00 pm 556 595 269 555 697 1298 TOTAL 2703 2079 1995 2264 2524 2822
Source: Field survey
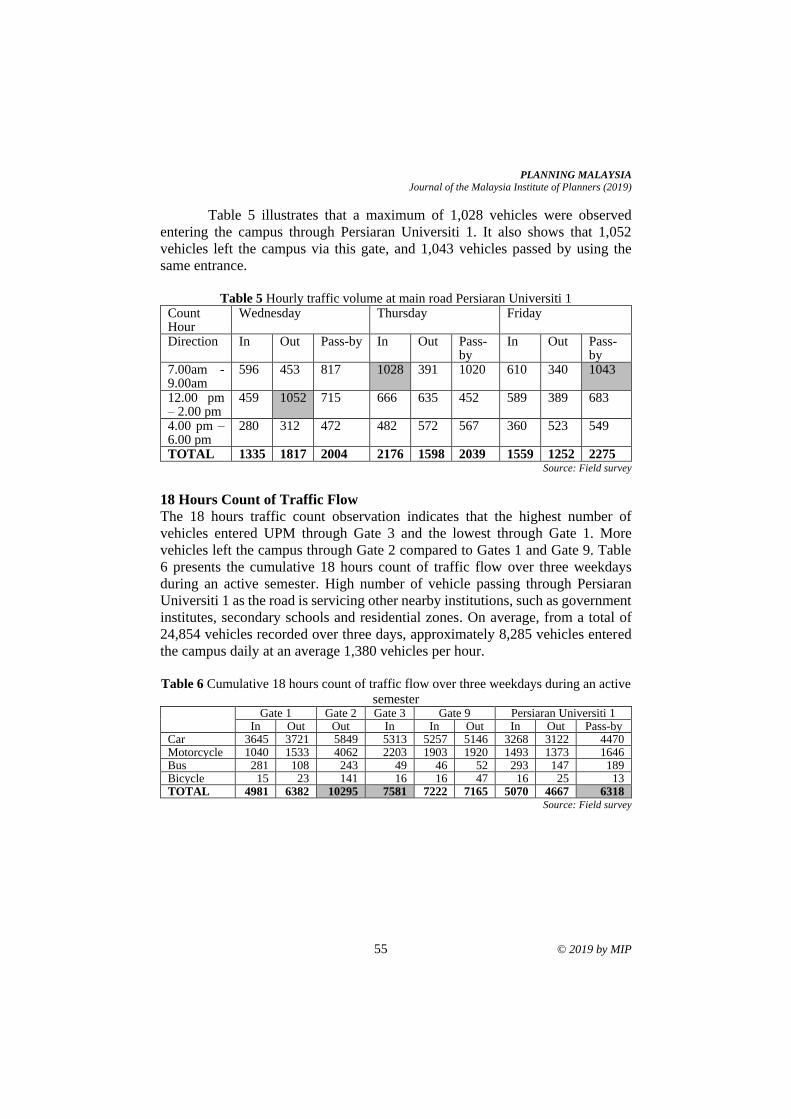
PLANNING MALAYSIA
Journal of the Malaysia Institute of Planners (2019)
55 © 2019 by MIP
Table 5 illustrates that a maximum of 1,028 vehicles were observed
entering the campus through Persiaran Universiti 1. It also shows that 1,052
vehicles left the campus via this gate, and 1,043 vehicles passed by using the
same entrance.
Table 5 Hourly traffic volume at main road Persiaran Universiti 1
Count Hour
Wednesday Thursday Friday
Direction In Out Pass-by In Out Pass-by
In Out Pass-by
7.00am -9.00am
596 453 817 1028 391 1020 610 340 1043
12.00 pm – 2.00 pm
459 1052 715 666 635 452 589 389 683
4.00 pm – 6.00 pm
280 312 472 482 572 567 360 523 549
TOTAL 1335 1817 2004 2176 1598 2039 1559 1252 2275 Source: Field survey
18 Hours Count of Traffic Flow
The 18 hours traffic count observation indicates that the highest number of
vehicles entered UPM through Gate 3 and the lowest through Gate 1. More
vehicles left the campus through Gate 2 compared to Gates 1 and Gate 9. Table
6 presents the cumulative 18 hours count of traffic flow over three weekdays
during an active semester. High number of vehicle passing through Persiaran
Universiti 1 as the road is servicing other nearby institutions, such as government
institutes, secondary schools and residential zones. On average, from a total of
24,854 vehicles recorded over three days, approximately 8,285 vehicles entered
the campus daily at an average 1,380 vehicles per hour.
Table 6 Cumulative 18 hours count of traffic flow over three weekdays during an active
semester
Gate 1 Gate 2 Gate 3 Gate 9 Persiaran Universiti 1 In Out Out In In Out In Out Pass-by
Car 3645 3721 5849 5313 5257 5146 3268 3122 4470 Motorcycle 1040 1533 4062 2203 1903 1920 1493 1373 1646 Bus 281 108 243 49 46 52 293 147 189 Bicycle 15 23 141 16 16 47 16 25 13 TOTAL 4981 6382 10295 7581 7222 7165 5070 4667 6318
Source: Field survey
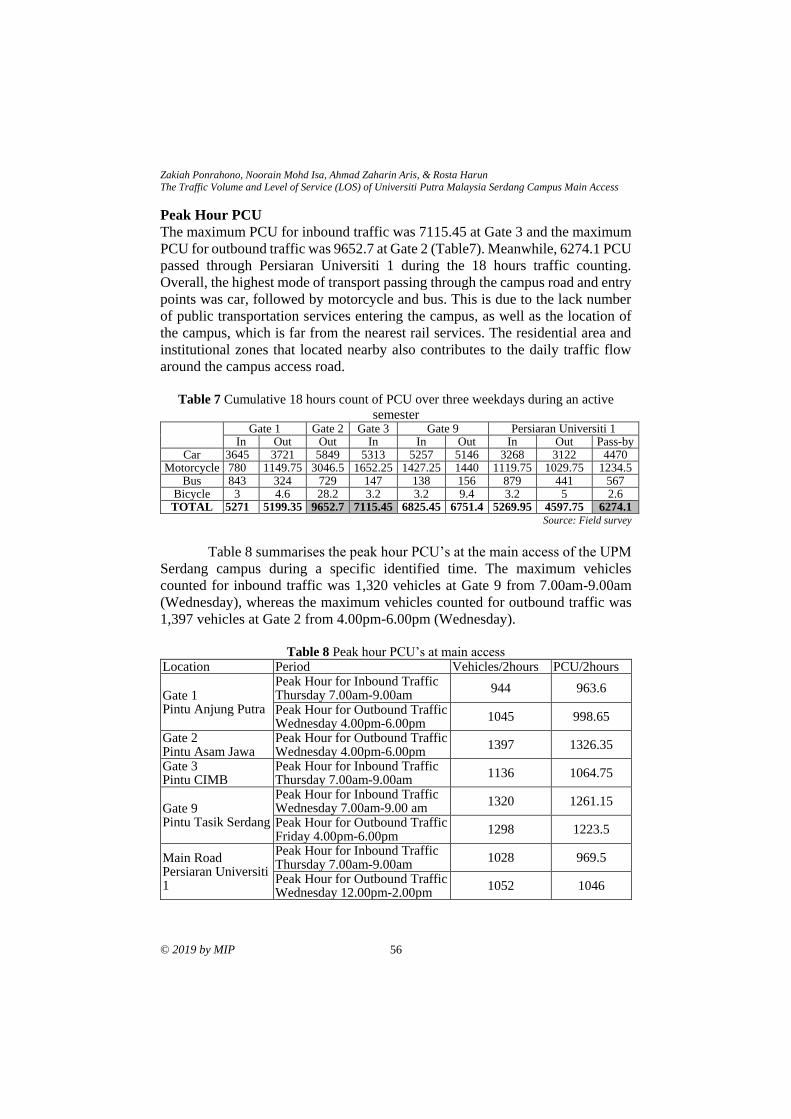
Zakiah Ponrahono, Noorain Mohd Isa, Ahmad Zaharin Aris, & Rosta Harun
The Traffic Volume and Level of Service (LOS) of Universiti Putra Malaysia Serdang Campus Main Access
© 2019 by MIP 56
Peak Hour PCU
The maximum PCU for inbound traffic was 7115.45 at Gate 3 and the maximum
PCU for outbound traffic was 9652.7 at Gate 2 (Table7). Meanwhile, 6274.1 PCU
passed through Persiaran Universiti 1 during the 18 hours traffic counting.
Overall, the highest mode of transport passing through the campus road and entry
points was car, followed by motorcycle and bus. This is due to the lack number
of public transportation services entering the campus, as well as the location of
the campus, which is far from the nearest rail services. The residential area and
institutional zones that located nearby also contributes to the daily traffic flow
around the campus access road.
Table 7 Cumulative 18 hours count of PCU over three weekdays during an active
semester
Gate 1 Gate 2 Gate 3 Gate 9 Persiaran Universiti 1 In Out Out In In Out In Out Pass-by
Car 3645 3721 5849 5313 5257 5146 3268 3122 4470 Motorcycle 780 1149.75 3046.5 1652.25 1427.25 1440 1119.75 1029.75 1234.5
Bus 843 324 729 147 138 156 879 441 567 Bicycle 3 4.6 28.2 3.2 3.2 9.4 3.2 5 2.6 TOTAL 5271 5199.35 9652.7 7115.45 6825.45 6751.4 5269.95 4597.75 6274.1
Source: Field survey
Table 8 summarises the peak hour PCU’s at the main access of the UPM
Serdang campus during a specific identified time. The maximum vehicles
counted for inbound traffic was 1,320 vehicles at Gate 9 from 7.00am-9.00am
(Wednesday), whereas the maximum vehicles counted for outbound traffic was
1,397 vehicles at Gate 2 from 4.00pm-6.00pm (Wednesday).
Table 8 Peak hour PCU’s at main access
Location Period Vehicles/2hours PCU/2hours
Gate 1 Pintu Anjung Putra
Peak Hour for Inbound Traffic Thursday 7.00am-9.00am
944 963.6
Peak Hour for Outbound Traffic Wednesday 4.00pm-6.00pm
1045 998.65
Gate 2 Pintu Asam Jawa
Peak Hour for Outbound Traffic Wednesday 4.00pm-6.00pm
1397 1326.35
Gate 3 Pintu CIMB
Peak Hour for Inbound Traffic Thursday 7.00am-9.00am
1136 1064.75
Gate 9 Pintu Tasik Serdang
Peak Hour for Inbound Traffic Wednesday 7.00am-9.00 am
1320 1261.15
Peak Hour for Outbound Traffic Friday 4.00pm-6.00pm
1298 1223.5
Main Road Persiaran Universiti 1
Peak Hour for Inbound Traffic Thursday 7.00am-9.00am
1028 969.5
Peak Hour for Outbound Traffic Wednesday 12.00pm-2.00pm
1052 1046
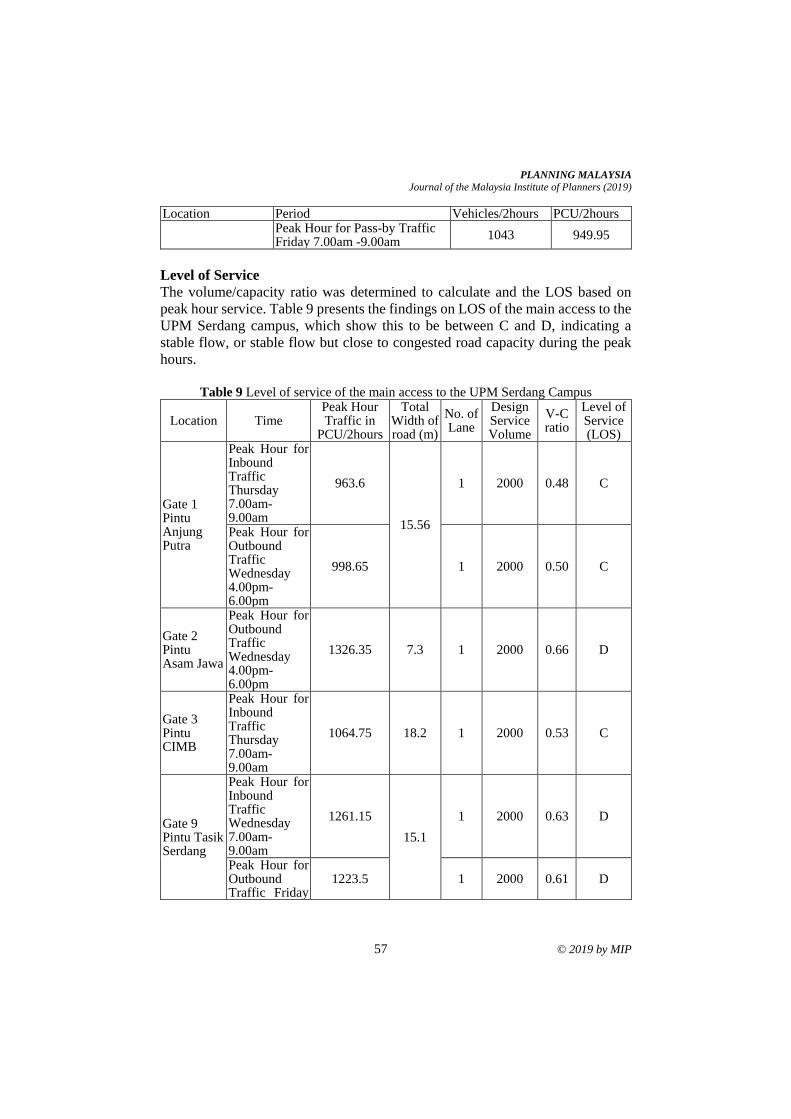
PLANNING MALAYSIA
Journal of the Malaysia Institute of Planners (2019)
57 © 2019 by MIP
Location Period Vehicles/2hours PCU/2hours Peak Hour for Pass-by Traffic Friday 7.00am -9.00am
1043 949.95
Level of Service
The volume/capacity ratio was determined to calculate and the LOS based on
peak hour service. Table 9 presents the findings on LOS of the main access to the
UPM Serdang campus, which show this to be between C and D, indicating a
stable flow, or stable flow but close to congested road capacity during the peak
hours.
Table 9 Level of service of the main access to the UPM Serdang Campus
Location Time Peak Hour Traffic in
PCU/2hours
Total Width of road (m)
No. of Lane
Design Service Volume
V-C ratio
Level of Service (LOS)
Gate 1 Pintu Anjung Putra
Peak Hour for Inbound Traffic Thursday 7.00am-9.00am
963.6
15.56
1 2000 0.48 C
Peak Hour for Outbound Traffic Wednesday 4.00pm-6.00pm
998.65 1 2000 0.50 C
Gate 2 Pintu Asam Jawa
Peak Hour for Outbound Traffic Wednesday 4.00pm-6.00pm
1326.35 7.3 1 2000 0.66 D
Gate 3 Pintu CIMB
Peak Hour for Inbound Traffic Thursday 7.00am-9.00am
1064.75 18.2 1 2000 0.53 C
Gate 9 Pintu Tasik Serdang
Peak Hour for Inbound Traffic Wednesday 7.00am-9.00am
1261.15
15.1
1 2000 0.63 D
Peak Hour for Outbound Traffic Friday
1223.5 1 2000 0.61 D
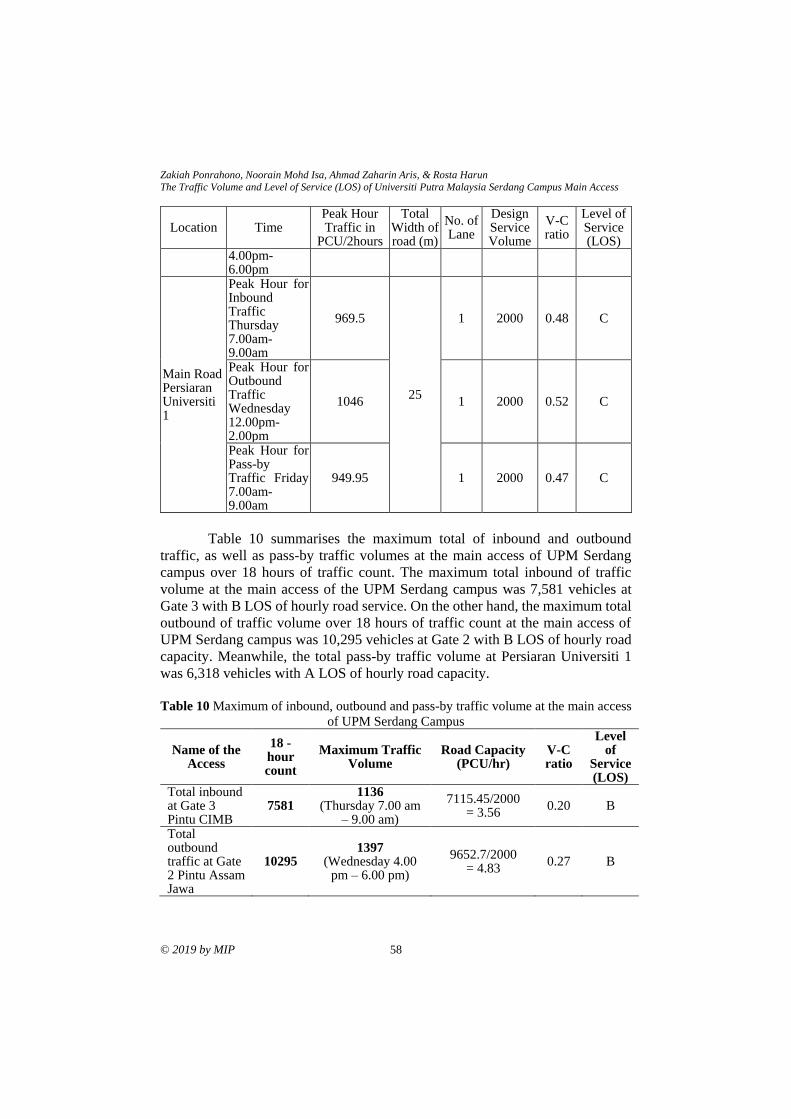
Zakiah Ponrahono, Noorain Mohd Isa, Ahmad Zaharin Aris, & Rosta Harun
The Traffic Volume and Level of Service (LOS) of Universiti Putra Malaysia Serdang Campus Main Access
© 2019 by MIP 58
Location Time Peak Hour Traffic in
PCU/2hours
Total Width of road (m)
No. of Lane
Design Service Volume
V-C ratio
Level of Service (LOS)
4.00pm-6.00pm
Main Road Persiaran Universiti 1
Peak Hour for Inbound Traffic Thursday 7.00am-9.00am
969.5
25
1 2000 0.48 C
Peak Hour for Outbound Traffic Wednesday 12.00pm-2.00pm
1046 1 2000 0.52 C
Peak Hour for Pass-by Traffic Friday 7.00am-9.00am
949.95 1 2000 0.47 C
Table 10 summarises the maximum total of inbound and outbound
traffic, as well as pass-by traffic volumes at the main access of UPM Serdang
campus over 18 hours of traffic count. The maximum total inbound of traffic
volume at the main access of the UPM Serdang campus was 7,581 vehicles at
Gate 3 with B LOS of hourly road service. On the other hand, the maximum total
outbound of traffic volume over 18 hours of traffic count at the main access of
UPM Serdang campus was 10,295 vehicles at Gate 2 with B LOS of hourly road
capacity. Meanwhile, the total pass-by traffic volume at Persiaran Universiti 1
was 6,318 vehicles with A LOS of hourly road capacity.
Table 10 Maximum of inbound, outbound and pass-by traffic volume at the main access
of UPM Serdang Campus
Name of the Access
18 - hour count
Maximum Traffic Volume
Road Capacity (PCU/hr)
V-C ratio
Level of
Service (LOS)
Total inbound at Gate 3 Pintu CIMB
7581 1136
(Thursday 7.00 am – 9.00 am)
7115.45/2000 = 3.56
0.20 B
Total outbound traffic at Gate 2 Pintu Assam Jawa
10295 1397
(Wednesday 4.00 pm – 6.00 pm)
9652.7/2000 = 4.83
0.27 B
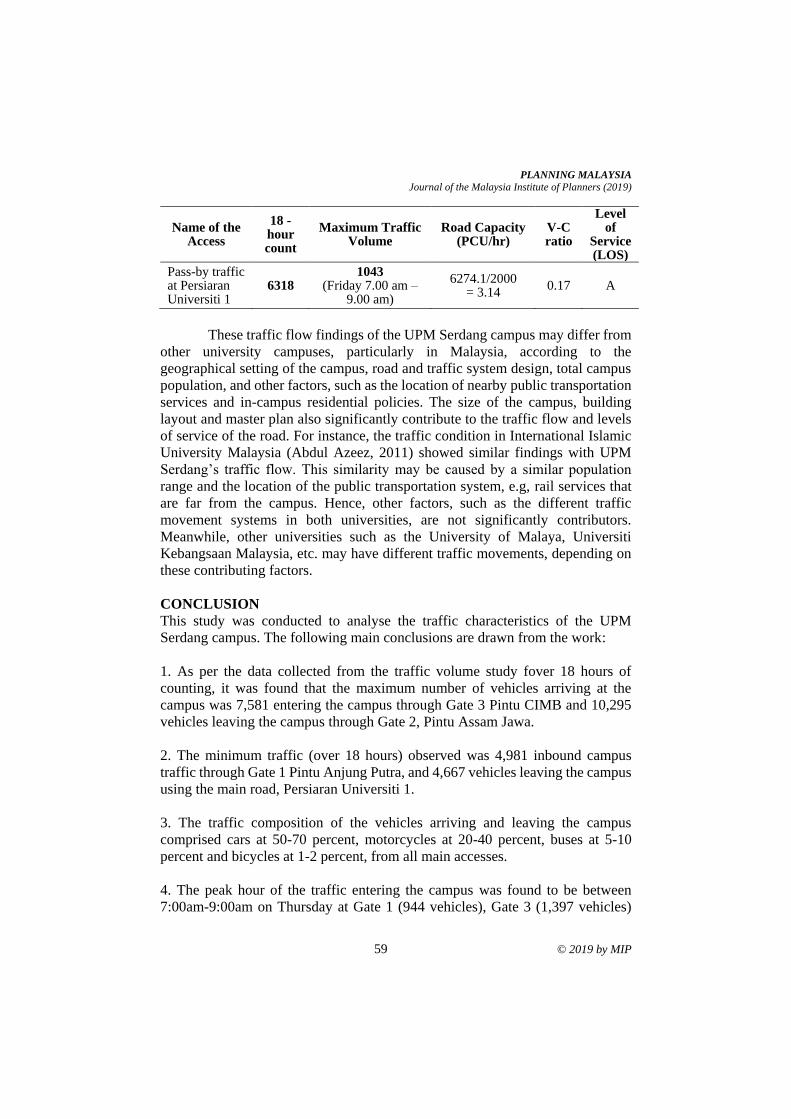
PLANNING MALAYSIA
Journal of the Malaysia Institute of Planners (2019)
59 © 2019 by MIP
Name of the Access
18 - hour count
Maximum Traffic Volume
Road Capacity (PCU/hr)
V-C ratio
Level of
Service (LOS)
Pass-by traffic at Persiaran Universiti 1
6318 1043
(Friday 7.00 am – 9.00 am)
6274.1/2000 = 3.14
0.17 A
These traffic flow findings of the UPM Serdang campus may differ from
other university campuses, particularly in Malaysia, according to the
geographical setting of the campus, road and traffic system design, total campus
population, and other factors, such as the location of nearby public transportation
services and in-campus residential policies. The size of the campus, building
layout and master plan also significantly contribute to the traffic flow and levels
of service of the road. For instance, the traffic condition in International Islamic
University Malaysia (Abdul Azeez, 2011) showed similar findings with UPM
Serdang’s traffic flow. This similarity may be caused by a similar population
range and the location of the public transportation system, e.g, rail services that
are far from the campus. Hence, other factors, such as the different traffic
movement systems in both universities, are not significantly contributors.
Meanwhile, other universities such as the University of Malaya, Universiti
Kebangsaan Malaysia, etc. may have different traffic movements, depending on
these contributing factors.
CONCLUSION
This study was conducted to analyse the traffic characteristics of the UPM
Serdang campus. The following main conclusions are drawn from the work:
1. As per the data collected from the traffic volume study fover 18 hours of
counting, it was found that the maximum number of vehicles arriving at the
campus was 7,581 entering the campus through Gate 3 Pintu CIMB and 10,295
vehicles leaving the campus through Gate 2, Pintu Assam Jawa.
2. The minimum traffic (over 18 hours) observed was 4,981 inbound campus
traffic through Gate 1 Pintu Anjung Putra, and 4,667 vehicles leaving the campus
using the main road, Persiaran Universiti 1.
3. The traffic composition of the vehicles arriving and leaving the campus
comprised cars at 50-70 percent, motorcycles at 20-40 percent, buses at 5-10
percent and bicycles at 1-2 percent, from all main accesses.
4. The peak hour of the traffic entering the campus was found to be between
7:00am-9:00am on Thursday at Gate 1 (944 vehicles), Gate 3 (1,397 vehicles)
Zakiah Ponrahono, Noorain Mohd Isa, Ahmad Zaharin Aris, & Rosta Harun
The Traffic Volume and Level of Service (LOS) of Universiti Putra Malaysia Serdang Campus Main Access
© 2019 by MIP 60
and Persiaran Universiti 1 (1,028 vehicles), and on Wednesday at Gate 9 (1,320
vehicles).
5. The peak hour of traffic leaving the campus was found to be between 4:00pm-
6:00pm on Wednesday at Gate 1 (1,045 vehicles), Gate 3 (1,397 vehicles) and
Persiaran Universiti 1 (1,052 vehicles), and on Friday at Gate 9 (1,298 vehicles).
6. The level of service as calculated for all main access of the UPM Serdang
campus was found to be between C- D level of service against all the peak hour
traffic.
7. More vehicles entered the campus through Gate 3 (7,851 vehicles) and more
vehicles leave the campus through Gate 2 with 10,295 vehicles observed over 18
hours.
8. The comparative study between different university campuses is suggested for
future research to identify common on-campus transportation system issues and
develop sustainable transportation campus indices.
ACKNOWLEDGEMENTS
This research was fully supported by the UPM Putra Grant – Current Issue
9300437 (UPM RMC).
REFERENCES Abdul Azeez Kadar Hamsa (2011). Analysis of Traffic Flow Characteristics in a
University Setting. In International Transport Research Conference – A Road
Map for Safer Mobility. April 12-13, 2011, Penang, Malaysia.
Abd-Razak, M. Z., Mustafa, N. K. F., Che-Ani, A. I., Abdullah, N. A. G., & Mohd-Nor,
M. F. I. (2011). Campus sustainability: Student’s perception on campus physical
development planning in Malaysia. Procedia Engineering, 20, 230-237.
Aoun, A., Abou-Zeid, M., Kaysi, I., & Myntti, C. (2013). Reducing parking demand and
traffic congestion at the American University of Beirut. Transport Policy, 25,
52-60.
Azzali, S., & Abdel Sabour, E. (2018). A framework for improving sustainable mobility
in higher education campuses: The case study of Qatar University. Case Studies
on Transport Policy, 6(4), 603-612.
Curtis, C., & Scheurer, J. (2010). Planning for sustainable accessibility: Developing tools
to aid discussion and decision-making. Progress in Planning, 74(2), 53-106.
Dontu, A. I., Maftei, A., Barsanescu, P. D., Sachelarie, A., & Budeanu, B. (2016). Method
of preventing unwanted traffic in the “tudor Vladimirescu” University Campus.
IOP Conference Series: Materials Science and Engineering, 147(1), 012111.
Gopikrishna, J., & Shanmugapriyan, V. (2015). Critical study on road inventory and
traffic circulation for ensuring road safety in CEG campus. Indian Journal of
Science and Technology, 8(32), 6-9.
PLANNING MALAYSIA
Journal of the Malaysia Institute of Planners (2019)
61 © 2019 by MIP
Lundberg, B., & Weber, J. (2014). Non-motorized transport and university populations:
An analysis of connectivity and network perceptions. Journal of Transport
Geography, 39, 165-178.
Norzalwi, N., & Ismail, A. (2011). Public approach towards sustainable transportation in
UKM’s campus. Australian Journal of Basic and Applied Sciences, 5(5), 1332-
1337.
Public Works Department Malaysia (1986). Arahan teknik (Jalan) 8/86: A guide on
geometric design of roads.
Singh, B., & Goyal, T. (2015). Study of traffic volume and level of service of Panjab
University, Chandigarh. International Journal of Engineering Research and
Applications, 5(7), 9–14.
Soria-Lara, J. A., Marquet, O., & Miralles-Guasch, C. (2017). The influence of location,
socioeconomics, and behaviour on travel-demand by car in metropolitan
university campuses. Transportation Research Part D: Transport and
Environment, 53, 149-160
Received: 12th January 2019. Accepted: 2nd August 2019
1 Senior Lecturer at Universiti Sains Malaysia. Email: [email protected] 62
PLANNING MALAYSIA:
Journal of the Malaysian Institute of Planners
VOLUME 17 ISSUE 2 (2019), 62 – 73
APPRAISAL OF URBANISATION, TOWNSHIP AND HOUSING
TRENDS FOR A DESIRED FUTURE IN MALAYSIA
Ruhizal Roosli1, Sana Malik2, Julaihi Wahid 3, & Helen Nesadurai4
1, 2 School of Housing, Building & Planning
UNIVERSITI SAINS MALAYSIA
3 College of Engineering
AJMAN UNIVERSITY, UNITED ARAB EMIRATES
4 School of Arts and Social Sciences
MONASH UNIVERSITY, MALAYSIA
Abstract
This paper reviews the trend of township planning in Malaysia by featuring
measures for the preparation of urban housing, and utilising the contemporary
shifts in town ‘landscaping’. Learning from the Habitat III, a competitive
township is essential for better and vibrant society. In Malaysia, the
competitiveness, capital at present can be measured in policy implementation
financially and transformative technologies support with any cutting-edge human
capital strategy. The objectives of this paper are to investigate the strategic angle
of sustainable urban development and to suggest better future urbanisation,
township and housing in Malaysia. Detailed review was done through content
analysis aiming at well-being and economic stability of its residents. The content
in focus comprised housing integration, housing assistance, economic
participation, and technology and design. It was found that Malaysia must be
aware and compatible with such challenges to align with the national aspiration
for harmonious living standards for future planning and housing development.
Keywords: urbanisation, city planning, urban housing, urban policy, township
PLANNING MALAYSIA
Journal of the Malaysia Institute of Planners (2019)
63 © 2019 by MIP
INTRODUCTION
Until 2010, the total number of Malaysian households was 6,396,174 with the
number of living quarters at 7,380,865 (JPM, 2011). Based on statistics, there are
enough houses for every family, with an additional 984,691 more houses
available in the market. Rightfully, the aim of government towards providing
‘One Family One House’ should have been fulfilled. However, the issue of
insufficient housing still surfaces in Malaysia and has led to other problems such
as the high prices of houses and limited affordability; abandoned housing
projects, and unsold housing units (UNDP-EPU, 2015). These problems in turn
would create other social problems such as homelessness and involvement in
crime due to the stress and pressures faced in daily life (Kingsley, 2017). In order
to solve these problems, meticulous ‘physical’ planning needs to be done, which
indirectly would promote a harmonious social growth and resulting in a
commendable social achievement (UNDP-EPU, 2015).
Therefore, an understanding of the needs and demands of the public is
important, and should be seen from the viewpoints of the segmented status of
individuals, households, and regional society (Jenkins, Smith, & Ya Ping, 2007).
For example, a social disadvantage would have an impact on an individual’s
education, which would lead to a job placement with a low salary. This could
have been caused by the location of a school which was not strategic and
hampered the schooling activities of students as mentioned in the New Urban
UN-Habitat Agenda (Amann & Jurasszovich, 2017). In order to understand the
potential and direction in setting contemporary township with planned housing,
there must also be an understanding on the smart township approach, housing
concepts and the legal framework, especially at the local level, to serve as
guidelines in planning decision-making process.
METHODS AND MATERIALS
The work in this paper concentrated mostly on academic reports of original
investigations rather than reviews apart from the following in Table 1. These
databases are in both electronic form and printed form, and are continuously
being updated. Reviews and reports on the township and housing trend include
the following (Table 1):
Table 1 Reviews and reports Author Theme Construction Industry Development Board (CIDB) Malaysia
Country Report
Economic Planning Unit Malaysia Plan Green Building Index (GBI) Sustainable Assessment Criteria Department of Statistics (JPM). National Census United Nations World Urbanisation Prospects United Nations Social Housing United Nations Future Cities
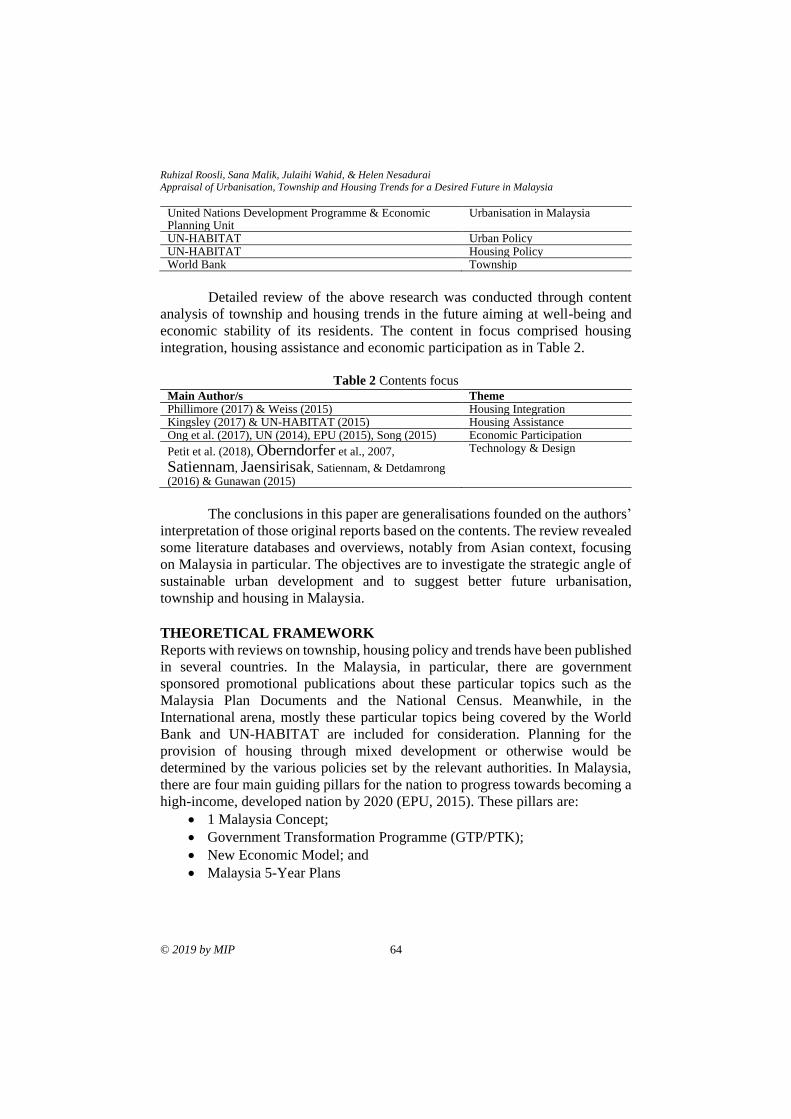
Ruhizal Roosli, Sana Malik, Julaihi Wahid, & Helen Nesadurai
Appraisal of Urbanisation, Township and Housing Trends for a Desired Future in Malaysia
© 2019 by MIP 64
United Nations Development Programme & Economic Planning Unit
Urbanisation in Malaysia
UN-HABITAT Urban Policy UN-HABITAT Housing Policy World Bank Township
Detailed review of the above research was conducted through content
analysis of township and housing trends in the future aiming at well-being and
economic stability of its residents. The content in focus comprised housing
integration, housing assistance and economic participation as in Table 2.
Table 2 Contents focus
The conclusions in this paper are generalisations founded on the authors’
interpretation of those original reports based on the contents. The review revealed
some literature databases and overviews, notably from Asian context, focusing
on Malaysia in particular. The objectives are to investigate the strategic angle of
sustainable urban development and to suggest better future urbanisation,
township and housing in Malaysia.
THEORETICAL FRAMEWORK
Reports with reviews on township, housing policy and trends have been published
in several countries. In the Malaysia, in particular, there are government
sponsored promotional publications about these particular topics such as the
Malaysia Plan Documents and the National Census. Meanwhile, in the
International arena, mostly these particular topics being covered by the World
Bank and UN-HABITAT are included for consideration. Planning for the
provision of housing through mixed development or otherwise would be
determined by the various policies set by the relevant authorities. In Malaysia,
there are four main guiding pillars for the nation to progress towards becoming a
high-income, developed nation by 2020 (EPU, 2015). These pillars are:
• 1 Malaysia Concept;
• Government Transformation Programme (GTP/PTK);
• New Economic Model; and
• Malaysia 5-Year Plans
Main Author/s Theme Phillimore (2017) & Weiss (2015) Housing Integration Kingsley (2017) & UN-HABITAT (2015) Housing Assistance Ong et al. (2017), UN (2014), EPU (2015), Song (2015) Economic Participation
Petit et al. (2018), Oberndorfer et al., 2007,
Satiennam, Jaensirisak, Satiennam, & Detdamrong (2016) & Gunawan (2015)
Technology & Design
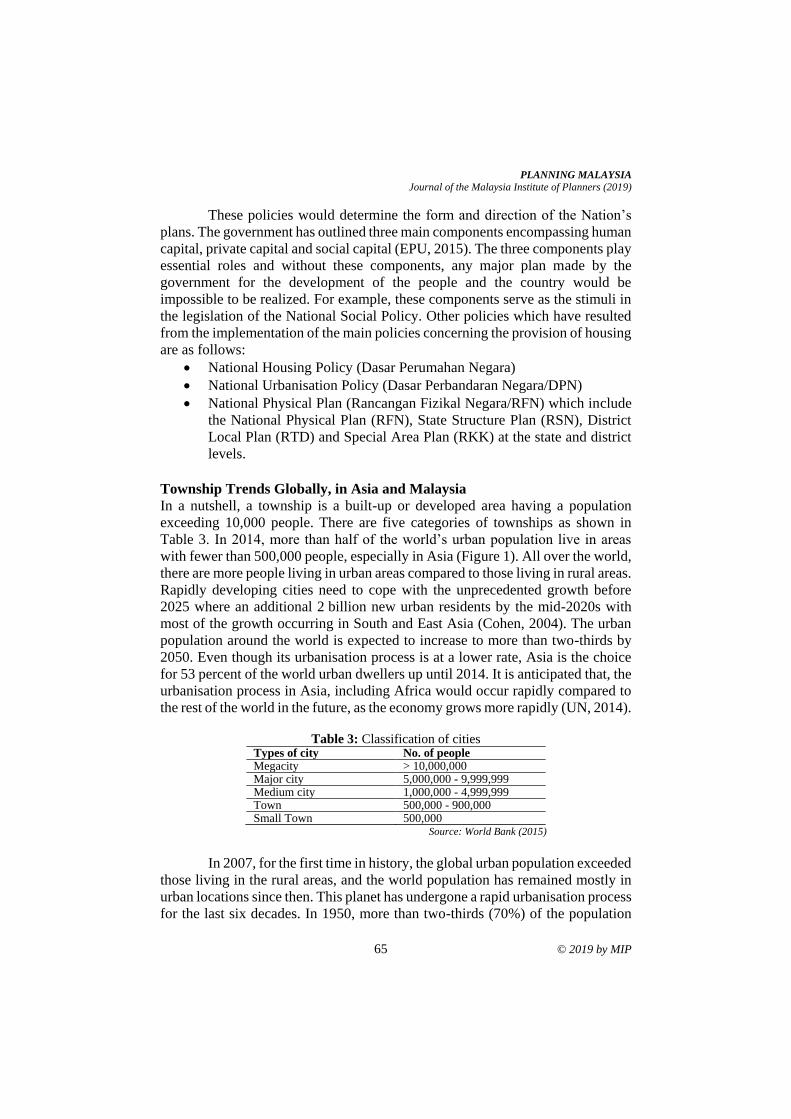
PLANNING MALAYSIA
Journal of the Malaysia Institute of Planners (2019)
65 © 2019 by MIP
These policies would determine the form and direction of the Nation’s
plans. The government has outlined three main components encompassing human
capital, private capital and social capital (EPU, 2015). The three components play
essential roles and without these components, any major plan made by the
government for the development of the people and the country would be
impossible to be realized. For example, these components serve as the stimuli in
the legislation of the National Social Policy. Other policies which have resulted
from the implementation of the main policies concerning the provision of housing
are as follows:
• National Housing Policy (Dasar Perumahan Negara)
• National Urbanisation Policy (Dasar Perbandaran Negara/DPN)
• National Physical Plan (Rancangan Fizikal Negara/RFN) which include
the National Physical Plan (RFN), State Structure Plan (RSN), District
Local Plan (RTD) and Special Area Plan (RKK) at the state and district
levels.
Township Trends Globally, in Asia and Malaysia
In a nutshell, a township is a built-up or developed area having a population
exceeding 10,000 people. There are five categories of townships as shown in
Table 3. In 2014, more than half of the world’s urban population live in areas
with fewer than 500,000 people, especially in Asia (Figure 1). All over the world,
there are more people living in urban areas compared to those living in rural areas.
Rapidly developing cities need to cope with the unprecedented growth before
2025 where an additional 2 billion new urban residents by the mid-2020s with
most of the growth occurring in South and East Asia (Cohen, 2004). The urban
population around the world is expected to increase to more than two-thirds by
2050. Even though its urbanisation process is at a lower rate, Asia is the choice
for 53 percent of the world urban dwellers up until 2014. It is anticipated that, the
urbanisation process in Asia, including Africa would occur rapidly compared to
the rest of the world in the future, as the economy grows more rapidly (UN, 2014).
Table 3: Classification of cities Types of city No. of people Megacity > 10,000,000 Major city 5,000,000 - 9,999,999 Medium city 1,000,000 - 4,999,999 Town 500,000 - 900,000 Small Town 500,000
Source: World Bank (2015)
In 2007, for the first time in history, the global urban population exceeded
those living in the rural areas, and the world population has remained mostly in
urban locations since then. This planet has undergone a rapid urbanisation process
for the last six decades. In 1950, more than two-thirds (70%) of the population
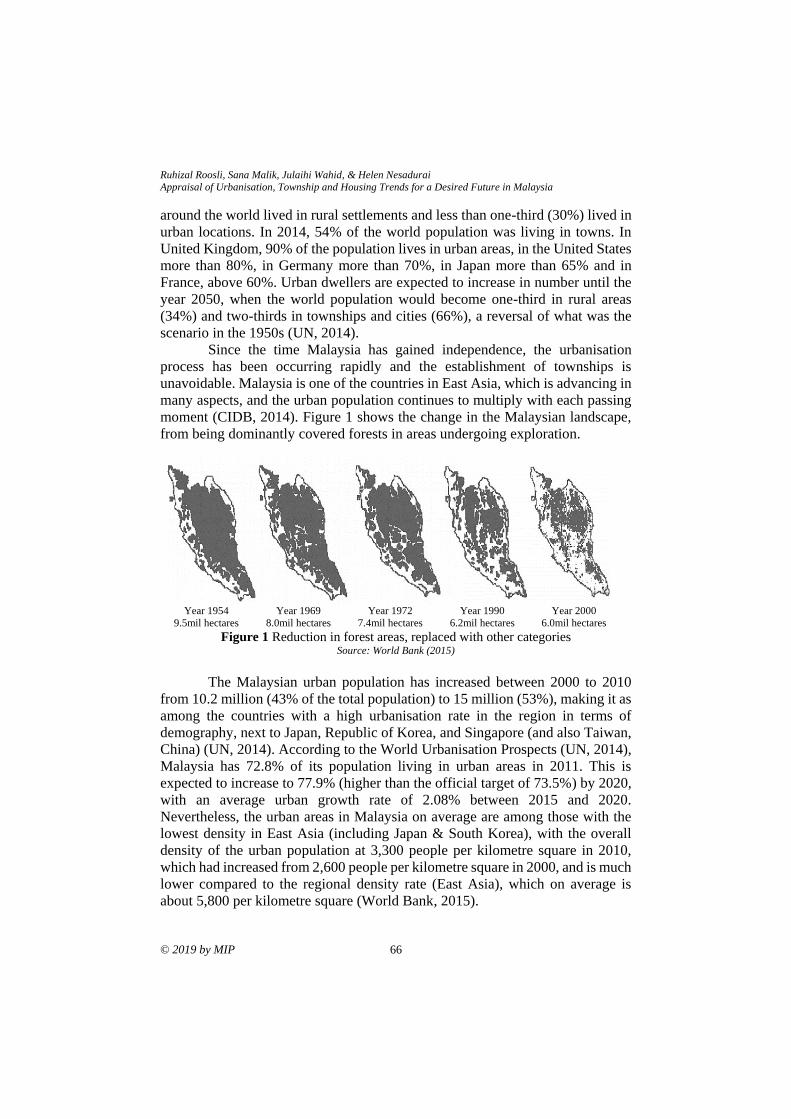
Ruhizal Roosli, Sana Malik, Julaihi Wahid, & Helen Nesadurai
Appraisal of Urbanisation, Township and Housing Trends for a Desired Future in Malaysia
© 2019 by MIP 66
around the world lived in rural settlements and less than one-third (30%) lived in
urban locations. In 2014, 54% of the world population was living in towns. In
United Kingdom, 90% of the population lives in urban areas, in the United States
more than 80%, in Germany more than 70%, in Japan more than 65% and in
France, above 60%. Urban dwellers are expected to increase in number until the
year 2050, when the world population would become one-third in rural areas
(34%) and two-thirds in townships and cities (66%), a reversal of what was the
scenario in the 1950s (UN, 2014).
Since the time Malaysia has gained independence, the urbanisation
process has been occurring rapidly and the establishment of townships is
unavoidable. Malaysia is one of the countries in East Asia, which is advancing in
many aspects, and the urban population continues to multiply with each passing
moment (CIDB, 2014). Figure 1 shows the change in the Malaysian landscape,
from being dominantly covered forests in areas undergoing exploration.
Figure 1 Reduction in forest areas, replaced with other categories Source: World Bank (2015)
The Malaysian urban population has increased between 2000 to 2010
from 10.2 million (43% of the total population) to 15 million (53%), making it as
among the countries with a high urbanisation rate in the region in terms of
demography, next to Japan, Republic of Korea, and Singapore (and also Taiwan,
China) (UN, 2014). According to the World Urbanisation Prospects (UN, 2014),
Malaysia has 72.8% of its population living in urban areas in 2011. This is
expected to increase to 77.9% (higher than the official target of 73.5%) by 2020,
with an average urban growth rate of 2.08% between 2015 and 2020.
Nevertheless, the urban areas in Malaysia on average are among those with the
lowest density in East Asia (including Japan & South Korea), with the overall
density of the urban population at 3,300 people per kilometre square in 2010,
which had increased from 2,600 people per kilometre square in 2000, and is much
lower compared to the regional density rate (East Asia), which on average is
about 5,800 per kilometre square (World Bank, 2015).
Year 1954
9.5mil hectares
Year 1969
8.0mil hectares
Year 1972
7.4mil hectares
Year 1990
6.2mil hectares
Year 2000
6.0mil hectares
PLANNING MALAYSIA
Journal of the Malaysia Institute of Planners (2019)
67 © 2019 by MIP
Until 2010, Malaysia has 19 urban areas with more than 100,000 people,
which comprised Kuala Lumpur (urban area with more than 5 million people);
George Town (between 1 million and 5 million people); Johor Bahru (5 urban
areas having between 500,000 to 1 million people); and 12 other urban areas
between 100,000 and 500,000 people. During the same period, the Kuala Lumpur
urban area was the largest in Malaysia and the eighth biggest in the East Asian
region, bigger than some of the urban megacity areas such as Jakarta, Manila, and
Seoul, although with fewer number of people. It increased from about 1,500 per
kilometre square to 1,700 between 2000 and 2010, with an average annual growth
rate of 1.2%, considered to be among the lowest growth rate for an urban area of
similar size in the region (JPM, 2011).
ANALYSIS & DISCUSSIONS
The Adaptation Process of Planning in Malaysia
In Malaysia, practically the international conventions as proposed by
international bodies would be adapted to suit the local conditions (UNDP-EPU,
2015). The concept of liveable towns or cities was also adapted from such
international standards. The concept of liveable townships firstly requires it to be
viewed from the perspective of the current practical planning framework. The
term liveability is usually used to portray the various shared aspects of society,
the surroundings, and the experiences that would shape the society. Liveability
brings into focus the human experiences in a particular place at a particular time.
There is an interconnectedness in this situation, among the economic, social and
spatial components which could be linked during the planning and development
stages. Thus, in the planning for the provision of housing, consideration needs to
be given to the combined components of the economic stimulus, spatial and social
aspects. In principle, from the viewpoint of planning and the provision of housing,
the combination of ‘housing assistance’ and ‘economic participation’ for the
public housing needs to be understood clearly (UN-HABITAT, 2015). At the
same time, the role of the private sector in providing housing in other categories
would also depend on market demands, as offering houses which are unsuitable
would lead to them being unsold.
For example, condominiums and apartment units built on the outskirts of
towns throughout the country faced difficulties of being sold within the first six
months after they were launched. It is a fact that, any housing development that
does not take into account the economic participation of the designated
population, the provision of such housing would be deemed a failure. This is due
to the lack of financial input from the local populace, which would impede the
dynamics of economic growth, and tend to have negative effects on social growth
(UN, 2014). For example, a housing development project needs to consider mixed
planning or economic stimulus activities in the surrounding areas. Mixed
Ruhizal Roosli, Sana Malik, Julaihi Wahid, & Helen Nesadurai
Appraisal of Urbanisation, Township and Housing Trends for a Desired Future in Malaysia
© 2019 by MIP 68
development would consist of components for housing, utilities and facilities,
commercial, industries, and institutions among others. Indirectly, there would be
a fair representation of activities for the population that would encourage pursuits
such as job opportunities, recreation, services and others of similar nature. Mixed
development in Malaysia has long been in practice. Previous research has also
shown that when amenities and commercial outlets are within walking distance
or under shelter from the main door of the housing unit to the outlets, the
percentage of foreclosures dropped drastically (Song, 2015). This means the
emphasis is on walkability within the housing area is important for the
development to be vibrant (Roosli & Collins, 2016).
The Future Challenges of Future Housing in Malaysia
Housing in the future for Malaysia will revolve around the theme of integration.
Integration of housing can be seen in two aspects, which is an integration of
housing as a township through the creation of smart cities (digital planning) and
the integration of housing at the personal level by designing smart homes
(Phillimore, 2017). Integration of housing as a satellite township shall be
supported by infrastructure for connectivity, facilities for conveniences (high-end
and high–touch), and comprehensive planning for township identity (Phillimore,
2017). On the other hand, integration of housing at the personal level is about
having houses that provide good quality of life with customised designs and
multi-purpose space. The result of this can be translated into three distinct ways
(Weiss, 2015). Firstly is the general evolution in the characteristics of housing
units. This will be seen as newer building methods and designs strive to overcome
increases in density and cost of land. Secondly, can be seen in the environment
around housing where cities will continue to mature and increase in density
allowing for viability of more public services and spending. Thirdly, the
combination of both ways in order to create a rapid increase in demand for certain
combination of housing units such as mixed developments to be discussed later.
As land becomes scarcer in urban areas, it is expected that future housing
units will be smaller in size. With that in mind, future housing estates that are
dense should be designed with more communal spaces, especially in high-rise
living to allow areas for people to engage in social activities. Vertical village
living with the ambience of on the ground setting is envisioned by urban planners
and architects as a solution for urban housing in Malaysia. Hence, more houses
will be designed to cater for lives where eating, resting, working and living are
brought together.
Increasing features for liveability will also be the mainstream in the
future. The connectivity of future housing should be seen within the same area
through building connectors that are either underground or linked through sky
bridges. This linkage will increase the walkability within an area and reduce the
need for cars. Currently, this trend is common among commercial and public
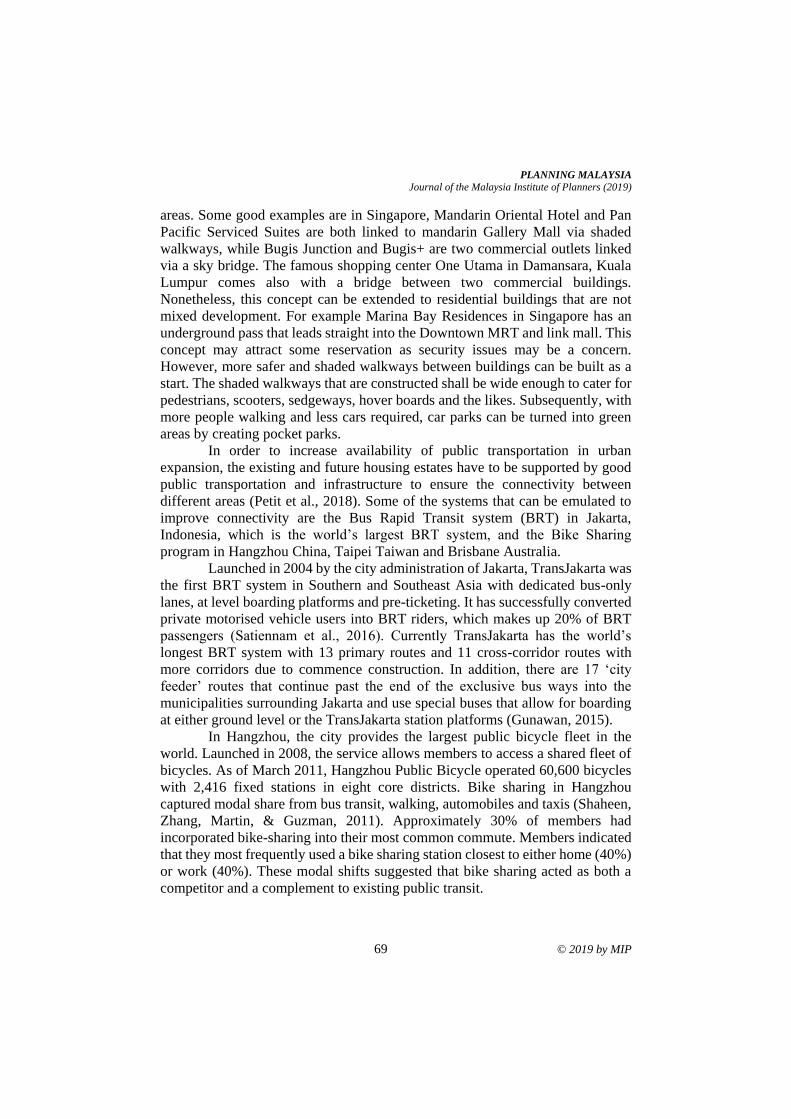
PLANNING MALAYSIA
Journal of the Malaysia Institute of Planners (2019)
69 © 2019 by MIP
areas. Some good examples are in Singapore, Mandarin Oriental Hotel and Pan
Pacific Serviced Suites are both linked to mandarin Gallery Mall via shaded
walkways, while Bugis Junction and Bugis+ are two commercial outlets linked
via a sky bridge. The famous shopping center One Utama in Damansara, Kuala
Lumpur comes also with a bridge between two commercial buildings.
Nonetheless, this concept can be extended to residential buildings that are not
mixed development. For example Marina Bay Residences in Singapore has an
underground pass that leads straight into the Downtown MRT and link mall. This
concept may attract some reservation as security issues may be a concern.
However, more safer and shaded walkways between buildings can be built as a
start. The shaded walkways that are constructed shall be wide enough to cater for
pedestrians, scooters, sedgeways, hover boards and the likes. Subsequently, with
more people walking and less cars required, car parks can be turned into green
areas by creating pocket parks.
In order to increase availability of public transportation in urban
expansion, the existing and future housing estates have to be supported by good
public transportation and infrastructure to ensure the connectivity between
different areas (Petit et al., 2018). Some of the systems that can be emulated to
improve connectivity are the Bus Rapid Transit system (BRT) in Jakarta,
Indonesia, which is the world’s largest BRT system, and the Bike Sharing
program in Hangzhou China, Taipei Taiwan and Brisbane Australia.
Launched in 2004 by the city administration of Jakarta, TransJakarta was
the first BRT system in Southern and Southeast Asia with dedicated bus-only
lanes, at level boarding platforms and pre-ticketing. It has successfully converted
private motorised vehicle users into BRT riders, which makes up 20% of BRT
passengers (Satiennam et al., 2016). Currently TransJakarta has the world’s
longest BRT system with 13 primary routes and 11 cross-corridor routes with
more corridors due to commence construction. In addition, there are 17 ‘city
feeder’ routes that continue past the end of the exclusive bus ways into the
municipalities surrounding Jakarta and use special buses that allow for boarding
at either ground level or the TransJakarta station platforms (Gunawan, 2015).
In Hangzhou, the city provides the largest public bicycle fleet in the
world. Launched in 2008, the service allows members to access a shared fleet of
bicycles. As of March 2011, Hangzhou Public Bicycle operated 60,600 bicycles
with 2,416 fixed stations in eight core districts. Bike sharing in Hangzhou
captured modal share from bus transit, walking, automobiles and taxis (Shaheen,
Zhang, Martin, & Guzman, 2011). Approximately 30% of members had
incorporated bike-sharing into their most common commute. Members indicated
that they most frequently used a bike sharing station closest to either home (40%)
or work (40%). These modal shifts suggested that bike sharing acted as both a
competitor and a complement to existing public transit.
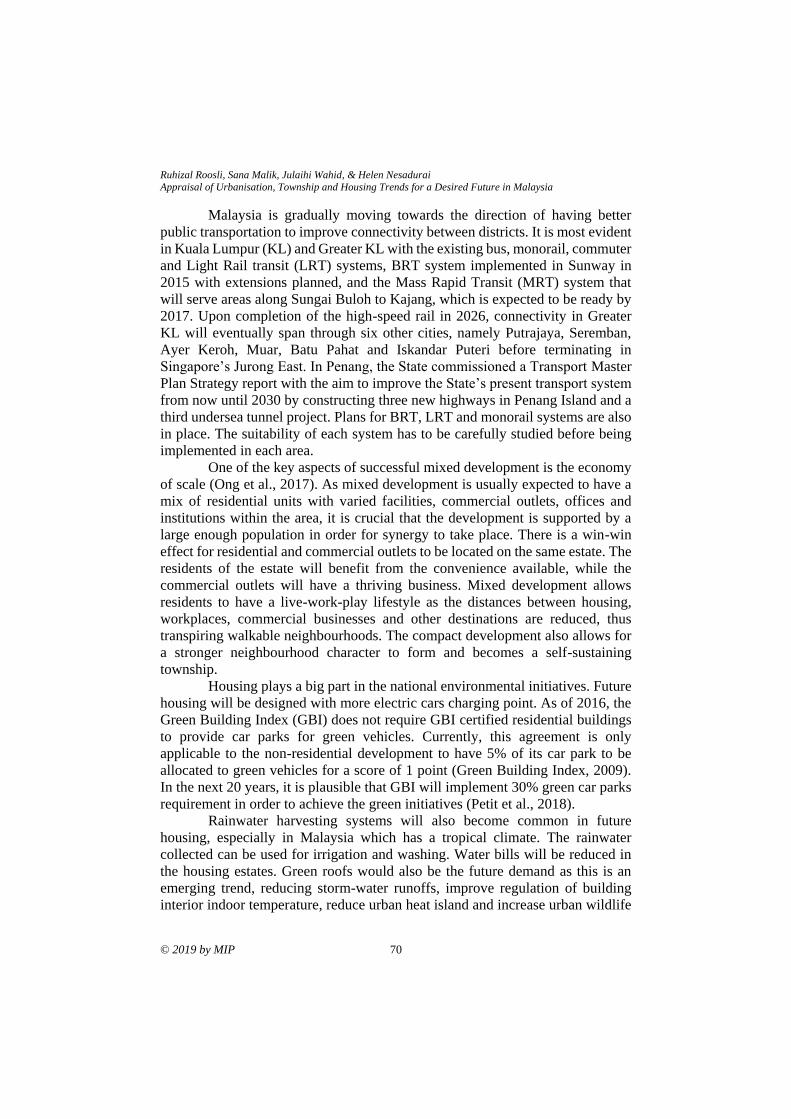
Ruhizal Roosli, Sana Malik, Julaihi Wahid, & Helen Nesadurai
Appraisal of Urbanisation, Township and Housing Trends for a Desired Future in Malaysia
© 2019 by MIP 70
Malaysia is gradually moving towards the direction of having better
public transportation to improve connectivity between districts. It is most evident
in Kuala Lumpur (KL) and Greater KL with the existing bus, monorail, commuter
and Light Rail transit (LRT) systems, BRT system implemented in Sunway in
2015 with extensions planned, and the Mass Rapid Transit (MRT) system that
will serve areas along Sungai Buloh to Kajang, which is expected to be ready by
2017. Upon completion of the high-speed rail in 2026, connectivity in Greater
KL will eventually span through six other cities, namely Putrajaya, Seremban,
Ayer Keroh, Muar, Batu Pahat and Iskandar Puteri before terminating in
Singapore’s Jurong East. In Penang, the State commissioned a Transport Master
Plan Strategy report with the aim to improve the State’s present transport system
from now until 2030 by constructing three new highways in Penang Island and a
third undersea tunnel project. Plans for BRT, LRT and monorail systems are also
in place. The suitability of each system has to be carefully studied before being
implemented in each area.
One of the key aspects of successful mixed development is the economy
of scale (Ong et al., 2017). As mixed development is usually expected to have a
mix of residential units with varied facilities, commercial outlets, offices and
institutions within the area, it is crucial that the development is supported by a
large enough population in order for synergy to take place. There is a win-win
effect for residential and commercial outlets to be located on the same estate. The
residents of the estate will benefit from the convenience available, while the
commercial outlets will have a thriving business. Mixed development allows
residents to have a live-work-play lifestyle as the distances between housing,
workplaces, commercial businesses and other destinations are reduced, thus
transpiring walkable neighbourhoods. The compact development also allows for
a stronger neighbourhood character to form and becomes a self-sustaining
township.
Housing plays a big part in the national environmental initiatives. Future
housing will be designed with more electric cars charging point. As of 2016, the
Green Building Index (GBI) does not require GBI certified residential buildings
to provide car parks for green vehicles. Currently, this agreement is only
applicable to the non-residential development to have 5% of its car park to be
allocated to green vehicles for a score of 1 point (Green Building Index, 2009).
In the next 20 years, it is plausible that GBI will implement 30% green car parks
requirement in order to achieve the green initiatives (Petit et al., 2018).
Rainwater harvesting systems will also become common in future
housing, especially in Malaysia which has a tropical climate. The rainwater
collected can be used for irrigation and washing. Water bills will be reduced in
the housing estates. Green roofs would also be the future demand as this is an
emerging trend, reducing storm-water runoffs, improve regulation of building
interior indoor temperature, reduce urban heat island and increase urban wildlife
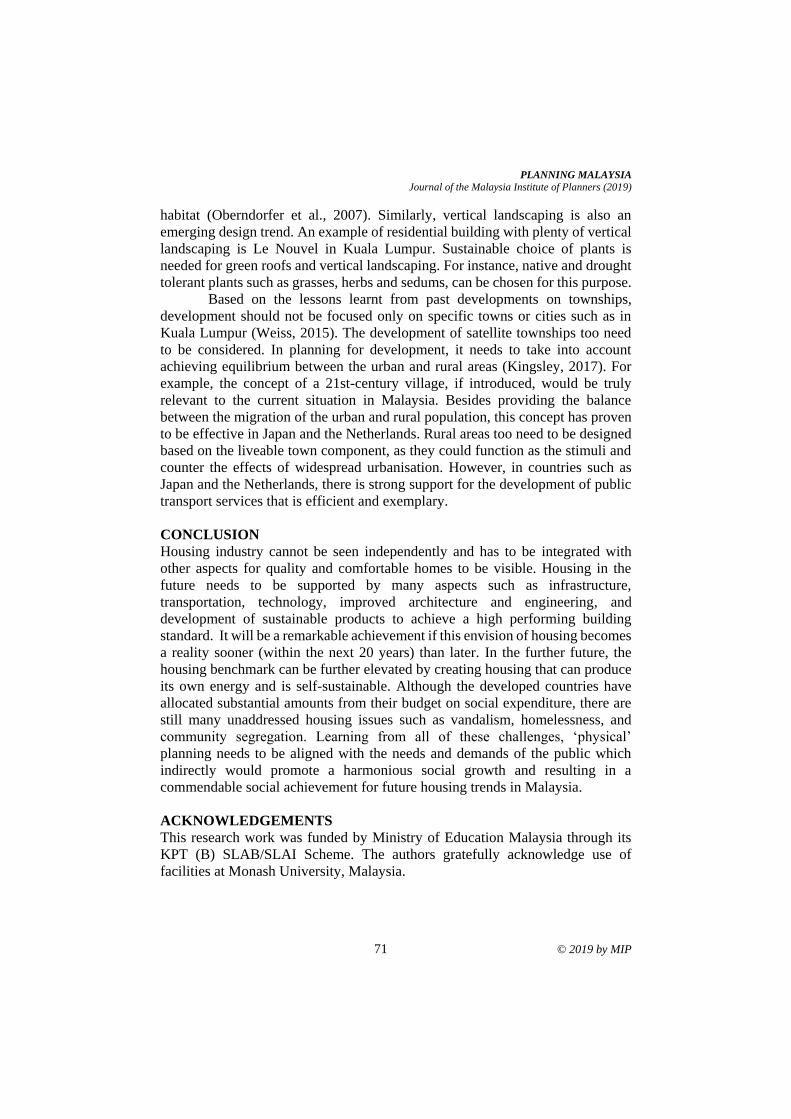
PLANNING MALAYSIA
Journal of the Malaysia Institute of Planners (2019)
71 © 2019 by MIP
habitat (Oberndorfer et al., 2007). Similarly, vertical landscaping is also an
emerging design trend. An example of residential building with plenty of vertical
landscaping is Le Nouvel in Kuala Lumpur. Sustainable choice of plants is
needed for green roofs and vertical landscaping. For instance, native and drought
tolerant plants such as grasses, herbs and sedums, can be chosen for this purpose.
Based on the lessons learnt from past developments on townships,
development should not be focused only on specific towns or cities such as in
Kuala Lumpur (Weiss, 2015). The development of satellite townships too need
to be considered. In planning for development, it needs to take into account
achieving equilibrium between the urban and rural areas (Kingsley, 2017). For
example, the concept of a 21st-century village, if introduced, would be truly
relevant to the current situation in Malaysia. Besides providing the balance
between the migration of the urban and rural population, this concept has proven
to be effective in Japan and the Netherlands. Rural areas too need to be designed
based on the liveable town component, as they could function as the stimuli and
counter the effects of widespread urbanisation. However, in countries such as
Japan and the Netherlands, there is strong support for the development of public
transport services that is efficient and exemplary.
CONCLUSION
Housing industry cannot be seen independently and has to be integrated with
other aspects for quality and comfortable homes to be visible. Housing in the
future needs to be supported by many aspects such as infrastructure,
transportation, technology, improved architecture and engineering, and
development of sustainable products to achieve a high performing building
standard. It will be a remarkable achievement if this envision of housing becomes
a reality sooner (within the next 20 years) than later. In the further future, the
housing benchmark can be further elevated by creating housing that can produce
its own energy and is self-sustainable. Although the developed countries have
allocated substantial amounts from their budget on social expenditure, there are
still many unaddressed housing issues such as vandalism, homelessness, and
community segregation. Learning from all of these challenges, ‘physical’
planning needs to be aligned with the needs and demands of the public which
indirectly would promote a harmonious social growth and resulting in a
commendable social achievement for future housing trends in Malaysia.
ACKNOWLEDGEMENTS
This research work was funded by Ministry of Education Malaysia through its
KPT (B) SLAB/SLAI Scheme. The authors gratefully acknowledge use of
facilities at Monash University, Malaysia.
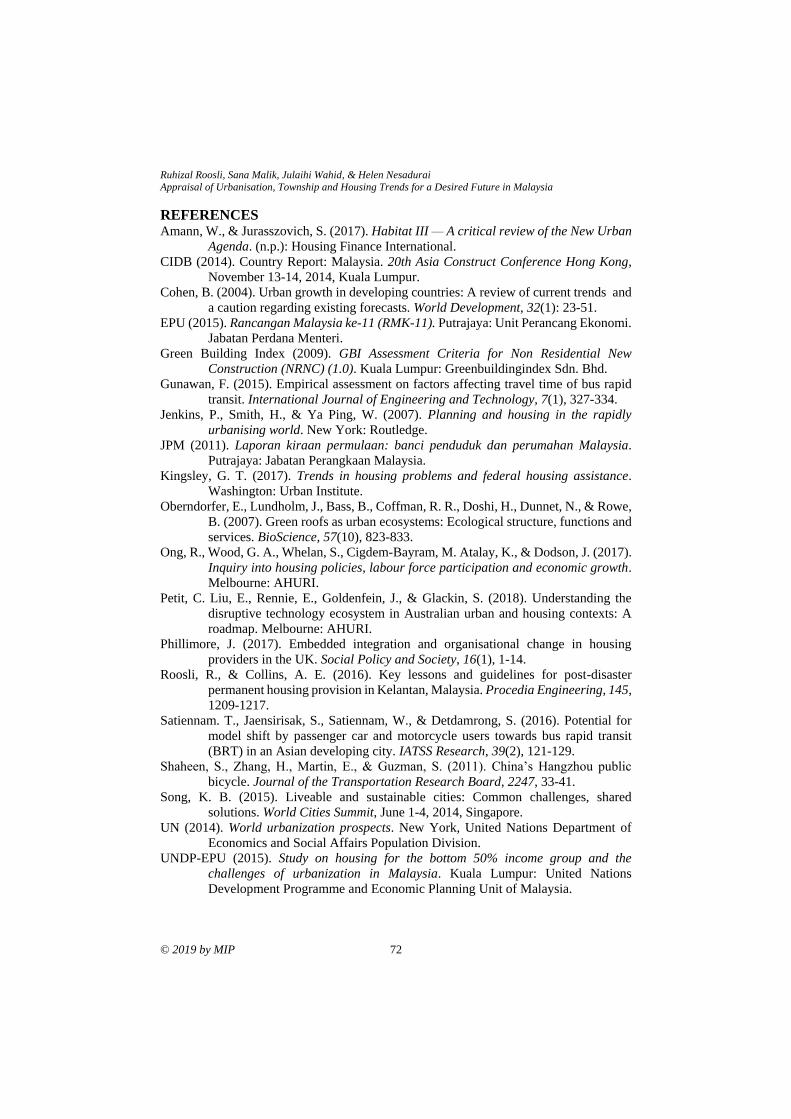
Ruhizal Roosli, Sana Malik, Julaihi Wahid, & Helen Nesadurai
Appraisal of Urbanisation, Township and Housing Trends for a Desired Future in Malaysia
© 2019 by MIP 72
REFERENCES Amann, W., & Jurasszovich, S. (2017). Habitat III — A critical review of the New Urban
Agenda. (n.p.): Housing Finance International.
CIDB (2014). Country Report: Malaysia. 20th Asia Construct Conference Hong Kong,
November 13-14, 2014, Kuala Lumpur.
Cohen, B. (2004). Urban growth in developing countries: A review of current trends and
a caution regarding existing forecasts. World Development, 32(1): 23-51.
EPU (2015). Rancangan Malaysia ke-11 (RMK-11). Putrajaya: Unit Perancang Ekonomi.
Jabatan Perdana Menteri.
Green Building Index (2009). GBI Assessment Criteria for Non Residential New
Construction (NRNC) (1.0). Kuala Lumpur: Greenbuildingindex Sdn. Bhd.
Gunawan, F. (2015). Empirical assessment on factors affecting travel time of bus rapid
transit. International Journal of Engineering and Technology, 7(1), 327-334.
Jenkins, P., Smith, H., & Ya Ping, W. (2007). Planning and housing in the rapidly
urbanising world. New York: Routledge.
JPM (2011). Laporan kiraan permulaan: banci penduduk dan perumahan Malaysia.
Putrajaya: Jabatan Perangkaan Malaysia.
Kingsley, G. T. (2017). Trends in housing problems and federal housing assistance.
Washington: Urban Institute.
Oberndorfer, E., Lundholm, J., Bass, B., Coffman, R. R., Doshi, H., Dunnet, N., & Rowe,
B. (2007). Green roofs as urban ecosystems: Ecological structure, functions and
services. BioScience, 57(10), 823-833.
Ong, R., Wood, G. A., Whelan, S., Cigdem-Bayram, M. Atalay, K., & Dodson, J. (2017).
Inquiry into housing policies, labour force participation and economic growth.
Melbourne: AHURI.
Petit, C. Liu, E., Rennie, E., Goldenfein, J., & Glackin, S. (2018). Understanding the
disruptive technology ecosystem in Australian urban and housing contexts: A
roadmap. Melbourne: AHURI.
Phillimore, J. (2017). Embedded integration and organisational change in housing
providers in the UK. Social Policy and Society, 16(1), 1-14.
Roosli, R., & Collins, A. E. (2016). Key lessons and guidelines for post-disaster
permanent housing provision in Kelantan, Malaysia. Procedia Engineering, 145,
1209-1217.
Satiennam. T., Jaensirisak, S., Satiennam, W., & Detdamrong, S. (2016). Potential for
model shift by passenger car and motorcycle users towards bus rapid transit
(BRT) in an Asian developing city. IATSS Research, 39(2), 121-129.
Shaheen, S., Zhang, H., Martin, E., & Guzman, S. (2011). China’s Hangzhou public
bicycle. Journal of the Transportation Research Board, 2247, 33-41.
Song, K. B. (2015). Liveable and sustainable cities: Common challenges, shared
solutions. World Cities Summit, June 1-4, 2014, Singapore.
UN (2014). World urbanization prospects. New York, United Nations Department of
Economics and Social Affairs Population Division.
UNDP-EPU (2015). Study on housing for the bottom 50% income group and the
challenges of urbanization in Malaysia. Kuala Lumpur: United Nations
Development Programme and Economic Planning Unit of Malaysia.

PLANNING MALAYSIA
Journal of the Malaysia Institute of Planners (2019)
73 © 2019 by MIP
UN-HABITAT (2015). Green building interventions for social housing. Nairobi: UN-
HABITAT.
Weiss, M. L. (2015). Handbook of contemporary Malaysia. New York: Routledge.
World Bank (2015). East Asia’s changing urban landscape measuring a decade of spatial
growth. Washington: World Bank Group
Received: 30th November 2018. Accepted: 19th August 2019
1Student at University. Email: [email protected] 74
PLANNING MALAYSIA:
Journal of the Malaysian Institute of Planners
VOLUME 17 ISSUE 2 (2019), Page 74 – 91
SERVICE CATCHMENT OF MASS RAPID TRANSIT (MRT) FEEDER
BUS: A PRELIMINARY STUDY OF T461 ROUTE TAMAN KAJANG
UTAMA
Chloe Aida Lim Jhin Lin1 & Zakiah Ponrahono2
1,2Faculty of Environmental Studies
UNIVERSITI PUTRA MALAYSIA
Abstract
The planning and development of rail services require various considerations.
Land availability, land use, catchment, route matching, infrastructure fitting,
barrier free and micro-climate friendly designs are some of the factors heeded
prior to such installations. A deviation between designated and highly demanded
service area in urban sprawl zones of the city has been occurring in many
Malaysian cities. These gaps have led to the mismatch between origin/destination
of passengers and planned locations of train stations and its feeder bus stops. As
such, rail services become less accessible to populations with the highest
demands. This paper discusses the preliminary findings from a pilot study which
seeks to calibrate the research instrument and validate preliminary findings before
actual data collection for the purpose of determining the service catchment of the
T461 feeder bus in Kajang MRT Station. The Garmin GPS device acts as the
research instrument to obtain coordinates of locations where passengers board
and alight feeder buses. On-board surveys and comparison analyses are methods
that have been used to obtain the optimum GPS coordinates of the bus stop
locations. The preliminary findings indicate that the research instrument is ready
to be used for actual data collection and geospatial analysis to determine the
service catchment of the T461 feeder bus service.
Keywords: Feeder bus, service catchment, urban rail transit
PLANNING MALAYSIA
Journal of the Malaysia Institute of Planners (2019)
75 © 2019 by MIP
INTRODUCTION
The planning and development of rail services require various considerations.
Land availability, land use, catchment, route matching, infrastructure fitting,
barrier free and micro-climate-friendly designs are some of the factors heeded
prior to such installations. A deviation between designated and highly demanded
service areas in urban sprawl zones of the city has been occurring in many
Malaysian cities. These gaps have led to the mismatch between origin/destination
of passengers and planned locations of train stations and its feeder bus stops. As
such, rail services become less accessible to populations with the highest
demands. Whilst many types of bus services are provided to varying degrees in
Malaysia, less has been prioritised on ensuring the feeder bus system’s
integration, coordination and monitoring to reach an efficient level of
sustainability (Hayashi, Doi, Yagishita, & Kuwata, 2004).
Rail lines provide maximum efficiency when it comes to transporting a
huge number of passengers in the most convenient way, whereas feeder bus
routes provide a platform for passengers to travel from bus stops to rail line
stations. It is important that the designated feeder bus routes and stops provided
along the route is planned and located in a way that uses the least cost, while
serving a sufficient number of passengers to a satisfactory level. Nevertheless,
several issues in feeder bus services such as the lack of facilities, low passenger
trips and long waiting times still occur. Therefore, the feeder bus route design is
the first and most important step in the planning procedure. A good bus route
network with high coverage and high accessibility will increase the quality of
service for a travelling passenger (Almasi, Sadollah, Oh, Kim, & Kang, 2018;
Almasi, Mounes, Koting, & Karim, 2014).
Service Catchment
To access the transit network, passengers have to travel to stations either by
walking, cycling and public or private transportation. These stations are meant to
be located at strategic locations that have catchment areas of high potential
travellers. Vuchic (2005) suggests that maximising area coverage is a crucial goal
in the design of rail network, as the frequency of usage depends on how easily
accessible the stations are to potential travellers. Catchment areas are generally
defined as the maximum walking distance or acceptable walking distance, of
which the passengers are willing to walk rather than drive (Pongprasert & Kubota,
2017).
In 1929, American architect Clarence Perry (as cited in Asfour & Zourob,
2017) articulated the neighbourhood unit concept as a part of the published
Regional Plan of New York. The concept stemmed from Perry’s interest to create
functional, safe and attractive neighbourhoods for middle and upper-income
nuclear families with children, and also to remedy the ill-effects of heavy
vehicular traffic (LeGates & Stout, 2011; Meenakshi, 2011). The neighbourhood
Chloe Aida Lim Jhin Lin & Zakiah Ponrahono
Service Catchment of MRT Feeder Bus: A Preliminary Study of T461 Route Taman Kajang Utama
© 2019 by MIP 76
concept depicts the relationship between residential components of a
neighbourhood based on a five-minute walking radius, which is within 400
meters (Khalid, n.d.). Perry’s concept has contributed tremendously in the field
of urban planning in cities as a basic guideline for acceptable walking distances
in a neighbourhood. However, the neighbourhood unit concept has also raised
questions and criticisms globally as to what extent is this method is responsive to
local housing needs. Based on several studies (as cited in Asfour & Zourob,
2017), recent social changes and diverse lifestyles, self-sufficiency, and cross-
neighbourhood walkability are determinants of walking behaviours and distances
that are acceptable by the residents.
In the public transit industry, service catchment guidelines are commonly
based on buffers at 400 meters around bus stops and 800 meters around rail
stations (El-Geneidy, Grimsrud, Wasfi, Tétreault, & Surprenant-Legault, 2014).
In the Malaysian context, the Green Neighbourhood Guidelines developed by
PLANMalaysia stated that for human movement in a neighbourhood, common
facilities such as bus stops are to be placed in walkable locations that are within
400 meters or a five minute walk, and transit stations to be located within 800
meters or a ten minute walk. However, acceptable walking distances depend on
many factors and differ between communities. Azmi and Karim (2011) found that
residents in Shah Alam tend to walk a maximum distance of 200 meters to reach
community facilities before deciding to drive. Moreover, Sukor and Fisal (2018)
discovered that respondents in Penang Island are willing to walk an average
distance of 600 meters to access bus services, with the average time travelled to
be around 20 minutes. In Singapore, it is found that about 60% of MRT
passengers walked to the stations with an average walking distance of 608 meters
(Olszewski & Wibowo, 2005).
The willingness to walk varies for different countries and cities due to
the many factors that influence acceptable walking distance, such as gender, age,
income and weather (Johar, Jain, Garg, & Gundaliya, 2015). El-Geneidy et al.
(2014) concluded that service areas around transit stations should vary based on
the service offered and attributes of the people and places served.
‘Ped shed’ (pedestrian shed) is a terminology used to explain the
percentage or ratio of pedestrian accessible areas. Quoting the definition of Ped
shed in the New Lynn Urban Plan, “Ped sheds are often defined as the area
covered by a 5-minute walk (about 400 to 500 meters or a ten minute walk – 800
to 1000 meters)” (New Zealand, Auckland Council, 2010, p. 181). Ped sheds can
also be defined as walkable catchments in maps showing the actual area within a
five minute walking distance from any centre, or ten minutes from major transit
stops such as a railway station. The Ped shed analysis technique has been used
widely to assess the walkability of a neighbourhood and is a comparative
evaluation of movement in an urban area from residential areas to common
facilities (Active Healthy Communities, 2014).
PLANNING MALAYSIA
Journal of the Malaysia Institute of Planners (2019)
77 © 2019 by MIP
Good Design of Feeder Bus System
A well-designed route network can improve the efficiency of the feeder bus
system and reduce total costs of supplying the transit service (Salvo & Sabatini,
2014; Lovett, Haynes, Sünnenberg, & Gale, 2002). The route network should be
designed in a way that utilises and fully maximises the catchment areas of the
station (Shi, Blainer, & Hounsell, 2017). Besides route networks, bus operations
should follow designated feeder bus routes and stops for passengers’ access and
egress points, to avoid inefficient transit services and inconvenience to the
passengers. The bus stop facilities should also meet the passengers’ needs, such
as the provision of a shade and bench for passengers to sit while waiting for the
bus to arrive. The lack of facilities will decrease the level of satisfaction of bus
transit for the passengers, which may lead to them choosing other means of
transportation.
The feeder bus is a public transit service for the connection of local areas,
where the demand for bus services has to be gathered and transferred to the main
stop, which is usually a transit hub or terminal, such as a rapid rail transit station
or an express bus terminal (Ciaffi, Cipriani, & Petrelli, 2012). Feeder buses also
provide services to transport passengers between the outskirts of a city to the
urban centre. Inefficient feeder bus services can impede access to better housing,
employment and income opportunities (O’Connor & Caulfield, 2017) and lessen
the level of service of the rail system. The current feeder bus system adopted in
many urban routes is not appropriate for the urban settlement forms, as well as
the socio-demographic and trip characteristics of the communities (Almasi et al.,
2014). Many advantageous measures of bus priority as applied in developed
countries have not been adopted in assessing feeder bus service levels in Malaysia
(Advani & Tiwari, 2006). Several contemporary studies have propagated the use
of the following variables to assess a bus service’s sustainability levels: the
number of bus fleets, the route coverage of bus operations, the percentage of main
land use activity points covered by designated routes, the bus speed and
schedules/route adherence, the passenger load factors, as well as service durations
and time periods of service provision (Almanis et al., 2014; Ciaffi et al., 2012;
Huang, Liu, Huang, & Shen, 2010); yet, such studies are lacking in the
contemporary research of feeder bus services quality in Malaysia, especially in
evaluating the effectiveness and quality of feeder bus performance. Focusing on
the service catchment of feeder bus services and whether the placement of bus
stops maximise coverage while avoiding gap redundancies, a case study in
Malaysia’s urban area can be considered useful to illustrate an assessment of
feeder bus services and the land use transport strategy.
This study concerns the location and design of feeder bus stops as the
two parameters that influence rail service system performance, as well as the
safety and security of passengers. The environment and placement of bus stops
are also essential in enhancing passengers’ comfort, convenience and favourable
Chloe Aida Lim Jhin Lin & Zakiah Ponrahono
Service Catchment of MRT Feeder Bus: A Preliminary Study of T461 Route Taman Kajang Utama
© 2019 by MIP 78
waiting experiences, as well as buses’ reliability and accessibility. This study
assesses the current system of feeder bus services in supplementing rail services
in urban areas of Malaysia. In this context, therefore, the overall aim of this
research is to obtain the service catchment gap of planned feeder bus routes.
This paper discusses the preliminary findings on the existing operations
of the feeder bus service in Kajang MRT station based on a pilot study that took
place on a Wednesday during morning off-peak hours. The purpose of the pilot
study is to test and calibrate the research instrument. A preliminary discussion on
issues related to existing feeder bus operation, services and recommendations is
drawn in this paper, focusing on data based upon the on-board survey and
interviews.
MATERIALS AND METHODS
To determine the service catchment of the T461 feeder bus service, the research
instrument plays an important role in the collection and analysis of data. For this
study, the main research instrument required is a global positioning system (GPS)
device. To calibrate the GPS device, a pilot study was conducted through an on-
board survey method, whereby the GPS coordinates of the locations when
passengers board and alight the feeder bus are recorded. The pilot study consists
of three repetitive trips along the T461 feeder bus route, covering the Taman
Kajang Utama area. The GPS coordinates were recorded during each trip to
calibrate the research instrument. The pilot study took place on a Wednesday
morning off-peak hour, to avoid peak hours as the purpose of the pilot study is to
calibrate the research instrument. To validate the accuracy of the GPS coordinates
recorded, the coordinates recorded for each trip are compared with actual
coordinates of the bus stops found on the Google Maps service.
For this paper, results and discussions are focussed on the pilot study,
which is based on data collected through an on-board survey to obtain GPS
coordinates of the passengers’ boarding and alighting locations.
On-board survey
To determine the service catchment of the T461 feeder bus service, data
collection involves identifying the locations of the designated bus stops along the
bus route by utilizing the GPS device. This is done to analyse the service
catchment areas of each bus stop through spatial analysis, which requires exact
locations of the bus stops.
Besides that, data collection will also include the manual counting of
passengers boarding and alighting the feeder bus during different times
throughout the day to determine and compare the frequency of use of the feeder
bus service. The evaluation is conducted by collecting data over several bus trip
sessions, consisting of the first trip of the day, during the morning peak hour
(from 7.00am until 9.00am), afternoon peak hour (from 12.30pm until 2.30pm),
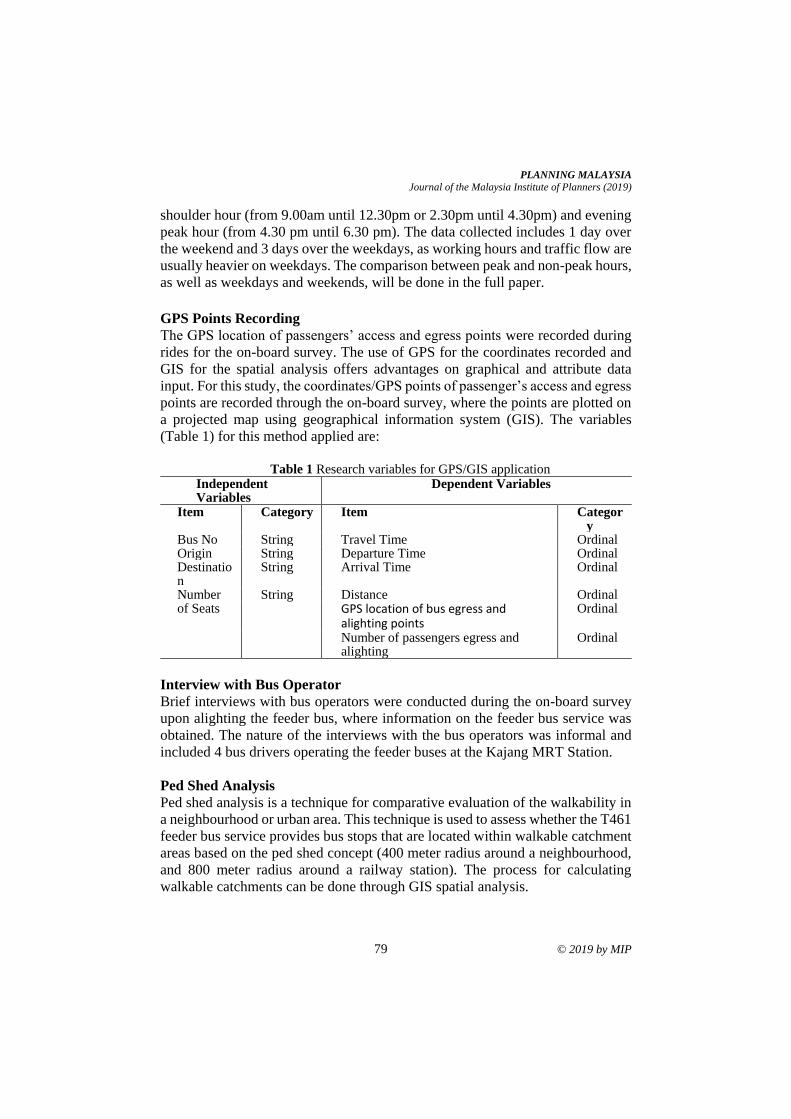
PLANNING MALAYSIA
Journal of the Malaysia Institute of Planners (2019)
79 © 2019 by MIP
shoulder hour (from 9.00am until 12.30pm or 2.30pm until 4.30pm) and evening
peak hour (from 4.30 pm until 6.30 pm). The data collected includes 1 day over
the weekend and 3 days over the weekdays, as working hours and traffic flow are
usually heavier on weekdays. The comparison between peak and non-peak hours,
as well as weekdays and weekends, will be done in the full paper.
GPS Points Recording
The GPS location of passengers’ access and egress points were recorded during
rides for the on-board survey. The use of GPS for the coordinates recorded and
GIS for the spatial analysis offers advantages on graphical and attribute data
input. For this study, the coordinates/GPS points of passenger’s access and egress
points are recorded through the on-board survey, where the points are plotted on
a projected map using geographical information system (GIS). The variables
(Table 1) for this method applied are:
Table 1 Research variables for GPS/GIS application
Independent Variables
Dependent Variables
Item Category Item Category
Bus No String Travel Time Ordinal Origin String Departure Time Ordinal Destination
String Arrival Time Ordinal
Number of Seats
String Distance Ordinal GPS location of bus egress and alighting points
Ordinal
Number of passengers egress and alighting
Ordinal
Interview with Bus Operator
Brief interviews with bus operators were conducted during the on-board survey
upon alighting the feeder bus, where information on the feeder bus service was
obtained. The nature of the interviews with the bus operators was informal and
included 4 bus drivers operating the feeder buses at the Kajang MRT Station.
Ped Shed Analysis
Ped shed analysis is a technique for comparative evaluation of the walkability in
a neighbourhood or urban area. This technique is used to assess whether the T461
feeder bus service provides bus stops that are located within walkable catchment
areas based on the ped shed concept (400 meter radius around a neighbourhood,
and 800 meter radius around a railway station). The process for calculating
walkable catchments can be done through GIS spatial analysis.
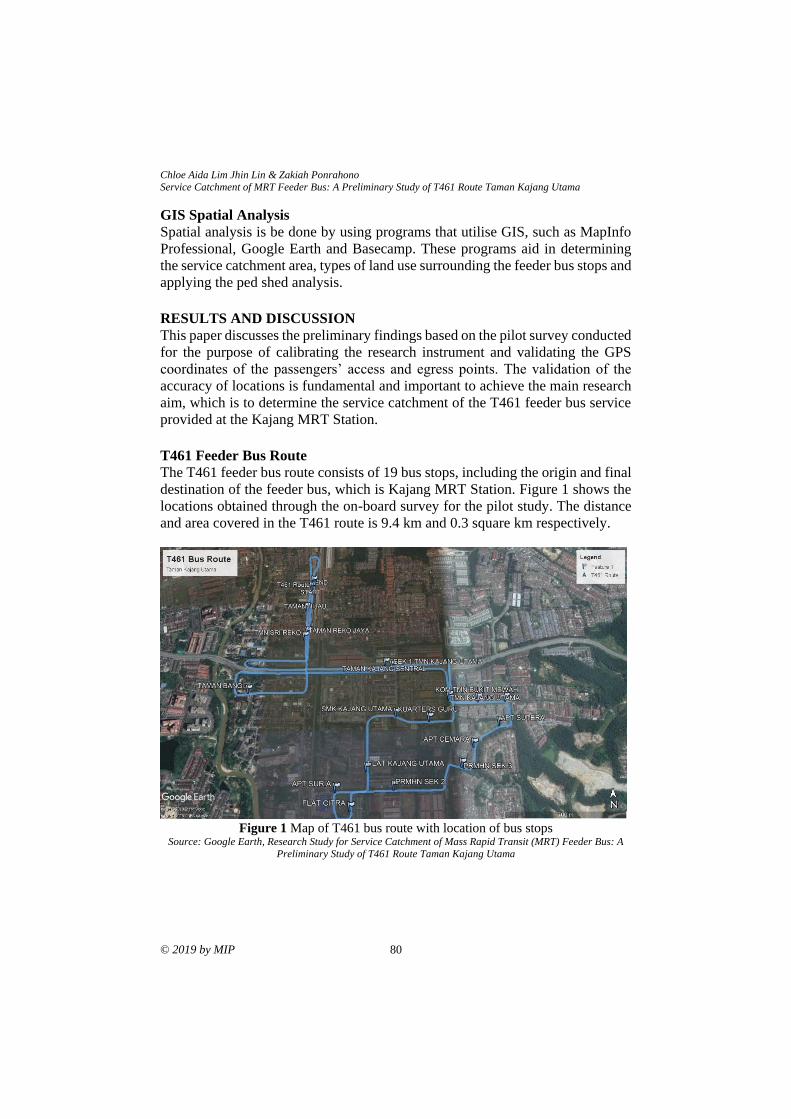
Chloe Aida Lim Jhin Lin & Zakiah Ponrahono
Service Catchment of MRT Feeder Bus: A Preliminary Study of T461 Route Taman Kajang Utama
© 2019 by MIP 80
GIS Spatial Analysis
Spatial analysis is be done by using programs that utilise GIS, such as MapInfo
Professional, Google Earth and Basecamp. These programs aid in determining
the service catchment area, types of land use surrounding the feeder bus stops and
applying the ped shed analysis.
RESULTS AND DISCUSSION
This paper discusses the preliminary findings based on the pilot survey conducted
for the purpose of calibrating the research instrument and validating the GPS
coordinates of the passengers’ access and egress points. The validation of the
accuracy of locations is fundamental and important to achieve the main research
aim, which is to determine the service catchment of the T461 feeder bus service
provided at the Kajang MRT Station.
T461 Feeder Bus Route
The T461 feeder bus route consists of 19 bus stops, including the origin and final
destination of the feeder bus, which is Kajang MRT Station. Figure 1 shows the
locations obtained through the on-board survey for the pilot study. The distance
and area covered in the T461 route is 9.4 km and 0.3 square km respectively.
Figure 1 Map of T461 bus route with location of bus stops
Source: Google Earth, Research Study for Service Catchment of Mass Rapid Transit (MRT) Feeder Bus: A
Preliminary Study of T461 Route Taman Kajang Utama
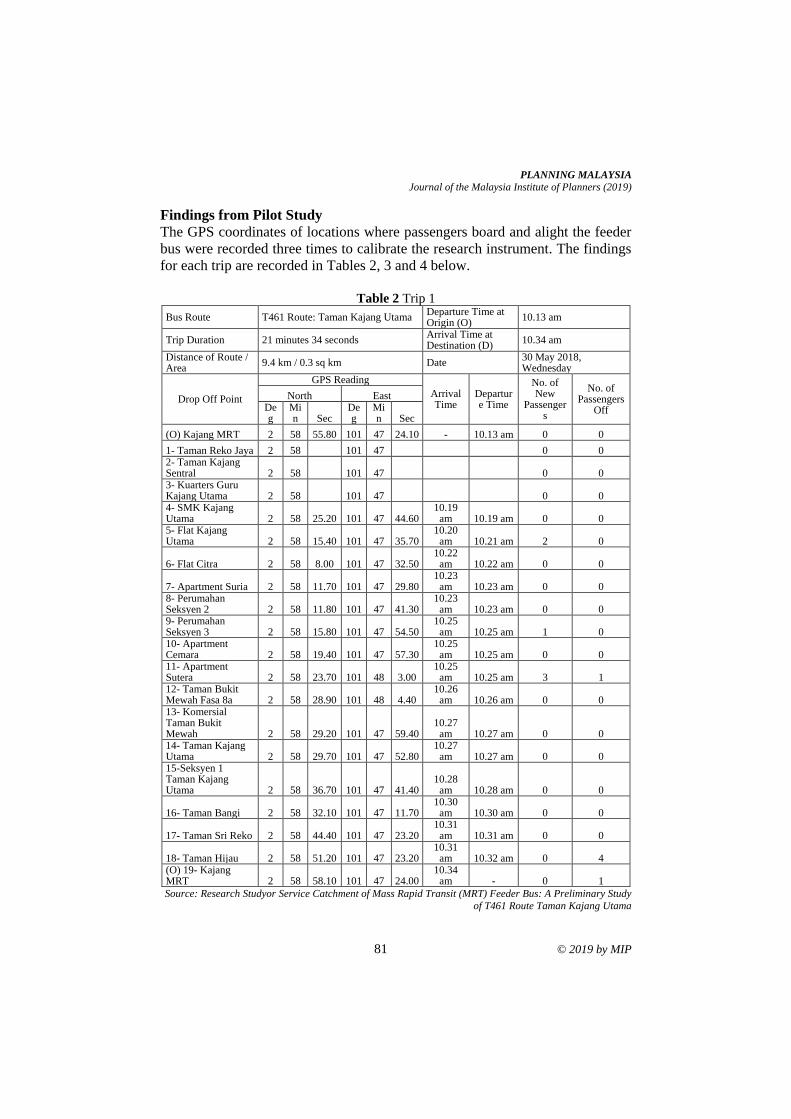
PLANNING MALAYSIA
Journal of the Malaysia Institute of Planners (2019)
81 © 2019 by MIP
Findings from Pilot Study
The GPS coordinates of locations where passengers board and alight the feeder
bus were recorded three times to calibrate the research instrument. The findings
for each trip are recorded in Tables 2, 3 and 4 below.
Table 2 Trip 1
Bus Route T461 Route: Taman Kajang Utama Departure Time at Origin (O)
10.13 am
Trip Duration 21 minutes 34 seconds Arrival Time at Destination (D)
10.34 am
Distance of Route / Area
9.4 km / 0.3 sq km Date 30 May 2018, Wednesday
Drop Off Point
GPS Reading
Arrival Time
Departure Time
No. of New
Passengers
No. of Passengers
Off
North East Deg
Min Sec
Deg
Min Sec
(O) Kajang MRT 2 58 55.80 101 47 24.10 - 10.13 am 0 0
1- Taman Reko Jaya 2 58 101 47 0 0 2- Taman Kajang Sentral 2 58 101 47 0 0 3- Kuarters Guru Kajang Utama 2 58 101 47 0 0 4- SMK Kajang Utama 2 58 25.20 101 47 44.60
10.19 am 10.19 am 0 0
5- Flat Kajang Utama 2 58 15.40 101 47 35.70
10.20 am 10.21 am 2 0
6- Flat Citra 2 58 8.00 101 47 32.50 10.22
am 10.22 am 0 0
7- Apartment Suria 2 58 11.70 101 47 29.80 10.23
am 10.23 am 0 0 8- Perumahan Seksyen 2 2 58 11.80 101 47 41.30
10.23 am 10.23 am 0 0
9- Perumahan Seksyen 3 2 58 15.80 101 47 54.50
10.25 am 10.25 am 1 0
10- Apartment Cemara 2 58 19.40 101 47 57.30
10.25 am 10.25 am 0 0
11- Apartment Sutera 2 58 23.70 101 48 3.00
10.25 am 10.25 am 3 1
12- Taman Bukit Mewah Fasa 8a 2 58 28.90 101 48 4.40
10.26 am 10.26 am 0 0
13- Komersial Taman Bukit Mewah 2 58 29.20 101 47 59.40
10.27 am 10.27 am 0 0
14- Taman Kajang Utama 2 58 29.70 101 47 52.80
10.27 am 10.27 am 0 0
15-Seksyen 1 Taman Kajang Utama 2 58 36.70 101 47 41.40
10.28 am 10.28 am 0 0
16- Taman Bangi 2 58 32.10 101 47 11.70 10.30
am 10.30 am 0 0
17- Taman Sri Reko 2 58 44.40 101 47 23.20 10.31
am 10.31 am 0 0
18- Taman Hijau 2 58 51.20 101 47 23.20 10.31
am 10.32 am 0 4 (O) 19- Kajang MRT 2 58 58.10 101 47 24.00
10.34 am - 0 1
Source: Research Studyor Service Catchment of Mass Rapid Transit (MRT) Feeder Bus: A Preliminary Study
of T461 Route Taman Kajang Utama
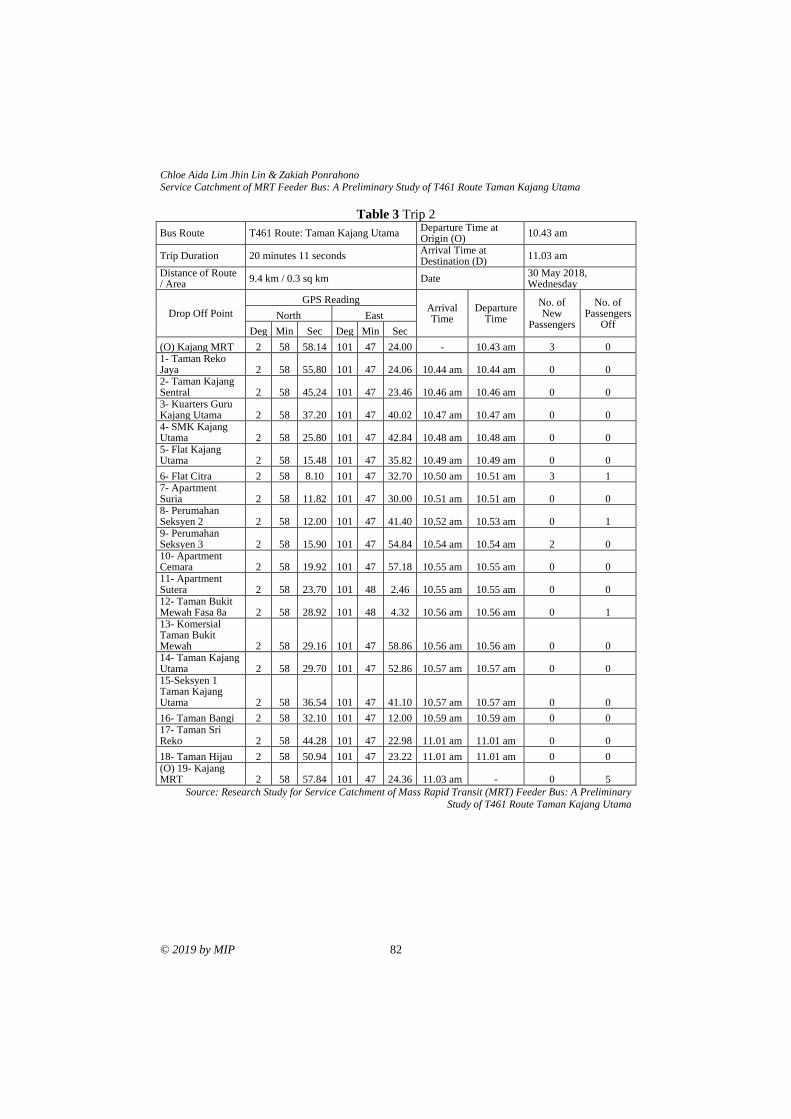
Chloe Aida Lim Jhin Lin & Zakiah Ponrahono
Service Catchment of MRT Feeder Bus: A Preliminary Study of T461 Route Taman Kajang Utama
© 2019 by MIP 82
Table 3 Trip 2
Bus Route T461 Route: Taman Kajang Utama Departure Time at Origin (O)
10.43 am
Trip Duration 20 minutes 11 seconds Arrival Time at Destination (D)
11.03 am
Distance of Route / Area
9.4 km / 0.3 sq km Date 30 May 2018, Wednesday
Drop Off Point
GPS Reading Arrival Time
Departure Time
No. of New
Passengers
No. of Passengers
Off North East
Deg Min Sec Deg Min Sec
(O) Kajang MRT 2 58 58.14 101 47 24.00 - 10.43 am 3 0 1- Taman Reko Jaya 2 58 55.80 101 47 24.06 10.44 am 10.44 am 0 0 2- Taman Kajang Sentral 2 58 45.24 101 47 23.46 10.46 am 10.46 am 0 0 3- Kuarters Guru Kajang Utama 2 58 37.20 101 47 40.02 10.47 am 10.47 am 0 0 4- SMK Kajang Utama 2 58 25.80 101 47 42.84 10.48 am 10.48 am 0 0 5- Flat Kajang Utama 2 58 15.48 101 47 35.82 10.49 am 10.49 am 0 0
6- Flat Citra 2 58 8.10 101 47 32.70 10.50 am 10.51 am 3 1 7- Apartment Suria 2 58 11.82 101 47 30.00 10.51 am 10.51 am 0 0 8- Perumahan Seksyen 2 2 58 12.00 101 47 41.40 10.52 am 10.53 am 0 1 9- Perumahan Seksyen 3 2 58 15.90 101 47 54.84 10.54 am 10.54 am 2 0 10- Apartment Cemara 2 58 19.92 101 47 57.18 10.55 am 10.55 am 0 0 11- Apartment Sutera 2 58 23.70 101 48 2.46 10.55 am 10.55 am 0 0 12- Taman Bukit Mewah Fasa 8a 2 58 28.92 101 48 4.32 10.56 am 10.56 am 0 1 13- Komersial Taman Bukit Mewah 2 58 29.16 101 47 58.86 10.56 am 10.56 am 0 0 14- Taman Kajang Utama 2 58 29.70 101 47 52.86 10.57 am 10.57 am 0 0 15-Seksyen 1 Taman Kajang Utama 2 58 36.54 101 47 41.10 10.57 am 10.57 am 0 0
16- Taman Bangi 2 58 32.10 101 47 12.00 10.59 am 10.59 am 0 0 17- Taman Sri Reko 2 58 44.28 101 47 22.98 11.01 am 11.01 am 0 0
18- Taman Hijau 2 58 50.94 101 47 23.22 11.01 am 11.01 am 0 0 (O) 19- Kajang MRT 2 58 57.84 101 47 24.36 11.03 am - 0 5
Source: Research Study for Service Catchment of Mass Rapid Transit (MRT) Feeder Bus: A Preliminary
Study of T461 Route Taman Kajang Utama
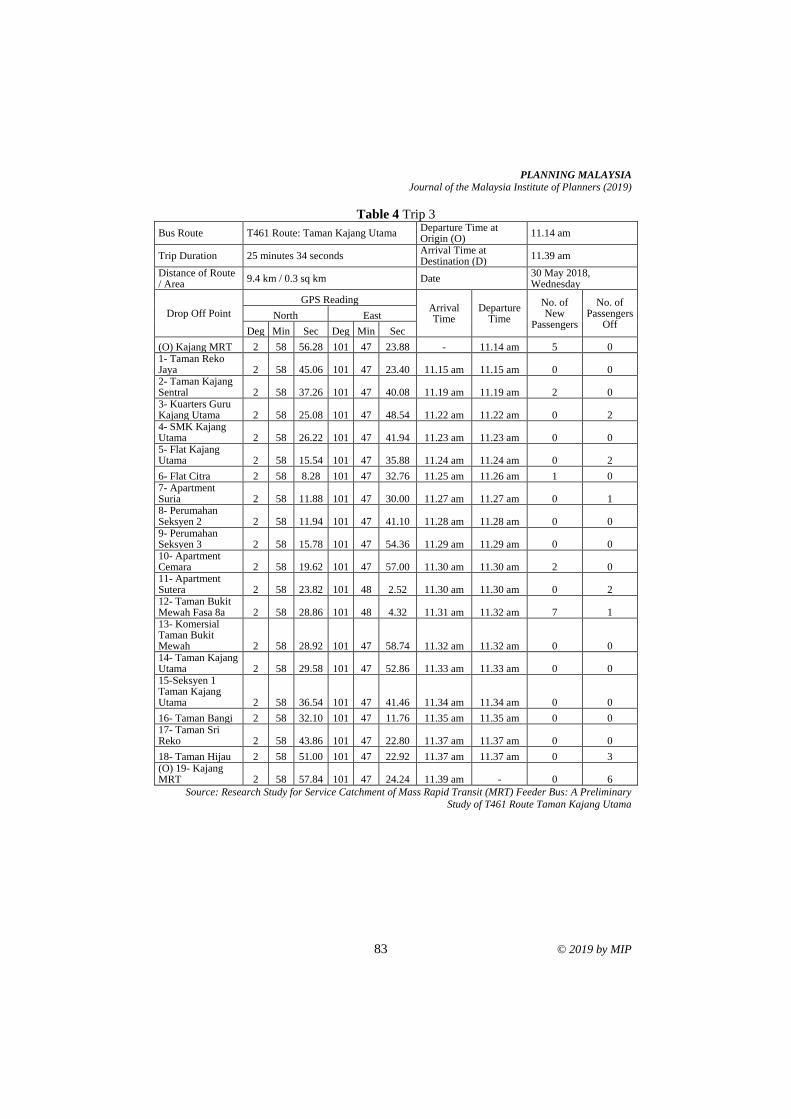
PLANNING MALAYSIA
Journal of the Malaysia Institute of Planners (2019)
83 © 2019 by MIP
Table 4 Trip 3
Bus Route T461 Route: Taman Kajang Utama Departure Time at Origin (O)
11.14 am
Trip Duration 25 minutes 34 seconds Arrival Time at Destination (D)
11.39 am
Distance of Route / Area
9.4 km / 0.3 sq km Date 30 May 2018, Wednesday
Drop Off Point
GPS Reading Arrival Time
Departure Time
No. of New
Passengers
No. of Passengers
Off North East
Deg Min Sec Deg Min Sec
(O) Kajang MRT 2 58 56.28 101 47 23.88 - 11.14 am 5 0 1- Taman Reko Jaya 2 58 45.06 101 47 23.40 11.15 am 11.15 am 0 0 2- Taman Kajang Sentral 2 58 37.26 101 47 40.08 11.19 am 11.19 am 2 0 3- Kuarters Guru Kajang Utama 2 58 25.08 101 47 48.54 11.22 am 11.22 am 0 2 4- SMK Kajang Utama 2 58 26.22 101 47 41.94 11.23 am 11.23 am 0 0 5- Flat Kajang Utama 2 58 15.54 101 47 35.88 11.24 am 11.24 am 0 2
6- Flat Citra 2 58 8.28 101 47 32.76 11.25 am 11.26 am 1 0 7- Apartment Suria 2 58 11.88 101 47 30.00 11.27 am 11.27 am 0 1 8- Perumahan Seksyen 2 2 58 11.94 101 47 41.10 11.28 am 11.28 am 0 0 9- Perumahan Seksyen 3 2 58 15.78 101 47 54.36 11.29 am 11.29 am 0 0 10- Apartment Cemara 2 58 19.62 101 47 57.00 11.30 am 11.30 am 2 0 11- Apartment Sutera 2 58 23.82 101 48 2.52 11.30 am 11.30 am 0 2 12- Taman Bukit Mewah Fasa 8a 2 58 28.86 101 48 4.32 11.31 am 11.32 am 7 1 13- Komersial Taman Bukit Mewah 2 58 28.92 101 47 58.74 11.32 am 11.32 am 0 0 14- Taman Kajang Utama 2 58 29.58 101 47 52.86 11.33 am 11.33 am 0 0 15-Seksyen 1 Taman Kajang Utama 2 58 36.54 101 47 41.46 11.34 am 11.34 am 0 0
16- Taman Bangi 2 58 32.10 101 47 11.76 11.35 am 11.35 am 0 0 17- Taman Sri Reko 2 58 43.86 101 47 22.80 11.37 am 11.37 am 0 0
18- Taman Hijau 2 58 51.00 101 47 22.92 11.37 am 11.37 am 0 3 (O) 19- Kajang MRT 2 58 57.84 101 47 24.24 11.39 am - 0 6
Source: Research Study for Service Catchment of Mass Rapid Transit (MRT) Feeder Bus: A Preliminary
Study of T461 Route Taman Kajang Utama
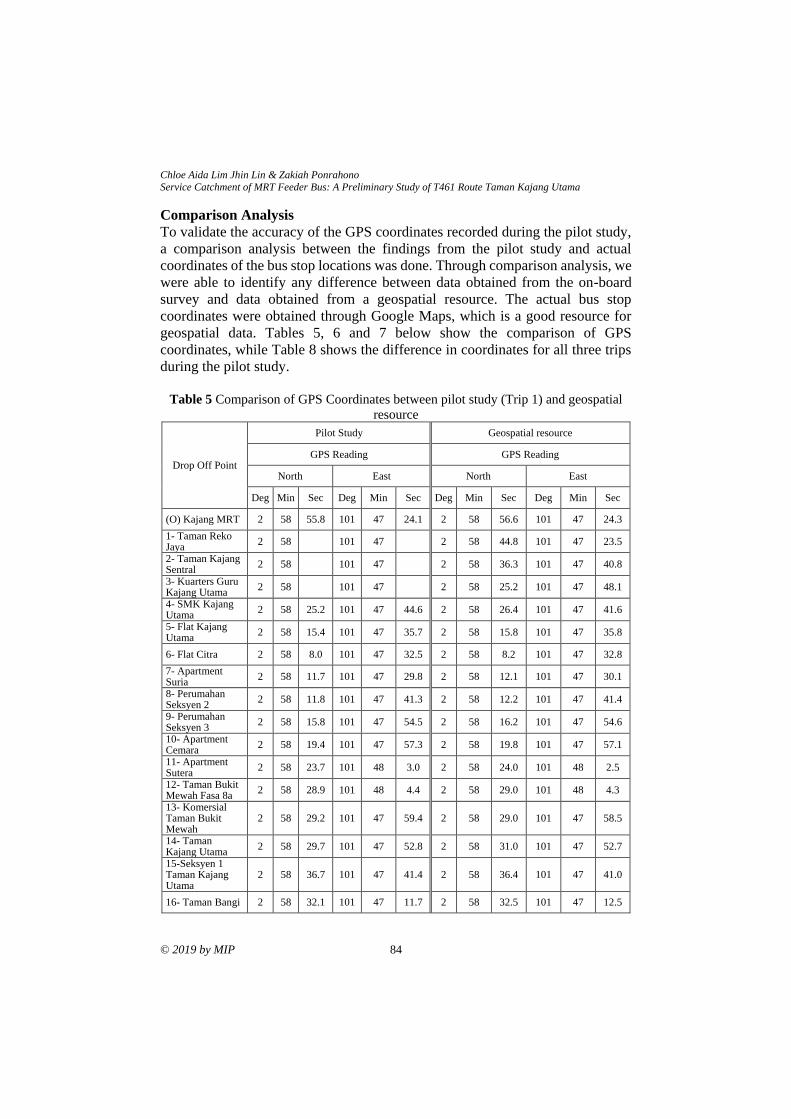
Chloe Aida Lim Jhin Lin & Zakiah Ponrahono
Service Catchment of MRT Feeder Bus: A Preliminary Study of T461 Route Taman Kajang Utama
© 2019 by MIP 84
Comparison Analysis
To validate the accuracy of the GPS coordinates recorded during the pilot study,
a comparison analysis between the findings from the pilot study and actual
coordinates of the bus stop locations was done. Through comparison analysis, we
were able to identify any difference between data obtained from the on-board
survey and data obtained from a geospatial resource. The actual bus stop
coordinates were obtained through Google Maps, which is a good resource for
geospatial data. Tables 5, 6 and 7 below show the comparison of GPS
coordinates, while Table 8 shows the difference in coordinates for all three trips
during the pilot study.
Table 5 Comparison of GPS Coordinates between pilot study (Trip 1) and geospatial
resource
Drop Off Point
Pilot Study Geospatial resource
GPS Reading GPS Reading
North East North East
Deg Min Sec Deg Min Sec Deg Min Sec Deg Min Sec
(O) Kajang MRT 2 58 55.8 101 47 24.1 2 58 56.6 101 47 24.3
1- Taman Reko Jaya
2 58 101 47 2 58 44.8 101 47 23.5
2- Taman Kajang Sentral
2 58 101 47 2 58 36.3 101 47 40.8
3- Kuarters Guru Kajang Utama
2 58 101 47 2 58 25.2 101 47 48.1
4- SMK Kajang Utama
2 58 25.2 101 47 44.6 2 58 26.4 101 47 41.6
5- Flat Kajang Utama
2 58 15.4 101 47 35.7 2 58 15.8 101 47 35.8
6- Flat Citra 2 58 8.0 101 47 32.5 2 58 8.2 101 47 32.8
7- Apartment Suria
2 58 11.7 101 47 29.8 2 58 12.1 101 47 30.1
8- Perumahan Seksyen 2
2 58 11.8 101 47 41.3 2 58 12.2 101 47 41.4
9- Perumahan Seksyen 3
2 58 15.8 101 47 54.5 2 58 16.2 101 47 54.6
10- Apartment Cemara
2 58 19.4 101 47 57.3 2 58 19.8 101 47 57.1
11- Apartment Sutera
2 58 23.7 101 48 3.0 2 58 24.0 101 48 2.5
12- Taman Bukit Mewah Fasa 8a
2 58 28.9 101 48 4.4 2 58 29.0 101 48 4.3
13- Komersial Taman Bukit Mewah
2 58 29.2 101 47 59.4 2 58 29.0 101 47 58.5
14- Taman Kajang Utama
2 58 29.7 101 47 52.8 2 58 31.0 101 47 52.7
15-Seksyen 1 Taman Kajang Utama
2 58 36.7 101 47 41.4 2 58 36.4 101 47 41.0
16- Taman Bangi 2 58 32.1 101 47 11.7 2 58 32.5 101 47 12.5
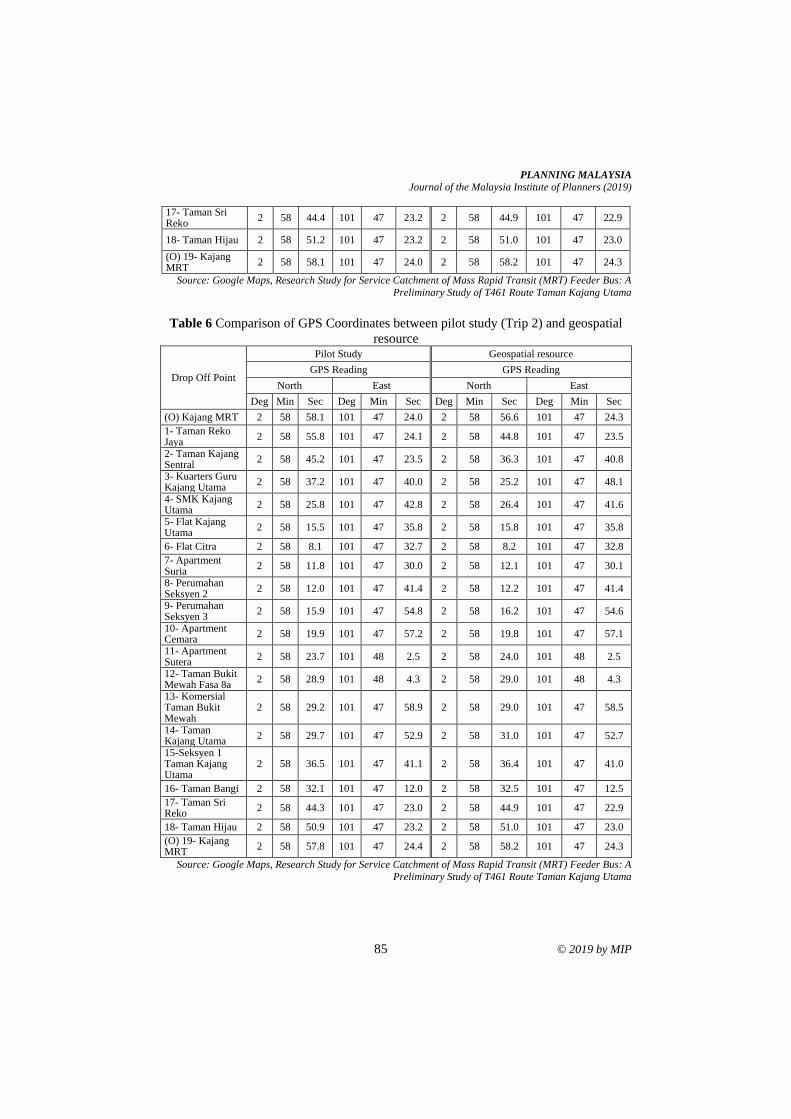
PLANNING MALAYSIA
Journal of the Malaysia Institute of Planners (2019)
85 © 2019 by MIP
17- Taman Sri Reko
2 58 44.4 101 47 23.2 2 58 44.9 101 47 22.9
18- Taman Hijau 2 58 51.2 101 47 23.2 2 58 51.0 101 47 23.0
(O) 19- Kajang MRT
2 58 58.1 101 47 24.0 2 58 58.2 101 47 24.3
Source: Google Maps, Research Study for Service Catchment of Mass Rapid Transit (MRT) Feeder Bus: A
Preliminary Study of T461 Route Taman Kajang Utama
Table 6 Comparison of GPS Coordinates between pilot study (Trip 2) and geospatial
resource
Drop Off Point
Pilot Study Geospatial resource
GPS Reading GPS Reading
North East North East
Deg Min Sec Deg Min Sec Deg Min Sec Deg Min Sec
(O) Kajang MRT 2 58 58.1 101 47 24.0 2 58 56.6 101 47 24.3
1- Taman Reko Jaya
2 58 55.8 101 47 24.1 2 58 44.8 101 47 23.5
2- Taman Kajang Sentral
2 58 45.2 101 47 23.5 2 58 36.3 101 47 40.8
3- Kuarters Guru Kajang Utama
2 58 37.2 101 47 40.0 2 58 25.2 101 47 48.1
4- SMK Kajang Utama
2 58 25.8 101 47 42.8 2 58 26.4 101 47 41.6
5- Flat Kajang Utama
2 58 15.5 101 47 35.8 2 58 15.8 101 47 35.8
6- Flat Citra 2 58 8.1 101 47 32.7 2 58 8.2 101 47 32.8
7- Apartment Suria
2 58 11.8 101 47 30.0 2 58 12.1 101 47 30.1
8- Perumahan Seksyen 2
2 58 12.0 101 47 41.4 2 58 12.2 101 47 41.4
9- Perumahan Seksyen 3
2 58 15.9 101 47 54.8 2 58 16.2 101 47 54.6
10- Apartment Cemara
2 58 19.9 101 47 57.2 2 58 19.8 101 47 57.1
11- Apartment Sutera
2 58 23.7 101 48 2.5 2 58 24.0 101 48 2.5
12- Taman Bukit Mewah Fasa 8a
2 58 28.9 101 48 4.3 2 58 29.0 101 48 4.3
13- Komersial Taman Bukit Mewah
2 58 29.2 101 47 58.9 2 58 29.0 101 47 58.5
14- Taman Kajang Utama
2 58 29.7 101 47 52.9 2 58 31.0 101 47 52.7
15-Seksyen 1 Taman Kajang Utama
2 58 36.5 101 47 41.1 2 58 36.4 101 47 41.0
16- Taman Bangi 2 58 32.1 101 47 12.0 2 58 32.5 101 47 12.5
17- Taman Sri Reko
2 58 44.3 101 47 23.0 2 58 44.9 101 47 22.9
18- Taman Hijau 2 58 50.9 101 47 23.2 2 58 51.0 101 47 23.0
(O) 19- Kajang MRT
2 58 57.8 101 47 24.4 2 58 58.2 101 47 24.3
Source: Google Maps, Research Study for Service Catchment of Mass Rapid Transit (MRT) Feeder Bus: A
Preliminary Study of T461 Route Taman Kajang Utama
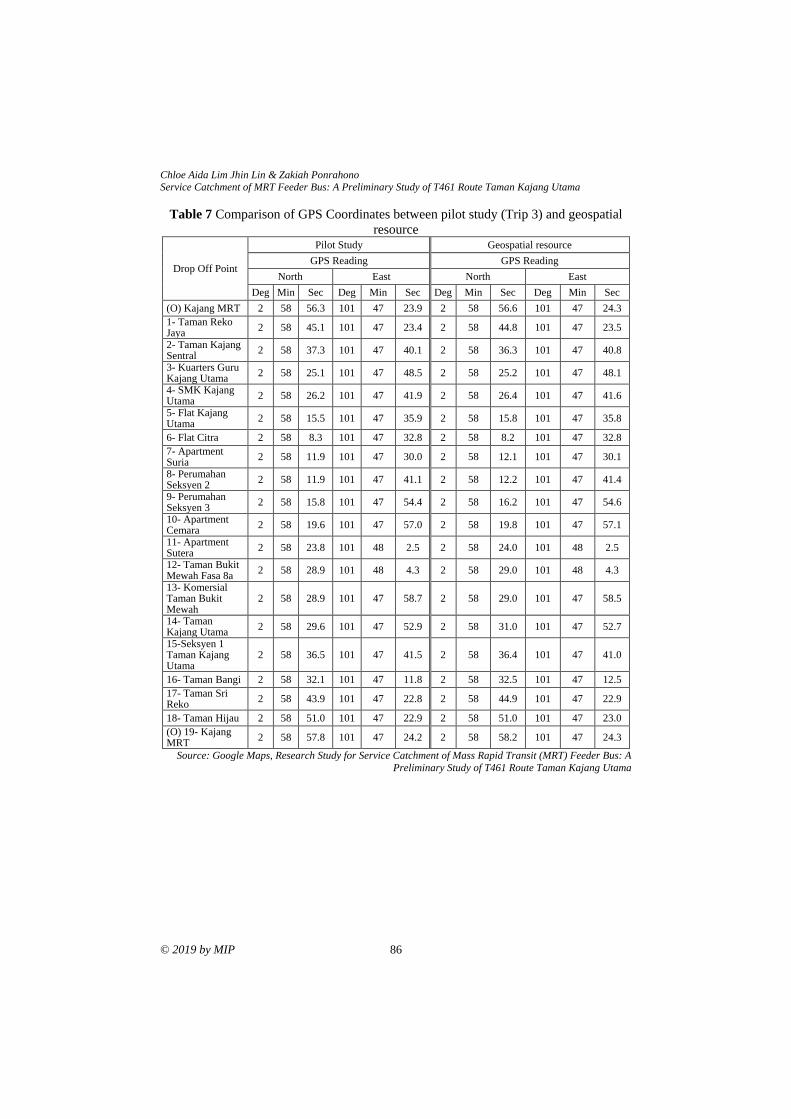
Chloe Aida Lim Jhin Lin & Zakiah Ponrahono
Service Catchment of MRT Feeder Bus: A Preliminary Study of T461 Route Taman Kajang Utama
© 2019 by MIP 86
Table 7 Comparison of GPS Coordinates between pilot study (Trip 3) and geospatial
resource
Drop Off Point
Pilot Study Geospatial resource
GPS Reading GPS Reading
North East North East
Deg Min Sec Deg Min Sec Deg Min Sec Deg Min Sec
(O) Kajang MRT 2 58 56.3 101 47 23.9 2 58 56.6 101 47 24.3
1- Taman Reko Jaya
2 58 45.1 101 47 23.4 2 58 44.8 101 47 23.5
2- Taman Kajang Sentral
2 58 37.3 101 47 40.1 2 58 36.3 101 47 40.8
3- Kuarters Guru Kajang Utama
2 58 25.1 101 47 48.5 2 58 25.2 101 47 48.1
4- SMK Kajang Utama
2 58 26.2 101 47 41.9 2 58 26.4 101 47 41.6
5- Flat Kajang Utama
2 58 15.5 101 47 35.9 2 58 15.8 101 47 35.8
6- Flat Citra 2 58 8.3 101 47 32.8 2 58 8.2 101 47 32.8
7- Apartment Suria
2 58 11.9 101 47 30.0 2 58 12.1 101 47 30.1
8- Perumahan Seksyen 2
2 58 11.9 101 47 41.1 2 58 12.2 101 47 41.4
9- Perumahan Seksyen 3
2 58 15.8 101 47 54.4 2 58 16.2 101 47 54.6
10- Apartment Cemara
2 58 19.6 101 47 57.0 2 58 19.8 101 47 57.1
11- Apartment Sutera
2 58 23.8 101 48 2.5 2 58 24.0 101 48 2.5
12- Taman Bukit Mewah Fasa 8a
2 58 28.9 101 48 4.3 2 58 29.0 101 48 4.3
13- Komersial Taman Bukit Mewah
2 58 28.9 101 47 58.7 2 58 29.0 101 47 58.5
14- Taman Kajang Utama
2 58 29.6 101 47 52.9 2 58 31.0 101 47 52.7
15-Seksyen 1 Taman Kajang Utama
2 58 36.5 101 47 41.5 2 58 36.4 101 47 41.0
16- Taman Bangi 2 58 32.1 101 47 11.8 2 58 32.5 101 47 12.5
17- Taman Sri Reko
2 58 43.9 101 47 22.8 2 58 44.9 101 47 22.9
18- Taman Hijau 2 58 51.0 101 47 22.9 2 58 51.0 101 47 23.0
(O) 19- Kajang MRT
2 58 57.8 101 47 24.2 2 58 58.2 101 47 24.3
Source: Google Maps, Research Study for Service Catchment of Mass Rapid Transit (MRT) Feeder Bus: A
Preliminary Study of T461 Route Taman Kajang Utama
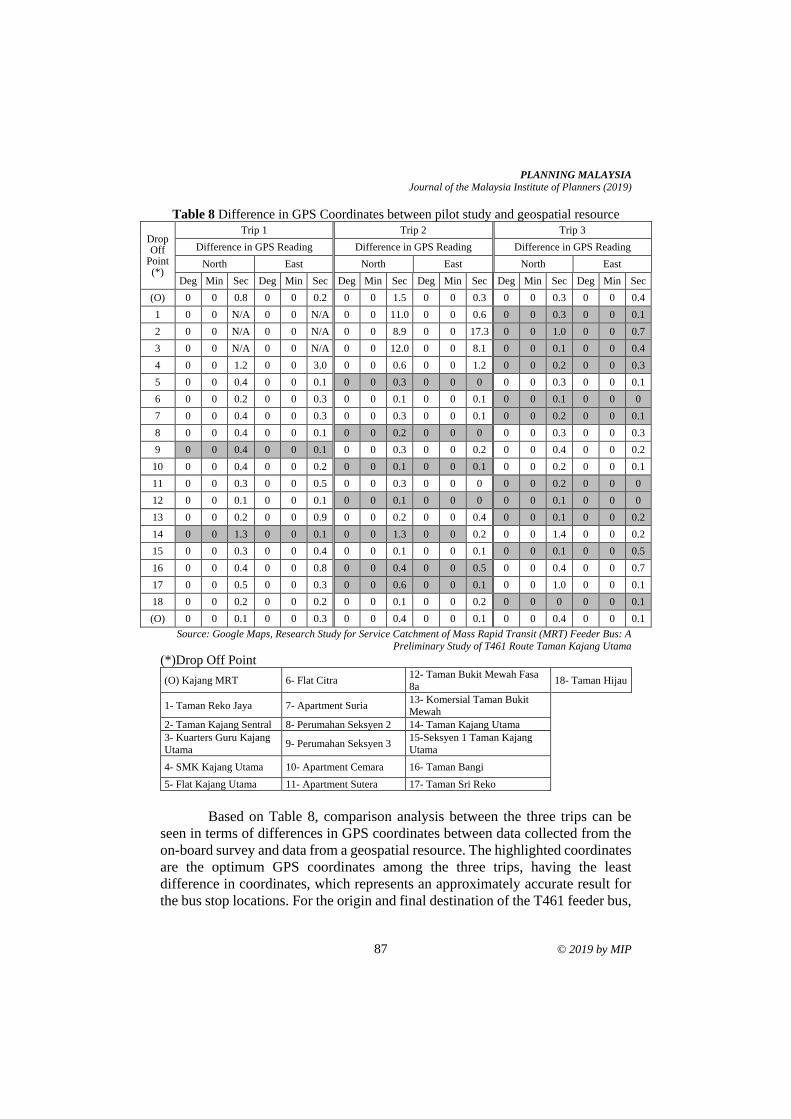
PLANNING MALAYSIA
Journal of the Malaysia Institute of Planners (2019)
87 © 2019 by MIP
Table 8 Difference in GPS Coordinates between pilot study and geospatial resource
Drop Off
Point (*)
Trip 1 Trip 2 Trip 3
Difference in GPS Reading Difference in GPS Reading Difference in GPS Reading
North East North East North East
Deg Min Sec Deg Min Sec Deg Min Sec Deg Min Sec Deg Min Sec Deg Min Sec
(O) 0 0 0.8 0 0 0.2 0 0 1.5 0 0 0.3 0 0 0.3 0 0 0.4
1 0 0 N/A 0 0 N/A 0 0 11.0 0 0 0.6 0 0 0.3 0 0 0.1
2 0 0 N/A 0 0 N/A 0 0 8.9 0 0 17.3 0 0 1.0 0 0 0.7
3 0 0 N/A 0 0 N/A 0 0 12.0 0 0 8.1 0 0 0.1 0 0 0.4
4 0 0 1.2 0 0 3.0 0 0 0.6 0 0 1.2 0 0 0.2 0 0 0.3
5 0 0 0.4 0 0 0.1 0 0 0.3 0 0 0 0 0 0.3 0 0 0.1
6 0 0 0.2 0 0 0.3 0 0 0.1 0 0 0.1 0 0 0.1 0 0 0
7 0 0 0.4 0 0 0.3 0 0 0.3 0 0 0.1 0 0 0.2 0 0 0.1
8 0 0 0.4 0 0 0.1 0 0 0.2 0 0 0 0 0 0.3 0 0 0.3
9 0 0 0.4 0 0 0.1 0 0 0.3 0 0 0.2 0 0 0.4 0 0 0.2
10 0 0 0.4 0 0 0.2 0 0 0.1 0 0 0.1 0 0 0.2 0 0 0.1
11 0 0 0.3 0 0 0.5 0 0 0.3 0 0 0 0 0 0.2 0 0 0
12 0 0 0.1 0 0 0.1 0 0 0.1 0 0 0 0 0 0.1 0 0 0
13 0 0 0.2 0 0 0.9 0 0 0.2 0 0 0.4 0 0 0.1 0 0 0.2
14 0 0 1.3 0 0 0.1 0 0 1.3 0 0 0.2 0 0 1.4 0 0 0.2
15 0 0 0.3 0 0 0.4 0 0 0.1 0 0 0.1 0 0 0.1 0 0 0.5
16 0 0 0.4 0 0 0.8 0 0 0.4 0 0 0.5 0 0 0.4 0 0 0.7
17 0 0 0.5 0 0 0.3 0 0 0.6 0 0 0.1 0 0 1.0 0 0 0.1
18 0 0 0.2 0 0 0.2 0 0 0.1 0 0 0.2 0 0 0 0 0 0.1
(O) 0 0 0.1 0 0 0.3 0 0 0.4 0 0 0.1 0 0 0.4 0 0 0.1
Source: Google Maps, Research Study for Service Catchment of Mass Rapid Transit (MRT) Feeder Bus: A
Preliminary Study of T461 Route Taman Kajang Utama
(*)Drop Off Point
(O) Kajang MRT 6- Flat Citra 12- Taman Bukit Mewah Fasa
8a 18- Taman Hijau
1- Taman Reko Jaya 7- Apartment Suria 13- Komersial Taman Bukit
Mewah
2- Taman Kajang Sentral 8- Perumahan Seksyen 2 14- Taman Kajang Utama
3- Kuarters Guru Kajang
Utama 9- Perumahan Seksyen 3
15-Seksyen 1 Taman Kajang
Utama
4- SMK Kajang Utama 10- Apartment Cemara 16- Taman Bangi
5- Flat Kajang Utama 11- Apartment Sutera 17- Taman Sri Reko
Based on Table 8, comparison analysis between the three trips can be
seen in terms of differences in GPS coordinates between data collected from the
on-board survey and data from a geospatial resource. The highlighted coordinates
are the optimum GPS coordinates among the three trips, having the least
difference in coordinates, which represents an approximately accurate result for
the bus stop locations. For the origin and final destination of the T461 feeder bus,
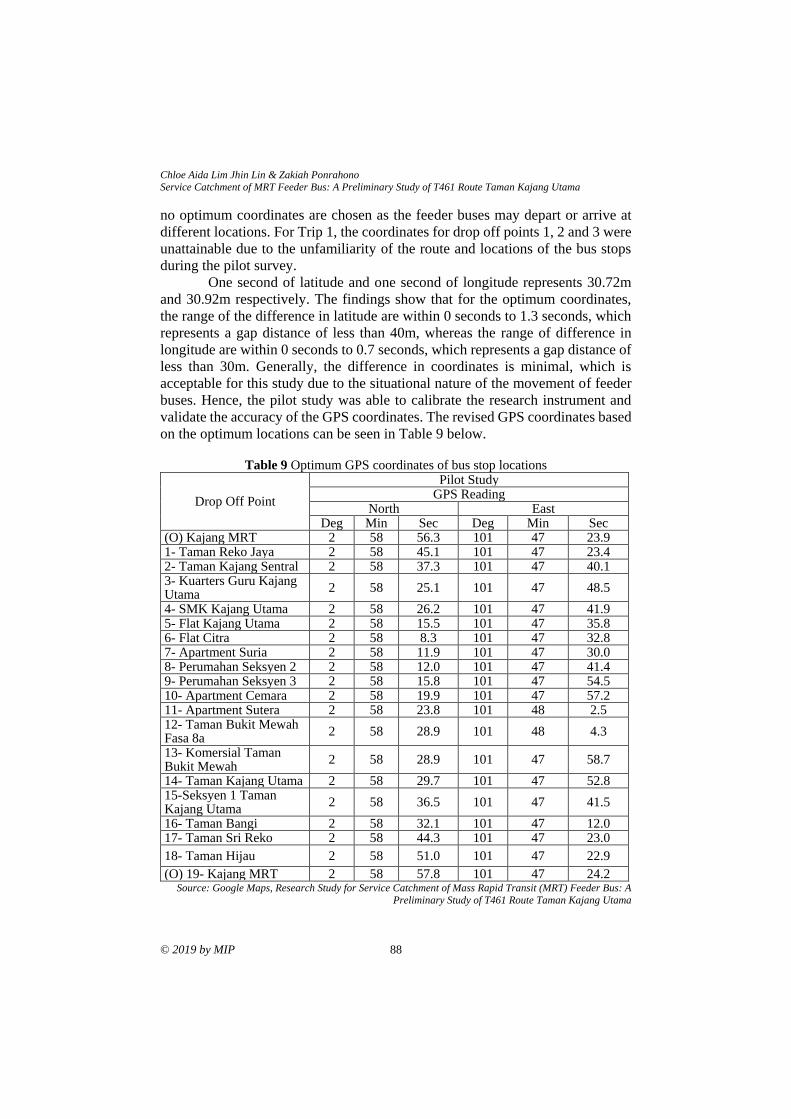
Chloe Aida Lim Jhin Lin & Zakiah Ponrahono
Service Catchment of MRT Feeder Bus: A Preliminary Study of T461 Route Taman Kajang Utama
© 2019 by MIP 88
no optimum coordinates are chosen as the feeder buses may depart or arrive at
different locations. For Trip 1, the coordinates for drop off points 1, 2 and 3 were
unattainable due to the unfamiliarity of the route and locations of the bus stops
during the pilot survey.
One second of latitude and one second of longitude represents 30.72m
and 30.92m respectively. The findings show that for the optimum coordinates,
the range of the difference in latitude are within 0 seconds to 1.3 seconds, which
represents a gap distance of less than 40m, whereas the range of difference in
longitude are within 0 seconds to 0.7 seconds, which represents a gap distance of
less than 30m. Generally, the difference in coordinates is minimal, which is
acceptable for this study due to the situational nature of the movement of feeder
buses. Hence, the pilot study was able to calibrate the research instrument and
validate the accuracy of the GPS coordinates. The revised GPS coordinates based
on the optimum locations can be seen in Table 9 below.
Table 9 Optimum GPS coordinates of bus stop locations
Drop Off Point
Pilot Study GPS Reading
North East Deg Min Sec Deg Min Sec
(O) Kajang MRT 2 58 56.3 101 47 23.9 1- Taman Reko Jaya 2 58 45.1 101 47 23.4 2- Taman Kajang Sentral 2 58 37.3 101 47 40.1 3- Kuarters Guru Kajang Utama
2 58 25.1 101 47 48.5
4- SMK Kajang Utama 2 58 26.2 101 47 41.9 5- Flat Kajang Utama 2 58 15.5 101 47 35.8 6- Flat Citra 2 58 8.3 101 47 32.8 7- Apartment Suria 2 58 11.9 101 47 30.0 8- Perumahan Seksyen 2 2 58 12.0 101 47 41.4 9- Perumahan Seksyen 3 2 58 15.8 101 47 54.5 10- Apartment Cemara 2 58 19.9 101 47 57.2 11- Apartment Sutera 2 58 23.8 101 48 2.5 12- Taman Bukit Mewah Fasa 8a
2 58 28.9 101 48 4.3
13- Komersial Taman Bukit Mewah
2 58 28.9 101 47 58.7
14- Taman Kajang Utama 2 58 29.7 101 47 52.8 15-Seksyen 1 Taman Kajang Utama
2 58 36.5 101 47 41.5
16- Taman Bangi 2 58 32.1 101 47 12.0 17- Taman Sri Reko 2 58 44.3 101 47 23.0
18- Taman Hijau 2 58 51.0 101 47 22.9
(O) 19- Kajang MRT 2 58 57.8 101 47 24.2 Source: Google Maps, Research Study for Service Catchment of Mass Rapid Transit (MRT) Feeder Bus: A
Preliminary Study of T461 Route Taman Kajang Utama
PLANNING MALAYSIA
Journal of the Malaysia Institute of Planners (2019)
89 © 2019 by MIP
Recommendations
From the larger context of the tudy, further discussion should be done on several
aspects in the feeder bus system regarding the service catchment of the feeder bus
service. The following are recommendations for further discussion in the actual
study:
• Bus stop spacing
• Bus stop environment and facilities
• Process of Ped shed analysis
• Redundancies in service gap
• Land use pattern
• Geospatial analysis
CONCLUSION
Literature review shows that walkable catchment areas differ all around the world
and depend on various factors. Commonly, the 400m and 800m buffers are
applied in urban planning to determine walkable catchment areas in a
neighbourhood. By determining the service catchment of feeder buses, we are
able to identify gaps or mismatches in the feeder bus system that might potentially
affect the performance and effectiveness of urban rail transit. Ped shed
terminology has been used as a tool in urban planning to assess the walkability
catchments of common facilities. It is also useful in suggesting improvements for
the connectivity and walkability of bus stops.
The findings from this preliminary study indicate that the research
instrument is ready to be used for actual data collection and geospatial analysis
to determine the service catchment of the T461 feeder bus service. Optimum GPS
coordinates derived from the pilot study will be used for geospatial analysis to
achieve the research objectives.
ACKNOWLEDGEMENTS
This research was fully supported by the UPM Putra Grant – IPM/2018/9592500
(UPM RMC).
REFERENCES Active Healthy Communities. (2014). PedShed analysis. Retrieved from
http://www.activehealthycommunities.com.au/plan/gis-analysis/walking-
cycling-pedshed-analysis/
Advani, M., & Tiwari, G. (2006). Review of capacity improvement strategies for bus
transit service. Indian Journal of Transport Management, 30(4), 363-391.
Almasi, M. H., Mounes, S. M., Koting, S., & Karim, M. R. (2014). Analysis of feeder
bus network design and scheduling problems. The Scientific World Journal,
Article ID 408473.
Chloe Aida Lim Jhin Lin & Zakiah Ponrahono
Service Catchment of MRT Feeder Bus: A Preliminary Study of T461 Route Taman Kajang Utama
© 2019 by MIP 90
Almasi, M. H., Sadollah, A., Oh, Y., Kim, D., & Kang, S. (2018). Optimal coordination
strategy for an integrated multimodal transit feeder network design considering
multiple objectives. Sustainability 2018, 10, 734.
Asfour, O. S., & Zourob, N. (2017). The neighbourhood unit adequacy: An analysis of
the case of Gaza, Palestine. Cities, 69, 1-11.
Azmi, D. I., & Karim, H. A. (2012). A comparative study of walking behavior to
community facilities in low-cost and medium cost housing. Procedia – Social
and Behavioral Sciences, 35, 619-628.
Ciaffi, F., Cipriani, E., & Petrelli, M. (2012). Feeder bus network design problem : A new
metaheuristic procedure and real size applications. Procedia - Social and
Behavioral Sciences, 54, 798-807.
El-Geneidy, A., Grimsrud, M., Wasfi, R., Tétreault, P., & Surprenant-Legault, J. (2014).
New evidence on walking distances to transit stops: Identifying redundancies
and gaps using variable service areas. Transportation, 41(1), 193-210.
Hayashi, Y., Doi, K., Yagishita, M., & Kuwata, M. (2004). Urban transport sustainability:
Asian trends, problems and policy practices. EJTIR, 4(1), 27-45.
Huang, Z. D, Liu, X. J., Huang, C. C., & Shen, J. W. (2010). A GIS-based framework for
bus network optimization using genetic algorithm. Annals of GIS, 16(3), 185-
194.
Johar, A., Jain, S. S., Garg, P. K., & Gundaliya, P. J. (2015). A study for commuter walk
distance from bus stops to different destination along routes in Delhi. European
Transport, 59(3), (n.p.).
Khalid, N. S. (n.d.). Human walking behaviour to open spaces. Retrieved from
https://www.academia.edu/9714659/HUMAN_WALKING_BEHAVIOUR_T
O_OPEN_SPACES
Lovett, A., Haynes, R., Sünnenberg, G., & Gale, S. (2002). Car travel time and
accessibility by bus to general practitioner services: A study using patient
registers and GIS. Social Science and Medicine, 55, 97-111.
LeGates, R. T., & Stout, F. (Eds.). 1943- (2011). The city reader (5th ed). London:
Routledge.
Meenakshi. (2011). Neighborhood unit and its conceptualization in the contemporary
urban context. Institute of Town Planners, India Journal 8(3), 81-87.
New Zealand, Auckland Council. (2010). New Lynn Urban Plan 2010-2030. Retrieved
from https://www.aucklandcouncil.govt.nz/plans-projects-policies-reports-
bylaws/our-plans-strategies/place-based-plans/docsnewlynnurbanplan/new-
lynn-urban-plan-2010-part-1.pdf
O’Connor, D., & Caulfield, B. (2017). Level of service and the transit neighbourhood –
observations from Dublin city and suburbs. In 15th International Conference
Series on Competition and Ownership in Land Passenger Transport. Stockholm,
Sweden.
Olszewski, P., & Wibowo, S. (2005). Using equivalent walking distance to assess
pedestrian accessibility to transit stations in Singapore. Transportation Research
Record: Journal of the Transportation Research Board, 1927, 38-45.
Pongprasert, P., & Kubota, H. (2017). Switching from motorcycle taxi to walking: A case
study of transit station access in Bangkok, Thailand. International Association
of Traffic and Safety Sciences; 41(4), 182-190.
PLANNING MALAYSIA
Journal of the Malaysia Institute of Planners (2019)
91 © 2019 by MIP
Salvo, G., & Sabatini, S. (2014). A GIS approach to evaluate bus stop accessibility.
Advanced OR and AI Methods in Transportation. Retrieved from
http://www.iasi.cnr.it/ewgt/ 16conference/ID108.pdf.
Shi, Y., Blainey, S., & Hounsell, N. (2017). Using GIS to assess the potential for
centralised planning of bus networks. Transportation Planning and Technology,
40(1), 119-142.
Sukor, N. S., & Fisal, S. F. (2018). Factors influencing the willingness to walk to the bus
stops in Penang Island. Planning Malaysia, 16(1), 193-204.
Vuchic, v. R. (2005). Urban transit: Operations, planning and economics. New Jersey:
John Wiley & Sons
Received: 12th January 2019. Accepted: 2nd August 2019
1Lecturer at Universiti Putra Malaysia Email: [email protected] 92
PLANNING MALAYSIA:
Journal of the Malaysian Institute of Planners
VOLUME 17 ISSUE 2 (2019), Page 92 – 100
VEHICLE – PEDESTRIAN CONFLICT: A CASE STUDY IN
UNIVERSITI PUTRA MALAYSIA
Noorain Mohd Isa1, Ahmad Zaharin Aris 2, Zakiah Ponrahono3, & Rosta Harun4
1,2,3,4Faculty of Environmental Studies
UNIVERSITI PUTRA MALAYSIA
Abstract
Vehicle-pedestrian conflict is a commonly unsafe event that occurs in both urban
and rural areas, especially in developing countries. It is still an open research
topic, mostly in traffic safety and urban planning, which is utilised for evaluating
the behaviours of vehicles and pedestrians at a non-signalised marked walkway.
Three stations were selected based on higher daily activities to calculate the
regularity of pedestrian movement. A manual calculation method was applied,
and the calculation was done only during the daytime. Three different teams were
formed to obtain the measurements at the three different sampling points
simultaneously. A present study on preliminary vehicle-pedestrian conflict
reveals the frequency of pedestrians in a concentrated area and its Level of
Service (LOS) in Universiti Putra Malaysia (UPM) Serdang. The findings show
that rush hour occurs during the mid-day in weekday, when students have finished
their classes and adults have gone out for other businesses.
Keywords: campus, pedestrian, non-motorised vehicle, shared pathway
PLANNING MALAYSIA
Journal of the Malaysia Institute of Planners (2019)
93 © 2019 by MIP
INTRODUCTION
Urban areas, especially in developing countries, commonly have mixed traffic
flows (Ni, Wang, Sun, & Li, 2016). In this approach of mixed traffic, motor
vehicles, non-motorised vehicles (bicycles) and pedestrians share the same space
(roads and intersections), which in turn triggers conflicts (Almodfer, Xiong,
Fang, Kong, & Zheng, 2016). These vehicle-vehicle conflicts, bicycle-vehicle
conflicts, and pedestrian-vehicle conflicts occur frequently, with vehicle-
pedestrian conflicts being the most concerning issue.
The behaviour of pedestrians and drivers can become a great influence,
which depends on many uncertain factors (Suzuki & Ito, 2017). For example,
pedestrians and cyclists may step out onto the road without warning and
sometimes are unaware or being less alert around traffic, which present risk of
collision with vehicles. Besides that, the millennial generation tends to obsess
over their smart phones, texting or talking and being seemingly ignorant of their
surroundings (Cloutier et. al., 2017). On the other hand, drivers of motorised
vehicles could also be using their smart phones while driving, compromising their
attention to the road. Policy and decision makers around the world have typically
prioritised the safety of pedestrians (Iryo-Asano & Alhajyaseen, 2017). However,
these intentions get less attention due to increasing vehicle congestion in urban
areas. Additionally, pedestrian areas have been minimised to allow for better road
openings.
Pedestrians are vulnerable road users because of their unprotected safety
on the road (Zheng, Chase, Elefteriadou, Schroeder, & Sisiopiku, 2015). In
Malaysia, more than 6,000 cases involving pedestrian injuries and fatalities on
the road are reported annually. Meanwhile, pedestrian fatalities are averages at
500 deaths each year (Mohd Syazwan, Baba, Nur Zarifah, Aqbal Hafeez, & Noor
Faradila, 2017). Most injuries involve the elderly (60 years above), and >60% of
these accidents occurred on straight roads. The fatality statistics of pedestrians
has been showing a continued increase from 24.4% in 2006 to 44.2% in 2013,
and thus needs to be attended to. Table 1 shows the fatalities involving
pedestrians in Southeast Asian countries. Universiti Putra Malaysia (UPM) has set a new record when it was listed
as the world’s top 17th university in the UI-Greenmetric World University
Ranking based on its rigorous efforts to promote campus sustainability and
effective environmental management. In year 2013, UPM established a cycling
space for the students to cycle in the campus as part of its green campus initiative.
This benefits the students by improving air quality, minimising pollution and road
damage, and promotes healthy living. This could also reduce the frequencies of
bus service within the campus. These bicycle lanes have been built on the existing
roads, which are also being used by other vehicles. The bicycle lanes themselves
are shared with pedestrian.
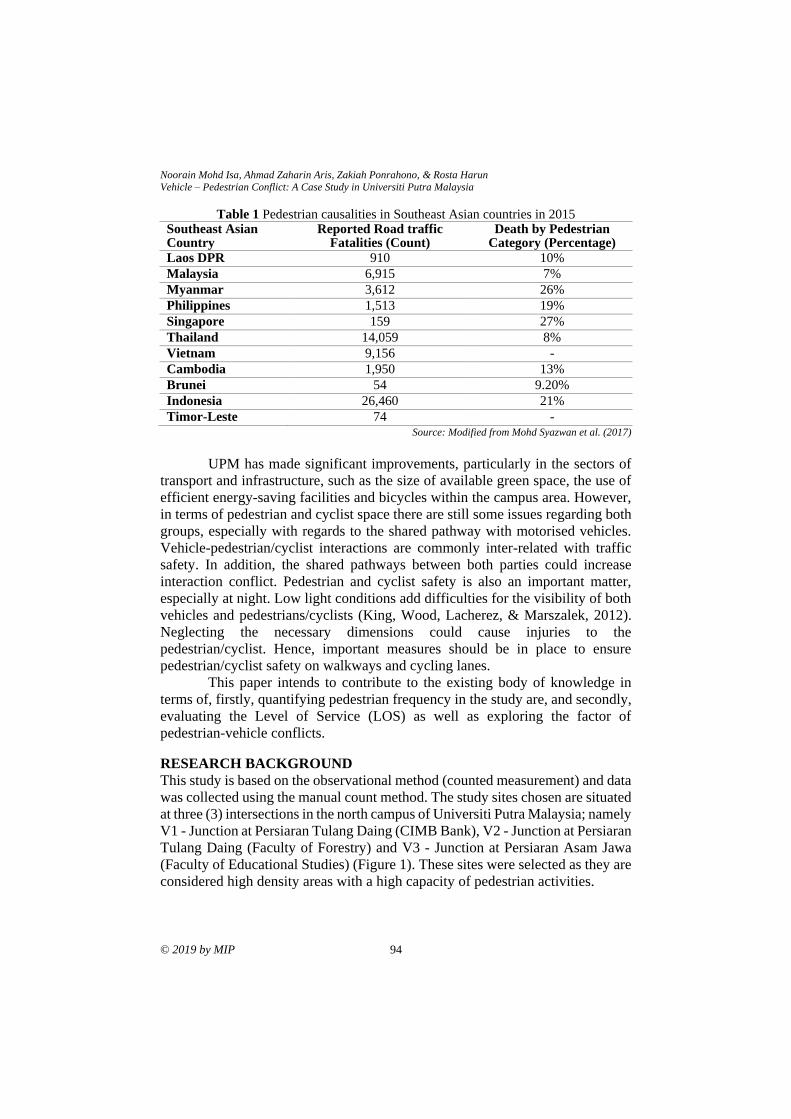
Noorain Mohd Isa, Ahmad Zaharin Aris, Zakiah Ponrahono, & Rosta Harun
Vehicle – Pedestrian Conflict: A Case Study in Universiti Putra Malaysia
© 2019 by MIP 94
Table 1 Pedestrian causalities in Southeast Asian countries in 2015 Southeast Asian Country
Reported Road traffic Fatalities (Count)
Death by Pedestrian Category (Percentage)
Laos DPR 910 10%
Malaysia 6,915 7%
Myanmar 3,612 26%
Philippines 1,513 19%
Singapore 159 27%
Thailand 14,059 8%
Vietnam 9,156 -
Cambodia 1,950 13%
Brunei 54 9.20%
Indonesia 26,460 21%
Timor-Leste 74 - Source: Modified from Mohd Syazwan et al. (2017)
UPM has made significant improvements, particularly in the sectors of
transport and infrastructure, such as the size of available green space, the use of
efficient energy-saving facilities and bicycles within the campus area. However,
in terms of pedestrian and cyclist space there are still some issues regarding both
groups, especially with regards to the shared pathway with motorised vehicles.
Vehicle-pedestrian/cyclist interactions are commonly inter-related with traffic
safety. In addition, the shared pathways between both parties could increase
interaction conflict. Pedestrian and cyclist safety is also an important matter,
especially at night. Low light conditions add difficulties for the visibility of both
vehicles and pedestrians/cyclists (King, Wood, Lacherez, & Marszalek, 2012).
Neglecting the necessary dimensions could cause injuries to the
pedestrian/cyclist. Hence, important measures should be in place to ensure
pedestrian/cyclist safety on walkways and cycling lanes.
This paper intends to contribute to the existing body of knowledge in
terms of, firstly, quantifying pedestrian frequency in the study are, and secondly,
evaluating the Level of Service (LOS) as well as exploring the factor of
pedestrian-vehicle conflicts.
RESEARCH BACKGROUND
This study is based on the observational method (counted measurement) and data
was collected using the manual count method. The study sites chosen are situated
at three (3) intersections in the north campus of Universiti Putra Malaysia; namely
V1 - Junction at Persiaran Tulang Daing (CIMB Bank), V2 - Junction at Persiaran
Tulang Daing (Faculty of Forestry) and V3 - Junction at Persiaran Asam Jawa
(Faculty of Educational Studies) (Figure 1). These sites were selected as they are
considered high density areas with a high capacity of pedestrian activities.
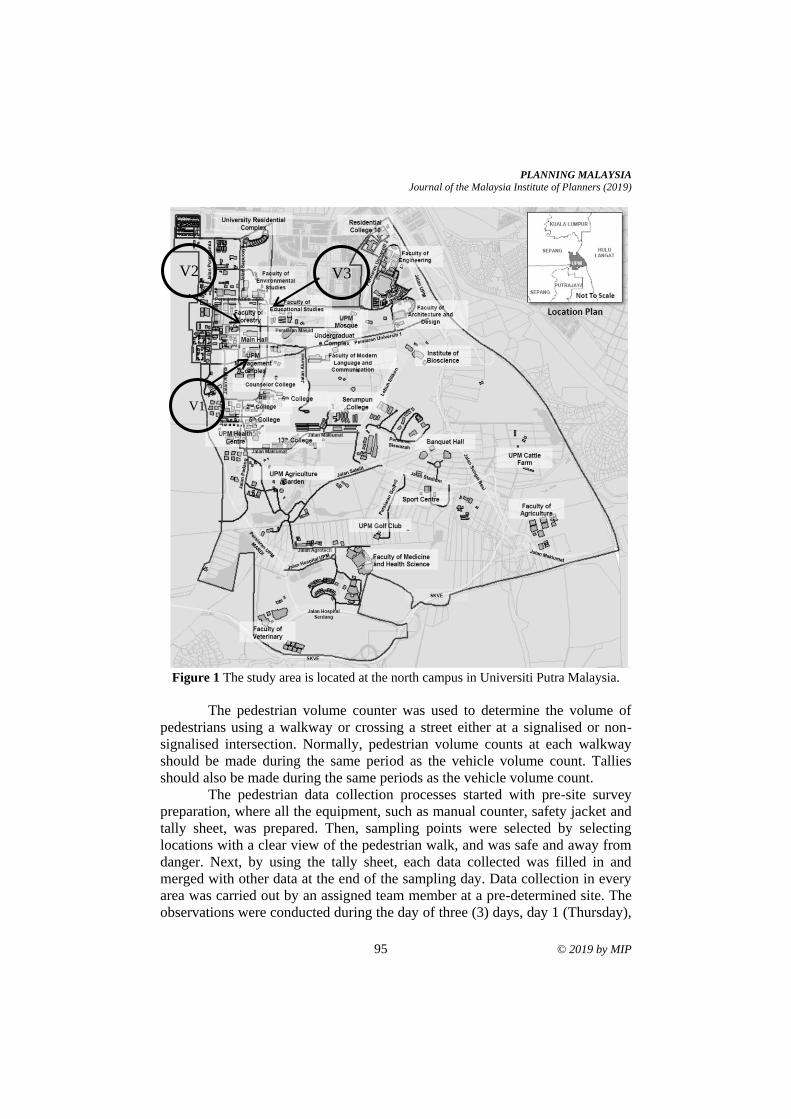
PLANNING MALAYSIA
Journal of the Malaysia Institute of Planners (2019)
95 © 2019 by MIP
Figure 1 The study area is located at the north campus in Universiti Putra Malaysia.
The pedestrian volume counter was used to determine the volume of
pedestrians using a walkway or crossing a street either at a signalised or non-
signalised intersection. Normally, pedestrian volume counts at each walkway
should be made during the same period as the vehicle volume count. Tallies
should also be made during the same periods as the vehicle volume count.
The pedestrian data collection processes started with pre-site survey
preparation, where all the equipment, such as manual counter, safety jacket and
tally sheet, was prepared. Then, sampling points were selected by selecting
locations with a clear view of the pedestrian walk, and was safe and away from
danger. Next, by using the tally sheet, each data collected was filled in and
merged with other data at the end of the sampling day. Data collection in every
area was carried out by an assigned team member at a pre-determined site. The
observations were conducted during the day of three (3) days, day 1 (Thursday),
V1
V2 V3
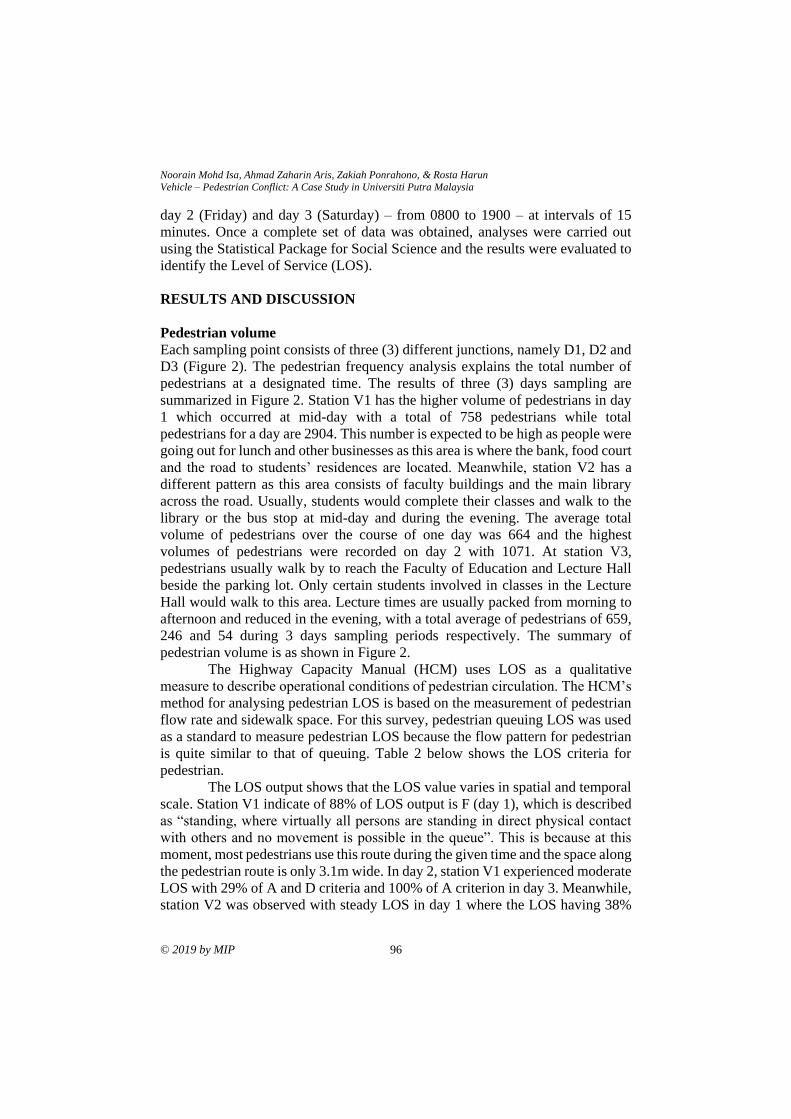
Noorain Mohd Isa, Ahmad Zaharin Aris, Zakiah Ponrahono, & Rosta Harun
Vehicle – Pedestrian Conflict: A Case Study in Universiti Putra Malaysia
© 2019 by MIP 96
day 2 (Friday) and day 3 (Saturday) – from 0800 to 1900 – at intervals of 15
minutes. Once a complete set of data was obtained, analyses were carried out
using the Statistical Package for Social Science and the results were evaluated to
identify the Level of Service (LOS).
RESULTS AND DISCUSSION
Pedestrian volume
Each sampling point consists of three (3) different junctions, namely D1, D2 and
D3 (Figure 2). The pedestrian frequency analysis explains the total number of
pedestrians at a designated time. The results of three (3) days sampling are
summarized in Figure 2. Station V1 has the higher volume of pedestrians in day
1 which occurred at mid-day with a total of 758 pedestrians while total
pedestrians for a day are 2904. This number is expected to be high as people were
going out for lunch and other businesses as this area is where the bank, food court
and the road to students’ residences are located. Meanwhile, station V2 has a
different pattern as this area consists of faculty buildings and the main library
across the road. Usually, students would complete their classes and walk to the
library or the bus stop at mid-day and during the evening. The average total
volume of pedestrians over the course of one day was 664 and the highest
volumes of pedestrians were recorded on day 2 with 1071. At station V3,
pedestrians usually walk by to reach the Faculty of Education and Lecture Hall
beside the parking lot. Only certain students involved in classes in the Lecture
Hall would walk to this area. Lecture times are usually packed from morning to
afternoon and reduced in the evening, with a total average of pedestrians of 659,
246 and 54 during 3 days sampling periods respectively. The summary of
pedestrian volume is as shown in Figure 2.
The Highway Capacity Manual (HCM) uses LOS as a qualitative
measure to describe operational conditions of pedestrian circulation. The HCM’s
method for analysing pedestrian LOS is based on the measurement of pedestrian
flow rate and sidewalk space. For this survey, pedestrian queuing LOS was used
as a standard to measure pedestrian LOS because the flow pattern for pedestrian
is quite similar to that of queuing. Table 2 below shows the LOS criteria for
pedestrian.
The LOS output shows that the LOS value varies in spatial and temporal
scale. Station V1 indicate of 88% of LOS output is F (day 1), which is described
as “standing, where virtually all persons are standing in direct physical contact
with others and no movement is possible in the queue”. This is because at this
moment, most pedestrians use this route during the given time and the space along
the pedestrian route is only 3.1m wide. In day 2, station V1 experienced moderate
LOS with 29% of A and D criteria and 100% of A criterion in day 3. Meanwhile,
station V2 was observed with steady LOS in day 1 where the LOS having 38%
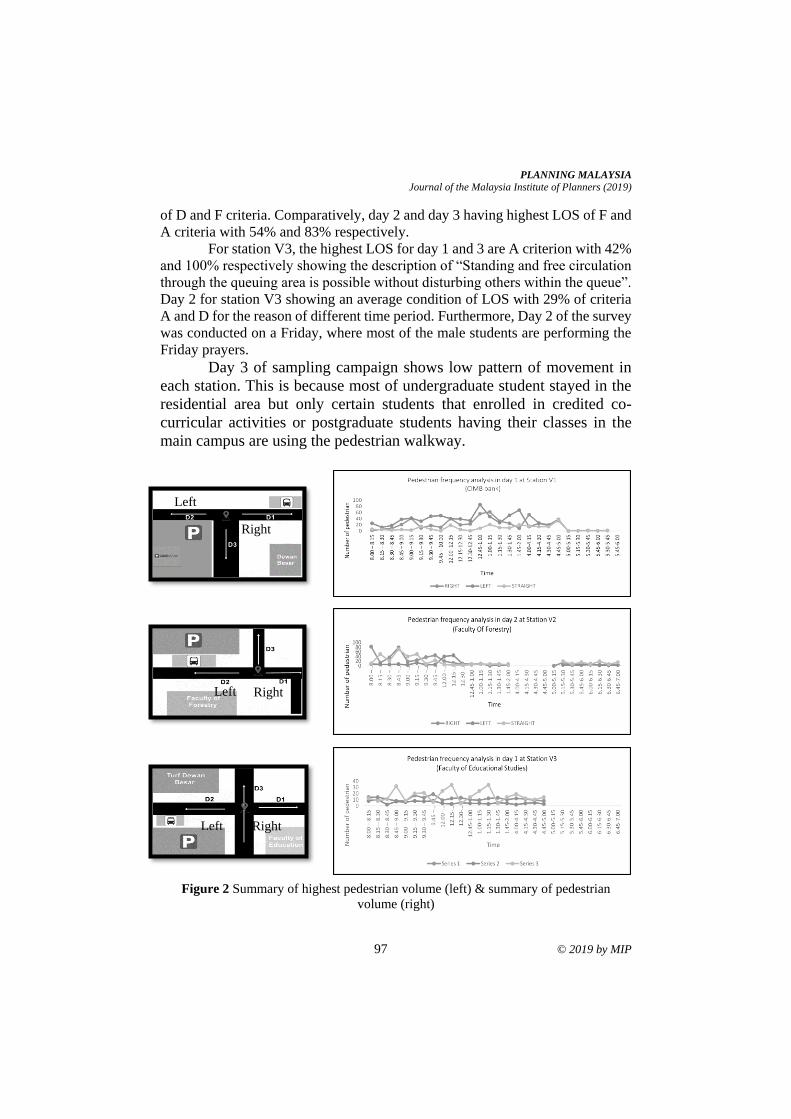
PLANNING MALAYSIA
Journal of the Malaysia Institute of Planners (2019)
97 © 2019 by MIP
of D and F criteria. Comparatively, day 2 and day 3 having highest LOS of F and
A criteria with 54% and 83% respectively.
For station V3, the highest LOS for day 1 and 3 are A criterion with 42%
and 100% respectively showing the description of “Standing and free circulation
through the queuing area is possible without disturbing others within the queue”.
Day 2 for station V3 showing an average condition of LOS with 29% of criteria
A and D for the reason of different time period. Furthermore, Day 2 of the survey
was conducted on a Friday, where most of the male students are performing the
Friday prayers.
Day 3 of sampling campaign shows low pattern of movement in
each station. This is because most of undergraduate student stayed in the
residential area but only certain students that enrolled in credited co-
curricular activities or postgraduate students having their classes in the
main campus are using the pedestrian walkway.
Figure 2 Summary of highest pedestrian volume (left) & summary of pedestrian
volume (right)
Left
Right
Left
Right Left
Right
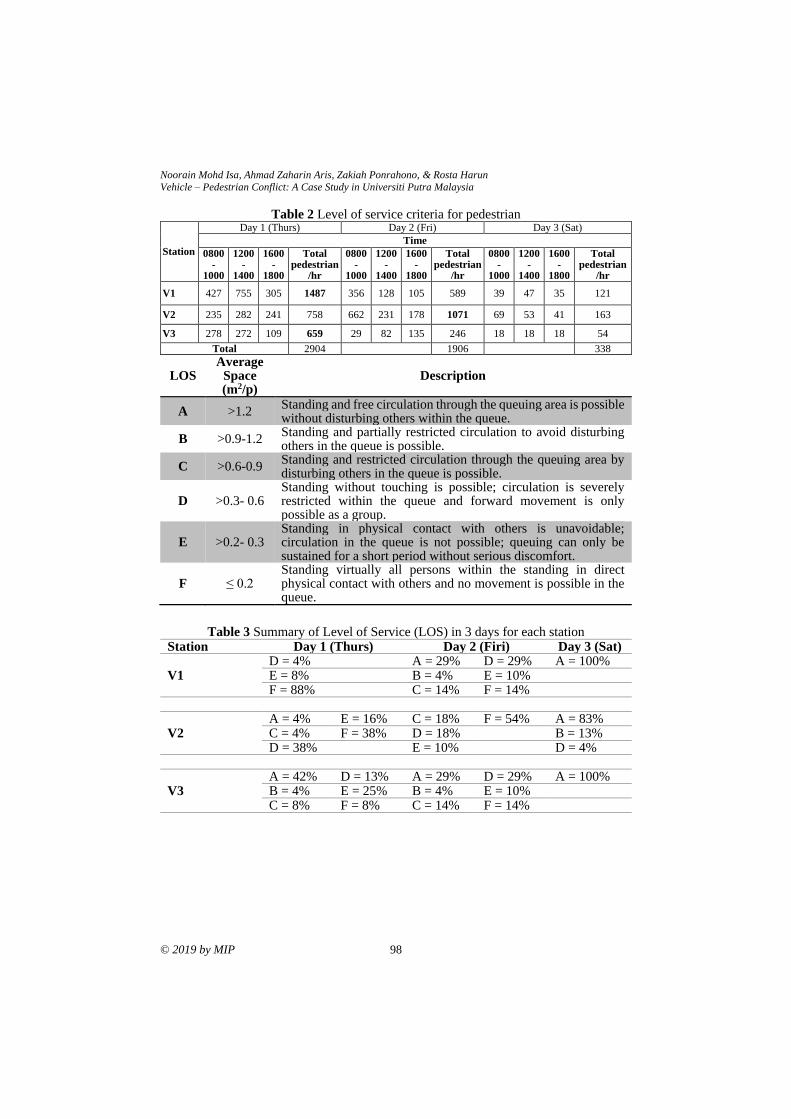
Noorain Mohd Isa, Ahmad Zaharin Aris, Zakiah Ponrahono, & Rosta Harun
Vehicle – Pedestrian Conflict: A Case Study in Universiti Putra Malaysia
© 2019 by MIP 98
Table 2 Level of service criteria for pedestrian
Station
Day 1 (Thurs) Day 2 (Fri) Day 3 (Sat)
Time
0800 -
1000
1200 -
1400
1600 -
1800
Total pedestrian
/hr
0800 -
1000
1200 -
1400
1600 -
1800
Total pedestrian
/hr
0800 -
1000
1200 -
1400
1600 -
1800
Total pedestrian
/hr
V1 427 755 305 1487 356 128 105 589 39 47 35 121
V2 235 282 241 758 662 231 178 1071 69 53 41 163
V3 278 272 109 659 29 82 135 246 18 18 18 54
Total 2904 1906 338
LOS Average
Space (m2/p)
Description
A >1.2 Standing and free circulation through the queuing area is possible without disturbing others within the queue.
B >0.9-1.2 Standing and partially restricted circulation to avoid disturbing others in the queue is possible.
C >0.6-0.9 Standing and restricted circulation through the queuing area by disturbing others in the queue is possible.
D >0.3- 0.6 Standing without touching is possible; circulation is severely restricted within the queue and forward movement is only possible as a group.
E >0.2- 0.3 Standing in physical contact with others is unavoidable; circulation in the queue is not possible; queuing can only be sustained for a short period without serious discomfort.
F ≤ 0.2 Standing virtually all persons within the standing in direct physical contact with others and no movement is possible in the queue.
Table 3 Summary of Level of Service (LOS) in 3 days for each station
Station Day 1 (Thurs) Day 2 (Firi) Day 3 (Sat)
V1 D = 4% A = 29% D = 29% A = 100% E = 8% B = 4% E = 10% F = 88% C = 14% F = 14%
V2 A = 4% E = 16% C = 18% F = 54% A = 83% C = 4% F = 38% D = 18% B = 13% D = 38% E = 10% D = 4%
V3 A = 42% D = 13% A = 29% D = 29% A = 100% B = 4% E = 25% B = 4% E = 10% C = 8% F = 8% C = 14% F = 14%
PLANNING MALAYSIA
Journal of the Malaysia Institute of Planners (2019)
99 © 2019 by MIP
CONCLUSION
In this study, by using the data collected from three stations, the pedestrian
volume pattern was generated. The distribution of pedestrian varies between
spatial and temporal measurement. The highest contribution of pedestrian volume
is during weekday where most of the students will be around the main campus
for lecture time. It also indicates that most of the students will be concentrated in
an area of lecture hall and library. From the findings, the Level of Services (LOS)
were measured. The LOS criteria also strongly depend on the spatial and temporal
distribution as for present study, most of the station experience criterion F during
weekday which explains issues on crowd and congestion while criterion A during
weekend.
Based on the output, the preliminary data can be used to explore diverse
and complex pedestrian-vehicle interactions and pair these with sufficient
considerations when evaluating pedestrian safety. In the future, the development
of walkway designs and the addition of safety and visibility features can reduce
the probability of interactions between crossing pedestrians and vehicles.
Awareness of both drivers and pedestrians to respect each other's space requires
an understanding of where, between whom, and under what circumstances
interactions can occur. Such an approach can also help identify which
engineering, urban design and enforcement programs are needed to ensure safe
pedestrian crossings for all ages. ACKNOWLEDGEMENTS
This research was fully supported by the UPM Putra Grant – Current Issue
9300437 managed by UPM RMC
REFERENCES Almodfer, R., Xiong, S., Fang, Z., Kong, X., & Zheng, S. (2016). Quantitative analysis
of lane-based pedestrian-vehicle conflict at a non-signalized marked crosswalk.
Transportation Research Part F: Traffic Psychology and Behaviour, 42, 468-478.
Cloutier, M.-S., Lachapelle, U., Amours-Ouellet, A.-A. d., Bergeron, J., Lord, S., &
Torres, J. (2017). "Outta my way!" Individual and environmental correlates of
interactions between pedestrians and vehicles during street crossings. Accident
Analysis & Prevention, 104, 36-45.
Iryo-Asano, M., & Alhajyaseen, W. K. M. (2017). Modeling pedestrian crossing speed
profiles considering speed change behavior for the safety assessment of signalized
intersections. Accident Analysis & Prevention, 108, 332-342.
King, M. J., Wood, J. M., Lacherez, P. F., & Marszalek, R. P. (2012) Optimism about
safety and group-serving interpretations of safety among pedestrians and cyclists
in relation to road use in general and under low light conditions. Accident Analysis
& Prevention, 44(1), 154-159.
Mohd Syazwan, S., Baba, M. D., Nur Zarifah, H., Aqbal Hafeez, A., & Noor Faradila, P.
(2016). Prevalence of distracted pedestrians while crossing: A study of Malaysia’s
situation. MATEC Web of Conferences, 90 01031.
Noorain Mohd Isa, Ahmad Zaharin Aris, Zakiah Ponrahono, & Rosta Harun
Vehicle – Pedestrian Conflict: A Case Study in Universiti Putra Malaysia
© 2019 by MIP 100
Ni, Y., Wang, M., Sun, J., & Li, K. (2016). Evaluation of pedestrian safety at
intersections: A theoretical framework based on pedestrian-vehicle interaction
patterns. Accident Analysis & Prevention, 96, 118-129.
Suzuki, K. & Ito, H. (2017). Empirical analysis on risky behaviors and pedestrian-vehicle
conflicts at large-size signalized intersections. Transportation Research Procedia,
25, 2139-2152.
Wazana, A. (1997). Are there injury-prone children? A critical review of the literature.
The Canadian Journal of Psychiatry, 42(6), 602-610.
Zheng, Y., Chase, T., Elefteriadou, L., Schroeder, B., & Sisiopiku, V. P. (2015). Modeling
vehicle-pedestrian interactions outside of crosswalks. Simulation Modelling
Practice and Theory, 59, 89-110
Received: 12th January 2019. Accepted: 2nd August 2019
1Lecturer at Universiti Putra Malaysia. Email: [email protected] 101
PLANNING MALAYSIA:
Journal of the Malaysian Institute of Planners
VOLUME 17 ISSUE 2 (2019), Page 101 – 111
EVALUATING CAPACITY BUILDING OF THE LOCAL
COMMUNITY TOWARDS ENVIRONMENTAL CONSERVATION IN
AN ESTUARINE COMMUNITY, KONG KONG LAUT, JOHOR
Faradiella Mohd Kusin1, Amirul Azuan Md Joni2, Ferdaus Mohamat Yusuff3,
& Sharifah Nur Munirah Syed Hasan4
1,2,3,4Faculty of Environmental Studies
UNIVERSITI PUTRA MALAYSIA
Abstract
Key community-based environmental conservation programmes in Kong Kong
Laut, Johor include the river and mangrove ecosystem conservation and
management programme. The overall aim of conserving the ecosystem and
encouraging local community participation in the programme is to promote the
existing eco-tourism potential of the area. This paper entails the outcomes of
community-based activities aimed at building the capacities of local communities
through community mobilisation, awareness creation and capacity building (i.e.
transferred knowledge and skills). Findings indicate that there have been
improvements in the river water quality status within the ecosystems over the
course of a one-year project, despite relatively small participation among the local
communities in the conservation programme. However, it was evident that active
participation from a minority group of the local community has contributed to
significant human and social capital, suggesting that community empowerment
might be crucial for future development. Despite this, a school outreach
programme on waste minimisation within the community demonstrated an
encouraging level of participation among school children and teachers. The major
challenge to maintaining continuous efforts to conserve their environment is the
simultaneous developments taking place close to the river and mangrove
ecosystems. While it remains a challenge to all the stakeholders, collaborative
efforts among the local communities and the university, school, government
agencies and private sector have made it possible to strategise for more future
approaches that will benefit the whole community.
Keywords: Knowledge transfer, environmental conservation, capacity building,
local community, awareness, water quality
Faradiella Mohd Kusin, Amirul Azuan Md Joni, Ferdaus Mohamat Yusuff, Sharifah Nur Munirah Syed Hasan
Evaluating Capacity Building of the Local Community Towards Environmental Conservation in an Estuarine
Community, Kong Kong Laut, Johor
© 2019 by MIP 102
INTRODUCTION
The role of university engagements in capacity building programmes has been
undeniably important in helping to develop and strengthen the skills and abilities
that communities need in order to adapt and thrive in a changing environment.
Capacity building not only focuses on internal activities among students and
university staff towards building their capacities, but rather, the focus has now
extended to externally-oriented activities aimed at building capacity within a
local community to promote engagement in a wider group of stakeholders.
Universities may either lead such activities, or be the key partner in endeavours
to empower communities in order to address challenges (Shiel, Filho, do-Paco,
& Brandli, 2016). This will enable communities to develop sustainable ways of
living through facilitation, community learning and continuous efforts to build
their capacities.
This paper presents the processes and outcomes of community
development and conservation programmes aimed at improving participation and
building capacity in a local community. It assesses the extent to which the
approaches have contributed to more sustainably-managed environments and
increased awareness among the local communities through the transferred
knowledge and skills.
The greatest challenge in the conservation and management of river and
mangrove ecosystems in Kong Kong Laut, Johor comes from the simultaneous
developments taking place close to the river ecosystem and the various
anthropogenic activities along the coast. The mangrove ecosystem is very diverse
in its composition and has become one of the main attractions of the local
community in terms of eco-tourism potential. Therefore, such a conservation
effort would essentially help in maintaining and sustaining the river and
mangrove ecosystems’ functions in the particular environment. This paper
describes the experiences gained in the community-based programme in which
the overall objective is the conservation and management of the river and
mangrove ecosystems. In addition, involvement and active participation of local
communities have been identified as key to integrating the diverse perspectives
of the local communities (Raburu, Wa’Munga, & Okeyo-Owuor, 2012).
METHODS
Programme Planning
The activities conducted throughout the conservation project were planned on a
quarterly basis over a period of one year starting with community mobilisation,
awareness creation and capacity building in an attempt to encourage full
participation from the local communities.
PLANNING MALAYSIA
Journal of the Malaysia Institute of Planners (2019)
103 © 2019 by MIP
Approaches Used in the Conservation Programme
Community Mobilisation
At the beginning of the project, community leaders and representatives were
mobilised and brought for a tour within the river ecosystems to enable them to
recognise environmental problems and the potential to improve existing eco-
tourism within the area. A focused-group discussion was then conducted where
they discussed the causes of environmental problems, possible ways of mitigating
the issues and strategies for future eco-tourism development in their local
community. Members of the community were also mobilised and given the
opportunity to visit other local communities having the same ecosystem
characteristics as theirs. Apart from the community members, teachers from a
primary school located in the project area were also involved in order to indirectly
encourage participation among school children.
Awareness Creation
Awareness brings issues to the attention of individuals or key groups who have
the power to influence outcomes (Stephen, Jai, Syma, & Laly, 2000). According
to Bahir (2010), a typical awareness-raising cycle includes, namely: capturing the
attention of stakeholders and stimulating their interest; improving the public’s
knowledge and understanding; enhancing social skills and competencies for
change; increasing capacity to implement change; and finally, implementing the
change and evaluating progress made.
In order to attract maximum participation from stakeholders in the
conservation programme, several approaches towards crafting awareness
programmes and activities were carried out, as different approaches were targeted
for different stakeholders (Figure 1). For instance, a two-day conservation and
community service programme in the local community provided opportunities to
create awareness to a wider group of stakeholders, including government
officials, the private sector, school children, and the general public. In this
programme, local communities were informed of the importance of
environmental conservation so as to facilitate their understanding on the
importance of maintaining sustainable environments.
Apart from this programme, the role played by the school in awareness
creation through a school outreach programme was outstanding. Activities
involving the school children were designed to create life-long awareness among
the pupils and the general public. All activities conducted such as the waste
minimisation and recycling programme were organised in the form of
competitions among the primary school children and the general public (local
communities of Kampung Sg Latoh and Kong Kong Laut). The theme for the
competitions was set in accordance with the waste management programme, (i.e.
From Waste to Solution). The best products from the waste minimization
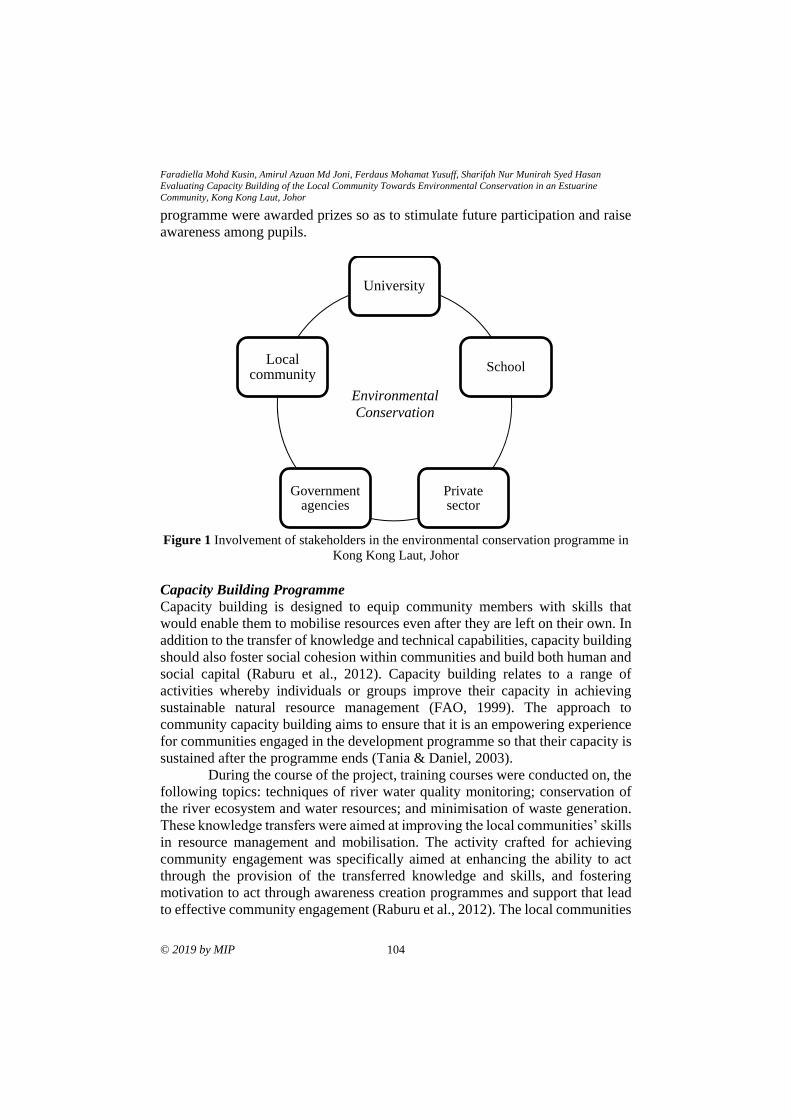
Faradiella Mohd Kusin, Amirul Azuan Md Joni, Ferdaus Mohamat Yusuff, Sharifah Nur Munirah Syed Hasan
Evaluating Capacity Building of the Local Community Towards Environmental Conservation in an Estuarine
Community, Kong Kong Laut, Johor
© 2019 by MIP 104
programme were awarded prizes so as to stimulate future participation and raise
awareness among pupils.
Figure 1 Involvement of stakeholders in the environmental conservation programme in
Kong Kong Laut, Johor
Capacity Building Programme
Capacity building is designed to equip community members with skills that
would enable them to mobilise resources even after they are left on their own. In
addition to the transfer of knowledge and technical capabilities, capacity building
should also foster social cohesion within communities and build both human and
social capital (Raburu et al., 2012). Capacity building relates to a range of
activities whereby individuals or groups improve their capacity in achieving
sustainable natural resource management (FAO, 1999). The approach to
community capacity building aims to ensure that it is an empowering experience
for communities engaged in the development programme so that their capacity is
sustained after the programme ends (Tania & Daniel, 2003).
During the course of the project, training courses were conducted on, the
following topics: techniques of river water quality monitoring; conservation of
the river ecosystem and water resources; and minimisation of waste generation.
These knowledge transfers were aimed at improving the local communities’ skills
in resource management and mobilisation. The activity crafted for achieving
community engagement was specifically aimed at enhancing the ability to act
through the provision of the transferred knowledge and skills, and fostering
motivation to act through awareness creation programmes and support that lead
to effective community engagement (Raburu et al., 2012). The local communities
University
School
Private sector
Government agencies
Local community
Environmental
Conservation
PLANNING MALAYSIA
Journal of the Malaysia Institute of Planners (2019)
105 © 2019 by MIP
were also motivated to develop their leadership skills. Apart from the community
members, the university staff also benefited from the various aspects of the
capacity building activities.
Community Participation
Participation of all stakeholders including the local community, university
community, school community, government agency and private sector was
measured by evaluating the number of actual participation from the targeted
number of participants from each target groups. The degree of participation was
denoted as having satisfactory or unsatisfactory involvement based on the number
of actual participation ranked from low to high percentage of participation. Local
community participation was further evaluated through a cross-sectional survey
involving the local communities within the ecosystem to exemplify their
awareness and satisfaction on the conservation programme as well as their
willingness to participate in the capacity building programmes. The local
communities were informed of the activities so that they were aware of the
conservation programme.
Monitoring Programme
In order to ensure the effectiveness of this programme, continuous monitoring
was carried out each month for one year. A field monitoring programme for
observing the improvement of water quality was performed during the period
April to December 2015. This was intended to assess whether any improvement
had been made after the commissioning of the conservation programme starting
November 2014. Monitoring of the water quality was undertaken at several
locations (S1-S5) as shown in Figure 2. Description of the monitored locations is
given in Table 1. Multiple activities that are taking place in the vicinity of the
study area could directly or indirectly cause an impact on the quality of the river
water (Kusin et al., 2017). As such, the conservation programme was centralised
in the areas that are potentially affected by various activities within and nearby
the river ecosystem.
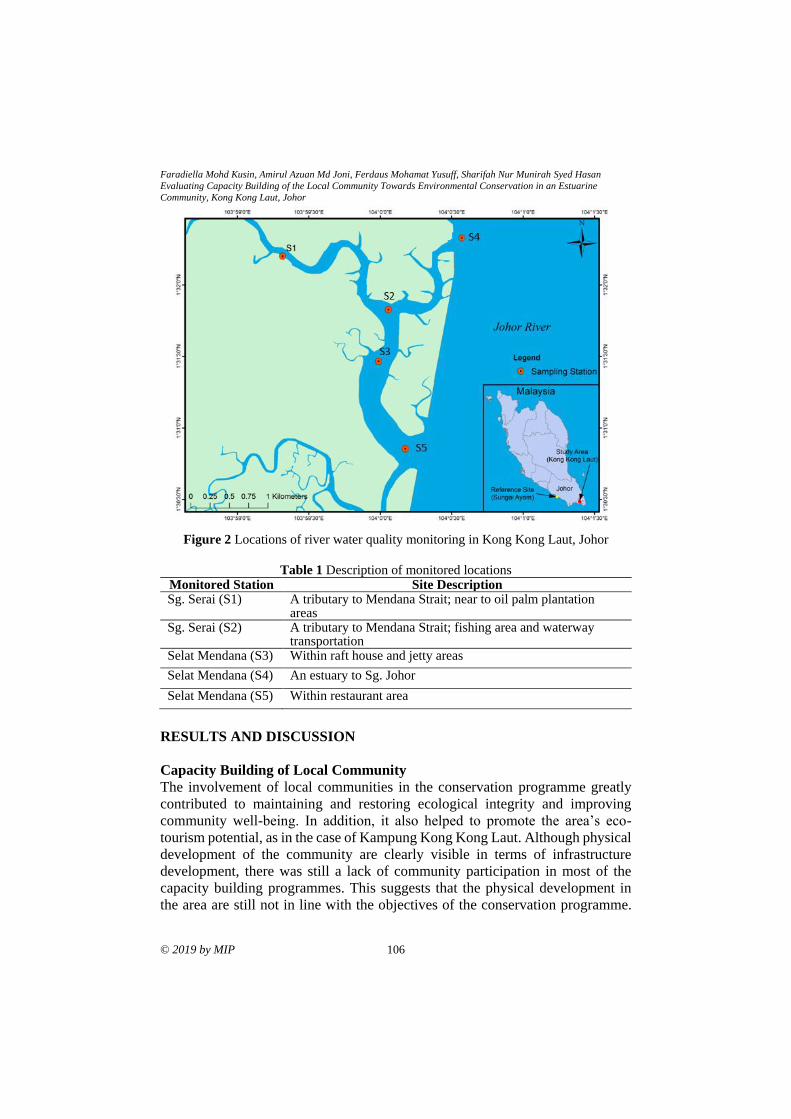
Faradiella Mohd Kusin, Amirul Azuan Md Joni, Ferdaus Mohamat Yusuff, Sharifah Nur Munirah Syed Hasan
Evaluating Capacity Building of the Local Community Towards Environmental Conservation in an Estuarine
Community, Kong Kong Laut, Johor
© 2019 by MIP 106
Figure 2 Locations of river water quality monitoring in Kong Kong Laut, Johor
Table 1 Description of monitored locations Monitored Station Site Description Sg. Serai (S1) A tributary to Mendana Strait; near to oil palm plantation
areas Sg. Serai (S2) A tributary to Mendana Strait; fishing area and waterway
transportation Selat Mendana (S3) Within raft house and jetty areas
Selat Mendana (S4) An estuary to Sg. Johor
Selat Mendana (S5) Within restaurant area
RESULTS AND DISCUSSION
Capacity Building of Local Community
The involvement of local communities in the conservation programme greatly
contributed to maintaining and restoring ecological integrity and improving
community well-being. In addition, it also helped to promote the area’s eco-
tourism potential, as in the case of Kampung Kong Kong Laut. Although physical
development of the community are clearly visible in terms of infrastructure
development, there was still a lack of community participation in most of the
capacity building programmes. This suggests that the physical development in
the area are still not in line with the objectives of the conservation programme.
PLANNING MALAYSIA
Journal of the Malaysia Institute of Planners (2019)
107 © 2019 by MIP
However, active participation from a minority segment of the local communities
has been a great contribution. Despite the relatively small number of active
participation, this group has contributed to significant growth of human and social
capital within their community. Thus, this choice had indirectly created 2 groups
of social capital within the local communities, namely, the uncooperative group
and the cooperative group. Social capital can be defined as the social relationship
of individuals or groups (Agnitsch, Flora, & Ryan, 2006; Matarasso, 2007). It
may facilitate transactions among groups of a particular interest, while excluding
other groups from access to resources (Warren, Acciaioli, Steenbergen, &
McCarthy, 2015). The existence of the uncooperative group arises basically
because they feel uncomfortable with outside interference as they are aware of
the implications (Sudarmono, Sulehan, & Bakar, 2012). One of the implications
that usually eventuate is the lowering of their social status compared to the
outsiders, who are viewed as having high status. Thus, they have to work hard to
obtain more resources in order to achieve higher benefits. On the other hand, the
cooperative group was willingly involved in the activities as their own motivation
drove them to use the resources available for the benefit of the whole community.
As monitoring and data collection processes were continuous throughout
the period of the project, it became evident that the uncooperative group not only
had a fragile relationship with the cooperative group (even though they come
from within the same community (bonding social capital)), but also with outsiders
(linking social capital). In this case, the implication was other organisations.
According to Woolcock & Narayan (2000), linking social capital has a major
influence on helping individuals or communities to gain power to control their
lives in many aspects, including environmental circumstances within a
community’s living area. Furthermore, the new interventions made the
uncooperative group feel threatened, especially when they were trying to
maintain their existing lifestyles. The conflict occurred when there were
interventions through specific regulations and mechanisms that attempt to
interfere with the local community’s daily practices. This is also one of the factors
that may lead to the fragility of linking social capacity, which is influential to help
a community gain access to other resources and thus, improve their quality of life
(Woolcock & Narayan, 2000).
Local Community Participation
The overall participation from stakeholders over the course of the programme is
summarised in Table 2. Participants’ involvement was ranked according to the
percentage of participation from each groups; poor (0-25%), low (16-50%),
moderate (51-75%) and high (76-100%). Satisfactory involvement denotes
moderate to high participation from the targeted number of participants from each
group. It was evident that participation from the local communities of Kg. Sg.
Latoh and Kong Kong Laut was still at unsatisfactory level. Therefore, the local
Faradiella Mohd Kusin, Amirul Azuan Md Joni, Ferdaus Mohamat Yusuff, Sharifah Nur Munirah Syed Hasan
Evaluating Capacity Building of the Local Community Towards Environmental Conservation in an Estuarine
Community, Kong Kong Laut, Johor
© 2019 by MIP 108
communities were evaluated of their awareness on the conservation programme,
satisfaction towards existing condition of the ecosystem, so as their willingness
to participate in the capacity building programme.
Table 2 Summary of participation of stakeholders/target groups
Stakeholder/target group Role Remarks University (researchers and students of Faculty of Environmental Studies, UPM)
Project team / Programme leader/ Facilitator/ Demonstrator
Satisfactory involvement by all members
Local community (Communities of Kg. Sg Latoh and Kong Kong Laut)
Permanent residents/villagers
Unsatisfactory involvement
Local community (members of Koperasi Kg Sg Latoh Berhad)
Initiator to community infrastructure development, managing the eco-tourism sector
Satisfactory involvement by a minority of active members
School community (primary school-SK Kong Kong Laut)
Teacher/educator Pupils
Satisfactory involvement by all members
Government agency (IRDA)
Development funder Satisfactory involvement
Private sector (individual companies)
Service provider Satisfactory involvement
The local communities included communities of Kg. Sg. Latoh and Kong
Kong Laut, as well as members of Koperasi Kg. Sg. Latoh Berhad. This includes
a range of communities aging between 20-70 years and having education
background of between secondary school certificate and bachelor’s degree
holders. In terms of awareness creation, it was found that majority of the local
communities were aware of the conservation programmes taking place within
their ecosystem. However, more than half of them were having lower satisfaction
towards existing riverine ecosystem conditions. This was mainly due to current
physical development across their community that may hinder synchronised
integration between natural resources management and rural development.
Despite having high intention to participate in the conservation
programmes, the level of participation in the community was closely related with
their social and economic needs. The older generation and members of Koperasi
Kg. Sg. Latoh Berhad were the active participating communities because they
were the initiator to the community infrastructure development and responsible
for the eco-tourism sector within the community. They also believed that
environmental conservation is equally important to physical and eco-tourism
development that has long served as their main source of income. The younger
PLANNING MALAYSIA
Journal of the Malaysia Institute of Planners (2019)
109 © 2019 by MIP
generation showed lesser extent of participation partly because they are less sure
of their ability to contribute to such programmes and due to time availability.
Factors Influencing Capacity Building on Environmental Conservation in a
Local Community
Factors that influenced the outcomes of the conservation programme in Kong
Kong Laut based on local experiences with capacity building approaches are
given in Table 3. These are summarised according to several basic principles,
which must be put in practice for community-based natural resource management
approaches (Addun & Muzones, 1997).
Table 3 Factors that influence capacity building on environmental conservation in Kong
Kong Laut Influencing factor Requirements for improvement
*Empowerment – the actual transfer of economic and political power from the operationalisation of community management
Wider cooperation between leaders and organisation members is needed
*Sustainability – ensure development through resource extraction practices, intra-generational equity and equity between present and future generations
A systematic incorporation of the conservation approach is needed to bridge the gap between young and senior members
*Equity – where communities as a whole rather than only a few individuals benefit
Attention is required to encourage participation of marginalised groups
Timeframe Interventions require longer time frames to enable adaptive learning
*As defined by Addun & Muzones (1997)
Partnerships in the Community Conservation Programme
Partnerships in community-based programme are important in order to achieve
sustained and continuous capacity building among all the stakeholders. Over the
course of the project, several collaborative activities were carried out with
collaboration among local communities, government agencies, the university and
the private sector respectively. The activities included a series of workshops and
awareness programmes such as: Awareness Campaign on Waste Management;
Workshop on Pytoremediation Technique; Waste-to-Solution Competition; and
an educational visit by the stakeholders. The major government agencies that
worked closely with the project were the Iskandar Regional Development
Authority (IRDA) and the Department of Fisheries, Johor. IRDA is a Malaysian
Federal Government statutory body responsible for regulating and fostering
stakeholders’ involvement towards sustainable development within Iskandar
Malaysia. The project also benefitted from contributions by private companies
that have helped in enhancing and promoting the eco-tourism potential of the
village.
Faradiella Mohd Kusin, Amirul Azuan Md Joni, Ferdaus Mohamat Yusuff, Sharifah Nur Munirah Syed Hasan
Evaluating Capacity Building of the Local Community Towards Environmental Conservation in an Estuarine
Community, Kong Kong Laut, Johor
© 2019 by MIP 110
CONCLUSION
A sustained and successful conservation programme requires a good relationship
between both the bonding social capital and influential linking social capital. This
reflects the potential for an effective transfer of knowledge and skills. It is crucial
that such a relationship would improve in various aspects, thus enabling them to
attain better capacities of life in facing challenges. Experiences gained from the
community-based programme have exemplified significant roles from all
stakeholders involved, although continuous efforts will still have to be made to
stimulate full participation among local communities. Community sustainability
was seen as an important tool to facilitate wider cooperation among the local
public, as it was evident that they do have the capacity to further develop their
areas by integrating natural resources. This is clearly in line with the overall
objective of the conservation programme, despite having to face changing
environments as a result of current physical developments across their
community.
ACKNOWLEDGEMENTS
The authors would like to thank the University Community Transformation
Centre (UCTC) of Universiti Putra Malaysia for providing the financial support
for the project through the Knowledge Transfer Grant Scheme (KTGS) grant no:
KTGS/9437505 and the Ministry of Higher Education Malaysia through the grant
FRGS/5540081. Thanks are also due to all the community members of Kong
Kong Laut, Johor and Koperasi Kg. Sg. Latoh Berhad for the direct and indirect
support of the project.
REFERENCES Addun, R. P. & Muzones, D. M. (1997). Community-based coastal resource management
(CBCRM): Tambuyog’s experience in the Philippines. In G. F. Claridge, & B.
O’Callaghan (Eds.), Community involvement in wetland management: lessons
from the field (pp. 219-230). Kuala Lumpur: Wetlands International.
Agnitsch, K., Flora, J. & Ryan, V. (2006). Bonding and bridging social capital: The
interactive effects on community action. Community Development, 37(1), 36-51.
Bahir, D. (2010). Sensitization and awareness raising strategy Tana-Beles WME Reports.
Orgut & Niras No 11: 24 pp.
FAO. (1999). Incentives systems for natural resources management: The role of indirect
incentives. Report No. 99/023 IFAD-RAF.
Kusin, F. M., Rahman, M. S. A., Madzin, Z., Jusop, S., Mohamat-Yusuff, F., Ariffin, M.,
& Zahar, M.S.M. (2017). The occurrence and potential ecological risk assessment
of bauxite mine-impacted water and sediments in Kuantan, Pahang, Malaysia.
Environmental Science & Pollution Research, 24(2), 1306-1321.
Matarasso, F. (2007). Common ground: Cultural action as a route to community
development. Community Development Journal, 42(4), 449-458.
Raburu, P. O., Wa’Munga, P. O., & Okeyo-Owuor, J. B. (2012). Experiences from
community participation in managing Nyando Wetland, Lake Victoria Basin,
PLANNING MALAYSIA
Journal of the Malaysia Institute of Planners (2019)
111 © 2019 by MIP
Kenya. Nairobi, Kenya: Kenya Disaster Concern - VIRED - UNDP.
Shiel, C., Filho, W. L, do-Paco, A., & Brandli, L. (2016). Evaluating the engagement of
universities in capacity building for sustainable development in local
communities. Evaluation and Program Planning, 54, 123-134.
Stephen, R. K., Jai, N. M., Syma, A. E., & Laly, L. L. (2000). Community natural
resource management: Promise, rhetoric, and reality. Society and Natural
Resources, 13, 705-715.
Sudarmono, Sulehan, J., & Bakar, N. R. A (2012). Patron-client relationship of urbanized
fishing communities in Makassar. International Journal on Social Science,
Economics and Art, 2, 1-5.
Tania, M. S., & Daniel, J. D. (2003). Social learning for collaborative natural resource
management. Society and Natural Resources, 15, 309-326.
Warren, C., Acciaioli, G., Steenbergen, D., & McCarthy, J. (2015). Social capital
formation in community development and conservation interventions:
Comparative research in Indonesia. Brief for GSDR 2015.
Woolcock, M., & Narayan, D. (2000). Social capital: Implications for development
theory, research, and policy. World Bank Research Observer, 15(2), 225-250
Received: 12th January 2019. Accepted: 2nd August 2019
1Student at Universiti Putra Malaysia. Email: [email protected] 112
PLANNING MALAYSIA:
Journal of the Malaysian Institute of Planners
VOLUME 17 ISSUE 2 (2019), Page 112 – 122
QUANTIFYING THE ORGANIC WASTE GENERATED FROM THE
FRESH MARKET IN KUNDASANG TOWN, SABAH
Nurul Nadia Fatiha Yaacob1, Latifah Abd Manaf2
& Zulfa Hanan Ash'aari3
1,2,3Faculty of Environmental Studies
UNIVERSITI PUTRA MALAYSIA
Abstract
It is necessary to assess solid waste generation to identify the rate by which we
generate waste. A rapid increase in solid waste generation constitutes a significant
challenge for developing countries such as Malaysia. Municipal Solid Waste
(MSW) is the primary source of solid waste generated in Malaysia and covers
64% of the total waste composition. 45% of the average composition of
Malaysian MSW is dominated by organic waste (e.g. food, vegetable and fruits).
This is followed by recyclable waste (e.g. plastic, paper and metal) at 30% with
the remaining made up of non-recyclable waste (e.g. polystyrene). The Fresh
Market in Kundasang town, Sabah is a major contributor to the increase of
organic waste generated in the Ranau district. As such, it has the potential to
implement effective composting practices. This study was conducted to
determine the total amount of organic waste generated as well as the organic
waste generation rate in the Fresh Market. The sampling was conducted among
148 sellers in the Fresh Market over a period of two weeks (5th August - 18th
August 2017). Total organic waste generation was 13,147.50kg, while the organic
waste generation rate was 6.35kg/premise/day. The value for municipal solid
waste generation recorded by Majlis Daerah Ranau (MDR) in three varied routes
of Kundasang during August 2017 (Jalan Pekan Kundasang, Jalan Mesilou and
Jalan Kota Kinabalu) were 17 tonnes, 15 tonnes and 13 tonnes respectively. This
shows that the solid waste generated in Jalan Pekan Kundasang was the highest
compare to Jalan Mesilou and Jalan Kota Kinabalu. This study presents the
current status of organic waste generation which can serve as preliminary baseline
information.
Keywords: compost; municipal solid waste; organic waste; waste generation;
waste composition
PLANNING MALAYSIA
Journal of the Malaysia Institute of Planners (2019)
113 © 2019 by MIP
INTRODUCTION
Increased generation of solid waste and its management represents a significant
challenge for Malaysia. Currently, the mean per person of solid waste generation
in Malaysia is 0.85 kg/person/day and an estimated 33,130 tonnes of solid waste
per day is generated, thereby exceeding the projected production of 33,000 tonnes
per day by 2020 (Mohammed, Mustafa, Bashir, & Mokhtar, 2013). The
composition of solid waste in Malaysia is dominated by recyclable waste, but
these wastes are not fully recovered and recycled. The percentage of organic
waste is the highest consisting of up to 63.7% of the total solid waste composition
found in landfill sites. These organic wastes contain high moisture content, and
the bulk density is above 200kg/m2 (Sumiani, Onn, Mohd, & Wan, 2009). Malaysia has undergone substantial change in agricultural exports for all
five regions; the Northern, Central, Southern, East Coast and Eastern with an
estimated population of 8,250 involved in vegetable production (Tey et al., 2014).
A highland altitude is a suitable place for the growth of temperate crops
throughout the year. In Peninsular Malaysia, farmers grow their temperate
vegetables, fruits, flowers and also tea in Cameron Highland due to its conducive
climate (Saadati, Abdullah, Zakaria, Rezayi, & Hosseinizare, 2012). Meanwhile,
in Sabah, temperate vegetables and fruits are grown in Kundasang. Most of these
vegetables and fruits are produced by smallholder farmers to fulfil the demand of
local community members and/or tourists. Wholesale traders then buy these
agricultural products from the Fresh Market in Kundasang town. This Fresh
Market contains small stalls selling a variety of fresh food such as vegetables and
fruit.
In Sabah, an estimated 1.4 million tonnes of solid waste was generated,
and the volume is increasing rapidly (Ministry of Housing and Local
Government, 2013). Kundasang is the most-visited destination in Sabah by both
local and international tourists due to its proximity to Mount Kinabalu (the
highest mountain in Southeast Asia). Increased tourist numbers and rapid
economic development have led to significant increases in the volume of solid
waste being generated in this area. Additionally, most wholesale vegetables from
Sandakan (east coast) and Kota Kinabalu (west coast) are sent directly to
Kundasang. As such, Kundasang is regarded as a regional hub for fresh produce
distribution due to its strategic geographic location and accessibility. The roads
linking Kota Kinabalu, Kundasang and Sandakan, are among the first paved roads
to be built in Sabah and were completed in 1972 (Dambul & Buang, 2017).
The recent rapid expansion of agriculture production in this area has also
led to increased generation of organic waste. These organic waste materials need
to be managed sustainably to avoid the depletion of natural resources, minimise
risk to human health, reduce environmental burdens and maintain an overall
balance in the ecosystem. One method of archiving this is by composting as it is
low-cost and environmentally-friendly. According to Agamuthu, Khidzir and
Nurul Nadia Fatiha Yaacob, Latifah Abd Manaf & Zulfa Hanan Ash'aari
Quantifying of Organic Waste Generation from Fresh Market, Kundasang Town, Sabah.
© 2019 by MIP 114
Hamid (2009), in order to structure a proper solid waste (SW) management
practice for a given region, it is essential to know the quantity of waste generated
and its composition before any implementation process can take place.
Thus, this study aims to determine the total amount of organic waste
production together with organic waste generation rates (waste generation per
premise) in the Fresh Market in Kundasang town, Sabah. The data were obtained
to identify the majority of the organic waste generation rates by the sellers in the
Fresh Market. The study provides preliminary baseline information for the
decision-making stage for planning and management plans.
RESEARCH BACKGROUND
This study was conducted at Kundasang, located in the Sabah highlands. It is
among the most popular tourist destinations in Sabah because of its proximity to
Mount Kinabalu. Historically, Kundasang is a rural area, which has grown from
a small town into a popular leisure destination for visitors from all over the world.
As a result, the area has experienced increased development of resorts and
homestay accommodation making tourism the main activity in Kundasang with
most of the villagers working as farmers and/or sellers of fresh vegetables at the
small stalls in Kundasang town. However, the tourism activities have affected the
environment as rising consumption has increased municipal solid waste
generation, especially organic waste. The total agricultural area in Kundasang is 18,085.2 hectares. It is
experiencing continuous growth in agricultural activities (Roslee, Tahir, Musta
& Omang, 2010). The Fresh Market in Kundasang is located between Mount
Kinabalu and Ranau town (six kilometres from the southeast side of Mount
Kinabalu and 12 kilometres from Ranau town). The Fresh Market houses 235
sellers who operated from small stalls selling vegetables and fruits. These stalls
contribute to the production of large amounts of organic waste. The typical seller
is a mature adult woman aged between 40 to 59 years. Business operations extend
from 7am to 6pm (Monday to Saturday). Figure 1 shows the location of the Fresh
Market.
METHODOLOGY
This study focuses on the issue of organic waste generated by the vegetable and
fruit sellers in the Fresh Market. According to the Malaysian Standards
MS2505:2012, solid waste generation includes waste retained for other purposes
and wastes discarded for collection. This refers to direct waste collection either
at the source (e.g. individual premises) and/or from vehicle loads (Edjabou et al.,
2015). This is a quantitative research using the direct measurement of organic
waste, as summarised in Figure 2.
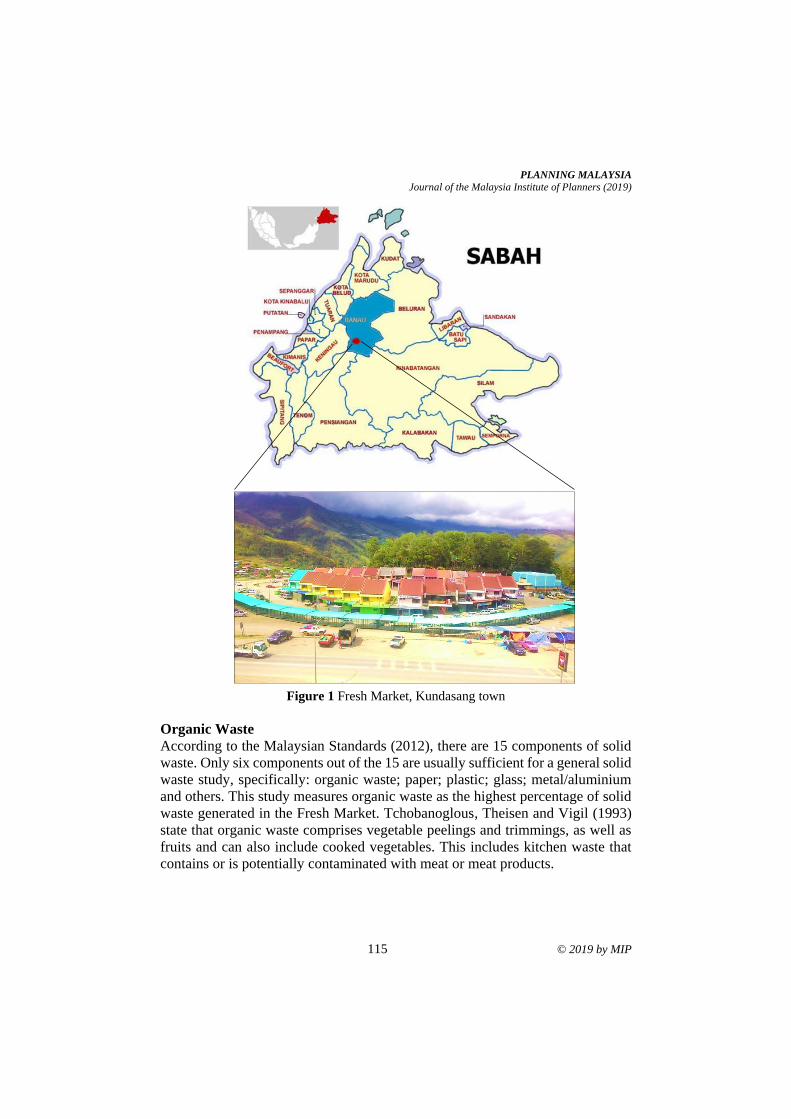
PLANNING MALAYSIA
Journal of the Malaysia Institute of Planners (2019)
115 © 2019 by MIP
Figure 1 Fresh Market, Kundasang town
Organic Waste
According to the Malaysian Standards (2012), there are 15 components of solid
waste. Only six components out of the 15 are usually sufficient for a general solid
waste study, specifically: organic waste; paper; plastic; glass; metal/aluminium
and others. This study measures organic waste as the highest percentage of solid
waste generated in the Fresh Market. Tchobanoglous, Theisen and Vigil (1993)
state that organic waste comprises vegetable peelings and trimmings, as well as
fruits and can also include cooked vegetables. This includes kitchen waste that
contains or is potentially contaminated with meat or meat products.
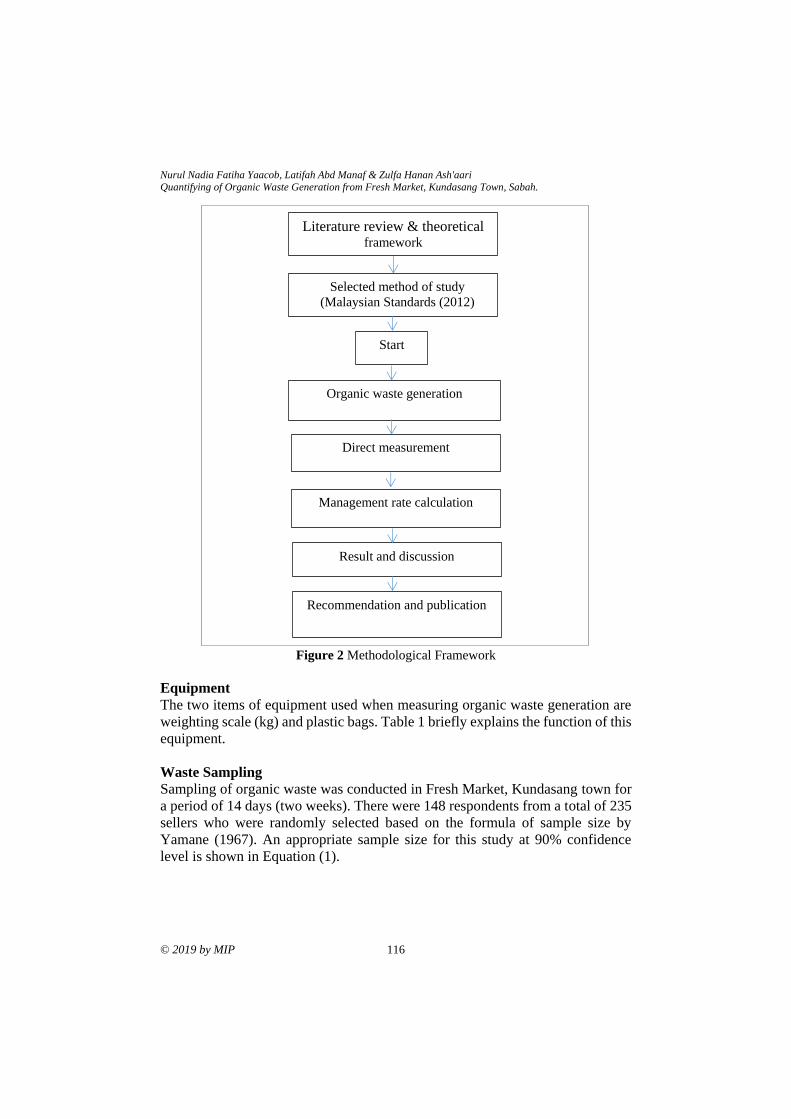
Nurul Nadia Fatiha Yaacob, Latifah Abd Manaf & Zulfa Hanan Ash'aari
Quantifying of Organic Waste Generation from Fresh Market, Kundasang Town, Sabah.
© 2019 by MIP 116
Figure 2 Methodological Framework
Equipment
The two items of equipment used when measuring organic waste generation are
weighting scale (kg) and plastic bags. Table 1 briefly explains the function of this
equipment.
Waste Sampling
Sampling of organic waste was conducted in Fresh Market, Kundasang town for
a period of 14 days (two weeks). There were 148 respondents from a total of 235
sellers who were randomly selected based on the formula of sample size by
Yamane (1967). An appropriate sample size for this study at 90% confidence
level is shown in Equation (1).
Literature review & theoretical framework
Selected method of study
(Malaysian Standards (2012)
Start
Organic waste generation
Direct measurement
Management rate calculation
Result and discussion
Recommendation and publication
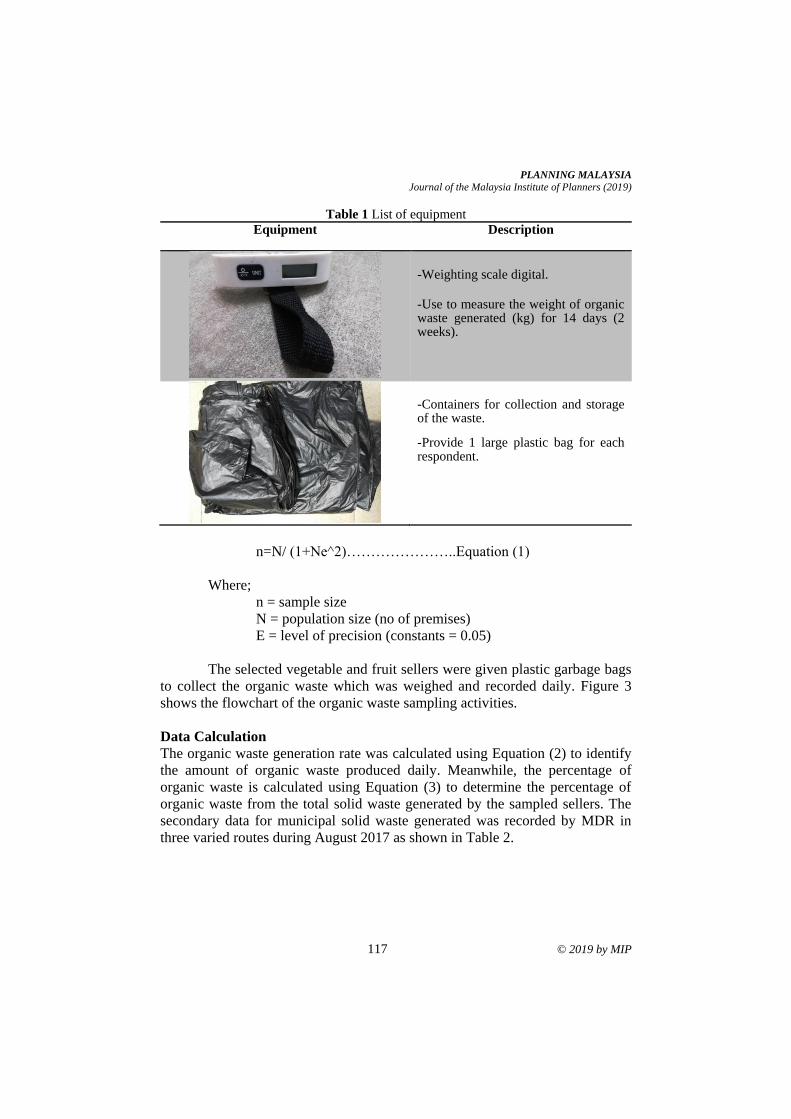
PLANNING MALAYSIA
Journal of the Malaysia Institute of Planners (2019)
117 © 2019 by MIP
Table 1 List of equipment
Equipment Description
-Weighting scale digital.
-Use to measure the weight of organic waste generated (kg) for 14 days (2 weeks).
-Containers for collection and storage of the waste.
-Provide 1 large plastic bag for each respondent.
n=N/ (1+Ne^2)…………………..Equation (1)
Where;
n = sample size
N = population size (no of premises)
E = level of precision (constants = 0.05)
The selected vegetable and fruit sellers were given plastic garbage bags
to collect the organic waste which was weighed and recorded daily. Figure 3
shows the flowchart of the organic waste sampling activities.
Data Calculation
The organic waste generation rate was calculated using Equation (2) to identify
the amount of organic waste produced daily. Meanwhile, the percentage of
organic waste is calculated using Equation (3) to determine the percentage of
organic waste from the total solid waste generated by the sampled sellers. The
secondary data for municipal solid waste generated was recorded by MDR in
three varied routes during August 2017 as shown in Table 2.
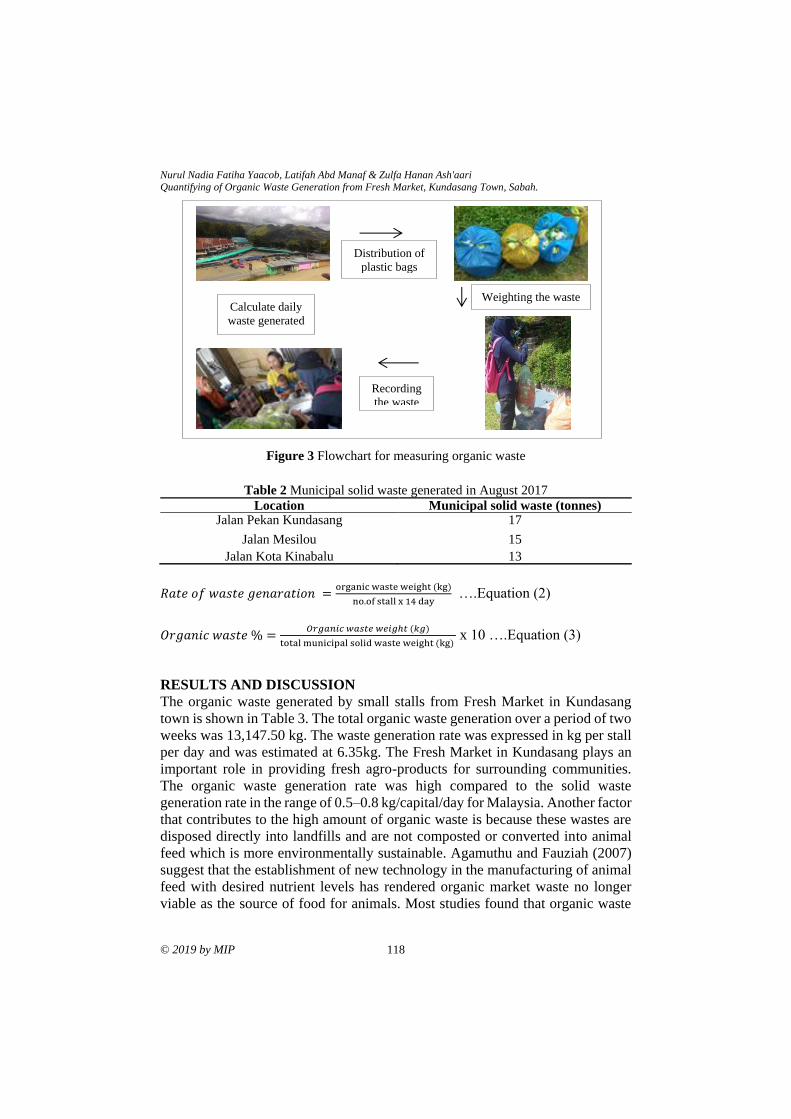
Nurul Nadia Fatiha Yaacob, Latifah Abd Manaf & Zulfa Hanan Ash'aari
Quantifying of Organic Waste Generation from Fresh Market, Kundasang Town, Sabah.
© 2019 by MIP 118
Figure 3 Flowchart for measuring organic waste
Table 2 Municipal solid waste generated in August 2017
Location Municipal solid waste (tonnes) Jalan Pekan Kundasang 17
Jalan Mesilou 15
Jalan Kota Kinabalu 13
𝑅𝑎𝑡𝑒 𝑜𝑓 𝑤𝑎𝑠𝑡𝑒 𝑔𝑒𝑛𝑎𝑟𝑎𝑡𝑖𝑜𝑛 =organic waste weight (kg)
no.of stall x 14 day ….Equation (2)
𝑂𝑟𝑔𝑎𝑛𝑖𝑐 𝑤𝑎𝑠𝑡𝑒 % =𝑂𝑟𝑔𝑎𝑛𝑖𝑐 𝑤𝑎𝑠𝑡𝑒 𝑤𝑒𝑖𝑔ℎ𝑡 (𝑘𝑔)
total municipal solid waste weight (kg) x 10 ….Equation (3)
RESULTS AND DISCUSSION
The organic waste generated by small stalls from Fresh Market in Kundasang
town is shown in Table 3. The total organic waste generation over a period of two
weeks was 13,147.50 kg. The waste generation rate was expressed in kg per stall
per day and was estimated at 6.35kg. The Fresh Market in Kundasang plays an
important role in providing fresh agro-products for surrounding communities.
The organic waste generation rate was high compared to the solid waste
generation rate in the range of 0.5–0.8 kg/capital/day for Malaysia. Another factor
that contributes to the high amount of organic waste is because these wastes are
disposed directly into landfills and are not composted or converted into animal
feed which is more environmentally sustainable. Agamuthu and Fauziah (2007)
suggest that the establishment of new technology in the manufacturing of animal
feed with desired nutrient levels has rendered organic market waste no longer
viable as the source of food for animals. Most studies found that organic waste
Weighting the waste
Distribution of
plastic bags
Recording
the waste
Calculate daily
waste generated
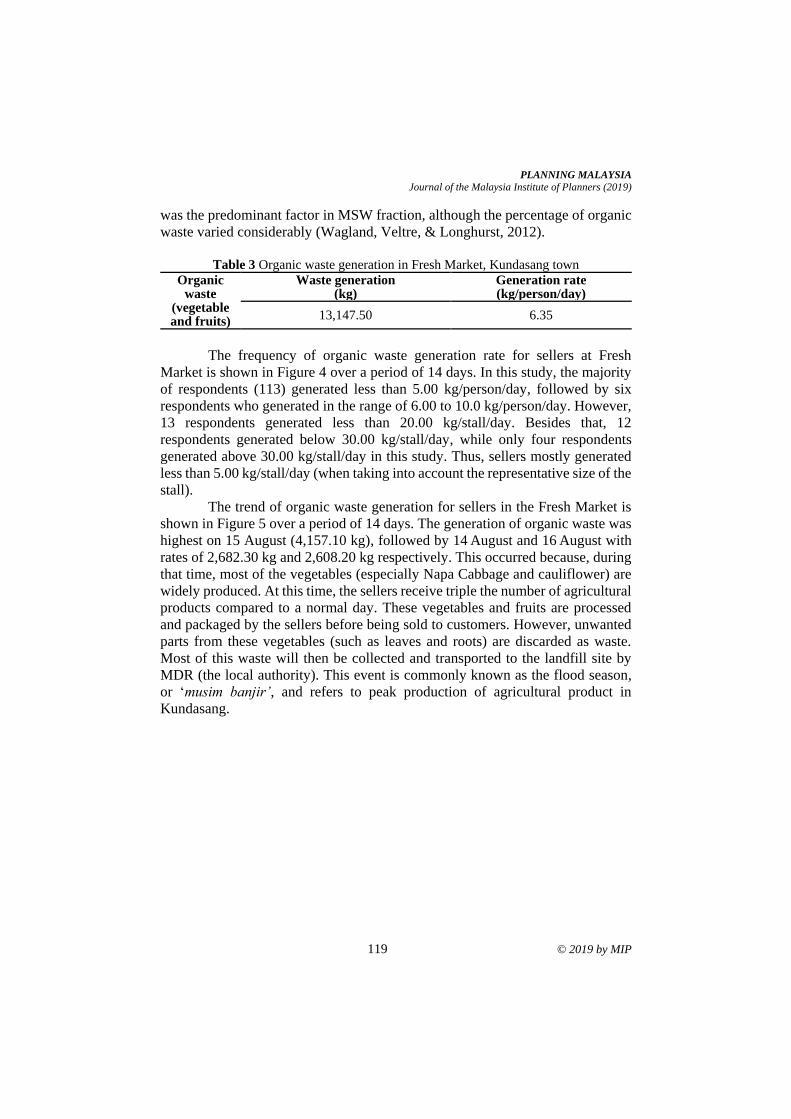
PLANNING MALAYSIA
Journal of the Malaysia Institute of Planners (2019)
119 © 2019 by MIP
was the predominant factor in MSW fraction, although the percentage of organic
waste varied considerably (Wagland, Veltre, & Longhurst, 2012).
Table 3 Organic waste generation in Fresh Market, Kundasang town
Organic waste
(vegetable and fruits)
Waste generation (kg)
Generation rate (kg/person/day)
13,147.50 6.35
The frequency of organic waste generation rate for sellers at Fresh
Market is shown in Figure 4 over a period of 14 days. In this study, the majority
of respondents (113) generated less than 5.00 kg/person/day, followed by six
respondents who generated in the range of 6.00 to 10.0 kg/person/day. However,
13 respondents generated less than 20.00 kg/stall/day. Besides that, 12
respondents generated below 30.00 kg/stall/day, while only four respondents
generated above 30.00 kg/stall/day in this study. Thus, sellers mostly generated
less than 5.00 kg/stall/day (when taking into account the representative size of the
stall).
The trend of organic waste generation for sellers in the Fresh Market is
shown in Figure 5 over a period of 14 days. The generation of organic waste was
highest on 15 August (4,157.10 kg), followed by 14 August and 16 August with
rates of 2,682.30 kg and 2,608.20 kg respectively. This occurred because, during
that time, most of the vegetables (especially Napa Cabbage and cauliflower) are
widely produced. At this time, the sellers receive triple the number of agricultural
products compared to a normal day. These vegetables and fruits are processed
and packaged by the sellers before being sold to customers. However, unwanted
parts from these vegetables (such as leaves and roots) are discarded as waste.
Most of this waste will then be collected and transported to the landfill site by
MDR (the local authority). This event is commonly known as the flood season,
or ‘musim banjir’, and refers to peak production of agricultural product in
Kundasang.
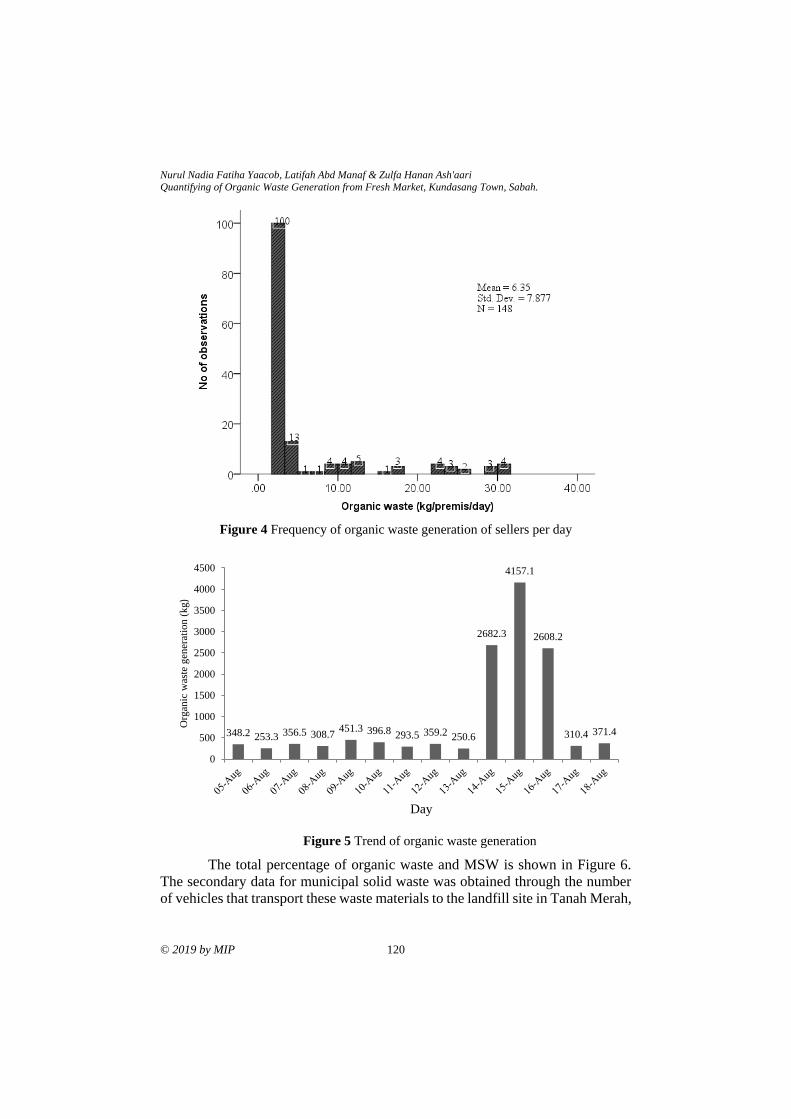
Nurul Nadia Fatiha Yaacob, Latifah Abd Manaf & Zulfa Hanan Ash'aari
Quantifying of Organic Waste Generation from Fresh Market, Kundasang Town, Sabah.
© 2019 by MIP 120
Figure 4 Frequency of organic waste generation of sellers per day
Figure 5 Trend of organic waste generation
The total percentage of organic waste and MSW is shown in Figure 6.
The secondary data for municipal solid waste was obtained through the number
of vehicles that transport these waste materials to the landfill site in Tanah Merah,
348.2 253.3 356.5 308.7451.3 396.8 293.5 359.2 250.6
2682.3
4157.1
2608.2
310.4 371.4
0
500
1000
1500
2000
2500
3000
3500
4000
4500
Org
anic
was
te g
ener
atio
n (
kg
)
Day
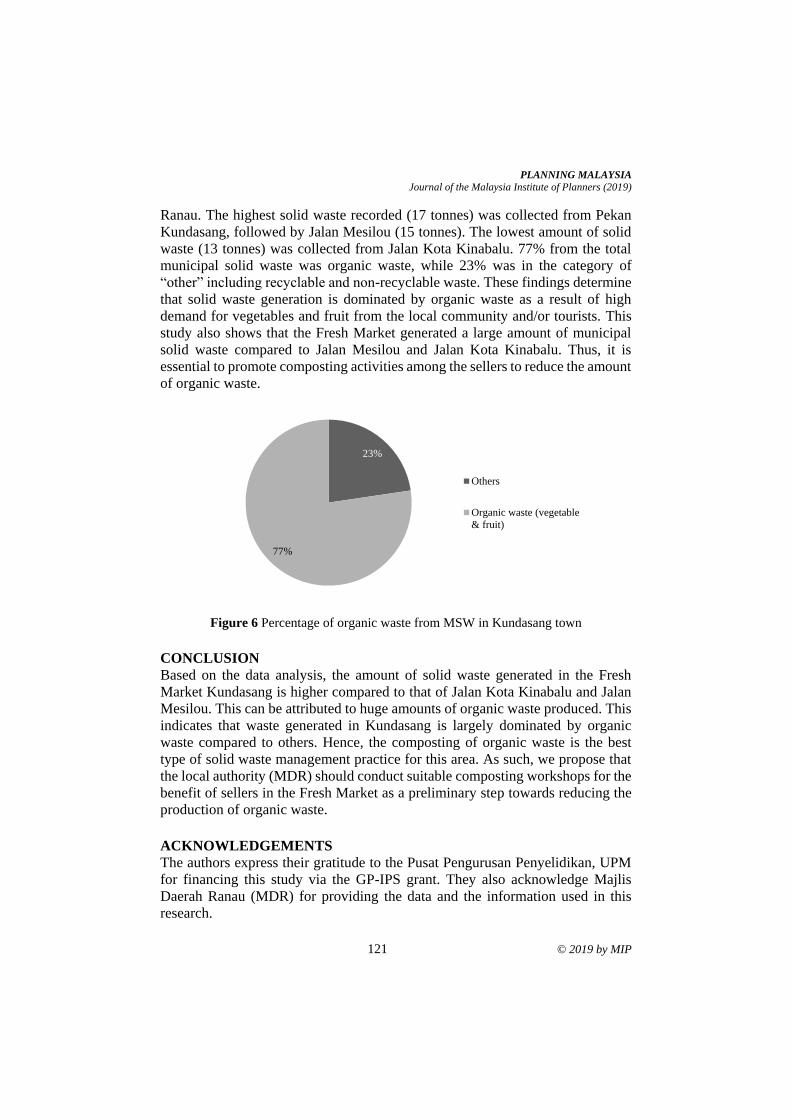
PLANNING MALAYSIA
Journal of the Malaysia Institute of Planners (2019)
121 © 2019 by MIP
Ranau. The highest solid waste recorded (17 tonnes) was collected from Pekan
Kundasang, followed by Jalan Mesilou (15 tonnes). The lowest amount of solid
waste (13 tonnes) was collected from Jalan Kota Kinabalu. 77% from the total
municipal solid waste was organic waste, while 23% was in the category of
“other” including recyclable and non-recyclable waste. These findings determine
that solid waste generation is dominated by organic waste as a result of high
demand for vegetables and fruit from the local community and/or tourists. This
study also shows that the Fresh Market generated a large amount of municipal
solid waste compared to Jalan Mesilou and Jalan Kota Kinabalu. Thus, it is
essential to promote composting activities among the sellers to reduce the amount
of organic waste.
Figure 6 Percentage of organic waste from MSW in Kundasang town
CONCLUSION
Based on the data analysis, the amount of solid waste generated in the Fresh
Market Kundasang is higher compared to that of Jalan Kota Kinabalu and Jalan
Mesilou. This can be attributed to huge amounts of organic waste produced. This
indicates that waste generated in Kundasang is largely dominated by organic
waste compared to others. Hence, the composting of organic waste is the best
type of solid waste management practice for this area. As such, we propose that
the local authority (MDR) should conduct suitable composting workshops for the
benefit of sellers in the Fresh Market as a preliminary step towards reducing the
production of organic waste.
ACKNOWLEDGEMENTS
The authors express their gratitude to the Pusat Pengurusan Penyelidikan, UPM
for financing this study via the GP-IPS grant. They also acknowledge Majlis
Daerah Ranau (MDR) for providing the data and the information used in this
research.
23%
77%
Others
Organic waste (vegetable
& fruit)
Nurul Nadia Fatiha Yaacob, Latifah Abd Manaf & Zulfa Hanan Ash'aari
Quantifying of Organic Waste Generation from Fresh Market, Kundasang Town, Sabah.
© 2019 by MIP 122
REFERENCES Agamuthu, P., & Fauziah, S. H. (2007). Sustainable management of wet market waste.
In Proceedings of the International Conference on Sustainable Solid Waste
Management (pp. 5-7). Centre for Environmental Studies, Department of Civil
Engineering, Anna University.
Agamuthu, P., Khidzir, K. M., & Hamid, F. S. (2009). Drivers of sustainable waste
management in Asia. Waste Management & Research, 27(7), 625-633.
Dambul, R. D., & Buang, A. (2017). Memahami permasalahan pelancongan di
Kundasang, Sabah: Kekuatan dan kelemahan pendekatan positivisme
(Explaining the problems of tourism in Kundasang, Sabah: The strengths and
limitations of the positivist perspective). Geografia-Malaysian Journal of
Society and Space, 4, 20-31.
Edjabou, M. E., Jensen, M. B., Götze, R., Pivnenko, K., Petersen, C., Scheutz, C., &
Astrup, T. F. (2015). Municipal solid waste composition: Sampling
methodology, statistical analyses, and case study evaluation. Waste
Management, 36, 12-23.
Ministry of Housing and Local Government. (2013, October 15). Statistic on average of
solid waste generation in each state. Available at http://www.kpkt.gov.
Mohammed, Y. S., Mustafa, M., Bashir, N., & Mokhtar, A. S. (2013). Renewable energy
resources for distributed power generation in Nigeria: A review of the potential.
Renewable and Sustainable Energy Reviews, 22, 257-268.
Roslee, R., Tahir, S., Musta, B., & Omang, A. K. (2010). Geological inputs for Landslide
Hazard Identification (LHI) in the Trusmadi formation slopes, Sabah, Malaysia.
Borneo Science, 26, 37-51.
Saadati, N., Abdullah, M. P., Zakaria, Z., Rezayi, M., & Hosseinizare, N. (2012).
Distribution and fate of HCH isomers and DDT metabolites in a tropical
environment–case study Cameron Highlands–Malaysia. Chemistry Central
Journal, 6(1), 130.
Sumiani, Y., Onn, C. C., Mohd, D., & Wan, W. Z. (2009). Strategies for planning of
optimum landfill sitting decision-making. Journal of Sains Malaysiana, 457-
462.
Tey, Y. S., Li, E., Bruwer, J., Abdullah, A. M., Brindal, M., Radam, A., & Darham, S.
(2014). The relative importance of factors influencing the adoption of
sustainable agricultural practices: A factor approach for Malaysian vegetable
farmers. Sustainability Science, 9(1), 17-29.
Tchobanoglous, G., Theisen, H., & Vigil, S. (1993). Integrated solid waste management
engineering principles and management issues. Singapore: McGraw-Hill, Inc.
Wagland, S. T., Veltre, F., & Longhurst, P. J. (2012). Development of an image-based
analysis method to determine the physical composition of a mixed waste
material. Waste Management, 32(2), 245-248.
Yamane, T. (1967). Statistics: An introductory analysis (2nd Edition). New York: Harper
and Row
Received: 12th January 2019. Accepted: 2nd August 2019
1Student at Universiti Putra Malaysia. Email: [email protected] 123
PLANNING MALAYSIA:
Journal of the Malaysian Institute of Planners
VOLUME 17 ISSUE 2 (2019), Page 123 – 132
WATER FOOTPRINT OF CROP PRODUCTION IN TEHRAN
PROVINCE
Somayeh Rezaei Kalvani1, Amir Hamzah Sharaai2, Latifah Abd Manaf3,
& Amir Hossein Hamidian4
1,2Faculty of Environmental Studies
UNIVERSITI PUTRA MALAYSIA 3Faculty of Natural Resources
UNIVERSITI of TEHRAN 4Institute of Plantation Studies
UNIVERSITI PUTRA MALAYSIA
Abstract
Evaluation of supply chain of water consumption contributes toward reducing
water scarcity, as it allows for increased water productivity in the agricultural
sector. Water Footprint (WF) is a powerful tool for water management; it accounts
for the volume of water consumption at high spatial and temporal resolution. The
objective of this research is to investigate the water footprint trend of crop
production in Tehran from 2008 to 2015 and to assess blue water scarcity in the
agricultural sector. Water consumption of crop production was evaluated based
on the WF method. Evapotranspiration was evaluated by applying the
CROPWAT model. Blue water scarcity was evaluated using the blue water
footprint-to-blue water availability formula. The results demonstrate that
pistachio, cotton, walnut, almond, and wheat have a large WF, amounting to
11.111 m3/kg, 4,703 m3/kg, 3,932 m3/kg, 3,217 m3/kg, and 1.817 m3/kg,
respectively. Agricultural blue water scarcity amounted to 0.6 (severe water stress
class) (2015–2016). Agricultural water consumption in Tehran is unsustainable
since it contributes to severe blue water scarcity. Tehran should reduce
agricultural water scarcity by reducing the water footprint of the agricultural
sector.
Keywords: blue water footprint, CROPWAT model, green water footprint, water
consumption; water management
Somayeh Rezaei Kalvani, Amir Hamzah Sharaai, Latifah Manaf, & Amir Hossein Hamidian
Water Footprint of Crop Production in Tehran Province
© 2019 by MIP 124
INTRODUCTION
Water is life. This statement refers to the worth of water for individuals and life on
the planet. Water is essential for human beings, and thus access to clean water is
considered a human right. Water crisis is a crucial issue because approximately
1.2 billion people face severe water scarcity (Rijsberman, 2004).
A variety of methods to evaluate water use in the supply chain have been
developed. Allen, Pereira, Raes and Smith (1998) introduced virtual water,
which accounts for water consumption in other countries. Hoekstra and Hung
(2002) introduced a tool to measure water consumption in the supply chain of
products with regard to time and location, which is known as the water footprint
concept. The International Standard Organisation (ISO) provides guidelines for
water footprint assessment, known as ISO14046.
To date, limited WF studies have been done in Iran but all are based on a
national scale. This study addresses this gap by examining the water footprint of
crop production in Tehran province and comparing the trend in water footprint
during the period 2008–2015. Then, blue water stress was evaluated.
Iran is facing severe water scarcity. Water use in Iran was approximately
4.5 billion m3 in 1963. Consumption has increased dramatically to more than 93
billion m3 in 2006 but per capita water use was declined sharply (Zehtabian,
Khosravi, & Ghodsi, 2009). A country will be identified as a water scarcity area
when water availability for one person is lower than 1,700 m3 (Rockstrom &
Falkenmark, 2006). Iran with a population of more than 70 million people is
among the countries facing the most severe water shortage in the world (Madani,
2014). It is claimed that approximately 90% of limited water resources in Iran is
allocated to the inefficient agricultural sector (Madani, 2014). Therefore, it is
essential to account for the water consumption in Tehran to reduce its negative
effect on water resources. This study can help decision makers to prioritise water
consumption in order to achieve optimal water consumption in the agricultural
sector (Tillotson, Liu, Guan, & Pahlow, 2014).
The purpose of this study is to assess the water footprint of different crop
products and compare the water footprint trend from 2008 to 2015. Besides that,
blue water scarcity was evaluated to identify the status of blue water resource in
terms of sustainability.
METHODOLOGY
In this study, the water footprint method created by Hoekstra and Hung (2002) is
used because this approach is more comprehensive assessment for evaluating
water consumption at high spatial and temporal resolution. In this study, the blue
and green water footprints for the production of crops in Tehran province were
evaluated based on the Hoekstra et al. approach (Hoekstra, Chapagain, Aldaya,
& Mekonne, 2011). The annual blue and green water footprint of apple, apricot,
cherry, sour cherry, pear, plum, almond, walnut, pistachio, pomegranate, peach,
PLANNING MALAYSIA
Journal of the Malaysia Institute of Planners (2019)
125 © 2019 by MIP
wheat, alfalfa, barley, bean, cotton, maize, tomato, potato, grapes, melon,
watermelon, and onion were evaluated from 2007 to 2015. The blue water
footprint of growing crops is the fraction of water use by crop CWU blue (m3/ha)
to the yield (ton/ha.), as per Equation (1) (Hoekstra et al., 2011). The green water
footprint is evaluated using a similar method - Equation (2) (Hoekstra et al.,
2011).
WF blue = CWU blue
Y
Equation (1)
WF green = CWU green
Y
Equation (2)
Crop water use (CWU) is assessed based on evapotranspiration (ET).
CWU per crop is evaluated. CWU is defined as the sum of water consumption
for each crop during the growing time in cubic meters to hectare (m3/ha)
(Hoekstra et al., 2011). Crop water use (CWUblue and CWUgreen) is accounted
for by multiplying ET blue and ET green with 10, respectively (Hoekstra et al.,
2011) (Equations (3) and (4)). The evaluation of ET was done during crop growth
from planting day to harvesting day. Lgp refers to length of the growing period.
The value of 10 is used to convert the unit mm to m3/ha.
CWU blue= 10∑ ET bluelgp
d =1 Equation (3)
CWU green= 10∑ ET greenlgp
d=1 Equation (4)
Evaluation of ET was laborious and time consuming. In this study, ETblue
and ETgreen were simulated using the CROPWAT model (Allen et al., 1998). The
requirements for this software are climate data and crop parameters. The output
from the CROPWAT software includes evapotranspiration, effective rainfall, and
irrigation requirements. ETblue was determined by subtracting effective rainfall
from evapotranspiration. However, the green water footprint is the minimum
effective rainfall and evapotranspiration (Hoekstra et al., 2011).
Water Footprint of Crop Production
The water footprint of crop production was assessed by multiplying crop water
footprint (m3/ton) with volume of production (ton/year) in a year. In this study,
the green and blue water footprints were calculated by multiplying water
footprint with annual production ((Equations (5) and (6)) (Boer, 2014).
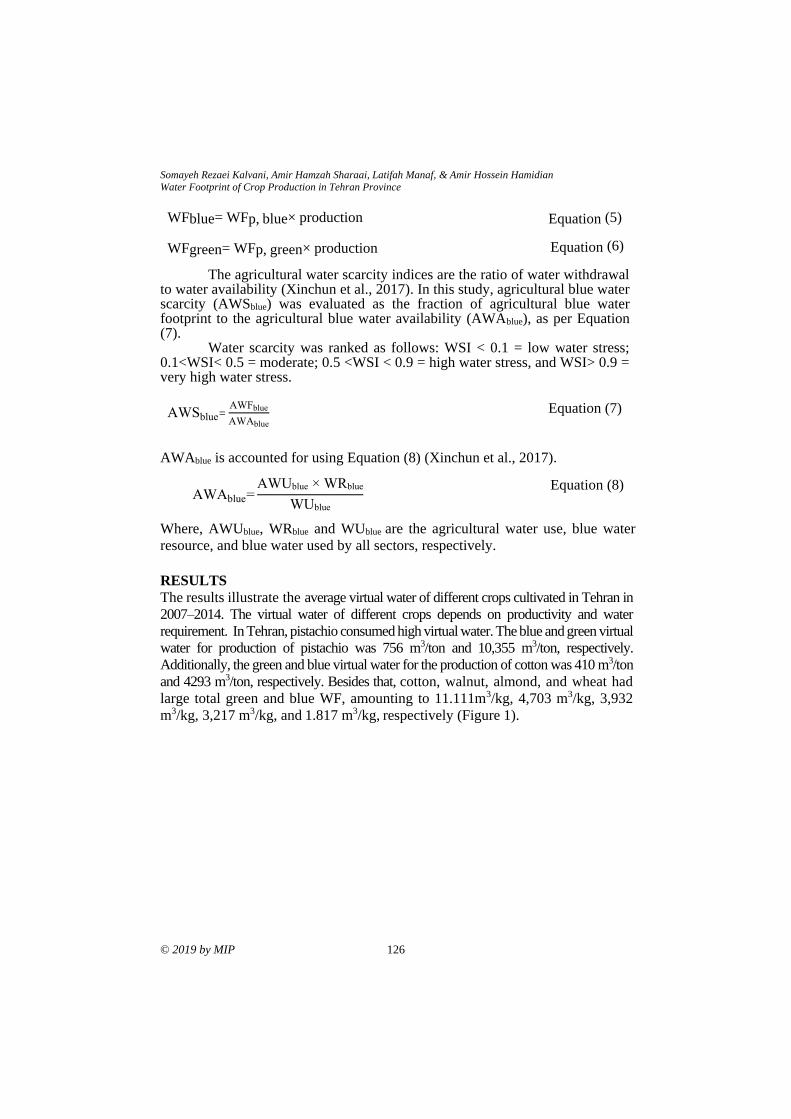
Somayeh Rezaei Kalvani, Amir Hamzah Sharaai, Latifah Manaf, & Amir Hossein Hamidian
Water Footprint of Crop Production in Tehran Province
© 2019 by MIP 126
WFblue= WFp, blue× production Equation (5)
WFgreen= WFp, green× production Equation (6)
The agricultural water scarcity indices are the ratio of water withdrawal to water availability (Xinchun et al., 2017). In this study, agricultural blue water scarcity (AWSblue) was evaluated as the fraction of agricultural blue water footprint to the agricultural blue water availability (AWAblue), as per Equation (7).
Water scarcity was ranked as follows: WSI < 0.1 = low water stress; 0.1<WSI< 0.5 = moderate; 0.5 <WSI < 0.9 = high water stress, and WSI> 0.9 = very high water stress.
AWSblue= AWFblue
AWAblue
Equation (7)
AWAblue is accounted for using Equation (8) (Xinchun et al., 2017).
AWAblue=AWUblue × WRblue
WUblue
Equation (8)
Where, AWUblue, WRblue and WUblue are the agricultural water use, blue water
resource, and blue water used by all sectors, respectively.
RESULTS
The results illustrate the average virtual water of different crops cultivated in Tehran in
2007–2014. The virtual water of different crops depends on productivity and water
requirement. In Tehran, pistachio consumed high virtual water. The blue and green virtual
water for production of pistachio was 756 m3/ton and 10,355 m3/ton, respectively.
Additionally, the green and blue virtual water for the production of cotton was 410 m3/ton
and 4293 m3/ton, respectively. Besides that, cotton, walnut, almond, and wheat had
large total green and blue WF, amounting to 11.111m3/kg, 4,703 m3/kg, 3,932
m3/kg, 3,217 m3/kg, and 1.817 m3/kg, respectively (Figure 1).
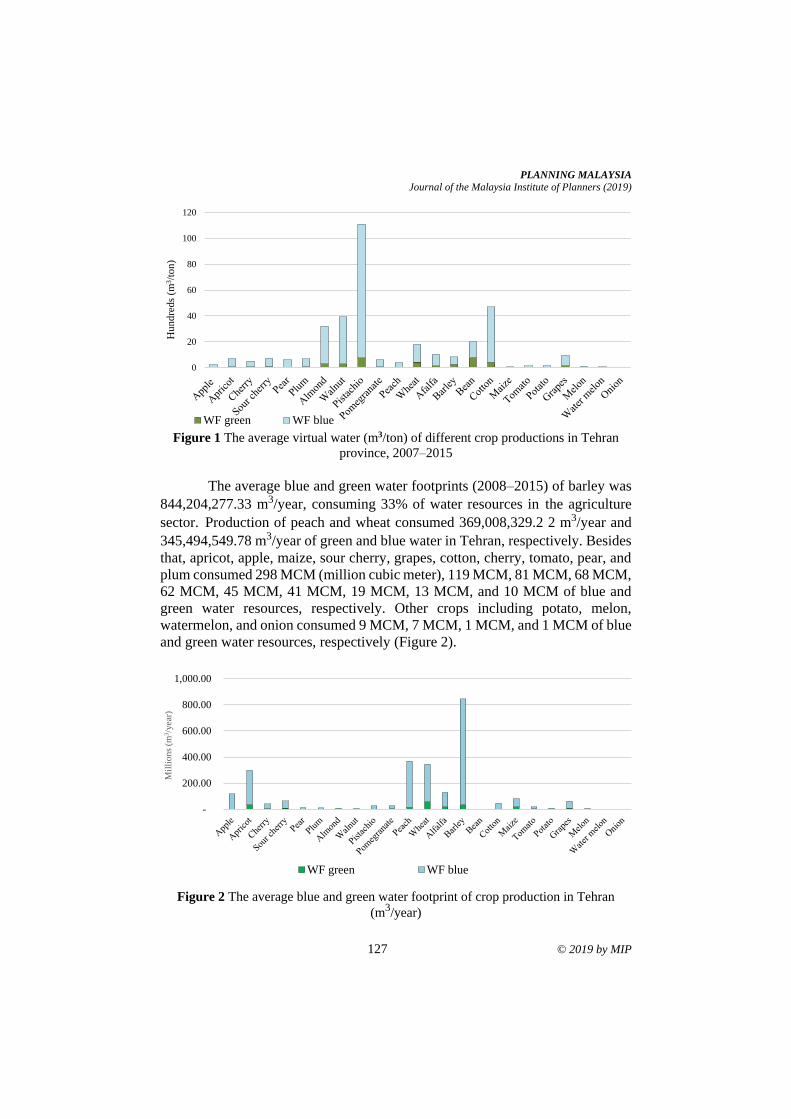
PLANNING MALAYSIA
Journal of the Malaysia Institute of Planners (2019)
127 © 2019 by MIP
Figure 1 The average virtual water (m3/ton) of different crop productions in Tehran
province, 2007–2015
The average blue and green water footprints (2008–2015) of barley was
844,204,277.33 m3/year, consuming 33% of water resources in the agriculture
sector. Production of peach and wheat consumed 369,008,329.2 2 m3/year and
345,494,549.78 m3/year of green and blue water in Tehran, respectively. Besides
that, apricot, apple, maize, sour cherry, grapes, cotton, cherry, tomato, pear, and
plum consumed 298 MCM (million cubic meter), 119 MCM, 81 MCM, 68 MCM,
62 MCM, 45 MCM, 41 MCM, 19 MCM, 13 MCM, and 10 MCM of blue and
green water resources, respectively. Other crops including potato, melon,
watermelon, and onion consumed 9 MCM, 7 MCM, 1 MCM, and 1 MCM of blue
and green water resources, respectively (Figure 2).
Figure 2 The average blue and green water footprint of crop production in Tehran
(m3/year)
0
20
40
60
80
100
120
Hu
nd
reds
(m3/t
on
)
WF green WF blue
-
200.00
400.00
600.00
800.00
1,000.00
Mil
lio
ns
(m3/y
ear)
WF green WF blue
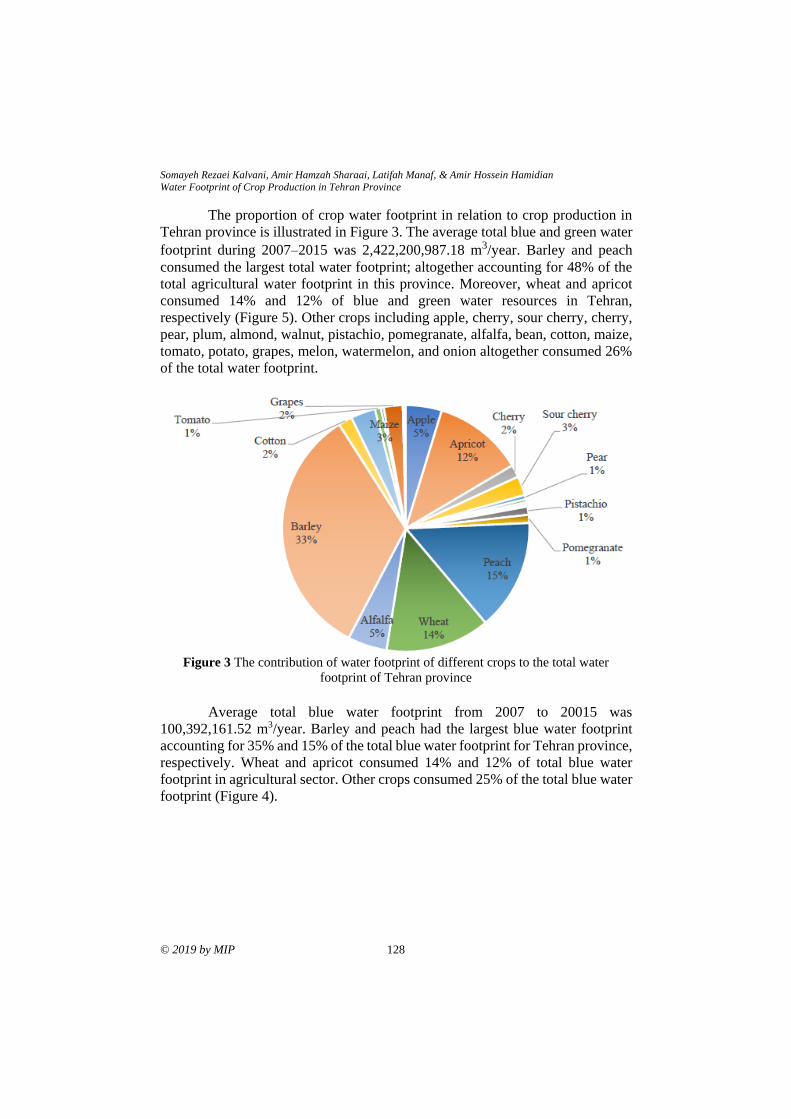
Somayeh Rezaei Kalvani, Amir Hamzah Sharaai, Latifah Manaf, & Amir Hossein Hamidian
Water Footprint of Crop Production in Tehran Province
© 2019 by MIP 128
The proportion of crop water footprint in relation to crop production in
Tehran province is illustrated in Figure 3. The average total blue and green water
footprint during 2007–2015 was 2,422,200,987.18 m3/year. Barley and peach
consumed the largest total water footprint; altogether accounting for 48% of the
total agricultural water footprint in this province. Moreover, wheat and apricot
consumed 14% and 12% of blue and green water resources in Tehran,
respectively (Figure 5). Other crops including apple, cherry, sour cherry, cherry,
pear, plum, almond, walnut, pistachio, pomegranate, alfalfa, bean, cotton, maize,
tomato, potato, grapes, melon, watermelon, and onion altogether consumed 26%
of the total water footprint.
Figure 3 The contribution of water footprint of different crops to the total water
footprint of Tehran province
Average total blue water footprint from 2007 to 20015 was
100,392,161.52 m3/year. Barley and peach had the largest blue water footprint
accounting for 35% and 15% of the total blue water footprint for Tehran province,
respectively. Wheat and apricot consumed 14% and 12% of total blue water
footprint in agricultural sector. Other crops consumed 25% of the total blue water
footprint (Figure 4).
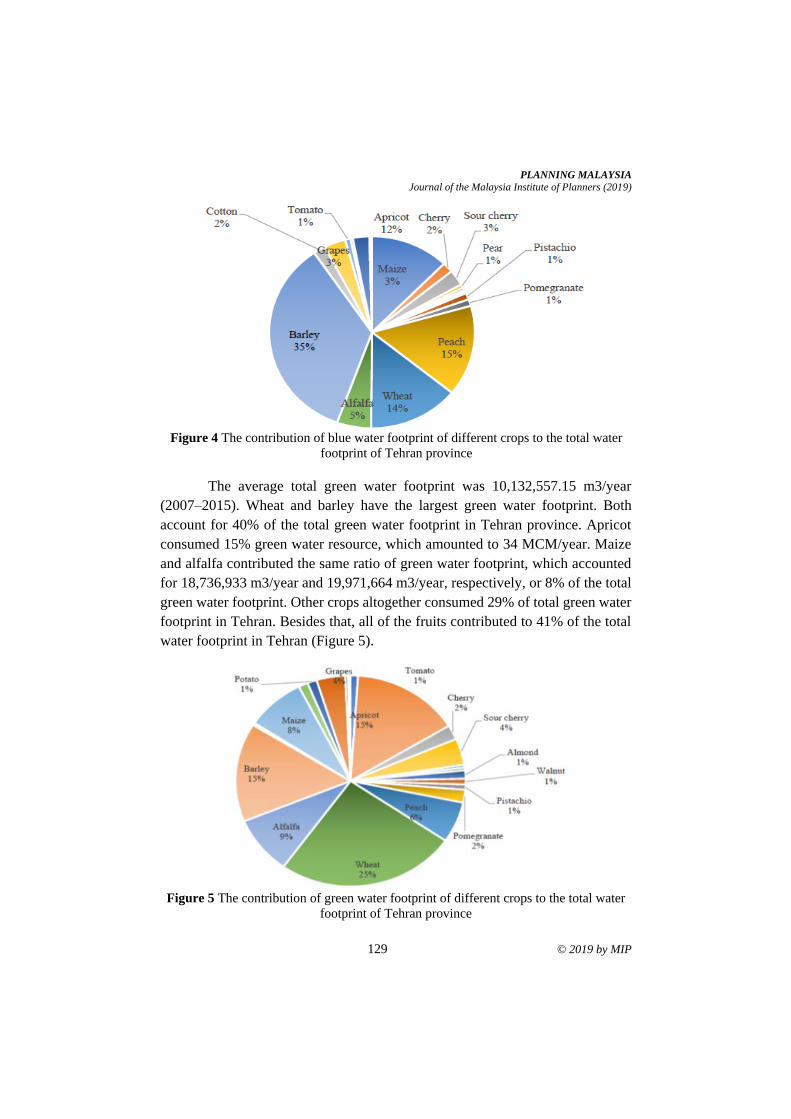
PLANNING MALAYSIA
Journal of the Malaysia Institute of Planners (2019)
129 © 2019 by MIP
Figure 4 The contribution of blue water footprint of different crops to the total water
footprint of Tehran province
The average total green water footprint was 10,132,557.15 m3/year
(2007–2015). Wheat and barley have the largest green water footprint. Both
account for 40% of the total green water footprint in Tehran province. Apricot
consumed 15% green water resource, which amounted to 34 MCM/year. Maize
and alfalfa contributed the same ratio of green water footprint, which accounted
for 18,736,933 m3/year and 19,971,664 m3/year, respectively, or 8% of the total
green water footprint. Other crops altogether consumed 29% of total green water
footprint in Tehran. Besides that, all of the fruits contributed to 41% of the total
water footprint in Tehran (Figure 5).
Figure 5 The contribution of green water footprint of different crops to the total water
footprint of Tehran province
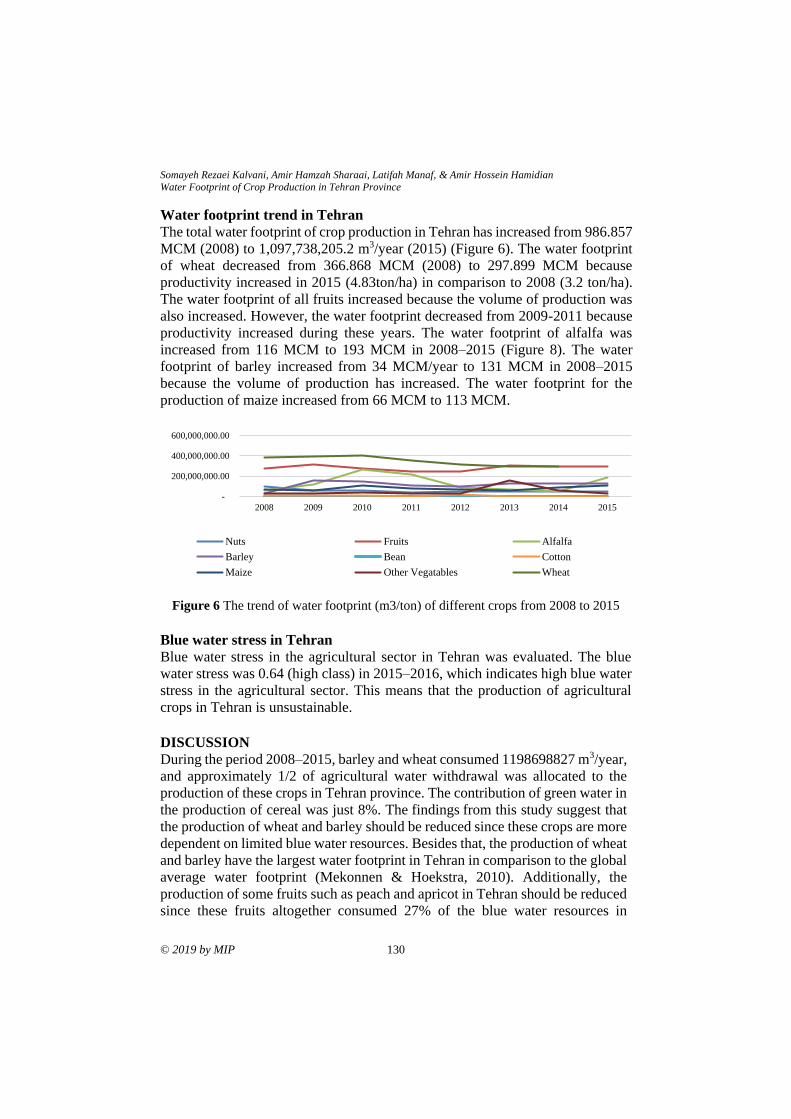
Somayeh Rezaei Kalvani, Amir Hamzah Sharaai, Latifah Manaf, & Amir Hossein Hamidian
Water Footprint of Crop Production in Tehran Province
© 2019 by MIP 130
Water footprint trend in Tehran
The total water footprint of crop production in Tehran has increased from 986.857
MCM (2008) to 1,097,738,205.2 m3/year (2015) (Figure 6). The water footprint
of wheat decreased from 366.868 MCM (2008) to 297.899 MCM because
productivity increased in 2015 (4.83ton/ha) in comparison to 2008 (3.2 ton/ha).
The water footprint of all fruits increased because the volume of production was
also increased. However, the water footprint decreased from 2009-2011 because
productivity increased during these years. The water footprint of alfalfa was
increased from 116 MCM to 193 MCM in 2008–2015 (Figure 8). The water
footprint of barley increased from 34 MCM/year to 131 MCM in 2008–2015
because the volume of production has increased. The water footprint for the
production of maize increased from 66 MCM to 113 MCM.
Figure 6 The trend of water footprint (m3/ton) of different crops from 2008 to 2015
Blue water stress in Tehran
Blue water stress in the agricultural sector in Tehran was evaluated. The blue
water stress was 0.64 (high class) in 2015–2016, which indicates high blue water
stress in the agricultural sector. This means that the production of agricultural
crops in Tehran is unsustainable.
DISCUSSION During the period 2008–2015, barley and wheat consumed 1198698827 m3/year,
and approximately 1/2 of agricultural water withdrawal was allocated to the
production of these crops in Tehran province. The contribution of green water in
the production of cereal was just 8%. The findings from this study suggest that
the production of wheat and barley should be reduced since these crops are more
dependent on limited blue water resources. Besides that, the production of wheat
and barley have the largest water footprint in Tehran in comparison to the global
average water footprint (Mekonnen & Hoekstra, 2010). Additionally, the
production of some fruits such as peach and apricot in Tehran should be reduced
since these fruits altogether consumed 27% of the blue water resources in
-
200,000,000.00
400,000,000.00
600,000,000.00
2008 2009 2010 2011 2012 2013 2014 2015
Nuts Fruits Alfalfa
Barley Bean Cotton
Maize Other Vegatables Wheat
PLANNING MALAYSIA
Journal of the Malaysia Institute of Planners (2019)
131 © 2019 by MIP
Tehran. The water footprint of some crops such as watermelon, melon, and onion
is the lowest in Tehran. This study, therefore, suggested increase in the
cultivation of these crops, as they have shown the highest productivity.
It is concluded that the water footprint (m3/ton) of crops relies on
productivity. Besides that, the water footprint also showed an increasing trend
whenever productivity decreased. The green water footprint was the largest
footprint contributing to the total water footprint in 2007, but in 2015, this
footprint was the lowest because the precipitation in 2015 was lower than 2007
and 2015 was a dry year.
In a previous water footprint assessment of Iran (Ababaei & Etedali,
2014), the water footprint of cereal production was evaluated on a national scale.
This research, however, investigates the water footprint of all crops in the
province of Tehran as well as the water footprint trend spanning 9 years. The
water footprint of crops (2008–2005) in this this research is slightly larger than
the water footprint assessment by Hoekstra (1996–2005) (Mekonnen &
Hoekstra, 2010) because climate and productivity were different.
CONCLUSION
The total average water footprint (excluding the grey water footprint) for
production of crops in Tehran province from 2008 and 2015 was
1,069,096,320.93 m3/year. Blue water footprint contributed the largest footprint
(91%) in the total water footprint for Tehran province because of the climate
condition in this province. Total water footprint was slightly increased from
986,857,963m3/year (2008) to 1,097,738,205.2 m3/year (2015). The water
footprint in Tehran relies on productivity, which differs from year to year.
Reduced productivity contributes to increased total water footprint. The total
water footprint in 2015 was higher than that of 2008. Green water footprint is
dependent on rainfall. The green water footprint in Tehran increased in the year
observing high precipitation. The production of cereal consumed half of the water
withdrawal in the agricultural sector. It is suggested that the production of wheat
and barley be reduced since the production of these crops relatively depends on
limited blue water resources. Besides that, decision makers in the agricultural
sector should reduce the production of crops with high water footprint, so as to
reduce pressure on water resources in Tehran. Moreover, agricultural blue water
scarcity accounted for 0.6 (in the severe class of water stress) in 2015–2016. The
WF of crop production depends on productivity and climate condition. The green
WF is reliant on rainfall. It is, therefore, suggested that the production of cereal
in Tehran be reduced since the production of these crops is highly dependent on
limited blue water resources. In the future, the water footprint assessment
particularly blue water footprint will be evaluated separately to obtain separate
ground and surface water footprints and, in turn, ground and surface water stress,
respectively.
Somayeh Rezaei Kalvani, Amir Hamzah Sharaai, Latifah Manaf, & Amir Hossein Hamidian
Water Footprint of Crop Production in Tehran Province
© 2019 by MIP 132
ACKNOWLEDGEMENT
The authors would like to gratefully acknowledge Universiti Putra Malaysia
(GP/2018/9592300) for supporting this research project.
REFERENCES Ababaei, B., & Etedali, H. R. (2014). Estimation of water footprint components of Iran’s
wheat production: Comparison of global and national scale estimates.
Environmental Processes, 1(3), 193-205.
Allen, R. G., Pereira, L. S., Raes, D., & Smith, M. (1998). Crop evapotranspiration -
Guidelines for computing crop water requirements - FAO Irrigation and
Drainage Paper 56. Rome: FAO.
Boer, T. D. (2014). Water footprint assessment of crop production in Shaanxi, China
(Thesis). University of Twente, Enschede, the Netherlands.
Hoekstra, A. Y., Chapagain, A. K., Aldaya, M. M., & Mekonne, M. M. (2011). The water
footprint assessment manual. London: Earthscan.
Hoekstra, A. Y., & Hung, P. Q. (2002). A quantification of virtual water flows between
nations in relation to international crop trade. Value of Water Research Report
Series No. 11. UNESCO-IHE.
Madani, K. (2014). Water management in Iran: What is causing the looming crisis?
Journal of Environmental Studies and Sciences, 4(4), 315-328.
Mekonnen, M., & Hoekstra, A. (2010). The green, blue and grey water footprint of crops
and derived crop products. Value of Water Research Report Series No. 47 (Vol.
2 – Appendices), UNESCO-IHE.
Organización de las Naciones Unidas. (2005). Coping with water scarcity: Challeng
of the twenty-first century. Un Water, 24(1), 28–29.
Rijsberman, F. R. (2004). Water scarcity: Fact or fiction? Proceedings of the 4th
International Crop Science Congress, 80, 5-22.
Rockstrom, J., & Falkenmark, M. (2006). The new blue and green water paradigm:
Breaking new ground for water resources planning and management. Journal of
Water Resources Planning and Management, 132(3), 129-132.
Tillotson, M. R., Liu, J., Guan, D., & Pahlow, M. (2014). Water footprint symposium:
Where next for water footprint and water assessment methodology?, The
International Journal of Life Cycle Assessment, 19(8), 1561–1565.
Zehtabian, G., Khosravi, H., & Ghodsi, M. (2009). High demand in a land of water
scarcity: Iran. In G. Schneier-Madanes & M. Courel (2009). Water and
sustainability in arid regions: Bridging the gap between physical and social
sciences (pp. 75-86). Berlin: Springer Science & Business Media.
Xinchun, C., Mengyang, W., Xiangping, G., Yalian, Z., Yan, G., Nan, W., & Weiguang,
W. (2017). Assessing water scarcity in agricultural production system based on
the generalized water resources and water footprint framework. Science of the
Total Environment, 609, 587-597
Received: 12th January 2019. Accepted: 2nd August 2019
1PhD candidate at the National University of Malaysia. Email: [email protected] 133
PLANNING MALAYSIA:
Journal of the Malaysian Institute of Planners
VOLUME 17 ISSUE 2 (2019), Page 133 – 145
THE BEHAVIOURS AND JOB POSITIONS OF CITIZENS IN SMART
CITIES’ DEVELOPMENT
Sengboon Lim1, Jalaluddin Abdul Malek2, Mohd Yusof Hussain3,
& Zurinah Tahir4
1,2,3,4Faculty of Social Sciences and Humanities
UNIVERSITI KEBANGSAAN MALAYSIA
Abstract
Of the three major actors in smart cities, citizens have the most ambiguous roles,
unlike the government which is the clear decision-maker, and the private
technological players which are obviously supposed to provide state-of-the-art
technologies to smart cities. Evidently, the possession of ambiguous
characteristics or vague roles can result in the manipulation and subjugation of
the general public by the power-holders. Thus, the objective of this paper is to
identify the desirable characteristics – including the behaviours and job positions
– of the citizens who participate in the development of smart cities. Following the
conduction of semi-structured interviews on the stakeholders of smart cities, it
was found that citizens can actually be (1) active and independent volunteers in
public life, (2) local champions or co-producers of public values, as well as (3)
aware and educated-intention human sensors who drive changes, instead of being
passive users of data or beneficiaries of services. It has been argued that the
creation of smart cities is reliant on a deeper understanding of the citizens’
characteristics, apart from the implementation of policies which generate aware
and civic-minded citizens.
Keywords: role of citizen; public participation; smart city; public
engagement
Sengboon Lim, Jalaluddin Abdul Malek, Mohd Yusof Hussain, & Zurinah Tahir
The behaviours and job positions of citizens in smart cities’ development
© 2019 by MIP 134
INTRODUCTION
At the moment, although the concept of smart cities is ill-defined and suffering
from a wide variety of definitions from various paradigms (Albino, Berardi, &
Dangelico, 2015; Lara, Moreira Da Costa, Furlani, & Yigitcanlar, 2016; Mora,
Bolici, & Deakin, 2017), there is a general consensus that three-way interactions
which involve the governments (institutional factor), corporates (technological
factor), and citizens (human factor) constitute the fundamental components of a
smart city (Nam & Pardo, 2011). However, recent studies on Smart London
(Willems, Bergh, & Viaene, 2017) and Dublin (Cardullo & Kitchin, 2017) have
revealed that the characteristics of the citizens of such cities are still unclear, and
that the individuals are mostly playing the role of passive beneficiaries.
Thus, the objective of this paper is to identify the characteristics of the
citizens who participated in the development of smart cities. As such, the research
question that has been looked into is the existence of newer characteristics in
citizens who were involved in the same.
CITIZEN’S CHARACTERISTICS
In the 1990's, citizens were not central to the development of smart cities, even
though the latter have been built to improve the quality of life (Koolhaas, 2014).
Evidently, the earlier concepts of smart cities have intrinsically considered
citizens to be ‘passive’ recipients of services and beneficiaries of activities
(Castelnovo, 2016). It is true that citizens have very few choices, if at all, to
decide whether or not to participate in the initiatives of smart cities or the
programmes organised by the local authorities. However, the citizens still have
to constantly update their knowledge of the rapidly-changing technological
applications, or risk being left behind.
The above situation has prompted some scholars in the early 2010s to
redefine smart cities such that citizens are given due precedence (Chourabi et al.,
2012; Nam & Pardo, 2011). Accordingly, several orientations have been
proposed with respect to the smart cities’ initiatives. For example, Chourabi et al.
(2012) has advocated that such initiatives allow the members of the cities to
participate in the governance. In time, these ideas have been accepted in policies
like Smart Barcelona and Smart London. As a result, the citizens are gradually
taking on the ‘active user’ role (Castelnovo, 2016). In other words, they are
increasingly being allowed to become co-producers (Bovaird, 2007; UCLG,
2016), providers of information, and human sensors (Linders, 2012; Berntzen &
Johannessen, 2016b; Vanolo, 2016) to help the cities become smarter.
According to the literature on public administration, the ‘active’
characteristic of the citizens has long been studied as part of the dynamic
relationship between public administrators and citizens (Callahan, 2007; Thomas,
2013; Vigoda, 2002). In fact, the said attribute is still subjected to on-going
debates. Logically, the citizens of smart cities should be active in the sense that
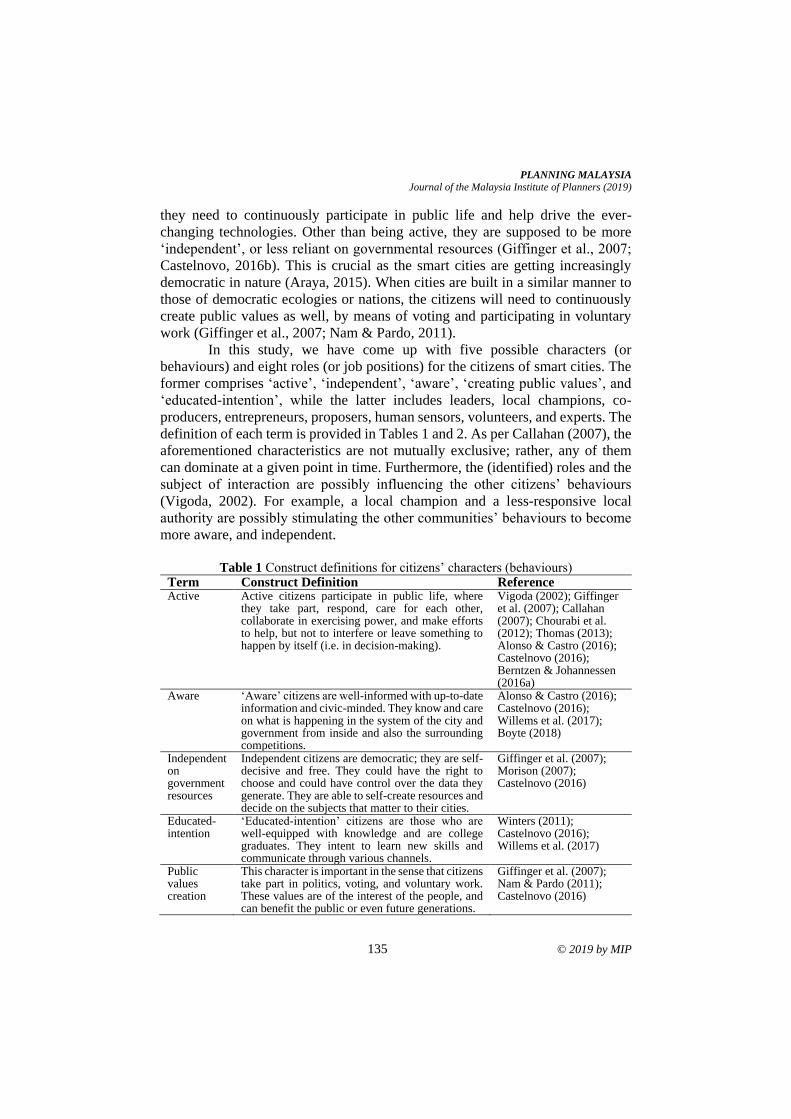
PLANNING MALAYSIA
Journal of the Malaysia Institute of Planners (2019)
135 © 2019 by MIP
they need to continuously participate in public life and help drive the ever-
changing technologies. Other than being active, they are supposed to be more
‘independent’, or less reliant on governmental resources (Giffinger et al., 2007;
Castelnovo, 2016b). This is crucial as the smart cities are getting increasingly
democratic in nature (Araya, 2015). When cities are built in a similar manner to
those of democratic ecologies or nations, the citizens will need to continuously
create public values as well, by means of voting and participating in voluntary
work (Giffinger et al., 2007; Nam & Pardo, 2011).
In this study, we have come up with five possible characters (or
behaviours) and eight roles (or job positions) for the citizens of smart cities. The
former comprises ‘active’, ‘independent’, ‘aware’, ‘creating public values’, and
‘educated-intention’, while the latter includes leaders, local champions, co-
producers, entrepreneurs, proposers, human sensors, volunteers, and experts. The
definition of each term is provided in Tables 1 and 2. As per Callahan (2007), the
aforementioned characteristics are not mutually exclusive; rather, any of them
can dominate at a given point in time. Furthermore, the (identified) roles and the
subject of interaction are possibly influencing the other citizens’ behaviours
(Vigoda, 2002). For example, a local champion and a less-responsive local
authority are possibly stimulating the other communities’ behaviours to become
more aware, and independent.
Table 1 Construct definitions for citizens’ characters (behaviours)
Term Construct Definition Reference Active Active citizens participate in public life, where
they take part, respond, care for each other, collaborate in exercising power, and make efforts to help, but not to interfere or leave something to happen by itself (i.e. in decision-making).
Vigoda (2002); Giffinger et al. (2007); Callahan (2007); Chourabi et al. (2012); Thomas (2013); Alonso & Castro (2016); Castelnovo (2016); Berntzen & Johannessen (2016a)
Aware ‘Aware’ citizens are well-informed with up-to-date information and civic-minded. They know and care on what is happening in the system of the city and government from inside and also the surrounding competitions.
Alonso & Castro (2016); Castelnovo (2016); Willems et al. (2017); Boyte (2018)
Independent on government resources
Independent citizens are democratic; they are self-decisive and free. They could have the right to choose and could have control over the data they generate. They are able to self-create resources and decide on the subjects that matter to their cities.
Giffinger et al. (2007); Morison (2007); Castelnovo (2016)
Educated- intention
‘Educated-intention’ citizens are those who are well-equipped with knowledge and are college graduates. They intent to learn new skills and communicate through various channels.
Winters (2011); Castelnovo (2016); Willems et al. (2017)
Public values creation
This character is important in the sense that citizens take part in politics, voting, and voluntary work. These values are of the interest of the people, and can benefit the public or even future generations.
Giffinger et al. (2007); Nam & Pardo (2011); Castelnovo (2016)
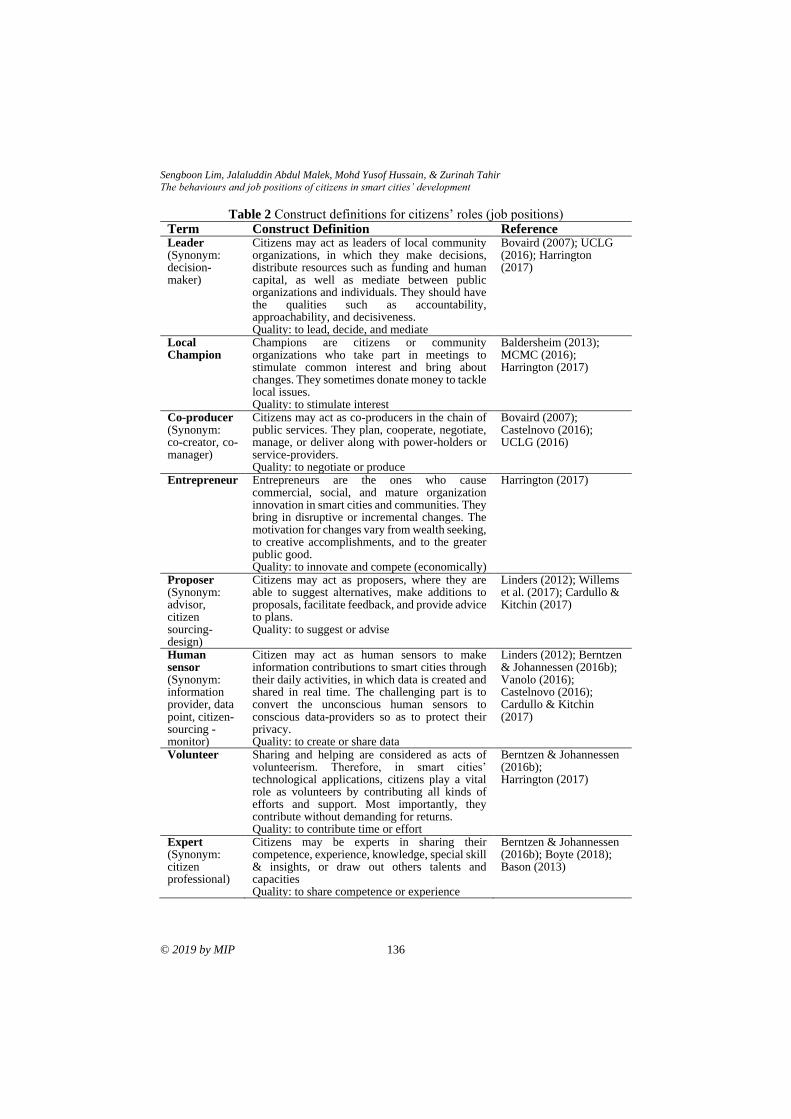
Sengboon Lim, Jalaluddin Abdul Malek, Mohd Yusof Hussain, & Zurinah Tahir
The behaviours and job positions of citizens in smart cities’ development
© 2019 by MIP 136
Table 2 Construct definitions for citizens’ roles (job positions) Term Construct Definition Reference Leader (Synonym: decision-maker)
Citizens may act as leaders of local community organizations, in which they make decisions, distribute resources such as funding and human capital, as well as mediate between public organizations and individuals. They should have the qualities such as accountability, approachability, and decisiveness. Quality: to lead, decide, and mediate
Bovaird (2007); UCLG (2016); Harrington (2017)
Local Champion
Champions are citizens or community organizations who take part in meetings to stimulate common interest and bring about changes. They sometimes donate money to tackle local issues. Quality: to stimulate interest
Baldersheim (2013); MCMC (2016); Harrington (2017)
Co-producer (Synonym: co-creator, co-manager)
Citizens may act as co-producers in the chain of public services. They plan, cooperate, negotiate, manage, or deliver along with power-holders or service-providers. Quality: to negotiate or produce
Bovaird (2007); Castelnovo (2016); UCLG (2016)
Entrepreneur Entrepreneurs are the ones who cause commercial, social, and mature organization innovation in smart cities and communities. They bring in disruptive or incremental changes. The motivation for changes vary from wealth seeking, to creative accomplishments, and to the greater public good. Quality: to innovate and compete (economically)
Harrington (2017)
Proposer (Synonym: advisor, citizen sourcing-design)
Citizens may act as proposers, where they are able to suggest alternatives, make additions to proposals, facilitate feedback, and provide advice to plans. Quality: to suggest or advise
Linders (2012); Willems et al. (2017); Cardullo & Kitchin (2017)
Human sensor (Synonym: information provider, data point, citizen-sourcing - monitor)
Citizen may act as human sensors to make information contributions to smart cities through their daily activities, in which data is created and shared in real time. The challenging part is to convert the unconscious human sensors to conscious data-providers so as to protect their privacy. Quality: to create or share data
Linders (2012); Berntzen & Johannessen (2016b); Vanolo (2016); Castelnovo (2016); Cardullo & Kitchin (2017)
Volunteer Sharing and helping are considered as acts of volunteerism. Therefore, in smart cities’ technological applications, citizens play a vital role as volunteers by contributing all kinds of efforts and support. Most importantly, they contribute without demanding for returns. Quality: to contribute time or effort
Berntzen & Johannessen (2016b); Harrington (2017)
Expert (Synonym: citizen professional)
Citizens may be experts in sharing their competence, experience, knowledge, special skill & insights, or draw out others talents and capacities Quality: to share competence or experience
Berntzen & Johannessen (2016b); Boyte (2018); Bason (2013)
PLANNING MALAYSIA
Journal of the Malaysia Institute of Planners (2019)
137 © 2019 by MIP
METHOD
This study – which was carried out during the Smart Selangor Conference 2017
(MBI, 2017) – was part of a larger research on the citizen-centricity of smart
cities. Being the most developed state in Malaysia, Selangor has adopted the
Smart State vision since 2015 (Fong, 2017; SSDU, 2016). Accordingly, the above
conference has invited various stakeholders of smart cities to get together and
share new technologies as well as networks.
Convenience sampling was performed, following which the informants
were interviewed with reference to semi-structured questionnaires that consisted
of (1) questions on demographic details of the respondents, as well as (2)
questions on the citizens’ characteristics and roles mentioned in the previous
section. The informants provided data from the views of power-holders and have-
not citizens. Data collection was stopped when the informant count was 18
because the answers began to repeat, and the contents attained a saturation point
(Laher & Botha, 2012). According to Laher & Botha (2012), there is no exact
sample size for qualitative study, however it should not be too small (i.e. 1 or 2
samples) or too big (i.e. more than 100 samples). For example, a qualitative
citizenship study by Williams (2014) has interviewed 20 informants.
Thematic analysis was executed to identify the codes, categories, and
themes from the verbatim data (Merriam & Tisdell, 2016). Atlas.ti v.7.5.7 and
Mendeley v.1.19.1 software have been used to facilitate the analysis.
FINDINGS
Demographics Details of Informants
The informants have been selected in such a way that there is maximum diversity
among them (in terms of gender, age, local and global views, education level,
experience in the field of smart cities, serving sector, as well as role in smart
cities), as described in Table 3. In terms of nationality, the majority (11 of 18)
informants were from Asia (eight from Malaysia, and one each from Indonesia
and Taiwan; the remaining informant declined to reveal his identity owing to
protocol restrictions). Meanwhile, four were from Europe (two from Spain, and
one each from Netherlands and Sweden), and three were from the United States,
Dominican Republic, and Turkey respectively.
As for experience in the field of smart cities, six of the respondents had
11 – 20 years of experience, six more 1 – 5 years, three more than 20 years, and
the remaining three 6 – 10 years. With respect to the sector in which the
respondents were serving, nine of them were in the private sector, seven public
sector, and two public-private partnership companies. To ensure the privacy of
the informants, symbols have been used to represent the stakeholders’ roles or
positions in the development of smart cities. For example, ‘PC’ denoted
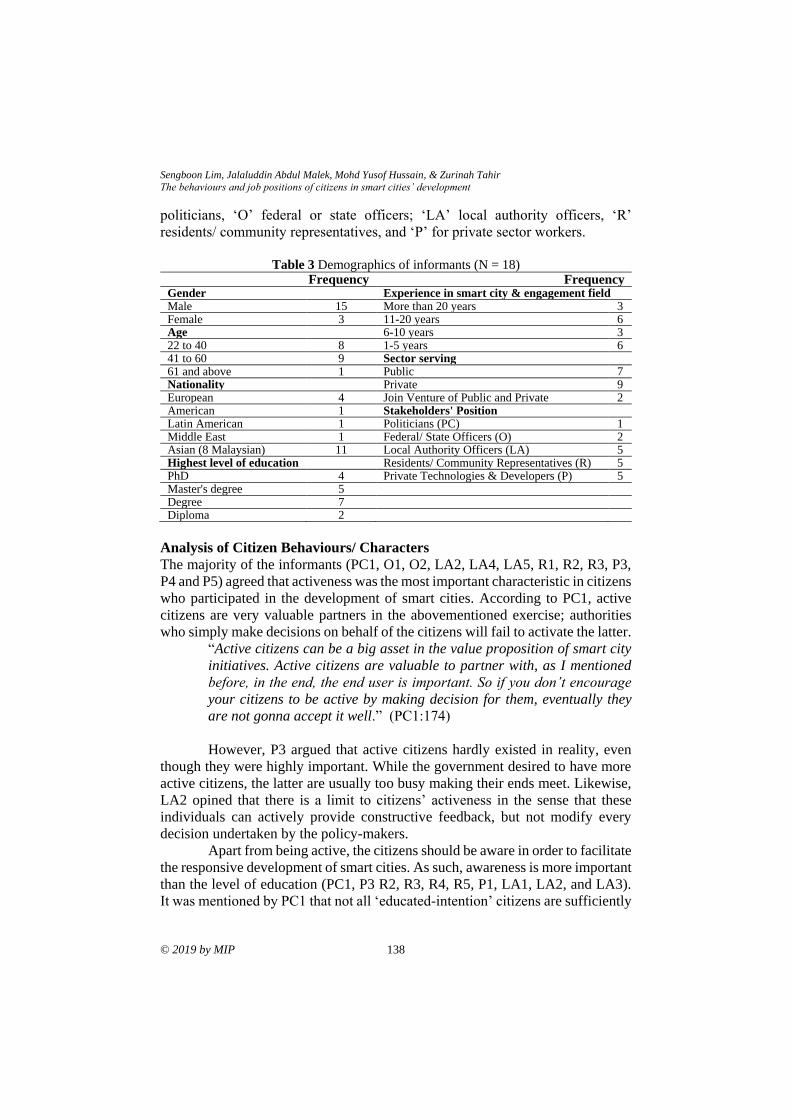
Sengboon Lim, Jalaluddin Abdul Malek, Mohd Yusof Hussain, & Zurinah Tahir
The behaviours and job positions of citizens in smart cities’ development
© 2019 by MIP 138
politicians, ‘O’ federal or state officers; ‘LA’ local authority officers, ‘R’
residents/ community representatives, and ‘P’ for private sector workers.
Table 3 Demographics of informants (N = 18)
Frequency Frequency Gender Experience in smart city & engagement field Male 15 More than 20 years 3 Female 3 11-20 years 6 Age 6-10 years 3 22 to 40 8 1-5 years 6 41 to 60 9 Sector serving 61 and above 1 Public 7 Nationality Private 9 European 4 Join Venture of Public and Private 2 American 1 Stakeholders' Position Latin American 1 Politicians (PC) 1 Middle East 1 Federal/ State Officers (O) 2 Asian (8 Malaysian) 11 Local Authority Officers (LA) 5 Highest level of education Residents/ Community Representatives (R) 5 PhD 4 Private Technologies & Developers (P) 5 Master's degree 5 Degree 7 Diploma 2
Analysis of Citizen Behaviours/ Characters
The majority of the informants (PC1, O1, O2, LA2, LA4, LA5, R1, R2, R3, P3,
P4 and P5) agreed that activeness was the most important characteristic in citizens
who participated in the development of smart cities. According to PC1, active
citizens are very valuable partners in the abovementioned exercise; authorities
who simply make decisions on behalf of the citizens will fail to activate the latter.
“Active citizens can be a big asset in the value proposition of smart city
initiatives. Active citizens are valuable to partner with, as I mentioned
before, in the end, the end user is important. So if you don’t encourage
your citizens to be active by making decision for them, eventually they
are not gonna accept it well.” (PC1:174)
However, P3 argued that active citizens hardly existed in reality, even
though they were highly important. While the government desired to have more
active citizens, the latter are usually too busy making their ends meet. Likewise,
LA2 opined that there is a limit to citizens’ activeness in the sense that these
individuals can actively provide constructive feedback, but not modify every
decision undertaken by the policy-makers.
Apart from being active, the citizens should be aware in order to facilitate
the responsive development of smart cities. As such, awareness is more important
than the level of education (PC1, P3 R2, R3, R4, R5, P1, LA1, LA2, and LA3).
It was mentioned by PC1 that not all ‘educated-intention’ citizens are sufficiently
PLANNING MALAYSIA
Journal of the Malaysia Institute of Planners (2019)
139 © 2019 by MIP
civic-minded and interested to contribute to a smart city’s initiatives and
programmes organised by the local authorities. Rather, citizens with high levels
of awareness were more likely to do so. Nevertheless, P2, R1, and LA1 argued
that most of citizens were not aware since they lacked interest in public life. As
such, local governments need to constantly cultivate aware citizens.
The majority of the informants did not relate independence on
governmental resources with the development of smart cities. Conversely, the
said respondents opined that citizens have to depend on resources provided by
the government, especially during the early phases of the implementation of
initiatives in such cities. However, according to LA4 and PC1, the citizens should
learn more skills and be independent over the longer term, in view of the fact that
more independent citizens enhance the development of smart cities. Meanwhile,
P3 claimed that there is a possibility for community schools to be managed by
the public without completely relying on the government. For example, a
kindergarten facility can be provided by the authorities; from there, the premise
is self-managed by the community via online platforms.
Most respondents were unfamiliar with the creation of public values. Be
that as it may, they felt that the abovementioned exercise is a huge challenge
because the citizens of smart cities are generally self-centered (P5) and might not
all be interested to participate in public life (PC1). Additionally, the creation of
such values is an uphill task as these are naturally and culturally inherent (LA4).
According to LA4, selflessness generally manifests in times of hardship like
crises or disasters. For example, following the hurricane in Texas (Gonzalez,
2017), the communities came together to help each other despite the immense
societal diversity. Nevertheless, these rarely happen in normal life.
Other characteristics like ‘driving change’ (by O2, PC1, P3, LA4, and
LA5) and ‘empathy’ (by P5 and LA4) have surfaced during interviews. Citizens
can drive changes instead of merely waiting for help from the government. LA4
gave an example that in response to emergencies, citizens can actually initiate
disaster relief efforts. Furthermore, with compliance to the existing laws, such
relief works can involve the creation of websites that identify the locations of
emergency supplies, or donated supplies and medicines. On another matter, P3,
P4, and LA4 stated that citizens can make changes by voting for their desired
leaders during elections as well.
Empathy denotes an attempt to include all feedback and accept all
differences in order to come up with better solutions to problems. P5 added that
a competent and empathetic person will recognise not only his/ her interests, but
also those of others, thereby leading to co-production.
Sengboon Lim, Jalaluddin Abdul Malek, Mohd Yusof Hussain, & Zurinah Tahir
The behaviours and job positions of citizens in smart cities’ development
© 2019 by MIP 140
Analysis of Citizen’s Job Positions/ Roles
Next, the possible job positions or roles of the citizens of smart cities were
analysed. The general view of the informants was that citizens are not in an ideal
position to become the leaders of all the initiatives of smart cities. Rather, they
are only suitable to act as local champions who connect communities and expand
common interests with the government. P4 opined that the leaders should
comprise elected politicians. However, it is interesting to note that in Barcelona,
neighbourhood leaders can eventually become councillors.
On another matter, there were differing views in terms of the co-producer
role of the citizens. Evidently, the majority of the interviewees have never
encountered this term before. Following explanations from the researchers that
the concept is similar to partnerships and workload-sharing, the informants
started to put forth ideas. P5 mentioned that it is possible to co-produce, but this
is influenced by self-interest. For example, in Malaysia, a certain race or religion
may be given priorities over others during the selection of co-producers.
Nevertheless, P3 supported the idea of co-production. Additionally, according to
R4, Barcelona is now focusing on co-management, whereby the government
provides infrastructures like neighbourhood kindergartens, apart from allowing
the communities to form committees and manage these facilities as per their
needs.
The prevailing opinion of the respondents was that entrepreneurs are
important for delivering economic innovations and financial assistance to the
residents of smart cities. However, most of the citizens are not suited to become
entrepreneurs because, according to R4, P1, and P4 not all citizens like to be
involved in businesses. Rather, this role is only desired by business owners. Still,
it is the duty of the government to assist in economic matters.
With reference to the role of a proposer, LA5 described a scenario in
Indonesia in which village communities can come up with programmes and
applications to improve their neighbourhoods. Through these, they can access
governmental websites and, for instance, request the authorities to fix
neighbourhood amenities like parks. Likewise, P4 – a private consultant –
mentioned that citizens can come up with ideas during meetings; this practice is
very much emphasised in Barcelona.
Human sensors are involved in the conscious or unconscious sharing of
information or provision of data. Some of the informants (R1, R2, R3, R4, LA1,
and LA2) mentioned that they have not heard of the term ‘human sensor’ before.
Still, LA5 felt that idea-sharing by the community through online platforms can
give rise to the generation of more solutions. An example of the effectiveness of
human sensors by O1 revolved around the abandoned shopping trolley problem
in common areas in Singapore. On the other hand, P3 pointed out that citizens are
not in favour of sharing data with the government, even though they readily do
so to like-minded people or through Facebook.
PLANNING MALAYSIA
Journal of the Malaysia Institute of Planners (2019)
141 © 2019 by MIP
Citizens can act as volunteers – is the most desired role as per the
informants’ feedback. A smart city needs volunteers with altruistic mentalities.
According to LA4, the desire to participate and help without receiving obvious
benefits makes it the most important role of a citizen. Conversely, R4 opined that
smart cities are supposed to have fewer volunteers, and a larger number of the
same shows that the infrastructure of the city needs human assistance and hence,
are not smart enough.
Last but not least, all informants except for PC1 and LA2 agreed that
citizens can become experts who contribute their skills and knowledge to make
cities smarter. As per LA2, public professionals have vast experiences and
expertise in their respective fields, while general citizens should listen and
provide opinion instead of assuming the role as experts. Otherwise, no additional
roles have been raised by the informants.
DISCUSSION ON CITIZENS’ CHARACTERISTICS
This study has attempted to elicit the desirable characteristics of citizens who
participated in development of smart cities direction. All characteristics and roles
which have been mentioned in the previous section came mainly from the current
literature on smart cities, and these have been cross-checked with those on public
administration. Comparisons between both types of literatures, apart from the
attempts to redefine the possible roles of the citizens (Cardullo & Kitchin, 2017),
have revealed that some of the said characteristics are not totally new; rather they
are less-commonly heard of in the development of smart cities amid the prevalent
roles of social media (Linders, 2012) and other technologies.
The relatively newer characters (i.e. independence and creation of public
values) and roles (i.e. co-producers and human sensors) were somewhat alien to
the informants. Evidently, this finding is in line with those of the smart city
literatures, as summarized in Tables 1 and 2. Another noteworthy outcome was
that according to one of the informants, all the above mentioned characteristics
are not mutually exclusive. Simply put, in real practice, the roles and
characteristics of the citizens can be interchangeable, depending on the levels of
interaction and cooperation between the citizens and governments.
As per the interviews, two new characters have also surfaced, namely
‘driving change’ and ‘empathy’. Apparently, citizens have the ability to drive
changes in smart cities, provided that they are aware of the happenings in and
around the area (Giffinger et al., 2007). This type of change is related to citizen-
sourcing, whereby citizens help the government to be more responsive and
effective (Linders, 2012). Also, the former can act as entrepreneurs (Harrington,
2017) to influence the direction and outcomes of the policies, apart from
improving the government’s awareness of the current situations. While empathy
has been mentioned in the literature on smart cities (Lee, Hong, & Jeong, 2016;
Thomas, Wang, Mullagh, & Dunn, 2016), it has not been explained. Evidently, it
Sengboon Lim, Jalaluddin Abdul Malek, Mohd Yusof Hussain, & Zurinah Tahir
The behaviours and job positions of citizens in smart cities’ development
© 2019 by MIP 142
refers to a human quality which accepts differences (in terms of opinions,
interests, or problems), in addition to observing, and sympathising. Empathy may
even be related to awareness and civic-mindedness, both of which are attained
through self-tracking (En & Pöll, 2016). Anyhow, this characteristic is highly
important and can also be a part of public values. Hence, further explorations into
the same are needed in the future.
As per the analysis of the eight job roles, these were adequate to cover
the possible roles within the scope of knowledge of the informants. In fact, all the
proposed roles – except for several controversial ones like entrepreneurs and
leaders – were accepted by informants. Although Harrington (2017) have
proposed the ‘entrepreneur’ role for the citizens, we concur with respondents that
such a role is only appropriate for business owners and their ilk. On another
matter, leaders are largely confined to politicians. Rather, ‘local champion’
appears to be a more suitable term to address the gap between the community and
the government.
In fact, with respect to the classification mentioned in this paper, a
behaviour (action) which could be turned into a ‘job’ or ‘post’ would have been
categorised as a role rather than a character. Two cases will be presented to
explain this. First, sharing of information or provision of data is an action that is
becoming more important in smart cities. In fact, this can be further developed
into a salaried job (i.e. ‘human sensors’) in the future. Second, actions like co-
production and co-management are highly likely to be transformed into an
occupation (i.e. ‘co-producers’) as well (Tables 1 and 2).
CONTRIBUTIONS AND LIMITATIONS
This study has filled the knowledge gap pertaining to the characteristics of the
citizens who participate in the development of smart cities. It has also answered
the research question on the newer characteristics of the said citizens, apart from
conceptualising the same with respect to the development of smart cities. For
example, instead of being passive users of data or beneficiaries of services,
citizens can actually be (1) active and independent volunteers in public life, (2)
local champions or co-producers who create public values together, as well as (3)
aware and educated-intention human sensors who drive changes.
One of the limitations of this study was the mutually-exclusive nature of
the aforementioned characteristics (Callahan, 2007). In reality, both citizens and
public professionals will find it difficult to adopt these characteristics to achieve
the objectives of the smart cities. While the semi-structured interviews with the
stakeholders have elicited valuable opinions, the convenient selection of the
informants might have reduced the validity of the results since the respondents’
opinions were subjective.
PLANNING MALAYSIA
Journal of the Malaysia Institute of Planners (2019)
143 © 2019 by MIP
CONCLUSION AND SUGGESTION
The development of ‘smarter’ cities is not always in accordance with the
descriptions by mainstream corporates (e.g. IBM and Cisco) that solely focus on
technology-led strategy (Mora, Deakin, Reid, & Angelidou, 2019). Rather, it is a
holistic process which requires deeper understanding of the citizens’
characteristics. Thus, in the drafting of policies for smart cities, it is strongly
recommended that the authorities prioritise on the cultivation of aware and civic-
minded citizens in readiness for driving cutting age technologies. Doing so is
definitely better than merely giving precedence to the provision of basic ICT
infrastructures.
In a nutshell, it can be concluded that the aforementioned desirable
characteristics of the citizens of smart cities are at an early stage of manifestation.
This is because technology changes and develops, subsequently giving rise to
new possibilities that assist in the creation of smarter cities. Data triangulation
and verification by means of quantitative questionnaire-based surveys are
recommended to confirm and fine-tune the results of this study.
ACKNOWLEDGEMENT
This paper is part of the revised version of the one presented in the PASAK-3
Conference 2018.
REFERENCES Albino, V., Berardi, U., & Dangelico, R. (2015). Smart cities: Definitions, dimensions,
performance, and initiatives. Journal of Urban Technology, 22(1), 3-21.
Alonso, R. G., & Castro, S. L. (2016). Technology helps, people make: A smart city
governance framework grounded in deliberative democracy. In J. Gil-Garcia
(Ed.), Smarter as the New Urban Agenda (pp. 333-347). Cham Heidelberg:
Springer.
Araya, D. (Ed.). (2015). Smart cities as democratic ecologies. New York & London:
Palgrave Macmillan.
Baldersheim, H. (2013, September). Smart cities = smart citizens? Are smart cities and
smart citizen different? Analysis of survey data from Norway. In The ECPR
General Conference. September 4-7, 2013, Bordeaux, France.
Bason, C. (2013). Engaging citizens in policy innovation: Benefiting public policy from
the design inputs of citizens and stakeholders as ‘experts.’ In Lindquist et al.
(Ed.), Putting citizens first. engagement in policy and service delivery for the
21st century. Canberra: ANU Press.
Berntzen, L., & Johannessen, M. R. (2016a). The role of citizen participation in municipal
smart city projects: Lessons learned from Norway. In J. Gil-Garcia (Ed.),
Smarter as the New Urban Agenda (pp. 299-314). Cham Heidelberg: Springer.
Berntzen, L., & Johannessen, M. R. (2016b). The role of citizens in “smart cities.” In
Management International Conference. University of Presov, Slovakia.
Bovaird, T. (2007). Beyond engagement and participation: User and community
coproduction of public services. Public Admininistration Review, 67(5), 846-
Sengboon Lim, Jalaluddin Abdul Malek, Mohd Yusof Hussain, & Zurinah Tahir
The behaviours and job positions of citizens in smart cities’ development
© 2019 by MIP 144
860.
Boyte, H. C. (2018). How Americans can reweave our fraying social fabric. Retrieved
November 6, 2018, from https://www.minnpost.com/community-
voices/2018/11/how-americans-can-reweave-our-fraying-social-fabric/
Callahan, K. (2007). Citizen participation: Models and methods. International Journal of
Public Administration, 30(11), 1179-1196.
Cardullo, P., & Kitchin, R. (2017). Being a ‘citizen’ in the smart city: up and down the
scaffold of smart citizen participation. County Kildare, Ireland.
Castelnovo, W. (2016). Co-production makes cities smarter: Citizens’ participation in
smart city initiatives. In M. Fugini (Ed.), Co-production in the public sector (pp.
97-117). AG Switzerland: Springer.
Chourabi, H., Nam, T., Walker, S., Gil-Garcia, J. R., Mellouli, S., Nahon, K., …& Scholl,
H. J. (2012). Understanding smart cities: An integrative framework. In
Proceedings of the 45th Hawaii ICSS (pp. 2289-2297).
Fong, V. (2017). Smart Selangor Blueprint: Selangor smart cities? Retrieved February
1, 2018, from http://www.smartcitiesasia.com/blueprint-smart-city-selangor/
Giffinger, R., Fertner, C., Kramar, H., Kalasek, R., Pichler, N., & Meijers, E. (2007).
Smart cities: Ranking of European medium-sized cities. Wien: TU Vienna.
Gonzalez, A. L. (2017). Where to volunteer, donate to help victims of hurricane Harvey.
Retrieved February 7, 2018, from https://www.sacurrent.com/the-
daily/archives/2017/08/28/where-to-volunteer-donate-to-help- victims-of-
hurricane-harvey
Harrington, K. (2017). Smart city leaders, champions, and entrepreneurs. In V. Kumar
(Ed.), Smart economy in smart cities (pp. 1005-1012). Singapore: Springer.
Koolhaas, R. (2014). My thoughts on the smart city. Retrieved November 11, 2018, from
http://ec.europa.eu/archives/commission_2010-2014/kroes/en/content/my-
thoughts-smart-city- rem-koolhaas.html
Laher, S., & Botha, A. (2012). Methods of sampling. In C. Wagner, B. Kawulich, & M.
Garner (Eds.), Doing social research: A global context. Berkshire: McGrawHill.
Lara, A. P., Moreira Da Costa, E., Furlani, T. Z., & Yigitcanlar, T. (2016). Smartness that
matters: towards a comprehensive and human-centred characterisation of smart
cities. Journal of Open Innovation: Technology, Market & Complexity, 2(1), 1-
13.
Lee, T., Hong, S.-G., & Jeong, H. (2016). A study on smart city development project for
regional innovation: Co-creation and design thinking approach. Advanced
Science and Technology Letters, 141, pp.48-52.
Linders, D. (2012). From e-government to we-government: Defining a typology for
citizen coproduction in the age of social media. Government Information
Quarterly, 29, 446-454.
Menteri Besar Inc. [MBI] (2017). 6-in-1 digital urban & future commerce events.
Retrieved February 1, 2018, from http://www.selangorsmartcity.com/
Malaysian Communications & Multimedia Commission [MCMC]. (2016). Digital
connectivity: Industry performance report 2015. Cyberjaya: Author.
Merriam, S. B., & Tisdell, E. J. (2016). Qualitative research: A guide to design and
implementation (4th ed.). San Francisco: Jossey-Bass.
Mora, L., Bolici, R., & Deakin, M. (2017). The first two decades of smart-city research:
PLANNING MALAYSIA
Journal of the Malaysia Institute of Planners (2019)
145 © 2019 by MIP
Abibliometric analysis. Journal of Urban Technology, 24(1), 3-27.
Mora, L., Deakin, M., Reid, A., & Angelidou, M. (2019). How to overcome the
dichotomous nature of smart city research: Proposed methodology and results of
a pilot study. Journal of Urban Technology, 26(2), 89-128.
Morison, J. (2007). Models of democracy: From representation to participation? In J.
Jowell & D. Oliver (Eds.), The changing constitution (pp. 134-156). Oxford:
Oxford University Press.
Nam, T., & Pardo, T. (2011). Conceptualizing smart city with dimensions of technology,
people & institutions. In Proceedings of the 12th ICDGR (pp. 282-291).
SSDU (2016). Smart Selangor executive summary 2016. Menteri Besar Selangor Inc.
Thomas, J. C. (2013). Citizen, customer, partner: Rethinking the place of the public in
public management. Public Administration Review, 73(6), 786-796.
Thomas, V., Wang, D., Mullagh, L., & Dunn, N. (2016). Where’s wally? In search of
citizen perspectives on the smart city. Sustainability, 8(207), 1-13.
UCLG (2016). Executive summary of co-creating the urban future: The agenda of
metropolises, cities and territories (Vol. Gold IV). Barcelona: United Cities and
Local Governments.
Vanolo, A. (2016). Is there anybody out there? The place and role of citizens in
tomorrow’s smart cities. Futures, 82, 26-36.
Vigoda, E. (2002). From responsiveness to collaboration: Governance, citizens, and the
next generation of public administration. Public Administration Review, 62(5),
527-540.
Willems, J., Bergh, J. Van den, & Viaene, S. (2017). Smart city projects and citizen
participation: The case of London. In R. Andeßner (Ed.), Public sector
management in a globalized world (pp. 249-266). Fachmedien Wiesbaden:
Springer.
Williams, S. I. (2014). Engaging citizens in democratic governance and the decision-
making process with congressional committees. Minneapolis: Walden
University.
Winters, J. V. (2011). Why are smart cities growing? Who moves and who stays. Journal
of Regional Science, 51(2), 253-270
Received: 22nd November 2018. Accepted: 26th June 2019.
1Student at Universitas Diponegoro. Email: [email protected] 146
PLANNING MALAYSIA:
Journal of the Malaysian Institute of Planners
VOLUME 17 ISSUE 2 (2019), Page 146 – 157
THE NEED FOR THE IMPROVEMENT OF STREET VENDORS
MANAGEMENT IN PUBLIC SPACES AT SURAKARTA CITY
Murtanti Jani Rahayu1, Imam Buchori2 & Retno Widjajanti3
1,2,3Doctoral Program of Architecture and Urban Planning
UNIVERSITAS DIPONEGORO, SEMARANG, INDONESIA
Abstract
The presence of an activity in a public space should not obstruct the right of other
users. In order to create an ideal public space as a shared space, the existence of
various activities such as street vendors (SVs) must be properly managed. SVs,
as well as other activities, should strengthen the function of public spaces and not
the other way round. Stabilisation is implemented by regulating several
characteristics of SVs location and activity as a form of SVs management in
public spaces. This idea became the entry point for SVs improvement, although
so far SVs conditions have not been optimally improved. Some new components/
indicators of arrangement will enrich the efforts for stabilisation. In this study,
the analysis technique of partial least square (PLS), which negates a variety of
assumptions was applied to test the effect of stabilisation on the change or
improvement of SVs’ welfare, behaviour, and location. The results show that the
enrichment of components in stabilisation arrangement has a positive and
significant effect on the three elements of SV improvement. The effect of
stabilisation on SVs’ behavioural changes had the highest value if compared to
that of welfare and location changes.
Keywords: Stabilisation, public space, welfare, behaviour
PLANNING MALAYSIA
Journal of the Malaysia Institute of Planners (2019)
147 © 2019 by MIP
INTRODUCTION
Surakarta city has long conducted SVs stabilisation at the governmental public
spaces such as those located around pedestrians (without disturbing the right of
pedestrians), city park, and open space. This step was taken by the government
as a way of accommodating the needs and fulfilling the characteristics of SVs as
well as keeping the beauty of the city. This further indicates that Surakarta city
has made serious efforts in developing a good planning system that enhances city
management and that equally conform to social justice and the beautification of
the city which is sustainable (Hudalah, Winarso, & Woltjer, 2010; Buchori,
2011). If the regulated stabilisation is not conducted, SVs will be regarded as a
city element that is detrimental to the visual aesthetics of the environment,
unexpected, and vulnerable to raise the conflict of space exploitation (Shirvani,
1985; Yatmo 2008). In addition, Yatmo (2008) calls that element out of place. In
order to make SVs an element that contributes to the environment, its presence
needs to be recognised and facilitated in the city development plan (McGee &
Yeung, 1977; Lefebvre, 1991; Yatmo, 2008). Accordingly, the state of ignored
elements, out of place, or city pathology can ultimately change into an energetic
city as the expected condition of SVs resulted from stabilisation in Surakarta City
nowadays.
In Surakarta, stabilisation is undertaken by stipulating a location whose
basis is a public space to be a legal retailing area for SVs through building some
shelters, although the related retailing activities are still regarded informal
(McGee & Yeung, 1977; Kettles, 2007; Puspitasari, 2010; Tualeka, 2013;
Schindler, 2014; Linares, 2018). According to Rahayu (2016), the success of
arranging SVs in a public space will become one of the keys to successfully
reduce poverty. While arrangements have been made, the increase in SV
conditions has not occurred optimally. Therefore, some new arrangement
components/ indicators are needed to enrich stabilisation efforts, in order to
obtain optimum results.
The arrangement of SVs is one of the forms of interaction between
humans and its surrounding environment (Rahayu, 2016). This interaction will
lead to changes (Bintarto, 1989). These changes include welfare, location, and
behavioural changes. Sunaryo (2004) also states that the physical condition of
environment will really influence humans, either knowingly or unknowingly, so
that it causes a change.
In the meantime, the objective of development per se is to achieve
welfare (Bintarto, 1989). The constituent of welfare in the context of development
can be defined as a change to a better or more qualified condition so that the
change which is studied is the existing change of the welfare that aligns with the
objectives of SVs arrangement.
Anchored in Koelle (1974), the indicator of welfare is seen from the
quality of life which covers several aspects that entail income or material,
Murtanti Jani Rahayu, Imam Buchori & Retno Widjajanti
The Need for the Improvement of Street Vendors Management in Public Spaces at Surakarta City
© 2019 by MIP 148
physicality and health, mentality such as education, and spirituality pertinent to
the sense that SVs arrangement is secured from both crimes and eviction.
A change of location refers to location displacement, which frequently
leads to a condition whereby the SVs, in fact, will move their location again over
the stated given position even after being officially arranged. In addition, with
respect to the change of behaviour on the basis of Bloom’s theory (Sunaryo,
2004), it can be split into three domains that comprise knowledge, attitude, and
action. In accordance with Muhibbin Syah (2008), knowledge represents any
information known by SVs so that they acquire adequate understanding through
their five senses. Attitude refers to someone’s efficacy playing a role in
committing himself/herself to do something. Furthermore, action portrays the
skills of psychomotor which manifest the acquired insights or knowledge and the
mental attitude. The values consistently embedded in one’s self will effectively
control him/her. The behaviour in this context is in accordance with a change of
behaviour towards the welfare experienced by SVs. This condition entails the
improvement of insights or knowledge about welfare, the improvement of
attitude towards welfare, and the improvement of action for the sake of welfare.
The existence of SVs can be identified through the characteristics of
activities and locations (Mc Gee & Yeung, 1977). Location characteristic, besides
being related to the typical features of location, is also connected with the
retailing regulation adjusted based on the condition of location (Rahayu,
Werdiningtyas, & Musyawaroh, 2016). The characteristic of activity is associated
with a variety of activities which become the bases and are influenced by the
location per se such as the types of goods, the types of trading facilities, the scale
of consumer or customer service, capital, and income. There are two factors or
characteristics which should be considered while conducting SVs stabilisation
namely the characteristics of SVs location and SVs activity which can be
intervened by the government (Werdiningtyas, Rahayu, & Musyawaroh, 2012;
Rahayu & Musyawaroh, 2013; Rahayu et al., 2016). The aforementioned
characteristics of stabilisation entail 21 components of arrangement, including
the size of retail units (P1), retail facilities (P2), retailing activity time (P3), SVs
grouping (P4), the strategic value of location (P5), accessibility (P6), retail
supporting facilities (P7), parking area (P8), lighting (P9), clean water (P10),
waste disposal facilities (P11), the aesthetics of location (P12), the distance to
activities center (P13), the level of security (P14), the level of cleanliness/
hygiene (P15), the level of convenience (P16), education/ training from
government (P17), legality (P18), agglomeration (P19), retribution (P20), and
loan assistance from the government (P21) (Mc Gee &Yeung, 1977; Regional
Regulation 3/2008 Surakarta City; Donovan, 2008; Werdiningtyas et al., 2012;
Novelia & Sardjito, 2015; Rahayu et al., 2016; Widjajanti, 2016). Among the 21
components of stabilisation arrangement, there are 3 new components, namely
retribution, the strategic value of location and the aesthetics of location
PLANNING MALAYSIA
Journal of the Malaysia Institute of Planners (2019)
149 © 2019 by MIP
(Werdiningtyas et al., 2012; Rahayu et al., 2016; Hanifah & Musadun, 2014). The
new components will be tested for validity in influencing SVs changes, in
addition to the 18 other arrangement components. Therefore, the enrichment of
SVs stabilisation components that influence the changes in SVs can be obtained.
METHOD
The area of this study involved 25 locations of SVs stabilisation which were
spread across Surakarta City, Central Java, Indonesia (Figure 1). This study used
a quantitative method using the data collection technique SEM on the basis of
Partial Least Square (PLS) that negates various assumptions as commonly made
in the study on the basis of Ordinary Least Square (OLS) (Ghozali & Latan,
2015).
The population of SVs engaged in this study was those retail units in
Surakarta city that had been managed through stabilisation, both (a) those existing
within the stated location of stabilisation and (b) those having moved over the
given location of stabilisation. The tested hypothesis was the effect of
stabilisation on welfare development, the change of location, and the
improvement of the SVs’ behaviours through evaluating (1) outer model with
valuing convergent validity, discriminant validity, Cronbach's alpha, composite
reliability and AVE, and (2) inner model with valuing F2 dan R2. This study uses
the loading factor limit of 0.5, cronbach's alpha of 0.7, and the reliability
composite value of 0.7. Good results are indicated by numbers above the
threshold.
The proportional random sampling technique was applied to get the
number of respondents from the SVs that were still present at the location of
stabilisation. The number of population was 551 SVs, with the degree of error
5% gained from 213 respondents. The number of population from the SVs that
had moved over the location of stabilisation was difficult to be detected, so such
SVs incorporated in this study were those who could be encountered by applying
incidental/convenience sampling technique. They were 30 SVs that represented
them. The exogenous latent variable indicators of stabilisation arrangement
include 21 components/indicators, consisting of 18 confirmatory components and
3 exploratory components (new components). In addition, the endogenous latent
variables of change or improvement included the variables of welfare
improvement (PI), behavioural change (BC) and location change (LC). The
indicators of welfare improvement were comprised of income (PI1), health access
(PI2), educational access (PI3), and security (PI4). Behavioural change entailed
the insights appertaining to income (BC1), those associated with health access
(BC2), those related to educational access (BC3), those corresponding to security
(BC4), positive attitude towards the standard of income (BC5), positive attitude
towards health access (BC6), positive attitude towards educational access, (BC7),
positive attitude towards the importance of security (BC8), the efforts to achieve
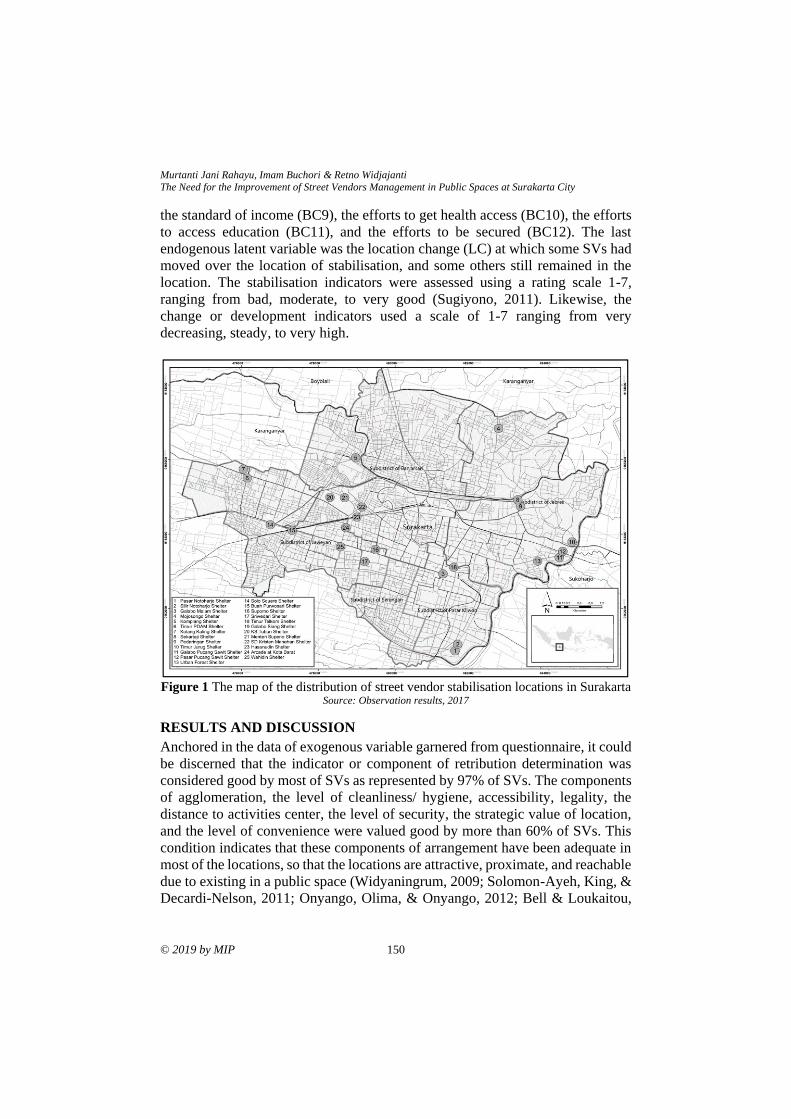
Murtanti Jani Rahayu, Imam Buchori & Retno Widjajanti
The Need for the Improvement of Street Vendors Management in Public Spaces at Surakarta City
© 2019 by MIP 150
the standard of income (BC9), the efforts to get health access (BC10), the efforts
to access education (BC11), and the efforts to be secured (BC12). The last
endogenous latent variable was the location change (LC) at which some SVs had
moved over the location of stabilisation, and some others still remained in the
location. The stabilisation indicators were assessed using a rating scale 1-7,
ranging from bad, moderate, to very good (Sugiyono, 2011). Likewise, the
change or development indicators used a scale of 1-7 ranging from very
decreasing, steady, to very high.
Figure 1 The map of the distribution of street vendor stabilisation locations in Surakarta
Source: Observation results, 2017
RESULTS AND DISCUSSION
Anchored in the data of exogenous variable garnered from questionnaire, it could
be discerned that the indicator or component of retribution determination was
considered good by most of SVs as represented by 97% of SVs. The components
of agglomeration, the level of cleanliness/ hygiene, accessibility, legality, the
distance to activities center, the level of security, the strategic value of location,
and the level of convenience were valued good by more than 60% of SVs. This
condition indicates that these components of arrangement have been adequate in
most of the locations, so that the locations are attractive, proximate, and reachable
due to existing in a public space (Widyaningrum, 2009; Solomon-Ayeh, King, &
Decardi-Nelson, 2011; Onyango, Olima, & Onyango, 2012; Bell & Loukaitou,
PLANNING MALAYSIA
Journal of the Malaysia Institute of Planners (2019)
151 © 2019 by MIP
2014, Widjajanti, 2016). Appertaining to legality component, the SVs had
possessed a placement license as adequate proof in order that they could stay for
retailing in an area of a public space whereby their activity status was informal.
This condition is viewed by Bromley (2000) as the government ambiguous
attitude since though their activities are categorized as informal; such condition
is more profitable for the SVs.
For a couple of characteristics/variabels such as retailing activity time,
SVs grouping, clean water, and retail facilities were valued good by less than
50% of SVs. It was due to these factors, that some other SVs assumed that those
components were not yet optimal in their stabilisation area. Furthermore, a
number of components such as the size of retail units, retail supporting facilities,
education/training from government, aesthetics of location, lighting, parking
area, and waste disposal facilities were only considered good by less than 50% of
SVs. These components only sufficed in some locations. The last component was
loan assistance from the government. Associated with this component, there were
no any SVs who gave the value more than 4. Majority of SVs agreed that the
government never allotted an amount of loan to them. In fact, in accordance with
Tualeka (2013), loan is the most important thing for the SVs’ business nowadays.
With regard to endogenous variable, the welfare improvement in this
sense referred to an improvement that occurred after SVs were placed in the
stabilisation area. The improvement of security became the first order in the
welfare variable which was considered good by most of the SVs. The SVs
security from eviction and crimes will lead to a state where the SVs are willing
to follow the governmental management (Santos, 2017; Kettles, 2007; Rahayu &
Musyawaroh, 2013). SVs do not need to be afraid of either being chased by
security forces while they are retailing, or being terrorised by crimes by virtue of
staying in a crowded area.
The improvement of access to education took the second highest order to
be valued good by the SVs; the improvement of access to health was placed in
the third order by the SVs; and the last order was the improvement of income.
This is in line with the point conveyed by Onyango et al. (2012) and Rahayu et
al. (2016) in which after management, the income improvement is merely
experienced by some SVs. According to behavioural change data, it was observed
that an improvement mostly undergone by the SVs was at the indicator of action
in accessing education and health as shown by more than 70% of SVs. Secondly,
it was the action to gain income and to have security. The next most vital
improvement was found at the SVs’ attitude and insights or knowledge pertinent
to the standard of education and health.
The fourth order of improvement happened to the indicators of attitude
and insights or knowledge corresponding to the level of security which were
experienced by 58% of SVs. The last order for the experienced improvement by
SVs was at the indicators of insights or knowledge and attitude towards the
Murtanti Jani Rahayu, Imam Buchori & Retno Widjajanti
The Need for the Improvement of Street Vendors Management in Public Spaces at Surakarta City
© 2019 by MIP 152
standard of income. Such attitude towards the standard of income meant to
express the agreement towards the standard of income gained in every month.
The assigned minimum income standard was the UMK of regency or city. These
SVs knew and had agreed with the presence of UMK certified by the government
in order that the societies could live prosperously. However, for them, the
important thing was a real action and effort, not merely insights and attitude
towards a governmental policy. More importantly, for them, they expected to
have adequate profits from retailing everyday. Of what benefit is the use of
knowing and agreeing if there was no real action to achieve it. In fact, the results
obtained would only depend on how hard they tried, not on how much they knew
and agreed. This is different from Muhibbin Syah (2008) in that between
knowledge, attitudes and actions are interrelated. As for the location change,
some stabilised SVs moved over to the stated location for various reasons. Some
of them considered that the location they occupied was less strategic. This shows
that the SVs retailing location is indeed very sensitive to changes or shifts even
though they are only a few (Zees & Sugiantoro, 2013). Some SVs assess the
location of arrangement is not developed aesthetically, so it is less attractive for
visitors to come (Rahayu, 2016).
The next step was data processing using the SmartPLS 3.0 program.
Based on the result of the convergent validity test on outer models, it was found
that there were 5 components that had a loading factor below 0.5, namely: (P3)
the retailing activity time, (P10) clean water, (P17) education/ training from
government, (P20) retribution, and (P21) loan assistance from the government,
so that those indicators must be removed from the model. As for the obtained
AVE value, there were still found some variables that had a value of <0.5 so that
the indicators that had the lowest loading factor values must be eliminated as well.
They encompassed (P1) the size of retail units, (P8) parking area, and (P11) waste
disposal facilities so that a good convergent validity was obtained with AVE>
0.5. Furthermore, it can be seen that valid components/indicators that form the
stabilisation arrangement and influence the changes in SVs are (P2) retail
facilities, (P5) the strategic value of location, (P6) accessibility, (P7) retail
supporting facilities, (P8) parking area, (P9) lighting, (P12) the aesthetics of
location, (P13) the distance to activities center, (P14) the level of security, (P15)
the level of cleanliness, (P16) the level of convenience, (P18) education/training
from government and (P19) agglomeration. The 13 valid arrangement
components consist of 11 old components and 2 new components.
Continuously, the reliability test was undertaken. Concerning the result of
the reliability test, the Cronbach's alpha value of all constructs > 0.7, and the
composite reliability value > 0.7, which meant that all constructs had fulfilled
good construct reliability. The estimation result of PLS model can be seen in the
following figure.
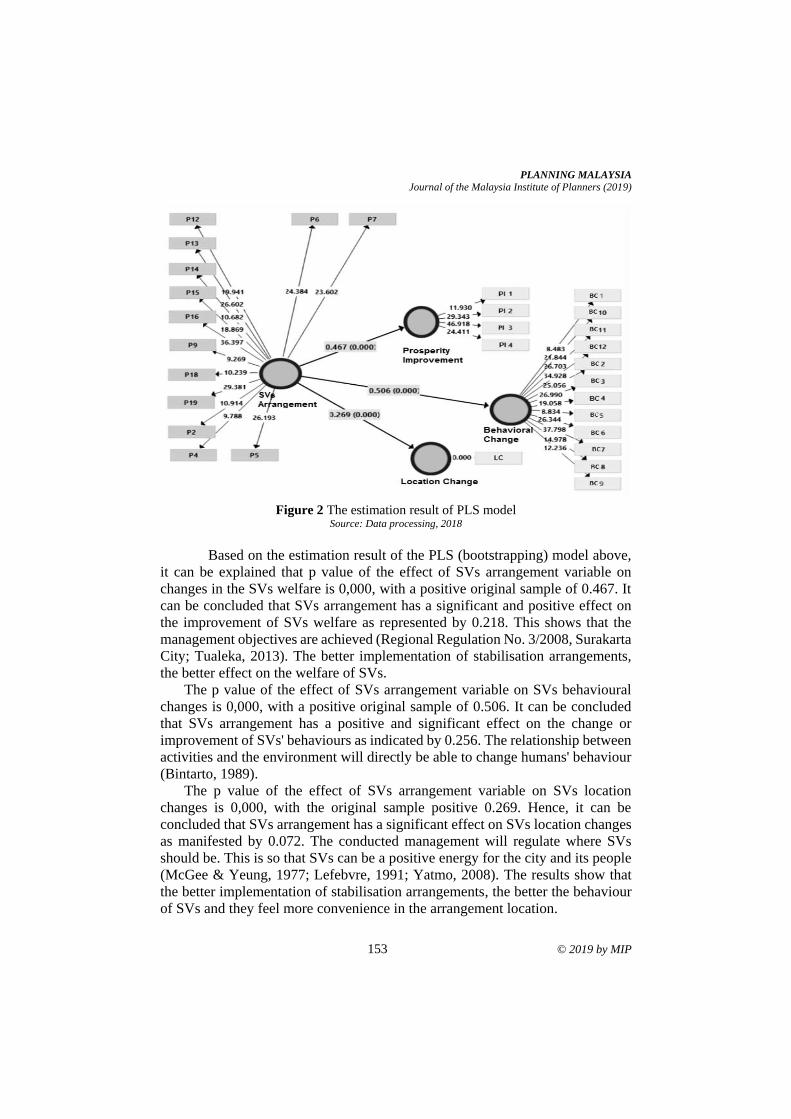
PLANNING MALAYSIA
Journal of the Malaysia Institute of Planners (2019)
153 © 2019 by MIP
Figure 2 The estimation result of PLS model
Source: Data processing, 2018
Based on the estimation result of the PLS (bootstrapping) model above,
it can be explained that p value of the effect of SVs arrangement variable on
changes in the SVs welfare is 0,000, with a positive original sample of 0.467. It
can be concluded that SVs arrangement has a significant and positive effect on
the improvement of SVs welfare as represented by 0.218. This shows that the
management objectives are achieved (Regional Regulation No. 3/2008, Surakarta
City; Tualeka, 2013). The better implementation of stabilisation arrangements,
the better effect on the welfare of SVs.
The p value of the effect of SVs arrangement variable on SVs behavioural
changes is 0,000, with a positive original sample of 0.506. It can be concluded
that SVs arrangement has a positive and significant effect on the change or
improvement of SVs' behaviours as indicated by 0.256. The relationship between
activities and the environment will directly be able to change humans' behaviour
(Bintarto, 1989).
The p value of the effect of SVs arrangement variable on SVs location
changes is 0,000, with the original sample positive 0.269. Hence, it can be
concluded that SVs arrangement has a significant effect on SVs location changes
as manifested by 0.072. The conducted management will regulate where SVs
should be. This is so that SVs can be a positive energy for the city and its people
(McGee & Yeung, 1977; Lefebvre, 1991; Yatmo, 2008). The results show that
the better implementation of stabilisation arrangements, the better the behaviour
of SVs and they feel more convenience in the arrangement location.
Murtanti Jani Rahayu, Imam Buchori & Retno Widjajanti
The Need for the Improvement of Street Vendors Management in Public Spaces at Surakarta City
© 2019 by MIP 154
The locations of SVs stabilisation which have been set by the government
will make those locations legal for SVs even though their activities are still
categorized as informal activities (Mc Gee & Yeung, 1977; Kettles, 2007;
Puspitasari, 2010; Tualeka, 2013; Schindler, 2014; Linares, 2018). This Surakarta
governmental policy, other than to carry out the mandate of Law No. 26/2007
about spatial planning that has to accommodate the informal sectors within its
spatial structure, is also in line with the basic problems of Surakarta city.
Generally, the basic problems occurring in Surakarta city encompass three cases
which entail spatial planning, poverty, and marginal people (Rahayu &
Musyawaroh, 2013). One of the problems faced by marginalised people is the
presence of SVs.
Surakarta City, likewise in Singapore, arranges SVs in a number of public
space locations which are determined by the government. This way, besides
preventing slums and congestion, is also capable of attracting tourists (Rahayu &
Musyawaroh, 2013; Henderson, 2012). The SVs prefer such management in the
form of stabilisation (Lince, 2011; Rahayu, 2016). One of the objectives of the
SVs management or arrangement is to create welfare for SVs besides other goals
for the sake of the orderliness and the aesthetics of the city. In addition, this
finding also aligns with the results of studies conducted by Henderson (2012),
and Rahayu and Musyawaroh (2013), whereby the management or arrangement
of SVs will influence their income although not all of the SVs gain an
improvement.
Besides affecting the increased SVs’ income, the SVs management also
encourages SVs to have an increased ability to access health and education. SVs
themselves realize that becoming SVs is caused by low education and skills.
Hence, for SVs, improving their education or their children’s education is
important in order that they can live more prosperously (Manning & Pratomo,
2013). SVs also want better quality health for themselves and their families in
order to continuously work hard and try better. SVs in this sense experience
vertical mobility in the aspects of income, education, and health. This is the
evolutionary condition as stated by Santos (2017).
After SVs are managed through stabilisation, they can carry out their
business calmly and securely because the places where they trade do justice to
the proper characteristics and are legal as well. This point becomes an entry for
the stabilised SVs to improve their knowledge, attitude, and efforts for the sake
of welfare. The increase of behaviours experienced by most of the SVs happen to
the improvement of their actions in reaching welfare, the improvement of their
knowledge, and lastly, the improvement of their attitude.
This condition indicates that after being managed or arranged, most of
the SVs try harder to prosper. Their efforts to become more prosperous are
manifested by the improvement of their behaviours in achieving welfare. The
PLANNING MALAYSIA
Journal of the Malaysia Institute of Planners (2019)
155 © 2019 by MIP
quality of a good stabilisation management is articulated by the SVs through
trying harder in doing business so that their welfare increases.
Given the fact that some stabilised SVs, later on, move over to the given
stabilisation locations, it indicates that there is a sort of vulnerability from the
locations of stabilisation that they occupy. SVs’ habit of looking for a location
merely based on their intuition but not in accordance with a particular rule
(Onyango et al., 2012) eventually leads them to feel that the locations of
stabilisation which they occupy are less appropriate based on their perceptions as
regards the proper locations they expect. According to the SVs who have moved
over to the given stabilised locations, even though their income is mostly
increased after getting managed, the welfare has not completely increased in
overall. The increment of their income has not yet been in line with the increasing
number of their needs. The SVs move over to the designated locations of
stabilisation because they expect to gain a significant increase of welfare.
CONCLUSION
Of the 21 stabilisation components/indicators, there are 13 components that are
valid in determining the good or bad effect of the SVs arrangement. Within the
13 components, 2 of them are new components/exploratory, namely the strategic
value of location and the aesthetics of location. This research has shown the
enrichment of components in stabilisation arrangements that affect changes in
SVs. Overall, those components encompass retail facilities, SVs grouping, the
strategic value of location, accessibility, retail supporting facilities, lighting, the
aesthetics of location, the distance to activities center, the level of security,
cleanliness/ hygiene, the level of convenience, legality, and agglomeration. The
8 indicators which are not valid in determining the good or bad effect of SVs
arrangement are the size of retail units, the retailing activity time, parking area,
clean water, waste disposal facilities, education/ training from government,
retribution, and loan assistance from the government.
Stabilisation variables have a significant and positive effect on the change
or improvement variables, although in the weak category. The better the condition
of the components in stabilisation arrangements will lead to better changes in
SVs. The order of the effect of the magnitude of stabilisation, which is the most
occurrence in behavioural changes, then the changes in welfare, and finally the
changes in location.
Murtanti Jani Rahayu, Imam Buchori & Retno Widjajanti
The Need for the Improvement of Street Vendors Management in Public Spaces at Surakarta City
© 2019 by MIP 156
ACKNOWLEDGMENT
Our utmost gratitude goes to Indonesia Endowment Fund for Education,
Universitas Diponegoro, and Universitas Sebelas Maret for their various support
in conducting this study. Most importantly, our gratitude goes to Rr. Ratri W and
all friends who are too many to be mentioned here individually. Hopefully, this
article will be beneficial to both science and the society at large.
REFERENCES Bell, J. S., & Loukaitou-Sideris, A. (2014). Sidewalk informality: An examination of
street vending regulation in China. International Planning Studies, 19, 221-243.
Bintarto. (1989). Interaksi desa-kota dan permasalahannya. Jakarta: Ghalia Indonesia.
Bromley, R. (2000). Street vending and public policy: A global review. International
Journal of Sociology and Social Policy, 20(1/2), 1-28.
Buchori, I. (2011). Konsep sistem informasi rencana tata ruang wilayah untuk
kabupaten/kota di Indonesia. Jurnal Tata Loka, 13(4), 224-234.
Donovan, M. (2008). Informal cities and the contestation of public space: The case of
Bogotá’s street vendors. Urban Study, 45(1), 29-51.
Ghozali, I., & Latan, H. (2015). Partial least squares: Konsep, teknik dan aplikasi
menggunakan Smart PLS 3.0 (Edisi 2). Semarang: Badan Penerbit Undip.
Hanifah, U., & Mussadun. (2014). Penilaian tingkat keberhasilan relokasi PKL di
kawasan Pasar Waru dan Simpang Lima. Jurnal Perencanaan Wilayah dan Kota
SAPPK ITB dan IAP, 25(3), 228-242.
Henderson, J. C. (2012). Hawker centers as tourist attractions: The case of Singapore.
International Journal of Hospitality Management, 849-855.
Hudalah, D., Winarso, H., & Woltjer, J. (2010). Planning by opportunity: An analysis of
periurban environmental conflict in Indonesia. Environment and Planning A, 42(9),
2254-2269.
Kettles, G. W. (2007). Legal responses to sidewalk vending: The case of Los Angeles,
California. In J. Cross & A. Morales (Eds), Street entrepreneurs people, place, and
politics in local and global perspective (pp. 58–78). New York: Routledge.
Koelle, H. (1974). An experimental study on the determination of a definition for the
quality of life. Regional Studies, 8, 1-10.
Lefebvre, H. (1974). The production of space, translated by (1991), , . (N.-S. Donald,
Trans.). Oxford, UK and Cambridge, Mass, USA: Blackwell.
Linares, L. A. (2018). The paradoxes of informalizing street trade in the Latin American
city. International Journal of Sociology and Social Policy, 38(7-8), 651-672.
Lince, S. (2011). The informal sector in Jinja. African Studies Review, 54(2), 73-93.
Manning, C., & Pratomo, D. S. (2013). Do migrants get stuck in the informal sector?
Findings from a household survey in four Indonesian cities. Bulletin of Indonesian
Economic Studies, 49(2), 167-192. McGee, T. G., & Yeung, Y. (1977). Hawkers in Southeast Asian cities: Planning for the
bazaar economy. Ottawa: International Development Research Centre.
Muhibbin Syah, M. (2008). Psikologi pendidikan. Bandung: PT Remaja Rosda Karya.
Novelia, A. S., & Sardjito. (2015). Kriteria penentuan lokasi pedagang kaki lima
berdasarkan preferensi pedagangnya di kawasan perkotaan Sidoarjo. Jurnal Teknik
ITS, 4(1), 230.
PLANNING MALAYSIA
Journal of the Malaysia Institute of Planners (2019)
157 © 2019 by MIP
Onyango, J., Olima, W., & Onyango, L. (2012). Dynamics of street vending phenomenon
in the Kisumu Municipality, Kenya. International Journal of Arts and Commerce,
1(4), 107-120.
Puspitasari. (2010). Penataan PKL kuliner untuk mewujudkan fungsi tata ruang kota di
ruang kota di Kota Yogyakarta dan Kabupaten Sleman. Jurnal Mimbar Hukum,
22(3), 588-606.
Rahayu, M. J., & Musyawaroh. (2013). Stabilisasi sebagai bentuk penataan PKL makanan
siap saji di Kota Surakarta. Jurnal Tata Loka, 15(1), 39-52.
Rahayu, M. J., Werdiningtyas, R., & Musyawaroh. (2016). Faktor-faktor yang
mempengaruhi keberhasilan penataan PKL sebagai strategi penataan ruang Kota
Surakarta. Region, 6(3), 109-122.
Rahayu, M. J. (2016). Perubahan kondisi PKL pasca penataan stabilisasi dan relokasi di
Kota Surakarta. In G. Hardiman (Ed.), Sustainable architecture and urbanism (pp.
43-59). Semarang: Departemen Arsitektur Fakultas Teknik Universitas
Diponegoro.
Santos, M. (2017). The shared space: The two circuits of the urban economy in
underdevelopment countries. London and New York: Methuen.
Schindler, S. (2014). Producing and contesting the formal/informal divide: Regulating
street hawking in Delhi, India. Urban Studies, 51(12), 2596-2612.
Shirvani, H. (1985). The urban design process. New York: Van Nostran Reinhold
Company.
Solomon-Ayeh, B. E., King, R. S., & Decardi-Nelson, I. (2011). Street vending and the
use of urban public space in Kumasi, Ghana. The Ghana Surveyor, 4(1), 20-31.
Sugiyono. (2011). Metode Penelitian Kuantitatif, Kualitatif dan R&D. Bandung:
Alfabeta.
Sunaryo. (2004). Psikologi untuk keperawatan kedokteran. Jakarta: EGC.
Tualeka, B. A. (2013). Memahami kebijakan pembinaan PKL Surabaya, kajian terhadap
perda Kota Surabaya No.17 Tahun 2003. DIA Jurnal Administrasi Publik, 11(1),
149-159.
Werdiningtyas, R., Rahayu, M. J., & Musyawaroh. (2012). Hawkers behaviour and
characteristic as an important factor to empower local economy. 2nd CONVEEESH
& 13th SENVAR, 2, 1-10. Yogyakarta: Duta Wacana Christian University.
Widjajanti, R. (2016). The space utilization by street vendors based on the location
characteristics in the education area of Tembalang, Semarang. Procedia - Social
and Behavioral Sciences, 227, 186-193.
Widyaningrum, R. (2009). Karakteristik aktivitas pedagang kaki lima pada kawasan
komersial di pusat kota (Studi kasus: Simpang Lima Semarang). Jurnal Teknik,
20(3), 162-170.
Yatmo, Y. A. (2008). Street vendors as ‘out of place’ urban elements. Journal of Urban
Design, 13(3), 387-402.
Zees, E. A. T. & Sugiantoro. (2013). Sensitifitas pedagang kaki lima terhadap lokasi pada
skala mikro di Kota Manado. Jurnal Perencanaan Wilayah dan Kota ITB
SAPPK, 2(3), 777-797
Received: 25th January 2019. Accepted: 2nd July 2019.
2Lecturer at Universiti Putra Malaysia. Email: [email protected]. 158
PLANNING MALAYSIA:
Journal of the Malaysian Institute of Planners
VOLUME 17 ISSUE 2 (2019), Page 158 – 167
ENHANCING THE POTENTIAL OF RECYCLABLES WASTE
COLLECTION THROUGH WASTE BANK PROGRAMME:
EXPERIENCE FROM HEI IN MALAYSIA
Fatma Sabariah Alias1, Latifah Abdul Manaf2, Mariani Ariffin3,
& Sabrina Ho Abdullah4
1,2,3,4Faculty of Environmental Studies
UNIVERSITI PUTRA MALAYSIA
Abstract
A voluntary approach for recycling programme can be enhanced by the
establishment of waste bank in institutions of higher education. Hence, a waste
bank programme was implemented in a “close loop” system at the Faculty of
Environmental Studies, Universiti Putra Malaysia (FPAS, UPM). This aims to
promote collection of recyclable materials and raise awareness among UPM
students on the importance of recycling. Throughout the five (5) phases of
operation, about 500 students were registered as waste bank members with the
amount of total collected recyclables reaching 14,817.46 kg. The direct
measurement method was applied in the waste bank operation procedure to weigh
the recyclable materials received twice a week. The most frequent type of
recyclable material collected was paper, including black/white paper, newspaper,
and mix paper. The waste bank programme has enhanced the potential of solid
waste minimisation by shifting the amount of waste disposed at the landfill site.
Moreover, it enables recyclable materials to be seen as valuable resources as
monetary rewards were given to encourage recycling practices among students
based on the total weight for each collection of recyclable materials. Therefore,
the implementation of the waste bank programme in Higher Education
Institutions (HEI) in Malaysia creates an opportunity to be a medium of a
sustainable solid waste minimisation system in promoting sustainable green
campuses at the university.
Keywords: awareness, green campus, higher education institution, recyclables,
recycling, waste bank
PLANNING MALAYSIA
Journal of the Malaysia Institute of Planners (2019)
159 © 2019 by MIP
INTRODUCTION
The rapid rate of development in Malaysia has accelerated the daily generation
and volume of solid waste. The amount of waste produced has increased from
33,000 tonnes in 2012 to 38,000 tonnes of waste in year 2015. This figure is
expected to increase to 16.76 million tonnes by year 2020 with 45,900 tonnes of
waste are predicted to be generated every day (Agamuthu & Dennis, 2011;
SWCorp. 2012; SWCorp, 2014). Approximately 28% of the total daily waste
generated originate from the commercial and institutional sectors, which
contributed 9,224 million tonnes of waste generated daily (NSWMD, 2015).
At the same time, the rapid expansion of the Higher Education
Institutions (HEI) sector in Malaysia has also led to the increasing of solid waste
generation as the population within HEIs in Malaysia increases (Jibril, Sipan, &
Lawal, 2012). Population in HEIs comprises administrative personnel, students,
academic staff and non-academic staff. These groups produced waste of which
only 40% of recyclable items were collected at educational institutions with an
average per person of 0.33 kg/person/day. Additionally, the recycling rate for the
institutional and commercial sectors is about 7.4% and almost 89% of waste were
disposed of in landfill sites (NSWMD, 2015).
A recycling programme is an activity which often attracts attention in
HEIs as an on-going sustainability initiative for solid waste management. HEIs
are among the major contributors to the increase in solid waste generation and
most of the waste generated were recyclable materials (Kehmeyer et al., 2011).
HEIs in Malaysia have taken the initiative to implement recycling as a campus
sustainability programme by involving the campus community, such as in
Universiti Sains Malaysia (USM). However, the recycling programme failed to
achieve sustainability due to the seasonal nature of the programme and the
ineffective recycling system adopted (Abas & Md Nor, 2014). Meanwhile,
Universiti Teknologi Malaysia (UTM) has produced the UTM Sustainable
Campus Policy as a general guideline for campus sustainability including areas
such as energy management. Monday is UTM Recycling Day, where the Green
Office and Sustainable Arcade make an effort to provide a conducive campus
environment for a sustainable learning and teaching environment in the university
(Zen, Ahamad, & Omar, 2014). UPM was also the leading university in terms of
sustainable campus by implementing the Environmental Management System
(EMS) MS ISO 14001 through activities relating to the teaching and learning
process in the campus towards sustainable development goals.
In fact, solid waste minimisation strategies (particularly in recycling)
have been noted as practical solutions in overcoming the solid waste disposal
issues due to the increasing waste generation rates (Sakawi, 2011). Moreover,
Purcell and Magette (2010) also revealed that recycling can reduce the waste
disposal problem by extending the landfill space and prolonging the lifespan of
landfill sites.
Fatma Sabariah Alias, Latifah Abdul Manaf, Mariani Ariffin, & Sabrina Ho Abdullah, Enhancing the Potential of Recyclables Waste Collection Through Waste Bank Programme: Experience from Higher Education Institutions in Malaysia
© 2019 by MIP 160
Initially, recycling collections were dominated by the informal sector
such as door-to door itinerant recycling buyers, waste collection workers
separating recyclable materials and scavenging activities in landfills (Siwar,
2008). Zen and Siwar (2015) revealed that about 31% of households have a high
preference towards door-to-door itinerant buyers because of monetary incentives
received. Besides that, accessibility of kerbside recycling and drop-off recycling
has a significant impact on solid waste reduction and can also have a positive
effect on the percentage of recyclables collected. However, both methods largely
dependent on household participation on voluntary basis. Nevertheless, the
individuals’ recycling participation is also influenced by investment of time,
space, money and effort, in addition to their knowledge and attitude towards
recycling (Sidique, Joshi, & Lupi, 2010).
According to Beringer, Wright and Malone (2008), and Zen, Bandi,
Zakaria and Saleh (2013), campus waste characterisation studies are relatively
inexpensive and can generate administrative support and cooperation among
students and academia by inspiring involvement in the sustainable campus
community. This can be achieved through activities involving the aspects of
teaching, learning and research as part of the education to the campus community.
Thus, this paper highlights the activities of UPM through its Faculty of
Environmental Studies’ initiative of implementing a waste bank programme for
the campus community as part of its ongoing efforts to promote green campus.
RESEARCH BACKGROUND
Universiti Putra Malaysia (UPM) formerly known as Universiti Pertanian
Malaysia is located in Serdang, Selangor next to Malaysia’s administrative
capital city, Putrajaya. It is one of Malaysia’s leading research universities (RU)
with a total enrolment of 24,874 students and 2,595 academic staff for the 2016
academic year. Its campus sits on an estimated 1,108.103 hectares of land,
housing 16 faculties, 17 student hostels, nine (9) institutes, four (4) centres and
several administrative and academic buildings respectively. The major activities
on campus focused on teaching, research and extracurricular activities such as
sports, recreation, associations, clubs, arts and culture.
Waste Bank Initiative
The waste bank was initiated by a lecturer in FPAS and a group of volunteers
from the solid waste management course (EMG 3104). They were inspired by
UPM’s green campus aspiration and sought to achieve this by reducing solid
waste generation and promoting recycling practices among the campus
community. The project began in the year 2015 and has continuously being
operated on the campus. The waste bank (Figure 1) is located at the Solid Waste
Lab at FPAS, UPM.
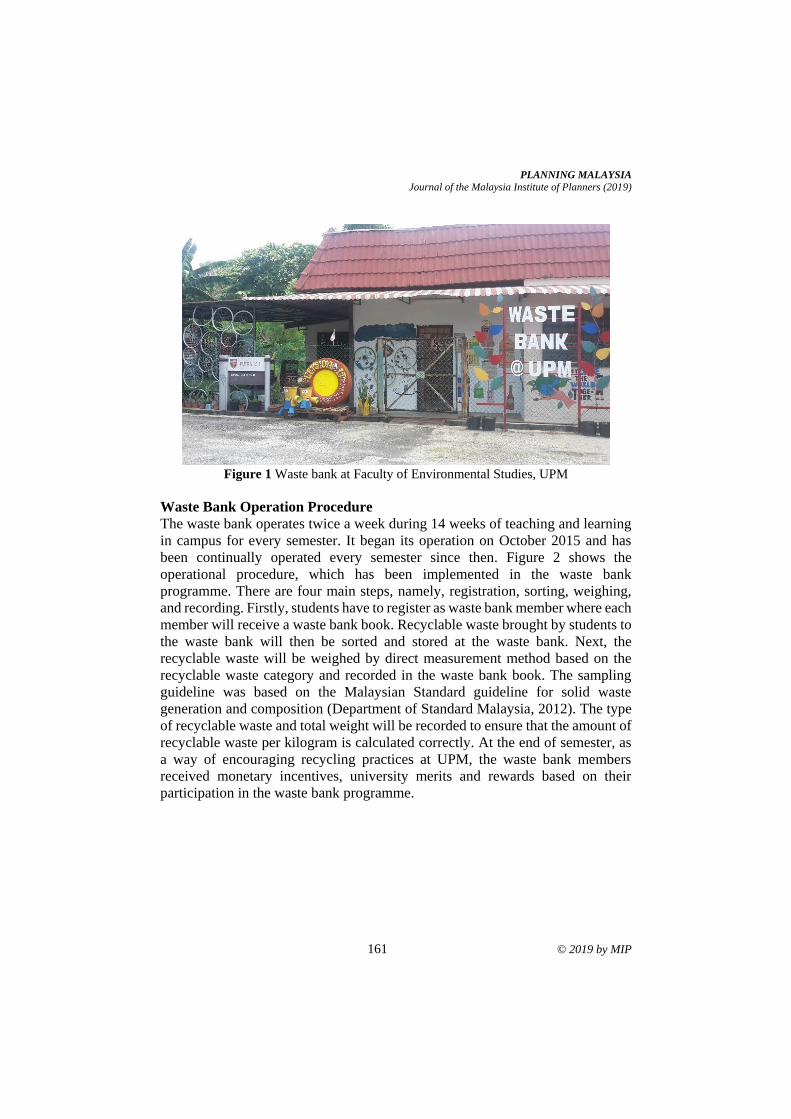
PLANNING MALAYSIA
Journal of the Malaysia Institute of Planners (2019)
161 © 2019 by MIP
Figure 1 Waste bank at Faculty of Environmental Studies, UPM
Waste Bank Operation Procedure
The waste bank operates twice a week during 14 weeks of teaching and learning
in campus for every semester. It began its operation on October 2015 and has
been continually operated every semester since then. Figure 2 shows the
operational procedure, which has been implemented in the waste bank
programme. There are four main steps, namely, registration, sorting, weighing,
and recording. Firstly, students have to register as waste bank member where each
member will receive a waste bank book. Recyclable waste brought by students to
the waste bank will then be sorted and stored at the waste bank. Next, the
recyclable waste will be weighed by direct measurement method based on the
recyclable waste category and recorded in the waste bank book. The sampling
guideline was based on the Malaysian Standard guideline for solid waste
generation and composition (Department of Standard Malaysia, 2012). The type
of recyclable waste and total weight will be recorded to ensure that the amount of
recyclable waste per kilogram is calculated correctly. At the end of semester, as
a way of encouraging recycling practices at UPM, the waste bank members
received monetary incentives, university merits and rewards based on their
participation in the waste bank programme.
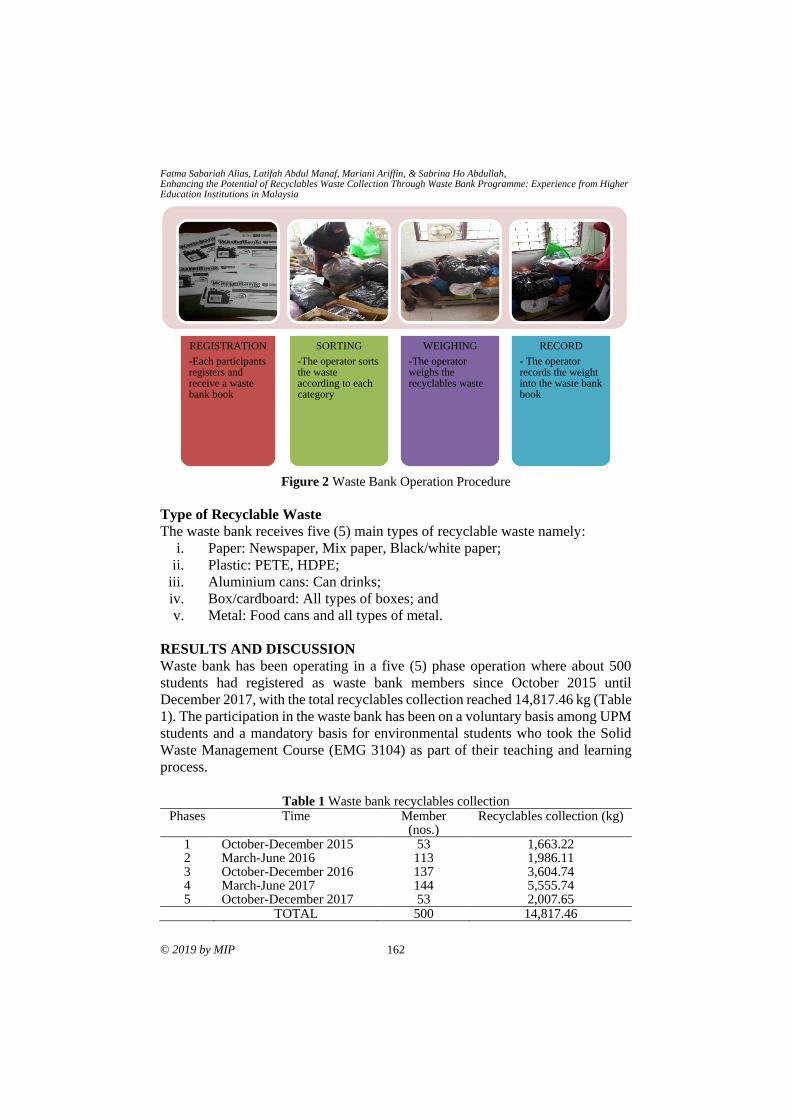
Fatma Sabariah Alias, Latifah Abdul Manaf, Mariani Ariffin, & Sabrina Ho Abdullah, Enhancing the Potential of Recyclables Waste Collection Through Waste Bank Programme: Experience from Higher Education Institutions in Malaysia
© 2019 by MIP 162
Figure 2 Waste Bank Operation Procedure
Type of Recyclable Waste
The waste bank receives five (5) main types of recyclable waste namely:
i. Paper: Newspaper, Mix paper, Black/white paper;
ii. Plastic: PETE, HDPE;
iii. Aluminium cans: Can drinks;
iv. Box/cardboard: All types of boxes; and
v. Metal: Food cans and all types of metal.
RESULTS AND DISCUSSION
Waste bank has been operating in a five (5) phase operation where about 500
students had registered as waste bank members since October 2015 until
December 2017, with the total recyclables collection reached 14,817.46 kg (Table
1). The participation in the waste bank has been on a voluntary basis among UPM
students and a mandatory basis for environmental students who took the Solid
Waste Management Course (EMG 3104) as part of their teaching and learning
process.
Table 1 Waste bank recyclables collection
Phases Time Member (nos.)
Recyclables collection (kg)
1 October-December 2015 53 1,663.22 2 March-June 2016 113 1,986.11 3 October-December 2016 137 3,604.74 4 March-June 2017 144 5,555.74 5 October-December 2017 53 2,007.65 TOTAL 500 14,817.46
REGISTRATION
-Each participants registers and receive a waste bank book
SORTING
-The operator sorts the waste according to each category
WEIGHING
-The operator weighs the recyclables waste
RECORD
- The operator records the weight into the waste bank book
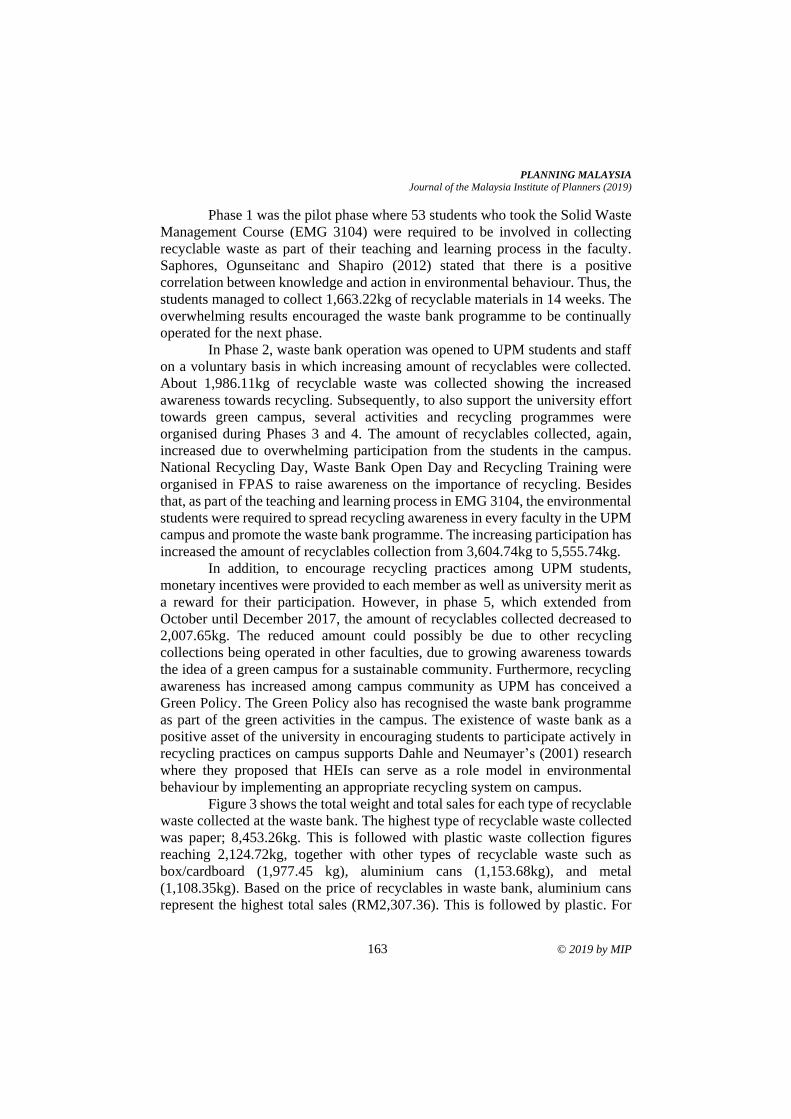
PLANNING MALAYSIA
Journal of the Malaysia Institute of Planners (2019)
163 © 2019 by MIP
Phase 1 was the pilot phase where 53 students who took the Solid Waste
Management Course (EMG 3104) were required to be involved in collecting
recyclable waste as part of their teaching and learning process in the faculty.
Saphores, Ogunseitanc and Shapiro (2012) stated that there is a positive
correlation between knowledge and action in environmental behaviour. Thus, the
students managed to collect 1,663.22kg of recyclable materials in 14 weeks. The
overwhelming results encouraged the waste bank programme to be continually
operated for the next phase.
In Phase 2, waste bank operation was opened to UPM students and staff
on a voluntary basis in which increasing amount of recyclables were collected.
About 1,986.11kg of recyclable waste was collected showing the increased
awareness towards recycling. Subsequently, to also support the university effort
towards green campus, several activities and recycling programmes were
organised during Phases 3 and 4. The amount of recyclables collected, again,
increased due to overwhelming participation from the students in the campus.
National Recycling Day, Waste Bank Open Day and Recycling Training were
organised in FPAS to raise awareness on the importance of recycling. Besides
that, as part of the teaching and learning process in EMG 3104, the environmental
students were required to spread recycling awareness in every faculty in the UPM
campus and promote the waste bank programme. The increasing participation has
increased the amount of recyclables collection from 3,604.74kg to 5,555.74kg.
In addition, to encourage recycling practices among UPM students,
monetary incentives were provided to each member as well as university merit as
a reward for their participation. However, in phase 5, which extended from
October until December 2017, the amount of recyclables collected decreased to
2,007.65kg. The reduced amount could possibly be due to other recycling
collections being operated in other faculties, due to growing awareness towards
the idea of a green campus for a sustainable community. Furthermore, recycling
awareness has increased among campus community as UPM has conceived a
Green Policy. The Green Policy also has recognised the waste bank programme
as part of the green activities in the campus. The existence of waste bank as a
positive asset of the university in encouraging students to participate actively in
recycling practices on campus supports Dahle and Neumayer’s (2001) research
where they proposed that HEIs can serve as a role model in environmental
behaviour by implementing an appropriate recycling system on campus. Figure 3 shows the total weight and total sales for each type of recyclable
waste collected at the waste bank. The highest type of recyclable waste collected
was paper; 8,453.26kg. This is followed with plastic waste collection figures
reaching 2,124.72kg, together with other types of recyclable waste such as
box/cardboard (1,977.45 kg), aluminium cans (1,153.68kg), and metal
(1,108.35kg). Based on the price of recyclables in waste bank, aluminium cans
represent the highest total sales (RM2,307.36). This is followed by plastic. For
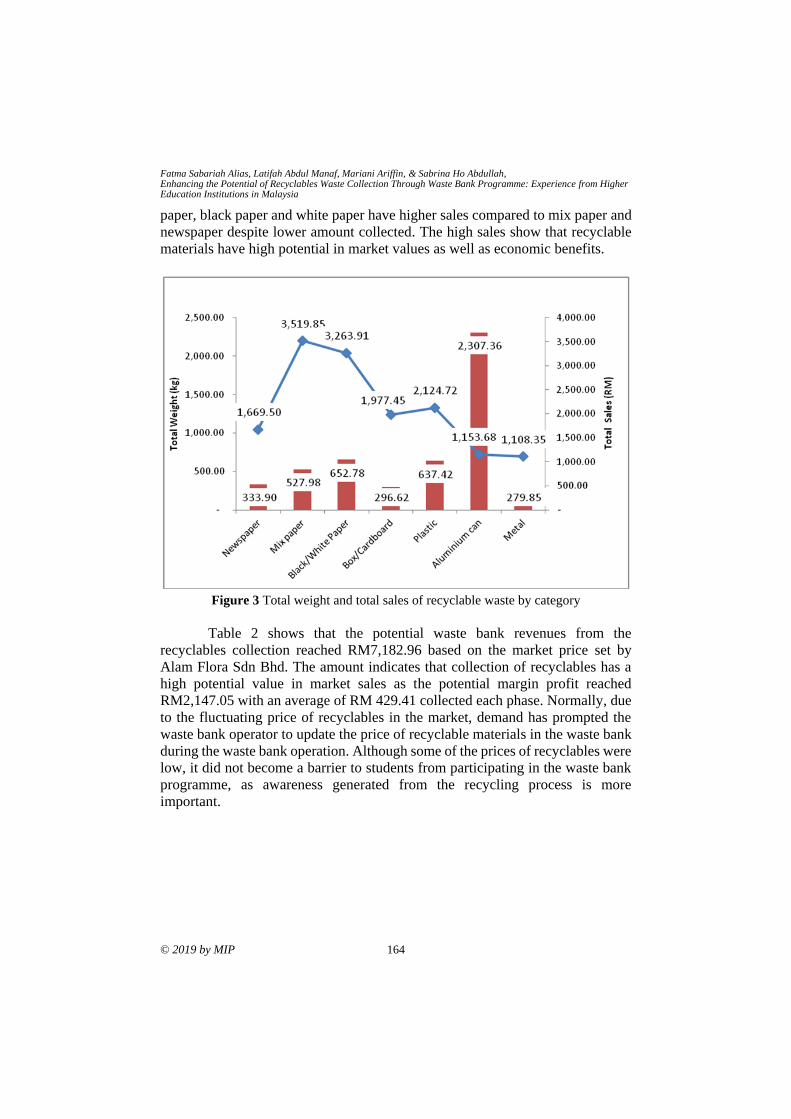
Fatma Sabariah Alias, Latifah Abdul Manaf, Mariani Ariffin, & Sabrina Ho Abdullah, Enhancing the Potential of Recyclables Waste Collection Through Waste Bank Programme: Experience from Higher Education Institutions in Malaysia
© 2019 by MIP 164
paper, black paper and white paper have higher sales compared to mix paper and
newspaper despite lower amount collected. The high sales show that recyclable
materials have high potential in market values as well as economic benefits.
Figure 3 Total weight and total sales of recyclable waste by category
Table 2 shows that the potential waste bank revenues from the
recyclables collection reached RM7,182.96 based on the market price set by
Alam Flora Sdn Bhd. The amount indicates that collection of recyclables has a
high potential value in market sales as the potential margin profit reached
RM2,147.05 with an average of RM 429.41 collected each phase. Normally, due
to the fluctuating price of recyclables in the market, demand has prompted the
waste bank operator to update the price of recyclable materials in the waste bank
during the waste bank operation. Although some of the prices of recyclables were
low, it did not become a barrier to students from participating in the waste bank
programme, as awareness generated from the recycling process is more
important.
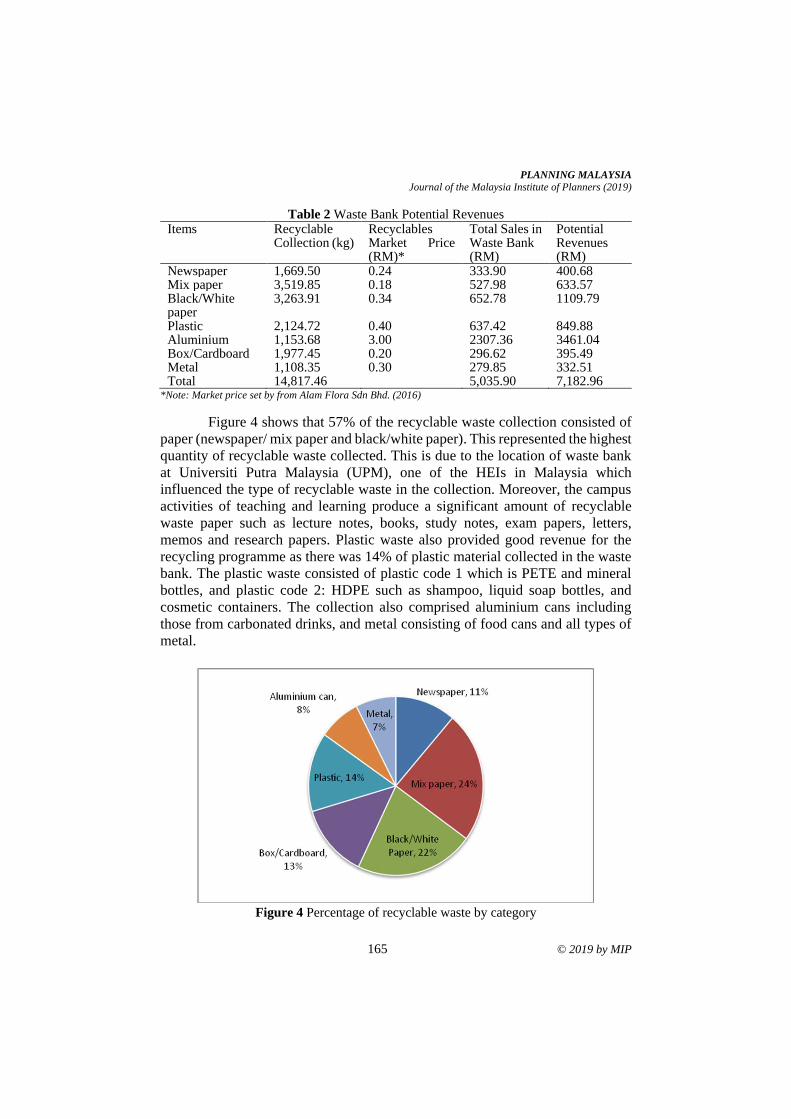
PLANNING MALAYSIA
Journal of the Malaysia Institute of Planners (2019)
165 © 2019 by MIP
Table 2 Waste Bank Potential Revenues Items Recyclable
Collection (kg) Recyclables Market Price (RM)*
Total Sales in Waste Bank (RM)
Potential Revenues (RM)
Newspaper 1,669.50 0.24 333.90 400.68 Mix paper 3,519.85 0.18 527.98 633.57 Black/White paper
3,263.91 0.34 652.78 1109.79
Plastic 2,124.72 0.40 637.42 849.88 Aluminium 1,153.68 3.00 2307.36 3461.04 Box/Cardboard 1,977.45 0.20 296.62 395.49 Metal 1,108.35 0.30 279.85 332.51 Total 14,817.46 5,035.90 7,182.96
*Note: Market price set by from Alam Flora Sdn Bhd. (2016)
Figure 4 shows that 57% of the recyclable waste collection consisted of
paper (newspaper/ mix paper and black/white paper). This represented the highest
quantity of recyclable waste collected. This is due to the location of waste bank
at Universiti Putra Malaysia (UPM), one of the HEIs in Malaysia which
influenced the type of recyclable waste in the collection. Moreover, the campus
activities of teaching and learning produce a significant amount of recyclable
waste paper such as lecture notes, books, study notes, exam papers, letters,
memos and research papers. Plastic waste also provided good revenue for the
recycling programme as there was 14% of plastic material collected in the waste
bank. The plastic waste consisted of plastic code 1 which is PETE and mineral
bottles, and plastic code 2: HDPE such as shampoo, liquid soap bottles, and
cosmetic containers. The collection also comprised aluminium cans including
those from carbonated drinks, and metal consisting of food cans and all types of
metal.
Figure 4 Percentage of recyclable waste by category
Fatma Sabariah Alias, Latifah Abdul Manaf, Mariani Ariffin, & Sabrina Ho Abdullah, Enhancing the Potential of Recyclables Waste Collection Through Waste Bank Programme: Experience from Higher Education Institutions in Malaysia
© 2019 by MIP 166
Throughout the waste bank operation, monetary rewards and university
merit were an encouragement for students to participation. These have also
become a key contributing factor to the success of the waste bank operation in
UPM. Basri, Zawawi, Zain, Mohamad and Kasa (2016) also mentioned that
encouragement and incentive measures should be provided to students as this will
motivate them to be more keen to participate in the on-campus recycling
activities. Students play a vital role in the sustainable campus society as their
attitudes and behaviour have been of great importance in the success of the
recycling programme.
CONCLUSION
Based on the results obtained, it can be concluded that it is important to develop
sustainability policies in campus which cover the issue of solid waste
minimisation to support the waste bank programme. The waste bank programme
reveals the potential of solid waste minimisation, as can be seen from the
recyclables collection in the campus and also raised awareness towards the
importance of recycling. Besides that, the waste bank programme also shows the
potential value of recyclables in the market. Moreover, it could be suggested that
the waste bank programme can be seen as an environmental protection in HEIs
as part of the learning and teaching programme aiming towards sustainability of
campuses and green universities. A waste bank programme would be a beneficial
model for a sustainable solid waste minimization system for HEIs in Malaysia in
order to increase awareness levels towards sustainability development goals.
ACKNOWLEDGEMENT The authors would like to thank the volunteers and participants at Universiti Putra
Malaysia (UPM) for their time and support of the waste bank programme at the
Faculty of Environmental Studies.
REFERENCES Agamuthu, P., & Dennis, V. (2011). Policy trends of extended producer responsibility
(EPR) in Malaysia. Waste Management & Research Journal. Retrieved from
https://www.researchgate.net/publication/51504774_Policy_trends_of_extende
d_producer_responsibility_in_Malaysia.
Abas, M. A., & Md Nor, N. (2014). Participation of campus community at Universiti
Sains Malaysia on the single stream recycling system. Jurnal Personalia
Pelajar, 17, (83-95).
Basri, N. E. A., Zawawi, M. A., Zain, S. M., Mohamad, W. N. A. W., & Kasa A. (2016).
Effects of an awareness programme on the perception of engineering students at
the Universiti Kebangsaan Malaysia towards solid waste recycling practices.
Pertanika Journal of Social Science and Humanities, 24, 1-14.
PLANNING MALAYSIA
Journal of the Malaysia Institute of Planners (2019)
167 © 2019 by MIP
Beringer, A., Wright, T., & Malone, L. (2008). Sustainability in higher education in
Atlantic Canada. International Journal of Sustainability in Higher Education,
9(1), 48-67.
Dahle, M., & Neumayer, E. (2001). Overcoming barriers to campus greening: A survey
among higher educational institutions in London, UK International Journal of
Sustainability in Higher Education, 2, 139-160.
Department of Standard Malaysia (2012) MS 2505:2012, Malaysian Standard. Guideline
for sampling of household solid waste – Composition and Characterisation
analysis. Kuala Lumpur: Author.
Jibril, J, Sipan, I., & Lawal, J. (2012). 3R’s critical success factor for integrated solid
waste management in higher educational institution. International Journal of
Sustainable Development, 05(10), 109-120.
Kehmeyer, M., Miller, C., Neppel, K., Ronnebaum, C., Webber, J. & Zinke, B. (2011).
Waste characterization study for Kansas State University Recycling. Kansas
State University, Natural Resources and Environment Sciences Capstone
Course.
National Solid Waste Management Department [NSWMD], (2015). Final Lab Report,
Solid Waste Management Lab 2015. Ministry of Housing and Local
Government (MHLG)
Purcell, M., & Magette W. L. (2010). Attitudes and behaviour towards waste management
in the Dublin, Ireland region. Waste Management, 30, 1997-2006.
Saphores, J. M., Ogunseitanc, O. A., & Shapiro, A. A. (2012). Willingness to engage in
a pro-environmental behavior: An analysis of e-waste recycling based on a
national survey of U.S. households. Resources, Conservation and Recycling, 60,
49-63.
SWCorp, (2012). Composition on household solid waste in Malaysia. Final report survey
on solid waste composition, characteristic, and existing practice of solid waste
recycling in Malaysia.
SWcorp. (2014). Pelan Strategik Swcorp 2014-2020, Melakar Dimensi Baharu Menuju
Masa Hadapan.
Sakawi. Z., (2011). Municipal solid waste management in Malaysia: Solution for
sustainable waste management. Journal of Applied Sciences in Environmental
Sanitation, 6(1), 29-38.
Siwar, C. (2008). Solid waste management: Recycling, green jobs and challenges in
Malaysia. ILO Research Conference on Green Jobs for Asia & Pacific. April 21-
23, 2019, Niigata, Japan.
Sidique, S. F., Joshi, S. V., & Lupi, F. (2010). Factors influencing the rate of recycling:
An analysis of Minnesota counties. Resources, Conservation and Recycling 54,
242-249.
Zen, I. S. & Siwar, C. (2015). An analysis of household acceptance of curbside recycling
scheme in Kuala Lumpur, Malaysia. Habitat International, 47, 248-255.
Zen, I. S., Ahamad, R., & Omar, W. (2014). The development and measurement of
conducive campus environment for Universiti Teknologi Malaysia (UTM) of
campus sustainability. Jurnal Teknologi, 68(1), 71-82
Received: 12th January 2019. Accepted: 2nd August 2019
1PhD candidate at Universiti Putra Malaysia. Email: [email protected] 168
PLANNING MALAYSIA:
Journal of the Malaysian Institute of Planners
VOLUME 17 ISSUE 2 (2019), Page 168 – 178
SOURCE WATER PROTECTION FROM PHARMACEUTICAL
CONTAMINANTS: ASSESSMENT OF ENVIRONMENTAL
QUALITY ACT 1974 AND ITS REGULATIONS
Adillah Othman1 & Mariani Ariffin2
1,2Faculty of Environmental Studies
UNIVERSITI PUTRA MALAYSIA
Abstract
Pharmaceutical contaminants have become a global “emerging pollutant”. Many
countries developed various policies and technologies to deal with the problem.
In Malaysia, there is no serious attention given to this problem in the
Environmental Quality Act 1974 (EQA) and other regulations (Malaysian
legislation). Therefore, pharmaceutical contaminants still enter the environment
and affect human health through water consumption and water usage. In response
to this problem, this study aims to analyse Malaysian legislation and to identify
potential protection provided to protect source water from pharmaceutical
contaminants. This study employed a qualitative approach. A systematic search
was carried out on existing pharmaceutical-related Malaysian legislation. Later,
content analysis was conducted to discover patterns and ideas within the existing
legislation. This would determine the provisions that could assist the protection
of source water from pharmaceutical contaminants. The findings of this study
demonstrate only few provisions addressed the problem of pharmaceutical
contaminants and thus, this type of contaminant continues to harm the
environment. It is hoped that the result of this study could enhance Malaysian
legislation pertaining to the problem and minimise the risk of pharmaceutical
contaminant in drinking water.
Keywords: drug disposal; emerging contaminant; Environmental Quality Act;
Malaysia; pharmaceutical residues; source water; waste management;
water pollution
PLANNING MALAYSIA
Journal of the Malaysia Institute of Planners (2019)
169 © 2019 by MIP
INTRODUCTION
Pharmaceutical contaminants caused by the production residue, improper
disposal of expired and unused medication, accidental spills during
manufacturing and distributing, as well as from the raw and treated effluent
discharged from housing areas and hospitals, which are later brought into the
rivers (Al-Odaini, Zakaria, Yaziz, Surif, & Abdulghani, 2011; Boleda, Galceran,
& Ventura, 2011; Kookana et al., 2014). Pharmaceuticals which are neither
volatile nor biodegradable escaping sedimentation and biological treatment in
sewerage treatment plan (STP) and their metabolites enter the water bodies (Al-
Odaini et al., 2011; Boleda et al., 2011; Jelic et al., 2011). There were reports
showing pharmaceutical contaminants having toxic impact onto environment and
human especially through water consumption and water usage (Alshakka,
Ibrahim, Hassali, Palaian, & Aljadhey, 2016).
Pharmaceutical contaminants also found in Malaysian source water.
Source water refers to “any river, river basin, ground water, and water body” as
defined by Selangor Water Management Authority Enactment 1999. However,
there is no explicit regulation that governs the issue of pharmaceutical-safe source
water as pharmaceutical waste is considered as a non-priority pollutant (Al-
Odaini et al., 2011; Al-Odaini, Zakaria, Yaziz, & Surif, 2016). Malaysian
legislation only deal with the problem of pollution in general and the legislation
themselves are scattered and piecemeal. Furthermore, the extent of their
enforcement is disputable since source water management in Malaysia is also
regulated under the state legislation.
This study focuses on source water protection from pharmaceutical
contaminants in Malaysia by evaluating Malaysian legislative framework to
mitigate the risk of pharmaceutical contaminants from entering source water.
This include management, monitoring, and surveillance to ensure continuous
protection of source water as they could provide information for identifying
threats and hazards, also targeting source water protection and management
strategies towards issue concern (Canadian Council of Ministers of the
Environment, 2004; Plummer, Velaniskis, de Grosbois, Kreutzwiser, & Rob,
2010; The Council of the European Union, 1998; World Health Organization,
2004, 2011).
MATERIALS AND METHODS
This study is qualitative in nature. Secondary data were systematically selected,
consisting of legal documents in Malaysia such as EQA and its regulations related
to the problem of pharmaceutical contaminants. These sets of document have
been searched through various databases such as Google Scholar, Mendeley, and
from the official website of relevant government agencies including Department
of Environment, Ministry of Health, and Ministry of Ministry of Energy, Green
Technology, and Water. Specific keywords were used such as “pharmaceutical
Adillah Othman & Mariani Ariffin Source Water Protection from Pharmaceutical Contaminants: Assessment of Environmental Quality Act 1974 and Its Regulations
© 2019 by MIP 170
waste”, “pharmaceutical pollutant”, “clinical waste”, “medical waste”, “waste
management law in Malaysia”, “pharmaceutical law in Malaysia”,
“pharmaceutical waste policy”, and “pharmaceutical legislation”. Only relevant
legal documents related to source water protection from contaminants were
scrutinised and finalised. Selected legal documents have been sent to experts for
validation purposes to ensure their comprehensiveness and could cater the
problem of pharmaceutical contaminants in source water. Data collected were
analysed using content analysis approach. The raw data was coded and
categorised according to themes. Nvivo10 software was utilised to carry out the
content analysis and to ensure the collected data was systematically managed.
This was also vital for the development of ‘cognitive mapping’ and framework
matrices for the data.
RESULTS
Coding was done by examining selected Malaysian legislation. After indicators
were identified, categories and sub-categories were inductively generated and
given specific description to ensure the analysed legislation came within the
ambit of the definition. The indicators, categories, and sub-categories and
discussed below.
Provision Related to Source Water Management and Protection from
Hazardous Substance
Control of Effluent Discharge
Section 25 and 27 of EQA made the restriction on pollution of inland waters by
discharging any environmental hazardous substance (EHS), pollutant or waste
unless licensed by the authority. Further, in Section 34B prohibits scheduled
wastes from entering Malaysian waters. Section 2 of the same Act defines
‘scheduled wastes’ as any waste prescribed by the minister in the regulations as
scheduled wastes. The ‘regulations’ referred in Section 2 of EQA is
Environmental Quality (Scheduled Wastes) Regulations 2005 (EQSWR).
EQSWR further defines ‘scheduled wastes’ as any waste falling within the
categories of waste listed in the First Schedule. SW 4 of the First Schedule lists
wastes from discarded drugs, clinical, pharmaceutical preparation, production
products, and residues from treatment or recovery of scheduled wastes to be part
of ‘scheduled wastes’ category.
Furthermore, Regulations 4, 5, 9, and 10 of EQSWR details out that
scheduled waste should be disposed and treated as according to regulations’
requirement, such as labelling for identification and warning purposes as well as
procedure for storage of schedule waste to prevent spillage or leakage into the
environment. The activities should be conducted at ‘prescribed premises’
whereby ‘prescribed premises’ refers to premises prescribed in Order 3 of
PLANNING MALAYSIA
Journal of the Malaysia Institute of Planners (2019)
171 © 2019 by MIP
Environmental Quality (Prescribed Premises) (Scheduled Wastes Treatment and
Disposal Facilities) Order 1989 (EQPSO), which includes off-site storage
facilities, off-site treatment facilities, off-site recovery facilities, scheduled waste
incinerators, land treatment facilities, and secure landfills.
Regulations 11, 12, and 13 of Environmental Quality (Industrial Effluent)
Regulation 2009 (EQIER) specified certain parameter under Fifth Schedule for
the discharge of industrial effluent or mixed effluent. There are two standards
applicable for each parameter, namely Standard A for the discharge into
catchment listed under Sixth Schedule, and Standard B for the discharge into any
other inland water or Malaysian water or other than what has been listed under
Sixth Schedule.
Risk Mitigation from Accidental Discharge
There are regulations that deal with the risk prevention of the source water threat
and pollution including on the risk of spillage or accidental discharge of the
contaminant into soil or inland waters. For instance, Regulation 20 of EQIER and
Regulation 14 of EQSWR mentioned that the person who caused any spillage or
accidental discharge of scheduled waste (Reg. 14), industrial, and mixed effluent
(Reg. 20) which either directly or indirectly gains or may gain access into soil or
inland waters, shall immediately notify the Director-General of Environmental
Quality about the occurrence. On top of that, the person shall perform any
necessary action to cleanse the spill or discharge and must also determine the
impact of such spillage or accidental discharge towards the environment.
Administrative Platform
Administrative platform is classified into two, which are general administration
practices and monetary administration that is strictly covers the environmental
fund.
General administration practice includes ‘environmental audit’ as in
Section 33A of EQA, which plays an important role as it could be considered as
the main Section to ensure the requirements set out under legislation were
complied. Several Environmental Quality Regulations such as EQIER, EQSWR,
and Environmental Quality (Sewage) Regulations 2009 (‘EQSR’) have laid down
the acceptable condition of the contaminant to be discharged into source water
and the ‘receiving place’ which the contaminant or waste should go. Without an
environmental audit, the authority will bear more burdens in ensuring compliance
of the regulations.
In term of monetary administration, Section 36B, 36D, and 36E of EQA
have specified on the establishment of ‘environmental fund’ for the purpose of
preserving the environment and mitigating the pollution including preventing the
occurrence of discharge and dumping of EHS and waste and encouraging
Adillah Othman & Mariani Ariffin Source Water Protection from Pharmaceutical Contaminants: Assessment of Environmental Quality Act 1974 and Its Regulations
© 2019 by MIP 172
conservation measures against damage that may cause by the discharge and
dumping of EHS and waste.
Responsibilities of Stakeholders
First responsibility of stakeholder is to identify the existing and emerging threat
to source water. Section 37 of EQA, Regulations 4 of EQSR, Regulation 3, 11
and 12 of EQSWR require the information and notification to be provided to the
authority in regard to any effluent discharged including up-to-date inventory of
scheduled waste.
Further, Regulations 5, 6, 8, 9, 10, and 13 of EQSWR spell out the
responsibility of waste generator to provide detail procedures of treatment,
recovery of products and the residuals from the recovery, storage, labelling, and
transported outside waste generator of scheduled waste.
Next responsibility is to develop and implement methods for source
water protection and preservation. The methods to be developed might include
policies, guidelines, practices, processes, programmes, standards, and measures
for protection and preservation of source water from EHS and any pollutant that
might be detrimental to public health. For instance, Regulation 15 of the EQSWR
states that every waste generator shall conduct training for his employees in terms
of management of scheduled waste including identification, handling, labelling,
storage, transportation, spillage, and discharge of scheduled waste.
Best Management Practice
Best Management Practice (BMP) addressed under Malaysian legislation is
relating to the issue of hazardous substances wastes. BMP is defined under
Regulation 1 of EQIER as “practical, structural or non-structural methods for
the purpose of preventing or reducing the discharge of industrial effluent or
mixed effluent containing contaminants”. However, the definition was left for
various interpretations since there is no specific practice could be considered as
BMP. In Malaysia, the provision only applies to the discharge of industrial and
mixed effluent, and excluded all other effluent such as domestic and household
effluent.
For example, Regulation 14 of EQIER mentioned that BMP should be
adopted for industrial effluent or mixed effluent if discharging certain types of
contaminant is listed under Ninth Schedule of the regulations. The parameter list
in the Ninth Schedule mentions the BMP for discharging endocrine disruptors
(EDCs), which could include the synthetic EDCs comprising pharmaceuticals
and personal care products (Aris, Shamsuddin, & Praveena, 2014; Wee & Aris,
2017).
Basically, BMP is considered as ‘something extra’ from the regulatory
requirement. For example, the protection of water environment from hazardous
substances could be the vital part of BMP. This is based on its role in preventing
PLANNING MALAYSIA
Journal of the Malaysia Institute of Planners (2019)
173 © 2019 by MIP
and protecting hazardous contaminants from entering water environment, and not
solely focusing on specific contaminant as discussed in the first part sub-category
of BMP.
As one practice of BMP, Malaysian Department of Environment (DOE)
has introduced a scheme on Environmentally Hazardous Substances Notification
and Registration (EHSNR) whereby manufacturers and importers of EHS are
required to submit EHS notification to DOE when the substances are
manufactured or imported above certain amount. With this scheme, DOE will
have the necessary information on EHS, which enable them to work with other
agencies to identify the EHS and prevent this EHS from polluting the
environment.
DOE, in 1999, has also published the Guidelines on Handling of Clinical
Waste in Malaysia by DOE in 2009. Under the guidelines, consideration is given
to generation and minimisation, source separation and segregation, identification
and labelling, handling and storage, safe transportation, treatment, and disposal
of residues. Since the definition of clinical waste has included pharmaceutical
products, therefore, this guideline could be complementary to EQSWR since it
detailed out the procedure and the steps to be taken for managing the clinical
waste in order to avoid risk to human health and the environment.
Provision Related to Monitoring of Source Water
Notification and Information from Stakeholder
Section 37 of EQA makes it necessary for the stakeholder to furnish information
with regard to the EHS and the use of EHS and any environmental risk that may
result from the use of those materials.
Regulation 4 of EQSR, and Regulations 12 and 13 of EQSWR require
the notification and information to be given to the authority regarding the
discharge or release of effluent into any inland waters or Malaysia waters. The
notification shall be in accordance with First Schedule of EQSR and Sixth
Schedule of EQSWR, whereby it shall contain, among others, premises’
information, information on sewage treatment, type of waste, waste packaging,
quantity, and type of operation. Furthermore, EQSR also touches on the type of
contaminants and acceptable parameter of discharge of such contaminants in its
Second Schedule.
Environmental Audit
Environmental audit is a post evaluation approach undertaken after the
development of a project to ensure regulations compliance (Yusoff, 2013). Unlike
surveillance, specific requirements need to be fulfilled under environmental
audit. Section 33A of EQA requires owner or occupier of vehicle, ship, and
Adillah Othman & Mariani Ariffin Source Water Protection from Pharmaceutical Contaminants: Assessment of Environmental Quality Act 1974 and Its Regulations
© 2019 by MIP 174
premise to carry out environmental audit in the manner prescribed by regulations
made under the EQA and to submit the report to the authority.
Several environmental quality regulations, such as EQIER, EQSR and
EQSWR, have also laid down the acceptable condition of the contaminant to be
discharged into source water. Without an environmental audit, the authority could
not monitor the compliance to the regulations.
Provision Related to Surveillance of Source Water
Surveillance Agencies
Surveillance agencies refer to independent agencies that will conduct surveillance
on source water quality. The agencies shall include government ministries and
state authorities.
Section 33A (1) of EQA requires the owner or occupier of vehicle, ship,
or premises to submit environmental audit report to the authority. Section 33A
(2) and (3) further state that the owner or occupier shall appoint qualified
personnel who are registered with the authority to carry out the environmental
audit.
DISCUSSION
Based on the analysis, this study found that there are protections in the existing
Malaysian legislation for pharmaceutical contaminant in source water. However,
there are still gaps especially with regard to pharmaceutical contaminations.
Pharmaceutical contaminants have been regulated under various categories such
as scheduled waste, EHS, and industrial effluent. From all EQA and its
regulations, only four (4) addressed the issue of pharmaceutical residue in their
provisions, namely EQA, EQSWR, EQSR, and EQIER.
Only a few has specifically mentioned the types of contaminant that enter
the water environment such as EQIER and EQSWR. Other legislation adopted a
more general term such as EHS, ‘poisonous’, and ‘noxious’ contaminant, which
the study has to interpret whether the pharmaceutical contaminants come within
the ambit of what the legislation intended to protect. As mentioned in the finding
that EHS is among the substance which Malaysian legislation looked into, this
could be a good protection to source water since previous literature has
recognised pharmaceutical contaminant as one type of EHS component
(Milutinoviv & Trumbulovic, 2014; Motiekaityte & Venckus, 2016).
While many literatures have reported various pathway of pharmaceutical
residue (Al-Odaini et al., 2011; Al-Odaini et al., 2016; Boleda et al., 2011;
Kookana et al., 2014) and its released into the environment without any treatment
(Lundborg & Tamhankar, 2017), Malaysian legislation still do not classify
pharmaceutical residue as one of the parameters that should be treated in
wastewater treatment plant. The worst scenario is, there are currently more than
PLANNING MALAYSIA
Journal of the Malaysia Institute of Planners (2019)
175 © 2019 by MIP
200 industries involving pharmaceutical products such as manufacturing,
distributing, and consuming (Drug Control Authority, 2016). Lundborg and
Tamhankar (2017) further suggested that wastewater treatment plant should be
upgraded in order to treat pharmaceutical residue before the residual water being
discharged into river or source water.
Effluent discharge is considered as the major source of emission which
might contain pharmaceutical contaminants either in its natural form or its
metabolites (Rajbongshi, Shah, & Sajib, 2016). Although the EQIER have
specified a certain parameter for the discharge of industrial effluent or mixed
effluent, nothing in this legislation refers to pharmaceutical contaminant or as one
of the parameters to be considered before discharge. But EQIER lists the
catchment areas of water supply intake for the purpose of human consumption
(including drinking water) under its Sixth Schedule where the effluent parameter
discharge are specified. Thus, EQIER could help in preventing pharmaceutical
contaminants in drinking water if pharmaceutical residue is included under the
list of the parameter. Further, the category of ‘other industries’ in Schedule
Seventh of Regulation 12 of EQIER is vague since the definition of the ‘other
industries’ is unclear whether it includes pharmaceutical industries.
Apart from the categorisation of pharmaceutical waste as scheduled
waste under EQSWR, none of the legislation mentioned the approach to handle
pharmaceutical waste from other sources such as household waste and non-point
source (Alshakka et al., 2016; Gaw, Thomas, & Hutchinson, 2014; Gorman,
2010; Lundborg & Tamhankar, 2017; Rajbongshi et al., 2016). This could lead
to the unlawful disposal of such contaminants into the environment such as via
trash and flushing down the toilet (Vatovec, Van Wagoner, & Evans, 2017). The
scope of scheduled waste under existing legislation should be expanded in order
to cover various types of pharmaceutical contaminants and its sources.
The result showed that the legislation listed has fulfilled both legal
capacity and monetary capability. It gives full power to the authority to protect
the environment from pollution. Addiionally, previous literature also mentioned
that among the key components to protect source water is the capability to make
and access of funding, and when the fund is able to meet the expenses of water
management (Al Ibrahim & Patrick, 2017).
In Malaysian legislation, there are several provisions referring to
monitoring such as information sharing, notification of discharge of contaminant,
and environmental audit. Except Regulation 12 of EQSWR, which states that
scheduled waste should include pharmaceutical, other legislation do not mention
specifically about pharmaceutical contaminant.
It has been reported that a lot of pharmaceutical contaminants are
polluting the environment, yet there is lack of documentation, making this type
of pollution difficult to manage (Lundborg & Tamhankar, 2017; Milutinoviv &
Trumbulovic, 2014). Monitoring could be considered as one of the important
Adillah Othman & Mariani Ariffin Source Water Protection from Pharmaceutical Contaminants: Assessment of Environmental Quality Act 1974 and Its Regulations
© 2019 by MIP 176
methods since the information acquired could be used to administer the type of
waste from risking the environment and new innovation of technologies could be
proposed in order to protect source water from pharmaceutical contaminant
(Lundborg & Tamhankar, 2017). It would alert the authority to develop inventory
management, later allow the control to the amount of hazardous pharmaceutical
waste generated (Priya, 2017).
In addition, routine surveillance can guide the development and
implementation of appropriate contextual interventions (Lundborg & Tamhankar,
2017). EQA does mention the independent bodies to carry out the surveillance
and audit, yet their responsibilities are not detailed out.
CONCLUSION
The loopholes in Malaysian legislation basically relating to source water
management, including the inclusion of pharmaceutical contaminant as the part
of “waste” and “parameter” that legislation should be looked into. WHO (2011)
has urged for the existing policies to be improved on the management of
pharmaceutical waste.
The finding of this study could give better information on the relevant
methods, in which Malaysian legislation should improve in order to protect
source water from pharmaceutical contaminants since public health is likely to be
negatively affected if this problem remained unattended. Advancement of
technical innovations is very crucial. Nevertheless, the improvement of
technology is useless if pharmaceutical contaminants were not included in the
legislation parameter. Apart from that, many countries such as US, Europe, and
Canada have proven that among the best and economical way to cope with this
issue of pharmaceutical waste is via ‘take-back” programme.
In conclusion, source water protection from pharmaceutical
contaminants could not be done by single action. The protection involves multiple
and various actions to realise the aim of having pharmaceutical-safe water
supplies.
ACKNOWLEDGEMENT
This work was supported by the Ministry of Higher Education, Malaysia (KPT)
under Trans-Disciplinary Research Grant Scheme (TRGS)
[TRGS/2016/5535712]. We wish to thank all our colleagues who have provided
professional support and constructive criticism in order to complete this paper.
PLANNING MALAYSIA
Journal of the Malaysia Institute of Planners (2019)
177 © 2019 by MIP
REFERENCES Al-Odaini, N. A., Zakaria, M. P., Yaziz, M. I., Surif, S., & Abdulghani, M. (2011). The
occurrence of human pharmaceuticals in wastewater effluents and surface water
of Langat River and its tributaries, Malaysia. International Journal of
Environmental Analytical Chemistry, 7319(February 2015), 1-20.
Al-Odaini, N., Zakaria, M. P., Yaziz, M. I., & Surif, S. (2016). Detecting human
pharmaceutical pollutants in Malaysian aquatic environment: A new challenge
for water quality management. In M. P. Zakaria, M. I. Mohamed, & S. Kasmin
(Eds.), Contemporary environmental quality management in Malaysia and
selected countries. Serdang: Universiti Putra Malaysia Press.
Al Ibrahim, A., & Patrick, R. J. (2017). Source water protection planning and
management in metropolitan Canada: A preliminary assessment. Water, 9(7),
497.
Alshakka, M., Ibrahim, M. I. M., Hassali, M. A., Palaian, S., & Aljadhey, H. (2016).
Hazards of pharmaceuticals in water as new area in Eco-Pharmacovigilance
Research. Journal of Pharmacy Practice and Community Medicine, 2(1), 3-8.
Aris, A. Z., Shamsuddin, A. S., & Praveena, S. M. (2014). Occurrence of 17α-
ethynylestradiol (EE2) in the environment and effect on exposed biota: A
review. Environment International, 69, 104-119.
Boleda, M. R., Galceran, M. T., & Ventura, F. (2011). Behavior of pharmaceuticals and
drugs of abuse in a drinking water treatment plant (DWTP) using combined
conventional and ultrafiltration and reverse osmosis (UF/RO) treatments.
Environmental Pollution, 159(6), 1584-1591.
Canadian Council of Ministers of the Environment. (2004). From source to tap: Guidance
on the multi-barrier approach to safe drinking water. Winnipeg: Author.
Drug Control Authority. (2016). Pharmaceutical industry.
Gaw, S., Thomas, K. V., & Hutchinson, T. H. (2014). Sources, impacts and trends of
pharmaceuticals in the marine and coastal environment. Philosophical
Transactions of the Royal Society B, 369, 20130572.
Gorman, J. A. (2010). Drugs in our water: A legal proposal for responsible nationwide
pharmaceutical consumption. Florida State University of Land Use &
Environmental Law, 26(1), 147-178.
Jelic, A., Gros, M., Ginebreda, A., Cespedes-Sanchez, R., Ventura, F., Petrovic, M., &
Barcelo, D. (2011). Occurrence, partition and removal of pharmaceuticals in
sewage water and sludge during wastewater treatment. Water Research, 45,
1165-1176.
Kookana, R. S., Williams, M., Boxall, A. B. A., Larsson, D. G. J., Gaw, S., Choi, K., …&
Carriquiriborde, P. (2014). Potential ecological footprints of active
pharmaceutical ingredients: An examination of risk factors in low-, middle- and
high-income countries. Philosophical Transactions of the Royal Society B:
Biological Sciences, 369(1656), 20130586.
Lundborg, C. S., & Tamhankar, A. (2017). Antibiotic residues in the environment of
South East Asia. The BMJ, 358(Suppl. 1), 42-45.
Milutinoviv, V., & Trumbulovic, L. (2014). Higher education in function of sustainable
development of tourism in Serbia and Western Balkans: Students’ papers
proceeding. (L. Trumbulovic; & N. Milutivonic, Eds.). Business and Technical
Adillah Othman & Mariani Ariffin Source Water Protection from Pharmaceutical Contaminants: Assessment of Environmental Quality Act 1974 and Its Regulations
© 2019 by MIP 178
College of Vocational Studies.
Motiekaityte, V., & Venckus, Z. (2016). Legal regulation of pharmaceutical waste
management in Lithuania. Professional Studies: Theory and Practice, 2(17), 26-
33.
Plummer, R., Velaniskis, J., de Grosbois, D., Kreutzwiser, R., & Rob, de L. (2010). The
development of new environmental policies and processes in response to a crisis:
The case of the multiple barrier approach for safe drinking water. Environmental
Science and Policy, 13(6), 535-548.
Priya, P. (2017). Management of pharmaceutical waste. Journal of Drug Discovery and
Therapeutics, 5(2), 1-8.
Rajbongshi, S., Shah, Y. D., & Sajib, A. U. (2016). Pharmaceutical waste management:
A review. European Journal of Biomedical and Pharmaceutical Sciences, 3(12),
192-206.
The Council of the European Union. (1998). Council Directive 98/83/EC of 3 November
1998 on the quality of water intended for human consumption. Official Journal
of the European Communities, L330, 32-54.
Vatovec, C., Van Wagoner, E., & Evans, C. (2017). Investigating sources of
pharmaceutical pollution: Survey of over-the-counter and prescription
medication purchasing, use, and disposal practices among university students.
Journal of Environmental Management, 198(Part 1), 348-352.
Wee, S. Y., & Aris, A. Z. (2017). Endocrine disrupting compounds in drinking water
supply system and human health risk implication. Environment International,
106(April), 207-233.
World Health Organization. (2004). Water Safety Plans: Managing drinking-water
quality from catchment to consumer. https://doi.org/10.4324/9781315693606
World Health Organization. (2001). Guidelines for drinking-water quality. Geneva:
Author.
Yusoff, H. N. (2013). Understanding environmental audit in the public sector: Malaysian
perspective. Jurnal Teknologi, 62(1), 25-30
Received: 12th January 2019. Accepted: 2nd August 2019
1PhD Student at Universiti Putra Malaysia. Email: [email protected] 179
PLANNING MALAYSIA:
Journal of the Malaysian Institute of Planners
VOLUME 17 ISSUE 2 (2019), Page 179 – 190
QUANTIFYING THE ABOVEGROUND BIOMASS AND CARBON
STORAGE OF URBAN TREE SPECIES IN SOKOTO METROPOLIS,
NORTH-WESTERN NIGERIA
Dangulla Murtala1, Latifah Abd Manaf2, Mohammed Firuz Ramli3,
Mohd Rusli Yacob4, & Ahmad A. Makmom5
1Department of Geography
USMANU DANFODIYO UNIVERSITY, SOKOTO, NIGERIA 2,3,4Department of Environmental Science
UNIVERSITI PUTRA MALAYSIA 5Department of Environmental Management
UNIVERSITI PUTRA MALAYSIA
Abstract
Increases in human activities, land use/cover changes and urbanisation have led
to continuous accumulation of carbon dioxide and other greenhouse gases in the
atmosphere, thus threatening the efficiency of natural carbon sinks such as urban
trees. This paper assessed the aboveground biomass and carbon stock of trees in
Sokoto metropolis, North-Western Nigeria, using an allometric equation. The
metropolis was stratified into five broad land use/cover types from which 200
sample plots of 30m × 30m were generated. Data on tree species and diameter at
breast height were collected from all trees ≥ 5cm in diameter within the plots. A
total of 722 trees belonging to 30 species in 17 genera and 14 families were
identified. The trees stored 854.73 tonnes of biomass equivalent to 427.37 tonnes
of carbon with the highest proportion being stored by Azadirachta indica,
Mangifera indica, Adansonia digitata, and Ficus polita. There was a significant
difference in tree biomass and carbon stock across the land use/cover types (F =
4.730, p < 0.001). The Green Area recorded the highest carbon density of 96.5t
ha-1 while Farmland recorded the least carbon density (7.4t ha-1). Urban areas
have diverse tree species that could contribute significantly to reducing global
atmospheric carbon. This potential, which varies with the species, number, and
size of trees, as well as land cover, can be successfully estimated using allometric
equations.
Keywords: aboveground biomass; carbon stock; diversity; native species; exotic
species
Dangulla Murtala, Latifah Abd Manaf, Mohammed Firuz Ramli, Mohd Rusli Yacob and Ahmad A. Makmom Quantifying the Aboveground Biomass and Carbon Storage of Urban Tree Species in Sokoto Metropolis, North-Western Nigeria
© 2019 by MIP 180
INTRODUCTION
Carbon dioxide (CO2) contributes approximately 84% of global radiative forcing
(World Meteorological Organization, 2014) and 60% of observed global
warming (Grace, 2004) making it the most important anthropogenic greenhouse
gas in the atmosphere. The atmospheric concentration of CO2 rose from about
300 ppm in the pre-industrial 1880s to about 405.58 ppm in 2017 (World
Meteorological Organization, 2014). This threatens the efficiency of global
natural carbon sinks and accelerates the process of global warming (Canadell et
al., 2010). Most of these increases are attributable to human activities such as
burning fossil fuels, land use/cover changes (Wang et al., 2014), and urbanisation
(Churkina, 2016).
Urban areas are centres of economic and commercial activities, as they
accommodate more than half of the global population. These areas require higher
amount of fossil fuel for transportation, cooking, heating, cooling, and electricity
generation; thus, emitting higher atmospheric carbon (Pataki et al., 2006).
According to the United Nations (2018), the rates of urbanisation are higher in
Asia and Africa where levels of carbon dioxide emissions are also higher (Clerici,
Rubiano, Abd-Elrahman, Posada, & Escobedo, 2016). It was envisaged that
Africa would contribute about 21% of the global urban population, with Nigeria
expected to contribute an estimated 186 million people by 2050 (United Nations,
2018).
Urban trees and forests are increasingly being recognised as important
components of biodiversity, hence gaining more relevance for academic,
planning, and urban sustainability purposes (Dahlhausen, Biber, Rötzer, Uhl, &
Pretzsch, 2016). Trees enhance the resilience of ecosystems in the face of changes
and losses due to pests or diseases (Conway & Vander Vecht, 2015). In urban
areas, trees provide free ecosystem services such as the provision of food, shade
and fuel, removal of air pollutants, provision of recreational activities and other
physical and mental health (Justin et al., 2016), as well as psychological and
spiritual benefits (Peter & Shackleton, 2017). Urban trees also sequester and store
large amounts of carbon as they grow over time (Liu & Li, 2012). The potential
for carbon sequestration and storage of trees depend on their density,
composition, growing condition and environmental gradients (Chave et al., 2009;
Nowak, Greenfield, Hoehn, & Lapoint, 2013). Despite its global importance
however, carbon sequestration and storage potential of urban trees in Africa and
many developing regions have not been adequately assessed and documented
(McPherson, Xiao, & Aguaron, 2013). Most urban carbon studies were conducted
in developed countries such as the United States (Liu & Li, 2012). The results
obtained from such studies might therefore not extrapolate successfully to areas
with different urbanisation patterns (Davies, Edmondson, Heinemeyer, Leake, &
Gaston, 2011). This justifies the need for region-specific estimates so that
relevant information for climate change mitigation and urban sustainability
PLANNING MALAYSIA
Journal of the Malaysia Institute of Planners (2019)
181 © 2019 by MIP
purposes could be generated. The aim of this paper is, therefore, to estimate the
biomass and carbon stock of trees in Sokoto metropolis, North-Western Nigeria
and highlight the contribution of individual tree species in the region to urban
carbon balance (Tang, Chen, & Zhao, 2016), reduction of CO2 emissions in the
global carbon cycle, and climate change mitigation.
MATERIALS AND METHOD
The Study Area
Sokoto is located on latitudes 13°3'5"N and longitudes 5°13’53"E, and covers an
area of about 94 km2 (Figure 1). The city has an estimated population of 554,775
people (National Bureau of Statistics, 2016), and lies in a semi-arid region with
typical Koppen’s tropical wet and dry (Aw) climate (Belda, Holtanová, Halenka,
& Kalvová, 2014). The mean annual temperature in this zone ranges between
21℃ and 33℃ while mean annual rainfall ranges between 508mm in the driest
part to 1,016mm in the wettest part (Sanni, Odekunle, & Adesina, 2012).
Vegetation comprises the Sudano-Sahelian type of short, feathery grasses, and
some spiny woody species (Nsangu, 2009). The soils are generally leached and
ferruginous consisting of silt and sand with hydromorphic soils found in riverine
areas (Swindell, 1986).
Sampling and Data Collection
This study adopted a stratified sampling approach (Zhang et al., 2016), which
ensures better representation by taking into account variation in the size of
clusters (Levy & Lemeshow, 2011), thereby increasing sampling precision
(Yang, McBride, Zhou, & Sun, 2005). A Landsat 8 OLI TIRS image of the
metropolis for 2015 was pre-processed and classified (see Liu & Yang, 2015)
with TerrSet geospatial monitoring and modelling system into five broad land
use/cover classes. These include the Built-up Area, Farmland, Green Area, Open
Space, and Wetland/Water. A stratified sample of 200 points was then generated
across the land cover classes using the TerrSet sampling facility (Figure 1). This
is considered reasonable (Nowak, Crane, Stevens, & Hoehn, 2003; Nowak,
Walton, Stevens, Crane, & Hoehn, 2008).
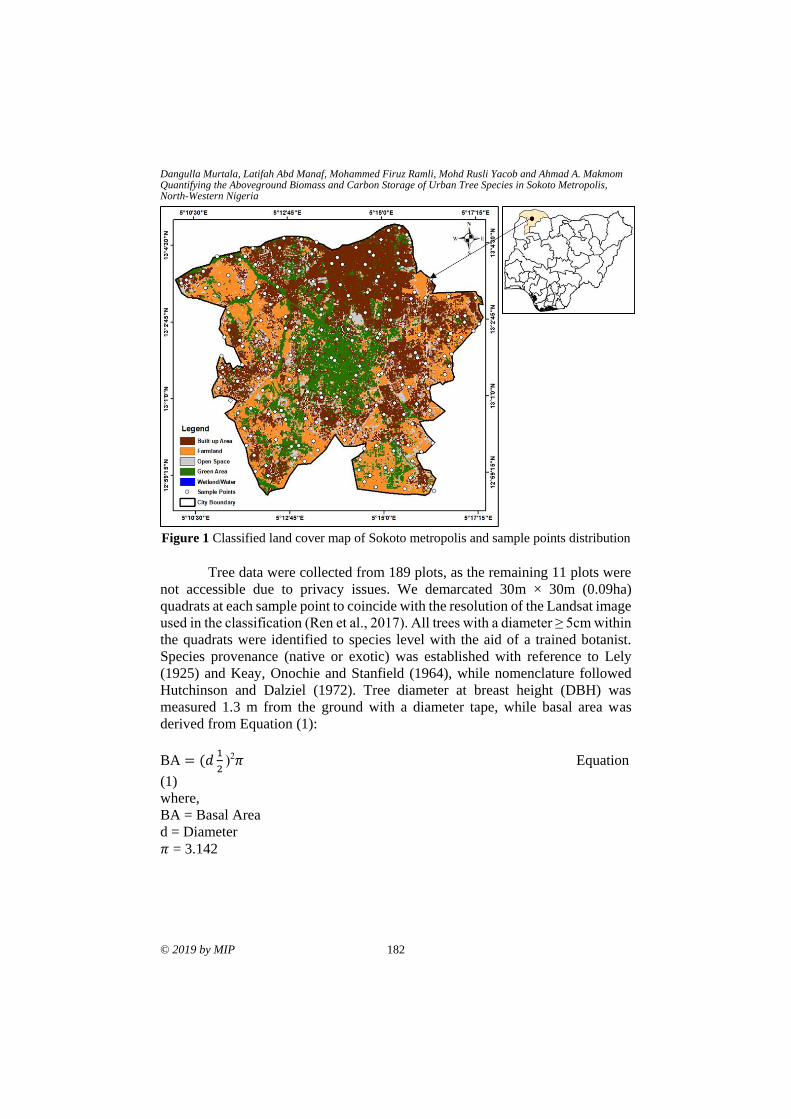
Dangulla Murtala, Latifah Abd Manaf, Mohammed Firuz Ramli, Mohd Rusli Yacob and Ahmad A. Makmom Quantifying the Aboveground Biomass and Carbon Storage of Urban Tree Species in Sokoto Metropolis, North-Western Nigeria
© 2019 by MIP 182
Figure 1 Classified land cover map of Sokoto metropolis and sample points distribution
Tree data were collected from 189 plots, as the remaining 11 plots were
not accessible due to privacy issues. We demarcated 30m × 30m (0.09ha)
quadrats at each sample point to coincide with the resolution of the Landsat image
used in the classification (Ren et al., 2017). All trees with a diameter ≥ 5cm within
the quadrats were identified to species level with the aid of a trained botanist.
Species provenance (native or exotic) was established with reference to Lely
(1925) and Keay, Onochie and Stanfield (1964), while nomenclature followed
Hutchinson and Dalziel (1972). Tree diameter at breast height (DBH) was
measured 1.3 m from the ground with a diameter tape, while basal area was
derived from Equation (1):
BA = (𝑑1
2)2𝜋 Equation
(1)
where,
BA = Basal Area
d = Diameter
𝜋 = 3.142
PLANNING MALAYSIA
Journal of the Malaysia Institute of Planners (2019)
183 © 2019 by MIP
Data Analysis
Tree species composition, structural characteristics and density were calculated,
while aboveground biomass (AGB) and carbon stock (C) were estimated using
an allometric equation. Using allometric equations to estimate AGB is a more
popular option (Vashum & Jayakumar, 2012) than the expensive and time-
consuming, destructive approach (Chave et al., 2014). Many such equations exist
in the literature (e.g. Chave et al., 2014; Feldpausch et al., 2011). However, this
study adopted the equation provided by Brown, Gillespie and Lugo (1989), which
was developed specifically to estimate AGB of trees in dry climates with less than
900mm annual rainfall and successfully used in other studies (e.g. O’Donoghue
& Shackleton, 2013; Woldegerima, Yeshitela, & Lindley, 2017). This is given in
Equation (2):
Y = exp{-1.996+2.32*ln(D)} Equation
(2)
where,
Y = biomass per tree (kg)
exp = e – (the base of natural logarithms), raised to the power of (…)
D = DBH (cm)
The equation uses tree DBH as the predictor variable as this produces the
most stable regional AGB estimates (Montagu, Düttmer, Barton, & Cowie,
2005), while also reducing uncertainties (Liu & Li, 2012). The results were
multiplied by a conversion factor of 0.8 (Nowak et al., 2013) to account for the
variability in biomass and carbon content between open-grown and high-biomass
forest trees, which were used to develop most of the AGB estimation equations.
This was then multiplied by 0.5 to obtain carbon stock (Liu & Li, 2012).
RESULTS AND DISCUSSION
Tree Species Composition, Biomass and Carbon Stock
The total number of species recorded, their status, nomenclature and
corresponding biomass and carbon stock is given in Table 1. A total of 722 stems
belonging to 30 species in 17 genera and 14 families were recorded. The native
species accounted for 26.8% of the stems while exotic species accounted for
73.2%. Species with a higher number of stems include Azadirachta indica (424),
Mangifera indica (68), Adansonia digitata (37), Ficus polita (37) and Terminalia
catappa (24).
The total tree biomass was estimated at 854.73 tonnes, which is
equivalent to 427.37 tonnes of carbon. Species with the highest biomass and
carbon stock include Azadirachta indica, Mangifera indica, Adansonia digitata
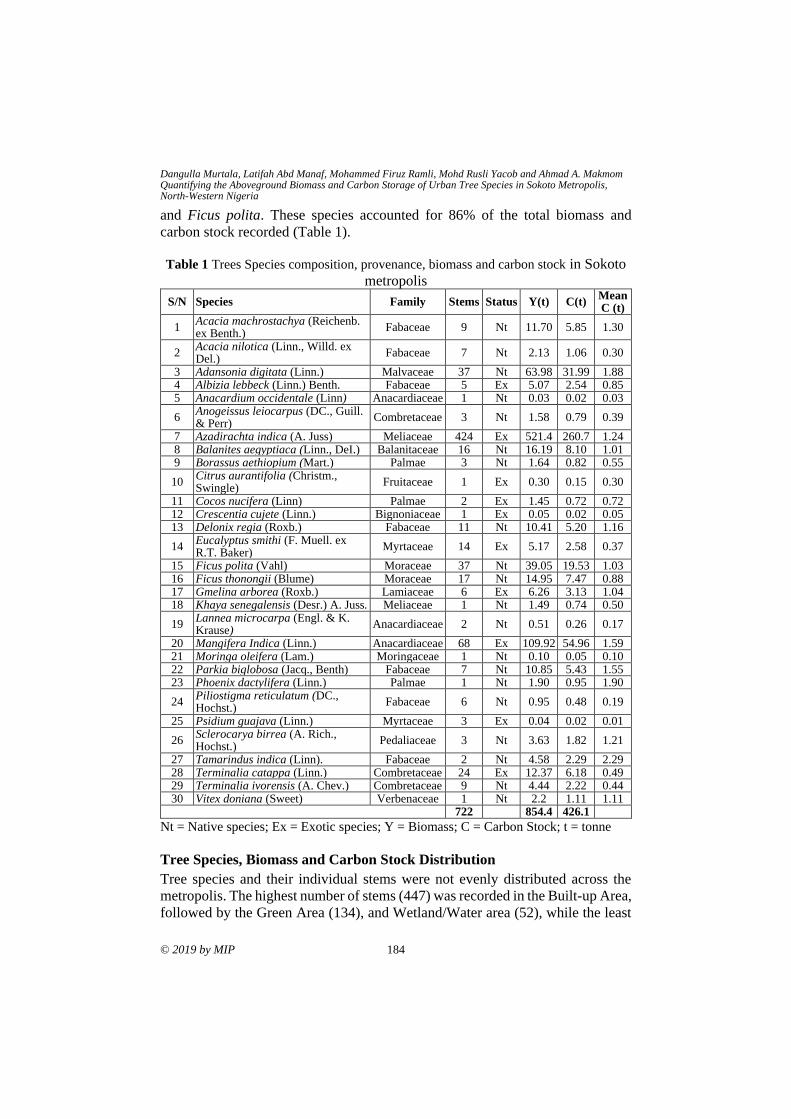
Dangulla Murtala, Latifah Abd Manaf, Mohammed Firuz Ramli, Mohd Rusli Yacob and Ahmad A. Makmom Quantifying the Aboveground Biomass and Carbon Storage of Urban Tree Species in Sokoto Metropolis, North-Western Nigeria
© 2019 by MIP 184
and Ficus polita. These species accounted for 86% of the total biomass and
carbon stock recorded (Table 1).
Table 1 Trees Species composition, provenance, biomass and carbon stock in Sokoto
metropolis
S/N Species Family Stems Status Y(t) C(t) Mean C (t)
1 Acacia machrostachya (Reichenb. ex Benth.)
Fabaceae 9 Nt 11.70 5.85 1.30
2 Acacia nilotica (Linn., Willd. ex Del.)
Fabaceae 7 Nt 2.13 1.06 0.30
3 Adansonia digitata (Linn.) Malvaceae 37 Nt 63.98 31.99 1.88 4 Albizia lebbeck (Linn.) Benth. Fabaceae 5 Ex 5.07 2.54 0.85 5 Anacardium occidentale (Linn) Anacardiaceae 1 Nt 0.03 0.02 0.03
6 Anogeissus leiocarpus (DC., Guill. & Perr)
Combretaceae 3 Nt 1.58 0.79 0.39
7 Azadirachta indica (A. Juss) Meliaceae 424 Ex 521.4 260.7 1.24 8 Balanites aegyptiaca (Linn., DeI.) Balanitaceae 16 Nt 16.19 8.10 1.01 9 Borassus aethiopium (Mart.) Palmae 3 Nt 1.64 0.82 0.55
10 Citrus aurantifolia (Christm., Swingle)
Fruitaceae 1 Ex 0.30 0.15 0.30
11 Cocos nucifera (Linn) Palmae 2 Ex 1.45 0.72 0.72 12 Crescentia cujete (Linn.) Bignoniaceae 1 Ex 0.05 0.02 0.05 13 Delonix regia (Roxb.) Fabaceae 11 Nt 10.41 5.20 1.16
14 Eucalyptus smithi (F. Muell. ex R.T. Baker)
Myrtaceae 14 Ex 5.17 2.58 0.37
15 Ficus polita (Vahl) Moraceae 37 Nt 39.05 19.53 1.03 16 Ficus thonongii (Blume) Moraceae 17 Nt 14.95 7.47 0.88 17 Gmelina arborea (Roxb.) Lamiaceae 6 Ex 6.26 3.13 1.04 18 Khaya senegalensis (Desr.) A. Juss. Meliaceae 1 Nt 1.49 0.74 0.50
19 Lannea microcarpa (Engl. & K. Krause)
Anacardiaceae 2 Nt 0.51 0.26 0.17
20 Mangifera Indica (Linn.) Anacardiaceae 68 Ex 109.92 54.96 1.59 21 Moringa oleifera (Lam.) Moringaceae 1 Nt 0.10 0.05 0.10 22 Parkia biglobosa (Jacq., Benth) Fabaceae 7 Nt 10.85 5.43 1.55 23 Phoenix dactylifera (Linn.) Palmae 1 Nt 1.90 0.95 1.90
24 Piliostigma reticulatum (DC., Hochst.)
Fabaceae 6 Nt 0.95 0.48 0.19
25 Psidium guajava (Linn.) Myrtaceae 3 Ex 0.04 0.02 0.01
26 Sclerocarya birrea (A. Rich., Hochst.)
Pedaliaceae 3 Nt 3.63 1.82 1.21
27 Tamarindus indica (Linn). Fabaceae 2 Nt 4.58 2.29 2.29 28 Terminalia catappa (Linn.) Combretaceae 24 Ex 12.37 6.18 0.49 29 Terminalia ivorensis (A. Chev.) Combretaceae 9 Nt 4.44 2.22 0.44 30 Vitex doniana (Sweet) Verbenaceae 1 Nt 2.2 1.11 1.11
722 854.4 426.1
Nt = Native species; Ex = Exotic species; Y = Biomass; C = Carbon Stock; t = tonne
Tree Species, Biomass and Carbon Stock Distribution
Tree species and their individual stems were not evenly distributed across the
metropolis. The highest number of stems (447) was recorded in the Built-up Area,
followed by the Green Area (134), and Wetland/Water area (52), while the least
PLANNING MALAYSIA
Journal of the Malaysia Institute of Planners (2019)
185 © 2019 by MIP
number of stems (43) was recorded in the Open Space. Similarly, the highest stem
density was obtained in the Green Area (184ha-1) while the lowest stem density
(12.9ha-1) was recorded in the Open Space. The density and distribution of
biomass and carbon stock also vary significantly between the different land
use/cover types. The total biomass and carbon stock were higher in the Built-up
and Green areas, while the lowest values were recorded in the Farmland.
However, carbon density per hectare was higher in the Green Area (96.5 tonnes
ha-1) and Wetland/Water area (55.8 tonnes ha-1) even though the Built-up Area
had higher total biomass and carbon stock (Table 2).
Table 2 Trees species, biomass and carbon stock distribution
Total Stems S/N Land cover Native Exotic Total Y (t) C (t) C (t/ha)
1 Built-up Area 128 319 447 533.1 266.54 28.8 2 Farmland 33 13 46 42.5 21.23 7.4 3 Green Area 5 129 134 139.0 69.51 96.5 4 Open Space 16 27 43 49.8 24.92 7.5 5 Wetland/Water 11 41 52 90.3 45.16 55.8 Total 193 529 722 854.73 427.37
Y = Biomass; C = Carbon stock
DISCUSSION
The composition and distribution of trees species in this study (Table 1) shows
that Sokoto metropolis is composed of few native and exotic tree species
distributed disproportionately across the different land use/cover types. The
exotic species however, have higher stem population, thus dominating the
landscape. This has been reported in many studies (e.g. Kuruneri-Chitepo &
Shackleton, 2011; Seburanga, Kaplin, Zhang, & Gatesire, 2014), thereby raising
the fear that the exotic species may in the long run, outcompete the native species
in many cities due to biotic homogenisation (McKinney, 2006). Hence, much
need to be done to improve tree abundance and diversity in the metropolis through
afforestation programmes and tree planting campaigns. Such programmes should
take account of the many stresses urban tress are exposed to as a result of
increasing urban temperatures, restricted rooting space, water deficiencies
(Davies et al., 2011) and the ecosystem service potentials of the different tree
species.
The total biomass and carbon stock recorded in this study are
considerably high when compared to findings from other studies such as Liu and
Li (2012), where mean carbon stock of 33.22t ha-1, 30.25t ha-1 and 43.70t ha-1
were observed in Shenyang, Hangzhou, and Beijing cities, respectively.
However, this is comparatively less than the 552,415 tonnes total carbon reported
by Woldegerima et al. (2017) in Addis Ababa. The relatively high tree biomass
and carbon stock recorded in this study may be attributable to the number of trees
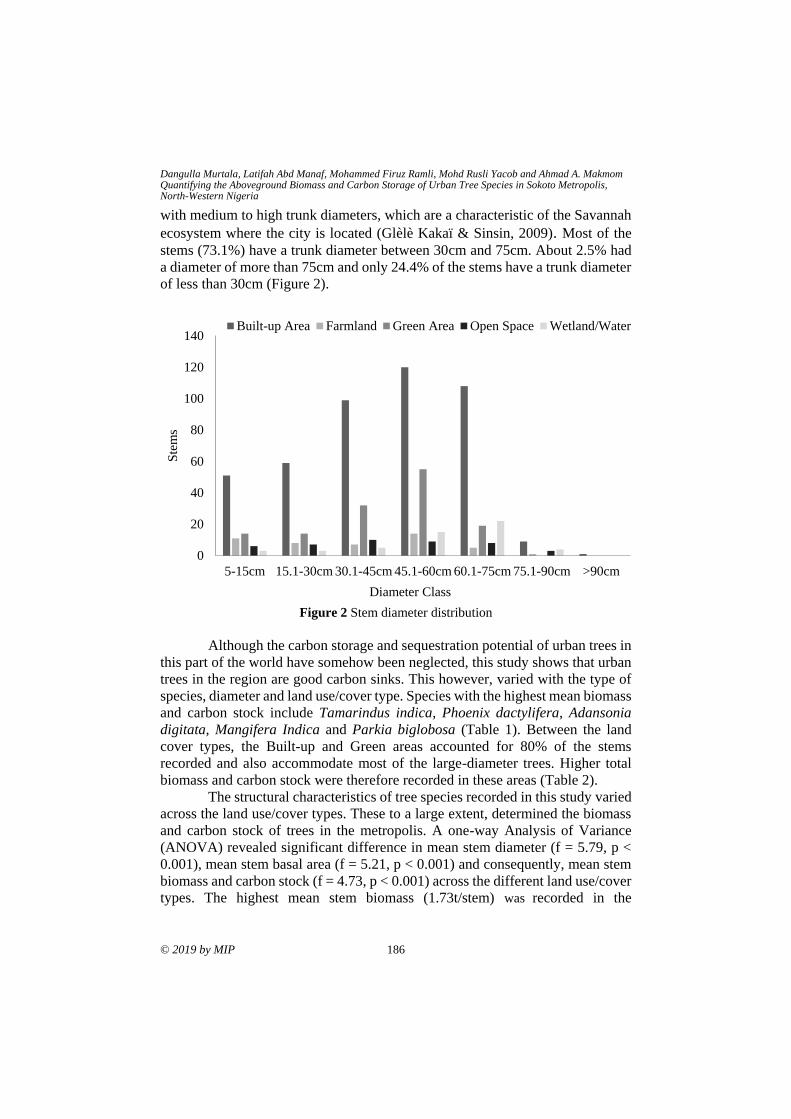
Dangulla Murtala, Latifah Abd Manaf, Mohammed Firuz Ramli, Mohd Rusli Yacob and Ahmad A. Makmom Quantifying the Aboveground Biomass and Carbon Storage of Urban Tree Species in Sokoto Metropolis, North-Western Nigeria
© 2019 by MIP 186
with medium to high trunk diameters, which are a characteristic of the Savannah
ecosystem where the city is located (Glèlè Kakaï & Sinsin, 2009). Most of the
stems (73.1%) have a trunk diameter between 30cm and 75cm. About 2.5% had
a diameter of more than 75cm and only 24.4% of the stems have a trunk diameter
of less than 30cm (Figure 2).
Figure 2 Stem diameter distribution
Although the carbon storage and sequestration potential of urban trees in
this part of the world have somehow been neglected, this study shows that urban
trees in the region are good carbon sinks. This however, varied with the type of
species, diameter and land use/cover type. Species with the highest mean biomass
and carbon stock include Tamarindus indica, Phoenix dactylifera, Adansonia
digitata, Mangifera Indica and Parkia biglobosa (Table 1). Between the land
cover types, the Built-up and Green areas accounted for 80% of the stems
recorded and also accommodate most of the large-diameter trees. Higher total
biomass and carbon stock were therefore recorded in these areas (Table 2).
The structural characteristics of tree species recorded in this study varied
across the land use/cover types. These to a large extent, determined the biomass
and carbon stock of trees in the metropolis. A one-way Analysis of Variance
(ANOVA) revealed significant difference in mean stem diameter (f = 5.79, p <
0.001), mean stem basal area (f = 5.21, p < 0.001) and consequently, mean stem
biomass and carbon stock (f = 4.73, p < 0.001) across the different land use/cover
types. The highest mean stem biomass (1.73t/stem) was recorded in the
0
20
40
60
80
100
120
140
5-15cm 15.1-30cm 30.1-45cm 45.1-60cm 60.1-75cm 75.1-90cm >90cm
Ste
ms
Diameter Class
Built-up Area Farmland Green Area Open Space Wetland/Water
PLANNING MALAYSIA
Journal of the Malaysia Institute of Planners (2019)
187 © 2019 by MIP
Wetland/Water where mean stem diameter was highest and the lowest mean stem
biomass (0.92t/stem) was recorded in the Farmland where mean stem diameter
was correspondingly lower (Table 3).
Table 3 Comparison of structural parameters and tree biomass
S/N Parameter BUA Farmland
GA OS WW f p
1 Total Stems 477 46 134 43 52
2 Stem Density (ha-1)
48.22 15.97 186.1 12.91 64.2
3 Mean DBH (cm) ±SD
44.6± 20.8
36.8± 23.4
43.4± 16.95
43.3± 22.0
55.8± 18.8
5.79 .001
4 Mean BA (cm2) ±SD
1903.7± 1645.43
1487.1± 1448.29
1701.7± 1016.16
1846.7± 1558.16
2714.4± 1395.61
5.21 .001
5 Mean Biomass (t) ±SD
1.19± 1.18
0.92± 0.96
1.03± 0.66
1.15± 1.05
1.73± 0.95
4.73 .001
BUA = Built-up Area; GA = Green Area; OS = Open Space; WW = Wetland/ Water
CONCLUSION
Sokoto metropolis is composed of a few tree species which are distributed
disproportionately across the land cover classes. Depending on the tree species,
tree density and diameter as well as land cover type, these trees store a
considerable amount of aboveground biomass and carbon stock and thus,
contribute significantly to the regional and global carbon budget. In view of
climate change mitigation, Tamarindus indica, Phoenix dactylifera, Adansonia
digitata, Mangifera Indica and Parkia biglobosa which have higher mean
biomass and carbon stock storage should be adopted as species of choice in the
metropolis and widely propagated.
ACKNOWLEDGEMENT
We acknowledge the support from Universiti Putra Malaysia under Grant
GCS15-4002.
REFERENCES
Belda, M., Holtanová, E., Halenka, T., & Kalvová, J. (2014). Climate classification
revisited: From Köppen to Trewartha. Climate Research, 59(1), 1-13.
Brown, S., Gillespie, A. J. R., & Lugo, A. E. (1989). Biomass estimation methods for
tropical forests with applications to forest inventory data. Forest Science, 35(4),
881-902.
Canadell, J. G., Ciais, P., Dhakal, S., Dolman, H., Friedlingstein, P., Gurney, K. R., …&
Raupach, M. R. (2010). Interactions of the carbon cycle, human activity, and the
climate system: A research portfolio. Current Opinion in Environmental
Sustainability, 2(4), 301-311.
Dangulla Murtala, Latifah Abd Manaf, Mohammed Firuz Ramli, Mohd Rusli Yacob and Ahmad A. Makmom Quantifying the Aboveground Biomass and Carbon Storage of Urban Tree Species in Sokoto Metropolis, North-Western Nigeria
© 2019 by MIP 188
Chave, J., Coomes, D., Jansen, S., Lewis, S. L., Swenson, N. G., & Zanne, A. E. (2009).
Towards a worldwide wood economics spectrum. Ecology Letters, 12(4), 351-
366.
Chave, J., Réjou-Méchain, M., Búrquez, A., Chidumayo, E., Colgan, M. S., Delitti, W.
B. C., …& Vieilledent, G. (2014). Improved allometric models to estimate the
aboveground biomass of tropical trees. Global Change Biology, 20(10), 3177-
3190.
Churkina, G. (2016). The role of urbanization in the global carbon cycle. Frontiers in
Ecology and Evolution, 3, 144.
Clerici, N., Rubiano, K., Abd-Elrahman, A., Posada, H. J., & Escobedo, F. (2016).
Estimating aboveground biomass and carbon stocks in periurban Andean
secondary forests using very high resolution imagery. Forests, 7(7), 138.
Conway, T. M., & Vander Vecht, J. (2015). Growing a diverse urban forest: Species
selection decisions by practitioners planting and supplying trees. Landscape and
Urban Planning, 138, 1-10.
Dahlhausen, J., Biber, P., Rötzer, T., Uhl, E., & Pretzsch, H. (2016). Tree species and
their space requirements in six urban environments worldwide. Forests, 7(6), 1-
19.
Davies, Z. G., Edmondson, J. L., Heinemeyer, A., Leake, J. R., & Gaston, K. J. (2011).
Mapping an urban ecosystem service: Quantifying above-ground carbon storage
at a city-wide scale. Journal of Applied Ecology, 48(5), 1125-1134.
Feldpausch, T. R., Banin, L., Phillips, O. L., Baker, T. R., Lewis, S. L., & Quesada, C. A.
(2011). Height-diameter allometry of tropical forest trees. Biogeosciences, 8,
1081-1106.
Glèlè Kakaï, R., & Sinsin, B. (2009). Structural description of two Isoberlinia dominated
vegetation types in the Wari-Maro Forest Reserve (Benin). South African
Journal of Botany, 75(1), 43-51.
Grace, J. (2004). Understanding and managing the global carbon cycle. Journal of
Ecology, 92(2), 189-202.
Hutchinson, J., & Dalziel, J. (1972). Flora of West Tropical Africa. (R. W. J. K. and F.
N. Hepper, Ed.) (Revised). London: Crown Agents for Overseas Governments
and Administrations.
Justin, M., Östberg, J., Konijnendijk van den Bosch, C., Nielsen, A. B., Hauer, R.,
Sjöman, H., …& Jansson, M. (2016). Urban tree diversity-Taking stock and
looking ahead. Urban Forestry and Urban Greening, 15, 1-5.
Keay, R. W. J., Onochie, C. F. A., & Stanfield, D. P. (1964). Nigerian Trees. Federal
Department of Forest Research Ibadan, Nigeria (Vol. 1). Apapa, Lagos:
Nigerian National Press Ltd.
Kuruneri-Chitepo, C., & Shackleton, C. M. (2011). The distribution, abundance and
composition of street trees in selected towns of the Eastern Cape, South Africa.
Urban Forestry & Urban Greening, 10(3), 247-254.
Lely, H. V. (1925). The useful trees of Northern Nigeria. London, S.W.1: Crown Agents
for the Colonies.
Levy, P. S., & Lemeshow, S. (2011). Sampling of pPopulations: Methods and
applications (Fourth Edition). (n.p.): Wiley.
Liu, C., & Li, X. (2012). Carbon storage and sequestration by urban forests in Shenyang,
PLANNING MALAYSIA
Journal of the Malaysia Institute of Planners (2019)
189 © 2019 by MIP
China. Urban Forestry and Urban Greening, 11(2), 121-128.
Liu, T., & Yang, X. (2015). Monitoring land changes in an urban area using satellite
imagery, GIS and landscape metrics. Applied Geography, 56, 42-54.
McKinney, M. L. (2006). Urbanisation as a major cause of biotic homogenization.
Biological Conservation, 127, 247-260.
McPherson, E. G., Xiao, Q., & Aguaron, E. (2013). A new approach to quantify and map
carbon stored, sequestered and emissions avoided by urban forests. Landscape
and Urban Planning, 120, 70-84.
Montagu, K. D., Düttmer, K., Barton, C. V. M., & Cowie, A. L. (2005). Developing
general allometric relationships for regional estimates of carbon sequestration -
An example using Eucalyptus pilularis from seven contrasting sites. Forest
Ecology and Management, 204(1), 113-127.
National Bureau of Statistics. (2016). Annual abstract of statistics (Vol. 1). Abuja,
Nigeria: Author.
Nowak, D. J., Crane, D. E., Stevens, J. C., & Hoehn, R. E. (2003). The Urban forest
Effects (UFORE) model: Field data collection manual (Vol. 13210). Syracuse,
NY: USDA Forest Service, Northeastern Research Station.
Nowak, D. J., Greenfield, E. J., Hoehn, R. E., & Lapoint, E. (2013). Carbon storage and
sequestration by trees in urban and community areas of the United States.
Environmental Pollution, 178, 229-236.
Nowak, D. J., Walton, J., Stevens, J. C., Crane, D. E., & Hoehn, R. E. (2008). Effect of
plot and sample size on timing and precision of urban forest assessments
methods. Arboriculture and Urban Forestry, 34(6), 386-390.
Nsangu, C. A. (2009). Urban agriculture and physical planning: A case study of Zaria,
Nigeria. In M. Redwood (Ed.), Agriculture in urban planning: Generating
livelihoods and food security (pp. 217–234). London: Earthscan Publications
Ltd.
O’Donoghue, A., & Shackleton, C. M. (2013). Current and potential carbon stocks of
trees in urban parking lots in towns of the Eastern Cape, South Africa. Urban
Forestry and Urban Greening, 12(4), 443-449.
Pataki, D. E., Alig, R. J., Fung, A. S., Golubiewski, N. E., Kennedy, C. A., Mcpherson,
E. G., …& Lankao, P. R. (2006). Urban ecosystems and the North American
carbon cycle. Global Change Biology, 12(11), 2092-2102.
Peter, de L., & Shackleton, C. M. (2017). Aesthetic and spiritual ecosystem services
provided by urban sacred sites. Sustainability (Switzerland), 9(9), 1628.
Ren, Z., Du, Y., He, X., Pu, R., Zheng, H., & Hu, H. (2017). Spatiotemporal pattern of
urban forest leaf area index in response to rapid urbanization and urban greening.
Journal of Forestry Research, 29(3), 785-796.
Sanni, M., Odekunle, T. O., & Adesina, F. A. (2012). Spatio-temporal variation of
drought severity in the Sudano-Sahelian Region of Nigeria: Implications for
policies on water management. In W. L. Filho (Ed.), Climate change and the
sustainable use of water resources. Berlin Heidelberg: Springer-Verlag.
Seburanga, J. L., Kaplin, B. A., Zhang, Q.-X., & Gatesire, T. (2014). Amenity trees and
green space structure in urban settlements of Kigali, Rwanda. Urban Forestry &
Urban Greening, 13(1), 84-93.
Swindell, K. (1986). Population and agriculture in the Sokoto-Rima basin of north-west
Dangulla Murtala, Latifah Abd Manaf, Mohammed Firuz Ramli, Mohd Rusli Yacob and Ahmad A. Makmom Quantifying the Aboveground Biomass and Carbon Storage of Urban Tree Species in Sokoto Metropolis, North-Western Nigeria
© 2019 by MIP 190
Nigeria. A study of political intervention, adaptation and change, 1800-1980.
Cahiers d’Etudes Africaines, 101–102, 75-111.
Tang, Y., Chen, A., & Zhao, S. (2016). Carbon storage and sequestration of urban street
trees in Beijing, China. Frontiers in Ecology and Evolution, 4(53), 1-8.
United Nations. (2018). World urbanization prospects: The 2018 revision. Department of
Economic and Social Affairs, Population Division, Methodology Working Paper
No. ESA/P/WP.252. New York.
Vashum, K. T., & Jayakumar, S. (2012). Methods to estimate above-ground biomass and
carbon stock in natural forests - A review. Journal of Ecosystem & Ecography,
2(4), 1-7.
Wang, Y., Ji, W., Yu, X., Xu, X., Jiang, D., Wang, Z., & Zhuang, D. (2014). The impact
of urbanization on the annual average temperature of the past 60 years in Beijing.
Advances in Meteorology, 014(1), 1-10.
Woldegerima, T., Yeshitela, K., & Lindley, S. (2017). Ecosystem services assessment of
the urban forests of Addis Ababa, Ethiopia. Urban Ecosystems, 20(3), 683-699.
World Meteorological Organization. (2014). The state of greenhouse gases in the
atmosphere based on global observations through 2013. Available at
https://www.wmo.int/pages/ mediacentre/press
Yang, J., McBride, J., Zhou, J., & Sun, Z. (2005). The urban forest in Beijing and its role
in air pollution reduction. Urban Forestry and Urban Greening, 3(2), 65-78.
Zhang, D., Zheng, H., He, X., Ren, Z., Zhai, C., Yu, X., … Wang, P. (2016). Effects of
forest type and urbanization on species composition and diversity of urban forest in
Changchun, Northeast China. Urban Ecosystems, 19(1), 455-473
Received: 12th January 2019. Accepted: 2nd August 2019
1Lecturer at Federal University Dutse, Nigeria.Email: [email protected] 191
PLANNING MALAYSIA:
Journal of the Malaysian Institute of Planners
VOLUME 17 ISSUE 2 (2019), Page 191 – 202
INCOME PERSPECTIVE ON THE FACTORS INFLUENCING
HOUSEHOLDS’ RECYCLING INTENTION: IMPLICATIONS FROM
THE EXTENDED THEORY OF PLANNED BEHAVIOUR
Muhammad Salisu Khalil1, Ho Yuek Ming2, Latifah Abd Manaf3,
Amir Hamzah Sharaai4, & Aliyu Baba Nabegu5
1,2,3,4,5Faculty of Environmental Studies
UNIVERSITI PUTRA MALAYSIA
Abstract
Although few studies have attempted to explain residents’ waste handling
behaviour from social and psychological perspective, yet, there is little
understanding regarding the influence of households’ moral obligation,
consequences awareness, and perceived lack of facilitating conditions on forming
recycling intention. This study aims at investigating the key determinants of
household recycling intention using the extended theory of planned behaviour
(TPB). Data collected from 422 households in Kano metropolis were analysed
using structural equation modelling to determine the influence of each predictor
on the recycling intention. The results indicate that attitude, subjective norms,
personal norm, consequences awareness and perceived lack of facilitating
conditions significantly predict recycling intention, with attitude being the most
significant predictor of households’ intention. Additional analysis on the effect
of households’ income level on their recycling intention shows that income level
moderates the relationships between attitude and recycling intention, personal
norms—recycling intention, and perceived lack of facilitating conditions—
recycling intention. The findings provide valuable suggestions for recycling
policies that can focus on households’ intention formation by providing recycling
facilities, encouraging participation through market-driven recycling programs,
and promoting recycling awareness and education.
Keywords: Solid waste, recycling, households, behavioural intention, Kano
metropolis
Muhammad Salisu Khalil, Ho Yuek Ming, Latifah Abd Manaf, Amir Hamzah Sharaai, & Aliyu Baba Nabegu Income Perspective on the Factors Influencing Households’ Recycling Intention: Implications from the Extended Theory of Planned Behaviour
© 2019 by MIP 192
INTRODUCTION
Household solid waste (HSW) is the main source of municipal solid waste
(MSW) in many countries to which most cost of the waste management is
allocated (Parkpour, Zeidi, Emamjomeh, Asefzadeh, & Pearson, 2014). In spite
of the huge allocation, improper handling and disposal of the wastes has been a
major challenge and a growing concern in many countries, particularly in
developing nations.
Landfilling has been a major way of solid waste disposal in many
countries across the world. The rate of landfilling is higher than the sustainable
waste reduction and recycling in many African and east European nations (Pérez-
López et al., 2016). However, landfilling is detrimental to the environment and
public health, and results to high rates of morbidity and mortality (Pérez-López,
Prior, Zafra-Gómez, & Plata-Díaz, 2016). Waste recycling seemed to be a
fundamental scheme that can be used to achieve a sustainable management of
municipal solid waste as it has significant environmental and economic benefits
(Khalil, Abdullah, Abd Manaf, Sharaai, & Nabegu, 2017). In spite of its
importance, low participation of residents in recycling has been reported in most
developing countries. For example, previous studies reported that more than half
of all the solid waste generated is recyclable, however, only about 2% of the
wastes produced are recycled due to lack of residents’ participation in recycling
(Khalil et al., 2017).
Past literature on household solid waste recycling has focused mainly on
four aspects of recycling, namely; determinants of waste recycling behaviour,
efficiency of waste recycling schemes, and the partnerships between formal and
informal recycling sectors (Wan, Shen, & Yu, 2014; Xu, Ling, Lu, & Shen 2017).
However, only few studies discussed about the effectiveness of waste separation
and recycling policies (Wan et al., 2014; Xu et al., 2017). This study seeks to
investigate the moderating effect of a demographic variable on factors
influencing residents’ recycling intention in Kano metropolis Nigeria by
extending the theory of planned behaviour.
THEORETICAL FRAMEWORK
Theory of Planned Behaviour (TPB)
Theory of Planned Behaviour (TPB) proposed that people’s intention to perform
a behaviour depends on their “behavioural beliefs” about the outcome of the
behaviour, “normative beliefs” about the expectations of important people around
them, as well as their “control belief” about performing the behaviour and the
likely obstacles (Ajzen, 1991). These three beliefs give rise to the formation of
attitudes, subjective norms, and perceived behavioural control respectively,
which subsequently influence people’s intention to perform an action (Ajzen,
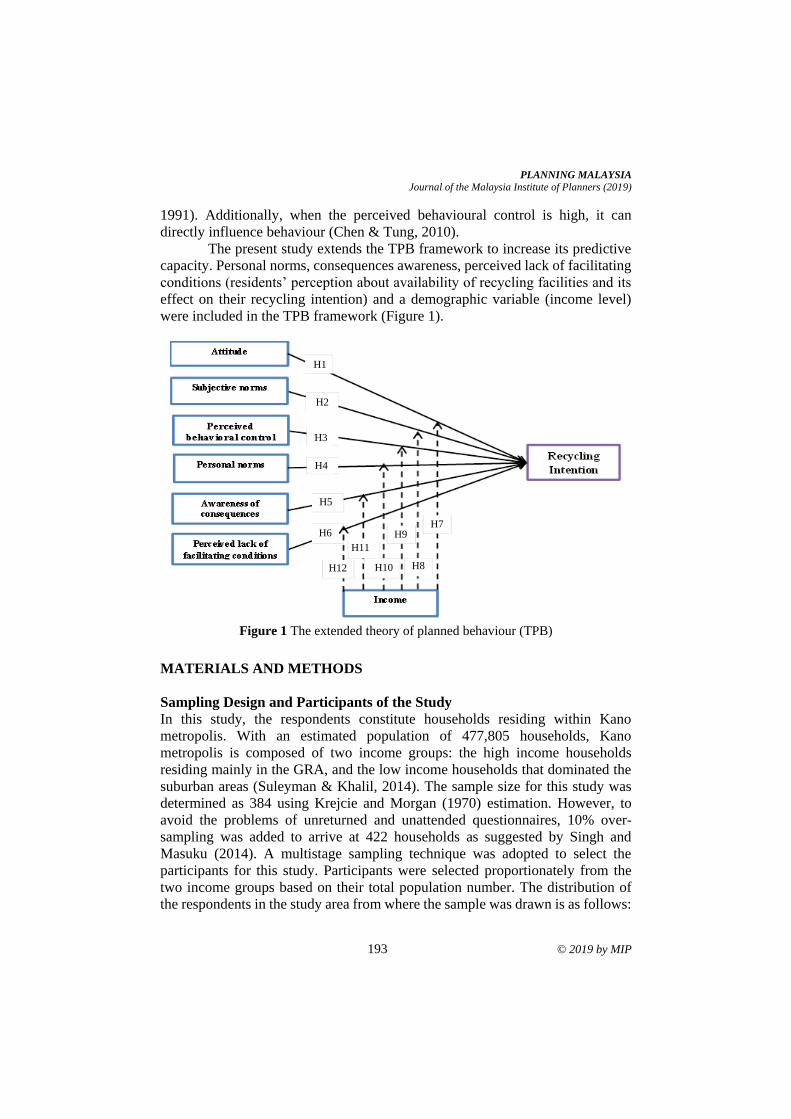
PLANNING MALAYSIA
Journal of the Malaysia Institute of Planners (2019)
193 © 2019 by MIP
1991). Additionally, when the perceived behavioural control is high, it can
directly influence behaviour (Chen & Tung, 2010).
The present study extends the TPB framework to increase its predictive
capacity. Personal norms, consequences awareness, perceived lack of facilitating
conditions (residents’ perception about availability of recycling facilities and its
effect on their recycling intention) and a demographic variable (income level)
were included in the TPB framework (Figure 1).
Figure 1 The extended theory of planned behaviour (TPB)
MATERIALS AND METHODS
Sampling Design and Participants of the Study
In this study, the respondents constitute households residing within Kano
metropolis. With an estimated population of 477,805 households, Kano
metropolis is composed of two income groups: the high income households
residing mainly in the GRA, and the low income households that dominated the
suburban areas (Suleyman & Khalil, 2014). The sample size for this study was
determined as 384 using Krejcie and Morgan (1970) estimation. However, to
avoid the problems of unreturned and unattended questionnaires, 10% over-
sampling was added to arrive at 422 households as suggested by Singh and
Masuku (2014). A multistage sampling technique was adopted to select the
participants for this study. Participants were selected proportionately from the
two income groups based on their total population number. The distribution of
the respondents in the study area from where the sample was drawn is as follows:
H1
H2
H3
H4
H5
H6 H7
H8
H9
H10
H11
H12
Muhammad Salisu Khalil, Ho Yuek Ming, Latifah Abd Manaf, Amir Hamzah Sharaai, & Aliyu Baba Nabegu Income Perspective on the Factors Influencing Households’ Recycling Intention: Implications from the Extended Theory of Planned Behaviour
© 2019 by MIP 194
low income areas have 251,660 households, and its proportionate sample was
236.94 (52.64%), Nassarawa (high income) has 226,145 households, and its
proportionate sample was 213.058 (47.33%).
Questionnaires were administered with the help of research assistants
between September and November, 2017. From the 422 returned questionnaires,
about 29 were found to have a significant missing data; hence they were removed
using a list wise deletion method. This method reduced the sample to 393, making
the response rate of the completed questionnaire to be 93.77%, which is
considered adequate enough for the analysis of this study.
Measures
This study adopted and modified the instrument from previous study by Chen and
Tung (2010), a five-point Likert scale was used to assess the respondents’ level
of agreement to each statement measuring the constructs from 1=strongly
disagree to 5=strongly agree. In the first section of the instrument, participants
were asked to respond to demographic questions and in the second section
participants were asked to respond to questions on latent constructs.
Data analysis
The analyses performed in this study include the descriptive statistics in which
the participants’ demographic characteristics were analysed. Subsequently,
confirmatory factor analysis (CFA) was conducted to test the validity and
reliability of the variables in the model. Additionally, structural equation
modelling analysis was carried out to determine the individual and collective
contribution of the predictor variables on the recycling intention. Finally, the
study utilises Multi-Group Analysis technique in order to test the moderating
effect of income on the relationships between the predictor variable and recycling
intention. All these analyses were made possible using SPSS version 20 and
AMOS version 22 statistical tools.
RESULTS AND DISCUSSION
Result of the Descriptive Analysis
Of the 393 respondents, majority of them (50.9%) were male and the rest were
female. Most of the households were within the age bracket 35-49 years old while
only few (1.3%) were above 65 years of age. Additionally, majority of the
respondents (62.8%) attained a tertiary education level, and 52.64% of them
reside in low income area. 43.3% of the households have their monthly income
between N150001-N300000 ($416-$833). The household size of majority of the
respondents (36.1%) ranges between 5-8 people.
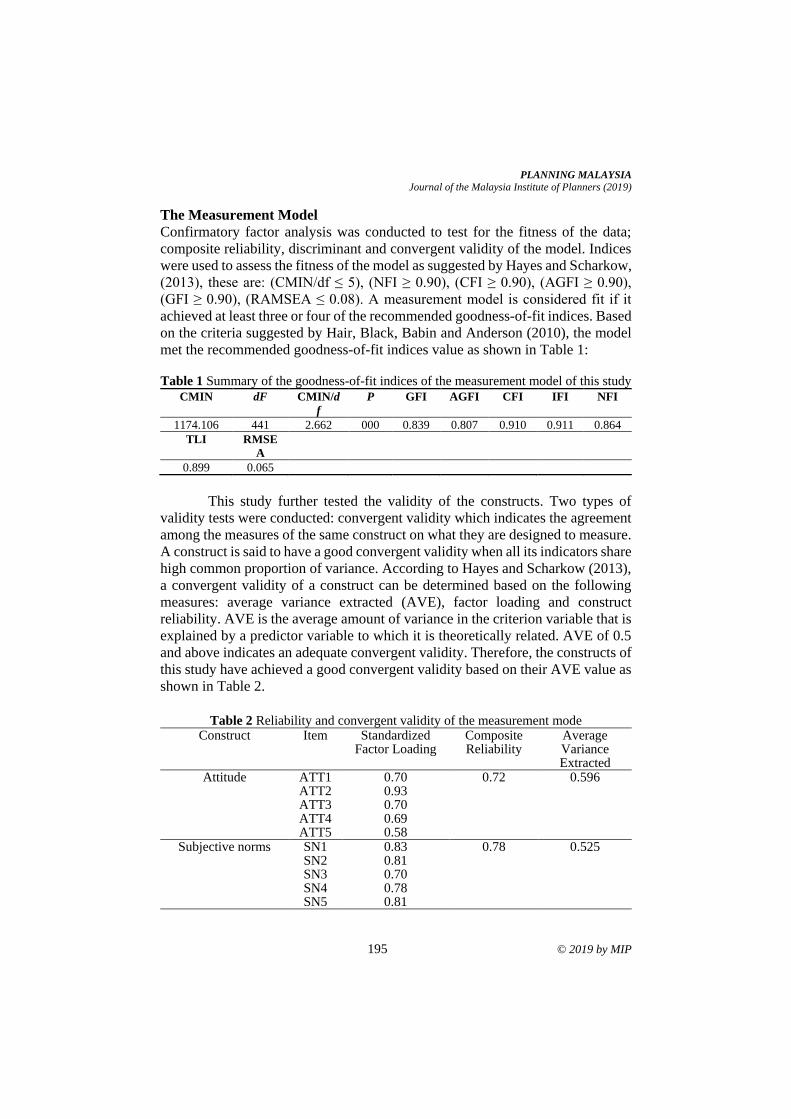
PLANNING MALAYSIA
Journal of the Malaysia Institute of Planners (2019)
195 © 2019 by MIP
The Measurement Model
Confirmatory factor analysis was conducted to test for the fitness of the data;
composite reliability, discriminant and convergent validity of the model. Indices
were used to assess the fitness of the model as suggested by Hayes and Scharkow,
(2013), these are: (CMIN/df ≤ 5), (NFI ≥ 0.90), (CFI ≥ 0.90), (AGFI ≥ 0.90),
(GFI ≥ 0.90), (RAMSEA ≤ 0.08). A measurement model is considered fit if it
achieved at least three or four of the recommended goodness-of-fit indices. Based
on the criteria suggested by Hair, Black, Babin and Anderson (2010), the model
met the recommended goodness-of-fit indices value as shown in Table 1:
Table 1 Summary of the goodness-of-fit indices of the measurement model of this study
CMIN dF CMIN/d
f
P GFI AGFI CFI IFI NFI
1174.106 441 2.662 000 0.839 0.807 0.910 0.911 0.864
TLI RMSE
A
0.899 0.065
This study further tested the validity of the constructs. Two types of
validity tests were conducted: convergent validity which indicates the agreement
among the measures of the same construct on what they are designed to measure.
A construct is said to have a good convergent validity when all its indicators share
high common proportion of variance. According to Hayes and Scharkow (2013),
a convergent validity of a construct can be determined based on the following
measures: average variance extracted (AVE), factor loading and construct
reliability. AVE is the average amount of variance in the criterion variable that is
explained by a predictor variable to which it is theoretically related. AVE of 0.5
and above indicates an adequate convergent validity. Therefore, the constructs of
this study have achieved a good convergent validity based on their AVE value as
shown in Table 2.
Table 2 Reliability and convergent validity of the measurement mode
Construct Item Standardized Factor Loading
Composite Reliability
Average Variance Extracted
Attitude ATT1 0.70 0.72 0.596 ATT2 0.93 ATT3 0.70 ATT4 0.69 ATT5 0.58
Subjective norms SN1 0.83 0.78 0.525 SN2 0.81 SN3 0.70 SN4 0.78 SN5 0.81
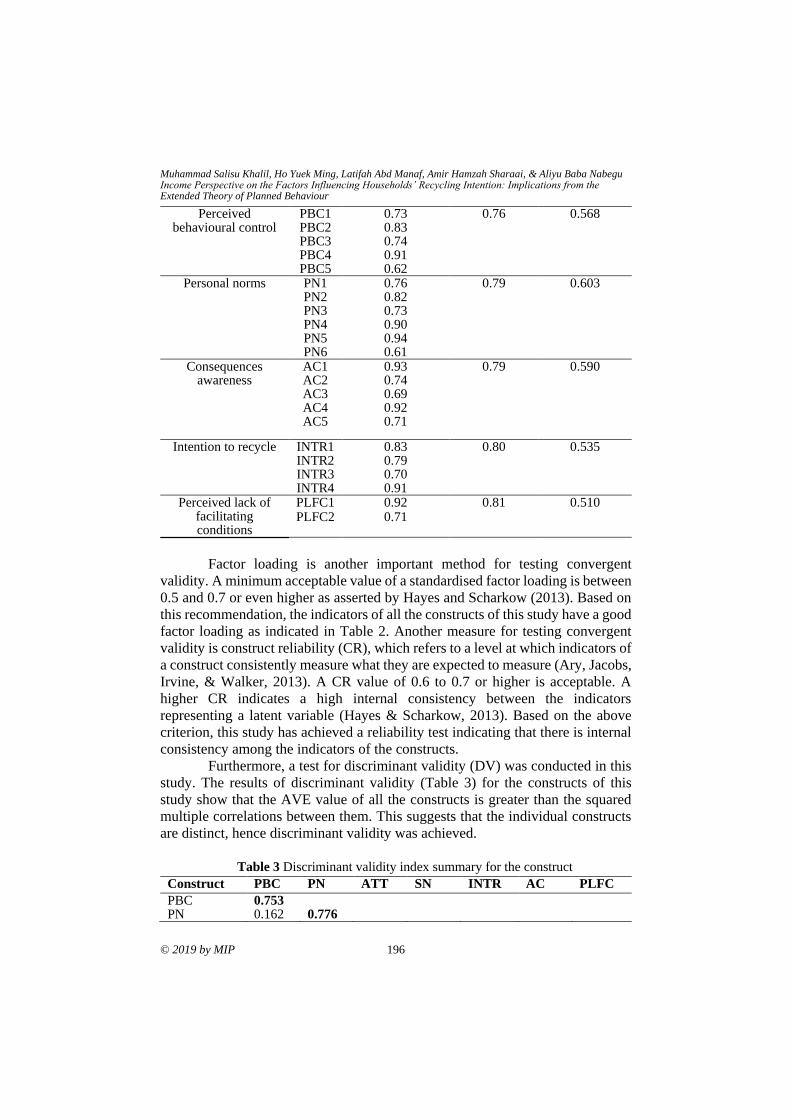
Muhammad Salisu Khalil, Ho Yuek Ming, Latifah Abd Manaf, Amir Hamzah Sharaai, & Aliyu Baba Nabegu Income Perspective on the Factors Influencing Households’ Recycling Intention: Implications from the Extended Theory of Planned Behaviour
© 2019 by MIP 196
Perceived behavioural control
PBC1 0.73 0.76 0.568 PBC2 0.83 PBC3 0.74 PBC4 0.91 PBC5 0.62
Personal norms PN1 0.76 0.79 0.603 PN2 0.82 PN3 0.73 PN4 0.90 PN5 0.94 PN6 0.61
Consequences awareness
AC1 AC2 AC3 AC4 AC5
0.93 0.74 0.69 0.92 0.71
0.79 0.590
Intention to recycle INTR1 0.83 0.80 0.535
INTR2 0.79 INTR3 0.70 INTR4 0.91
Perceived lack of facilitating conditions
PLFC1 0.92 0.81 0.510 PLFC2 0.71
Factor loading is another important method for testing convergent
validity. A minimum acceptable value of a standardised factor loading is between
0.5 and 0.7 or even higher as asserted by Hayes and Scharkow (2013). Based on
this recommendation, the indicators of all the constructs of this study have a good
factor loading as indicated in Table 2. Another measure for testing convergent
validity is construct reliability (CR), which refers to a level at which indicators of
a construct consistently measure what they are expected to measure (Ary, Jacobs,
Irvine, & Walker, 2013). A CR value of 0.6 to 0.7 or higher is acceptable. A
higher CR indicates a high internal consistency between the indicators
representing a latent variable (Hayes & Scharkow, 2013). Based on the above
criterion, this study has achieved a reliability test indicating that there is internal
consistency among the indicators of the constructs.
Furthermore, a test for discriminant validity (DV) was conducted in this
study. The results of discriminant validity (Table 3) for the constructs of this
study show that the AVE value of all the constructs is greater than the squared
multiple correlations between them. This suggests that the individual constructs
are distinct, hence discriminant validity was achieved.
Table 3 Discriminant validity index summary for the construct
Construct PBC PN ATT SN INTR AC PLFC
PBC 0.753 PN 0.162 0.776
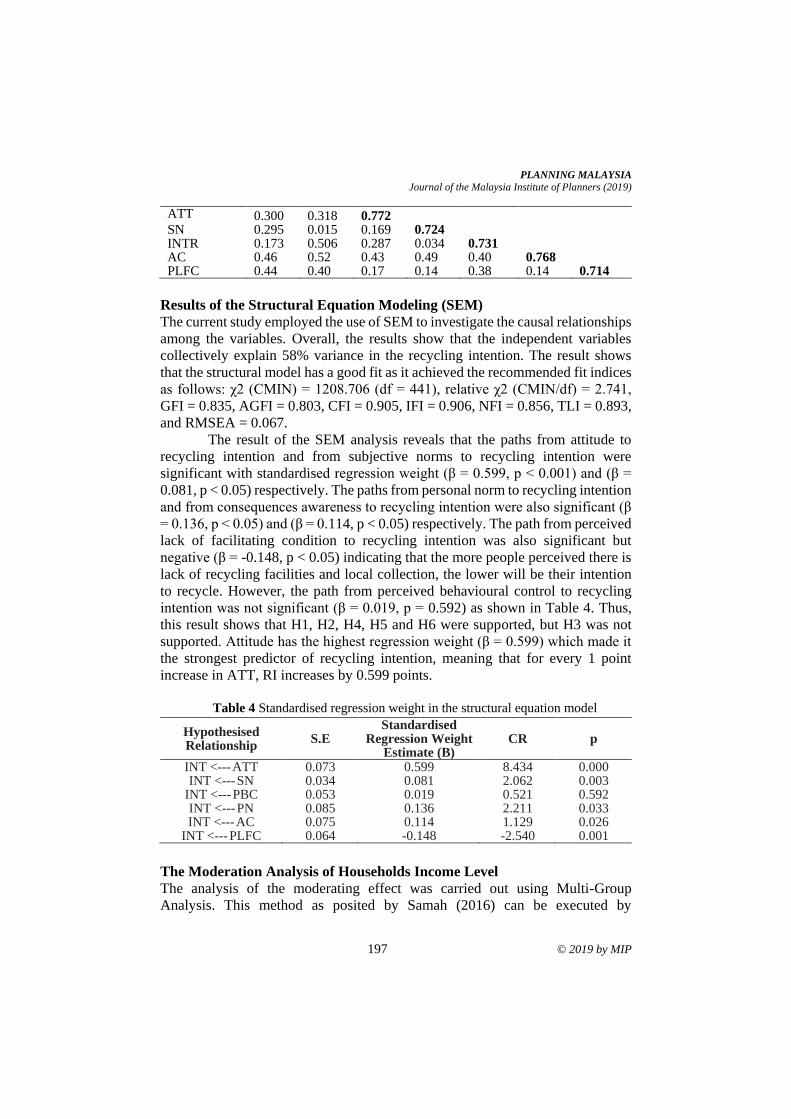
PLANNING MALAYSIA
Journal of the Malaysia Institute of Planners (2019)
197 © 2019 by MIP
ATT 0.300 0.318 0.772
SN 0.295 0.015 0.169 0.724 INTR 0.173 0.506 0.287 0.034 0.731 AC 0.46 0.52 0.43 0.49 0.40 0.768 PLFC 0.44 0.40 0.17 0.14 0.38 0.14 0.714
Results of the Structural Equation Modeling (SEM)
The current study employed the use of SEM to investigate the causal relationships
among the variables. Overall, the results show that the independent variables
collectively explain 58% variance in the recycling intention. The result shows
that the structural model has a good fit as it achieved the recommended fit indices
as follows: χ2 (CMIN) = 1208.706 (df = 441), relative χ2 (CMIN/df) = 2.741,
GFI = 0.835, AGFI = 0.803, CFI = 0.905, IFI = 0.906, NFI = 0.856, TLI = 0.893,
and RMSEA = 0.067.
The result of the SEM analysis reveals that the paths from attitude to
recycling intention and from subjective norms to recycling intention were
significant with standardised regression weight (β = 0.599, p < 0.001) and (β =
0.081, p < 0.05) respectively. The paths from personal norm to recycling intention
and from consequences awareness to recycling intention were also significant (β
= 0.136, p < 0.05) and (β = 0.114, p < 0.05) respectively. The path from perceived
lack of facilitating condition to recycling intention was also significant but
negative (β = -0.148, p < 0.05) indicating that the more people perceived there is
lack of recycling facilities and local collection, the lower will be their intention
to recycle. However, the path from perceived behavioural control to recycling
intention was not significant (β = 0.019, p = 0.592) as shown in Table 4. Thus,
this result shows that H1, H2, H4, H5 and H6 were supported, but H3 was not
supported. Attitude has the highest regression weight (β = 0.599) which made it
the strongest predictor of recycling intention, meaning that for every 1 point
increase in ATT, RI increases by 0.599 points.
Table 4 Standardised regression weight in the structural equation model
Hypothesised Relationship
S.E Standardised
Regression Weight Estimate (B)
CR p
INT <--- ATT 0.073 0.599 8.434 0.000 INT <--- SN 0.034 0.081 2.062 0.003
INT <--- PBC 0.053 0.019 0.521 0.592 INT <--- PN 0.085 0.136 2.211 0.033 INT <--- AC 0.075 0.114 1.129 0.026
INT <--- PLFC 0.064 -0.148 -2.540 0.001
The Moderation Analysis of Households Income Level
The analysis of the moderating effect was carried out using Multi-Group
Analysis. This method as posited by Samah (2016) can be executed by
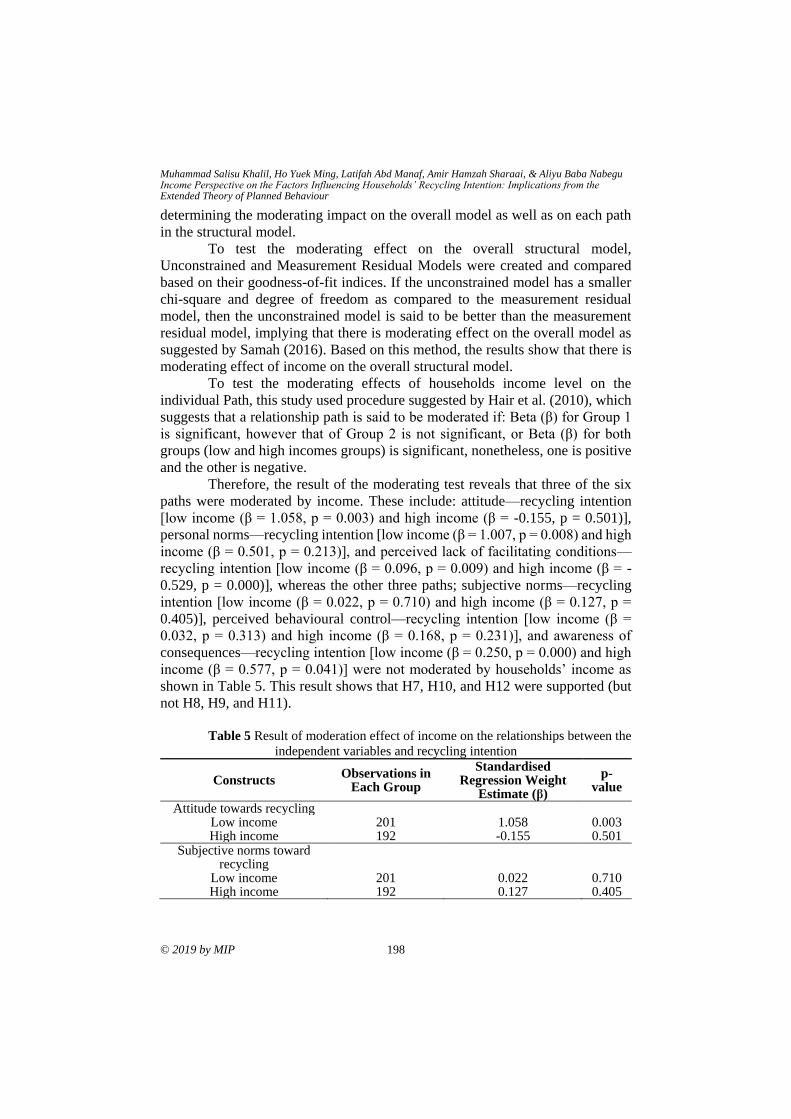
Muhammad Salisu Khalil, Ho Yuek Ming, Latifah Abd Manaf, Amir Hamzah Sharaai, & Aliyu Baba Nabegu Income Perspective on the Factors Influencing Households’ Recycling Intention: Implications from the Extended Theory of Planned Behaviour
© 2019 by MIP 198
determining the moderating impact on the overall model as well as on each path
in the structural model.
To test the moderating effect on the overall structural model,
Unconstrained and Measurement Residual Models were created and compared
based on their goodness-of-fit indices. If the unconstrained model has a smaller
chi-square and degree of freedom as compared to the measurement residual
model, then the unconstrained model is said to be better than the measurement
residual model, implying that there is moderating effect on the overall model as
suggested by Samah (2016). Based on this method, the results show that there is
moderating effect of income on the overall structural model.
To test the moderating effects of households income level on the
individual Path, this study used procedure suggested by Hair et al. (2010), which
suggests that a relationship path is said to be moderated if: Beta (β) for Group 1
is significant, however that of Group 2 is not significant, or Beta (β) for both
groups (low and high incomes groups) is significant, nonetheless, one is positive
and the other is negative.
Therefore, the result of the moderating test reveals that three of the six
paths were moderated by income. These include: attitude—recycling intention
[low income (β = 1.058, p = 0.003) and high income (β = -0.155, p = 0.501)],
personal norms—recycling intention [low income (β = 1.007, p = 0.008) and high
income (β = 0.501, p = 0.213)], and perceived lack of facilitating conditions—
recycling intention [low income (β = 0.096, p = 0.009) and high income (β = -
0.529, p = 0.000)], whereas the other three paths; subjective norms—recycling
intention [low income (β = 0.022, p = 0.710) and high income (β = 0.127, p =
0.405)], perceived behavioural control—recycling intention [low income (β =
0.032, p = 0.313) and high income (β = 0.168, p = 0.231)], and awareness of
consequences—recycling intention [low income (β = 0.250, p = 0.000) and high
income (β = 0.577, p = 0.041)] were not moderated by households’ income as
shown in Table 5. This result shows that H7, H10, and H12 were supported (but
not H8, H9, and H11).
Table 5 Result of moderation effect of income on the relationships between the
independent variables and recycling intention
Constructs Observations in
Each Group
Standardised Regression Weight
Estimate (β)
p-value
Attitude towards recycling Low income 201 1.058 0.003 High income 192 -0.155 0.501
Subjective norms toward recycling
Low income 201 0.022 0.710 High income 192 0.127 0.405
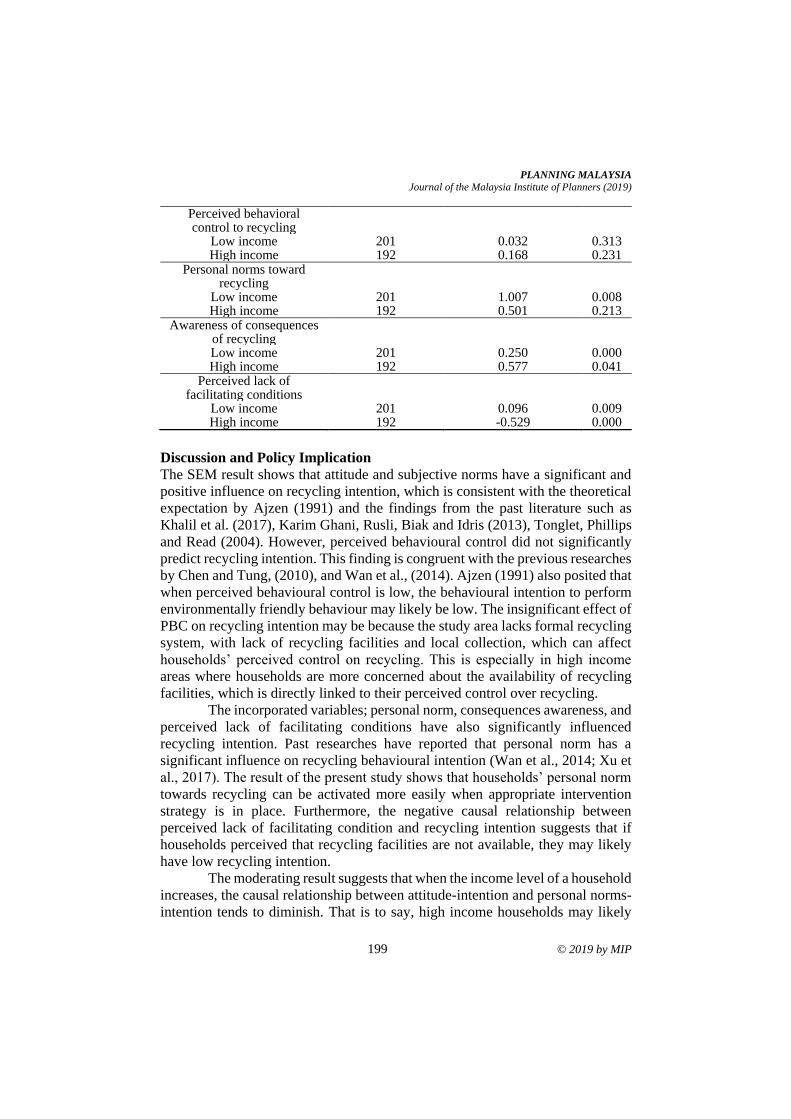
PLANNING MALAYSIA
Journal of the Malaysia Institute of Planners (2019)
199 © 2019 by MIP
Perceived behavioral control to recycling
Low income 201 0.032 0.313 High income 192 0.168 0.231
Personal norms toward recycling
Low income 201 1.007 0.008 High income 192 0.501 0.213
Awareness of consequences of recycling
Low income 201 0.250 0.000 High income 192 0.577 0.041
Perceived lack of facilitating conditions
Low income 201 0.096 0.009 High income 192 -0.529 0.000
Discussion and Policy Implication
The SEM result shows that attitude and subjective norms have a significant and
positive influence on recycling intention, which is consistent with the theoretical
expectation by Ajzen (1991) and the findings from the past literature such as
Khalil et al. (2017), Karim Ghani, Rusli, Biak and Idris (2013), Tonglet, Phillips
and Read (2004). However, perceived behavioural control did not significantly
predict recycling intention. This finding is congruent with the previous researches
by Chen and Tung, (2010), and Wan et al., (2014). Ajzen (1991) also posited that
when perceived behavioural control is low, the behavioural intention to perform
environmentally friendly behaviour may likely be low. The insignificant effect of
PBC on recycling intention may be because the study area lacks formal recycling
system, with lack of recycling facilities and local collection, which can affect
households’ perceived control on recycling. This is especially in high income
areas where households are more concerned about the availability of recycling
facilities, which is directly linked to their perceived control over recycling.
The incorporated variables; personal norm, consequences awareness, and
perceived lack of facilitating conditions have also significantly influenced
recycling intention. Past researches have reported that personal norm has a
significant influence on recycling behavioural intention (Wan et al., 2014; Xu et
al., 2017). The result of the present study shows that households’ personal norm
towards recycling can be activated more easily when appropriate intervention
strategy is in place. Furthermore, the negative causal relationship between
perceived lack of facilitating condition and recycling intention suggests that if
households perceived that recycling facilities are not available, they may likely
have low recycling intention.
The moderating result suggests that when the income level of a household
increases, the causal relationship between attitude-intention and personal norms-
intention tends to diminish. That is to say, high income households may likely
Muhammad Salisu Khalil, Ho Yuek Ming, Latifah Abd Manaf, Amir Hamzah Sharaai, & Aliyu Baba Nabegu Income Perspective on the Factors Influencing Households’ Recycling Intention: Implications from the Extended Theory of Planned Behaviour
© 2019 by MIP 200
have low attitude towards recycling especially when recycling facilities and local
collections are lacking. On the other hand, the attitude of low income households
may likely influence their intention to recycle regardless of the availability of
recycling facilities. Similarly, the moderating result shows that the causal
relationship between perceived lack of facilitating conditions and recycling
intention is positive and significant for low income householders; however, the
same relationship shows significant but negative for high income households.
This suggests that households in high income group are motivated by the
availability of recycling facilities, which is directly linked to their perceived
control. On the other hand, households in low income group are more concerned
about the financial benefit of recycling rather than the recycling facilities as such
their low income status may likely influence their recycling intention. This is
consistent with the findings of Fisher, Bashyal and Bachman (2012), and Pakpour
et al. (2014), but contrary to that of Meyer and Liebe (2010) who reported that
higher income consumers are more likely to perform environmentally friendly
behaviour.
Policy Implications of the Study
The results of this study show that perceived behavioural control did not influence
households’ recycling intention. To improve households’ perceived control,
authorities should provide appropriate recycling facilities such as curb side
collection, drop-off points that are convenient to the households.
Additionally, the significant influence of awareness of consequences on
recycling intention in this study underlines the significance of enlightening
people about the positive consequences of recycling and the individual and
collective responsibility of performing recycling for the benefit of oneself and the
community at large.
The findings also suggest that the policy approach should be area
specific. For example, the low income households can be encouraged to
participate further in recycling by giving them incentives as they tend to be more
motivated toward the financial benefits of recycling, whereas, the high income
households can be encouraged by providing recycling facilities and local
collections in a more convenient and accessible location that would ease their
participation.
CONCLUSION
This study attempted to investigate the moderating effect of income on
households’ recycling intention. The results indicated that income moderated the
positive relationships between attitude - recycling intention, personal norms -
recycling intention, as well as those between perceived lack of facilitating
conditions - recycling intention. While previous researchers have found that
recycling intention increases with the increase in income level, the results from
PLANNING MALAYSIA
Journal of the Malaysia Institute of Planners (2019)
201 © 2019 by MIP
this study revealed a unique finding that recycling intention decreases with
increase in household income. This finding is considered unique as no previous
study investigated the moderating effect of income on households’ recycling
intention. The extended TPB model used in this research will help policy makers
to better understand the factors affecting recycling intention.
ACKNOWLEDGEMENTS
The publication of this article was sponsored by the Universiti Putra Malaysia.
REFERENCES
Ajzen, I. (1991). The theory of planned behavior. Organizational Behavior and Human
Decision Processes, 50(2), 179–211.
Ary, D., Jacobs, L. C., Irvine, C. K., & Walker, D. (2013). Introduction to Research in
Education. Boston, MA: Cengage Learning.
Chen, M.-F., & Tung, P.-J. (2010). The moderating effect of perceived lack of facilities
on consumers’ recycling intentions. Environment and Behavior, 42(6), 824-844.
Fisher, C., Bashyal, S., & Bachman, B. (2012). Demographic impacts on environmentally
friendly purchase behaviors. Journal of Targeting, Measurement and Analysis
for Marketing, 20(3-4), 172-184.
Hair, J. F., Black, W. C., Babin, B. J., & Anderson, R.E. (2010). Multivariate data
analysis. New York: Pearson Higher Ed.
Hayes, A. F., & Scharkow, M. (2013). The relative trustworthiness of inferential tests of
the indirect effect in statistical mediation analysis: Does method really matter?
Psychological Science, 24(10), 1918-1927.
Karim Ghani, W. A., Rusli, I. F., Biak, D. R. A., & Idris, A. (2013). An application of the
theory of planned behaviour to study the influencing factors of participation in
source separation of food waste. Waste Management, 33(5), 1276-1281.
Khalil, M., Abdullah, S., Abd Manaf, L., Sharaai, A., & Nabegu, A. (2017). Examining
the moderating role of perceived lack of facilitating conditions on household
recycling intention in Kano, Nigeria. Recycling, 2(4), 18.
Krejcie, R. V., & Morgan, D. W. (1970). Determining sample size for research activities.
Education Psychology, 30, 607-610.
Meyer, R., & Liebe, U. (2010). Are the affluent prepared to pay for the planet ? Explaining
willingness to pay for public and quasi-private environmental goods in
Switzerland. Population and Environment, 32(1), 42-65.
Pakpour, A. H., Zeidi, I. M., Emamjomeh, M. M., Asefzadeh, S., & Pearson, H. (2014).
Household waste behaviours among a community sample in Iran: An application
of the theory of planned behaviour. Waste Management, 34, 980-986.
Pérez-López, G., Prior, D., Zafra-Gómez, J. L., & Plata-Díaz, A. M. (2016). Cost
efficiency in municipal solid waste service delivery: Alternative management
forms in relation to local population size. European Journal of Operational
Research, 255(2), 583-592.
Suleyman, N., & Khalil, M. S. (2014). Student perceptions of geography as a discipline:
A comparative study: Case studies from Turkey and Nigeria. Germany,
Saarland: LAP Lambert Academic Publishing.
Muhammad Salisu Khalil, Ho Yuek Ming, Latifah Abd Manaf, Amir Hamzah Sharaai, & Aliyu Baba Nabegu Income Perspective on the Factors Influencing Households’ Recycling Intention: Implications from the Extended Theory of Planned Behaviour
© 2019 by MIP 202
Samah, B. A. (2016). Enhancing extension education research using structural equation
modelling. Serdang: Universiti Putra Malaysia Press.
Singh, A. S., & Masuku, M. B. (2014). Sampling techniques & determination of sample
size in applied statistics research: An overview. International Journal of
Economics, Commerce and Management, 2(11), 1-22.
Tonglet, M., Phillips, P. S., & Read, A. D. (2004). Using the theory of planned behaviour
to investigate the determinants of recycling behaviour: A case study from
Brixworth, UK. Resources, Conservation and Recycling, 41, 191-214.
Wan, C., Shen, G. Q., & Yu, A. (2014). The role of perceived effectiveness of policy
measures in predicting recycling behaviour in Hong Kong. Resources,
Conservation and Recycling, 83, 141-151.
Xu, L., Ling, M., Lu, Y., & Shen, M. (2017). Understanding household waste separation
behaviour: Testing the roles of moral, past experience, and perceived policy
effectiveness within the theory of planned behaviour. Sustainability, 9(4), 2-27
Received: 12th January 2019. Accepted: 2nd August 2019
1Senior lecturer at Universiti Malaysia Kelantan. Email: [email protected] 203
PLANNING MALAYSIA:
Journal of the Malaysian Institute of Planners
VOLUME 17 ISSUE 2 (2019), Page 203 – 214
CHILDREN’S DIRECT AND INDIRECT EXPERIENCES WITH
NATURE AND THEIR CONNECTEDNESS TO NATURE
Nor Diyana Mustapa1, Nor Zarifah Maliki2, Nor Fadzila Aziz3, & Aswati Hamzah4
1Faculty of Architecture and Ekistics
UNIVERSITI MALAYSIA KELANTAN
2,3School of Housing, Building and Planning
UNIVERSITI SAINS MALAYSIA
4School of Educational Studies
UNIVERSITI SAINS MALAYSIA
Abstract
Direct experiences with nature during childhood plays an important role to
influence children’s connectedness to nature (CTN) as a child now and later as
an adult. However, today’s children obtain nature experiences mostly through
indirect ways (e.g. observing nature and vicarious learning), which may not have
the same quality as direct ways (e.g. activities with plants and earth elements).
Hence, this study aims to first identify the current trends of children experience
nature and further examine the effects of both direct and indirect experiences
with nature on their CTN. Questionnaires were distributed to 760 children from
20 schools include both urban and rural schools in Kedah and Penang, Malaysia.
The data were analysed using mean score, standard deviation, and multiple
regression. The results confirmed that the current trends of children having
experiences with nature are more through indirect ways. Results also showed that
indirect experiences with nature make more contribution to children’s CTN than
direct experiences. Overall, this study highlights that indirect experiences with
nature can be an alternative and effective way to develop children’s CTN without
neglecting the importance of direct experiences with nature.
Keywords: children, connectedness to nature, direct experiences with nature,
indirect experiences with nature
Nor Diyana Mustapa, Nor Zarifah Maliki, Nor Fadzila Aziz, & Aswati Hamzah Children’s Direct and Indirect Experiences with Nature and their Connectedness to Nature
© 2019 by MIP 204
INTRODUCTION
An individual attachment to nature, known as connectedness to nature (CTN),
plays an important role in developing a positive attitude and behaviour towards
the environment. Studies have found that CTN has positively influenced people’s
environmental concerns and behaviours (Cheng & Monroe, 2010; Collado,
Staats, & Corraliza, 2013; Duerden & Witt, 2010), as well as specific attitudes
towards nature (Lin et al., 2017) and the environment including wildlife (Zhang,
Goodale, & Chen, 2014). In addition, CTN also has a positive impact on
individual’s psychological well-being (Capaldi, Dopko, & Zelenski, 2014;
Howell, Dopko, Passmore, & Buro, 2011). Given the many benefits of CTN
regarding individual attitudes towards nature and the environment, as well as
psychological well-being, the question is how an individual develops their CTN.
Many studies have demonstrated that frequent experiences with and in nature are
the most significant factor that contributes to an individual’s CTN, which
subsequently influences their environmental concerns and behaviours (Cheng &
Monroe, 2010; Duerden & Witt, 2010; Zhang et al., 2014). Most importantly,
retrospective studies have found that childhood frequent experiences with and in
nature in creating long-lasting effects that endure until adulthood (Chawla, 2007;
Wells & Lekies, 2006).
However, it has become a concern as the frequency of children having
direct experiences with nature is declining (Gundersen, Skår, O’Brien, Wold, &
Follo, 2016; Skår & Krogh, 2009). Rapid urbanisation and population growth,
which mostly occur in developing countries including Malaysia, have reduced
children’s experiences with nature especially direct experiences (Chawla & Derr,
2012; Louv, 2008). Modernisation has also caused children’s leisure activities to
change from them being actively involved in outdoor activities to being passively
confined to indoor activities, aided by gadgets (Louv, 2008; Veitch, Bagley, Ball,
& Salmon, 2006). Also, parental restrictions due to safety have limited children’s
opportunities to play in the outdoor environment (Castonguay, 2010; Holt, Lee,
Millar, & Spence, 2015) where they can experience nature directly. For that
reason, children have obtained experiences with nature mostly from indirect
experiences through the media (Cohen & Horm-Wingerd, 1993; Kellert, 2005)
and books, as well as in classes and visits to organised natural places, such as
zoos (Louv, 2008).
Even though many studies have demonstrated that both direct and
indirect experiences with nature make contribution to children’s CTN (Duerden
& Witt, 2010), concerns have been raised, as several studies have found that
children have less knowledge about, affection to and interest in nature when they
only have indirect experiences with nature without direct experiences (Aaron &
Witt, 2011). Direct experiences with nature through gardening and planting trees
were found to make greater contribution to children’s CTN when they become
adult as compared to indirect experiences with nature (Lohr & Pearson-mims,
PLANNING MALAYSIA
Journal of the Malaysia Institute of Planners (2019)
205 © 2019 by MIP
2005). As the frequency of children having direct experiences with nature is
declining (Skår & Krogh, 2009; Gundersen et al., 2016) and children obtain
nature experiences mostly through indirect ways; hence, it is important to
examine whether indirect experiences with nature have a similar effect to direct
experiences with nature on children’s CTN. Moreover, most studies have been
conducted in Western countries, and few have been conducted in Asian countries.
It is important to fill this gap because studies have found that people with different
cultures have a different engagement with nature (Milfont, 2012; Robertson,
Walford, & Fox, 2003). Therefore, this study aims to first identify the current
trends of Malaysian children experience with nature that include both direct and
indirect experiences, and further examine the effects of these experiences on their
CTN.
METHODOLOGY
Participants
This study used quantitative approach involving distribution of questionnaires to
760 children aged 10-11 years old from 20 schools, both urban and rural schools,
located in Northern Region of Malaysia, particularly in Kedah and Penang. The
sample was chosen using stratified random sampling. Children aged 10 to 11
years old were first divided into urban and rural strata. Then, five schools were
selected randomly from each stratum; all the selected schools were national
schools (Sekolah Kebangsaan (SK)). Subsequently, a class was randomly chosen
from each batch (year) in every school. Complete collection (criterion sampling)
was used to select the children. Every student in the chosen classes completed the
questionnaire; however, only 760 were randomly selected according to the
number that had been calculated using proportionate simple random sampling
calculation. Overall the number of selected children was 382 from Kedah and 378
from Penang. Data collection was conducted from February 2016 until April
2016. Copies of questionnaire were distributed personally to the children in
classes. The questionnaires were distributed in the Malay language as English is
not the first language of the children. The children took 20 minutes to answer the
questionnaire.
Questionnaire Development
Experiences with Nature
Children’s experiences with nature were measured through two types of
experiences, which were ‘direct experiences’ and ‘indirect experiences’. The
items for both experiences were adapted from Cheng and Monroe (2010), and
Zhang et al. (2014). Some of the items were also derived from pre-test. The
children were asked to tick on the frequency of them doing the listed items.
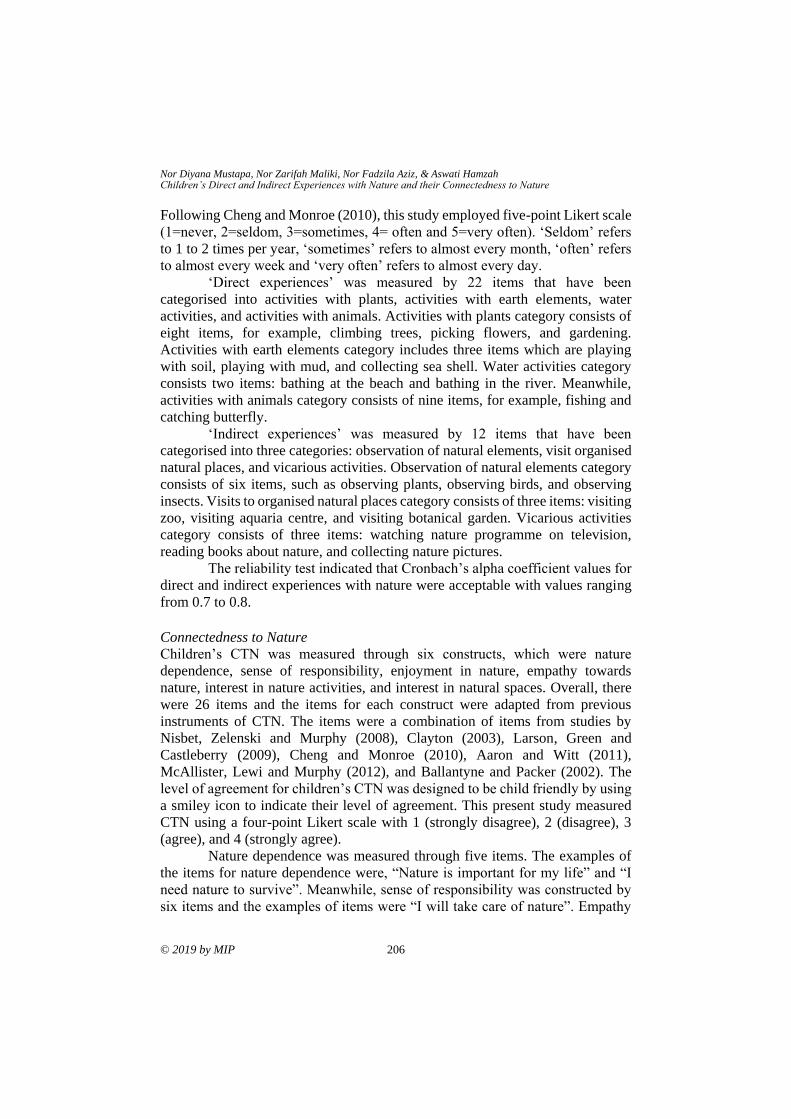
Nor Diyana Mustapa, Nor Zarifah Maliki, Nor Fadzila Aziz, & Aswati Hamzah Children’s Direct and Indirect Experiences with Nature and their Connectedness to Nature
© 2019 by MIP 206
Following Cheng and Monroe (2010), this study employed five-point Likert scale
(1=never, 2=seldom, 3=sometimes, 4= often and 5=very often). ‘Seldom’ refers
to 1 to 2 times per year, ‘sometimes’ refers to almost every month, ‘often’ refers
to almost every week and ‘very often’ refers to almost every day.
‘Direct experiences’ was measured by 22 items that have been
categorised into activities with plants, activities with earth elements, water
activities, and activities with animals. Activities with plants category consists of
eight items, for example, climbing trees, picking flowers, and gardening.
Activities with earth elements category includes three items which are playing
with soil, playing with mud, and collecting sea shell. Water activities category
consists two items: bathing at the beach and bathing in the river. Meanwhile,
activities with animals category consists of nine items, for example, fishing and
catching butterfly.
‘Indirect experiences’ was measured by 12 items that have been
categorised into three categories: observation of natural elements, visit organised
natural places, and vicarious activities. Observation of natural elements category
consists of six items, such as observing plants, observing birds, and observing
insects. Visits to organised natural places category consists of three items: visiting
zoo, visiting aquaria centre, and visiting botanical garden. Vicarious activities
category consists of three items: watching nature programme on television,
reading books about nature, and collecting nature pictures.
The reliability test indicated that Cronbach’s alpha coefficient values for
direct and indirect experiences with nature were acceptable with values ranging
from 0.7 to 0.8.
Connectedness to Nature
Children’s CTN was measured through six constructs, which were nature
dependence, sense of responsibility, enjoyment in nature, empathy towards
nature, interest in nature activities, and interest in natural spaces. Overall, there
were 26 items and the items for each construct were adapted from previous
instruments of CTN. The items were a combination of items from studies by
Nisbet, Zelenski and Murphy (2008), Clayton (2003), Larson, Green and
Castleberry (2009), Cheng and Monroe (2010), Aaron and Witt (2011),
McAllister, Lewi and Murphy (2012), and Ballantyne and Packer (2002). The
level of agreement for children’s CTN was designed to be child friendly by using
a smiley icon to indicate their level of agreement. This present study measured
CTN using a four-point Likert scale with 1 (strongly disagree), 2 (disagree), 3
(agree), and 4 (strongly agree).
Nature dependence was measured through five items. The examples of
the items for nature dependence were, “Nature is important for my life” and “I
need nature to survive”. Meanwhile, sense of responsibility was constructed by
six items and the examples of items were “I will take care of nature”. Empathy
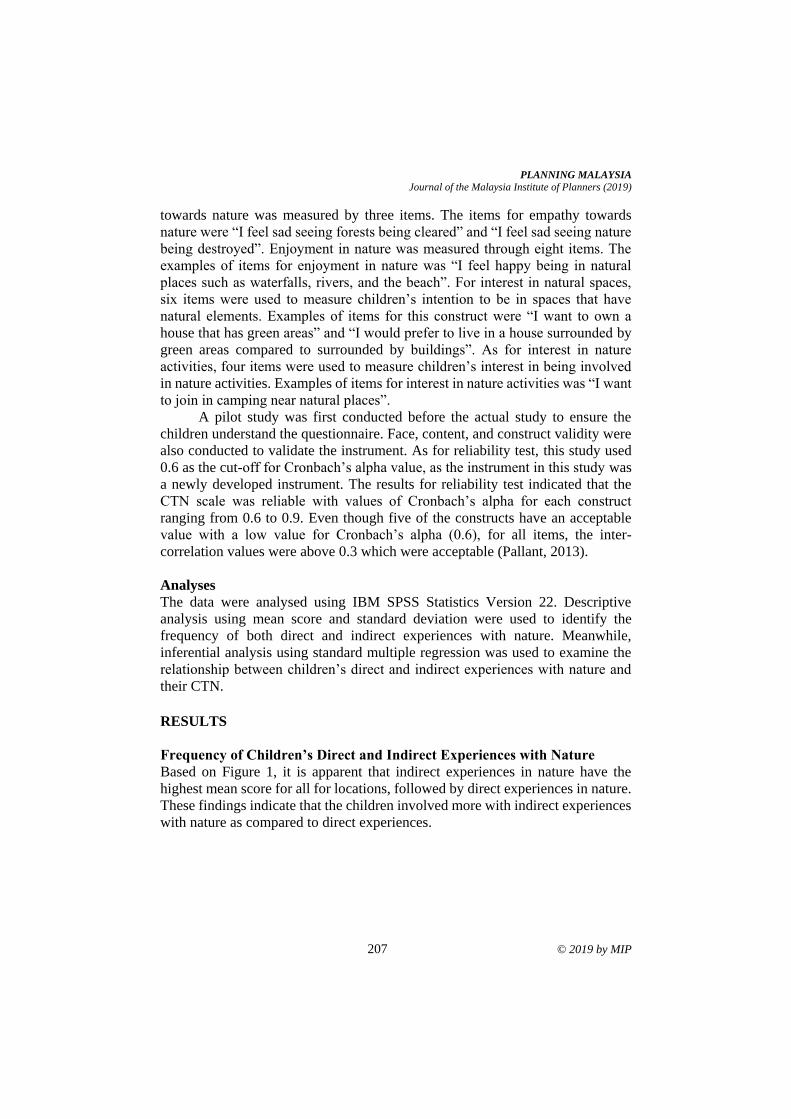
PLANNING MALAYSIA
Journal of the Malaysia Institute of Planners (2019)
207 © 2019 by MIP
towards nature was measured by three items. The items for empathy towards
nature were “I feel sad seeing forests being cleared” and “I feel sad seeing nature
being destroyed”. Enjoyment in nature was measured through eight items. The
examples of items for enjoyment in nature was “I feel happy being in natural
places such as waterfalls, rivers, and the beach”. For interest in natural spaces,
six items were used to measure children’s intention to be in spaces that have
natural elements. Examples of items for this construct were “I want to own a
house that has green areas” and “I would prefer to live in a house surrounded by
green areas compared to surrounded by buildings”. As for interest in nature
activities, four items were used to measure children’s interest in being involved
in nature activities. Examples of items for interest in nature activities was “I want
to join in camping near natural places”.
A pilot study was first conducted before the actual study to ensure the
children understand the questionnaire. Face, content, and construct validity were
also conducted to validate the instrument. As for reliability test, this study used
0.6 as the cut-off for Cronbach’s alpha value, as the instrument in this study was
a newly developed instrument. The results for reliability test indicated that the
CTN scale was reliable with values of Cronbach’s alpha for each construct
ranging from 0.6 to 0.9. Even though five of the constructs have an acceptable
value with a low value for Cronbach’s alpha (0.6), for all items, the inter-
correlation values were above 0.3 which were acceptable (Pallant, 2013).
Analyses
The data were analysed using IBM SPSS Statistics Version 22. Descriptive
analysis using mean score and standard deviation were used to identify the
frequency of both direct and indirect experiences with nature. Meanwhile,
inferential analysis using standard multiple regression was used to examine the
relationship between children’s direct and indirect experiences with nature and
their CTN.
RESULTS
Frequency of Children’s Direct and Indirect Experiences with Nature
Based on Figure 1, it is apparent that indirect experiences in nature have the
highest mean score for all for locations, followed by direct experiences in nature.
These findings indicate that the children involved more with indirect experiences
with nature as compared to direct experiences.
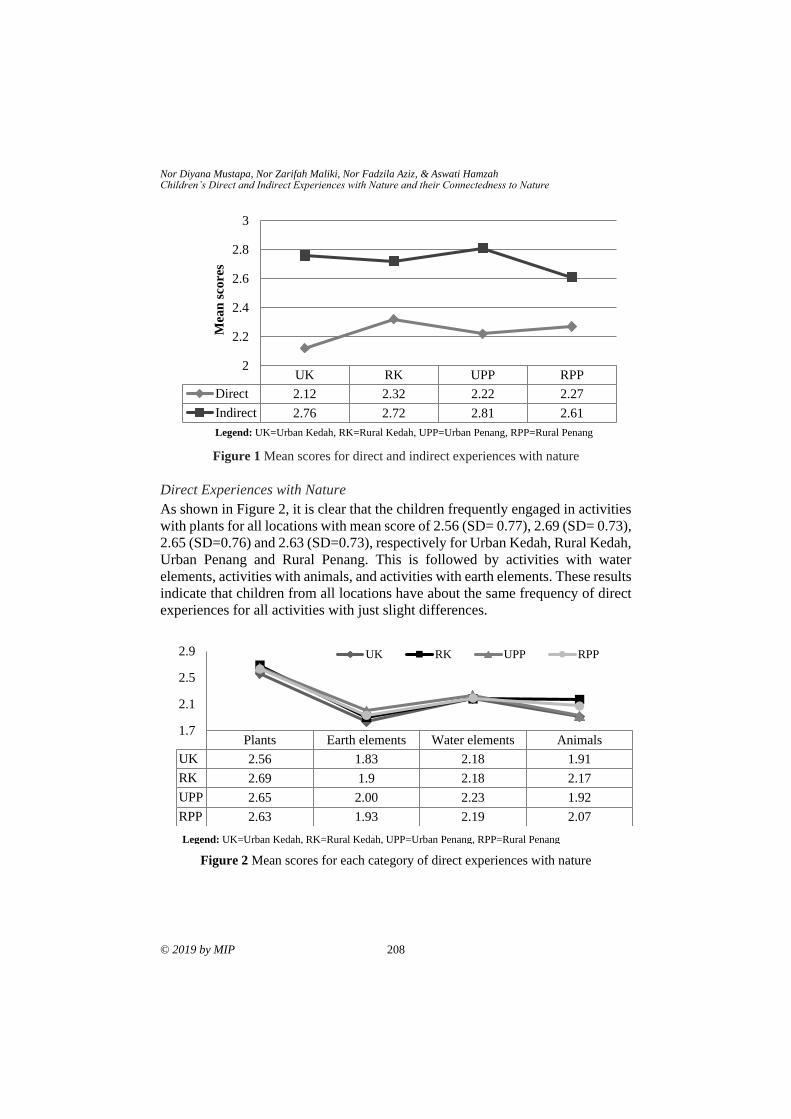
Nor Diyana Mustapa, Nor Zarifah Maliki, Nor Fadzila Aziz, & Aswati Hamzah Children’s Direct and Indirect Experiences with Nature and their Connectedness to Nature
© 2019 by MIP 208
Figure 1 Mean scores for direct and indirect experiences with nature
Direct Experiences with Nature
As shown in Figure 2, it is clear that the children frequently engaged in activities
with plants for all locations with mean score of 2.56 (SD= 0.77), 2.69 (SD= 0.73),
2.65 (SD=0.76) and 2.63 (SD=0.73), respectively for Urban Kedah, Rural Kedah,
Urban Penang and Rural Penang. This is followed by activities with water
elements, activities with animals, and activities with earth elements. These results
indicate that children from all locations have about the same frequency of direct
experiences for all activities with just slight differences.
Figure 2 Mean scores for each category of direct experiences with nature
UK RK UPP RPP
Direct 2.12 2.32 2.22 2.27
Indirect 2.76 2.72 2.81 2.61
2
2.2
2.4
2.6
2.8
3M
ean
sco
res
Plants Earth elements Water elements Animals
UK 2.56 1.83 2.18 1.91
RK 2.69 1.9 2.18 2.17
UPP 2.65 2.00 2.23 1.92
RPP 2.63 1.93 2.19 2.07
1.7
2.1
2.5
2.9 UK RK UPP RPP
Legend: UK=Urban Kedah, RK=Rural Kedah, UPP=Urban Penang, RPP=Rural Penang
Legend: UK=Urban Kedah, RK=Rural Kedah, UPP=Urban Penang, RPP=Rural Penang
PLANNING MALAYSIA
Journal of the Malaysia Institute of Planners (2019)
209 © 2019 by MIP
Indirect Experiences with Nature
From Figure 3, it is clear that the activities that have higher mean scores for
indirect experiences are observation of natural elements and vicarious activities.
Meanwhile, the least frequent indirect experiences with nature that children did
was visit organized natural places. These results indicate that the activities that
the children did most are observation of natural elements and vicarious activities.
However, the category of visits to organised natural places has a lower frequency,
as children need to travel to those places.
Figure 3 Mean scores for indirect experiences with nature categories
The Relationship between Children’s Experiences with Nature and their
Connectedness to Nature
Prior to conducting multiple regression analysis, all the preliminary analyses for
multicollinearity, outliers, normality, linearity, and homoscedasticity meet the
assumptions; hence, the regression model is appropriate. The coefficient
determination for the developed model is 0.120 (R2 = 0.120). Thus, 0.120
(12.0%) of CTN can be explained by the independent variables. The model has a
significance level of 0.000 (p <0.005). Therefore, this model is appropriate to
predict CTN. Based on Table 2, only one independent variable predicts CTN. The
results illustrate that indirect experiences with nature are statistically significant
in making a contribution to CTN with p < 0.05 (b= 0.32, t=7.74, Sig. 0.00).
Meanwhile, direct experiences with nature is not statistically significant in
making a contribution to CTN with (b= 0.044, t=1.06, Sig. 0.29). Surprisingly,
the results have demonstrated that direct experiences with nature have no
significant effect on CTN, whereas indirect experiences with nature significantly
affect CTN.
Observation Visitation Vicarious
UK 3.05 2.18 2.77
RK 3.1 2.04 2.65
UPP 3.08 2.22 2.87
RPP 2.92 2.05 2.59
1.8
2.2
2.6
3
3.4 UK RK UPP RPP
Legend: UK=Urban Kedah, RK=Rural Kedah, UPP=Urban Penang, RPP=Rural Penang
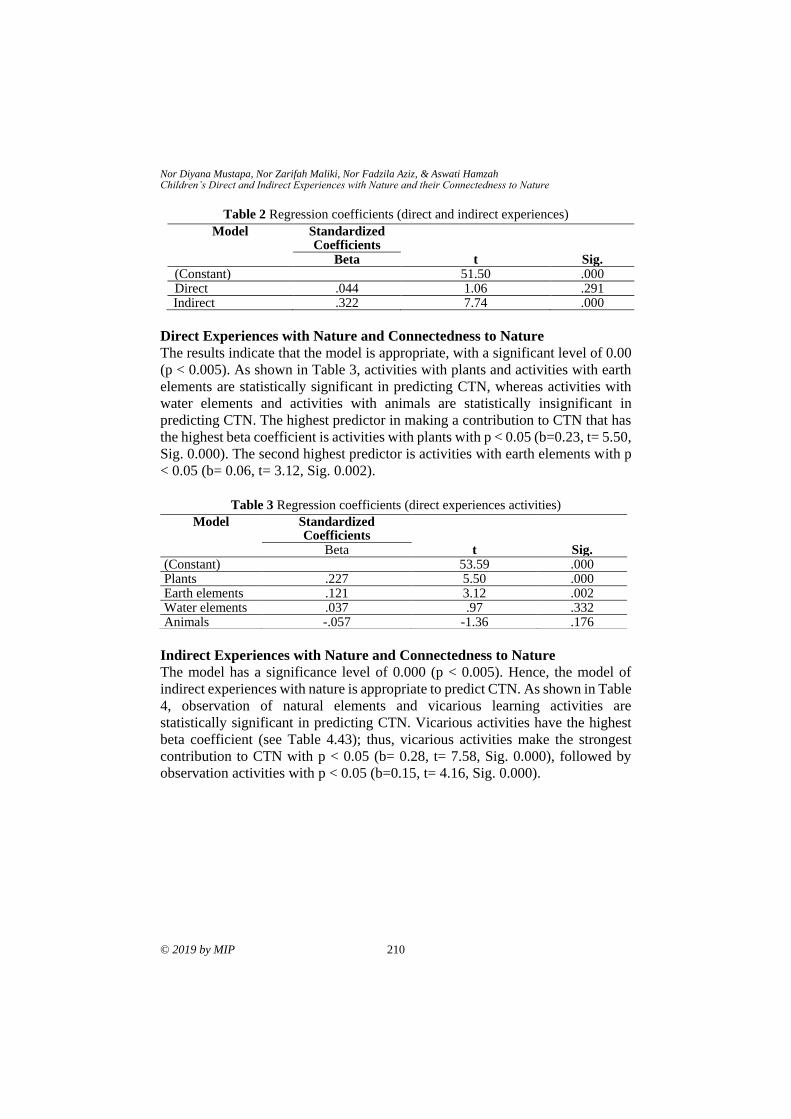
Nor Diyana Mustapa, Nor Zarifah Maliki, Nor Fadzila Aziz, & Aswati Hamzah Children’s Direct and Indirect Experiences with Nature and their Connectedness to Nature
© 2019 by MIP 210
Table 2 Regression coefficients (direct and indirect experiences)
Model Standardized Coefficients
Beta t Sig. (Constant) 51.50 .000 Direct .044 1.06 .291 Indirect .322 7.74 .000
Direct Experiences with Nature and Connectedness to Nature
The results indicate that the model is appropriate, with a significant level of 0.00
(p < 0.005). As shown in Table 3, activities with plants and activities with earth
elements are statistically significant in predicting CTN, whereas activities with
water elements and activities with animals are statistically insignificant in
predicting CTN. The highest predictor in making a contribution to CTN that has
the highest beta coefficient is activities with plants with p < 0.05 (b=0.23, t= 5.50,
Sig. 0.000). The second highest predictor is activities with earth elements with p
< 0.05 (b= 0.06, t= 3.12, Sig. 0.002).
Table 3 Regression coefficients (direct experiences activities)
Indirect Experiences with Nature and Connectedness to Nature
The model has a significance level of 0.000 (p < 0.005). Hence, the model of
indirect experiences with nature is appropriate to predict CTN. As shown in Table
4, observation of natural elements and vicarious learning activities are
statistically significant in predicting CTN. Vicarious activities have the highest
beta coefficient (see Table 4.43); thus, vicarious activities make the strongest
contribution to CTN with p < 0.05 (b= 0.28, t= 7.58, Sig. 0.000), followed by
observation activities with p < 0.05 (b=0.15, t= 4.16, Sig. 0.000).
Model Standardized Coefficients
t Sig. Beta (Constant) 53.59 .000 Plants .227 5.50 .000 Earth elements .121 3.12 .002 Water elements .037 .97 .332 Animals -.057 -1.36 .176
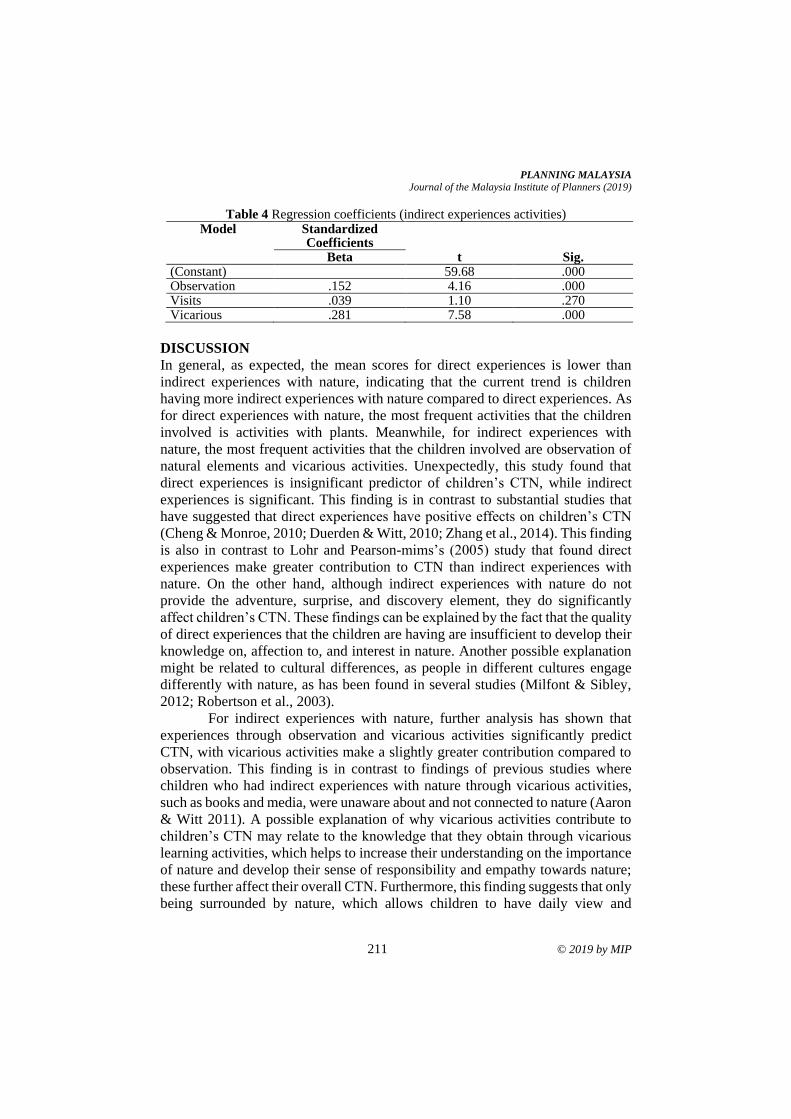
PLANNING MALAYSIA
Journal of the Malaysia Institute of Planners (2019)
211 © 2019 by MIP
Table 4 Regression coefficients (indirect experiences activities) Model Standardized
Coefficients t Sig. Beta
(Constant) 59.68 .000 Observation .152 4.16 .000 Visits .039 1.10 .270 Vicarious .281 7.58 .000
DISCUSSION
In general, as expected, the mean scores for direct experiences is lower than
indirect experiences with nature, indicating that the current trend is children
having more indirect experiences with nature compared to direct experiences. As
for direct experiences with nature, the most frequent activities that the children
involved is activities with plants. Meanwhile, for indirect experiences with
nature, the most frequent activities that the children involved are observation of
natural elements and vicarious activities. Unexpectedly, this study found that
direct experiences is insignificant predictor of children’s CTN, while indirect
experiences is significant. This finding is in contrast to substantial studies that
have suggested that direct experiences have positive effects on children’s CTN
(Cheng & Monroe, 2010; Duerden & Witt, 2010; Zhang et al., 2014). This finding
is also in contrast to Lohr and Pearson-mims’s (2005) study that found direct
experiences make greater contribution to CTN than indirect experiences with
nature. On the other hand, although indirect experiences with nature do not
provide the adventure, surprise, and discovery element, they do significantly
affect children’s CTN. These findings can be explained by the fact that the quality
of direct experiences that the children are having are insufficient to develop their
knowledge on, affection to, and interest in nature. Another possible explanation
might be related to cultural differences, as people in different cultures engage
differently with nature, as has been found in several studies (Milfont & Sibley,
2012; Robertson et al., 2003).
For indirect experiences with nature, further analysis has shown that
experiences through observation and vicarious activities significantly predict
CTN, with vicarious activities make a slightly greater contribution compared to
observation. This finding is in contrast to findings of previous studies where
children who had indirect experiences with nature through vicarious activities,
such as books and media, were unaware about and not connected to nature (Aaron
& Witt 2011). A possible explanation of why vicarious activities contribute to
children’s CTN may relate to the knowledge that they obtain through vicarious
learning activities, which helps to increase their understanding on the importance
of nature and develop their sense of responsibility and empathy towards nature;
these further affect their overall CTN. Furthermore, this finding suggests that only
being surrounded by nature, which allows children to have daily view and
Nor Diyana Mustapa, Nor Zarifah Maliki, Nor Fadzila Aziz, & Aswati Hamzah Children’s Direct and Indirect Experiences with Nature and their Connectedness to Nature
© 2019 by MIP 212
observation towards nature, also can help to increase the level of children’s CTN.
Therefore, indirect experiences can be an alternative and effective way to develop
children’s CTN.
As for direct experiences with nature, even though direct experiences do
not significantly affect children’s CTN, further analysis revealed that activities
with plants and earth elements are statistically significant in making a slight
contribution to children’s CTN. This indicates that as children frequently do
activities with plants and earth elements such as gardening and playing with soil,
the children will gain more knowledge about the plants and soil, develop affection
towards those elements and further develop their interest to further participate in
activities that involve those elements. Both activities make only a small
contribution, something which is likely to be related to the quality of the
experience itself. Hence, the importance of direct experiences also cannot be
neglected.
CONCLUSION
Overall, the findings of this research suggest that such low frequency of
children’s direct experiences with nature is insufficient to develop their CTN; and
the trends of children having most nature experiences indirectly does not give
negative effect as indirect experiences with nature is significantly influence their
CTN. Hence, indirect experiences through vicarious activities and observation
towards nature can become an effective alternative way to connect the children
with nature in the future as children have constraints of being explorative in the
outdoor environment where they can have direct experiences with nature.
However, the importance of direct experiences with nature cannot be neglected.
It is suggested that practitioners in built environment, environmental education,
as well as parents should help to reconnect the children with nature through both
direct and indirect ways as both can complement each other.
ACKNOWLEDGEMENTS
The author would like to acknowledge the Fundamental Research Grant Scheme
(FRGS) under the Ministry of Education (MOE) as the funding for this research.
REFERENCES Aaron, R. F., & Witt, P. A. (2011). Urban students’ definitions and perceptions of nature.
Children Youth and Environments, 21(2), 145-167.
Ballantyne, R., & Packer, J. (2002). Nature-based excursions: School students’
perceptions of learning in natural environments. International Research in
Geographical and Environmental Education, 11(3), 218-236.
Capaldi, C. A., Dopko, R. L., & Zelenski, J. M. (2014). The relationship between nature
connectedness and happiness: A meta-analysis. Frontiers in Psychology,
5(2014), 1-17.
Castonguay, G. (2010). Children’s use of the outdoor environment in a low-income
PLANNING MALAYSIA
Journal of the Malaysia Institute of Planners (2019)
213 © 2019 by MIP
Montreal neighborhood. Children, Youth and Environments, 20(1), 200-230.
Chawla, L. (2007). Childhood experiences associated with care for the natural world: A
theoretical framework for empirical results. Children, Youth and Environments,
17(4), 144-170.
Chawla, L., & Derr, V. (2012). The development of conservation behaviours in childhood
and youth. In S. Clayton (Ed.), The Oxford handbook of environmental and
conservation psychology (pp. 527-555). New York: Oxford University Press.
Cheng, J. C.-H., & Monroe, M. C. (2010). Connection to nature: Children’s affective
attitude toward nature. Environment and Behavior, 44(1), 31-49.
Clayton, S. (2003). Environmental identity: A conceptual and an operational definition.
In S. Clayton & S. Opotow (Eds.), Identity and the natural environment: The
psychological significance of nature (pp. 45-65). Cambridge, MA: MIT Press.
Cohen, S., & Horm-Wingerd, D. (1993). Children and the environment: Ecological
awareness among preschool children. Environment and Behavior, 25(1), 103-
120.
Collado, S., Staats, H., & Corraliza, J. A. (2013). Experiencing nature in children’s
summer camps: Affective, cognitive and behavioural consequences. Journal of
Environmental Psychology, 33(2013), 37-44.
Duerden, M. D., & Witt, P. A. (2010). The impact of direct and indirect experiences on
the development of environmental knowledge, attitudes, and behavior. Journal
of Environmental Psychology, 30(4), 379-392.
Gundersen, V., Skår, M., O’Brien, L., Wold, L. C., & Follo, G. (2016). Children and
nearby nature: A nationwide parental survey from Norway. Urban Forestry and
Urban Greening, 17, 116-125.
Holt, N. L., Lee, H., Millar, C. A., & Spence, J. C. (2015). `Eyes on where children play’:
A retrospective study of active free play. Children’s Geographies, 13(1), 73-88.
Howell, A. J., Dopko, R. L., Passmore, H.-A., & Buro, K. (2011). Nature connectedness:
Associations with well-being and mindfulness. Personality and Individual
Differences, 51(2), 166-171.
Kellert, S. R. (2005). Building for life: Designing and understanding the human-nature
connection. Washington, DC: Island Press.
Larson, L. R., Green, G. T., & Castleberry, S. B. (2009). Construction and validation of
an instrument to measure environmental orientations in a diverse group of
children. Environment and Behavior, 43(1), 72-89.
Lin, B. B., Gaston, K. J., Fuller, R. A., Wu, D., Bush, R., & Shanahan, D. F. (2017). How
green is your garden?: Urban form and socio-demographic factors influence yard
vegetation, visitation, and ecosystem service benefits. Landscape and Urban
Planning, 157, 239-246.
Lohr, V. I., & Pearson-mims, C. H. (2005). Children’s active and passive interactions
with plants inflence their attitudes and actions towards trees and gardening as
adults. HorTechnology, 15(3), 472-476.
Louv, R. (2008). Last children in the woods. Saving our children from nature-deficit
disorder. Chapel Hill, NC: Algonquin Books.
McAllister, C., Lewis, J., & Murphy, S. (2012). The green grass grew all around:
Rethinking urban natural spaces with children in mind. Children, Youth and
Environments, 22(2), 164-193.
Nor Diyana Mustapa, Nor Zarifah Maliki, Nor Fadzila Aziz, & Aswati Hamzah Children’s Direct and Indirect Experiences with Nature and their Connectedness to Nature
© 2019 by MIP 214
Milfont, T. L. (2012). Cultural differences in environmental engagement. In S. Clayton
(Ed.), The Oxford handbook of environmental and conservation (pp. 181-200).
New York: Oxford University Press.
Milfont, T. L., & Sibley, C. G. (2012). The big five personality traits and environmental
engagement: Associations at the individual and societal level. Journal of
Environmental Psychology, 32(2), 187-195.
Nisbet, E. K., Zelenski, J. M., & Murphy, S. A. (2008). The nature relatedness scale:
Linking individuals’ connection with nature to environmental concern and
behavior. Environment and Behavior, 41(5), 715-740.
Pallant, J. (2013). SPSS survival manual: A step by step guide to data analysis using IBM
SPSS (5th ed.). Milton Keynes, UK: Open University Press.
Robertson, M., Walford, R., & Fox, A. (2003). Landscape meanings and personal
identities: Some perspectives of East Anglian children. International Research
in Geographical and Environmental Education, 12(1), 32-48.
Skår, M., & Krogh, E. (2009). Changes in children’s nature-based experiences near home:
From spontaneous play to adult-controlled, planned and organised activities.
Children’s Geographies, 7(3), 339-354.
Veitch, J., Bagley, S., Ball, K., & Salmon, J. (2006). Where do children usually play? A
qualitative study of parents’ perceptions of influences on children’s active free-
play. Health & Place, 12(4), 383-393.
Wells, N. M., & Lekies, K. S. (2006). Nature and the life course: Pathways from
childhood nature experiences. Children Youth and Environments, 16(1), 1-24.
Zhang, W., Goodale, E., & Chen, J. (2014). How contact with nature affects children’s
biophilia, biophobia and conservation attitude in China. Biological
Conservation, 177, 109-116.
Received: 1st March 2019. Accepted: 26th June 2019
1Senior Lecturer at Universiti Putra Malaysia. Email: [email protected] 215
PLANNING MALAYSIA:
Journal of the Malaysian Institute of Planners
VOLUME 17 ISSUE 2 (2019), Page 215 – 224
SOCIAL IMPACT EVALUATION OF TEA PRODUCTION USING
SOCIAL LIFE CYCLE ASSESSMENT (S-LCA) METHOD IN
CAMERON HIGHLANDS, PAHANG, MALAYSIA
Amir Hamzah Sharaai11, Khairul Izzuddin Muhammad2 & Yeoh Geok Wah3
1,2Faculty of Environmental Studies
UNIVERSITI PUTRA MALAYSIA
3Institute of Plantation Studies
UNIVERSITI PUTRA MALAYSIA
Abstract
Commercial convention of tea production and plantation at the largest scale in
this country has shown an escalation year by year, together with the high demand
for tea products in the Malaysian market. This may have a direct social impact
throughout the life cycle of tea production. Thus, this research sought to identify
the social impacts from the overall process of tea production. This study used the
Social Life Cycle Assessment (S-LCA) involving descriptive analysis by
assessing the social impacts associated with the stakeholders of tea production
using three sets of questionnaires. The studies were conducted at one of the
highest tea production companies in Cameron Highlands, Malaysia. The findings
of the stakeholders showed a good level of satisfaction because there was no
significant negative effect. Overall, the social aspects of the tea production met
the required criteria in terms of social significance. However, there were some
social aspects that can be improved by the factory in the future such as health and
safety, discrimination, job opportunity and local community involvement.
Keywords: Social Life Cycle Assessment (S-LCA), job satisfaction; job
discrimination; social security; safe and healthy living condition
Amir Hamzah Sharaai1, Khairul Izzuddin Muhammad & Yeoh Geok Wah Social Impact Evaluation of Tea Production Using Social Life Cycle Assessment (SLCA) Method in Cameron Highlands, Pahang, Malaysia
© 2019 by MIP 216
INTRODUCTION
The tea bush is botanically known as Camellia Sinensis. It is an evergreen plant
with smooth, shiny, oval-shaped leaves and small white flowers. Today, tea is
grown in more than 25 countries around the world. In Malaysia, the best place for
tea is in Cameron Highlands, which has been planted with the world’s most
flavoured beverage made from the dried leaves and buds of the tea bush. Tea is
also one of the precursors to Cameron Highlands development as a hill station
before its transformation into a major tourist destination. Recently, tea industry
in Cameron Highlands is facing difficulties to sustain and survives. The tea
industry is facing many challenges in its expanding its operations and in handling
the social impact of tea companies such as the discrimination toward workers,
cultural & heritage conservation, water shortages, and demands of fair wages
from workers. Not only that, some local communities had to depend on polluted
source of drinking water and had been inflicted with diseases as the result of
extensive use of fertilizers and herbicides in the plantations, and untreated
effluent discharge from tea mill into majority of the streams.
Tea production is one of the major economic income generators that
provides high rate of employment in Cameron Highlands, Pahang. The high
demand for tea in the manufacturing industry for tea-based products contributes
to the opening of large-scale tea cultivation and creates more employment
opportunities to the local community. The demands come not only from the
domestic market, but also from international markets. According to the Food and
Agriculture Organization (FAO) of the United Nations (2016), the production of
tea in Malaysia has been continuously increasing year by year. In 2015, the total
production of tea was 9,760 tonnes and it has increased to 11,600 tonnes in 2016.
In order to meet the overwhelming demand, tea plantations require expansion and
the use of more lands. In some producing countries, the expansion of tea
plantations led to new areas being developed for plantation and leading to
conflicts between the plantations and the local communities especially regarding
their lands that have been misappropriated by the plantations.
The main objective in this study is to assess the social implications of tea
production toward workers, local communities and consumers. S-LCA is a
technique of social impact assessment, which is aimed at assessing the social and
socio-economic aspects of a product as well as the positive and negative impacts
on the whole life cycle (Amir Hamzah, 2016). The assessment begins from the
comprehensive production and processing of raw materials, production,
distribution, use, reuse, maintenance, recycling and final disposal of a particular
product (Muhammad, Sharaai, Ismail, Harun, & Wong, 2019).
Basically, the concept of the S-LCA adopted in this study is similar to
the Life Cycle Assessment (LCA) framework which focusses on environment
while the S-LCA focusses on social aspect. To understand and analyse the social
issues in tea production, an S-LCA study could be a feasible option for assessing
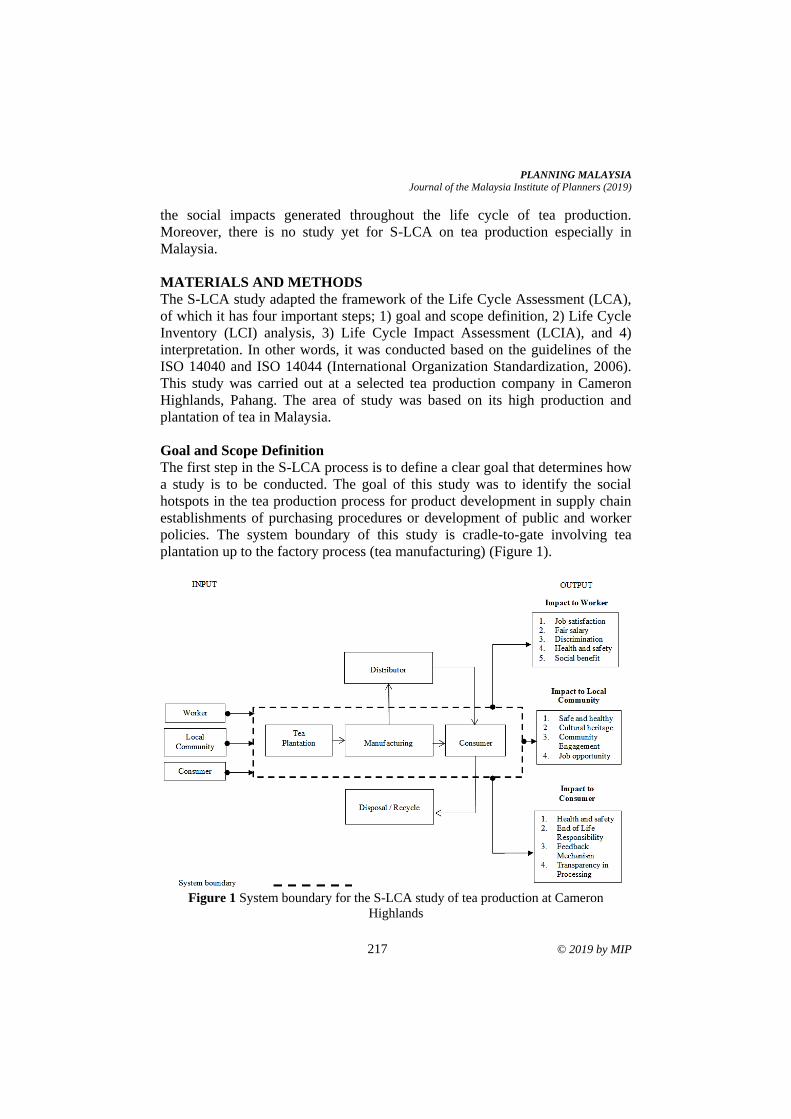
PLANNING MALAYSIA
Journal of the Malaysia Institute of Planners (2019)
217 © 2019 by MIP
the social impacts generated throughout the life cycle of tea production.
Moreover, there is no study yet for S-LCA on tea production especially in
Malaysia.
MATERIALS AND METHODS The S-LCA study adapted the framework of the Life Cycle Assessment (LCA),
of which it has four important steps; 1) goal and scope definition, 2) Life Cycle
Inventory (LCI) analysis, 3) Life Cycle Impact Assessment (LCIA), and 4)
interpretation. In other words, it was conducted based on the guidelines of the
ISO 14040 and ISO 14044 (International Organization Standardization, 2006).
This study was carried out at a selected tea production company in Cameron
Highlands, Pahang. The area of study was based on its high production and
plantation of tea in Malaysia.
Goal and Scope Definition
The first step in the S-LCA process is to define a clear goal that determines how
a study is to be conducted. The goal of this study was to identify the social
hotspots in the tea production process for product development in supply chain
establishments of purchasing procedures or development of public and worker
policies. The system boundary of this study is cradle-to-gate involving tea
plantation up to the factory process (tea manufacturing) (Figure 1).
Figure 1 System boundary for the S-LCA study of tea production at Cameron
Highlands
Amir Hamzah Sharaai1, Khairul Izzuddin Muhammad & Yeoh Geok Wah Social Impact Evaluation of Tea Production Using Social Life Cycle Assessment (SLCA) Method in Cameron Highlands, Pahang, Malaysia
© 2019 by MIP 218
Social Life Cycle Inventory Analysis (S-LCI)
The social life cycle inventory analysis concerns the process in which data are
collected. In order to obtain the potential social impacts in a system boundary, a
survey was used to obtain the related information from three stakeholders: the
workers, the local communities and the consumers. Three sets of questionnaires
were employed as the instrument to obtain the related information from the three
stakeholders. The questionnaires were constructed based on a subcategory
proposed by UNEP (2009), which included five subcategories for workers, four
subcategories for the local communities and four subcategories for the
consumers.
Research instrument
The three sets of questionnaires contained 35 items for workers, 29 items for the
local communities and 24 items for the consumers. All data collected from the
questionnaire survey was analysed descriptively after which the analysed data
was used to support the expected outcomes. The questionnaires were assessed
based on validity and reliability tests before they were distributed in the actual
study. Two languages, Malay and English, were used in the questionnaires so that
the respondents could better understand and answer them. A 5-point Likert scale
was used, ranging from ‘strongly disagree’ (1 point), ‘disagree’ (2 point),
‘neutral’ (3 point), ‘agree’ (4 point) and ‘strongly disagree’ (5 point).
Validity of the questionnaire
In order to validate the content of the survey, content validity analysis was
performed to ensure that the number of items in each category is sufficient to
represent each category. Besides, consultation with experts in social studies was
carried out as well. They examined the suitability and adequacy of the questions
posed in the questionnaires. These experts were selected due to their vast
experiences (15 years’ of experience and knowledge in this particular field) and
they had personally seen, witnessed, and participated in the social impacts and
tea industry activities. The item content validity index (I-CVI) (Muhammad,
Muhamad Pauzi, & Sharaai, 2015) was evaluated by the experts to evaluate the
relevancy of each item in the questionnaire where the experts were given the
choice to tick the 4-point Likert scale (1 = not relevant, value 2 = somewhat
relevant, value 3 = relevant, and value 4 = very relevant). For each question, the
experts were required to give either the values of 3 or 4 for ‘relevant’ rating and
marked as (X), or the values of 1 or 2 for ‘irrelevant’ and marked with the dash
symbol (-). Then, the proportion of the values was calculated. Table 1 shows the
sub category and the item content validity index (I-CVI).
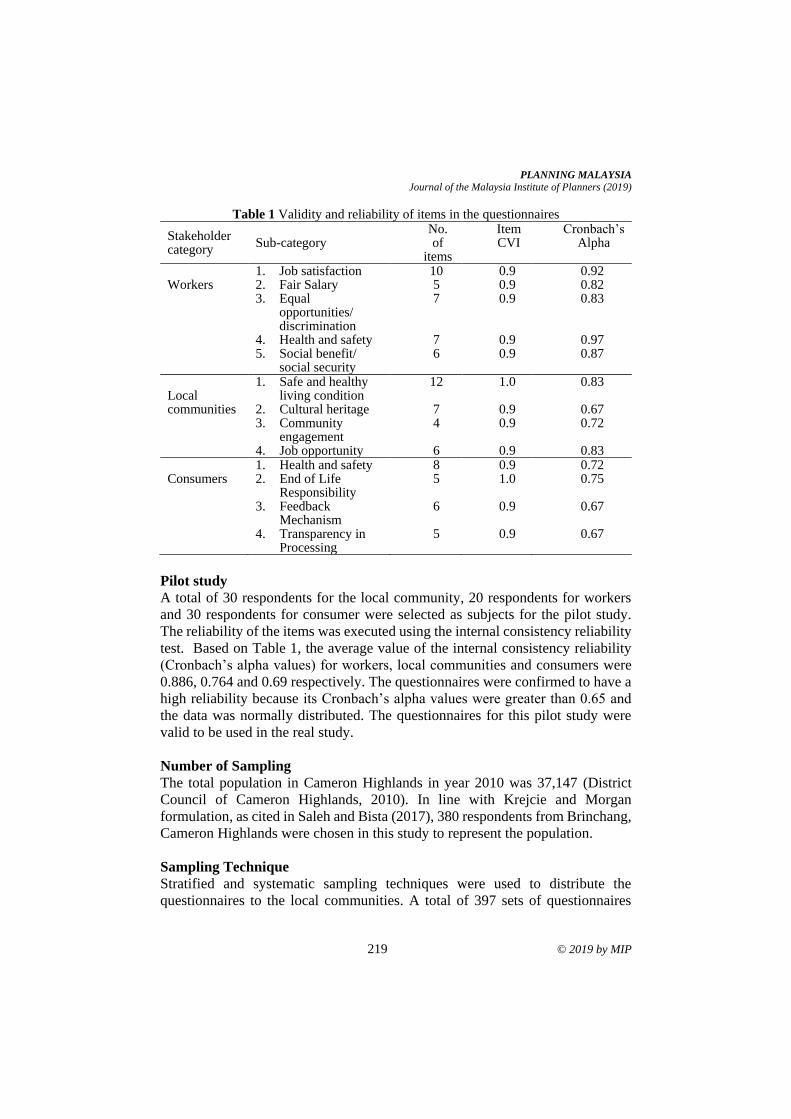
PLANNING MALAYSIA
Journal of the Malaysia Institute of Planners (2019)
219 © 2019 by MIP
Table 1 Validity and reliability of items in the questionnaires
Stakeholder category
Sub-category No. of
items
Item CVI
Cronbach’s Alpha
Workers
1. Job satisfaction 2. Fair Salary 3. Equal
opportunities/ discrimination
4. Health and safety 5. Social benefit/
social security
10 5 7
7 6
0.9 0.9 0.9
0.9 0.9
0.92 0.82 0.83
0.97 0.87
Local communities
1. Safe and healthy living condition
2. Cultural heritage 3. Community
engagement 4. Job opportunity
12
7 4
6
1.0
0.9 0.9
0.9
0.83
0.67 0.72
0.83
Consumers
1. Health and safety 2. End of Life
Responsibility 3. Feedback
Mechanism 4. Transparency in
Processing
8 5
6
5
0.9 1.0
0.9
0.9
0.72 0.75
0.67
0.67
Pilot study
A total of 30 respondents for the local community, 20 respondents for workers
and 30 respondents for consumer were selected as subjects for the pilot study.
The reliability of the items was executed using the internal consistency reliability
test. Based on Table 1, the average value of the internal consistency reliability
(Cronbach’s alpha values) for workers, local communities and consumers were
0.886, 0.764 and 0.69 respectively. The questionnaires were confirmed to have a
high reliability because its Cronbach’s alpha values were greater than 0.65 and
the data was normally distributed. The questionnaires for this pilot study were
valid to be used in the real study.
Number of Sampling
The total population in Cameron Highlands in year 2010 was 37,147 (District
Council of Cameron Highlands, 2010). In line with Krejcie and Morgan
formulation, as cited in Saleh and Bista (2017), 380 respondents from Brinchang,
Cameron Highlands were chosen in this study to represent the population.
Sampling Technique
Stratified and systematic sampling techniques were used to distribute the
questionnaires to the local communities. A total of 397 sets of questionnaires
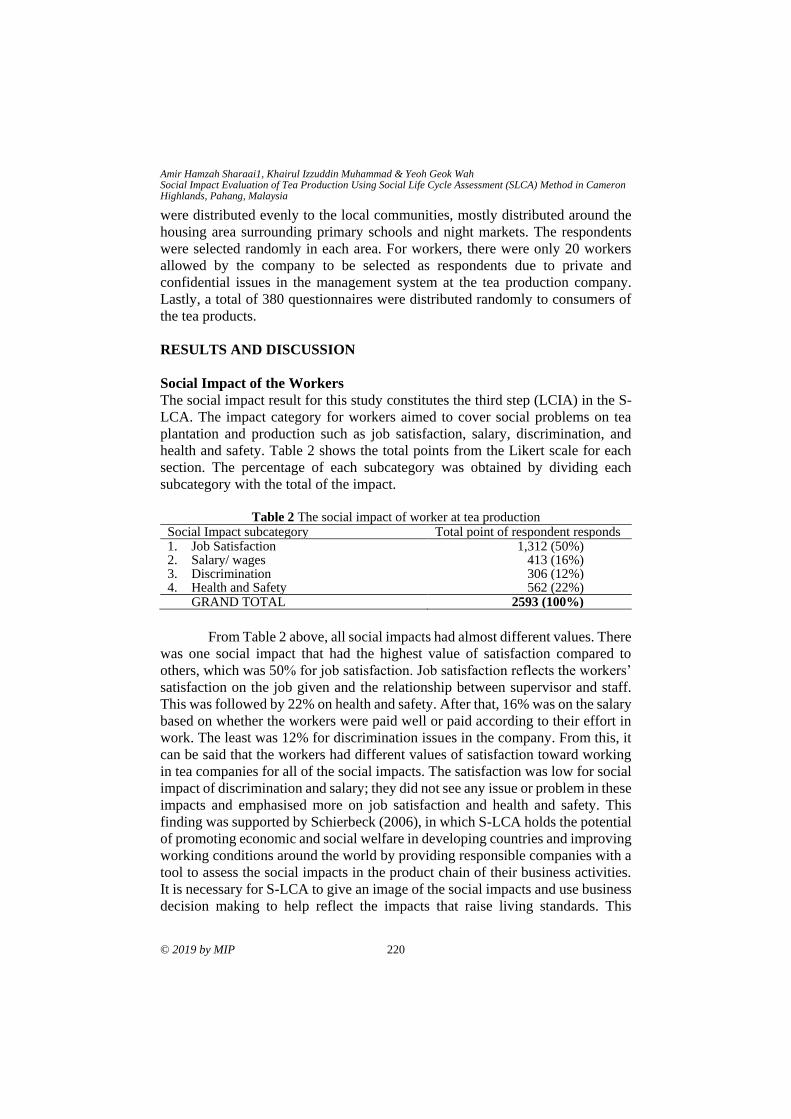
Amir Hamzah Sharaai1, Khairul Izzuddin Muhammad & Yeoh Geok Wah Social Impact Evaluation of Tea Production Using Social Life Cycle Assessment (SLCA) Method in Cameron Highlands, Pahang, Malaysia
© 2019 by MIP 220
were distributed evenly to the local communities, mostly distributed around the
housing area surrounding primary schools and night markets. The respondents
were selected randomly in each area. For workers, there were only 20 workers
allowed by the company to be selected as respondents due to private and
confidential issues in the management system at the tea production company.
Lastly, a total of 380 questionnaires were distributed randomly to consumers of
the tea products.
RESULTS AND DISCUSSION
Social Impact of the Workers
The social impact result for this study constitutes the third step (LCIA) in the S-
LCA. The impact category for workers aimed to cover social problems on tea
plantation and production such as job satisfaction, salary, discrimination, and
health and safety. Table 2 shows the total points from the Likert scale for each
section. The percentage of each subcategory was obtained by dividing each
subcategory with the total of the impact.
Table 2 The social impact of worker at tea production
Social Impact subcategory Total point of respondent responds 1. Job Satisfaction 1,312 (50%) 2. Salary/ wages 413 (16%) 3. Discrimination 306 (12%) 4. Health and Safety 562 (22%)
GRAND TOTAL 2593 (100%)
From Table 2 above, all social impacts had almost different values. There
was one social impact that had the highest value of satisfaction compared to
others, which was 50% for job satisfaction. Job satisfaction reflects the workers’
satisfaction on the job given and the relationship between supervisor and staff.
This was followed by 22% on health and safety. After that, 16% was on the salary
based on whether the workers were paid well or paid according to their effort in
work. The least was 12% for discrimination issues in the company. From this, it
can be said that the workers had different values of satisfaction toward working
in tea companies for all of the social impacts. The satisfaction was low for social
impact of discrimination and salary; they did not see any issue or problem in these
impacts and emphasised more on job satisfaction and health and safety. This
finding was supported by Schierbeck (2006), in which S-LCA holds the potential
of promoting economic and social welfare in developing countries and improving
working conditions around the world by providing responsible companies with a
tool to assess the social impacts in the product chain of their business activities.
It is necessary for S-LCA to give an image of the social impacts and use business
decision making to help reflect the impacts that raise living standards. This
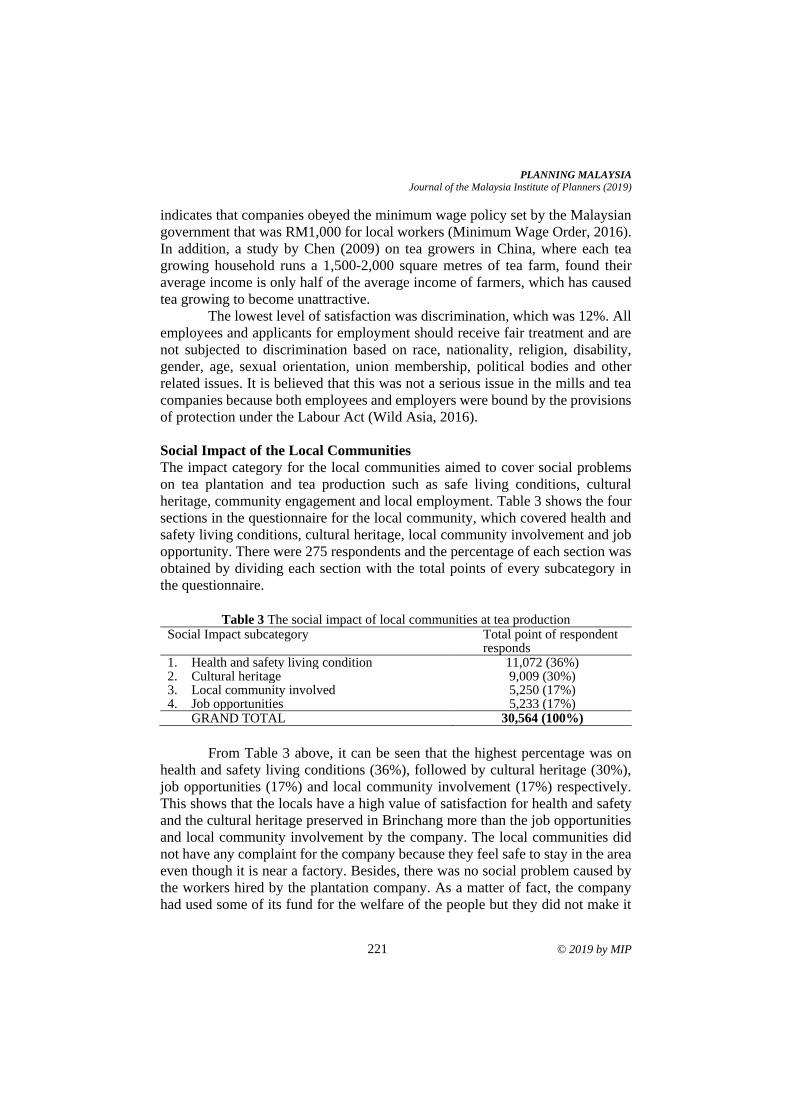
PLANNING MALAYSIA
Journal of the Malaysia Institute of Planners (2019)
221 © 2019 by MIP
indicates that companies obeyed the minimum wage policy set by the Malaysian
government that was RM1,000 for local workers (Minimum Wage Order, 2016).
In addition, a study by Chen (2009) on tea growers in China, where each tea
growing household runs a 1,500-2,000 square metres of tea farm, found their
average income is only half of the average income of farmers, which has caused
tea growing to become unattractive.
The lowest level of satisfaction was discrimination, which was 12%. All
employees and applicants for employment should receive fair treatment and are
not subjected to discrimination based on race, nationality, religion, disability,
gender, age, sexual orientation, union membership, political bodies and other
related issues. It is believed that this was not a serious issue in the mills and tea
companies because both employees and employers were bound by the provisions
of protection under the Labour Act (Wild Asia, 2016).
Social Impact of the Local Communities
The impact category for the local communities aimed to cover social problems
on tea plantation and tea production such as safe living conditions, cultural
heritage, community engagement and local employment. Table 3 shows the four
sections in the questionnaire for the local community, which covered health and
safety living conditions, cultural heritage, local community involvement and job
opportunity. There were 275 respondents and the percentage of each section was
obtained by dividing each section with the total points of every subcategory in
the questionnaire.
Table 3 The social impact of local communities at tea production
Social Impact subcategory Total point of respondent responds
1. Health and safety living condition 11,072 (36%) 2. Cultural heritage 9,009 (30%) 3. Local community involved 5,250 (17%) 4. Job opportunities 5,233 (17%)
GRAND TOTAL 30,564 (100%)
From Table 3 above, it can be seen that the highest percentage was on
health and safety living conditions (36%), followed by cultural heritage (30%),
job opportunities (17%) and local community involvement (17%) respectively.
This shows that the locals have a high value of satisfaction for health and safety
and the cultural heritage preserved in Brinchang more than the job opportunities
and local community involvement by the company. The local communities did
not have any complaint for the company because they feel safe to stay in the area
even though it is near a factory. Besides, there was no social problem caused by
the workers hired by the plantation company. As a matter of fact, the company
had used some of its fund for the welfare of the people but they did not make it
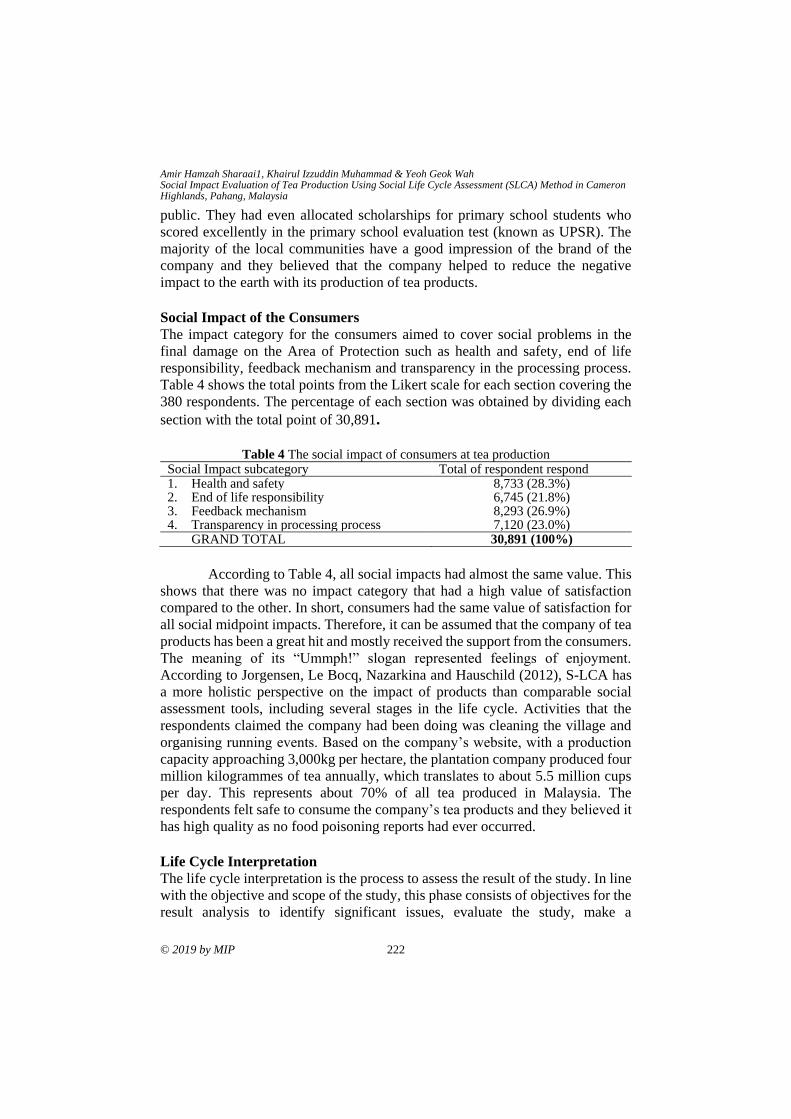
Amir Hamzah Sharaai1, Khairul Izzuddin Muhammad & Yeoh Geok Wah Social Impact Evaluation of Tea Production Using Social Life Cycle Assessment (SLCA) Method in Cameron Highlands, Pahang, Malaysia
© 2019 by MIP 222
public. They had even allocated scholarships for primary school students who
scored excellently in the primary school evaluation test (known as UPSR). The
majority of the local communities have a good impression of the brand of the
company and they believed that the company helped to reduce the negative
impact to the earth with its production of tea products.
Social Impact of the Consumers
The impact category for the consumers aimed to cover social problems in the
final damage on the Area of Protection such as health and safety, end of life
responsibility, feedback mechanism and transparency in the processing process.
Table 4 shows the total points from the Likert scale for each section covering the
380 respondents. The percentage of each section was obtained by dividing each
section with the total point of 30,891.
Table 4 The social impact of consumers at tea production
Social Impact subcategory Total of respondent respond 1. Health and safety 8,733 (28.3%) 2. End of life responsibility 6,745 (21.8%) 3. Feedback mechanism 8,293 (26.9%) 4. Transparency in processing process 7,120 (23.0%)
GRAND TOTAL 30,891 (100%)
According to Table 4, all social impacts had almost the same value. This
shows that there was no impact category that had a high value of satisfaction
compared to the other. In short, consumers had the same value of satisfaction for
all social midpoint impacts. Therefore, it can be assumed that the company of tea
products has been a great hit and mostly received the support from the consumers.
The meaning of its “Ummph!” slogan represented feelings of enjoyment.
According to Jorgensen, Le Bocq, Nazarkina and Hauschild (2012), S-LCA has
a more holistic perspective on the impact of products than comparable social
assessment tools, including several stages in the life cycle. Activities that the
respondents claimed the company had been doing was cleaning the village and
organising running events. Based on the company’s website, with a production
capacity approaching 3,000kg per hectare, the plantation company produced four
million kilogrammes of tea annually, which translates to about 5.5 million cups
per day. This represents about 70% of all tea produced in Malaysia. The
respondents felt safe to consume the company’s tea products and they believed it
has high quality as no food poisoning reports had ever occurred.
Life Cycle Interpretation
The life cycle interpretation is the process to assess the result of the study. In line
with the objective and scope of the study, this phase consists of objectives for the
result analysis to identify significant issues, evaluate the study, make a
PLANNING MALAYSIA
Journal of the Malaysia Institute of Planners (2019)
223 © 2019 by MIP
conclusion, explain the limitations of the study, and give suggestions and
recommendations (UNEP, 2009). This is a positive strength for the company as
the products are not required to be replaced or reinvented to replace the obsolete
products. The company can save cost from creating new products and spend
additional revenue to maintain the premium grade of their black tea. The market
is saturated by tea products from multiple manufacturers. Other competitors are
pushing products into the market, increasing competition and eating the
company’s market share. Since tea products have been around for a long time,
there is not much diversification that can be improvised to the product for
improvement and might lead to product stagnation.
CONCLUSION
Contrary to what most people believe, this study proved that the existence of tea
plantation and mills had led to positive impacts to the stakeholders i.e. workers
local communities and consumers. The overall social aspects derived from the S-
LCA for tea production met the required criteria in terms of social significance
for those who had direct contact with this operation. However, there are marginal
aspects such as discrimination to workers and poor local community involvement
and feedback mechanism that needs to be reviewed and improved.
In overall, this study presents an important product conducted using S-
LCA in this country. The results of this study can be interpreted and applied to
reduce social impacts and improve efficiency across every stage of the production
line. This can contribute to the long-term success of the company’s owner by
enhancing the product with the customers, retailers and staff to promote social
sustainability. By understanding the relative impacts of the various operations
over which farmers as a producer ultimately have control, it enables the company
to take targeted initiatives and investment into procurement, energy and process
efficiency measures, and production design.
The results of this study will be forwarded to relevant factories coupled
with recommendations for best manufacturing practices, which are specifically
aimed at reducing the negative social impacts of tea production. Nevertheless,
this study only focused on two life cycle phases (tea plantation and manufacturing
processing), which do not represent the whole life cycle of tea production.
Research still needs to be carried out for the rest of the phases to determine the
overall potential social impacts especially regarding the other two important
phases in tea production i.e. the distributors and consumers.
ACKNOWLEDGEMENTS
The authors wish to thank the tea plantation company and Universiti Putra
Malaysia for providing the grant (GP/2018/9592300) for this study.
Amir Hamzah Sharaai1, Khairul Izzuddin Muhammad & Yeoh Geok Wah Social Impact Evaluation of Tea Production Using Social Life Cycle Assessment (SLCA) Method in Cameron Highlands, Pahang, Malaysia
© 2019 by MIP 224
REFERENCES Amir Hamzah, S, (2016, September). Penilaian kitar hayat sosial: Analisis kesan sosial
produk. Persidangan Kebangsaan Pembangunan dan Pendidikan Lestari 2012.
September 19-20, 2012, Pulau Pinang, Malaysia.
Chen, W. (2009). From tea garden to cup: China’s tea sustainability report. (n.p.): Social
Resources Institute, China.
District Council of Cameron Highlands (2010). Available at
http://www.mdcameron.gov.my/en.
Food and Agriculture Organization of the United Nations (2016). Available at
http://www.fao.org/publications/sofa/2016/en/.
International Organization Standardisation (2006). Environmental management – Life
Cycle Assessment – Requirements and guidelines. Geneva: Author.
Jørgensen, A., Le Bocq, A., Nazarkina, L., & Hauschild, M. (2008). Methodologies for
social life cycle assessment. The International Journal of Life Cycle Assessment,
13(2), 96-103.
Muhammad, K. I., Muhamad Pauzi, M. F., & Sharaai, A. H. (2015). Social Life Cycle
Assessment (SLCA) for palm oil production in Malaysia. Advances in
Environmental Biology, 9(23), 89-94.
Muhammad, K. I., Sharaai, A. H., Ismail, M. H., Harun, R., & Wong, S. Y. (2019). Social
implications of palm oil production through social life cycle perspectives in
Johor, Malaysia. The International Journal of Life Cycle Assessment, 24(5), 935-
944.
Saleh, A., & Bista, K. (2017). Examining factors impacting online survey response rates
in educational research: Perceptions of graduate students. Journal of
MultiDisciplinary Evaluation, 13(29), 63-74.
Schierbeck, J. (2006). A framework for social life cycle impact assessment. The
International Journal of Life Cycle Assessment, 11(2), 88-97.
UNEP (2009). Guidelines for social life cycle assessment of product. Paris: United
Nations Environment Programme.
Wild Asia (2016). Verification assessment of social management and practices - Felda
Global Ventures Plantations (Malaysia) Sdn Bhd. Retrieved from
http://www.feldaglobal.com/wp-content/uploads/2016/10/FGV-Group-Review-
and-Field-Report_04032016.pdf.
Received: 12th January 2019. Accepted: 2nd August 2019
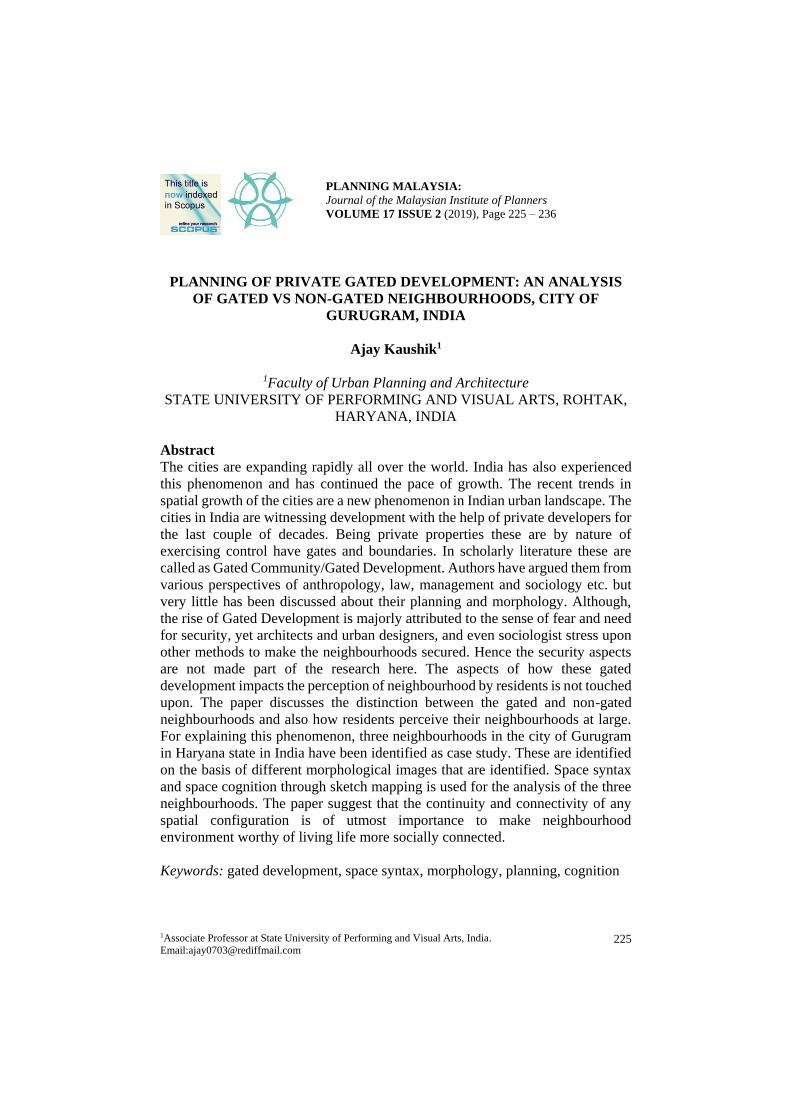
1Associate Professor at State University of Performing and Visual Arts, India.
Email:[email protected] 225
PLANNING MALAYSIA:
Journal of the Malaysian Institute of Planners
VOLUME 17 ISSUE 2 (2019), Page 225 – 236
PLANNING OF PRIVATE GATED DEVELOPMENT: AN ANALYSIS
OF GATED VS NON-GATED NEIGHBOURHOODS, CITY OF
GURUGRAM, INDIA
Ajay Kaushik1
1Faculty of Urban Planning and Architecture
STATE UNIVERSITY OF PERFORMING AND VISUAL ARTS, ROHTAK,
HARYANA, INDIA
Abstract
The cities are expanding rapidly all over the world. India has also experienced
this phenomenon and has continued the pace of growth. The recent trends in
spatial growth of the cities are a new phenomenon in Indian urban landscape. The
cities in India are witnessing development with the help of private developers for
the last couple of decades. Being private properties these are by nature of
exercising control have gates and boundaries. In scholarly literature these are
called as Gated Community/Gated Development. Authors have argued them from
various perspectives of anthropology, law, management and sociology etc. but
very little has been discussed about their planning and morphology. Although,
the rise of Gated Development is majorly attributed to the sense of fear and need
for security, yet architects and urban designers, and even sociologist stress upon
other methods to make the neighbourhoods secured. Hence the security aspects
are not made part of the research here. The aspects of how these gated
development impacts the perception of neighbourhood by residents is not touched
upon. The paper discusses the distinction between the gated and non-gated
neighbourhoods and also how residents perceive their neighbourhoods at large.
For explaining this phenomenon, three neighbourhoods in the city of Gurugram
in Haryana state in India have been identified as case study. These are identified
on the basis of different morphological images that are identified. Space syntax
and space cognition through sketch mapping is used for the analysis of the three
neighbourhoods. The paper suggest that the continuity and connectivity of any
spatial configuration is of utmost importance to make neighbourhood
environment worthy of living life more socially connected.
Keywords: gated development, space syntax, morphology, planning, cognition
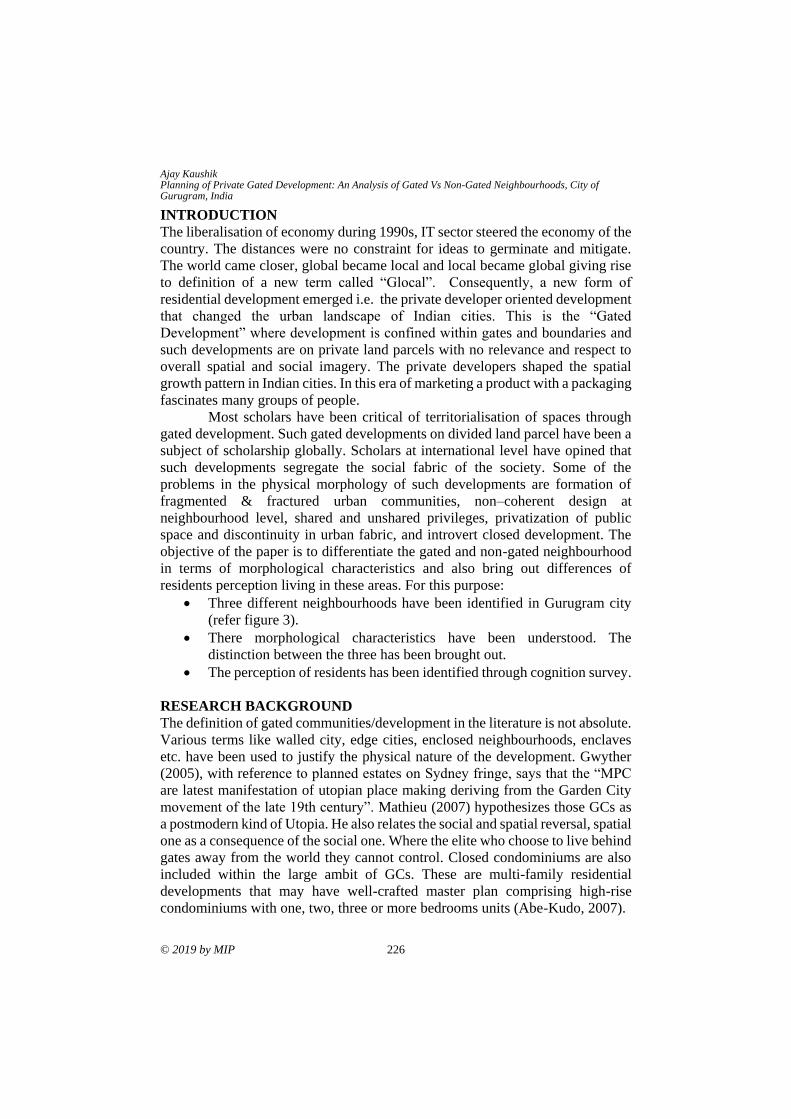
Ajay Kaushik Planning of Private Gated Development: An Analysis of Gated Vs Non-Gated Neighbourhoods, City of Gurugram, India
© 2019 by MIP 226
INTRODUCTION
The liberalisation of economy during 1990s, IT sector steered the economy of the
country. The distances were no constraint for ideas to germinate and mitigate.
The world came closer, global became local and local became global giving rise
to definition of a new term called “Glocal”. Consequently, a new form of
residential development emerged i.e. the private developer oriented development
that changed the urban landscape of Indian cities. This is the “Gated
Development” where development is confined within gates and boundaries and
such developments are on private land parcels with no relevance and respect to
overall spatial and social imagery. The private developers shaped the spatial
growth pattern in Indian cities. In this era of marketing a product with a packaging
fascinates many groups of people.
Most scholars have been critical of territorialisation of spaces through
gated development. Such gated developments on divided land parcel have been a
subject of scholarship globally. Scholars at international level have opined that
such developments segregate the social fabric of the society. Some of the
problems in the physical morphology of such developments are formation of
fragmented & fractured urban communities, non–coherent design at
neighbourhood level, shared and unshared privileges, privatization of public
space and discontinuity in urban fabric, and introvert closed development. The
objective of the paper is to differentiate the gated and non-gated neighbourhood
in terms of morphological characteristics and also bring out differences of
residents perception living in these areas. For this purpose:
• Three different neighbourhoods have been identified in Gurugram city
(refer figure 3).
• There morphological characteristics have been understood. The
distinction between the three has been brought out.
• The perception of residents has been identified through cognition survey.
RESEARCH BACKGROUND
The definition of gated communities/development in the literature is not absolute.
Various terms like walled city, edge cities, enclosed neighbourhoods, enclaves
etc. have been used to justify the physical nature of the development. Gwyther
(2005), with reference to planned estates on Sydney fringe, says that the “MPC
are latest manifestation of utopian place making deriving from the Garden City
movement of the late 19th century”. Mathieu (2007) hypothesizes those GCs as
a postmodern kind of Utopia. He also relates the social and spatial reversal, spatial
one as a consequence of the social one. Where the elite who choose to live behind
gates away from the world they cannot control. Closed condominiums are also
included within the large ambit of GCs. These are multi-family residential
developments that may have well-crafted master plan comprising high-rise
condominiums with one, two, three or more bedrooms units (Abe-Kudo, 2007).
PLANNING MALAYSIA
Journal of the Malaysia Institute of Planners (2019)
227 © 2019 by MIP
This paper is on discontinuity in urban fabric and its impact on human
perception. Usually the private developers develop a piece of land with
boundaries and well-designed gate at the entrance to attract the prospective
customers. On the other hand, gating of a neighbourhood is also a phenomenon
in which and any neighbourhood is compounded with gated and boundaries.
These gates/boundaries are not part of initial planning of the neighbourhood.
These gates/boundaries are erected by the residents’ welfare organisation of the
neighbourhood to maintain security of the area.
CONTEXT
The private developers now have a major role in shaping the spatial growth of
Indian cities. In fact this is now a major trend across all countries of the world.
India adopted new housing policy known as ‘National Urban Housing and Habitat
Policy, 2007’ that emphasized on the role of private sector for meeting the deficit
in housing. In Haryana (one of the state of India), during the last decade there has
been a spurt in private residential development across the state, especially in
Gurugram (a district). The kind of residential developments that are taking place
in India and in the state of Haryana is similar in other countries. The master plan
document enumerates the physical planning norms for a city, but it does not
foresee the implication of the resultant spatial development after its
implementation. Such developments are very intensive in city of Gurugram.
Gurugram, Haryana
Haryana was part of the composite Punjab state till 1966. This region has
witnessed tremendous economic progress over the last 30 years due to the Green
Revolution. Haryana has been spearheading the growth trends in the country and
is one of the states with high growth rate. According to census 2011 the total
population of Haryana was 2,53,53,081 (Government of India, 2011). Physically
it is one of the smallest states in India with an area of 44,212 square kilometres.
But the state’s GDP growth rate and per-capita income is amongst the highest in
the country. State of Haryana encircles the National Capital Delhi on three sides
and Uttar Pradesh on one side. Gurugram falls under National Capital Region.
On its north, it is bounded by the Jhajjar District of the state & the union territory
of Delhi; Faridabad District lies to its east. On south it shares boundaries with
Mewat whereas Rewari lies in its west. It is also known as Gurgaon/Gurugram
(Biswas, 2002). It is renamed by the present political dispensation as Gurugram
in September 2016.
Private Developers & the Process of Urban Development in Gurugram
The key element in Gurugram’s explosive growth was the state of Haryana’s
lifting of restrictions on the land-acquisition process. The lifting of restrictions
and Gurugram’s natural advantage in being close to Delhi allowed private
Ajay Kaushik Planning of Private Gated Development: An Analysis of Gated Vs Non-Gated Neighbourhoods, City of Gurugram, India
© 2019 by MIP 228
developers to build residences, office parks, and manufacturing facilities that met
the demand of India’s booming high-tech sectors during the high-growth period
that followed liberalisation of key sectors in the early 1990s.
Today the city of Gurugram is classified as region of hyper potential. The
recent master plan of Gurugram has a projected population of 42.50 lacs and with
an area of 16021 acres for residential development out of total of 32988 acres of
developed land (Government of Haryana, 2012). Gurugram is significant from
the gated development point of view because 69% of gated group housings in the
state are located in Gurugram region.
With reference to Gurugram, the new sectors that are being developed
show a quite different character in terms of private vs public space. As a matter
of policy the land is acquired by developers from the land owners and after getting
the license to develop a colony or a group housing, developers are able to sell the
residential unit in terms of plots of flats. The basic nature of private development
gives them the inherent character of gated and guarded residential complex.
Case Study Areas
Gating is a morphological outcome of city neighbourhood. The city of Gurugram,
which has been gradually developed with the help of master plan over a period of
time, and has different planning and development strategies that have manifested
in its urban development in the form of gating. The sectors are, as mentioned
earlier, the neighbourhood units planned by Haryana Urban Development
Authority, HUDA. The morphological resemblance of earlier sectors can be
traced from the planning of sectors of Chandigarh. The city of Chandigarh has
been planned with sector as the basis planning unit. It is the primary module of
city’s design, a neighbourhood unit of size 800 meters x 1200 meters. It is a self-
sufficient unit having shops, school, health centres and places of recreations and
worship. The population of a sector varies between 3000 and 20000 depending
upon the sizes of plots and the topography of the area. Henceforth, for
neighbourhood unit the term ‘sector’ shall be used.
PLANNING MALAYSIA
Journal of the Malaysia Institute of Planners (2019)
229 © 2019 by MIP
Figure 1 Graphical plan of Sectors 4, 56, 49 respectively on comparative scale
Source: Author
Sector 4 This is one of the earliest developed sectors of the city. The same was developed
during 1975-1978 (Mehtani, 2012). This residential sector comprises plotted
development with plot sizes that range from 150 square meters to 500 square
meters. Sector development is a typical prototype of orthogonal street network
system as can be seen in figure 6. A typical housing is as seen in Figure 1.
Sector 56
This sector was developed during the year 2000 (Mehtani, 2012) The residential
sector comprises plotted development by HUDA and 83 group housings on plots
ranging from half acre to over 15 acres. The gated group housing is spread all
over and majority of them located on northern part of the sector.
Sector 49
This sector comprises mixed development and was developed between the year
1995-2000. The sector is a development initiative of private developers. Since it
is developed by private developers all the respective development is gated and
guarded.
METHODOLOGY
To analyse the morphology of the three distinct sectors developed at different
point of time with different policy background following methodology is
adopted.
Application of Space Syntax in Spatial Cognition
Space syntax is based on the fact that an urban environment is an interconnected
space where everywhere links to everywhere else. The space syntax approach
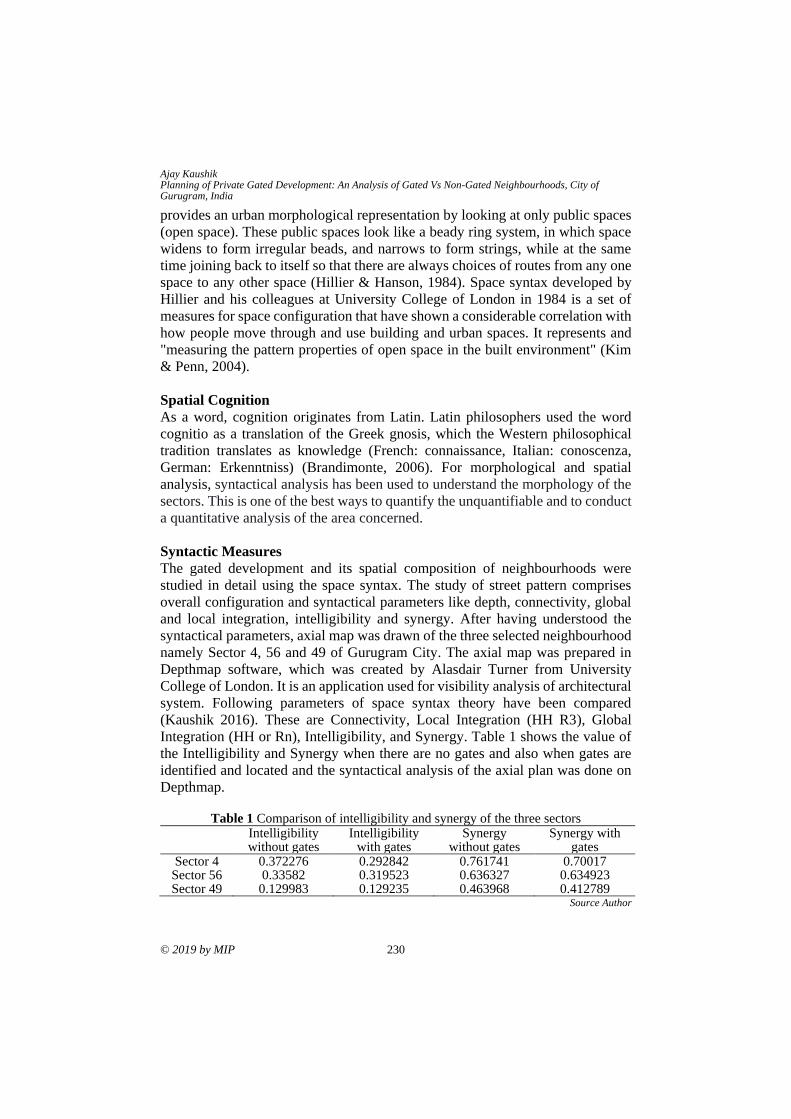
Ajay Kaushik Planning of Private Gated Development: An Analysis of Gated Vs Non-Gated Neighbourhoods, City of Gurugram, India
© 2019 by MIP 230
provides an urban morphological representation by looking at only public spaces
(open space). These public spaces look like a beady ring system, in which space
widens to form irregular beads, and narrows to form strings, while at the same
time joining back to itself so that there are always choices of routes from any one
space to any other space (Hillier & Hanson, 1984). Space syntax developed by
Hillier and his colleagues at University College of London in 1984 is a set of
measures for space configuration that have shown a considerable correlation with
how people move through and use building and urban spaces. It represents and
"measuring the pattern properties of open space in the built environment" (Kim
& Penn, 2004).
Spatial Cognition
As a word, cognition originates from Latin. Latin philosophers used the word
cognitio as a translation of the Greek gnosis, which the Western philosophical
tradition translates as knowledge (French: connaissance, Italian: conoscenza,
German: Erkenntniss) (Brandimonte, 2006). For morphological and spatial
analysis, syntactical analysis has been used to understand the morphology of the
sectors. This is one of the best ways to quantify the unquantifiable and to conduct
a quantitative analysis of the area concerned.
Syntactic Measures
The gated development and its spatial composition of neighbourhoods were
studied in detail using the space syntax. The study of street pattern comprises
overall configuration and syntactical parameters like depth, connectivity, global
and local integration, intelligibility and synergy. After having understood the
syntactical parameters, axial map was drawn of the three selected neighbourhood
namely Sector 4, 56 and 49 of Gurugram City. The axial map was prepared in
Depthmap software, which was created by Alasdair Turner from University
College of London. It is an application used for visibility analysis of architectural
system. Following parameters of space syntax theory have been compared
(Kaushik 2016). These are Connectivity, Local Integration (HH R3), Global
Integration (HH or Rn), Intelligibility, and Synergy. Table 1 shows the value of
the Intelligibility and Synergy when there are no gates and also when gates are
identified and located and the syntactical analysis of the axial plan was done on
Depthmap.
Table 1 Comparison of intelligibility and synergy of the three sectors
Intelligibility without gates
Intelligibility with gates
Synergy without gates
Synergy with gates
Sector 4 0.372276 0.292842 0.761741 0.70017 Sector 56 0.33582 0.319523 0.636327 0.634923 Sector 49 0.129983 0.129235 0.463968 0.412789
Source Author
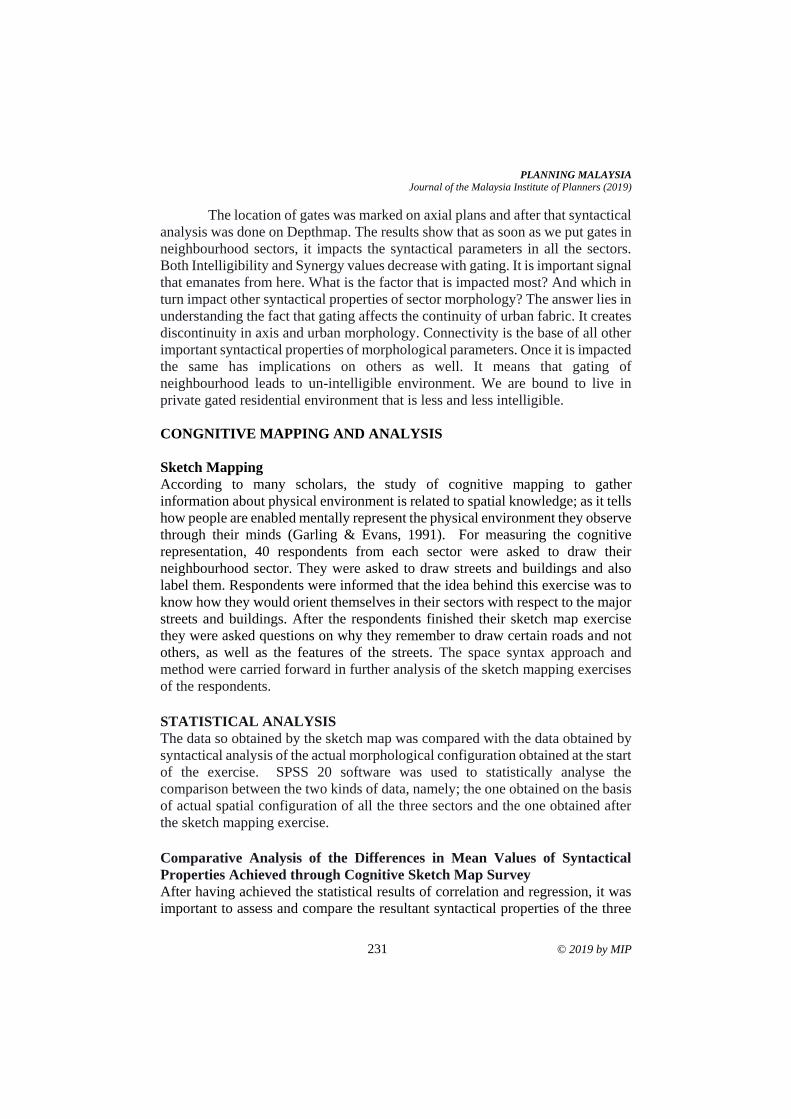
PLANNING MALAYSIA
Journal of the Malaysia Institute of Planners (2019)
231 © 2019 by MIP
The location of gates was marked on axial plans and after that syntactical
analysis was done on Depthmap. The results show that as soon as we put gates in
neighbourhood sectors, it impacts the syntactical parameters in all the sectors.
Both Intelligibility and Synergy values decrease with gating. It is important signal
that emanates from here. What is the factor that is impacted most? And which in
turn impact other syntactical properties of sector morphology? The answer lies in
understanding the fact that gating affects the continuity of urban fabric. It creates
discontinuity in axis and urban morphology. Connectivity is the base of all other
important syntactical properties of morphological parameters. Once it is impacted
the same has implications on others as well. It means that gating of
neighbourhood leads to un-intelligible environment. We are bound to live in
private gated residential environment that is less and less intelligible.
CONGNITIVE MAPPING AND ANALYSIS
Sketch Mapping
According to many scholars, the study of cognitive mapping to gather
information about physical environment is related to spatial knowledge; as it tells
how people are enabled mentally represent the physical environment they observe
through their minds (Garling & Evans, 1991). For measuring the cognitive
representation, 40 respondents from each sector were asked to draw their
neighbourhood sector. They were asked to draw streets and buildings and also
label them. Respondents were informed that the idea behind this exercise was to
know how they would orient themselves in their sectors with respect to the major
streets and buildings. After the respondents finished their sketch map exercise
they were asked questions on why they remember to draw certain roads and not
others, as well as the features of the streets. The space syntax approach and
method were carried forward in further analysis of the sketch mapping exercises
of the respondents.
STATISTICAL ANALYSIS
The data so obtained by the sketch map was compared with the data obtained by
syntactical analysis of the actual morphological configuration obtained at the start
of the exercise. SPSS 20 software was used to statistically analyse the
comparison between the two kinds of data, namely; the one obtained on the basis
of actual spatial configuration of all the three sectors and the one obtained after
the sketch mapping exercise.
Comparative Analysis of the Differences in Mean Values of Syntactical
Properties Achieved through Cognitive Sketch Map Survey
After having achieved the statistical results of correlation and regression, it was
important to assess and compare the resultant syntactical properties of the three
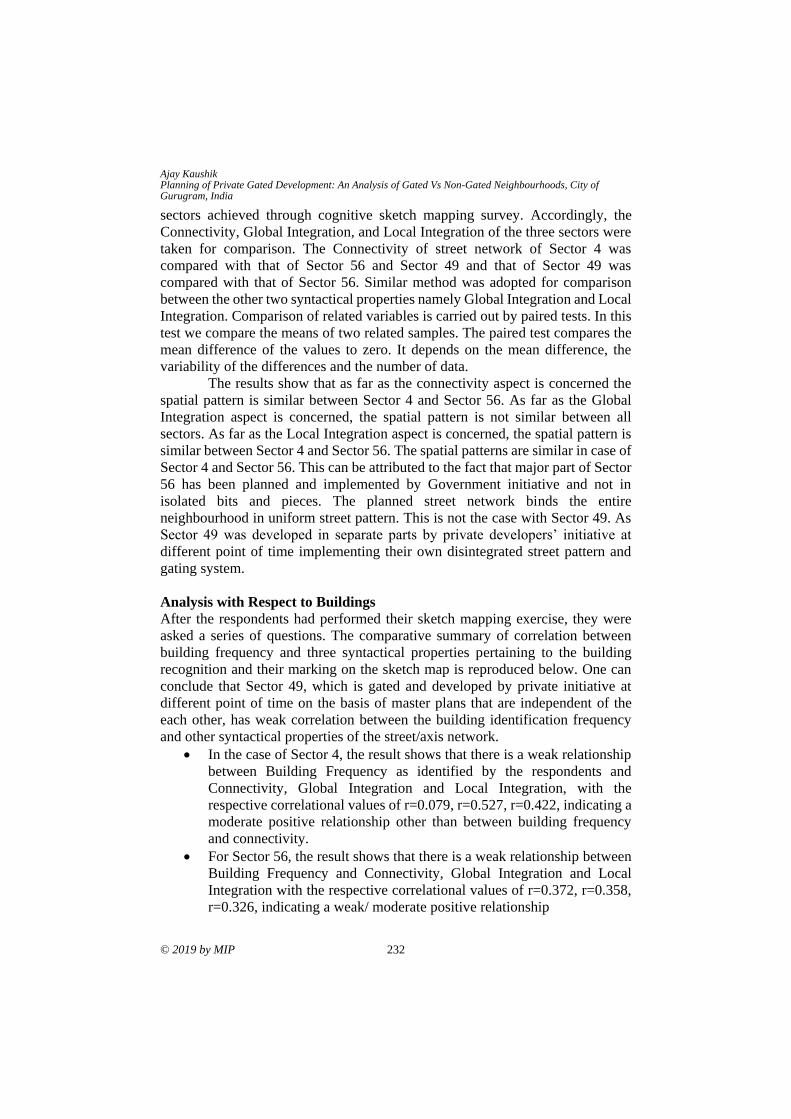
Ajay Kaushik Planning of Private Gated Development: An Analysis of Gated Vs Non-Gated Neighbourhoods, City of Gurugram, India
© 2019 by MIP 232
sectors achieved through cognitive sketch mapping survey. Accordingly, the
Connectivity, Global Integration, and Local Integration of the three sectors were
taken for comparison. The Connectivity of street network of Sector 4 was
compared with that of Sector 56 and Sector 49 and that of Sector 49 was
compared with that of Sector 56. Similar method was adopted for comparison
between the other two syntactical properties namely Global Integration and Local
Integration. Comparison of related variables is carried out by paired tests. In this
test we compare the means of two related samples. The paired test compares the
mean difference of the values to zero. It depends on the mean difference, the
variability of the differences and the number of data.
The results show that as far as the connectivity aspect is concerned the
spatial pattern is similar between Sector 4 and Sector 56. As far as the Global
Integration aspect is concerned, the spatial pattern is not similar between all
sectors. As far as the Local Integration aspect is concerned, the spatial pattern is
similar between Sector 4 and Sector 56. The spatial patterns are similar in case of
Sector 4 and Sector 56. This can be attributed to the fact that major part of Sector
56 has been planned and implemented by Government initiative and not in
isolated bits and pieces. The planned street network binds the entire
neighbourhood in uniform street pattern. This is not the case with Sector 49. As
Sector 49 was developed in separate parts by private developers’ initiative at
different point of time implementing their own disintegrated street pattern and
gating system.
Analysis with Respect to Buildings
After the respondents had performed their sketch mapping exercise, they were
asked a series of questions. The comparative summary of correlation between
building frequency and three syntactical properties pertaining to the building
recognition and their marking on the sketch map is reproduced below. One can
conclude that Sector 49, which is gated and developed by private initiative at
different point of time on the basis of master plans that are independent of the
each other, has weak correlation between the building identification frequency
and other syntactical properties of the street/axis network.
• In the case of Sector 4, the result shows that there is a weak relationship
between Building Frequency as identified by the respondents and
Connectivity, Global Integration and Local Integration, with the
respective correlational values of r=0.079, r=0.527, r=0.422, indicating a
moderate positive relationship other than between building frequency
and connectivity.
• For Sector 56, the result shows that there is a weak relationship between
Building Frequency and Connectivity, Global Integration and Local
Integration with the respective correlational values of r=0.372, r=0.358,
r=0.326, indicating a weak/ moderate positive relationship
PLANNING MALAYSIA
Journal of the Malaysia Institute of Planners (2019)
233 © 2019 by MIP
• In the case of Sector 49, the result shows that there is an extremely weak
relationship between Building Frequency and Connectivity, Global
Integration and Local Integration, with the respective correlational values
of r=0.178, r=0.054, r=0.125, indicating a very weak positive
relationship.
On the whole there is a trend of weak correlation between Building
Frequency and Connectivity. Whereas the correlation between Global Integration
and Building Frequency is higher in the three sectors. Higher Global Integration
or we can say the higher global accessibility results in higher building frequency.
The Local Integration and Connectivity follow a decreasing trend with
the decrease in the frequency of the buildings as identified in the case of Sector 4
and 56. However this association is not found in the case of Sector 49.
Analysis with Respect to Axis/Streets
In the cognitive survey, the respondents were asked to draw the streets/axis that
they remember. It was found that the length and the width of axis have strong
correlation with the axis frequency, meaning that more respondents remember
longer and wider axis. The relation between the axis frequency and the
Connectivity and Global Integration and Local Integration is strong in the case of
Sector 4. This is attributed to the fact that Sector 4 layout was planned and
executed by Government in totality and not in fragmented manner as in the case
of Sector 49. Sector 49 has the fragmented layout of the streets executed by
different developers at different point of time. These layouts are gated and are
inaccessible to non-residents of that development.
CONCLUSION
Several points can be highlighted from the findings of the study. Firstly, the
characteristics of gated and non-gated developments in the context of Gurugram
City were identified using non-syntactical and syntactical methods of analysis.
The main purpose was however to diagnose and differentiate between both types
of development through cognition studies. The spatial configurations of both
types of developments were compared with what was obtained through spatial
cognitive analysis. The conclusion drawn towards the fact that our built
environment is becoming un-intelligible neighbourhoods and are gated and non-
porous.
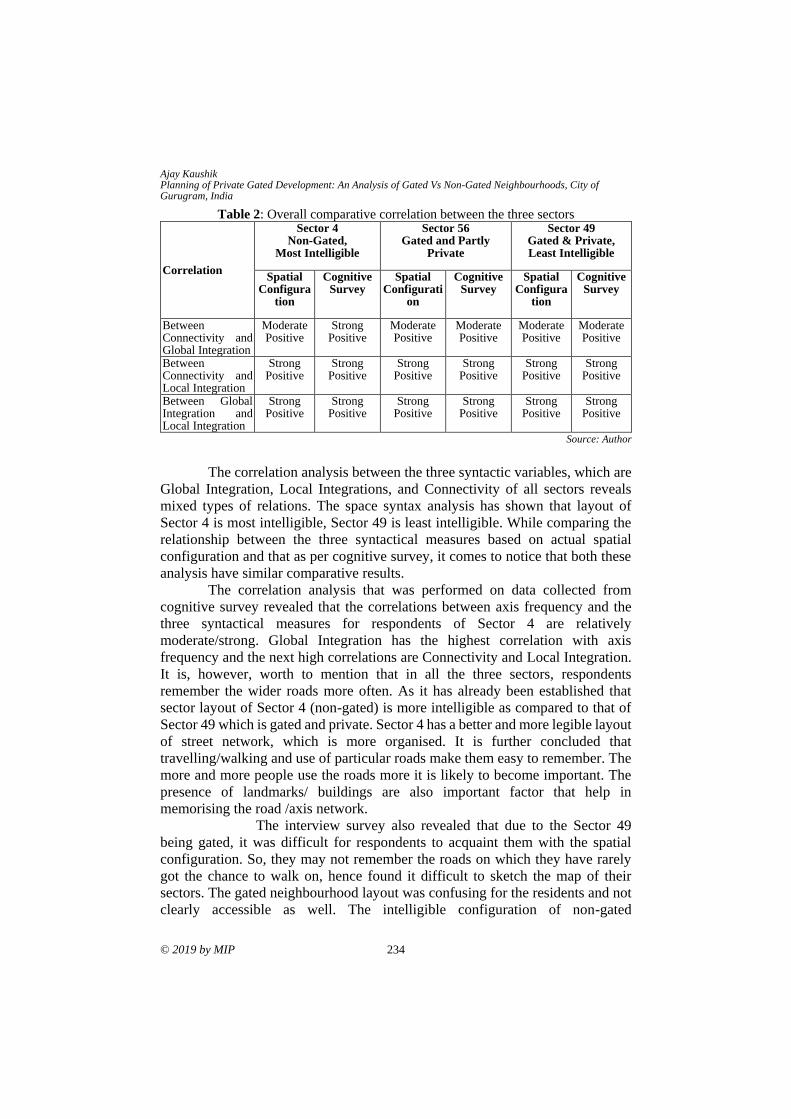
Ajay Kaushik Planning of Private Gated Development: An Analysis of Gated Vs Non-Gated Neighbourhoods, City of Gurugram, India
© 2019 by MIP 234
Table 2: Overall comparative correlation between the three sectors
Correlation
Sector 4 Non-Gated,
Most Intelligible
Sector 56 Gated and Partly
Private
Sector 49 Gated & Private, Least Intelligible
Spatial Configura
tion
Cognitive Survey
Spatial Configurati
on
Cognitive Survey
Spatial Configura
tion
Cognitive Survey
Between Connectivity and Global Integration
Moderate Positive
Strong Positive
Moderate Positive
Moderate Positive
Moderate Positive
Moderate Positive
Between Connectivity and Local Integration
Strong Positive
Strong Positive
Strong Positive
Strong Positive
Strong Positive
Strong Positive
Between Global Integration and Local Integration
Strong Positive
Strong Positive
Strong Positive
Strong Positive
Strong Positive
Strong Positive
Source: Author
The correlation analysis between the three syntactic variables, which are
Global Integration, Local Integrations, and Connectivity of all sectors reveals
mixed types of relations. The space syntax analysis has shown that layout of
Sector 4 is most intelligible, Sector 49 is least intelligible. While comparing the
relationship between the three syntactical measures based on actual spatial
configuration and that as per cognitive survey, it comes to notice that both these
analysis have similar comparative results.
The correlation analysis that was performed on data collected from
cognitive survey revealed that the correlations between axis frequency and the
three syntactical measures for respondents of Sector 4 are relatively
moderate/strong. Global Integration has the highest correlation with axis
frequency and the next high correlations are Connectivity and Local Integration.
It is, however, worth to mention that in all the three sectors, respondents
remember the wider roads more often. As it has already been established that
sector layout of Sector 4 (non-gated) is more intelligible as compared to that of
Sector 49 which is gated and private. Sector 4 has a better and more legible layout
of street network, which is more organised. It is further concluded that
travelling/walking and use of particular roads make them easy to remember. The
more and more people use the roads more it is likely to become important. The
presence of landmarks/ buildings are also important factor that help in
memorising the road /axis network.
The interview survey also revealed that due to the Sector 49
being gated, it was difficult for respondents to acquaint them with the spatial
configuration. So, they may not remember the roads on which they have rarely
got the chance to walk on, hence found it difficult to sketch the map of their
sectors. The gated neighbourhood layout was confusing for the residents and not
clearly accessible as well. The intelligible configuration of non-gated
PLANNING MALAYSIA
Journal of the Malaysia Institute of Planners (2019)
235 © 2019 by MIP
neighbourhood has resulted in relatively more accurate axis recognition during
cognitive survey. Even the buildings in the more intelligible sectors were
recognised and remembered more often as compared to those in the unintelligible
sector i.e gated one.
While finding out how much different the sectors’ morphological
configuration is felt by the respondents as compared to the actual spatial analysis
using space syntax, it was found that in all the three sectors the regression analysis
results are similar. With Connectivity as the predictor, it was found that it
influences the Global Integration and Local Integration, it means that the
connectivity in any spatial system influences the other syntactical properties of
any spatial layout. Since the connectivity of gated development is poor hence the
Global Integration and Local Integration values also decrease in such cases.
Finally, the above discussion put forward that in contemporary world when we
are moving towards more and more of gated development through the
participation of private sector as we are leading towards more un-intelligible
neighbourhood environment. The environment has least proximity and access to
common citizen. This way we are moving towards a city image that is constituted
of private and caged environment. There is a need to look into such practices.
ACKNOWLEDGMENTS
This paper is a part of ongoing research at Deenbandhu Chhotu Ram University
of Science and Technology, Murthal, Sonepat, Haryana. I am indebted to my
supervisor Dr. Jyoti Pandey Sharma for her timely advice and encouragement.
REFERENCES Biswas, S. (2002). Gurgaon Mega Corporate Park. Architecture + Design, Nov- Dec
2002, 68-73.
Brandimonte, M. A., Bruno, N., & Collina, S. (2006). Cognition. In P. Pawlik & G.
d’Ydewalle (Eds.), Psychological concepts: An international historical
perspective (pp 1-22). Hove, UK: Psychology Press.
Government of India (2011). Census of India, New Delhi: Office of the Registrar
General and Census Commissioner. Retrieved from http://censusindia.gov.in/
Garling, T., & Evans, G. W. (1991). Environment, cognition and action – An integrated
approach. New York: Oxford University Press.
Government of Haryana (2012). Gurgaon Manesar Urban Complex - GMUC 2031.
Haryana: Town and Country Planning Department. Retrieved from
https://tcpharyana.gov.in/
Development_Plan/ColouredCopy/GMUC_DDP_2031.pdf
Gwyther, G. (2005). Paradise planned: Community formation and the master planned
estate. Urban Policy and Research, 23(1), 57-72.
Hillier, B & Hanson, J. (1984). The social logic of space. Cambridge: Cambridge
University Press, UK.
Abe-Kudo, J. (2007). Vertical gated communities in Tokyo. Proceeding of 4th Int. Conf.
Res. Netw. Priv. Urban Gov. Gated Communities (pp 1-7).

Ajay Kaushik Planning of Private Gated Development: An Analysis of Gated Vs Non-Gated Neighbourhoods, City of Gurugram, India
© 2019 by MIP 236
Kaushik, A. (2016). Space syntax- A tool for smart and analytical investigation into urban
settings. Journal of the Indian Institute of Architects, 81(11), 23-28.
Kim, Y. O. & Penn, A. (2004), Linking the spatial syntax of cognitive maps to the spatial
syntax of the environment. Environment and Behavior-B, 36 (4), 483-504.
Mathieu, P. (2016). Gated community as a postmodern utopia. Proceedings of 4th Int.
Conf. Res. Netw. Priv. Urban Gov. Gated Communities (pp 1-20).
Mehtani. P. C. (2012). Growth, developmen1t and sustainability of cities: A case study
of Gurgaon (Doctoral Dissertation). University of Delhi, India
Received: 3rd March 2019. Accepted: 19th August 2019.
1Assistant Professor at RMUTR, Bangkok Thailand. Email: [email protected] 237
PLANNING MALAYSIA:
Journal of the Malaysian Institute of Planners
VOLUME 17 ISSUE 2 (2019), Page 237 – 248
GLOBAL ENVIRONMENTAL KUZNET CURVE FACTS AND
CHALLENGES FOR THAILAND ON EMISSION REDUCTION PLAN
Chantamon Potipituk1
1Faculty of Architecture and Design
RAJAMANGALA UNIVERSITY OF TECHNOLOGY RATTANAKOSIN
THAILAND
ABSTRACT
The correlation between country’s gross domestic product and environment as
reflected by carbon dioxide (CO2) emission, also known as environmental Kuznet
Curve (KC), shows a clear indication on the country’s economic development
and environmental protection status. In many aspects, economic growth and
environment are not always going on a hand-in-hand mode. The most obvious
example is seen in the use of natural resources to promote country’s economic
development, which is stand-off one another. However, environmental Kuznet
Curve has shown a fact that environmental protection can be in parallel with the
economic development given that country’s economics does not largely depend
on natural resources. We juxtapose the cross country data on gross domestic
product (GDP) and CO2 emission from many offline and online documents. This
paper explores the current facts of global environmental KC and corresponding
possible consequences on Bangkok Metropolitan Emission reduction plan and
implementation, towards environmentally sustainable development in Bangkok
Metropolitan. By examining the global KC, three levels of development of the
individual country have been identified in terms of per capita GDP and CO2
emission. It shows that most Southeast Asian countries are at initial stage of KC-
based development.
Keywords: Kuznet Curve, sustainable development, emission, planning system
Chantamon Potipituk
Global Environmental Kuznet Curve Facts and Challenges for Thailand on Emission Reduction Plan
© 2019 by MIP 238
INTRODUCTION
A new paradigm in sustainable development has been released as Griggs (2013)
defined the sustainable development in the Anthropocene which is “Development
that meets the needs of the present while safeguarding Earth’s life-support
system, on which the welfare of current and future generations depends”. This
paradigm seems very much people centrist. Traditionally, sustainable
development embraces three aspects of environment, economics and social
(Pearce, Barbier, & Markandya, 2013; Weaver, Jansen, Van Grootveld, Van
Spiegel, & Vergragt, 2017). Thus, within the sustainable development concept,
the environment and economic development are expected to go in parallel.
However, in fact, environment and development are two words that do not always
go hand-in-hand in same direction (Sachs, 2015; Midlarsky, 2018). In most cases,
these two entities go in diametrically opposite pathway (Smil, 2016). From the
view point of human development, the relationship between environment and
development is a sort of love-hate correlation. Development needs environment
as resources, while human-being needs an environment and development to
support their life. Economic development obviously needs resources for the
progress of human capital advancement (Salehi-Isfahani, 2016).
Afrane (2012) asserted that during the low-hanging fruit era of oil
production, while developed countries enjoyed blissful economic boom, most
underdeveloped countries in Asia and Africa were still struggling for their
independence. These two contrasting situations create substantial use of energy
resources for logistic supplies and development. In the 1972 UN Conference on
the Human Environment, world communities intended to bring the disparities
between the industrialised and developing nations together into a common future
to delineate the rights of the human family to a healthy and productive
environment (Brundtland, 1987). By this platform, the environment and
economic development gained equal opportunity to sustain. The sustainable
development concept was accepted by the UN General Assembly in 1987.
The diametrical opposition of the natural resources use and economic
growth, which is reflected in the global Kuznet Curve by individual country, has
been basically the rationale of this study. This becomes the important information
to examine the country’s individual economic growth and environmental
protection status. We intend to explore the dilemma of environmental
conservation and economic development by examining current global
environmental Kuznet Curve, as it has long been experienced by most developing
world with the emphasis on Southeast Asian countries, particularly Thailand, and
becomes the strong challenges now and the future. Global cross-country data on
per capita gross domestic product (GDP) and carbon dioxide (CO2) emission have
been put side by side from the excerpt of offline and online documents and
correlation analysis has been done. The correlation of per capita GDP and CO2
emission is important to examine the dilemma, as Adams (2001) highlighted that
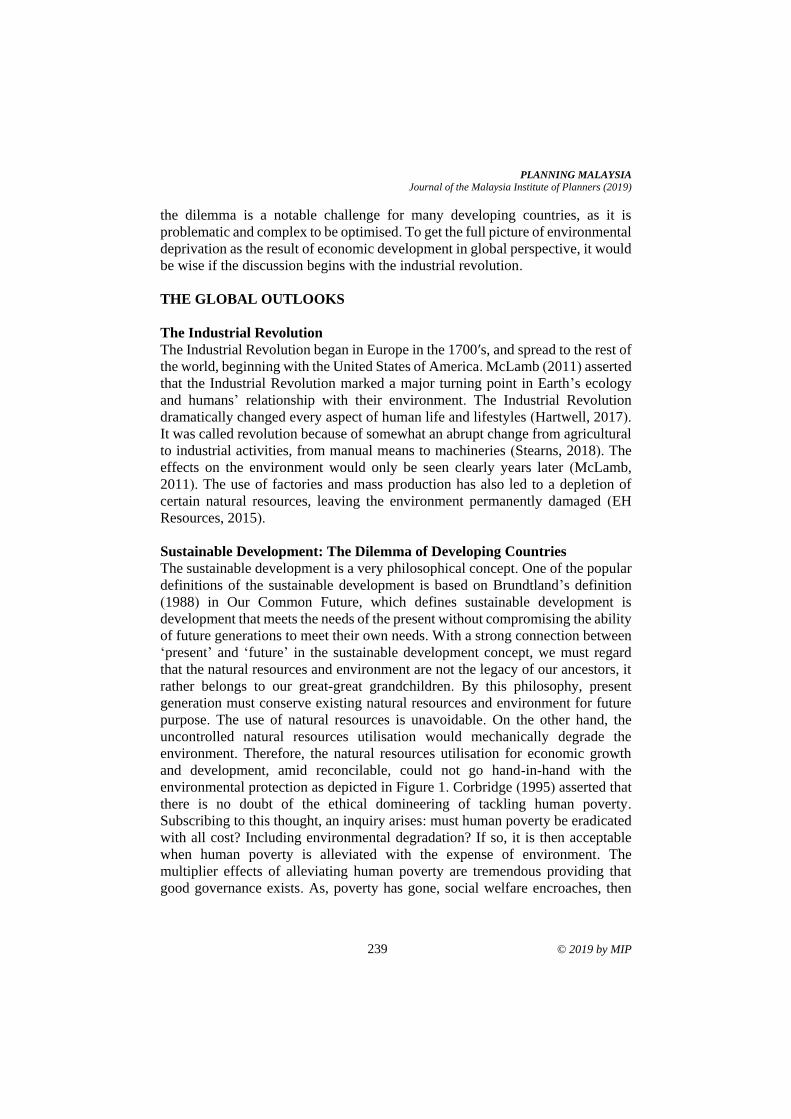
PLANNING MALAYSIA
Journal of the Malaysia Institute of Planners (2019)
239 © 2019 by MIP
the dilemma is a notable challenge for many developing countries, as it is
problematic and complex to be optimised. To get the full picture of environmental
deprivation as the result of economic development in global perspective, it would
be wise if the discussion begins with the industrial revolution.
THE GLOBAL OUTLOOKS
The Industrial Revolution
The Industrial Revolution began in Europe in the 1700′s, and spread to the rest of
the world, beginning with the United States of America. McLamb (2011) asserted
that the Industrial Revolution marked a major turning point in Earth’s ecology
and humans’ relationship with their environment. The Industrial Revolution
dramatically changed every aspect of human life and lifestyles (Hartwell, 2017).
It was called revolution because of somewhat an abrupt change from agricultural
to industrial activities, from manual means to machineries (Stearns, 2018). The
effects on the environment would only be seen clearly years later (McLamb,
2011). The use of factories and mass production has also led to a depletion of
certain natural resources, leaving the environment permanently damaged (EH
Resources, 2015).
Sustainable Development: The Dilemma of Developing Countries
The sustainable development is a very philosophical concept. One of the popular
definitions of the sustainable development is based on Brundtland’s definition
(1988) in Our Common Future, which defines sustainable development is
development that meets the needs of the present without compromising the ability
of future generations to meet their own needs. With a strong connection between
‘present’ and ‘future’ in the sustainable development concept, we must regard
that the natural resources and environment are not the legacy of our ancestors, it
rather belongs to our great-great grandchildren. By this philosophy, present
generation must conserve existing natural resources and environment for future
purpose. The use of natural resources is unavoidable. On the other hand, the
uncontrolled natural resources utilisation would mechanically degrade the
environment. Therefore, the natural resources utilisation for economic growth
and development, amid reconcilable, could not go hand-in-hand with the
environmental protection as depicted in Figure 1. Corbridge (1995) asserted that
there is no doubt of the ethical domineering of tackling human poverty.
Subscribing to this thought, an inquiry arises: must human poverty be eradicated
with all cost? Including environmental degradation? If so, it is then acceptable
when human poverty is alleviated with the expense of environment. The
multiplier effects of alleviating human poverty are tremendous providing that
good governance exists. As, poverty has gone, social welfare encroaches, then
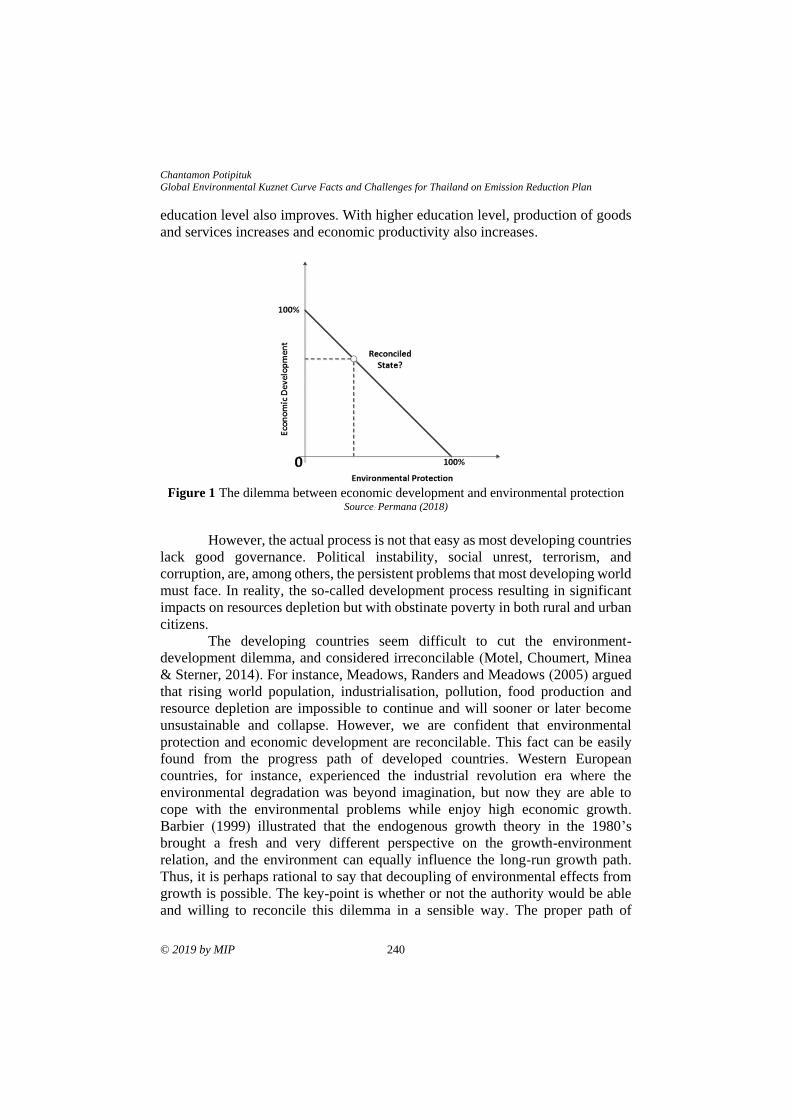
Chantamon Potipituk
Global Environmental Kuznet Curve Facts and Challenges for Thailand on Emission Reduction Plan
© 2019 by MIP 240
education level also improves. With higher education level, production of goods
and services increases and economic productivity also increases.
Figure 1 The dilemma between economic development and environmental protection Source: Permana (2018)
However, the actual process is not that easy as most developing countries
lack good governance. Political instability, social unrest, terrorism, and
corruption, are, among others, the persistent problems that most developing world
must face. In reality, the so-called development process resulting in significant
impacts on resources depletion but with obstinate poverty in both rural and urban
citizens.
The developing countries seem difficult to cut the environment-
development dilemma, and considered irreconcilable (Motel, Choumert, Minea
& Sterner, 2014). For instance, Meadows, Randers and Meadows (2005) argued
that rising world population, industrialisation, pollution, food production and
resource depletion are impossible to continue and will sooner or later become
unsustainable and collapse. However, we are confident that environmental
protection and economic development are reconcilable. This fact can be easily
found from the progress path of developed countries. Western European
countries, for instance, experienced the industrial revolution era where the
environmental degradation was beyond imagination, but now they are able to
cope with the environmental problems while enjoy high economic growth.
Barbier (1999) illustrated that the endogenous growth theory in the 1980’s
brought a fresh and very different perspective on the growth-environment
relation, and the environment can equally influence the long-run growth path.
Thus, it is perhaps rational to say that decoupling of environmental effects from
growth is possible. The key-point is whether or not the authority would be able
and willing to reconcile this dilemma in a sensible way. The proper path of
PLANNING MALAYSIA
Journal of the Malaysia Institute of Planners (2019)
241 © 2019 by MIP
development on agriculture-based, mixed agriculture-industry based, industry-
based, and then industry-cum-services as eventual process of development would
be worth implementing.
UNIFYING ECONOMIC GROWTH AND ENVIRONMENTAL
CONSERVATION: LEARNING FROM CROSS-COUNTRY DATA
There is always cure for all diseases except death. Although many people believe
that environment-development dilemma is irreconcilable, but the ways to
optimise it are always there. The balance on these two domains can always be
negotiated. Using a cross-country data (note: the data could not be presented here
as it too long for this limited space), a powerful example of GDP and level of
environmental degradation as illustrated by Kuznet curve. Chow and Li (2014)
defined the Environmental Kuznet Curve (EKC) as an empirical relationship
during the course of economic development where per capita CO2 emissions first
increases with per capita real GDP and later decreases with per capita real GDP.
Kuznet curve has been fashionable to depict the sustainability (Farhani, Mrizak,
Chaibi, & Rault, 2014).
The curve in Figure 2 perfectly depicts the richer the greener and the
poorer the “green”. While the left-most part of the curve shows the countries with
weak environmental protection, the right-most part of the curve shows the
countries with strong protection. This curve tells us that a country with low GDP,
the environmental problem i.e. environmental pollution in that country is also
low, since no or few polluting industries are in place. The main economic
activities are mostly agriculture-based products. The pollution level is therefore
low. According to Tierney (2009), the peak point was about USD 8,000 based on
GDP per capita in 1985 PPP. However, by using cross-country data in 2010-2015,
the peak point is now higher, which is about USD 50,000. The outliers such as
Bahrain, Brunei, Oman, Qatar and United Arab Emirates were excluded from the
analysis. They are high income countries but their per capita emission is high.
Chantamon Potipituk
Global Environmental Kuznet Curve Facts and Challenges for Thailand on Emission Reduction Plan
© 2019 by MIP 242
Figure 2 Global Environmental Kuznet Curve (based on cross country data)
Although perhaps the only indicator of CO2 emission is insufficient to
comprehensively show the characteristics of the EKC, however, it seems that
some recent studies done in developing cities show that there is indeed a strong
connection between economic development, as reflected in the land use changes,
and CO2 emission stemming from transport sector (Permana, Perera, Aziz, & Ho,
2015a; Permana, Perera, Aziz, & Ho, 2015b). However, one can argue that the
poverty strongly associates with the environmental degradation (see Duraiappah,
1998; Ravnborg, 2003; Aaron, 2005).
DIFFERENT COUNTRIES, DIFFERENT NEEDS: THAILAND CASE,
LEARNING FROM GLOBAL EKC
In consultation with the Kuznet curve, at any given point or period, different
countries have different level of development. Thus they have different needs.
Switzerland, for example, with per capita GDP PPP 2010 was about USD 84,000,
per capita CO2 emission was only 4.95 tonnes. On a different side, Burundi
emitted 0.35 tonne of CO2 per capita while its per capita GDP was USD 870.
Burundi, for sure, will not emphasise their development over environmental
protection, since Burundi needs to strongly struggle with the acute poverty
problem.
Figure 3 is composed of two super-imposed graphs; (1) countries with
different per capita GDP ordered from the smallest to the largest and (2)
correlation between environmental conservation and natural resources use i.e.
economic growth. It shows that countries with GDP per capita less than USD
10,000 are considered as at the initial stage of development. At this stage, the
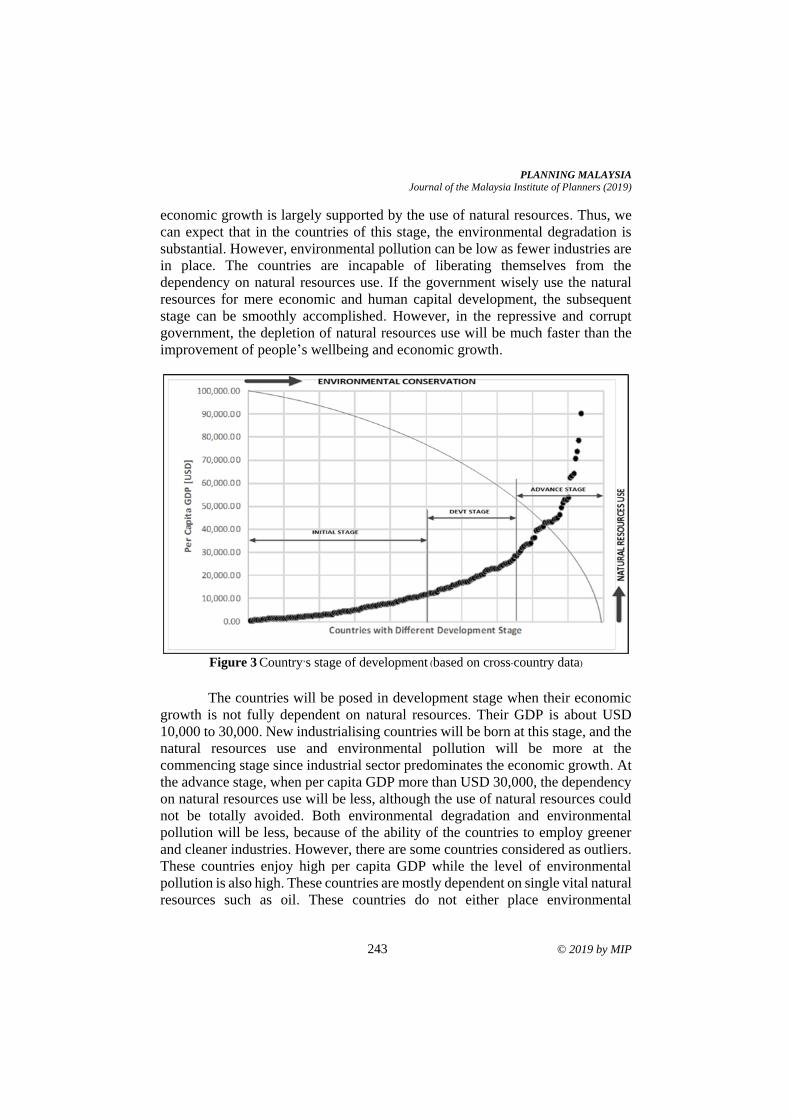
PLANNING MALAYSIA
Journal of the Malaysia Institute of Planners (2019)
243 © 2019 by MIP
economic growth is largely supported by the use of natural resources. Thus, we
can expect that in the countries of this stage, the environmental degradation is
substantial. However, environmental pollution can be low as fewer industries are
in place. The countries are incapable of liberating themselves from the
dependency on natural resources use. If the government wisely use the natural
resources for mere economic and human capital development, the subsequent
stage can be smoothly accomplished. However, in the repressive and corrupt
government, the depletion of natural resources use will be much faster than the
improvement of people’s wellbeing and economic growth.
Figure 3 Country’s stage of development (based on cross-country data)
The countries will be posed in development stage when their economic
growth is not fully dependent on natural resources. Their GDP is about USD
10,000 to 30,000. New industrialising countries will be born at this stage, and the
natural resources use and environmental pollution will be more at the
commencing stage since industrial sector predominates the economic growth. At
the advance stage, when per capita GDP more than USD 30,000, the dependency
on natural resources use will be less, although the use of natural resources could
not be totally avoided. Both environmental degradation and environmental
pollution will be less, because of the ability of the countries to employ greener
and cleaner industries. However, there are some countries considered as outliers.
These countries enjoy high per capita GDP while the level of environmental
pollution is also high. These countries are mostly dependent on single vital natural
resources such as oil. These countries do not either place environmental
Chantamon Potipituk
Global Environmental Kuznet Curve Facts and Challenges for Thailand on Emission Reduction Plan
© 2019 by MIP 244
protection as priority or have technological independency from countries. Or,
simply the total population of the country is too small, and industries are mostly
run by expatriates.
From the cross-country data presented, it is fair to say that optimising the
natural resource use and environmental degradation or pollution is a dynamic
process depending on the development stage of the country. One assumption on
this circumstances is that a country will follow a traditional stage of development
i.e. [agriculture]-[agriculture + industry]-[industry + service]. This is what EKC
would eventually affect the emission reduction programmes in a country.
Thailand, with per capita GDP of about USD 6,500 (in 2017) and per
capita emission is about 4.3 tonnes CO2E, is presently at the initial stage of
development, in which agricultural-based and industrial-based economy can be
considered balanced, but leading towards agro-industry and industrial-based
economy. By this stage, the Thailand plan to reduce CO2 emission is at very
fundamental stage covering all possible sectors. The plan to reduce the CO2
emission is covered in the Thailand Voluntary Emission Reduction Program (T-
VER). The objectives of T-VER are basically; (1) to push the development of co-
benefit greenhouse gaseous (GHG) emission reduction projects and programmes
through certifying carbon credits, (2) to promote voluntary Carbon Market in
Thailand, (3) to raise the awareness of climate change by stakeholders, (4) to
encourage public and private sector involvement, and (5) to prepare all
stakeholders for the future new agreement in Global GHG emission reduction.
The types of projects and programmes covered by T-VER include energy
efficiency for households, industries and commerce; alternate energy covering
low-emission energy and green energy; renewable energy such as solar power,
wind power and biogas; transportation by promoting more public transport e.g.
extension of BTS and MRT in Bangkok Metropolitan Region; and waste
management by promoting sustainable solid waste management. T-VER has been
implemented by Bangkok Metropolitan Authority and Nakhon Ratchashima City
Authority; land use and forestry associated programmes have been implemented
in the whole of Thailand; and agriculture programmes e.g. the use of non-GHG
fertilisers. Many private companies, government-owned companies, government
organisation have involved in the implementation of the projects. However, the
results could not be reported at this stage since the projects are still on-going.
LESSONS LEARNT FROM GLOBAL EKC FATCS
Sustaining the Potentials
Every country and nation has its own potentials for the advancement of their
development. The potentials of the country can be, and definitely, natural
resources, human resources, and technological know-how. Unfortunately, the
developing world lacks human resources and technological know-how. Thus,
PLANNING MALAYSIA
Journal of the Malaysia Institute of Planners (2019)
245 © 2019 by MIP
natural resources as the only asset, must be utilised wisely and sustainably.
Natural resources must be able to develop human resources, because of the
multiplier effect properties of human resources development. With high quality
of human resources, technological know-how to develop the country is made
available. Japan has no natural resources and a natural disaster vulnerable
country. But, Japan has high quality of human resources. Thus, natural resources
roles in their development process can be nullified. United Arab Emirates, Qatar
and Oman has natural resources. But this potential is not used to develop the
capacity of their nations. In the short-term, the need of human resources to run
the country is met by hiring high quality expatriates. Financial reward is one of
the strongest attractions for professional. UAE, Qatar and Oman are practically
run by expatriates who mostly come from developed countries of Northern
America and Western Europe. The number of local people in these countries is
less than the number of expatriates and migrants workers. Their policies are good
for the short-term but not for the long-term, unless they also conducted an
intensive transfer of knowledge from the professional expatriates to local people.
Environment: A Resource for Development
Natural resources are definitely vital prerequisite for the development process.
No one can avoid the use of natural resources to meet their needs, not even
developed countries with advance technology know-how. However, not all
resources provided by nature are renewable, most of them are in non-renewable
state. Presently, to harvest renewable energy is very expensive and most of them
are at preliminary stage. The use of sun and wind energy is still not that advance
and with limited energy production, unlike nuclear energy or hydropower energy.
Hydropower energy is limited by nature, and it will be no more expansion
someday after no more water with potential energy exists. Oil as a prominent
source of energy will soon deplete. The replenishment will take millions of years.
Thus it is considered as non-renewable energy. On the other hand, the use of
renewable energy is not ready yet with respect to technology and mass
production. There is almost no low-cost technology presently to utilise renewable
energy. Therefore, there is only small fraction of renewable energy use in the
world, although there is significant increases. For example, in 2012 the
percentage of renewable energy for electricity was about 12.2% and in 2014 this
percentage was about 22% (REN 21, 2014).
Producing More with Less
Efficiency is one way to conserve the environment. Efficiency can support
sustainability, including sustainable consumption and production. Sustainable
consumption and production is about "the use of services and related products,
which respond to basic needs and bring a better quality of life while minimising
the use of natural resources and toxic materials as well as the emissions of waste
Chantamon Potipituk
Global Environmental Kuznet Curve Facts and Challenges for Thailand on Emission Reduction Plan
© 2019 by MIP 246
and pollutants over the life cycle of the service or product so as not to jeopardise
the needs of further generations" (Oslo symposium, 1994). These flowery words
can be shortened by saying that we must produce more with less. The key is
efficiency in both production and consumption. When we observe a product for
the whole of its life-cycle, we will immediately identify that the production
process from exploiting raw material to end of lifetime of the product (cradle-to-
grave process) involves a number of inputs i.e. material and energy, and also
residuals. Technology, to certain extent, is able to increase the productivity of a
stuff that has actually limited capacity. One example is the productivity of farm
land. Before the introduction of technology, a hectare of farm land can produce
only 5 tonnes of paddy per season. But with the application of technological
product for enriching soil nutrients i.e. fertiliser along with good irrigation
system, the farm land production can be improved up to 9 tonnes per hectare per
season. This case happened in Thailand and some parts of Indonesia.
Implications to Thailand Country’s Planning and Southeast Asia’s
Perspective
Understanding the facts of Global Environmental Kuznet Curve, it can be
concluded that for the Thailand’s case, the country is presently moving towards
industrial country stage, with agro-industry as the core activities. Additionally,
by referring to KC-based development, Thailand is considered as the country at
initial stage of the balance between economic development and environmental
protection. The planning system of Thailand, in which Department of Town and
Country Planning, as the sole agency in charge of country planning, has been
comprehensively accommodating the programmes of emission reduction in the
plan, as reflected, for example in the T-VER, which involving various
stakeholders of the country. As a country at the development stage (referring to
Figure 3), Thailand emphasises economic growth with attention to environmental
protection and conservation. Malaysia has been on the right track towards
emission reduction without hampering the economic growth, by introducing its
voluntary reduction of emissions intensity of GDP by up to 40% by 2020 through
various programs (MNRE, n.d). The KC also shows Malaysia at the end-phase of
initial stage towards next level of development.
ACKNOWLEDGEMENT
We acknowledge the support of Rajamangala University of Technology
Rattanakosin, without which this research would not have been accomplished.
PLANNING MALAYSIA
Journal of the Malaysia Institute of Planners (2019)
247 © 2019 by MIP
REFERENCES Aaron, K. K. (2005). Perspective: Big oil, rural poverty, and environmental degradation
in the Niger Delta region of Nigeria. Journal of Agricultural Safety and Health,
11(2), 127-134.
Adams, W. M. (2001). Green development: Environment and sustainability in the Third
World (2nd Edition). London: Routledge.
Afrane, G. (2012). Examining the potential for liquid biofuels production and usage in
Ghana. Energy Policy, 40, 444-451.
Barbier, E. B. (1999). Endogenous growth and natural resource scarcity. Environmental
and Resource Economics, 14(1), 51-74.
Brundtland, G. H. (1987). Report of the World Commission on Environment and
Development: Our common future. Retrieved February 11, 2018 from
http://www.un-documents.net/our-common-future.pdf
Chow, G. C., & Li, J. (2014). Environmental Kuznets Curve: Conclusive economic
evidence for CO2. Pacific Economic Review, 19, 1-7.
Corbridge, S. (1995). Development studies: A reader. London: Arnold.
Duraiappah, A. K. (1998). Poverty and environmental degradation: A review and analysis
of the nexus. World Development, 26(12): 2169-2179.
Environmental History Resources [EH Resources] (2015). Retrieved February 11, 2018
from http://www.eh-resources.org/timeline/timeline_ industrial.html ().
Farhani, S., Mrizak, S., Chaibi, A., & Rault, C. (2014). The environmental Kuznets curve
and sustainability: A panel data analysis. Energy Policy, 71, 189-198.
Griggs, D. (2013). Sustainable development for people and planet. Nature, 495, 305-307.
Hartwell, R. M. (2017). The industrial revolution and economic growth. London:
Routledge.
McLamb, E. (2011). The ecological impact of the industrial revolution. Retrieved
February 11, 2018 from http://www.ecology.com/2011/09/18/ ecological-
impact-industrial-revolution/
Meadows, D. H., Randers, J., & Meadows, D. L. (2005). The limits to growth: The 30-
year update revised edition. London: Earthscan.
Midlarsky, M. I. (2018). Democracy and the environment. In P. Diehl (Ed.),
Environmental conflict: An anthology (pp. 155-178). London: Routledge.
MNRE (n.d.). Malaysia’s Second National Communication (NC2) submitted to the
United Nations Framework Convention on Climate Change (UNFCCC).
Putrajaya: Ministry of Natural Resources and Environment of Malaysia.
Motel, P. M., Choumert, J., Minea, A., & Sterner, T. (2014). Explorations in the
environment-development dilemma. Environmental and Resource Economics,
57, 479-485.
Pearce, D., Barbier, E., & Markandya, A. (2013). Sustainable development: Economics
and environment in the Third World. London: Routledge.
Permana, A. S., Perera, R., Aziz, N.A., & Ho, C. S. (2015a). Creating the synergy of land
use, transport, energy and environment elements towards climate change co-
benefits. International Journal of Built Environment and Sustainability, 2(1):17-
28.
Chantamon Potipituk
Global Environmental Kuznet Curve Facts and Challenges for Thailand on Emission Reduction Plan
© 2019 by MIP 248
Permana, A. S., Perera, R., Aziz, N.A., & Ho, C. S. (2015b). Corroborating the land use
change as primary determinant of air quality degradation in a concentric city.
International Journal of Built Environment and Sustainability, 2(2):75-84.
Oslo Symposium (1994). Assessed on March 17, 2018 at http://www.unep.
org/rio20/About/SustainableConsumptionandProduction/tabid/102187/Default.
aspx
Ravnborg, H. M. (2003). Poverty and environmental degradation in the Nicaraguan
hillsides. World Development, 31(11), 1933-1946.
Renewable Energy Network for 21 Century [REN 21] (2014). Renewables 2014 global
status report.
Sachs, W. (2015). Planet dialectics: Explorations in environment and development.
London: Zed Books Ltd.
Salehi-Isfahani, D. (2016). Human development in the Middle East and North Africa. In
The new Palgrave dictionary of economics (pp. 1-14). London: Palgrave
Macmillan.
Smil, V. (2016). China's environmental crisis: an enquiry into the limits of national
development. London: Routledge.
Stearns, P. N. (2018). The industrial revolution in world history. London: Routledge.
Weaver, P., Jansen, L., Van Grootveld, G., Van Spiegel, E., & Vergragt, P. (2017).
Sustainable technology development. London: Routledge
Received: 5th March 2019. Accepted: 20th August 2019.
1PhD student at Universiti Kebangsaan Malaysia. Email: [email protected] 249
PLANNING MALAYSIA:
Journal of the Malaysian Institute of Planners
VOLUME 17 ISSUE 2 (2019), Page 249 – 258
THE ANALYSIS OF VULNERABILITY FACED BY GAHAI
AGROPOLITAN PARTICIPANTS
Mohd Khairi Ismail1, Chamhuri Siwar2, Rospidah Ghazali3,
Nor Zuriati Amani Ab Rani4, & Basri Abdul Talib5
1,2,3,4,5Institute for Environment and Development (LESTARI)
UNIVERSITI KEBANGSAAN MALAYSIA
Abstract
Vulnerability is always related to the poor group. Vulnerability can be defined as
being vulnerable to damage or ill effects because of changes in the society and
the environment, and the inability to adapt to changes. In-depth understanding is
important to probe what action should be taken to achieve the sustainability of
the community and its environment. In Malaysia, the government has
implemented various eradication programmes on rural poverty, and sustainable
livelihoods, such as the agropolitan projects. Agropolitan projects are capable of
achieving the objective to eradicate poverty, and the vulnerability faced by
project participants which will affect their lives. Therefore, the purpose of this
study was to identify the vulnerability of agropolitan participants in Malaysia by
utilising the Gahai Agropolitan, Lipis, Pahang project as a case study. This study
used simple random sampling and it involved 45 participants of Gahai
Agropolitan Project. Data were analysed using the Descriptive Analysis and
Exploratory Factor Analysis (EFA). The findings showed that Gahai Agropolitan
Project Participants faced multi-dimensional vulnerability in terms of economic,
social, and physical and environmental aspects. Therefore, the Ministry of Rural
Development (KKLW) and the Rubber Industry Smallholders Development
Authority (RISDA) need to pay more attention to reduce the vulnerability to
participants of the agropolitan project, and help them to increase their income and
improve their lives.
Keywords: vulnerability; Gahai Agropolitan; Malaysia
Mohd Khairi Ismail, Chamhuri Siwar, Rospidah Ghazali, Nor Zuriati Amani Ab Rani, & Basri Abdul Talib
The Analysis of Vulnerability Faced by Gahai Agropolitan Participants
© 2019 by MIP 250
INTRODUCTION
Poverty in rural areas has shown a higher rate than in urban areas (Economic
Planning Unit, 2015). This situation usually occurs among rural people who are
involved in agricultural activities. Poverty is also related to vulnerability.
Vulnerability is a very important aspect to consider in creating the basic policy
or programme development for sustainable livelihoods. Many of the plans,
policies and development programmes implemented do not achieve optimal
results and fail because they do not include the context of vulnerability.
According to Idrus, Lim and Hadi (2004), a deep understanding of these
vulnerabilities is important to understand any action taken to achieve
sustainability of the community and its environment.
In Malaysia, the government has implemented various poverty
alleviation programmes in rural areas and sustainable livelihoods. In 2007, the
government implemented the agropolitan project to continue the programmes of
eradicating poverty and increase the sustainable livelihood of poor people in rural
areas. The implementation of the agropolitan project was successful when the
report showed that the income of the participants was increasing (Economic
Planning Unit, 2015). However, the participants are still facing vulnerability.
Therefore, the purpose of this study is to identify the vulnerability of participants
in agropolitan projects in Malaysia, focusing on Gahai Agropolitan Project, Lipis,
Pahang.
LITERATURE REVIEW
Vulnerability is defined as a situation of facing unexpected risks. Based on the
basic theory of economics, vulnerability is the exposure to risks and uncertainties
about the future that adversely affects the well-being of individuals (Chaudhuri,
2003). Vulnerability is the pressure on the path towards achieving sustainable
development. Every development effort, especially in a country that is rushing to
develop its economy and community, will face various barriers to sustain the
venture. This is partly due to the members of the community itself, and some
from various external causes, especially the country's stability to guide
development (Hadi, Idrus, Mohamed, & Harman Shah,2006).
Henninger (1998) states that there are five risks that affect an individual's
vulnerability which are (i) the environment (flood, drought); (ii) market risk
(prices, salaries, and unemployment); (iii) political risks (subsidies); (iv) social
risk; and (v) disease. Vulnerability will affect individuals due to various factors
such as bad harvest, loss of a job, uncertain expenditure, illnesses, and various
other risks and surprises. Serrat (2008) explains that vulnerability affects two
situations, which consist of an external factor (shock, seasonal, periodic trends)
and an internal factor (inability to achieve well-being in life). Shock external
factor includes conflict, pain, flood, storm, drought, plant disease and pests.
While that, seasonal factors consist of price and job opportunities. The periodic
PLANNING MALAYSIA
Journal of the Malaysia Institute of Planners (2019)
251 © 2019 by MIP
trends refer to demographics, the environment, the economy, and technology
trends.
According to Christiaensen and Boisvert (2000), there is a difference
between poverty and vulnerability. Poverty describes a situation of inadequacy at
one time, while vulnerability refers to the probability of experiencing scarce in
the future. In other words, vulnerability is a risk that can affect the future of an
individual. For example, if individuals have minimal income nowadays, they are
considered indigent and susceptible to vulnerabilities, such as loss of jobs that
can affect their income.
Ibrahim and Siwar (2017) state that lower-income groups and vulnerable
groups face natural disasters. The effects of natural disasters can affect their
income and life. Changes in climate and flood can cause heat rise, the occurrence
of diseases and growing crop pests, and these affect vulnerability.
METHODOLOGY
This study was conducted in the Gahai Agropolitan Project, Lipis, Pahang. The
development of the Gahai Agropolitan Project started in 2007 and expired in
2012. The Gahai Agropolitan Project, Lipis, covered an area of 238.76 hectares
involving 50 participants (KKLW, 2012). The selection of Gahai Agropolitan
Project, Lipis for this study was based on the criteria that (i) Gahai Agropolitan
Project has exceeded development for more than five years, and enabled impact
studies to be conducted; (ii) Gahai Agropolitan Project is located in Pahang State,
which is one of the states with high poverty rates (Economic Planning Unit,
2015), and is in line with the objectives of the study in assessing the impact of
agropolitan projects in eradicating poverty, and (iii) the selection of the Gahai
Agropolitan Project was a recommendation from the Ministry of Rural and
Regional Development (KKLW) as it is an early agropolitan project of its
establishment and shows good performance.
The population of this study was 50 participants of Gahai Agropolitan
Project and 45 participants were used as sample. This study used simple random
sampling. The determination of the number of sample for this study was based on
the suggestion by Krejcie and Morgan (1970).
The study employed quantitative research and case study. This study
used questionnaire as the primary data. The questionnaire contained questions
related to respondents' profile, the nominal form of questionnaire, and Likert
scale questionnaire. The questionnaire used Likert scale questions from 1 to 5,
namely: (1) very low vulnerability, (2) low vulnerability, (3) moderate
vulnerability, (4) vulnerability, and (5) very high vulnerability. There were three
factors of the vulnerability of the study, namely the economic, social and physical
aspects and environmental vulnerability aspects. The variables of vulnerability
factors consisted of 16 items. The list of variables is shown in Table 1.
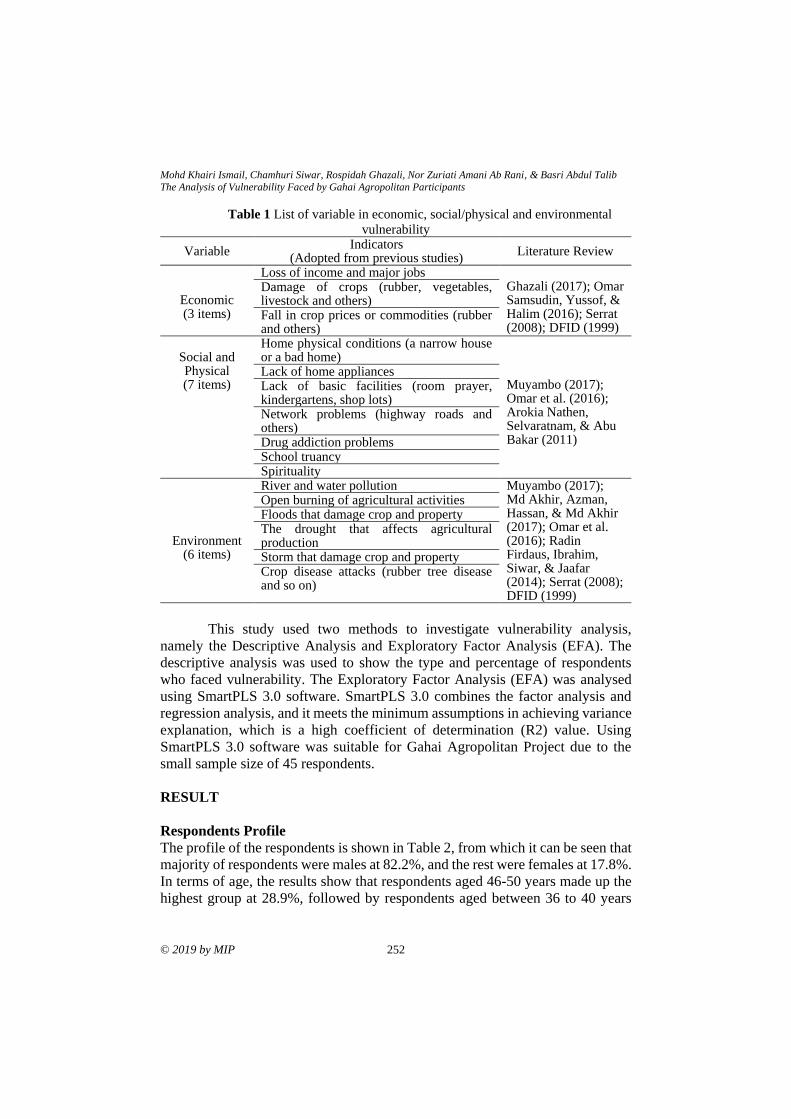
Mohd Khairi Ismail, Chamhuri Siwar, Rospidah Ghazali, Nor Zuriati Amani Ab Rani, & Basri Abdul Talib
The Analysis of Vulnerability Faced by Gahai Agropolitan Participants
© 2019 by MIP 252
Table 1 List of variable in economic, social/physical and environmental
vulnerability
Variable Indicators
(Adopted from previous studies) Literature Review
Economic (3 items)
Loss of income and major jobs Ghazali (2017); Omar Samsudin, Yussof, & Halim (2016); Serrat (2008); DFID (1999)
Damage of crops (rubber, vegetables, livestock and others) Fall in crop prices or commodities (rubber and others)
Social and Physical (7 items)
Home physical conditions (a narrow house or a bad home)
Muyambo (2017); Omar et al. (2016); Arokia Nathen, Selvaratnam, & Abu Bakar (2011)
Lack of home appliances Lack of basic facilities (room prayer, kindergartens, shop lots) Network problems (highway roads and others) Drug addiction problems School truancy Spirituality
Environment (6 items)
River and water pollution Muyambo (2017); Md Akhir, Azman, Hassan, & Md Akhir (2017); Omar et al. (2016); Radin Firdaus, Ibrahim, Siwar, & Jaafar (2014); Serrat (2008); DFID (1999)
Open burning of agricultural activities Floods that damage crop and property The drought that affects agricultural production Storm that damage crop and property Crop disease attacks (rubber tree disease and so on)
This study used two methods to investigate vulnerability analysis,
namely the Descriptive Analysis and Exploratory Factor Analysis (EFA). The
descriptive analysis was used to show the type and percentage of respondents
who faced vulnerability. The Exploratory Factor Analysis (EFA) was analysed
using SmartPLS 3.0 software. SmartPLS 3.0 combines the factor analysis and
regression analysis, and it meets the minimum assumptions in achieving variance
explanation, which is a high coefficient of determination (R2) value. Using
SmartPLS 3.0 software was suitable for Gahai Agropolitan Project due to the
small sample size of 45 respondents.
RESULT
Respondents Profile
The profile of the respondents is shown in Table 2, from which it can be seen that
majority of respondents were males at 82.2%, and the rest were females at 17.8%.
In terms of age, the results show that respondents aged 46-50 years made up the
highest group at 28.9%, followed by respondents aged between 36 to 40 years
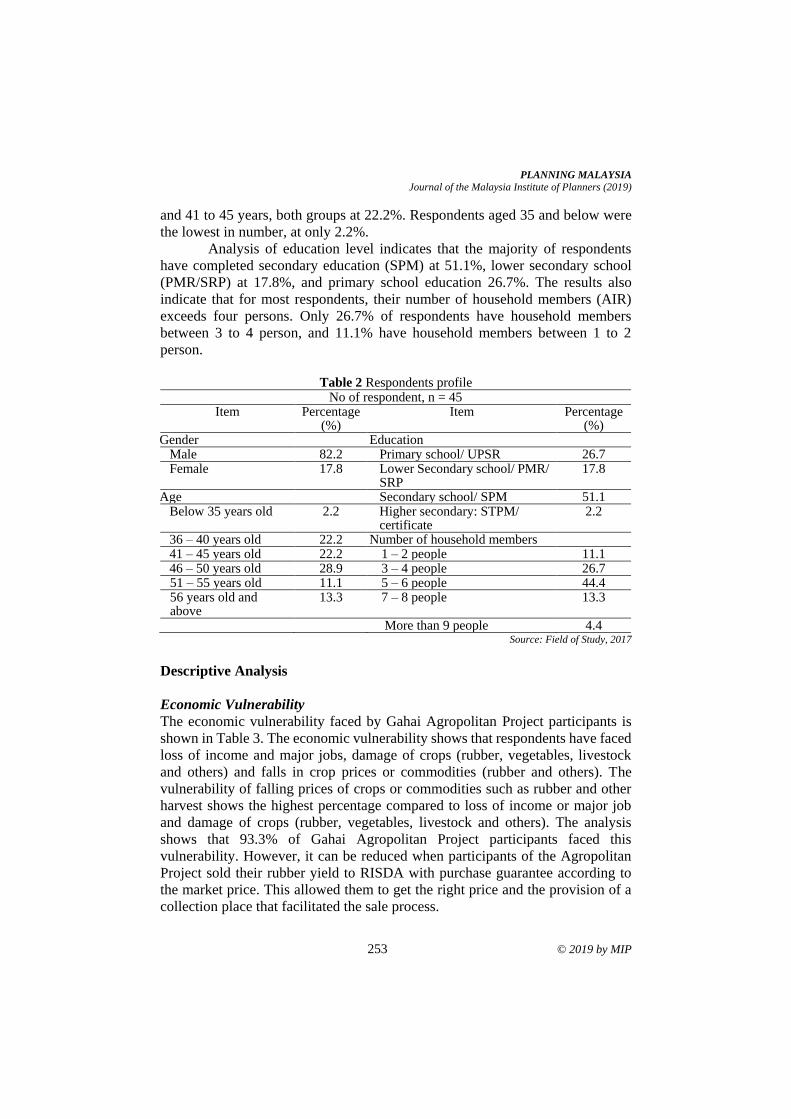
PLANNING MALAYSIA
Journal of the Malaysia Institute of Planners (2019)
253 © 2019 by MIP
and 41 to 45 years, both groups at 22.2%. Respondents aged 35 and below were
the lowest in number, at only 2.2%.
Analysis of education level indicates that the majority of respondents
have completed secondary education (SPM) at 51.1%, lower secondary school
(PMR/SRP) at 17.8%, and primary school education 26.7%. The results also
indicate that for most respondents, their number of household members (AIR)
exceeds four persons. Only 26.7% of respondents have household members
between 3 to 4 person, and 11.1% have household members between 1 to 2
person.
Table 2 Respondents profile
No of respondent, n = 45 Item Percentage
(%) Item Percentage
(%) Gender Education Male 82.2 Primary school/ UPSR 26.7 Female 17.8 Lower Secondary school/ PMR/
SRP 17.8
Age Secondary school/ SPM 51.1 Below 35 years old 2.2 Higher secondary: STPM/
certificate 2.2
36 – 40 years old 22.2 Number of household members 41 – 45 years old 22.2 1 – 2 people 11.1 46 – 50 years old 28.9 3 – 4 people 26.7 51 – 55 years old 11.1 5 – 6 people 44.4 56 years old and above
13.3 7 – 8 people 13.3
More than 9 people 4.4 Source: Field of Study, 2017
Descriptive Analysis
Economic Vulnerability
The economic vulnerability faced by Gahai Agropolitan Project participants is
shown in Table 3. The economic vulnerability shows that respondents have faced
loss of income and major jobs, damage of crops (rubber, vegetables, livestock
and others) and falls in crop prices or commodities (rubber and others). The
vulnerability of falling prices of crops or commodities such as rubber and other
harvest shows the highest percentage compared to loss of income or major job
and damage of crops (rubber, vegetables, livestock and others). The analysis
shows that 93.3% of Gahai Agropolitan Project participants faced this
vulnerability. However, it can be reduced when participants of the Agropolitan
Project sold their rubber yield to RISDA with purchase guarantee according to
the market price. This allowed them to get the right price and the provision of a
collection place that facilitated the sale process.
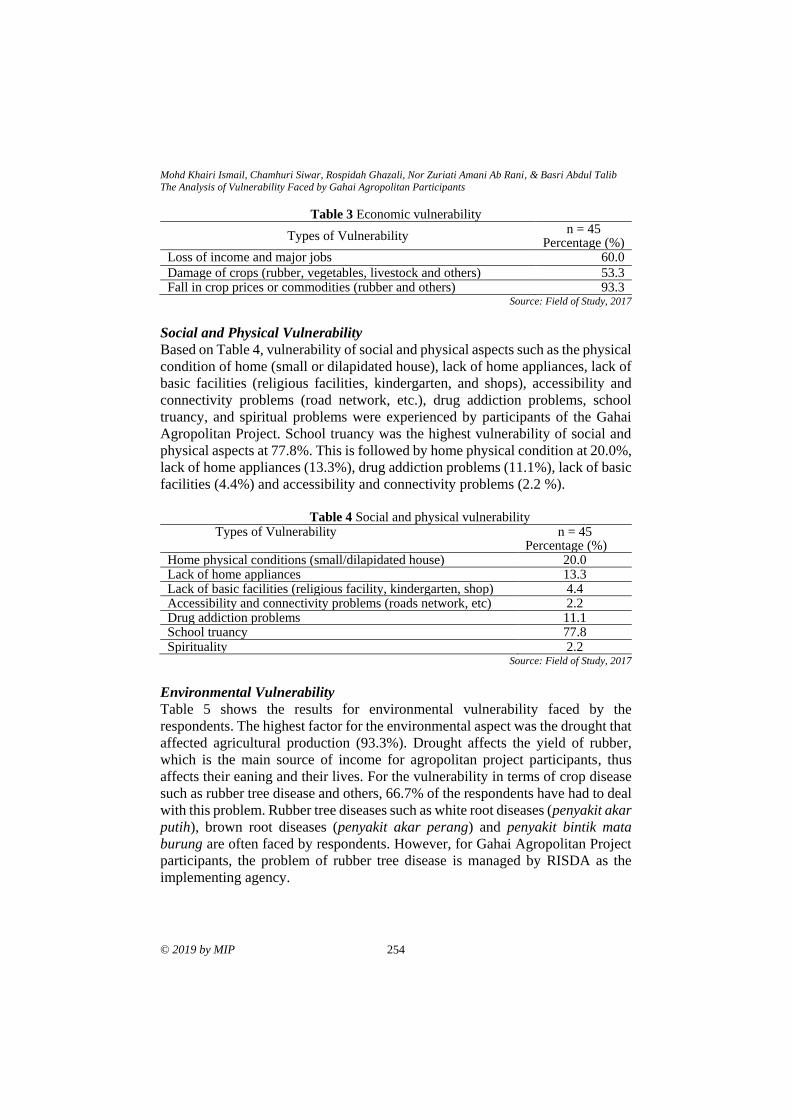
Mohd Khairi Ismail, Chamhuri Siwar, Rospidah Ghazali, Nor Zuriati Amani Ab Rani, & Basri Abdul Talib
The Analysis of Vulnerability Faced by Gahai Agropolitan Participants
© 2019 by MIP 254
Table 3 Economic vulnerability
Types of Vulnerability n = 45
Percentage (%) Loss of income and major jobs 60.0
Damage of crops (rubber, vegetables, livestock and others) 53.3 Fall in crop prices or commodities (rubber and others) 93.3
Source: Field of Study, 2017
Social and Physical Vulnerability
Based on Table 4, vulnerability of social and physical aspects such as the physical
condition of home (small or dilapidated house), lack of home appliances, lack of
basic facilities (religious facilities, kindergarten, and shops), accessibility and
connectivity problems (road network, etc.), drug addiction problems, school
truancy, and spiritual problems were experienced by participants of the Gahai
Agropolitan Project. School truancy was the highest vulnerability of social and
physical aspects at 77.8%. This is followed by home physical condition at 20.0%,
lack of home appliances (13.3%), drug addiction problems (11.1%), lack of basic
facilities (4.4%) and accessibility and connectivity problems (2.2 %).
Table 4 Social and physical vulnerability
Types of Vulnerability n = 45 Percentage (%)
Home physical conditions (small/dilapidated house) 20.0 Lack of home appliances 13.3 Lack of basic facilities (religious facility, kindergarten, shop) 4.4 Accessibility and connectivity problems (roads network, etc) 2.2 Drug addiction problems 11.1 School truancy 77.8 Spirituality 2.2
Source: Field of Study, 2017
Environmental Vulnerability
Table 5 shows the results for environmental vulnerability faced by the
respondents. The highest factor for the environmental aspect was the drought that
affected agricultural production (93.3%). Drought affects the yield of rubber,
which is the main source of income for agropolitan project participants, thus
affects their eaning and their lives. For the vulnerability in terms of crop disease
such as rubber tree disease and others, 66.7% of the respondents have had to deal
with this problem. Rubber tree diseases such as white root diseases (penyakit akar
putih), brown root diseases (penyakit akar perang) and penyakit bintik mata
burung are often faced by respondents. However, for Gahai Agropolitan Project
participants, the problem of rubber tree disease is managed by RISDA as the
implementing agency.
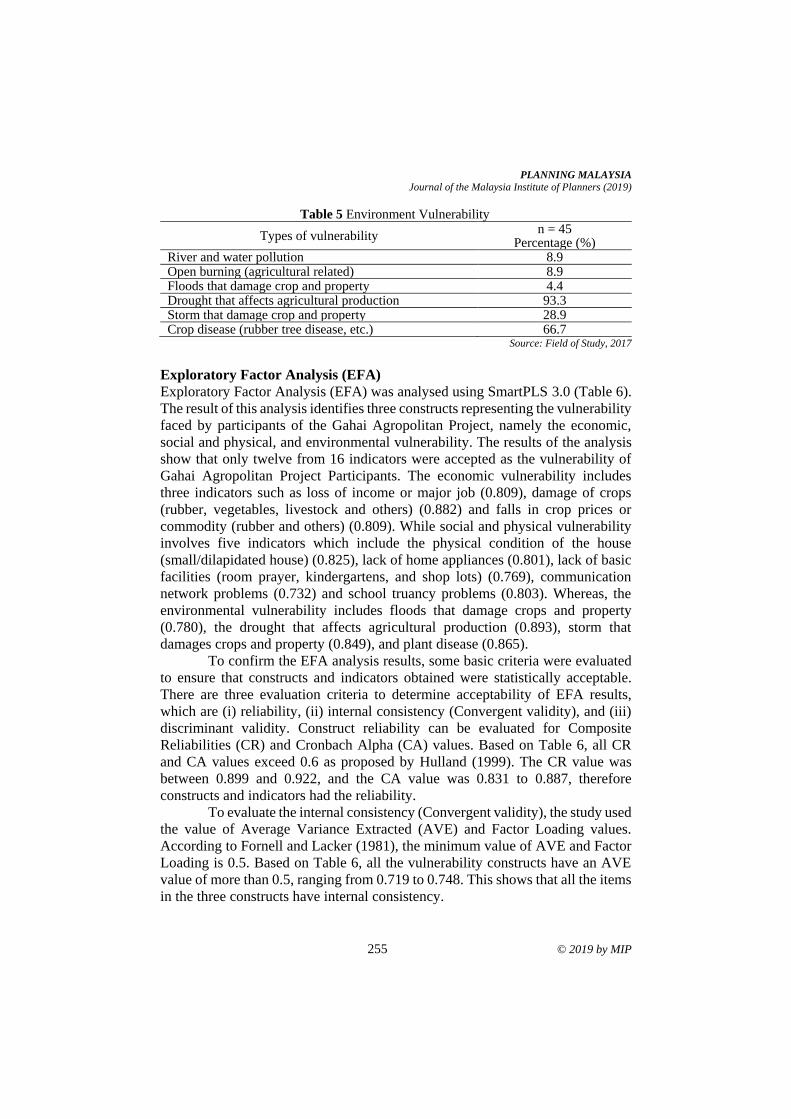
PLANNING MALAYSIA
Journal of the Malaysia Institute of Planners (2019)
255 © 2019 by MIP
Table 5 Environment Vulnerability
Types of vulnerability n = 45
Percentage (%) River and water pollution 8.9 Open burning (agricultural related) 8.9 Floods that damage crop and property 4.4 Drought that affects agricultural production 93.3 Storm that damage crop and property 28.9 Crop disease (rubber tree disease, etc.) 66.7
Source: Field of Study, 2017
Exploratory Factor Analysis (EFA)
Exploratory Factor Analysis (EFA) was analysed using SmartPLS 3.0 (Table 6).
The result of this analysis identifies three constructs representing the vulnerability
faced by participants of the Gahai Agropolitan Project, namely the economic,
social and physical, and environmental vulnerability. The results of the analysis
show that only twelve from 16 indicators were accepted as the vulnerability of
Gahai Agropolitan Project Participants. The economic vulnerability includes
three indicators such as loss of income or major job (0.809), damage of crops
(rubber, vegetables, livestock and others) (0.882) and falls in crop prices or
commodity (rubber and others) (0.809). While social and physical vulnerability
involves five indicators which include the physical condition of the house
(small/dilapidated house) (0.825), lack of home appliances (0.801), lack of basic
facilities (room prayer, kindergartens, and shop lots) (0.769), communication
network problems (0.732) and school truancy problems (0.803). Whereas, the
environmental vulnerability includes floods that damage crops and property
(0.780), the drought that affects agricultural production (0.893), storm that
damages crops and property (0.849), and plant disease (0.865).
To confirm the EFA analysis results, some basic criteria were evaluated
to ensure that constructs and indicators obtained were statistically acceptable.
There are three evaluation criteria to determine acceptability of EFA results,
which are (i) reliability, (ii) internal consistency (Convergent validity), and (iii)
discriminant validity. Construct reliability can be evaluated for Composite
Reliabilities (CR) and Cronbach Alpha (CA) values. Based on Table 6, all CR
and CA values exceed 0.6 as proposed by Hulland (1999). The CR value was
between 0.899 and 0.922, and the CA value was 0.831 to 0.887, therefore
constructs and indicators had the reliability.
To evaluate the internal consistency (Convergent validity), the study used
the value of Average Variance Extracted (AVE) and Factor Loading values.
According to Fornell and Lacker (1981), the minimum value of AVE and Factor
Loading is 0.5. Based on Table 6, all the vulnerability constructs have an AVE
value of more than 0.5, ranging from 0.719 to 0.748. This shows that all the items
in the three constructs have internal consistency.
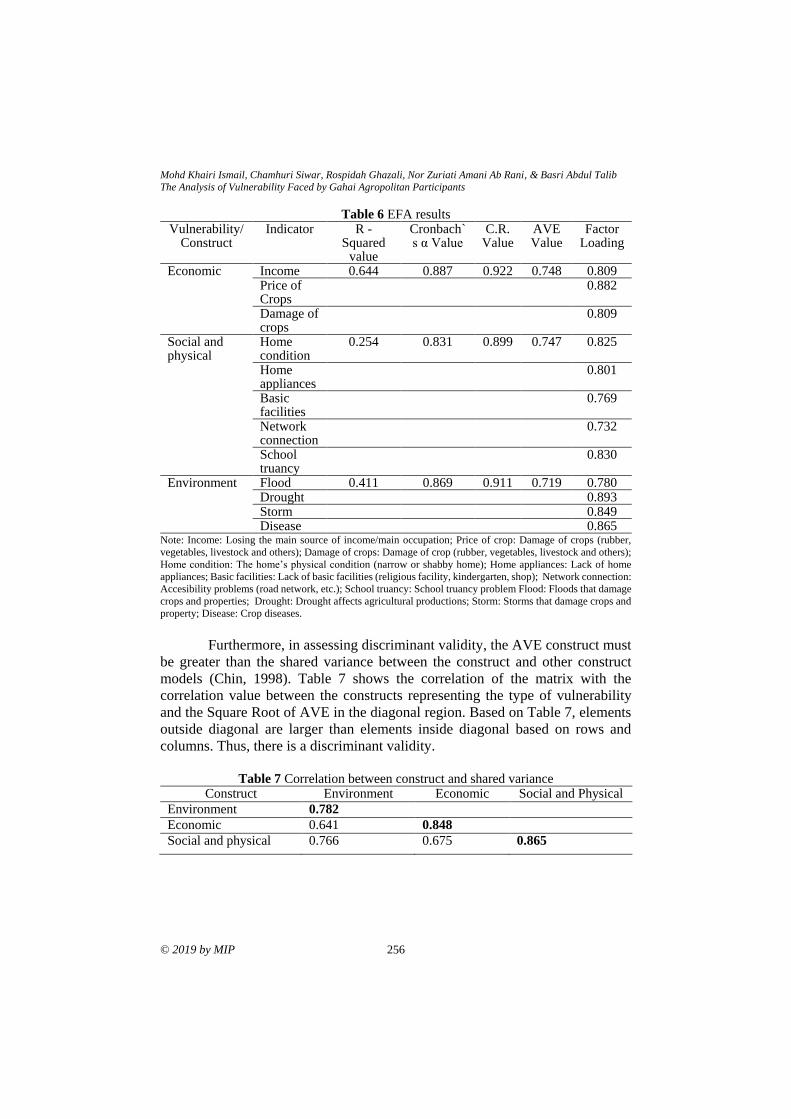
Mohd Khairi Ismail, Chamhuri Siwar, Rospidah Ghazali, Nor Zuriati Amani Ab Rani, & Basri Abdul Talib
The Analysis of Vulnerability Faced by Gahai Agropolitan Participants
© 2019 by MIP 256
Table 6 EFA results Vulnerability/
Construct Indicator R -
Squared value
Cronbach`s α Value
C.R. Value
AVE Value
Factor Loading
Economic Income 0.644 0.887 0.922 0.748 0.809 Price of Crops
0.882
Damage of crops
0.809
Social and physical
Home condition
0.254 0.831 0.899 0.747
0.825
Home appliances
0.801
Basic facilities
0.769
Network connection
0.732
School truancy
0.830
Environment Flood 0.411 0.869 0.911 0.719 0.780 Drought 0.893 Storm 0.849 Disease 0.865
Note: Income: Losing the main source of income/main occupation; Price of crop: Damage of crops (rubber,
vegetables, livestock and others); Damage of crops: Damage of crop (rubber, vegetables, livestock and others);
Home condition: The home’s physical condition (narrow or shabby home); Home appliances: Lack of home
appliances; Basic facilities: Lack of basic facilities (religious facility, kindergarten, shop); Network connection:
Accesibility problems (road network, etc.); School truancy: School truancy problem Flood: Floods that damage
crops and properties; Drought: Drought affects agricultural productions; Storm: Storms that damage crops and
property; Disease: Crop diseases.
Furthermore, in assessing discriminant validity, the AVE construct must
be greater than the shared variance between the construct and other construct
models (Chin, 1998). Table 7 shows the correlation of the matrix with the
correlation value between the constructs representing the type of vulnerability
and the Square Root of AVE in the diagonal region. Based on Table 7, elements
outside diagonal are larger than elements inside diagonal based on rows and
columns. Thus, there is a discriminant validity.
Table 7 Correlation between construct and shared variance
Construct Environment Economic Social and Physical
Environment 0.782
Economic 0.641 0.848
Social and physical 0.766 0.675 0.865
PLANNING MALAYSIA
Journal of the Malaysia Institute of Planners (2019)
257 © 2019 by MIP
CONCLUSION
In conclusion, Gahai Agropolitan Project Participants face multi-dimensional
vulnerability in terms of economic, social and physical, and environmental
aspects. Only twelve indicators from 16 indicators are accepted as factors of
vulnerability in the Gahai Agropolitan Project. All variables of economic
vulnerability were accepted such as loss of income or major job, damage of crops
(rubber, vegetables, livestock and others) and falls in crop prices or commodity
(rubber and others). Meanwhile, for social and physical vulnerability, only five
variables were accepted as factors in Gahai Agropolitan Project which are the
physical condition of the house (narrow or shabby home), lack of home
appliances, lack of basic facilities (religious facility, kindergarten, and shops),
communication network problems and school truancy problems. There are four
indicators on the vulnerability of the environment, consisting of floods that
damage crops and property, the drought that affects agricultural production, storm
that damages crops and properties, and plant diseases. The CR value was between
0.899 and 0.922, and the CA value was 0.831 to 0.887, indicating constructs and
indicators reliability. The value of AVE, ranging from 0.719 to 0.748, shows that
all the items in the three constructs have internal consistency. Based on this study,
the vulnerability can be defined as a difficult situation faced by Gahai
Agropolitan Project participants that are affecting their lives. Therefore, the
Ministry of Rural Development (KKLW) and the Rubber Industry Smallholders
Development Authority (RISDA) need to pay more attention to reduce the
vulnerability to the participants of the agropolitan project, and help them to
increase their income and improve their lives.
ACKNOWLEDGEMENTS
The authors would like to thank the Universiti Kebangsaan Malaysia Mainstream
Research Grant (UKM-AP-2014-17) and the Universiti Kebangsaan Malaysia
Research University Grant (UKM-GUP-2015-050) for funding the fieldwork and
other research activity related to this project.
REFERENCES Arokia Nathen, A., Selvaratnam, D. P., & Abu Bakar, N. (2011). Hubungan tingkat
pendapatan dan kehidupan lestari: Kerangka konseptual. Persidangan
Kebangsaan Ekonomi Malaysia ke VI (PERKEM VI), Ekonomi Berpendapatan
Tinggi: Transformasi ke Arah Peningkatan Inovasi, Produktiviti dan Kualiti
Hidup, June 5-7, 2011, Melaka, Malaysia.
Chaudhuri, S. (2003). Assessing vulnerability to poverty: Concepts, empirical methods
and illustrative examples. Retrieved from
https://pdfs.semanticscholar.org/4461/840126dab19ab38692628d35de9516e6d
cc0.pdf.
Chin, W. W. (1998). The partial least squares approach to structural equation
modelling. Modern Methods for Business Research, 295(2), 295-336.
Mohd Khairi Ismail, Chamhuri Siwar, Rospidah Ghazali, Nor Zuriati Amani Ab Rani, & Basri Abdul Talib
The Analysis of Vulnerability Faced by Gahai Agropolitan Participants
© 2019 by MIP 258
Christiaensen, L. J., & Boisvert, R. N. (2000). On measuring household food
vulnerability: Case evidence from Northern Mali. Ithaca, NY: Department of
Agricultural, Resource, and Managerial Economics, Cornell University.
DFID (1999). Sustainable Livelihoods and Poverty Elimination. UK: Department for
International Development.
Economic Planning Unit. (2015). Rancangan Malaysia Kesebelas 2015-2020. Kuala
Lumpur: Jabatan Percetakan Negara.
Ghazali, R. (2017). Keterangkuman dan masyarakat saksama: Multidimensi
kemudahterancaman isi rumah B40. In Institut Tadbiran Awam Negara (Ed.).
Memperkasa sosioekonomi kelompok B40: Mendepani arus perdana (pp. 49-
64). Kuala Lumpur: Author.
Hadi, A. S., Idrus, S., Mohamed, A. F., & Harman Shah, A. H. (2006). Perubahan
persekitaran dan kemudahterancaman lembangan Langat. Bangi: Penerbit
UKM.
Henninger, N. (1998). Mapping and geographic analysis of poverty and human welfare:
Review and assessment. Report prepared for the UNEP-CGIAR Consortium for
Spatial Information. Washington, DC: World Resources Institute.
Ibrahim, A. Z., & Siwar, C. (2017). Kelestarian penghidupan petani luar bandar. Sintok:
Universiti Utara Malaysia
Idrus, S., Lim C. S., & Hadi, A. S. (2004). Kemudahterancaman (vulnerability) penduduk
terhadap perubahan guna tanah di Selangor. Malaysian Journal of
Environmental Management, 5: 79-98.
Kementerian Luar Bandar dan Wilayah [KKLW] (2012). Garis panduan pengurusan
ladang sejahtera projek agropolitan di bawah program lonjakan mega luar
bandar (PLMLB). Putrajaya: Auhtor.
Krejcie, R. V., & Morgan, D. W. (1970). Determining sample size for research
activities. Educational and psychological measurement, 30(3), 607-610.
Md Akhir, N., Azman, A., Hassan, N., & Md Akhir, N. H. ( 2017). Kajian penelitian
masalah mangsa bencana banjir disember 2014 di Kelantan. Journal of Social
Sciences and Humanities, Special Issue 3, 007.
Muyambo, F., Jordaan, A.J. & Bahta, Y.T., (2017). Assessing social vulnerability to
drought in South Africa: Policy implication for drought risk reduction. Jàmbá:
Journal of Disaster Risk Studies, 9(1), a326.
Omar, M., Samsudin, M., Yussof, I., & Halim, S. A. (2012). Kemudahterancaman dan
kelestarian hidup komuniti luar bandar: Satu penelitian dari sudut kerangka
kelestarian hidup. Journal of Tropical Marine Ecosystem, 2, 71-82.
Radin Firdaus, R. B., Ibrahim, A. Z., Siwar, C., & Jaafar, A. H. (2014). Penghidupan
petani padi dalam mendepani cabaran perubahan iklim: Peranan intervensi
kerajaan menerusi Skim Subsidi Harga Padi (SSHP). Kajian Malaysia, 32(2),
73-92.
Serrat, O, (2008). The sustainable livelihoods approach. Knowledge Solutions, November
2008, 1-4
Received: 17th April 2019. Accepted: 20th August 2019
1Professor at International Islamic University Malaysia. Email: [email protected] 259
PLANNING MALAYSIA:
Journal of the Malaysian Institute of Planners
VOLUME 17 ISSUE 2 (2019), Page 259 – 266
CONCEPT OF PRIVACY FROM ISLAMIC PERSPECTIVE IN FLOOD
EVACUATION CENTRE
Asiah Abdul Rahim1 & Wan Mohamad Amin W Seman2
1,2Kulliyyah of Architecture and Environmental Design
INTERNATIONAL ISLAMIC UNIVERSITY OF MALAYSIA
Abstract
The flood events in Kelantan during December 2014 were examples of disasters
in recent years that garnered national attention. Emergencies can occur with little
or no warning. Floods deprive families of basic food and shelter, and lead to
significant social and emotional impacts that linger long after the event. Every
year, schools and community areas have been used as evacuation centres. A
number of problems faced by the evacuees have been identified, especially in
terms of physical facilities such as the lack of privacy for women and families,
especially during night time. The objectives of this paper are as follows: (1) to
study on the concept of privacy from an Islamic Perspective; and (2) to assess
privacy in the context of a flood evacuation centre. The data gathered were
tabulated. The research also utilised secondary data from literature. Data were
analysed using content analysis and case studies. The data were analysed based
on issues raised. Recommendations and suggestion are posed on overcoming the
identified issues and problems. This research contributes a review of examples of
evacuation facilities that follow Islamic teaching in the context of privacy in
evacuation centres.
Keywords: privacy, islamic perspective, flood evacuation centre
Asiah Abdul Rahim & Wan Mohamad Amin W Seman
Concept of Privacy from Islamic Perspective in Flood Evacuation Centre
© 2019 by MIP 260
INTRODUCTION
Definition of Privacy from Islamic Perspective
In Islam, Qur’an and Sunnah (Hadith) are the primary sources of law and
references. Qur’an and Sunnah provide important Islamic teachings and
references on human privacy. As recorded in Hadith Arbain Nawawi, no. 12 by
Tirmidhi, Prophet (peace be upon him) said “From the perfection of a person’s
good faith in Islam is leaving alone what does not concern him”. The hadith
shows the importance of being determined and concentrated to issues relevant
and related to us to improve our capacity and capability.
Surah An-Nur, verses 27-28, mention that a person is not allowed to enter
another’s property if he or she does not have the permission from the property
owners. The verses emphasise that it is solely and completely in the hand of the
owner whether or not to allow someone to enter the area inside his/her house.
Here, the area is obstructed with blocking elements such as protected walls or
doors. Authorisation to deliver access limitation is explained in Surah An- Nur,
verse 58. Tafsir Tabari mentioned the general rule from this verse, which
indicated ‘the slave’ (whom your right hands possess) which can be either male
or female, as well as those who have not yet reached puberty, need to ask
permission if he or she wishes to access the area of ‘their master’, especially when
the master is taking a rest during three types of privacy. The three types of privacy
are (i) property, (ii) meeting, or (iii) conversation and evidence.
According to Marcus and Carter (2007), privacy is a clear specification
of what is at stake (what is being kept private) and the parties against which
privacy is being invoked (who should not be privy to the information being kept
private). Islam protects the privacy of people tremendously. Human beings
should be concerned only for their own responsibilities and their own businesses.
Flood Evacuation Centre
Floods cause the destruction of public facilities and properties. Based on the
National Security Council (NSC), the massive flood that happened in Kelantan
in 2014 was the worst in the history of Kelantan (Azlee, 2015). The water levels
at most flood hit area superseded the last biggest flood of 1967, and evacuation
and emergency sheltering were extremely challenging.
According to Bologna (2010), the safe evacuation of flood victims in
Malaysia is one of the most important emergency response activities after the
occurrence of floods or other disasters and hazards. Planning is a crucial
component in any safety and health program including emergency action (Nik
Nor Ronaidi, 2012).
The December 2014 Kelantan Flood was example of the natural disasters
in recent years that have garnered national attention. Emergencies can occur
suddenly with little or no warning. Such disasters deprive families of even the
PLANNING MALAYSIA
Journal of the Malaysia Institute of Planners (2019)
261 © 2019 by MIP
most basic needs such as food and shelter, and pose significant social and
emotional impacts that linger long after the event. Schools and community areas
have been used as evacuation centres. However a number of problems faced by
the evacuees have been identified, especially in terms of physical facilities, such
as lack of privacy for women and safety during night time. Privacy and safety are
the main factors indicating unsuitable evacuation area especially for families and
single women.
The Function of Flood Evacuation Centres
According to Somasundaram and Davies (2014), an evacuation centre is a place
where the communities of disaster affected areas assemble. McInerny (2012) also
added that evacuation centre is also equipped with technical, financial, social
assistance and emotional support. Davis (1978) said that evacuation centre also
is “a place used solely for receipt of service, or a staging point for future action”.
The identified services of evacuation centres include (Siti Falindah & Nik Nadrul
Hisham, 2015):
a. Food catering;
b. Health and safety;
c. Transportation, volunteers;
d. Site services;
e. Telecommunication; and
f. Special facilities for special needs.
RESEARCH BACKGROUND
Unsuitable evacuation centres are those which (The Malaysian Insider, 2014;
Said, Gapor, Samian, & Abd Aziz, 2013):
a. Use a school or multipurpose hall as evacuation centre;
b. Lack facilities and are not suitable for people to stay;
c. Have a shortage of essential necessity such as food;
d. Lack understanding between victims; and
e. Have overcrowded environment and insufficient and unsuitable
infrastructures and equipment.
The lack of consideration for the disabled community in evacuation
centre was described by a study by Asiah, Ismawi, Mohd Ramzi, Izawati and Che
Zulkhairi (2015) as follows:
a. Evacuation centres are completely non-universal and completely
inaccessible;
b. A lack of recognition and safety procedures in handling and locating frail
senior citizens, people with disabilities and patients with physical
conditions; and
Asiah Abdul Rahim & Wan Mohamad Amin W Seman
Concept of Privacy from Islamic Perspective in Flood Evacuation Centre
© 2019 by MIP 262
c. Lacking in privacy, safety and security, as well as a convenient privacy
design that ensure the well-being of relocated disaster victims.
The objectives of this research are (i) to study on the concept of privacy
and safety from Islamic Perspective in flood evacuation centres; and (ii) to assess
the implementation of the concept of privacy in flood evacuation centres. The
gathered data was tabulated. Secondary data was collected from literature review.
The data was analysed using content analysis and case studies.
IMPORTANCE OF PRIVACY IN FLOOD EVACUATION CENTRE
Among important elements in building emergency relief centre are personal
support and privacy area (Victoria Department of Human Services, 2013). The
flood evacuation centre must be designed to protect and maintain the privacy of
the affected people. The layout of the flood evacuation centre should have
separated space and boundary for both males and females. The concept of
boundary is important in planning and designing the architectural space (Abu-
Gazzeh, 1993). Flood evacuation centres serve as a temporary home for the
evacuees. Hence the centre must be designed with partitions that are convenient
and can be promptly put up during flood. The partition could be a wall or a curtain
depending on the size and structure of the flood evacuation centre.
Abu Gazzeh (1993) added that there are culture-specific, cognitively-
important practices that differ depending on the society in determining whether
to put partition or segregation in the space. The facilities must offer the flood
victims with individual living space to increase the level of privacy in the
evacuation centre. By having a separated area, the evacuees, especially women,
have the freedom to change clothes and sleep without fearing for their safety
against the opposite gender.
CURRENT PRACTICE OF FLOOD EVACUATION CENTRE IN
MALAYSIA
Mercy Malaysia – Evacuation Centre in Perkampungan MERCY Tualang,
Kuala Krai, Kelantan, Malaysia
Perkampungan MERCY Tualang has 32 houses with variety of sizes based on
evacuees’ family size. During early construction, each house was built to a
standard size, but as the household size of evacuees was different, MERCY
provided a renovation programme that expanded the spaces for more comfort to
accommodate larger family size.
Most of the family that stayed in Perkampungan MERCY Tualang were
the flood victims from Kampung Bekok and Tualang, Kuala Krai. Flood victims
tend to stay in Perkampungan MERCY Tualang around two years before they
move to their permanent houses. Perkampungan MERCY Tualang has been
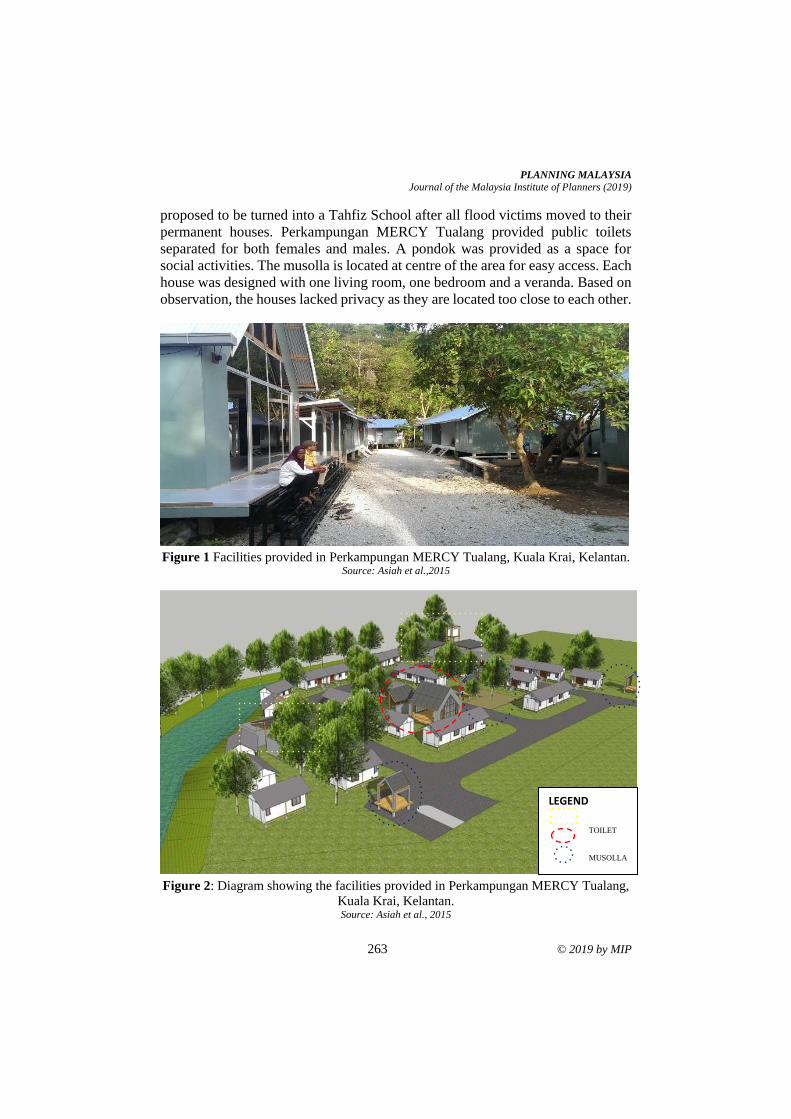
PLANNING MALAYSIA
Journal of the Malaysia Institute of Planners (2019)
263 © 2019 by MIP
proposed to be turned into a Tahfiz School after all flood victims moved to their
permanent houses. Perkampungan MERCY Tualang provided public toilets
separated for both females and males. A pondok was provided as a space for
social activities. The musolla is located at centre of the area for easy access. Each
house was designed with one living room, one bedroom and a veranda. Based on
observation, the houses lacked privacy as they are located too close to each other.
Figure 1 Facilities provided in Perkampungan MERCY Tualang, Kuala Krai, Kelantan.
Source: Asiah et al.,2015
Figure 2: Diagram showing the facilities provided in Perkampungan MERCY Tualang,
Kuala Krai, Kelantan. Source: Asiah et al., 2015
LEGEND
TOILET MUSOLLA
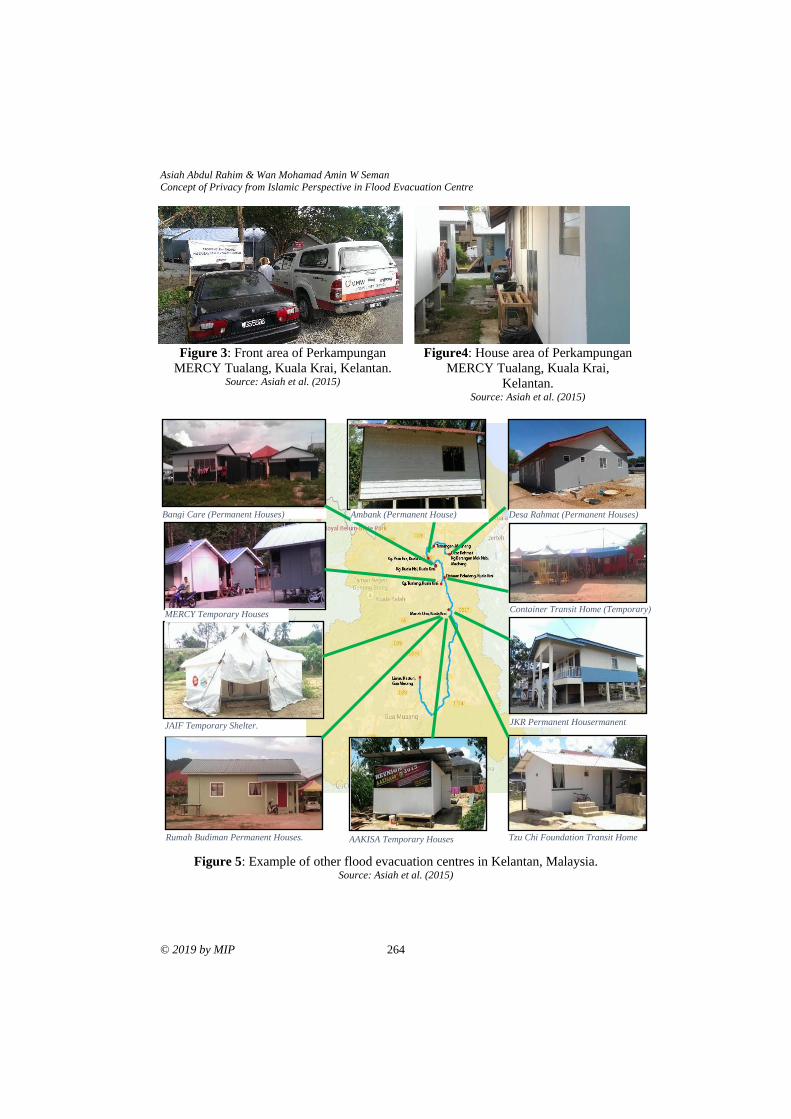
Asiah Abdul Rahim & Wan Mohamad Amin W Seman
Concept of Privacy from Islamic Perspective in Flood Evacuation Centre
© 2019 by MIP 264
Figure 3: Front area of Perkampungan
MERCY Tualang, Kuala Krai, Kelantan. Source: Asiah et al. (2015)
Figure4: House area of Perkampungan
MERCY Tualang, Kuala Krai,
Kelantan. Source: Asiah et al. (2015)
Figure 5: Example of other flood evacuation centres in Kelantan, Malaysia.
Source: Asiah et al. (2015)
Bangi Care (Permanent Houses)
JAIF Temporary Shelter.
Rumah Budiman Permanent Houses. AAKISA Temporary Houses
JKR Permanent Housermanent
houses.
Tzu Chi Foundation Transit Home
Container Transit Home (Temporary)
Desa Rahmat (Permanent Houses)
MERCY Temporary Houses
Ambank (Permanent House)
PLANNING MALAYSIA
Journal of the Malaysia Institute of Planners (2019)
265 © 2019 by MIP
According to Asiah et al. (2015), the shelters are divided into two
categories, which are permanent structure shelters and temporary structure
shelters. The weight of the building materials is an important factor. There is a
significant difference between heavy structures and lightweight structures. The
permanent structures are more comfortable compared to the temporary structures.
The temporary structures lacked privacy features. Temporary houses are not
comfortable to stay in as the building materials are not suitable for long stays.
Segregation between males and females is also an issue. The distance between
houses and the building material is not responsive to the lack of privacy issues.
CONCLUSION AND RECOMMENDATION
Based on the findings, it can be concluded that current evacuation centre is not
properly designed to meet the need of people especially in terms of privacy. In
Islamic teaching, privacy is an important architectural factor as it relates to
covering the aurah. It is an obligation for Muslims to cover their aurah. Since a
majority of Malaysians are Muslims, privacy features in evacuation centres
should be taken seriously. This paper contributes a review of the existing
evacuation facilities that need to be improved in terms of privacy based on Islamic
teachings.
It is time for flood evacuation centres to be properly designed with careful
consideration of the needs of the flood evacuees. The evacuation centre should
be equipped with convenient facilities and accommodation that prevent chances
of privacy intrusion. The right to privacy should be taken seriously when creating
temporary living areas in evacuation centres. The study recommends
improvement in the following areas: accessible toilets in mosques, community
halls and schools; better connectivity between buildings and facilities; and
privacy-sensitive design of temporary accommodation.
REFERENCES Abu-Gazzeh, T. (1993). Privacy as the basis of architectural planning in the Islamic
culture of Saudi Arabia. Architectural & Behavioural Journal, 11(30), 269-288.
Asiah, A. R., Ismawi, Z., Mohd Ramzi, M. H., Izawati, T., & Che Zulkhairi, A. (2015).
User perception of mobile homes for shelter relief centre as a respond for flood
disaster preparedness. (n.d.): Kementerian Pengajian Tinggi.
Azlee, A. (2015). Worst flood in Kelantan, confirms National Security Council (NSC).
Retrieved from Malaymail at https://www.malaymail.com/s/813959/worst-
floods-in-kelantan-confirms-nsc
Bologna, R. (2010). Planning and designing post disaster transitional housing: The case
of the Abruzzo (Italy) earthquake. Proceedings TG63 – Special Track 18th CIB
World Building Congress, Balford, UK.
Davis, I. R. (1978). Part one: Emergency shelter. The Role of Technology in International
Disaster Assistance: Proceedings of the Committee on International Disaster
Assistance Workshop. March 1977, Washington, DC.
Asiah Abdul Rahim & Wan Mohamad Amin W Seman
Concept of Privacy from Islamic Perspective in Flood Evacuation Centre
© 2019 by MIP 266
Marcus, J. S., & Carter, K. (2007). Comparison of privacy and trust policies in the area
of electronic communications. (n.p.): (n.p.).
McInerny, T. (2012). Emergency sheltering in Australia: Considerations beyond the four
walls and a roof. Retrieved from
https://www.redcross.org.au/getmedia/23ed0b6d-af70-4abb-bdf8-
d1e32f84d451/Emergency-sheltering-poster.pdf.aspx.
Nik Nor Ronaidi, N. M. (2012). Emergency response planning and implementation
(PowerPoint slides). Retrieved from
https://www.slideshare.net/NikRonaidi/emergency-response-planning-and-
implementation-15685052
Said, M. Z, Gapor, S. A., Samian, M. N, & Aziz, A. M. A, (2013). Konflik di pusat
pemindahan banjir: Kajian kes di Daerah Padang Terap, Kedah. Malaysia
Journal of Society and Space, 9(1), 61-69.
Siti Falindah, P., & Nik Nadrul Hisham, N. R. (2015). The perceived quality and
satisfaction with services at evacuation centres: The case of Kemaman
Evacuation Centre. South East Asia Journal of Contemporary Business,
Economics and Law, 8(2), 21-29.
Somasundaram, T., & Davies, J. B. (2014). Collaboration to improve evacuation centre
operations in Queensland. International Journal of Disaster Resilience in the
Built Environment, 5(3), 305-317.
The Malaysian Insider (2014)
http://www.themalaysianinsider.com/malaysia/article/over-65000-evacuated-
as-floods-worsenbernama
Victoria Department of Human Services (2013). Emergency relief handbook: A planning
guide. Melbourne: Author
Received: 12th January 2019. Accepted: 2nd August 2019
1Research Officer at Forest Research Institute Malaysia (FRIM). Email: [email protected] 267
PLANNING MALAYSIA:
Journal of the Malaysian Institute of Planners
VOLUME 17 ISSUE 2 (2019), Page 267 – 279
AWARENESS AND KNOWLEDGE OF TPO (ACT 172) AMONG
CONSTRUCTION INDUSTRY PROFESSIONALS AND LOCAL
PLANNING AUTHORITY PERSONNEL IN KLANG VALLEY
Nik Adlin Nik Mohamed Sukri1, Wan Tarmeze Wan Ariffin2
& Noriah Othman3
1,2Development Project Management
FOREST RESEARCH INSTITUTE MALAYSIA
3Faculty of Architecture, Planning and Surveying
UNIVERSITI TEKNOLOGI MARA
Abstract
The need to care for trees, especially in urban areas, has become increasingly
important for countries like Malaysia which are developing rapidly. Recognising
the fact that construction activities could put trees at risks of death and damage,
the Malaysian government introduced Tree Preservation Order (Act 172) in 1996.
However, there were cases occurred afterwards whereby matured trees had been
cut down for development without consent of the local authorities. This situation
has raised many questions about the effectiveness of the TPO (Act 172)
implementation, including on how far the TPO (Act 172) has been publicised and
understood by those related to the construction industry, a pre-requisite for
successful legislative implementation. This study assesses the current awareness
and knowledge of the TPO (Act 172) among 60 professionals in the construction
industry (PCI) and 47 personnel in local authorities (PLA) within Klang Valley
through a questionnaire survey. The results show that the awareness level of TPO
(Act 172) among PLA respondents was higher than that of PCI. While most of
the PLA got acquainted with the TPO (Act 172) through their organisations, most
of the PCI learned it from friends and social medias. It is recommended that the
government should be more active in publicising the TPO (Act 172) such as
through mass media and awareness campaigns.
Keywords: Tree Preservation Order (TPO), Act 172, local planning authority,
construction industry, tree preservation
Nik Adlin Nik Mohamed Sukri, Wan Tarmeze Wan Ariffin & Noriah Othman Awareness and Knowledge of TPO (Act 172) Among Construction Industry Professionals and Local Planning Authority Personnels in Klang Valley
© 2019 by MIP 268
INTRODUCTION
In 2016, the value of Malaysian construction projects was reported to reach RM83
billion (Kaur, 2015). Mega construction projects that are being carried out in big
cities such as Kuala Lumpur and the surrounding municipalities could increase
the possibility of tree damage, and to certain extent, of tree death, if care was not
taken. Most of the irregularities and mistakes during construction work that
threaten the trees can be avoided through appropriate construction project
management, which includes the planning and execution of project activities
(Ziemiańska & Suchocka, 2013).
Malaysia has introduced Tree Preservation Order (TPO) in the Town and
Country Planning Act 1976 that gives power to the local authorities to preserve
any tree or a group of trees and to protect the tress from being felled, topped,
lopped, uprooted, damaged or destroyed, for instance, during construction or as
the results of development activities. By implementing the TPO (Act 172), it is
expected that all the involved parties have understood the order and that all trees
are protected during construction projects. However, as elaborated by Nik Adlin,
Noriah and Wan Termeze (2017), there have been cases from time to time, such
as of the Melaka Raya in 2015 and of the Jalan Cochraine in 2016, in which
matured trees were felled without the local authorities’ consent. Such cases have
raised questions on whether or not TPO has been effectively implemented.
Houde (1997) suggests that for a tree preservation law to be effective,
each staff in a local authority must be aware of requirements of tree preservation.
In the context of Malaysia, it is important to ensure that the TPO (Act 172) is well
understood by the local authorities before it is enforced to the construction
industry for better protection of trees. With this in mind, a study was conducted,
through a questionnaire survey, on the stakeholders of the public and private
sectors related to construction activities to determine their awareness and
knowledge on TPO (Act 172). The results could give some insights on the status-
quo of publicity efforts carried out by the relevant government agencies to ensure
that TPO (Act 172) is well understood by the public, and especially those in the
construction industry.
MATERIALS AND METHODS
Questionnaire Survey
General objective of the questionnaire survey was to evaluate the level of
awareness and knowledge on TPO (Act 172) among the professionals in
construction industry (PCI) and personnel of local planning authorities (PLA)
within the Klang Valley. Awareness of TPO (Act 172) was defined as knowing
that the legislation exists. Meanwhile, the level of knowledge on TPO (Act 172)
was determinable by how thorough its document has been read and understood.
PLANNING MALAYSIA
Journal of the Malaysia Institute of Planners (2019)
269 © 2019 by MIP
Survey Respondents
Information about companies (contractors) in the construction industry within
Klang Valley was obtained through CIDB website (http://smb.cidb.gov.my). To
ease the logistic (nearby the main author’s office), only contractors in Gombak
area were surveyed. They were from the G7 class of Civil Construction category
and of CE01 Road & Pavement Works (Pembinaan Jalan dan Pavmen) and CE14
Landscapes Works (Landskap di Luar Bangunan) sub-category groups (Table 1).
These two sub-category groups were selected because they would be the ones
who had to deal with decisions regarding the existing trees at the construction
sites.
Table 1 The survey respondents
Group Respondents Remarks PCI
Contractors Class: G7, Category: Civil Construction, Sub-categories: CE01 & CE14, Region: Gombak
PLA
Local Authorities within Klang Valley
1) Kuala Lumpur City Hall (DBKL) 2) Perbadanan Putrajaya (PPJ) 3) Shah Alam City Council (MBSA) 4) Subang Jaya Municipal Council (MPSJ) 5) Petaling Jaya City Council (MBPJ) 6) Selayang Municipal Council (MPS) 7) Ampang Jaya Municipal Council (MPAJ) 8) Klang Municipal Council (MPK) 9) Kajang Municipal Council (MPKj) 10) Sepang Municipal Council (MPSp) 11) Hulu Selangor District Council (MDHS)
The CIDB website accessed on February 2017 showed that they were 77
companies listed in the groups. Out of the 77, 23 companies were not shortlisted
because their registered addresses were not in Gombak, but somewhere else in
Puchong, Kelang, Petaling Jaya, Seri Kembangan, Puncak Alam, Cheras and
Shah Alam. The rest of the companies were contacted through phone calls. 51 of
the companies said that they were willing to participate and arrangement were
made to deliver the PCI survey questionnaire forms by hand. Two survey forms
were then delivered to each of these companies. From the 102 copies, only 60
PCI survey forms were answered and returned (collected at sites).
For the PLA survey, information about each local authority were
obtained from their websites, for instance, www.mpaj.gov.my (Majlis
Perbandaran Ampang Jaya), www.mpkj.gov.my (Majlis Perbandaran Kajang)
and www.ppj.gov.my (Perbadanan Putrajaya). Through the organisation chart
of each local authority, the number of personnel from departments most related
to the TPO (Act 172), such as Landscape and Town Planning, was determined as
well as the number of respondents. A phone call was made to each local authority
and a contact person was appointed to receive 6 to 8 copies of the questionnaire
forms to be distributed to related personnel in the departments. Out of 70 copies

Nik Adlin Nik Mohamed Sukri, Wan Tarmeze Wan Ariffin & Noriah Othman Awareness and Knowledge of TPO (Act 172) Among Construction Industry Professionals and Local Planning Authority Personnels in Klang Valley
© 2019 by MIP 270
distributed, the study was able to get back 47 PLA survey forms. Many of the
survey forms had not been returned because some of the targeted respondents
were working outside of the office.
Questionnaire Form
The questions asked and the choices of answer in the survey form are as shown
in Table 2. The questions were grouped into five, each with different intentions:
a) as pre-requisite (Q1), b) to know the sources of information (Q2), c) confirming
the knowledge (Q3 to Q6), d) to reinstate the good attitude towards trees and the
importance of the TPO (Act 172) (Q7), and e) to allow self-evaluation by the
respondents (Q8).
Table 2 Questions and the choices of answer
No. Question Choices of aAnswer
Q1
Do you know or have heard
of the Tree Preservation
Order?
a. Yes
b. No
Q2
How do you know TPO or
where have you heard about
it? (can choose more than one
answer)
a. Head office/management
b. Radio/TV/newspaper
c. Friends/social media
d. Others
Q3 TPO (Act 172) is part of the
following Act:
a. Akta Bandaraya Kuala Lumpur 1971
b. Akta Kualiti Alam Sekitar 1974
c. Akta Perancangan Bandar dan Desa 1976
d. Combination of the above Acts
Q4 TPO is an order: (can choose
more than one answer)
a. Not to cut down all trees
b. Not to cut down preserved trees
c. Not to cut down trees of a girth > 0.8 m
d. To cut down dead trees
e. To cut down dangerous trees
f. To replace the trees that have been cut down
Q5
In the TPO (Act 172),
‘felling a tree’ includes
cutting down, topping,
lopping, uprooting, damaging
or destroying a tree.
a. Agree
b. Disagree
Q6
If found guilty of violating
the rules of the TPO, one can
be (can choose more than one
answer)
a. Fined RM100,000
b. Jailed for 6 months
c. Fined RM100,000 and jailed for 6 months
d. Fined not more than RM10,000
e. Jailed for not more than 6 weeks
Q7
Trees are important, therefore
I agree that (can choose more
than one answer)
a. The TPO is implemented by the Govt.
b. The developers and contractors are to
comply with the TPO as much as possible.
PLANNING MALAYSIA
Journal of the Malaysia Institute of Planners (2019)
271 © 2019 by MIP
c. The Govt is to ensure that the TPO and the
regulations are understood by the people
Q8
The level of my knowledge
and understanding of TPO
are:
a. High
b. Medium
c. Low
The first question was very straightforward, and the answer would decide
whether or not the respondent’s next answers were to be taken into consideration.
In other words, if a respondent answered “No” for question number 1, then the
rest of his answers would not be used. Question number 2 was to know how the
respondents were informed about the TPO (Act 172), whether from their
organisation, mass-media (radio, TV, newspaper), friends (social media) or other
sources. The given choices of answer would provide bases in determining the
effectiveness of roles played and methods used by the respective parties
responsible for the publicity of the TPO (Act 172).
Questions number 3 to 6 were designed to evaluate whether or not the
respondents have read or seen statements of the TPO (Act 172). If they had, albeit
briefly, then the selected answer for question number 3 must be “c. Akta
Perancangan Bandar dan Desa 1976” (Town and Country Planning Act 1976).
Those who have answered other than “c.” could be considered as never read or
seen the TPO (Act 172) statements. The logic behind this assumption was that
the TPO (Act 172) is part of the Akta Perancangan Bandar dan Desa 1976, thus
without reading the Act 172, one would not have an idea about the Tree
Preservation Order.
For questions 4 to 6, only those who understood the TPO (Act 172)
statements, whether generally or thoroughly, could select the right answers. For
example, in question 4, the most accurate answer is “b. Not to cut down preserved
trees” (see clause 35A (1) and (2a) on page 60 of the Act 172). Furthermore, for
question 5, the respondents who had thoroughly read and understood the TPO
(Act 172) (Laws of Malaysia, 2006), especially the clause “felling a tree” includes
cutting down, topping, lopping, uprooting, damaging or destroying a tree;” of Part
1 Interpretation 2. (1) on page 10 could pick the right answer which is “a. Agree”.
Question 6 was related to the clause 35A (4) on page 61 which says “Any person
who contravenes any provision in the tree preservation order commits an offence
and is liable, on conviction, to a fine not exceeding one hundred thousand ringgit
or to imprisonment for a term not exceeding six months or to both.”. As such, the
right answers for question 6 are “a.”, “b.”, and “c.”.
Question 7 was to reinstate, subliminally, the notion among the
respondents that trees are important, therefore the TPO (Act 172) must be
seriously promoted, implemented and enforced to ensure that it will be effectively
protecting the trees. Lastly, through question 8, the respondents could declare
their levels of knowledge and understanding of the TPO (Act 172) as either high,
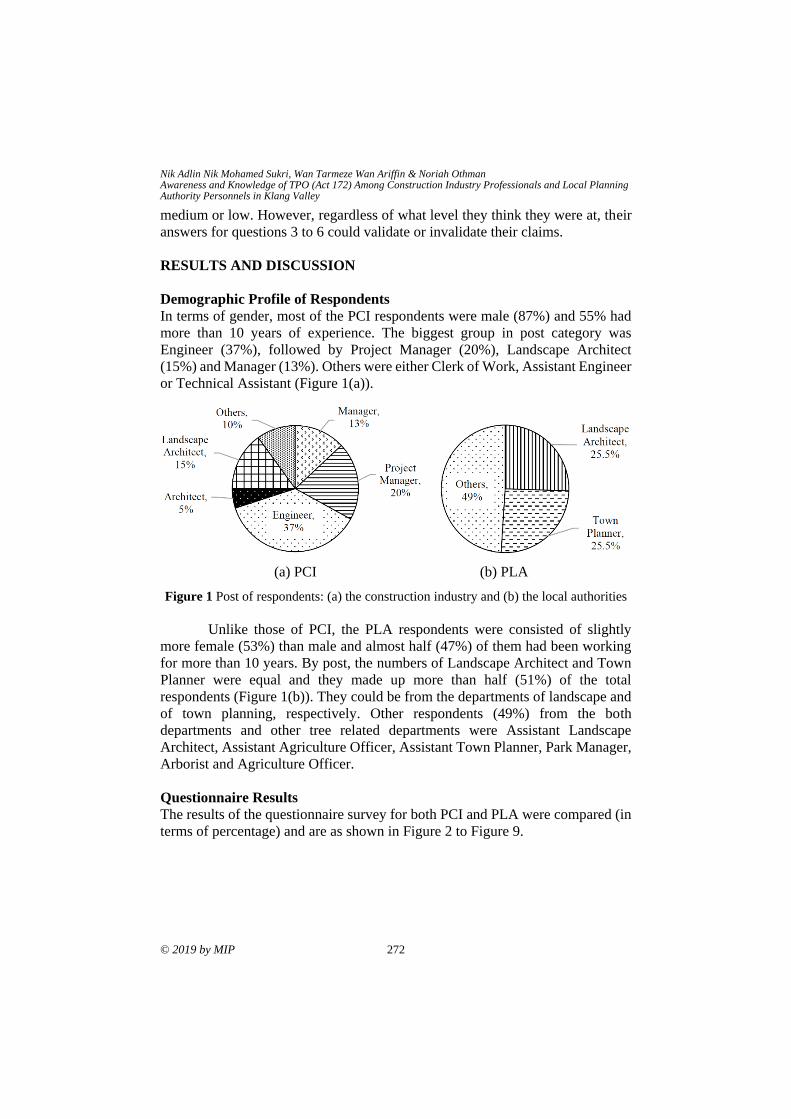
Nik Adlin Nik Mohamed Sukri, Wan Tarmeze Wan Ariffin & Noriah Othman Awareness and Knowledge of TPO (Act 172) Among Construction Industry Professionals and Local Planning Authority Personnels in Klang Valley
© 2019 by MIP 272
medium or low. However, regardless of what level they think they were at, their
answers for questions 3 to 6 could validate or invalidate their claims.
RESULTS AND DISCUSSION
Demographic Profile of Respondents
In terms of gender, most of the PCI respondents were male (87%) and 55% had
more than 10 years of experience. The biggest group in post category was
Engineer (37%), followed by Project Manager (20%), Landscape Architect
(15%) and Manager (13%). Others were either Clerk of Work, Assistant Engineer
or Technical Assistant (Figure 1(a)).
Figure 1 Post of respondents: (a) the construction industry and (b) the local authorities
Unlike those of PCI, the PLA respondents were consisted of slightly
more female (53%) than male and almost half (47%) of them had been working
for more than 10 years. By post, the numbers of Landscape Architect and Town
Planner were equal and they made up more than half (51%) of the total
respondents (Figure 1(b)). They could be from the departments of landscape and
of town planning, respectively. Other respondents (49%) from the both
departments and other tree related departments were Assistant Landscape
Architect, Assistant Agriculture Officer, Assistant Town Planner, Park Manager,
Arborist and Agriculture Officer.
Questionnaire Results
The results of the questionnaire survey for both PCI and PLA were compared (in
terms of percentage) and are as shown in Figure 2 to Figure 9.
(a) PCI (b) PLA
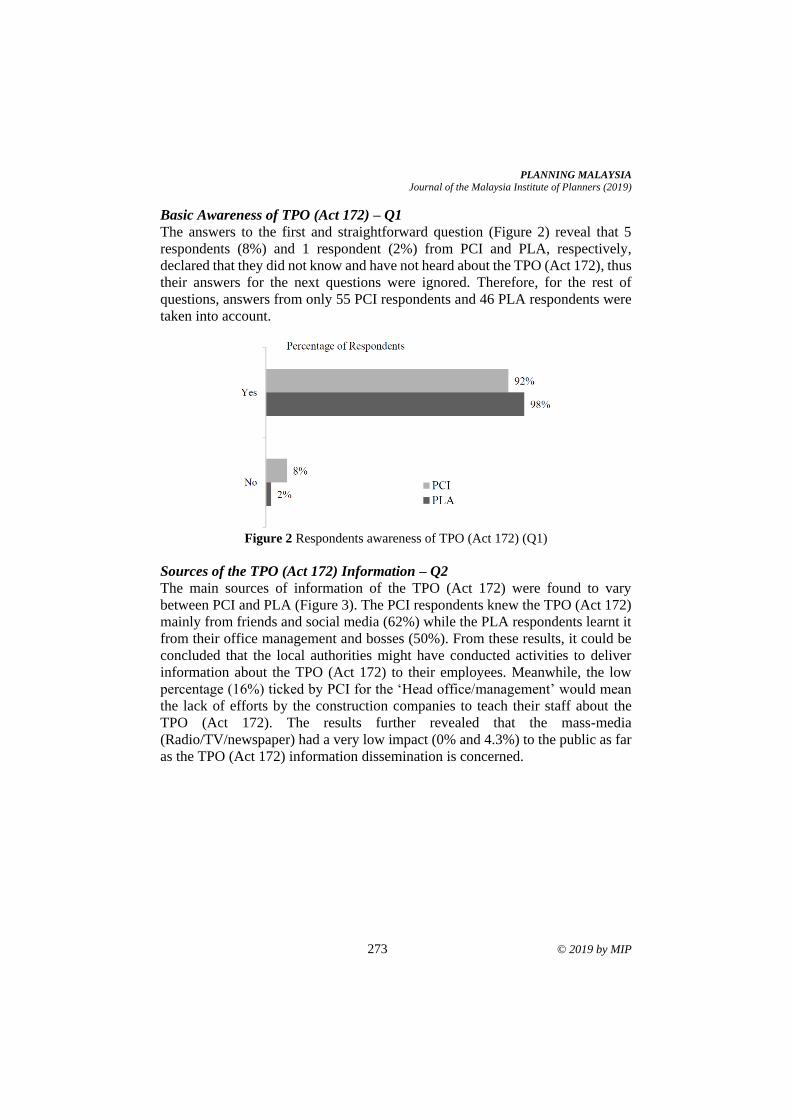
PLANNING MALAYSIA
Journal of the Malaysia Institute of Planners (2019)
273 © 2019 by MIP
Basic Awareness of TPO (Act 172) – Q1
The answers to the first and straightforward question (Figure 2) reveal that 5
respondents (8%) and 1 respondent (2%) from PCI and PLA, respectively,
declared that they did not know and have not heard about the TPO (Act 172), thus
their answers for the next questions were ignored. Therefore, for the rest of
questions, answers from only 55 PCI respondents and 46 PLA respondents were
taken into account.
Figure 2 Respondents awareness of TPO (Act 172) (Q1)
Sources of the TPO (Act 172) Information – Q2
The main sources of information of the TPO (Act 172) were found to vary
between PCI and PLA (Figure 3). The PCI respondents knew the TPO (Act 172)
mainly from friends and social media (62%) while the PLA respondents learnt it
from their office management and bosses (50%). From these results, it could be
concluded that the local authorities might have conducted activities to deliver
information about the TPO (Act 172) to their employees. Meanwhile, the low
percentage (16%) ticked by PCI for the ‘Head office/management’ would mean
the lack of efforts by the construction companies to teach their staff about the
TPO (Act 172). The results further revealed that the mass-media
(Radio/TV/newspaper) had a very low impact (0% and 4.3%) to the public as far
as the TPO (Act 172) information dissemination is concerned.
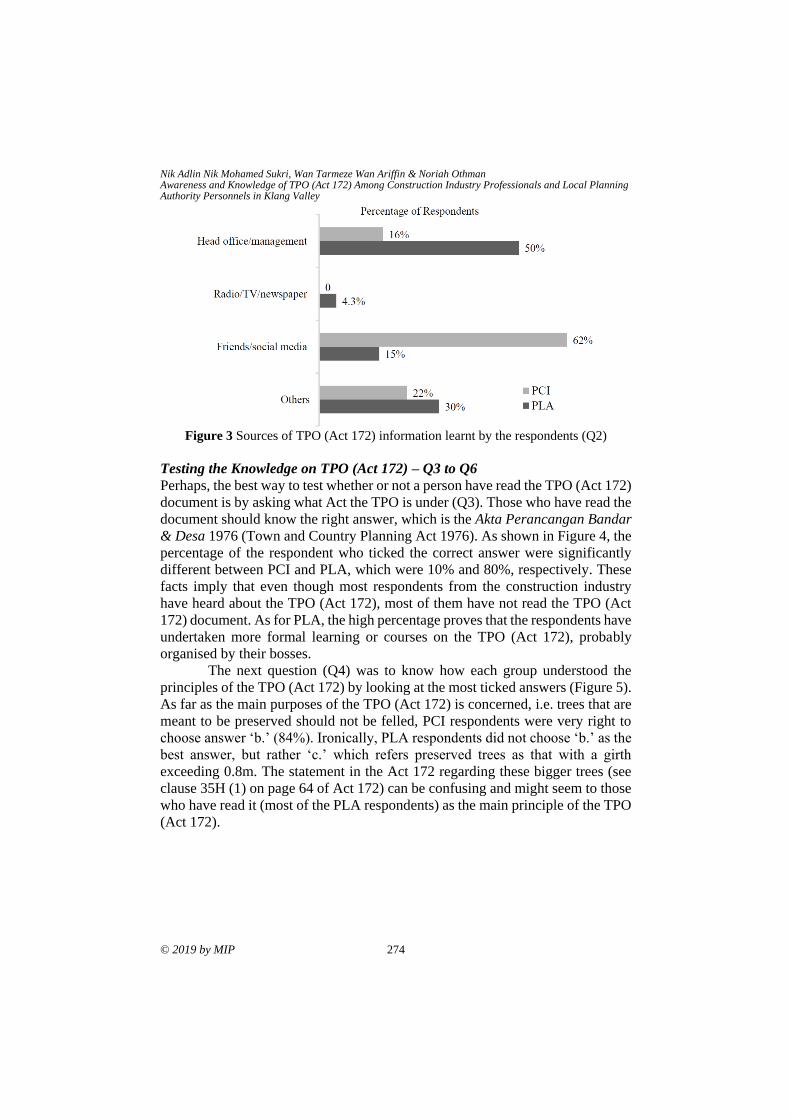
Nik Adlin Nik Mohamed Sukri, Wan Tarmeze Wan Ariffin & Noriah Othman Awareness and Knowledge of TPO (Act 172) Among Construction Industry Professionals and Local Planning Authority Personnels in Klang Valley
© 2019 by MIP 274
Figure 3 Sources of TPO (Act 172) information learnt by the respondents (Q2)
Testing the Knowledge on TPO (Act 172) – Q3 to Q6
Perhaps, the best way to test whether or not a person have read the TPO (Act 172)
document is by asking what Act the TPO is under (Q3). Those who have read the
document should know the right answer, which is the Akta Perancangan Bandar
& Desa 1976 (Town and Country Planning Act 1976). As shown in Figure 4, the
percentage of the respondent who ticked the correct answer were significantly
different between PCI and PLA, which were 10% and 80%, respectively. These
facts imply that even though most respondents from the construction industry
have heard about the TPO (Act 172), most of them have not read the TPO (Act
172) document. As for PLA, the high percentage proves that the respondents have
undertaken more formal learning or courses on the TPO (Act 172), probably
organised by their bosses.
The next question (Q4) was to know how each group understood the
principles of the TPO (Act 172) by looking at the most ticked answers (Figure 5).
As far as the main purposes of the TPO (Act 172) is concerned, i.e. trees that are
meant to be preserved should not be felled, PCI respondents were very right to
choose answer ‘b.’ (84%). Ironically, PLA respondents did not choose ‘b.’ as the
best answer, but rather ‘c.’ which refers preserved trees as that with a girth
exceeding 0.8m. The statement in the Act 172 regarding these bigger trees (see
clause 35H (1) on page 64 of Act 172) can be confusing and might seem to those
who have read it (most of the PLA respondents) as the main principle of the TPO
(Act 172).
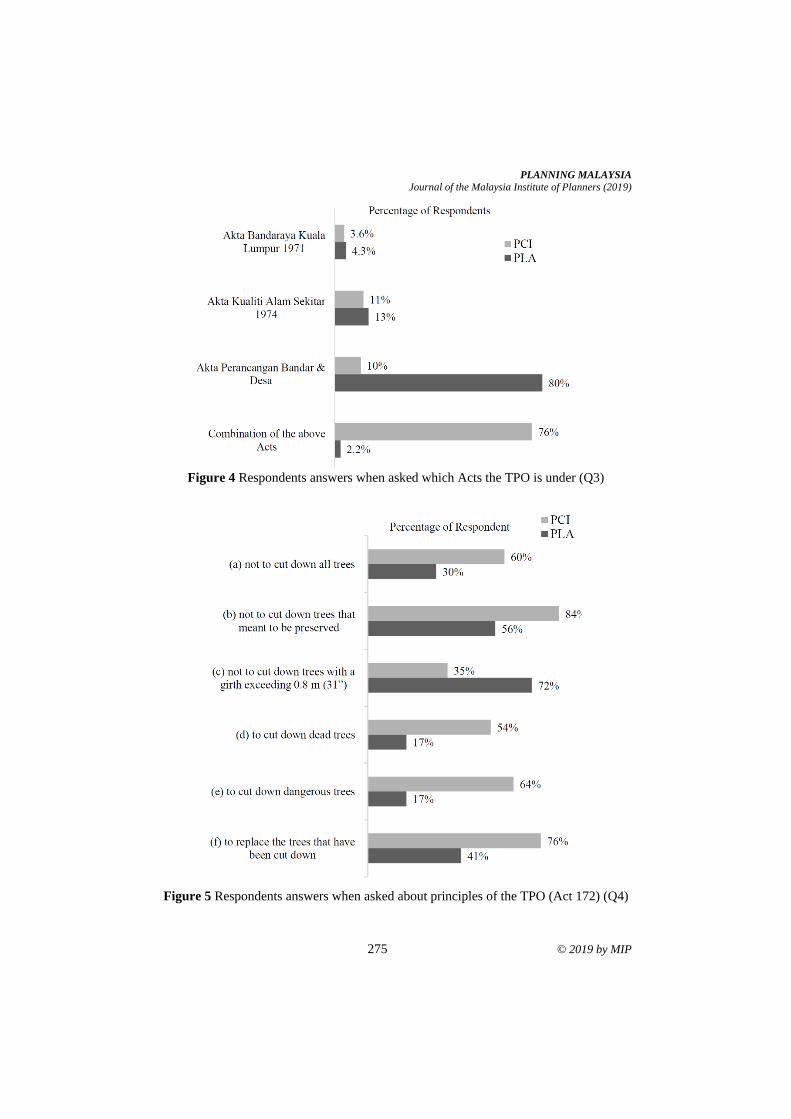
PLANNING MALAYSIA
Journal of the Malaysia Institute of Planners (2019)
275 © 2019 by MIP
Figure 4 Respondents answers when asked which Acts the TPO is under (Q3)
Figure 5 Respondents answers when asked about principles of the TPO (Act 172) (Q4)
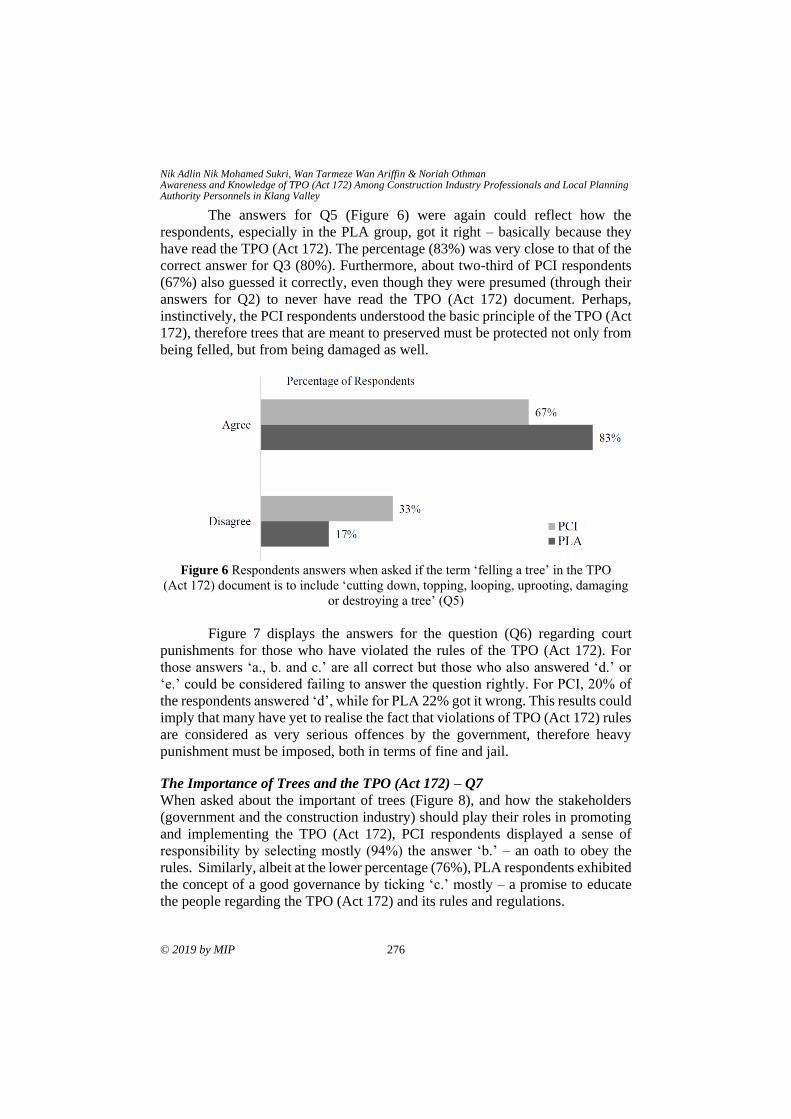
Nik Adlin Nik Mohamed Sukri, Wan Tarmeze Wan Ariffin & Noriah Othman Awareness and Knowledge of TPO (Act 172) Among Construction Industry Professionals and Local Planning Authority Personnels in Klang Valley
© 2019 by MIP 276
The answers for Q5 (Figure 6) were again could reflect how the
respondents, especially in the PLA group, got it right – basically because they
have read the TPO (Act 172). The percentage (83%) was very close to that of the
correct answer for Q3 (80%). Furthermore, about two-third of PCI respondents
(67%) also guessed it correctly, even though they were presumed (through their
answers for Q2) to never have read the TPO (Act 172) document. Perhaps,
instinctively, the PCI respondents understood the basic principle of the TPO (Act
172), therefore trees that are meant to preserved must be protected not only from
being felled, but from being damaged as well.
Figure 6 Respondents answers when asked if the term ‘felling a tree’ in the TPO
(Act 172) document is to include ‘cutting down, topping, looping, uprooting, damaging
or destroying a tree’ (Q5)
Figure 7 displays the answers for the question (Q6) regarding court
punishments for those who have violated the rules of the TPO (Act 172). For
those answers ‘a., b. and c.’ are all correct but those who also answered ‘d.’ or
‘e.’ could be considered failing to answer the question rightly. For PCI, 20% of
the respondents answered ‘d’, while for PLA 22% got it wrong. This results could
imply that many have yet to realise the fact that violations of TPO (Act 172) rules
are considered as very serious offences by the government, therefore heavy
punishment must be imposed, both in terms of fine and jail.
The Importance of Trees and the TPO (Act 172) – Q7
When asked about the important of trees (Figure 8), and how the stakeholders
(government and the construction industry) should play their roles in promoting
and implementing the TPO (Act 172), PCI respondents displayed a sense of
responsibility by selecting mostly (94%) the answer ‘b.’ – an oath to obey the
rules. Similarly, albeit at the lower percentage (76%), PLA respondents exhibited
the concept of a good governance by ticking ‘c.’ mostly – a promise to educate
the people regarding the TPO (Act 172) and its rules and regulations.
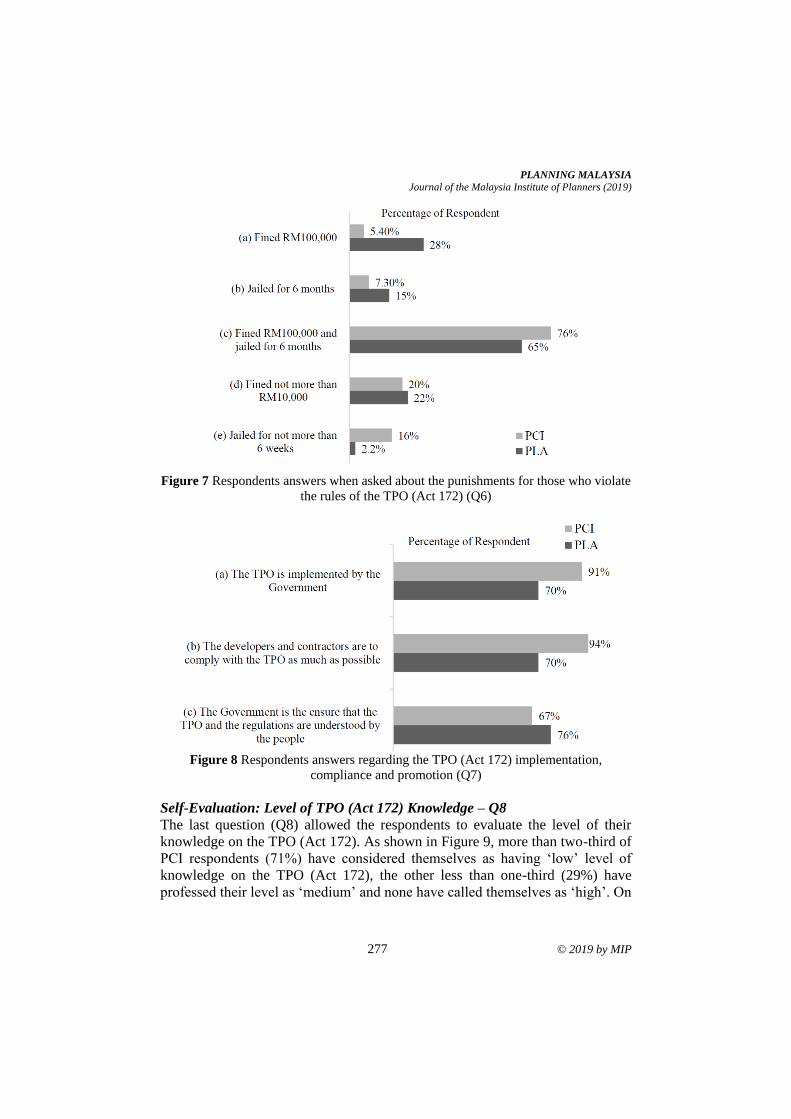
PLANNING MALAYSIA
Journal of the Malaysia Institute of Planners (2019)
277 © 2019 by MIP
Figure 7 Respondents answers when asked about the punishments for those who violate
the rules of the TPO (Act 172) (Q6)
Figure 8 Respondents answers regarding the TPO (Act 172) implementation,
compliance and promotion (Q7)
Self-Evaluation: Level of TPO (Act 172) Knowledge – Q8
The last question (Q8) allowed the respondents to evaluate the level of their
knowledge on the TPO (Act 172). As shown in Figure 9, more than two-third of
PCI respondents (71%) have considered themselves as having ‘low’ level of
knowledge on the TPO (Act 172), the other less than one-third (29%) have
professed their level as ‘medium’ and none have called themselves as ‘high’. On
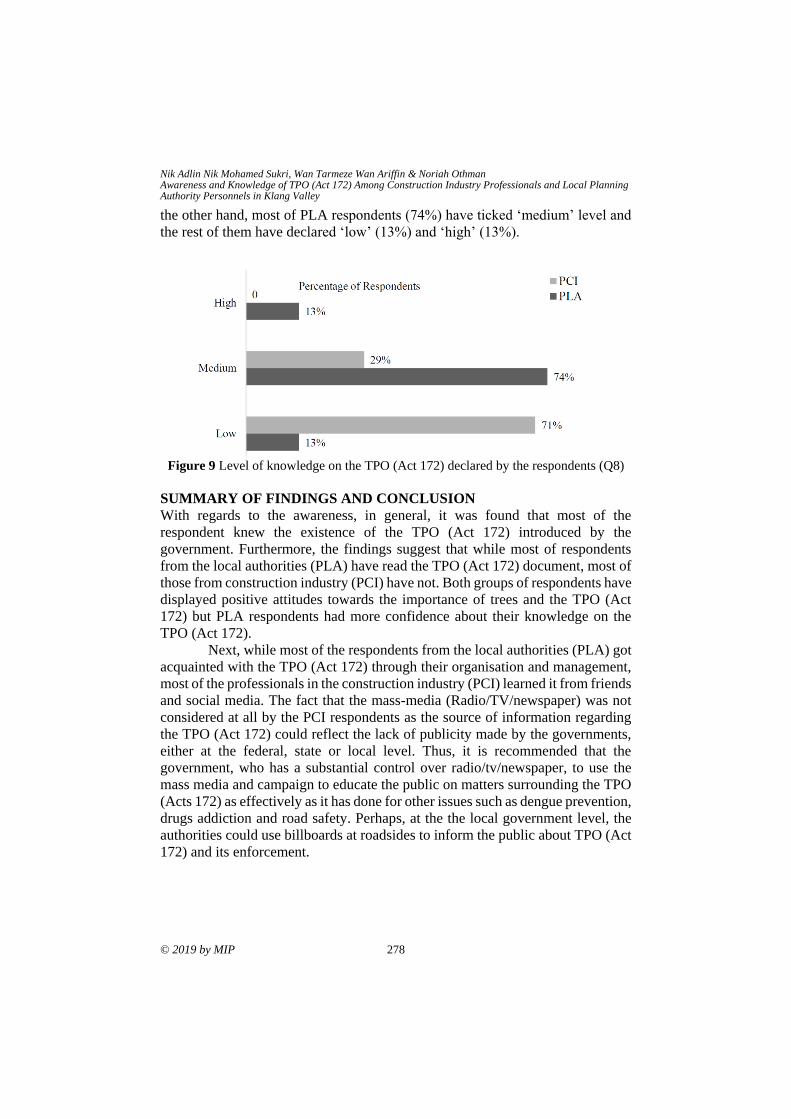
Nik Adlin Nik Mohamed Sukri, Wan Tarmeze Wan Ariffin & Noriah Othman Awareness and Knowledge of TPO (Act 172) Among Construction Industry Professionals and Local Planning Authority Personnels in Klang Valley
© 2019 by MIP 278
the other hand, most of PLA respondents (74%) have ticked ‘medium’ level and
the rest of them have declared ‘low’ (13%) and ‘high’ (13%).
Figure 9 Level of knowledge on the TPO (Act 172) declared by the respondents (Q8)
SUMMARY OF FINDINGS AND CONCLUSION
With regards to the awareness, in general, it was found that most of the
respondent knew the existence of the TPO (Act 172) introduced by the
government. Furthermore, the findings suggest that while most of respondents
from the local authorities (PLA) have read the TPO (Act 172) document, most of
those from construction industry (PCI) have not. Both groups of respondents have
displayed positive attitudes towards the importance of trees and the TPO (Act
172) but PLA respondents had more confidence about their knowledge on the
TPO (Act 172).
Next, while most of the respondents from the local authorities (PLA) got
acquainted with the TPO (Act 172) through their organisation and management,
most of the professionals in the construction industry (PCI) learned it from friends
and social media. The fact that the mass-media (Radio/TV/newspaper) was not
considered at all by the PCI respondents as the source of information regarding
the TPO (Act 172) could reflect the lack of publicity made by the governments,
either at the federal, state or local level. Thus, it is recommended that the
government, who has a substantial control over radio/tv/newspaper, to use the
mass media and campaign to educate the public on matters surrounding the TPO
(Acts 172) as effectively as it has done for other issues such as dengue prevention,
drugs addiction and road safety. Perhaps, at the the local government level, the
authorities could use billboards at roadsides to inform the public about TPO (Act
172) and its enforcement.
PLANNING MALAYSIA
Journal of the Malaysia Institute of Planners (2019)
279 © 2019 by MIP
ACKNOWLEDGEMENT
The authors would like to extent their sincere gratitude towards all the
construction companies and the local authorities for allowing their staff to
participate in the survey.
REFERENCES Houde, J. (1997). Public property tree preservation. Journal of Arboriculture, 23(2), 83-
86.
Kaur, G. (2015, December 29). Construction sector to be busy in 2016 with projects worth
RM83bil. The Star Online. Retrieved from
https://www.thestar.com.my/business/business-news/2015/12/29/jobs-flow-to-
drive-construction-sector
Nik Adlin, N. M. S., Noriah, O., & Wan Tarmeze, W. A. (2017). A Review on the needs
to improve Malaysian Tree Preservation Order (TPO) (ACT 172). Planning
Malaysia, 15(4), 105-114.
Ziemiańska, M., & Suchocka, M. (2013). The planning and principles of tree protection
in the investment process. Sustainable Development Applications, 4, 11-25
Received: 12th January 2019. Accepted: 2nd August 2019
1Researcher at International Islamic University Malaysia. Email: [email protected] 280
PLANNING MALAYSIA:
Journal of the Malaysian Institute of Planners
VOLUME 17 ISSUE 2 (2019), Page 280 – 289
EMPOWERING COMMUNITY MOVEMENT: EMPRICAL EVIDENCE
Aisyah Abu Bakar1, Mariana Mohamed Osman2 & Muhammad Faris Abdullah3
1,2Kulliyyah of Architecture and Environmental Design,
INTERNATIONAL ISLAMIC UNIVERSITY MALAYSIA
Abstract
The living environment in which humans dwell in and are surrounded by, and
thus include the immediate built environment, is fertile ground for personal
development leading to community advancement. Issue: Ample amount of
studies have been carried out on the influence of personal empowerment (PE) on
community movement (CM). Little attention was given to the empirical evidence
of the impact of PE on CM. Purpose: This paper sets out to confirm the statistical
predictability of CM based on PE. Approach: Multiple Correlation and Multiple
Linear Regression were executed to assess linear associations and parameters of
linear equations to predict CM components based on PE items. Findings:
Majority of PE items were significant predictors of CM components and ‘setting
goals and striving to meet goals’ was the strongest predictor of CM.
Keywords: community movement, personal empowerment
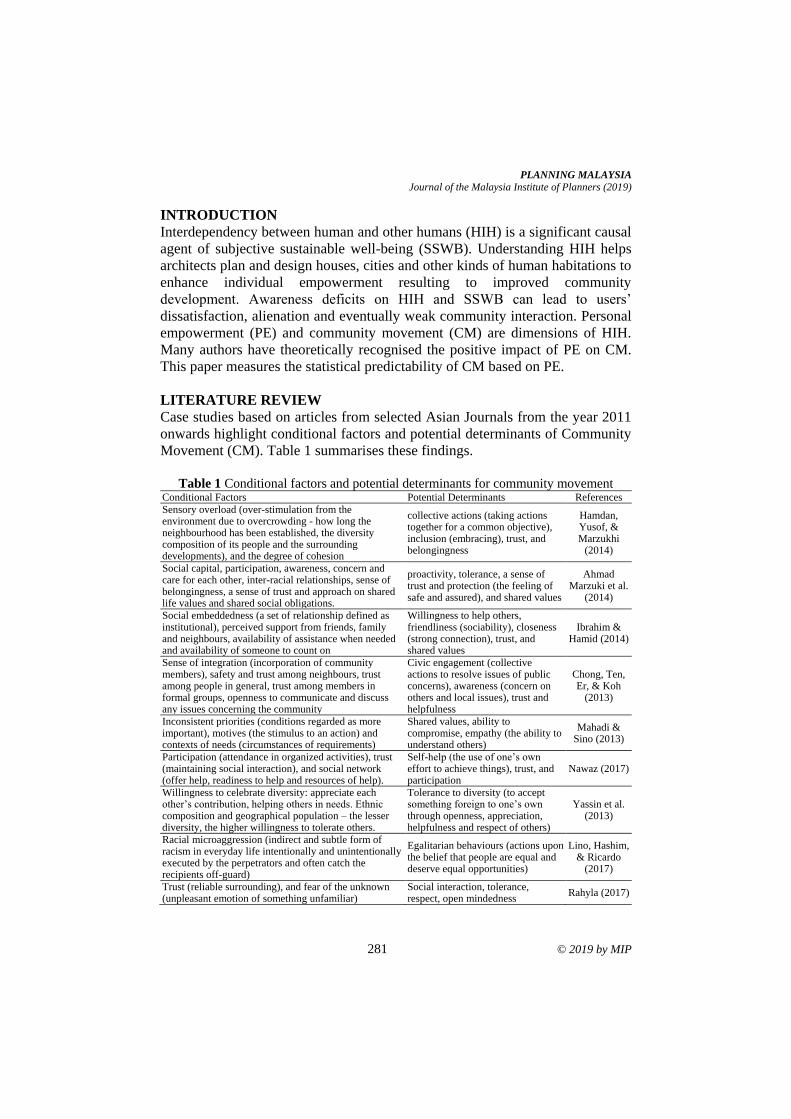
PLANNING MALAYSIA
Journal of the Malaysia Institute of Planners (2019)
281 © 2019 by MIP
INTRODUCTION
Interdependency between human and other humans (HIH) is a significant causal
agent of subjective sustainable well-being (SSWB). Understanding HIH helps
architects plan and design houses, cities and other kinds of human habitations to
enhance individual empowerment resulting to improved community
development. Awareness deficits on HIH and SSWB can lead to users’
dissatisfaction, alienation and eventually weak community interaction. Personal
empowerment (PE) and community movement (CM) are dimensions of HIH.
Many authors have theoretically recognised the positive impact of PE on CM.
This paper measures the statistical predictability of CM based on PE.
LITERATURE REVIEW
Case studies based on articles from selected Asian Journals from the year 2011
onwards highlight conditional factors and potential determinants of Community
Movement (CM). Table 1 summarises these findings.
Table 1 Conditional factors and potential determinants for community movement
Conditional Factors Potential Determinants References
Sensory overload (over-stimulation from the environment due to overcrowding - how long the neighbourhood has been established, the diversity composition of its people and the surrounding developments), and the degree of cohesion
collective actions (taking actions together for a common objective), inclusion (embracing), trust, and belongingness
Hamdan, Yusof, & Marzukhi
(2014)
Social capital, participation, awareness, concern and care for each other, inter-racial relationships, sense of belongingness, a sense of trust and approach on shared life values and shared social obligations.
proactivity, tolerance, a sense of trust and protection (the feeling of safe and assured), and shared values
Ahmad Marzuki et al.
(2014)
Social embeddedness (a set of relationship defined as institutional), perceived support from friends, family and neighbours, availability of assistance when needed and availability of someone to count on
Willingness to help others, friendliness (sociability), closeness (strong connection), trust, and shared values
Ibrahim & Hamid (2014)
Sense of integration (incorporation of community members), safety and trust among neighbours, trust among people in general, trust among members in formal groups, openness to communicate and discuss any issues concerning the community
Civic engagement (collective actions to resolve issues of public concerns), awareness (concern on others and local issues), trust and helpfulness
Chong, Ten, Er, & Koh
(2013)
Inconsistent priorities (conditions regarded as more important), motives (the stimulus to an action) and contexts of needs (circumstances of requirements)
Shared values, ability to compromise, empathy (the ability to understand others)
Mahadi & Sino (2013)
Participation (attendance in organized activities), trust (maintaining social interaction), and social network (offer help, readiness to help and resources of help).
Self-help (the use of one’s own effort to achieve things), trust, and participation
Nawaz (2017)
Willingness to celebrate diversity: appreciate each other’s contribution, helping others in needs. Ethnic composition and geographical population – the lesser diversity, the higher willingness to tolerate others.
Tolerance to diversity (to accept something foreign to one’s own through openness, appreciation, helpfulness and respect of others)
Yassin et al. (2013)
Racial microaggression (indirect and subtle form of racism in everyday life intentionally and unintentionally executed by the perpetrators and often catch the recipients off-guard)
Egalitarian behaviours (actions upon the belief that people are equal and deserve equal opportunities)
Lino, Hashim, & Ricardo
(2017)
Trust (reliable surrounding), and fear of the unknown (unpleasant emotion of something unfamiliar)
Social interaction, tolerance, respect, open mindedness
Rahyla (2017)
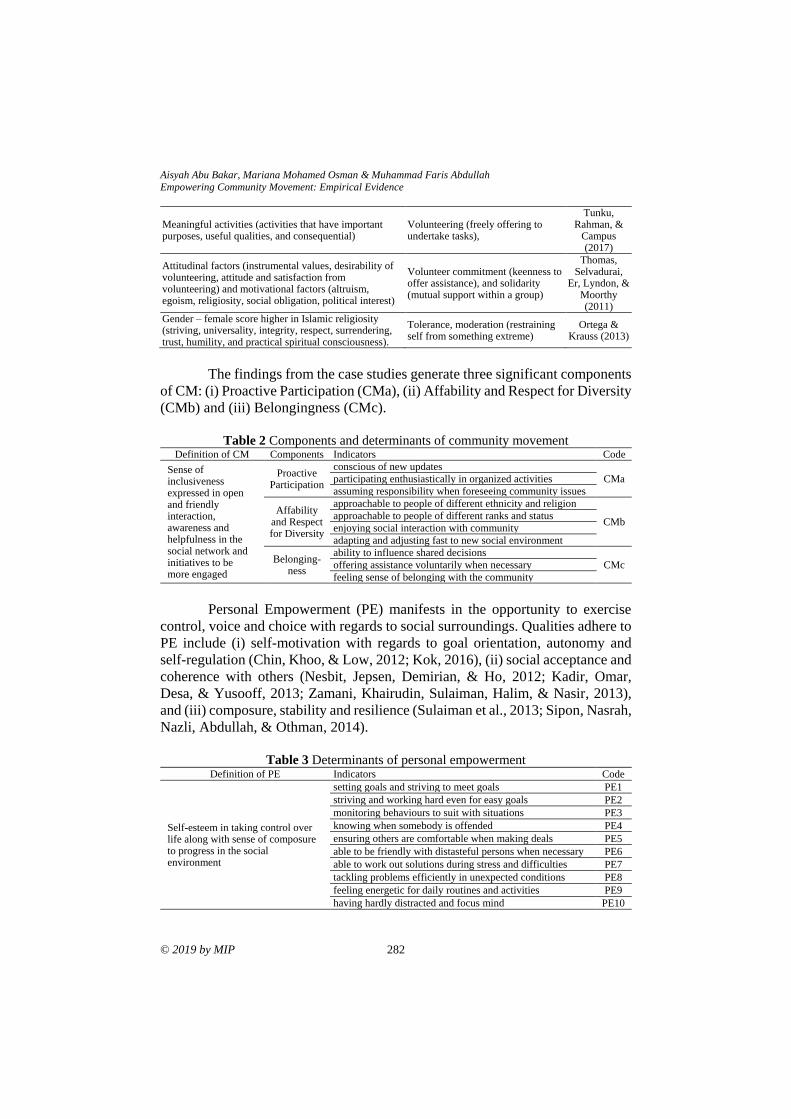
Aisyah Abu Bakar, Mariana Mohamed Osman & Muhammad Faris Abdullah
Empowering Community Movement: Empirical Evidence
© 2019 by MIP 282
Meaningful activities (activities that have important purposes, useful qualities, and consequential)
Volunteering (freely offering to undertake tasks),
Tunku, Rahman, &
Campus (2017)
Attitudinal factors (instrumental values, desirability of volunteering, attitude and satisfaction from volunteering) and motivational factors (altruism, egoism, religiosity, social obligation, political interest)
Volunteer commitment (keenness to offer assistance), and solidarity (mutual support within a group)
Thomas, Selvadurai,
Er, Lyndon, & Moorthy (2011)
Gender – female score higher in Islamic religiosity (striving, universality, integrity, respect, surrendering, trust, humility, and practical spiritual consciousness).
Tolerance, moderation (restraining self from something extreme)
Ortega & Krauss (2013)
The findings from the case studies generate three significant components
of CM: (i) Proactive Participation (CMa), (ii) Affability and Respect for Diversity
(CMb) and (iii) Belongingness (CMc).
Table 2 Components and determinants of community movement
Definition of CM Components Indicators Code
Sense of inclusiveness expressed in open and friendly interaction, awareness and helpfulness in the social network and initiatives to be more engaged
Proactive Participation
conscious of new updates
CMa participating enthusiastically in organized activities
assuming responsibility when foreseeing community issues
Affability and Respect for Diversity
approachable to people of different ethnicity and religion
CMb approachable to people of different ranks and status
enjoying social interaction with community
adapting and adjusting fast to new social environment
Belonging-ness
ability to influence shared decisions
CMc offering assistance voluntarily when necessary
feeling sense of belonging with the community
Personal Empowerment (PE) manifests in the opportunity to exercise
control, voice and choice with regards to social surroundings. Qualities adhere to
PE include (i) self-motivation with regards to goal orientation, autonomy and
self-regulation (Chin, Khoo, & Low, 2012; Kok, 2016), (ii) social acceptance and
coherence with others (Nesbit, Jepsen, Demirian, & Ho, 2012; Kadir, Omar,
Desa, & Yusooff, 2013; Zamani, Khairudin, Sulaiman, Halim, & Nasir, 2013),
and (iii) composure, stability and resilience (Sulaiman et al., 2013; Sipon, Nasrah,
Nazli, Abdullah, & Othman, 2014).
Table 3 Determinants of personal empowerment
Definition of PE Indicators Code
Self-esteem in taking control over life along with sense of composure to progress in the social environment
setting goals and striving to meet goals PE1
striving and working hard even for easy goals PE2
monitoring behaviours to suit with situations PE3
knowing when somebody is offended PE4
ensuring others are comfortable when making deals PE5
able to be friendly with distasteful persons when necessary PE6
able to work out solutions during stress and difficulties PE7
tackling problems efficiently in unexpected conditions PE8
feeling energetic for daily routines and activities PE9
having hardly distracted and focus mind PE10
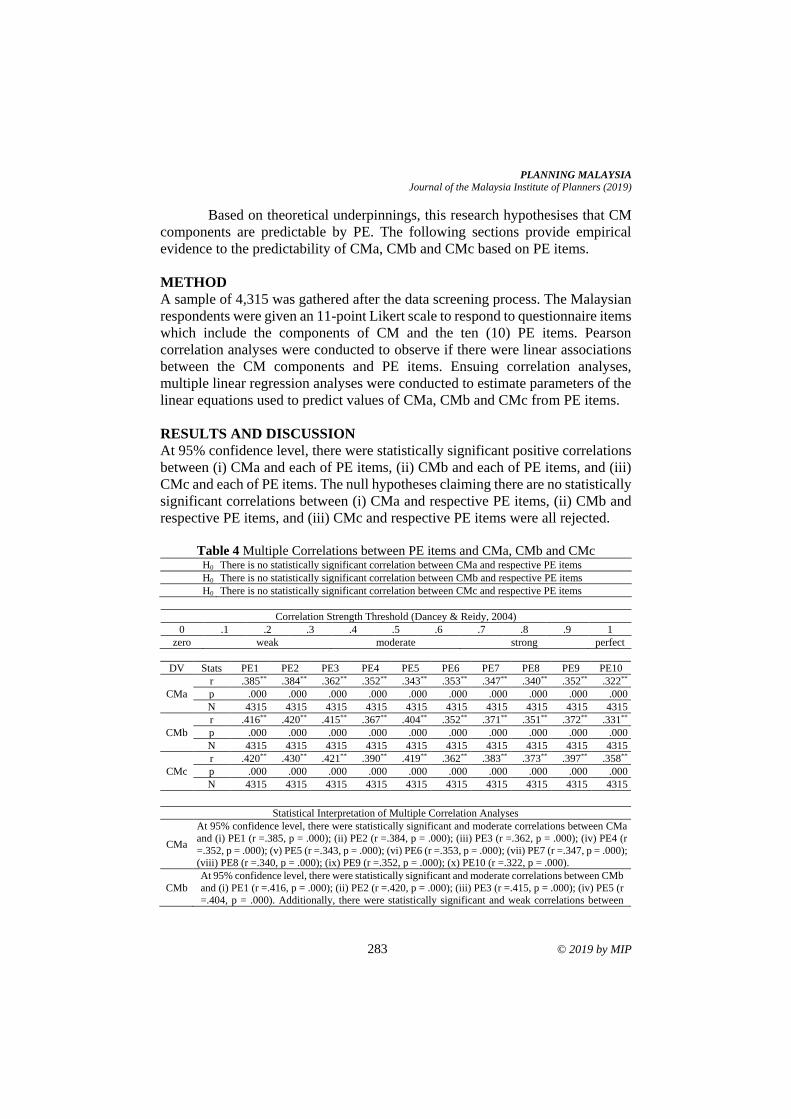
PLANNING MALAYSIA
Journal of the Malaysia Institute of Planners (2019)
283 © 2019 by MIP
Based on theoretical underpinnings, this research hypothesises that CM
components are predictable by PE. The following sections provide empirical
evidence to the predictability of CMa, CMb and CMc based on PE items.
METHOD
A sample of 4,315 was gathered after the data screening process. The Malaysian
respondents were given an 11-point Likert scale to respond to questionnaire items
which include the components of CM and the ten (10) PE items. Pearson
correlation analyses were conducted to observe if there were linear associations
between the CM components and PE items. Ensuing correlation analyses,
multiple linear regression analyses were conducted to estimate parameters of the
linear equations used to predict values of CMa, CMb and CMc from PE items.
RESULTS AND DISCUSSION
At 95% confidence level, there were statistically significant positive correlations
between (i) CMa and each of PE items, (ii) CMb and each of PE items, and (iii)
CMc and each of PE items. The null hypotheses claiming there are no statistically
significant correlations between (i) CMa and respective PE items, (ii) CMb and
respective PE items, and (iii) CMc and respective PE items were all rejected.
Table 4 Multiple Correlations between PE items and CMa, CMb and CMc
H0 There is no statistically significant correlation between CMa and respective PE items
H0 There is no statistically significant correlation between CMb and respective PE items
H0 There is no statistically significant correlation between CMc and respective PE items
Correlation Strength Threshold (Dancey & Reidy, 2004)
0 .1 .2 .3 .4 .5 .6 .7 .8 .9 1
zero weak moderate strong perfect
DV Stats PE1 PE2 PE3 PE4 PE5 PE6 PE7 PE8 PE9 PE10
CMa
r .385** .384** .362** .352** .343** .353** .347** .340** .352** .322**
p .000 .000 .000 .000 .000 .000 .000 .000 .000 .000
N 4315 4315 4315 4315 4315 4315 4315 4315 4315 4315
CMb
r .416** .420** .415** .367** .404** .352** .371** .351** .372** .331**
p .000 .000 .000 .000 .000 .000 .000 .000 .000 .000
N 4315 4315 4315 4315 4315 4315 4315 4315 4315 4315
CMc
r .420** .430** .421** .390** .419** .362** .383** .373** .397** .358**
p .000 .000 .000 .000 .000 .000 .000 .000 .000 .000
N 4315 4315 4315 4315 4315 4315 4315 4315 4315 4315
Statistical Interpretation of Multiple Correlation Analyses
CMa
At 95% confidence level, there were statistically significant and moderate correlations between CMa
and (i) PE1 (r =.385, p = .000); (ii) PE2 (r =.384, p = .000); (iii) PE3 (r =.362, p = .000); (iv) PE4 (r
=.352, p = .000); (v) PE5 (r =.343, p = .000); (vi) PE6 (r =.353, p = .000); (vii) PE7 (r =.347, p = .000);
(viii) PE8 (r =.340, p = .000); (ix) PE9 (r =.352, p = .000); (x) PE10 (r =.322, p = .000).
CMb
At 95% confidence level, there were statistically significant and moderate correlations between CMb
and (i) PE1 (r =.416, p = .000); (ii) PE2 (r =.420, p = .000); (iii) PE3 (r =.415, p = .000); (iv) PE5 (r
=.404, p = .000). Additionally, there were statistically significant and weak correlations between
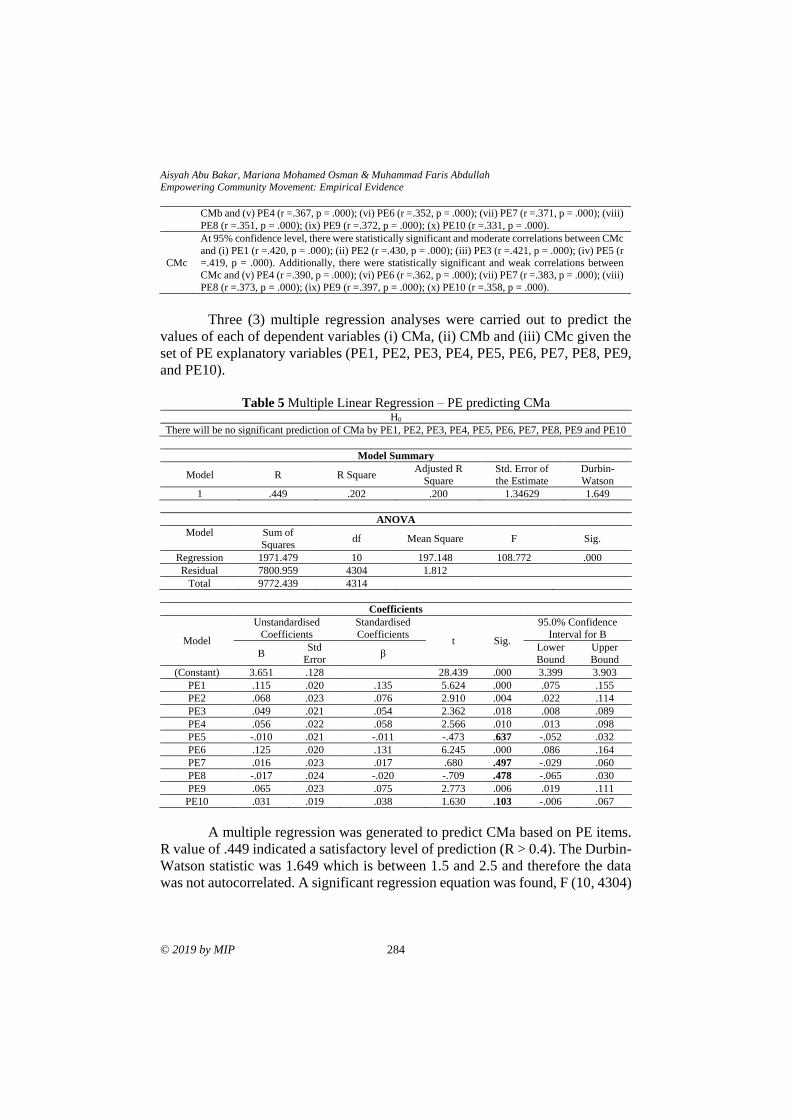
Aisyah Abu Bakar, Mariana Mohamed Osman & Muhammad Faris Abdullah
Empowering Community Movement: Empirical Evidence
© 2019 by MIP 284
CMb and (v) PE4 (r =.367, p = .000); (vi) PE6 (r =.352, p = .000); (vii) PE7 (r =.371, p = .000); (viii)
PE8 (r =.351, p = .000); (ix) PE9 (r =.372, p = .000); (x) PE10 (r =.331, p = .000).
CMc
At 95% confidence level, there were statistically significant and moderate correlations between CMc
and (i) PE1 (r =.420, p = .000); (ii) PE2 (r =.430, p = .000); (iii) PE3 (r =.421, p = .000); (iv) PE5 (r
=.419, p = .000). Additionally, there were statistically significant and weak correlations between
CMc and (v) PE4 (r =.390, p = .000); (vi) PE6 (r =.362, p = .000); (vii) PE7 (r =.383, p = .000); (viii)
PE8 (r =.373, p = .000); (ix) PE9 (r =.397, p = .000); (x) PE10 (r =.358, p = .000).
Three (3) multiple regression analyses were carried out to predict the
values of each of dependent variables (i) CMa, (ii) CMb and (iii) CMc given the
set of PE explanatory variables (PE1, PE2, PE3, PE4, PE5, PE6, PE7, PE8, PE9,
and PE10).
Table 5 Multiple Linear Regression – PE predicting CMa
H0
There will be no significant prediction of CMa by PE1, PE2, PE3, PE4, PE5, PE6, PE7, PE8, PE9 and PE10
Model Summary
Model R R Square Adjusted R
Square
Std. Error of
the Estimate
Durbin-
Watson
1 .449 .202 .200 1.34629 1.649
ANOVA
Model Sum of
Squares df Mean Square F Sig.
Regression 1971.479 10 197.148 108.772 .000
Residual 7800.959 4304 1.812
Total 9772.439 4314
Coefficients
Model
Unstandardised
Coefficients
Standardised
Coefficients t Sig.
95.0% Confidence
Interval for B
B Std
Error β
Lower
Bound
Upper
Bound
(Constant) 3.651 .128 28.439 .000 3.399 3.903
PE1 .115 .020 .135 5.624 .000 .075 .155
PE2 .068 .023 .076 2.910 .004 .022 .114
PE3 .049 .021 .054 2.362 .018 .008 .089
PE4 .056 .022 .058 2.566 .010 .013 .098
PE5 -.010 .021 -.011 -.473 .637 -.052 .032
PE6 .125 .020 .131 6.245 .000 .086 .164
PE7 .016 .023 .017 .680 .497 -.029 .060
PE8 -.017 .024 -.020 -.709 .478 -.065 .030
PE9 .065 .023 .075 2.773 .006 .019 .111
PE10 .031 .019 .038 1.630 .103 -.006 .067
A multiple regression was generated to predict CMa based on PE items.
R value of .449 indicated a satisfactory level of prediction (R > 0.4). The Durbin-
Watson statistic was 1.649 which is between 1.5 and 2.5 and therefore the data
was not autocorrelated. A significant regression equation was found, F (10, 4304)
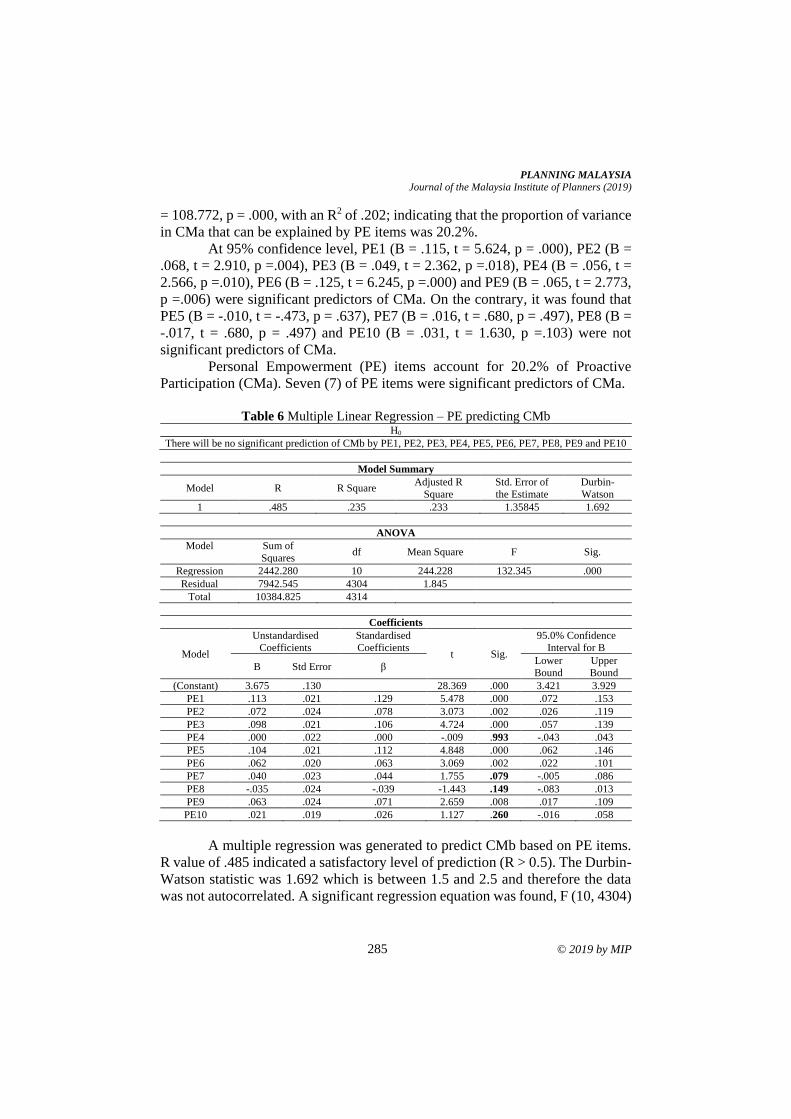
PLANNING MALAYSIA
Journal of the Malaysia Institute of Planners (2019)
285 © 2019 by MIP
= 108.772, p = .000, with an R2 of .202; indicating that the proportion of variance
in CMa that can be explained by PE items was 20.2%.
At 95% confidence level, PE1 (B = .115, t = 5.624, p = .000), PE2 (B =
.068, t = 2.910, p =.004), PE3 (B = .049, t = 2.362, p =.018), PE4 (B = .056, t =
2.566, p =.010), PE6 (B = .125, t = 6.245, p =.000) and PE9 (B = .065, t = 2.773,
p =.006) were significant predictors of CMa. On the contrary, it was found that
PE5 (B = -.010, t = -.473, p = .637), PE7 (B = .016, t = .680, p = .497), PE8 (B =
-.017, t = .680, p = .497) and PE10 (B = .031, t = 1.630, p =.103) were not
significant predictors of CMa.
Personal Empowerment (PE) items account for 20.2% of Proactive
Participation (CMa). Seven (7) of PE items were significant predictors of CMa.
Table 6 Multiple Linear Regression – PE predicting CMb
H0
There will be no significant prediction of CMb by PE1, PE2, PE3, PE4, PE5, PE6, PE7, PE8, PE9 and PE10
Model Summary
Model R R Square Adjusted R
Square
Std. Error of
the Estimate
Durbin-
Watson
1 .485 .235 .233 1.35845 1.692
ANOVA
Model Sum of
Squares df Mean Square F Sig.
Regression 2442.280 10 244.228 132.345 .000
Residual 7942.545 4304 1.845
Total 10384.825 4314
Coefficients
Model
Unstandardised
Coefficients
Standardised
Coefficients t Sig.
95.0% Confidence
Interval for B
B Std Error β Lower
Bound
Upper
Bound
(Constant) 3.675 .130 28.369 .000 3.421 3.929
PE1 .113 .021 .129 5.478 .000 .072 .153
PE2 .072 .024 .078 3.073 .002 .026 .119
PE3 .098 .021 .106 4.724 .000 .057 .139
PE4 .000 .022 .000 -.009 .993 -.043 .043
PE5 .104 .021 .112 4.848 .000 .062 .146
PE6 .062 .020 .063 3.069 .002 .022 .101
PE7 .040 .023 .044 1.755 .079 -.005 .086
PE8 -.035 .024 -.039 -1.443 .149 -.083 .013
PE9 .063 .024 .071 2.659 .008 .017 .109
PE10 .021 .019 .026 1.127 .260 -.016 .058
A multiple regression was generated to predict CMb based on PE items.
R value of .485 indicated a satisfactory level of prediction (R > 0.5). The Durbin-
Watson statistic was 1.692 which is between 1.5 and 2.5 and therefore the data
was not autocorrelated. A significant regression equation was found, F (10, 4304)
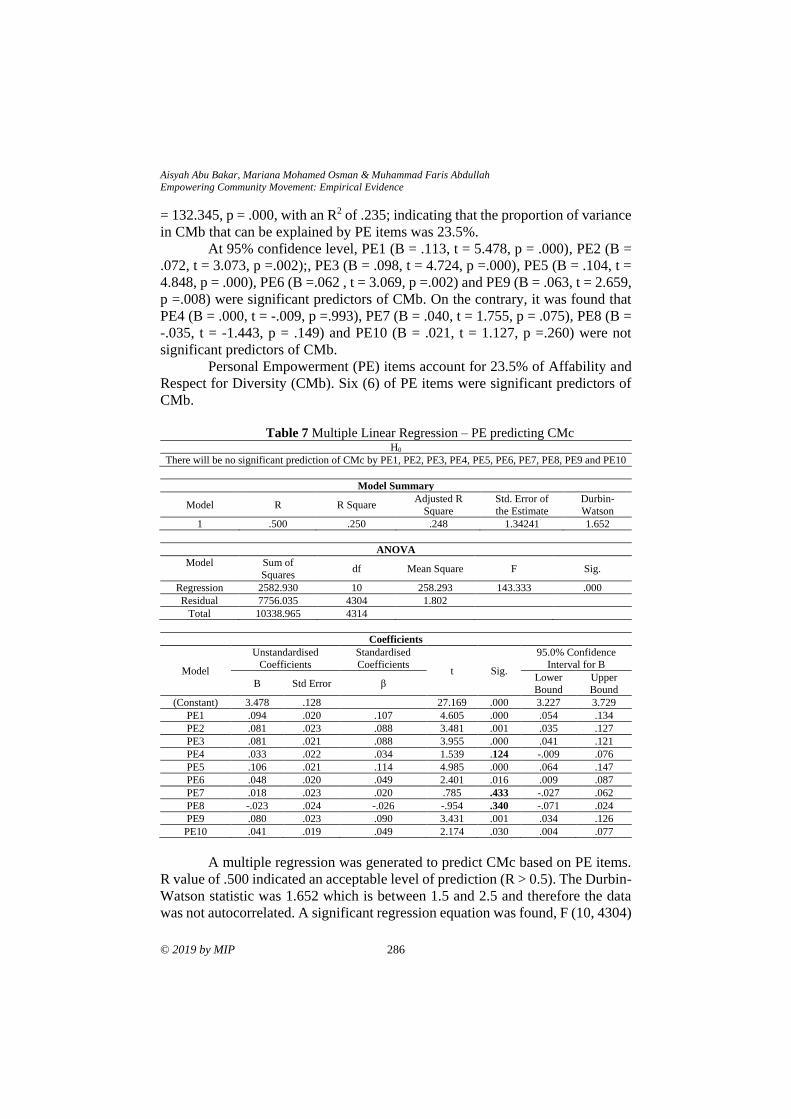
Aisyah Abu Bakar, Mariana Mohamed Osman & Muhammad Faris Abdullah
Empowering Community Movement: Empirical Evidence
© 2019 by MIP 286
= 132.345, p = .000, with an R2 of .235; indicating that the proportion of variance
in CMb that can be explained by PE items was 23.5%.
At 95% confidence level, PE1 (B = .113, t = 5.478, p = .000), PE2 (B =
.072, t = 3.073, p =.002);, PE3 (B = .098, t = 4.724, p =.000), PE5 (B = .104, t =
4.848, p = .000), PE6 (B =.062 , t = 3.069, p =.002) and PE9 (B = .063, t = 2.659,
p =.008) were significant predictors of CMb. On the contrary, it was found that
PE4 (B = .000, t = -.009, p =.993), PE7 (B = .040, t = 1.755, p = .075), PE8 (B =
-.035, t = -1.443, p = .149) and PE10 (B = .021, t = 1.127, p =.260) were not
significant predictors of CMb.
Personal Empowerment (PE) items account for 23.5% of Affability and
Respect for Diversity (CMb). Six (6) of PE items were significant predictors of
CMb.
Table 7 Multiple Linear Regression – PE predicting CMc
H0
There will be no significant prediction of CMc by PE1, PE2, PE3, PE4, PE5, PE6, PE7, PE8, PE9 and PE10
Model Summary
Model R R Square Adjusted R
Square
Std. Error of
the Estimate
Durbin-
Watson
1 .500 .250 .248 1.34241 1.652
ANOVA
Model Sum of
Squares df Mean Square F Sig.
Regression 2582.930 10 258.293 143.333 .000
Residual 7756.035 4304 1.802
Total 10338.965 4314
Coefficients
Model
Unstandardised
Coefficients
Standardised
Coefficients t Sig.
95.0% Confidence
Interval for B
B Std Error β Lower
Bound
Upper
Bound
(Constant) 3.478 .128 27.169 .000 3.227 3.729
PE1 .094 .020 .107 4.605 .000 .054 .134
PE2 .081 .023 .088 3.481 .001 .035 .127
PE3 .081 .021 .088 3.955 .000 .041 .121
PE4 .033 .022 .034 1.539 .124 -.009 .076
PE5 .106 .021 .114 4.985 .000 .064 .147
PE6 .048 .020 .049 2.401 .016 .009 .087
PE7 .018 .023 .020 .785 .433 -.027 .062
PE8 -.023 .024 -.026 -.954 .340 -.071 .024
PE9 .080 .023 .090 3.431 .001 .034 .126
PE10 .041 .019 .049 2.174 .030 .004 .077
A multiple regression was generated to predict CMc based on PE items.
R value of .500 indicated an acceptable level of prediction (R > 0.5). The Durbin-
Watson statistic was 1.652 which is between 1.5 and 2.5 and therefore the data
was not autocorrelated. A significant regression equation was found, F (10, 4304)
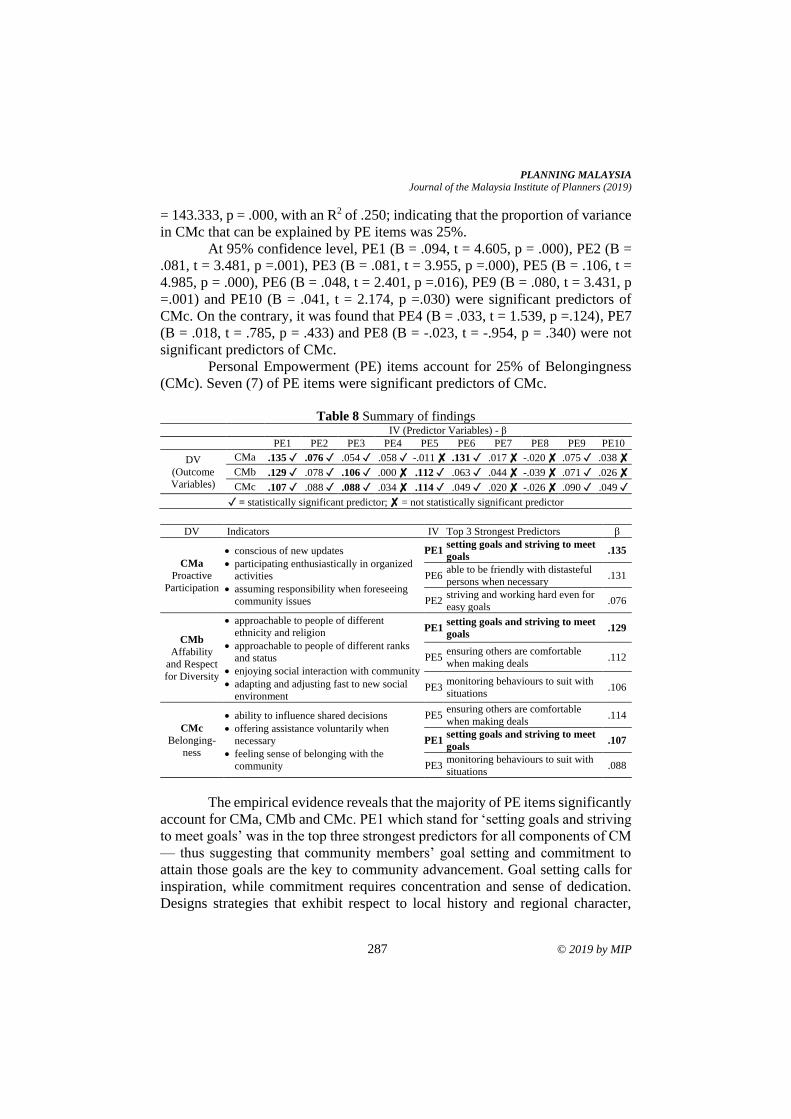
PLANNING MALAYSIA
Journal of the Malaysia Institute of Planners (2019)
287 © 2019 by MIP
= 143.333, p = .000, with an R2 of .250; indicating that the proportion of variance
in CMc that can be explained by PE items was 25%.
At 95% confidence level, PE1 (B = .094, t = 4.605, p = .000), PE2 (B =
.081, t = 3.481, p =.001), PE3 (B = .081, t = 3.955, p =.000), PE5 (B = .106, t =
4.985, p = .000), PE6 (B = .048, t = 2.401, p =.016), PE9 (B = .080, t = 3.431, p
=.001) and PE10 (B = .041, t = 2.174, p =.030) were significant predictors of
CMc. On the contrary, it was found that PE4 (B = .033, t = 1.539, p =.124), PE7
(B = .018, t = .785, p = .433) and PE8 (B = -.023, t = -.954, p = .340) were not
significant predictors of CMc.
Personal Empowerment (PE) items account for 25% of Belongingness
(CMc). Seven (7) of PE items were significant predictors of CMc.
Table 8 Summary of findings
IV (Predictor Variables) - β
PE1 PE2 PE3 PE4 PE5 PE6 PE7 PE8 PE9 PE10
DV
(Outcome
Variables)
CMa .135 ✓ .076 ✓ .054 ✓ .058 ✓ -.011 ✘ .131 ✓ .017 ✘ -.020 ✘ .075 ✓ .038 ✘
CMb .129 ✓ .078 ✓ .106 ✓ .000 ✘ .112 ✓ .063 ✓ .044 ✘ -.039 ✘ .071 ✓ .026 ✘
CMc .107 ✓ .088 ✓ .088 ✓ .034 ✘ .114 ✓ .049 ✓ .020 ✘ -.026 ✘ .090 ✓ .049 ✓
✓ = statistically significant predictor; ✘ = not statistically significant predictor
DV Indicators IV Top 3 Strongest Predictors β
CMa
Proactive
Participation
• conscious of new updates
• participating enthusiastically in organized
activities
• assuming responsibility when foreseeing
community issues
PE1 setting goals and striving to meet
goals .135
PE6 able to be friendly with distasteful
persons when necessary .131
PE2 striving and working hard even for
easy goals .076
CMb
Affability
and Respect
for Diversity
• approachable to people of different
ethnicity and religion
• approachable to people of different ranks
and status
• enjoying social interaction with community
• adapting and adjusting fast to new social
environment
PE1 setting goals and striving to meet
goals .129
PE5 ensuring others are comfortable
when making deals .112
PE3 monitoring behaviours to suit with
situations .106
CMc
Belonging-
ness
• ability to influence shared decisions
• offering assistance voluntarily when
necessary
• feeling sense of belonging with the
community
PE5 ensuring others are comfortable
when making deals .114
PE1 setting goals and striving to meet
goals .107
PE3 monitoring behaviours to suit with
situations .088
The empirical evidence reveals that the majority of PE items significantly
account for CMa, CMb and CMc. PE1 which stand for ‘setting goals and striving
to meet goals’ was in the top three strongest predictors for all components of CM
— thus suggesting that community members’ goal setting and commitment to
attain those goals are the key to community advancement. Goal setting calls for
inspiration, while commitment requires concentration and sense of dedication.
Designs strategies that exhibit respect to local history and regional character,
Aisyah Abu Bakar, Mariana Mohamed Osman & Muhammad Faris Abdullah
Empowering Community Movement: Empirical Evidence
© 2019 by MIP 288
well-designed and -maintained civic buildings, as well as mixed land uses to
allow various activities can revitalise communal happenings and promotes a
sense of belongingness. Such conducive neighbourhoods empower community
members to restore social and economic fabric leading to positive community
movement.
CONCLUSION
HIH in SSWB accounts for personal development in relation to the surrounding
context. This paper proves that community movement is a significant outcome of
personal empowerment. The results warrant for further tests on the constructs
explained in this paper.
REFERENCES Ahmad Marzuki, N., Azizah Ahmad, N., Shukri Abdul Hamid, A., Sobhi Ishak, M.,
Marzuki, N. A., Ahmad, N. A., … Ishak, M. S. (2014). Community social capital in Malaysia: A pilot study. Asian Social Science, 10(12), 202–209.
Chin, N.-S., Khoo, S., & Low, W.-Y. (2012). Self-determination and goal orientation in track and field. Journal of Human Kinetics, 33(1), 151-161.
Chong, S. T., Ten, W. K., Er, A. C., & Koh, D. (2013). Neighbourhood participation as a proxy to civic engagement. Pertanika Journal of Social Science and Humanities, 21(S), 143–154.
Dancey, C., & Reidy, J. (2004) Statistics without maths for psychology: Ssing SPSS for Windows. London: Prentice Hall.
Hamdan, H., Yusof, F., & Marzukhi, M. A. (2014). Social capital and quality of life in urban neighborhoods high density housing. Procedia - Social and Behavioral Sciences, 153, 169-179.
Ibrahim, R., & Hamid, T. A. (2014). Social embeddedness as a mechanism for linking social cohesion to well-being among older adults: Moderating effect of gender. Clinical Interventions in Aging, 9, 863-870.
Kadir, N. B. A., Omar, F., Desa, A., & Yusooff, F. (2013). Secure style, PWB-related gratitude and SWB-related engagement as predictors of affect balance among social science students in Malaysia: A pilot study. Pertanika Journal of Social Science and Humanities, 21, 85-98.
Kok, J. K. (2016). The relationships between procrastination and motivational aspects of self-regulation. Jurnal Psikologi Malaysia, 30(1), 30-39.
Lino, M., Hashim, I. H. M., & Ricardo, R. (2017). The lurking racism: Exploring racial microaggression in the Malaysian university setting. Pertanika Journal of Social Science and Humanities, 25(1), 473-484.
Mahadi, Z., & Sino, H. (2013). Defining public needs in sustainable development: A case study of Sepang, Malaysia. Pertanika Journal of Social Science and Humanities, 21(4), 1341-1360.
Nawaz, F. (2017). Strengthening women through group participation, trust and networks : A study on women’ s self-help groups in Bangladesh. Pertanika Journal of Social Science and Humanities, 25(1), 45–60.
Nesbit, P. L., Jepsen, D., Demirian, S., & Ho, J. (2012). Extending self-leadership research to the East: Measurement equivalence of the Chinese and English versions of the MSLQ. Asian Journal of Social Psychology, 15(2), 101-111.
PLANNING MALAYSIA
Journal of the Malaysia Institute of Planners (2019)
289 © 2019 by MIP
Rahyla, S. (2017). The local people perceptions on the economic impacts of indonesian workers in rural areas: A case study at Rural Johor. Pertanika Journal of Social Science and Humanities, 25(1), 485-502.
Sipon, S., Nasrah, S. K., Nazli, N. N. N. N., Abdullah, S., & Othman, K. (2014). Stress and religious coping among flood victims. Procedia - Social and Behavioral Sciences, 140, 605-608.
Sulaiman, W. S. W., Kadir, N. B. A., Halim, F. W., Omar, F., Latiff, R. A., & Sulaiman, W. S. W. (2013). Structural relations between personality traits, coping strategy, social support and well-being among adolescents. Pertanika Journal of Social Science and Humanities, 21(December), 121-134.
Thomas, V. B., Selvadurai, S., Er, A. C., Lyndon, N., & Moorthy, R. (2011). Factors Influencing Commitment of Volunteers’ in Neighborhood Watch Organization. Journal of Social Sciences, 7(4), 569-574.
Tunku, U., Rahman, A., & Campus, P. (2017). Youth engagement in meaningful activities and happiness: A comparative study of Chinese undergraduates from Taiwan and Malaysia. Pertanika Journal of Social Science and Humanities, 25(1), 445-460.
Yassin, S. M., Dahalan, D., Abdullah, H., Ismail, I. A., Hamzah, A., Ahmad, N., …& Serit, B. (2013). Challenges in the social environment landscape: Readiness of youth in embracing diversity. Pertanika Journal of Social Science and Humanities, 21(July), 11–20.
Zamani, Z. A., Khairudin, R., Sulaiman, W. S. W., Halim, F. W., & Nasir, R. (2013).
Relationship between achievement motivation and personality among pre and
post-independence Malaysian Malays. Pertanika Journal of Social Science and
Humanities, 21(December), 135-142
Received: 12th January 2019. Accepted: 2nd August 2019
2Senior Lecturer at Universiti Teknologi MARA. Email: [email protected] 290
PLANNING MALAYSIA:
Journal of the Malaysian Institute of Planners
VOLUME 17 ISSUE 2 (2019), Page 290 – 301
MEASURING ATTRIBUTES AND BEHAVIOURAL PATTERNS OF
STREET LIVELINESS IN URBAN AREA
Normah Sulaiman1, Yusfida Ayu Abdullah2 & Raja Norashekin Raja Othman3
1 Faculty of Built Environment, Engineering, Technology & Design
TAYLORS’ UNIVERSITY
2,3 Faculty of Architecture, Planning and Surveying
UNIVERSITI TEKNOLOGI MARA
Abstract
Streets are essential elements of the form and function of the urban environment.
A growing body of research has pointed out that the more human activities in the
street, the more interesting the city will be. Streets showcase the community and
connect people. They are the most comfortable social environments that provide
aesthetical and interactional pleasure for everyone. This paper presents the
outcomes of a study which measured street liveliness based on the attributes and
behaviours of the pedestrians. The aim of this study was to examine how people
experience the liveliness at various times for various activities on the street. To
achieve this, the study applied a case study method by looking at one of the streets
that showed a diversity of activities with a unique shopping experience and
liveliness in Kuala Lumpur called Jalan Masjid India. The method involved two
types of data collection techniques, which were site observations, and pedestrian
counts. Results which consisted of behavioural mapping and activity analysis
revealed that Jalan Masjid India has its own merits in terms of street liveliness,
function, and urban activities.
Keywords: street, behavioural pattern, street liveliness, urban area
PLANNING MALAYSIA
Journal of the Malaysia Institute of Planners (2019)
291 © 2019 by MIP
INTRODUCTION
In the field of urban design, various definitions of public space can easily
be found. From good practices around the world, UN-Habitat (2016, p.1)
gives the definition of public space as “all places publicly owned or of public use,
accessible and enjoyable by all for free and without a profit motive.” Each public
space has its own spatial, historic, environmental, and economic features. When
it comes to the street as a public space, Jacobs’ (2011) theory explains that the
street is an interesting space. Besides being the vital organ of the city, the tangible
facilities between the streets and their sidewalks framed by the buildings permit
the streets to become a vibrant place. Koohsari et al. (2015) stated that open
spaces influence physical activity in three ways. First is the setting where people
engage in physical activity. Next, the public space is a destination for people
to socialise, and finally, it can be a route to pass through and reach another
destination. Hence, as a thoroughfare, the physical activities are related to active
travel, such as transiting, cycling, walking, and running. In short, these
three settings contribute to different types of physical activity behaviours.
The aim of this study is to evaluate how people experience the liveliness
of the street at various times for various activities. The intention of this study was
to understand public street life, and to provide recommendations that could shape
public space liveliness. Observational data was used to gain the behavioural
patterns on the street and appreciate its physical aspects. Pedestrian counts were
conducted to understand the urban activities and public life of the street. The
findings focused on strengthening the method applied to promote improvements
in evaluating the street as a successful public space.
Streets as Fundamental Shared Spaces
In an urban environment, the elements that complete its form and function are the
streets. Streets are defined as linear three-dimensional spaces enclosed on
opposite sides by buildings. Back in the old days, the role of the street was seen
as a major thoroughfare for vehicular traffic, while the urban fabric was usually
dense, and buildings were built next to one another, and flushed with streets
(Sulaiman, Ayu Abdullah, & Hamdan, 2017). In between these connected
masses, the facades of the buildings created the wall of open
spaces, finely forming a mesh of street grid on a small scale that defines streets
and squares. Roads, streets, boulevards, and avenues act as channels of efficient
movement, and as visual elements. Besides their primary purpose, streets also
connect people. As interesting as they can be, streets are not only physically a
space and a channel of movement, but also a place. They are the most
fundamental shared public spaces, and the most vital organs of the city. In
contrast, their dullness will reflect the city itself (Jacobs, 2011).
While their role from various perspectives is understood, as a place,
streets also reveal the community, and connect people. These connected masses
Normah Sulaiman, Yusfida Ayu Abdullah & Raja Norashekin Raja Othman
Measuring Attributes and Behavioural Patterns of Street Liveliness in Urban Area
© 2019 by MIP 292
of buildings create frontages, medians, and streetscapes not only as a route for
traffic, but also as a space for connectivity and activities. While they are still
accessible by cars, pedestrians are dominant in these most comfortable of social
environments, where one can analyse the form and qualities to find their
value. Sulaiman et al. (2017) wrote that, through the concept of shared spaces,
integrating the needs and demands of different forms of movement adds
tremendous value to the streets as the activities are not only for drivers, but are
now also safe for cyclists, transit vehicles and users as well as pedestrians of all
ages and abilities.
Connecting People and Places
Traditionally, the street is used as major access for transporting movements.
Sholihah and Heath (2016) highlighted that the movement can be walking, riding
horses, camels and other animals, using animals to pull carts, cycling, and driving
cars and motorcycles etc. As a link from one point to another, the form of
movement is purely for circulation. Now that the role of the street as a place is
understood, the experience on the street will determine the success of it.
By auditing the transportation nodes, accessibility points, and traffic
lanes, the street typology can be ascertained. These tangible qualities help to
formulate data on its movement patterns as well as physical and visual linkages
and identify the existing functions and activities within it. Commonly, the access
and linkage qualities are evaluated by the connections of one area to the
surrounding, visually and physically. Carmona, Tiesdell and Oc (2010) pointed
out that the sense of movement is visually dynamic, and it provides the
opportunity for social interaction and cultural exchange. The wayfinding within
the area is relatively good when a user finds it easy to get to and from a place,
and when it is also visible both from a distance and up close. Conveniently, it
should also be very well connected to public transit to get to adjacent buildings,
with good signage so that it leads people to the place easily.
As a shared place, the number of activities in the street becomes great
when users have more chances to take part in them although that also depends on
the street. When people will find more reasons to come or return to a place as
well as have something to do in it, the better the place will be.
METHODOLOGY
This study employed a case study method as it required a close study of
pedestrians on a street. Masjid India Street, or widely known as Jalan Masjid
India, was chosen as the case study because of its character as a downtown or
market street. Also, the length of the street is suitable to conduct the study while
the place itself is vibrant for commerce and able to handle a high volume of
pedestrians and high levels of activities throughout the day. In a formal design
treatment, downtown streets with high levels of pedestrian activities, distinctive
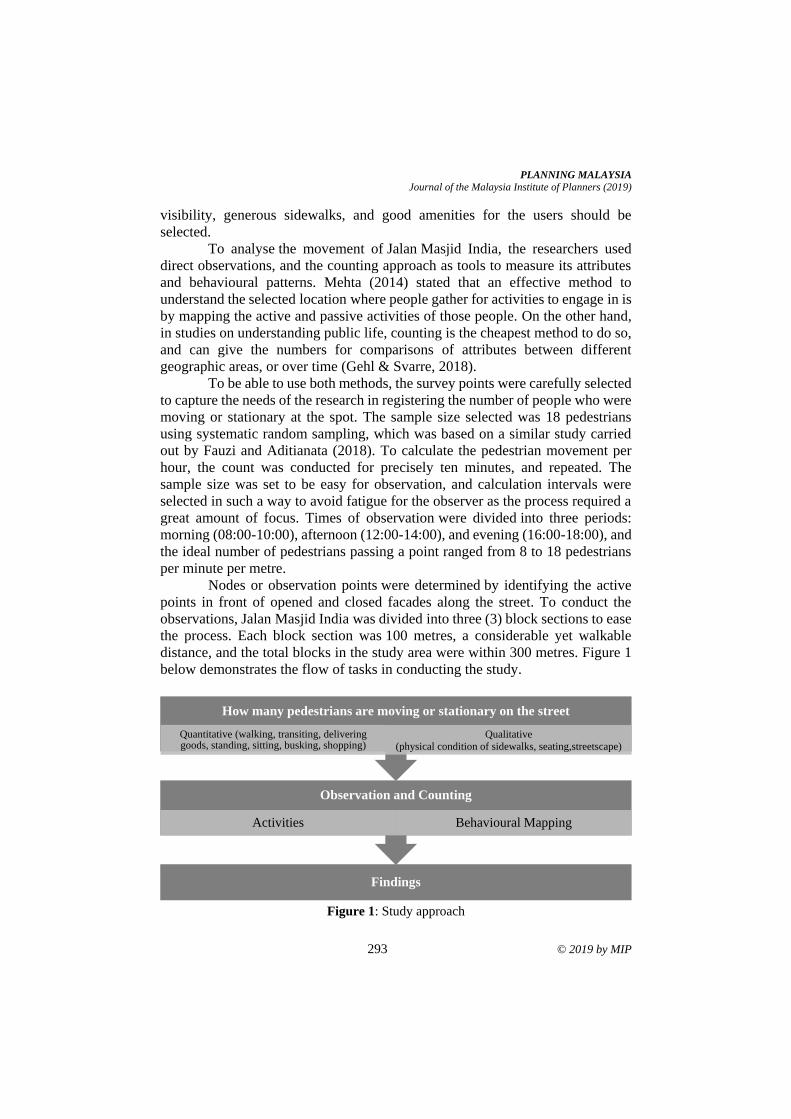
PLANNING MALAYSIA
Journal of the Malaysia Institute of Planners (2019)
293 © 2019 by MIP
visibility, generous sidewalks, and good amenities for the users should be
selected.
To analyse the movement of Jalan Masjid India, the researchers used
direct observations, and the counting approach as tools to measure its attributes
and behavioural patterns. Mehta (2014) stated that an effective method to
understand the selected location where people gather for activities to engage in is
by mapping the active and passive activities of those people. On the other hand,
in studies on understanding public life, counting is the cheapest method to do so,
and can give the numbers for comparisons of attributes between different
geographic areas, or over time (Gehl & Svarre, 2018).
To be able to use both methods, the survey points were carefully selected
to capture the needs of the research in registering the number of people who were
moving or stationary at the spot. The sample size selected was 18 pedestrians
using systematic random sampling, which was based on a similar study carried
out by Fauzi and Aditianata (2018). To calculate the pedestrian movement per
hour, the count was conducted for precisely ten minutes, and repeated. The
sample size was set to be easy for observation, and calculation intervals were
selected in such a way to avoid fatigue for the observer as the process required a
great amount of focus. Times of observation were divided into three periods:
morning (08:00-10:00), afternoon (12:00-14:00), and evening (16:00-18:00), and
the ideal number of pedestrians passing a point ranged from 8 to 18 pedestrians
per minute per metre.
Nodes or observation points were determined by identifying the active
points in front of opened and closed facades along the street. To conduct the
observations, Jalan Masjid India was divided into three (3) block sections to ease
the process. Each block section was 100 metres, a considerable yet walkable
distance, and the total blocks in the study area were within 300 metres. Figure 1
below demonstrates the flow of tasks in conducting the study.
Figure 1: Study approach
Findings
Observation and Counting
Behavioural Mapping Activities
How many pedestrians are moving or stationary on the street
Qualitative
(physical condition of sidewalks, seating,streetscape)
Quantitative (walking, transiting, delivering goods, standing, sitting, busking, shopping)
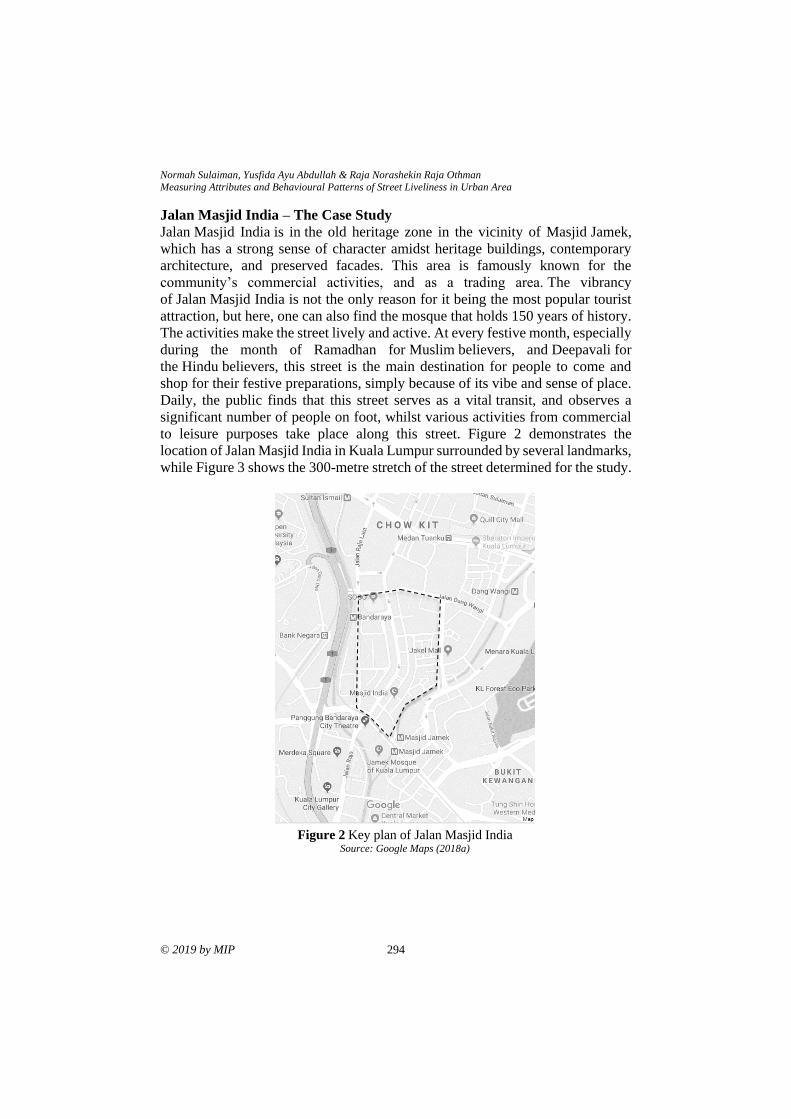
Normah Sulaiman, Yusfida Ayu Abdullah & Raja Norashekin Raja Othman
Measuring Attributes and Behavioural Patterns of Street Liveliness in Urban Area
© 2019 by MIP 294
Jalan Masjid India – The Case Study
Jalan Masjid India is in the old heritage zone in the vicinity of Masjid Jamek,
which has a strong sense of character amidst heritage buildings, contemporary
architecture, and preserved facades. This area is famously known for the
community’s commercial activities, and as a trading area. The vibrancy
of Jalan Masjid India is not the only reason for it being the most popular tourist
attraction, but here, one can also find the mosque that holds 150 years of history.
The activities make the street lively and active. At every festive month, especially
during the month of Ramadhan for Muslim believers, and Deepavali for
the Hindu believers, this street is the main destination for people to come and
shop for their festive preparations, simply because of its vibe and sense of place.
Daily, the public finds that this street serves as a vital transit, and observes a
significant number of people on foot, whilst various activities from commercial
to leisure purposes take place along this street. Figure 2 demonstrates the
location of Jalan Masjid India in Kuala Lumpur surrounded by several landmarks,
while Figure 3 shows the 300-metre stretch of the street determined for the study.
Figure 2 Key plan of Jalan Masjid India
Source: Google Maps (2018a)
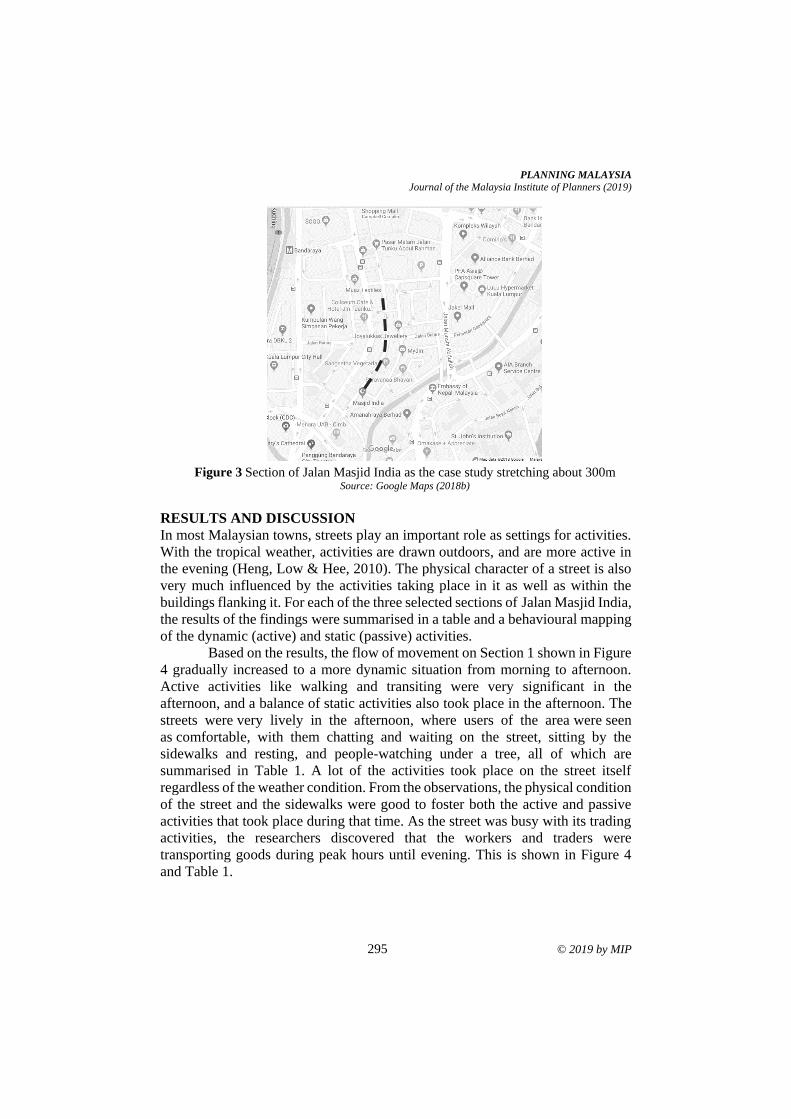
PLANNING MALAYSIA
Journal of the Malaysia Institute of Planners (2019)
295 © 2019 by MIP
Figure 3 Section of Jalan Masjid India as the case study stretching about 300m
Source: Google Maps (2018b)
RESULTS AND DISCUSSION
In most Malaysian towns, streets play an important role as settings for activities.
With the tropical weather, activities are drawn outdoors, and are more active in
the evening (Heng, Low & Hee, 2010). The physical character of a street is also
very much influenced by the activities taking place in it as well as within the
buildings flanking it. For each of the three selected sections of Jalan Masjid India,
the results of the findings were summarised in a table and a behavioural mapping
of the dynamic (active) and static (passive) activities.
Based on the results, the flow of movement on Section 1 shown in Figure
4 gradually increased to a more dynamic situation from morning to afternoon.
Active activities like walking and transiting were very significant in the
afternoon, and a balance of static activities also took place in the afternoon. The
streets were very lively in the afternoon, where users of the area were seen
as comfortable, with them chatting and waiting on the street, sitting by the
sidewalks and resting, and people-watching under a tree, all of which are
summarised in Table 1. A lot of the activities took place on the street itself
regardless of the weather condition. From the observations, the physical condition
of the street and the sidewalks were good to foster both the active and passive
activities that took place during that time. As the street was busy with its trading
activities, the researchers discovered that the workers and traders were
transporting goods during peak hours until evening. This is shown in Figure 4
and Table 1.
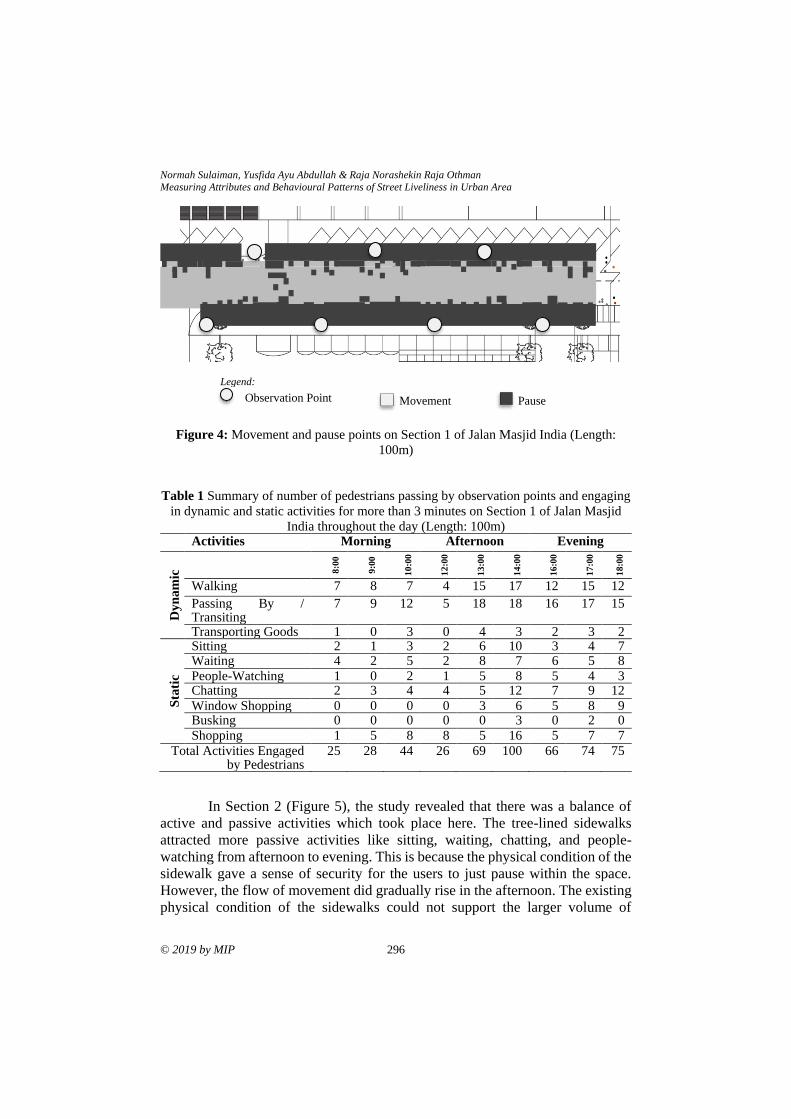
Normah Sulaiman, Yusfida Ayu Abdullah & Raja Norashekin Raja Othman
Measuring Attributes and Behavioural Patterns of Street Liveliness in Urban Area
© 2019 by MIP 296
Figure 4: Movement and pause points on Section 1 of Jalan Masjid India (Length:
100m)
Table 1 Summary of number of pedestrians passing by observation points and engaging
in dynamic and static activities for more than 3 minutes on Section 1 of Jalan Masjid
India throughout the day (Length: 100m)
Activities Morning Afternoon Evening
Dy
na
mic
8:0
0
9:0
0
10
:00
12
:00
13
:00
14
:00
16
:00
17
:00
18
:00
Walking 7 8 7 4 15 17 12 15 12
Passing By / Transiting
7 9 12 5 18 18 16 17 15
Transporting Goods 1 0 3 0 4 3 2 3 2
Sta
tic
Sitting 2 1 3 2 6 10 3 4 7 Waiting 4 2 5 2 8 7 6 5 8
People-Watching 1 0 2 1 5 8 5 4 3 Chatting 2 3 4 4 5 12 7 9 12
Window Shopping 0 0 0 0 3 6 5 8 9 Busking 0 0 0 0 0 3 0 2 0
Shopping 1 5 8 8 5 16 5 7 7
Total Activities Engaged by Pedestrians
25 28 44 26 69 100 66 74 75
In Section 2 (Figure 5), the study revealed that there was a balance of
active and passive activities which took place here. The tree-lined sidewalks
attracted more passive activities like sitting, waiting, chatting, and people-
watching from afternoon to evening. This is because the physical condition of the
sidewalk gave a sense of security for the users to just pause within the space.
However, the flow of movement did gradually rise in the afternoon. The existing
physical condition of the sidewalks could not support the larger volume of
Observation Point
Legend:
Movement Pause
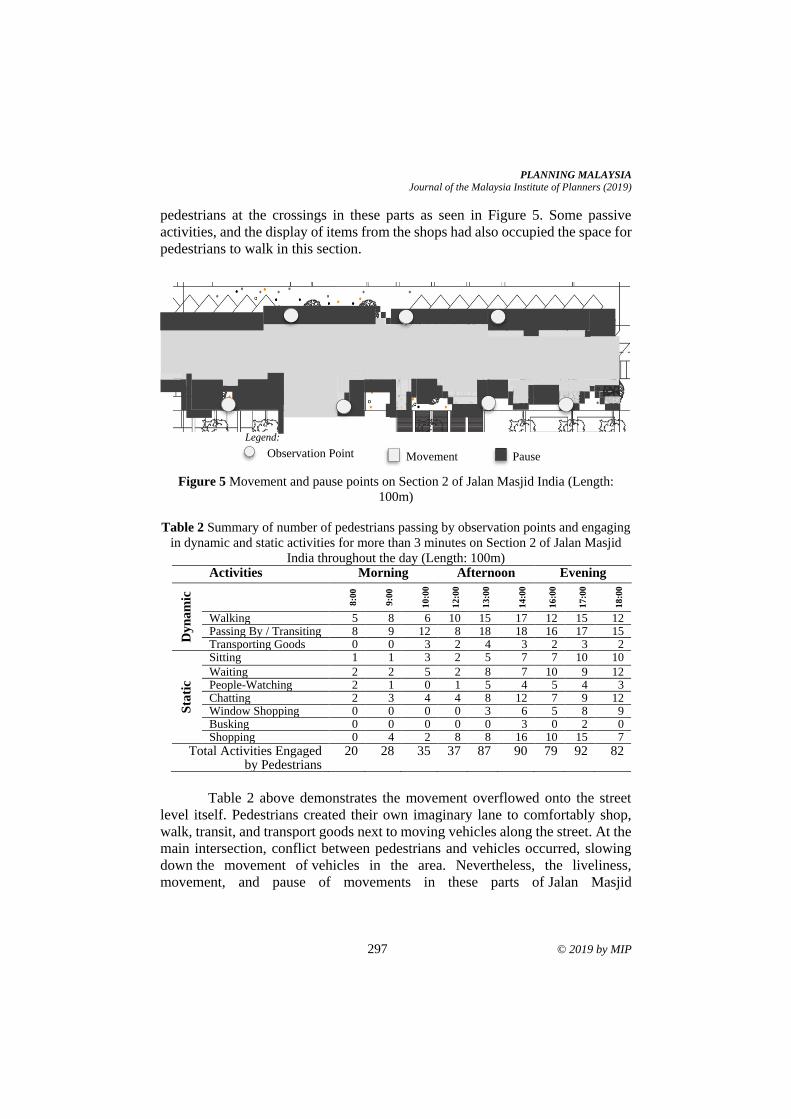
PLANNING MALAYSIA
Journal of the Malaysia Institute of Planners (2019)
297 © 2019 by MIP
pedestrians at the crossings in these parts as seen in Figure 5. Some passive
activities, and the display of items from the shops had also occupied the space for
pedestrians to walk in this section.
Figure 5 Movement and pause points on Section 2 of Jalan Masjid India (Length:
100m)
Table 2 Summary of number of pedestrians passing by observation points and engaging
in dynamic and static activities for more than 3 minutes on Section 2 of Jalan Masjid
India throughout the day (Length: 100m)
Activities Morning Afternoon Evening
Dy
na
mic
8:0
0
9:0
0
10
:00
12
:00
13
:00
14
:00
16
:00
17
:00
18
:00
Walking 5 8 6 10 15 17 12 15 12 Passing By / Transiting 8 9 12 8 18 18 16 17 15 Transporting Goods 0 0 3 2 4 3 2 3 2
Sta
tic
Sitting 1 1 3 2 5 7 7 10 10
Waiting 2 2 5 2 8 7 10 9 12 People-Watching 2 1 0 1 5 4 5 4 3 Chatting 2 3 4 4 8 12 7 9 12 Window Shopping 0 0 0 0 3 6 5 8 9 Busking 0 0 0 0 0 3 0 2 0 Shopping 0 4 2 8 8 16 10 15 7
Total Activities Engaged by Pedestrians
20 28 35 37 87 90 79 92 82
Table 2 above demonstrates the movement overflowed onto the street
level itself. Pedestrians created their own imaginary lane to comfortably shop,
walk, transit, and transport goods next to moving vehicles along the street. At the
main intersection, conflict between pedestrians and vehicles occurred, slowing
down the movement of vehicles in the area. Nevertheless, the liveliness,
movement, and pause of movements in these parts of Jalan Masjid
Observation Point
Legend:
Movement Pause
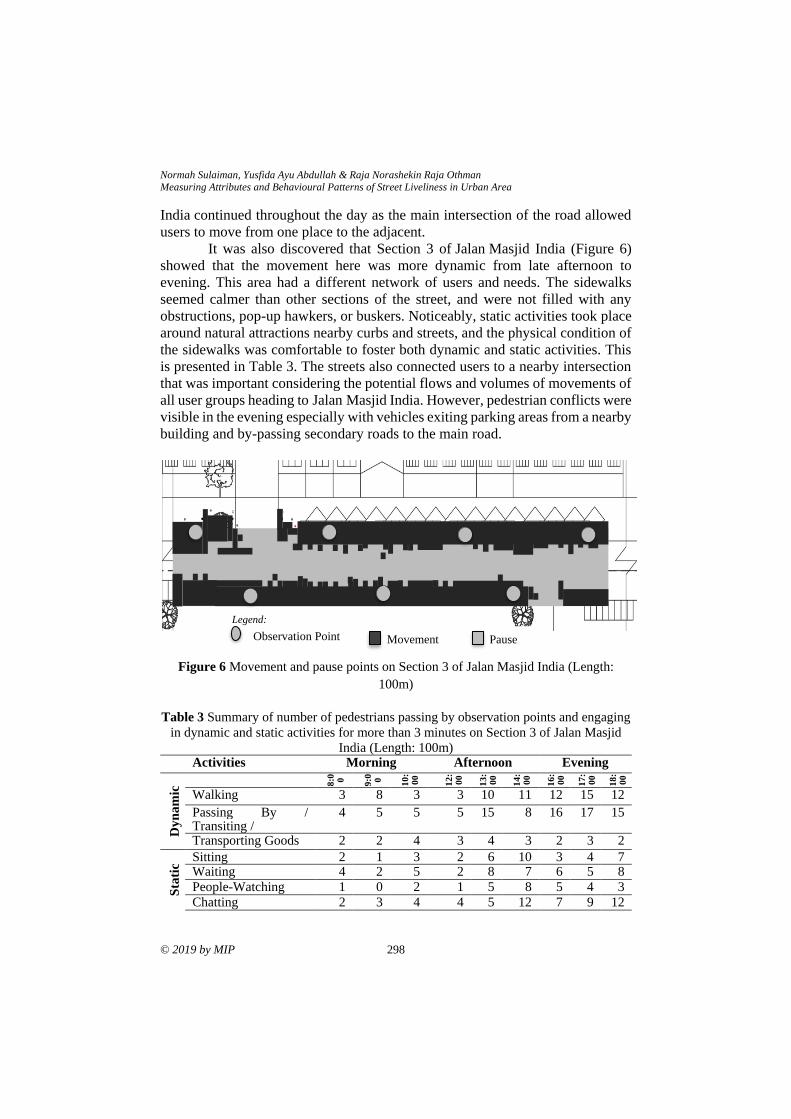
Normah Sulaiman, Yusfida Ayu Abdullah & Raja Norashekin Raja Othman
Measuring Attributes and Behavioural Patterns of Street Liveliness in Urban Area
© 2019 by MIP 298
India continued throughout the day as the main intersection of the road allowed
users to move from one place to the adjacent.
It was also discovered that Section 3 of Jalan Masjid India (Figure 6)
showed that the movement here was more dynamic from late afternoon to
evening. This area had a different network of users and needs. The sidewalks
seemed calmer than other sections of the street, and were not filled with any
obstructions, pop-up hawkers, or buskers. Noticeably, static activities took place
around natural attractions nearby curbs and streets, and the physical condition of
the sidewalks was comfortable to foster both dynamic and static activities. This
is presented in Table 3. The streets also connected users to a nearby intersection
that was important considering the potential flows and volumes of movements of
all user groups heading to Jalan Masjid India. However, pedestrian conflicts were
visible in the evening especially with vehicles exiting parking areas from a nearby
building and by-passing secondary roads to the main road.
Figure 6 Movement and pause points on Section 3 of Jalan Masjid India (Length:
100m)
Table 3 Summary of number of pedestrians passing by observation points and engaging
in dynamic and static activities for more than 3 minutes on Section 3 of Jalan Masjid
India (Length: 100m)
Activities Morning Afternoon Evening
Dyn
am
ic 8:0 0
9:0 0
10
:0
0
12
:0
0
13
:0
0
14
:0
0
16
:0
0
17
:0
0
18
:0
0
Walking 3 8 3 3 10 11 12 15 12
Passing By / Transiting /
4 5 5 5 15 8 16 17 15
Transporting Goods 2 2 4 3 4 3 2 3 2
Sta
tic
Sitting 2 1 3 2 6 10 3 4 7 Waiting 4 2 5 2 8 7 6 5 8
People-Watching 1 0 2 1 5 8 5 4 3
Chatting 2 3 4 4 5 12 7 9 12
Observation Point
Legend:
Movement Pause
PLANNING MALAYSIA
Journal of the Malaysia Institute of Planners (2019)
299 © 2019 by MIP
Window Shopping 0 0 0 0 3 6 5 8 9
Busking 0 0 0 0 0 3 0 2 0
Shopping 1 2 3 3 5 10 5 5 5
Total Activities Engaged by Pedestrians
19 24 29 23 61 78 61 65 74
Movement along Jalan Masjid India
The movement along Jalan Masjid India was represented by the public, which
included people of all abilities and ages sitting, walking, pausing, and resting on
the streets. The study area was evaluated and found to be well connected and easy
to access. However, on some days, especially weekends, and during peak hours
on weekdays, conflicts between pedestrians and vehicles seemed visible due to
the activities that were simultaneously taking place.
The physical condition of the Jalan Masjid India sidewalks was found to
be satisfactory for walking. The continuous design spaces were adequate to link
users to and from adjacent places. The evaluation indicated that the sidewalks
were wide and comfortable enough to accommodate high numbers of users with
minimal clashes as summarised in Tables 1, 2, and 3 above. The major pause
points in the movement, as shown in Figures 4, 5, and 6 earlier, were mainly the
vendors, street stall operators, and owners of commercial storefronts. Adequate
spaces were allocated to these users that support the vibrant, active, and engaging
street environment.
The overall movement and pause points of Jalan Masjid India were good
for a street environment, where the buildings create frontages, and its streetscape
showcases the people using the space for connectivity and activities.
However, to improve the quality of the street, regular cleaning and maintenance
is required to support the commercial activities along the street. Besides that,
protection from extreme weather should also be incorporated to ensure an
enjoyable street experience for the users.
CONCLUSION
The findings of the study revealed that the movement and activities along Jalan
Masjid India were very lively with a significant number of people on foot noted
throughout the observation exercise. These people brought life to the street
throughout the day even though there were conflicts between pedestrians and
vehicles which were visible at certain times. Despite the extreme transitions
between rainy and hot days, the results proved that users were still comfortable
walking to adjacent places. Thus, clearly, Jalan Masjid India is functional, and its
physical character acts as a comfortable mode of movement for users.
The potential of the street as a great public space is seen as possible if the
street design and soft landscape were more defined and focused. The study
concludes that the walkability of the street is good although there were some
challenges, such as poorly maintained footways, and broken pavements. The
Normah Sulaiman, Yusfida Ayu Abdullah & Raja Norashekin Raja Othman
Measuring Attributes and Behavioural Patterns of Street Liveliness in Urban Area
© 2019 by MIP 300
research also identified the active and passive areas that can foster engagement
of interactions, and that an urban designer must avoid the creation of empty
spaces that are not well-connected to the pedestrian network on a larger scale.
Ultimately, from the study, it can be determined that some changes can
be made to the street as it seems flexible enough to adapt without affecting current
core businesses of the street through a flexible street management approach.
Through this tactic, the character of Jalan Masjid India as a downtown market
street was highlighted using design treatments while still allowing it to handle a
high volume of pedestrians and activities. The planning of the design treatments
should also consider the street context and limits as well as potential flows and
volumes of movement of all user groups coming from nearby streets
into Jalan Masjid India. Gradually, this will give time for users to adapt to the
changes, and the street’s liveliness, function, and urban activities. Henceforth, the
street will be able to function to full capacity, where people can enjoy many social
and outdoor activities.
ACKNOWLEDGEMENTS
The authors would like to thank Taylor’s University and Universiti Teknologi
MARA (UiTM) for supporting the research.
REFERENCES Carmona, M. Tiesdell, S., & Oc, T. (2010). Public places, urban spaces. Oxford, UK:
Architectural Press.
Gehl, J., & Svarre, B. (2018). How to study public life. Washington: Island Press.
Fauzi, A., & Aditianata, A. (2018). Spatial Analysis in determining physical factors of
pedestrian space livability, Case study: Pedestrian space on Jalan Kemasan,
Yogyakarta. IOP Conference Series: Earth and Environmental Science, 123,
012042.
Google Maps (2018a). Jalan Masjid India. Retrieved from
https://www.google.com/maps/ @3.1542198,101.6962938,16.25z
Google Maps (2018b). Jalan Masjid India. Retrieved from
https://www.google.com/maps/ @3.1535906,101.696556,16.75z
Heng, C. K,, Low, B. L. & Hee, L. (2010). On Asian streets and public space. Singapore:
NUS Press.
Jacobs, J. (2011). The death and life of great American Cities (1st ed). New York: Modern
Library.
Koohsari, M., Mavoa, S., Villanueva, K., Sugiyama, T., Badland, H., …& Giles-Corti, B.
(2015). Public open space, physical activity, urban design and public health:
Concepts, methods and research agenda. Health & Place, 33, 75-82.
Mehta, V. (2014) The street. London: Routledge Taylor & Francis Group
Sholihah, A.B. & Heath, T. (2016) Assessing the quality of a traditional street in
Indonesia: The diversity indicator. In AMER Intnternational Conference of
Quality of Life, February 25-27, 2016, Medan, Indonesia.

PLANNING MALAYSIA
Journal of the Malaysia Institute of Planners (2019)
301 © 2019 by MIP
Sulaiman, N., Ayu Abdullah, Y., & Hamdan, H. (2017). Street as public space -
Measuring street life of Kuala Lumpur. IOP Conference Series: Materials
Science And Engineering, 245, 082025.
UN-Habitat. (2016). Charter of public space. Instituto Nazionale di Urbanistica.
Received: 12th January 2019. Accepted: 2nd August 2019
1Researcher at International Islamic University Malaysia. Email: [email protected] 302
PLANNING MALAYSIA:
Journal of the Malaysian Institute of Planners
VOLUME 17 ISSUE 2 (2019), Page 302 – 311
PERSONAL EMPOWERMENT AS DETERMINANTS OF
ORGANISATIONAL OPPORTUNITY
Aisyah Abu Bakar1, Mariana Mohamed Osman2 & Muhammad Faris Abdullah3
1,2,3Kulliyyah of Architecture and Environmental Design
INTERNATIONAL ISLAMIC UNIVERSITY MALAYSIA
Abstract
Architects can influence workplace behaviours and manoeuvre workers’
emotions through aligning design strategies with human moods. Design sustains
organisational well-being through strengthening space occupants’ empowerment,
leading to better work performances. Issue: Existing research has limited
empirical evidence on the impact of personal empowerment (PE) on
organisational opportunity (OO). Purpose: This paper aims to verify the
statistical predictability of OO based on PE. Approach: Multiple Correlation and
Multiple Linear Regression were carried out to assess linear associations and
parameters of linear equations to predict OO components based on PE items.
Findings: OO components were predictable by the majority of the PE items and
‘monitoring behaviours to suit with situation’ was the strongest predictor of OO.
Keywords: organisational opportunity, personal empowerment
PLANNING MALAYSIA
Journal of the Malaysia Institute of Planners (2019)
303 © 2019 by MIP
INTRODUCTION
Human interdependence with other humans (HIH) plays a big part in architectural
psychology as designers now gain a new set of criteria in improving emotional
aspects of spatial designs. HIH is one of the potent causes of subjective
sustainable well-being (SSWB). Personal empowerment (PE) and organisational
opportunity (OO) are dimensions of HIH. Space qualities have a tremendous
impact on occupants’ way of thinking, patterns of actions and, thus promote PE,
leading to improved concentration, willingness to act, and ultimately, OO. Over
time, extensive literature have discussed the positive effect of PE on OO. This
paper assesses the statistical predictability of OO based on PE.
LITERATURE REVIEW
Case studies based on articles from selected Asian Journals from the year 2011
onwards highlight conditional factors and potential determinants of OO. Table 1
summarises these findings.
Table 1 Conditional factors and potential determinants for organisational opportunity
Conditional Factors (Keywords) Potential Determinants References Job security (stability and continuance of one’s job), organisational commitment (sense of oneness with organisation), social comfort (feeling of trust with social environment) and quality of work (quality of experience of employees-organisation relationship).
Co-workers involvement and belongingness (willing to contribute, participate, share, volunteer), and sense of responsibility
Sarina & Mohamad
Adli (2012)
Financial well-being (ability to meet current and ongoing financial obligation, and moderation in spending (restraining self from excessive expenditure)
Productivity (effectiveness), and self-control (ability to control oneself or desires)
Mokhtar, Husniyah,
Sabri, & Abu Talib. (2015)
Time-based constraint (the time demands of one role are incompatible with those of another), strain-based constraint (strain experienced in one role interferes with participation in another role), and behaviour-based constraint (behaviour pattern appropriate to one domain are inappropriate in another).
Emotional intelligence (ability to recognize and react to owns and others’ emotions), self-control (ability to control oneself) and social support (perception that one is cared for)
Panatik, Zainal Badri, Rajab, Abdul Rahman, & Mad Shaha
(2011)
Work-family conflict (incompatible demands between career and family roles), and personal adjustment (balancing conflicting needs or certain requirements against the surrounding obstacles)
Self-esteem through adaptation (confidence in self-worthiness resulting from one’s interaction with others)
(Rashid, Nordin, Omar, &
Ismail (2012) Work ethics (principles that hard work is virtuous and believing in moral benefits of work), and passiveness in taking charge (reluctant to do more than what were minimally required to do).
Organisational commitment (accountability, integrity, teamwork and participation, effort and proactivity)
Salin (2013)
Goal orientation (the ability to take charge and focus on demanding tasks), bravery (courageous character), achievement motivation (the need to success or attaining excellence), and job performance
Dominance (influence over others), openness (frankness), cheerful (optimistic), confidence, and imaginative (inventiveness)
Halim, Zainal, Omar, Hafidz,
& Othman (2013)
Job insecurity (behavioural withdrawal, perceived powerlessness to maintain a desired continuity experienced, and concern the possibility of being retrenched in the future)
Optimism (hopefulness and confidence for the future), and confidence in hierarchy and ranks of the organisation
Ho, Sambasivan,
& Liew (2013)
Safety culture (an outcome of values, attitudes and behaviours concerning safety in the workplace), safety training, resource allocation and management.
Commitment (dedication), and leadership (guiding and inspiring others)
Ismail, Ahmad,
Ismail, &
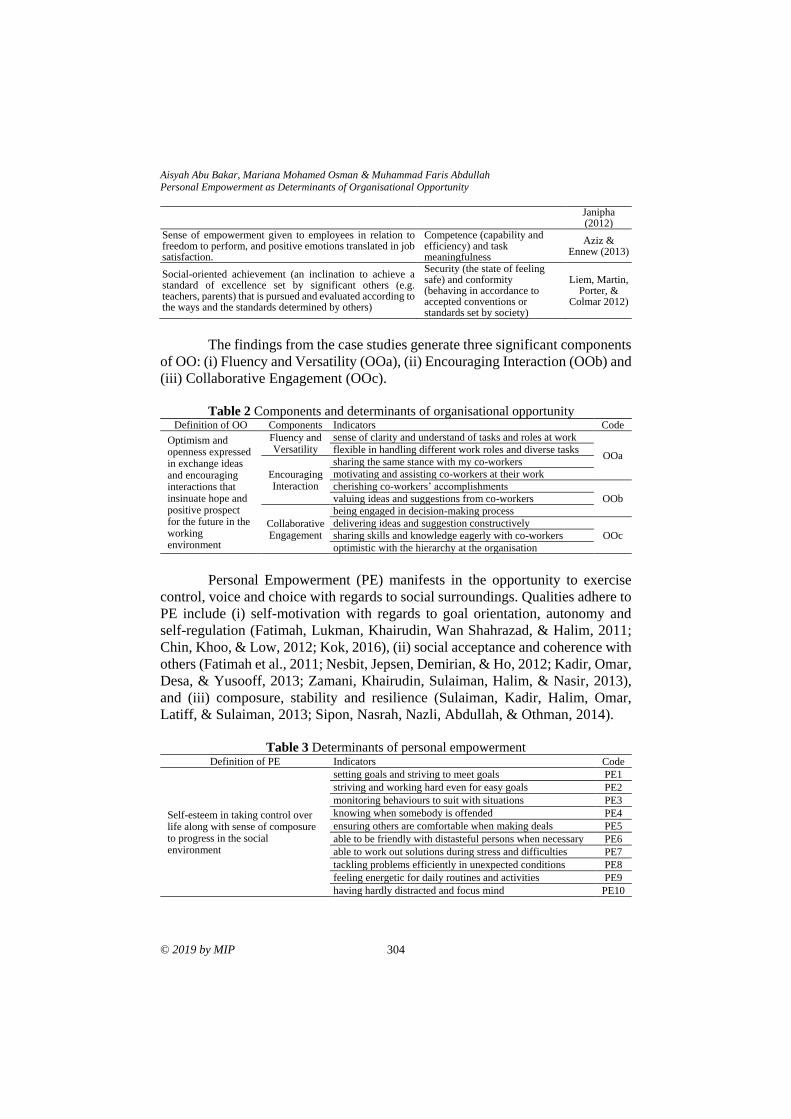
Aisyah Abu Bakar, Mariana Mohamed Osman & Muhammad Faris Abdullah
Personal Empowerment as Determinants of Organisational Opportunity
© 2019 by MIP 304
Janipha (2012)
Sense of empowerment given to employees in relation to freedom to perform, and positive emotions translated in job satisfaction.
Competence (capability and efficiency) and task meaningfulness
Aziz & Ennew (2013)
Social-oriented achievement (an inclination to achieve a standard of excellence set by significant others (e.g. teachers, parents) that is pursued and evaluated according to the ways and the standards determined by others)
Security (the state of feeling safe) and conformity (behaving in accordance to accepted conventions or standards set by society)
Liem, Martin, Porter, &
Colmar 2012)
The findings from the case studies generate three significant components
of OO: (i) Fluency and Versatility (OOa), (ii) Encouraging Interaction (OOb) and
(iii) Collaborative Engagement (OOc).
Table 2 Components and determinants of organisational opportunity
Definition of OO Components Indicators Code
Optimism and openness expressed in exchange ideas and encouraging interactions that insinuate hope and positive prospect for the future in the working environment
Fluency and Versatility
sense of clarity and understand of tasks and roles at work
OOa flexible in handling different work roles and diverse tasks
Encouraging Interaction
sharing the same stance with my co-workers
motivating and assisting co-workers at their work
cherishing co-workers’ accomplishments
OOb valuing ideas and suggestions from co-workers
Collaborative Engagement
being engaged in decision-making process
delivering ideas and suggestion constructively
OOc sharing skills and knowledge eagerly with co-workers
optimistic with the hierarchy at the organisation
Personal Empowerment (PE) manifests in the opportunity to exercise
control, voice and choice with regards to social surroundings. Qualities adhere to
PE include (i) self-motivation with regards to goal orientation, autonomy and
self-regulation (Fatimah, Lukman, Khairudin, Wan Shahrazad, & Halim, 2011;
Chin, Khoo, & Low, 2012; Kok, 2016), (ii) social acceptance and coherence with
others (Fatimah et al., 2011; Nesbit, Jepsen, Demirian, & Ho, 2012; Kadir, Omar,
Desa, & Yusooff, 2013; Zamani, Khairudin, Sulaiman, Halim, & Nasir, 2013),
and (iii) composure, stability and resilience (Sulaiman, Kadir, Halim, Omar,
Latiff, & Sulaiman, 2013; Sipon, Nasrah, Nazli, Abdullah, & Othman, 2014).
Table 3 Determinants of personal empowerment
Definition of PE Indicators Code
Self-esteem in taking control over life along with sense of composure to progress in the social environment
setting goals and striving to meet goals PE1
striving and working hard even for easy goals PE2
monitoring behaviours to suit with situations PE3
knowing when somebody is offended PE4
ensuring others are comfortable when making deals PE5
able to be friendly with distasteful persons when necessary PE6
able to work out solutions during stress and difficulties PE7
tackling problems efficiently in unexpected conditions PE8
feeling energetic for daily routines and activities PE9
having hardly distracted and focus mind PE10
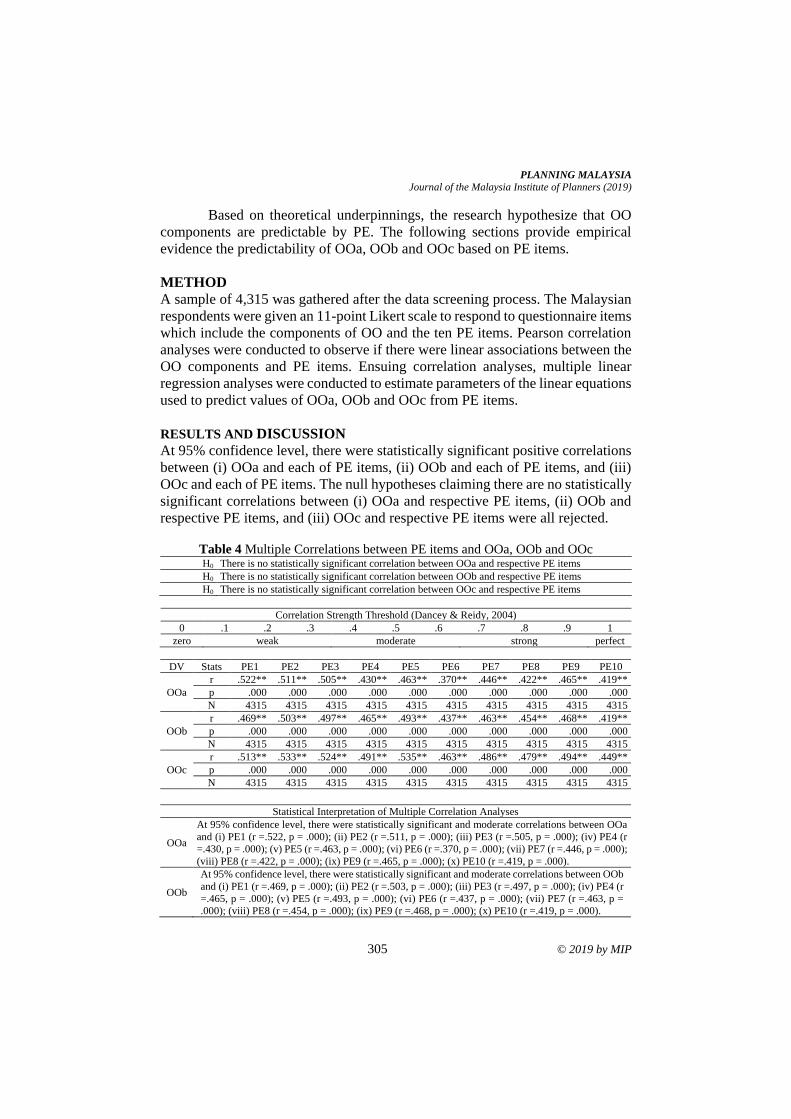
PLANNING MALAYSIA
Journal of the Malaysia Institute of Planners (2019)
305 © 2019 by MIP
Based on theoretical underpinnings, the research hypothesize that OO
components are predictable by PE. The following sections provide empirical
evidence the predictability of OOa, OOb and OOc based on PE items.
METHOD
A sample of 4,315 was gathered after the data screening process. The Malaysian
respondents were given an 11-point Likert scale to respond to questionnaire items
which include the components of OO and the ten PE items. Pearson correlation
analyses were conducted to observe if there were linear associations between the
OO components and PE items. Ensuing correlation analyses, multiple linear
regression analyses were conducted to estimate parameters of the linear equations
used to predict values of OOa, OOb and OOc from PE items.
RESULTS AND DISCUSSION
At 95% confidence level, there were statistically significant positive correlations
between (i) OOa and each of PE items, (ii) OOb and each of PE items, and (iii)
OOc and each of PE items. The null hypotheses claiming there are no statistically
significant correlations between (i) OOa and respective PE items, (ii) OOb and
respective PE items, and (iii) OOc and respective PE items were all rejected.
Table 4 Multiple Correlations between PE items and OOa, OOb and OOc H0 There is no statistically significant correlation between OOa and respective PE items
H0 There is no statistically significant correlation between OOb and respective PE items
H0 There is no statistically significant correlation between OOc and respective PE items
Correlation Strength Threshold (Dancey & Reidy, 2004)
0 .1 .2 .3 .4 .5 .6 .7 .8 .9 1
zero weak moderate strong perfect
DV Stats PE1 PE2 PE3 PE4 PE5 PE6 PE7 PE8 PE9 PE10
OOa
r .522** .511** .505** .430** .463** .370** .446** .422** .465** .419**
p .000 .000 .000 .000 .000 .000 .000 .000 .000 .000
N 4315 4315 4315 4315 4315 4315 4315 4315 4315 4315
OOb
r .469** .503** .497** .465** .493** .437** .463** .454** .468** .419**
p .000 .000 .000 .000 .000 .000 .000 .000 .000 .000
N 4315 4315 4315 4315 4315 4315 4315 4315 4315 4315
OOc
r .513** .533** .524** .491** .535** .463** .486** .479** .494** .449**
p .000 .000 .000 .000 .000 .000 .000 .000 .000 .000
N 4315 4315 4315 4315 4315 4315 4315 4315 4315 4315
Statistical Interpretation of Multiple Correlation Analyses
OOa
At 95% confidence level, there were statistically significant and moderate correlations between OOa
and (i) PE1 (r =.522, p = .000); (ii) PE2 (r =.511, p = .000); (iii) PE3 (r =.505, p = .000); (iv) PE4 (r
=.430, p = .000); (v) PE5 (r =.463, p = .000); (vi) PE6 (r =.370, p = .000); (vii) PE7 (r =.446, p = .000);
(viii) PE8 (r =.422, p = .000); (ix) PE9 (r =.465, p = .000); (x) PE10 (r =.419, p = .000).
OOb
At 95% confidence level, there were statistically significant and moderate correlations between OOb
and (i) PE1 (r =.469, p = .000); (ii) PE2 (r =.503, p = .000); (iii) PE3 (r =.497, p = .000); (iv) PE4 (r
=.465, p = .000); (v) PE5 (r =.493, p = .000); (vi) PE6 (r =.437, p = .000); (vii) PE7 (r =.463, p =
.000); (viii) PE8 (r =.454, p = .000); (ix) PE9 (r =.468, p = .000); (x) PE10 (r =.419, p = .000).
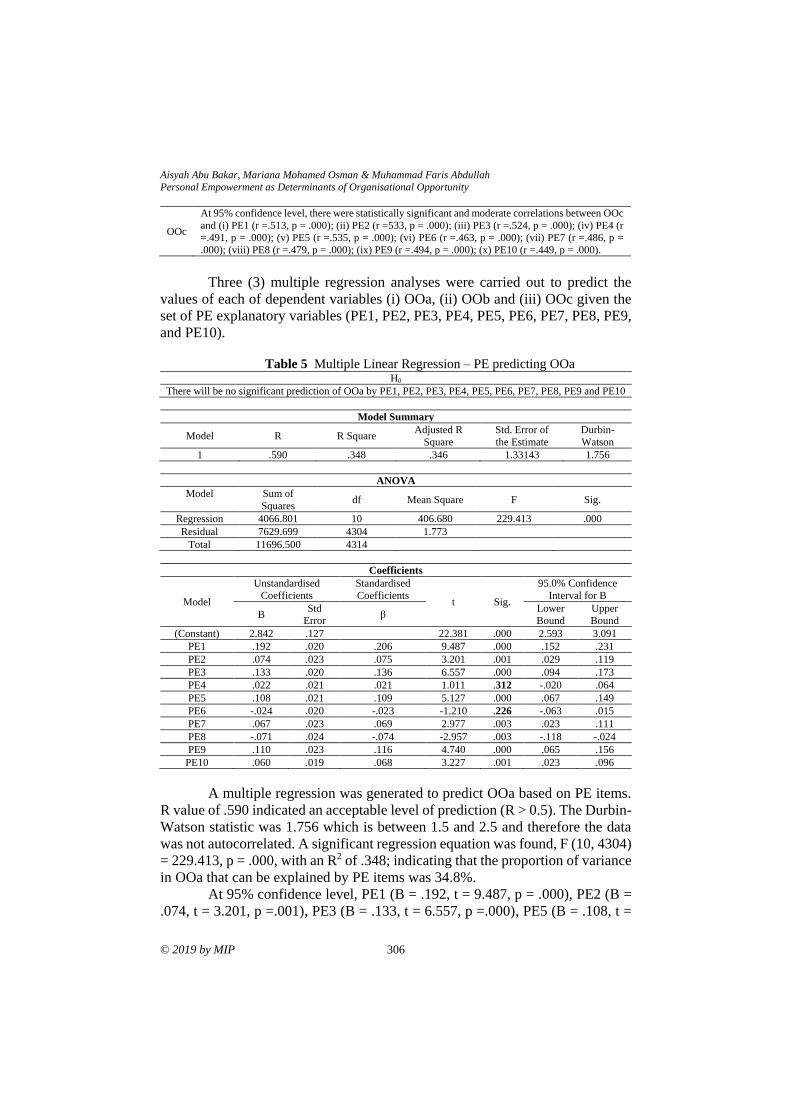
Aisyah Abu Bakar, Mariana Mohamed Osman & Muhammad Faris Abdullah
Personal Empowerment as Determinants of Organisational Opportunity
© 2019 by MIP 306
OOc
At 95% confidence level, there were statistically significant and moderate correlations between OOc
and (i) PE1 (r =.513, p = .000); (ii) PE2 (r =533, p = .000); (iii) PE3 (r =.524, p = .000); (iv) PE4 (r
=.491, p = .000); (v) PE5 (r =.535, p = .000); (vi) PE6 (r =.463, p = .000); (vii) PE7 (r =.486, p =
.000); (viii) PE8 (r =.479, p = .000); (ix) PE9 (r =.494, p = .000); (x) PE10 (r =.449, p = .000).
Three (3) multiple regression analyses were carried out to predict the
values of each of dependent variables (i) OOa, (ii) OOb and (iii) OOc given the
set of PE explanatory variables (PE1, PE2, PE3, PE4, PE5, PE6, PE7, PE8, PE9,
and PE10).
Table 5 Multiple Linear Regression – PE predicting OOa H0
There will be no significant prediction of OOa by PE1, PE2, PE3, PE4, PE5, PE6, PE7, PE8, PE9 and PE10
Model Summary
Model R R Square Adjusted R
Square
Std. Error of
the Estimate
Durbin-
Watson
1 .590 .348 .346 1.33143 1.756
ANOVA
Model Sum of
Squares df Mean Square F Sig.
Regression 4066.801 10 406.680 229.413 .000
Residual 7629.699 4304 1.773
Total 11696.500 4314
Coefficients
Model
Unstandardised
Coefficients
Standardised
Coefficients t Sig.
95.0% Confidence
Interval for B
B Std
Error β
Lower
Bound
Upper
Bound
(Constant) 2.842 .127 22.381 .000 2.593 3.091
PE1 .192 .020 .206 9.487 .000 .152 .231
PE2 .074 .023 .075 3.201 .001 .029 .119
PE3 .133 .020 .136 6.557 .000 .094 .173
PE4 .022 .021 .021 1.011 .312 -.020 .064
PE5 .108 .021 .109 5.127 .000 .067 .149
PE6 -.024 .020 -.023 -1.210 .226 -.063 .015
PE7 .067 .023 .069 2.977 .003 .023 .111
PE8 -.071 .024 -.074 -2.957 .003 -.118 -.024
PE9 .110 .023 .116 4.740 .000 .065 .156
PE10 .060 .019 .068 3.227 .001 .023 .096
A multiple regression was generated to predict OOa based on PE items.
R value of .590 indicated an acceptable level of prediction (R > 0.5). The Durbin-
Watson statistic was 1.756 which is between 1.5 and 2.5 and therefore the data
was not autocorrelated. A significant regression equation was found, F (10, 4304)
= 229.413, p = .000, with an R2 of .348; indicating that the proportion of variance
in OOa that can be explained by PE items was 34.8%.
At 95% confidence level, PE1 (B = .192, t = 9.487, p = .000), PE2 (B =
.074, t = 3.201, p =.001), PE3 (B = .133, t = 6.557, p =.000), PE5 (B = .108, t =
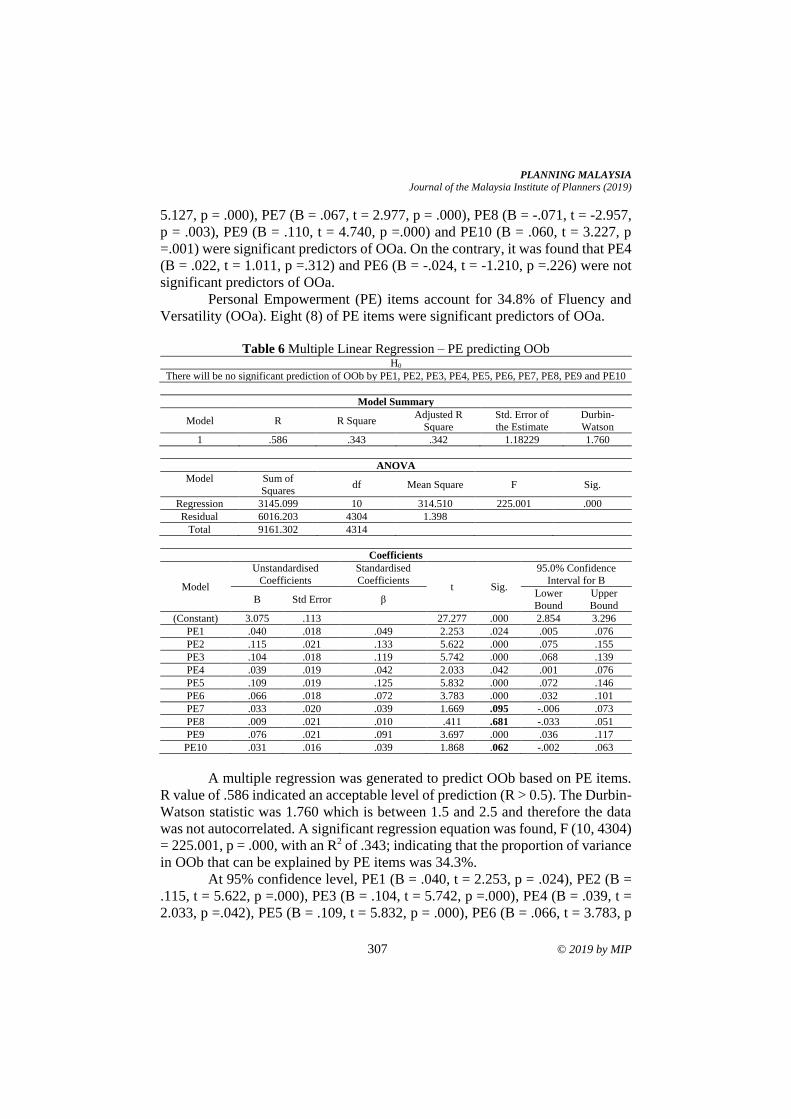
PLANNING MALAYSIA
Journal of the Malaysia Institute of Planners (2019)
307 © 2019 by MIP
5.127, p = .000), PE7 (B = .067, t = 2.977, p = .000), PE8 (B = -.071, t = -2.957,
p = .003), PE9 (B = .110, t = 4.740, p =.000) and PE10 (B = .060, t = 3.227, p
=.001) were significant predictors of OOa. On the contrary, it was found that PE4
(B = .022, t = 1.011, p =.312) and PE6 (B = -.024, t = -1.210, p =.226) were not
significant predictors of OOa.
Personal Empowerment (PE) items account for 34.8% of Fluency and
Versatility (OOa). Eight (8) of PE items were significant predictors of OOa.
Table 6 Multiple Linear Regression – PE predicting OOb
H0
There will be no significant prediction of OOb by PE1, PE2, PE3, PE4, PE5, PE6, PE7, PE8, PE9 and PE10
Model Summary
Model R R Square Adjusted R
Square
Std. Error of
the Estimate
Durbin-
Watson
1 .586 .343 .342 1.18229 1.760
ANOVA
Model Sum of
Squares df Mean Square F Sig.
Regression 3145.099 10 314.510 225.001 .000
Residual 6016.203 4304 1.398
Total 9161.302 4314
Coefficients
Model
Unstandardised
Coefficients
Standardised
Coefficients t Sig.
95.0% Confidence
Interval for B
B Std Error β Lower
Bound
Upper
Bound
(Constant) 3.075 .113 27.277 .000 2.854 3.296
PE1 .040 .018 .049 2.253 .024 .005 .076
PE2 .115 .021 .133 5.622 .000 .075 .155
PE3 .104 .018 .119 5.742 .000 .068 .139
PE4 .039 .019 .042 2.033 .042 .001 .076
PE5 .109 .019 .125 5.832 .000 .072 .146
PE6 .066 .018 .072 3.783 .000 .032 .101
PE7 .033 .020 .039 1.669 .095 -.006 .073
PE8 .009 .021 .010 .411 .681 -.033 .051
PE9 .076 .021 .091 3.697 .000 .036 .117
PE10 .031 .016 .039 1.868 .062 -.002 .063
A multiple regression was generated to predict OOb based on PE items.
R value of .586 indicated an acceptable level of prediction (R > 0.5). The Durbin-
Watson statistic was 1.760 which is between 1.5 and 2.5 and therefore the data
was not autocorrelated. A significant regression equation was found, F (10, 4304)
= 225.001, p = .000, with an R2 of .343; indicating that the proportion of variance
in OOb that can be explained by PE items was 34.3%.
At 95% confidence level, PE1 (B = .040, t = 2.253, p = .024), PE2 (B =
.115, t = 5.622, p =.000), PE3 (B = .104, t = 5.742, p =.000), PE4 (B = .039, t =
2.033, p =.042), PE5 (B = .109, t = 5.832, p = .000), PE6 (B = .066, t = 3.783, p
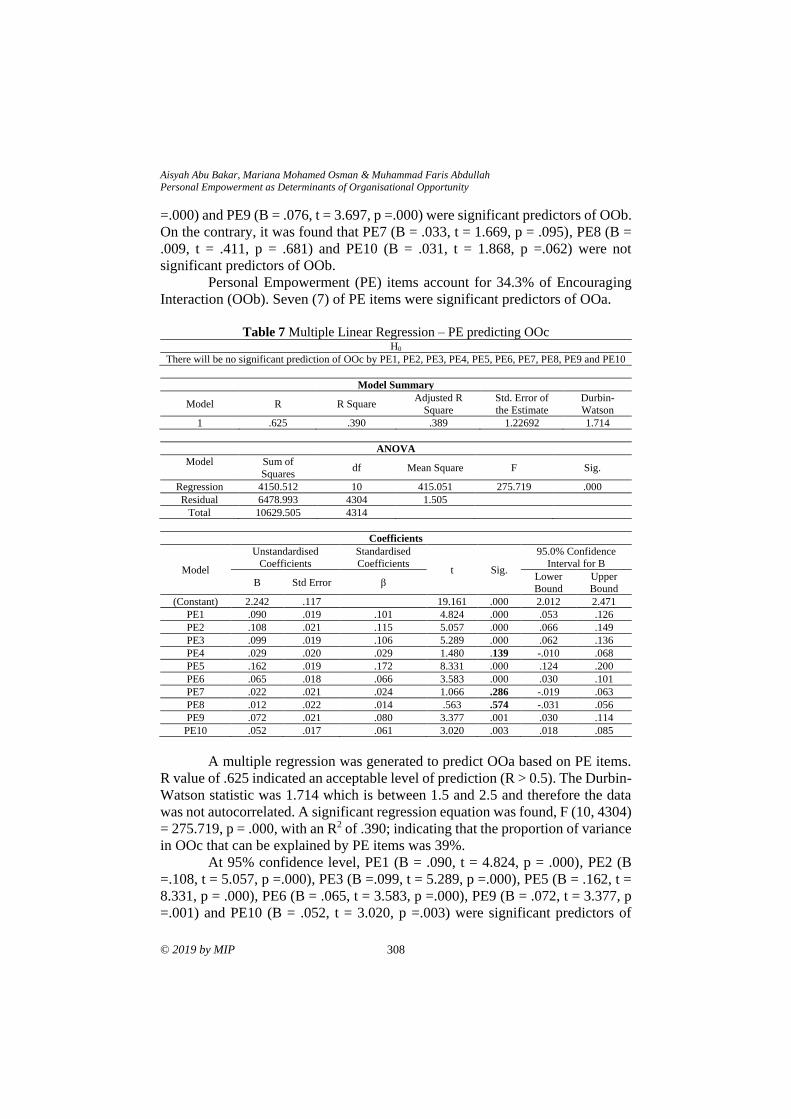
Aisyah Abu Bakar, Mariana Mohamed Osman & Muhammad Faris Abdullah
Personal Empowerment as Determinants of Organisational Opportunity
© 2019 by MIP 308
=.000) and PE9 (B = .076, t = 3.697, p =.000) were significant predictors of OOb.
On the contrary, it was found that PE7 (B = .033, t = 1.669, p = .095), PE8 (B =
.009, t = .411, p = .681) and PE10 (B = .031, t = 1.868, p =.062) were not
significant predictors of OOb.
Personal Empowerment (PE) items account for 34.3% of Encouraging
Interaction (OOb). Seven (7) of PE items were significant predictors of OOa.
Table 7 Multiple Linear Regression – PE predicting OOc
H0
There will be no significant prediction of OOc by PE1, PE2, PE3, PE4, PE5, PE6, PE7, PE8, PE9 and PE10
Model Summary
Model R R Square Adjusted R
Square
Std. Error of
the Estimate
Durbin-
Watson
1 .625 .390 .389 1.22692 1.714
ANOVA
Model Sum of
Squares df Mean Square F Sig.
Regression 4150.512 10 415.051 275.719 .000
Residual 6478.993 4304 1.505
Total 10629.505 4314
Coefficients
Model
Unstandardised
Coefficients
Standardised
Coefficients t Sig.
95.0% Confidence
Interval for B
B Std Error β Lower
Bound
Upper
Bound
(Constant) 2.242 .117 19.161 .000 2.012 2.471
PE1 .090 .019 .101 4.824 .000 .053 .126
PE2 .108 .021 .115 5.057 .000 .066 .149
PE3 .099 .019 .106 5.289 .000 .062 .136
PE4 .029 .020 .029 1.480 .139 -.010 .068
PE5 .162 .019 .172 8.331 .000 .124 .200
PE6 .065 .018 .066 3.583 .000 .030 .101
PE7 .022 .021 .024 1.066 .286 -.019 .063
PE8 .012 .022 .014 .563 .574 -.031 .056
PE9 .072 .021 .080 3.377 .001 .030 .114
PE10 .052 .017 .061 3.020 .003 .018 .085
A multiple regression was generated to predict OOa based on PE items.
R value of .625 indicated an acceptable level of prediction (R > 0.5). The Durbin-
Watson statistic was 1.714 which is between 1.5 and 2.5 and therefore the data
was not autocorrelated. A significant regression equation was found, F (10, 4304)
= 275.719, p = .000, with an R2 of .390; indicating that the proportion of variance
in OOc that can be explained by PE items was 39%.
At 95% confidence level, PE1 (B = .090, t = 4.824, p = .000), PE2 (B
=.108, t = 5.057, p =.000), PE3 (B =.099, t = 5.289, p =.000), PE5 (B = .162, t =
8.331, p = .000), PE6 (B = .065, t = 3.583, p =.000), PE9 (B = .072, t = 3.377, p
=.001) and PE10 (B = .052, t = 3.020, p =.003) were significant predictors of
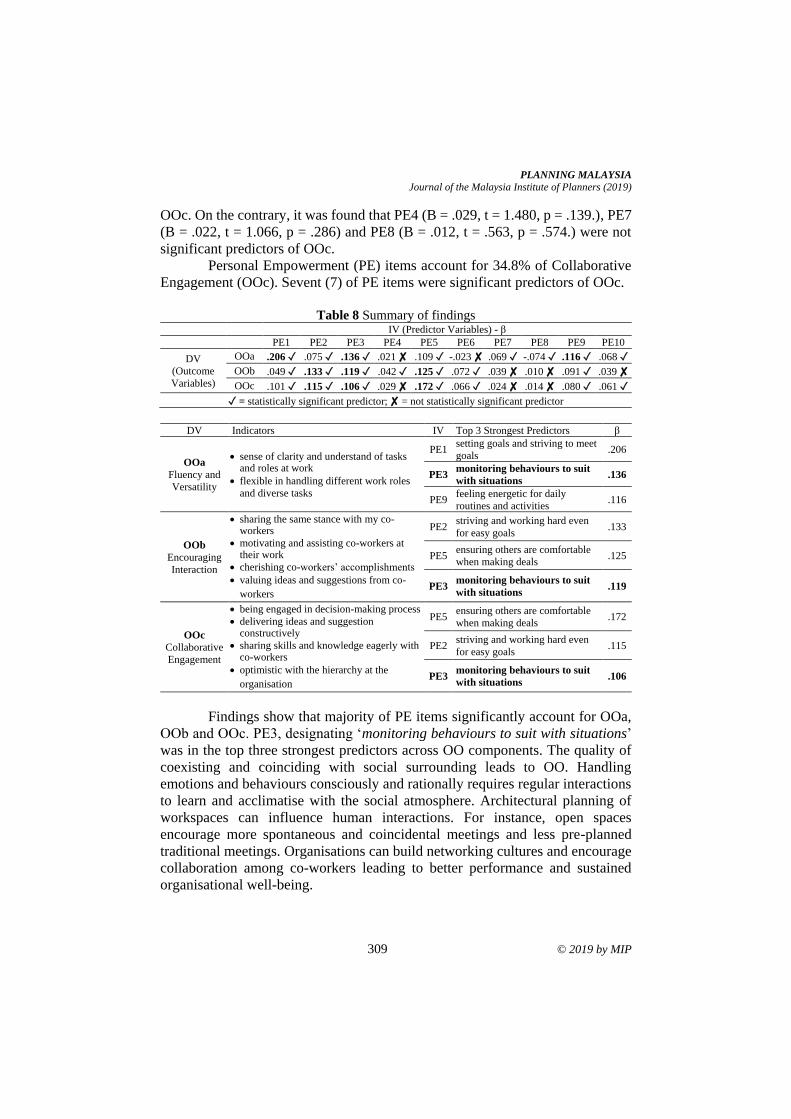
PLANNING MALAYSIA
Journal of the Malaysia Institute of Planners (2019)
309 © 2019 by MIP
OOc. On the contrary, it was found that PE4 (B = .029, t = 1.480, p = .139.), PE7
(B = .022, t = 1.066, p = .286) and PE8 (B = .012, t = .563, p = .574.) were not
significant predictors of OOc.
Personal Empowerment (PE) items account for 34.8% of Collaborative
Engagement (OOc). Sevent (7) of PE items were significant predictors of OOc.
Table 8 Summary of findings
IV (Predictor Variables) - β
PE1 PE2 PE3 PE4 PE5 PE6 PE7 PE8 PE9 PE10
DV
(Outcome
Variables)
OOa .206 ✓ .075 ✓ .136 ✓ .021 ✘ .109 ✓ -.023 ✘ .069 ✓ -.074 ✓ .116 ✓ .068 ✓
OOb .049 ✓ .133 ✓ .119 ✓ .042 ✓ .125 ✓ .072 ✓ .039 ✘ .010 ✘ .091 ✓ .039 ✘
OOc .101 ✓ .115 ✓ .106 ✓ .029 ✘ .172 ✓ .066 ✓ .024 ✘ .014 ✘ .080 ✓ .061 ✓
✓ = statistically significant predictor; ✘ = not statistically significant predictor
DV Indicators IV Top 3 Strongest Predictors β
OOa
Fluency and
Versatility
• sense of clarity and understand of tasks and roles at work
• flexible in handling different work roles
and diverse tasks
PE1 setting goals and striving to meet
goals .206
PE3 monitoring behaviours to suit
with situations .136
PE9 feeling energetic for daily
routines and activities .116
OOb
Encouraging
Interaction
• sharing the same stance with my co-workers
• motivating and assisting co-workers at their work
• cherishing co-workers’ accomplishments
• valuing ideas and suggestions from co-
workers
PE2 striving and working hard even
for easy goals .133
PE5 ensuring others are comfortable
when making deals .125
PE3 monitoring behaviours to suit
with situations .119
OOc
Collaborative
Engagement
• being engaged in decision-making process
• delivering ideas and suggestion constructively
• sharing skills and knowledge eagerly with co-workers
• optimistic with the hierarchy at the
organisation
PE5 ensuring others are comfortable
when making deals .172
PE2 striving and working hard even
for easy goals .115
PE3 monitoring behaviours to suit
with situations .106
Findings show that majority of PE items significantly account for OOa,
OOb and OOc. PE3, designating ‘monitoring behaviours to suit with situations’
was in the top three strongest predictors across OO components. The quality of
coexisting and coinciding with social surrounding leads to OO. Handling
emotions and behaviours consciously and rationally requires regular interactions
to learn and acclimatise with the social atmosphere. Architectural planning of
workspaces can influence human interactions. For instance, open spaces
encourage more spontaneous and coincidental meetings and less pre-planned
traditional meetings. Organisations can build networking cultures and encourage
collaboration among co-workers leading to better performance and sustained
organisational well-being.
Aisyah Abu Bakar, Mariana Mohamed Osman & Muhammad Faris Abdullah
Personal Empowerment as Determinants of Organisational Opportunity
© 2019 by MIP 310
CONCLUSION
HIH in SSWB propounds the idea that human expressions and behaviours need
coexist harmoniously with concerns of others. This paper evidence that OO is
predictable through PE. Statistical modelling on the constructs elaborated in this
paper are the next steps in the future direction of the research.
REFERENCES Aziz, Y. A., & Ennew, C. (2013). Assessing the effects of empowerment and emotions
on job satisfaction in hotel service environments. Pertanika Journal of Social Science and Humanities, 21(SPEC. ISSUE), 65-84.
Chin, N.-S., Khoo, S., & Low, W.-Y. (2012). Self-determination and goal orientation in track and field. Journal of Human Kinetics, 33(1), 151-161.
Dancey, C., & Reidy, J. (2004) Statistics without maths for psychology: Ssing SPSS for Windows. London: Prentice Hall.
Fatimah, O., Lukman, Z. M., Khairudin, R., Wan Shahrazad, W. S., & Halim, F. W. (2011). Procrastination’s relation with fear of failure, competence expectancy and intrinsic motivation. Pertanika Journal of Social Science and Humanities, 19(Special), 123-127.
Halim, F. W., Zainal, A., Omar, F., Hafidz, S. W. M., & Othman, M. A. (2013). Exploring the mediating mechanisms in the personality-job performance relationship. Pertanika Journal of Social Science and Humanities, 21(December), 189-200.
Ho, J. A., Sambasivan, M., & Liew, E. Y. (2013). The relationship between job insecurity, shock, and turnover intention, amongst survivors of organizational downsizing. Pertanika Journal of Social Science and Humanities, 21(Special), 101-114.
Ismail, F., Ahmad, N., Ismail, R., & Janipha, N. A. I. (2012). The behavioural factors’ characteristics of safety culture. Journal of Asian Behavioural Studies, 2, 67-75.
Kadir, N. B. A., Omar, F., Desa, A., & Yusooff, F. (2013). Secure style, PWB-related gratitude and SWB-related engagement as predictors of affect balance among social science students in Malaysia: A pilot study. Pertanika Journal of Social Science and Humanities, 21, 85-98.
Kok, J. K. (2016). The relationships between procrastination and motivational aspects of self-regulation. Jurnal Psikologi Malaysia, 30(1), 30-39.
Liem, G. A. D., Martin, A. J., Porter, A. L., & Colmar, S. (2012). Sociocultural antecedents of academic motivation and achievement: Role of values and achievement motives in achievement goals and academic performance. Asian Journal of Social Psychology, 15(1), 1-13.
Mokhtar, N., Husniyah, A. R., Sabri, M. F., & Abu Talib, M. (2015). Financial well-being among public employees in Malaysia: A preliminary study. Asian Social Science, 11(18), 49-54.
Nesbit, P. L., Jepsen, D., Demirian, S., & Ho, J. (2012). Extending self-leadership research to the East: Measurement equivalence of the Chinese and English versions of the MSLQ. Asian Journal of Social Psychology, 15(2), 101-111.
Panatik, S. A., Zainal Badri, S. K., Rajab, A., Abdul Rahman, H., & Mad Shaha, I. (2011). The impact of work family conflict on psychological well-being among school teachers in Malaysia. Social and Behavioral Sciences, 29(2010), 1500-1507.
Rashid, W. E. W., Nordin, M. S., Omar, A., & Ismail, I. (2012). Work/family conflict: The link between self-esteem and satisfaction outcomes. Procedia - Social and Behavioral Sciences, 65(ICIBSoS), 564-569.
PLANNING MALAYSIA
Journal of the Malaysia Institute of Planners (2019)
311 © 2019 by MIP
Salin, P. (2013). Islamic work ethics and organizational commitment: Evidence from employees of banking institutions in Malaysia. Social Sciences & Humanities, 21(4), 1471-1489.
Sarina, M. N., & Mohamad Adli, A. (2012). Quality work life among factory workers in Malaysia. Procedia - Social and Behavioral Sciences, 35(December 2011), 739-745.
Sipon, S., Nasrah, S. K., Nazli, N. N. N. N., Abdullah, S., & Othman, K. (2014). Stress and religious coping among flood victims. Procedia - Social and Behavioral Sciences, 140, 605-608.
Sulaiman, W. S. W., Kadir, N. B. A., Halim, F. W., Omar, F., Latiff, R. A., & Sulaiman,
W. S. W. (2013). Structural relations between personality traits, coping strategy,
social support and well-being among adolescents. Pertanika Journal of Social
Science and Humanities, 21(December), 121-134.
Zamani, Z. A., Khairudin, R., Sulaiman, W. S. W., Halim, F. W., & Nasir, R. (2013).
Relationship between achievement motivation and personality among pre and
post-independence Malaysian Malays. Pertanika Journal of Social Science and
Humanities, 21(December), 135-142
Received: 12th January 2019. Accepted: 2nd August 2019
1Researcher at International Islamic University Malaysia. Email: [email protected] 312
PLANNING MALAYSIA:
Journal of the Malaysian Institute of Planners
VOLUME 17 ISSUE 2 (2019), Page 302 – 311
PREDICTABILITY OF POSITIVE RELATIONSHIPS THROUGH
PERSONAL EMPOWERMENT
Aisyah Abu Bakar1, Mariana Mohamed Osman2 & Muhammad Faris Abdullah3
1,2,3Kulliyyah of Architecture and Environmental Design
INTERNATIONAL ISLAMIC UNIVERSITY MALAYSIA
Abstract
Designers have long adopted the knowledge from the field of psychology to
expand architectural space’s emotional impacts. Appropriate design strategies
can improve and sustain well-being through instilling the sense of empowerment,
leading to positive relationships among space occupants. Issue: A large body of
the literature has sought to provide a conclusive empirical assessment on the
predictability of attitudes and behaviours in positive relationships (PR) through
personal empowerment (PE). Purpose: This paper intends to determine the
predictability of PR based on PE. Approach: Multiple Correlation and Multiple
Linear Regression were conducted to estimate linear associations and parameters
of linear equations to predict PR components based on PE items. Findings:
Components of PR were predictable by the majority of the PE items and
‘monitoring behaviours to suit with situation’ was the strongest predictor of PR.
Keywords: positive relationship, personal empowerment
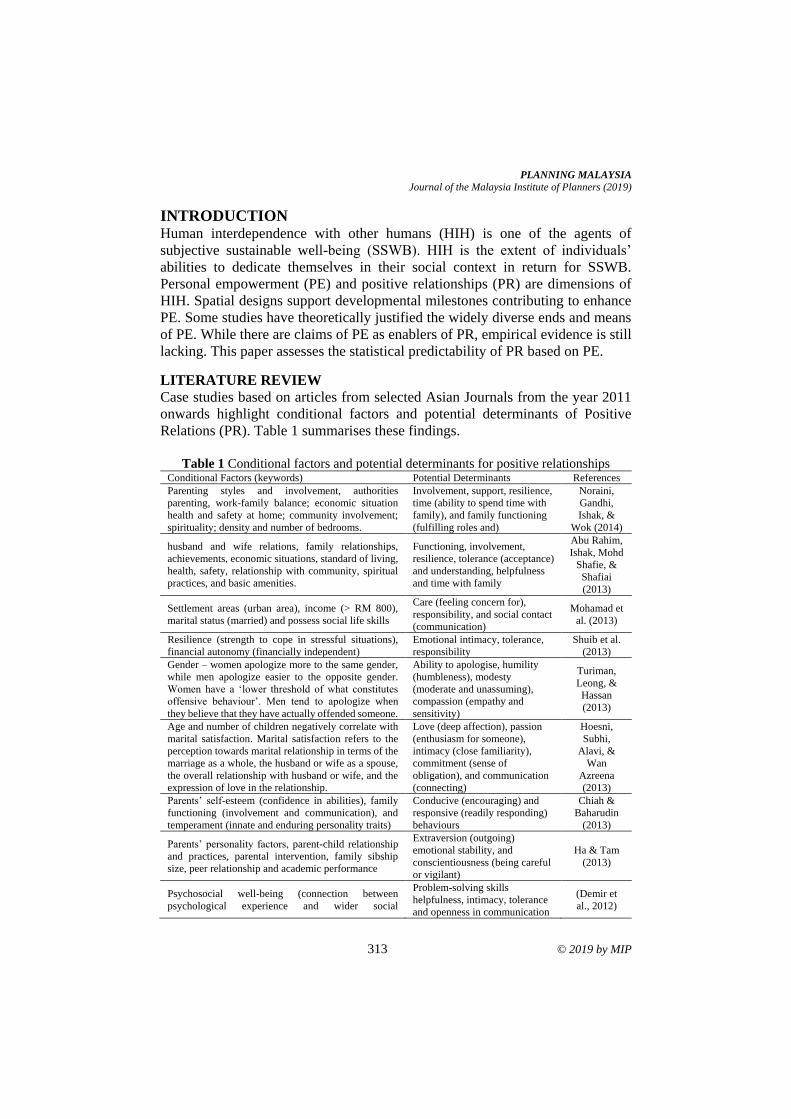
PLANNING MALAYSIA
Journal of the Malaysia Institute of Planners (2019)
313 © 2019 by MIP
INTRODUCTION
Human interdependence with other humans (HIH) is one of the agents of
subjective sustainable well-being (SSWB). HIH is the extent of individuals’
abilities to dedicate themselves in their social context in return for SSWB.
Personal empowerment (PE) and positive relationships (PR) are dimensions of
HIH. Spatial designs support developmental milestones contributing to enhance
PE. Some studies have theoretically justified the widely diverse ends and means
of PE. While there are claims of PE as enablers of PR, empirical evidence is still
lacking. This paper assesses the statistical predictability of PR based on PE.
LITERATURE REVIEW
Case studies based on articles from selected Asian Journals from the year 2011
onwards highlight conditional factors and potential determinants of Positive
Relations (PR). Table 1 summarises these findings.
Table 1 Conditional factors and potential determinants for positive relationships
Conditional Factors (keywords) Potential Determinants References
Parenting styles and involvement, authorities
parenting, work-family balance; economic situation
health and safety at home; community involvement;
spirituality; density and number of bedrooms.
Involvement, support, resilience,
time (ability to spend time with
family), and family functioning
(fulfilling roles and)
Noraini,
Gandhi,
Ishak, &
Wok (2014)
husband and wife relations, family relationships,
achievements, economic situations, standard of living,
health, safety, relationship with community, spiritual
practices, and basic amenities.
Functioning, involvement,
resilience, tolerance (acceptance)
and understanding, helpfulness
and time with family
Abu Rahim,
Ishak, Mohd
Shafie, &
Shafiai
(2013)
Settlement areas (urban area), income (> RM 800),
marital status (married) and possess social life skills
Care (feeling concern for),
responsibility, and social contact
(communication)
Mohamad et
al. (2013)
Resilience (strength to cope in stressful situations),
financial autonomy (financially independent)
Emotional intimacy, tolerance,
responsibility
Shuib et al.
(2013)
Gender – women apologize more to the same gender,
while men apologize easier to the opposite gender.
Women have a ‘lower threshold of what constitutes
offensive behaviour’. Men tend to apologize when
they believe that they have actually offended someone.
Ability to apologise, humility
(humbleness), modesty
(moderate and unassuming),
compassion (empathy and
sensitivity)
Turiman,
Leong, &
Hassan
(2013)
Age and number of children negatively correlate with
marital satisfaction. Marital satisfaction refers to the
perception towards marital relationship in terms of the
marriage as a whole, the husband or wife as a spouse,
the overall relationship with husband or wife, and the
expression of love in the relationship.
Love (deep affection), passion
(enthusiasm for someone),
intimacy (close familiarity),
commitment (sense of
obligation), and communication
(connecting)
Hoesni,
Subhi,
Alavi, &
Wan
Azreena
(2013)
Parents’ self-esteem (confidence in abilities), family
functioning (involvement and communication), and
temperament (innate and enduring personality traits)
Conducive (encouraging) and
responsive (readily responding)
behaviours
Chiah &
Baharudin
(2013)
Parents’ personality factors, parent-child relationship
and practices, parental intervention, family sibship
size, peer relationship and academic performance
Extraversion (outgoing)
emotional stability, and
conscientiousness (being careful
or vigilant)
Ha & Tam
(2013)
Psychosocial well-being (connection between
psychological experience and wider social
Problem-solving skills
helpfulness, intimacy, tolerance
and openness in communication
(Demir et
al., 2012)
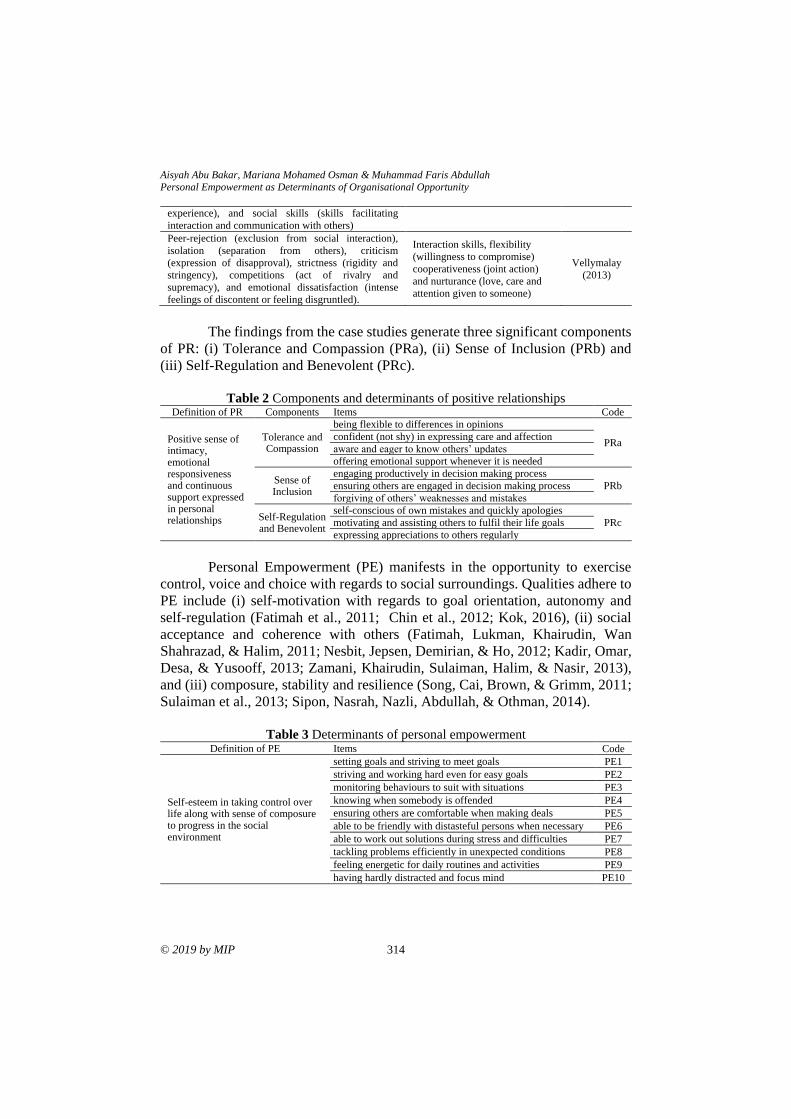
Aisyah Abu Bakar, Mariana Mohamed Osman & Muhammad Faris Abdullah
Personal Empowerment as Determinants of Organisational Opportunity
© 2019 by MIP 314
experience), and social skills (skills facilitating
interaction and communication with others)
Peer-rejection (exclusion from social interaction),
isolation (separation from others), criticism
(expression of disapproval), strictness (rigidity and
stringency), competitions (act of rivalry and
supremacy), and emotional dissatisfaction (intense
feelings of discontent or feeling disgruntled).
Interaction skills, flexibility
(willingness to compromise)
cooperativeness (joint action)
and nurturance (love, care and
attention given to someone)
Vellymalay
(2013)
The findings from the case studies generate three significant components
of PR: (i) Tolerance and Compassion (PRa), (ii) Sense of Inclusion (PRb) and
(iii) Self-Regulation and Benevolent (PRc).
Table 2 Components and determinants of positive relationships
Definition of PR Components Items Code
Positive sense of intimacy, emotional responsiveness and continuous support expressed in personal relationships
Tolerance and Compassion
being flexible to differences in opinions
PRa confident (not shy) in expressing care and affection
aware and eager to know others’ updates
offering emotional support whenever it is needed
Sense of Inclusion
engaging productively in decision making process
PRb ensuring others are engaged in decision making process
forgiving of others’ weaknesses and mistakes
Self-Regulation and Benevolent
self-conscious of own mistakes and quickly apologies
PRc motivating and assisting others to fulfil their life goals
expressing appreciations to others regularly
Personal Empowerment (PE) manifests in the opportunity to exercise
control, voice and choice with regards to social surroundings. Qualities adhere to
PE include (i) self-motivation with regards to goal orientation, autonomy and
self-regulation (Fatimah et al., 2011; Chin et al., 2012; Kok, 2016), (ii) social
acceptance and coherence with others (Fatimah, Lukman, Khairudin, Wan
Shahrazad, & Halim, 2011; Nesbit, Jepsen, Demirian, & Ho, 2012; Kadir, Omar,
Desa, & Yusooff, 2013; Zamani, Khairudin, Sulaiman, Halim, & Nasir, 2013),
and (iii) composure, stability and resilience (Song, Cai, Brown, & Grimm, 2011;
Sulaiman et al., 2013; Sipon, Nasrah, Nazli, Abdullah, & Othman, 2014).
Table 3 Determinants of personal empowerment
Definition of PE Items Code
Self-esteem in taking control over life along with sense of composure to progress in the social environment
setting goals and striving to meet goals PE1
striving and working hard even for easy goals PE2
monitoring behaviours to suit with situations PE3
knowing when somebody is offended PE4
ensuring others are comfortable when making deals PE5
able to be friendly with distasteful persons when necessary PE6
able to work out solutions during stress and difficulties PE7
tackling problems efficiently in unexpected conditions PE8
feeling energetic for daily routines and activities PE9
having hardly distracted and focus mind PE10
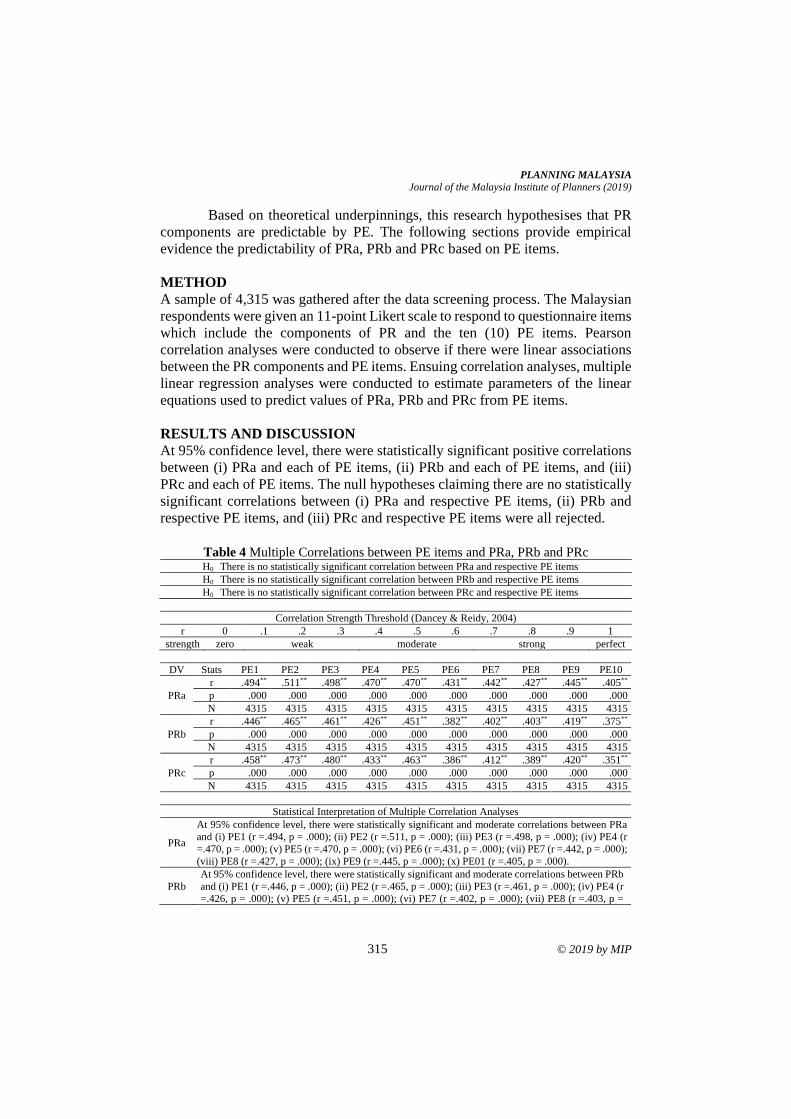
PLANNING MALAYSIA
Journal of the Malaysia Institute of Planners (2019)
315 © 2019 by MIP
Based on theoretical underpinnings, this research hypothesises that PR
components are predictable by PE. The following sections provide empirical
evidence the predictability of PRa, PRb and PRc based on PE items.
METHOD
A sample of 4,315 was gathered after the data screening process. The Malaysian
respondents were given an 11-point Likert scale to respond to questionnaire items
which include the components of PR and the ten (10) PE items. Pearson
correlation analyses were conducted to observe if there were linear associations
between the PR components and PE items. Ensuing correlation analyses, multiple
linear regression analyses were conducted to estimate parameters of the linear
equations used to predict values of PRa, PRb and PRc from PE items.
RESULTS AND DISCUSSION
At 95% confidence level, there were statistically significant positive correlations
between (i) PRa and each of PE items, (ii) PRb and each of PE items, and (iii)
PRc and each of PE items. The null hypotheses claiming there are no statistically
significant correlations between (i) PRa and respective PE items, (ii) PRb and
respective PE items, and (iii) PRc and respective PE items were all rejected.
Table 4 Multiple Correlations between PE items and PRa, PRb and PRc H0 There is no statistically significant correlation between PRa and respective PE items
H0 There is no statistically significant correlation between PRb and respective PE items
H0 There is no statistically significant correlation between PRc and respective PE items
Correlation Strength Threshold (Dancey & Reidy, 2004)
r 0 .1 .2 .3 .4 .5 .6 .7 .8 .9 1
strength zero weak moderate strong perfect
DV Stats PE1 PE2 PE3 PE4 PE5 PE6 PE7 PE8 PE9 PE10
PRa
r .494** .511** .498** .470** .470** .431** .442** .427** .445** .405**
p .000 .000 .000 .000 .000 .000 .000 .000 .000 .000
N 4315 4315 4315 4315 4315 4315 4315 4315 4315 4315
PRb
r .446** .465** .461** .426** .451** .382** .402** .403** .419** .375**
p .000 .000 .000 .000 .000 .000 .000 .000 .000 .000
N 4315 4315 4315 4315 4315 4315 4315 4315 4315 4315
PRc
r .458** .473** .480** .433** .463** .386** .412** .389** .420** .351**
p .000 .000 .000 .000 .000 .000 .000 .000 .000 .000
N 4315 4315 4315 4315 4315 4315 4315 4315 4315 4315
Statistical Interpretation of Multiple Correlation Analyses
PRa
At 95% confidence level, there were statistically significant and moderate correlations between PRa
and (i) PE1 (r =.494, p = .000); (ii) PE2 (r =.511, p = .000); (iii) PE3 (r =.498, p = .000); (iv) PE4 (r
=.470, p = .000); (v) PE5 (r =.470, p = .000); (vi) PE6 (r =.431, p = .000); (vii) PE7 (r =.442, p = .000);
(viii) PE8 (r =.427, p = .000); (ix) PE9 (r =.445, p = .000); (x) PE01 (r =.405, p = .000).
PRb
At 95% confidence level, there were statistically significant and moderate correlations between PRb
and (i) PE1 (r =.446, p = .000); (ii) PE2 (r =.465, p = .000); (iii) PE3 (r =.461, p = .000); (iv) PE4 (r
=.426, p = .000); (v) PE5 (r =.451, p = .000); (vi) PE7 (r =.402, p = .000); (vii) PE8 (r =.403, p =
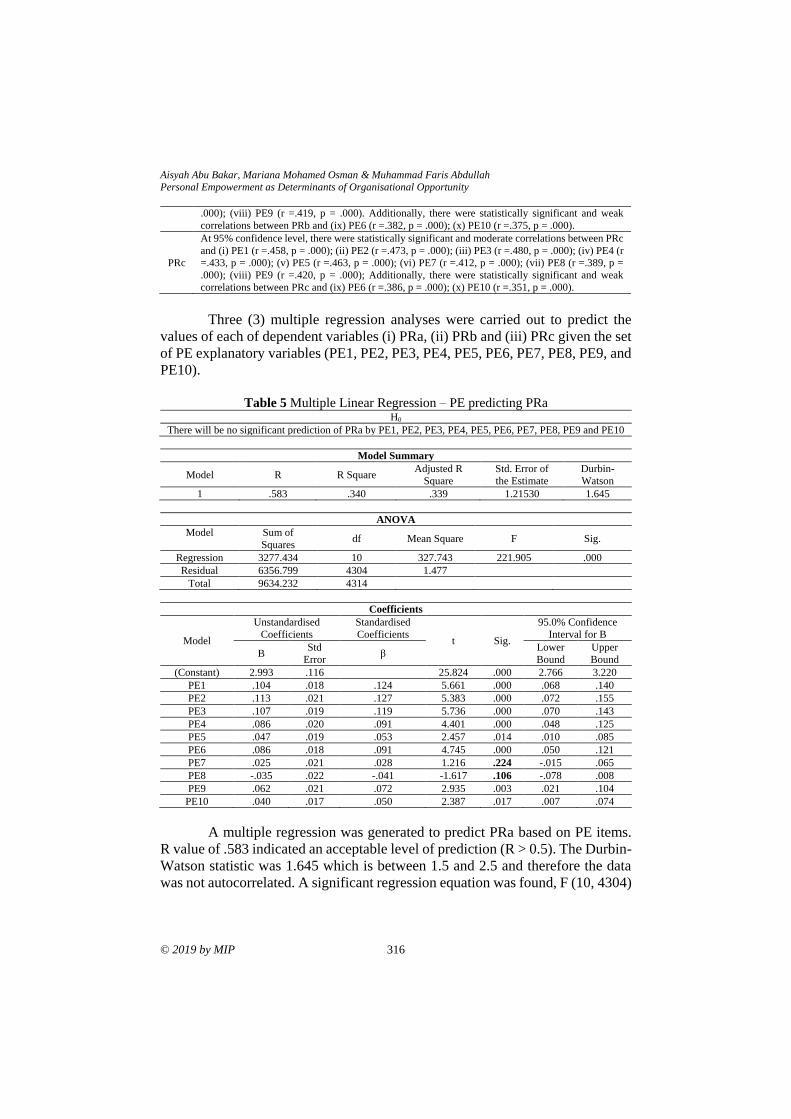
Aisyah Abu Bakar, Mariana Mohamed Osman & Muhammad Faris Abdullah
Personal Empowerment as Determinants of Organisational Opportunity
© 2019 by MIP 316
.000); (viii) PE9 (r =.419, p = .000). Additionally, there were statistically significant and weak
correlations between PRb and (ix) PE6 (r =.382, p = .000); (x) PE10 (r =.375, p = .000).
PRc
At 95% confidence level, there were statistically significant and moderate correlations between PRc
and (i) PE1 (r =.458, p = .000); (ii) PE2 (r =.473, p = .000); (iii) PE3 (r =.480, p = .000); (iv) PE4 (r
=.433, p = .000); (v) PE5 (r =.463, p = .000); (vi) PE7 (r =.412, p = .000); (vii) PE8 (r =.389, p =
.000); (viii) PE9 (r =.420, p = .000); Additionally, there were statistically significant and weak
correlations between PRc and (ix) PE6 (r =.386, p = .000); (x) PE10 (r =.351, p = .000).
Three (3) multiple regression analyses were carried out to predict the
values of each of dependent variables (i) PRa, (ii) PRb and (iii) PRc given the set
of PE explanatory variables (PE1, PE2, PE3, PE4, PE5, PE6, PE7, PE8, PE9, and
PE10).
Table 5 Multiple Linear Regression – PE predicting PRa
H0
There will be no significant prediction of PRa by PE1, PE2, PE3, PE4, PE5, PE6, PE7, PE8, PE9 and PE10
Model Summary
Model R R Square Adjusted R
Square
Std. Error of
the Estimate
Durbin-
Watson
1 .583 .340 .339 1.21530 1.645
ANOVA
Model Sum of
Squares df Mean Square F Sig.
Regression 3277.434 10 327.743 221.905 .000
Residual 6356.799 4304 1.477
Total 9634.232 4314
Coefficients
Model
Unstandardised
Coefficients
Standardised
Coefficients t Sig.
95.0% Confidence
Interval for B
B Std
Error β
Lower
Bound
Upper
Bound
(Constant) 2.993 .116 25.824 .000 2.766 3.220
PE1 .104 .018 .124 5.661 .000 .068 .140
PE2 .113 .021 .127 5.383 .000 .072 .155
PE3 .107 .019 .119 5.736 .000 .070 .143
PE4 .086 .020 .091 4.401 .000 .048 .125
PE5 .047 .019 .053 2.457 .014 .010 .085
PE6 .086 .018 .091 4.745 .000 .050 .121
PE7 .025 .021 .028 1.216 .224 -.015 .065
PE8 -.035 .022 -.041 -1.617 .106 -.078 .008
PE9 .062 .021 .072 2.935 .003 .021 .104
PE10 .040 .017 .050 2.387 .017 .007 .074
A multiple regression was generated to predict PRa based on PE items.
R value of .583 indicated an acceptable level of prediction (R > 0.5). The Durbin-
Watson statistic was 1.645 which is between 1.5 and 2.5 and therefore the data
was not autocorrelated. A significant regression equation was found, F (10, 4304)
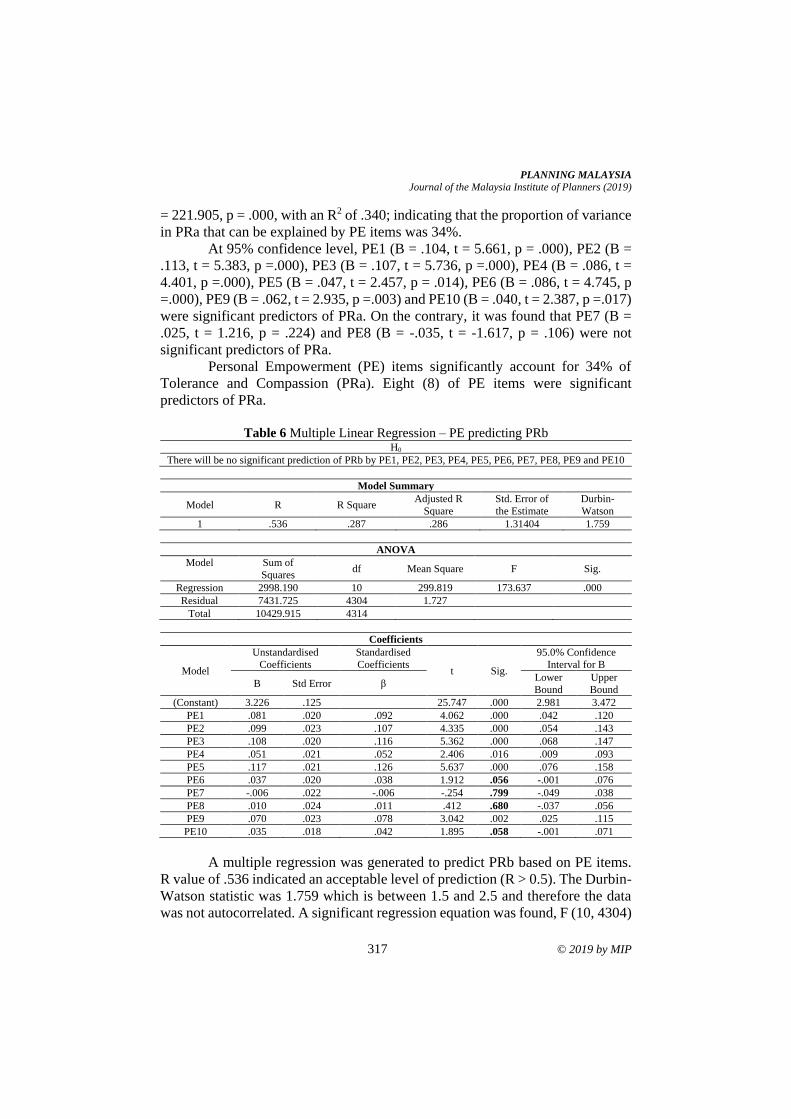
PLANNING MALAYSIA
Journal of the Malaysia Institute of Planners (2019)
317 © 2019 by MIP
= 221.905, p = .000, with an R2 of .340; indicating that the proportion of variance
in PRa that can be explained by PE items was 34%.
At 95% confidence level, PE1 (B = .104, t = 5.661, p = .000), PE2 (B =
.113, t = 5.383, p =.000), PE3 (B = .107, t = 5.736, p =.000), PE4 (B = .086, t =
4.401, p =.000), PE5 (B = .047, t = 2.457, p = .014), PE6 (B = .086, t = 4.745, p
=.000), PE9 (B = .062, t = 2.935, p =.003) and PE10 (B = .040, t = 2.387, p =.017)
were significant predictors of PRa. On the contrary, it was found that PE7 (B =
.025, t = 1.216, p = .224) and PE8 (B = -.035, t = -1.617, p = .106) were not
significant predictors of PRa.
Personal Empowerment (PE) items significantly account for 34% of
Tolerance and Compassion (PRa). Eight (8) of PE items were significant
predictors of PRa.
Table 6 Multiple Linear Regression – PE predicting PRb
H0
There will be no significant prediction of PRb by PE1, PE2, PE3, PE4, PE5, PE6, PE7, PE8, PE9 and PE10
Model Summary
Model R R Square Adjusted R
Square
Std. Error of
the Estimate
Durbin-
Watson
1 .536 .287 .286 1.31404 1.759
ANOVA
Model Sum of
Squares df Mean Square F Sig.
Regression 2998.190 10 299.819 173.637 .000
Residual 7431.725 4304 1.727
Total 10429.915 4314
Coefficients
Model
Unstandardised
Coefficients
Standardised
Coefficients t Sig.
95.0% Confidence
Interval for B
B Std Error β Lower
Bound
Upper
Bound
(Constant) 3.226 .125 25.747 .000 2.981 3.472
PE1 .081 .020 .092 4.062 .000 .042 .120
PE2 .099 .023 .107 4.335 .000 .054 .143
PE3 .108 .020 .116 5.362 .000 .068 .147
PE4 .051 .021 .052 2.406 .016 .009 .093
PE5 .117 .021 .126 5.637 .000 .076 .158
PE6 .037 .020 .038 1.912 .056 -.001 .076
PE7 -.006 .022 -.006 -.254 .799 -.049 .038
PE8 .010 .024 .011 .412 .680 -.037 .056
PE9 .070 .023 .078 3.042 .002 .025 .115
PE10 .035 .018 .042 1.895 .058 -.001 .071
A multiple regression was generated to predict PRb based on PE items.
R value of .536 indicated an acceptable level of prediction (R > 0.5). The Durbin-
Watson statistic was 1.759 which is between 1.5 and 2.5 and therefore the data
was not autocorrelated. A significant regression equation was found, F (10, 4304)
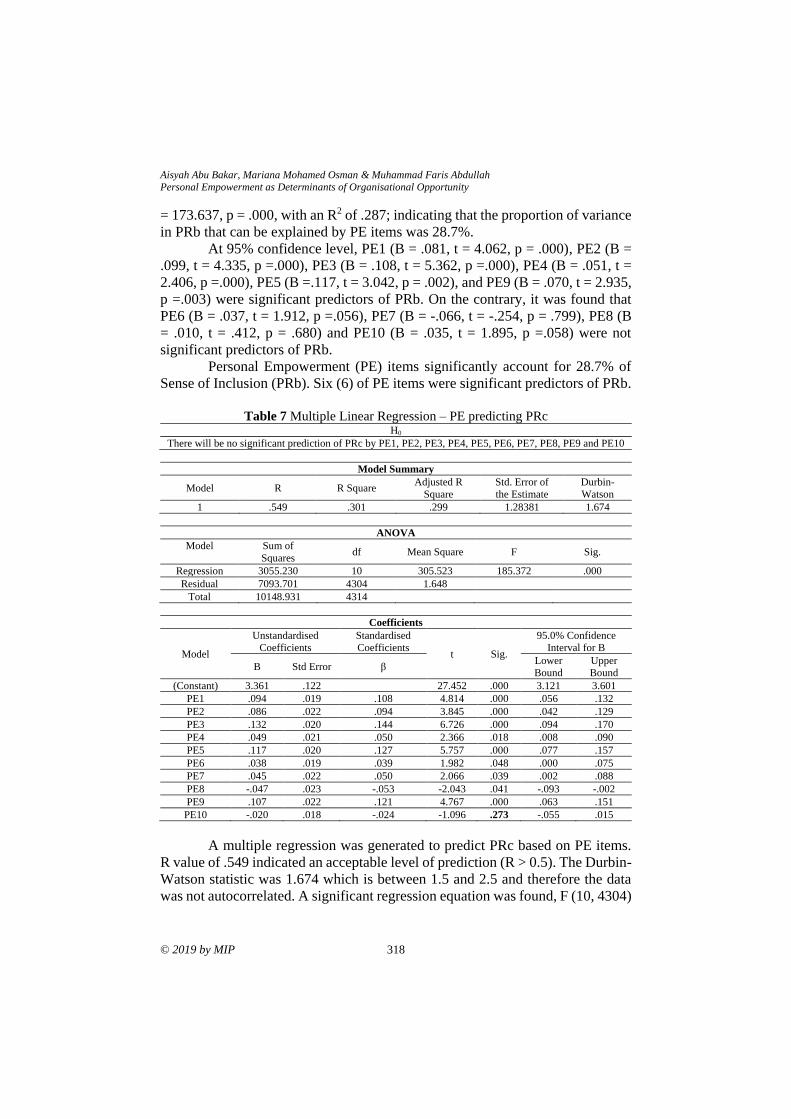
Aisyah Abu Bakar, Mariana Mohamed Osman & Muhammad Faris Abdullah
Personal Empowerment as Determinants of Organisational Opportunity
© 2019 by MIP 318
= 173.637, p = .000, with an R2 of .287; indicating that the proportion of variance
in PRb that can be explained by PE items was 28.7%.
At 95% confidence level, PE1 (B = .081, t = 4.062, p = .000), PE2 (B =
.099, t = 4.335, p =.000), PE3 (B = .108, t = 5.362, p =.000), PE4 (B = .051, t =
2.406, p =.000), PE5 (B =.117, t = 3.042, p = .002), and PE9 (B = .070, t = 2.935,
p =.003) were significant predictors of PRb. On the contrary, it was found that
PE6 (B = .037, t = 1.912, p =.056), PE7 (B = -.066, t = -.254, p = .799), PE8 (B
= .010, t = .412, p = .680) and PE10 (B = .035, t = 1.895, p =.058) were not
significant predictors of PRb.
Personal Empowerment (PE) items significantly account for 28.7% of
Sense of Inclusion (PRb). Six (6) of PE items were significant predictors of PRb.
Table 7 Multiple Linear Regression – PE predicting PRc
H0
There will be no significant prediction of PRc by PE1, PE2, PE3, PE4, PE5, PE6, PE7, PE8, PE9 and PE10
Model Summary
Model R R Square Adjusted R
Square
Std. Error of
the Estimate
Durbin-
Watson
1 .549 .301 .299 1.28381 1.674
ANOVA
Model Sum of
Squares df Mean Square F Sig.
Regression 3055.230 10 305.523 185.372 .000
Residual 7093.701 4304 1.648
Total 10148.931 4314
Coefficients
Model
Unstandardised
Coefficients
Standardised
Coefficients t Sig.
95.0% Confidence
Interval for B
B Std Error β Lower
Bound
Upper
Bound
(Constant) 3.361 .122 27.452 .000 3.121 3.601
PE1 .094 .019 .108 4.814 .000 .056 .132
PE2 .086 .022 .094 3.845 .000 .042 .129
PE3 .132 .020 .144 6.726 .000 .094 .170
PE4 .049 .021 .050 2.366 .018 .008 .090
PE5 .117 .020 .127 5.757 .000 .077 .157
PE6 .038 .019 .039 1.982 .048 .000 .075
PE7 .045 .022 .050 2.066 .039 .002 .088
PE8 -.047 .023 -.053 -2.043 .041 -.093 -.002
PE9 .107 .022 .121 4.767 .000 .063 .151
PE10 -.020 .018 -.024 -1.096 .273 -.055 .015
A multiple regression was generated to predict PRc based on PE items.
R value of .549 indicated an acceptable level of prediction (R > 0.5). The Durbin-
Watson statistic was 1.674 which is between 1.5 and 2.5 and therefore the data
was not autocorrelated. A significant regression equation was found, F (10, 4304)
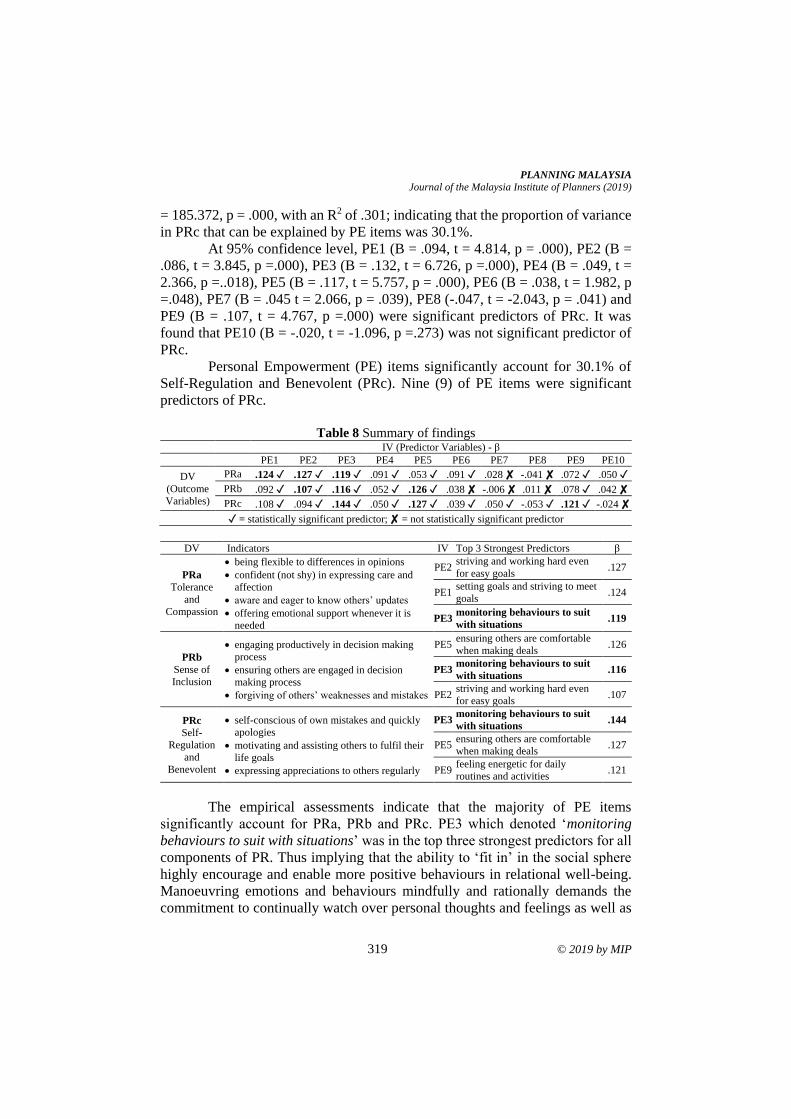
PLANNING MALAYSIA
Journal of the Malaysia Institute of Planners (2019)
319 © 2019 by MIP
= 185.372, p = .000, with an R2 of .301; indicating that the proportion of variance
in PRc that can be explained by PE items was 30.1%.
At 95% confidence level, PE1 (B = .094, t = 4.814, p = .000), PE2 (B =
.086, t = 3.845, p =.000), PE3 (B = .132, t = 6.726, p =.000), PE4 (B = .049, t =
2.366, p =..018), PE5 (B = .117, t = 5.757, p = .000), PE6 (B = .038, t = 1.982, p
=.048), PE7 (B = .045 t = 2.066, p = .039), PE8 (-.047, t = -2.043, p = .041) and
PE9 (B = .107, t = 4.767, p =.000) were significant predictors of PRc. It was
found that PE10 (B = -.020, t = -1.096, p =.273) was not significant predictor of
PRc.
Personal Empowerment (PE) items significantly account for 30.1% of
Self-Regulation and Benevolent (PRc). Nine (9) of PE items were significant
predictors of PRc.
Table 8 Summary of findings
IV (Predictor Variables) - β
PE1 PE2 PE3 PE4 PE5 PE6 PE7 PE8 PE9 PE10
DV
(Outcome
Variables)
PRa .124 ✓ .127 ✓ .119 ✓ .091 ✓ .053 ✓ .091 ✓ .028 ✘ -.041 ✘ .072 ✓ .050 ✓
PRb .092 ✓ .107 ✓ .116 ✓ .052 ✓ .126 ✓ .038 ✘ -.006 ✘ .011 ✘ .078 ✓ .042 ✘
PRc .108 ✓ .094 ✓ .144 ✓ .050 ✓ .127 ✓ .039 ✓ .050 ✓ -.053 ✓ .121 ✓ -.024 ✘
✓ = statistically significant predictor; ✘ = not statistically significant predictor
DV Indicators IV Top 3 Strongest Predictors β
PRa
Tolerance
and
Compassion
• being flexible to differences in opinions
• confident (not shy) in expressing care and
affection
• aware and eager to know others’ updates
• offering emotional support whenever it is
needed
PE2 striving and working hard even
for easy goals .127
PE1 setting goals and striving to meet
goals .124
PE3 monitoring behaviours to suit
with situations .119
PRb
Sense of
Inclusion
• engaging productively in decision making
process
• ensuring others are engaged in decision
making process
• forgiving of others’ weaknesses and mistakes
PE5 ensuring others are comfortable
when making deals .126
PE3 monitoring behaviours to suit
with situations .116
PE2 striving and working hard even
for easy goals .107
PRc
Self-
Regulation
and
Benevolent
• self-conscious of own mistakes and quickly
apologies
• motivating and assisting others to fulfil their
life goals
• expressing appreciations to others regularly
PE3 monitoring behaviours to suit
with situations .144
PE5 ensuring others are comfortable
when making deals .127
PE9 feeling energetic for daily
routines and activities .121
The empirical assessments indicate that the majority of PE items
significantly account for PRa, PRb and PRc. PE3 which denoted ‘monitoring
behaviours to suit with situations’ was in the top three strongest predictors for all
components of PR. Thus implying that the ability to ‘fit in’ in the social sphere
highly encourage and enable more positive behaviours in relational well-being.
Manoeuvring emotions and behaviours mindfully and rationally demands the
commitment to continually watch over personal thoughts and feelings as well as
Aisyah Abu Bakar, Mariana Mohamed Osman & Muhammad Faris Abdullah
Personal Empowerment as Determinants of Organisational Opportunity
© 2019 by MIP 320
reactions of others. Architectural design can enhance attentive communications
and receptive interactions through space sizes and layouts, furniture
organisations, colour choices and many other design strategies. Designers
indirectly enrich positive relationships through empowering space occupants,
therefore leading to positive relationships and sustained well-being.
CONCLUSION
HIH in SSWB deems well-being that is achievable through a supportive and
congruent interaction system. This paper proves that positive relationships are
achievable through personal empowerment. The future direction of this research
involves statistical modelling on the constructs described in this paper.
REFERENCES Abu Rahim, M. A. R., Ishak, I., Mohd Shafie, S. A., & Shafiai, R. M. (2013). Factors
influencing family life satisfaction among parents in Malaysia : The Structural Equation Modeling Approach (SEM). Journal of Humanities and Social Sciences, 17(4), 78-85.
Chiah, W. Y., & Baharudin, R. (2013). Parenting behaviour of mothers, adolescents’ social emotional adjustments and their correlates in intact and non-intact Malay families in Kuala Lumpur. Pertanika Journal of Social Science and Humanities, 21(4), 1431-1446.
Dancey, C., & Reidy, J. (2004) Statistics without maths for psychology: Ssing SPSS for Windows. London: Prentice Hall.
Fatimah, O., Lukman, Z. M., Khairudin, R., Wan Shahrazad, W. S., & Halim, F. W. (2011). Procrastination’s relation with fear of failure, competence expectancy and intrinsic motivation. Pertanika Journal of Social Science and Humanities, 19(Special), 123-127.
Ha, T. S., & Tam, C. L. (2013). Relationships of birth order, parent-child relationship, personality, and academic performance. Pertanika Journal of Social Science and Humanities, 21(1), 44-52.
Hoesni, S. M., Subhi, N., Alavi, K., & Wan Azreena, W. J. (2013). Exploring love and marital satisfaction among married Malay males. Pertanika Journal of Social Science and Humanities, 21(December), 59-68.
Kadir, N. B. A., Omar, F., Desa, A., & Yusooff, F. (2013). Secure style, PWB-related gratitude and SWB-related engagement as predictors of affect balance among social science students in Malaysia: A pilot study. Pertanika Journal of Social Science and Humanities, 21, 85-98.
Mohamad, M. S., Hoesni, S. M., Subhi, N., Chong, S. T., Sarnon, N., & Nen, S. (2013). Family experiences of caring among caregivers of schizophrenia patients. Pertanika Journal of Social Science and Humanities, 21(4), 1633-1644.
Nesbit, P. L., Jepsen, D., Demirian, S., & Ho, J. (2012). Extending self-leadership research to the East: Measurement equivalence of the Chinese and English versions of the MSLQ. Asian Journal of Social Psychology, 15(2), 101-111.
Noraini, M. N., Gandhi, A. D., Ishak, I., & Wok, S. (2014). Development of indicators for family well- being in Malaysia. Social Indicators Research, 115(1), 279-318.
Shuib, R., Endut, N., Ali, S. H., Osman, I., Abdullah, S., Oon, S. W., …& Shahrudin, S. S. H. (2013). Domestic violence and women’s well-being in Malaysia: issues and
PLANNING MALAYSIA
Journal of the Malaysia Institute of Planners (2019)
321 © 2019 by MIP
challenges conducting a national study using the WHO multi-country questionnaire on women’s health and domestic violence against women. Procedia - Social and Behavioral Sciences, 91, 475–488.
Sipon, S., Nasrah, S. K., Nazli, N. N. N. N., Abdullah, S., & Othman, K. (2014). Stress and religious coping among flood victims. Procedia - Social and Behavioral Sciences, 140, 605-608.
Song, H., Cai, H., Brown, J. D., & Grimm, K. J. (2011). Differential item functioning of the Rosenberg Self-Esteem Scale in the US and China: Measurement bias matters. Asian Journal of Social Psychology, 14(3), 176–188.
Sulaiman, W. S. W., Kadir, N. B. A., Halim, F. W., Omar, F., Latiff, R. A., & Sulaiman, W. S. W. (2013). Structural relations between personality traits, coping strategy, social support and well-being among adolescents. Pertanika Journal of Social Science and Humanities, 21(December), 121-134.
Turiman, S., Leong, A., & Hassan, F. (2013). Are men more apologetic than women? Pertanika Journal of Social Science and Humanities, 21(3), 953-964.
Vellymalay, S. K. N. (2013). A case study on friendship, loneliness and social dissatisfaction among preschool children. Pertanika Journal of Social Science and Humanities, 21(4), 1379-1393.
Zamani, Z. A., Khairudin, R., Sulaiman, W. S. W., Halim, F. W., & Nasir, R. (2013).
Relationship between achievement motivation and personality among pre and post-
independence Malaysian Malays. Pertanika Journal of Social Science and Humanities,
21(December), 135-142
Received: 12th January 2019. Accepted: 2nd August 2019
1Assistant Professor at International Islamic University Malaysia. Email: [email protected] 322
PLANNING MALAYSIA:
Journal of the Malaysian Institute of Planners
VOLUME 17 ISSUE 2 (2019), Page 302 – 311
USERS’ PERCEPTION ON CHILDREN AT MASJID – PLANNING FOR
CHILDREN FRIENDLY MASJID
Aniza Abu Bakar1, Zur Atiqa Zulkifely2, Noor Hanita Abd. Majid3,
& Mohd. Burhan Ibrahim4
1,2,3Kulliyyah of Architecture and Environmental Design
4Kulliyyah of Education
INTERNATIONAL ISLAMIC UNIVERSITY MALAYSIA
Abstract
Masjid is an important institution to know Allah SWT, empower, and unite
society. Early exposure of children to masjid is crucial as nurturing them to love
masjid is a process towards loving the creator, strengthening their faith, and
improving akhlaq (behaviour) towards becoming a good Muslim and eventually
forming a stable society and nation. However, there have been some negative
perceptions on the presence of young children in masjid among the jamaah
(congregational members). This discourages families in engaging their young
children with masjid as early as possible. Eventually, it would hinder them from
learning high values of Islam that would strengthen their faith, shape good
character, and akhlaq. This study aims to identify the perception of the parents or
guardian that bring children to masjid as well as other jamaah on the presence of
children at masjid through a structured questionnaire survey with random
sampling approach. Eight masjids within the urban area of Kuala Lumpur and
Selangor were involved with the target of fifty respondents each. 55.2% of the
400 respondents were parents/guardians that bring children to the masjid. The
findings suggest that respondents welcome the presence of children at masjid as
it is deemed suitable as a place for children's education and that masjid should
provide educational programmes for them. Crying and playing children seem to
distract the jamaah. Hence they feel designated spaces for children is deemed
necessary.
Keywords: children-friendly masjid, jamaah, perception, space for children at
the masjid, children’s activity
PLANNING MALAYSIA
Journal of the Malaysia Institute of Planners (2019)
323 © 2019 by MIP
INTRODUCTION
The term 'masjid' originates from the word 'masajid' which is the plural of 'sajada'
– which brings the meaning of prostration with full respect and obedience (Abd
Wahab, Ab Hamid and Che Man, 2016). In the Al-Qur'an, the word 'masjid' is
mentioned twenty-seven times. Masjid is also referred to as the House of God –
the place where only Allah SWT is worshipped. A hadith narrated by Abu
Hurairah: Allah's Apostle said, "The reward of the prayer offered by a person in
congregation is twenty-five times greater than that of the prayer offered in one's
house or the market (alone). And this is because if he performs ablution and does
it perfectly and then proceeds to the mosque with the sole intention of praying,
then for every step he takes towards the mosque, he is upgraded one degree in
reward and his one sin is taken off (crossed out) from his accounts (of deeds).
When he offers his prayer, the angels keep on asking Allah's Blessings and Allah's
forgiveness for him as long as he is (staying) at his Musalla. They say, 'O Allah!
Bestow Your blessings upon him, be Merciful and kind to him.' And one is
regarded in prayer as long as one is waiting for the prayer." (Sahih Bukhari, n.d).
Masjid is the best place to perform the congregational prayer, and its role goes
beyond this as it functions as the centre of administration, marketplace and others
particularly during the era of the Prophet Muhammad SAW and his companions.
Hence, establishing masjid was among the essential tasks of the Prophet SAW,
and the practice continues until today.
In Malaysia, the establishment of the masjid is in line with the Federal
Constitution provision as Islam is the official religion of the country. The diverse
roles of masjid reflect its inclusiveness of all walks of life. Everyone is welcome
to the masjid, particularly in the remembrance of Allah SWT and to strengthen
their faith. Hence, masjid has an exceptional place in the heart of the Muslims.
On the inclusiveness, children are no exception. The following hadith is
referred to. "The Messenger of Allah (SAW) came out to us for one of the evening
prayers (Maghrib or 'Isha'), carrying Hasan or Husayn. The Messenger of Allah
(SAW) came forward, put the child down and said takbeer ("Allaahu Akbar") to
start the prayer. Then he prostrated during the prayer, and his prostration lasted
for a long time. My father said: I raised my head and saw the child on the back
of the Messenger of Allah (SAW), so I went back to my prostration. When the
Messenger of Allah (SAW) finished praying, the people said to him: 'O Messenger
of Allah, during your prayer you prostrated and it took a long time, until we
thought that something had happened, or that you were receiving revelation.’ He
said, 'Nothing happened, but my son was riding on my back, and I did not want
to hurry him up until he had had enough” (Sahih Bukhari and Muslim, n.d). This
hadith reflects the tolerance level that adults should have when it comes to dealing
with young children as the incident took place while the Prophet Muhammad
SAW was performing prayer.
Aniza Abu Bakar, Zur Atiqa Zulkifely, Noor Hanita Abd. Majid, & Mohd. Burhan Ibrahim
Users’ Perception on Children at Masjid – Planning for Children Friendly Masjid
© 2019 by MIP 324
The presence of children in the masjid in Malaysia has been discussed by
the members of the society and expert at official and unofficial platforms. Mainly
the issue is on the unsuitability of their presence at masjid as the children's
activities are said to disturb others (Jupiter, 2019). Harsh action such as
preventing young children from entering the main prayer hall of the masjid is also
reported, while some signs show children are prevented from coming to masjid.
Thus, the Mufti of the Federal Territory, Datuk Dr Zulkifli bin Mohamad Al Bakri
gives a lengthy explanation on this through his article entitled "Masjid dan
Kanak-Kanak" in Bayyan Linnas number 63 (Mohamad Al Bakri, 2016).
This study aims to identify the perception of the parents or guardian that
bring children to masjid as well as other jamaah (congregational members that
do not bring children to the masjid) on the presence of children at masjid through
a structured questionnaire survey. It is deemed crucial to establish this issue from
the perspective of those that go to the masjid with and without children, towards
identifying the solutions.
LITERATURE REVIEW
Masjid has been an important institution since the era of Prophet Muhammad
SAW. Islam is manifested to be a complete code of practice, and a masjid plays
a vital role to signify it (Imam, 2000). As a centre of spiritual contents and a
platform of communication, it develops the unity and brotherhood among the
Muslim communities. The primary activity of masjid is to facilitate
congregational solat (prayer). Many other events in favours of the daily life of an
individual Muslim or a Muslim community are accomplished through a masjid.
Thus, masjid has become an indispensable part of the Muslim.
The History of Masjid
The hijrah (migration) of Prophet Muhammad SAW with his companions and
follower from Makkah to Madinah marked the beginning of the Muslim calendar.
On their arrival at Quba - the outskirt of Madinah, they spent a few days there,
and the Prophet built the first masjid SAW known as Masjid Quba. When Prophet
Muhammad SAW arrived in Madinah, the first task that he embarked on was
building a masjid known as Al-Masjid An-Nabawiy or the Prophet's mosque
(Omer, 2010). The practice of Prophet Muhammad SAW since the hijrah
movement continues, and masjid becomes the core element and symbolic feature
in Muslim society.
Masjid as Place to Worship Allah
According to Hizan, Ismail and Ispawi (2017), and supported by Laugu (2007),
the word ‘masjid’ in Arabic means a place of worship or a place of doing ritual
activities to God. Since the early years of Islam, masjid has been used as a place
to worship and perform religious-ritual activities. The meaning is shown by the
PLANNING MALAYSIA
Journal of the Malaysia Institute of Planners (2019)
325 © 2019 by MIP
Qur'an in Surah At-Tawbah: 19 – “Have you made the providing of water for the
pilgrim and the maintenance of al-Masjid al-Haram equal to [the deeds of] one
who believes in Allah and the Last Day and strives in the cause of Allah?”
Masjid as a Learning Centre
The Prophet SAW used masjid as the centre to spread Islamic knowledge, and he
was the first teacher. The basics of the aqeedah (belief system), the acts of
worship, and the shari'a rules (political, economic, social, and judicial) and others
are being taught in the masjid. The Prophet SAW also asked Abdullah ibn Sa'īd
to teach the Muslims the skills of reading and writing, and within a brief period,
some Muslims became literate and so could read and write the Qur'an. The
Prophet SAW also took another step to make the Muslims literate by making the
literate captives of war gain their freedom by instructing reading and writing to
ten Muslim children. Due to the efforts made by the school of Islam to increase
people' awareness, masjids which had already been the primary place for
worshipping were used as the first base for learning knowledge, and the Qur'an
was considered as the first book and text for teaching the Muslims (Oloyede,
2014).
Educating Children as Young Khalifah
According to the Oxford dictionary Khalifah means 'Deputy or steward;
sometimes translated as vicegerent'. According to the teachings of Islam, each
individual is a khalifah on earth. Muslims, in particular, must strive to adhere to
and advance God's will by establishing a society that reflects human dignity and
justice. Rahmat and Fahrudin (2018) explained that Prophet Adam AS and his
grandchildren act as earth's controllers, and it was also mentioned that among
them, there are Prophets, Apostles, Guardians, Siddiqin (people who witness the
truth), pious people, and worshipers; these people act as God's representative on
earth. “I will create a vicegerent on earth.” (Al-Baqarah, 2: 30). From this
Quranic verse, it can be seen everyone is created to worship Allah SWT and carry
out his task as a khalifah on earth.
Hence, every child is a young khalifah who will eventually grow into an
accomplished khalifah when he is an adult. All parents have the responsibility to
ensure the upbringing of their children shall lead towards achieving this purpose
by cultivating them with the right aqeedah that is, building and strengthening
their faith and belief to the oneness of Allah. Thus, parents have to prepare their
children with the proper knowledge that will allow them to know and obey the
commands of Allah SWT. After the basics of aqeedah, they need to be taught and
trained to practice good deeds. One of these obligatory deeds is the establishing
of prayer - the act that connects the young khalifah to his God and is also a form
of protection against disobedience (Hassan, 2007). One of the perfect ways to
foster these values is by exposing the children to masjid.
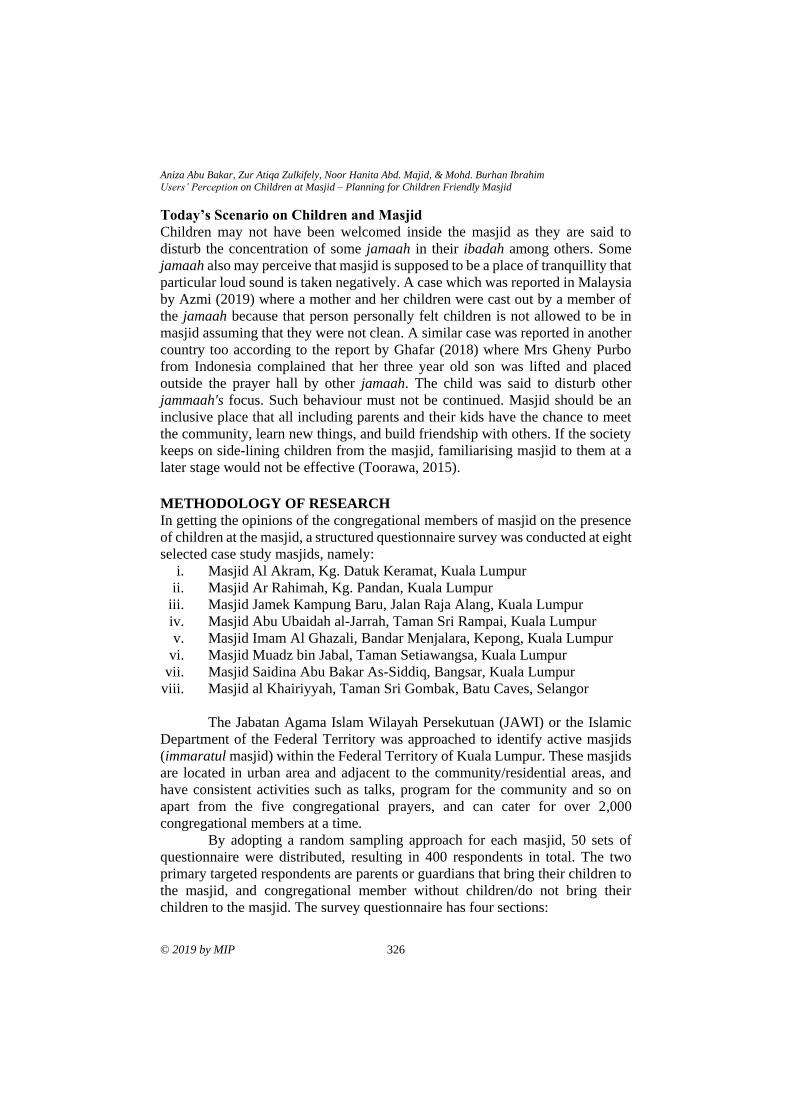
Aniza Abu Bakar, Zur Atiqa Zulkifely, Noor Hanita Abd. Majid, & Mohd. Burhan Ibrahim
Users’ Perception on Children at Masjid – Planning for Children Friendly Masjid
© 2019 by MIP 326
Today’s Scenario on Children and Masjid
Children may not have been welcomed inside the masjid as they are said to
disturb the concentration of some jamaah in their ibadah among others. Some
jamaah also may perceive that masjid is supposed to be a place of tranquillity that
particular loud sound is taken negatively. A case which was reported in Malaysia
by Azmi (2019) where a mother and her children were cast out by a member of
the jamaah because that person personally felt children is not allowed to be in
masjid assuming that they were not clean. A similar case was reported in another
country too according to the report by Ghafar (2018) where Mrs Gheny Purbo
from Indonesia complained that her three year old son was lifted and placed
outside the prayer hall by other jamaah. The child was said to disturb other
jammaah's focus. Such behaviour must not be continued. Masjid should be an
inclusive place that all including parents and their kids have the chance to meet
the community, learn new things, and build friendship with others. If the society
keeps on side-lining children from the masjid, familiarising masjid to them at a
later stage would not be effective (Toorawa, 2015).
METHODOLOGY OF RESEARCH
In getting the opinions of the congregational members of masjid on the presence
of children at the masjid, a structured questionnaire survey was conducted at eight
selected case study masjids, namely:
i. Masjid Al Akram, Kg. Datuk Keramat, Kuala Lumpur
ii. Masjid Ar Rahimah, Kg. Pandan, Kuala Lumpur
iii. Masjid Jamek Kampung Baru, Jalan Raja Alang, Kuala Lumpur
iv. Masjid Abu Ubaidah al-Jarrah, Taman Sri Rampai, Kuala Lumpur
v. Masjid Imam Al Ghazali, Bandar Menjalara, Kepong, Kuala Lumpur
vi. Masjid Muadz bin Jabal, Taman Setiawangsa, Kuala Lumpur
vii. Masjid Saidina Abu Bakar As-Siddiq, Bangsar, Kuala Lumpur
viii. Masjid al Khairiyyah, Taman Sri Gombak, Batu Caves, Selangor
The Jabatan Agama Islam Wilayah Persekutuan (JAWI) or the Islamic
Department of the Federal Territory was approached to identify active masjids
(immaratul masjid) within the Federal Territory of Kuala Lumpur. These masjids
are located in urban area and adjacent to the community/residential areas, and
have consistent activities such as talks, program for the community and so on
apart from the five congregational prayers, and can cater for over 2,000
congregational members at a time.
By adopting a random sampling approach for each masjid, 50 sets of
questionnaire were distributed, resulting in 400 respondents in total. The two
primary targeted respondents are parents or guardians that bring their children to
the masjid, and congregational member without children/do not bring their
children to the masjid. The survey questionnaire has four sections:
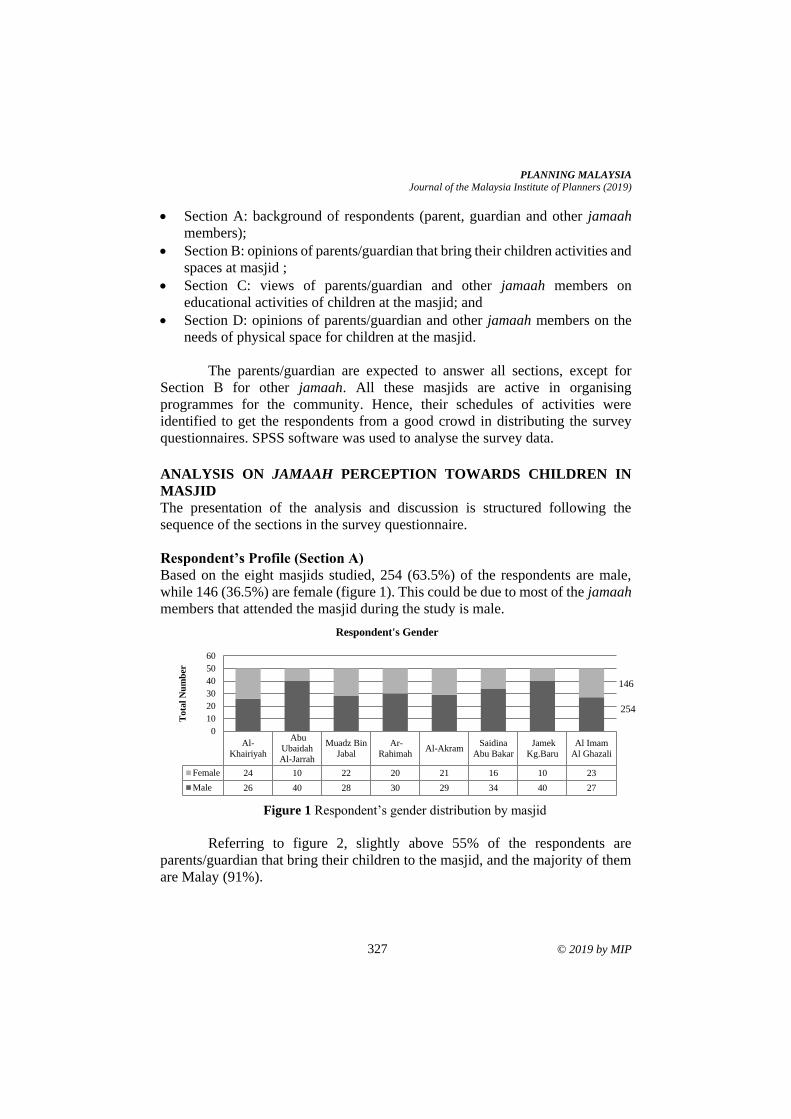
PLANNING MALAYSIA
Journal of the Malaysia Institute of Planners (2019)
327 © 2019 by MIP
• Section A: background of respondents (parent, guardian and other jamaah
members);
• Section B: opinions of parents/guardian that bring their children activities and
spaces at masjid ;
• Section C: views of parents/guardian and other jamaah members on
educational activities of children at the masjid; and
• Section D: opinions of parents/guardian and other jamaah members on the
needs of physical space for children at the masjid.
The parents/guardian are expected to answer all sections, except for
Section B for other jamaah. All these masjids are active in organising
programmes for the community. Hence, their schedules of activities were
identified to get the respondents from a good crowd in distributing the survey
questionnaires. SPSS software was used to analyse the survey data.
ANALYSIS ON JAMAAH PERCEPTION TOWARDS CHILDREN IN
MASJID
The presentation of the analysis and discussion is structured following the
sequence of the sections in the survey questionnaire.
Respondent’s Profile (Section A)
Based on the eight masjids studied, 254 (63.5%) of the respondents are male,
while 146 (36.5%) are female (figure 1). This could be due to most of the jamaah
members that attended the masjid during the study is male.
Figure 1 Respondent’s gender distribution by masjid
Referring to figure 2, slightly above 55% of the respondents are
parents/guardian that bring their children to the masjid, and the majority of them
are Malay (91%).
Al-
Khairiyah
Abu
Ubaidah
Al-Jarrah
Muadz Bin
Jabal
Ar-
RahimahAl-Akram
Saidina
Abu Bakar
Jamek
Kg.Baru
Al Imam
Al Ghazali
Female 24 10 22 20 21 16 10 23
Male 26 40 28 30 29 34 40 27
0
10
20
30
40
50
60
To
tal
Nu
mb
er
Respondent's Gender
146
254
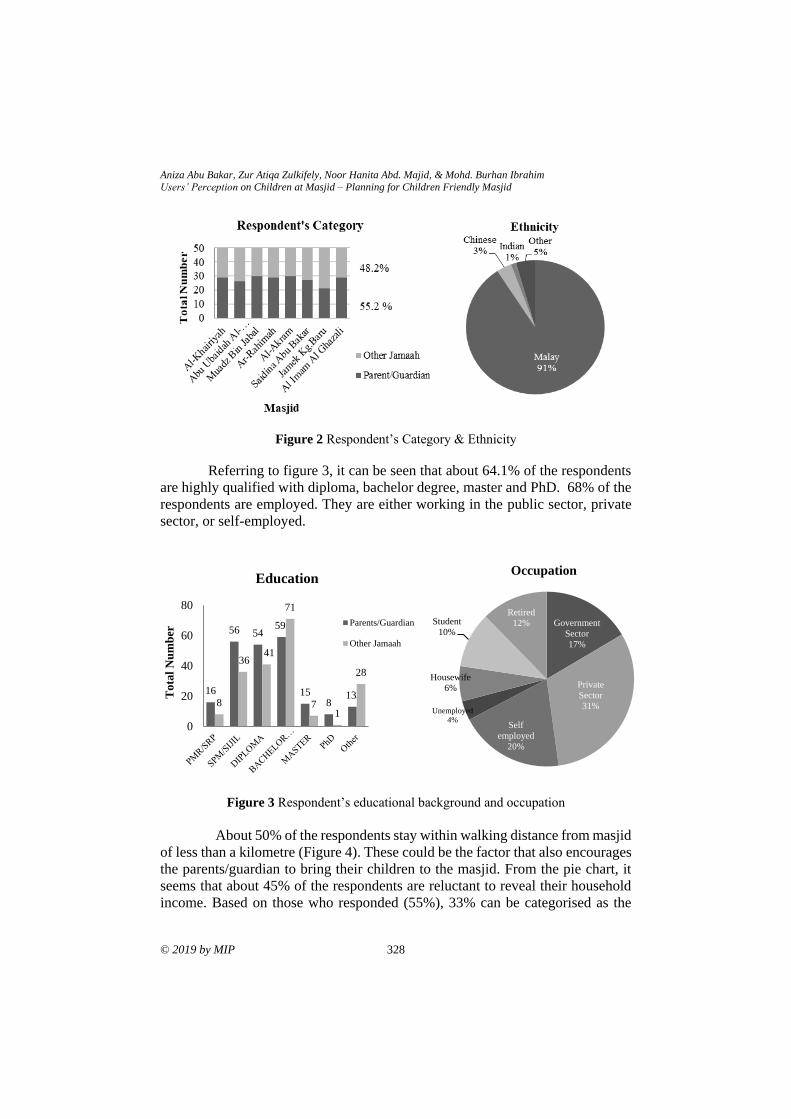
Aniza Abu Bakar, Zur Atiqa Zulkifely, Noor Hanita Abd. Majid, & Mohd. Burhan Ibrahim
Users’ Perception on Children at Masjid – Planning for Children Friendly Masjid
© 2019 by MIP 328
Figure 2 Respondent’s Category & Ethnicity
Referring to figure 3, it can be seen that about 64.1% of the respondents
are highly qualified with diploma, bachelor degree, master and PhD. 68% of the
respondents are employed. They are either working in the public sector, private
sector, or self-employed.
Figure 3 Respondent’s educational background and occupation
About 50% of the respondents stay within walking distance from masjid
of less than a kilometre (Figure 4). These could be the factor that also encourages
the parents/guardian to bring their children to the masjid. From the pie chart, it
seems that about 45% of the respondents are reluctant to reveal their household
income. Based on those who responded (55%), 33% can be categorised as the
16
56 5459
158
138
3641
71
71
28
0
20
40
60
80
Tota
l N
um
ber
Education
Parents/Guardian
Other Jamaah
Government
Sector
17%
Private
Sector
31%
Self
employed
20%
Unemployed
4%
Housewife
6%
Student
10%
Retired
12%
Occupation
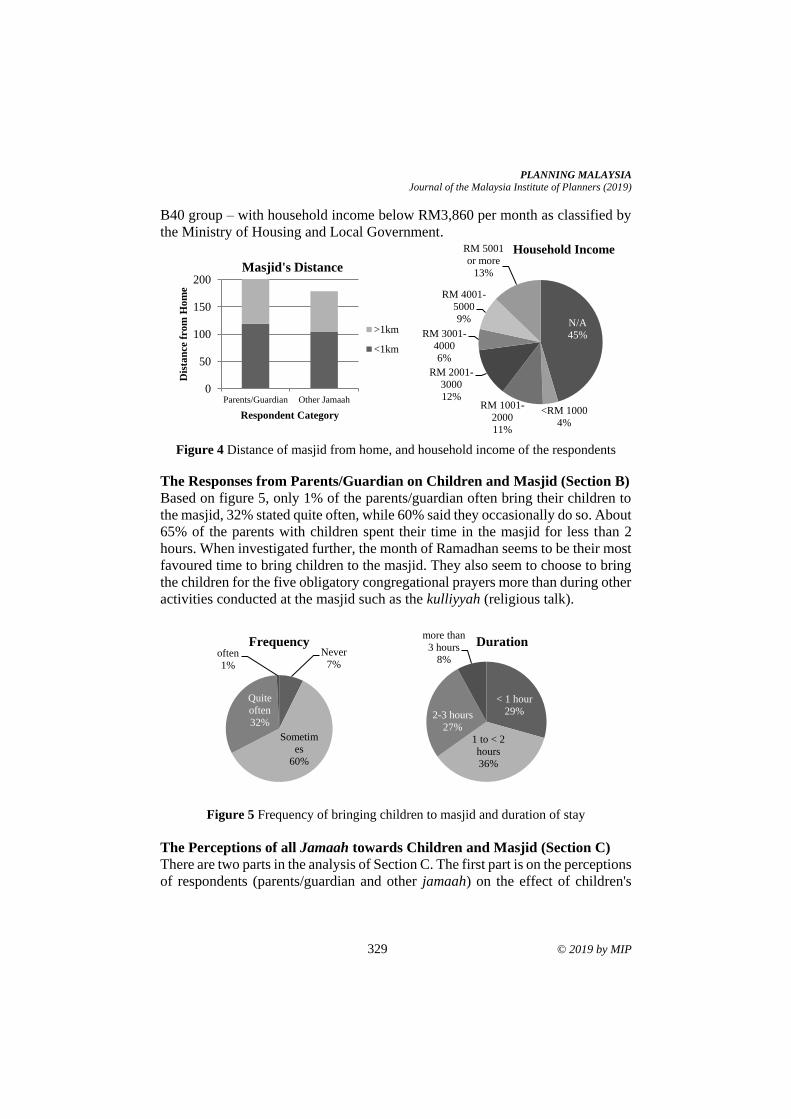
PLANNING MALAYSIA
Journal of the Malaysia Institute of Planners (2019)
329 © 2019 by MIP
B40 group – with household income below RM3,860 per month as classified by
the Ministry of Housing and Local Government.
Figure 4 Distance of masjid from home, and household income of the respondents
The Responses from Parents/Guardian on Children and Masjid (Section B)
Based on figure 5, only 1% of the parents/guardian often bring their children to
the masjid, 32% stated quite often, while 60% said they occasionally do so. About
65% of the parents with children spent their time in the masjid for less than 2
hours. When investigated further, the month of Ramadhan seems to be their most
favoured time to bring children to the masjid. They also seem to choose to bring
the children for the five obligatory congregational prayers more than during other
activities conducted at the masjid such as the kulliyyah (religious talk).
Figure 5 Frequency of bringing children to masjid and duration of stay
The Perceptions of all Jamaah towards Children and Masjid (Section C)
There are two parts in the analysis of Section C. The first part is on the perceptions
of respondents (parents/guardian and other jamaah) on the effect of children's
0
50
100
150
200
Parents/Guardian Other Jamaah
Dis
tan
ce f
rom
Ho
me
Respondent Category
Masjid's Distance
>1km
<1km
N/A
45%
<RM 1000
4%
RM 1001-
2000
11%
RM 2001-
3000
12%
RM 3001-
4000
6%
RM 4001-
5000
9%
RM 5001
or more
13%
Household Income
< 1 hour
29%
1 to < 2
hours
36%
2-3 hours
27%
more than
3 hours
8%
DurationNever
7%
Sometim
es
60%
Quite
often
32%
often
1%
Frequency
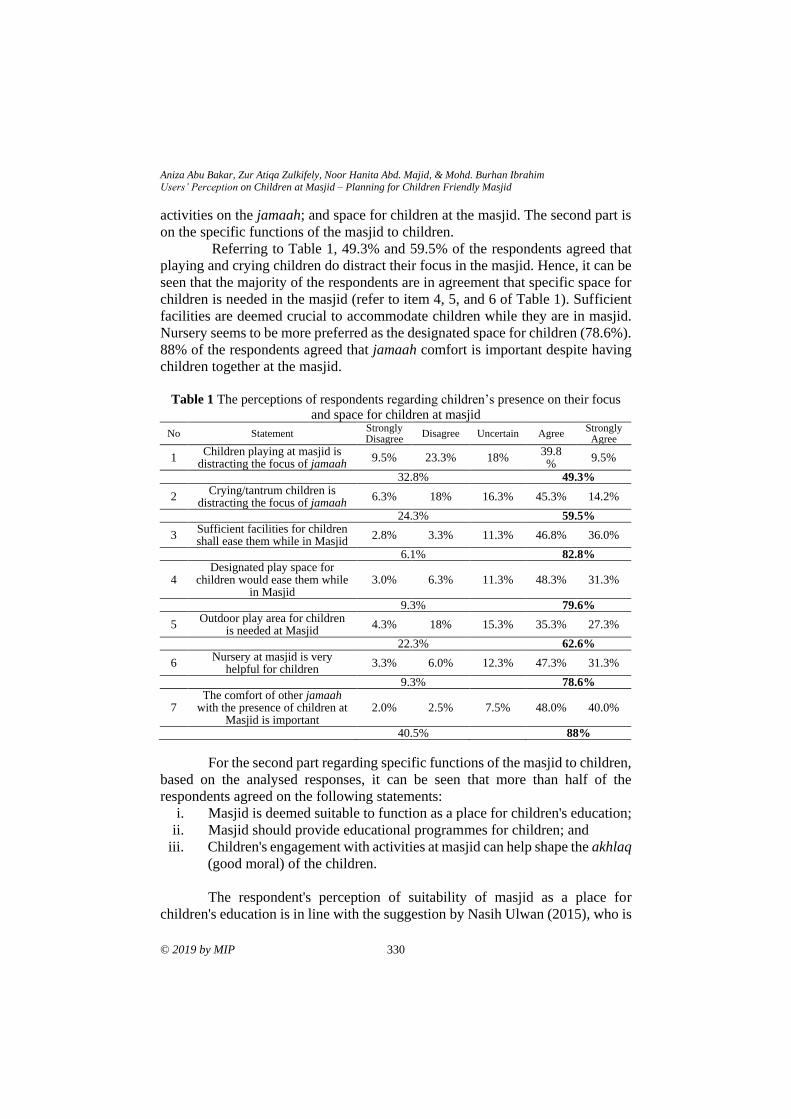
Aniza Abu Bakar, Zur Atiqa Zulkifely, Noor Hanita Abd. Majid, & Mohd. Burhan Ibrahim
Users’ Perception on Children at Masjid – Planning for Children Friendly Masjid
© 2019 by MIP 330
activities on the jamaah; and space for children at the masjid. The second part is
on the specific functions of the masjid to children.
Referring to Table 1, 49.3% and 59.5% of the respondents agreed that
playing and crying children do distract their focus in the masjid. Hence, it can be
seen that the majority of the respondents are in agreement that specific space for
children is needed in the masjid (refer to item 4, 5, and 6 of Table 1). Sufficient
facilities are deemed crucial to accommodate children while they are in masjid.
Nursery seems to be more preferred as the designated space for children (78.6%).
88% of the respondents agreed that jamaah comfort is important despite having
children together at the masjid.
Table 1 The perceptions of respondents regarding children’s presence on their focus
and space for children at masjid
For the second part regarding specific functions of the masjid to children,
based on the analysed responses, it can be seen that more than half of the
respondents agreed on the following statements:
i. Masjid is deemed suitable to function as a place for children's education;
ii. Masjid should provide educational programmes for children; and
iii. Children's engagement with activities at masjid can help shape the akhlaq
(good moral) of the children.
The respondent's perception of suitability of masjid as a place for
children's education is in line with the suggestion by Nasih Ulwan (2015), who is
No Statement Strongly Disagree
Disagree Uncertain Agree Strongly
Agree
1 Children playing at masjid is
distracting the focus of jamaah 9.5% 23.3% 18%
39.8%
9.5%
32.8% 49.3%
2 Crying/tantrum children is
distracting the focus of jamaah 6.3% 18% 16.3% 45.3% 14.2%
24.3% 59.5%
3 Sufficient facilities for children shall ease them while in Masjid
2.8% 3.3% 11.3% 46.8% 36.0%
6.1% 82.8%
4 Designated play space for
children would ease them while in Masjid
3.0% 6.3% 11.3% 48.3% 31.3%
9.3% 79.6%
5 Outdoor play area for children
is needed at Masjid 4.3% 18% 15.3% 35.3% 27.3%
22.3% 62.6%
6 Nursery at masjid is very
helpful for children 3.3% 6.0% 12.3% 47.3% 31.3%
9.3% 78.6%
7 The comfort of other jamaah
with the presence of children at Masjid is important
2.0% 2.5% 7.5% 48.0% 40.0%
40.5% 88%

PLANNING MALAYSIA
Journal of the Malaysia Institute of Planners (2019)
331 © 2019 by MIP
a leading scholar on children's early education from the perspective of Islam,
where he mentioned that there are three suggested physical places for children's
education, namely the home, the masjid, and the school. The respondents were
asked to rank activities that can be conducted by the masjid for the children, and
the result is shown in Figure 6.
Figure 6 Educational Programmes for Children at Masjid
Learning to perform the solat (prayer) followed by learning the Al Quran
were deemed as of high importance. Tuition classes that support children
academic was ranked as less important. However, based on the visits to the eight
masjids involved, five masjids conduct additional tuition classes to support the
academic achievement of the children. These classes received good response
from the children and their parents. This result in a way reflects that our society
may have a strong perception that a masjid must focus on religious activities first
and foremost.
The perceptions of parent/guardian and other jamaah on the needs of
Physical Space for Children (Section D)
Based on the survey, it seems that the majority of the respondents agreed that
children should be at the corridor of masjid rather than in the nursery and main
prayer hall (Figure 7). This suggests that children are welcome to masjid, but the
main prayer hall may not be the best place for them as their nature as children
(being active) would distract the jamaah. On top of that, respondents also
suggested some other spaces such as at the back of the main prayer hall as a
suitable place for the children so that they can be visually monitored by their
parents.
Figure 7 The best place for children in masjid
Looking in general over the eight studied masjids, slightly over 50% of
the respondents agreed that the current facilities are sufficient for them to carry
any activities together with the children, and 54.3% seem to be satisfied with the
facilities (Table 2). It is also interesting to note that about 1/3 of the respondents
were uncertain on the sufficiency of the facilities as well as their level of
satisfaction as they may not be aware of the said facilities. 56.3% of the
Aniza Abu Bakar, Zur Atiqa Zulkifely, Noor Hanita Abd. Majid, & Mohd. Burhan Ibrahim
Users’ Perception on Children at Masjid – Planning for Children Friendly Masjid
© 2019 by MIP 332
respondents agreed that children should not be in the main prayer hall while
kulliyyah (religious talk) is in progress, while about a quarter of the respondents
were uncertain about this. The majority (78.8%) of the respondents agreed that
additional space is necessary to be provided for children.
Table 2 The perceptions of respondents on the current facilities and space concerning
children at masjid
CONCLUSION AND RECOMMENDATION
Based on the study, it can be concluded that the congregational members of
masjids are mainly the Malay, with moderate to high academic qualification,
employed, and stay nearby masjid. It can also be said that the number of jamaah
that bring children to the masjid is quite low (when combined between
'occasionally' and 'never' categories, the percentage was about 67%. It would be
fascinating to study the reason behind this in order to encourage the provison of
children-friendly environment at masjid. Generally, the study found that the
presence of children may affect the focus of the jamaah. The respondents felt that
specific/designated space should be provided for children. Finally, it can be said
that the presence of children at masjid is welcome, however particular
improvement is needed to ensure the comfort of both children and jamaah.
ACKNOWLEDGEMENTS
This research was funded through the Fundamental Research Grant Scheme
under the Ministry of Education Malaysia with the grant ID: FRGS19-031-0639.
The researcher would like to thank the International Islamic University Malaysia
and all the eight masjids that were involved as the case studies for their great
support and cooperation.
No Statements Strongly
Disagree Disagree Uncertain Agree
Strongly
Agree
1
Facilities provided by the masjid are
sufficient to carry out any activities
with children
2.3% 14.2% 32.5% 36.3% 14.8%
16.5% 51.1%
2
Facilities provided by the masjid are
satisfactory to perform any activities
with children
1.5% 10.8% 33.5% 41.3% 13.0%
12.3% 54.3%
3
Children are less comfortable in the
main prayer hall when the Kulliyyah
is in progress
3.5% 15.5% 24.8% 40.0% 16.3%
19.0% 56.3%
4 The masjid has to provide additional
space for the children in the masjid
2.5% 8.3% 10.5% 41.8% 37.0%
10.8% 78.8%
PLANNING MALAYSIA
Journal of the Malaysia Institute of Planners (2019)
333 © 2019 by MIP
REFERENCES Abd. Wahab, N. A., Ab. Hamid. N., & Che Man. N. (2016). Pemerkasaan peranan masjid
di Malaysia. Era Kontemporari, 5(2), 219-228.
Azmi, S. M, (2019). “Pergi keluar! Budak2 ni kotor.” - Ibu dan anak dihalau dari
masjid, tapi masih teruskan solat [Blog Post]. Retrieved from
https://www.ohmymedia.cc/pergi-keluar-budak2-ni-kotor-ibu-dan-anak-
dihalau-dari-masjid-tapi-masih-teruskan-solat/
Ghafar, N. (2018). Anak dihalau keluar dari masjid dengan kasar ketika solat tarawih,
kasihannya! [Blog Post]. Retrieved from https://my.theasianparent.com/anak-
dihalau-keluar-masjid
Hassan, M, H. (2007). Asas pendidikan anak-anak berdasarkan nasihat Luqmanul Hakim
kepada anaknya. Retrieved from http://haniff.sg/wp-
content/uploads/2007/08/artikel-khalifahmuda.pdf
Hizan, M. H., Ismail, N., & Ispawi, N. S. (2017). The role of mosque library as a
knowledge institution. Research Hub, 3(11), 7-16.
Imam, S. M. N. (2000). Mosque architecture: Formulation of design criteria and
standards in the context of Bangladesh (Master’s thesis). Bangladesh University
of Engineering and Technology, Dhaka, Bangladesh.
Jupiter, H. (2019). Kanak-kanak dilarang ke masjid, ganggu khusyuk ketika solat.
Retrieved from https://apakataorang.com/kanak-kanak-dilarang-ke-masjid-
ganggu-khusyuk-ketika-solat/
Khalifah (n.d.) In Oxford Islamic Studies Online. Retrieved March 18, 2019 from
http://www.oxfordislamicstudies.com/article/opr/t125/e1262#
Laugu, N. (2007). The roles of mosque libraries. Al-Jami‘Ah, 45(1), 91-118.
Mohamad Al Bakri, Z., (2016), Bayan lLinnas No. 63 – Masjid dan kanak-kanak.
Available at https://muftiwp.gov.my/ms/component/tags/tag/bayan-linnas.
Nasih Ulwan, A. (2015). Tarbiyatul aulad fil Islam. Batu Caves, Selangor: PTS
Publishing House.
Oloyede, I. O. (2014). Multi-purpose use of the mosque in Islam. Opening of Al Hujjaj
Central Mosque Lekki. Ilorin, Nigeria. Retrieved from
https://www.nscia.com.ng/index.php/info-portal/information/66-multi-purpose-
use-of-the-mosque-in-islam-by-is-haq-olanrewaju-oloyede
Omer, S. (2010). Some lessons from Prophet Muhammad (SAW) in architecture: The
Prophet’s Mosque in Madinah. Intellectual Discourse, 18(1), 115-140.
Rahmat, M., & Fahrudin. (2018). Understanding the meaning of khalifah fil ardhi in the
Quran and implications on education. IOP Conference Series Earth and
Environmental Science, 145(1), 012121.
Sahih Bukhari [online]: Available at https://muflihun.com/hadith
Toorawa, S. (2015). Children in the masjid: Making space for our future [Blog Post].
Retrieved from https://www.soundvision.com/article/children-in-the-masjid-
making-space-for-our-future
Received: 12th January 2019. Accepted: 2nd August 2019
1Associate Professor at International Islamic University Malaysia. Email: [email protected] 334
PLANNING MALAYSIA:
Journal of the Malaysian Institute of Planners
VOLUME 17 ISSUE 2 (2019), Page 334 – 342
AN ASSESSMENT ON EARLY WARNING SYSTEM: INITIAL
SURVEY ANALYSIS
Mohd Ramzi Mohd Hussain1, Noor Suzilawati Rabe2, Ismawi Zen3,
Izawati Tukiman4, Rahsidi Sabri Muda5, & Ahmad Fadhli Mamat6
1, 2, 4 Kulliyyah of Architecture and Environmental Design
INTERNATIONAL ISLAMIC UNIVERSITY MALAYSIA
3 AL MADINAH INTERNATIONAL UNIVERSITY
5,6Tenaga National Berhad Research
TENAGA NASIONAL BERHAD
Abstract
In Cameron Highland, Lembah Bertam area and further downstream villages in
Susu Dam area are prone and vulnerable to the highest occurrence of floods
especially during monsoon season. Thus, Early Warning System (EWS) were set
up to avoid or to reduce the impact of natural hazard turns disasters such as floods,
landslides and storms with the aim to reduce the vulnerability and disaster risks
that signifies the effectiveness of EWS in the realisation of affected community.
To test the awareness and preparedness of community in the selected area, a
questionnaire survey was employed as the data collection method. The
questionnaire survey was conducted before the direct engagement on the EWS
information with the community. Using the mixed sampling method of cluster
random sampling, a total of 800 respondents from 11 villages, and 5 main
ethnicity groups were involved in the survey. From the result, there was a positive
relationship showing that respondents who claimed they knew about the EWS
from information signage were those from the older age category and earning
higher monthly income. On the other hand, there is a negative relationship
between respondents’ age and monthly income against other sources that
indicates respondents who claimed they knew about the EWS from other sources
were those in the younger age category and have low monthly income.
Keywords: early warning system; dam, hazard, Cameron Highland
PLANNING MALAYSIA
Journal of the Malaysia Institute of Planners (2019)
335 © 2019 by MIP
INTRODUCTION
Overall, there are 74 dams in Malaysia, which consist of various types and
functions. Dams in Malaysia are owned and operated by different agencies such
as the Department of Irrigation and Drainage, Water Supply Department, energy
supply company (such as TNB), State Government and other agencies according
to their respective needs and responsibilities.
Apart from other functions, provision of dams is also essential for the
nation’s infrastructure to provide for renewable energy of hydropower electricity.
Hydropower is the only renewable energy technology that is presently
commercially viable on a larger scale. It has four major advantages, namely it is
renewable, it produces negligible amounts of greenhouse gases, it is the least
costly way of storing large amounts of electricity, and it can easily adjust the
amount of electricity produced to the amount demanded by consumers.
However, construction and dam development posed potential hazard to
communities, the environment and property, often well beyond their locations.
Among the impacts of dam include dam failure that could lead to flood event that
cause potential flooding impacts to the community and assets (vulnerability).
Thus, this paper explores the community knowledge on the dam failure and flood
early warning system at Lembah Bertam and Susu Dam area.
BACKGROUND OF THE STUDY
Hazard is defined as phenomena that poses a threat to people, structures or
economic assets and which may cause a disaster (UN-SPIDER, 2015). Disaster
could be categorised either man-made or naturally occurring, while vulnerability
is the extent to which a community are exposed to loss or damage that indirectly
influence their perceptions and willingness to act(Jones et al, 2014).
As recorded in the Global Risks report (World Economic Forum, 2016),
the world we are living in is facing issues of climate change, social instability,
unmanageable inflation, large scale involuntary migration, biodiversity loss,
terrorism, and so forth. It is forecasted that countries like in Asia are likely to
experience major natural catastrophes with extreme weather events (World
Economic Forum, 2016). Asia accounts for 70% of natural disasters in the world
(ADB, 2012). The main reason for this is the fact that Asia Pacific lies within
Pacific Ring of Fire, which accounts for 90% world’s earthquakes and 70% of
world’s volcanoes (Jha & Brecht, 2011).
Malaysia is geographically located outside the Pacific Ring of Fire.
Therefore, it is relatively free from certain severe crises found in neighbouring
countries. However, as shown in Figure 1, Malaysia is vulnerable to natural
hazards including floods, forest fires, tsunami, cyclonic storms, landslides,
epidemics, and haze.
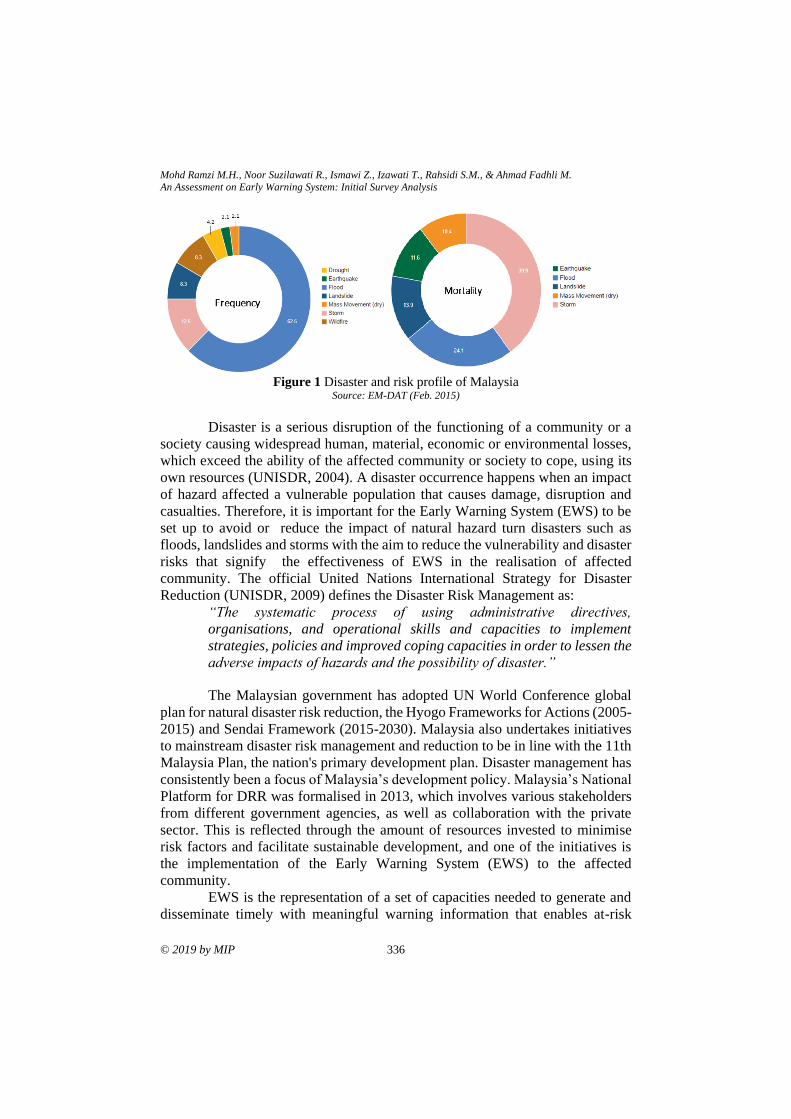
Mohd Ramzi M.H., Noor Suzilawati R., Ismawi Z., Izawati T., Rahsidi S.M., & Ahmad Fadhli M.
An Assessment on Early Warning System: Initial Survey Analysis
© 2019 by MIP 336
Figure 1 Disaster and risk profile of Malaysia
Source: EM-DAT (Feb. 2015)
Disaster is a serious disruption of the functioning of a community or a
society causing widespread human, material, economic or environmental losses,
which exceed the ability of the affected community or society to cope, using its
own resources (UNISDR, 2004). A disaster occurrence happens when an impact
of hazard affected a vulnerable population that causes damage, disruption and
casualties. Therefore, it is important for the Early Warning System (EWS) to be
set up to avoid or reduce the impact of natural hazard turn disasters such as
floods, landslides and storms with the aim to reduce the vulnerability and disaster
risks that signify the effectiveness of EWS in the realisation of affected
community. The official United Nations International Strategy for Disaster
Reduction (UNISDR, 2009) defines the Disaster Risk Management as:
“The systematic process of using administrative directives,
organisations, and operational skills and capacities to implement
strategies, policies and improved coping capacities in order to lessen the
adverse impacts of hazards and the possibility of disaster.”
The Malaysian government has adopted UN World Conference global
plan for natural disaster risk reduction, the Hyogo Frameworks for Actions (2005-
2015) and Sendai Framework (2015-2030). Malaysia also undertakes initiatives
to mainstream disaster risk management and reduction to be in line with the 11th
Malaysia Plan, the nation's primary development plan. Disaster management has
consistently been a focus of Malaysia’s development policy. Malaysia’s National
Platform for DRR was formalised in 2013, which involves various stakeholders
from different government agencies, as well as collaboration with the private
sector. This is reflected through the amount of resources invested to minimise
risk factors and facilitate sustainable development, and one of the initiatives is
the implementation of the Early Warning System (EWS) to the affected
community.
EWS is the representation of a set of capacities needed to generate and
disseminate timely with meaningful warning information that enables at-risk
PLANNING MALAYSIA
Journal of the Malaysia Institute of Planners (2019)
337 © 2019 by MIP
individuals, communities and organisations to prepare and act accordingly, and
in sufficient time to reduce harm or loss. According to Mohd Hussain et al.
(2018), EWS can be categorised into community managed EWS and community
based EWS. A community managed EWS refers to the system managed by
community but they are not completely involved in the establishment of the
system. Whereas, community based EWS is a system developed, operated and
maintained by the community itself. While developing the system, the
community would explore external support from different individuals,
communities, organisations and institutions. Thus it can be concluded that it is
necessary that the community develops and maintains close coordination and
links with the stakeholders.
As EWS tends to focus on warning and monitoring on hazards and threats
only, hazards and vulnerability should be assessed together to reduce risks. A
community which is highly exposed to hazard also experiences a high level of
vulnerability and needs a more heads-up warning.
STUDY METHODOLOGY
The initial survey questionnaire was designed to elicit the perceptions of the
community before EWS implementation in the settlements. The survey was
conducted on a one-to-one interview basis with a total survey population of 800
respondents who reside in the Sultan Abu Bakar (SAB) Dam and Susu Dam areas. This research employed the method of probability sampling in which it
gives an equal opportunity to the population to be included in a sample. Brown
(1947) elaborated that a probability or random sampling has the greatest freedom
bias but may represent the most costly sample in terms of time and energy for a
given level of sampling error. In selecting samples from the targeted sampling,
cluster sampling was chosen as it assumed as the best sampling technique for this
research. Cluster sampling is advantageous for those researchers whose subjects
are fragmented over large geographical areas as it saves time and money (Davis,
2005). Overall, the number of respondents from each village represented 30% of
the total village population.
The data retrieved from the questionnaire was analysed using IBM SPSS
Statistics Version 23. The first phase of questionnaire survey was done before the
community engagement programme with the population. This intended to gauge
the response from respondents that could reflect their nature of understanding,
awareness and preparedness of the community in Cameron Highlands before the
EWS was installed.
The questionnaire survey for this research was divided into three main
sections which consisted of Section A: demographic information of the
respondents, Section B: information on experience before the implementation of
EWS, and Section C: information on experience during the installation of EWS.
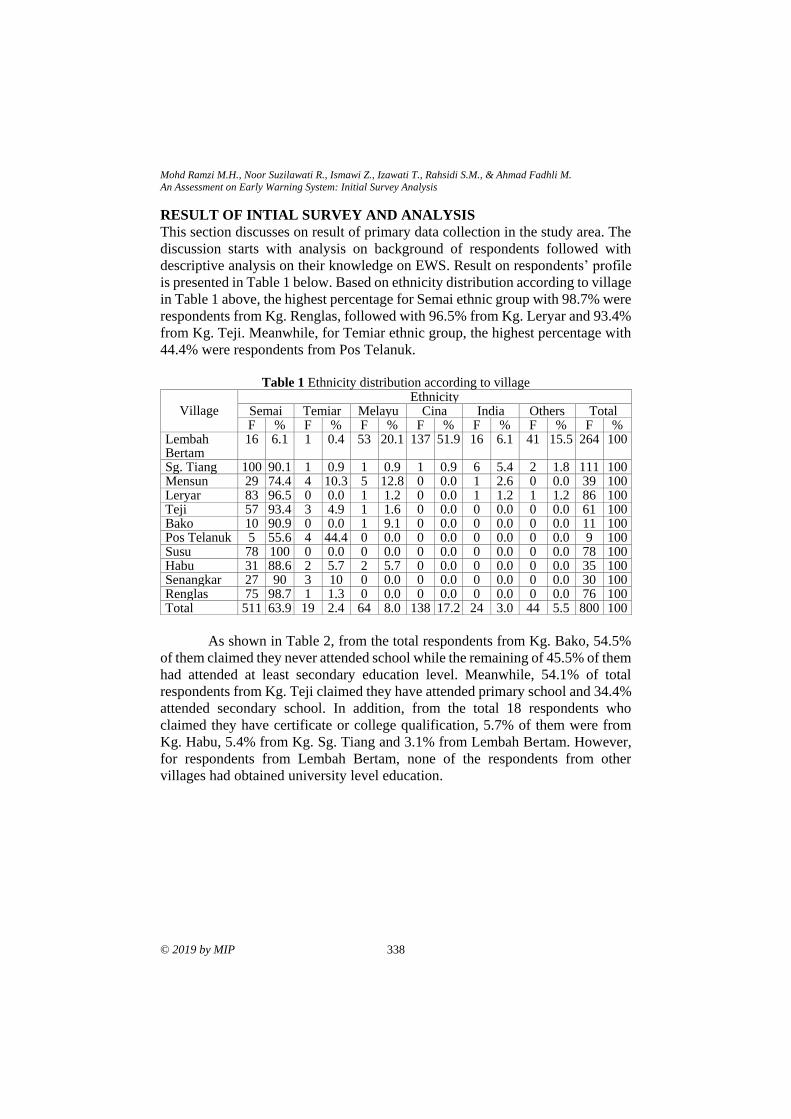
Mohd Ramzi M.H., Noor Suzilawati R., Ismawi Z., Izawati T., Rahsidi S.M., & Ahmad Fadhli M.
An Assessment on Early Warning System: Initial Survey Analysis
© 2019 by MIP 338
RESULT OF INTIAL SURVEY AND ANALYSIS
This section discusses on result of primary data collection in the study area. The
discussion starts with analysis on background of respondents followed with
descriptive analysis on their knowledge on EWS. Result on respondents’ profile
is presented in Table 1 below. Based on ethnicity distribution according to village
in Table 1 above, the highest percentage for Semai ethnic group with 98.7% were
respondents from Kg. Renglas, followed with 96.5% from Kg. Leryar and 93.4%
from Kg. Teji. Meanwhile, for Temiar ethnic group, the highest percentage with
44.4% were respondents from Pos Telanuk.
Table 1 Ethnicity distribution according to village
Village
Ethnicity Semai Temiar Melayu Cina India Others Total F % F % F % F % F % F % F %
Lembah Bertam
16 6.1 1 0.4 53 20.1 137 51.9 16 6.1 41 15.5 264 100
Sg. Tiang 100 90.1 1 0.9 1 0.9 1 0.9 6 5.4 2 1.8 111 100 Mensun 29 74.4 4 10.3 5 12.8 0 0.0 1 2.6 0 0.0 39 100 Leryar 83 96.5 0 0.0 1 1.2 0 0.0 1 1.2 1 1.2 86 100 Teji 57 93.4 3 4.9 1 1.6 0 0.0 0 0.0 0 0.0 61 100 Bako 10 90.9 0 0.0 1 9.1 0 0.0 0 0.0 0 0.0 11 100 Pos Telanuk 5 55.6 4 44.4 0 0.0 0 0.0 0 0.0 0 0.0 9 100 Susu 78 100 0 0.0 0 0.0 0 0.0 0 0.0 0 0.0 78 100 Habu 31 88.6 2 5.7 2 5.7 0 0.0 0 0.0 0 0.0 35 100 Senangkar 27 90 3 10 0 0.0 0 0.0 0 0.0 0 0.0 30 100 Renglas 75 98.7 1 1.3 0 0.0 0 0.0 0 0.0 0 0.0 76 100 Total 511 63.9 19 2.4 64 8.0 138 17.2 24 3.0 44 5.5 800 100
As shown in Table 2, from the total respondents from Kg. Bako, 54.5%
of them claimed they never attended school while the remaining of 45.5% of them
had attended at least secondary education level. Meanwhile, 54.1% of total
respondents from Kg. Teji claimed they have attended primary school and 34.4%
attended secondary school. In addition, from the total 18 respondents who
claimed they have certificate or college qualification, 5.7% of them were from
Kg. Habu, 5.4% from Kg. Sg. Tiang and 3.1% from Lembah Bertam. However,
for respondents from Lembah Bertam, none of the respondents from other
villages had obtained university level education.
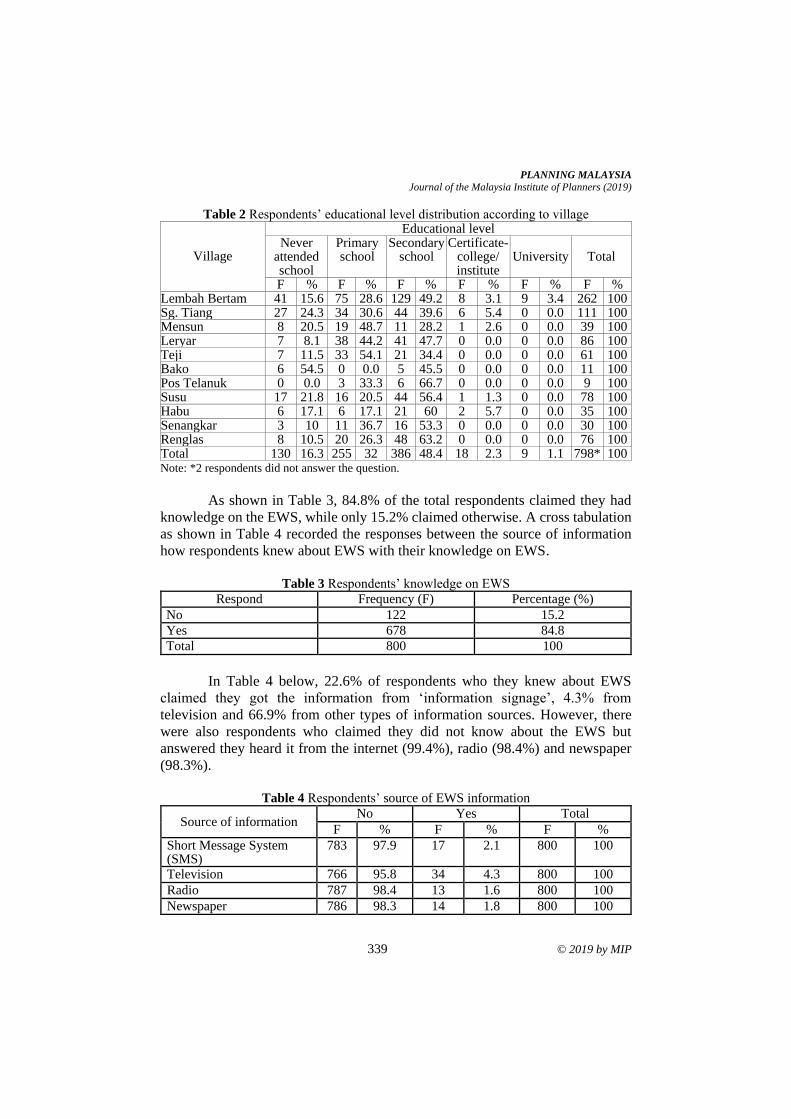
PLANNING MALAYSIA
Journal of the Malaysia Institute of Planners (2019)
339 © 2019 by MIP
Table 2 Respondents’ educational level distribution according to village
Village
Educational level Never
attended school
Primary school
Secondary school
Certificate- college/ institute
University
Total
F % F % F % F % F % F % Lembah Bertam 41 15.6 75 28.6 129 49.2 8 3.1 9 3.4 262 100 Sg. Tiang 27 24.3 34 30.6 44 39.6 6 5.4 0 0.0 111 100 Mensun 8 20.5 19 48.7 11 28.2 1 2.6 0 0.0 39 100 Leryar 7 8.1 38 44.2 41 47.7 0 0.0 0 0.0 86 100 Teji 7 11.5 33 54.1 21 34.4 0 0.0 0 0.0 61 100 Bako 6 54.5 0 0.0 5 45.5 0 0.0 0 0.0 11 100 Pos Telanuk 0 0.0 3 33.3 6 66.7 0 0.0 0 0.0 9 100 Susu 17 21.8 16 20.5 44 56.4 1 1.3 0 0.0 78 100 Habu 6 17.1 6 17.1 21 60 2 5.7 0 0.0 35 100 Senangkar 3 10 11 36.7 16 53.3 0 0.0 0 0.0 30 100 Renglas 8 10.5 20 26.3 48 63.2 0 0.0 0 0.0 76 100 Total 130 16.3 255 32 386 48.4 18 2.3 9 1.1 798* 100 Note: *2 respondents did not answer the question.
As shown in Table 3, 84.8% of the total respondents claimed they had
knowledge on the EWS, while only 15.2% claimed otherwise. A cross tabulation
as shown in Table 4 recorded the responses between the source of information
how respondents knew about EWS with their knowledge on EWS.
Table 3 Respondents’ knowledge on EWS
Respond Frequency (F) Percentage (%)
No 122 15.2
Yes 678 84.8
Total 800 100
In Table 4 below, 22.6% of respondents who they knew about EWS
claimed they got the information from ‘information signage’, 4.3% from
television and 66.9% from other types of information sources. However, there
were also respondents who claimed they did not know about the EWS but
answered they heard it from the internet (99.4%), radio (98.4%) and newspaper
(98.3%).
Table 4 Respondents’ source of EWS information
Source of information No Yes Total
F % F % F %
Short Message System (SMS)
783 97.9 17 2.1 800 100
Television 766 95.8 34 4.3 800 100
Radio 787 98.4 13 1.6 800 100
Newspaper 786 98.3 14 1.8 800 100
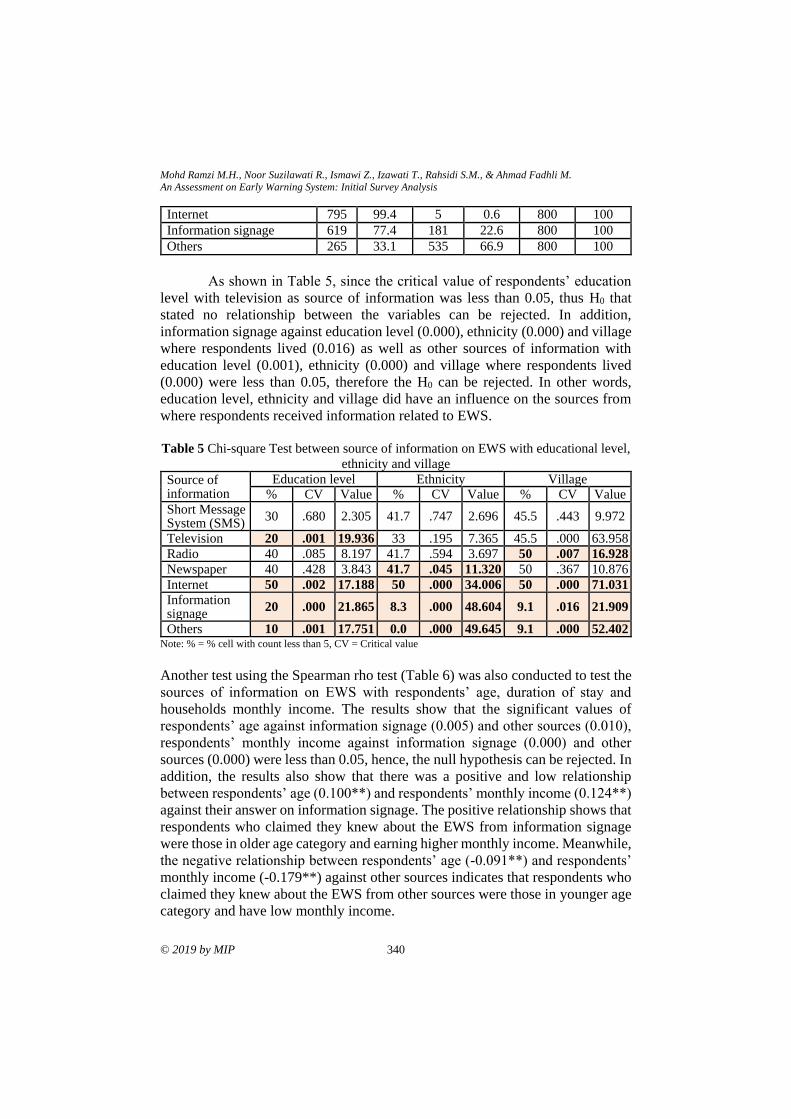
Mohd Ramzi M.H., Noor Suzilawati R., Ismawi Z., Izawati T., Rahsidi S.M., & Ahmad Fadhli M.
An Assessment on Early Warning System: Initial Survey Analysis
© 2019 by MIP 340
Internet 795 99.4 5 0.6 800 100
Information signage 619 77.4 181 22.6 800 100
Others 265 33.1 535 66.9 800 100
As shown in Table 5, since the critical value of respondents’ education
level with television as source of information was less than 0.05, thus H0 that
stated no relationship between the variables can be rejected. In addition,
information signage against education level (0.000), ethnicity (0.000) and village
where respondents lived (0.016) as well as other sources of information with
education level (0.001), ethnicity (0.000) and village where respondents lived
(0.000) were less than 0.05, therefore the H0 can be rejected. In other words,
education level, ethnicity and village did have an influence on the sources from
where respondents received information related to EWS.
Table 5 Chi-square Test between source of information on EWS with educational level,
ethnicity and village
Source of information
Education level Ethnicity Village % CV Value % CV Value % CV Value
Short Message System (SMS)
30 .680 2.305 41.7 .747 2.696 45.5 .443 9.972
Television 20 .001 19.936 33 .195 7.365 45.5 .000 63.958
Radio 40 .085 8.197 41.7 .594 3.697 50 .007 16.928
Newspaper 40 .428 3.843 41.7 .045 11.320 50 .367 10.876
Internet 50 .002 17.188 50 .000 34.006 50 .000 71.031
Information signage
20 .000 21.865 8.3 .000 48.604 9.1 .016 21.909
Others 10 .001 17.751 0.0 .000 49.645 9.1 .000 52.402 Note: % = % cell with count less than 5, CV = Critical value
Another test using the Spearman rho test (Table 6) was also conducted to test the
sources of information on EWS with respondents’ age, duration of stay and
households monthly income. The results show that the significant values of
respondents’ age against information signage (0.005) and other sources (0.010),
respondents’ monthly income against information signage (0.000) and other
sources (0.000) were less than 0.05, hence, the null hypothesis can be rejected. In
addition, the results also show that there was a positive and low relationship
between respondents’ age (0.100**) and respondents’ monthly income (0.124**)
against their answer on information signage. The positive relationship shows that
respondents who claimed they knew about the EWS from information signage
were those in older age category and earning higher monthly income. Meanwhile,
the negative relationship between respondents’ age (-0.091**) and respondents’
monthly income (-0.179**) against other sources indicates that respondents who
claimed they knew about the EWS from other sources were those in younger age
category and have low monthly income.
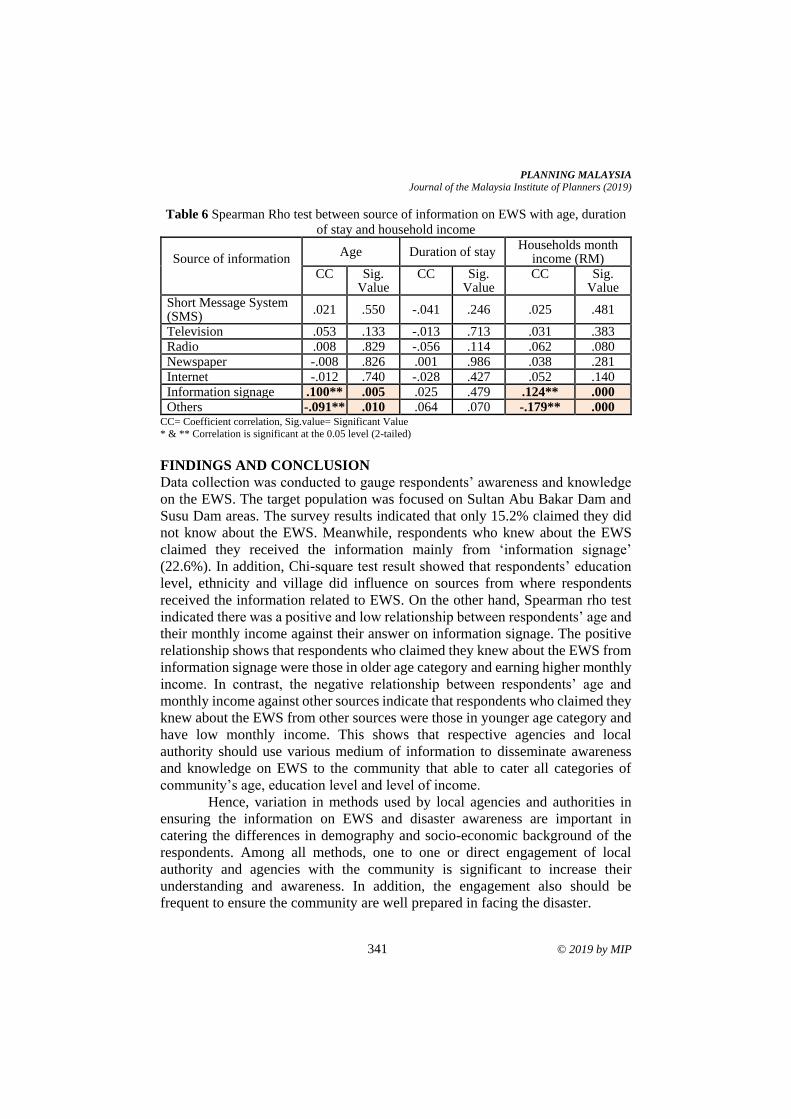
PLANNING MALAYSIA
Journal of the Malaysia Institute of Planners (2019)
341 © 2019 by MIP
Table 6 Spearman Rho test between source of information on EWS with age, duration
of stay and household income
Source of information
Age Duration of stay Households month
income (RM) CC Sig.
Value CC Sig.
Value CC Sig.
Value Short Message System (SMS)
.021 .550 -.041 .246 .025 .481
Television .053 .133 -.013 .713 .031 .383 Radio .008 .829 -.056 .114 .062 .080 Newspaper -.008 .826 .001 .986 .038 .281
Internet -.012 .740 -.028 .427 .052 .140 Information signage .100** .005 .025 .479 .124** .000
Others -.091** .010 .064 .070 -.179** .000 CC= Coefficient correlation, Sig.value= Significant Value
* & ** Correlation is significant at the 0.05 level (2-tailed)
FINDINGS AND CONCLUSION
Data collection was conducted to gauge respondents’ awareness and knowledge
on the EWS. The target population was focused on Sultan Abu Bakar Dam and
Susu Dam areas. The survey results indicated that only 15.2% claimed they did
not know about the EWS. Meanwhile, respondents who knew about the EWS
claimed they received the information mainly from ‘information signage’
(22.6%). In addition, Chi-square test result showed that respondents’ education
level, ethnicity and village did influence on sources from where respondents
received the information related to EWS. On the other hand, Spearman rho test
indicated there was a positive and low relationship between respondents’ age and
their monthly income against their answer on information signage. The positive
relationship shows that respondents who claimed they knew about the EWS from
information signage were those in older age category and earning higher monthly
income. In contrast, the negative relationship between respondents’ age and
monthly income against other sources indicate that respondents who claimed they
knew about the EWS from other sources were those in younger age category and
have low monthly income. This shows that respective agencies and local
authority should use various medium of information to disseminate awareness
and knowledge on EWS to the community that able to cater all categories of
community’s age, education level and level of income.
Hence, variation in methods used by local agencies and authorities in
ensuring the information on EWS and disaster awareness are important in
catering the differences in demography and socio-economic background of the
respondents. Among all methods, one to one or direct engagement of local
authority and agencies with the community is significant to increase their
understanding and awareness. In addition, the engagement also should be
frequent to ensure the community are well prepared in facing the disaster.
Mohd Ramzi M.H., Noor Suzilawati R., Ismawi Z., Izawati T., Rahsidi S.M., & Ahmad Fadhli M.
An Assessment on Early Warning System: Initial Survey Analysis
© 2019 by MIP 342
ACKNOWLEDGEMENTS
This study was conducted under a consultancy project in collaboration with
Tenaga Nasional Berhad Research (TNBR).
REFERENCES Asian Development Bank [ADB] (2012). Fast facts for disaster risk management in Asian
cities. Manila: Author.
Brown, G. H. (1947). A comparison of sampling methods. Journal of Marketing, 6, 331-
337.
Davis, D. (2005). Business research for decision making. Pacific Grove, CA:
Brooks/Cole Publishing Company.
EM-DAT (Feb. 2015) - The OFDA/CRED - International Disaster Database
http://www.emdat.be - Université catholique de Louvain Brussels – Belgium
Jha, A., & Brecht, H. (2011). An eye on East Asia and Pacific: Building Urban Resilience
in East Asia. Washington DC: World Bank.
Jones, R.N., et al. (201 4). Foundations for decision making. In Barros, V.R. et al. (eds).
(2014). Climate Change 2014: Impacts, Adaptation, and Vulnerability.Part A:
Global and Sectoral Aspects. Contribution of Working Group II to the Fifth
Assessment Report of the Intergovernmental Panel on Climate Change. Cambridge,
United Kingdom and New York: Cambridge University Press.
Mohd Hussain, M. R., Zen, I., Muda, R. S., Thiruchelvam, S., Tukiman, I., & Ahmad
Shazili, A. N. (2018). Community Awareness on The Implementation of Early
Warning System at Tenaga Nasional Berhad Sultan Abu Bakar Hydroelectric
Scheme, Lembah Bertam, Cameron Highland. Planning Malaysia, 16(1), 155-162.
UN-SPIDER. (2015). Disaster risk management. Retrieved June 27, 2019, from
http://www.un-spider.org/risks-and-disasters/disaster-risk-management
UNISDR. (2004). On-line conference: Priority areas to implement disaster risk
reduction. Retrieved June 27, 2019, from https://www.unisdr.org/2004/wcdr-
dialogue/terminology.htm
UNISDR. (2009). UNISDR terminology on disaster risk reduction. Available at
www.preventionweb.net
World Economic Forum (2016). Global risks 2016. Availaible at www.weforum.org
Received: 20th July 2019. Accepted: 2nd August 2019
1Assistant Professor at International Islamic University Malaysia. Email: [email protected] 343
PLANNING MALAYSIA:
Journal of the Malaysian Institute of Planners
VOLUME 17 ISSUE 2 (2019), Page 343 – 351
RESPONDENTS’ AREA OF PREFERENCE WHEN DISASTER
STRIKES: A CASE STUDY OF CAMERON HIGHLAND
Noor Suzilawati Rabe1, Mohd Ramzi Mohd Hussain2, Izawati Tukiman3,
Ismawi Zen 4, Rahsidi Sabri Muda5, & Ahmad Fadhli Mamat6
1, 2, 3Kulliyyah of Architecture and Environmental Design
INTERNATIONAL ISLAMIC UNIVERSITY MALAYSIA
4AL MADINAH INTERNATIONAL UNIVERSITY
5,6Tenaga National Berhad Research
TENAGA NASIONAL BERHAD
Abstract
Disaster can be understood as the probability or threat of quantifiable damage,
injury, liability, loss, or any other negative occurrence that is caused by external
or internal vulnerabilities that required an immediate action. Therefore, this study
intends to understand respondents’ preferences of location when disaster strikes
their settlements/ villages. Their responses are important to indicate their
preparedness when facing disaster. Data collection was employed using the
questionnaire survey method to the 11 villages. The selection of population was
based on a cluster random sampling to ensure equal probability chances were
given to every individual in every village. A total of 847 responses were able to
be used for data analysis. The results show that the respondents’ knowledge on
safe location was influenced by their demographic background. In addition, their
experience with disasters and residential area also influenced their area of
preference to seek refuge in the event of a disaster. Thus, an active promotion of
such information related to risk management and reduction should be varied to
cater the unique characteristics of the population.
Keywords: Safe haven, route, disaster, dam, Cameron Highland
Noor Suzilawati R., Mohd Ramzi M.H., Izawati T., Ismawi Z., Rahsidi S.M., & Ahmad Fadhli M.
A Study on Safe Haven for Community in Lembah Bertam and Susu Dam, Cameron Highland
© 2019 by MIP 344
INTRODUCTION
Cameron Highland, Lembah Bertam and further downstream villages are
reported to have the highest occurrence of floods especially during monsoon
season which makes the areas vulnerable. For that reasons, there are currently
two dams that have been constructed in the study area, which include Sultan Abu
Bakar (SAB) Dam in Lembah Bertam Hydroelectric Scheme and Susu Dam in
Ulu Jelai Hydroelectric Scheme. The development of both dams is seen as one of
the achievements in creating a better life for the local societies. Other than one of
the entry point projects under the Economic Transformation Programme (ETP),
dams provide flood control, supply water and irrigation, provide hydropower,
offer recreation benefits and also provide navigation signs.
A disaster is a serious disruption of the functioning of a community or a
society causing widespread human, material, economic or environmental losses,
which exceed the ability of the affected community or society to cope, using its
own resources (UNISDR 2004). A disaster happens when the impact of a hazard
affects a vulnerable population that causes damage, disruption and casualties.
Hence, this paper discusses the responses of a community on their area of
preference to seek refuge when disaster strikes. The findings of this study will
help to identify the best approach to increase public preparedness and minimising loss of life and injuries in the event of disaster.
STUDY BACKGROUND
The preparation of a disaster preparedness plan within the community is
important in relation to disaster management of the community as a whole. Public
health and safety in the event of a disaster are strengthened as plans are devised
and implemented since disaster often strikes without warning. The best way to
prepare for disaster awareness is to create a specific plan of action that can be put
as a notice to all community.
Community-based Disaster Risk Management (CBDRM) is a process in
which at-risk communities are actively engaged in the identification, analysis,
treatment, monitoring and evaluation of disaster risks in order to reduce their
vulnerabilities and enhance their capacities (ADPC, 2003). This means that
people are at the heart of decision-making and implementation of disaster risk
management activities. The involvement of the most vulnerable social groups is
considered as paramount in this process, while the support of the least vulnerable
groups is necessary for successful implementation. One of the key aspects
highlighted in disaster management is the provision of local shelter. Shelters are
often located in public school buildings, community hall and others. The
designated emergency shelters must be informed to the community in order to
make sure they know where to head to when the early disaster warning is issued.
Shelter as defined by various authors (Kolen & Helshoot, 2012; Isahak et al.,
PLANNING MALAYSIA
Journal of the Malaysia Institute of Planners (2019)
345 © 2019 by MIP
2018) refers to a strong building that offers protection and to safeguard people
from a helpless situation and is an integral part of disaster risk reduction (DRR).
Seag et al. (2013) identified that shelter provision can be divided into
two. One is a temporary shelter for emergency evacuation; while the other is
designated for a long-term relief operation. Other authors (Ashar, Amaratunga,
& Haigh, 2014; Pannier, 2016) divided the shelter into vertical and horizontal
evacuation. Vertical evacuation is the act of people movement within a flood
prone area with the aim of reaching a relatively safe place above the water level
for example reaching to upper building storey. Meanwhile horizontal evacuation
is act of evacuation by going away from the affected area to a safe area using the
recommended designated pathway.
A disaster can become uncontrollable once the event is underway.
Therefore, preventive steps need to be taken before, during and after a disaster. If
a community is not well prepared, control over the disaster event would be
usually lost during its occurrence. If each individual in the community is familiar
with ways of coping and precautionary measures, then the disruption by a disaster
can be reduced (Sampath, 2001).
The implementation of the disaster management plan should be done at
community level with support from local authorities, and technical and research
institutions. The implementation process will include various structural and non-
structural activities such as community training, disaster response drills,
community early warning systems, disaster resilient construction of houses,
forest plantations, mangrove plantation, diversification of crops, rainwater
harvesting, construction of dykes, bridges and so on for vulnerability reduction
and hazard mitigation. Hence, evacuation is a common strategy in emergency
management. In many hazardous events, the best option is to relocate threatened
populations to safer areas (Cova & Johnson, 2003). Evacuation refers to the
temporary relocation from areas at risk to areas of greater safety (Cheng, Qian, &
Zhang, 2011).
As reviewed by numerous authors, the location of a shelter could be
anywhere, as long it is confirmed safe to the victims and declared as a ‘green
area’ and easy to locate for the supply of foods and other items essential for
survival. The temporary evacuation centre location needs to be setup at a higher
ground level. However, it must be accessible at least by air or land. The shelter
location must be on a field with a minimum area of 20 meters by 20 meters (Mat
Rasul & Darus, 2016).
However, the success rate for evacuation is dependent on travel time and
the available time for evacuation work. For instance, the available time for
evacuation can be improved through flood forecasting and warning systems that
provide a longer available time and decrease the possibility that residents cannot
evacuate to flood shelters related to flood circumstances. Early warning is an
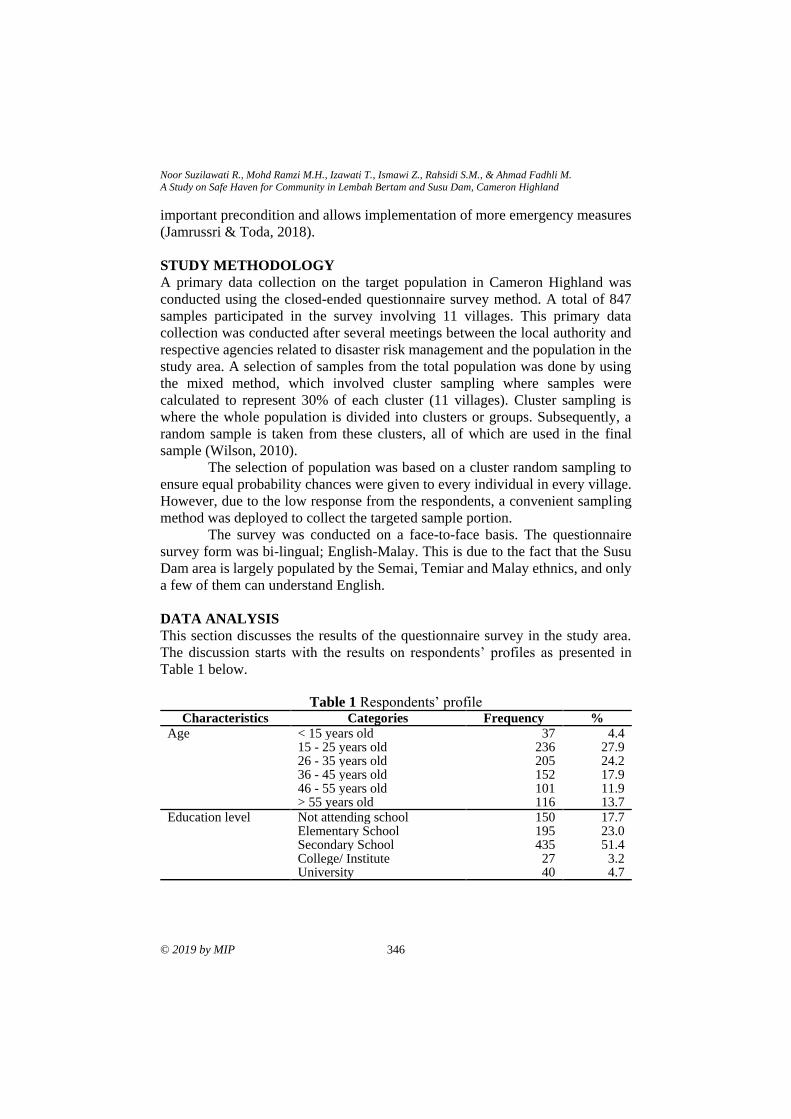
Noor Suzilawati R., Mohd Ramzi M.H., Izawati T., Ismawi Z., Rahsidi S.M., & Ahmad Fadhli M.
A Study on Safe Haven for Community in Lembah Bertam and Susu Dam, Cameron Highland
© 2019 by MIP 346
important precondition and allows implementation of more emergency measures
(Jamrussri & Toda, 2018).
STUDY METHODOLOGY
A primary data collection on the target population in Cameron Highland was
conducted using the closed-ended questionnaire survey method. A total of 847
samples participated in the survey involving 11 villages. This primary data
collection was conducted after several meetings between the local authority and
respective agencies related to disaster risk management and the population in the
study area. A selection of samples from the total population was done by using
the mixed method, which involved cluster sampling where samples were
calculated to represent 30% of each cluster (11 villages). Cluster sampling is
where the whole population is divided into clusters or groups. Subsequently, a
random sample is taken from these clusters, all of which are used in the final
sample (Wilson, 2010).
The selection of population was based on a cluster random sampling to
ensure equal probability chances were given to every individual in every village.
However, due to the low response from the respondents, a convenient sampling
method was deployed to collect the targeted sample portion.
The survey was conducted on a face-to-face basis. The questionnaire
survey form was bi-lingual; English-Malay. This is due to the fact that the Susu
Dam area is largely populated by the Semai, Temiar and Malay ethnics, and only
a few of them can understand English.
DATA ANALYSIS
This section discusses the results of the questionnaire survey in the study area.
The discussion starts with the results on respondents’ profiles as presented in
Table 1 below.
Table 1 Respondents’ profile Characteristics Categories Frequency %
Age < 15 years old 37 4.4 15 - 25 years old 236 27.9 26 - 35 years old 205 24.2 36 - 45 years old 152 17.9 46 - 55 years old 101 11.9 > 55 years old 116 13.7
Education level Not attending school 150 17.7 Elementary School 195 23.0 Secondary School 435 51.4 College/ Institute 27 3.2 University 40 4.7
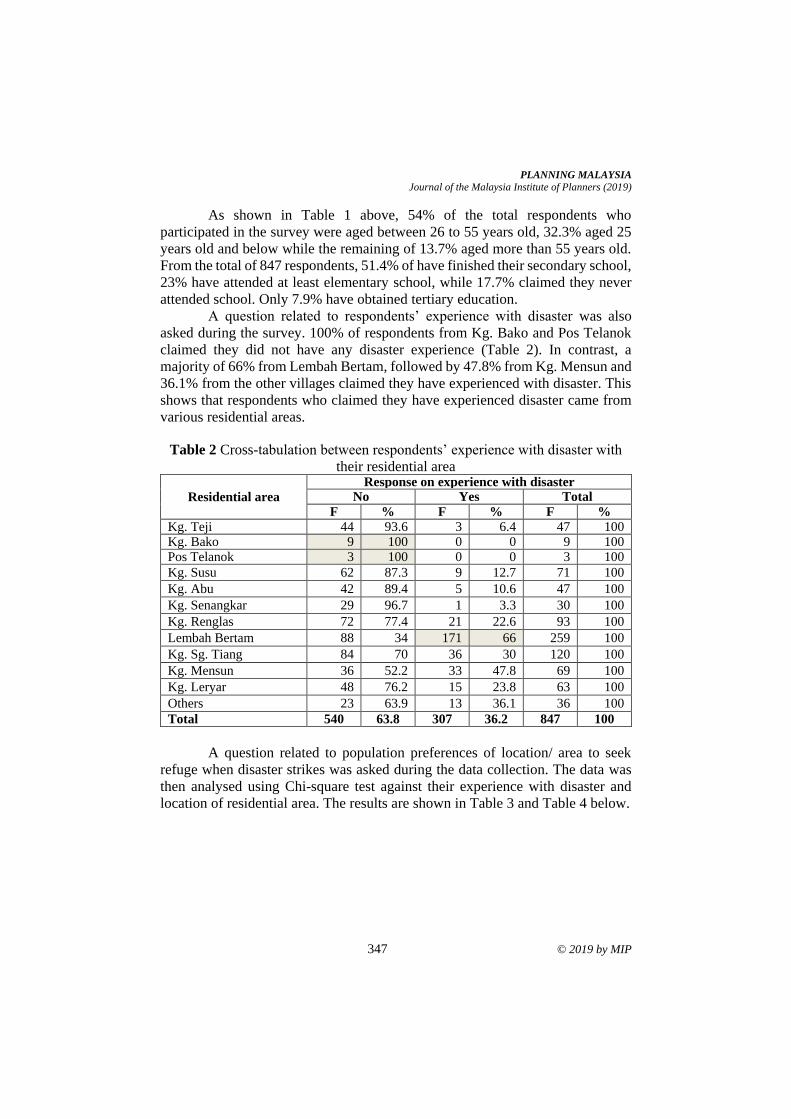
PLANNING MALAYSIA
Journal of the Malaysia Institute of Planners (2019)
347 © 2019 by MIP
As shown in Table 1 above, 54% of the total respondents who
participated in the survey were aged between 26 to 55 years old, 32.3% aged 25
years old and below while the remaining of 13.7% aged more than 55 years old.
From the total of 847 respondents, 51.4% of have finished their secondary school,
23% have attended at least elementary school, while 17.7% claimed they never
attended school. Only 7.9% have obtained tertiary education.
A question related to respondents’ experience with disaster was also
asked during the survey. 100% of respondents from Kg. Bako and Pos Telanok
claimed they did not have any disaster experience (Table 2). In contrast, a
majority of 66% from Lembah Bertam, followed by 47.8% from Kg. Mensun and
36.1% from the other villages claimed they have experienced with disaster. This
shows that respondents who claimed they have experienced disaster came from
various residential areas.
Table 2 Cross-tabulation between respondents’ experience with disaster with
their residential area
Residential area
Response on experience with disaster No Yes Total
F % F % F %
Kg. Teji 44 93.6 3 6.4 47 100 Kg. Bako 9 100 0 0 9 100 Pos Telanok 3 100 0 0 3 100
Kg. Susu 62 87.3 9 12.7 71 100
Kg. Abu 42 89.4 5 10.6 47 100
Kg. Senangkar 29 96.7 1 3.3 30 100
Kg. Renglas 72 77.4 21 22.6 93 100
Lembah Bertam 88 34 171 66 259 100
Kg. Sg. Tiang 84 70 36 30 120 100
Kg. Mensun 36 52.2 33 47.8 69 100
Kg. Leryar 48 76.2 15 23.8 63 100
Others 23 63.9 13 36.1 36 100
Total 540 63.8 307 36.2 847 100
A question related to population preferences of location/ area to seek
refuge when disaster strikes was asked during the data collection. The data was
then analysed using Chi-square test against their experience with disaster and
location of residential area. The results are shown in Table 3 and Table 4 below.
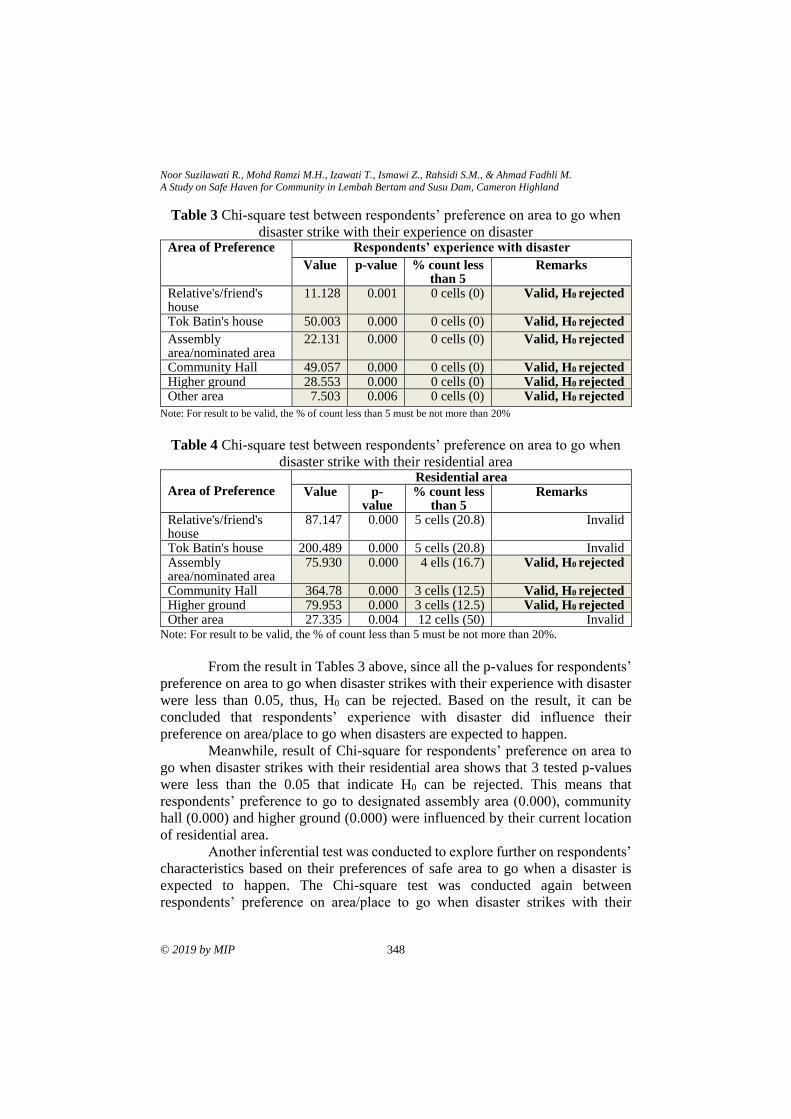
Noor Suzilawati R., Mohd Ramzi M.H., Izawati T., Ismawi Z., Rahsidi S.M., & Ahmad Fadhli M.
A Study on Safe Haven for Community in Lembah Bertam and Susu Dam, Cameron Highland
© 2019 by MIP 348
Table 3 Chi-square test between respondents’ preference on area to go when
disaster strike with their experience on disaster Area of Preference
Respondents’ experience with disaster
Value p-value % count less than 5
Remarks
Relative's/friend's house
11.128 0.001 0 cells (0) Valid, H0 rejected
Tok Batin's house 50.003 0.000 0 cells (0) Valid, H0 rejected
Assembly area/nominated area
22.131
0.000 0 cells (0) Valid, H0 rejected
Community Hall 49.057 0.000 0 cells (0) Valid, H0 rejected Higher ground 28.553 0.000 0 cells (0) Valid, H0 rejected Other area 7.503 0.006 0 cells (0) Valid, H0 rejected
Note: For result to be valid, the % of count less than 5 must be not more than 20%
Table 4 Chi-square test between respondents’ preference on area to go when
disaster strike with their residential area Area of Preference
Residential area Value p-
value % count less
than 5 Remarks
Relative's/friend's house
87.147
0.000 5 cells (20.8) Invalid
Tok Batin's house 200.489 0.000 5 cells (20.8) Invalid Assembly area/nominated area
75.930
0.000 4 ells (16.7) Valid, H0 rejected
Community Hall 364.78 0.000 3 cells (12.5) Valid, H0 rejected Higher ground 79.953 0.000 3 cells (12.5) Valid, H0 rejected Other area 27.335 0.004 12 cells (50) Invalid
Note: For result to be valid, the % of count less than 5 must be not more than 20%.
From the result in Tables 3 above, since all the p-values for respondents’
preference on area to go when disaster strikes with their experience with disaster
were less than 0.05, thus, H0 can be rejected. Based on the result, it can be
concluded that respondents’ experience with disaster did influence their
preference on area/place to go when disasters are expected to happen.
Meanwhile, result of Chi-square for respondents’ preference on area to
go when disaster strikes with their residential area shows that 3 tested p-values
were less than the 0.05 that indicate H0 can be rejected. This means that
respondents’ preference to go to designated assembly area (0.000), community
hall (0.000) and higher ground (0.000) were influenced by their current location
of residential area.
Another inferential test was conducted to explore further on respondents’
characteristics based on their preferences of safe area to go when a disaster is
expected to happen. The Chi-square test was conducted again between
respondents’ preference on area/place to go when disaster strikes with their
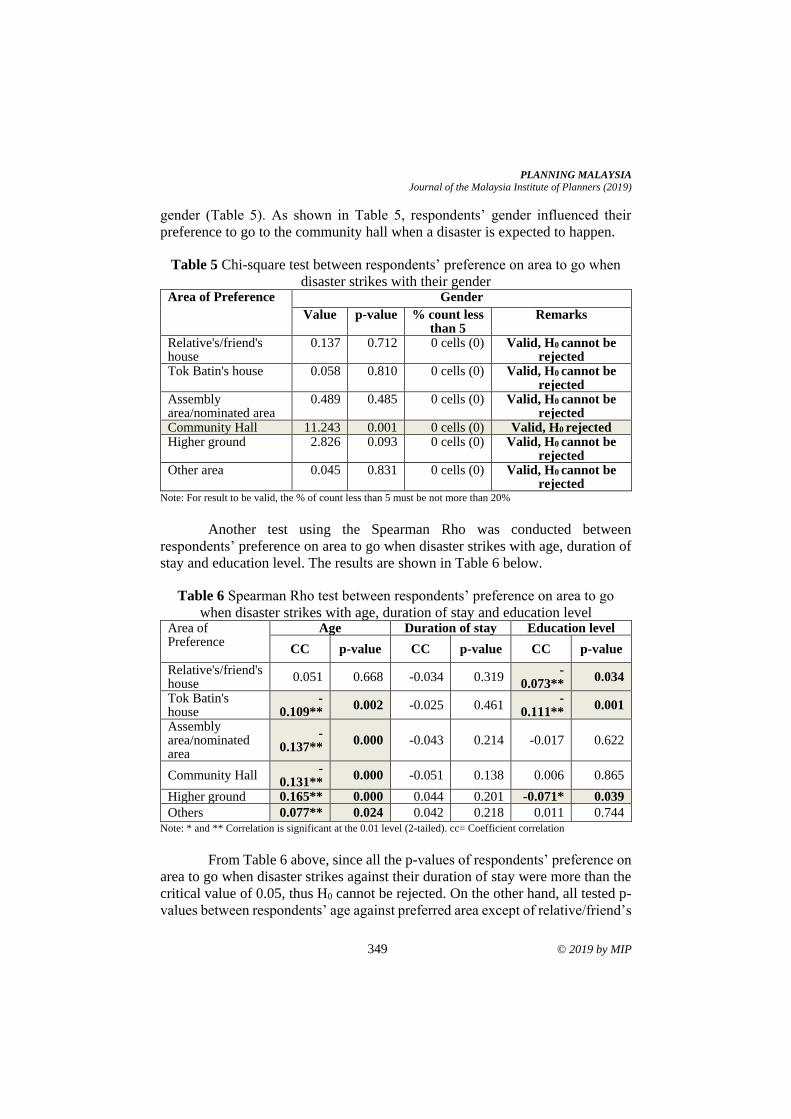
PLANNING MALAYSIA
Journal of the Malaysia Institute of Planners (2019)
349 © 2019 by MIP
gender (Table 5). As shown in Table 5, respondents’ gender influenced their
preference to go to the community hall when a disaster is expected to happen.
Table 5 Chi-square test between respondents’ preference on area to go when
disaster strikes with their gender Area of Preference
Gender
Value p-value % count less than 5
Remarks
Relative's/friend's house
0.137 0.712 0 cells (0) Valid, H0 cannot be rejected
Tok Batin's house 0.058 0.810 0 cells (0) Valid, H0 cannot be rejected
Assembly area/nominated area
0.489 0.485 0 cells (0) Valid, H0 cannot be rejected
Community Hall 11.243 0.001 0 cells (0) Valid, H0 rejected Higher ground 2.826 0.093 0 cells (0) Valid, H0 cannot be
rejected Other area 0.045 0.831 0 cells (0) Valid, H0 cannot be
rejected Note: For result to be valid, the % of count less than 5 must be not more than 20%
Another test using the Spearman Rho was conducted between
respondents’ preference on area to go when disaster strikes with age, duration of
stay and education level. The results are shown in Table 6 below.
Table 6 Spearman Rho test between respondents’ preference on area to go
when disaster strikes with age, duration of stay and education level Area of Preference
Age Duration of stay Education level
CC p-value CC p-value CC p-value
Relative's/friend's house
0.051 0.668 -0.034 0.319 -
0.073** 0.034
Tok Batin's house
-0.109**
0.002 -0.025 0.461 -
0.111** 0.001
Assembly area/nominated area
-0.137**
0.000 -0.043 0.214 -0.017 0.622
Community Hall -
0.131** 0.000 -0.051 0.138 0.006 0.865
Higher ground 0.165** 0.000 0.044 0.201 -0.071* 0.039
Others 0.077** 0.024 0.042 0.218 0.011 0.744 Note: * and ** Correlation is significant at the 0.01 level (2-tailed). cc= Coefficient correlation
From Table 6 above, since all the p-values of respondents’ preference on
area to go when disaster strikes against their duration of stay were more than the
critical value of 0.05, thus H0 cannot be rejected. On the other hand, all tested p-
values between respondents’ age against preferred area except of relative/friend’s
Noor Suzilawati R., Mohd Ramzi M.H., Izawati T., Ismawi Z., Rahsidi S.M., & Ahmad Fadhli M.
A Study on Safe Haven for Community in Lembah Bertam and Susu Dam, Cameron Highland
© 2019 by MIP 350
house are less than 0.05, thus H0 can be rejected. In addition, p-values for
respondents’ preference area of relative/ friend’s house (0.034), Tok Batin’s
house (0.001) and higher ground (0.039) against their education level are less
than 0.05, thus H0 also can be rejected. The result shows that there is a positive
and low relationship between the variables which indicates the older the
respondents’ were, the more they preferred to go to higher ground (0.165**) and
others (0.077**) as the option to choose when disaster strikes.
On the other hand, the negative relationship between respondents’ age
against preference to go to Tok Batin’s house (-0.109**), identified assembly
area (-0.137**), community hall (-0.131**) and respondents’ education level
against their preference to go relative/ friend’s house (-0.073**), Tok Batin’s
house (-0.111**) and higher ground (-0.071*) points out that the more their age
increased or the higher their education level, the more they disagreed over the
preferred area chosen as a safe area when disaster strikes.
FINDINGS AND CONCLUSION
Overall, 66% respondents from Lembah Bertam, 47.8% from Kg. Mensun and
36.1% from the other villages claimed they have experienced with disaster. From
the result of the Chi-square, respondents’ experience with disaster did influence
their preference on area/location to seek refuge during a disaster. In addition,
other test reveals that respondents’ preference to go to a designated assembly
area, community hall and higher ground were influenced by their current location
of residential/village area. Moreover, respondents’ gender also influenced their
preference to go to community hall in the event of a disaster. Another test using
the Spearman Rho was conducted and revealed that there is a positive and low
relationship showing respondents’ who are older preferred to go to higher ground
and other areas when disaster strikes. In contrast, the results showing the negative
relationship show younger respondents’ preferred to go to Tok Batin’s house,
identified assembly area, community hall. In addition, the lower their education
level, the more they preferred to go a relative/friend’s house, Tok Batin’s house
and higher ground.
Findings from the results show that the involvement of various
government agencies and the non-governmental sector in executing disaster
management is crucial. In order to increase the awareness of an affected
community, preparedness programme aimed at minimising the risks caused by
natural disasters should be facilitated through various programmes and medium.
Awareness and preparedness campaign should also take into consideration of
multi-characteristics of the population in ensuring the successfulness outcome of
the disaster risk management program. In addition, the lack of information on
hazard related risks, vulnerabilities and the preparedness actions to local
communities could be the main hindrance to garnering community action. Thus,
PLANNING MALAYSIA
Journal of the Malaysia Institute of Planners (2019)
351 © 2019 by MIP
the establishment and promotion of such information should be actively
organised in disaster prone areas.
ACKNOWLEDGMENT
This study was conducted under a consultancy project in collaboration with
Tenaga Nasional Berhad Research (TNBR).
REFERENCES Asian Disaster Preparedness Center (ADPC). (2007). Child-oriented participatory risk
assessment and planning: A toolkit. Thailand: Asian Disaster Preparedness Center.
Ashar, F., Amaratunga, D., & Haigh, R. (2014). The analysis of tsunami vertical shelter
in Padang city. Procedia Economics and Finance, 18, 916-923.
Cheng, C., Qian, X., & Zhang, Y. (2011). Estimation of the evacuation clearance time
based on dam-break simulation of the Huaxi dam in Southwestern China. Natural
Hazards, 57(2), 227-243.
Cova, T. J., & Johnson, J. P. (2003). A network flow model for lane-based evacuation
routing. Transportation Research Part A, 37, 579-604.
Isahak, A., Reza, M. I. H., Siwar, C., Ismail, S. M., Sulaiman, N., Hanafi, Z., Zainuddin,
M. S., & Taha, M. R. (2018). Delineating risk zones and evaluation of shelter
centres for flood disaster management along the Pahang River Basin, Malaysia.
Jamba, 10(1), 501.
Jamrussri, S., & Toda, Y. (2018). Available flood evacuation time for high-risk areas in
the middle reach of Chao Phraya River Basin. Water, 2, 1-23.
Kolen, B., & Helshoot, I. (2012). Time needed to evacuate the Netherlands in the event
of large-scale flooding: Strategies and consequences. Disasters, 36, 700-722.
Mat Rasul, R., & Darus, M. M. (2016). Temporary evacuation and relief centre design
management in Malaysia: An Overview. In 3rd ISME International Colloquium,
December 27-28, 2016, Melaka, Malaysia.
Pannier, R. (2016). Ensuring safety of people in case of severe floods: Feasibility and
relevance of vertical evacuation strategies in high population density. E3S Web of
Conferences, 7, 19004.
Sampath, P. (2001). Vulnerability reduction at community level: The New Global
Paradigm, In: Pradeep, S., Akka, D., & Uma, M. (eds), Disaster Mitigation
Experiences and Reflections. New Delhi, India: Prentice Hall of India Pvt Ltd.
Seag, D., Hong, S. J., Park, H. S., Kim, D. S., Hong, S. J., & Park, H. S. (2013). Analysis
of evacuation system on tsunami disaster prevention in Korea. Journal of Coastal
Research, 65, 974-979
UNISDR. (2004). On-Line conference: Priority areas to implement disaster risk
reduction. Retrieved June 27, 2019, from https://www.unisdr.org/2004/wcdr-
dialogue/terminology.htm
Wilson, J. (2010). Essentials of business research: A guide to doing your research project.
Thousand Oaks: SAGE Publication
Received: 20th July 2019. Accepted:3rd August 2019
1Assosiate Professor at International Islamic University Malaysia. Email: mariana @iium.edu.my 352
PLANNING MALAYSIA:
Journal of the Malaysian Institute of Planners
VOLUME 17 ISSUE 2 (2019), Page 352 – 360
QUALITY OF LIFE ASSESSMENT BASED ON ECONOMIC WELL-
BEING PERSPECTIVE: A CASE STUDY OF JOHOR BAHRU AND
PETALING, SELANGOR
Mariana Mohamed Osman1, Nur Farhanah Rosli2 & Noor Suzilawati Rabe3
1,2,3Kuliyyah of Architecture and Environmental Design
INTERNATIONAL ISLAMIC UNIVERSITY MALAYSIA
Abstract
The definition of quality of life is varied. Different individuals may perceive the
quality of life in a different form of other individuals. Over more than four
decades, Malaysia has made remarkable achievements regarding its economic
growth as well as its socio-economic development. Numerous factors have been
identified that may influence the quality of life of the people according to their
personal preferences. This article assessed the perception of 100 respondent's
lives in two major cities in Malaysia namely Johor Bharu and Petaling. These
cities are also the major district in Johor Darul Takzim and Selangor Darul Ehsan.
These study also would be focusing on the economic well-being of the individual.
The economic individual is economic capacity, transportation, living condition
and educational satisfaction.
Keyword: Quality of life, Economic well-being, Selangor, Johor
PLANNING MALAYSIA
Journal of the Malaysia Institute of Planners (2019)
353 © 2019 by MIP
INTRODUCTION
Improving the quality of life (QOL) of the itizen has always been the main focus
of the Malaysian government and it has been one of the main agendas in the 11th
Malaysia Plan 2016-2020. Generally, QOL is about the extent to which human
needs are fulfilled concerning their perception of subjective well-being. Thus, it
is the role of policymakers and professionals to provide opportunities for people
to be able to meet their desired well-being (Costanza et al., 2005). The World
Health Organization Quality of Life group define QOL as ‘individual’s
perception of their position in life in the context of the culture and value systems
in which they live and with their goals, expectations, standards and concerns’
(Phillips, 2006, p.23). Similarly, several authors (Zainal et al., 2012; Gilgeous,
1998) see QOL as the satisfaction of people over various dimensions including
material, education, security, physical and living environment that affected by
their perception on what they refer as the ideal life. Serag El-Din et. al (2012),
described the quality of life as a complex concept that might be defined by various
disciplinary. The term ‘quality of life’ is used solely to describe some physical
features, but it describes all types of relationship, dynamics and the reticular
relationship that relates to physical features.
LITERATURE REVIEW
The word ‘quality’ as defined by Oxford Dictionary refers to a standard of
something that could be measured against things of a similar kind. In other words,
it is the degree of excellent on something. Whilst, quality of life as also
encompassing personal advancements, a healthy lifestyle, access and freedom to
pursue knowledge, and attainment to a standard of living which surpasses the
fulfilment of the basic and psychological needs of the individual in order to
achieve social well-being compatible with the nation’s aspirations (Economic
Planning Unit, 2004). Other than that, quality of life also defines as an individual's
perception of their position in life in the context of the culture and value systems
in which they live and about their goals, expectations, standards and concerns. It
is a broad-ranging concept affected in a complex way by the person's physical
health, psychological state, personal beliefs, social relationships and their
relationship to salient features of their environment (World Health Organization,
2012). QOL is the subject of academic debate in various fields particularly in
economics, the field of happiness studies, a research area shared with
psychologists and sociologists (Rabe, Osman, Bachok, Rosli, & Abdullah, 2018).
The concept of quality of life is complex because it includes
multidimensional of contributory facets such as housing, education, work and
environment (Garcia-Mira, Uzzell, Real, & Romay, 2005; Serag El Din et al.,
2012). Serag El Din et al. (2012) also agree that quality of life requires multiple
approaches from different theoretical perspectives. However, Yahaya (2015)
explains that the rapid economic growth reflects the high quality of life for the
Mariana Mohamed Osman, Nur Farhanah Rosli & Noor Suzilawati Rabe
Perceiving quality of life in terms of economic well-being: Johor Bahru vs Petaling
© 2019 by MIP 354
people in a country where all population should have an equal opportunity to
enjoy the amenities provided by their government.
Generally, Malaysia Quality of Life (MQLI) report was first produced in
1999 until the year 2011. Throughout these years, the major changes in the
indicators are including the growing of 10 measurements (in 1999) to 11 major
measurements in 2011. Meanwhile, in 2013, the quality of life measurement
report was rebranded and introduced as Malaysia Well-Being Index Report
consisting of 14 major quality of life measurements. The latest report was more
organized with the classification of both economic and social well-being.
Components in Economic well-being namely transportation, communications,
education, income and distribution and working life.
RESEARCH METHODOLOGY
This study involves the economic well-being sectors in two major districts in
Malaysia namely Petaling Jaya district and Johor Bahru district. Petaling is one
of the major districts in Selangor meanwhile Johor Bahru is the capital city of
Johor. Both Johor and Selangor are among the states in Malaysia that
experienced rapid development progress. According to the Department of
Statistic Malaysia (2016), Johor hold the highest GDP in Malaysia as compared
to the other states. In terms of population number, the population in Johor Bahru
was 1,345,191 whilst Petaling was 1,782,375 (DOSM, 2016).
In this research, the method used was quantitative and qualitative. For
qualitative research, review of literature, journals, published data from various
secondary sources was employed. Driven by the objective formulated based on
qualitative analysis, a quantitative method was used to answer the research
question. Through questionnaire survey form, the questions were designed to
measure respondents’ scale of preferences on how they perceived their current
economic well-being quality. Random sampling was adopted in selecting the
number of respondents from both districts. However, due to the low number of
participation from the target population, a convenient sampling method was used
that was based on the availability and willingness of respondents. A total of 100
respondents were chosen from both districts and a scale using of 0-10 weas used
to measure their perception towards the quality of life.
Specifically, in referring to the Malaysian well-being Index Report, this
study focusses on the elements in economic well-being in this study namely
economic capacity, transportation, living condition and education satisfaction.
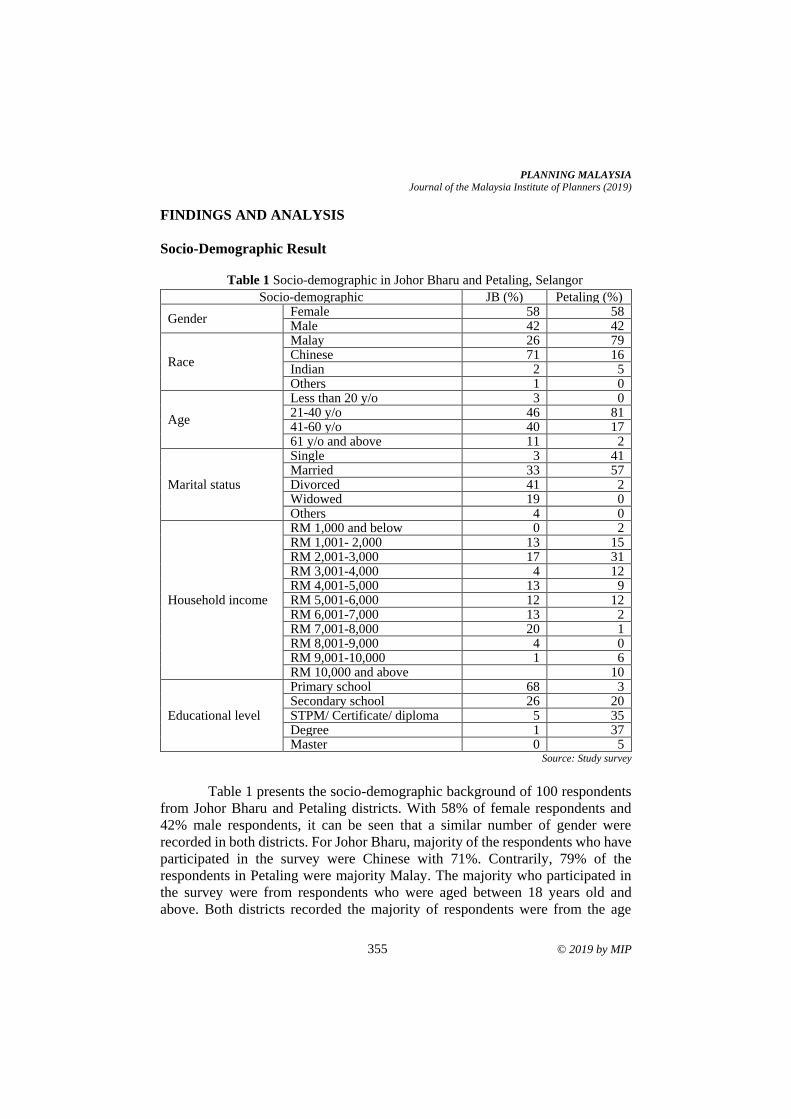
PLANNING MALAYSIA
Journal of the Malaysia Institute of Planners (2019)
355 © 2019 by MIP
FINDINGS AND ANALYSIS
Socio-Demographic Result
Table 1 Socio-demographic in Johor Bharu and Petaling, Selangor
Socio-demographic JB (%) Petaling (%)
Gender Female 58 58 Male 42 42
Race
Malay 26 79 Chinese 71 16 Indian 2 5 Others 1 0
Age
Less than 20 y/o 3 0 21-40 y/o 46 81 41-60 y/o 40 17 61 y/o and above 11 2
Marital status
Single 3 41 Married 33 57 Divorced 41 2 Widowed 19 0 Others 4 0
Household income
RM 1,000 and below 0 2 RM 1,001- 2,000 13 15 RM 2,001-3,000 17 31 RM 3,001-4,000 4 12 RM 4,001-5,000 13 9 RM 5,001-6,000 12 12 RM 6,001-7,000 13 2 RM 7,001-8,000 20 1 RM 8,001-9,000 4 0 RM 9,001-10,000 1 6 RM 10,000 and above 10
Educational level
Primary school 68 3 Secondary school 26 20 STPM/ Certificate/ diploma 5 35 Degree 1 37 Master 0 5
Source: Study survey
Table 1 presents the socio-demographic background of 100 respondents
from Johor Bharu and Petaling districts. With 58% of female respondents and
42% male respondents, it can be seen that a similar number of gender were
recorded in both districts. For Johor Bharu, majority of the respondents who have
participated in the survey were Chinese with 71%. Contrarily, 79% of the
respondents in Petaling were majority Malay. The majority who participated in
the survey were from respondents who were aged between 18 years old and
above. Both districts recorded the majority of respondents were from the age
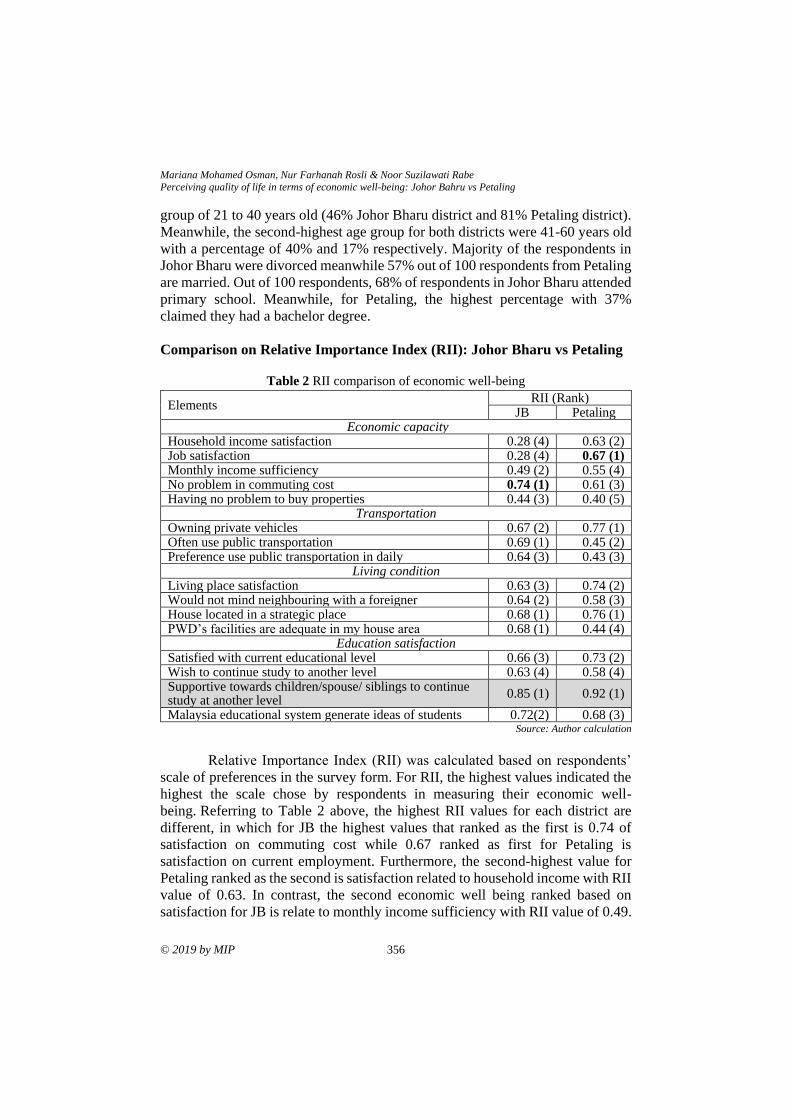
Mariana Mohamed Osman, Nur Farhanah Rosli & Noor Suzilawati Rabe
Perceiving quality of life in terms of economic well-being: Johor Bahru vs Petaling
© 2019 by MIP 356
group of 21 to 40 years old (46% Johor Bharu district and 81% Petaling district).
Meanwhile, the second-highest age group for both districts were 41-60 years old
with a percentage of 40% and 17% respectively. Majority of the respondents in
Johor Bharu were divorced meanwhile 57% out of 100 respondents from Petaling
are married. Out of 100 respondents, 68% of respondents in Johor Bharu attended
primary school. Meanwhile, for Petaling, the highest percentage with 37%
claimed they had a bachelor degree.
Comparison on Relative Importance Index (RII): Johor Bharu vs Petaling
Table 2 RII comparison of economic well-being
Elements RII (Rank)
JB Petaling Economic capacity
Household income satisfaction 0.28 (4) 0.63 (2) Job satisfaction 0.28 (4) 0.67 (1) Monthly income sufficiency 0.49 (2) 0.55 (4) No problem in commuting cost 0.74 (1) 0.61 (3) Having no problem to buy properties 0.44 (3) 0.40 (5)
Transportation Owning private vehicles 0.67 (2) 0.77 (1) Often use public transportation 0.69 (1) 0.45 (2) Preference use public transportation in daily 0.64 (3) 0.43 (3)
Living condition Living place satisfaction 0.63 (3) 0.74 (2) Would not mind neighbouring with a foreigner 0.64 (2) 0.58 (3) House located in a strategic place 0.68 (1) 0.76 (1) PWD’s facilities are adequate in my house area 0.68 (1) 0.44 (4)
Education satisfaction Satisfied with current educational level 0.66 (3) 0.73 (2) Wish to continue study to another level 0.63 (4) 0.58 (4) Supportive towards children/spouse/ siblings to continue study at another level
0.85 (1) 0.92 (1)
Malaysia educational system generate ideas of students 0.72(2) 0.68 (3) Source: Author calculation
Relative Importance Index (RII) was calculated based on respondents’
scale of preferences in the survey form. For RII, the highest values indicated the
highest the scale chose by respondents in measuring their economic well-
being. Referring to Table 2 above, the highest RII values for each district are
different, in which for JB the highest values that ranked as the first is 0.74 of
satisfaction on commuting cost while 0.67 ranked as first for Petaling is
satisfaction on current employment. Furthermore, the second-highest value for
Petaling ranked as the second is satisfaction related to household income with RII
value of 0.63. In contrast, the second economic well being ranked based on
satisfaction for JB is relate to monthly income sufficiency with RII value of 0.49.
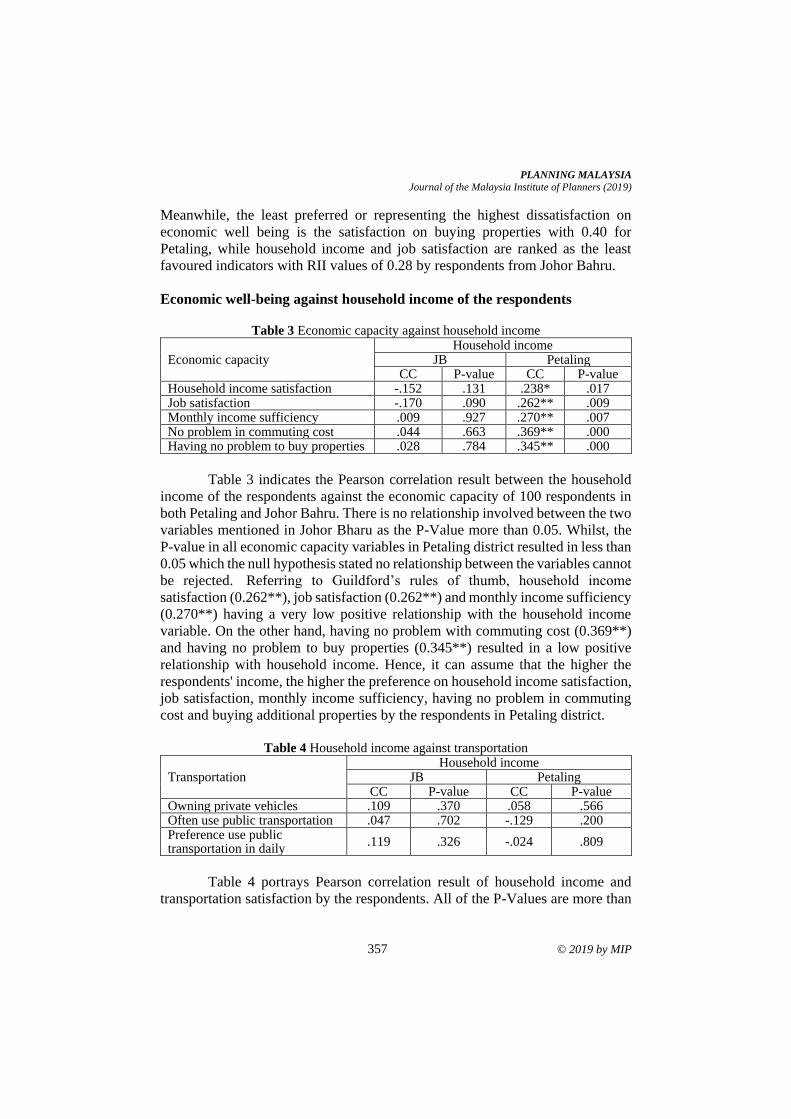
PLANNING MALAYSIA
Journal of the Malaysia Institute of Planners (2019)
357 © 2019 by MIP
Meanwhile, the least preferred or representing the highest dissatisfaction on
economic well being is the satisfaction on buying properties with 0.40 for
Petaling, while household income and job satisfaction are ranked as the least
favoured indicators with RII values of 0.28 by respondents from Johor Bahru.
Economic well-being against household income of the respondents
Table 3 Economic capacity against household income
Economic capacity Household income
JB Petaling CC P-value CC P-value
Household income satisfaction -.152 .131 .238* .017 Job satisfaction -.170 .090 .262** .009 Monthly income sufficiency .009 .927 .270** .007 No problem in commuting cost .044 .663 .369** .000 Having no problem to buy properties .028 .784 .345** .000
Table 3 indicates the Pearson correlation result between the household
income of the respondents against the economic capacity of 100 respondents in
both Petaling and Johor Bahru. There is no relationship involved between the two
variables mentioned in Johor Bharu as the P-Value more than 0.05. Whilst, the
P-value in all economic capacity variables in Petaling district resulted in less than
0.05 which the null hypothesis stated no relationship between the variables cannot
be rejected. Referring to Guildford’s rules of thumb, household income
satisfaction (0.262**), job satisfaction (0.262**) and monthly income sufficiency
(0.270**) having a very low positive relationship with the household income
variable. On the other hand, having no problem with commuting cost (0.369**)
and having no problem to buy properties (0.345**) resulted in a low positive
relationship with household income. Hence, it can assume that the higher the
respondents' income, the higher the preference on household income satisfaction,
job satisfaction, monthly income sufficiency, having no problem in commuting
cost and buying additional properties by the respondents in Petaling district.
Table 4 Household income against transportation
Transportation Household income
JB Petaling CC P-value CC P-value
Owning private vehicles .109 .370 .058 .566 Often use public transportation .047 .702 -.129 .200 Preference use public transportation in daily
.119 .326 -.024 .809
Table 4 portrays Pearson correlation result of household income and
transportation satisfaction by the respondents. All of the P-Values are more than
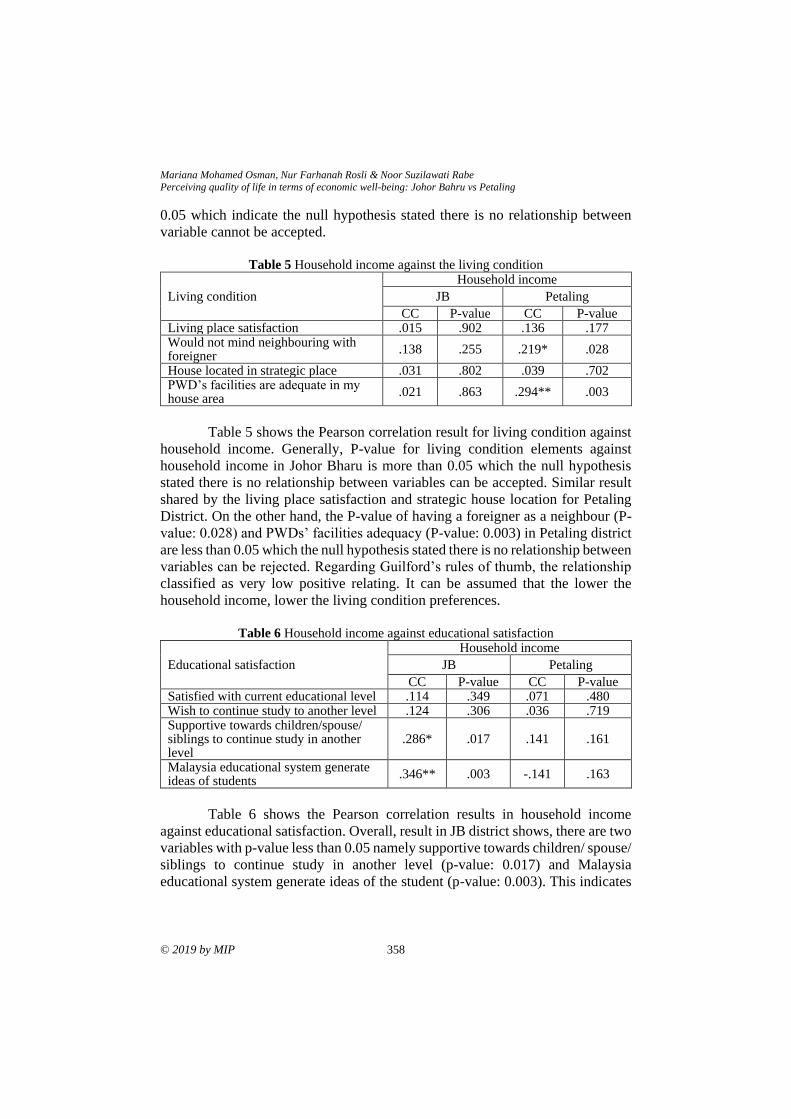
Mariana Mohamed Osman, Nur Farhanah Rosli & Noor Suzilawati Rabe
Perceiving quality of life in terms of economic well-being: Johor Bahru vs Petaling
© 2019 by MIP 358
0.05 which indicate the null hypothesis stated there is no relationship between
variable cannot be accepted.
Table 5 Household income against the living condition
Living condition
Household income
JB Petaling
CC P-value CC P-value Living place satisfaction .015 .902 .136 .177 Would not mind neighbouring with foreigner
.138 .255 .219* .028
House located in strategic place .031 .802 .039 .702 PWD’s facilities are adequate in my house area
.021 .863 .294** .003
Table 5 shows the Pearson correlation result for living condition against
household income. Generally, P-value for living condition elements against
household income in Johor Bharu is more than 0.05 which the null hypothesis
stated there is no relationship between variables can be accepted. Similar result
shared by the living place satisfaction and strategic house location for Petaling
District. On the other hand, the P-value of having a foreigner as a neighbour (P-
value: 0.028) and PWDs’ facilities adequacy (P-value: 0.003) in Petaling district
are less than 0.05 which the null hypothesis stated there is no relationship between
variables can be rejected. Regarding Guilford’s rules of thumb, the relationship
classified as very low positive relating. It can be assumed that the lower the
household income, lower the living condition preferences.
Table 6 Household income against educational satisfaction
Educational satisfaction
Household income
JB Petaling
CC P-value CC P-value Satisfied with current educational level .114 .349 .071 .480 Wish to continue study to another level .124 .306 .036 .719 Supportive towards children/spouse/ siblings to continue study in another level
.286* .017 .141 .161
Malaysia educational system generate ideas of students
.346** .003 -.141 .163
Table 6 shows the Pearson correlation results in household income
against educational satisfaction. Overall, result in JB district shows, there are two
variables with p-value less than 0.05 namely supportive towards children/ spouse/
siblings to continue study in another level (p-value: 0.017) and Malaysia
educational system generate ideas of the student (p-value: 0.003). This indicates
PLANNING MALAYSIA
Journal of the Malaysia Institute of Planners (2019)
359 © 2019 by MIP
that the null hypothesis stated that there is no relationship between these variables
can e rejected.
On the other hand, p-value in all educational satisfaction variables in
Petaling is more than 0.05 which the null hypothesis stated there is no relationship
between variables can be accepted.
CONCLUSION
In conclusion, from the RII result, it shows that the respondents in both major
cities in Malaysia perceiving their quality of life in terms of economic well-being.
It can be seen that both cities perceiving the quality of life in their form which
resulted in the different result for both cities. From the result also, it can be
assumed that even though respondents in Johor Bharu least satisfied with the
household income and their job, respondents in Petaling perceiving both of these
elements as the most satisfying elements in economic capacity. Meanwhile, when
the respondents in Johor Bharu satisfied with their monthly commuting cost,
respondents in Petaling perceive it the other way around.
Hence, it can be concluded that to distinguish the quality of life in any
terms it is based on the individual or the community itself since the quality of life
contains border concept which affects the individual in terms of surrounding, the
economy as well as the community. Quality of life study should be focusing on
cross-cultural and regional differences or similarities in different parts of the
world (Mohit, 2014). While economic growth leads to improvements in the
quality of life, a better quality of life enables the population to participate more
fully in economic development (Holdstock & Rowson, 2005).
REFERENCES Costanza, R. et al. (2005). Quality of life: An approach integrating opportunities, human
needs, and subjective well-being. Ecological Economics, 61(1), 267-276.
Economic Planning Unit (2004). Malaysia Quality of Life Report, 2004.
Garcia-Mira, R., Uzzell, D. L., Real, J. E., & Romay, J. (2005). Housing, space and
quality of life.
Gilgeous, V. (1998). The quality of work life. Integrated Manufacturing System, 9(1),
173-181.
Holdstock, D., & Rowson, M. (2005). Malaysia: Achieving the Millennium Development
Goals: Successes and challenges. United Nations Country Team, Malaysia.
Lora, E. et al. (2010). The quality of life in Latin American cities: Markets and perception.
The Inter-American Development Bank.
Mohit, M. A. (2014). Present trends and future directions of quality-of-life. Procedia -
Social and Behavioral Sciences, 153, 655–665.
Phillips D. (2006) Quality of life: Concept, policy and practice. London: Routledge
Rabe, N. S., Osman, M. M., Bachok, S., Rosli, N. F., & Abdullah, M. F. (2018).
Perceptual study on conventional quality of life indicators. Planning Malaysia
Journal, 16(5), 303-313.

Mariana Mohamed Osman, Nur Farhanah Rosli & Noor Suzilawati Rabe
Perceiving quality of life in terms of economic well-being: Johor Bahru vs Petaling
© 2019 by MIP 360
Serag el din, H. et al. (2013). Principles of urban quality of life for a neighborhood. HBRC
Journal, 9(1), 86-92.
WHO. (2012). WHOQOL. Retrieved from http://www.who.int/healthinfo/
global_burden_ disease/estimates/en/index1.html
Yahaya, A. S., & Selvaratnam, D. P. (2015). Relationship between Malaysian quality of
life and gross domestic product. Kuala Lumpur International Business,
Economics and Law Conference 6, 3, 978-967-11350-4-4.
Zainal, N. R., Kaur, G., Ahmad, N. A., & Khalili, J. M. (2012). Housing conditions and
quality of life of the urban poor in Malaysia. Procedia - Social and Behavioral
Sciences, 50, 827-838
Received: 12th January 2019. Accepted: 2nd August 2019
PLANNING MALAYSIA
Journal of the Malaysia Institute of Planners (2020)
193 © 2020 by MIP
NOTES TO CONTRIBUTORS AND GUIDELINES FOR MANUSCRIPT
SUBMISSION
INTRODUCTION
The Journal of the Malaysian Institute of Planners or PLANNING MALAYSIA is a
multidisciplinary journal related to theory, experiments, research, development,
applications of ICT, and practice of planning and development in Malaysia and
elsewhere.
The objective of the journal is to promote the activity of town planning through dialogue
and exchange of views concerning professional town planning practice. PLANNING
MALAYSIA will welcome any news, feature articles, or peer reviewed (including book
reviews, software review, etc.) articles for publication. All articles should be original
work by the authors. Articles, views and features will not be taken to be the official
view of the Malaysian Institute of Planners (MIP) unless it carries the name of MIP
as the author. This is to encourage open discussion on diverse issues and opinion for the
advancement of town planning practice. Articles and contributions will be accepted from
MIP members and non-members worldwide.
In year 2010, PLANNING MALAYSIA Journal has been indexed in SCOPUS. Previous
issues of PLANNING MALAYSIA Journal can be viewed on the MIP website.
SUBMISSION OF MANUSCRIPTS
Manuscript should be emailed to [email protected]. Manuscript should ideally be
in the range of 8-10 pages long. Each manuscript should have a title page and an abstract
of about 150 words. The title page should contain the title, full name(s), designation(s),
organizational affiliation(s), a contact address, and an email address. All manuscripts are
received on the understanding that they are not under concurrent consideration at another
journal. Exclusive copyright of accepted manuscripts shall be assigned to the Publisher
(i.e. the MIP), and in consideration for this, one copy of the current Journal will be
provided for each article. Additional reprints of article can be ordered, at cost, by the
author(s). PDF format of the article (if available) can be obtained from the Publisher.
LAYOUT
Manuscript should be typed in single spacing (including footnotes, endnotes and
references) on one side of the paper only (preferably A4) with the following margins:
right and left - 4.25 cm, top - 5.5 cm and bottom - 5.2 cm (including header – 4.5 cm and
footer – 4.3 cm) in 11 point Times New Roman font. Footnotes should be numbered
consecutively and placed at the end of the manuscript. Footnotes should be kept to a
minimum. Tables and diagrams should be provided in the text. References should follow
the APA (6th Edition) referencing format. All foreign words must be typed and
transliterated. The Editorial Board reserves the right to change the transliteration of all
historical names, titles and non-English terminology to bring them into conformity with
its own style.
Guidelines
© 2020 by MIP 194
USE OF FORMULA, FIGURES AND TABLES
Formula (mathematical formula) should be used only when necessary and the
CONCLUSION derived must be explained and made intelligible to a non-mathematical
reader. Wherever possible, authors are encouraged to place the mathematical parts of the
article in an appendix. In cases of empirical articles, authors are expected to make readily
available a complete set of data and any specialized computer programs to interested
readers.
All illustrations, figures and/or tables in the manuscript must be captioned, in clear black
and white (grayscale) and ready for reproduction.
REFEREEING PROCEDURE
Manuscripts will be acknowledged upon receipt. Only selected (preferred) manuscripts
will be reviewed by two (or three) referees in addition to the editors. Editorial decision
will normally be made within two to six months, but circumstances beyond control
occasionally dictate a longer cycle. If authors are invited to prepare a revision for further
consideration, the major issues to be resolved will be outlined and will be forwarded to
them as quickly as possible.
ACCEPTED ARTICLES
Authors of accepted articles will be requested to provide a digital copy of the manuscript,
preferably in Microsoft Word to the MIP (the Publisher) via email at
[email protected]. MIP will not be responsible for the loss or damage of the digital
copy.
COPYRIGHT
Copyright & Creative Commons Licence
eISSN: 0128-0945 © Year. The Authors. Published for Malaysia insititute of planner.
This is an open-access article under the CC BY-NC-ND license.
The authors hold the copyright without restrictions and also retain publishing rights
without restrictions.
Contact:
Editor-in-Chief
PLANNING MALAYSIA
Journal of the Malaysian Institute of Planners
B-01-02, Jalan SS7/13B, Aman Seri, Kelana Jaya,
47301, Petaling Jaya, Selangor Darul Ehsan, MALAYSIA
Tel: +603 78770637 Fax: +603 78779636
Email: [email protected]
Homepage: www.planningmalaysia.org
***
PLANNING MALAYSIA
Journal of the Malaysia Institute of Planners (2020)
195 © 2020 by MIP
ETHIC STATEMENT
The Journal of the Malaysia Institute of Planners or PLANNING MALAYSIA is a peer-
reviewed journal. This statement spells out ethical behaviour of all parties involved in the
act of publishing an article for this journal, i.e. the author, the peer-reviewer, the chief
editor and editors, and the publisher. This statement is based on COPE’s Best Practice
Guidelines for Journal Editors. URL: http://publicationethics.org/files/u2
/Best_Practice.pdf
DUTIES OF AUTHORS
Reporting Standards
Authors of original research should present an accurate account of the work done as well
as an objective discussion of its significance. Data of the research should be represented
accurately in the article. An article should contain sufficient detail and references to
permit others to replicate the work. Fraudulent or knowingly inaccurate statements
constitute unethical behaviour and are unacceptable.
Data Access and Retention
Authors may be asked to provide the raw data in connection with an article submitted for
editorial review, and should be prepared to provide public access to such, if practicable,
and should in any event be prepared to retain such data for a reasonable time after
publication.
Originality and Plagiarism
Authors should ensure that they have written entirely original works, and if the authors
have used the work and/or words of others this must be appropriately cited or quoted.
Such quotations and citations must be listed in the Reference at the end of the article.
Multiple Publication
An author should not in general publish manuscripts describing essentially the same
research in more than one journal or primary publication. Submitting the same manuscript
to more than one journal concurrently constitutes unethical publishing behaviour and is
unacceptable.
Acknowledgment of Sources
Proper acknowledgment of the work of others must always be given. Authors should cite
publications that have been influential in determining the nature of the reported work.
Authorship of the Paper
Authorship should be limited to those who have made a significant contribution to the
conception, design, execution, or interpretation of the study, and should be listed as co-
authors. Others who have participated in certain substantive aspects of the research
project, they should be acknowledged or listed as contributors.

Ethic Statement
© 2020 by MIP 196
Corresponding Author
Corresponding author is the author responsible for communicating with the journal for
publication. The corresponding author should ensure that all appropriate co-authors and
no inappropriate co-authors are included on the paper. All co-authors have seen and
approved the final version of the paper and have agreed to its submission for publication.
Acknowledgment of Funding Sources
Sources of funding for the research reported in the article should be duly acknowledged
at the end of the article.
Disclosure and Conflicts of Interest
All authors should disclose in their manuscript any financial or other substantive conflict
of interest that might be construed to influence the results or interpretation of their
manuscript.
Fundamental Errors in Published Works
When an author discovers a significant error or inaccuracy in his/her own published work,
it is the author’s obligation to promptly notify the journal editor or publisher and
cooperate with the editor to retract or correct the paper.
DUTIES OF REVIEWERS
Contribution of Peer Review
Peer review assists the chief editor and the editorial board in making editorial decisions
while editorial communications with the author may also assist the author in improving
the paper.
Unqualified to Review or Promptness
Any reviewer who feels unqualified to review the assigned manuscript or unable to
provide a prompt review should notify the editor and excuse himself/herself from the
review process.
Confidentiality
Manuscripts received for review must be treated as confidential documents. They must
not be shown to, or discussed with, others except as authorized by the chief editor.
Privileged information or ideas obtained through peer review must be kept confidential
and not used for personal advantage.
Standards of Objectivity
Reviews should be conducted objectively. There shall be no personal criticism of the
author. Reviewers should express their views clearly with supporting arguments.
Acknowledgment of Sources
Reviewers should identify relevant published work that has not been cited by the authors.
Any statement that had been previously reported elsewhere should be accompanied by
the relevant citation. A reviewer should also call to the chief editor's attention any
PLANNING MALAYSIA
Journal of the Malaysia Institute of Planners (2020)
197 © 2020 by MIP
substantial similarity or overlap between the manuscript under consideration and any
other published paper of which they have personal knowledge.
Conflict of Interest
Reviewers should decline to review manuscripts in which they have conflicts of interest
resulting from competitive, collaborative, or other relationships or connections with any
of the authors.
DUTIES OF EDITORS
Decision on the Publication of Articles
The chief editor of the PLANNING MALAYSIA is responsible for deciding which of the
articles submitted to the journal should be published. The chief editor may be guided by
the policies of the journal's editorial board subjected to such legal requirements regarding
libel, copyright infringement and plagiarism. The chief editor may confer with other
editors or reviewers in making this decision.
Fair play
Manuscripts shall be evaluated solely on their intellectual merit.
Confidentiality
The chief editor/editors and any editorial staff must not disclose any information about a
submitted manuscript to anyone other than the corresponding author, reviewers, potential
reviewers, other editorial advisers, and the publisher.
Disclosure and Conflicts of Interest
Unpublished materials disclosed in a submitted manuscript must not be used by anyone
who has a view of the manuscript while handling it in his or her own research without the
express written consent of the author