
Presentation - MALAYSIA AIRPORTS
53
MALAYSIA AIRPORTS FINANCIAL RESULTS FOR THE QUARTER ENDED 31 DECEMBER 2021 28 February 2022
-
Upload
khangminh22 -
Category
Documents
-
view
0 -
download
0
Transcript of Presentation - MALAYSIA AIRPORTS
MALAYSIA AIRPORTSFINANCIAL RESULTS FOR
THE QUARTER ENDED
31 DECEMBER 2021
28 February 2022
2
Disclaimer
This presentation may contain forward-looking statements by Malaysia Airports Holdings Berhad (Malaysia Airports) that reflect
management’s current expectations, beliefs, intentions or strategies regarding the future and assumptions in light of currently
available information. These statements are based on various assumptions and made subject to a number of risks, uncertainties and
contingencies. Actual results, performance or achievements may differ materially and significantly from those discussed in the
forward-looking statements. Such statements are not and should not be construed as a representation, warranty or undertaking as
to the future performance or achievements of Malaysia Airports and Malaysia Airports assumes no obligation or responsibility to
update any such statements.
No representation or warranty (either express or implied) is given by or on behalf of Malaysia Airports or its related corporations
(including without limitation, their respective shareholders, directors, officers, employees, agents, partners, associates and advisers),
as to the quality, accuracy, reliability or completeness of the information contained in this presentation, or that reasonable care has
been taken in compiling or preparing the Information.
Due to rounding, numbers presented throughout this, and other documents may not add up precisely to the totals provided and
percentages may not precisely reflect the absolute figures.
No part of this presentation is intended to or construed as an offer, recommendation or invitation to subscribe for or purchase any
securities in Malaysia Airports.
The financial results should be read in conjunction with the audited Financial Statements for the year ended 31 December 2020 and
the Interim Financial Statements for the quarter ended 31 December 2021.
Group Financial Performance
TY Financial Performance
Operating Statistics
Key HighlightsBusiness Updates
Traffic Outlook
3
Key Highlights
4
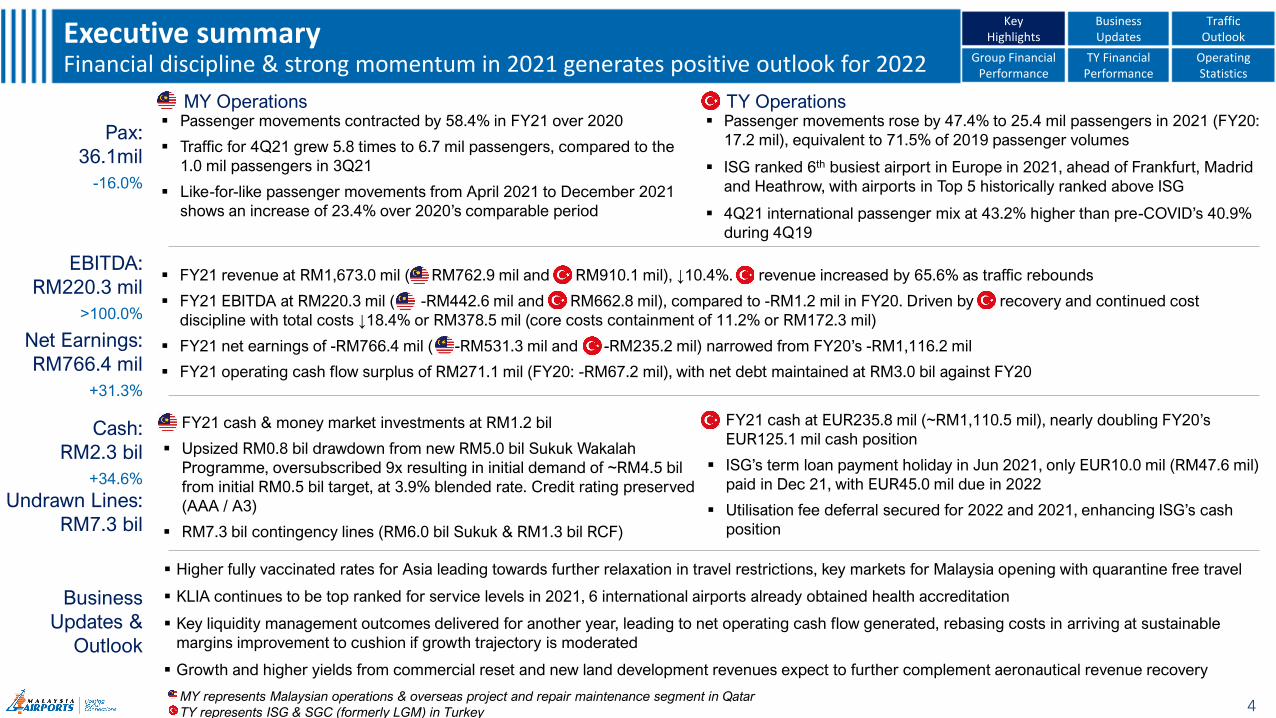
▪ FY21 revenue at RM1,673.0 mil ( RM762.9 mil and RM910.1 mil), ↓10.4%. revenue increased by 65.6% as traffic rebounds
▪ FY21 EBITDA at RM220.3 mil ( -RM442.6 mil and RM662.8 mil), compared to -RM1.2 mil in FY20. Driven by recovery and continued cost
discipline with total costs ↓18.4% or RM378.5 mil (core costs containment of 11.2% or RM172.3 mil)
▪ FY21 net earnings of -RM766.4 mil ( -RM531.3 mil and -RM235.2 mil) narrowed from FY20’s -RM1,116.2 mil
▪ FY21 operating cash flow surplus of RM271.1 mil (FY20: -RM67.2 mil), with net debt maintained at RM3.0 bil against FY20
▪ FY21 cash & money market investments at RM1.2 bil
▪ Upsized RM0.8 bil drawdown from new RM5.0 bil Sukuk Wakalah
Programme, oversubscribed 9x resulting in initial demand of ~RM4.5 bil
from initial RM0.5 bil target, at 3.9% blended rate. Credit rating preserved
(AAA / A3)
▪ RM7.3 bil contingency lines (RM6.0 bil Sukuk & RM1.3 bil RCF)
Pax:
36.1mil
-16.0%
EBITDA:
RM220.3 mil
>100.0%
▪ Passenger movements contracted by 58.4% in FY21 over 2020
▪ Traffic for 4Q21 grew 5.8 times to 6.7 mil passengers, compared to the
1.0 mil passengers in 3Q21
▪ Like-for-like passenger movements from April 2021 to December 2021
shows an increase of 23.4% over 2020’s comparable period
MY Operations TY Operations
▪ FY21 cash at EUR235.8 mil (~RM1,110.5 mil), nearly doubling FY20’s
EUR125.1 mil cash position
▪ ISG’s term loan payment holiday in Jun 2021, only EUR10.0 mil (RM47.6 mil)
paid in Dec 21, with EUR45.0 mil due in 2022
▪ Utilisation fee deferral secured for 2022 and 2021, enhancing ISG’s cash
position
MY represents Malaysian operations & overseas project and repair maintenance segment in Qatar
TY represents ISG & SGC (formerly LGM) in Turkey
Business
Updates &
Outlook
▪ Higher fully vaccinated rates for Asia leading towards further relaxation in travel restrictions, key markets for Malaysia opening with quarantine free travel
▪ KLIA continues to be top ranked for service levels in 2021, 6 international airports already obtained health accreditation
▪ Key liquidity management outcomes delivered for another year, leading to net operating cash flow generated, rebasing costs in arriving at sustainable
margins improvement to cushion if growth trajectory is moderated
▪ Growth and higher yields from commercial reset and new land development revenues expect to further complement aeronautical revenue recovery
Executive summaryFinancial discipline & strong momentum in 2021 generates positive outlook for 2022 Group Financial
PerformanceTY Financial
PerformanceOperating Statistics
Key Highlights
Business Updates
Traffic Outlook
▪ Passenger movements rose by 47.4% to 25.4 mil passengers in 2021 (FY20:
17.2 mil), equivalent to 71.5% of 2019 passenger volumes
▪ ISG ranked 6th busiest airport in Europe in 2021, ahead of Frankfurt, Madrid
and Heathrow, with airports in Top 5 historically ranked above ISG
▪ 4Q21 international passenger mix at 43.2% higher than pre-COVID’s 40.9%
during 4Q19
Net Earnings:
RM766.4 mil
+31.3%
Cash:
RM2.3 bil
+34.6%
Undrawn Lines:
RM7.3 bil
1,099.0
618.0
Borrowings
Profit / (Loss) After TaxEBITDA
518.9
619.4
178.3
367.3
176.9
5.5
+9.3%
RM1,110.5 mil
RM324.7 mil-47.6%
Non-Aero
RevenuePassenger Movements (Pax)
5
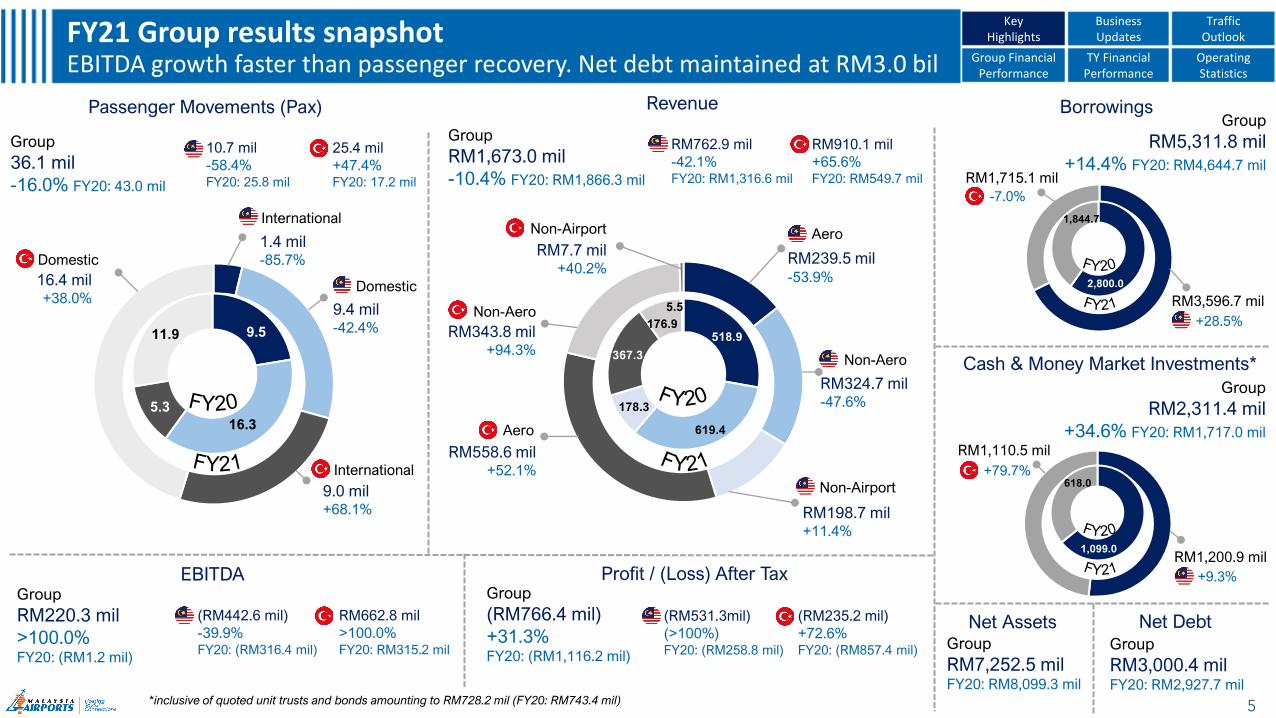
FY21 Group results snapshotEBITDA growth faster than passenger recovery. Net debt maintained at RM3.0 bil
+79.7%
RM1,200.9 mil
2,800.0
1,844.7 International
1.4 mil -85.7%
Group
RM7,252.5 milFY20: RM8,099.3 mil
9.5
16.3
5.3
11.9
Group
36.1 mil
-16.0% FY20: 43.0 mil
Domestic
9.4 mil -42.4%
International
9.0 mil +68.1%
Group
RM1,673.0 mil
-10.4% FY20: RM1,866.3 mil
RM239.5 mil-53.9%
Aero
Aero
RM558.6 mil +52.1%
Non-Aero
RM343.8 mil +94.3%
RM198.7 mil +11.4%
Non-Airport
RM7.7 mil +40.2%
Non-Airport
Group
RM220.3 mil
>100.0%FY20: (RM1.2 mil)
Group
(RM766.4 mil)
+31.3% FY20: (RM1,116.2 mil)
Group
RM5,311.8 mil
+14.4% FY20: RM4,644.7 mil
RM3,596.7 mil
+28.5%
-7.0%
RM1,715.1 mil
RM662.8 mil
>100.0%FY20: RM315.2 mil
(RM442.6 mil)
-39.9%FY20: (RM316.4 mil)
(RM531.3mil)
(>100%)FY20: (RM258.8 mil)
(RM235.2 mil)
+72.6%FY20: (RM857.4 mil)
25.4 mil
+47.4%FY20: 17.2 mil
10.7 mil
-58.4%FY20: 25.8 mil
RM762.9 mil
-42.1%FY20: RM1,316.6 mil
RM910.1 mil
+65.6%FY20: RM549.7 mil
16.4 mil+38.0%
Domestic
Passenger Movements (Pax) Revenue
Cash & Money Market Investments*
Net Assets
Group
RM2,311.4 mil
+34.6% FY20: RM1,717.0 mil
Group Financial Performance
TY Financial Performance
Operating Statistics
Key Highlights
Business Updates
Traffic Outlook
Group
RM3,000.4 milFY20: RM2,927.7 mil
Net Debt
*inclusive of quoted unit trusts and bonds amounting to RM728.2 mil (FY20: RM743.4 mil)
Group Results (RM mil) FY21 FY20 Variance %
Total Passengers (mil) 36.1 43.0 -16.0%
International Passengers (mil) 10.3 14.8 -30.3%
Domestic Passengers (mil) 25.7 28.1 -8.5%
Aircraft (000) 410.9 471.6 -12.9%
Revenue 1,673.0 1,866.3 -10.4%
Other Income 222.5 186.2 19.5%
Direct Cost (259.2) (349.0) 25.7%
Operating Cost (1,261.5) (1,514.7) 16.7%
User Fee & PSC Share (154.5) (190.0) 18.7%
EBITDA 220.3 (1.2) >100%
Depreciation & Amortisation (614.7) (609.8) -0.8%
Impairment on Intangible Assets - (500.4) >100%
Finance Costs (634.1) (641.0) 1.1%
Share of Assoc. & JV Profit (12.5) (11.6) -7.7%
(Loss)/Profit before Tax & Zakat (1,040.9) (1,763.9) 41.0%
Taxation & Zakat 274.5 647.7 -57.6%
(Loss)/Profit after Tax & Zakat (766.4) (1,116.2) 31.3%
Excluding PPA Adj*
EBITDA 212.2 (11.1) >-100%
(Loss)/Profit before Tax & Zakat (867.4) (1,141.5) -24.0%
(Loss)/Profit after Tax & Zakat (627.6) (618.2) 1.5%
EBITDA Margin 12.7% -0.6% >-100%
PAT Margin -37.5% -33.1% 13.3%
6
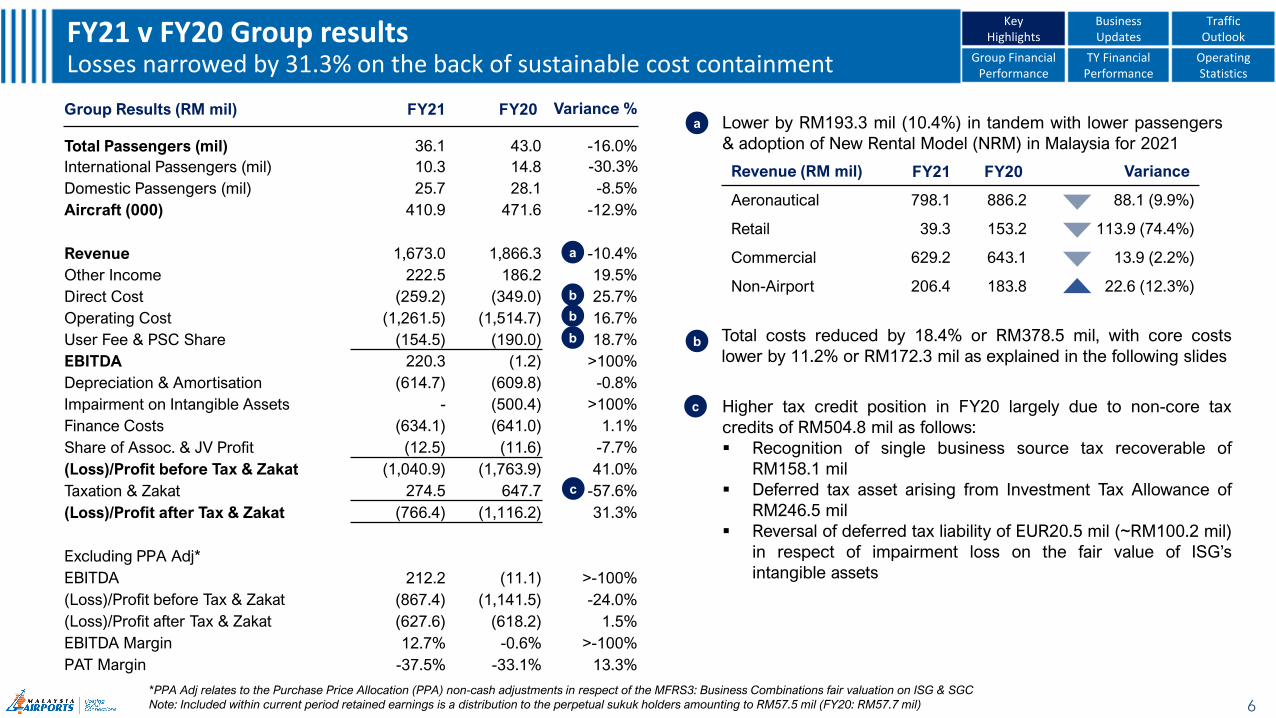
FY21 v FY20 Group resultsLosses narrowed by 31.3% on the back of sustainable cost containment
Total costs reduced by 18.4% or RM378.5 mil, with core costs
lower by 11.2% or RM172.3 mil as explained in the following slides
Lower by RM193.3 mil (10.4%) in tandem with lower passengers
& adoption of New Rental Model (NRM) in Malaysia for 2021
Revenue (RM mil) FY21 FY20 Variance
Aeronautical 798.1 886.2 88.1 (9.9%)
Retail 39.3 153.2 113.9 (74.4%)
Commercial 629.2 643.1 13.9 (2.2%)
Non-Airport 206.4 183.8 22.6 (12.3%)
b
a
b
a
c Higher tax credit position in FY20 largely due to non-core tax
credits of RM504.8 mil as follows:
▪ Recognition of single business source tax recoverable of
RM158.1 mil
▪ Deferred tax asset arising from Investment Tax Allowance of
RM246.5 mil
▪ Reversal of deferred tax liability of EUR20.5 mil (~RM100.2 mil)
in respect of impairment loss on the fair value of ISG’s
intangible assets
c
b
b
Group Financial Performance
TY Financial Performance
Operating Statistics
Key Highlights
Business Updates
TrafficOutlook
*PPA Adj relates to the Purchase Price Allocation (PPA) non-cash adjustments in respect of the MFRS3: Business Combinations fair valuation on ISG & SGC
Note: Included within current period retained earnings is a distribution to the perpetual sukuk holders amounting to RM57.5 mil (FY20: RM57.7 mil)
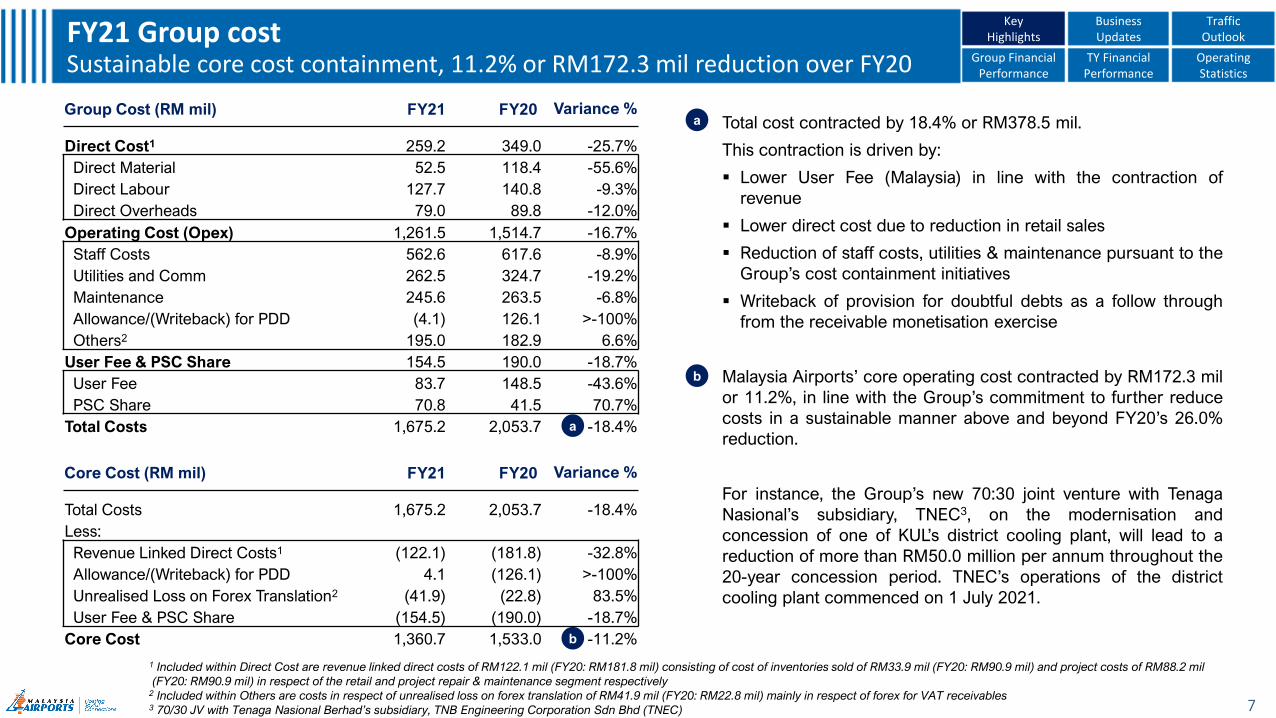
Group Cost (RM mil) FY21 FY20 Variance %
Direct Cost1 259.2 349.0 -25.7%
Direct Material 52.5 118.4 -55.6%
Direct Labour 127.7 140.8 -9.3%
Direct Overheads 79.0 89.8 -12.0%
Operating Cost (Opex) 1,261.5 1,514.7 -16.7%
Staff Costs 562.6 617.6 -8.9%
Utilities and Comm 262.5 324.7 -19.2%
Maintenance 245.6 263.5 -6.8%
Allowance/(Writeback) for PDD (4.1) 126.1 >-100%
Others2 195.0 182.9 6.6%
User Fee & PSC Share 154.5 190.0 -18.7%
User Fee 83.7 148.5 -43.6%
PSC Share 70.8 41.5 70.7%
Total Costs 1,675.2 2,053.7 -18.4%
7
FY21 Group costSustainable core cost containment, 11.2% or RM172.3 mil reduction over FY20 Group Financial
PerformanceTY Financial
PerformanceOperating Statistics
Key Highlights
Business Updates
Traffic Outlook
Core Cost (RM mil) FY21 FY20 Variance %
Total Costs 1,675.2 2,053.7 -18.4%
Less:
Revenue Linked Direct Costs1 (122.1) (181.8) -32.8%
Allowance/(Writeback) for PDD 4.1 (126.1) >-100%
Unrealised Loss on Forex Translation2 (41.9) (22.8) 83.5%
User Fee & PSC Share (154.5) (190.0) -18.7%
Core Cost 1,360.7 1,533.0 -11.2%
Total cost contracted by 18.4% or RM378.5 mil.
This contraction is driven by:
▪ Lower User Fee (Malaysia) in line with the contraction of
revenue
▪ Lower direct cost due to reduction in retail sales
▪ Reduction of staff costs, utilities & maintenance pursuant to the
Group’s cost containment initiatives
▪ Writeback of provision for doubtful debts as a follow through
from the receivable monetisation exercise
Malaysia Airports’ core operating cost contracted by RM172.3 mil
or 11.2%, in line with the Group’s commitment to further reduce
costs in a sustainable manner above and beyond FY20’s 26.0%
reduction.
For instance, the Group’s new 70:30 joint venture with Tenaga
Nasional’s subsidiary, TNEC3, on the modernisation and
concession of one of KUL’s district cooling plant, will lead to a
reduction of more than RM50.0 million per annum throughout the
20-year concession period. TNEC’s operations of the district
cooling plant commenced on 1 July 2021.
b
a
a
b
1 Included within Direct Cost are revenue linked direct costs of RM122.1 mil (FY20: RM181.8 mil) consisting of cost of inventories sold of RM33.9 mil (FY20: RM90.9 mil) and project costs of RM88.2 mil
(FY20: RM90.9 mil) in respect of the retail and project repair & maintenance segment respectively2 Included within Others are costs in respect of unrealised loss on forex translation of RM41.9 mil (FY20: RM22.8 mil) mainly in respect of forex for VAT receivables3 70/30 JV with Tenaga Nasional Berhad’s subsidiary, TNB Engineering Corporation Sdn Bhd (TNEC)
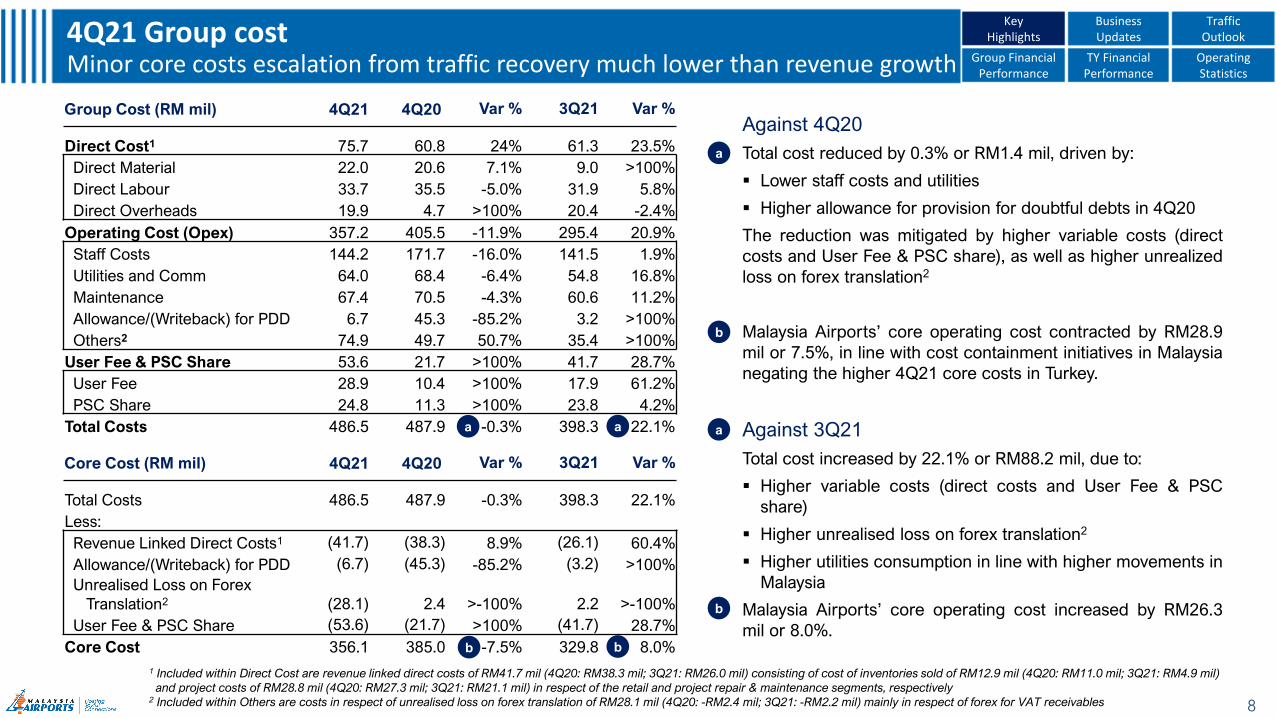
Against 4Q20
Total cost reduced by 0.3% or RM1.4 mil, driven by:
▪ Lower staff costs and utilities
▪ Higher allowance for provision for doubtful debts in 4Q20
The reduction was mitigated by higher variable costs (direct
costs and User Fee & PSC share), as well as higher unrealized
loss on forex translation2
Malaysia Airports’ core operating cost contracted by RM28.9
mil or 7.5%, in line with cost containment initiatives in Malaysia
negating the higher 4Q21 core costs in Turkey.
Against 3Q21
Total cost increased by 22.1% or RM88.2 mil, due to:
▪ Higher variable costs (direct costs and User Fee & PSC
share)
▪ Higher unrealised loss on forex translation2
▪ Higher utilities consumption in line with higher movements in
Malaysia
Malaysia Airports’ core operating cost increased by RM26.3
mil or 8.0%.
Group Cost (RM mil) 4Q21 4Q20 Var % 3Q21 Var %
Direct Cost1 75.7 60.8 24% 61.3 23.5%
Direct Material 22.0 20.6 7.1% 9.0 >100%
Direct Labour 33.7 35.5 -5.0% 31.9 5.8%
Direct Overheads 19.9 4.7 >100% 20.4 -2.4%
Operating Cost (Opex) 357.2 405.5 -11.9% 295.4 20.9%
Staff Costs 144.2 171.7 -16.0% 141.5 1.9%
Utilities and Comm 64.0 68.4 -6.4% 54.8 16.8%
Maintenance 67.4 70.5 -4.3% 60.6 11.2%
Allowance/(Writeback) for PDD 6.7 45.3 -85.2% 3.2 >100%
Others2 74.9 49.7 50.7% 35.4 >100%
User Fee & PSC Share 53.6 21.7 >100% 41.7 28.7%
User Fee 28.9 10.4 >100% 17.9 61.2%
PSC Share 24.8 11.3 >100% 23.8 4.2%
Total Costs 486.5 487.9 -0.3% 398.3 22.1%
8
4Q21 Group costMinor core costs escalation from traffic recovery much lower than revenue growth Group Financial
PerformanceTY Financial
PerformanceOperating Statistics
KeyHighlights
Business Updates
TrafficOutlook
Core Cost (RM mil) 4Q21 4Q20 Var % 3Q21 Var %
Total Costs 486.5 487.9 -0.3% 398.3 22.1%
Less:
Revenue Linked Direct Costs1 (41.7) (38.3) 8.9% (26.1) 60.4%
Allowance/(Writeback) for PDD (6.7) (45.3) -85.2% (3.2) >100%
Unrealised Loss on Forex
Translation2 (28.1) 2.4 >-100% 2.2 >-100%
User Fee & PSC Share (53.6) (21.7) >100% (41.7) 28.7%
Core Cost 356.1 385.0 -7.5% 329.8 8.0%
a
b
b
a
b
aa
b
1 Included within Direct Cost are revenue linked direct costs of RM41.7 mil (4Q20: RM38.3 mil; 3Q21: RM26.0 mil) consisting of cost of inventories sold of RM12.9 mil (4Q20: RM11.0 mil; 3Q21: RM4.9 mil)
and project costs of RM28.8 mil (4Q20: RM27.3 mil; 3Q21: RM21.1 mil) in respect of the retail and project repair & maintenance segments, respectively2 Included within Others are costs in respect of unrealised loss on forex translation of RM28.1 mil (4Q20: -RM2.4 mil; 3Q21: -RM2.2 mil) mainly in respect of forex for VAT receivables
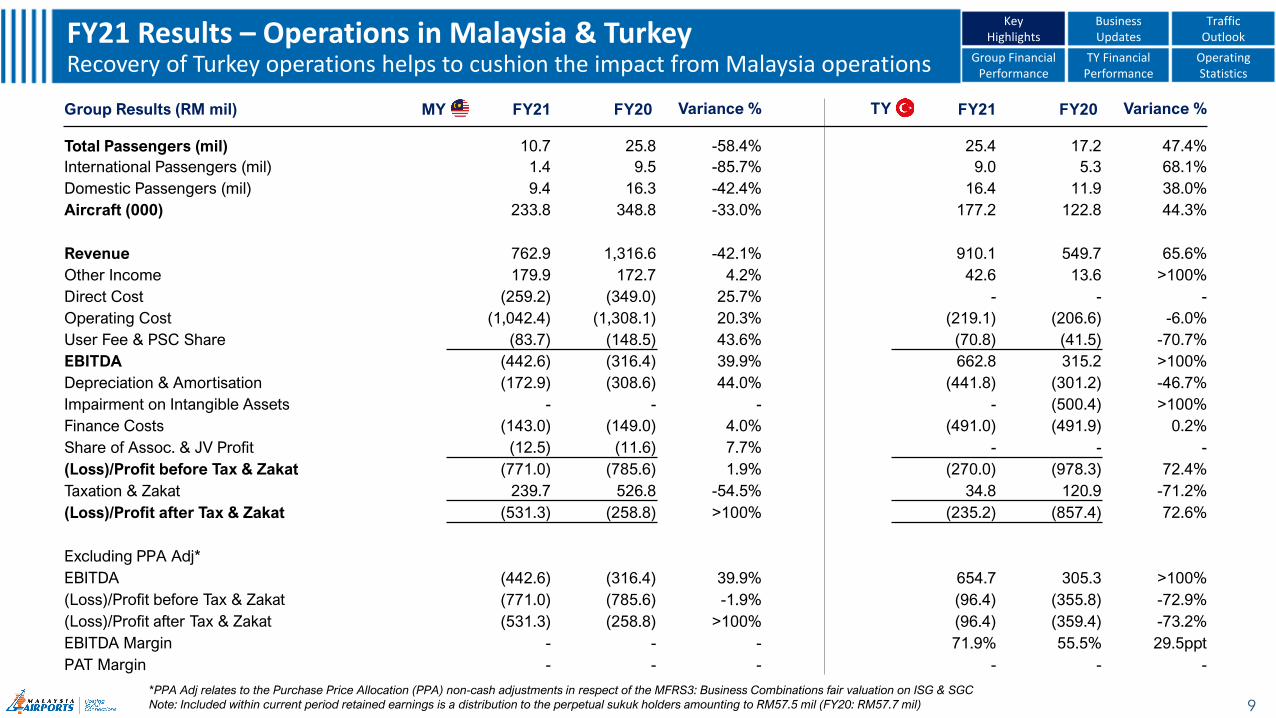
Group Results (RM mil) MY FY21 FY20 Variance % TY FY21 FY20 Variance %
Total Passengers (mil) 10.7 25.8 -58.4% 25.4 17.2 47.4%
International Passengers (mil) 1.4 9.5 -85.7% 9.0 5.3 68.1%
Domestic Passengers (mil) 9.4 16.3 -42.4% 16.4 11.9 38.0%
Aircraft (000) 233.8 348.8 -33.0% 177.2 122.8 44.3%
Revenue 762.9 1,316.6 -42.1% 910.1 549.7 65.6%
Other Income 179.9 172.7 4.2% 42.6 13.6 >100%
Direct Cost (259.2) (349.0) 25.7% - - -
Operating Cost (1,042.4) (1,308.1) 20.3% (219.1) (206.6) -6.0%
User Fee & PSC Share (83.7) (148.5) 43.6% (70.8) (41.5) -70.7%
EBITDA (442.6) (316.4) 39.9% 662.8 315.2 >100%
Depreciation & Amortisation (172.9) (308.6) 44.0% (441.8) (301.2) -46.7%
Impairment on Intangible Assets - - - - (500.4) >100%
Finance Costs (143.0) (149.0) 4.0% (491.0) (491.9) 0.2%
Share of Assoc. & JV Profit (12.5) (11.6) 7.7% - - -
(Loss)/Profit before Tax & Zakat (771.0) (785.6) 1.9% (270.0) (978.3) 72.4%
Taxation & Zakat 239.7 526.8 -54.5% 34.8 120.9 -71.2%
(Loss)/Profit after Tax & Zakat (531.3) (258.8) >100% (235.2) (857.4) 72.6%
Excluding PPA Adj*
EBITDA (442.6) (316.4) 39.9% 654.7 305.3 >100%
(Loss)/Profit before Tax & Zakat (771.0) (785.6) -1.9% (96.4) (355.8) -72.9%
(Loss)/Profit after Tax & Zakat (531.3) (258.8) >100% (96.4) (359.4) -73.2%
EBITDA Margin - - - 71.9% 55.5% 29.5ppt
PAT Margin - - - - - -
9
FY21 Results – Operations in Malaysia & TurkeyRecovery of Turkey operations helps to cushion the impact from Malaysia operations Group Financial
PerformanceTY Financial
PerformanceOperating Statistics
Key Highlights
Business Updates
Traffic Outlook
*PPA Adj relates to the Purchase Price Allocation (PPA) non-cash adjustments in respect of the MFRS3: Business Combinations fair valuation on ISG & SGC
Note: Included within current period retained earnings is a distribution to the perpetual sukuk holders amounting to RM57.5 mil (FY20: RM57.7 mil)
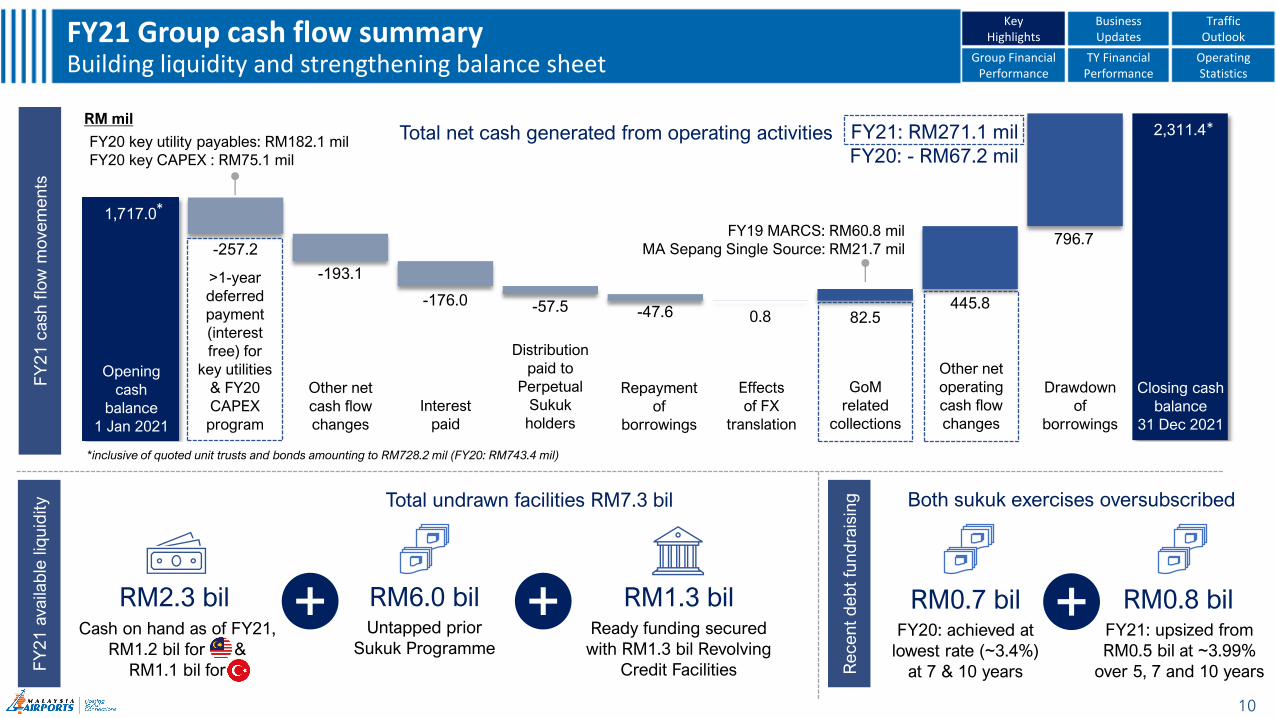
1,717.0
1,266.7 985.6 985.6 1,068.9 1,514.7
2,311.4
-257.2
-193.1
-176.0 -57.5 -47.6 0.8 82.5445.8
796.7
FY21: RM271.1 mil
FY20: - RM67.2 mil
10
FY21 Group cash flow summaryBuilding liquidity and strengthening balance sheet Group Financial
PerformanceTY Financial
PerformanceOperating Statistics
Key Highlights
Business Updates
Traffic Outlook
10
RM mil
Opening
cash
balance
1 Jan 2021
Closing cash
balance
31 Dec 2021
>1-year
deferred
payment
(interest
free) for
key utilities
& FY20
CAPEX
program
Distribution
paid to
Perpetual
Sukuk
holders
Other net
cash flow
changes
FY19 MARCS: RM60.8 mil
MA Sepang Single Source: RM21.7 mil
FY20 key utility payables: RM182.1 mil
FY20 key CAPEX : RM75.1 mil
*
Interest
paid
Repayment
of
borrowings
Other net
operating
cash flow
changes
Drawdown
of
borrowings
GoM
related
collections
Effects
of FX
translation
*
*Total net cash generated from operating activities
*inclusive of quoted unit trusts and bonds amounting to RM728.2 mil (FY20: RM743.4 mil)
Cash on hand as of FY21,
RM1.2 bil for &
RM1.1 bil for
RM2.3 bil RM1.3 bilReady funding secured
with RM1.3 bil Revolving
Credit Facilities
FY
21
cash
flo
w m
ovem
en
tsF
Y2
1 a
vaila
ble
liq
uid
ity
Recen
t d
eb
t fu
nd
rais
ingTotal undrawn facilities RM7.3 bil Both sukuk exercises oversubscribed
RM6.0 bilUntapped prior
Sukuk Programme
RM0.7 bil FY20: achieved at
lowest rate (~3.4%)
at 7 & 10 years
RM0.8 bilFY21: upsized from
RM0.5 bil at ~3.99%
over 5, 7 and 10 years
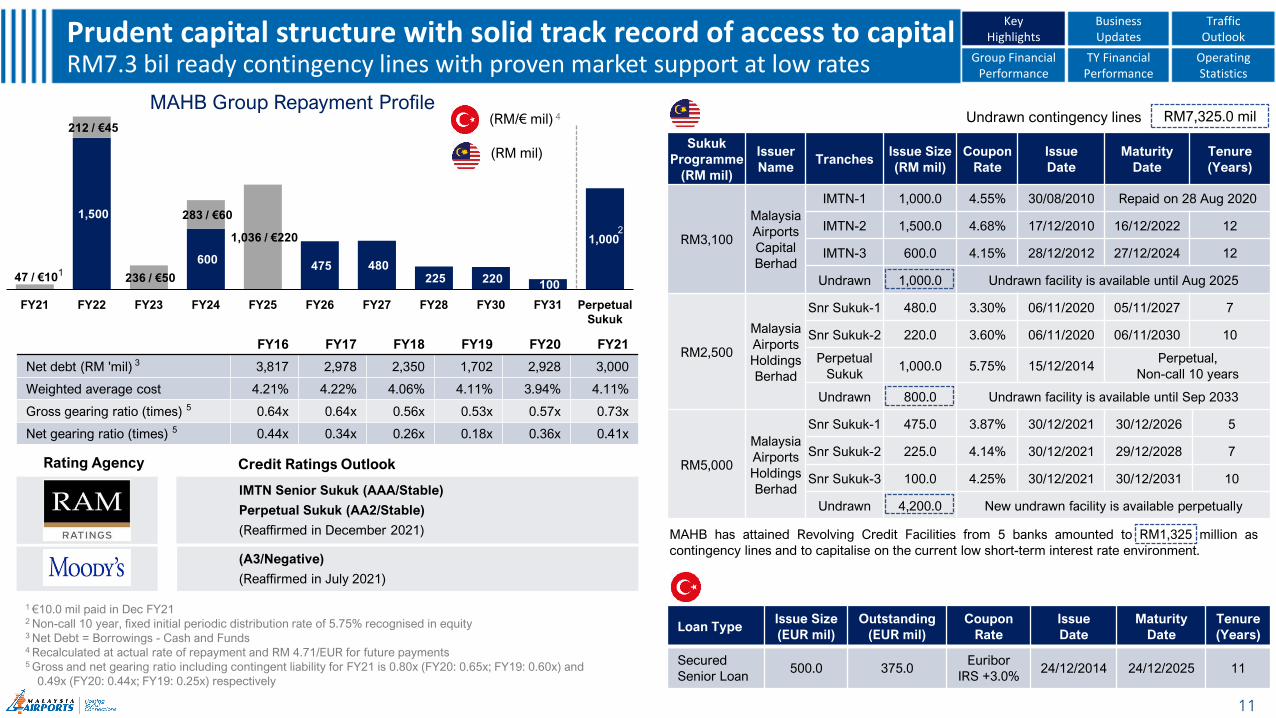
FY16 FY17 FY18 FY19 FY20 FY21
Net debt (RM 'mil) 3 3,817 2,978 2,350 1,702 2,928 3,000
Weighted average cost 4.21% 4.22% 4.06% 4.11% 3.94% 4.11%
Gross gearing ratio (times) 5 0.64x 0.64x 0.56x 0.53x 0.57x 0.73x
Net gearing ratio (times) 5 0.44x 0.34x 0.26x 0.18x 0.36x 0.41x
1,000
1,500
600 480
220 47 / €10
212 / €45
236 / €50
283 / €60
1,036 / €220
475 225
100
FY21 FY22 FY23 FY24 FY25 FY26 FY27 FY28 FY30 FY31 Perpetual
Sukuk
(RM/€ mil) 4
(RM mil)
11
Prudent capital structure with solid track record of access to capitalRM7.3 bil ready contingency lines with proven market support at low rates Group Financial
PerformanceTY Financial
PerformanceOperating Statistics
Key Highlights
Business Updates
Traffic Outlook
1 €10.0 mil paid in Dec FY21 2 Non-call 10 year, fixed initial periodic distribution rate of 5.75% recognised in equity3 Net Debt = Borrowings - Cash and Funds4 Recalculated at actual rate of repayment and RM 4.71/EUR for future payments5 Gross and net gearing ratio including contingent liability for FY21 is 0.80x (FY20: 0.65x; FY19: 0.60x) and
0.49x (FY20: 0.44x; FY19: 0.25x) respectively
2
Loan TypeIssue Size
(EUR mil)
Outstanding
(EUR mil)
Coupon
Rate
Issue
Date
Maturity
Date
Tenure
(Years)
Secured
Senior Loan 500.0 375.0
Euribor
IRS +3.0%24/12/2014 24/12/2025 11
Sukuk
Programme
(RM mil)
Issuer
NameTranches
Issue Size
(RM mil)
Coupon
Rate
Issue
Date
Maturity
Date
Tenure
(Years)
RM3,100
Malaysia
Airports
Capital
Berhad
IMTN-1 1,000.0 4.55% 30/08/2010 Repaid on 28 Aug 2020
IMTN-2 1,500.0 4.68% 17/12/2010 16/12/2022 12
IMTN-3 600.0 4.15% 28/12/2012 27/12/2024 12
Undrawn 1,000.0 Undrawn facility is available until Aug 2025
RM2,500
Malaysia
Airports
Holdings
Berhad
Snr Sukuk-1 480.0 3.30% 06/11/2020 05/11/2027 7
Snr Sukuk-2 220.0 3.60% 06/11/2020 06/11/2030 10
Perpetual
Sukuk1,000.0 5.75% 15/12/2014
Perpetual,
Non-call 10 years
Undrawn 800.0 Undrawn facility is available until Sep 2033
RM5,000
Malaysia
Airports
Holdings
Berhad
Snr Sukuk-1 475.0 3.87% 30/12/2021 30/12/2026 5
Snr Sukuk-2 225.0 4.14% 30/12/2021 29/12/2028 7
Snr Sukuk-3 100.0 4.25% 30/12/2021 30/12/2031 10
Undrawn 4,200.0 New undrawn facility is available perpetually
MAHB Group Repayment Profile
1
MAHB has attained Revolving Credit Facilities from 5 banks amounted to RM1,325 million as
contingency lines and to capitalise on the current low short-term interest rate environment.
RM7,325.0 milUndrawn contingency lines
Rating Agency
(A3/Negative)
(Reaffirmed in July 2021)
Credit Ratings Outlook
IMTN Senior Sukuk (AAA/Stable)
Perpetual Sukuk (AA2/Stable)
(Reaffirmed in December 2021)
12
Business Updates
13
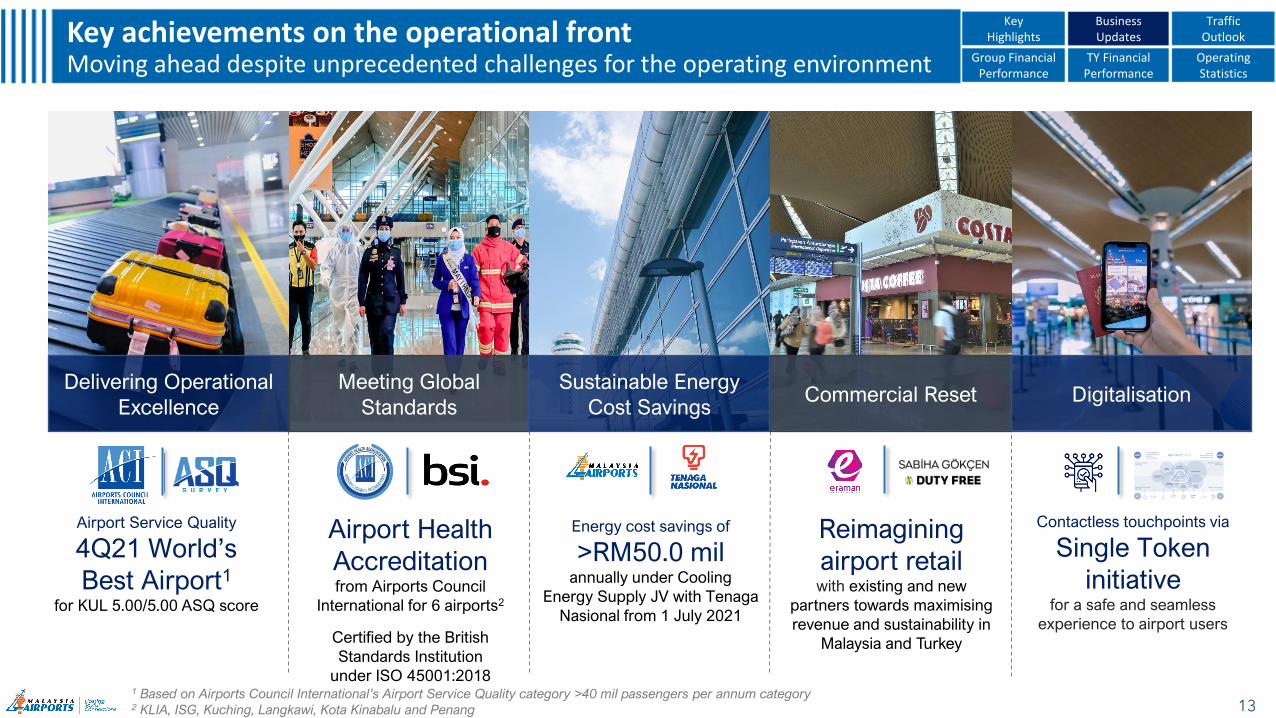
Key achievements on the operational front Moving ahead despite unprecedented challenges for the operating environment Group Financial
PerformanceTY Financial
PerformanceOperating Statistics
Key Highlights
Business Updates
Traffic Outlook
Commercial ResetDelivering Operational
Excellence
Meeting Global
Standards
Sustainable Energy
Cost SavingsDigitalisation
Energy cost savings of
>RM50.0 mil annually under Cooling
Energy Supply JV with Tenaga
Nasional from 1 July 2021
Reimagining
airport retail with existing and new
partners towards maximising
revenue and sustainability in
Malaysia and Turkey
1 Based on Airports Council International’s Airport Service Quality category >40 mil passengers per annum category2 KLIA, ISG, Kuching, Langkawi, Kota Kinabalu and Penang
Contactless touchpoints via
Single Token
initiativefor a safe and seamless
experience to airport users
Airport Service Quality
4Q21 World’s
Best Airport1for KUL 5.00/5.00 ASQ score
Airport Health
Accreditation from Airports Council
International for 6 airports2
Certified by the British
Standards Institution
under ISO 45001:2018
14
Strengthening financial position Delivering key outcomes leading to net operating cash flow generated Group Financial
PerformanceTY Financial
PerformanceOperating Statistics
Key Highlights
Business Updates
Traffic Outlook
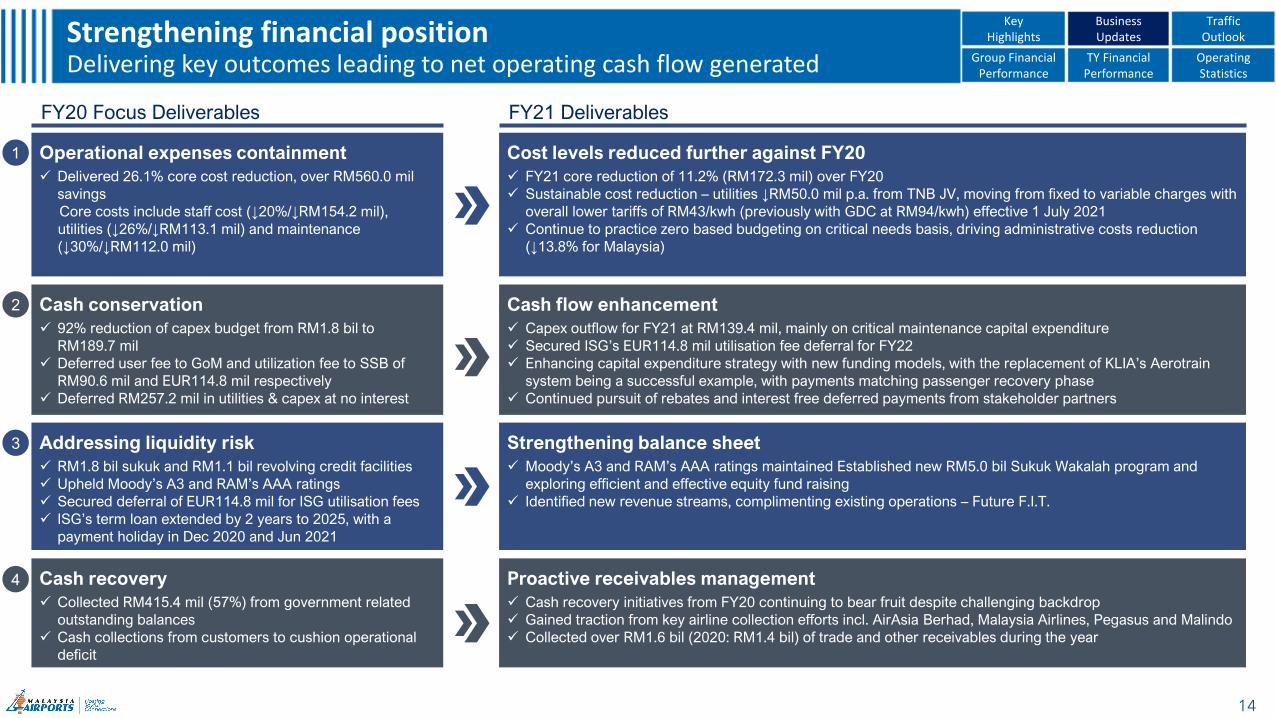
FY21 Deliverables
Operational expenses containment
✓ Delivered 26.1% core cost reduction, over RM560.0 mil
savings
Core costs include staff cost (↓20%/↓RM154.2 mil),
utilities (↓26%/↓RM113.1 mil) and maintenance
(↓30%/↓RM112.0 mil)
FY20 Focus Deliverables
Cash conservation
✓ 92% reduction of capex budget from RM1.8 bil to
RM189.7 mil
✓ Deferred user fee to GoM and utilization fee to SSB of
RM90.6 mil and EUR114.8 mil respectively
✓ Deferred RM257.2 mil in utilities & capex at no interest
Addressing liquidity risk
✓ RM1.8 bil sukuk and RM1.1 bil revolving credit facilities
✓ Upheld Moody’s A3 and RAM’s AAA ratings
✓ Secured deferral of EUR114.8 mil for ISG utilisation fees
✓ ISG’s term loan extended by 2 years to 2025, with a
payment holiday in Dec 2020 and Jun 2021
Cash recovery
✓ Collected RM415.4 mil (57%) from government related
outstanding balances
✓ Cash collections from customers to cushion operational
deficit
Cost levels reduced further against FY20
✓ FY21 core reduction of 11.2% (RM172.3 mil) over FY20
✓ Sustainable cost reduction – utilities ↓RM50.0 mil p.a. from TNB JV, moving from fixed to variable charges with
overall lower tariffs of RM43/kwh (previously with GDC at RM94/kwh) effective 1 July 2021
✓ Continue to practice zero based budgeting on critical needs basis, driving administrative costs reduction
(↓13.8% for Malaysia)
Cash flow enhancement
✓ Capex outflow for FY21 at RM139.4 mil, mainly on critical maintenance capital expenditure
✓ Secured ISG’s EUR114.8 mil utilisation fee deferral for FY22
✓ Enhancing capital expenditure strategy with new funding models, with the replacement of KLIA’s Aerotrain
system being a successful example, with payments matching passenger recovery phase
✓ Continued pursuit of rebates and interest free deferred payments from stakeholder partners
Strengthening balance sheet
✓ Moody’s A3 and RAM’s AAA ratings maintained Established new RM5.0 bil Sukuk Wakalah program and
exploring efficient and effective equity fund raising
✓ Identified new revenue streams, complimenting existing operations – Future F.I.T.
Proactive receivables management
✓ Cash recovery initiatives from FY20 continuing to bear fruit despite challenging backdrop
✓ Gained traction from key airline collection efforts incl. AirAsia Berhad, Malaysia Airlines, Pegasus and Malindo
✓ Collected over RM1.6 bil (2020: RM1.4 bil) of trade and other receivables during the year
1
2
3
4
Key sustainability highlights EESG integration into group wide operation & strategy
15
Group Financial Performance
TY Financial Performance
Operating Statistics
Key Highlights
Business Updates
Traffic Outlook
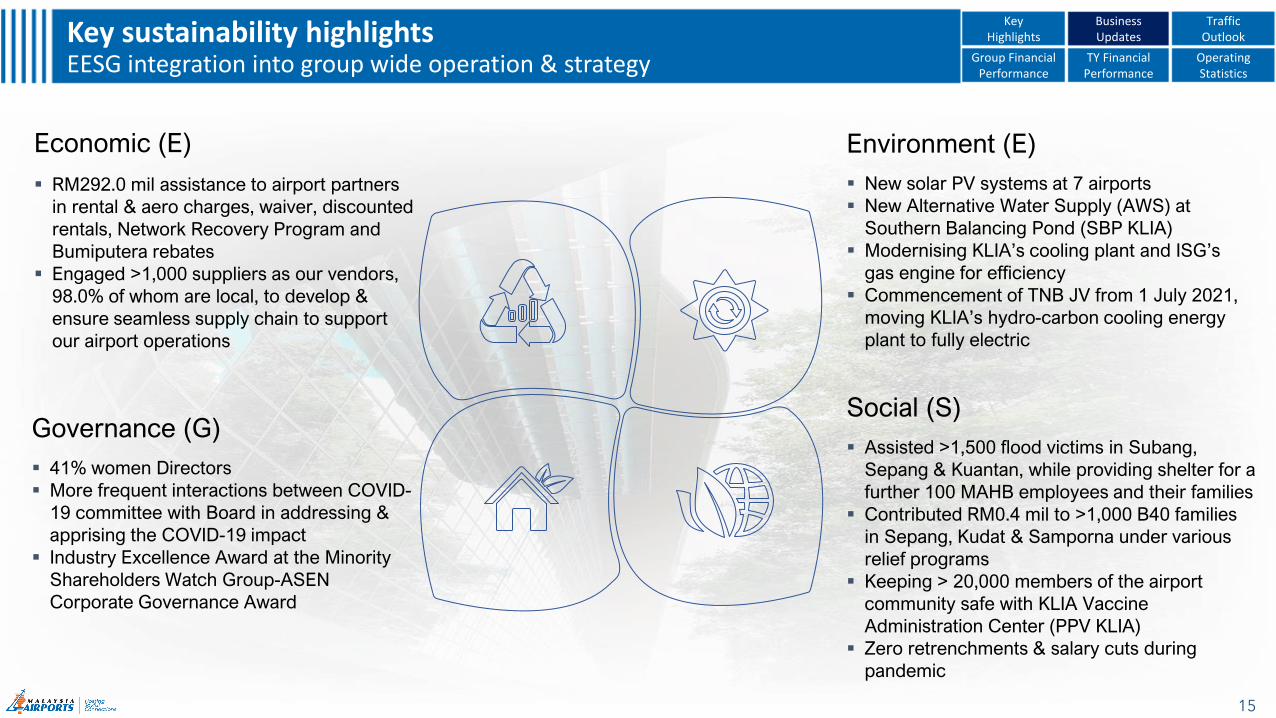
Economic (E)
▪ RM292.0 mil assistance to airport partners
in rental & aero charges, waiver, discounted
rentals, Network Recovery Program and
Bumiputera rebates
▪ Engaged >1,000 suppliers as our vendors,
98.0% of whom are local, to develop &
ensure seamless supply chain to support
our airport operations
Environment (E)
▪ New solar PV systems at 7 airports
▪ New Alternative Water Supply (AWS) at
Southern Balancing Pond (SBP KLIA)
▪ Modernising KLIA’s cooling plant and ISG’s
gas engine for efficiency
▪ Commencement of TNB JV from 1 July 2021,
moving KLIA’s hydro-carbon cooling energy
plant to fully electric
Social (S)
▪ Assisted >1,500 flood victims in Subang,
Sepang & Kuantan, while providing shelter for a
further 100 MAHB employees and their families
▪ Contributed RM0.4 mil to >1,000 B40 families
in Sepang, Kudat & Samporna under various
relief programs
▪ Keeping > 20,000 members of the airport
community safe with KLIA Vaccine
Administration Center (PPV KLIA)
▪ Zero retrenchments & salary cuts during
pandemic
Governance (G)
▪ 41% women Directors
▪ More frequent interactions between COVID-
19 committee with Board in addressing &
apprising the COVID-19 impact
▪ Industry Excellence Award at the Minority
Shareholders Watch Group-ASEN
Corporate Governance Award
16
>70% of Commercial Reset contracts awarded Seeding further growth for non-aero business via revitilised commercial spaces Group Financial
PerformanceTY Financial
PerformanceOperating Statistics
Key Highlights
Business Updates
Traffic Outlook
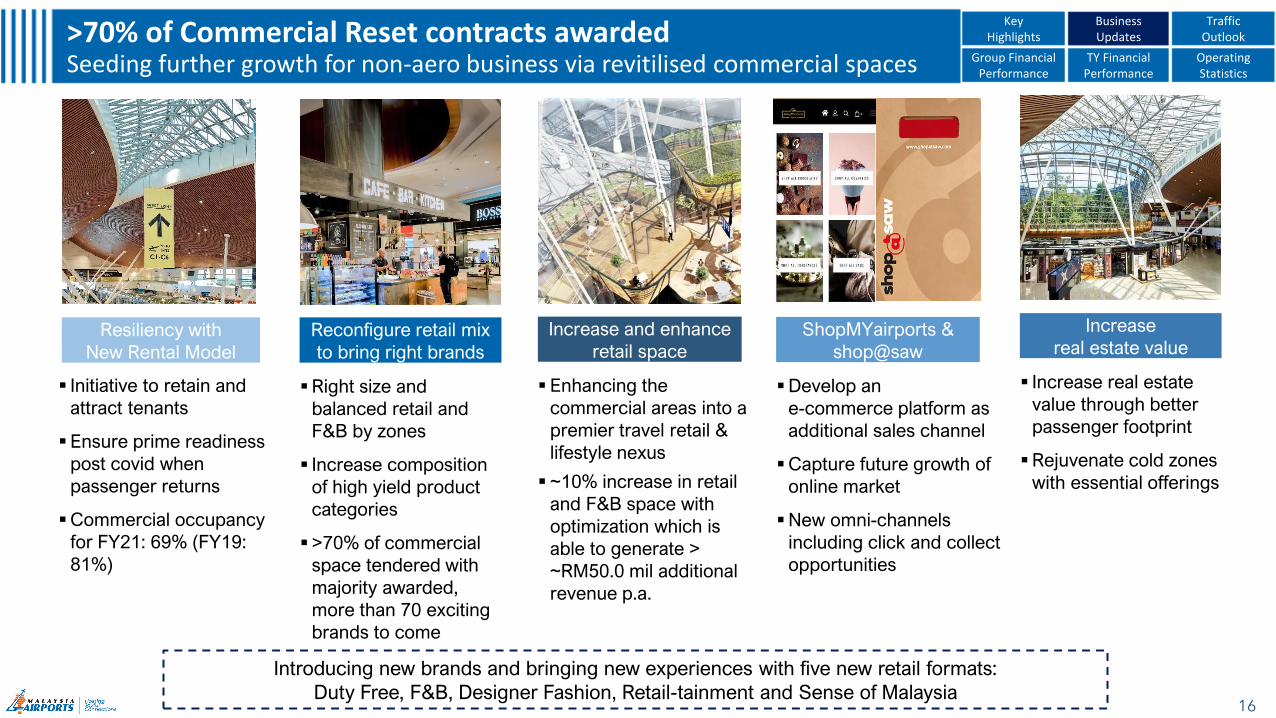
Reconfigure retail mix
to bring right brands
▪Right size and
balanced retail and
F&B by zones
▪ Increase composition
of high yield product
categories
▪>70% of commercial
space tendered with
majority awarded,
more than 70 exciting
brands to come
ShopMYairports &
shop@saw
▪Develop an
e-commerce platform as
additional sales channel
▪Capture future growth of
online market
▪New omni-channels
including click and collect
opportunities
Increase and enhance
retail space
▪ Enhancing the
commercial areas into a
premier travel retail &
lifestyle nexus
▪ ~10% increase in retail
and F&B space with
optimization which is
able to generate >
~RM50.0 mil additional
revenue p.a.
Increase
real estate value
▪ Increase real estate
value through better
passenger footprint
▪Rejuvenate cold zones
with essential offerings
Resiliency with
New Rental Model
▪ Initiative to retain and
attract tenants
▪Ensure prime readiness
post covid when
passenger returns
▪Commercial occupancy
for FY21: 69% (FY19:
81%)
Introducing new brands and bringing new experiences with five new retail formats:
Duty Free, F&B, Designer Fashion, Retail-tainment and Sense of Malaysia
17
Heightened experiences and notable firstsStimulating high capex investment by tenants while attracting higher yields Group Financial
PerformanceTY Financial
PerformanceOperating Statistics
KeyHighlights
Business Updates
Traffic Outlook
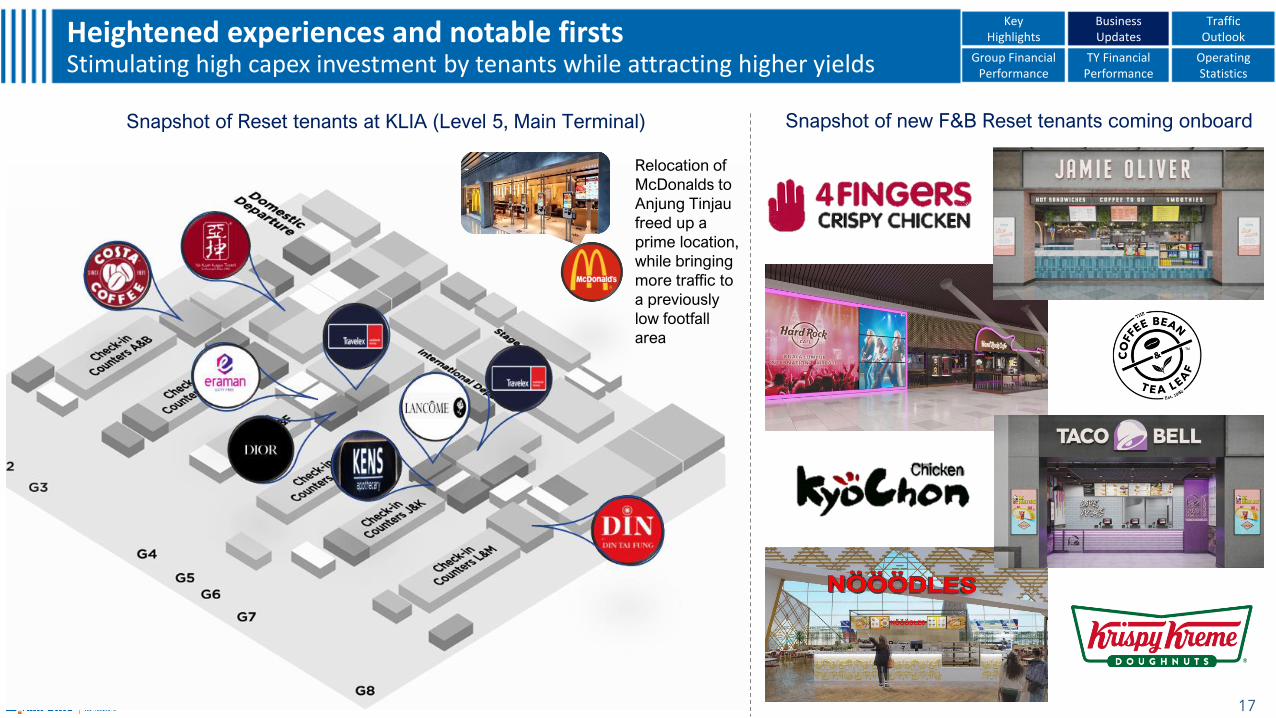
Snapshot of Reset tenants at KLIA (Level 5, Main Terminal) Snapshot of new F&B Reset tenants coming onboard
Relocation of
McDonalds to
Anjung Tinjau
freed up a
prime location,
while bringing
more traffic to
a previously
low footfall
area
18
Redefining comfort for more passengersNew and enhanced lounge facilities for a broader market Group Financial
PerformanceTY Financial
PerformanceOperating Statistics
Key Highlights
Business Updates
Traffic Outlook
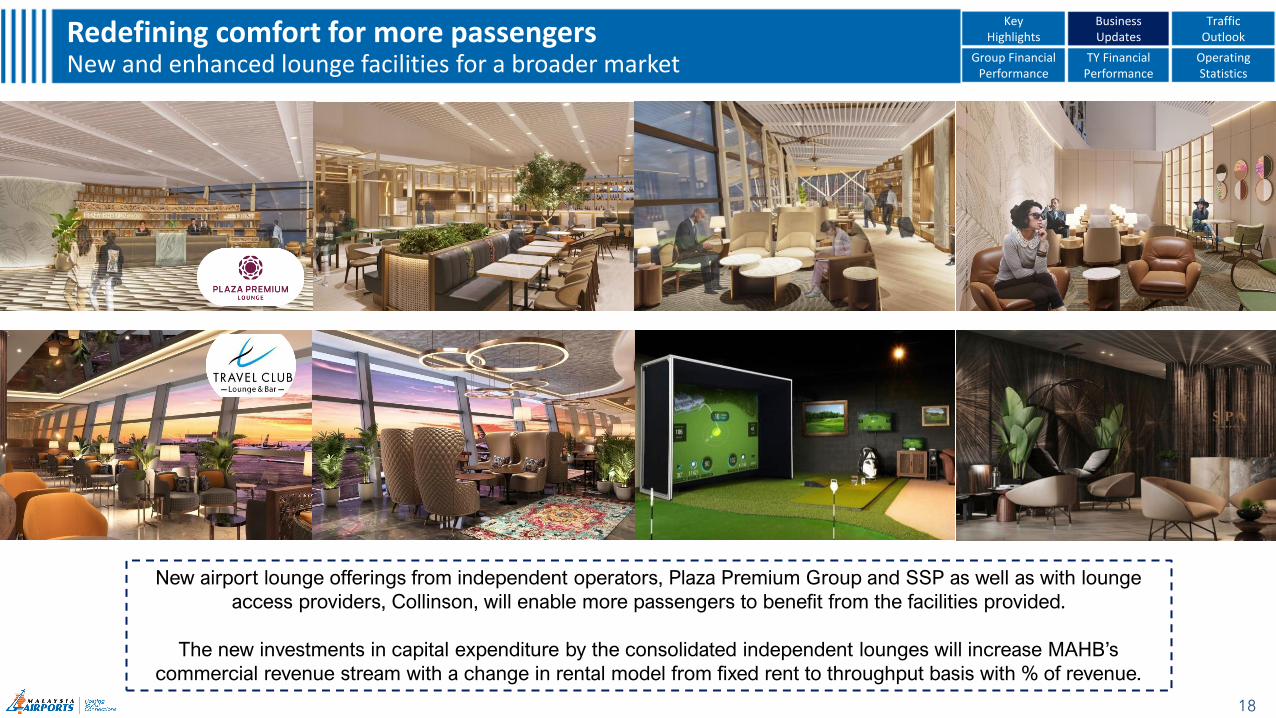
New airport lounge offerings from independent operators, Plaza Premium Group and SSP as well as with lounge
access providers, Collinson, will enable more passengers to benefit from the facilities provided.
The new investments in capital expenditure by the consolidated independent lounges will increase MAHB’s
commercial revenue stream with a change in rental model from fixed rent to throughput basis with % of revenue.
19
Demand driven approach for SZB RegenerationUnlocks growth potential to capture emerging APAC market Group Financial
PerformanceTY Financial
PerformanceOperating Statistics
Key Highlights
Business Updates
Traffic Outlook
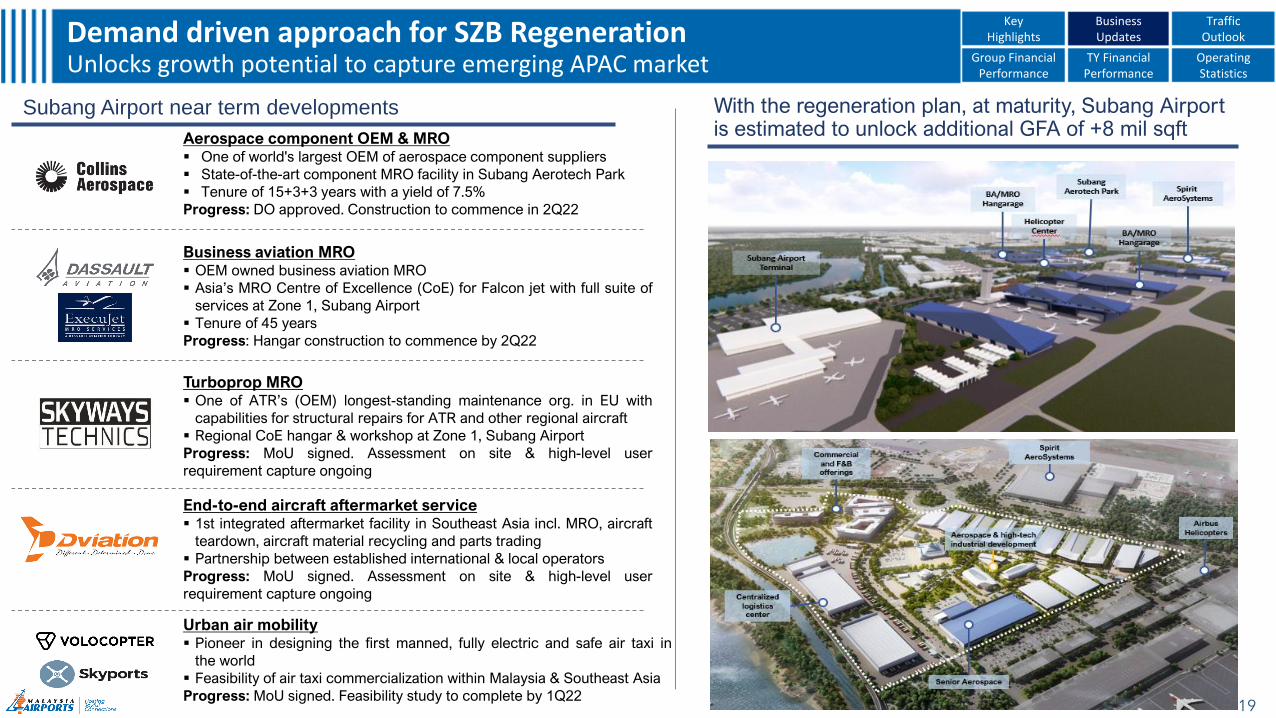
Subang Airport near term developments
Business aviation MRO▪ OEM owned business aviation MRO
▪ Asia’s MRO Centre of Excellence (CoE) for Falcon jet with full suite of
services at Zone 1, Subang Airport
▪ Tenure of 45 years
Progress: Hangar construction to commence by 2Q22
Turboprop MRO▪ One of ATR’s (OEM) longest-standing maintenance org. in EU with
capabilities for structural repairs for ATR and other regional aircraft
▪ Regional CoE hangar & workshop at Zone 1, Subang Airport
Progress: MoU signed. Assessment on site & high-level user
requirement capture ongoing
Urban air mobility▪ Pioneer in designing the first manned, fully electric and safe air taxi in
the world
▪ Feasibility of air taxi commercialization within Malaysia & Southeast Asia
Progress: MoU signed. Feasibility study to complete by 1Q22
End-to-end aircraft aftermarket service▪ 1st integrated aftermarket facility in Southeast Asia incl. MRO, aircraft
teardown, aircraft material recycling and parts trading
▪ Partnership between established international & local operators
Progress: MoU signed. Assessment on site & high-level user
requirement capture ongoing
Aerospace component OEM & MRO▪ One of world's largest OEM of aerospace component suppliers
▪ State-of-the-art component MRO facility in Subang Aerotech Park
▪ Tenure of 15+3+3 years with a yield of 7.5%
Progress: DO approved. Construction to commence in 2Q22
With the regeneration plan, at maturity, Subang Airport is estimated to unlock additional GFA of +8 mil sqft
20
KLIA Aeropolis, a vibrant and dynamic intermodal hubImmense opportunities to attract better yields with strategic partners Group Financial
PerformanceTY Financial
PerformanceOperating Statistics
Key Highlights
Business Updates
Traffic Outlook
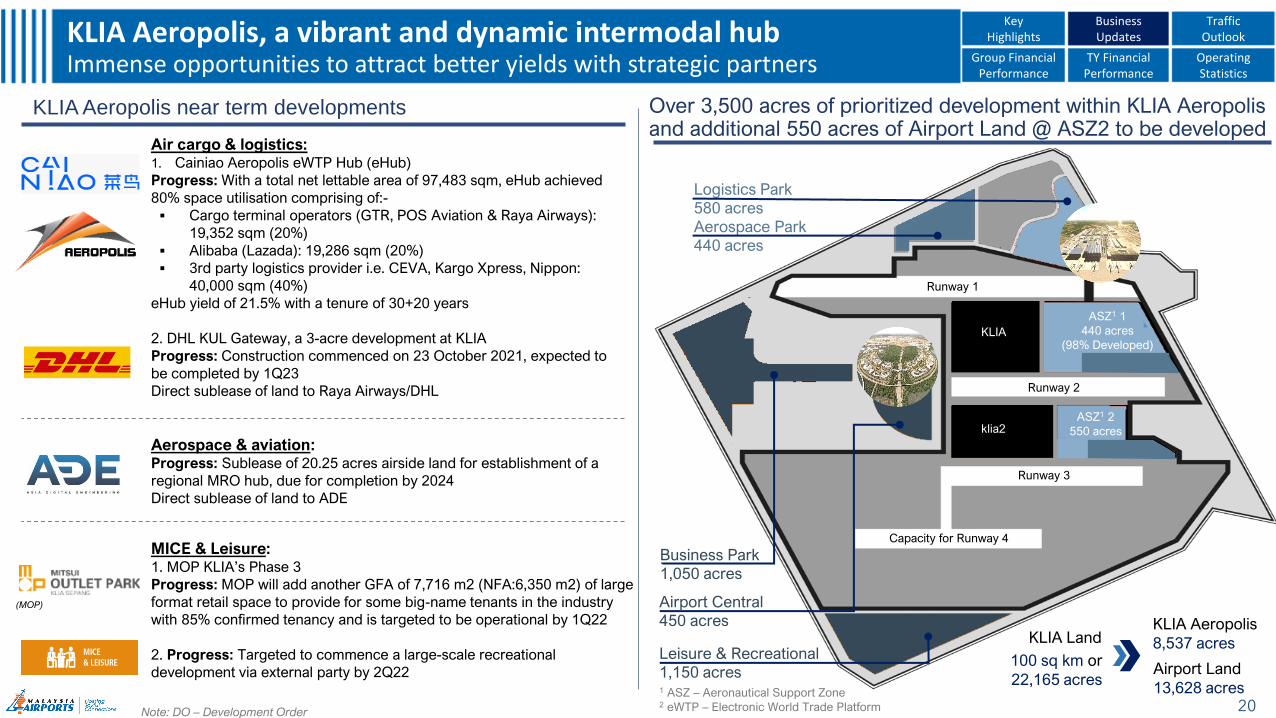
MICE & Leisure: 1. MOP KLIA’s Phase 3
Progress: MOP will add another GFA of 7,716 m2 (NFA:6,350 m2) of large
format retail space to provide for some big-name tenants in the industry
with 85% confirmed tenancy and is targeted to be operational by 1Q22
2. Progress: Targeted to commence a large-scale recreational
development via external party by 2Q22
KLIA Aeropolis near term developments
Air cargo & logistics:1. Cainiao Aeropolis eWTP Hub (eHub)
Progress: With a total net lettable area of 97,483 sqm, eHub achieved
80% space utilisation comprising of:-
▪ Cargo terminal operators (GTR, POS Aviation & Raya Airways):
19,352 sqm (20%)
▪ Alibaba (Lazada): 19,286 sqm (20%)
▪ 3rd party logistics provider i.e. CEVA, Kargo Xpress, Nippon:
40,000 sqm (40%)
eHub yield of 21.5% with a tenure of 30+20 years
2. DHL KUL Gateway, a 3-acre development at KLIA
Progress: Construction commenced on 23 October 2021, expected to
be completed by 1Q23
Direct sublease of land to Raya Airways/DHL
Aerospace & aviation: Progress: Sublease of 20.25 acres airside land for establishment of a
regional MRO hub, due for completion by 2024
Direct sublease of land to ADE
Note: DO – Development Order
(MOP)
Runway 3
Runway 2
Runway 1
Capacity for Runway 4
ASZ1 1
440 acres
(98% Developed)
ASZ1 2
550 acres
KLIA
klia2
Logistics Park580 acresAerospace Park440 acres
Business Park1,050 acres
Airport Central450 acres
Leisure & Recreational1,150 acres1 ASZ – Aeronautical Support Zone2 eWTP – Electronic World Trade Platform
KLIA Aeropolis
8,537 acres KLIA Land
Airport Land
13,628 acres
100 sq km or
22,165 acres
Over 3,500 acres of prioritized development within KLIA Aeropolis and additional 550 acres of Airport Land @ ASZ2 to be developed
Traffic Outlook
21
0.7 0.31.1
1.32.3
3.12.7
0.0
2.0
4.0
6.0
8.0
10.0
Jan Feb Mar Apr May Jun Jul Aug Sep Oct Nov Dec
2020
2021
2022
Malaysia total passenger traffic
25.8
10.7
1Q21 2Q21 3Q21 4Q21
2019 25.4 25.7 26.9 27.2
2020 18.4 0.8 4.5 2.1
2021 1.7 1.3 1.0 6.7
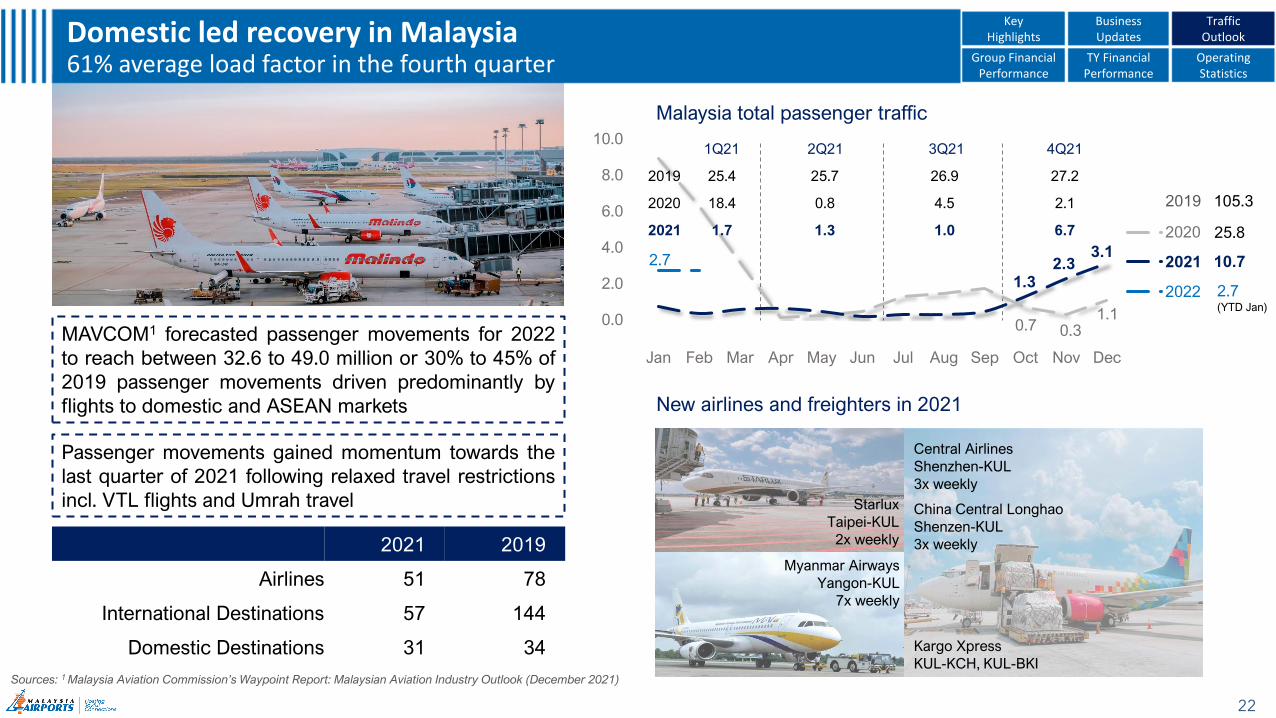
Domestic led recovery in Malaysia61% average load factor in the fourth quarter
Sources: 1 Malaysia Aviation Commission’s Waypoint Report: Malaysian Aviation Industry Outlook (December 2021)
22
MAVCOM1 forecasted passenger movements for 2022
to reach between 32.6 to 49.0 million or 30% to 45% of
2019 passenger movements driven predominantly by
flights to domestic and ASEAN markets
Group Financial Performance
TY Financial Performance
Operating Statistics
Key Highlights
Business Updates
Traffic Outlook
2021 2019
Airlines 51 78
International Destinations 57 144
Domestic Destinations 31 34
Passenger movements gained momentum towards the
last quarter of 2021 following relaxed travel restrictions
incl. VTL flights and Umrah travel
New airlines and freighters in 2021
Starlux
Taipei-KUL
2x weekly
Myanmar Airways
Yangon-KUL
7x weekly
Kargo Xpress
KUL-KCH, KUL-BKI
China Central Longhao
Shenzen-KUL
3x weekly
Central Airlines
Shenzhen-KUL
3x weekly
105.32019
2.7(YTD Jan)
Already above 70% fully vaccinated
Not on track to 70% fully vaccinated
On track to 70% fully vaccinated
No data
23
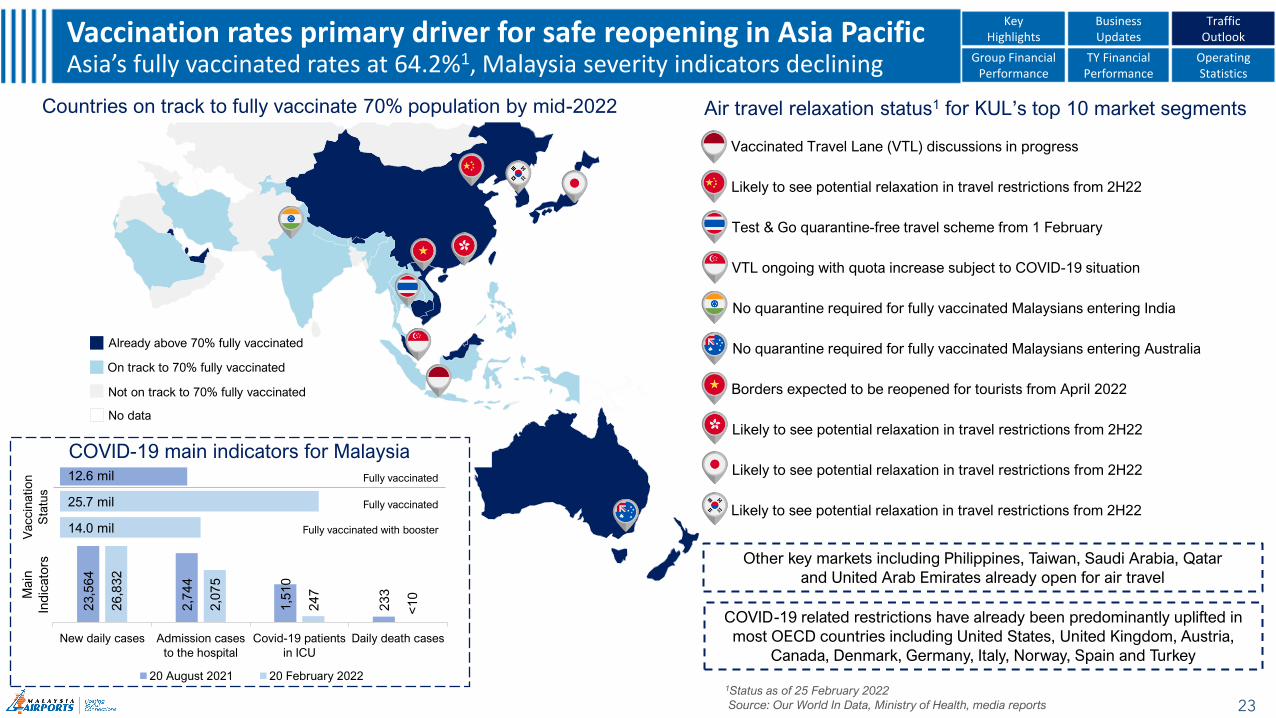
Vaccination rates primary driver for safe reopening in Asia PacificAsia’s fully vaccinated rates at 64.2%1, Malaysia severity indicators declining Group Financial
PerformanceTY Financial
PerformanceOperating Statistics
Key Highlights
Business Updates
Traffic Outlook
1Status as of 25 February 2022
Source: Our World In Data, Ministry of Health, media reports
COVID-19 related restrictions have already been predominantly uplifted in
most OECD countries including United States, United Kingdom, Austria,
Canada, Denmark, Germany, Italy, Norway, Spain and Turkey
Other key markets including Philippines, Taiwan, Saudi Arabia, Qatar
and United Arab Emirates already open for air travel
23
,56
4
2,7
44
1,5
10
23
3
26
,83
2
2,0
75
24
7
<1
0
New daily cases Admission cases
to the hospital
Covid-19 patients
in ICU
Daily death cases
Main
Ind
icato
rs
20 August 2021 20 February 2022
14.0 mil
25.7 mil
12.6 mil
Vaccin
atio
n
Sta
tus
COVID-19 main indicators for Malaysia
Fully vaccinated
Fully vaccinated
Fully vaccinated with booster
Countries on track to fully vaccinate 70% population by mid-2022 Air travel relaxation status1 for KUL’s top 10 market segments
▪ Test & Go quarantine-free travel scheme from 1 February
▪ VTL ongoing with quota increase subject to COVID-19 situation
▪ Likely to see potential relaxation in travel restrictions from 2H22
▪ Borders expected to be reopened for tourists from April 2022
▪ No quarantine required for fully vaccinated Malaysians entering Australia
▪ Likely to see potential relaxation in travel restrictions from 2H22
▪ No quarantine required for fully vaccinated Malaysians entering India
▪ Likely to see potential relaxation in travel restrictions from 2H22
▪ Vaccinated Travel Lane (VTL) discussions in progress
▪ Likely to see potential relaxation in travel restrictions from 2H22
740
1,150
2,290
1,570
3,600
3,370
6,350
6,490
7,100
240
140
220
1,320
770
1,080
790
1,650
1,460
0 2,000 4,000 6,000 8,000
Africa
Russia & Central Asia
Latin America
Middle East
ASEAN
Asia Pacific
North America
China
Europe
Single Aisle
Widebody
*
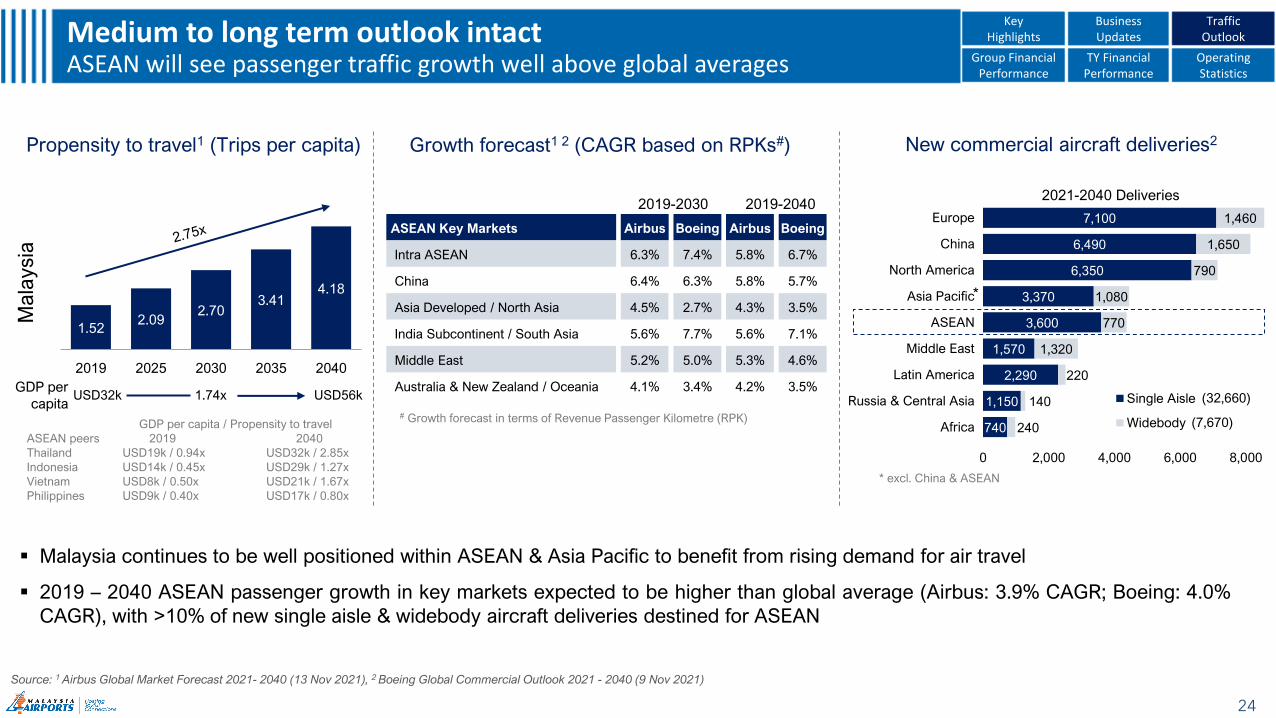
Medium to long term outlook intactASEAN will see passenger traffic growth well above global averages
24
Group Financial Performance
TY Financial Performance
Operating Statistics
Key Highlights
Business Updates
Traffic Outlook
1.522.09
2.703.41
4.18
2019 2025 2030 2035 2040
Mala
ysia
ASEAN Key Markets Airbus Boeing Airbus Boeing
Intra ASEAN 6.3% 7.4% 5.8% 6.7%
China 6.4% 6.3% 5.8% 5.7%
Asia Developed / North Asia 4.5% 2.7% 4.3% 3.5%
India Subcontinent / South Asia 5.6% 7.7% 5.6% 7.1%
Middle East 5.2% 5.0% 5.3% 4.6%
Australia & New Zealand / Oceania 4.1% 3.4% 4.2% 3.5%
2019-2030 2019-2040
GDP per
capitaUSD32k 1.74x USD56k
Propensity to travel1 (Trips per capita) Growth forecast1 2 (CAGR based on RPKs#) New commercial aircraft deliveries2
2021-2040 Deliveries
(32,660)
(7,670)
* excl. China & ASEAN
▪ Malaysia continues to be well positioned within ASEAN & Asia Pacific to benefit from rising demand for air travel
▪ 2019 – 2040 ASEAN passenger growth in key markets expected to be higher than global average (Airbus: 3.9% CAGR; Boeing: 4.0%
CAGR), with >10% of new single aisle & widebody aircraft deliveries destined for ASEAN
GDP per capita / Propensity to travel
ASEAN peers 2019 2040
Thailand USD19k / 0.94x USD32k / 2.85x
Indonesia USD14k / 0.45x USD29k / 1.27x
Vietnam USD8k / 0.50x USD21k / 1.67x
Philippines USD9k / 0.40x USD17k / 0.80x
# Growth forecast in terms of Revenue Passenger Kilometre (RPK)
Source: 1 Airbus Global Market Forecast 2021- 2040 (13 Nov 2021), 2 Boeing Global Commercial Outlook 2021 - 2040 (9 Nov 2021)
3.22.9 2.9
1.91.5
1.2
2.82.4 2.2
2.0
0.0
1.0
2.0
3.0
4.0
1 2 3 4 5 6 7 8 9 10 11 12
2019
2020
2021
2022
17.2
36.0
25.4
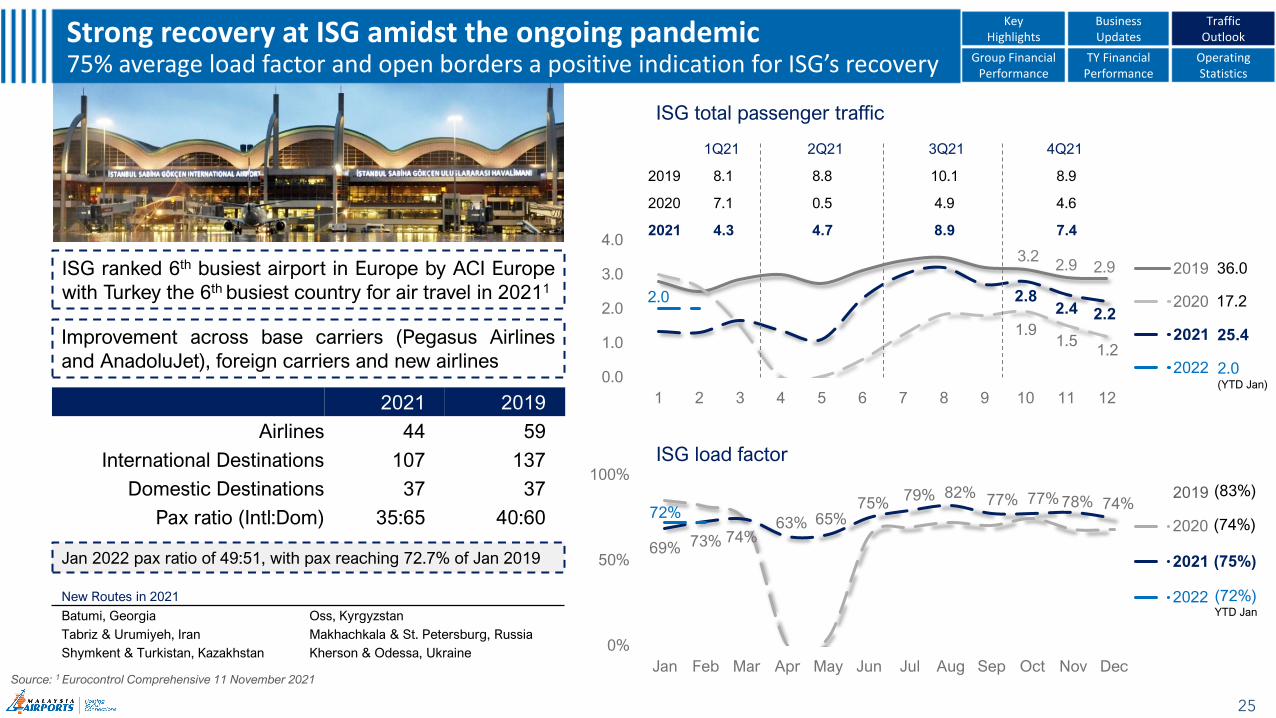
Strong recovery at ISG amidst the ongoing pandemic 75% average load factor and open borders a positive indication for ISG’s recovery
Source: 1 Eurocontrol Comprehensive 11 November 2021
25
Improvement across base carriers (Pegasus Airlines
and AnadoluJet), foreign carriers and new airlines
ISG ranked 6th busiest airport in Europe by ACI Europe
with Turkey the 6th busiest country for air travel in 20211
Group Financial Performance
TY Financial Performance
Operating Statistics
Key Highlights
Business Updates
TrafficOutlook
2021 2019
Airlines 44 59
International Destinations 107 137
Domestic Destinations 37 37
Pax ratio (Intl:Dom) 35:65 40:60
New Routes in 2021
Batumi, Georgia Oss, Kyrgyzstan
Tabriz & Urumiyeh, Iran Makhachkala & St. Petersburg, Russia
Shymkent & Turkistan, Kazakhstan Kherson & Odessa, Ukraine
Jan 2022 pax ratio of 49:51, with pax reaching 72.7% of Jan 2019
ISG load factor
69% 73% 74%63% 65%
75%79% 82% 77% 77% 78% 74%
72%
0%
50%
100%
Jan Feb Mar Apr May Jun Jul Aug Sep Oct Nov Dec
2020
2021
2022
2019 (83%)
(75%)
(74%)
(72%)YTD Jan
2.0(YTD Jan)
ISG total passenger traffic
1Q21 2Q21 3Q21 4Q21
2019 8.1 8.8 10.1 8.9
2020 7.1 0.5 4.9 4.6
2021 4.3 4.7 8.9 7.4
26
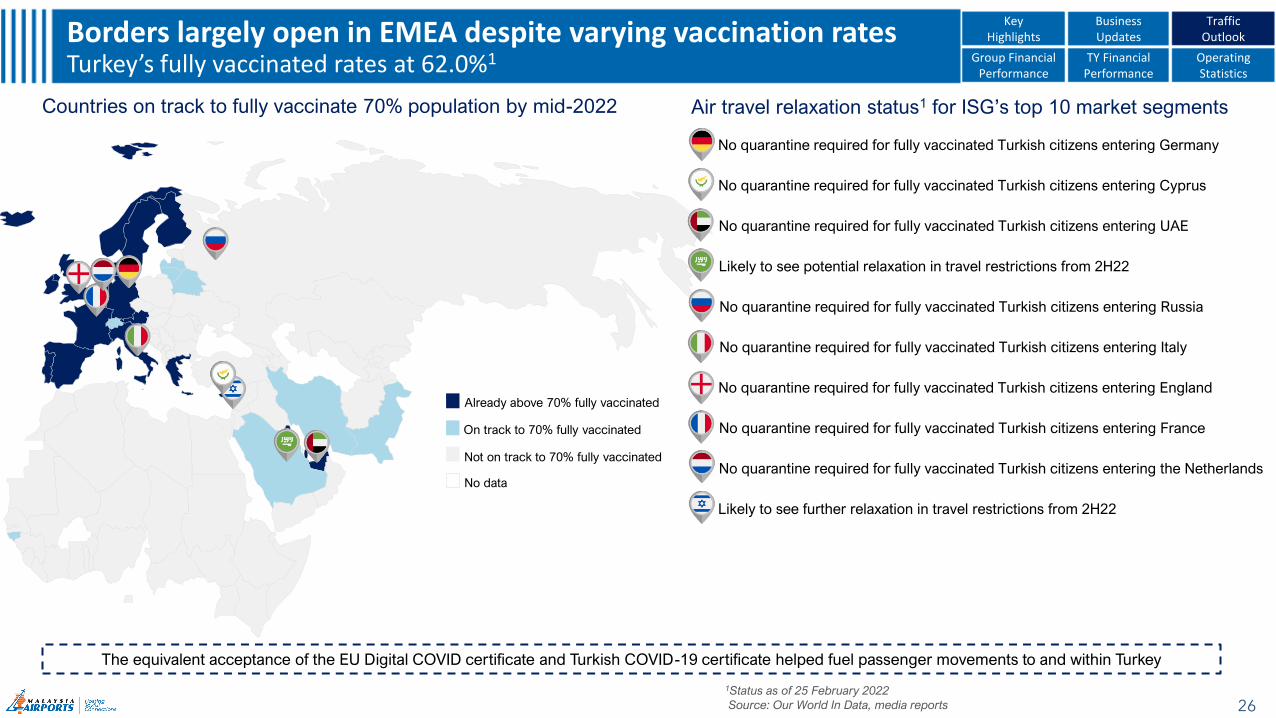
Borders largely open in EMEA despite varying vaccination rates Turkey’s fully vaccinated rates at 62.0%1 Group Financial
PerformanceTY Financial
PerformanceOperating Statistics
Key Highlights
Business Updates
Traffic Outlook
1Status as of 25 February 2022
Source: Our World In Data, media reports
The equivalent acceptance of the EU Digital COVID certificate and Turkish COVID-19 certificate helped fuel passenger movements to and within Turkey
Countries on track to fully vaccinate 70% population by mid-2022
Already above 70% fully vaccinated
Not on track to 70% fully vaccinated
On track to 70% fully vaccinated
No data
Air travel relaxation status1 for ISG’s top 10 market segments
▪ No quarantine required for fully vaccinated Turkish citizens entering Russia
▪ No quarantine required for fully vaccinated Turkish citizens entering Italy
▪ No quarantine required for fully vaccinated Turkish citizens entering England
▪ Likely to see further relaxation in travel restrictions from 2H22
▪ No quarantine required for fully vaccinated Turkish citizens entering Germany
▪ No quarantine required for fully vaccinated Turkish citizens entering Cyprus
▪ No quarantine required for fully vaccinated Turkish citizens entering UAE
▪ Likely to see potential relaxation in travel restrictions from 2H22
▪ No quarantine required for fully vaccinated Turkish citizens entering France
▪ No quarantine required for fully vaccinated Turkish citizens entering the Netherlands
740
1,150
2,290
1,570
3,600
3,370
6,350
6,490
7,100
240
140
220
1,320
770
1,080
790
1,650
1,460
0 2,000 4,000 6,000 8,000
Africa
Russia & Central Asia
Latin America
Middle East
ASEAN
Asia Pacific
North America
China
Europe
Single Aisle
Widebody
*
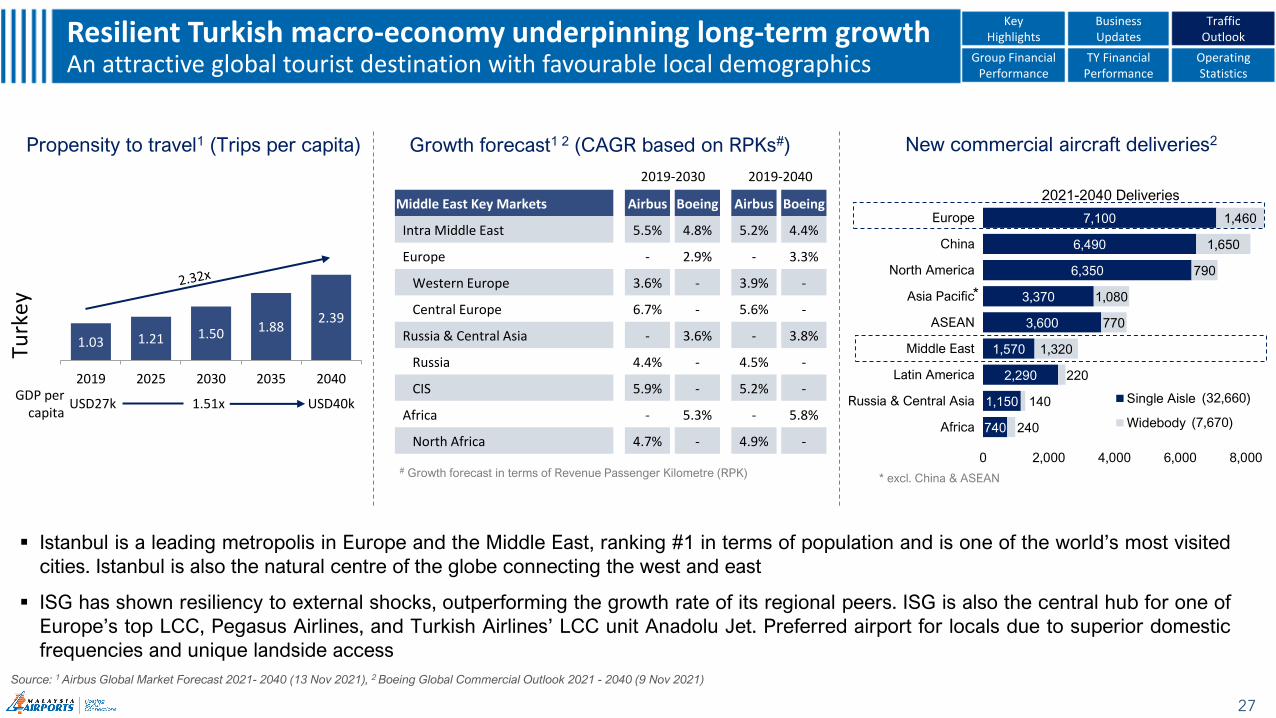
Resilient Turkish macro-economy underpinning long-term growth An attractive global tourist destination with favourable local demographics
27
Group Financial Performance
TY Financial Performance
Operating Statistics
Key Highlights
Business Updates
TrafficOutlook
Propensity to travel1 (Trips per capita) Growth forecast1 2 (CAGR based on RPKs#) New commercial aircraft deliveries2
2021-2040 Deliveries
(32,660)
(7,670)
* excl. China & ASEAN
▪ Istanbul is a leading metropolis in Europe and the Middle East, ranking #1 in terms of population and is one of the world’s most visited
cities. Istanbul is also the natural centre of the globe connecting the west and east
▪ ISG has shown resiliency to external shocks, outperforming the growth rate of its regional peers. ISG is also the central hub for one of
Europe’s top LCC, Pegasus Airlines, and Turkish Airlines’ LCC unit Anadolu Jet. Preferred airport for locals due to superior domestic
frequencies and unique landside access
# Growth forecast in terms of Revenue Passenger Kilometre (RPK)
Source: 1 Airbus Global Market Forecast 2021- 2040 (13 Nov 2021), 2 Boeing Global Commercial Outlook 2021 - 2040 (9 Nov 2021)
1.03 1.21 1.50 1.882.39
2019 2025 2030 2035 2040
Turk
ey
2019-2030 2019-2040
Middle East Key Markets Airbus Boeing Airbus Boeing
Intra Middle East 5.5% 4.8% 5.2% 4.4%
Europe - 2.9% - 3.3%
Western Europe 3.6% - 3.9% -
Central Europe 6.7% - 5.6% -
Russia & Central Asia - 3.6% - 3.8%
Russia 4.4% - 4.5% -
CIS 5.9% - 5.2% -
Africa - 5.3% - 5.8%
North Africa 4.7% - 4.9% -
GDP per capita
USD27k 1.51x USD40k
28
Appendix
29
Group Financial
Performance
RM mil
FY21 FY20
Variance % Variance % Variance %MY TY MY TY
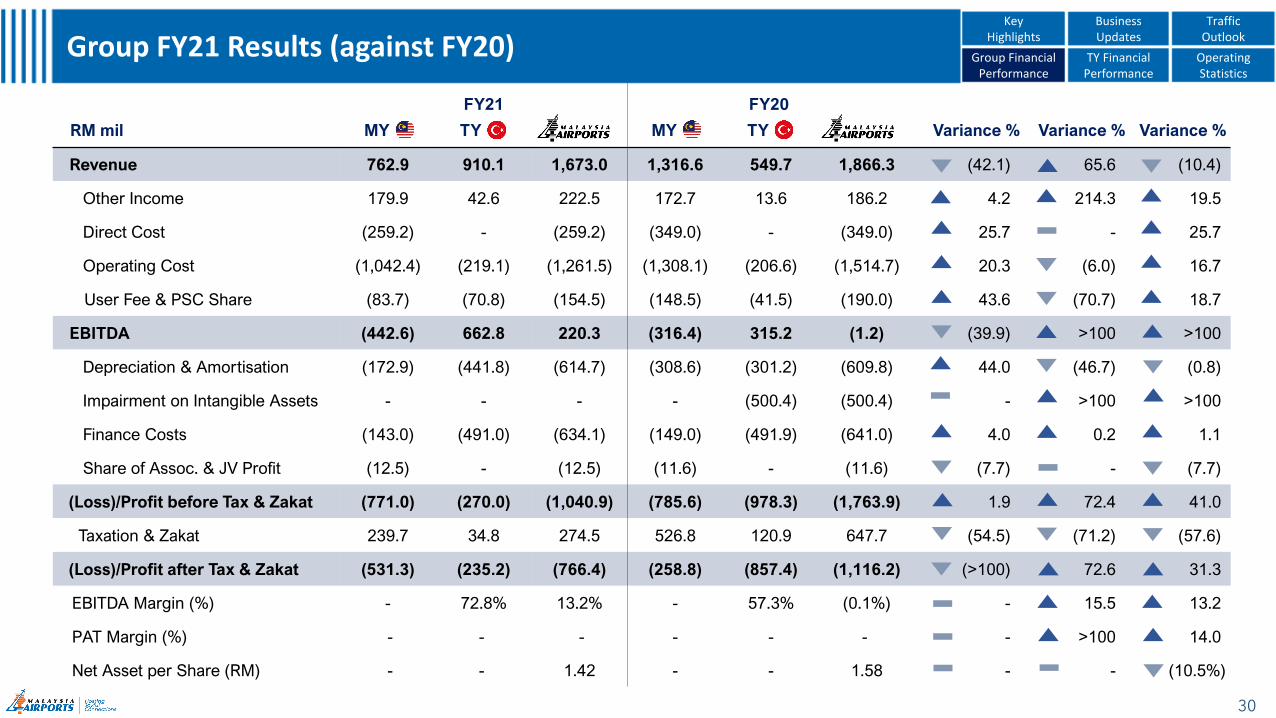
Revenue 762.9 910.1 1,673.0 1,316.6 549.7 1,866.3 (42.1) 65.6 (10.4)
Other Income 179.9 42.6 222.5 172.7 13.6 186.2 4.2 214.3 19.5
Direct Cost (259.2) - (259.2) (349.0) - (349.0) 25.7 - 25.7
Operating Cost (1,042.4) (219.1) (1,261.5) (1,308.1) (206.6) (1,514.7) 20.3 (6.0) 16.7
User Fee & PSC Share (83.7) (70.8) (154.5) (148.5) (41.5) (190.0) 43.6 (70.7) 18.7
EBITDA (442.6) 662.8 220.3 (316.4) 315.2 (1.2) (39.9) >100 >100
Depreciation & Amortisation (172.9) (441.8) (614.7) (308.6) (301.2) (609.8) 44.0 (46.7) (0.8)
Impairment on Intangible Assets - - - - (500.4) (500.4) - >100 >100
Finance Costs (143.0) (491.0) (634.1) (149.0) (491.9) (641.0) 4.0 0.2 1.1
Share of Assoc. & JV Profit (12.5) - (12.5) (11.6) - (11.6) (7.7) - (7.7)
(Loss)/Profit before Tax & Zakat (771.0) (270.0) (1,040.9) (785.6) (978.3) (1,763.9) 1.9 72.4 41.0
Taxation & Zakat 239.7 34.8 274.5 526.8 120.9 647.7 (54.5) (71.2) (57.6)
(Loss)/Profit after Tax & Zakat (531.3) (235.2) (766.4) (258.8) (857.4) (1,116.2) (>100) 72.6 31.3
EBITDA Margin (%) - 72.8% 13.2% - 57.3% (0.1%) - 15.5 13.2
PAT Margin (%) - - - - - - - >100 14.0
Net Asset per Share (RM) - - 1.42 - - 1.58 - - (10.5%)
30
Group FY21 Results (against FY20) Group Financial Performance
TY Financial Performance
Operating Statistics
Key Highlights
Business Updates
Traffic Outlook
RM mil
FY21 FY20
Variance % Variance % Variance %MY TY MY TY
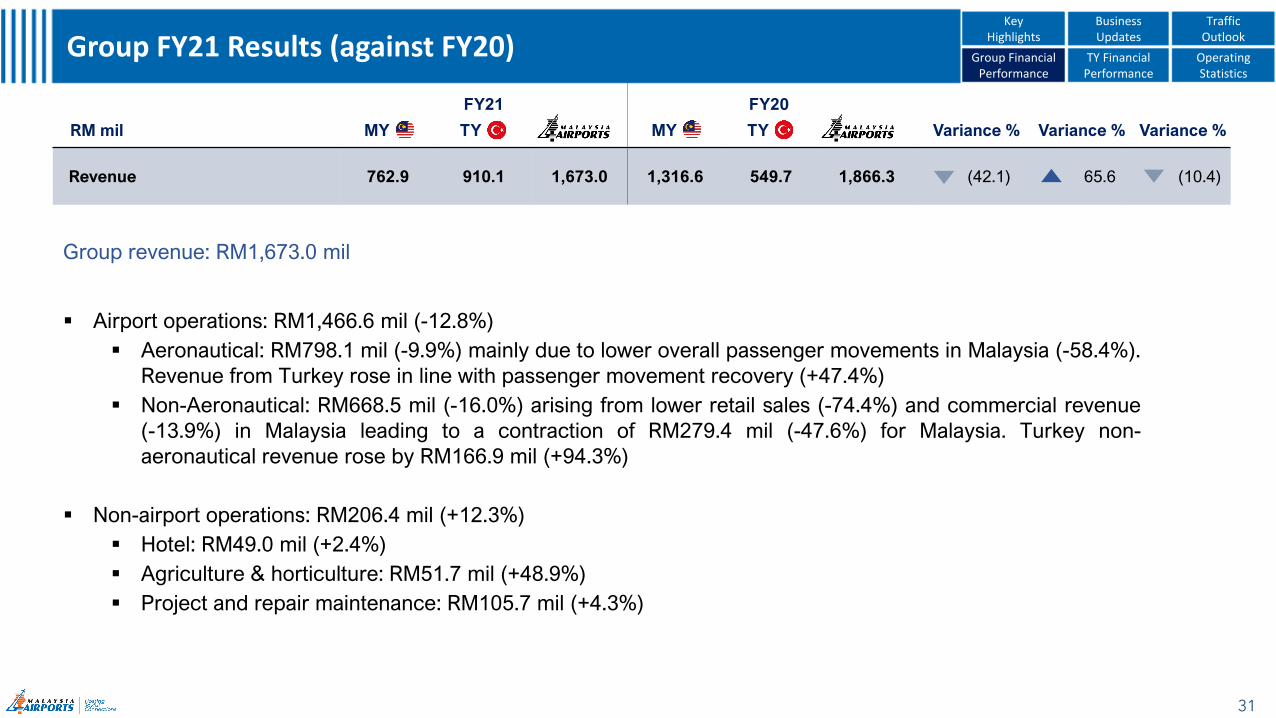
Revenue 762.9 910.1 1,673.0 1,316.6 549.7 1,866.3 (42.1) 65.6 (10.4)
31
Group FY21 Results (against FY20) Group Financial Performance
TY Financial Performance
Operating Statistics
Key Highlights
Business Updates
Traffic Outlook
Group revenue: RM1,673.0 mil
▪ Airport operations: RM1,466.6 mil (-12.8%)
▪ Aeronautical: RM798.1 mil (-9.9%) mainly due to lower overall passenger movements in Malaysia (-58.4%).
Revenue from Turkey rose in line with passenger movement recovery (+47.4%)
▪ Non-Aeronautical: RM668.5 mil (-16.0%) arising from lower retail sales (-74.4%) and commercial revenue
(-13.9%) in Malaysia leading to a contraction of RM279.4 mil (-47.6%) for Malaysia. Turkey non-
aeronautical revenue rose by RM166.9 mil (+94.3%)
▪ Non-airport operations: RM206.4 mil (+12.3%)
▪ Hotel: RM49.0 mil (+2.4%)
▪ Agriculture & horticulture: RM51.7 mil (+48.9%)
▪ Project and repair maintenance: RM105.7 mil (+4.3%)
RM mil
FY21 FY20
Variance % Variance % Variance %MY TY MY TY
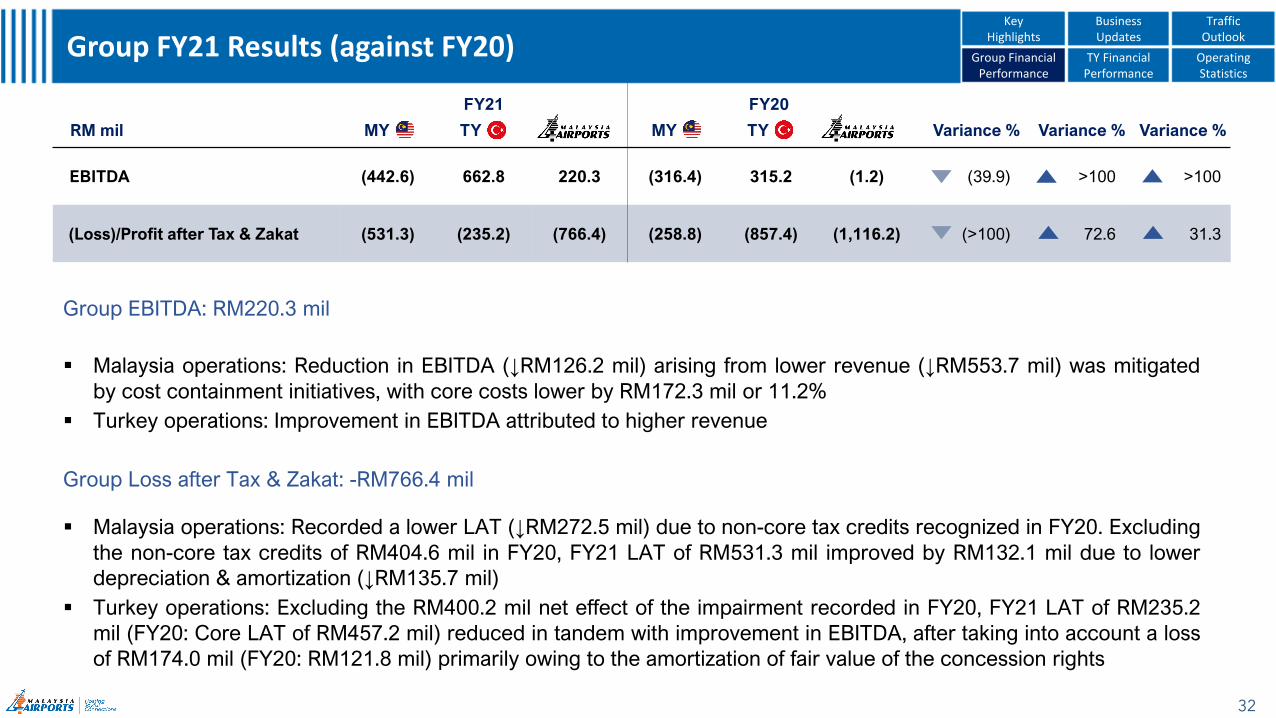
EBITDA (442.6) 662.8 220.3 (316.4) 315.2 (1.2) (39.9) >100 >100
(Loss)/Profit after Tax & Zakat (531.3) (235.2) (766.4) (258.8) (857.4) (1,116.2) (>100) 72.6 31.3
32
Group FY21 Results (against FY20) Group Financial Performance
TY Financial Performance
Operating Statistics
Key Highlights
Business Updates
Traffic Outlook
Group EBITDA: RM220.3 mil
▪ Malaysia operations: Reduction in EBITDA (↓RM126.2 mil) arising from lower revenue (↓RM553.7 mil) was mitigated
by cost containment initiatives, with core costs lower by RM172.3 mil or 11.2%
▪ Turkey operations: Improvement in EBITDA attributed to higher revenue
Group Loss after Tax & Zakat: -RM766.4 mil
▪ Malaysia operations: Recorded a lower LAT (↓RM272.5 mil) due to non-core tax credits recognized in FY20. Excluding
the non-core tax credits of RM404.6 mil in FY20, FY21 LAT of RM531.3 mil improved by RM132.1 mil due to lower
depreciation & amortization (↓RM135.7 mil)
▪ Turkey operations: Excluding the RM400.2 mil net effect of the impairment recorded in FY20, FY21 LAT of RM235.2
mil (FY20: Core LAT of RM457.2 mil) reduced in tandem with improvement in EBITDA, after taking into account a loss
of RM174.0 mil (FY20: RM121.8 mil) primarily owing to the amortization of fair value of the concession rights
RM mil
4Q21 4Q20
Variance % Variance % Variance %MY TY MY TY
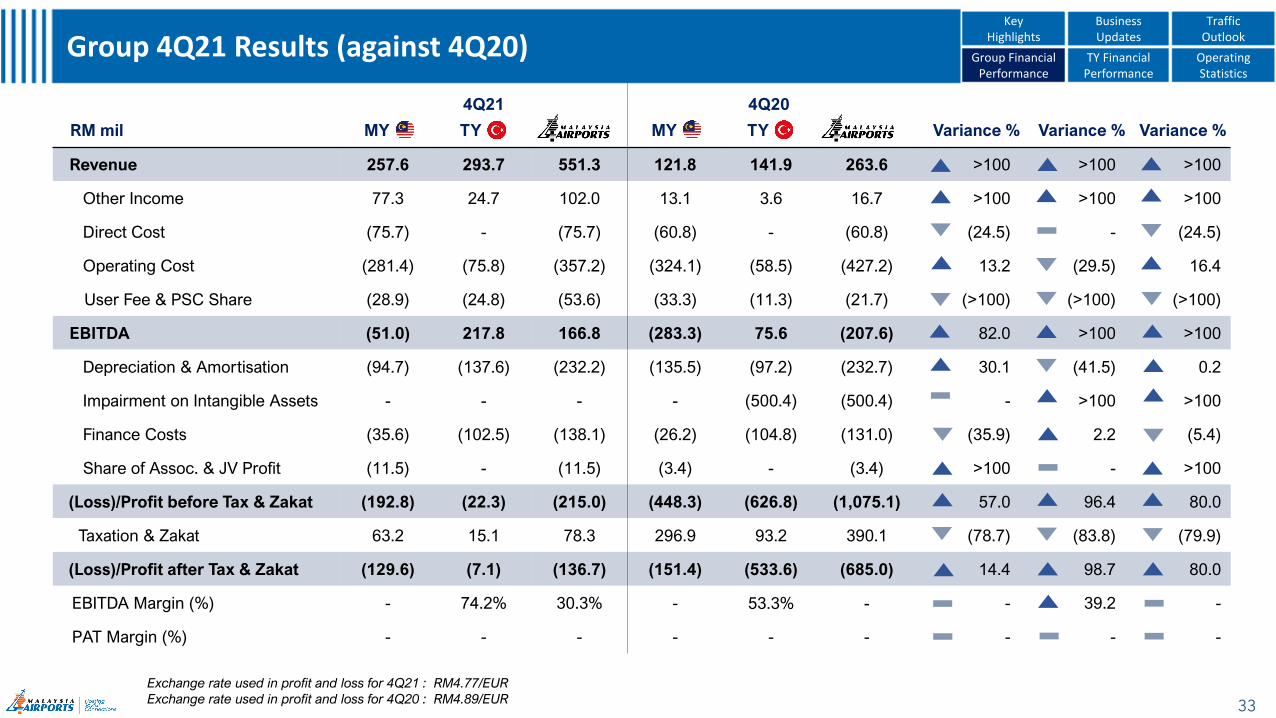
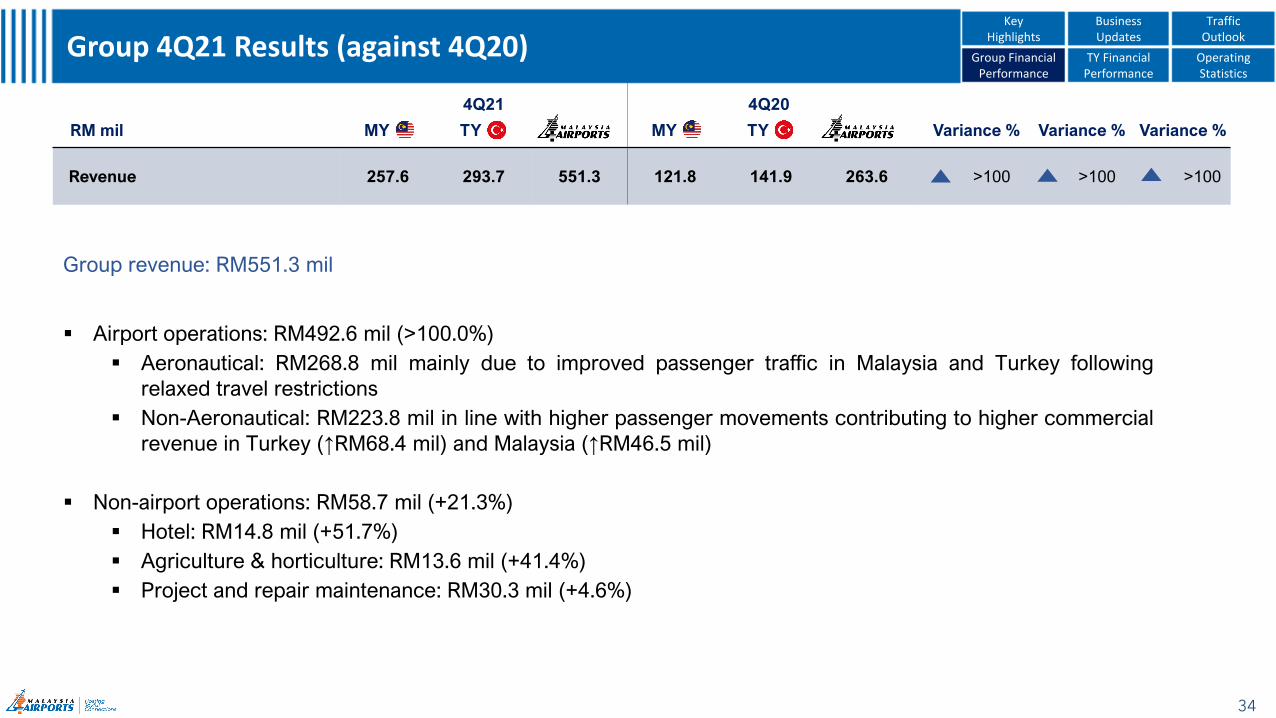
Revenue 257.6 293.7 551.3 121.8 141.9 263.6 >100 >100 >100
Other Income 77.3 24.7 102.0 13.1 3.6 16.7 >100 >100 >100
Direct Cost (75.7) - (75.7) (60.8) - (60.8) (24.5) - (24.5)
Operating Cost (281.4) (75.8) (357.2) (324.1) (58.5) (427.2) 13.2 (29.5) 16.4
User Fee & PSC Share (28.9) (24.8) (53.6) (33.3) (11.3) (21.7) (>100) (>100) (>100)
EBITDA (51.0) 217.8 166.8 (283.3) 75.6 (207.6) 82.0 >100 >100
Depreciation & Amortisation (94.7) (137.6) (232.2) (135.5) (97.2) (232.7) 30.1 (41.5) 0.2
Impairment on Intangible Assets - - - - (500.4) (500.4) - >100 >100
Finance Costs (35.6) (102.5) (138.1) (26.2) (104.8) (131.0) (35.9) 2.2 (5.4)
Share of Assoc. & JV Profit (11.5) - (11.5) (3.4) - (3.4) >100 - >100
(Loss)/Profit before Tax & Zakat (192.8) (22.3) (215.0) (448.3) (626.8) (1,075.1) 57.0 96.4 80.0
Taxation & Zakat 63.2 15.1 78.3 296.9 93.2 390.1 (78.7) (83.8) (79.9)
(Loss)/Profit after Tax & Zakat (129.6) (7.1) (136.7) (151.4) (533.6) (685.0) 14.4 98.7 80.0
EBITDA Margin (%) - 74.2% 30.3% - 53.3% - - 39.2 -
PAT Margin (%) - - - - - - - - -
33
Group 4Q21 Results (against 4Q20) Group Financial Performance
TY Financial Performance
Operating Statistics
Key Highlights
Business Updates
Traffic Outlook
Exchange rate used in profit and loss for 4Q21 : RM4.77/EUR
Exchange rate used in profit and loss for 4Q20 : RM4.89/EUR
RM mil
4Q21 4Q20
Variance % Variance % Variance %MY TY MY TY
Revenue 257.6 293.7 551.3 121.8 141.9 263.6 >100 >100 >100
34
Group 4Q21 Results (against 4Q20) Group Financial Performance
TY Financial Performance
Operating Statistics
Key Highlights
Business Updates
Traffic Outlook
Group revenue: RM551.3 mil
▪ Airport operations: RM492.6 mil (>100.0%)
▪ Aeronautical: RM268.8 mil mainly due to improved passenger traffic in Malaysia and Turkey following
relaxed travel restrictions
▪ Non-Aeronautical: RM223.8 mil in line with higher passenger movements contributing to higher commercial
revenue in Turkey (↑RM68.4 mil) and Malaysia (↑RM46.5 mil)
▪ Non-airport operations: RM58.7 mil (+21.3%)
▪ Hotel: RM14.8 mil (+51.7%)
▪ Agriculture & horticulture: RM13.6 mil (+41.4%)
▪ Project and repair maintenance: RM30.3 mil (+4.6%)
RM mil
4Q21 4Q20
Variance % Variance % Variance %MY TY MY TY
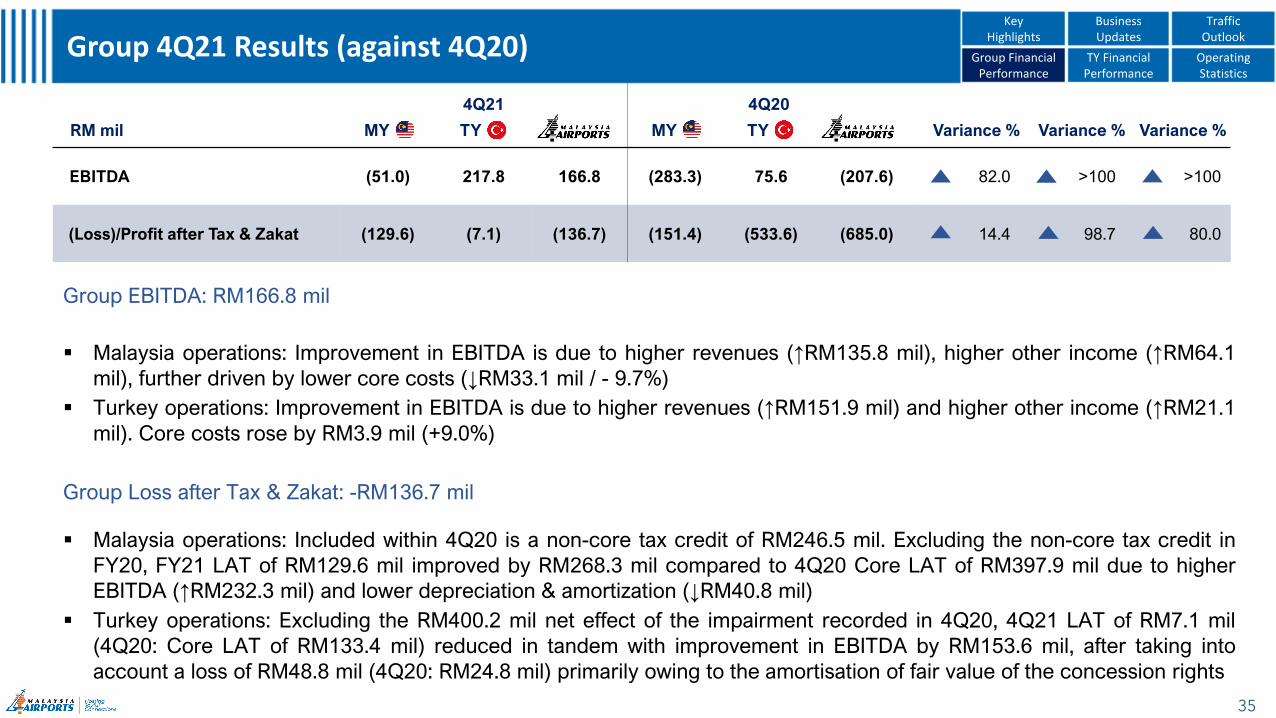
EBITDA (51.0) 217.8 166.8 (283.3) 75.6 (207.6) 82.0 >100 >100
(Loss)/Profit after Tax & Zakat (129.6) (7.1) (136.7) (151.4) (533.6) (685.0) 14.4 98.7 80.0
35
Group 4Q21 Results (against 4Q20) Group Financial Performance
TY Financial Performance
Operating Statistics
Key Highlights
Business Updates
Traffic Outlook
Group EBITDA: RM166.8 mil
▪ Malaysia operations: Improvement in EBITDA is due to higher revenues (↑RM135.8 mil), higher other income (↑RM64.1
mil), further driven by lower core costs (↓RM33.1 mil / - 9.7%)
▪ Turkey operations: Improvement in EBITDA is due to higher revenues (↑RM151.9 mil) and higher other income (↑RM21.1
mil). Core costs rose by RM3.9 mil (+9.0%)
Group Loss after Tax & Zakat: -RM136.7 mil
▪ Malaysia operations: Included within 4Q20 is a non-core tax credit of RM246.5 mil. Excluding the non-core tax credit in
FY20, FY21 LAT of RM129.6 mil improved by RM268.3 mil compared to 4Q20 Core LAT of RM397.9 mil due to higher
EBITDA (↑RM232.3 mil) and lower depreciation & amortization (↓RM40.8 mil)
▪ Turkey operations: Excluding the RM400.2 mil net effect of the impairment recorded in 4Q20, 4Q21 LAT of RM7.1 mil
(4Q20: Core LAT of RM133.4 mil) reduced in tandem with improvement in EBITDA by RM153.6 mil, after taking into
account a loss of RM48.8 mil (4Q20: RM24.8 mil) primarily owing to the amortisation of fair value of the concession rights
RM mil
4Q21 3Q21
Variance % Variance % Variance %MY TY MY TY
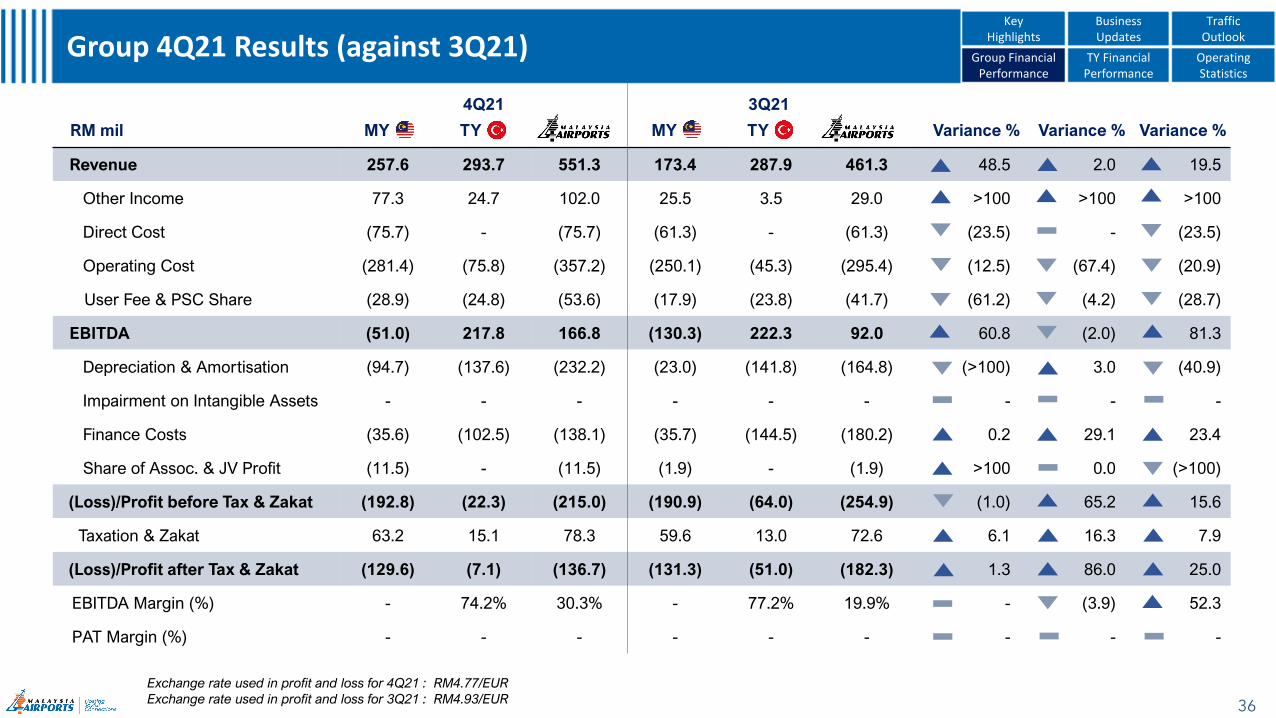
Revenue 257.6 293.7 551.3 173.4 287.9 461.3 48.5 2.0 19.5
Other Income 77.3 24.7 102.0 25.5 3.5 29.0 >100 >100 >100
Direct Cost (75.7) - (75.7) (61.3) - (61.3) (23.5) - (23.5)
Operating Cost (281.4) (75.8) (357.2) (250.1) (45.3) (295.4) (12.5) (67.4) (20.9)
User Fee & PSC Share (28.9) (24.8) (53.6) (17.9) (23.8) (41.7) (61.2) (4.2) (28.7)
EBITDA (51.0) 217.8 166.8 (130.3) 222.3 92.0 60.8 (2.0) 81.3
Depreciation & Amortisation (94.7) (137.6) (232.2) (23.0) (141.8) (164.8) (>100) 3.0 (40.9)
Impairment on Intangible Assets - - - - - - - - -
Finance Costs (35.6) (102.5) (138.1) (35.7) (144.5) (180.2) 0.2 29.1 23.4
Share of Assoc. & JV Profit (11.5) - (11.5) (1.9) - (1.9) >100 0.0 (>100)
(Loss)/Profit before Tax & Zakat (192.8) (22.3) (215.0) (190.9) (64.0) (254.9) (1.0) 65.2 15.6
Taxation & Zakat 63.2 15.1 78.3 59.6 13.0 72.6 6.1 16.3 7.9
(Loss)/Profit after Tax & Zakat (129.6) (7.1) (136.7) (131.3) (51.0) (182.3) 1.3 86.0 25.0
EBITDA Margin (%) - 74.2% 30.3% - 77.2% 19.9% - (3.9) 52.3
PAT Margin (%) - - - - - - - - -
36
Group 4Q21 Results (against 3Q21) Group Financial Performance
TY Financial Performance
Operating Statistics
Key Highlights
Business Updates
Traffic Outlook
Exchange rate used in profit and loss for 4Q21 : RM4.77/EUR
Exchange rate used in profit and loss for 3Q21 : RM4.93/EUR
RM mil
4Q21 3Q21
Variance % Variance % Variance %MY TY MY TY
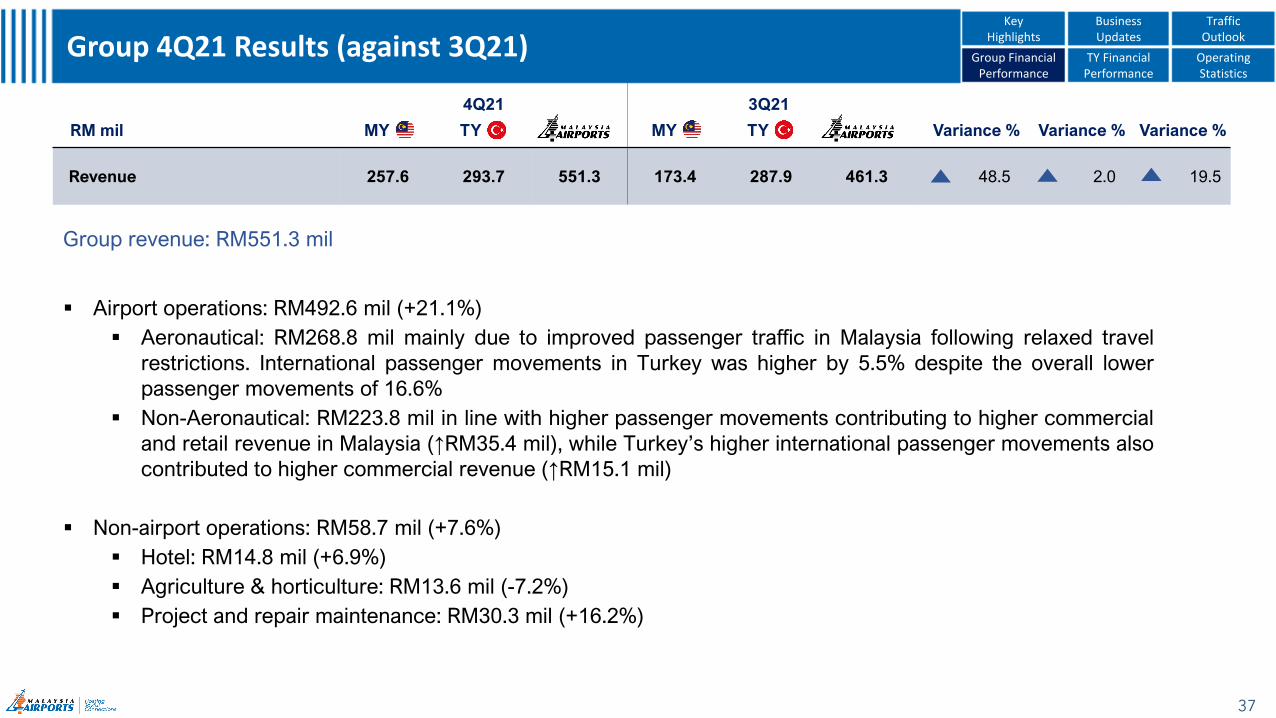
Revenue 257.6 293.7 551.3 173.4 287.9 461.3 48.5 2.0 19.5
37
Group 4Q21 Results (against 3Q21) Group Financial Performance
TY Financial Performance
Operating Statistics
Key Highlights
Business Updates
Traffic Outlook
Group revenue: RM551.3 mil
▪ Airport operations: RM492.6 mil (+21.1%)
▪ Aeronautical: RM268.8 mil mainly due to improved passenger traffic in Malaysia following relaxed travel
restrictions. International passenger movements in Turkey was higher by 5.5% despite the overall lower
passenger movements of 16.6%
▪ Non-Aeronautical: RM223.8 mil in line with higher passenger movements contributing to higher commercial
and retail revenue in Malaysia (↑RM35.4 mil), while Turkey’s higher international passenger movements also
contributed to higher commercial revenue (↑RM15.1 mil)
▪ Non-airport operations: RM58.7 mil (+7.6%)
▪ Hotel: RM14.8 mil (+6.9%)
▪ Agriculture & horticulture: RM13.6 mil (-7.2%)
▪ Project and repair maintenance: RM30.3 mil (+16.2%)
RM mil
4Q21 3Q21
Variance % Variance % Variance %MY TY MY TY
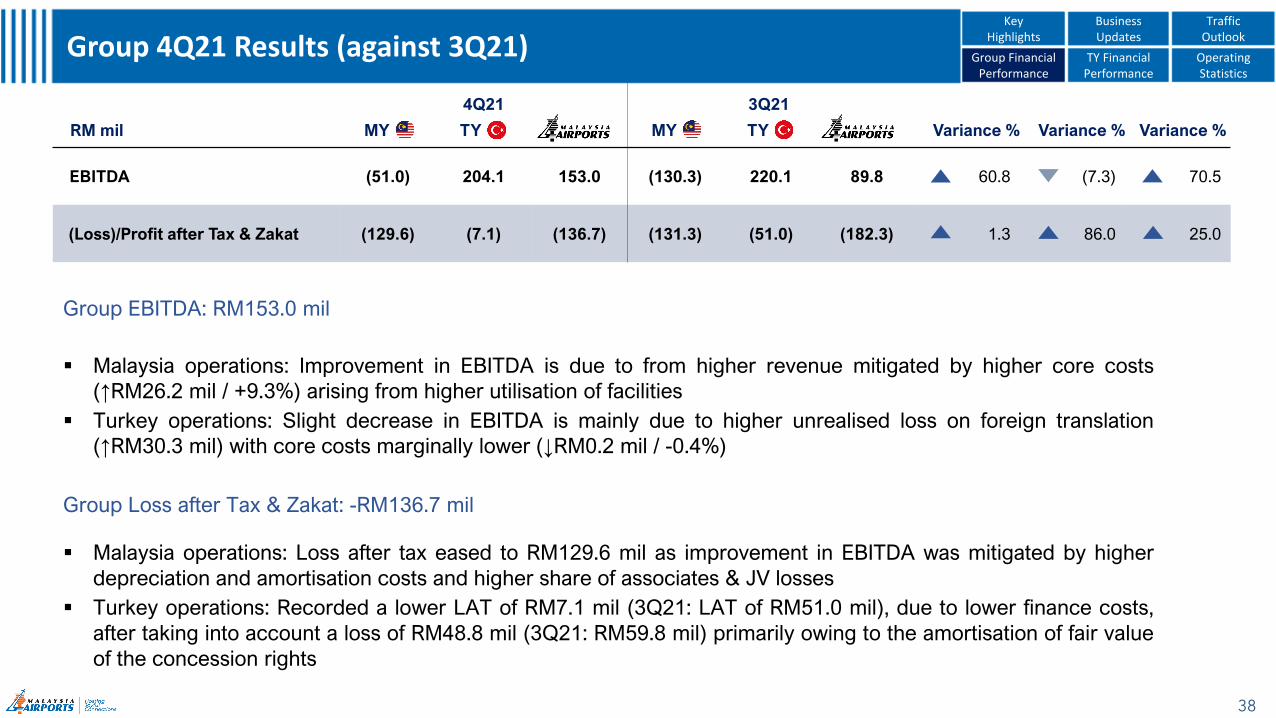
EBITDA (51.0) 204.1 153.0 (130.3) 220.1 89.8 60.8 (7.3) 70.5
(Loss)/Profit after Tax & Zakat (129.6) (7.1) (136.7) (131.3) (51.0) (182.3) 1.3 86.0 25.0
38
Group 4Q21 Results (against 3Q21) Group Financial Performance
TY Financial Performance
Operating Statistics
Key Highlights
Business Updates
Traffic Outlook
Group EBITDA: RM153.0 mil
▪ Malaysia operations: Improvement in EBITDA is due to from higher revenue mitigated by higher core costs
(↑RM26.2 mil / +9.3%) arising from higher utilisation of facilities
▪ Turkey operations: Slight decrease in EBITDA is mainly due to higher unrealised loss on foreign translation
(↑RM30.3 mil) with core costs marginally lower (↓RM0.2 mil / -0.4%)
Group Loss after Tax & Zakat: -RM136.7 mil
▪ Malaysia operations: Loss after tax eased to RM129.6 mil as improvement in EBITDA was mitigated by higher
depreciation and amortisation costs and higher share of associates & JV losses
▪ Turkey operations: Recorded a lower LAT of RM7.1 mil (3Q21: LAT of RM51.0 mil), due to lower finance costs,
after taking into account a loss of RM48.8 mil (3Q21: RM59.8 mil) primarily owing to the amortisation of fair value
of the concession rights
39
FY21 EBITDA and PAT Reconciliation
RM mil
FY21 FY20 Variance (%)
MY TY MY TY MY TR
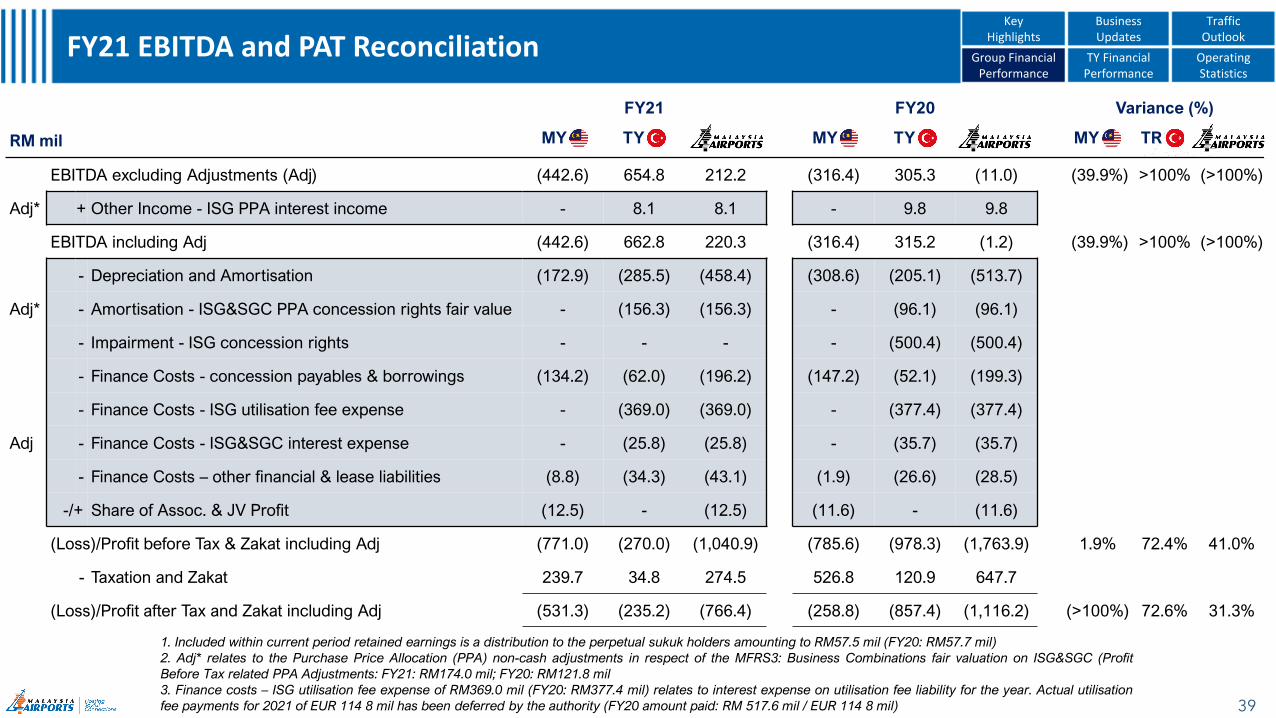
EBITDA excluding Adjustments (Adj) (442.6) 654.8 212.2 (316.4) 305.3 (11.0) (39.9%) >100% (>100%)
Adj* + Other Income - ISG PPA interest income - 8.1 8.1 - 9.8 9.8
EBITDA including Adj (442.6) 662.8 220.3 (316.4) 315.2 (1.2) (39.9%) >100% (>100%)
- Depreciation and Amortisation (172.9) (285.5) (458.4) (308.6) (205.1) (513.7)
Adj* - Amortisation - ISG&SGC PPA concession rights fair value - (156.3) (156.3) - (96.1) (96.1)
- Impairment - ISG concession rights - - - - (500.4) (500.4)
- Finance Costs - concession payables & borrowings (134.2) (62.0) (196.2) (147.2) (52.1) (199.3)
- Finance Costs - ISG utilisation fee expense - (369.0) (369.0) - (377.4) (377.4)
Adj - Finance Costs - ISG&SGC interest expense - (25.8) (25.8) - (35.7) (35.7)
- Finance Costs – other financial & lease liabilities (8.8) (34.3) (43.1) (1.9) (26.6) (28.5)
-/+ Share of Assoc. & JV Profit (12.5) - (12.5) (11.6) - (11.6)
(Loss)/Profit before Tax & Zakat including Adj (771.0) (270.0) (1,040.9) (785.6) (978.3) (1,763.9) 1.9% 72.4% 41.0%
- Taxation and Zakat 239.7 34.8 274.5 526.8 120.9 647.7
(Loss)/Profit after Tax and Zakat including Adj (531.3) (235.2) (766.4) (258.8) (857.4) (1,116.2) (>100%) 72.6% 31.3%
1. Included within current period retained earnings is a distribution to the perpetual sukuk holders amounting to RM57.5 mil (FY20: RM57.7 mil)
2. Adj* relates to the Purchase Price Allocation (PPA) non-cash adjustments in respect of the MFRS3: Business Combinations fair valuation on ISG&SGC (Profit
Before Tax related PPA Adjustments: FY21: RM174.0 mil; FY20: RM121.8 mil
3. Finance costs – ISG utilisation fee expense of RM369.0 mil (FY20: RM377.4 mil) relates to interest expense on utilisation fee liability for the year. Actual utilisation
fee payments for 2021 of EUR 114 8 mil has been deferred by the authority (FY20 amount paid: RM 517.6 mil / EUR 114 8 mil)
Group Financial Performance
TY Financial Performance
Operating Statistics
Key Highlights
Business Updates
Traffic Outlook
350.9
144.0
- 24.0
153.2
400.6
20.8 44.8 42.3 34.7
101.3
283.7
83.6
151.4
14.6 10.9 5.5
90.4 127.2
22.0 39.3
227.5
12.6 45.2 41.3 51.7
105.7
446.4
112.1
309.3
17.5 17.0 7.7
-
100.0
200.0
300.0
400.0
500.0
600.0
700.0
PSC &
PSSC
Landing &
Parking
Airline
Incentive
Others Retail Rental &
Royalties
Car Park Others Hotel Agriculture &
Horticulture
Proj & Repair
Maintenance
FY21 TR FY21 MY FY20 TR FY20 MY
40
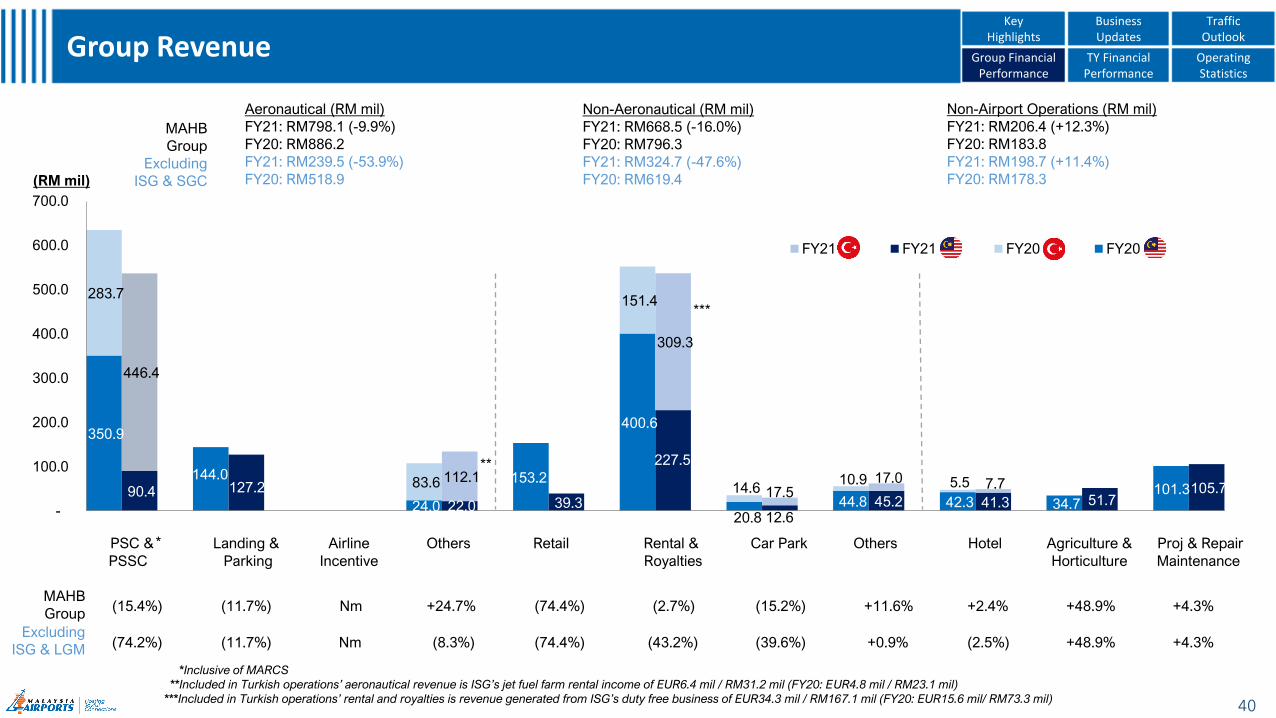
Group Revenue
Non-Airport Operations (RM mil)
FY21: RM206.4 (+12.3%)
FY20: RM183.8
FY21: RM198.7 (+11.4%)
FY20: RM178.3
*Inclusive of MARCS
**Included in Turkish operations’ aeronautical revenue is ISG’s jet fuel farm rental income of EUR6.4 mil / RM31.2 mil (FY20: EUR4.8 mil / RM23.1 mil)
***Included in Turkish operations’ rental and royalties is revenue generated from ISG’s duty free business of EUR34.3 mil / RM167.1 mil (FY20: EUR15.6 mil/ RM73.3 mil)
Non-Aeronautical (RM mil)
FY21: RM668.5 (-16.0%)
FY20: RM796.3
FY21: RM324.7 (-47.6%)
FY20: RM619.4
Aeronautical (RM mil)
FY21: RM798.1 (-9.9%)
FY20: RM886.2
FY21: RM239.5 (-53.9%)
FY20: RM518.9
Nm (8.3%) (74.4%) (43.2%) (39.6%) +0.9% (2.5%) +48.9% +4.3%
***
**
*
(74.2%)
(15.4%) (11.7%) Nm +24.7% (74.4%) (2.7%) (15.2%) +11.6% +2.4% +48.9% +4.3%
(11.7%)
MAHB
Group
Excluding
ISG & SGC
Group Financial Performance
TY Financial Performance
Operating Statistics
Key Highlights
Business Updates
Traffic Outlook
(RM mil)
Excluding
ISG & LGM
MAHB
Group
52.5
127.7 79.0
519.4
241.7 186.9
(6.0)
100.4 83.7
-
43.2
20.8
58.7
1.9
94.6
70.8 118.4 140.8
89.8
572.6
307.7
202.4
108.9 116.5 148.5
-
45.0
17.0
61.0
17.2 66.4
41.5
(100.0)
100.0
300.0
500.0
700.0
Direct
Materials
Direct
Labour
Direct
Overheads
Staff Costs Utilities
& Comm
Maintenance Net Allowance
of PDD
Others User Fee PSC Share
FY21 MY FY21 TR FY20 MY FY20 TR
41
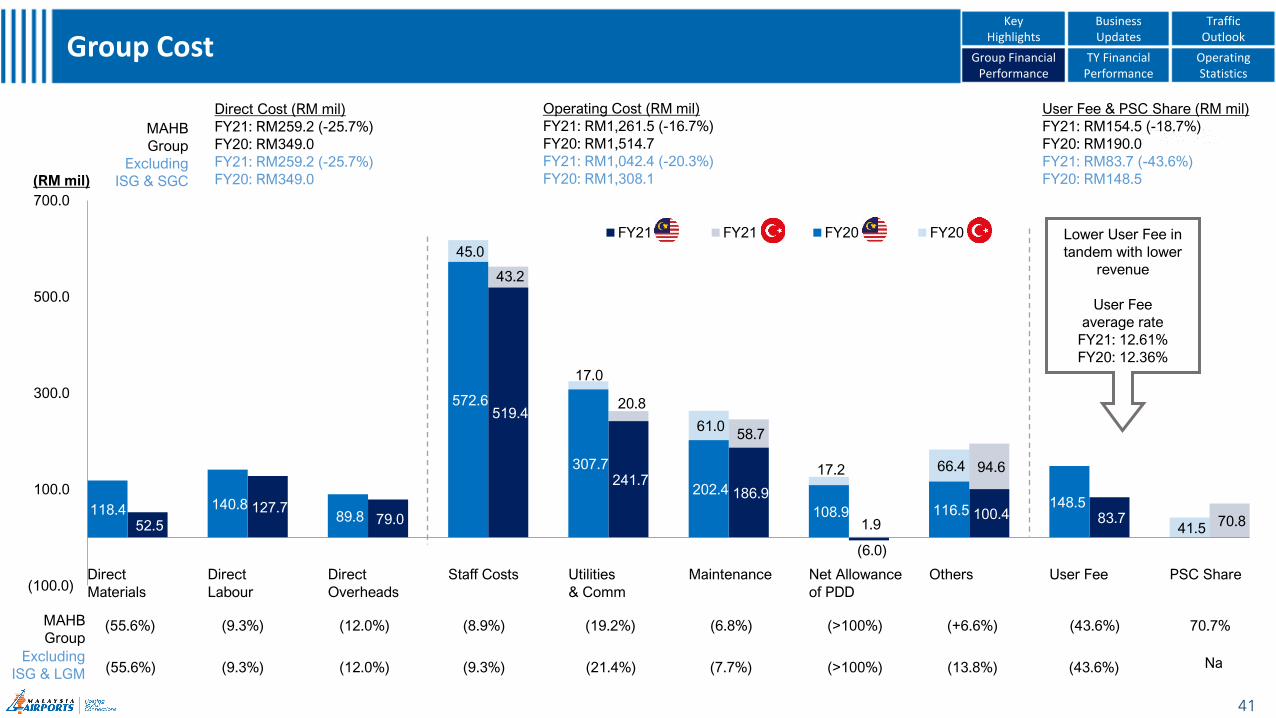
Group Cost
Operating Cost (RM mil)
FY21: RM1,261.5 (-16.7%)
FY20: RM1,514.7
FY21: RM1,042.4 (-20.3%)
FY20: RM1,308.1
Direct Cost (RM mil)
FY21: RM259.2 (-25.7%)
FY20: RM349.0
FY21: RM259.2 (-25.7%)
FY20: RM349.0
(12.0%)(55.6%)
(12.0%)(55.6%)
(9.3%)
(9.3%)
(19.2%)
(21.4%)
(8.9%)
(9.3%) (7.7%)
(6.8%) (+6.6%)
(13.8%)
70.7%(43.6%)
(43.6%)
User Fee & PSC Share (RM mil)
FY21: RM154.5 (-18.7%)
FY20: RM190.0
FY21: RM83.7 (-43.6%)
FY20: RM148.5
Na
(>100%)
(>100%)
Lower User Fee in
tandem with lower
revenue
User Fee
average rate
FY21: 12.61%
FY20: 12.36%
(RM mil)
MAHB
Group
Excluding
ISG & SGC
Group Financial Performance
TY Financial Performance
Operating Statistics
Key Highlights
Business Updates
Traffic Outlook
Excluding
ISG & LGM
MAHB
Group
198.2
1,200.9
8,284.4
3,596.7
564.8 1,102.6 76.9
1,110.5
6,931.0
1,715.1
5,054.7
166.4
285.8
1,099.0
8,186.3
2,800.0 508.9
1,058.5 109.1
618.0
7,705.0
1,844.7 5,013.2
94.6
-
2,000.0
4,000.0
6,000.0
8,000.0
10,000.0
12,000.0
14,000.0
16,000.0
18,000.0
Trade Receivables Cash & Funds Intangible Assets Borrowings Trade Payables Other Payables
Dec-21 MY Dec-21 TR Dec-20 MY Dec-20 TR
42
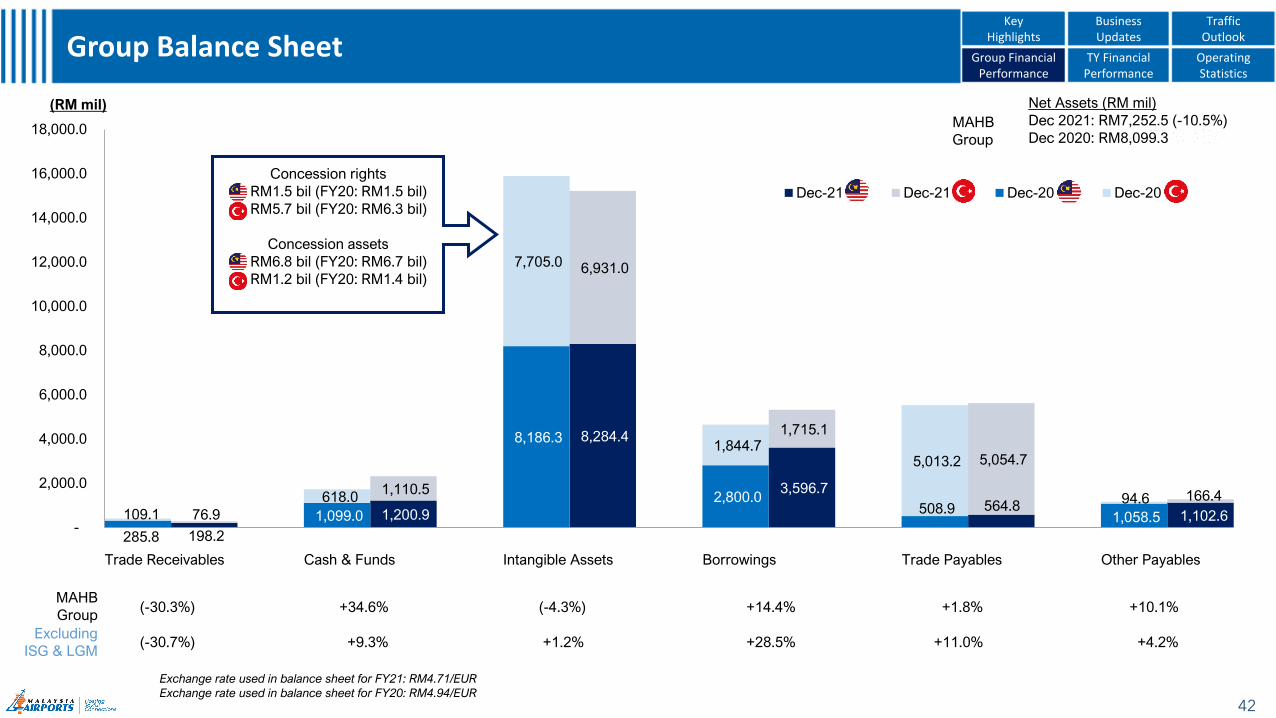
Group Balance Sheet
Exchange rate used in balance sheet for FY21: RM4.71/EUR
Exchange rate used in balance sheet for FY20: RM4.94/EUR
Net Assets (RM mil)
Dec 2021: RM7,252.5 (-10.5%)
Dec 2020: RM8,099.3
(RM mil)
Concession rights
-- : RM1.5 bil (FY20: RM1.5 bil)
-- : RM5.7 bil (FY20: RM6.3 bil)
Concession assets
-- : RM6.8 bil (FY20: RM6.7 bil)
-- : RM1.2 bil (FY20: RM1.4 bil)
MAHB
Group
(-30.3%) +34.6% (-4.3%) +14.4% +1.8% +10.1%
(-30.7%) +9.3% +1.2% +28.5% +11.0% +4.2%
Group Financial Performance
TY Financial Performance
Operating Statistics
Key Highlights
Business Updates
Traffic Outlook
Excluding
ISG & LGM
MAHB
Group
43
Turkish Operations(TY) Financial Performance
Profit Before Tax (EUR mil)
Revenue (EUR mil)
198.5 217.6
264.8
117.1
178.3
211.7231.4
47.2 44.8 48.9 57.5 54.329.4
49.0 46.5 52.1 64.8
7.833.5
55.5 59.2 61.8
77.4
25.255.6
46.7 49.2 54.8
65.2
29.8
59.7
0.0
100.0
200.0
300.0
2016 2017 2018 2019 2020 2021
Revenue (with IC12) Q1 Q2 Q3 Q4
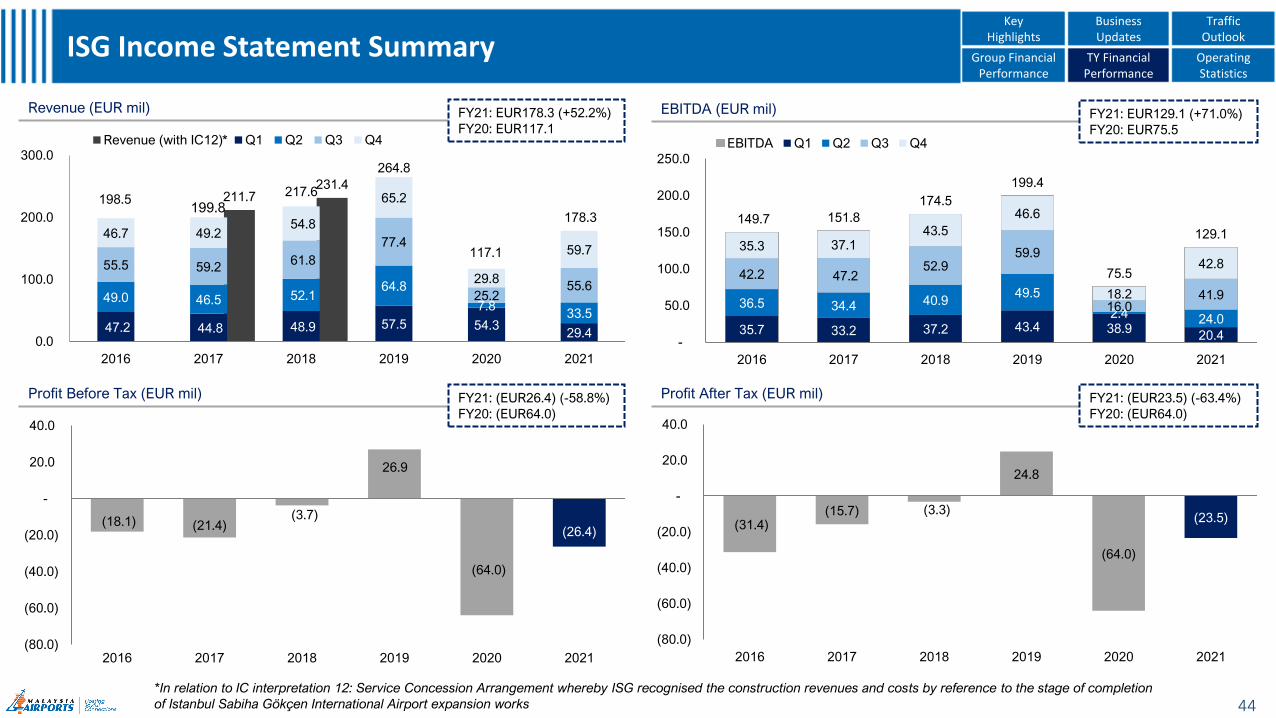
FY21: (EUR26.4) (-58.8%)
FY20: (EUR64.0)
FY21: EUR178.3 (+52.2%)
FY20: EUR117.1
(18.1) (21.4)(3.7)
26.9
(64.0)
(26.4)
(80.0)
(60.0)
(40.0)
(20.0)
-
20.0
40.0
2016 2017 2018 2019 2020 2021
44
ISG Income Statement Summary
Profit After Tax (EUR mil)
EBITDA (EUR mil)
FY21: (EUR23.5) (-63.4%)
FY20: (EUR64.0)
*In relation to IC interpretation 12: Service Concession Arrangement whereby ISG recognised the construction revenues and costs by reference to the stage of completion
of Istanbul Sabiha Gökçen International Airport expansion works
FY21: EUR129.1 (+71.0%)
FY20: EUR75.5
199.8
*
Group Financial Performance
TY Financial Performance
Operating Statistics
Key Highlights
Business Updates
Traffic Outlook
(31.4)(15.7) (3.3)
24.8
(64.0)
(23.5)
(80.0)
(60.0)
(40.0)
(20.0)
-
20.0
40.0
2016 2017 2018 2019 2020 2021
149.7 151.8
174.5
199.4
75.5
129.1
35.7 33.2 37.2 43.4 38.920.4
36.5 34.4 40.949.5
2.4 24.0
42.2 47.2 52.9
59.9
16.041.9
35.3 37.143.5
46.6
18.2
42.8
-
50.0
100.0
150.0
200.0
250.0
2016 2017 2018 2019 2020 2021
EBITDA Q1 Q2 Q3 Q4
59.4
10.8
1.8 4.8
15.6 17.6
3.3 3.8
91.5
14.1
2.4 6.4
31.5
20.7
3.8 6.6
0.0
20.0
40.0
60.0
80.0
100.0
PSC PBB & CIC Others Jet Fuel Farm Duty Free Rental
Income
Other Rental &
Commercial
Car Park Others
FY20 FY21
45
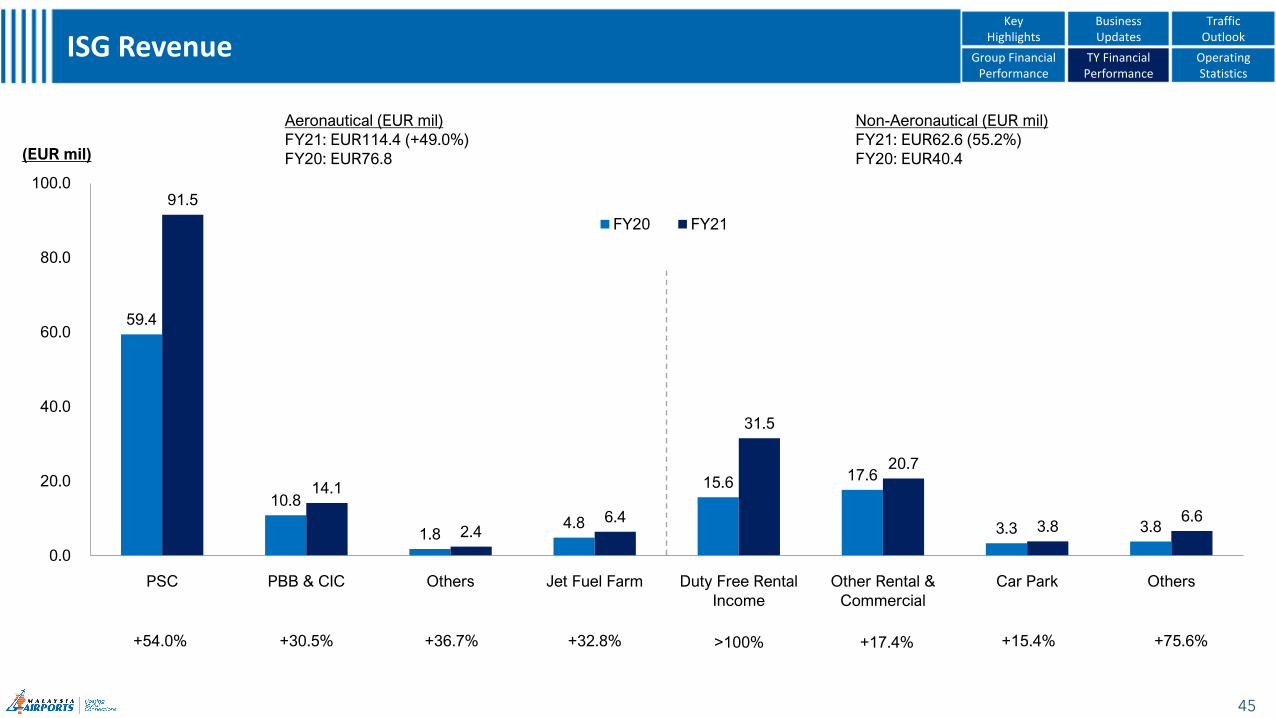
ISG Revenue
(EUR mil)
Non-Aeronautical (EUR mil)
FY21: EUR62.6 (55.2%)
FY20: EUR40.4
Aeronautical (EUR mil)
FY21: EUR114.4 (+49.0%)
FY20: EUR76.8
+54.0% +30.5% +36.7% +75.6%>100% +17.4% +15.4%+32.8%
Group Financial Performance
TY Financial Performance
Operating Statistics
KeyHighlights
Business Updates
Traffic Outlook
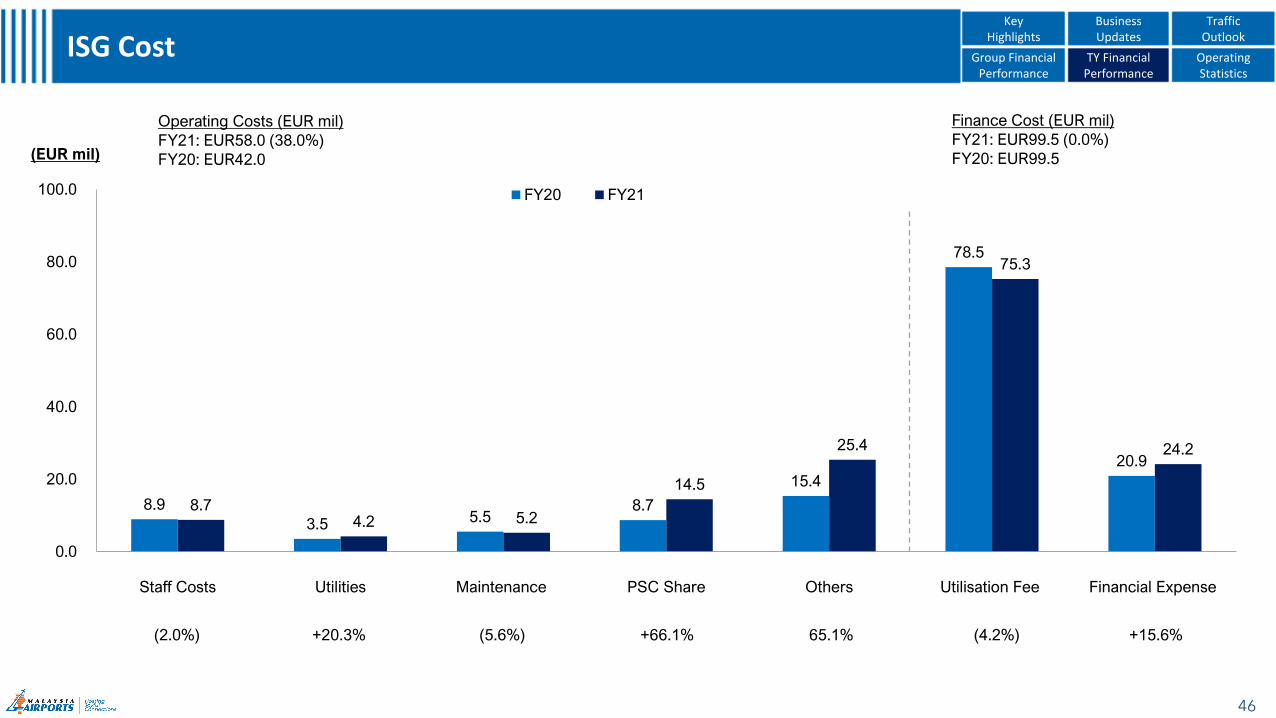
8.9
3.5 5.5 8.7
15.4
78.5
20.9
8.7 4.2 5.2
14.5
25.4
75.3
24.2
0.0
20.0
40.0
60.0
80.0
100.0
Staff Costs Utilities Maintenance PSC Share Others Utilisation Fee Financial Expense
FY20 FY21
46
ISG Cost
(2.0%) +20.3% (5.6%) (4.2%)65.1%+66.1% +15.6%
Operating Costs (EUR mil)
FY21: EUR58.0 (38.0%)
FY20: EUR42.0
Finance Cost (EUR mil)
FY21: EUR99.5 (0.0%)
FY20: EUR99.5(EUR mil)
Group Financial Performance
TY Financial Performance
Operating Statistics
KeyHighlights
Business Updates
Traffic Outlook

47
ISG Balance Sheet
(31.8%) +89.0% (-5.8%) +6.9% (2.5%)
(EUR mil)
Group Financial Performance
TY Financial Performance
Operating Statistics
Key Highlights
Business Updates
Traffic Outlook
43.2
117.6
954.2
1,059.9
373.4
29.5
222.2
898.7
1,133.1
364.1
0.0
200.0
400.0
600.0
800.0
1,000.0
1,200.0
Trade & Other Receivables Cash & Funds Intangible Assets Trade & Other Payables Borrowings
Dec-20 Dec-21
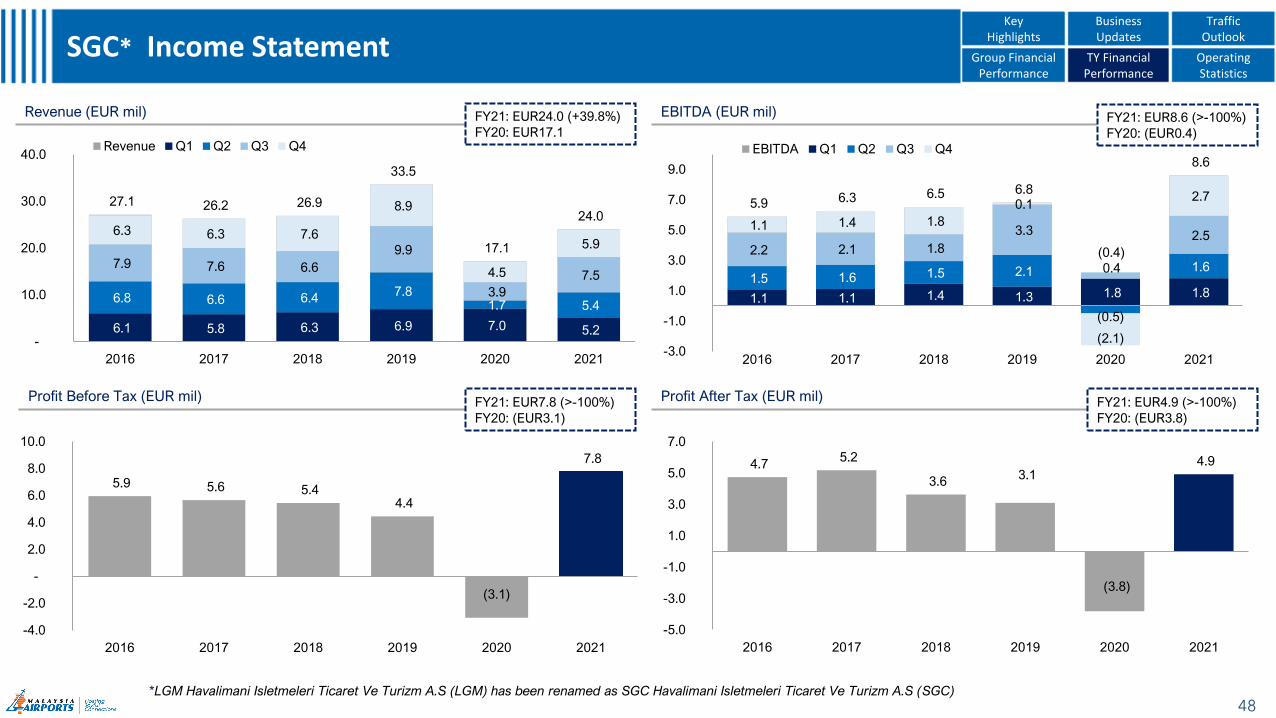
27.1 26.2 26.9
33.5
17.1
24.0
6.1 5.8 6.3 6.9 7.0 5.2
6.8 6.6 6.4 7.8
1.7 5.4
7.9 7.6 6.6
9.9
3.9
7.5
6.3 6.3 7.6
8.9
4.5
5.9
-
10.0
20.0
30.0
40.0
2016 2017 2018 2019 2020 2021
Revenue Q1 Q2 Q3 Q4
48
SGC* Income Statement
Profit Before Tax (EUR mil)
Revenue (EUR mil)
Profit After Tax (EUR mil)
EBITDA (EUR mil)
*LGM Havalimani Isletmeleri Ticaret Ve Turizm A.S (LGM) has been renamed as SGC Havalimani Isletmeleri Ticaret Ve Turizm A.S (SGC)
Group Financial Performance
TY Financial Performance
Operating Statistics
Key Highlights
Business Updates
TrafficOutlook
5.9 5.6 5.4 4.4
(3.1)
7.8
-4.0
-2.0
-
2.0
4.0
6.0
8.0
10.0
2016 2017 2018 2019 2020 2021
4.7 5.2
3.6 3.1
(3.8)
4.9
-5.0
-3.0
-1.0
1.0
3.0
5.0
7.0
2016 2017 2018 2019 2020 2021
FY21: EUR4.9 (>-100%)
FY20: (EUR3.8)
FY21: EUR7.8 (>-100%)
FY20: (EUR3.1)
FY21: EUR8.6 (>-100%)
FY20: (EUR0.4)
FY21: EUR24.0 (+39.8%)
FY20: EUR17.1
5.9 6.3 6.5 6.8
(0.4)
8.6
1.1 1.1 1.4 1.3 1.8 1.8 1.5 1.6 1.5 2.1
(0.5)
1.6
2.2 2.1 1.8
3.3
0.4
2.5 1.1 1.4 1.8
0.1
(2.1)
2.7
-3.0
-1.0
1.0
3.0
5.0
7.0
9.0
2016 2017 2018 2019 2020 2021
EBITDA Q1 Q2 Q3 Q4
49
Operating Statistics
0.2 0.3 0.2 0.3 0.6
1.8 1.4 1.1 0.8
6.1
1.4 1.2 1.5
3.1 3.2
3.3 3.1
3.2
5.9
4.2
0.0
1.0
2.0
3.0
4.0
5.0
6.0
7.0
8.0
9.0
10.0
4Q20 1Q21 2Q21 3Q21 4Q21
MY Int'l MY Domestic ISG Int'l ISG Domestic
50
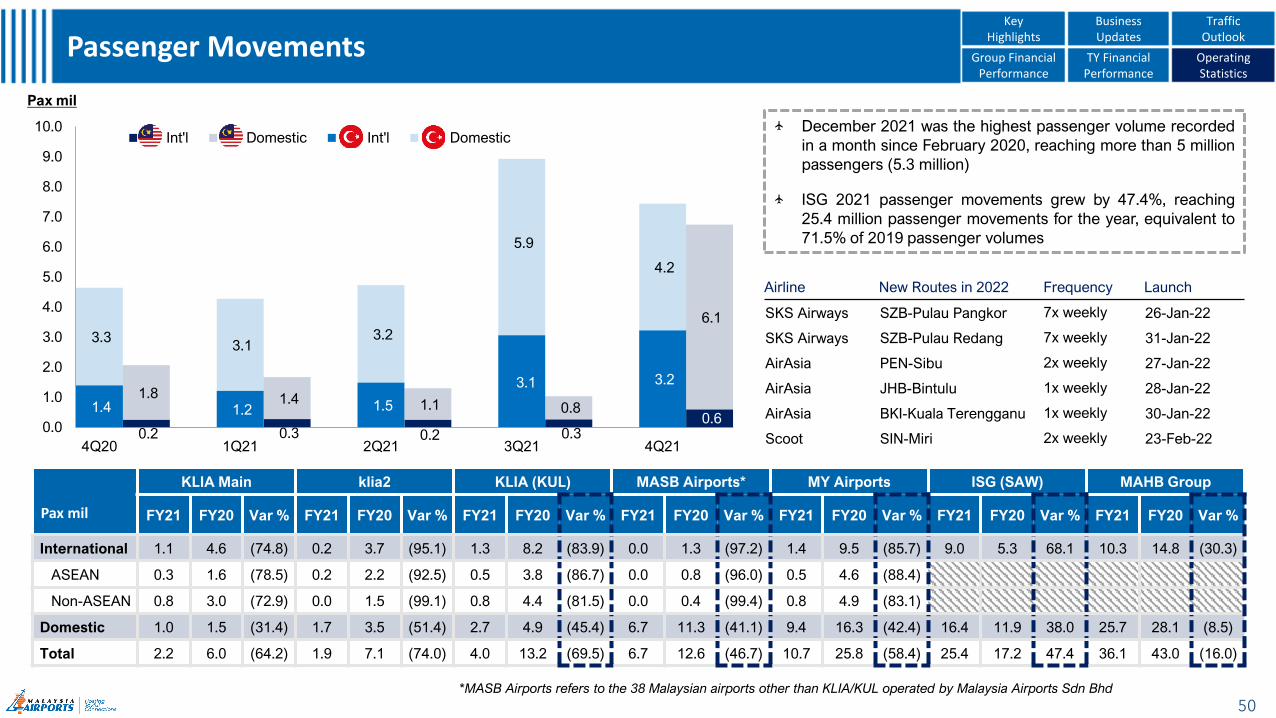
Passenger Movements
KLIA Main klia2 KLIA (KUL) MASB Airports* MY Airports ISG (SAW) MAHB Group
FY21 FY20 Var % FY21 FY20 Var % FY21 FY20 Var % FY21 FY20 Var % FY21 FY20 Var % FY21 FY20 Var % FY21 FY20 Var %
International 1.1 4.6 (74.8) 0.2 3.7 (95.1) 1.3 8.2 (83.9) 0.0 1.3 (97.2) 1.4 9.5 (85.7) 9.0 5.3 68.1 10.3 14.8 (30.3)
ASEAN 0.3 1.6 (78.5) 0.2 2.2 (92.5) 0.5 3.8 (86.7) 0.0 0.8 (96.0) 0.5 4.6 (88.4)
Non-ASEAN 0.8 3.0 (72.9) 0.0 1.5 (99.1) 0.8 4.4 (81.5) 0.0 0.4 (99.4) 0.8 4.9 (83.1)
Domestic 1.0 1.5 (31.4) 1.7 3.5 (51.4) 2.7 4.9 (45.4) 6.7 11.3 (41.1) 9.4 16.3 (42.4) 16.4 11.9 38.0 25.7 28.1 (8.5)
Total 2.2 6.0 (64.2) 1.9 7.1 (74.0) 4.0 13.2 (69.5) 6.7 12.6 (46.7) 10.7 25.8 (58.4) 25.4 17.2 47.4 36.1 43.0 (16.0)
December 2021 was the highest passenger volume recorded
in a month since February 2020, reaching more than 5 million
passengers (5.3 million)
ISG 2021 passenger movements grew by 47.4%, reaching
25.4 million passenger movements for the year, equivalent to
71.5% of 2019 passenger volumes
*MASB Airports refers to the 38 Malaysian airports other than KLIA/KUL operated by Malaysia Airports Sdn Bhd
Pax mil
Pax mil
Group Financial Performance
TY Financial Performance
Operating Statistics
Key Highlights
Business Updates
Traffic Outlook
Airline New Routes in 2022 Frequency Launch
SKS Airways SZB-Pulau Pangkor 7x weekly 26-Jan-22
SKS Airways SZB-Pulau Redang 7x weekly 31-Jan-22
AirAsia PEN-Sibu 2x weekly 27-Jan-22
AirAsia JHB-Bintulu 1x weekly 28-Jan-22
AirAsia BKI-Kuala Terengganu 1x weekly 30-Jan-22
Scoot SIN-Miri 2x weekly 23-Feb-22
13
.2
17
.2
22
.1
11
.2
16
.7
12
.0
11
.8
8.8
4.0
25
.4
19
.4
7.9
5.7
3.2
3.1
1.3
0.0
5.0
10.0
15.0
20.0
25.0
30.0
KLIA ISG London
Heathrow
Sydney
Kingsford Smith
Bangkok
Suvarnabhumi
Seoul
Incheon
Singapore
Changi
Hong Kong
International
FY20 FY21
51
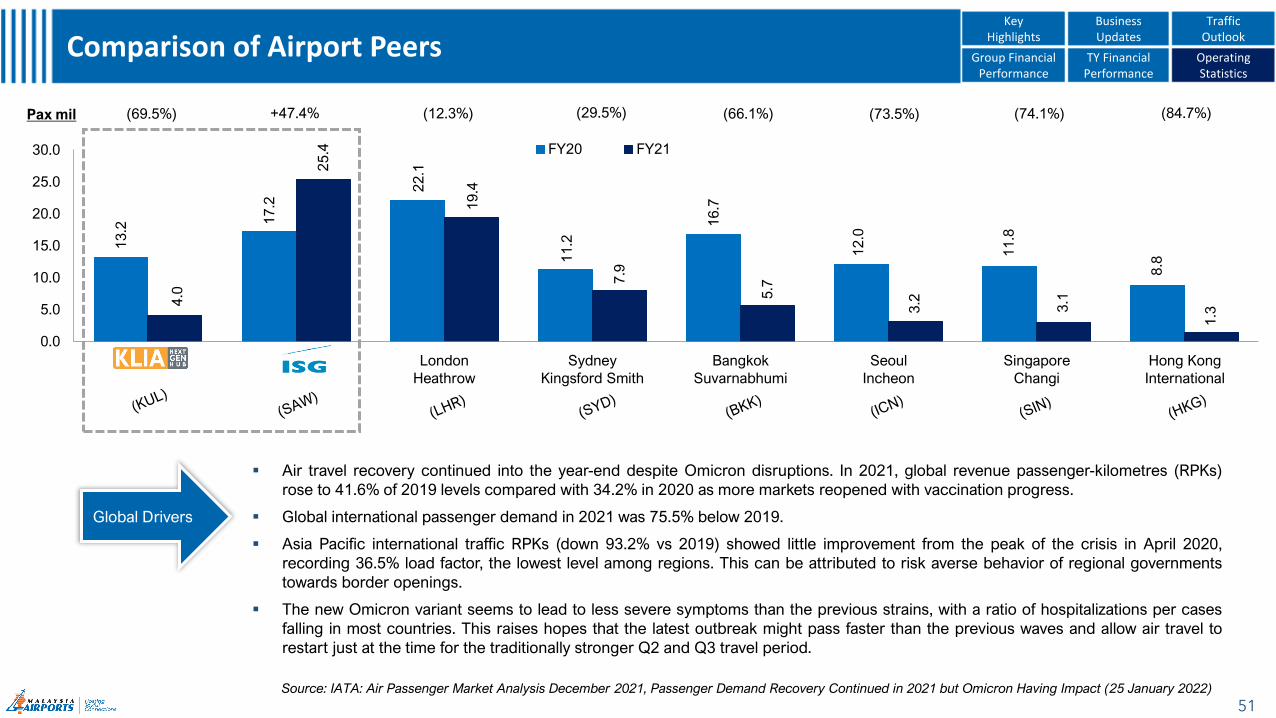
Comparison of Airport Peers
▪ Air travel recovery continued into the year-end despite Omicron disruptions. In 2021, global revenue passenger-kilometres (RPKs)
rose to 41.6% of 2019 levels compared with 34.2% in 2020 as more markets reopened with vaccination progress.
▪ Global international passenger demand in 2021 was 75.5% below 2019.
▪ Asia Pacific international traffic RPKs (down 93.2% vs 2019) showed little improvement from the peak of the crisis in April 2020,
recording 36.5% load factor, the lowest level among regions. This can be attributed to risk averse behavior of regional governments
towards border openings.
▪ The new Omicron variant seems to lead to less severe symptoms than the previous strains, with a ratio of hospitalizations per cases
falling in most countries. This raises hopes that the latest outbreak might pass faster than the previous waves and allow air travel to
restart just at the time for the traditionally stronger Q2 and Q3 travel period.
Global Drivers
(69.5%)Pax mil (29.5%) (66.1%)(12.3%)+47.4% (74.1%) (84.7%)(73.5%)
Group Financial Performance
TY Financial Performance
Operating Statistics
Key Highlights
Business Updates
Traffic Outlook
Source: IATA: Air Passenger Market Analysis December 2021, Passenger Demand Recovery Continued in 2021 but Omicron Having Impact (25 January 2022)
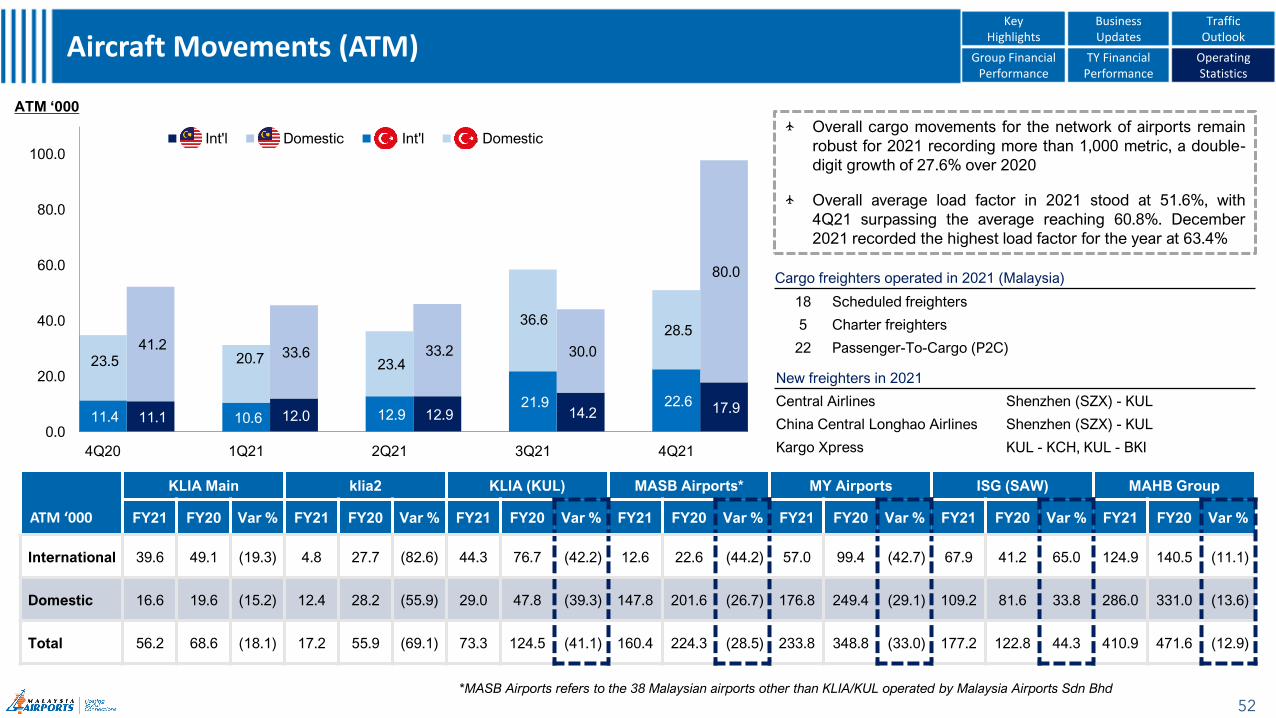
Overall cargo movements for the network of airports remain
robust for 2021 recording more than 1,000 metric, a double-
digit growth of 27.6% over 2020
Overall average load factor in 2021 stood at 51.6%, with
4Q21 surpassing the average reaching 60.8%. December
2021 recorded the highest load factor for the year at 63.4%
11.1 12.0 12.9 14.2 17.9
41.2 33.6 33.2 30.0
80.0
11.4 10.6 12.9 21.9 22.6
23.5 20.7 23.4
36.6 28.5
0.0
20.0
40.0
60.0
80.0
100.0
4Q20 1Q21 2Q21 3Q21 4Q21
MY Int'l MY Domestic ISG Int'l ISG Domestic
ATM ‘000
52
Aircraft Movements (ATM)
KLIA Main klia2 KLIA (KUL) MASB Airports* MY Airports ISG (SAW) MAHB Group
FY21 FY20 Var % FY21 FY20 Var % FY21 FY20 Var % FY21 FY20 Var % FY21 FY20 Var % FY21 FY20 Var % FY21 FY20 Var %
International 39.6 49.1 (19.3) 4.8 27.7 (82.6) 44.3 76.7 (42.2) 12.6 22.6 (44.2) 57.0 99.4 (42.7) 67.9 41.2 65.0 124.9 140.5 (11.1)
Domestic 16.6 19.6 (15.2) 12.4 28.2 (55.9) 29.0 47.8 (39.3) 147.8 201.6 (26.7) 176.8 249.4 (29.1) 109.2 81.6 33.8 286.0 331.0 (13.6)
Total 56.2 68.6 (18.1) 17.2 55.9 (69.1) 73.3 124.5 (41.1) 160.4 224.3 (28.5) 233.8 348.8 (33.0) 177.2 122.8 44.3 410.9 471.6 (12.9)
ATM ‘000
Group Financial Performance
TY Financial Performance
Operating Statistics
Key Highlights
Business Updates
Traffic Outlook
Cargo freighters operated in 2021 (Malaysia)
18 Scheduled freighters
5 Charter freighters
22 Passenger-To-Cargo (P2C)
New freighters in 2021
Central Airlines Shenzhen (SZX) - KUL
China Central Longhao Airlines Shenzhen (SZX) - KUL
Kargo Xpress KUL - KCH, KUL - BKI
*MASB Airports refers to the 38 Malaysian airports other than KLIA/KUL operated by Malaysia Airports Sdn Bhd