Technical efficiency of UK airports
29
Carlos Pestana Barros & Nicolas Peypoch A Comparative Analysis of Productivity Change in Italian and Portuguese Airports WP 006/2007/DE _________________________________________________________ Carlos Pestana Barros The Technical Efficiency of UK Airports WP 10/2008/DE/UECE _________________________________________________________ Department of Economics WORKING PAPERS ISSN Nº 0874-4548 School of Economics and Management TECHNICAL UNIVERSITY OF LISBON
-
Upload
independent -
Category
Documents
-
view
3 -
download
0
Transcript of Technical efficiency of UK airports
Carlos Pestana Barros & Nicolas Peypoch
A Comparative Analysis of Productivity Change in Italian and Portuguese Airports
WP 006/2007/DE _________________________________________________________
Carlos Pestana Barros
The Technical Efficiency of UK Airports
WP 10/2008/DE/UECE
_________________________________________________________
Department of Economics
WORKING PAPERS
ISSN Nº 0874-4548
School of Economics and Management TECHNICAL UNIVERSITY OF LISBON
Your username is: C.P. Barros Your password is: barros43857
The Technical Efficiency of UK Airports
Carlos Pestana Barros
Instituto de Economia e Gestão, Technical University of Lisbon, Rua Miguel Lupi, 20, 1249-078 Lisbon and UECE (Research Unit on Complexity and Economics):
Abstract:
In this paper, the innovative random stochastic frontier model is used to estimate
the technical efficiency of UK airports. These airports are ranked according to
their total productivity for the period 2000-2005 and homogenous and
heterogeneous variables in the cost function are disentangled, which leads us to
advise the implementation of common policies as well as policies by segments.
Economic implications arising from the study are also considered.
Keywords:
Airports, UK, efficiency, random frontier models, policy implications
1. Introduction
This paper explores the use of random technical efficiency as an instrument for
assessing the technical efficiency of UK airports, combining operational and financial
data. The random frontier model allows for heterogeneity in the data and is considered
the most promising state-of-the-art modelling available by which to analyse cost
functions (Greene, 2003, 2004, 2005). The advantage of this method over alternative
models is twofold. First, it allows for the error term to combine different statistical
2
distributions. Second, it uses random parameters; i.e., parameters that describe factors
not linked to observed features on the cost function. This type of estimation
disentangles the explanatory variables to determine which of them must be treated in a
homogeneous way and which are heterogeneous and must be managed by segments.
The efficiency of airports is of interest in contemporary economics, because of their
increasing strategic importance in the movement of people and cargo in the globalised
world (Oum and Yu, 2004). Efficiency has been the focus of much recent research (see
Pels et al., 2001, 2003; Oum and Yu, 2004; Yoshida, 2004; Yoshida and Fujimoto,
2004; Fung, Wan, Hui and Law, 2007; Barros, 2008). Moreover, the increased
competition among airlines resulting from deregulation and liberalisation has placed
airports in a much more competitive environment. As a result, airports are now under
pressure to upgrade their efficiency relative to their competitors. Benchmarking analysis
is one of the ways to drive airports towards the frontier of best practices (De Borger,
Kerstens and Costa, 2002).
Previous research on airports has been conducted by several authors using either
data envelopment analysis (DEA), such as Gillen and Lall (1997), Parker (1999), Pels,
Nijkamp and Rietveld (2001, 2003), Adler and Berechman (2001), Fernandes and
Pacheco (2002), Barros and Sampaio (2004) and Murillo-Melchor (1999), or the
homogeneous stochastic frontier model (Pels et al., 2001, 2003; Oum and Yu, 2004;
Yoshida, 2004; Yoshida and Fujimoto, 2004; Fung, Wan, Hui and Law, 2007; Barros,
2008). However, the stochastic frontier model used in these papers is the homogenous
frontier model, which assumes all units as homogenous. Therefore, the present research
is innovative in the context of airports.
The paper is organised as follows: section 2 describes the institutional setting;
section 3 surveys the literature on the topic; section 4 presents the methodological
3
framework; section 5 explains the method; section 6 displays the data; section 7
presents the results; section 8 discusses the findings; and finally, section 9 concludes.
2. Institutional Setting
British airports are owned and managed by one of three distinct entities, BAA
(British Airports Authority), Manchester Airports PLC and TBI PLC.
BAA is the owner and operator of seven British airports and operator of several airports
in Italy and the USA, making it one of the world’s largest transport-sector companies. It
also owns British Airline. BAA was established by the passing of the Airport Authority
Act 1966, to take responsibility for four state-owned airports. In 1986, under Margaret
Thatcher’s policy to privatise government-owned assets, BAA was transformed into a
PLC and has achieved expansion beyond the UK. This includes the acquisition of retail
contracts at Boston Logan International Airport and Baltimore-Washington
International Thurgood Marshall Airport (through subsidiary BAA USA, Inc.), and a
total management contract with the City of Indianapolis to run the Indianapolis
International Airport (as BAA Indianapolis, Inc.). In July 2006, BAA was taken over by
a consortium led by the Spanish transportation group, Grupo Ferrovial. As a result, the
company was delisted from the London Stock Exchange (where it had previously been
part of the FTSE100 index) and the company name was subsequently changed from
BAA plc to BAA Limited.
Manchester Airports PLC, formed in 1986, manages several English city airports and is
characterised by being a public limited company owned by local authorities. Following
the purchase of a majority shareholding in Humberside Airport in 1999 and the
acquisition of East Midlands Airport and Bournemouth Airport in 2001, the company
4
was restructured to create the Manchester Airport Group. Although Manchester Airport
Group is registered as a public limited company, its shares are not quoted or for sale on
the Stock Exchange. Manchester City Council has a majority shareholding (55%) with
each of nine other councils holding 5% each.
TBI PLC is the owner of three regional airports in England, Wales and Northern
Ireland. In 2004, TBI was acquired by a Spanish enterprise owned by AENA, the
company that manages Spanish airports, and Abertis, a Spanish construction company.
The company has also expanded into international airport management under contract.
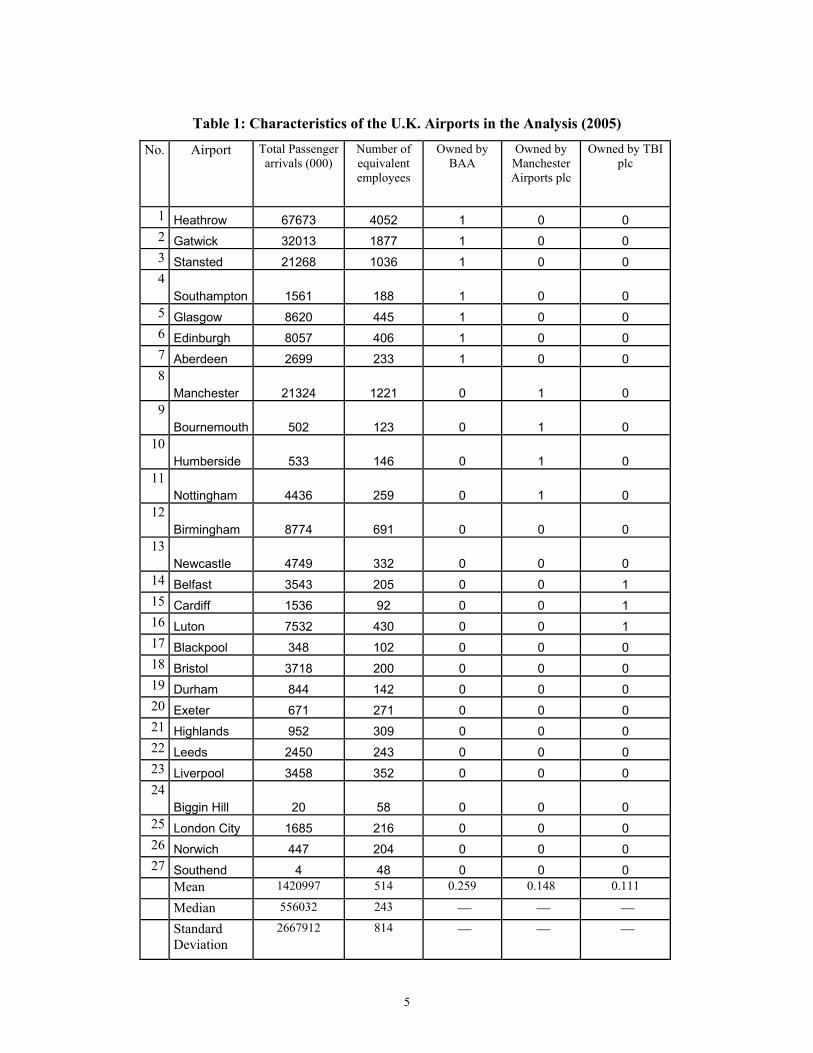
Table 1 depicts some characteristics of these companies in relation to UK airports. This
ownership status contributes to the competition among airports. The competition itself
is fuelled by the steady increase in passengers and flights, which is both a cause and
effect of the competition between the traditional national flag carrier airlines and the
new wave of low-cost carriers. London’s airports (Heathrow, Gatwick, Stansted, Luton
and London City Airport) accounted for 62% of the total traffic in 2005.
U.K. airports have been the subject of research by Parker (1999), who analyses
the performance of the British Airports Authority before and after privatisation with
data from the financial reports for the period 1979/80-1995/96, using a CCR-DEA
model and a BCC-DEA model. In addition, Jessop (2008) analyses the performance of
UK airports with a block model.
5
Table 1: Characteristics of the U.K. Airports in the Analysis (2005)
No. Airport Total Passenger arrivals (000)
Number of equivalent employees
Owned by BAA
Owned by Manchester Airports plc
Owned by TBI plc
1 Heathrow 67673 4052 1 0 0 2 Gatwick 32013 1877 1 0 0 3 Stansted 21268 1036 1 0 0 4
Southampton 1561 188 1 0 0 5 Glasgow 8620 445 1 0 0 6 Edinburgh 8057 406 1 0 0 7 Aberdeen 2699 233 1 0 0 8
Manchester 21324 1221 0 1 0 9
Bournemouth 502 123 0 1 0 10
Humberside 533 146 0 1 0 11
Nottingham 4436 259 0 1 0 12
Birmingham 8774 691 0 0 0 13
Newcastle 4749 332 0 0 0 14 Belfast 3543 205 0 0 1 15 Cardiff 1536 92 0 0 1 16 Luton 7532 430 0 0 1 17 Blackpool 348 102 0 0 0 18 Bristol 3718 200 0 0 0 19 Durham 844 142 0 0 0 20 Exeter 671 271 0 0 0 21 Highlands 952 309 0 0 0 22 Leeds 2450 243 0 0 0 23 Liverpool 3458 352 0 0 0 24
Biggin Hill 20 58 0 0 0 25 London City 1685 216 0 0 0 26 Norwich 447 204 0 0 0 27 Southend 4 48 0 0 0
Mean 1420997 514 0.259 0.148 0.111
Median 556032 243
Standard Deviation
2667912 814
6
Note: airports not belonging to BAA, Manchester or TBI are independent city airports
3. Literature Survey
While there is extensive literature on benchmarking applied to a diverse range of
economic fields, the scarcity of studies regarding European airports bears testimony to
the fact that this is a relatively under-researched topic (Humphreys and Francis, 2002;
Humphreys, Francis and Fry (2002), Graham, 2005).
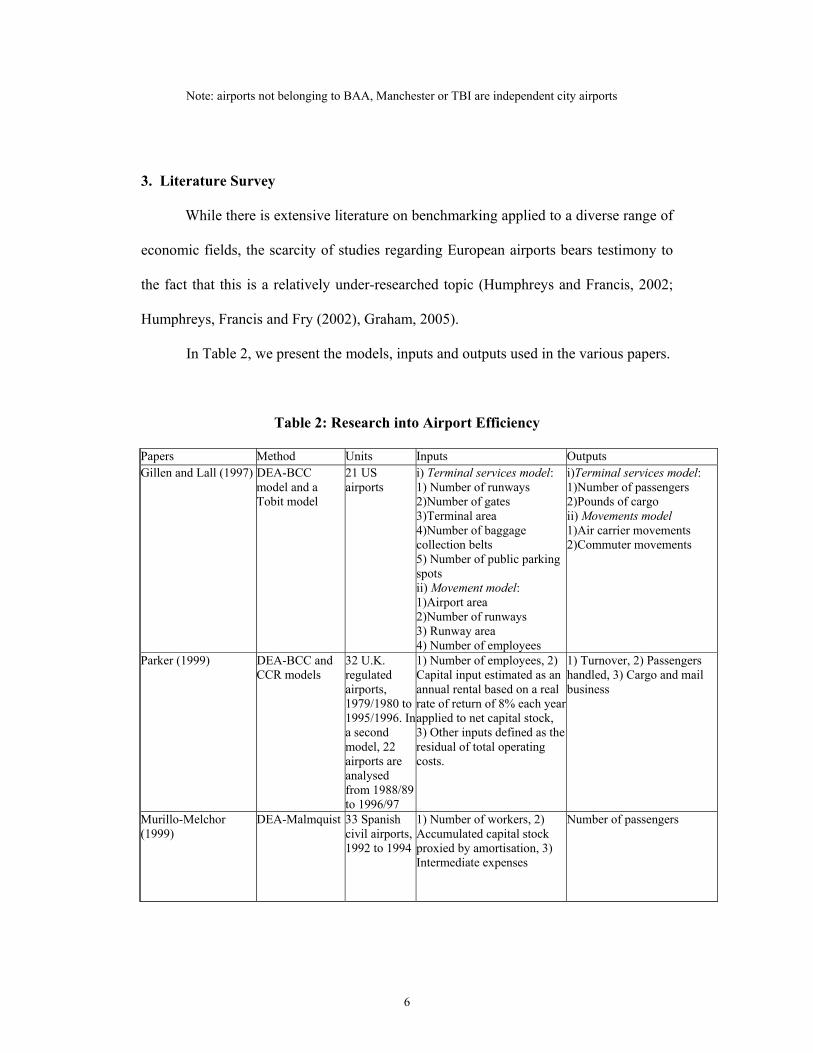
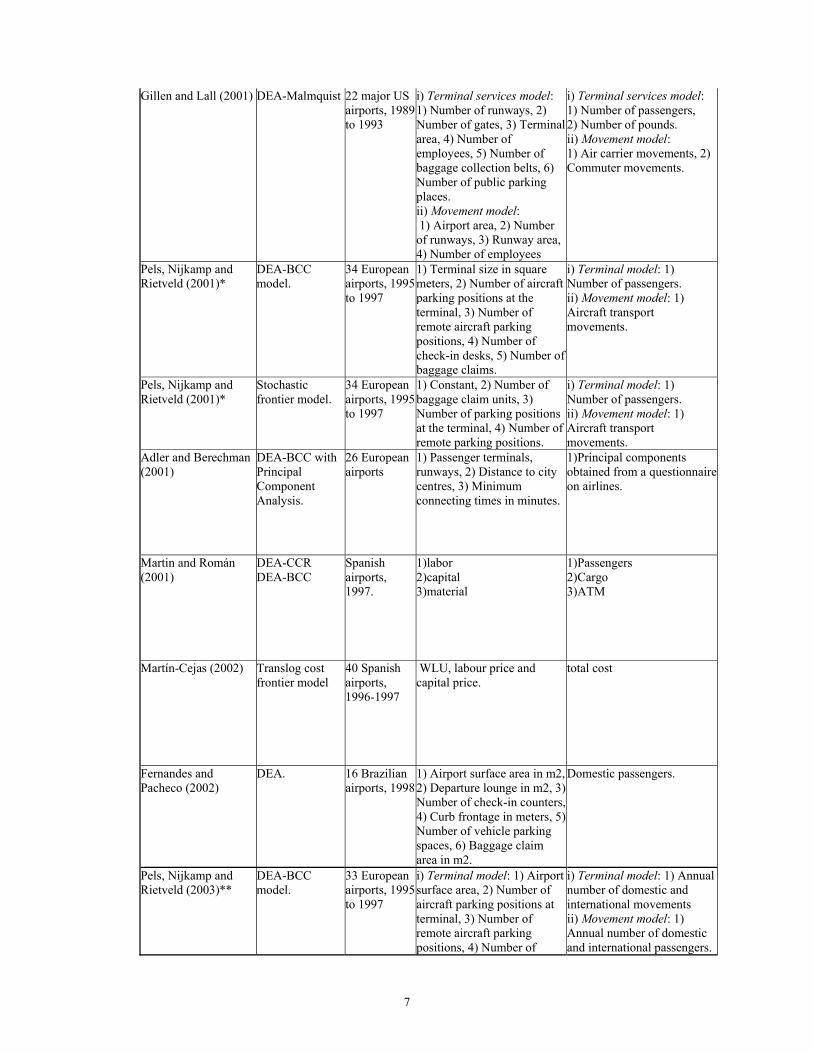
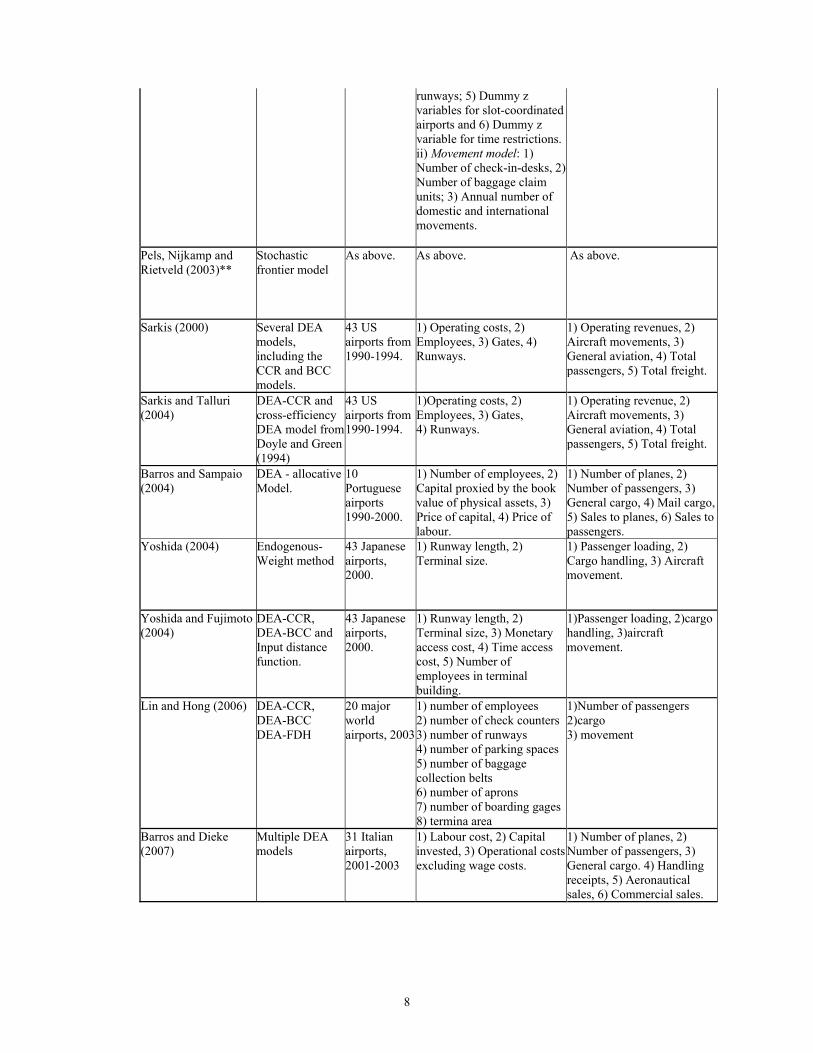
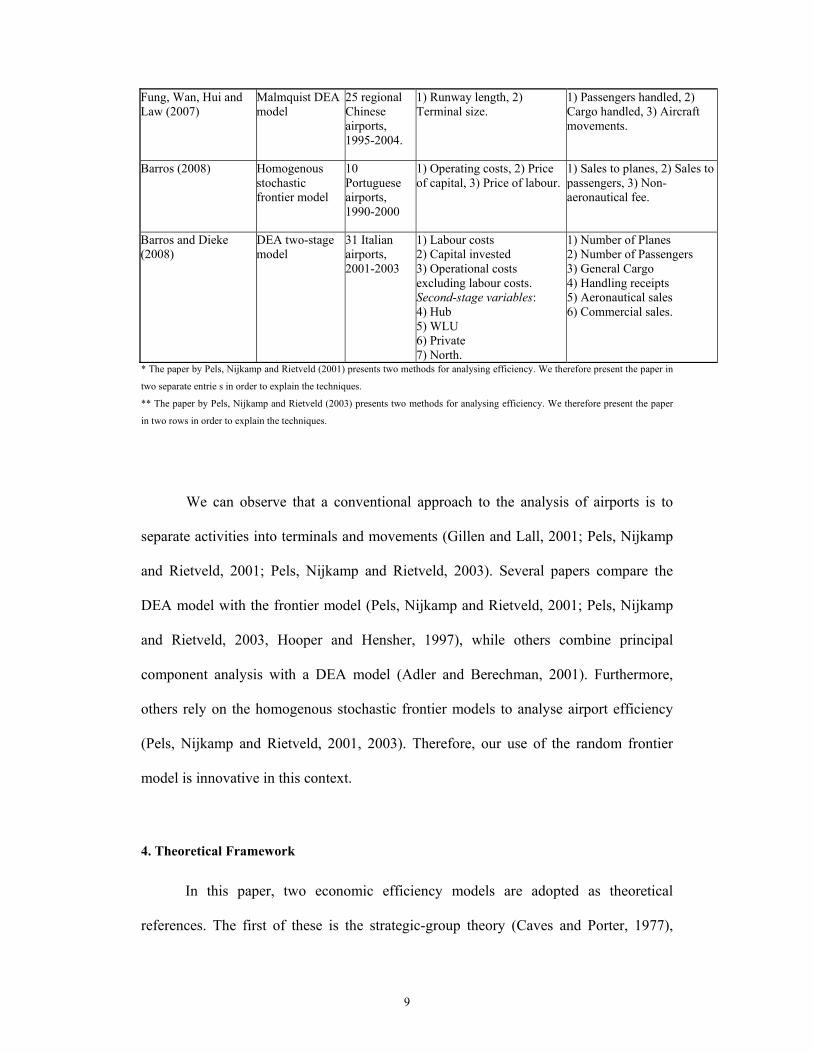
In Table 2, we present the models, inputs and outputs used in the various papers.
Table 2: Research into Airport Efficiency
Papers Method Units Inputs Outputs Gillen and Lall (1997) DEA-BCC
model and a Tobit model
21 US airports
i) Terminal services model: 1) Number of runways 2)Number of gates 3)Terminal area 4)Number of baggage collection belts 5) Number of public parking spots ii) Movement model: 1)Airport area 2)Number of runways 3) Runway area 4) Number of employees
i)Terminal services model: 1)Number of passengers 2)Pounds of cargo ii) Movements model 1)Air carrier movements 2)Commuter movements
Parker (1999) DEA-BCC and CCR models
32 U.K. regulated airports, 1979/1980 to 1995/1996. In a second model, 22 airports are analysed from 1988/89 to 1996/97
1) Number of employees, 2) Capital input estimated as an annual rental based on a real rate of return of 8% each year applied to net capital stock, 3) Other inputs defined as the residual of total operating costs.
1) Turnover, 2) Passengers handled, 3) Cargo and mail business
Murillo-Melchor (1999)
DEA-Malmquist 33 Spanish civil airports, 1992 to 1994
1) Number of workers, 2) Accumulated capital stock proxied by amortisation, 3) Intermediate expenses
Number of passengers
7
Gillen and Lall (2001) DEA-Malmquist 22 major US airports, 1989 to 1993
i) Terminal services model: 1) Number of runways, 2) Number of gates, 3) Terminal area, 4) Number of employees, 5) Number of baggage collection belts, 6) Number of public parking places. ii) Movement model: 1) Airport area, 2) Number of runways, 3) Runway area, 4) Number of employees
i) Terminal services model: 1) Number of passengers, 2) Number of pounds. ii) Movement model: 1) Air carrier movements, 2) Commuter movements.
Pels, Nijkamp and Rietveld (2001)*
DEA-BCC model.
34 European airports, 1995 to 1997
1) Terminal size in square meters, 2) Number of aircraft parking positions at the terminal, 3) Number of remote aircraft parking positions, 4) Number of check-in desks, 5) Number of baggage claims.
i) Terminal model: 1) Number of passengers. ii) Movement model: 1) Aircraft transport movements.
Pels, Nijkamp and Rietveld (2001)*
Stochastic frontier model.
34 European airports, 1995 to 1997
1) Constant, 2) Number of baggage claim units, 3) Number of parking positions at the terminal, 4) Number of remote parking positions.
i) Terminal model: 1) Number of passengers. ii) Movement model: 1) Aircraft transport movements.
Adler and Berechman (2001)
DEA-BCC with Principal Component Analysis.
26 European airports
1) Passenger terminals, runways, 2) Distance to city centres, 3) Minimum connecting times in minutes.
1)Principal components obtained from a questionnaire on airlines.
Martin and Román (2001)
DEA-CCR DEA-BCC
Spanish airports, 1997.
1)labor 2)capital 3)material
1)Passengers 2)Cargo 3)ATM
Martín-Cejas (2002) Translog cost frontier model
40 Spanish airports, 1996-1997
WLU, labour price and capital price.
total cost
Fernandes and Pacheco (2002)
DEA. 16 Brazilian airports, 1998
1) Airport surface area in m2, 2) Departure lounge in m2, 3) Number of check-in counters, 4) Curb frontage in meters, 5) Number of vehicle parking spaces, 6) Baggage claim area in m2.
Domestic passengers.
Pels, Nijkamp and Rietveld (2003)**
DEA-BCC model.
33 European airports, 1995 to 1997
i) Terminal model: 1) Airport surface area, 2) Number of aircraft parking positions at terminal, 3) Number of remote aircraft parking positions, 4) Number of
i) Terminal model: 1) Annual number of domestic and international movements ii) Movement model: 1) Annual number of domestic and international passengers.
8
runways; 5) Dummy z variables for slot-coordinated airports and 6) Dummy z variable for time restrictions.ii) Movement model: 1) Number of check-in-desks, 2) Number of baggage claim units; 3) Annual number of domestic and international movements.
Pels, Nijkamp and Rietveld (2003)**
Stochastic frontier model
As above. As above. As above.
Sarkis (2000) Several DEA models, including the CCR and BCC models.
43 US airports from 1990-1994.
1) Operating costs, 2) Employees, 3) Gates, 4) Runways.
1) Operating revenues, 2) Aircraft movements, 3) General aviation, 4) Total passengers, 5) Total freight.
Sarkis and Talluri (2004)
DEA-CCR and cross-efficiency DEA model from Doyle and Green (1994)
43 US airports from 1990-1994.
1)Operating costs, 2) Employees, 3) Gates, 4) Runways.
1) Operating revenue, 2) Aircraft movements, 3) General aviation, 4) Total passengers, 5) Total freight.
Barros and Sampaio (2004)
DEA - allocative Model.
10 Portuguese airports 1990-2000.
1) Number of employees, 2) Capital proxied by the book value of physical assets, 3) Price of capital, 4) Price of labour.
1) Number of planes, 2) Number of passengers, 3) General cargo, 4) Mail cargo, 5) Sales to planes, 6) Sales to passengers.
Yoshida (2004) Endogenous-Weight method
43 Japanese airports, 2000.
1) Runway length, 2) Terminal size.
1) Passenger loading, 2) Cargo handling, 3) Aircraft movement.
Yoshida and Fujimoto (2004)
DEA-CCR, DEA-BCC and Input distance function.
43 Japanese airports, 2000.
1) Runway length, 2) Terminal size, 3) Monetary access cost, 4) Time access cost, 5) Number of employees in terminal building.
1)Passenger loading, 2)cargo handling, 3)aircraft movement.
Lin and Hong (2006) DEA-CCR, DEA-BCC DEA-FDH
20 major world airports, 2003
1) number of employees 2) number of check counters 3) number of runways 4) number of parking spaces 5) number of baggage collection belts 6) number of aprons 7) number of boarding gages8) termina area
1)Number of passengers 2)cargo 3) movement
Barros and Dieke (2007)
Multiple DEA models
31 Italian airports, 2001-2003
1) Labour cost, 2) Capital invested, 3) Operational costs excluding wage costs.
1) Number of planes, 2) Number of passengers, 3) General cargo. 4) Handling receipts, 5) Aeronautical sales, 6) Commercial sales.
9
Fung, Wan, Hui and Law (2007)
Malmquist DEA model
25 regional Chinese airports, 1995-2004.
1) Runway length, 2) Terminal size.
1) Passengers handled, 2) Cargo handled, 3) Aircraft movements.
Barros (2008) Homogenous stochastic frontier model
10 Portuguese airports, 1990-2000
1) Operating costs, 2) Price of capital, 3) Price of labour.
1) Sales to planes, 2) Sales to passengers, 3) Non-aeronautical fee.
Barros and Dieke (2008)
DEA two-stage model
31 Italian airports, 2001-2003
1) Labour costs 2) Capital invested 3) Operational costs excluding labour costs. Second-stage variables: 4) Hub 5) WLU 6) Private 7) North.
1) Number of Planes 2) Number of Passengers 3) General Cargo 4) Handling receipts 5) Aeronautical sales 6) Commercial sales.
* The paper by Pels, Nijkamp and Rietveld (2001) presents two methods for analysing efficiency. We therefore present the paper in
two separate entrie s in order to explain the techniques.
** The paper by Pels, Nijkamp and Rietveld (2003) presents two methods for analysing efficiency. We therefore present the paper
in two rows in order to explain the techniques.
We can observe that a conventional approach to the analysis of airports is to
separate activities into terminals and movements (Gillen and Lall, 2001; Pels, Nijkamp
and Rietveld, 2001; Pels, Nijkamp and Rietveld, 2003). Several papers compare the
DEA model with the frontier model (Pels, Nijkamp and Rietveld, 2001; Pels, Nijkamp
and Rietveld, 2003, Hooper and Hensher, 1997), while others combine principal
component analysis with a DEA model (Adler and Berechman, 2001). Furthermore,
others rely on the homogenous stochastic frontier models to analyse airport efficiency
(Pels, Nijkamp and Rietveld, 2001, 2003). Therefore, our use of the random frontier
model is innovative in this context.
4. Theoretical Framework
In this paper, two economic efficiency models are adopted as theoretical
references. The first of these is the strategic-group theory (Caves and Porter, 1977),
10
which justifies differences in efficiency scores as being due to differences in the
structural characteristics of units within an industry, which in turn lead to differences in
performance. In the case of UK airports, units with similar asset configurations pursue
similar strategies, with similar results in terms of performance (Porter, 1979). While
different strategic options can be found among the different sectors of an industry, not
all options are available to each airport due to mobility impediments, causing a spread
in the efficiency scores of the industry.
The second theoretical reference is the resource-based theory (Barney, 1991; Rumelt,
1991; Wernerfelt, 1984), which justifies different efficiency on the grounds of
heterogeneity of resources and capabilities on which airports base their strategies. These
resources and capabilities may not be perfectly mobile across the industry, resulting in a
competitive advantage for the best-performing airport.
These two theoretical frameworks are rooted in economics (the strategic-group
theory) and in management (resource-based theory) and are adequate to support
efficiency analysis, whenever there are variations in the efficiency among the units
observed. Moreover, both theories have been previous used to support efficiency
analysis (Warning, 2004; Taymaz, 2005).
Purchasable assets cannot be considered to represent sources of sustainable
profits. Indeed, critical resources are not available in the market. Rather, they are built
and accumulated on the airport’s premises, their non-imitability and non-substitutability
being dependent on the specific traits of their accumulation process. The difference in
resources thus results in barriers to imitation (Rumelt, 1991) and in the airport
managers’ inability to alter their accumulated stock of resources over time. In this
context, unique assets are seen as exhibiting inherently differentiated levels of
11
efficiency; sustainable profits are ultimately a return on the unique assets owned and
controlled by the airport (Teece et al., 1997).
5. Method
The methodological approach adopt here is the stochastic cost econometric
frontier. The frontier is estimated econometrically and measures the difference between
the inefficient units and the frontier by the residuals, which are assumed to have two
components: noise and inefficiency. The general frontier cost function is of the form:
TNituitveitXCitC …=∀…=∀
+⋅= 1,2, t ;1,2, i ; )( (1)
Where Cit represents a scalar cost of the decision-unit i under analysis in the t-th period;
Xit is a vector of variables including input prices and output descriptors present in the
cost function. The error term vit is assumed to be i.i.d. and represents the effect of
random shocks (noise). It is independent of uit, which represents technical inefficiencies
and is assumed to be positive and to follow a N(0, σu2 ) distribution. The disturbance uit
is reflected in a half-normal independent distribution truncated at zero, signifying that
the cost of each airport must lie on or above its cost frontier, implying that deviations
from the frontier are caused by factors controlled by the airport management authority.
The total variance is defined as σ2 = σv2 + σu
2. The contribution of the different
elements to the total variation is given by: σv2 = σ2 / (1+ λ2) and σu
2 = σ2 λ2 / (1+ λ2);
where λ = σu / σv , which provides an indication of the relative contribution of u and v to
ε = u + v. Because estimation of equation (1) yields merely the residual ε, rather than u,
the latter must be calculated indirectly (Greene, 2003). For panel data analysis, Battese
and Coelli (1988) used the expectation of uit conditioned on the realised value of εit = uit
+ vit, as an estimator of uit. In other words, E[uit+νit| εit] is the mean productive
12
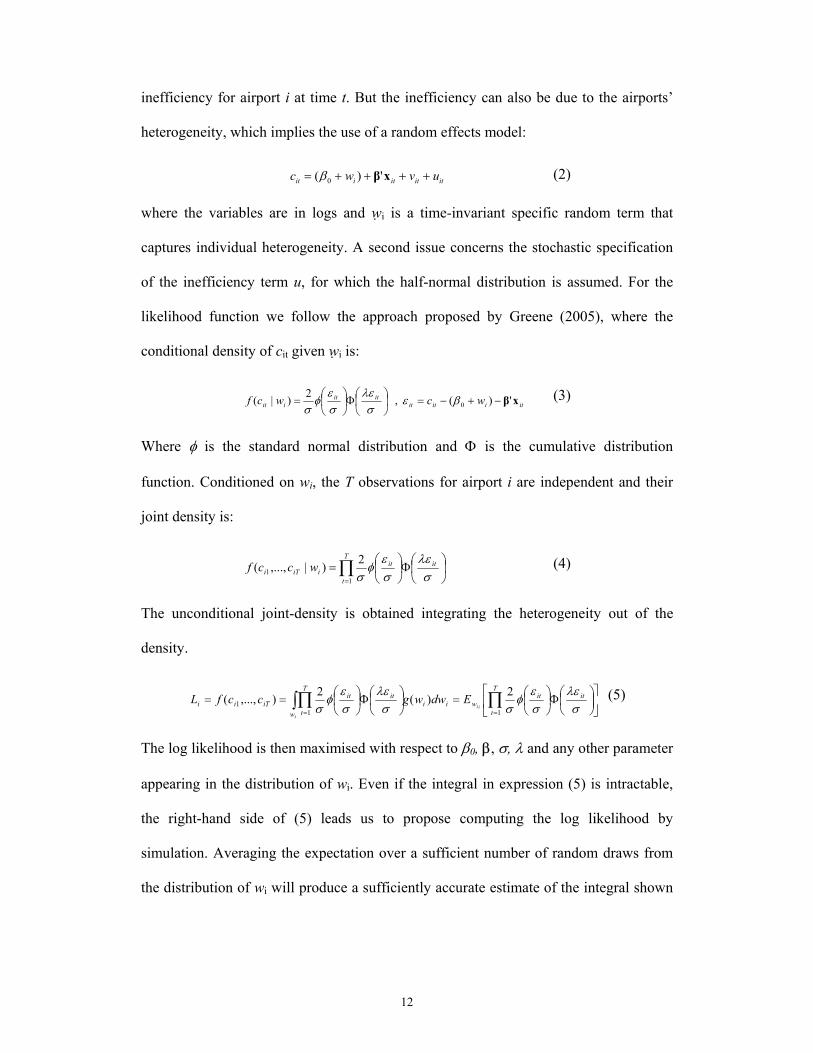
inefficiency for airport i at time t. But the inefficiency can also be due to the airports’
heterogeneity, which implies the use of a random effects model:
itititiit uvwc ++++= xβ')( 0β (2)
where the variables are in logs and w i is a time-invariant specific random term that
captures individual heterogeneity. A second issue concerns the stochastic specification
of the inefficiency term u, for which the half-normal distribution is assumed. For the
likelihood function we follow the approach proposed by Greene (2005), where the
conditional density of cit given wi is:
itiitititit
iit wcwcf xβ')( , 2)|( 0 −+−=
Φ
= βε
σλε
σε
φσ
(3)
Where φ is the standard normal distribution and Φ is the cumulative distribution
function. Conditioned on wi, the T observations for airport i are independent and their
joint density is:
∏=
Φ
=
T
t
ititiiTi wccf
11
2)|,...,(σ
λεσε
φσ
(4)
The unconditional joint-density is obtained integrating the heterogeneity out of the
density.
Φ
=
Φ
== ∏∫∏
==
T
t
ititwii
w
T
t
ititiTii ii
i
EdwwgccfL11
12)(2),...,(
σλε
σε
φσσ
λεσε
φσ
(5)
The log likelihood is then maximised with respect to β0, β, σ, λ and any other parameter
appearing in the distribution of wi. Even if the integral in expression (5) is intractable,
the right-hand side of (5) leads us to propose computing the log likelihood by
simulation. Averaging the expectation over a sufficient number of random draws from
the distribution of wi will produce a sufficiently accurate estimate of the integral shown
13
in (5) to allow estimation of the parameters (see Gourieroux and Monfort, 1996; Train,
2003). The simulated log likelihood is then:
∑ ∏∑= ==
Φ
=
R
r
T
t
iritiritN
is
wwR
L1 11
0||21log),,,,(log
σλε
σε
φσ
θσλβ β (6)
where θ includes the parameters of the distribution of wi and wir is the r-th draw for
observation i. Based on our panel data, Table 4 presents the maximum likelihood
estimators of model (1), as found in recent studies (see Greene, 2004 and 2005).
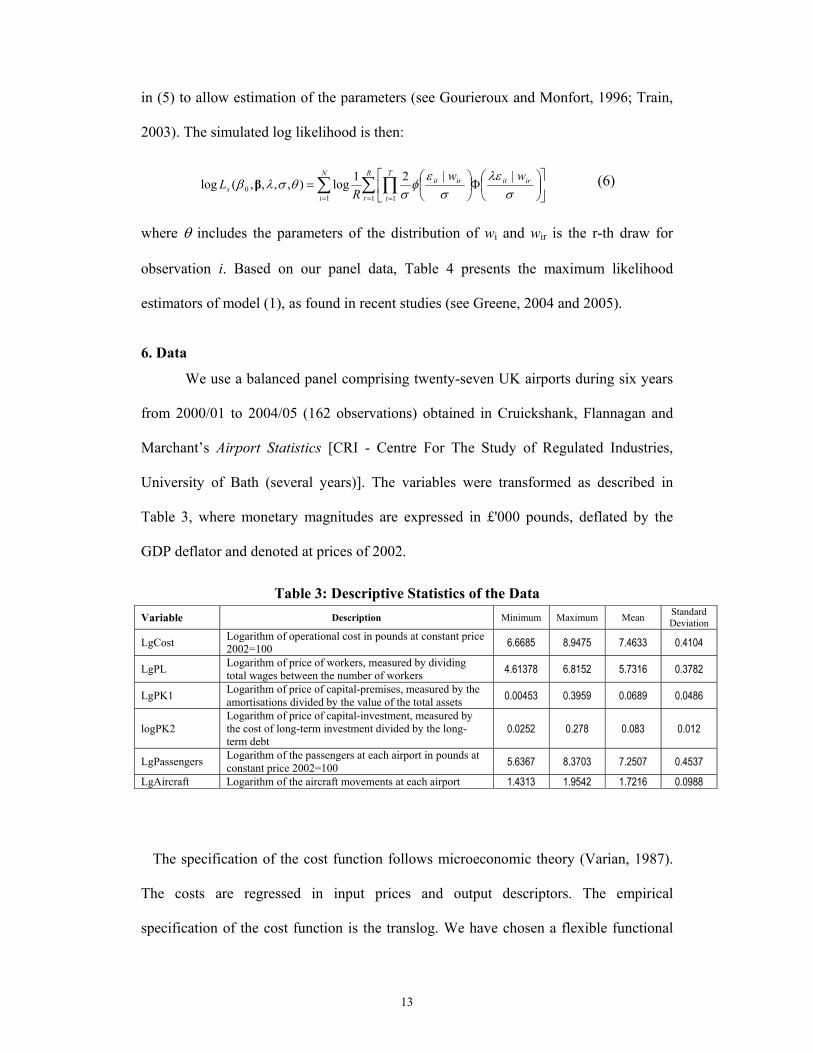
6. Data
We use a balanced panel comprising twenty-seven UK airports during six years
from 2000/01 to 2004/05 (162 observations) obtained in Cruickshank, Flannagan and
Marchant’s Airport Statistics [CRI - Centre For The Study of Regulated Industries,
University of Bath (several years)]. The variables were transformed as described in
Table 3, where monetary magnitudes are expressed in £'000 pounds, deflated by the
GDP deflator and denoted at prices of 2002.
Table 3: Descriptive Statistics of the Data Variable Description Minimum Maximum Mean Standard
Deviation
LgCost Logarithm of operational cost in pounds at constant price 2002=100 6.6685 8.9475 7.4633 0.4104
LgPL Logarithm of price of workers, measured by dividing total wages between the number of workers 4.61378 6.8152 5.7316 0.3782
LgPK1 Logarithm of price of capital-premises, measured by the amortisations divided by the value of the total assets 0.00453 0.3959 0.0689 0.0486
logPK2 Logarithm of price of capital-investment, measured by the cost of long-term investment divided by the long-term debt
0.0252 0.278 0.083 0.012
LgPassengers Logarithm of the passengers at each airport in pounds at constant price 2002=100 5.6367 8.3703 7.2507 0.4537
LgAircraft Logarithm of the aircraft movements at each airport 1.4313 1.9542 1.7216 0.0988
The specification of the cost function follows microeconomic theory (Varian, 1987).
The costs are regressed in input prices and output descriptors. The empirical
specification of the cost function is the translog. We have chosen a flexible functional
14
form in order to avoid imposing unnecessary a priori restrictions on the technologies to
be estimated. Each explanatory variable is divided by its geometric mean. In this way,
the translog can be considered as an approximation to an unknown function and the first
order coefficients can be interpreted as the production elasticities evaluated at the
sample geometric mean. We also include both a time trend and a squared time trend in
order to obtain some temporal changes. The equation to estimate is:
)(1 1
lnln1 1 1 1
lnlnlnln21
ln11
ln222
110)ln(
itUitVm
k
n
j jitwkitykjm
k
m
r
n
j
n
s sntwjitwjsritykitykr
jitwn
j jm
k kitykttitCost
−+∑=
∑=
+
∑=
∑=
∑=
∑=
+
+∑=
∑=
++++=
θδπ
βατττ
(7)
where y is the output measured as points, w denotes input price, t is a time
trend, v is a random error which reflects the statistical noise and is assumed to follow a
normal distribution centred at zero, while u reflects inefficiency and is assumed to
follow a half-normal distribution. Each explanatory variable was divided by its
geometric mean. In this way, the translog can be considered as an approximation to an
unknown function and the first order coefficients can be interpreted as the production
elasticities evaluated at the sample geometric mean. We also included a time trend and a
squared time trend in order to get some temporal changes. Therefore the equation to
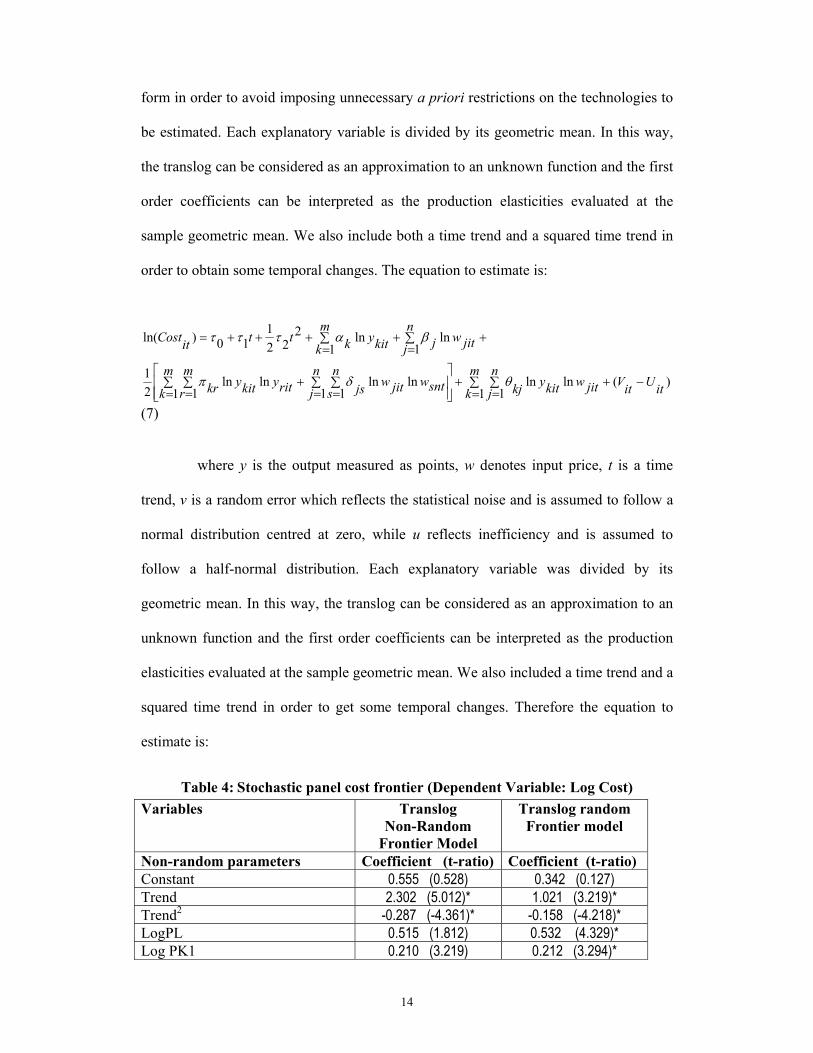
estimate is:
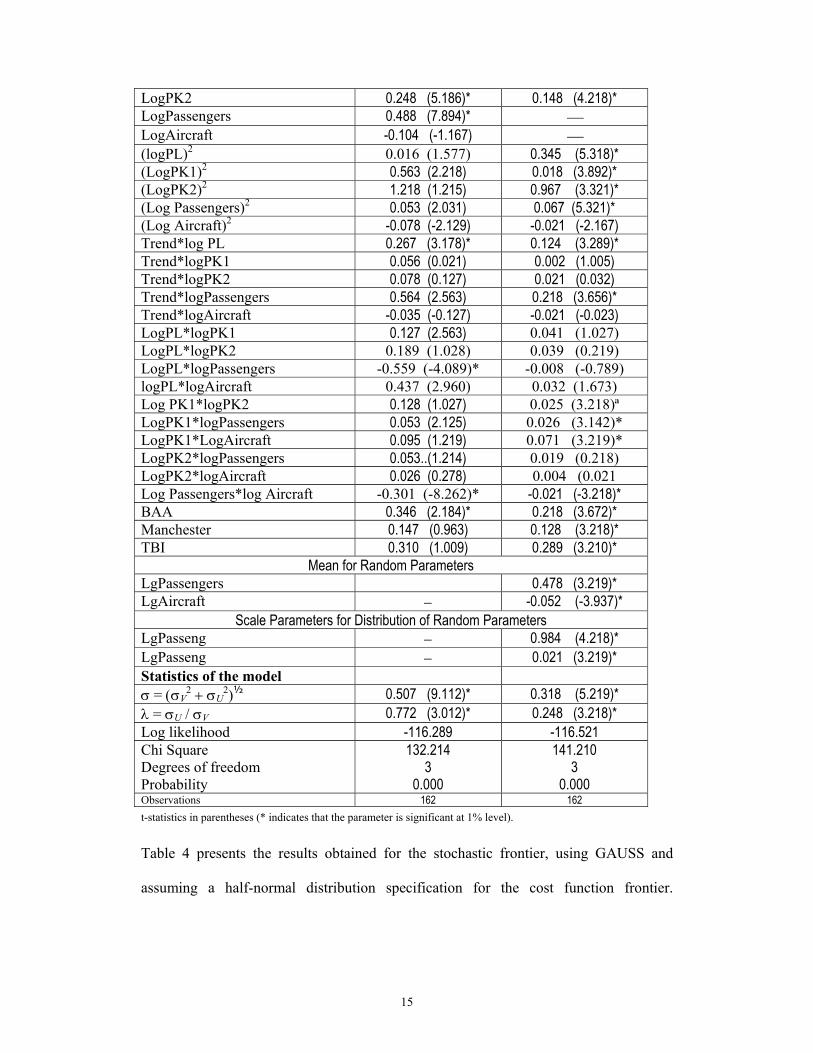
Table 4: Stochastic panel cost frontier (Dependent Variable: Log Cost)
Variables Translog Non-Random
Frontier Model
Translog random Frontier model
Non-random parameters Coefficient (t-ratio) Coefficient (t-ratio) Constant 0.555 (0.528) 0.342 (0.127) Trend 2.302 (5.012)* 1.021 (3.219)* Trend2 -0.287 (-4.361)* -0.158 (-4.218)* LogPL 0.515 (1.812) 0.532 (4.329)* Log PK1 0.210 (3.219) 0.212 (3.294)*
15
LogPK2 0.248 (5.186)* 0.148 (4.218)* LogPassengers 0.488 (7.894)* LogAircraft -0.104 (-1.167) (logPL)2 0.016 (1.577) 0.345 (5.318)* (LogPK1)2 0.563 (2.218) 0.018 (3.892)* (LogPK2)2 1.218 (1.215) 0.967 (3.321)* (Log Passengers)2 0.053 (2.031) 0.067 (5.321)* (Log Aircraft)2 -0.078 (-2.129) -0.021 (-2.167) Trend*log PL 0.267 (3.178)* 0.124 (3.289)* Trend*logPK1 0.056 (0.021) 0.002 (1.005) Trend*logPK2 0.078 (0.127) 0.021 (0.032) Trend*logPassengers 0.564 (2.563) 0.218 (3.656)* Trend*logAircraft -0.035 (-0.127) -0.021 (-0.023) LogPL*logPK1 0.127 (2.563) 0.041 (1.027) LogPL*logPK2 0.189 (1.028) 0.039 (0.219) LogPL*logPassengers -0.559 (-4.089)* -0.008 (-0.789) logPL*logAircraft 0.437 (2.960) 0.032 (1.673) Log PK1*logPK2 0.128 (1.027) 0.025 (3.218)ª LogPK1*logPassengers 0.053 (2.125) 0.026 (3.142)* LogPK1*LogAircraft 0.095 (1.219) 0.071 (3.219)* LogPK2*logPassengers 0.053..(1.214) 0.019 (0.218) LogPK2*logAircraft 0.026 (0.278) 0.004 (0.021 Log Passengers*log Aircraft -0.301 (-8.262)* -0.021 (-3.218)* BAA 0.346 (2.184)* 0.218 (3.672)* Manchester 0.147 (0.963) 0.128 (3.218)* TBI 0.310 (1.009) 0.289 (3.210)*
Mean for Random Parameters LgPassengers 0.478 (3.219)* LgAircraft − -0.052 (-3.937)*
Scale Parameters for Distribution of Random Parameters LgPasseng − 0.984 (4.218)* LgPasseng − 0.021 (3.219)* Statistics of the model σ = (σV
2 + σU2)½ 0.507 (9.112)* 0.318 (5.219)*
λ = σU / σV 0.772 (3.012)* 0.248 (3.218)* Log likelihood -116.289 -116.521 Chi Square Degrees of freedom Probability
132.214 3
0.000
141.210 3
0.000 Observations 162 162 t-statistics in parentheses (* indicates that the parameter is significant at 1% level).
Table 4 presents the results obtained for the stochastic frontier, using GAUSS and
assuming a half-normal distribution specification for the cost function frontier.
16
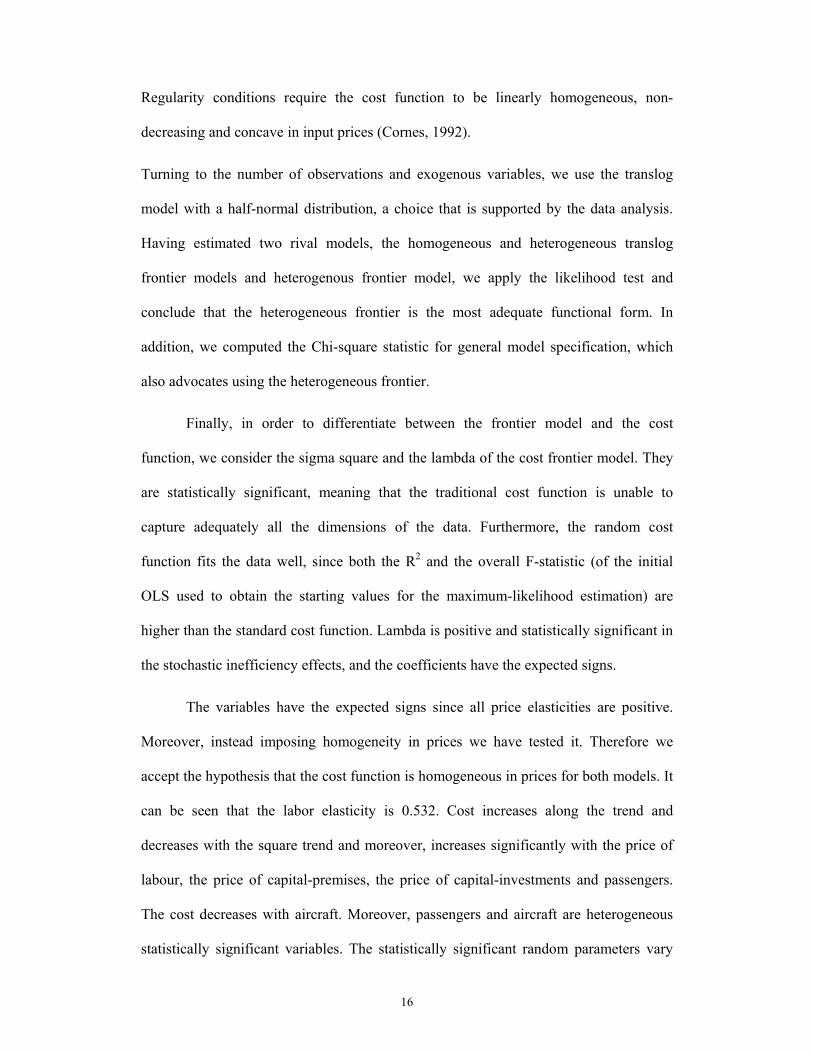
Regularity conditions require the cost function to be linearly homogeneous, non-
decreasing and concave in input prices (Cornes, 1992).
Turning to the number of observations and exogenous variables, we use the translog
model with a half-normal distribution, a choice that is supported by the data analysis.
Having estimated two rival models, the homogeneous and heterogeneous translog
frontier models and heterogenous frontier model, we apply the likelihood test and
conclude that the heterogeneous frontier is the most adequate functional form. In
addition, we computed the Chi-square statistic for general model specification, which
also advocates using the heterogeneous frontier.
Finally, in order to differentiate between the frontier model and the cost
function, we consider the sigma square and the lambda of the cost frontier model. They
are statistically significant, meaning that the traditional cost function is unable to
capture adequately all the dimensions of the data. Furthermore, the random cost
function fits the data well, since both the R2 and the overall F-statistic (of the initial
OLS used to obtain the starting values for the maximum-likelihood estimation) are
higher than the standard cost function. Lambda is positive and statistically significant in
the stochastic inefficiency effects, and the coefficients have the expected signs.
The variables have the expected signs since all price elasticities are positive.
Moreover, instead imposing homogeneity in prices we have tested it. Therefore we
accept the hypothesis that the cost function is homogeneous in prices for both models. It
can be seen that the labor elasticity is 0.532. Cost increases along the trend and
decreases with the square trend and moreover, increases significantly with the price of
labour, the price of capital-premises, the price of capital-investments and passengers.
The cost decreases with aircraft. Moreover, passengers and aircraft are heterogeneous
statistically significant variables. The statistically significant random parameters vary
17
along the sample. The identification of the mean values of random parameters implies
taking into account heterogeneity when implementing cost control measures.
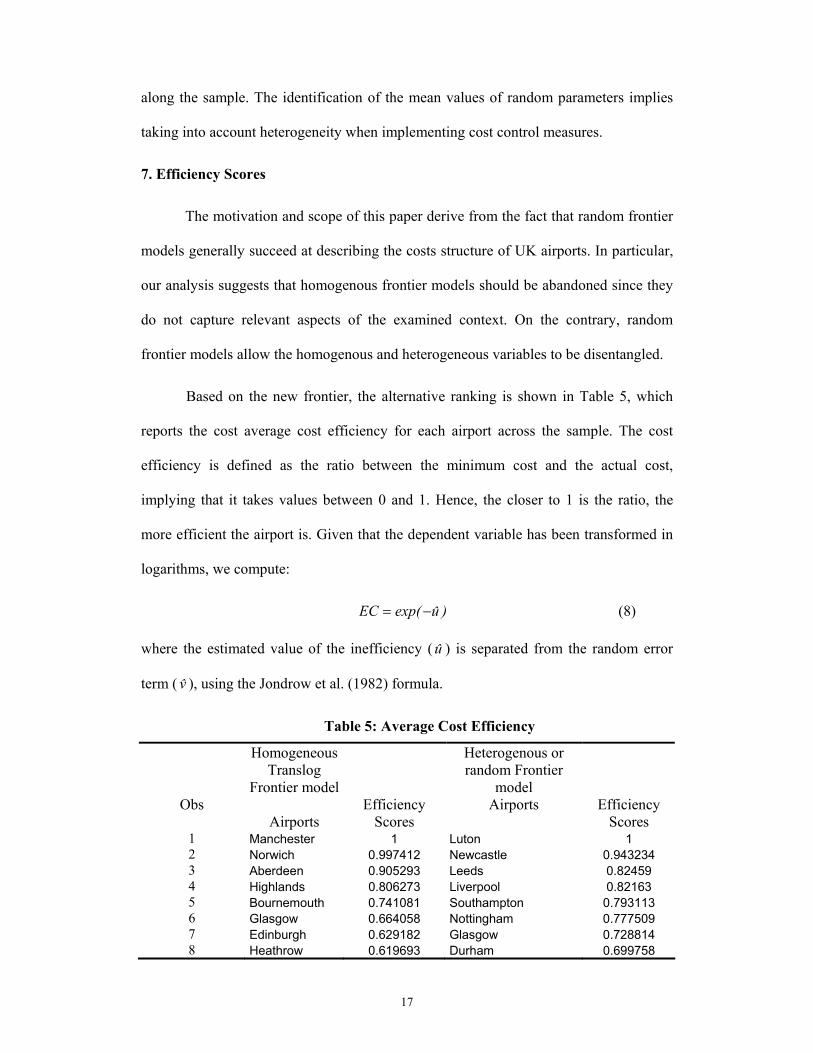
7. Efficiency Scores
The motivation and scope of this paper derive from the fact that random frontier
models generally succeed at describing the costs structure of UK airports. In particular,
our analysis suggests that homogenous frontier models should be abandoned since they
do not capture relevant aspects of the examined context. On the contrary, random
frontier models allow the homogenous and heterogeneous variables to be disentangled.
Based on the new frontier, the alternative ranking is shown in Table 5, which
reports the cost average cost efficiency for each airport across the sample. The cost
efficiency is defined as the ratio between the minimum cost and the actual cost,
implying that it takes values between 0 and 1. Hence, the closer to 1 is the ratio, the
more efficient the airport is. Given that the dependent variable has been transformed in
logarithms, we compute:
)uexp(EC −= (8)
where the estimated value of the inefficiency ( u ) is separated from the random error
term ( v ), using the Jondrow et al. (1982) formula.
Table 5: Average Cost Efficiency
Homogeneous Translog
Frontier model
Heterogenous or random Frontier
model
Obs Airports
Efficiency Scores
Airports Efficiency Scores
1 Manchester 1 Luton 1 2 Norwich 0.997412 Newcastle 0.943234 3 Aberdeen 0.905293 Leeds 0.82459 4 Highlands 0.806273 Liverpool 0.82163 5 Bournemouth 0.741081 Southampton 0.793113 6 Glasgow 0.664058 Nottingham 0.777509 7 Edinburgh 0.629182 Glasgow 0.728814 8 Heathrow 0.619693 Durham 0.699758
18
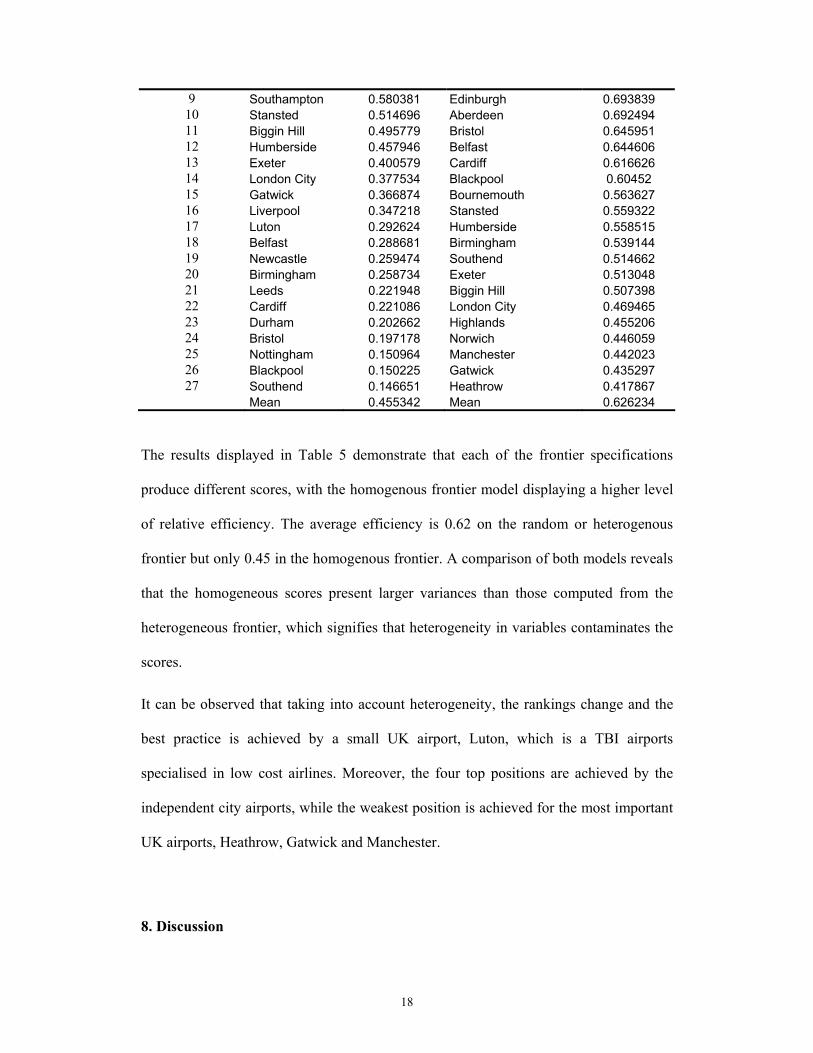
9 Southampton 0.580381 Edinburgh 0.693839 10 Stansted 0.514696 Aberdeen 0.692494 11 Biggin Hill 0.495779 Bristol 0.645951 12 Humberside 0.457946 Belfast 0.644606 13 Exeter 0.400579 Cardiff 0.616626 14 London City 0.377534 Blackpool 0.60452 15 Gatwick 0.366874 Bournemouth 0.563627 16 Liverpool 0.347218 Stansted 0.559322 17 Luton 0.292624 Humberside 0.558515 18 Belfast 0.288681 Birmingham 0.539144 19 Newcastle 0.259474 Southend 0.514662 20 Birmingham 0.258734 Exeter 0.513048 21 Leeds 0.221948 Biggin Hill 0.507398 22 Cardiff 0.221086 London City 0.469465 23 Durham 0.202662 Highlands 0.455206 24 Bristol 0.197178 Norwich 0.446059 25 Nottingham 0.150964 Manchester 0.442023 26 Blackpool 0.150225 Gatwick 0.435297 27 Southend 0.146651 Heathrow 0.417867 Mean 0.455342 Mean 0.626234
The results displayed in Table 5 demonstrate that each of the frontier specifications
produce different scores, with the homogenous frontier model displaying a higher level
of relative efficiency. The average efficiency is 0.62 on the random or heterogenous
frontier but only 0.45 in the homogenous frontier. A comparison of both models reveals
that the homogeneous scores present larger variances than those computed from the
heterogeneous frontier, which signifies that heterogeneity in variables contaminates the
scores.
It can be observed that taking into account heterogeneity, the rankings change and the
best practice is achieved by a small UK airport, Luton, which is a TBI airports
specialised in low cost airlines. Moreover, the four top positions are achieved by the
independent city airports, while the weakest position is achieved for the most important
UK airports, Heathrow, Gatwick and Manchester.
8. Discussion
19
This article has proposed a simple framework for the comparative evaluation of
UK airports and the rationalization of their operational activities. The analysis was
carried out through implementation of a Random or heterogenous stochastic frontier
model, which allows for the incorporation of multiple inputs and outputs in determining
the relative efficiencies and the inclusion of heterogeneity in the data.
The main policy implication of the findings of the present analysis is that
heterogeneity must be considered a major issue in the UK airports. Accordingly, public
policies towards airports should take into account such heterogeneity. For instance, the
authorities could implement policies by segments defined by passengers and aircraft
with the aim of regulating aircraft and passenger movements in the UK airports. The
planned “open skies” between the USA and the UK is one such policy, since it will have
an adverse effect on London’s airports and be more beneficial to other British airports.
Understandably, BAA is now blocking the accord. New slots allocation in congested
airports is another policy move. Airport capacity is expressed in slots (i.e. an expression
of capacity representing the permission given to a carrier to operate an air service at a
slot-controlled airport on a specific date and time for the purpose of landing and take-
off) and is allocated within the framework of voluntary guidelines developed and
evolved over the years by IATA. Slot allocation in European Union airports falls within
the scope of the European Union Single Market, thus being subject to a common
regulatory framework under European Council Regulation. Under the congestion
pricing strategy (Madas and Zografos, 2008), historic slot rights will be abandoned and
a congestion-based scheme with fees varying with congestion throughout the day will
be set by an administrative authority. Each carrier could operate at any time or slot by
paying the corresponding scarcity rent (i.e., congestion fee). During recent years, the
European Commission (1993, 2001, 2004) has pursued a radical revision of the existing
20
slot allocation regime, aiming to deal with the scarcity of airport capacity. However,
IATA regulation 95/93 denies the use of market-based mechanisms to allocate slots.
The European Commission proposes several market-based slot allocation mechanisms
(Madas and Zagrafos, 2008). This will be a natural area for cluster regulation, using
different market–based slot allocation mechanisms based on the characteristics of the
UK airports.
Relative to results of the model, the cost increases alongside with the trend,
which hints that there are not technological improvements during the period to drive the
costs down? However, costs increases at decreasing rate. Moreover, the cost
significantly increases homogenously with price of labour, price of capital-premises and
capital-investment. It also rises with passengers and aircrafts, but in a random way. The
significant random parameters vary along the sample. The identification of the mean
values of random parameters implies having into account the heterogeneity when
implementing policies for cost control.
What is the rationality of this result? This is an intuitive result, since airports are not
homogenous. There are small and large and medium sized airport. These visible
characteristics translate into different performances obtained in the market, resulting in
different clusters within the market. These clusters are distinguished from each other
based on the passenger and aircraft. This result also signifies that other inputs are
relatively homogenous on the labour and capital. With regard to labour and capital, this
means that competition over resources drives the market and translates into
homogenous dynamics in the labour and capital market.
How can we explain the efficiency rankings? This is an endogenous result of the model,
which can be explained by congestions and other managerial problems that the bigger
airports are facing in contemporary world which affect their performance.
21
In comparison with the previous literature in this area, our research overcomes
the bias towards DEA models in studies on airports. Relative to the stochastic frontier
model, all published papers have adopted models using homogenous frontiers and no
clear comparisons can be made. The comparison between homogenous and
heterogeneous frontier models is undertaken in the present research, concluding that
heterogeneity better captures the cost structure of the UK airports, based on the log
likelihood test. Possibly, the main limitation of the present research relates to the data
span, which is, to some extent, short for econometric purposes. The prevalence of DEA
models in this research field exhibits the problem of the short data span at European
level. Therefore, a larger data set is needed to confirm the validity of the present results.
The main limitations of the present research are related to the short data span.
Since the data set is short, the conclusions are limited. In order to generalise, a larger
panel data set would be necessary. Future extensions of the present research include the
analysis of the effects of competition, regulation and the Spanish presence on the
efficiency of airports in the UK, Oum, Adler and Yu (2006).
9. Conclusion
Common policies can be defined for UK airports based on the average values of
the homogeneous variables, whereas segmented policies may be prescribed to account
for heterogeneous variables. Given that the scale parameters of heterogeneous variables
are statistically significant, we recognise such heterogeneity, which entails managerial
insights and policy implications.
More research is needed to confirm the present conclusions.
22
References
Adler, N., Berechman, J., 2001. Measuring Airport Quality from the Airlines’
Viewpoint: An Application of Data Envelopment Analysis. Transport Policy, 8, 171-
181.
Barney J. 1991. Firm resources and sustained competitive advantage. Journal of
Management, 17, 99-120.
Barros, C.P., Sampaio, A., 2004. Technical and Allocative Efficiency in Airports.
International Journal of Transport Economics, 31, 355-377.
Barros, C.P. Dieke, P.U.C., 2007. Performance Evaluation of Italian Airports with Data
Envelopment Analysis. Journal of Air Transport Management, 13, 184-191.
Barros, C.P., 2008. Technical change and productivity growth in airports: A case study.
Transportation Research, Part A. (forthcoming).
Barros, C.P. and Dieke, P.U.C., 2008. Measuring the Economic Efficiency of Airports:
A Simar-Wilson Methodology Analysis. Transportation Research Part E (forthcoming).
Battese, G.E. and T.J. Coelli, 1988. Prediction of firm-level technical efficiencies with a
generalised frontier production function and panel data, Journal of Econometrics 38, 387-
399.
23
Caves, R. and Porter, M. E. 1977. From entry barriers to mobility barriers: Conjectural
decisions and contrived deterrence to new competition. Quarterly Journal of Economics,
91,241-261.
Cornes R., 1992. Duality and modern economics. Cambridge University Press, Cambridge,
UK.
Cruickshank, A.; Flannagan, P. and Marchant, J. (several years). Airport Statistics, CRI
- Centre For The Study of Regulated Industries, University of Bath, U.K.
De Borger, B., Kerstens, K., Costa, A., 2002. Public Transit Performances: what does
one learn from frontier studies? Transport Reviews, 22, 1, 1-38.
European Commission, 1993. European Council Regulation nº 95/93 of January 1993on
Common Rules for the Allocation of Slots at Community Airport. Official Journal of
the European Union, Brussels, Belgium, L 014, pp. 0001-0006.
European Commission, 2001. Proposal for a Regulation of the European Parliament
and of the Council amending Council Regulation no. 95/93 of January 1993 on
Common Rules for the Allocation of Slots at Community Airport. COM (2001) 335
Final , Brussels, Belgium.
European Commission, 2004.Regulation no. 793/2004 of the European Parliament and
of the Council of 21 April Amending Council Regulation n0. 95/93 on Common Rules
24
for the Allocation of Slots at Community Airports. Official Journal of the European
Union, Brussels, Belgium, L. 138, pp. 50-60.
Fernandes, E., Pacheco, R. R., 2002. Efficienct Use of Airport Capacity. Transportation
Research : Part A. Policy and Practice, 36, 225-38.
Fung, M.K.Y., Wan, K.K. H., Hui, Y.V., Law, J.S., 2007. Productivity Changes in
Chinese Airports 1995-2004. Transportation Research, Part E (forthcoming).
Gillen, D., Lall, A., 1997. Non-Parametric Measures of Efficiency of US Airports.
International Journal of Transport Economics, 28, 283-306.
Gillen, D., Lall, A., 2001. Developing Measures of Airport Productivity and
Performance: An Application of Data Envelopment Analysis. Transportation Research,
Part E, 33, 261-273.
Gourieroux, C. and A. Monfort, 1996. Simulation Based Methods: Econometric Methods.
(Oxford University Press, Oxford, UK).
Graham, A., 2005. Airport Benchmarking: A Review of the Current Situation.
Benchmarking: An International Journal, 12, 99-111.
Greene, W., 2003. Econometric Analysis, 5th ed. Prentice Hall, Upper Saddle River, NJ.
25
Greene, W., 2004. Distinguishing between heterogeneity and efficiency: stochastic frontier
analysis of the World Health Organisation’s panel on national health care systems. Health
Economics 13, 959-980.
Greene, W., 2005. Fixed and random effects in stochastic frontier models. Journal of Productivity
Analysis 23, 7-32.
Hooper, P.G., Hensher, D. A., 1997. Measuring Total Factor Productivity of Airports:
An Index Number Approach. Transportation Research, Part E. Logistics and
Transportation Review, 33, 249-59.
Humphreys, I., Francis, G., 2002. Performance Measurement: A Review of Airports.
International Journal of Transport Management, 1, 79-85.
Humphreys, I. Francis, G. and Fry, J., 2002. The benchmarking of airport performance.
Journal of Air Transport Management, 8, 239-247.
Jessop, A., 2003. Blockmodels with maximum entropy. European Journal of Operational
Research, 148, 1: 56-64.
Jondrow, J., Lovell, C.A.K.; Materov, I.S. and Schmidt,P. 1982. On the estimation of
technical inefficiency in the stochastic frontier production function model. Journal of
Econometrics, 19, 233-238.
26
Lin, L.C. and Hong, C.H., 2006. Operational performance evaluation of International major
airports: An application of data envelopment analysis. Journal of Air Transport
Management, 12, 342-351.
Madas, M.A. and Zografos, K.G., 2008. Airport capacity vs. demand: Mismatch or
Mismanagement? Transportation Research Part A 42, 1, 203-226.
Martín –Cejas, R.R., 2002. An approximation to the productive efficiency of the
Spanish airports network through a deterministic cost frontier. Journal of Air Transport
Management, 8, 233-238.
Martín, J.C. and Román, C., 2001. An application of DEA to measure the efficiency of
Spansih airports prior to privatisation. Journal of Air Transport Management, 7, 149-
157.
Murillo-Melchor, C., 1999. An Analysis of Technical Efficiency and Productive
Change in Spanish Airports Using the Malmquist Index. International Journal of
Transport Economics 26, 271-92.
Oum, T.; Zhang, A. and Zhang, Y., 2004. Alternative Forms of Economic Regulation
and Their Implications for Airports. Journal of Transport Economics and Policy,
38,217-246.
Oum, T.H.; Adler, N. And Yu, C., 2006. Privatization, corporatization, ownership forms
and their effects on the performance of the worlds’s major airports. Journal of air
Transport management, 12, 109-121.
27
Parker, D., 1999. The Performance of the BAA Before and After Privatisation. Journal
of Transport Economics and Policy 33, 133-146.
Pels, E., Nijkamp, P., Rietveld, P., 2003. Inefficiency and Scale Economics of European
Airport Operations. Transportation Research Part E 39, 341-361.
Pels, E., Nijkamp, P. Rietveld, P., 2001. Relative Efficiency of European Airports.
Transport Policy 8, 183-192.
Porter, M.E., 1979. The structure within industries and companies’ performance. The
Review of Economics and Statistics, 61, 214-227.
Rumelt, R., 1991. How much does industry matter? Strategic Management Journal, 12,
2, 167-185.
Taymaz, E., 2005. Are small firms really less productive? Small Business Economics, 25,5,
429-445.
Teece D., Pisano G. and Shuen A., 1997. Dynamic capabilities and strategic management.
Strategic Management Journal, 18, 7, 509-533.
Sarkis, J., 2000. Operational Efficiency of Major US Airports. Journal of Operation
Management 18, 335-251.
28
Sarkis, J., Talluri, S., 2004. Performance-Based Clustering for Benchmarking of US
Airports. Transportation Research Part A 38, 329-346.
Train, K. 2003. Discrete Choice Methods with Simulation, Cambridge, Cambridge
University Press.
Yoshida, Y., Fujimoto, H., 2004. Japanese-Airport Benchmarking with DEA and
Endogenous-Weight TFP Methods: Testing the Criticism of Over-investment in
Japanese Regional Airports. Transportation Research Part E 40, 533-546.
Yoshida, Y., 2004. Endogenous-Weight TFP Measurement: Methodology and its
Application to Japanese-Airport Benchmarking. Transportation Research Part E 40,151-
182.
Varian, H.R., 1987. Intermediate Microeconomics: A Modern Approach. N.Y.: Norton
and Co.
Warning, S., 2004. Performance differences in German Higher Education: Empirical
Analysis of Strategic Groups. Review of Industrial Organisation, 24,4, 393-408.
Wernerfelt, B., 1984. A resource-based view of the firm. Strategic Management Journal, 5,
2, 171-180.