
The Commercial Performance of Global Airports
25
WORKING PAPER The Commercial Performance of Global Airports By FRANZ FUERST* AND SVEN GROSS ** * University of Cambridge, Dept of Land Economy, 16-21 Silver St, Cambridge CB3 9EP, United Kingdom, [email protected], phone: +44 (0)1223 37137 ** Harz University of Applied Sciences, Friedrichstraße 57-59, 38855 Wernigerode, Germany
Transcript of The Commercial Performance of Global Airports
WORKING PAPER
The Commercial Performance of Global Airports
By
FRANZ FUERST*
AND
SVEN GROSS **
* University of Cambridge, Dept of Land Economy, 16-21 Silver St, CambridgeCB3 9EP, United Kingdom, [email protected], phone: +44 (0)1223 37137
** Harz University of Applied Sciences, Friedrichstraße 57-59, 38855Wernigerode, Germany

2
The Commercial Performance of Global Airports
Abstract
Revenues from non-aeronautical business have received increasing attention from airportsseeking to enhance their profitability. This study analyzes the commercial performance ofglobal airports using a panel dataset of 75 airports in 30 countries. Applying pooled OLS,random effects and 3SLS estimation frameworks, we identify the main drivers of financialperformance. Our results are in line with the existing literature, where the share ofinternational passengers, financial risk as well as airport size and the mix and intra-terminallocation of retail space are found to be significant determinants. The latter finding indicatesthe presence of economies of scale in generating higher commercial revenue and ensuringprofitability for an airport's non-aeronautical operations. No empirical support is found forthe hypothesis that privatization or state ownership of an airport and/or the national incomeper capita are significant factors of an airport's financial performance. Regarding the retailmix, a higher share of food and beverage outlets appears to depress the commercial yieldwhile a higher percentage of outlets located airside is associated with higher yields.
Keywords: commercial revenues, non-aeronautical airport income, airport finances
1. Introduction
Airports operate in a highly cyclical business environment which is affected
by many external factors. One strategy to reduce these economic risks is for
airports to expand their non-aeronautical activities in an effort to be less
susceptible to economic shocks compared to full reliance on the aeronautical
sector. The main argument in favour of such a strategy is that the non-
3
aeronautical segment encompasses a more diverse range of customer groups.
Apart from passengers, airport employees and visitors that are all closely
connected to the aeronautical operations of an airport, the non-aeronautical
commercial and retail facilities is additionally also frequented by local
residents, employees and visitors of companies locating near the airport and
other types of customers that are not airline passengers. Increasingly,
airports also include convention centers and other entertainment, business
and leisure facilities which are largely independent of fluctuations in air
passenger volumes. Furthermore, the expansion of the non-aeronautical
business is also attractive because of its lower operational cost structure
compared to the aeronautical business which may make it more profitable. In
some cases, non-aeronautical revenues even account for the largest share of
the profits of an airport operator. Increasingly, major credit rating
agencies take the diversification of revenue sources into consideration in
their financial ratings of airports (Behnke, 2008; Deloitte, 2009).
The importance of airport commercial activities and the airport retail
sector in particular has received considerable attention over the last
decade, particularly as liberalization and deregulation of the aviation
industry has forced airports worldwide to find new sources of income to
replace the aviation revenues lost because of the increasing market power of
airlines such as Ryanair, EasyJet or other Low Cost Carriers or also to
third party ground service operators. Despite the obvious importance of
commercial activities in light of these recent developments, research on the
commercial performance of airports and its determinants is still scarce.
This paper presents the first comprehensive academic study of global
commercial airport performance. There exists a growing body of empirical
studies of the non-aviation business, particularly on individual business
activities ranging from parking space management and parking revenue (e.g.
4
Qin/Olaru, 2013) to commercial real estate to the development of airports
towards so called airport cities (e.g. Aldridge et al., 2001; Appold and
Kasarda, 2013 Poungias, 2009; Reiss, 2007; Tacke, 2008). Several studies
focus on the retail sector, for example the characteristics of airport
retail, its development and potential for improvement (Giljohann-Farkas
2008), contractual aspects (e.g. Freathy/O’Connell, 1999; Kim/Shin, 2001)
and customer structures (e.g. Geuens/Vantomme/Brengman, 2004). However, the
majority of these studies is of descriptive character. Econometric studies
in this topic area predominantly deal with retail drivers, in particular
drivers of retail revenues in general (Volkova, 2009), influencing factors
of sales total and per passenger (Appold/Kasarda, 2006), influencing factors
for consuming food/beverages and making a purchase (Castillo-Manzano, 2010)
or only selected drivers, e.g. waiting time (Torres et al., 2005) or time
pressure and impulse buying tendency (Lin/Chen, 2013). The present study
expands on these studies by incorporating a large range of potential
explanatory factors that impact on revenues from retail and other commercial
non-aviation activities of airports. It analyses the drivers of commercial
performance and the drivers of airports using a sample of 75 airports in 30
countries. The next section reviews the existing literature in more depth to
derive possible specifications for an empirical model of airport commercial
revenues and rentability.
2. State of Research
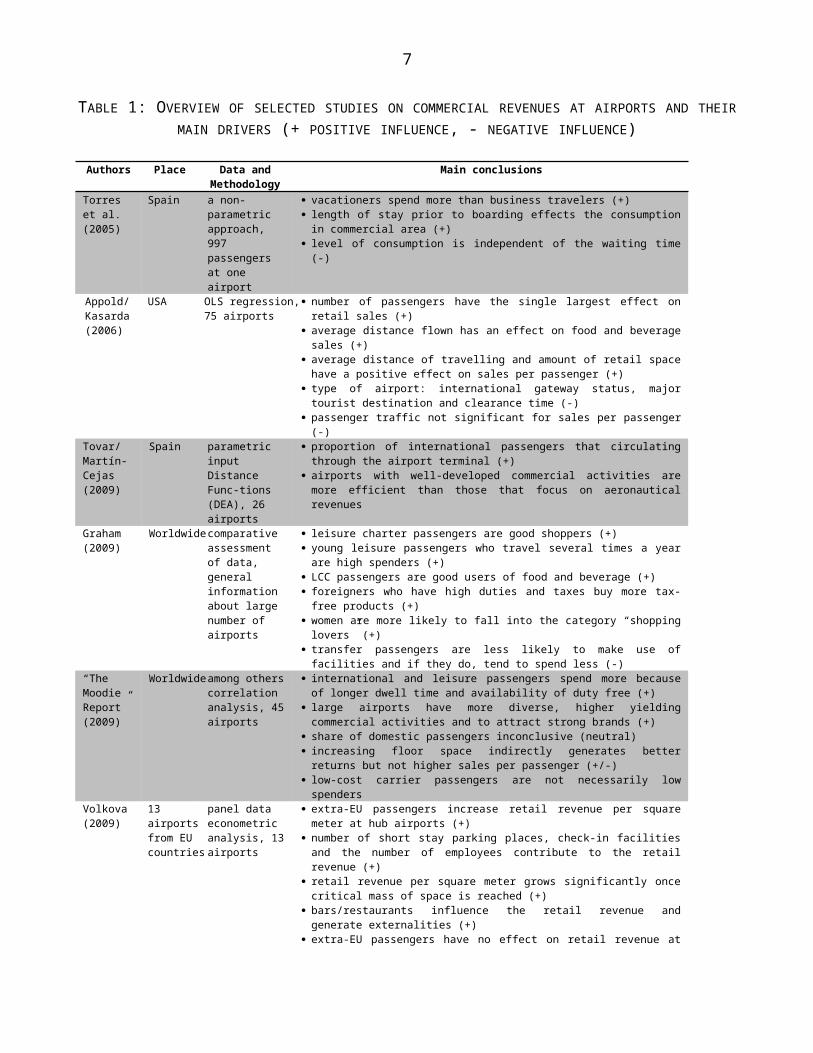
An overview of studies on commercial revenues at airports and their main
drivers, and their main conclusions is provided in Table 1. These are
typically single-country studies, particularly in the United States and
Spain drawing on figures reported by the airports directly and in a few
cases on consumer surveys. Recent econometric studies conclude that the size
5
of an airport and the number of passengers, average flight times and
accordingly the fraction of passengers on international flights and the
amount of retail space are the most important drivers of airport commercial
revenues. Additionally, Castillo-Manzano's (2010) analysis implies that the
share of frequent flyers is a distinct and important as this group may spend
more at airport retail outlets.
However, leisure travelers tend to spend more money at the airport than
business travellers due to longer average dwell times which have a
significant impact on an individual's expenses. It is considered that the
waiting time prior to embarking and the inclination of travelers to spend
more money if they are on a holiday trip explain the decision to consume
food/beverages and to make a non-food purchase. Once the decision has been
made to spend money, the amount has been shown to increase in line with a
passenger's waiting time. Castillo-Manzano (2010) reports that the
likelihood of food/beverages being consumed and a purchase being made
increases by 31 and 19 percent respectively if the waiting time exceeds 3
hours while the amount spent increases by almost 41 percent. The demographic
and social characteristics of the passengers appear to be important
predictors of spending behavior:
families with children have a higher likelihood to make a purchase or
to consume food/beverages, but this factor is also the greatest curb
on the amount spent,
elderly people have a less likelihood to make a purchase or to consume
food/beverages,
homemaker purchase rarely at an airport,
people in a group consume more food/beverages on average than if they are
alone,
6
passenger being accompanied to an airport eat/drink something with the
accompanying individual.
In sum, the size of an airport (expressed in passenger numbers and
aircraft movements), the national income in the state of the airport
(expressed in GDP and GDP per capita) as well as the size and situation of
the retail-surface (airside and landside) are key commercial revenue that
are common to the present study and the literature reviewed in this
section. Moreover, the present analysis includes additional factors which
have not or rarely been investigated in studies on airport revenues, e.g.
the coordination level of an airport (level from 1 to 3), the terms of
ownership (state-run, partially privatised, fully privatised) along with
factors identified in studies of infrastructure projects such as financial
risk and inflation (Forsyth, 2004; Hammami/RuhashyankikoYehoue1, 2006;
Leviäkangas, 2007).
7
TABLE 1: OVERVIEW OF SELECTED STUDIES ON COMMERCIAL REVENUES AT AIRPORTS AND THEIRMAIN DRIVERS (+ POSITIVE INFLUENCE, - NEGATIVE INFLUENCE)
Authors Place Data andMethodology
Main conclusions
Torres et al. (2005)
Spain a non-parametric approach, 997 passengers at one airport
vacationers spend more than business travelers (+) length of stay prior to boarding effects the consumptionin commercial area (+)
level of consumption is independent of the waiting time(-)
Appold/Kasarda(2006)
USA OLS regression, 75 airports
number of passengers have the single largest effect onretail sales (+)
average distance flown has an effect on food and beveragesales (+)
average distance of travelling and amount of retail spacehave a positive effect on sales per passenger (+)
type of airport: international gateway status, majortourist destination and clearance time (-)
passenger traffic not significant for sales per passenger(-)
Tovar/Martı́n-Cejas (2009)
Spain parametric input Distance Func-tions (DEA), 26 airports
proportion of international passengers that circulatingthrough the airport terminal (+)
airports with well-developed commercial activities aremore efficient than those that focus on aeronauticalrevenues
Graham (2009)
Worldwidecomparative assessment of data, general information about large number of airports
leisure charter passengers are good shoppers (+) young leisure passengers who travel several times a yearare high spenders (+)
LCC passengers are good users of food and beverage (+) foreigners who have high duties and taxes buy more tax-free products (+)
women are more likely to fall into the category “shoppinglovers” (+)
transfer passengers are less likely to make use offacilities and if they do, tend to spend less (-)
“The Moodie Report” (2009)
Worldwideamong otherscorrelation analysis, 45airports
international and leisure passengers spend more becauseof longer dwell time and availability of duty free (+)
large airports have more diverse, higher yieldingcommercial activities and to attract strong brands (+)
share of domestic passengers inconclusive (neutral) increasing floor space indirectly generates betterreturns but not higher sales per passenger (+/-)
low-cost carrier passengers are not necessarily lowspenders
Volkova (2009)
13 airports from EU countries
panel data econometric analysis, 13 airports
extra-EU passengers increase retail revenue per squaremeter at hub airports (+)
number of short stay parking places, check-in facilitiesand the number of employees contribute to the retailrevenue (+)
retail revenue per square meter grows significantly oncecritical mass of space is reached (+)
bars/restaurants influence the retail revenue andgenerate externalities (+)
extra-EU passengers have no effect on retail revenue at

8
regional airports (neutral)Castillo-Manzano(2010)
Spain bivariate probit model, over 20,000 passengers, 7 airports
waiting time prior to embarking, being on vacation, beinga frequent flyer and traveling with children (+)
number of group members and accompanied passengersexplain the consumption of food/beverages (+)
passengers from outside Eurozone more likely to consumefood/beverages, albeit just loose change (+)
passengers flying to international European destinations(+)
elderly people purchase less and spend less onfood/beverages (-)
passenger’s arrival at the airport on a courtesy bus bythe hotel (-)
business passengers not likely to make last-minutepurchases at the airport (-)
passenger using a LCC have a lower likelihood to purchasefood/beverages (-)
Fuerst/Gross/Klose (2011)
45airportsfromEUcountries
regressionanalysis
main drivers of commercial revenues per passenger includethe number of passengers passing through the airport, theratio of commercial to total revenues, national income,the share of domestic and leisure travelers and thenumber of flights (+)
a large amount of retail space per passenger is generallyassociated with lower commercial revenues per squaremeter confirming decreasing marginal revenue effects (-)
business travelers have a negative influence oncommercial revenues per passenger (-)
Source: own compilation
3. Data and Analytical Framework
Research into airport commercial revenues and profitability has been held
back to date by severe constraints in the availability and quality of
relevant data. The principal source of information for the present analysis
is the Moodie Report which contains revenue and other financial performance
data for a large number of global airports. The Moodie Report has been
published annually since 2001. However, the format of the reporting was
changed from the 2011 report onwards which no longer allows tracking of
performance data for individual airports. Extracting the data from the
Moodie Reports and supplementing the airport-level data with economic
indicators such as a country's GDP per capita or the risk-free rate of
investment, yielded a panel dataset of global airport indicators for the
period 1998-2009.

9
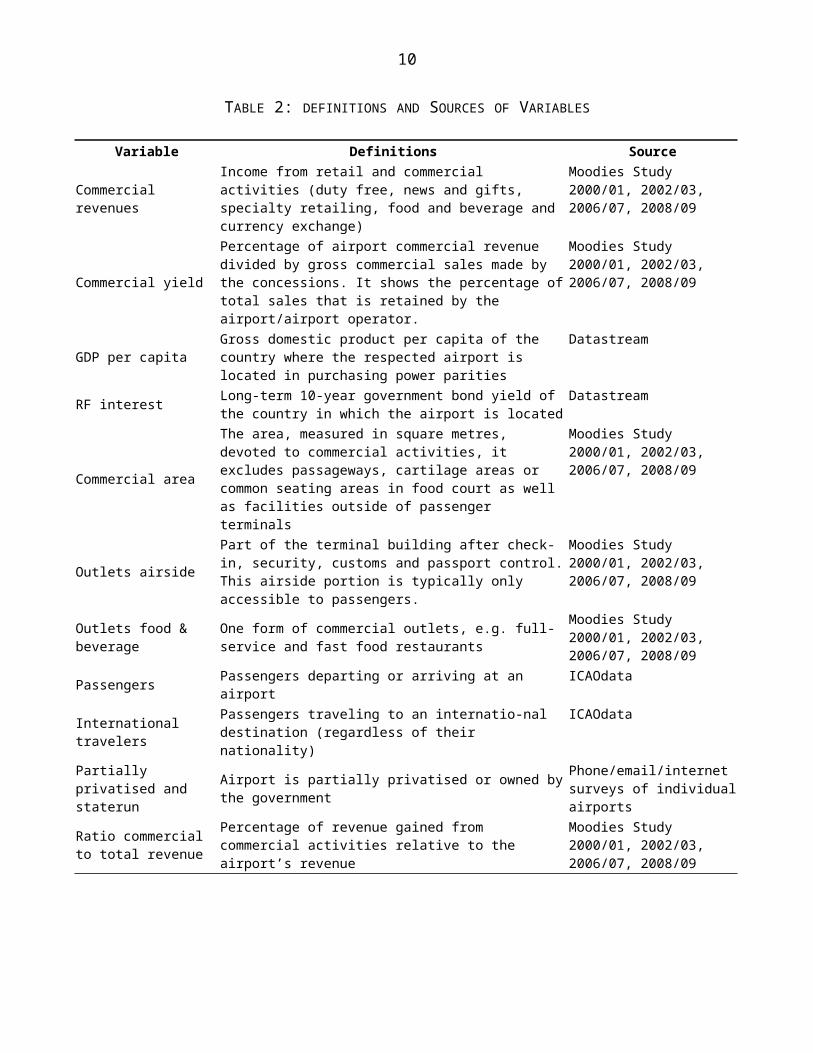
Table 2 gives an overview of the variables employed in our panel data
analysis. It is important to note that several airport operators do not
provide a breakdown of revenues by individual airports. For example, the
revenues reported for the British BAA Group comprise the three London
airports Heathrow, Gatwick and Stansted. However, we were able to infer the
volume of revenues for individual airports by using airport-level
information provided by these operators such as fee and cost structures,
the number of passengers etc. All monetary values were then converted into
US dollars to ensure comparability using the interbank exchange rate at the
call date of the respective annual statements. Supplementary research and
data quality control were conducted via telephone and email surveys with
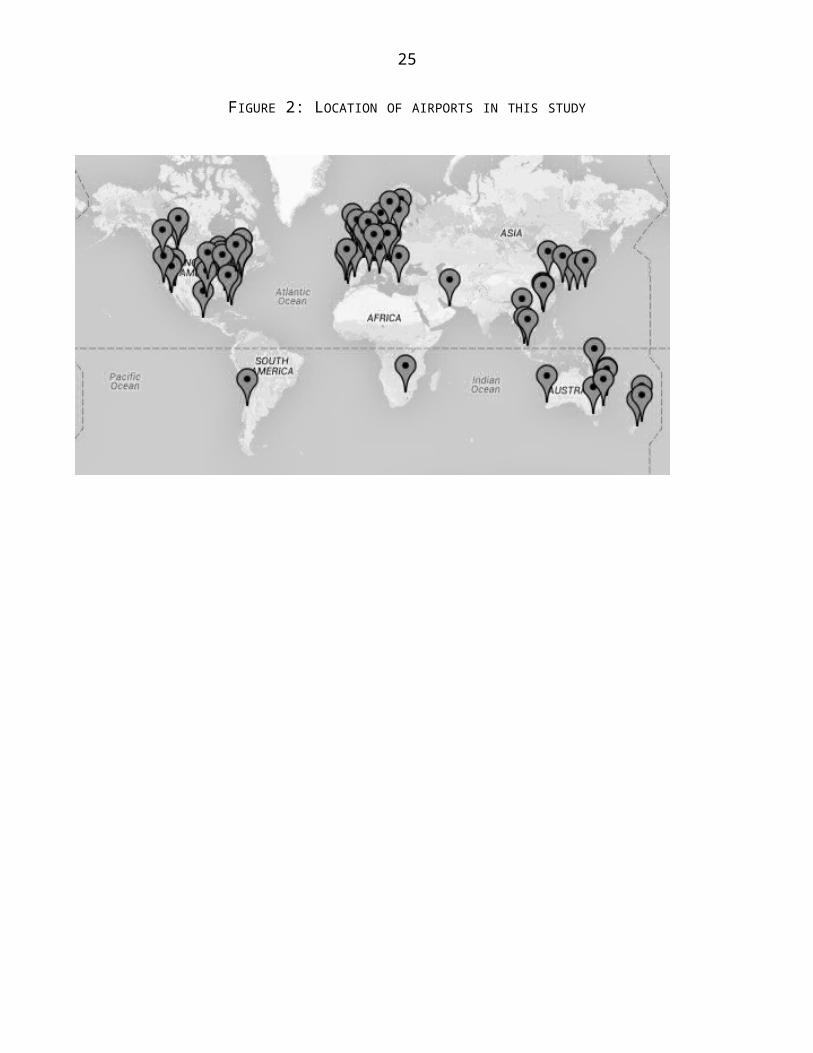
airport operators. The database used in this analysis includes information
on 75 airports over a period of 11 years, albeit as an unbalanced panel
with a considerable number of gaps due to limited data availability. Figure
2 in the appendix displays the locations of the airports in this study.
10
TABLE 2: DEFINITIONS AND SOURCES OF VARIABLES
Variable Definitions Source
Commercial revenues
Income from retail and commercial activities (duty free, news and gifts, specialty retailing, food and beverage and currency exchange)
Moodies Study 2000/01, 2002/03, 2006/07, 2008/09
Commercial yield
Percentage of airport commercial revenue divided by gross commercial sales made by the concessions. It shows the percentage oftotal sales that is retained by the airport/airport operator.
Moodies Study 2000/01, 2002/03, 2006/07, 2008/09
GDP per capitaGross domestic product per capita of the country where the respected airport is located in purchasing power parities
Datastream
RF interest Long-term 10-year government bond yield of the country in which the airport is located
Datastream
Commercial area
The area, measured in square metres, devoted to commercial activities, it excludes passageways, cartilage areas or common seating areas in food court as well as facilities outside of passenger terminals
Moodies Study 2000/01, 2002/03, 2006/07, 2008/09
Outlets airside
Part of the terminal building after check-in, security, customs and passport control.This airside portion is typically only accessible to passengers.
Moodies Study 2000/01, 2002/03, 2006/07, 2008/09
Outlets food & beverage
One form of commercial outlets, e.g. full-service and fast food restaurants
Moodies Study 2000/01, 2002/03, 2006/07, 2008/09
Passengers Passengers departing or arriving at an airport
ICAOdata
International travelers
Passengers traveling to an internatio-nal destination (regardless of their nationality)
ICAOdata
Partially privatised and staterun
Airport is partially privatised or owned bythe government
Phone/email/internet surveys of individualairports
Ratio commercial to total revenue
Percentage of revenue gained from commercial activities relative to the airport’s revenue
Moodies Study 2000/01, 2002/03, 2006/07, 2008/09
11
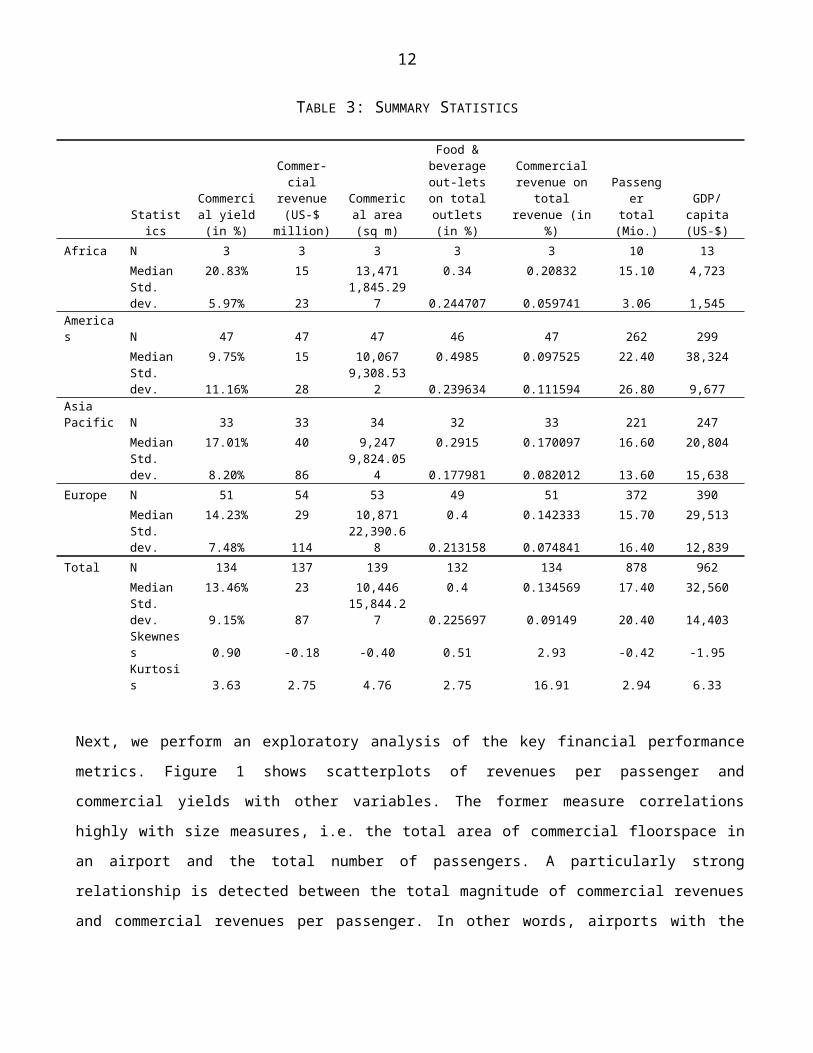
Table 3 examines different key characteristics of the dataset used in this
analysis. As expected, standard deviations are relatively high for most
variables, reflecting the broad range of values across the world. A
comparison of the percentage for the food & beverage outlets in the four
regions reveals that these outlets are more important in the Americas and
Europe than in Asia Pacific and Africa. However, the commercial area at
airports in the Americas, Asia Pacific and Europe is roughly equal; only
Africa has a higher median, but there are only three observations for that
continent. Interestingly the Americas has the lowest share of commercial
revenue on total revenue and commercial yield (in %), but we can identify
the highest standard deviation. As airport size may be an important driver
of commercial revenue, we examine the distribution by number of passengers
and – as expected – the highest volume is found in the Americas. Finally,
GDP per capita reveals a ranking as expected, Americas before Europe, Asia
Pacific and Africa.
12
TABLE 3: SUMMARY STATISTICS
Statistics
Commercial yield(in %)
Commer-cial
revenue(US-$
million)
Commerical area(sq m)
Food &beverageout-letson totaloutlets(in %)
Commercialrevenue on
totalrevenue (in
%)
Passenger
total(Mio.)
GDP/capita(US-$)
Africa N 3 3 3 3 3 10 13Median 20.83% 15 13,471 0.34 0.20832 15.10 4,723Std.dev. 5.97% 23
1,845.297 0.244707 0.059741 3.06 1,545
Americas N 47 47 47 46 47 262 299
Median 9.75% 15 10,067 0.4985 0.097525 22.40 38,324Std.dev. 11.16% 28
9,308.532 0.239634 0.111594 26.80 9,677
AsiaPacific N 33 33 34 32 33 221 247
Median 17.01% 40 9,247 0.2915 0.170097 16.60 20,804Std.dev. 8.20% 86
9,824.054 0.177981 0.082012 13.60 15,638
Europe N 51 54 53 49 51 372 390Median 14.23% 29 10,871 0.4 0.142333 15.70 29,513Std.dev. 7.48% 114
22,390.68 0.213158 0.074841 16.40 12,839
Total N 134 137 139 132 134 878 962Median 13.46% 23 10,446 0.4 0.134569 17.40 32,560Std.dev. 9.15% 87
15,844.27 0.225697 0.09149 20.40 14,403
Skewness 0.90 -0.18 -0.40 0.51 2.93 -0.42 -1.95Kurtosis 3.63 2.75 4.76 2.75 16.91 2.94 6.33
Next, we perform an exploratory analysis of the key financial performance
metrics. Figure 1 shows scatterplots of revenues per passenger and
commercial yields with other variables. The former measure correlations
highly with size measures, i.e. the total area of commercial floorspace in
an airport and the total number of passengers. A particularly strong
relationship is detected between the total magnitude of commercial revenues
and commercial revenues per passenger. In other words, airports with the
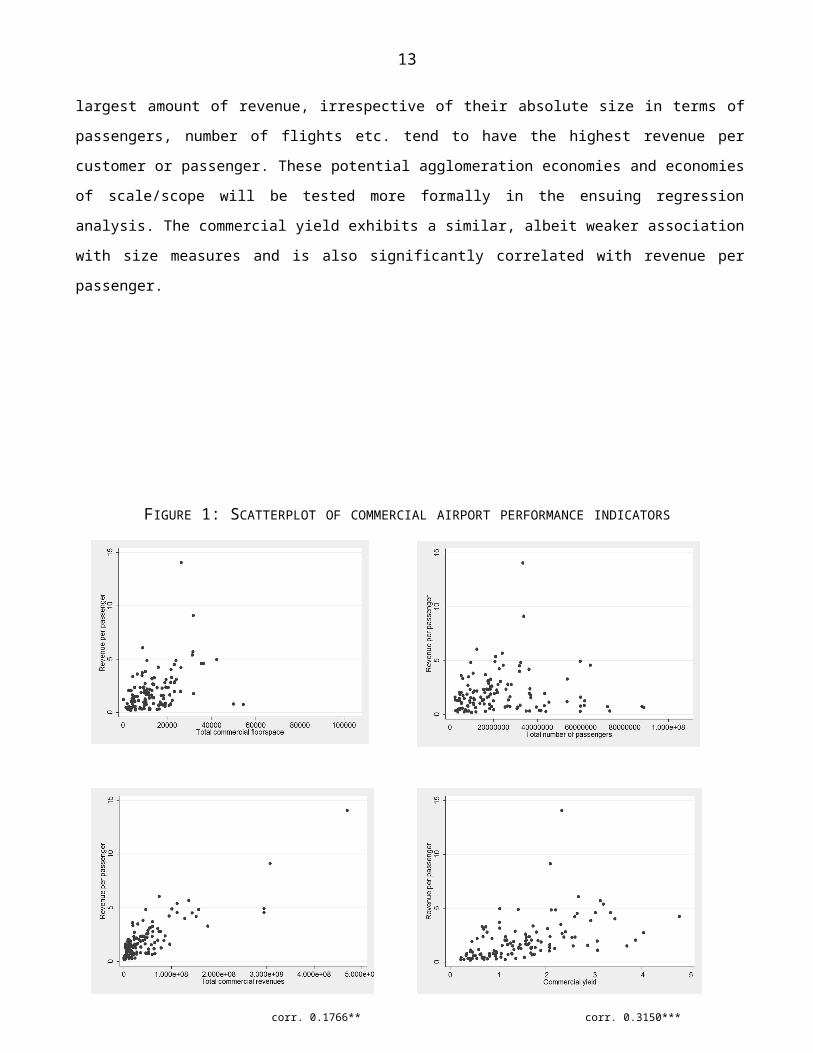
corr. 0.4113*** corr. 0.4248***
corr. 0.8398*** corr. 0.4897***
corr. 0.1766** corr. 0.3150***
13
largest amount of revenue, irrespective of their absolute size in terms of
passengers, number of flights etc. tend to have the highest revenue per
customer or passenger. These potential agglomeration economies and economies
of scale/scope will be tested more formally in the ensuing regression
analysis. The commercial yield exhibits a similar, albeit weaker association
with size measures and is also significantly correlated with revenue per
passenger.
FIGURE 1: SCATTERPLOT OF COMMERCIAL AIRPORT PERFORMANCE INDICATORS

14
* p < 0.05, ** p < 0.01, *** p < 0.001
The analytical strategy for estimating the impact of various drivers on the
commercial performance of airports includes three performance metrics
(commercial yield, total commercial revenues and commercial revenues per
passenger) evaluated with three different estimation techniques (pooled OLS,
random effects panel and 3 stage least squares). The basic pooled OLS single
equation estimation of the commercial yield takes the following log-log
form:
lnCYi=β0+β1RFRi+β2lnCATI+β3lnFBi+β4lnRTi+β5lnPIi+β6lnAIRi+β7lnCRPi+εi (1)
where CY is the commercial yield, RFR is the risk-free interest rate as
defined above, CAT is the total commercial floorspace, FB is the fraction of
food and beverage outlets, RT is total revenue in USD, PI is the fraction of
international passengers, AIR is the fraction of outlets that are located
15
airside and CRP is the commercial revenue per passenger. The estimation is
conducted both as a pooled OLS and as a random-effects panel data analysis
to ensure that the results are robust to modelling technique. Analogous to
Equation 1, we then estimate the equations for commercial revenues and
commercial revenues per passenger.
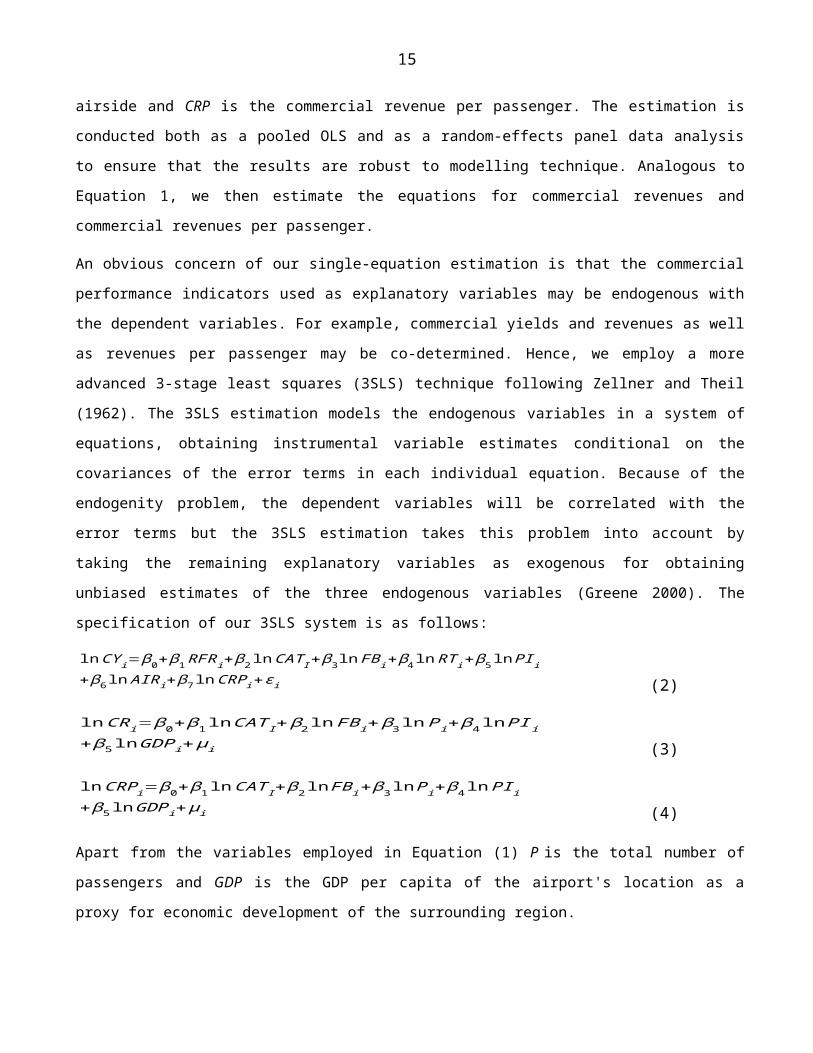
An obvious concern of our single-equation estimation is that the commercial
performance indicators used as explanatory variables may be endogenous with
the dependent variables. For example, commercial yields and revenues as well
as revenues per passenger may be co-determined. Hence, we employ a more
advanced 3-stage least squares (3SLS) technique following Zellner and Theil
(1962). The 3SLS estimation models the endogenous variables in a system of
equations, obtaining instrumental variable estimates conditional on the
covariances of the error terms in each individual equation. Because of the
endogenity problem, the dependent variables will be correlated with the
error terms but the 3SLS estimation takes this problem into account by
taking the remaining explanatory variables as exogenous for obtaining
unbiased estimates of the three endogenous variables (Greene 2000). The
specification of our 3SLS system is as follows:
lnCYi=β0+β1RFRi+β2lnCATI+β3lnFBi+β4lnRTi+β5lnPIi+β6lnAIRi+β7lnCRPi+εi (2)
lnCRi=β0+β1lnCATI+β2lnFBi+β3lnPi+β4lnPIi+β5lnGDPi+μi (3)
lnCRPi=β0+β1lnCATI+β2lnFBi+β3lnPi+β4lnPIi+β5lnGDPi+μi (4)
Apart from the variables employed in Equation (1) P is the total number of
passengers and GDP is the GDP per capita of the airport's location as a
proxy for economic development of the surrounding region.
16
4. Results & Discussion
The first proposition to be tested empirically is whether the total volume
of airport commercial revenues can be explained by the factors as
hypothesized in the previous section. The estimation results of Models 1 and
2 demonstrate that there is a significant relationship between the square
footage of commercial space in an airport and its commercial revenues simply
because a larger total area of commercial floorspace in an airport tends to
generate higher commercial income even when controlling for the total number
of passengers of an airport. The share of international passengers is found
to be a significant driver, implying that international travelers tend to
have higher expenditure on commercial activities than domestic travellers.
It is also possible that airports with a high percentage of international
travellers have a larger proportion of high-revenue generating commercial
activities such as high-end retail outlets selling international designer
fashion, jewellery and watches which are predominantly found in
international airports and to a lesser extent in airports serving the
domestic market.
Since the airports in our data sample vary considerably in terms of their
size, ranging from Riga Airport with just under 2 million passengers to
Atlanta International Airport with approximately 90 million passengers we
estimate the drivers of commercial revenue on a per passenger basis in a next
step. Models 3 and 4 underline the importance of large commercial areas for
generating higher revenues per passengers. A possible explanation for this
may be found in economies of scale and economies of scope in larger
commercial and retail operations. The retail outlets and other commercial
activities may also create positive spillover effects and externalities for
one another. Keeping the size of the commercial area constant, an increase
in the total number of passengers does not appear to affect commercial
17
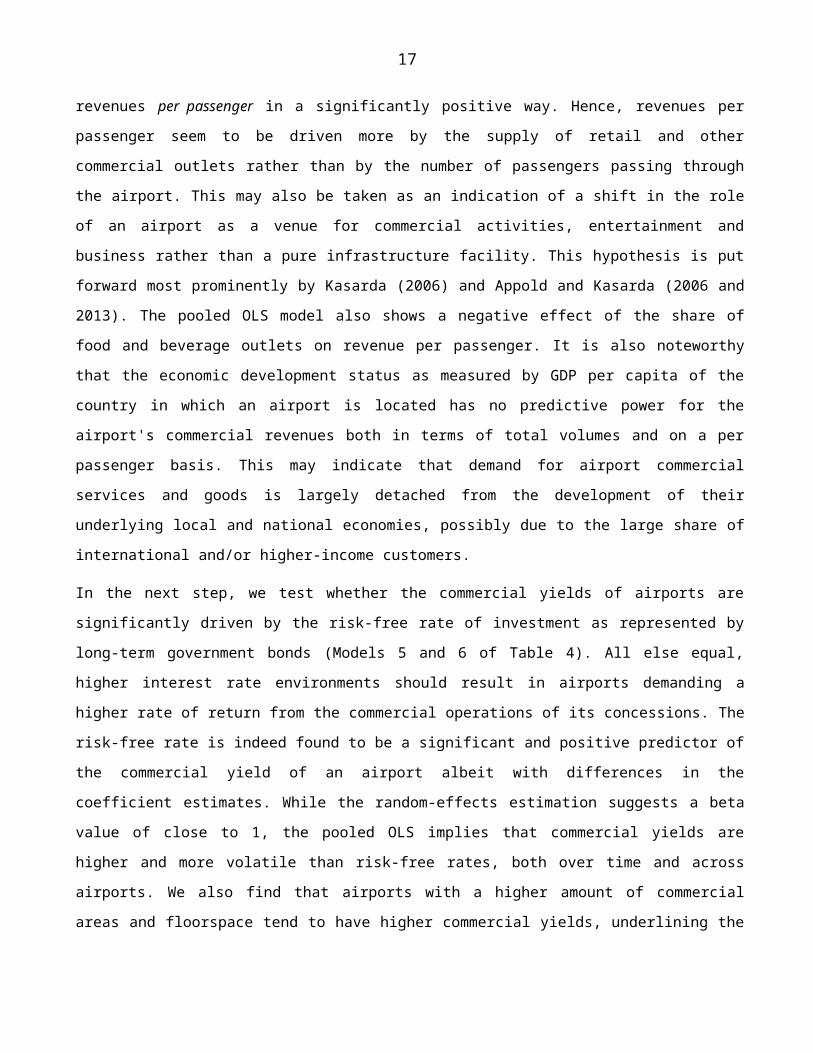
revenues per passenger in a significantly positive way. Hence, revenues per
passenger seem to be driven more by the supply of retail and other
commercial outlets rather than by the number of passengers passing through
the airport. This may also be taken as an indication of a shift in the role
of an airport as a venue for commercial activities, entertainment and
business rather than a pure infrastructure facility. This hypothesis is put
forward most prominently by Kasarda (2006) and Appold and Kasarda (2006 and
2013). The pooled OLS model also shows a negative effect of the share of
food and beverage outlets on revenue per passenger. It is also noteworthy
that the economic development status as measured by GDP per capita of the
country in which an airport is located has no predictive power for the
airport's commercial revenues both in terms of total volumes and on a per
passenger basis. This may indicate that demand for airport commercial
services and goods is largely detached from the development of their
underlying local and national economies, possibly due to the large share of
international and/or higher-income customers.
In the next step, we test whether the commercial yields of airports are
significantly driven by the risk-free rate of investment as represented by
long-term government bonds (Models 5 and 6 of Table 4). All else equal,
higher interest rate environments should result in airports demanding a
higher rate of return from the commercial operations of its concessions. The
risk-free rate is indeed found to be a significant and positive predictor of
the commercial yield of an airport albeit with differences in the
coefficient estimates. While the random-effects estimation suggests a beta
value of close to 1, the pooled OLS implies that commercial yields are
higher and more volatile than risk-free rates, both over time and across
airports. We also find that airports with a higher amount of commercial
areas and floorspace tend to have higher commercial yields, underlining the
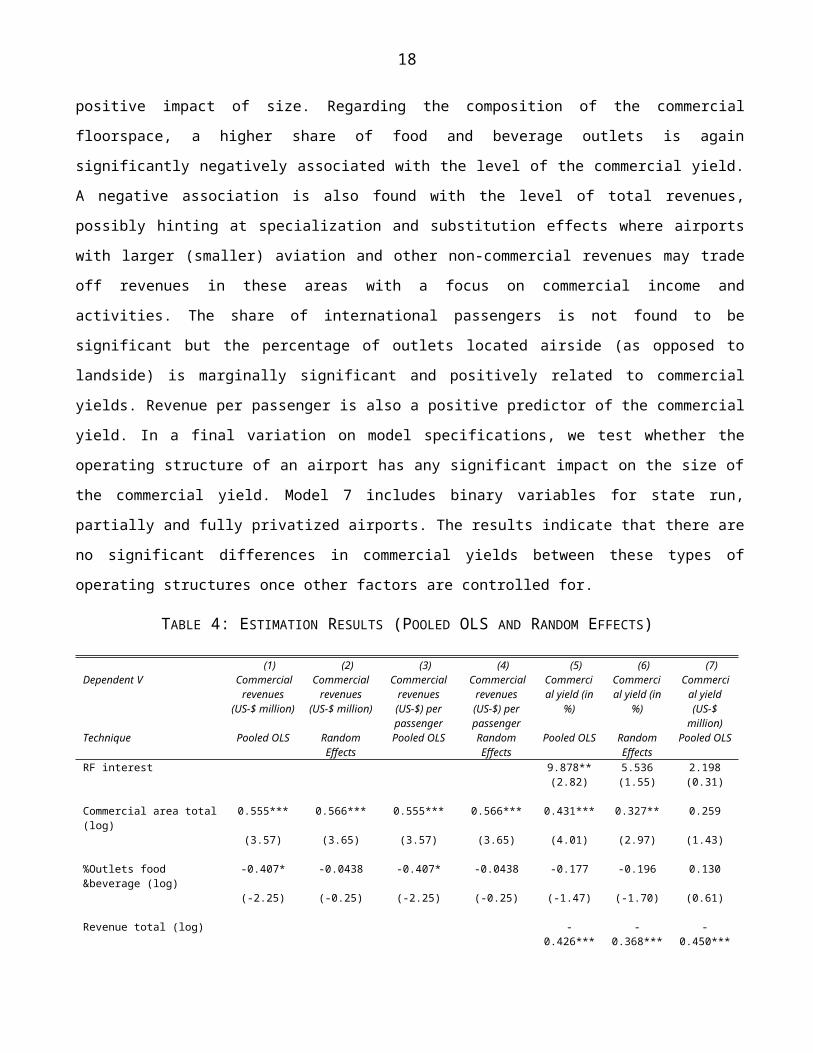
18
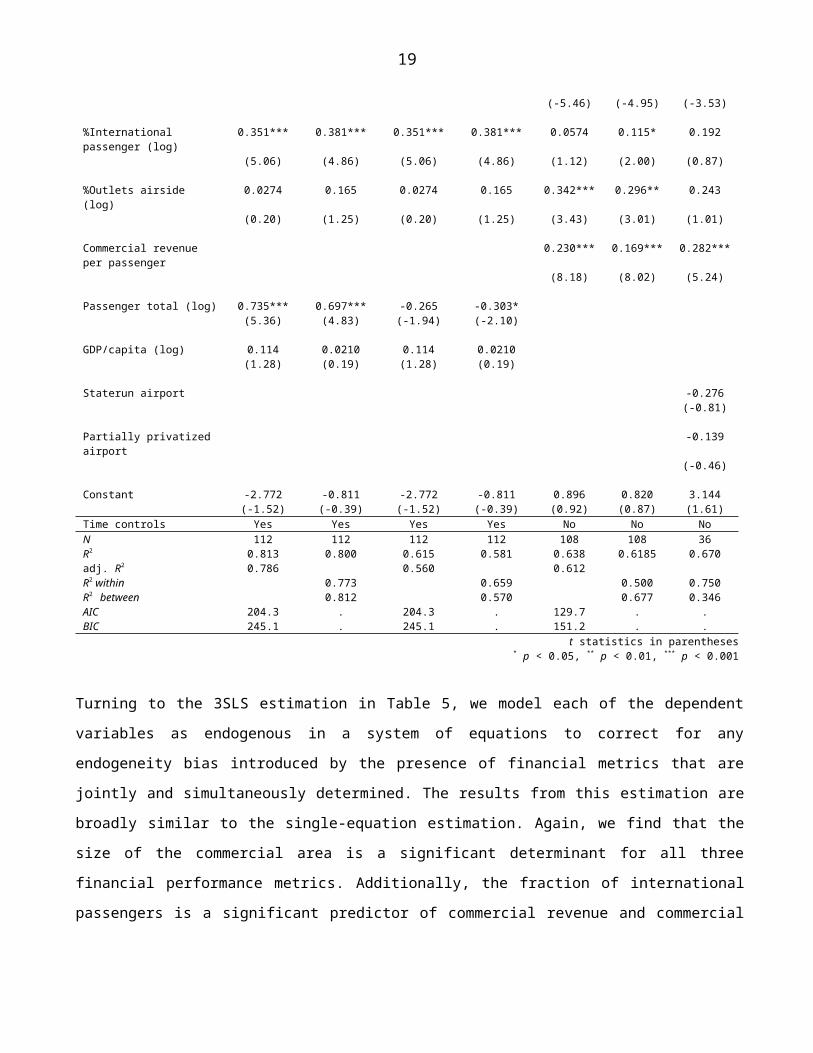
positive impact of size. Regarding the composition of the commercial
floorspace, a higher share of food and beverage outlets is again
significantly negatively associated with the level of the commercial yield.
A negative association is also found with the level of total revenues,
possibly hinting at specialization and substitution effects where airports
with larger (smaller) aviation and other non-commercial revenues may trade
off revenues in these areas with a focus on commercial income and
activities. The share of international passengers is not found to be
significant but the percentage of outlets located airside (as opposed to
landside) is marginally significant and positively related to commercial
yields. Revenue per passenger is also a positive predictor of the commercial
yield. In a final variation on model specifications, we test whether the
operating structure of an airport has any significant impact on the size of
the commercial yield. Model 7 includes binary variables for state run,
partially and fully privatized airports. The results indicate that there are
no significant differences in commercial yields between these types of
operating structures once other factors are controlled for.
TABLE 4: ESTIMATION RESULTS (POOLED OLS AND RANDOM EFFECTS)
(1) (2) (3) (4) (5) (6) (7)Dependent V Commercial
revenues(US-$ million)
Commercialrevenues
(US-$ million)
Commercialrevenues(US-$) perpassenger
Commercialrevenues(US-$) perpassenger
Commercial yield (in
%)
Commercial yield (in
%)
Commercial yield(US-$
million)Technique Pooled OLS Random
EffectsPooled OLS Random
EffectsPooled OLS Random
EffectsPooled OLS
RF interest 9.878** 5.536 2.198(2.82) (1.55) (0.31)
Commercial area total(log)
0.555*** 0.566*** 0.555*** 0.566*** 0.431*** 0.327** 0.259
(3.57) (3.65) (3.57) (3.65) (4.01) (2.97) (1.43)
%Outlets food &beverage (log)
-0.407* -0.0438 -0.407* -0.0438 -0.177 -0.196 0.130
(-2.25) (-0.25) (-2.25) (-0.25) (-1.47) (-1.70) (0.61)
Revenue total (log) -0.426***
-0.368***
-0.450***
19
(-5.46) (-4.95) (-3.53)
%International passenger (log)
0.351*** 0.381*** 0.351*** 0.381*** 0.0574 0.115* 0.192
(5.06) (4.86) (5.06) (4.86) (1.12) (2.00) (0.87)
%Outlets airside (log)
0.0274 0.165 0.0274 0.165 0.342*** 0.296** 0.243
(0.20) (1.25) (0.20) (1.25) (3.43) (3.01) (1.01)
Commercial revenue per passenger
0.230*** 0.169*** 0.282***
(8.18) (8.02) (5.24)
Passenger total (log) 0.735*** 0.697*** -0.265 -0.303*(5.36) (4.83) (-1.94) (-2.10)
GDP/capita (log) 0.114 0.0210 0.114 0.0210(1.28) (0.19) (1.28) (0.19)
Staterun airport -0.276(-0.81)
Partially privatized airport
-0.139
(-0.46)
Constant -2.772 -0.811 -2.772 -0.811 0.896 0.820 3.144(-1.52) (-0.39) (-1.52) (-0.39) (0.92) (0.87) (1.61)
Time controls Yes Yes Yes Yes No No NoN 112 112 112 112 108 108 36R2 0.813 0.800 0.615 0.581 0.638 0.6185 0.670adj. R2 0.786 0.560 0.612R2 within 0.773 0.659 0.500 0.750R2 between 0.812 0.570 0.677 0.346AIC 204.3 . 204.3 . 129.7 . .BIC 245.1 . 245.1 . 151.2 . .
t statistics in parentheses* p < 0.05, ** p < 0.01, *** p < 0.001
Turning to the 3SLS estimation in Table 5, we model each of the dependent
variables as endogenous in a system of equations to correct for any
endogeneity bias introduced by the presence of financial metrics that are
jointly and simultaneously determined. The results from this estimation are
broadly similar to the single-equation estimation. Again, we find that the
size of the commercial area is a significant determinant for all three
financial performance metrics. Additionally, the fraction of international
passengers is a significant predictor of commercial revenue and commercial
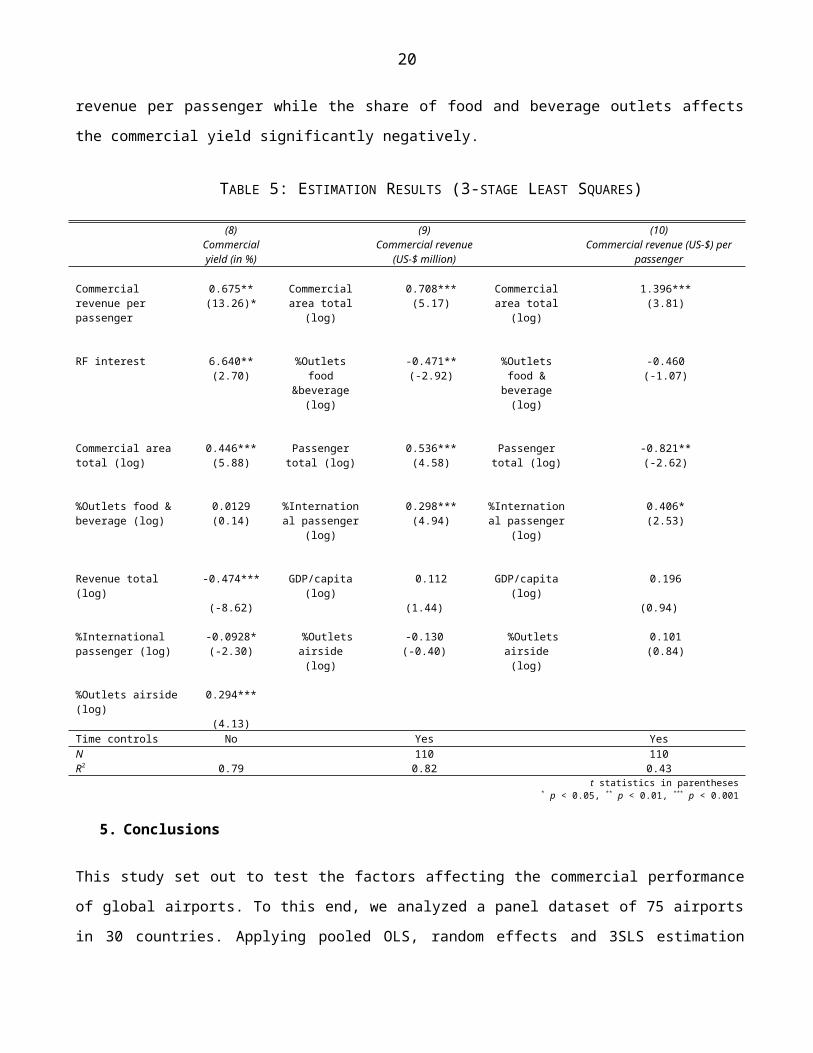
20
revenue per passenger while the share of food and beverage outlets affects
the commercial yield significantly negatively.
TABLE 5: ESTIMATION RESULTS (3-STAGE LEAST SQUARES)
(8) (9) (10)Commercialyield (in %)
Commercial revenue(US-$ million)
Commercial revenue (US-$) perpassenger
Commercial revenue per passenger
0.675**(13.26)*
Commercialarea total
(log)
0.708***(5.17)
Commercialarea total
(log)
1.396***(3.81)
RF interest 6.640**(2.70)
%Outletsfood
&beverage(log)
-0.471**(-2.92)
%Outletsfood &beverage(log)
-0.460(-1.07)
Commercial area total (log)
0.446***(5.88)
Passengertotal (log)
0.536***(4.58)
Passengertotal (log)
-0.821**(-2.62)
%Outlets food & beverage (log)
0.0129(0.14)
%International passenger
(log)
0.298***(4.94)
%International passenger
(log)
0.406*(2.53)
Revenue total (log)
-0.474*** GDP/capita(log)
0.112 GDP/capita(log)
0.196
(-8.62) (1.44) (0.94)
%International passenger (log)
-0.0928*(-2.30)
%Outletsairside(log)
-0.130(-0.40)
%Outletsairside(log)
0.101(0.84)
%Outlets airside(log)
0.294***
(4.13)Time controls No Yes YesN 110 110R2 0.79 0.82 0.43
t statistics in parentheses* p < 0.05, ** p < 0.01, *** p < 0.001
5. Conclusions
This study set out to test the factors affecting the commercial performance
of global airports. To this end, we analyzed a panel dataset of 75 airports
in 30 countries. Applying pooled OLS, random effects and 3SLS estimation
21
techniques, the main drivers of financial performance were indentified. Our
results are broadly in line with the existing literature, where the share of
international passengers, financial risk and airport size are found to be
significant determinants. The latter finding indicates the presence of
considerable economies of scale in generating commercial revenues and
ensuring profitability for an airport's non-aeronautical operations. By
contrast, no empirical support is found for the hypothesis that
privatization or state ownership of an airport and/or the national income
per capita are significant factors of an airport's financial performance. A
higher share of food and beverage outlets is found to affect the level of
the commercial yield negatively while a higher percentage of outlets located
airside tends to result in higher commercial yields.
The corollary of these findings for airports seeking to enhance their
financial performance in the non-aeronautical sector is that careful
planning of the size and mix of retail and other commercial areas and their
positioning in the airside/landside structure may be more important than the
question of whether to privatise or remain state-run. The lack of predictive
power of a country's GDP per capita implies that the performance of airports
is not simply a function of the macro-economy in which it is embedded,
possibly owing to the large degree of internationalization of the customer
base. Similarly, this more diverse group of customers with regard to their
provenance and purchasing power may act to mitigate any adverse effects a
country's business cycle. Although airports still experience considerable
exposure to the global business cycle, expanding the commercial and non-
aeronautical side of their operations may indeed makes them less vulnerable
to the more localized and national economic shocks.
A more in-depth study of the linkages between airport commercial revenues,
local, national and global economies is required to ascertain these risk-
22
mitigating effects. The present study was also limited by gaps in data
coverage both in terms of the number of years available as well as the
geographical distribution of the airports. For example, it was not possible
to incorporate several of the most important global airports in our analysis
because of a lack of data. Further research is also needed to corroborate
the reported findings for a larger sample of global airports and a more
thorough investigation of the financial performance metrics of commercial
activities such as information on cash flows, return on equity, return on
assets, stock market returns and liquidity measures would be desirable. The
present analysis provides a foundation for these more fine-grained and
expanded studies if and when the required datasets become available.
23
ReferencesAldridge, K., Carreno, M., Ison, S., Rye, T., & Straker, I., (2001). Car parkingmanagement at airports: A special case?. Transport Policy 13, 511-521.
Appold, S.J., & Kasarda, J.D. (2006): The appropriate scale of US airport retailactivities. Journal of Air Transport Management 12, 277-287.
Appold, S.J., & Kasarda, J.D. (2013). The Airport City phenomenon: Evidence fromlarge US airports. Urban Studies 6, 1239-1259.
Castillo-Manzano, J.I., (2010). Determinants of commercial revenues at airports:Lessons learned from Spanish regional airports. Tourism Management 6, 788-796.
Entwistle, M. (2007). Customer service and airport retail: Stimulate passengerspending. Journal of Airport Management, 2, 151-157.
Forsyth, P. (2004). Locational and monopoly rents at airports: creating them andshifting them. Journal of Air Transport Management 10, 51-60.
Freathy, P., & O'Connell, F. (1999). A typology of European airport retailing. TheService Industries Journal 3, 119–134.
Fuerst, F.; Gross, S.; & Klose, U. (2011). The sky is the limit? The determinantsand constraints of European airports commercial revenues. Journal of Air TransportManagement 17, 278-283.
Giljohann-Farkas, K. (2008). Airport Retailing, DEGI Research, December 2008 (lastaccessed 14.09.2009http://www.presseraum-offene-immobilienfonds.bvi.de/export/sites/vpr/de/publikationen/studienauszuege/download/03_degi_research_immofokus_122008.pdf),Frankfurt am Main, 2-5.
Graham, A. (2009). Managing Airports – An international perspective. 3rd edition,Oxford/Burlington.
Greene, W.H. (2000). Econometric Analysis, 4th edition. Upper Saddler River, NewJersey.
Geuens, M., Vantomme, D., Brengman, M. (2004). Developing a typology of airportshoppers. Tourism Management 25, 615-622.
Hammami, M., Ruhashyankiko, J.-F., & Yehoue1, E.B. (2006). Determinants of Public-Private Partnerships in Infrastructure. IMF Working Paper. Washington, USA.
Jing Qin, J., & Olaru, D. (2013). System Dynamics based simulation for airportrevenue analysis. Conference Proceedings 31st International Conference of theSystem Dynamics Society, Cambridge, MA.
24
Kasarda, J. D. (2006). The rise of the aerotropolis. The Next American City 10, 35-7.
Kim, H.-B., & Shin, J.-H., 2001. A Contextual Investigation of the Operation andManagement of Airport Concessions. Tourism Management 22, 149-155.
Leviäkangas, P. (2007). Private finance of transport infrastructure projects –Value and risk analysis of a Finnish shadow toll road project. Oulu.
Lin Y.-H., & Chen, C.-F. (2013). Passengers’ shopping motivations and commercialactivities at airports – The moderating effects of time pressure and impulse buyingtendency. Tourism Management 36, 426-434.
The Moodie Report (eds.) (2001). The Airport Commercial Revenue Study – 2000/2001.Brentford.
The Moodie Report (eds.) (2003). The Airport Commercial Revenue Study – 2002/2003.Brentford.
The Moodie Report (eds.) (2007). The Airport Retail Study – Fourth Edition 2006/07.Brentford.
The Moodie Report (eds.) (2009). The Airport Commercial Revenues Study – FifthEdition 2008/09. Brentford.
Poungias, P. (2009). Airport city developments: An airport investor’s perspective.Journal of Airport Management 4, 14-22.
Reiss, B. (2007). Maximising non-aviation revenue for airports: Developing airportcities to optimise real estate and capitalise on land development opportunities.Journal of Airport Management 3, 284-293.
Tacke, G. (2008). Price Optimization for Airport Parking. In Proceedings 11th
Hamburg Aviation Conference 13.-15.02.2008 (CD-Rom). Hamburg.
Torres, E., Domínguez, J. S., Valdes, L., & Aza, R. (2005). Passenger waiting timein an airport and expenditure carried out in the commercial area. Journal of AirTransport Management 6, 363-367.
Tovar, B., & Martín-Cejas, R. R. (2009). Are outsourcing and non-aeronauticalrevenues important drivers in the efficiency of Spanish airports?. Journal of AirTransport Management 5, 217-220.
Volkova, N. (2009) Determinants of retail revenue for today’s airports. GAP ProjectWorking Paper, Berlin.
Zellner, A., & Theil, H. (1962). Three stage least squares: Simultaneous estimateof simultaneous equations. Econometrica 29, 54-78.
Appendix
25
FIGURE 2: LOCATION OF AIRPORTS IN THIS STUDY