Analysis of “Tarmac Delays” at New York Airports
7
2010 Integrated Communications Navigation and Surveillance (ICNS) Conference, May 11-13, 2010 1 ANALYSIS OF “TARMAC DELAYS” AT NEW YORK AIRPORTS Maricel Medina (MSc.), Lance Sherry (Ph.D.) Center for Air Transportation System Research, George Mason University, Fairfax, VA Abstract— In response to media coverage of so called Tarmac Delays, new Department of Transportation (DOT) regulations come into effect on April 2010. These regulations outline airline responsibilities with regards to flights that remain on the ground in excess of two hours. Included in the regulations are requirements that airlines provide food, water and lavatory service for passengers delayed more than two hours on the tarmac, and for gate resources to be made available for flights to return to the gate and de-plane passengers for flights grounded for more than three hours. This paper describes the results of an analysis of “tarmac delays” at New York Airports from 2005 to 2009 using Bureau of Transportation Statistics (BTS) data: (i) John F. Kennedy (JFK), Newark Liberty International Airport (EWR) and La Guardia Airport (LGA) have been ranked as the top three airports with longest tarmac delays during the last five years, (ii) the probability of a flight experiencing a tarmac delay at a New York airport of greater than 2 hours is 0.54%, (iii) the average tarmac delay was 158 minutes per flight, (iv) June, July and August are the worst month for tarmac delays, (v) flights bound for Chicago O’Hare are the most likely to experience “tarmac delays,” (vi) an estimate of the annual cost to the airlines as a result of tarmac delay regulations at JFK, EWR, AND LGA is $43,859 per year. Tarmac delays, apron delays, lenghty abord aircraft waiting times, ground delay, departure delays, on-board flight delays. I. INTRODUCTION After several widely publicized incidents of passengers remaining on airplanes on the tarmac for long hours [1][2], the Department of Transportation (DOT) has issued a new rule designed to protect airline passengers. These new regulations enforce the voluntary actions taken by airlines in 1999 which reduce passenger discomforts and the number of complaints, but had no impact on the frequency or magnitude of tarmac delays [3]. The new rule imposed by the DOT provides a regulatory mechanism to ensure airlines will meet the minimum standards for passengers’ service. The Tarmac Delay regulations require the airlines adopt and publish contingency plans for lengthy tarmac delays including food and water for Tarmac Delays greater than 2 hours, and provides the passengers the rights to de-plane after 3 hours (with some limitations). The airlines must also respond to consumer problems, and publish tarmac delay data, designate an employee to monitor the effects of flight delays and cancellations. The strongest clause in the regulation declares “the operation of flights that remain chronically delayed to be an unfair and deceptive practice and an unfair method of competition.” This paper describes the results of an analysis Bureau of Transportation Statistics (BTS) [4] statistics to assess the frequency and severity of tarmac delays, and to estimate the cost of the regulations to the airlines. This study focuses on tarmac delays at New York Airports. Using data from 2005 to 2009, the following main results were identified: a) Flights departuing from New York airports experienced the highest number of tarmac delays b) the probability of a flight experiencing a tarmac delay greater than 2 hours is 0.54% c) the average fight delay experienced by the passengers was 158 minutes with a maximum time of 435 minutes (more than 6 hours), d) the number of tarmac delays flights has showed a decreased trend, e) June, July and August are the worst month for tarmac delays, with 64% of the delayed flights ocurring in these months. f) flights bound for Chicago O’Hare (8%) are the most likely to experience “tarmac delays,” g) Twenty-two airlines have had flights with tarmac delays. h) An estimate of the total cost to the airlines as a result of tarmac delay regulations at New York area is $43,859 per year or $476 per flight. These results indicate that tarmac delays are a rare but “painful” phenomenon. The likelihood of tarmac delays is exogenous to the departure airport as illuminated by the most congested schedule periods (June, July and August) and flights departing to the most congested airports (Chicago O’Hare – 8%, ATL - 5%, LAX – 4%). Further, the costs to the airlines are approximately only $43,859 per year. This paper is organized as follows: Section 2 provides a background of tarmac delays regulations. Section 3 describes the method for analysis. Section 4 provides the analysis of the tarmac delays at New York Airports and the implications of the rule on this airport. Section 5 summarizes the results and conclusions. II. TARMAC DELAYS REGULATION
Transcript of Analysis of “Tarmac Delays” at New York Airports
2010 Integrated Communications Navigation and Surveillance (ICNS) Conference, May 11-13, 2010
1
ANALYSIS OF “TARMAC DELAYS” AT NEW
YORK AIRPORTS
Maricel Medina (MSc.), Lance Sherry (Ph.D.)
Center for Air Transportation System Research, George Mason University, Fairfax, VA
Abstract— In response to media coverage of so called Tarmac
Delays, new Department of Transportation (DOT) regulations come
into effect on April 2010. These regulations outline airline
responsibilities with regards to flights that remain on the ground in
excess of two hours. Included in the regulations are requirements that
airlines provide food, water and lavatory service for passengers
delayed more than two hours on the tarmac, and for gate resources to
be made available for flights to return to the gate and de-plane
passengers for flights grounded for more than three hours.
This paper describes the results of an analysis of “tarmac delays” at
New York Airports from 2005 to 2009 using Bureau of
Transportation Statistics (BTS) data: (i) John F. Kennedy (JFK),
Newark Liberty International Airport (EWR) and La Guardia Airport
(LGA) have been ranked as the top three airports with longest tarmac
delays during the last five years, (ii) the probability of a flight
experiencing a tarmac delay at a New York airport of greater than 2
hours is 0.54%, (iii) the average tarmac delay was 158 minutes per
flight, (iv) June, July and August are the worst month for tarmac
delays, (v) flights bound for Chicago O’Hare are the most likely to
experience “tarmac delays,” (vi) an estimate of the annual cost to the
airlines as a result of tarmac delay regulations at JFK, EWR, AND
LGA is $43,859 per year.
Tarmac delays, apron delays, lenghty abord aircraft waiting
times, ground delay, departure delays, on-board flight delays.
I. INTRODUCTION
After several widely publicized incidents of passengers remaining on airplanes on the tarmac for long hours [1][2], the Department of Transportation (DOT) has issued a new rule designed to protect airline passengers. These new regulations enforce the voluntary actions taken by airlines in 1999 which reduce passenger discomforts and the number of complaints, but had no impact on the frequency or magnitude of tarmac delays [3]. The new rule imposed by the DOT provides a regulatory mechanism to ensure airlines will meet the minimum standards for passengers’ service.
The Tarmac Delay regulations require the airlines adopt and publish contingency plans for lengthy tarmac delays including food and water for Tarmac Delays greater than 2 hours, and provides the passengers the rights to de-plane after 3 hours (with some limitations). The airlines must also respond to consumer problems, and publish tarmac delay data, designate an employee to monitor the effects of flight delays and cancellations. The strongest clause in the regulation declares “the operation of flights that remain chronically
delayed to be an unfair and deceptive practice and an unfair method of competition.”
This paper describes the results of an analysis Bureau of Transportation Statistics (BTS) [4] statistics to assess the frequency and severity of tarmac delays, and to estimate the cost of the regulations to the airlines. This study focuses on tarmac delays at New York Airports. Using data from 2005 to 2009, the following main results were identified:
a) Flights departuing from New York airports
experienced the highest number of tarmac delays
b) the probability of a flight experiencing a tarmac delay
greater than 2 hours is 0.54%
c) the average fight delay experienced by the passengers
was 158 minutes with a maximum time of 435 minutes (more
than 6 hours),
d) the number of tarmac delays flights has showed a
decreased trend,
e) June, July and August are the worst month for tarmac
delays, with 64% of the delayed flights ocurring in these
months.
f) flights bound for Chicago O’Hare (8%) are the most
likely to experience “tarmac delays,”
g) Twenty-two airlines have had flights with tarmac
delays.
h) An estimate of the total cost to the airlines as a result
of tarmac delay regulations at New York area is $43,859 per
year or $476 per flight.
These results indicate that tarmac delays are a rare but
“painful” phenomenon. The likelihood of tarmac delays is exogenous to the departure airport as illuminated by the most congested schedule periods (June, July and August) and flights departing to the most congested airports (Chicago O’Hare – 8%, ATL - 5%, LAX – 4%). Further, the costs to the airlines are approximately only $43,859 per year.
This paper is organized as follows: Section 2 provides a background of tarmac delays regulations. Section 3 describes the method for analysis. Section 4 provides the analysis of the tarmac delays at New York Airports and the implications of the rule on this airport. Section 5 summarizes the results and conclusions.
II. TARMAC DELAYS REGULATION
2010 Integrated Communications Navigation and Surveillance (ICNS) Conference, May 11-13, 2010
2
Tarmac delays, also known as ground delays, refer to
delays that occur on the ground of the airport with passengers
already on board. Tarmac delays include taxi-in, for arrivals,
or taxi-out, for departures, and apron-gate (both) delays.
Regardless the cause of the ground delay, passengers face
a lot of problems when a flight is held for long hours on the
tarmac. To protect passengers, the DOT issued and Advance
Notice of Proposed Rulemaking (ANPRM) in 2007
announcing the needs to consider or amend rules to address
primarily the problems passengers face during long tarmac
delays. In December 2009 that the DOT issued the regulation
entitled “Enhancing Airline Passenger Protections”. This
regulation will take effect on April 2010 [5].
The new rule has five components to protect passengers
and ensure that airlines provide a service that meet minimum
standards:
1. Require carriers to adopt and publish contingency
plans for lengthy tarmac delays
2. Require carriers to respond to consumer problems
3. Declare the operations of flights that remain
chronically delayed to be an unfair and deceptive
practice and an unfair method of competition
4. Require carriers to publish delay data on their
websites.
5. Each carrier must adopt a customer service plan and
self-audit adherence to it.
The first clause establishes the requirement for a
contingency plans that includes:
a) Passengers on planes delayed on the tarmac for two
hours will have access to food, water, clean lavatories, and
the assistance of medical personal if needed, and
b) Passengers on planes delayed on the tarmac for three
hours will be permitted to deplane, unless there is a safety
and/or security-related impediment to deplaning passengers
or air traffic control advises the pilot that permitting
passengers to return to the gate or disembark would
significantly disrupt airport operations. [5]
These rules apply to any carrier that operates domestics
scheduled passenger service, including any charter service that
uses any aircraft with 30 or more passenger seats. The
contingency plan should be included for those aircrafts that
presents long ground delays on the tarmac and have fewer
than 30 seats.
III. METHOD OF ANALYSIS
A data mining analysis using BTS database has been done
to compute tarmac delays at JFK, EWR, AND LGA. The
analysis includes only the use of taxi out time to compute the
tarmac delays. It has been demonstrated that much of the
delays occurs during taxi out because aircrafts are delayed at
their origin if the predicted demand at their destination is
expected to exceed the predicted capacity [6].
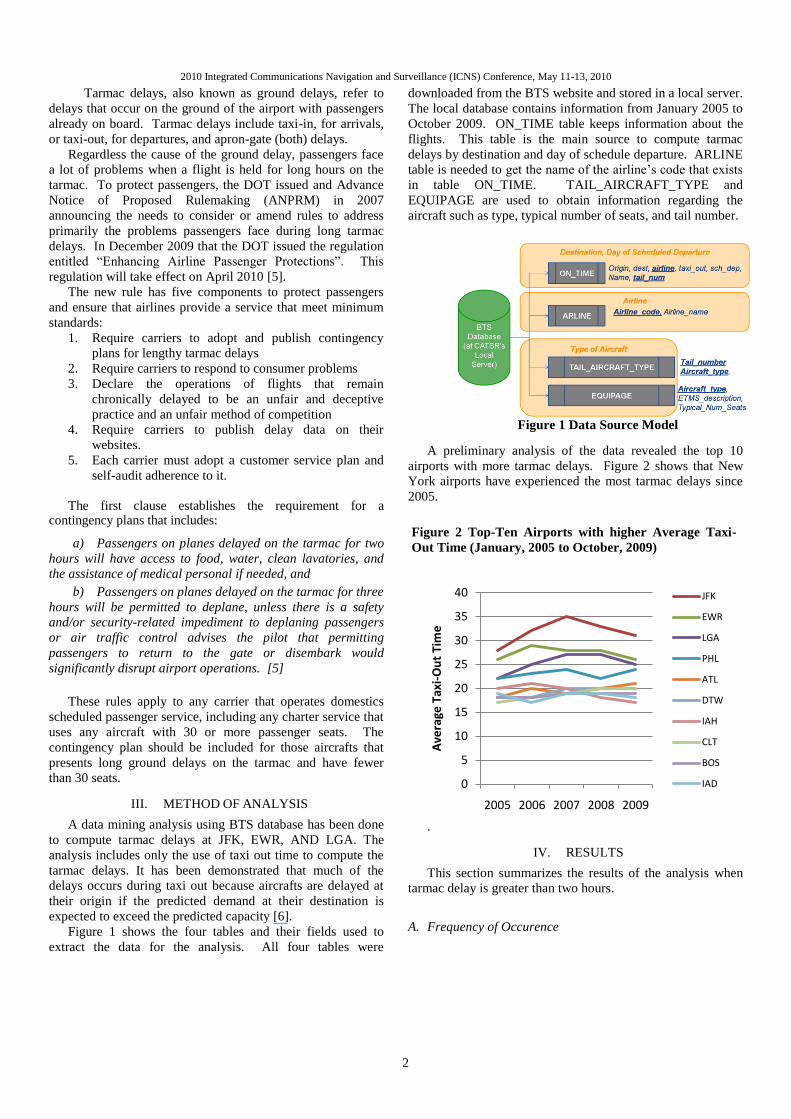
Figure 1 shows the four tables and their fields used to
extract the data for the analysis. All four tables were
downloaded from the BTS website and stored in a local server.
The local database contains information from January 2005 to
October 2009. ON_TIME table keeps information about the
flights. This table is the main source to compute tarmac
delays by destination and day of schedule departure. ARLINE
table is needed to get the name of the airline’s code that exists
in table ON_TIME. TAIL_AIRCRAFT_TYPE and
EQUIPAGE are used to obtain information regarding the
aircraft such as type, typical number of seats, and tail number.
A preliminary analysis of the data revealed the top 10
airports with more tarmac delays. Figure 2 shows that New
York airports have experienced the most tarmac delays since
2005.
.
IV. RESULTS
This section summarizes the results of the analysis when
tarmac delay is greater than two hours.
A. Frequency of Occurence
Figure 2 Top-Ten Airports with higher Average Taxi-
Out Time (January, 2005 to October, 2009)
0
5
10
15
20
25
30
35
40
2005 2006 2007 2008 2009
Ave
rage
Tax
i-O
ut
Tim
e
JFK
EWR
LGA
PHL
ATL
DTW
IAH
CLT
BOS
IAD
Figure 1 Data Source Model
2010 Integrated Communications Navigation and Surveillance (ICNS) Conference, May 11-13, 2010
3
Table 1 shows the total departure flights in the three
airports grouped by the number of minutes delayed using taxi-
out. A total of 1,873,219.00 flights departed from New York
Airports during January 2005 and October 2009 were queried
from the database. Only 0.54% of these fights (10,117) have
taxi-out time greater than two hours.
The average annual percentage of delayed flights is 0.11%.
The average of flights that spent more than two hours on the
tarmac was 0.56% annually during 2005 and 2008. The worst
year was 2007 when 0.72% of the flights spent more than two
hours. Based on ten months of data for 2009, 0.46% of flights
have been delayed for more than two hours on the tarmac.
Only 452 flights of the total delayed flights (0.02%) have
spent more than four hours on the tarmac during five years of
analysis. During the analyzed years, 94.33% of the flights
stayed lees than one hour on the tarmac, only 5.13% stayed
between one and two hours, 0.42% between two and three
hours and only 0.12% three hours or more. Table 2 shows the
distribution of total flights per tarmac delay and airport. JFK
has the majority of tarmac delay flights, followed by EWR and
LGA.
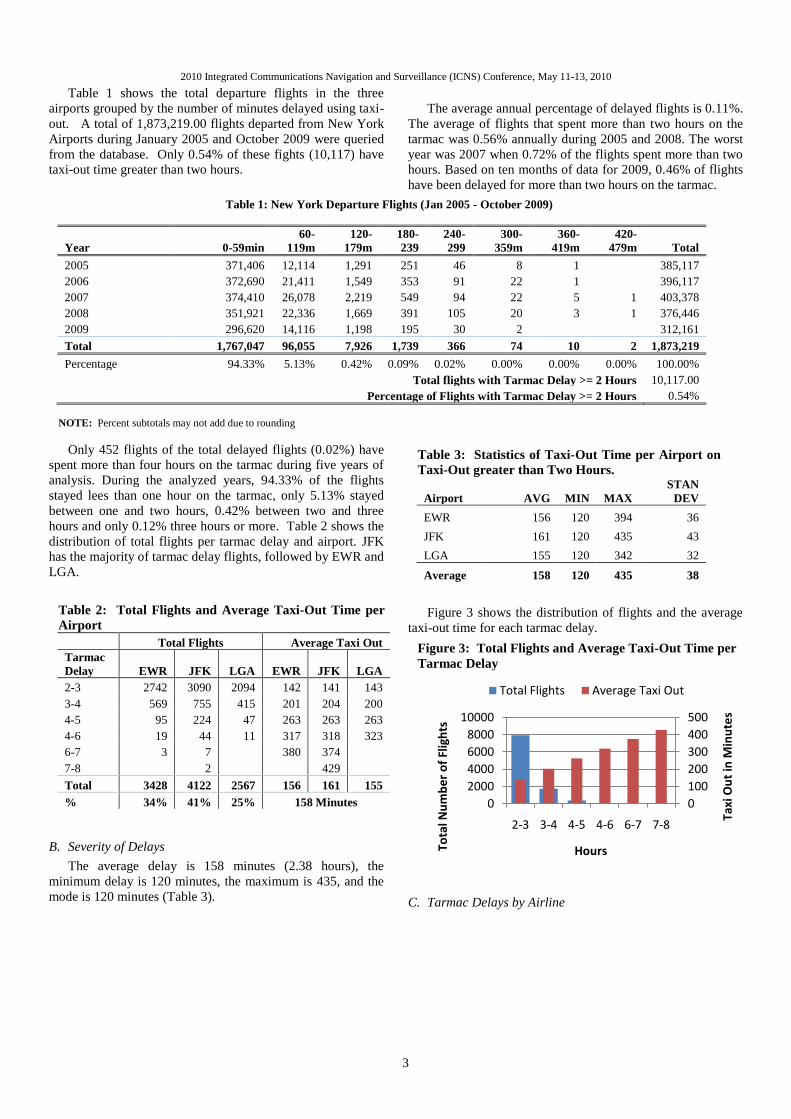
B. Severity of Delays
The average delay is 158 minutes (2.38 hours), the
minimum delay is 120 minutes, the maximum is 435, and the
mode is 120 minutes (Table 3).
Figure 3 shows the distribution of flights and the average
taxi-out time for each tarmac delay.
C. Tarmac Delays by Airline
Figure 3: Total Flights and Average Taxi-Out Time per
Tarmac Delay
0
100
200
300
400
500
0
2000
4000
6000
8000
10000
2-3 3-4 4-5 4-6 6-7 7-8
Taxi
Ou
t in
Min
ute
s
Tota
l Nu
mb
er
of
Flig
hts
Hours
Total Flights Average Taxi Out
Table 3: Statistics of Taxi-Out Time per Airport on
Taxi-Out greater than Two Hours.
Airport AVG MIN MAX
STAN
DEV
EWR 156 120 394 36
JFK 161 120 435 43
LGA 155 120 342 32
Average 158 120 435 38
Table 1: New York Departure Flights (Jan 2005 - October 2009)
Year 0-59min
60-
119m
120-
179m
180-
239
240-
299
300-
359m
360-
419m
420-
479m Total
2005 371,406 12,114 1,291 251 46 8 1
385,117
2006 372,690 21,411 1,549 353 91 22 1
396,117
2007 374,410 26,078 2,219 549 94 22 5 1 403,378
2008 351,921 22,336 1,669 391 105 20 3 1 376,446
2009 296,620 14,116 1,198 195 30 2
312,161
Total 1,767,047 96,055 7,926 1,739 366 74 10 2 1,873,219
Percentage 94.33% 5.13% 0.42% 0.09% 0.02% 0.00% 0.00% 0.00% 100.00%
Total flights with Tarmac Delay >= 2 Hours 10,117.00
Percentage of Flights with Tarmac Delay >= 2 Hours 0.54%
NOTE: Percent subtotals may not add due to rounding
Table 2: Total Flights and Average Taxi-Out Time per
Airport
Total Flights Average Taxi Out
Tarmac
Delay EWR JFK LGA EWR JFK LGA
2-3 2742 3090 2094 142 141 143
3-4 569 755 415 201 204 200
4-5 95 224 47 263 263 263
4-6 19 44 11 317 318 323
6-7 3 7
380 374
7-8
2
429
Total 3428 4122 2567 156 161 155
% 34% 41% 25% 158 Minutes
2010 Integrated Communications Navigation and Surveillance (ICNS) Conference, May 11-13, 2010
4
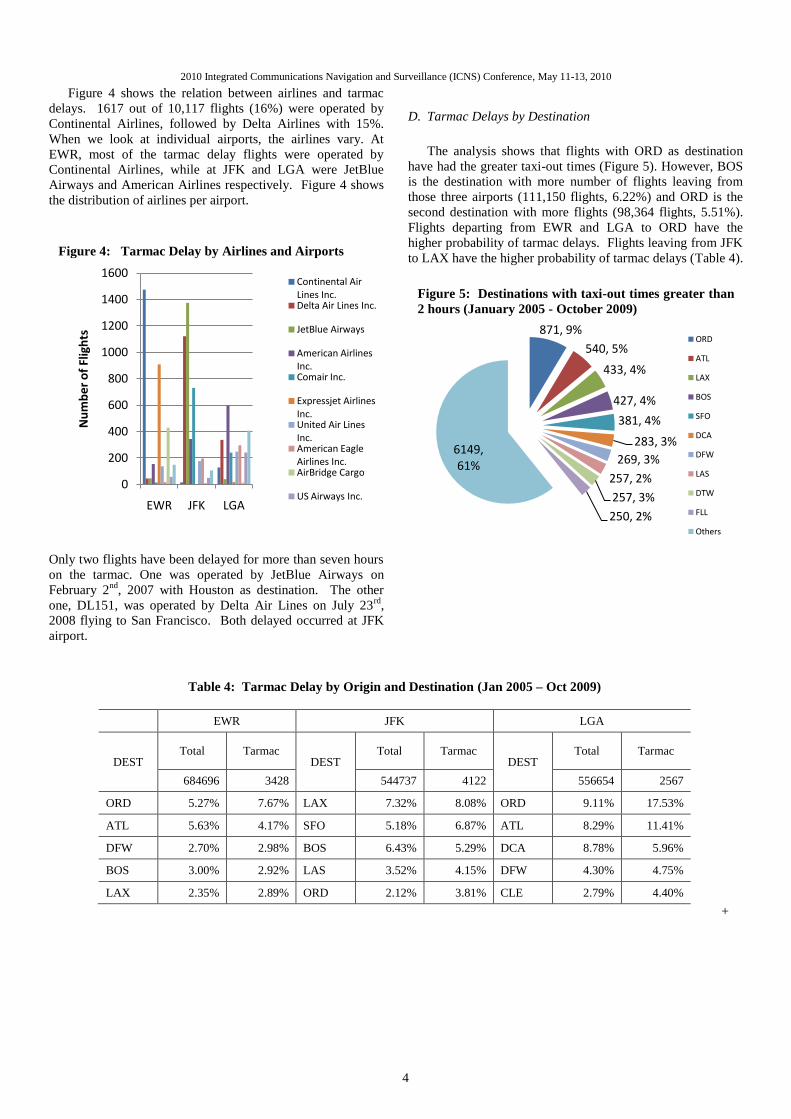
Figure 4 shows the relation between airlines and tarmac
delays. 1617 out of 10,117 flights (16%) were operated by
Continental Airlines, followed by Delta Airlines with 15%.
When we look at individual airports, the airlines vary. At
EWR, most of the tarmac delay flights were operated by
Continental Airlines, while at JFK and LGA were JetBlue
Airways and American Airlines respectively. Figure 4 shows
the distribution of airlines per airport.
Only two flights have been delayed for more than seven hours
on the tarmac. One was operated by JetBlue Airways on
February 2nd
, 2007 with Houston as destination. The other
one, DL151, was operated by Delta Air Lines on July 23rd
,
2008 flying to San Francisco. Both delayed occurred at JFK
airport.
D. Tarmac Delays by Destination
The analysis shows that flights with ORD as destination
have had the greater taxi-out times (Figure 5). However, BOS
is the destination with more number of flights leaving from
those three airports (111,150 flights, 6.22%) and ORD is the
second destination with more flights (98,364 flights, 5.51%).
Flights departing from EWR and LGA to ORD have the
higher probability of tarmac delays. Flights leaving from JFK
to LAX have the higher probability of tarmac delays (Table 4).
+
Table 4: Tarmac Delay by Origin and Destination (Jan 2005 – Oct 2009)
EWR JFK LGA
DEST Total Tarmac
DEST Total Tarmac
DEST Total Tarmac
684696 3428 544737 4122 556654 2567
ORD 5.27% 7.67% LAX 7.32% 8.08% ORD 9.11% 17.53%
ATL 5.63% 4.17% SFO 5.18% 6.87% ATL 8.29% 11.41%
DFW 2.70% 2.98% BOS 6.43% 5.29% DCA 8.78% 5.96%
BOS 3.00% 2.92% LAS 3.52% 4.15% DFW 4.30% 4.75%
LAX 2.35% 2.89% ORD 2.12% 3.81% CLE 2.79% 4.40%
Figure 5: Destinations with taxi-out times greater than
2 hours (January 2005 - October 2009)
871, 9%
540, 5%
433, 4%
427, 4%
381, 4%
283, 3%
269, 3%
257, 2%
257, 3%
250, 2%
6149, 61%
ORD
ATL
LAX
BOS
SFO
DCA
DFW
LAS
DTW
FLL
Others
Figure 4: Tarmac Delay by Airlines and Airports
0
200
400
600
800
1000
1200
1400
1600
EWR JFK LGA
Nu
mb
er
of
Flig
hts
Continental Air Lines Inc.Delta Air Lines Inc.
JetBlue Airways
American Airlines Inc.Comair Inc.
Expressjet Airlines Inc.United Air Lines Inc.American Eagle Airlines Inc.AirBridge Cargo
US Airways Inc.
2010 Integrated Communications Navigation and Surveillance (ICNS) Conference, May 11-13, 2010
5
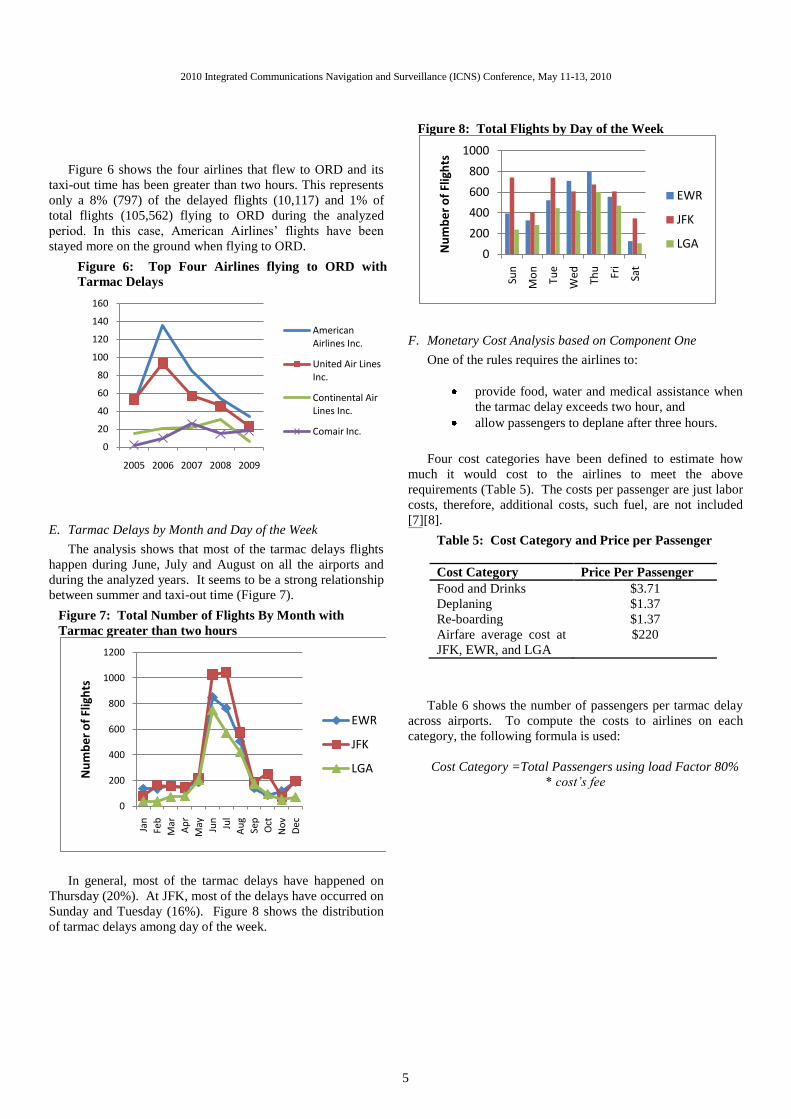
Figure 6 shows the four airlines that flew to ORD and its
taxi-out time has been greater than two hours. This represents
only a 8% (797) of the delayed flights (10,117) and 1% of
total flights (105,562) flying to ORD during the analyzed
period. In this case, American Airlines’ flights have been
stayed more on the ground when flying to ORD.
E. Tarmac Delays by Month and Day of the Week
The analysis shows that most of the tarmac delays flights
happen during June, July and August on all the airports and
during the analyzed years. It seems to be a strong relationship
between summer and taxi-out time (Figure 7).
In general, most of the tarmac delays have happened on
Thursday (20%). At JFK, most of the delays have occurred on
Sunday and Tuesday (16%). Figure 8 shows the distribution
of tarmac delays among day of the week.
F. Monetary Cost Analysis based on Component One
One of the rules requires the airlines to:
provide food, water and medical assistance when
the tarmac delay exceeds two hour, and
allow passengers to deplane after three hours.
Four cost categories have been defined to estimate how
much it would cost to the airlines to meet the above
requirements (Table 5). The costs per passenger are just labor
costs, therefore, additional costs, such fuel, are not included
[7][8].
Table 6 shows the number of passengers per tarmac delay
across airports. To compute the costs to airlines on each
category, the following formula is used:
Cost Category =Total Passengers using load Factor 80%
* cost’s fee
Table 5: Cost Category and Price per Passenger
Cost Category Price Per Passenger
Food and Drinks $3.71
Deplaning $1.37
Re-boarding $1.37
Airfare average cost at
JFK, EWR, and LGA
$220
Figure 8: Total Flights by Day of the Week
0
200
400
600
800
1000
Sun
Mo
n
Tue
Wed
Thu
Fri
Sat
Nu
mb
er
of
Flig
hts
EWR
JFK
LGA
Figure 7: Total Number of Flights By Month with
Tarmac greater than two hours
0
200
400
600
800
1000
1200
Jan
Feb
Mar
Ap
r
May Jun
Jul
Au
g
Sep
Oct
No
v
Dec
Nu
mb
er
of
Flig
hts
EWR
JFK
LGA
Figure 6: Top Four Airlines flying to ORD with
Tarmac Delays
0
20
40
60
80
100
120
140
160
2005 2006 2007 2008 2009
American Airlines Inc.
United Air Lines Inc.
Continental Air Lines Inc.
Comair Inc.
2010 Integrated Communications Navigation and Surveillance (ICNS) Conference, May 11-13, 2010
6
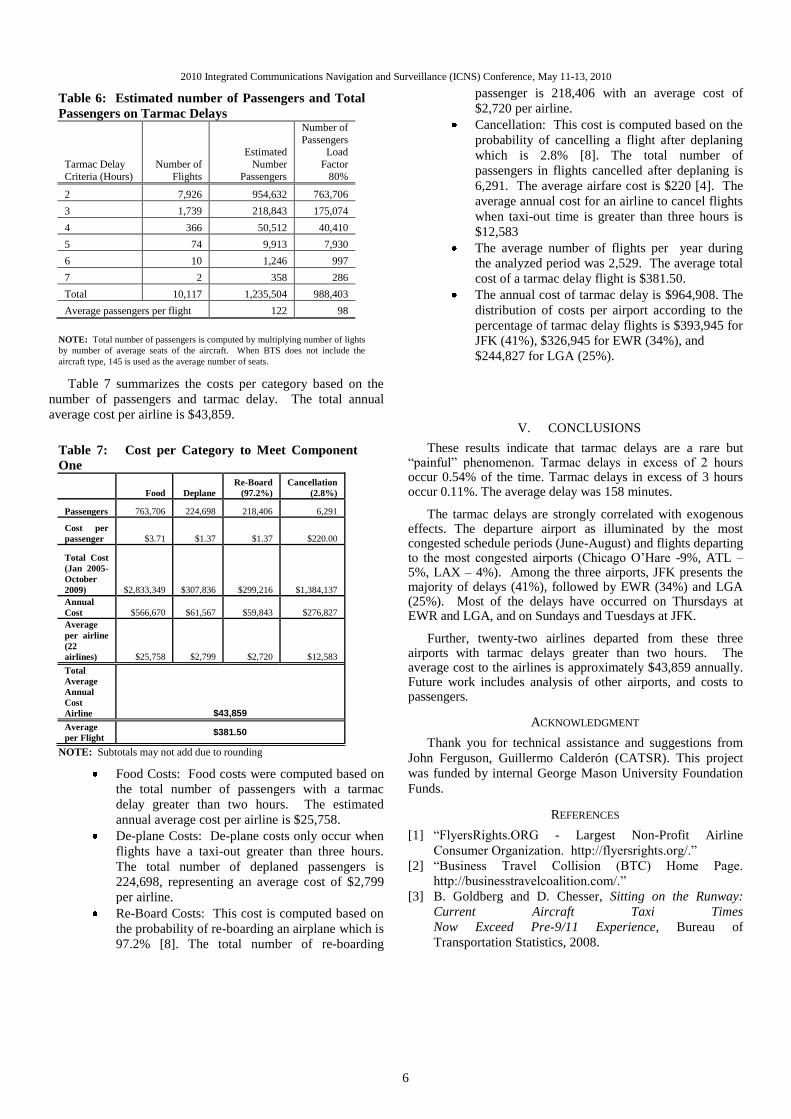
Table 7 summarizes the costs per category based on the
number of passengers and tarmac delay. The total annual
average cost per airline is $43,859.
Food Costs: Food costs were computed based on
the total number of passengers with a tarmac
delay greater than two hours. The estimated
annual average cost per airline is $25,758.
De-plane Costs: De-plane costs only occur when
flights have a taxi-out greater than three hours.
The total number of deplaned passengers is
224,698, representing an average cost of $2,799
per airline.
Re-Board Costs: This cost is computed based on
the probability of re-boarding an airplane which is
97.2% [8]. The total number of re-boarding
passenger is 218,406 with an average cost of
$2,720 per airline.
Cancellation: This cost is computed based on the
probability of cancelling a flight after deplaning
which is 2.8% [8]. The total number of
passengers in flights cancelled after deplaning is
6,291. The average airfare cost is $220 [4]. The
average annual cost for an airline to cancel flights
when taxi-out time is greater than three hours is
$12,583
The average number of flights per year during
the analyzed period was 2,529. The average total
cost of a tarmac delay flight is $381.50.
The annual cost of tarmac delay is $964,908. The
distribution of costs per airport according to the
percentage of tarmac delay flights is $393,945 for
JFK (41%), $326,945 for EWR (34%), and
$244,827 for LGA (25%).
V. CONCLUSIONS
These results indicate that tarmac delays are a rare but “painful” phenomenon. Tarmac delays in excess of 2 hours occur 0.54% of the time. Tarmac delays in excess of 3 hours occur 0.11%. The average delay was 158 minutes.
The tarmac delays are strongly correlated with exogenous effects. The departure airport as illuminated by the most congested schedule periods (June-August) and flights departing to the most congested airports (Chicago O’Hare -9%, ATL – 5%, LAX – 4%). Among the three airports, JFK presents the majority of delays (41%), followed by EWR (34%) and LGA (25%). Most of the delays have occurred on Thursdays at EWR and LGA, and on Sundays and Tuesdays at JFK.
Further, twenty-two airlines departed from these three airports with tarmac delays greater than two hours. The average cost to the airlines is approximately $43,859 annually. Future work includes analysis of other airports, and costs to passengers.
ACKNOWLEDGMENT
Thank you for technical assistance and suggestions from
John Ferguson, Guillermo Calderón (CATSR). This project
was funded by internal George Mason University Foundation
Funds.
REFERENCES
[1] “FlyersRights.ORG - Largest Non-Profit Airline
Consumer Organization. http://flyersrights.org/.”
[2] “Business Travel Collision (BTC) Home Page.
http://businesstravelcoalition.com/.”
[3] B. Goldberg and D. Chesser, Sitting on the Runway:
Current Aircraft Taxi Times
Now Exceed Pre-9/11 Experience, Bureau of
Transportation Statistics, 2008.
Table 7: Cost per Category to Meet Component
One
Food Deplane
Re-Board
(97.2%)
Cancellation
(2.8%)
Passengers 763,706 224,698 218,406 6,291
Cost per
passenger $3.71 $1.37 $1.37 $220.00
Total Cost
(Jan 2005-
October
2009) $2,833,349 $307,836 $299,216 $1,384,137
Annual
Cost $566,670 $61,567 $59,843 $276,827
Average
per airline
(22
airlines) $25,758 $2,799 $2,720 $12,583
Total
Average
Annual
Cost
Airline $43,859
Average
per Flight $381.50
NOTE: Subtotals may not add due to rounding
Table 6: Estimated number of Passengers and Total
Passengers on Tarmac Delays
Tarmac Delay
Criteria (Hours)
Number of
Flights
Estimated
Number
Passengers
Number of
Passengers Load
Factor
80%
2 7,926 954,632 763,706
3 1,739 218,843 175,074
4 366 50,512 40,410
5 74 9,913 7,930
6 10 1,246 997
7 2 358 286
Total 10,117 1,235,504 988,403
Average passengers per flight 122 98
NOTE: Total number of passengers is computed by multiplying number of lights
by number of average seats of the aircraft. When BTS does not include the
aircraft type, 145 is used as the average number of seats.
2010 Integrated Communications Navigation and Surveillance (ICNS) Conference, May 11-13, 2010
7
[4] “RITA | Bureau of Transportation Statistics (BTS).
http://www.bts.gov/.”
[5] Department of Transportation, Enhancing Airline
Passenger Protections, Federal Register, 2009.
[6] Evans, Antony David, “Responses to Airport Delays -A
system study of Newark International Airport,”
Massachusetts Institute of Technology, 2002.
[7] A.Q. Kara, J. Ferguson, K. Hoffman, and L. Sherry,
“Estimating Domestic US Airline Cost of Delay based on
European Model,” 4th International Conference on
Research in Air Transportation (ICRAT), Budapest,
Hungary: 2010.
[8] Decision Economics, Final Regulatory Impact Analysis
of Rulemaking on Enhanced Airline Passenger
Protections, 2009.