TREATMENT DELAYS, C - AAU Institutional Repository
216
COLLEGE OF HEALTH SCIENCES SCHOOL OF PUBLIC HEALTH CHALLENGES OF TUBERCULOSIS CONTROL IN SOUTHWEST ETHIOPIA: TREATMENT DELAYS, COST, AND OUTCOMES BY: ABYOT ASRES SHETANO A DISSERTATION SUBMITTED TO THE SCHOOL OF GRADUATE STUDIES OF ADDIS ABABA UNIVERSITY IN PARTIAL FULFILLMENT OF THE REQUIREMENTS FOR THE DEGREE OF DOCTOR OF PHILOSOPHY (PHD) IN PUBLIC HEALTH
-
Upload
khangminh22 -
Category
Documents
-
view
0 -
download
0
Transcript of TREATMENT DELAYS, C - AAU Institutional Repository
COLLEGE OF HEALTH SCIENCES
SCHOOL OF PUBLIC HEALTH
CHALLENGES OF TUBERCULOSIS CONTROL IN
SOUTHWEST ETHIOPIA: TREATMENT DELAYS, COST, AND
OUTCOMES
BY: ABYOT ASRES SHETANO
A DISSERTATION SUBMITTED TO THE SCHOOL OF GRADUATE
STUDIES OF ADDIS ABABA UNIVERSITY IN PARTIAL FULFILLMENT OF
THE REQUIREMENTS FOR THE DEGREE OF DOCTOR OF PHILOSOPHY
(PHD) IN PUBLIC HEALTH
ii
ADDIS ABABA UNIVERSITY
SCHOOL OF GRADUATE STUDIES
CHALLENGES OF TUBERCULOSIS CONTROL IN
SOUTHWEST ETHIOPIA: TREATMENT DELAYS, COST, AND
OUTCOMES
BY: ABYOT ASRES SHETANO
SUPERVISORS
DR. WAKGARI DERESSA (PHD, ASSOCIATE PROFESSOR)
DR. DEGU JERENE (MD, PHD)
ADDIS ABABA UNIVERSITY, COLLEGE OF HEALTH SCIENCES,
SCHOOL OF PUBLIC HEALTH
APRIL 2018

iii
DISSERTATION APPROVAL
ADDIS ABABA UNIVERSITY
SCHOOL OF GRADUATE STUDIES
CHALLENGES OF TUBERCULOSIS CONTROL IN
SOUTHWEST ETHIOPIA: TREATMENT DELAYS, COST, AND
OUTCOMES
BY
ABYOT ASRES SHETANO
SCHOOL OF PUBLIC HEALTH, ADDIS ABABA UNIVERSITY
APPROVED BY THE EXAMINING BOARD
_Dr.Mitike Molla ____________________
Chairman, Examining Board Signature and date
Dr. Wakgari Deressa ____________________
Primary Supervisor Signature and date
Dr. Degu Jerene ____________________
Secondary Supervisor Signature and date
________________________ ____________________
External Examiner Signature and date
Dr. Taye Tolera ____________________
Internal Examiner Signature and date
Dr. Daniel Gemechu ____________________
Internal Examiner Signature and date
i
Table of Contents
Table of Contents ............................................................................................................................. i
List of tables ................................................................................................................................... iii
List of figures ................................................................................................................................. iv
Acknowledgment ............................................................................................................................ v
List of Original papers ................................................................................................................... vi
Acronyms and abbreviations......................................................................................................... vii
Summary ........................................................................................................................................ ix
1. Introduction ............................................................................................................................. 1
1.1. Background of the study .................................................................................................. 1
1.2. Statement of the problem ................................................................................................. 2
2. Literature Review .................................................................................................................... 5
2.1. Epidemiology of tuberculosis........................................................................................... 5
2.2. Global strategies for the control of tuberculosis .............................................................. 9
2.3. Tuberculosis control in Ethiopia .................................................................................... 13
2.4. Challenges of tuberculosis control ................................................................................. 16
2.4.1. Delays to seek care and treatment ........................................................................... 16
2.4.2. Cost of seeking care and treatment for TB ............................................................. 19
2.4.3. Unsuccessful treatment outcomes ........................................................................... 23
2.5. Rationale and significance of the dissertation ................................................................ 26
3. Research questions ................................................................................................................ 30
4. Objectives of the dissertation ................................................................................................ 30
5. Methods ................................................................................................................................. 31
5.1. Study area and setting .................................................................................................... 31
5.2. Study designs and period................................................................................................ 32
5.3. Study population and sampling ...................................................................................... 34
5.4. Study variables ............................................................................................................... 39
5.5. Data collection tools and procedure ............................................................................... 39
5.6. Data management and analysis ...................................................................................... 41
5.7. Data quality assurance .................................................................................................... 46
5.8. Ethical considerations .................................................................................................... 46
6. Results ................................................................................................................................... 49
ii
6.2. TB treatment outcomes of eight and six months regimens (paper I) ............................. 51
6.3. Pathways to anti-TB treatment initiation (Paper II) ....................................................... 56
6.4. Pre-and post TB diagnosis costs to patients (Paper III) ................................................. 62
6.5. Delayed anti-TB treatment and patient outcomes (Paper IV) ........................................ 70
7. Discussion .............................................................................................................................. 74
7.1. TB Treatment outcomes of eight and six month regimens (Paper I) ............................. 75
7.2. Pathways to anti-TB treatment initiation (Paper II) ....................................................... 76
7.3. Pre –and post TB diagnosis costs to patients (Paper III)................................................ 78
7.4. Delayed anti-TB treatment and patient outcomes (Paper IV) ........................................ 81
7.5. Validity and Generalizability ............................................................................................. 84
7.6. Strengths and limitations ................................................................................................ 85
8. Conclusion ............................................................................................................................. 86
9. Recommendations ................................................................................................................. 87
References ..................................................................................................................................... 88
Annexes.......................................................................................... Error! Bookmark not defined.
iii
List of tables
Table 1: Sample sizes calculated for different objectives of the study ......................................... 36
Table 2 :Summary of dissertation work by major components of study methods and objective . 45
Table 3; Summary of key findings of the dissertation by objectives ............................................ 50
Table 4: Demographic and clinical characteristics of the patients, 2008-2014, Southwest Ethiopia
......................................................................................................................................... 52
Table 5; Follow-up characteristics and outcomes of TB cases, 2008-2014, Southwest Ethiopia 53
Table 6; Predictors of unsuccessful TB treatment outcomes, 2008-2014, Southwest Ethiopia ... 55
Table 7;Sociodemographic characteristics of TB cases in southwest Ethiopia, January to
December 2015 (n=735) .................................................................................................. 56
Table 8; Healthcare seeking practices among TB cases, Southwestern Ethiopia, January to
December 2015 (n=735) .................................................................................................. 57
Table 9: Clinical characteristics and delays to treatment among TB patients, January to
December 2015, Southwest Ethiopia ............................................................................. 59
Table 10: Predictors of patient delay, southwest Ethiopia, January to December 2015 ............... 60
Table 11: Predictors of provider delay among TB cases, southwest Ethiopia, January to
December 2015 ............................................................................................................. 61
Table 12: Sociodemographic and clinical characteristics of TB cases in southwest Ethiopia,
January to December 2015 ........................................................................................... 62
Table 13: Distribution of TB patient costs across cost categories and periods in south west
Ethiopia, January to December 2015 .......................................................................... 63
Table 14; Differences in pre and post TB diagnosis patient cost across different attributes,
January to December 2015, Southwest Ethiopia .......................................................... 65
Table 15: Predictors of pre-diagnosis cost among TB cases southwest Ethiopia January to
December 2015 ............................................................................................................. 67
Table 16: Predictors of post diagnosis cost among TB cases on treatment in southwest Ethiopia,
January to December 2015 ........................................................................................... 69
Table 17 Characteristics of TB cases across time spent to initiate treatment in southwest
Ethiopia January to December 2015 ............................................................................ 70
Table 18: Treatment follow-up characteristics of TB patients across time spent to intiate
treatment January 2015 to june 2016 ........................................................................... 71
Table 19: Predictors of unsuccessful treatment outcome among TB cases in southwest Ethiopia
January 2015 to June 2016 (N=699) ............................................................................ 73
iv
List of figures
Figure 1: Conceptual framework for the analyses of predictors and interrelationships between
delays, cost and treatment outcomes of TB treatment ................................................... 29
Figure 2: Map of the study area showing region and zones where the study was conducted ..... 32
Figure 3: Schematic description of study designs used for the dissertation ................................. 33
Figure 4: Schematic presentation of the sampling procedure and sample size analyzed ............. 38
Figure 5; Distribution of patient costs across pre and post diagnosis periods among TB cases on
treatment in districts of southwest Ethiopia January to December 2015 ........................ 64

v
Acknowledgment
I would like to express my deepest gratitude to my supervisors Dr. Wakgari Deressa and Dr.
Degu Jerene for their guidance, enthusiastic encouragement, valuable scientific comments, and
critiques starting from inception to completion of this study.
I am grateful for my home university, Mizan Tepi, which covered all my living cost and funding
part of the study. I would like to thank also all instructors, PhD fellows and alumni of the School
of Public Health, Addis Ababa University who have been instrumental in shaping my thoughts
and understanding during the various seminars held at the School. I would also like to thank
Dr(s).Abera Kumie and Nigussie Deyessa, for their continuous advice and assistance in keeping
my progress on schedule. I am very thankful to Prof. Alemayehu Worku and Prof. Ahmed Ali
for their general advice and encouragement throughout the study period.
Special thanks and heartfelt gratitude go to my beloved wife, teacher Minalush Haile, for
shouldering the overall family matters including taking care of our sons, during my long absence
and engagement for the study. I have no words to express my appreciation to your patience, love,
child caring, strength, and continuous encouragement throughout my study. Our sons, Natan and
Eyoab Abyot you are center piece of our life, I missed you terribly during my long absence and
engaging work for the study.
I am indebted to my father, Mr. Asres Shetano and my mother Mrs.Amelework Ayasho for
upbringing and shaping me the way I am today. I also would like to thank my brothers (Akililu,
Bekele, Asemahegn, Asrat, Teshome and Amanuel and my sister Aleminesh for their continuous
moral support and encouragement. I also thank my father in-law teacher Haile Belachew, mother
in-law Mrs.Zewuditu Adraro, all my brother and sister in-laws for their support and
encouragement during my study. I would like to thank all peoples who supported morally and
encouraged me during my study period.
My heartfelt gratitude also goes to the study participants, data collectors, supervisors, and
officials in the study woreda health office and zonal health departments for facilitating the data
collection. My sincere thanks also go to Mss.Menen Amare, Mr. Adane Assefa and Mr.
Wondimagegn Wondimu for their support during data collection and entry.

vi
List of Original papers
This dissertation is based on the following four papers, which will be referred to in the text by
Roman numerals:
I. Asres A., Jerene D., Deressa W., Tuberculosis Treatment Outcomes of Six and Eight
month Treatment Regimens in Districts of Southwestern Ethiopia: a comparative cross-
sectional study. BMC Infectious Diseases (2016) 16:653
II. Asres A., Jerene D., Deressa W., Pathways to Anti-tuberculosis Treatment Initiation
among Cases on Directly Observed Treatment Short course in districts of Southwestern
Ethiopia. A cross-sectional study (INFD-D-17-01386, BMC infectious diseases ,under review)
III. Asres A., Jerene D., Deressa W., Pre-and post Diagnosis Costs of Tuberculosis to
Patients on Directly Observed Treatment Short-course in districts of southwest Ethiopia:
a longitudinal study (Journal of Health, Population and Nutrition (2018),37:15
IV. Asres A., Jerene D., Deressa W. Delays to treatment initiation is associated with
tuberculosis treatment outcomes among patients on Directly Observed Treatment Short
course in southwest Ethiopia: a follow-up study (BMC Pulmonary Medicine (2018)
18:64
vii
Acronyms and abbreviations
AFB Acid Fast Bacilli
AIDS Acquired Immunodeficiency Syndrome
ART Antiretroviral Therapy
AAU Addis Ababa University
BCG Bacille Calmette-Gue´rin
CDR Case Detection Rate
CI Confidence Interval
COPD Chronic Obstructive Lung Disease
CPT Cotrimoxazole Prophylactic Therapy
DOTS Directly Observed Treatment Short Course
DST Drug Susceptibility Test
6EH Six months treatment with Ethambutol (E) and Isoniazid (H) combination
Epinfo Epidemiological Information
EPTB Extra Pulmonary Tuberculosis
ETB Ethiopian Birr
FDC Fixed Drug Combination
HBC High Burden Countries
HIV Human Immunodeficiency Virus
HCF Healthcare Facility
HCP Healthcare Provider
IPT Isoniazid Preventive Therapy
IQR Inter-quartile range
IRB Institutional Review Board
MDG Millennium Development Goal
MDR TB Multi Drug Resistant Tuberculosis
MTB Mycobacterium Tuberculosis
NGO Nongovernmental Organization
NTLCP National Tuberculosis and Leprosy Control Program
NTP National Tuberculosis Control Program
OR Odds Ratio
PAS Para-Amino salt of Salicylic acid
PHCU Primary Healthcare Unit

viii
PPD Purified Protein Derivative
PPM Public-Private Mix
PTB Pulmonary Tuberculosis
4RH Four months treatment with Rifampicin(R) and Isoniazid (H) combination
RR Relative Risk
SD Standard Deviation
SDG Sustainable Development Goal
SNNPR Southern Nation Nationalities and Peoples Region
SPSS Statistical Package for Social Sciences
TB Tuberculosis
TSR Treatment Success Rate
US$ United States Dollar
VIF Variance Inflation Factor
WHA World Health Assembly
WHO World Health Organization
XDR TB Extensively Drug Resistant Tuberculosis

ix
Summary
Background: Tuberculosis (TB) is among the major public health problems over the world.
Thus, global efforts have been designed to combat three distinct, but overlapping humanitarian,
public health, and economic burdens posed by the TB illness. Timely case detection and
treatment of cases have been a focus and priority in the prevention and control of TB. However,
long delays to initiate anti-TB treatment have been reported for which evidences on predictors of
the delay and impact of the delayed treatment on outcomes are limited. Elimination of
catastrophic costs posed by TB illness to patients and households has taken attention in the latest
end TB strategy. On the other hand, evidences on magnitude and drivers of patient cost across
continuum of TB care are scarce in Ethiopian setting. Treatment regimens play a vital role in
reducing time delays to treatment and cost spent across continuum of TB care, and improving
outcomes. Nonetheless, evidences on the interdependence among delays, patient cost of care and
outcomes in the era of shortened treatment regimen is scanty in Ethiopian setting.
Objectives: The aims of the dissertation were 1) to compare outcomes of six and eight-month
TB treatment regimen, 2) to determine time delays to initiate anti-TB treatment and its
predictors, 3) to assess pre-and post-diagnosis patient costs for TB care and 4) to examine
association between delayed anti-TB treatment initiation and treatment outcome.
Methods: A blend of cross-sectional and longitudinal studies were conducted among 735 TB
cases on treatment and 790 patient records from 14 public health facilities of Bench Maji, Kaffa
and Sheka zones in Southwest Ethiopia. The cases were selected using multistage cluster
sampling technique. Both primary and secondary data were gathered and/or extracted using
structured questionnaire from January 2015 through June 2016. For comparison of outcomes
across the six and eight month regimen, patient clinical profiles and outcomes were extracted
from unit TB register of cases registered during 2008 through 2014. Data for the cases on
treatment were collected at two points; 1) at enrollment when patients‟ sociodemographics, care-
seeking practices, direct and indirect costs of TB care seeking were collected and 2) at the end of
treatment when treatment practices, patient cost of TB treatment and outcomes were inquired.
The data were entered in to Epi-Data and processed on SPSS version 21 and STATA version 13.
Since the cost data were right skewed, analysis was made on natural logarithm and reported in
corresponding antilog. Bivariate and multiple logistic, linear, and log-binomial regression
models were fitted to identify predictors of delays, cost, and outcome. In all the statistical tests,
necessary assumptions were checked and significance judged at p<0.05.

x
Results: The overall treatment success among cases registered during 2008 through 2014 was 88
% ( 85.3% vs 90.6%, p=0.02 among those treated for eight months with 2ERHZ/6HE and six
months with 2ERHZ/4RH regimens, respectively). Thus, 4RH continuation phase treatment
adjusted Odds Ratio [aOR=0.55,95% CI;(0.34,0.89)], weight gain at the end of second month
treatment [aOR=0.28, 95% CI; (0.11, 0.72)] predicted lower odds of unsuccessful outcome. On
the other hand, age [aOR=1.02,95%CI; (1.001,1.022)], rural residence
[aOR=2.1,95%CI;(1.18,3.75)] and HIV co-infection [aOR=2.39,95%CI;(1.12,5.07)]
independently predicted higher odds of unsuccessful outcome.
TB patients had spent a median [inter-quartile range (IQR)] of 55(32-100) days to initiate anti-
TB treatment since onset of illness (total delay). Similarly a median (IQR) of 25(15-36) and
22(9-48) days had been elapsed respectively to initiate care seeking (patient delay) and anti-TB
treatment since first consultation (provider delay). Thus 54.6% of the total delay was attributed
to provider (health system) and the rest to the patient. Prior self-treatment (aOR: 1.72, 95%
confidence interval [CI]:1.07-2.75), HIV co-infection (aOR: 1.80, 95% CI: 1.05-3.10) and extra
pulmonary TB (aOR: 1.54, 95% CI: 1.03-2.29) independently predicted higher odds of patient
delay. On the other hand, initial visits to health posts or private clinics (aOR: 1.42, 95% CI: 1.01,
2.0) and delayed to seek care (aOR: 1.81, 95% CI: 1.33-2.50) significantly predicted higher odds
of provider delay.
Since onset of illness, TB patients totally incurred mean [(standard deviation (+SD)] of
US$244.71(+0.1) for care seeking and treatment. Thus mean (+SD) US$108.0(+0.1) and
US$117.0(+0.1) were respectively incurred during pre-diagnosis and post-diagnosis periods.
Mean (+SD) out of pocket patient expenditures during pre-and post-diagnosis were
US$21.46(0.16) and US$43.80(+0.1) respectively. Total indirect and pre-diagnosis costs
constitute 70.6% and 53.6% of the total cost respectively. Patient delay (adjusted coefficient
(βadj)= 0.004, p<0.001), provider delay (βadj =0.004,p<0.001), number of visited healthcare
facilities (βadj =0.17,p<0.001) and diagnosis at private facilities (βadj=0.16,p=0.02) independently
predicted increased pre-diagnosis cost. Similarly, rural residence (βadj=0.27,p<0.001),
hospitalization (βadj=0.91,p<0.001), patient delay (βadj=0.002,p<0.001) and provider delay (βadj
=0.002,p<0.001) predicted increased post-diagnosis costs.
The overall treatment success among the prospectively enrolled cases was 89.7% (86.7% vs.
92.6%, p=0.01) respectively among those initiated anti-TB treatment beyond and within 55days

xi
of onset of illness). Accordingly, treatment initiation beyond 55days of onset [Adjusted Relative
Risk (aRR)=1.92, 95%CI:1.30, 2.81),treatment center being hospital (aRR=3.73, 95%CI:2.23,
6.25), and HIV co-infection (aRR=2.18, 95%CI: 1.47, 3.25) independently predicted higher risk
of unsuccessful treatment outcome. In contrast, weight gain at the end of second month treatment
(aRR=0.40, 95%CI: 0.19, 0.83) predicted lower risk of unsuccessful outcome.
Conclusions:
The switch of continuation phase TB treatment regimen from 6EH to 4RH has brought
significantly higher treatment success that verified applicability of the regimen change in
resource constrained and high burden countries. TB cases in the study area elapsed too long time
to initiate care seeking and treatment. The delays are attributed to the patient, disease and health
system related factors. Throughout the care seeking and treatment pathways, TB cases incurred
substantial direct and indirect cost for TB care despite the “free TB service”. The delay to initiate
anti-TB treatment was significantly associated with increased patient costs and risk of
unsuccessful outcome. Patient and health system attributes predicted both costs incurred across
continuum of TB care and treatment outcome.
Recommendations
Promotion of early care seeking for TB through community level awareness creation; involving
both formal and informal providers can minimize patient delays. Moreover, improving
diagnostic and case-holding efficiencies of both private and public healthcare facilities can
reduce delays to treatment and risk of unfavorable outcomes. On the other hand, adoption of
patient centered TB care, reimbursement mechanisms of costs and scale up of the national
community and social insurance schemes to the study area can reduce the financial burden on
patients. Finally, further studies are required to explore reasons for patient and provider delays
using qualitative designs, costs of TB care, and its impacts on household and health system.
Keywords: TB, Patient delay, provider delay, direct cost, indirect cost, pre-diagnosis cost, post-
diagnosis cost, treatment outcome, longitudinal, Ethiopia

1
1. Introduction
1.1. Background of the study
Tuberculosis (TB) is a chronic infectious disease mainly caused by mycobacterium tuberculosis
(MTB). It typically affects the lungs often called pulmonary tuberculosis (PTB) but can affect
almost all body organs. The main sources of infection are those untreated smear-positive PTB
from whom the bacilli transmits via airborne route during coughing or sneezing [1-3]. Globally,
two billion people are infected with TB of whom about 10–15% develop active disease at some
stage later in life. The progression from infection to active TB disease is governed by exogenous
and endogenous risk factors [4-6]. In Human Immunodeficiency Virus (HIV) infected people,
the rate of progression is much higher at about 10-15% per year [7, 8]. First-line drugs that can
cure around 90% of TB cases have been available since 1950s [9]. Unless TB cases are treated in
the earliest five years, 50% die, 25% cure and 25% remain sick and infectious [10].
Tuberculosis has been recognized as a global problem and declared a public health emergency by
the World Health Organization (WHO) in 1993 at a time when an estimated 7-8 million cases
and 1.3-1.6 million deaths occur each year [11]. Since then, different global strategies including,
Directly Observed Treatment Short course (DOTS) [12, 13], collaborative TB/HIV interventions
[14], stop TB strategy [15] and end TB strategy [16] have been designed and implemented . The
global efforts to control TB have three distinct, but overlapping humanitarian, public health, and
economic dimensions [12]. The humanitarian concern relates to alleviation of illness and death
among patients through patient-centered approach and timely treatment. Thus effective
treatments of patients decrease disease transmission within communities that respond to public
concern. The economic dimension relates to the reduction of direct and indirect costs to the
individuals and society. Implementations of the strategies have been expanded across the globe
and brought decline in death rates [17]. Thus an estimated 49 million lives were saved between
2000 and 2015 [18].
Despite implementations of the strategies for decades, TB remained to be among the major
public health problems over the world. Globally, in 2015, 10.4 million incident cases and 1.4
million deaths were estimated to occur. Thus TB became among the top 10 causes of death
ranking above HIV/AIDS [18]. Since 1990s TB mortality rates have been falling in all WHO
regions, but the fall is relatively little in Sub-Saharan Africa where about 20% case fatality was

2
reported [18]. The high rates of mortality in the sub-Saharan Africa is because of the sharp HIV-
related increase in TB incidence [19]. The global TB morbidity and mortality pose an enormous
economic burden. On average, a TB patient loses 3 to 4 months of work which corresponds to up
to 30% annual household earnings and 0.52% loss of the world‟s gross national income [20].
Tuberculosis has been recognized as a major public health problem in Ethiopia and efforts to
control it began since early 1960s [21]. Accordingly, the country has been adopting different
strategies and targets recommended for TB control [22, 23].The first 2011 national TB
prevalence survey revealed smear positive PTB prevalence of 108/100,000 of which 55% were
not detected till the date of survey [24]. In 2015, about 205,463 new cases [25] and 29,000
deaths were estimated to occur in the country [18] when only 125,801 (61%) were notified to
National TB control Program (NTP) [25]. TB has been the 4th
and 6th
cause of death in females
and males, respectively [26]. Ethiopia is among the 14 TB, TB/HIV and Multi-Drug Resistance
(MDR) TB High Burden Countries (HBC) [18].
1.2. Statement of the problem
Effective treatment of TB cases has been one of the pillars in TB prevention and control across
different global strategies designed to date. Accordingly, different treatment regimens have been
recommended for adoption among countries. The latest treatment guidelines [27] recommended
six months treatment with rifampicin combination throughout both the intensive and
continuation phases of the treatment periods. However, regimens without rifampicin had been
considered safer in developing countries owing to irregular treatments and high absentee rates [9,
28]. Ethiopia has adopted a regimen replacing six months of Ethambutol and Isoniazid (6EH)
with four months of rifampicin and Isoniazid (4RH) continuation phase treatment as end of 2011
for all new adult cases of TB [23]. Patients are required to visit weekly with the 4RH [23] unlike
monthly visit during the 6EH continuation regimen [22]. Frequent visits to collect drugs are
reported to adversely affect treatment adherence among patients [29] that ultimately lead to
worse outcomes. A continuation phase treatment with 4RH elsewhere has demonstrated lower
rates of unsuccessful outcomes and costs [30, 31]. A continuation phase treatment with 4RH and
6EH among HIV negatives, respectively, predicted 8.8% Vs 13.3% mortality, 5.2% Vs 10.4%
failure/relapse and $23.64 and $26.07 average costs per patient [30]. Given the challenges of
frequent patient visit with the new regimen, effect of the change on treatment outcomes in
Ethiopia setting is not documented.

3
Timely case detection and treatment of cases under proper case management conditions have
been a focus and priority in the prevention and control of TB [16, 32, 33]. When diagnosis of TB
is delayed, patients go without treatment for longer period and transmit the infection. Thus, each
infectious case will result in as many as 20 to 28 secondary infections that ultimately increase the
infectious pool [34-37]. The delays to treatment could be due to delayed initiation of care
seeking that constitutes patient delay or delayed diagnosis after seeking care that constitute
provider delay. Consequently, analysis of TB transmission dynamics has stressed that delays to
diagnosis present a major obstacle to the control of TB [34].
Delays to TB treatment have been studied in different parts of the world including Ethiopia. A
review of studies reported median patient delay of 30days and provider delay of 7-28days [34,
38]. Studies from different parts of Ethiopia also reported longer delays to initiate treatment for
TB with median patient delay of 20-90 days [39-41] and provider delay of 6-34days [39, 41-43].
The long delays are attributed to female gender, older age, low awareness about TB, repeated
visits to health facilities, visiting lower level health care facilities and traditional healer [44, 45].
Subsequent to the prevailing long delays in Ethiopia, identification of barriers for diagnoses and
treatment delays have been set as a national priority research agenda [46]. However, available
studies in the country are limited to only few parts of the country (northern) [40, 47, 48], smear
positive PTB cases [43], focused on cases presenting to either health centers [42] or hospitals
[48] but not both. In addition, the studies were conducted before the introduction of six-month
treatment in 2011. Shorter treatment regimens motivate TB suspects to seek care and treatment
early [49]. However, complete picture of the patterns of delay at different health care setups in the
era of reduced treatment duration is scanty in Ethiopia.
Delayed detection and treatment of TB result in more serious illness by the time of diagnosis,
increased length of infectiousness and poor treatment outcomes including mortality and drug
resistance [50-54]. It is also reported that the high mortality rate among people living with HIV
is also partly explained by delays in TB treatment [34, 35]. In contrast, a study in Tel Aviv
reported no association between treatment success and delay [55]. Despite the prevailing long
delays and controversial evidences on association between delay in seeking treatment and
outcomes, evidences on the effect of treatment delays on outcomes are very limited in Ethiopia.
Delays to treatment represent a time span in which additional costs are incurred [56]. The high
perceived or actual cost of TB care seeking and treatment result in delays for diagnoses [52, 57-
4
59] and poor treatment adherence [60]. Both the delays and poor adherence in turn leads to the
development of MDR TB and extensively drug resistant TB (XDR TB) [61] those require much
higher cost of care [62].Though TB care services are said to be provided for free, patient and
household incur potentially catastrophic direct and indirect costs for TB care. Studies in Nigeria
and Yemen, respectively, reported that seeking care and treatment of TB totally costs a median
of US$592 per household [63] and mean cost of US$ 108.4 [64]. A study in Ethiopia also
reported median costs of care seeking per patient incurred by patient, companion and the public
health system were US$16 , US$3 and US$3, respectively [65]. In Ethiopia, household out-of-
pocket expenditures are the major sources of funding for prevention and control of TB
amounting to 63% of the total resources spent in 2008 [66].
In Ethiopia, only few studies exist on cost of TB to patients. The few studies exclusively dealt
on cost of care seeking and diagnoses [65] and cost effectiveness of treatment observation
modalities [67]. In addition the studies were conducted when the TB treatment regimen required
less frequent patients visits to health facilities unlike the current regimen that requires patients
visits as frequent as daily to weekly to the health facilities throughout the treatment period [23].
Hence, evidences on the patient financial burden posed by TB care seeking, diagnoses and
treatment is lacking particularly in the era of reduced treatment regimen.
5
2. Literature Review
2.1. Epidemiology of tuberculosis
2.1.1. Etiology and mode of transmission
Tuberculosis is one of the oldest chronic infectious diseases known to affect humans. It usually
affects the lungs often called PTB but other organs are also involved. TB is caused by bacteria
belonging to the MTB complex (M. bovis,M. africanum, M. microti, M. caprae, M. pinnipedii, M.
canetti and M. mungi) of which the most frequent and important agents of human disease are
MTB and M. bovis. It is a rod - shaped bacterium which was discovered by Robert Koch in 1882
[1, 3, 68]. Mycobacteria are often neutral on Gram‟s staining but once stained, it cannot be
decolorized by acid alcohol that dictates their classification as acid-fast bacilli (AFB). MTB had
several characteristic proteins include those in purified protein derivative (PPD) tuberculin, a
precipitate of non-species-specific molecules obtained from filtrates of heat-sterilized,
concentrated broth cultures [1-3].
Tuberculosis is a communicable disease that usually transmits from infectious patients (smear
positive PTB) via airborne droplet. The droplet nucleus produced from an infectious case is 1– 5
microns in diameter and aerosolized during coughing, sneezing, speaking, laughing or singing.
An episode of cough may produce as many as 3000 infectious droplet nuclei equivalent to as
many as 105 AFB/mL. The droplet then may remain suspended in the air for several hours and
may gain access to the terminal air passages when inhaled [1-3, 68]. Studies revealed that
culture positive sputum smear-negative PTB patients can also transmit infection attributing
about 13% of transmission [69].
2.1.2. Risk factors of transmission and disease
Development of active TB is a two-stage process comprised of exposure to infection and
infection to active disease. The processes are governed by both exogenous and endogenous risk
factors. The risk of transmission and infection are both mainly governed by external factors. The
risk of transmission increased by overcrowding, bad coughing hygiene, smear status of source
and other conditions that prolong the length of exposure including delayed diagnoses [1].
Whereas the progression from exposure to infection is determined mainly by bacillary load in the
sputum, duration of contact, the proximity of an individual to an index case, local air circulation,
indoor air pollution, social and behavioral risk factors including smoking and alcohol [5, 6].
After infection, disease can develop at any time through reactivation of a previously acquired

6
(latent) infection or through exogenous re-infection. The risk of disease development after
infection is governed by endogenous host factors. The risk of disease is much greater in the 5
years following infection and decline as the time interval increases [4, 70, 71].
Approximately 10-15% of those infected with MTB will develop TB disease at some point in
their lives. In about 5% of infected cases, the progression occurs within the first two years of
infection and the remainder over their lifetime [68, 70]. So far studies have well demonstrated
that HIV infection, malnutrition, young/old age, diabetes mellitus, indoor air pollution, alcohol
consumption, use of immunosuppressive drugs, and tobacco smoke significantly increase the risk
of active disease development [5, 6]. In HIV infected and other immunocompromized
individuals, the risk of progression to disease is higher at about 10% per year [7, 68, 72]. Further
studies have also reported the risk of active disease is associated with male sex, family history of
TB, history of asthma [73] being illiterate and possessing few goods [74].
2.1.3. Clinical manifestation and diagnosis
The clinical manifestations of tuberculosis are quite variable and depend on a number of factors
including host (age, immunity, and concomitant diseases), severity, site of infection (PTB,
EPTB) and microbial (virulence) factors. Before the advent of HIV, approximately 85% of
reported tuberculosis cases were limited to the lungs. For PTB cough is the most common
symptom which becomes sputum productive and subsequently with haemoptysis as the diseases
progress. Other symptoms including fever, loss of appetite, weight loss, weakness, night sweats,
and malaise are also common, but are more difficult to quantify since they may relate to
coexisting diseases. Thus, patients presenting with these symptoms represent TB suspect [3, 75].
Definite diagnosis of TB requires bacteriologic examination through microscopy and/or culture
of sputum or other clinical specimen. Accordingly, bacteriologic examination through sputum
smear microscopy and then culture and drug susceptibility testing (DST) have been
recommended method of TB diagnosis across the different TB control strategies [3, 15, 75]. A
case of TB is bacteriologicaly confirmed (definite) or one in which a health worker diagnosed
TB (clinically diagnosed) and has decided to treat the patient with a full course of anti-TB
treatment. A definite case of TB is a patient with MTB complex identified from a sputum or
clinical specimen, by sputum smear microscopy, culture or by a newer method such as molecular
line probe assay [27, 76].
7
TB cases have been categorized in to different forms based on anatomical site involved,
bacteriologic result, history of anti-TB treatment and HIV co-infection [27]. Thus, new cases are
those never taken anti TB treatment or taken for less than one month. Cases that have taken anti
TB treatments for at least one month are classified as previously treated cases including return
after default, relapse, or return after treatment failure. Based on the anatomical sites involved, TB
case can be pulmonary when lungs and/or other sites are involved and extra pulmonary when
only organs other than lungs are involved. Pulmonary TB cases can further be classified as smear
positive when one or more sputum smear specimens are positive for AFB and smear negative
when sputum smear is negative but culture-positive for MTB or clinician decisions to treat with
full course of anti-TB, radiographic abnormalities suggestive of active TB [27].
2.1.4. Treatment regimens
Before the advent of chemotherapy, 30-40% of TB cases used to die within a year and 50-70%
within five to seven years after the onset of TB illness [9]. The first chemotherapy for TB,
streptomycin was discovered in the mid-1940s, which led to cure and reduction of mortality for
majority of cases [1, 77, 78]. However, shortly after the introduction of streptomycin therapy,
resistance to the drug and poor adherence of patients were reported [79]. Thus, cure of TB
required concomitant use of at least two agents to which the organism was susceptible. This
became evident with the discovery of para-aminosalicylic acid (PAS) and Isoniazid [1, 80] at
which time the therapy lasted for18-24months. Subsquent to discovery of Ethambutol that
substituted PAS, treatment duration shortened to 18months [1]. In 1960‟s administration of 12
month treatments composed of Thiacetazone, Isoniazid and streptomycin for the first 2 months
followed by Thiacetazone and Isoniazid for 10 months were taken as standard treatment [3, 9]. A
standardized treatment means that all patients in a defined group receive the same treatment
regimen regardless of where they are treated. Following the introduction of rifampicin in the
early 1970s, effective short-course chemotherapy that lasted for less than 12 months was
heralded. In 1982 with the augmented potency of isoniazid/rifampicin with pyrazinamide,
treatments regimens became reduced to 6-month course of triple-drug regimen as standard
therapy [1].
The Short-course regimens comprised of an initial, or bactericidal, phase called intensive that is
aimed to kill bacilli and make patients non infectious and a continuation, or sterilizing, phase
which eliminate persisting mycobacteria to prevent relapse [1, 3, 9]. To ensure patient adherence
to treatment and ultimately cure among patients, direct observation of treatment and provision of

8
fixed-drug-combination (FDC) products have been recommended that have led to launch of the
DOTS strategy [13]. Since then, WHO has been recommending treatment guideline for adoption
across countries. Accordingly, the latest WHO guideline recommends 2-month initial phase of
[Isoniazid(H), Rifampin (R), Pyrazinamide(Z) and Ethambutol(E) (2RHZE)] followed by a 4-
month continuation phase of RH(4RH) for the treatment of virtually all forms of new TB
patients in both adults and children [27].
Response to TB therapy should be monitored in order to facilitate cure, treatment completion,
identify, and manage adverse drug reactions. Hence, monitoring of clinical and/or bacteriologic
responses including weight monitoring, clinical symptoms, and bacteriologic responses through
sputum microscopy/culture has been recommended [1, 3, 27]. Finally, treatment outcomes has
been ascertained as per standard definitions issued by WHO that comprises of cure, treatment
complete, lost to follow-up, treatment failure, and death. The sum of those completed treatment
and cured constitute treatment success and the rest constitute poor or unsuccessful treatment
outcomes [27].
2.1.5. Distribution of tuberculosis cases and deaths
Tuberculosis has been recognized as a global problem and declared a global public health
emergency by WHO in 1993 at which time 7-8 million cases and 1.3-1.6 million deaths had been
reported each year [11, 81]. To date, TB still causes ill health and death among millions of
people each year. Globally, in 2015 10.4 million incident cases were estimated of TB of which
61% and 26% respectively occurred in Asia and African Region. The 30 high TB burden
countries accounted for 87% of all estimated incident cases worldwide. The estimated incident
cases corresponded to global average of 142 cases per 100 000 population that varied from
under 10 per 100 000 population in most high-income countries to 150–300 in most of the 30
high TB burden countries. In the same year, 6.4 million cases of TB were notified to national TB
programmes. Of those notified cases, 6.1million were incident cases (new and relapse).
Similarly, among the notified cases, 62% were males and 90% were adults [18].
Though short-course regimens of first-line drugs that can cure around 90% of TB cases have
been available for decades, TB is one of the top 10 causes of death worldwide, and caused more
deaths than HIV/AIDS. Globally, in 2015, about 1.4 million TB deaths were estimated between

9
HIV negative and an additional 0.39million deaths among HIV infected. About 84% of TB
deaths among HIV-negative people occurred in the African and South-East Asia those comprised
86% of the global deaths. The deaths among HIV negatives corresponded to 62% of deaths being
in men, 25% in women, and 13% in children. Globally, in 2015 the estimated number of TB
deaths among HIV-negative people was equivalent to 19 per 100 000 population, and 24 when
TB deaths among HIV-positive people were included. The death rate varied from less than one
TB death per 100 000 population in many high-income countries to more than 40 deaths per 100
000 population in most of the African Region and in five high TB burden countries in Asia [18].
In 2015, 30% of the 3.4 million new bacteriologically confirmed and previously treated TB cases
notified globally had had Drug Susceptibility Test (DST) for rifampicin, with coverage of 24%
for new TB patients and 53% for previously treated TB patients. Thus an estimated 340 000
cases among notified TB patients were MDR/RR-TB that constitute 3.9% of new and 21% of
previously treated cases. China, India, and the Russian constitute 45% of the global total cases of
MDR/RR-TB. There were about 250 000 deaths from MDR/RR-TB in 2015 [18].
Of the incident TB cases notified in 2015, 55% had a documented HIV test result of whom 11%
had HIV. TB patients with documented HIV test result were highest (81%) in the African Region
where the burden of HIV-associated TB is highest. Similarly, the proportion of TB cases co
infected with HIV was highest in countries of the African Region that exceeded 50% in parts of
southern Africa. Globally in 2015, 78% of those TB cases co infected with HIV were on
antiretroviral therapy (ART) [18].
2.2. Global strategies for the control of tuberculosis
Interventions for the control of TB date back to the pre-chemotherapy era where patients had
been segregated and provided with fresh air, surgical and nutritional interventions [1]. Since the
late 1940s that demarked the chemotherapy era, chemotherapies were discovered and brought
dramatic effects towards the control of the disease. Apparently, the first public health act for the
prevention of TB was the decree of Lucca, Italy in 1699 that required notification of cases of TB
by physicians [9]. Since then different localized efforts had been implemented in different
localities despite the widespread distribution of the disease. As a result, control of the disease
had seemed to be achieved in industrialized countries and attention for TB had ceased for
decades. Global efforts to control TB were initiated in 1991, when a World Health Assembly

10
(WHA) resolution recognized TB as a major global public health problem. Subsequently, in
1994, a global strategy, DOTS was launched to respond to the resurgence of TB in all areas of
the world [11, 13, 82].
2.2.1. Directly Observed Treatment Short course (DOTS)
The DOTS strategy was an internationally recommended strategy composed of five key
components namely government commitment; case detection by predominantly passive case-
finding; standardized short-course chemotherapy under direct observation of health workers,
regular drug supply; and monitoring and evaluation [13]. As part of the strategy, targets of
detecting 70% of new smear positive cases, and curing 85% of them by the year 2000 were
established and endorsed by the WHA resolution [11]. In the absence of HIV, achieving these
targets would have reduced the incidence rate by 11% and the death rate by 12% per year. But
without greater effort to control, the annual incidence of TB was expected to increase by 41%
per year between 1998 and 2020 [83]. Later in view of the slow progress in many high burden
countries, the targets were postponed to 2005. To alleviate impediments for the attainment of the
targets, the control framework was expanded through reinforcing the five elements of DOTS
which applies for HIV associated and drug resistant TB [12].
2.2.2. TB/HIV collaborative activities
Tuberculosis is the leading causes of HIV-related morbidity and mortality that accounts for about
a third of Acquired Immunodeficiency syndrome (AIDS) deaths worldwide. HIV is also the most
powerful known risk factor for the development of active and recurrent TB with annual risk
ranging from 5-15% [84, 85]. In response to the recognition of the influences of the two diseases
on one another, a need for unified health sector strategy was emphasized. Accordingly, the Stop
TB department and the department of HIV/AIDS of the WHO published an interim policy on
collaborative TB/HIV activities [84]. Later based on evidences from different studies and best
practices of programmatic implementation, policy on collaborative activities was designed [85].
The recommended activities were establishment and strengthening of mechanisms for delivering
integrated TB and HIV services; reduce the burden of TB on HIV and vice versa. To reduce
burden of TB on people infected with HIV, Intensified TB case-finding and high quality anti-
tuberculosis treatment, Isoniazid preventive therapy (IPT), early antiretroviral therapy (ART) and
TB Infection control in health-care facilities and congregate settings were recommended [85].
On the other hand, to reduce the burden of HIV in patients with presumptive and diagnosed TB,

11
provision of HIV testing and counseling, HIV prevention interventions, co-trimoxazole
preventive therapy (CPT) and ART were recommended [85]. Thus, between 2000 and 2015, TB
treatment alone averted an estimated 39 million deaths among HIV-negative people. Similarly,
TB treatment supported by ART averted an additional 9.6 million deaths among HIV-positive
people [18].
2.2.3. Stop TB strategy
The stop TB strategy was designed in 2005 [15] to realize the target of dramatic reduction of
global burden of TB by 2015 consistent with the Millennium Development Goals (MDGs) [86].
The strategy was designed to attain four major objectives namely to achieve universal access to
high-quality diagnosis and treatment by people with TB, to reduce the suffering and
socioeconomic burden associated with TB, to protect poor and vulnerable populations from TB,
TB/HIV and MDR-TB, to support the development of new tools and enable their timely and
effective use. The strategy both builds and expands the DOTS strategy to address remaining
constraints and challenges for the control of TB. The strategy had six principal components
namely pursue high-quality DOTS expansion and enhancement, address TB/HIV and MDR-TB
and other special challenges, contribute to health system strengthening, engage all care
providers, empower people with TB and communities and enable and promote research. The
strategy adopted MDG targets of halting TB incidence and death by 2015 compared to the 1990
levels [15].
2.2.4. Impacts of the TB control strategies
Cognizant with the implementation of the global strategies, progress have been made with
control of TB. The number of treatment cohorts treated with DOTS increased from one million
in 1995 to 2.6 million in 2011. Since 1995, 56 million were successfully treated that raised
treatment success rate from 57% in 1995 to 87% in 2011 [87]. Though the DOTS technical
package has improved overall treatment success, it had no effect on case detection [81]. In
addition, direct observation of treatment stipulated as pillar of the DOTS strategy, had not shown
significance difference in cure rates compared to self-administered treatment. On the other hand,
multiple visits to health care facility for the DOTS service pose tremendous burden including
financial and social stigma. Thus, adoption of patient centered TB care is worthwhile for proper
control of TB [88]. The proportion of TB patients who knew their HIV status improved from
40% in 2011 to 55% in 2015 globally but proportions as high as 81% was achieved in the

12
African region. On the other hand, coverage of ART among TB/HIV co infected patients
improved from 49% in 2011 to 78% in 2015 [18].
Assessment of MDG targets of TB control indicated that the target was achieved on a worldwide
basis, and in 16 of the 22 HBC. Globally, the TB mortality rate fell by 47% between 1990 and
2015. The target of a 50% reduction in TB mortality was met in four WHO regions; the
Americas, the Eastern Mediterranean, the South-East Asia, and the Western Pacific Region and
in 11 HBC. Similarly, TB prevalence fell by 42% between 1990 and 2015.The target of halting
the prevalence was achieved in three WHO regions – the Region of the Americas, the South-East
Asia Region and the Western Pacific Region and in nine TB HBC [18].
2.2.5. The End TB strategy
The 65th
WHA held in May 2012 called upon WHO to develop a new post-2015 TB strategy
and targets [89]. Thus strategy named end TB [16] consistent with the Sustainable Development
Goals (SDG) was designed and endorsed by member states at the 67th
WHA. The strategy has
ten components organized under three pillars and four underlying principles. The principles of
the strategy include government stewardship and accountability, strong coalition with civil
societies, protection, and promotion of human right, ethics, and equity, and adaptation of the
strategy and target at country level. The pillars of the strategy include integrated patient center
care and prevention, bold policies and supportive systems and intensified research and
innovation [16].
The integrated patient centered care and prevention pillar is composed of four components 1)
early diagnosis and universal drug susceptibility testing, systematic screening of contacts and
high risk groups,2) treat all people with TB including drug resistant with patient support,3)
TB/HIV collaborative activities and management of co-morbidities and 4) preventive treatment
of persons at high risk and vaccination against TB. Furthermore, the strategy comprised of
targets to be attained by 2035 categorized in to three milestones five years apart to each other
(2020, 2025 and 2030). Accordingly 95% in TB deaths, 90% in TB incidence equivalent to less
than 10cases per 100,000 population) reductions compared to levels in 2015 and no affected
families facing catastrophic costs due to TB by 2035 were set [16]. In line with the strategy, a
five years (2016-2020) global plan to end TB was set by stop TB partnership [90]. Thus, three
people-centered targets called the 90-(90)-90: reach 90% of all people who need TB treatment,

13
including 90% of people in key populations, and achieve at least 90% treatment success were set.
The plan further emphasized the need for paradigm shift: a change in the way we fight TB at
every level, in every community, in every health facility and in every country to end TB [90].
2.3. Tuberculosis control in Ethiopia
2.3.1. Ethiopia: the country
Ethiopia is located in Northeast Africa, commonly referred to as Horn of Africa, and is situated
east of Sudan, north of Kenya, south of Eritrea, west of Djibouti, and northeast of Somalia. The
country covers about 1.1 million Km2 area of land endowed with diversified topography, climate,
and more than ethnic groups‟ belonging to diverse religions. As per the projection of the 2007
census, total population of the country has reached 101.7 million in 2016 constituting second
populous in Africa. The male to female ratio is 1.01 and 55% of the population is above the age
of 15 years. The country is organized in to nine regional states and two city administrations those
comprised of many zones and woredas [91].
2.3.2. Healthcare delivery in Ethiopia
The current healthcare delivery in Ethiopia is organized in to three levels those comprised of
different healthcare facilities (Annex 2). The tiers of care include primary healthcare units,
secondary level, and tertiary level of care. The primary health care unit (PHCU) is expected to
provide basic preventive, promotive, curative, and rehabilitative healthcare for about 60000 to
100000 peoples in the catchment. The PHCU comprised of health posts, health centers, and a
primary hospital. The secondary level health care unit, general hospital is expected to render
healthcare services to about 1.5million peoples in the catchment. The tertiary hospitals or tertiary
level of care is expected to provide advanced curative services to about five million peoples in
the catchment. There were about 3564 health centers, 16480 health posts, and 241 hospitals
operating throughout the country. In 2016, there were 1.4 per 1000 population different types of
health workers operating across different health care facilities [26]. TB diagnosis and treatment
services are provided across all the tires of care. However, all health posts and few newly built
health centers provide mere observation of treatments of those patients diagnosed at hospitals
and health centers. Many preventive and few curative healthcare services including child immunization,
family planning, maternity, TB, malaria and HIV/AIDS treatments are provided for free [25] .
Healthcare delivery in Ethiopia is financed from variety of sources including the government
treasury, bilateral and multilateral donors, household out-of-pocket expenditures, international
14
and local nongovernmental organizations (NGOs), private employers, and insurance schemes
[92]. Cognizant of the under financing of healthcare in the country, government of Ethiopia
endorsed a health care financing strategy in 1998 [66]. The strategy envisioned a wide range of
reform initiatives including revenue retention and systematizing a fee-waiver system for the
poor, standardizing exemption services, setting and revising user fees, introducing a private wing
in public hospitals, outsourcing nonclinical services, and health insurance schemes. Thus in
2016, 10.4% of households were enrolled in community based health insurance [26]. Following
the different healthcare financing initiatives, overall healthcare expenditure in 2010/11 has
reached Birr 26.5 billion (US$1.6 billion) of which 34% were from household out of pocket
expenditure. Similarly, per-capita healthcare expenditure has reached Birr 334.81 (US$20.77) in
2010/11 which was far below the US$60 recommended by the WHO [92].
2.3.3. National tuberculosis control program
Tuberculosis had been recognized as a major public health problem in Ethiopia long ago. Efforts
to control TB began in the early 1960s with the establishment of TB centers and sanatoriums in
three major urban areas. Subsequently Central Office (CO) of the National Tuberculosis Control
Programme (NTCP) was established in 1976. In 1994, the National Tuberculosis and Leprosy
Control programmes (NTLCP) became integrated and organized under the co-ordination and
technical leadership of the CO. Later in June 2000, the NTLCP was accommodated under
Disease Prevention and Control Department, which was previously named Epidemiology /AIDS
Department. The former CO was then named Tuberculosis and Leprosy Control Team (TLCT)
and became fully integrated into the general health services by the end of 2001 [22, 93]. In 1999
a global standardized TB prevention and control strategy, DOTS, was piloted in Arsi and Bale
zones of the Oromia Region that subsequently scaled up throughout the country [22]. Later, the
country has been adopting different strategies and targets recommended by WHO, including
TB/HIV collaborative activities [85] and stop TB strategies [15] for which respective
implementation guidelines have been adopted [23].
Subsequent to the adoption of different global control strategies, progress has been made with
the control of TB. Accordingly case detection rate rose from 11% in 1995 to 64% in 2012 and
treatment success among new smear positive from 61% in 1995 to 89% in 2015. Treatment
cohorts registered have also shown improvement and rose from 5.1 thousand in 1995 to 91
thousand in 2011. Between 1995 and 2011, a total of 879 thousand new cases were treated [87].
As per the reports of the Ministry of Health, nearly 92% of hospitals and 95% of health centers
15
had been implementing DOTS in 2011. In addition, TB treatment follow-up had been started in
2100 health posts giving overall of 4577 public and 317 public–private mix DOTS facilities [94].
Despite achievements in global targets of TB control, TB remained among the major public
health problem in the country. TB accounts for 4th
and 6th
causes of death among females and
males respectively [26]. The first national TB prevalence survey in 2011 revealed smear positive
PTB prevalence of 108/100,000 of which 55% were detected at the time of survey [24]. In
2015, about 205,463 new cases [25] and 29,000 were estimated to occur in the country [18]
when 125,801 (61%) were notified to National TB control Program equivalent to 191 per
100,000people [25]. Of the notified TB cases in 2015, 77% had documented HIV test result of
whom 8% were positive for HIV. In the same year, of those HIV co infected TB cases, 79%
were on ART. In the same year a total of 25,000 deaths equivalent to 26 per 100,000 people were
reported among HIV negatives and 3900 deaths equivalent to four per 100, 0000 among HIV
positives were reported in Ethiopia. Thus, Ethiopia had been listed among the 22 and lately
among 14 TB, TB/HIV, and MDR TB HBC. In 2015, a total of US$ 81million was required for
prevention and control of TB in Ethiopia of which 11% was from domestic source, 51%
international aid and 38% unfunded [18].
2.3.4. Tuberculosis control in Southern Nation Nationalities and Peoples Region
The Southern Nation Nationalities Region (SNNPR) is one of the nine regions in Ethiopia
constituting 118,000sq.km and 20% of the national population. In the Region, TB is 4th
cause of
total admission and 3rd
cause of inpatient deaths [95]. The nationally adopted TB control
strategy, DOTS, was piloted in four health facilities in four zones as a vertical program in 1995.
Later, the program became integrated into the general health service and scaled up to all zones
and health facilities. Thus in 2011 about 601 health facilities were providing DOTS equivalent to
DOTS coverage of 96% (hospitals and health centers). The number of TB cases registered for
treatment has increased from 8,339 in 1997 to 24,772 in 2012 of which about 62% are smear
positive [95, 96].
A retrospective trend analysis of the DOTS implementation in pilot zone of the region reported
increased proportion of patients treated with short course chemotherapy (7% to 97%), reduced
default rate (38% to 18%) and increased treatment success (38% to 73%) [97]. Similarly,
analyses of ten years experiences of TB control showed, 136,572 cases were registered for
treatment between 1995 and 2004, of which 47% were smear-positive, 25% were smear-negative

16
and 28% were extra-pulmonary tuberculosis (EPTB). As a result, the smear-positive case
notification rate has increased from 45 to 143 per 100,000 populations between 1995 and 2004.
In same time, the treatment success rate rose from 53% to 85% whereas the default and failure
rates decreased from (26% to 6%) and (7% to 1%) respectively [98].
2.4. Challenges of tuberculosis control
2.4.1. Delays to seek care and treatment
Delays to initiate care seeking and treatment for TB can happen at home where patients are
unable or do not want to seek care for their TB illness or at the health facility where longer time
is spent for diagnoses and treatment initiation. The delay at home constitutes patient delay and
that spent at health facilities represent health system or provider delays. The sum of the patient
and provider delays or time elapsed since onset of illness to treatment initiation constitutes total
delay. So far, an optimum cutoff for the delays at home and health system has not yet
established. Thus, most studies across the globe describe the delays using median time spent
between onsets of illness to first consultation of formal healthcare [48], diagnoses, and treatment
initiation. There were also studies described the delays using time cutoff defined by the authors.
Accordingly, time spans ranging from 1 to 4 weeks for patient delay [34, 39, 99], and 3-28 days
[41, 99, 100] for provider delay were used to dichotomize the delays.
The different forms of delays prevail across the globe. A systematic review in high and low
income countries reported median total delay, patient delay and health system delay of 25–185
days, 4.9–162 days and 2–87 days respectively [101]. Another review also indicated a total
diagnostic delay of 60–90 days [44]. The level of delays vary across different settings with
median total delays of 8 (0-45), 18 (0-191), 35 (21-56), 35(21-56), 21 (7-49) days at referral
hospital, district hospital, health center, health post/clinic and community respectively [102,
103]. A multicountry study in the Eastern Mediterranean Region showed patient delay ranged
from a mean of 9.9 days in Pakistan to 69 days in Somalia and system delay ranged from 5 days
in Iraq to 90.7 days in Pakistan [104]. A cross-sectional study in an intermediate TB incidence
setting also showed average patient's and total delays of 44 and 103 days respectively [105].
Studies reported 25% of the patents had delayed for longer than 42 days in China [106] and 30
days in Nepal [107] where 67.4% of the patients delayed the consultation beyond 30days.

17
Cross-sectional studies in African countries revealed median patient delay of 30 days in Angola
[34] and 4 weeks in Kamapla, Uganda [38]. Similarly provider delays of 7days in Angola [34]
4weeks in Uganda [38] were reported. The study in Uganda further reported 24.1% of the
patients had long total delay of >14 weeks and 29.3% had long health system delay of >6 weeks
[38]. Another study in Uganda reported that patients present to drug shops or pharmacies
(39.4%) and private clinics (36.8%) more commonly than government health units (14%) [35].
Findings from different parts of Ethiopia have also reported longer delays to initiate treatment for
TB with median patient delay of 20- 90 days. Median patient delay of 30 and 90 days in Tigrai,
and Amhara respectively, where 53 % of the patients had delayed for ≥30 days [39-41], 60
days in Addis Ababa [42], 20-63days in Afar, where 96% of the patients delayed for more than
21 days [43, 108] were reported. On the other hand, health service median delays of 6-34days
were also reported ; 6days in Addis Ababa [42], 9days in Tigrai region [39], 21days in Amhara
where only 9% of the patients were put on treatment within one month of the onset of their
illness [41], and 34 days in Afar [43].
2.4.1.1. Factors associated with delays in seeking care and treatment
Studies have indicated that factors associated with patient delays are attributed to the patients‟
demographic and socioeconomic characteristics. A systematic review reported low income, rural
life, unemployment, old age and female sex were consistently associated with patient delay [59].
Studies in Ethiopia and elsewhere have also reported rural residence [40, 48], illiteracy [40],
subsistence farming [35], older age [99] as risk factors for patient delay. A study in Amazon
showed that male gender and education less than secondary were associated with a 48% and
44% higher risks of longer patient delay respectively [50]. Similarly, a study in Malawi revealed
social role construction for men hinder males from seeking cares early [109]. However, studies
in Uganda [38] and Nigeria [99] respectively demonstrated female and male genders were
independent predictors of system delay. In contrast, a study in Addis Ababa reported no
significant difference in delay among socio-demographic factors [42].
Patient delays are also associated with the characteristics of the illness and other co-morbid
conditions. Accordingly, coexistence of other lung diseases, negative sputum smear, extra
pulmonary TB[48, 110], extensive radiologic abnormalities, absence of haemoptysis [106, 111]
being smear positive [40, 111] and severity of illness at first presentation [43] are associated with
patient delay. Studies also demonstrated that absence of cough, weight loss [112], fever, night

18
sweats and auscultation findings, presence of diabetes mellitus and cough as the only presenting
symptom were significantly associated with patient's delay [105, 111].
HIV co infection had been reported to delay care seeking and retention in care. A systematic
review reported contradicting reports on the association between HIV and delays. Patients with
HIV sought a diagnosis for TB earlier than HIV-negative or unknown status [52]. In contrary,
high awareness of AIDS, fear of learning their HIV status and a positive HIV test result or the
stigma of being perceived to be HIV positive were reported to have longer delay [52, 113].
Patient perceptions towards the TB illness and their life styles were also reported to be associated
with longer delays to seek care for TB. Studies have demonstrated that low awareness of TB
[114], self or prescribed medication [112, 115, 116], lack of knowledge and mistrust of the TB
control programme and stigma as risk factors of patient delay [44, 114, 117]. It was also
reported that significantly longer delay of TB diagnosis among smokers [118] and those perceive
smoking as a cause of TB [35, 38]. Furthermore patients who believe and knew TB is curable
[35, 50] consume alcohol daily [35, 38] and perceive that tuberculosis was common [50] had
longer delays. Studies in Ethiopia have also showed lack of awareness/misperceptions of causes
of TB [40] and seeking care at out of DOTS facilities (holy water, traditional healer, private
practitioners and drug vendors or non formal providers [40, 43], self treatment [41] were risk
factors for the delay.
Studies have also reported that health system characteristics contribute to the patient delay.
Accordingly, initial visit to government low-level healthcare facilities, private practitioner [112],
or traditional healer [39] and longer walking distance/time to public facilities, service fee for TB
care[43, 104], and profit-seeking behavior of providers[114] were reported as independent risk
factors for patient delay. Studies in China [119] and Uganda [38] respectively showed 17-30%
and 91% patients made more than 6 and median of 4 visits before diagnosis. Thus study in
Zimbabwe [116] indicated having more than four visits to healthcare facilities before diagnosis
predict longer provider delay.
Provider or system delays for diagnoses and initiation of treatment are also attributed to patient,
disease and provider related factors. Systematic reviews showed low health care coverage,
patient expenditures and entry into the health system by consulting a traditional healer or a non-
skilled professional, long travel time for the return visit and longer waiting time to be
19
consistently associated with system delay [52, 59]. Studies in China indicated differences in
districts, lack of knowledge and mistrust of the TB control programme, service fee for tests and
treatments other than TB and profit seeking behavior of providers were independent predictors
for provider delay [106, 114, 120]. Studies in Hong Kong and Taiwan attributed higher provider
delay to patients and system characteristics including patient age older than 60 years, absence of
initial sputum and chest X-ray examination, absence of haemoptysis and negative smear [111,
120]. On the other hand, diagnosis with Gene xpert predicted lower treatment delay among
patients in Zimbabwe [116].
2.4.2. Cost of seeking care and treatment for TB
Economic burden of diseases can be ascertained by cost-of-illness (COI) studies that estimate
the amount that could potentially be saved or gained if a disease were to be eradicated [121,
122]. It involves combining an epidemiological database with financial information to generate
an amount valued in monetary terms about the costs of a particular disease [123]. Thus the aim
of COI studies is to identify, measure, value, and sum the costs of a particular illness to reveal its
economic burden across different bearers [124]. Illness-related costs incurred by patients
constitute a severe economic burden for patients, households, the health system, and nation
especially in low-income countries. High costs of illness lead to impoverishments that impair
affordability and equitable access to health care [121, 122].
The costs of illness entail direct or explicit cost, indirect or implicit cost and intangible costs. The
direct cost constitutes out of pocket expenditures for medical care (prevention, seeking care,
diagnosis, treatment, and rehabilitation, etc) and nonmedical expenditures (transportation,
household expenditures, relocating, property losses, and informal cares). The indirect or implicit
cost refers to the forgone income due to productivity losses and subsequent income loss due to
morbidity and mortality, borne by the individual, family, society, or the employer. The lost
productivity or income could be due to inability to work because of the illness, loss of time due
to visits to health facilities, or loss of job. Finally, the intangible costs are those cost of pain,
grief, anxiety, and suffering which measures the psychological dimensions of illness. The
different categories of the costs are usually further stratified in to time periods when the costs
were incurred as those incurred prior to diagnosis, during diagnosis (prior to treatment) and costs
incurred during treatment or rehabilitation (post diagnosis) [56, 125, 126].
20
In 2015, globally US$6.6billion budget were available for TB prevention, diagnosis and
treatment in low and middle-income countries. Of the available budget globally in 2015, 84%
were from domestic source with huge variation across countries. International donation
accounted for 75% in 25HBC other than Brazil, Russia, India, China and South Africa (BRICS),
87% in low-income countries and 60% in lower middle-income countries [18]. An ecological
study using mixed effects and generalized estimating equation models in the former 22 HBCs
showed an increased in case detection, HIV testing, drug susceptibility testing, case notification
and decrease in death of smear positive with increase in percent of NTP budget [127].
In Ethiopia, US$81million was available for TB prevention, diagnosis, and treatment of which
11% and 51% funded from domestic and international sources respectively. The rest 38% of the
budget was unfunded [18]. The Ethiopian national health account (NHA) conducted in 2007/08
reported; a total of US$47.8 million was spent on TB prevention, diagnosis, and treatment.
Households out of pocket expenditure were the major sources accounted for 63% of the total
expenses. International donors and government respectively funded the rest 22% and 14%
expenses. Of the resources spent, private for-profit hospitals, received 35% followed by
providers and mangers of public health programs (22%). About 62% of TB funds were used for
TB outpatient care, followed by other TB prevention services (17%) [66].
Although governments have been implementing „free TB service policy', TB care is posing
tremendous financial burden in terms of time and productivity loss to both patients and their
households [128, 129]. A systematic review in European Union countries revealed total average
cost per-TB case of €10,282 for drug-susceptible TB, €57 213 for MDR-TB and €170,744 for
XDR-TB. A total of 103,104 disability-adjusted life years were caused by 71,964 cases notified
in 2012 in the European union equivalent to €5 361, 408 000 [130]. Similarly, a review from
sub-Saharan Africa revealed costs per TB case varied from less than I$1 to almost I$600 or from
a small fraction of mean monthly income for average annual income earners to over 10 times
average annual income for low income earners [131]. A systematic review from middle and low-
income countries also showed mean total costs ranged from U$55 to U$8198 for all types of TB,
with a weighted average of US$847. On average, 20% of the total cost was due to direct medical
costs, 20% to direct non-medical costs, and 60% to income loss. Half of the total cost was
incurred before TB treatment. The total cost was equivalent to 58% of reported annual individual
and 39% of reported household income [132].

21
Several studies have also reported high costs of TB across the different TB care pathways. A
total average costs per episode of TB illness of US$1053 of which US$292, US$338 and
US$422 were encountered before the start of treatment, during intensive phase and in
continuation phase, respectively were reported in the former Soviet Union [133]. Median direct
cost associated with TB of US$101 that represent 2.8 months of household income in
Burkinafaso [134] and US$ 183 in Benin where 38% and 29% of the costs were spent during
pre-diagnosis and intensive phase treatment respectively [135]. In Tigrai, northern Ethiopia,
median cost of seeking care of US$27 per patient [65] were also reported.
Patients incur costs for TB care at the different stages of the diseases care pathway including,
pre- diagnoses, diagnoses and treatment. A systematic review in Africa reported mean patient
pre-diagnostic costs varied between US$36 and U$196, corresponding to 10.4% and 35% of
their annual income respectively. The same review reported average patient treatment costs
ranged between US$3 and US$662, corresponding to 0.2-30% of their annual income [136]. A
synthesis of studies have also reported that low income patients, pay a total of US$ 149 to 724
for medical costs for the treatment course that represent 42% to 119% of the annual household
income [60]. A cross-sectional study in Nigeria showed that median direct pre-
diagnosis/diagnosis and indirect post-diagnostic/treatment costs of US$49 and US$416 per
patient respectively. The indirect pre-diagnostic and treatment cost constitutes 79% of the total
patient costs of US$528 [63]. A study in Burkinafaso also indicated that 72%, 95%, 68% and
50% patients respectively have incurred for pre-diagnosis, diagnosis, intensive phase and
continuation phase treatments [134].
TB care also pose financial burden on households. A systematic review in Africa indicated total
household treatment costs ranging between US$26 and US$662, accounting for 2.9-9.3% of
annual household income [136]. Studies also reported that the median total cost of TB care per
household was US$592; corresponding to 37% of median annual household income [63]. Further
median costs for seeking care per patient incurred by escort of US$3 [65]. Following an episode
of TB, household income reduced significantly and the proportion of households classified as
poor increased from 54% to 79% [63]. On the other hand, communities perceived as high as two
to five times higher costs than actually incurred cost for TB care [58].
Studies have also reported that health systems also incur cost for TB care that differs across the
type of TB cases with mean cost per patient of US$ 34.0 and US$ 38.8 for pulmonary and extra

22
pulmonary TB treatment respectively. Of the costs, drug treatment for pulmonary and extra
pulmonary TB represented 59.3% and 77.9% of total health service cost respectively [64]. A
study in Ethiopia reported median costs of US$3 per patient was incurred by the public health
system [65].
Patient and households use different coping mechanisms for the financial burden posed by the
TB illness and care. A systematic review in Africa showed that 18-61% of patients received
financial assistance from outside their household to cope with the cost of TB care [136]. A study
in Nigeria reported that 47%, 9% and 32% of patients and households borrowed money, sold
asset and both borrowed and sold asset to cope with cost of care [63]. In Ethiopia, illness costs
coping strategies among rural households included waiver privileges, selling household assets,
using savings and division of labor among household members to compensate for the loss of
working time due to sickness. Thus, the study indicated financial and time costs of illness
seemed to significantly contribute to the impoverishment of rural households [137]. A reduction
of US$1.95 to US$0.9 and US$4.28 to US$3.24 median patients‟ income and household
expenditure respectively compared to the pre illness time were also reported [138].
Different factors are reported to increase the amount of cost incurred by patients, households,
and health systems. A study in Yemen reported differences in mean costs for pulmonary
(US$108.4) and extra pulmonary (US$ 328) TB treatments where laboratory and X-ray costs
account about (55.5%) of the EPTB treatment [64]. Moreover significantly higher median out-of-
pocket costs for hospitalized (US$166.1) and ambulatory (US$94.16) cares, before (US$35.23),
during (US$27.12) and after diagnosis (US$23.43) were reported [139]. A study in Ethiopia have
showed that the total cost of diagnoses per patient was higher for women, rural residents; those
who received government food for work support, patients with smear negative pulmonary
tuberculosis patients and being diagnosed in places other than public diagnostic centers [65].
Being female and patient delays in seeking care in Zambia [57] and consulting private doctor in
Bolivian city of Cochabamba [140] revealed as significant predictors of total patient cost. A
study in Nigeria also reported no statistical significance association between total out-of-pocket
spending and HIV status [139].
Health facility based treatment has been reported to incur higher costs compared to community-
based treatments. A prospective cohort study in Sidama, southern Ethiopia showed community-
based treatment reduced the total cost of care and successful treatment of a smear-positive
23
patient costs (US$61.7) which is 39% lower compared to the treatment at health facility
(U$158.9) [67]. A study in Zambia also showed treatment costs incurred by patients on the
clinic-based DOTS were more than three times greater than those incurred on the self-
administered treatment strategy [57].
Cost of additional drugs and tests for adjunctive therapies during diagnoses and treatment of TB
were reported to increase out-of-pocket expenditures. Studies in China revealed that patients
charge per visit which amounts on average about 40 US dollars and additional drugs and tests
expenditure [141] and repeated outpatient visits before diagnosis, over-prescription of drugs and
prolonged treatments cost China [58] were reasons for high cost. Studies also indicated that high
out-of-pocket costs and productivity losses are associated with hospitalization, adverse drug
reactions, cost of drugs to 'protect' the liver, cost of diagnostic delay [128], MDR and XDR TBs
those incur [62]. A study in South Africa revealed that per patient cost of care for XDR-TB per
patient US$26,392, four times higher than MDR-TB (US$6772), and 103 times greater than
drug-sensitive TB (US$257). As a result drug resistant TB consume about 32% of the total
estimated national TB budget despite the fact that they constitute only 2.2% of the case burden
[62]. Studies have shown that financial interventions including financing TB programs improved
TB controls programs.
2.4.3. Unsuccessful treatment outcomes
The ultimate goal of any TB control programs is to reduce morbidity and mortality among
patients and stop transmission through curing the infectious cases [9]. As a result, treatment of
TB is not only treating an individual patient, rather it is a public health intervention. To this end,
a treatment outcome of patient is crucial in ensuring reduced patient morbidity and transmission
to others. TB treatment outcomes have been ascertained based on standard definitions issued by
WHO. Thus outcomes of TB patients fall in to either cure, treatment complete, failure, death and
lost to follow-up [23, 27, 89]. The cure and treatment completion rates constitute treatment
success that has been taken among indicators of TB control programs. The other outcomes;
death, lost to follow-up and treatment failure constitute unsuccessful or poor or unfavorable
outcome. The treatment outcomes are associated with variety of patient, disease and health
system related factors.

24
2.4.3.1. Treatment regimen and outcomes
Treatment outcomes of TB patients are dependent on adherence of health care provider to the
standard treatment and patient to the prescribed anti TB therapy. Standardized anti-TB treatment
regimens comprise of combinations of different drugs across the phases of treatment (intensive
and continuation) [27]. The level of adherence to the standardized therapy is affected by variety
of factors including, demographic, economic, patient-related factors, therapy-related factors,
health care team and system-related factors [142]. Throughout the history of TB treatment,
introduction of rifampicin has impacted in shortening of treatment duration and better outcomes
[143]. Introduction of rifampicin for the continuation phase treatment among adults reduced
treatment length from eight to six month [27].
A systematic review with meta analyses showed regimens utilizing rifampicin for only the first
1-2 months had significantly higher rates of failure, relapse, and acquired drug resistance, as
compared to regimens that used for 6 months [31]. A study in Nigeria, reported significantly
higher treatment success (85.2% vs. 77.8%) among patients treated with 4RH and 6EH
continuation phase respectively. Thus, defaulting was significantly more frequent in patients who
received 6EH (14.3%) vs. 4RH (5.5%). However proportion of treatment failure was not
significantly different among the 6EH and 4RH continuation phase treatments [144]. In contrast
a study from Uganda reported significantly lower failure/relapse among 4RH (5.2%) compared
to 6EH (10.4%) continuation phase treatment for those HIV negatives [30]. The study further
reported (12.4% vs 13.7% ) relapse/failure among HIV positive respectively among patients
treated with 4RH and 6EH during the continuation phase. Furthermore, significantly lower
mortality 8.8% among 4RH and 13.3% among 6EH was predicted. Lastly an average treatment
cost per patient was predicted at $26.07 for 6HE and $23.64 for 4RH [30].
2.4.3.2. Delayed TB treatment and patient outcome
Delays to diagnosis and treatment of TB result in more serious illness, increased length of
infectiousness and poor treatment outcomes including mortality and drug resistance [34, 53, 54].
A cohort study in Amhara region, northern Ethiopia showed patients with total delay of > 60
days were more likely to have unfavorable TB treatment outcome compared to those with total
delay of<=60 days [145]. A case control study in public hospital in Johannesburg, South Africa
attributed high mortality among TB patients in the first weeks of admission to late presentation
of cases [146]. Similarly a study in China showed patient delay of more than 30days was risk

25
factor for non cure among TB patients on treatment [54]. In contrast, a study in Tel Aviv
reported no association between treatment success and delay in treatment initiation [55].
2.4.3.3. HIV/AIDS and other co-morbidities as predictors of outcome
HIV has been reported to be a major risk factor for occurrence and poor treatment outcomes of
TB [147-150]. Studies have reported that HIV co infection independent predict unsuccessful TB
outcomes [151] including low cure, higher death [152] and lost to follow-up [153]. Compared to
HIV negative, HIV positive TB patients had more than 13 times higher 10 year case fatality [8].
A prospective cohort study in Nigeria, reported significantly lower cure and higher mortality in
HIV infected compared with non-HIV infected TB patients. However, there was no significance
difference with lost to follow-up from treatment and treatment failures across the HIV status
[154]. A retrospective cohort study in Hawassa, Southern Ethiopia [155] reported lower
survival among TB HIV co infected patients.
The risk of death among HIV co-infected TB patients had been reduced by use of ART and
prophylactic therapies for other opportunistic infections. An observational study among HIV
infected TB patients in Thailand showed lower risk of death among those treated with ART
CPT and fluconazole therapy [156]. However, a study from Thailand reported no association
between CPT and death among TB/HIV co infected patients [157]. On the other hand ,the risk of
death among HIV co infected TB cases increased with hospitalization at enrollment and low
CD4 cell count [157] and the longer that ART was delayed during TB treatment [156].
2.4.3.4. Patient Clinical conditions and sociodemographic factors
Unsuccessful TB treatment outcomes are also associated with patient clinical condition, and the
type of TB. Studies conducted in different settings reported that advanced chest X-ray findings
[151] and lack of appetite as an initial symptom of TB disease [158] as independent predictors
of unsuccessful treatment outcomes. Studies also revealed sputum smear positivity at enrollment
[159] and being on retreatment patient category [24] were significantly associated with death
during treatment. Moreover, remaining severely underweight or moving to a lower Body Mass
Index(BMI) category while on treatment [160] or body weight <35Kg at initiation of treatment
[24] predicted death among TB patients on treatment. On the other hand, Patients gained weight
after 2 months of treatment had a significantly smaller risk of an unsuccessful treatment outcome
compared to those lost their pretreatment weight [161, 162].
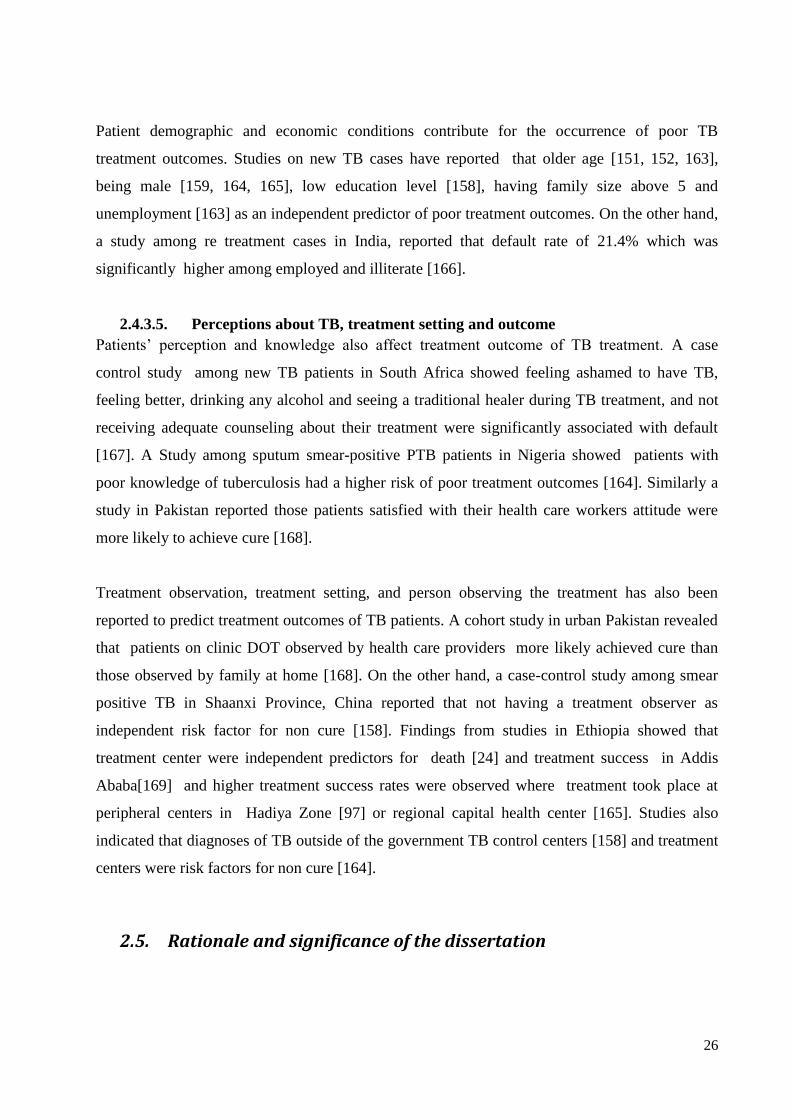
26
Patient demographic and economic conditions contribute for the occurrence of poor TB
treatment outcomes. Studies on new TB cases have reported that older age [151, 152, 163],
being male [159, 164, 165], low education level [158], having family size above 5 and
unemployment [163] as an independent predictor of poor treatment outcomes. On the other hand,
a study among re treatment cases in India, reported that default rate of 21.4% which was
significantly higher among employed and illiterate [166].
2.4.3.5. Perceptions about TB, treatment setting and outcome
Patients‟ perception and knowledge also affect treatment outcome of TB treatment. A case
control study among new TB patients in South Africa showed feeling ashamed to have TB,
feeling better, drinking any alcohol and seeing a traditional healer during TB treatment, and not
receiving adequate counseling about their treatment were significantly associated with default
[167]. A Study among sputum smear-positive PTB patients in Nigeria showed patients with
poor knowledge of tuberculosis had a higher risk of poor treatment outcomes [164]. Similarly a
study in Pakistan reported those patients satisfied with their health care workers attitude were
more likely to achieve cure [168].
Treatment observation, treatment setting, and person observing the treatment has also been
reported to predict treatment outcomes of TB patients. A cohort study in urban Pakistan revealed
that patients on clinic DOT observed by health care providers more likely achieved cure than
those observed by family at home [168]. On the other hand, a case-control study among smear
positive TB in Shaanxi Province, China reported that not having a treatment observer as
independent risk factor for non cure [158]. Findings from studies in Ethiopia showed that
treatment center were independent predictors for death [24] and treatment success in Addis
Ababa[169] and higher treatment success rates were observed where treatment took place at
peripheral centers in Hadiya Zone [97] or regional capital health center [165]. Studies also
indicated that diagnoses of TB outside of the government TB control centers [158] and treatment
centers were risk factors for non cure [164].
2.5. Rationale and significance of the dissertation

27
Though global strategies are relevant, investigation of local operational challenges is highly
required in order to adapt to the local settings. Hence, local operational studies have been
recommended and taken as a pillar for the different TB control strategies designed to date [89,
170]. Ethiopia has adopted treatment regimen change that recommended use of rifampcin
throughout the six months treatment period. However, effect of the regimen change on treatment
outcomes has not yet been well studied.
Delays to TB treatment prolong disease transmission, worsen illness, and increase cost of care
those result in poor outcome among patients. Enabling achievement of high cure rates help to
reduce transmission and attract the great majority of existing cases. Hence, it is imperative to
have evidences on the patterns of delay and the consequences on cost of care and outcomes of
among patients. The existing studies are limited to only few of the dimensions, despite the
multifaceted and interlinked dimensions of the TB burden (humanitarian, public and economic).
Specifically studies linking delay, cost, and subsequent outcomes among patients are limited in
Ethiopian setting. Consequently comprehensive evidences on humanitarian, public and economic
burdens those pose tremendous challenges on the control of the disease are limited in Ethiopia.
The study generated evidences on magnitude and predictors of treatment delays along with the
association between delay and outcomes. Moreover, predictors of cost incurred by patients
across the treatment pathways were assessed. Overall, the dissertation generated comprehensive
evidences on the humanitarian, public and economic aspects of TB disease. So, the evidences
support design of multidimensional interventions required to realize the targets of ending TB.
The evidences generated are important inputs to policy, program, practice, and future research.
The unacceptable prolonged patient and provider delays imply for wide spread transmission of
the TB illness to community at large and undesired outcomes to the patients. The delay
potentially hampers an ambitious target of reducing 50% incidence and 75% mortality of TB by
2025. Hence, the evidence on magnitude of delays and their predictors are important inputs for
policy and program actions targeting reduction of the delay involving patients, informal care
providers, community, and healthcare providers (health system). Similarly, an ambitious target
of no TB affected families to face catastrophic costs by 2025 has been set globally and adopted
by the country. Evidences on amount of patient costs and their predictors will be inputs for
designing financial protection mechanisms that ultimately supports the national and local
programs targeted to elimination of costs posed by TB illness to the patient and households.
28
Moreover, the dissertation will be a baseline for future research needs on patient and provider
delays, effective and efficient strategies to reduce delays to treatment and implications of the
patient cost to the household impoverishment.
2.6. Conceptual framework of the study
To better understand the problem under study and guide the analyses of findings, a conceptual
framework (Figure 1) was devised based on findings of literatures. The framework portrays
factors underlying time delays to anti-TB treatment initiation, patient cost of care and treatment
outcomes. Thus, it explains the interdependence of the time delays to initiate treatment, cost of
care and ultimate treatment outcome. The delay to anti-TB treatment commencement was
affected by patient, health system and disease attributes those ultimately predict the cost of care
and outcomes. On the other hand, treatment outcomes of TB patients were also predicted by
treatment regimen and duration. Finally, the conceptual framework indicated how each papers of
the dissertation were linked to the aspects of the framework.
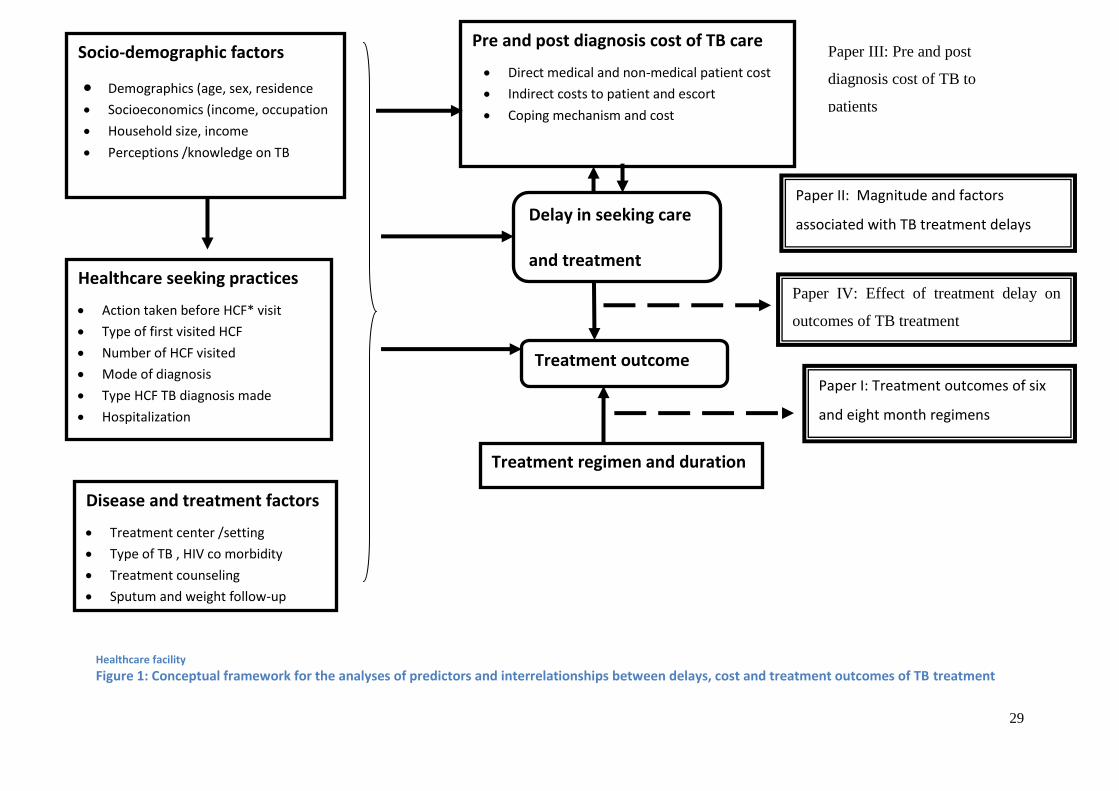
29
* Healthcare facility
Figure 1: Conceptual framework for the analyses of predictors and interrelationships between delays, cost and treatment outcomes of TB treatment
Pre and post diagnosis cost of TB care
Direct medical and non-medical patient cost
Indirect costs to patient and escort
Coping mechanism and cost
Socio-demographic factors
Demographics (age, sex, residence Socioeconomics (income, occupation
Household size, income
Perceptions /knowledge on TB
Paper III: Pre and post
diagnosis cost of TB to
patients
Healthcare seeking practices
Action taken before HCF* visit
Type of first visited HCF
Number of HCF visited
Mode of diagnosis
Type HCF TB diagnosis made
Hospitalization
Delay in seeking care
and treatment
Paper II: Magnitude and factors
associated with TB treatment delays
Paper IV: Effect of treatment delay on
outcomes of TB treatment
Treatment outcome
Disease and treatment factors
Treatment center /setting
Type of TB , HIV co morbidity
Treatment counseling
Sputum and weight follow-up
Paper I: Treatment outcomes of six
and eight month regimens
Treatment regimen and duration

30
3. Research questions
1. Is there a difference in treatment success among new TB cases treated with six compared
with eight-month treatment regimens?
2. How long do TB patients elapse to initiate care seeking and treatment for TB?
3. What factors are associated with time delays to initiate care seeking and treatment?
4. How much do seeking care, diagnosis, and treatment of TB cost to patients?
5. What is the effect of treatment delays on treatment outcomes of TB patients?
4. Objectives of the dissertation
4.1. General objective
The general aim of the study was to assess treatment delays, cost, and outcomes of TB in
districts of Southwestern Ethiopia.
4.2. Specific objectives
1. To compare outcomes of six and eight month treatment regimens of new TB cases (Paper I)
2. To assess magnitude and associated factors with TB treatment delay (Paper II)
3. To determine pre and post diagnosis cost of TB to patients (Paper III)
4. To evaluate effects of treatment delay on treatment outcomes of TB patients (Paper IV)

31
5. Methods
5.1. Study area and setting
The study was conducted in three zones of Southern Nation Nationalities and Peoples Region
(SNNPR) one of the nine regions in Ethiopia. As per the projections by Central Statistical
Agency (CSA) for 2014 [91], the region has a total population of 17,837,005 and it constitutes the
third populous Region among nine Regions and two city administrations in Ethiopia. The Region is
a home for more than 56 ethnic groups and located in the southern and southwestern part of the
country. The Region is organized in to 15 zones and four special woredas. The potential health
service coverage of the Region in 2011 was estimated to be 93%, but actual utilization, doesn‟t
exceed 50% [96]. In the same year, 96% of the health facilities (22 hospitals and 632 health
centres) were providing TB DOTS [96].
The three study Zones, Bench Maji, Kaffa, and Sheka are located at the southwestern border of
the Ethiopia (Figure 2) bordering South Sudan to the west. As per the projection by CSA for the
year 2014 [91] the zones harbor 2,064,102 inhabitants composed of almost all ethnic groups in
the country. The zones are known for their coffee and tea plantations and gold mining those
deploy peoples from almost all parts of the country. The zones are organized in to four town
administrations and more than 26 woredas comprised of many kebeles. During the study period,
the zones had one hospital each and more than 65 functional health centers in all the three zones.
All of the three hospitals and health centers are providing DOTS of which the three hospitals and
27 health centers were providing TB/HIV collaborative activities [96].
Diagnosis and treatment of TB across the country is being provided based on an adopted
national guideline that describe diagnostic and treatment standards [23]. Thus, diagnosis of TB is
made using sputum smear microscopy and clinical signs. Treatment regimens on the other hand
depend on type of TB, age, and other conditions. Accordingly, all new adult cases of TB had
been treated for eight months with combination of Ethambutol(E), Rifampicin(R),Isoniazid(H)
and pyrazinamide(Z) for first two months (2ERHZ) followed by Ethambutol and Isoniazid
combinations for six months (6HE). However, as of 2011, the continuation phase regimen for
new adult cases has been changed to four months (4RH) reducing total duration to six months.

32
Figure 2: Map of the study area showing region and zones where the study was conducted
5.2. Study designs and period
Both cross-sectional and longitudinal study designs were employed to answer the research
questions. Thus for paper I, comparative cross-sectional study design was used to compare
outcomes of TB cases treated with the eight and six months regimen (before and after
introduction of six months regimen). For paper II, pathways to anti-TB treatment initiation were
described using cross sectional design so that magnitude of delays to treatment initiation was
determined. For paper III, a longitudinal design was used to determine pre-and post-TB
diagnosis costs incurred by patients from onset of illness through treatment. Finally, for paper
IV, a follow-up study among those patients surveyed for determination of time delays was
employed to ascertain effect of treatment delays on outcomes (Figure 3). Hence, patients were
followed until earliest treatment outcome was observed.
The whole study project was conducted from January 2015 through June 2016.
Bench Maji, Kaffa
and Sheka zones
Ethiopia
SNNPR
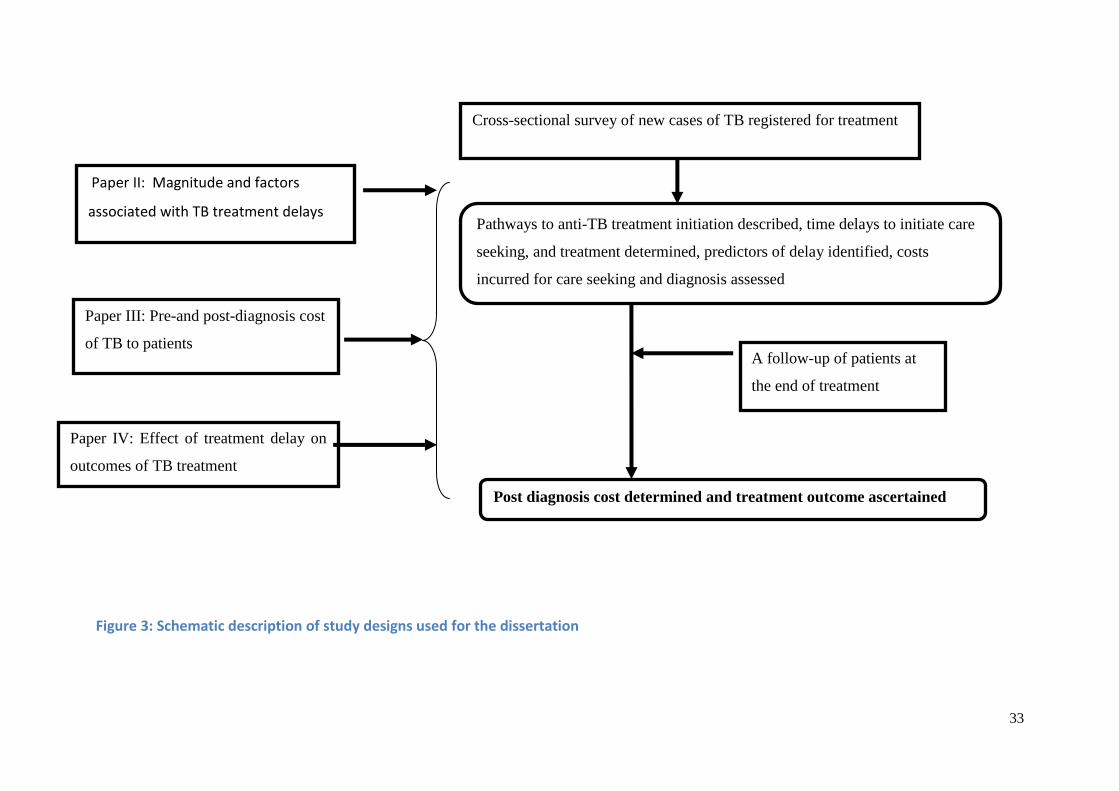
33
Figure 3: Schematic description of study designs used for the dissertation
Cross-sectional survey of new cases of TB registered for treatment
Paper II: Magnitude and factors
associated with TB treatment delays Pathways to anti-TB treatment initiation described, time delays to initiate care
seeking, and treatment determined, predictors of delay identified, costs
incurred for care seeking and diagnosis assessed
A follow-up of patients at
the end of treatment
Paper III: Pre-and post-diagnosis cost
of TB to patients
Paper IV: Effect of treatment delay on
outcomes of TB treatment
Post diagnosis cost determined and treatment outcome ascertained

34
5.3. Study population and sampling
5.3.1. Source and study population
For paper I, that compared outcomes of patients treated with the older eight months
(2ERHZ/6HE) and current six months (2ERHZ/4RH) treatment regimens, the source population
was all new cases of TB aged above 15 years who were registered during 2008 through 2014 at
public healthcare facilities (HCFs). The years 2008 through 2014 were purposefully selected to
accommodate cases treated before and after the introduction of new regimen in 2011. The age
cutoff of 15 years was chosen since the regimen change introduced in 2011 was only for cases
older than 15years. Thus, the study population was those patients older than 15years and
registered at the selected healthcare facilities of the study zones during 2008 through 2014.
For papers (II-IV), the source population was all new adult TB cases aged above 18 years who
were registered at all public HCF of three zones. Thus, the study population was those patients
registered at selected HCFs in the three study zones.
5.3.2. Sample size determination
Sample size computation for the studies considered objectives and study designs. Accordingly,
the calculations were made using StatCalc program of Epinfo and/or STATA version 13 at
confidence level of 95%, power of 80% and ratio of comparable groups (r=1) .
Sample size calculation formula for single population
𝑛 =(𝑍𝛼/2)2 𝑃(1−𝑝)
𝑑2 𝑛 =(𝑍𝛼/2)2𝛿2
𝑑2
where;
P is the estimated proportion of delay >30days
𝛅 is the expected standard deviation
Z α/2 corresponding z score for significance level of (1- α)%
d is the desired precision (margin of error 5% for proportion and 5unit for mean)
For the two-population formula either of the following formula were used
2
21
2211
2
1)(
)1()1()1()
11(
PP
r
PPPPZpP
rZ
n
2
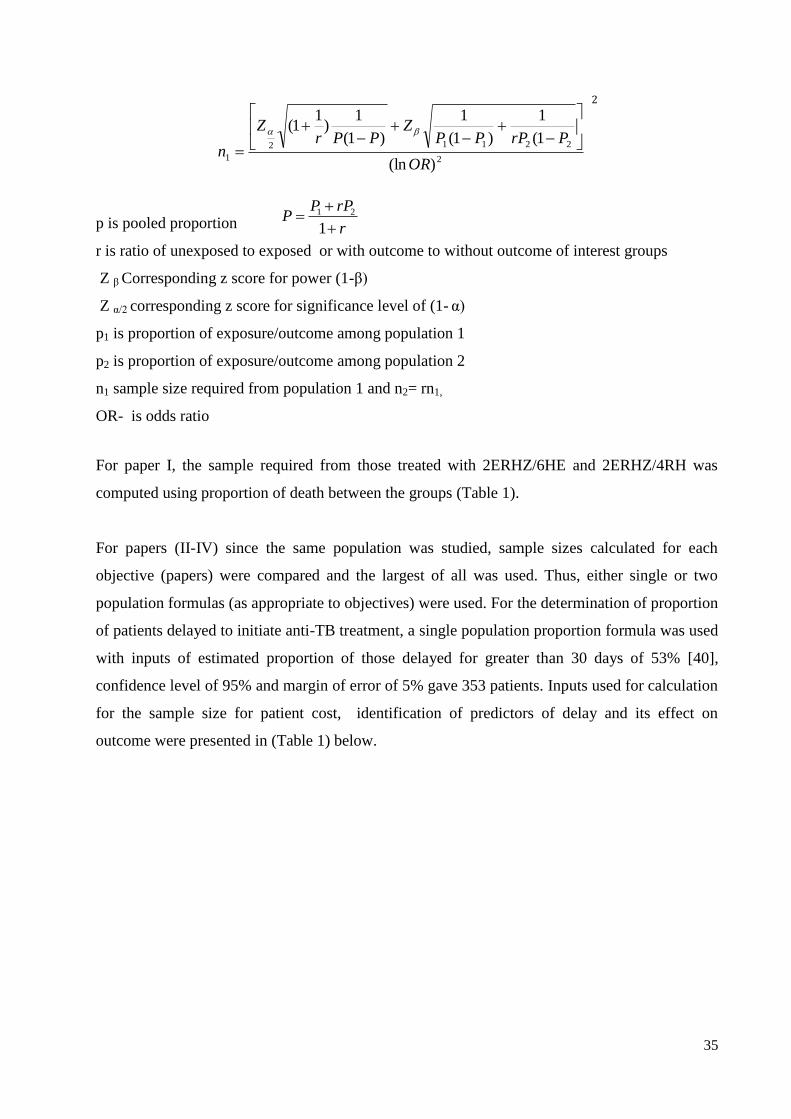
35
2
22112
1)(ln
1(
1
)1(
1
)1(
1)
11(
OR
PrPPPZ
PPrZ
n
2
p is pooled proportion
r is ratio of unexposed to exposed or with outcome to without outcome of interest groups
Z β Corresponding z score for power (1-β)
Z α/2 corresponding z score for significance level of (1- α)
p1 is proportion of exposure/outcome among population 1
p2 is proportion of exposure/outcome among population 2
n1 sample size required from population 1 and n2= rn1,
OR- is odds ratio
For paper I, the sample required from those treated with 2ERHZ/6HE and 2ERHZ/4RH was
computed using proportion of death between the groups (Table 1).
For papers (II-IV) since the same population was studied, sample sizes calculated for each
objective (papers) were compared and the largest of all was used. Thus, either single or two
population formulas (as appropriate to objectives) were used. For the determination of proportion
of patients delayed to initiate anti-TB treatment, a single population proportion formula was used
with inputs of estimated proportion of those delayed for greater than 30 days of 53% [40],
confidence level of 95% and margin of error of 5% gave 353 patients. Inputs used for calculation
for the sample size for patient cost, identification of predictors of delay and its effect on
outcome were presented in (Table 1) below.
r
rPPP
1
21
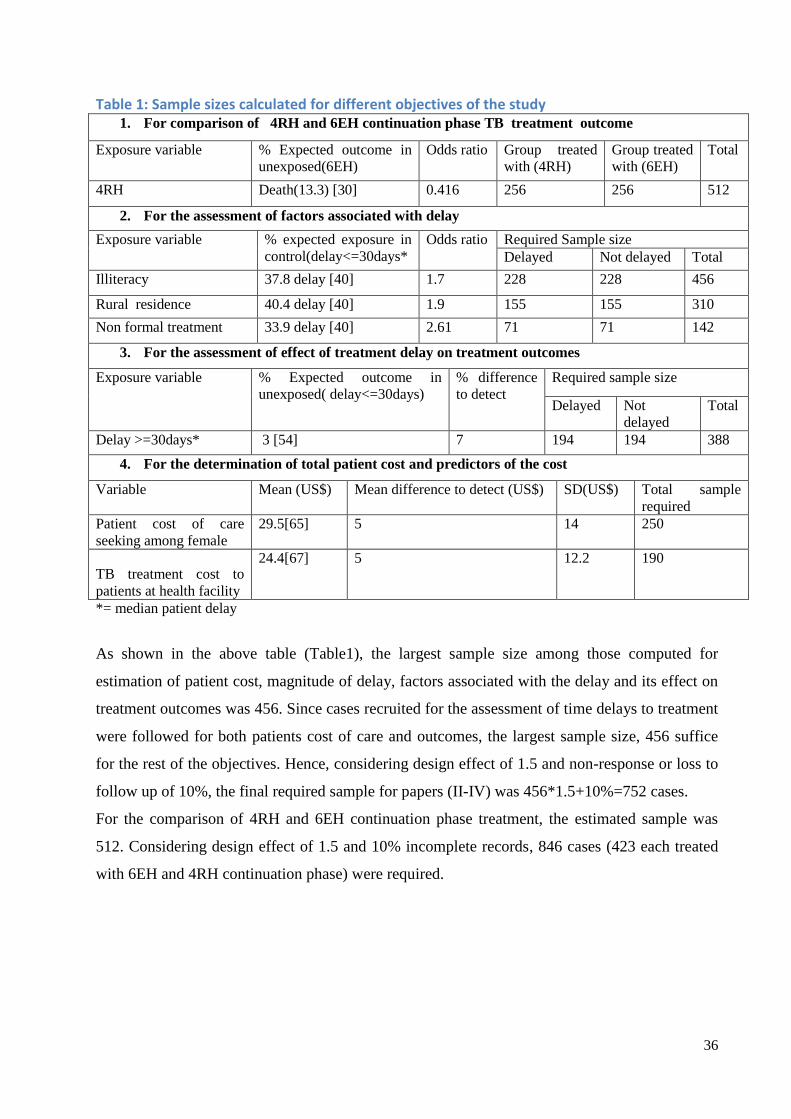
36
Table 1: Sample sizes calculated for different objectives of the study 1. For comparison of 4RH and 6EH continuation phase TB treatment outcome
Exposure variable % Expected outcome in
unexposed(6EH)
Odds ratio Group treated
with (4RH)
Group treated
with (6EH)
Total
4RH Death(13.3) [30] 0.416 256 256 512
2. For the assessment of factors associated with delay
Exposure variable % expected exposure in
control(delay<=30days*
Odds ratio Required Sample size
Delayed Not delayed Total
Illiteracy 37.8 delay [40] 1.7 228 228 456
Rural residence 40.4 delay [40] 1.9 155 155 310
Non formal treatment 33.9 delay [40] 2.61 71 71 142
3. For the assessment of effect of treatment delay on treatment outcomes
Exposure variable % Expected outcome in
unexposed( delay<=30days)
% difference
to detect
Required sample size
Delayed Not
delayed
Total
Delay >=30days* 3 [54] 7 194 194 388
4. For the determination of total patient cost and predictors of the cost
Variable Mean (US$) Mean difference to detect (US$) SD(US$) Total sample
required
Patient cost of care
seeking among female
29.5[65] 5 14 250
TB treatment cost to
patients at health facility
24.4[67] 5 12.2 190
*= median patient delay
As shown in the above table (Table1), the largest sample size among those computed for
estimation of patient cost, magnitude of delay, factors associated with the delay and its effect on
treatment outcomes was 456. Since cases recruited for the assessment of time delays to treatment
were followed for both patients cost of care and outcomes, the largest sample size, 456 suffice
for the rest of the objectives. Hence, considering design effect of 1.5 and non-response or loss to
follow up of 10%, the final required sample for papers (II-IV) was 456*1.5+10%=752 cases.
For the comparison of 4RH and 6EH continuation phase treatment, the estimated sample was
512. Considering design effect of 1.5 and 10% incomplete records, 846 cases (423 each treated
with 6EH and 4RH continuation phase) were required.
37
5.3.3. Sampling procedure
Three zones (Kaffa, Bench-Maji and Sheka) from SNNPR were purposefully selected. Then 10
woredas were selected from the zones based on proportional allocation and probability
proportional to size (PPS). Selection of the woredas was based on probability proportional to
size of the total TB cases notified during 2008 throgh 2014 for paper I and the preceding fiscal
year for papers I-IV. After selection of woredas, all the health facilities providing TB diagnosis
and treatment service were included. The samples for each HCF were determined based on
proportional allocation referring to the TB case notification (Figure 4).
For (paper I), that compared 4RH and 6EH continuation phase TB treatment outcomes, treatment
records of cases from the selected HCFs were categorized in to two groups. Those treated
between 2008 and 2011 constitute continuation phase treatment with 6EH and 2012 to 2014
constitute continuation phase treatment with 4RH. Finally, unit TB number of all the cases
registered in the two categories were extracted and entered into SPSS spreadsheet. So that the
required samples from the two categories were drawn randomly.
For papers I-IV, after selecting HCF and determining cases required from each HCFs, all
consecutive patients registered at the selected facilities during the study period were recruited
until required samples were reached. Thus, the recruited cases were assessed for time delays to
seek care and initiate treatment (paper II). Then, similar cases were followed to asses for post-
diagnosis costs and final treatment outcomes.
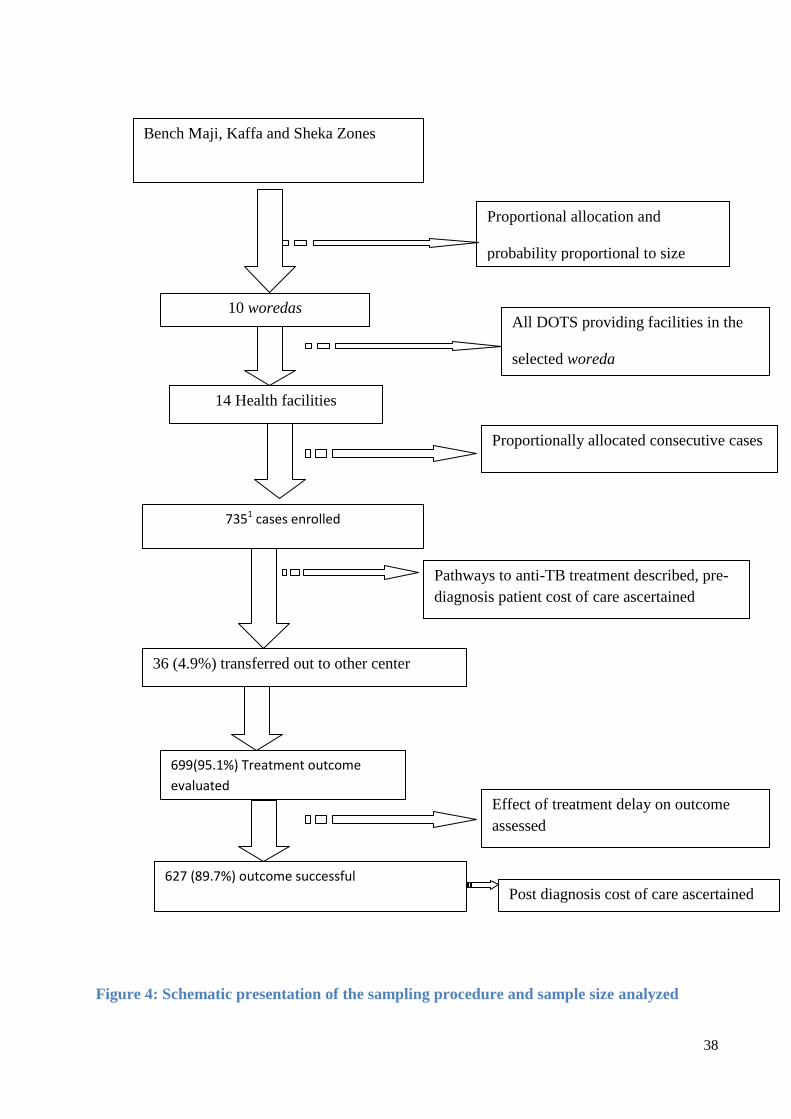
38
Figure 4: Schematic presentation of the sampling procedure and sample size analyzed
Bench Maji, Kaffa and Sheka Zones
Proportional allocation and
probability proportional to size
(PPS)
All DOTS providing facilities in the
selected woreda
10 woredas
14 Health facilities
Proportionally allocated consecutive cases
7351 cases enrolled
Pathways to anti-TB treatment described, pre-
diagnosis patient cost of care ascertained
36 (4.9%) transferred out to other center
699(95.1%) Treatment outcome
evaluated
Effect of treatment delay on outcome
assessed
627 (89.7%) outcome successful
Post diagnosis cost of care ascertained

39
5.3.4. Inclusion and exclusion criteria
For the assessment of delay, cost and effect of delay on outcomes those new TB cases, older than
18years and on intensive phase of treatment at time of enrollment were included. Whereas cases
unable to respond, died or lost to follow up or transferred out to other center before and after
enrollment were excluded from baseline and end line surveys respectively. For the comparison of
treatment, outcomes across six and eight month regimens, new cases and those older than
15years were included and those with missing treatment records were excluded from the study.
5.4. Study variables
5.4.1. Dependent variables
Delays to anti-TB treatment
Costs of TB illness to patients
Treatment success
5.4.2. Some of the independent/explanatory variables
Socio-demographics(age, residence, literacy, occupation, income etc),
Care seeking practices: first action to illness, type of health facility visited,
number of visits, Type of HCF where TB diagnosed, etc
Clinical factors: encountered symptoms, HIV co morbidity,
Perception/ knowledge about TB, information provision during treatment etc
Disease related: type of TB, treatment regimen, sputum and weight monitoring etc
5.5. Data collection tools and procedure
Data for the study variables were gathered using varieties of methods and sources. Accordingly,
structured questionnaire was adapted from tools recommended and used elsewhere for the cost
[56, 171, 172]. The structured questionnaire composed of sociodemographic, socioeconomic,
perceptions, knowledge, clinical, household variables, and health care seeking practices. The
questionnaire was translated into national language (Amharic) spoken by almost all residents in
the study area. Moreover structured data extraction checklist was also adopted from unit TB
register and clinical charts.
Training manual comprised of aim and implementation of the study, basics of TB control, TB
case definitions, components of questionnaire and interviewing techniques was prepared. Ten
diploma graduate nurse data collectors and three public health specialist (MPH) supervisors were
recruited and trained for three days. The training included description of questionnaire details,
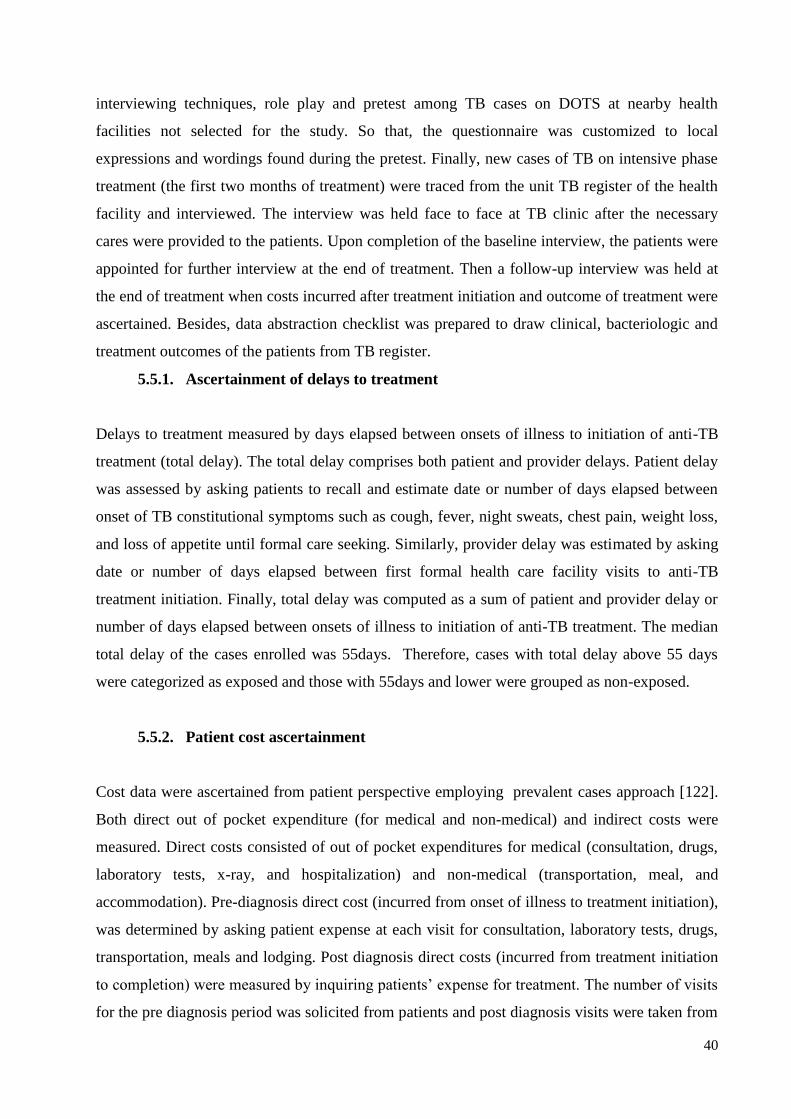
40
interviewing techniques, role play and pretest among TB cases on DOTS at nearby health
facilities not selected for the study. So that, the questionnaire was customized to local
expressions and wordings found during the pretest. Finally, new cases of TB on intensive phase
treatment (the first two months of treatment) were traced from the unit TB register of the health
facility and interviewed. The interview was held face to face at TB clinic after the necessary
cares were provided to the patients. Upon completion of the baseline interview, the patients were
appointed for further interview at the end of treatment. Then a follow-up interview was held at
the end of treatment when costs incurred after treatment initiation and outcome of treatment were
ascertained. Besides, data abstraction checklist was prepared to draw clinical, bacteriologic and
treatment outcomes of the patients from TB register.
5.5.1. Ascertainment of delays to treatment
Delays to treatment measured by days elapsed between onsets of illness to initiation of anti-TB
treatment (total delay). The total delay comprises both patient and provider delays. Patient delay
was assessed by asking patients to recall and estimate date or number of days elapsed between
onset of TB constitutional symptoms such as cough, fever, night sweats, chest pain, weight loss,
and loss of appetite until formal care seeking. Similarly, provider delay was estimated by asking
date or number of days elapsed between first formal health care facility visits to anti-TB
treatment initiation. Finally, total delay was computed as a sum of patient and provider delay or
number of days elapsed between onsets of illness to initiation of anti-TB treatment. The median
total delay of the cases enrolled was 55days. Therefore, cases with total delay above 55 days
were categorized as exposed and those with 55days and lower were grouped as non-exposed.
5.5.2. Patient cost ascertainment
Cost data were ascertained from patient perspective employing prevalent cases approach [122].
Both direct out of pocket expenditure (for medical and non-medical) and indirect costs were
measured. Direct costs consisted of out of pocket expenditures for medical (consultation, drugs,
laboratory tests, x-ray, and hospitalization) and non-medical (transportation, meal, and
accommodation). Pre-diagnosis direct cost (incurred from onset of illness to treatment initiation),
was determined by asking patient expense at each visit for consultation, laboratory tests, drugs,
transportation, meals and lodging. Post diagnosis direct costs (incurred from treatment initiation
to completion) were measured by inquiring patients‟ expense for treatment. The number of visits
for the pre diagnosis period was solicited from patients and post diagnosis visits were taken from

41
attendance records on unit register. Thus, transportation cost was calculated as the numbers of
visits multiplied by single trip fee as reported by the patients.
The indirect costs were estimated using human capital approach. Patients were requested to
estimate time lost due to sickness and visits for consultation, hospitalization, drug collection, and
trip journey. Then the time in any units (second, minute or hours) were all converted to hours
and then to days at an average of 8 working hours in a day (8hours = 1day). Finally, the number
of days were multiplied by an average daily wage rate of (US$2.43=50Ethiopian Birr) for
unemployed and daily rate calculated from their gross monthly salary for employed. For all the
cost items if no cost was incurred it was recorded as zero. All the costs were inquired in local
currency, Ethiopian Birr (ETB) and then converted in to US dollars (US$) using average
exchange rate of (1US$= 20.56ETB) during the study period [173].
5.5.3. Treatment outcome ascertainment
Treatment outcome was ascertained based on standard definitions recommended by the WHO
and adopted by the country [23, 174]. Accordingly, treatment outcomes of TB fall in to cured or
treatment completed or lost to follow up or death or treatment failure or transferred out. The
outcomes were retrieved from unit TB register of respective HCFs. Finally the outcomes were
categorized into successful when the TB patient completed treatment with or without evidence of
cure and unsuccessful when died or lost to follow-up or treatment failure. So that, coding was
made as unsuccessful outcomes=1 and successful=0. Details of the outcome definitions are
presented in definition terms section.
5.6. Data management and analysis
At the field, data were checked for consistency and completeness every day by supervisors
and/or principal investigator (PI). Then, data entry template was created on Epidata V3.5 based
on coded responses. Two experienced clerks entered the data of which 10% was randomly
double-checked by the PI. The data were then exported to SPSS version 21 and STATA version
13 where further recoding and cleaning was done to check for inconsistencies, outliers, and
missing values. Finally, the cleaned data were processed and analyzed using SPSS or STATA.
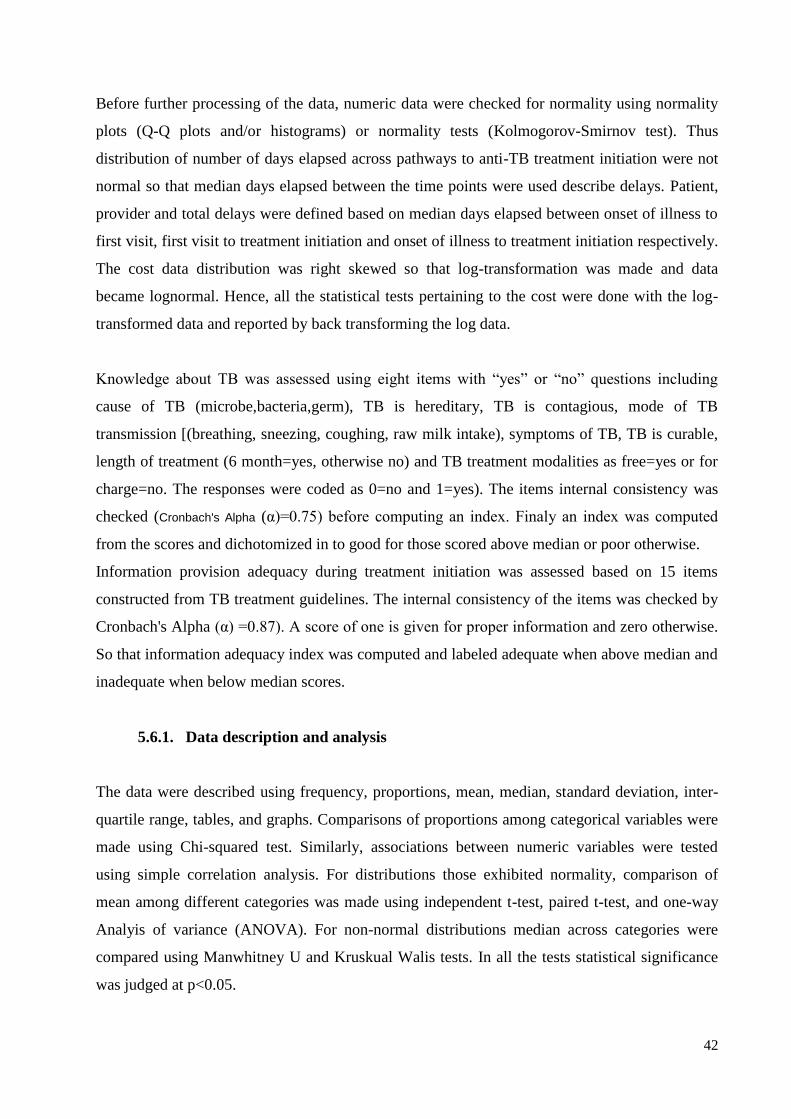
42
Before further processing of the data, numeric data were checked for normality using normality
plots (Q-Q plots and/or histograms) or normality tests (Kolmogorov-Smirnov test). Thus
distribution of number of days elapsed across pathways to anti-TB treatment initiation were not
normal so that median days elapsed between the time points were used describe delays. Patient,
provider and total delays were defined based on median days elapsed between onset of illness to
first visit, first visit to treatment initiation and onset of illness to treatment initiation respectively.
The cost data distribution was right skewed so that log-transformation was made and data
became lognormal. Hence, all the statistical tests pertaining to the cost were done with the log-
transformed data and reported by back transforming the log data.
Knowledge about TB was assessed using eight items with “yes” or “no” questions including
cause of TB (microbe,bacteria,germ), TB is hereditary, TB is contagious, mode of TB
transmission [(breathing, sneezing, coughing, raw milk intake), symptoms of TB, TB is curable,
length of treatment (6 month=yes, otherwise no) and TB treatment modalities as free=yes or for
charge=no. The responses were coded as 0=no and 1=yes). The items internal consistency was
checked (Cronbach's Alpha (α)=0.75) before computing an index. Finaly an index was computed
from the scores and dichotomized in to good for those scored above median or poor otherwise.
Information provision adequacy during treatment initiation was assessed based on 15 items
constructed from TB treatment guidelines. The internal consistency of the items was checked by
Cronbach's Alpha (α) =0.87). A score of one is given for proper information and zero otherwise.
So that information adequacy index was computed and labeled adequate when above median and
inadequate when below median scores.
5.6.1. Data description and analysis
The data were described using frequency, proportions, mean, median, standard deviation, inter-
quartile range, tables, and graphs. Comparisons of proportions among categorical variables were
made using Chi-squared test. Similarly, associations between numeric variables were tested
using simple correlation analysis. For distributions those exhibited normality, comparison of
mean among different categories was made using independent t-test, paired t-test, and one-way
Analyis of variance (ANOVA). For non-normal distributions median across categories were
compared using Manwhitney U and Kruskual Walis tests. In all the tests statistical significance
was judged at p<0.05.
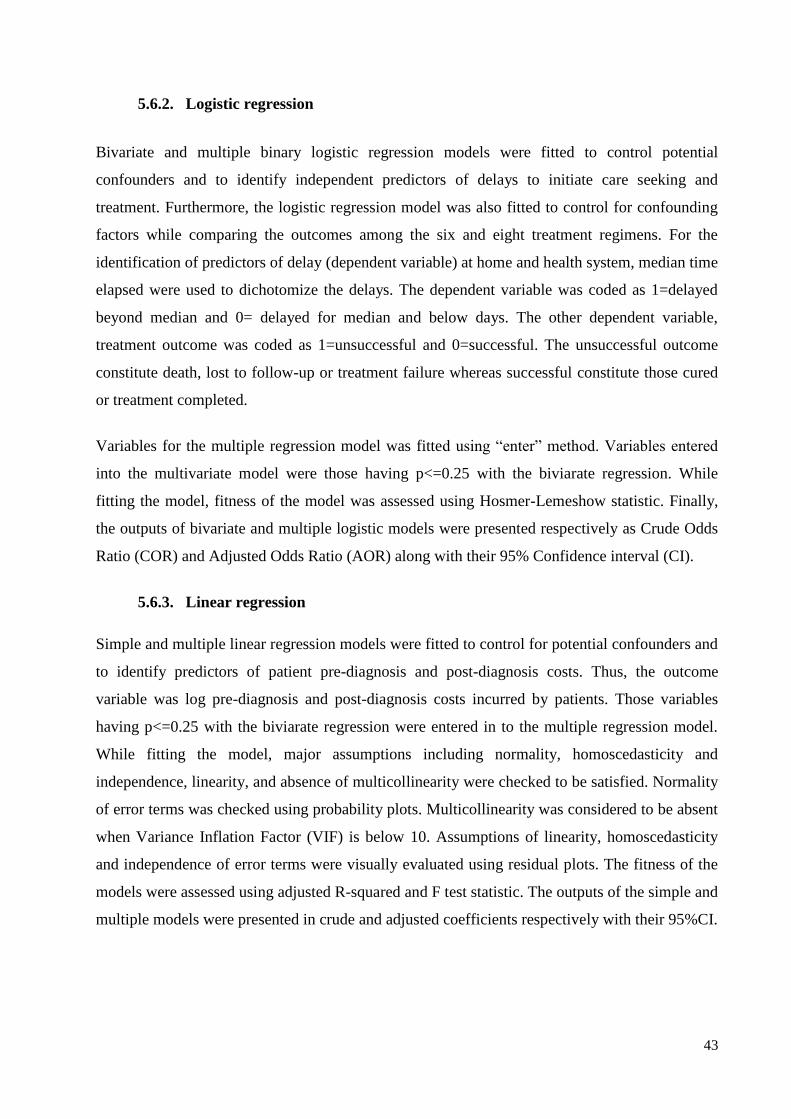
43
5.6.2. Logistic regression
Bivariate and multiple binary logistic regression models were fitted to control potential
confounders and to identify independent predictors of delays to initiate care seeking and
treatment. Furthermore, the logistic regression model was also fitted to control for confounding
factors while comparing the outcomes among the six and eight treatment regimens. For the
identification of predictors of delay (dependent variable) at home and health system, median time
elapsed were used to dichotomize the delays. The dependent variable was coded as 1=delayed
beyond median and 0= delayed for median and below days. The other dependent variable,
treatment outcome was coded as 1=unsuccessful and 0=successful. The unsuccessful outcome
constitute death, lost to follow-up or treatment failure whereas successful constitute those cured
or treatment completed.
Variables for the multiple regression model was fitted using “enter” method. Variables entered
into the multivariate model were those having p<=0.25 with the biviarate regression. While
fitting the model, fitness of the model was assessed using Hosmer-Lemeshow statistic. Finally,
the outputs of bivariate and multiple logistic models were presented respectively as Crude Odds
Ratio (COR) and Adjusted Odds Ratio (AOR) along with their 95% Confidence interval (CI).
5.6.3. Linear regression
Simple and multiple linear regression models were fitted to control for potential confounders and
to identify predictors of patient pre-diagnosis and post-diagnosis costs. Thus, the outcome
variable was log pre-diagnosis and post-diagnosis costs incurred by patients. Those variables
having p<=0.25 with the biviarate regression were entered in to the multiple regression model.
While fitting the model, major assumptions including normality, homoscedasticity and
independence, linearity, and absence of multicollinearity were checked to be satisfied. Normality
of error terms was checked using probability plots. Multicollinearity was considered to be absent
when Variance Inflation Factor (VIF) is below 10. Assumptions of linearity, homoscedasticity
and independence of error terms were visually evaluated using residual plots. The fitness of the
models were assessed using adjusted R-squared and F test statistic. The outputs of the simple and
multiple models were presented in crude and adjusted coefficients respectively with their 95%CI.
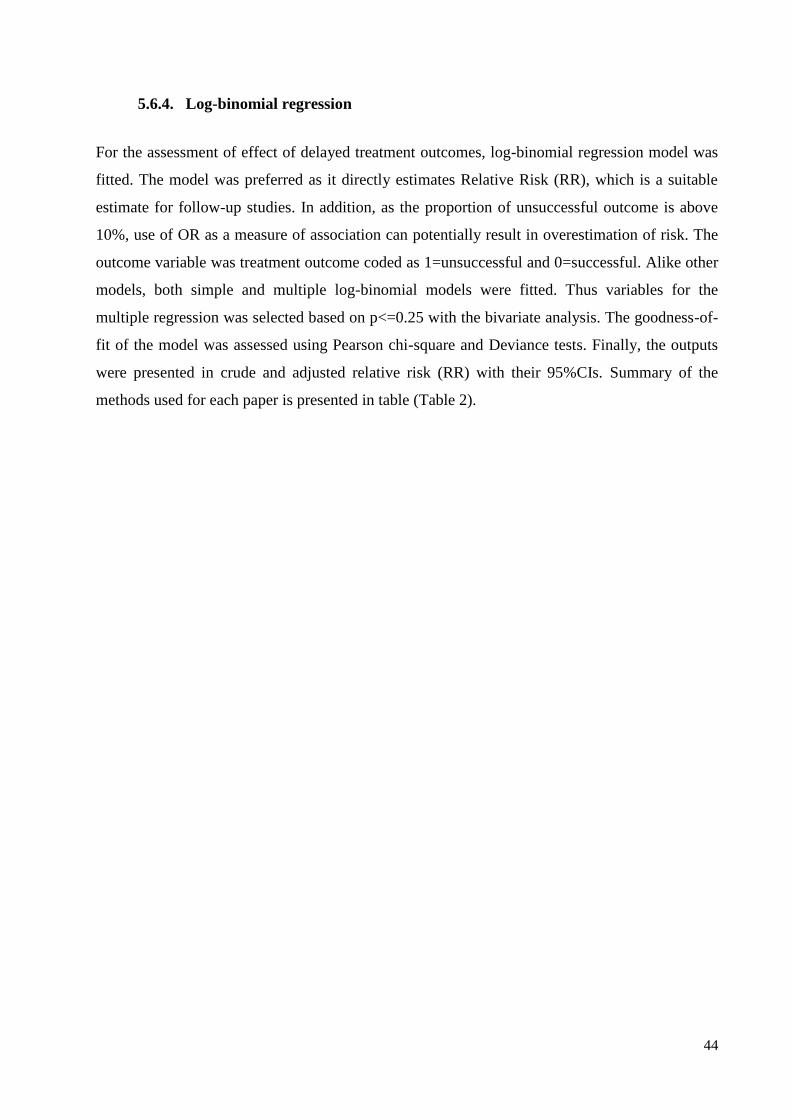
44
5.6.4. Log-binomial regression
For the assessment of effect of delayed treatment outcomes, log-binomial regression model was
fitted. The model was preferred as it directly estimates Relative Risk (RR), which is a suitable
estimate for follow-up studies. In addition, as the proportion of unsuccessful outcome is above
10%, use of OR as a measure of association can potentially result in overestimation of risk. The
outcome variable was treatment outcome coded as 1=unsuccessful and 0=successful. Alike other
models, both simple and multiple log-binomial models were fitted. Thus variables for the
multiple regression was selected based on p<=0.25 with the bivariate analysis. The goodness-of-
fit of the model was assessed using Pearson chi-square and Deviance tests. Finally, the outputs
were presented in crude and adjusted relative risk (RR) with their 95%CIs. Summary of the
methods used for each paper is presented in table (Table 2).

45
Table 2 :Summary of dissertation work by major components of study methods and objective
Objective Study design Study population Sample size
and sampling
Data collection tools Data analyses
To compare treatment outcomes of
6EH and 4RH continuation phase
treatment of TB (Paper I)
Comparative
cross sectional
Treatment cohorts treated for
with 4RH and 6EH continuation
phase treatment
790, simple
random
sampling
Structured data
abstraction checklist
Descriptive
measures, Logistic
regression,
To determine magnitude and
associated factors of delays to anti-
TB treatment (Paper II)
Cross-
sectional
Adult new cases of TB
registered for treatment at
health facilities
735, multistage
sampling
Interviewer administered
questionnaire
Descriptive
measures, binary
logistic regression
To determine pre and post
diagnosis costs of TB to patients
(paper III)
Follow-up Adult new cases of TB
registered for treatment at
health facilities
735,multistage
sampling
Interviewer administered
questionnaire
Descriptive
measures, linear
regression
To asses effect of treatment delay
on outcomes of TB patients
(Paper IV)
Follow-up Adult new cases of TB on
treatment at health facilities
735,multistage
sampling
Interviewer administered
structured questionnaire
Descriptive
measures, Log-
binomial regression

46
5.7. Data quality assurance
To ensure quality of the data, various actions were taken starting from designing the tool to data
analysis and interpretations. The questionnaires were adapted from standard instruments those
had been used in Ethiopia [172] and elsewhere [56, 171]. To avoid different forms of
measurement bias, questions were customized to local expressions following a pre-test of the
tools. Experienced diploma holder nurse data collectors and master holder supervisors were
recruited and trained intensively. Both the data collectors and supervisors were accustomed to
the local languages, cultures, and events. During the data collection, supervisors and PI
conducted close supportive supervision to data collectors so that immediate feedback had been
provided.
To minimize errors during data entry, the templates were programmed using check codes. Data
entry was handled by experienced clerks on user-friendly software, Epidata. Then sample of the
entered data were rechecked against the questionnaire for correctness of entry so that necessary
corrections were made before the analysis. During analysis and interpretation, appropriate
models and statistical tests were applied. Thus, important assumptions underlying the tests and
models fitness were checked with standard procedures.
5.8. Ethical considerations
The study was conducted in compliance with the international [175] and national [176] ethical
principles and standards for biomedical research involving human subjects. Thus, the
Institutional Review Board (IRB) of College of Health Science, Addis Ababa University (AAU)
ethically approved the study protocol with reference number SPH/14. Moreover, purpose of the
study was communicated and permission sought from SNNPR health bureau, Kaffa, Bench-Maji
and Sheka zones health department, respective woreda health offices and Health facilities.
Participation of the study subjects was entirely on voluntary basis. Hence, informed consent was
taken from the study subjects using the annexed consent and information sheet (Annex 3-4). The
information included purposes of the study, the rights of participants, potential benefits, and
harms of the study. The study did not involve any undue financial or non-financial inducement
for participation. In addition, the subjects were not persuaded or influenced in anyway by
anybody to take part in the study. To ensure confidentiality of the information provided by the

47
participants, personal identifiers were not gathered. The questionnaires were kept in a locked
cabinet and data in password-protected computer accessible to the PI.
The study did not introduce any harm to the participant. Hence, utmost effort was made to
maximize the benefit to the participants. During the data collection participants were provided
with information on cause, mode of transmission, manifestation, need for adhering to treatment
and avoidance of transmission of TB to others.
5.9. Definition of terms
The following operational definitions adopted from WHO and national TB control guidelines
[23, 27] and similar literatures were used.
Smear positive PTB is a patient with at least two smear examinations positive for AFB Or
with one smear examination positive for AFB by direct microscopy and culture positive, Or
with one initial smear examination positive for AFB and radiographic abnormalities
consistent with active TB as determined by a clinician.
Smear negative pulmonary TB is a patient having symptoms suggestive of TB with at least
three initial smear examinations negative for AFB by direct microscopy, and no response to
a course of broad-spectrum antibiotics, and again three negative smear examinations by
direct microscopy and radiological abnormalities consistent with pulmonary tuberculosis,
and decision by a clinician to treat with a full course of anti- tuberculosis Or a patient whose
diagnosis is based on culture positive for M. tuberculosis but three initial smear examinations
are negative by direct microscopy
Extra pulmonary TB is TB in organs other than the lungs, proven by one culture-positive
specimen from an extra-pulmonary site or histo-pathological evidence from a biopsy, Or TB
based on strong clinical evidence consistent with active EPTB and the decision by a
physician to treat with a full course of anti-TB therapy.
New case of TB is a patient who never had treatment for TB, or has been on anti-TB
treatment for less than four weeks in the past.
HIV-positive TB patient refers to any case of TB who has a positive result from HIV testing
at the time of TB diagnosis or other documented evidence of enrolment in HIV care
HIV-negative TB patient- any bacteriologically confirmed or clinically diagnosed case of
TB who has a negative result from HIV testing conducted at the time of TB diagnosis.

48
Cured: a patient whose sputum smear or culture was positive at the beginning of the
treatment but who was smear or culture-negative in the last month of treatment and on at
least one previous occasion.
Treatment completed: completed treatment but does not have a negative sputum smear or
culture result in the last month of treatment and on at least one previous occasion.
Treatment failure: a patient whose sputum smear or culture is positive at five months or
later during treatment or patients found to harbor MDR TB strain at any point of time during
the treatment, whether they are smear-negative or positive.
Died: a patient who dies for any reason during the course of TB treatment.
Lost to follow-up: a patient who has been on treatment for at least four weeks and
interrupted treatment for eight or more consecutive weeks.
Transfer out: a patient who has been transferred to another recording and reporting unit and
whose treatment outcome is unknown.
Treatment success: TB cases who either completed the treatment or cured of it.
Patient delay- days elapsed between onsets of illness to first formal healthcare seeking
Health system /provider delay is days spent between first consultation to initiation of
treatments
Total delay: number of days elapsed since onset of illness to anti-TB treatment initiation
Direct cost: out of pocket expenditure for TB care seeking, diagnoses and treatment by
patient, household and health system for medical or non medical conditions
Indirect cost: lost income due to TB illness, care seeking, and treatment.
Pre-diagnosis cost: cost incurred since onset of illness to treatment initiation
Post-diagnosis cost: cost incurred since commencement to completion of treatment
Total cost is the sum of both direct and indirect costs incurred for care seeking, diagnoses
and treatment of TB.

49
6. Results
6.1. Summary of key findings from papers (I-IV)
A total of 790 TB patient records (paper I) and 735 new TB cases on treatment (papers II-IV)
were studied from 14 public health facilities (three hospitals and 11 health centers) of the
selected 10 woredas. Of the 790 treatment records retrieved, 395 (50%) of the cases received
eight month (2ERHZE/6HE) and the rest 50% received six month (2ERHZ/4RH) anti-TB
treatment. Thus, significantly better outcome (treatment success) was observed among those
received the six-month regimen compared with the eight-month treatment regimen (Table 3).
On the other hand, out of the 735 TB cases enrolled, 469(63.8%) and 266(37.2%) of the cases
were registered at health centers and hospitals respectively. Until anti-TB treatment
commencement, a median of 55days had been elapsed since onset of their illness. During the
pathways to treatment, TB patients totally incurred a median of US$ 201.48 and US$93.75 until
TB diagnosis and after the diagnosis respectively. Of the total cases enrolled, 36(4.9%) were
transferred out to other treatment center so that treatment outcome was evaluated for the rest 699
(95.1%). Thus, significantly lower treatment success was observed among those initiated anti-TB
treatments beyond a median 55days compared to those initiated within 55days of the onset of
illness (Table 3).

50
Table 3; Summary of key findings of the dissertation by objectives
Objective Key findings
To compare treatment
outcomes of 6EH and 4RH
continuation phase
treatment of TB (Paper I)
Overall treatment success was 88% with significantly higher (90.6% vs 85.3% ) among those treated with
4RH and continuation phase treatment respectively
4RH continuation phase predicted lower odds of unsuccessful outcome whereas, HIV co infection and rural
residence predicted higher odds of unsuccessful outcome
To determine magnitude
and associated factors of
delays to treatment among
TB patients on DOTS
( Paper II)
TB patients initiated formal healthcare seeking after median(IQR) 25(15-36) days since onset of illness
Commencement of treatment since first formal healthcare seeking spent median(IQR) 22(9-48)days
Patients elapsed median (IQR) of 55(32-100) days since onset of illness to anti-TB treatment where 54.6% of
the delay was attributed to the provider (health system).
Patient and provider delays are positively correlated
Self treatment, HIV co infection, having extra pulmonary TB predict higher patient delay
First visitation to lower public and private facilities, delayed care seeking predict higher provider delay
To determine pre and post
diagnosis costs of TB to
patients (Paper III)
TB patients incurred median(IQR) US$201.48(136.70-318.94) from illness onset to completion of treatment
Direct out-of-pocket patient expenditure during pre-diagnosis and post diagnosis respectively amounted to
median(IQR) US$21.64(10.23-48.31) and US$35.02(0-70.40)
Indirect and Pre-diagnosis cost respectively constituted 70.6% and 53.6% of the total patient cost
Delays to treatment, visiting more than one HCF, care seeking at private HCF predicted increased pre-
diagnosis cost
Delays to treatment, rural residence and hospitalization predicted increased post diagnosis cost
To asses effect of
treatment delay on
outcomes of TB patients
(Paper IV)
Over all treatment success was 89.6% (86.7% and 92.6%) respectively among those initiated treatment
beyond and within 55days of onset of illness
Treatment initiation >55days of onset, HIV co infection and treatment center being hospital predicted higher
risk of unsuccessful outcome
Weight gain and having sputum checkup after diagnosis predicted lower risk of unsuccessful outcome
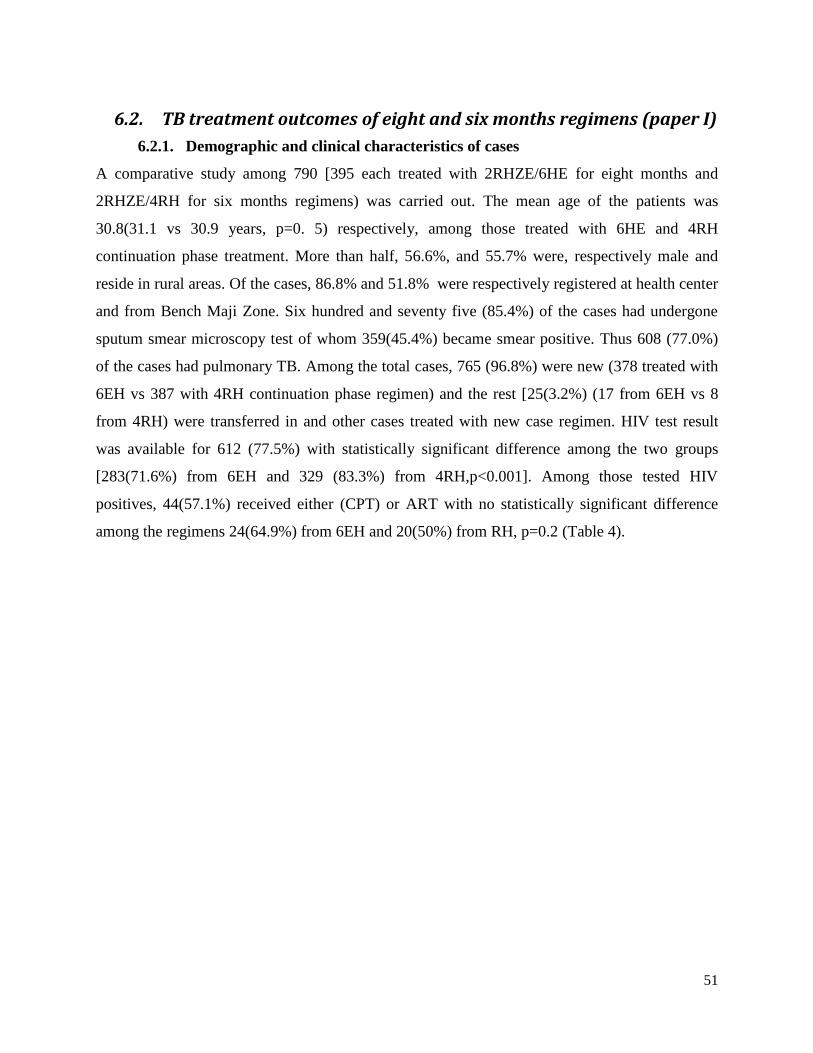
51
6.2. TB treatment outcomes of eight and six months regimens (paper I)
6.2.1. Demographic and clinical characteristics of cases
A comparative study among 790 [395 each treated with 2RHZE/6HE for eight months and
2RHZE/4RH for six months regimens) was carried out. The mean age of the patients was
30.8(31.1 vs 30.9 years, p=0. 5) respectively, among those treated with 6HE and 4RH
continuation phase treatment. More than half, 56.6%, and 55.7% were, respectively male and
reside in rural areas. Of the cases, 86.8% and 51.8% were respectively registered at health center
and from Bench Maji Zone. Six hundred and seventy five (85.4%) of the cases had undergone
sputum smear microscopy test of whom 359(45.4%) became smear positive. Thus 608 (77.0%)
of the cases had pulmonary TB. Among the total cases, 765 (96.8%) were new (378 treated with
6EH vs 387 with 4RH continuation phase regimen) and the rest [25(3.2%) (17 from 6EH vs 8
from 4RH) were transferred in and other cases treated with new case regimen. HIV test result
was available for 612 (77.5%) with statistically significant difference among the two groups
[283(71.6%) from 6EH and 329 (83.3%) from 4RH,p<0.001]. Among those tested HIV
positives, 44(57.1%) received either (CPT) or ART with no statistically significant difference
among the regimens 24(64.9%) from 6EH and 20(50%) from RH, p=0.2 (Table 4).

52
Table 4: Demographic and clinical characteristics of the patients, 2008-2014, Southwest Ethiopia
aStandard deviation,
b Cotrimoxazole prophylactic therapy,
cAntiretroviral therapy
6.2.2. Patient follow-up and outcomes
Measurements of patient weight at the end of second, fifth and sixth/seventh months of treatment
were available for 504 (63.8%), 145 (18.4%) and 141 (17.8%) respectively. Thus, 368 (46.6%)
or (48.4% from 6EH and 44.8% from 4RH, p=0.4) have gained some amount of weight at the
Variable Continuation phase treatment
regimen
Total
N=790
P value
6EH (n=395)
n (%)
4RH (n=395)
n(%)
Age (years) Mean +SDa
31.1+12.9 30.5+11.9 30.8+12.4 0.5
Gender Male 221(55.9) 226(57.2) 447(56.6) 0.7
Female 174(44.1) 169(42.8) 343(43.4)
Residence Urban 175(44.3) 175(44.3) 350(44.3) 1
Rural 220(55.7) 220(55.7) 440(55.7)
Zone Kaffa 106(26.8) 104(26.3) 210(26.6) 0.9
Bench Maji 206(52.2) 203(26.3) 409(51.8)
Sheka 83(21.0) 88(22.3) 171(21.6)
Treatment
center
Hospital 55(13.9) 49(12.4) 104(13.2) 0.5
Health center 340(86.1) 346(87.6) 686(86.8)
Baseline
weight
Mean +SD 47.6 +8.6 48.4 +8.5 48+ 8.5 0.2
Baseline
sputum smear
Positive 186 (47.1) 173(43.8) 359(45.4) 0.6
Negative 151 (38.2) 165(41.8) 316(40)
Unknown 58 (14.7) 57(14.4) 115(14.6)
Type of TB Pulmonary 303 (76.7 305 (77.2) 608 (77.0) 0.9
Positive 186 (47.1) 173 (43.8) 359 (45.4)
Negative 117 (30.4) 132 (33.4) 252 (31.9)
Extra
pulmonary
92 (23.3) 90 (22.8) 179 (23)
HIV status Positive 37 (9.4) 40 (10.1) 77 (9.7) <0.001
Negative 246 (62.3) 289 (73.2) 535 (67.7)
Unknown 112 (28.4) 66 (16.7) 178 (22.5)
Received
CPTb (n=77)
Yes 18(48.6) 17(42.5) 35(45.5) 0.6
Both CPT or
ARTc (n=77)
Yes 6(16.2) 6(15.0) 12(15.6) 0.8
Received
ART (n=77)
Yes 12(32.4) 9(22.5) 21(27.3) 0.3
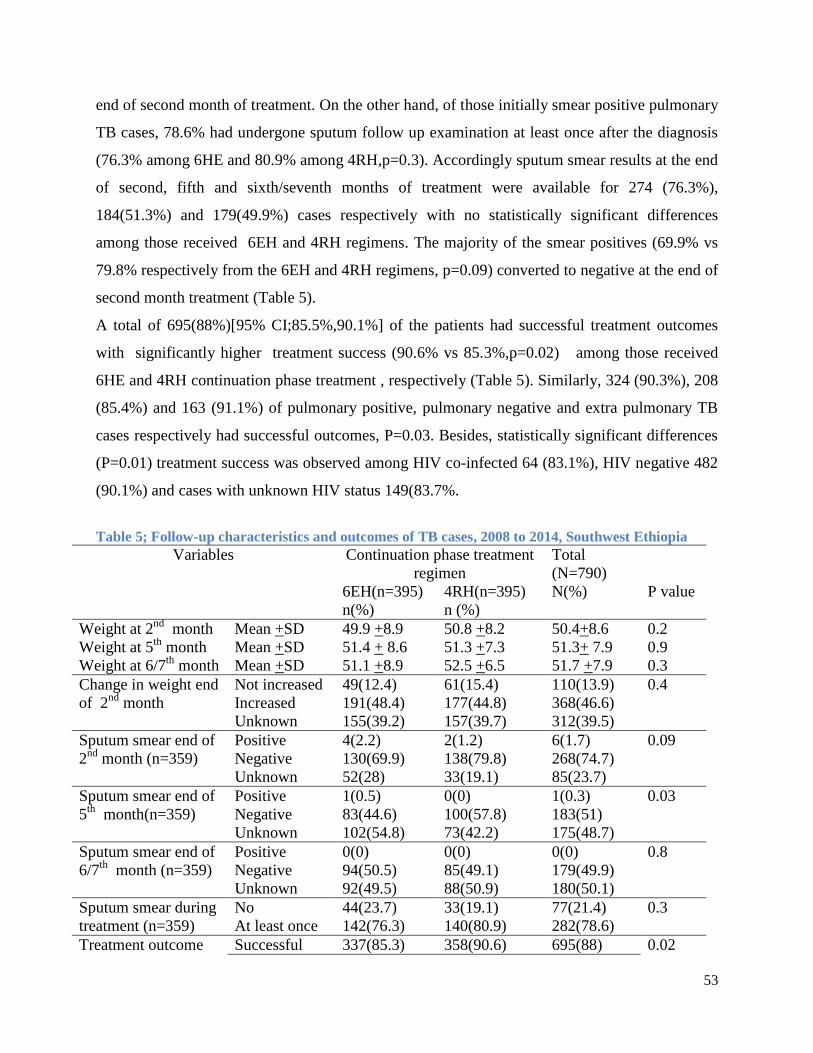
53
end of second month of treatment. On the other hand, of those initially smear positive pulmonary
TB cases, 78.6% had undergone sputum follow up examination at least once after the diagnosis
(76.3% among 6HE and 80.9% among 4RH,p=0.3). Accordingly sputum smear results at the end
of second, fifth and sixth/seventh months of treatment were available for 274 (76.3%),
184(51.3%) and 179(49.9%) cases respectively with no statistically significant differences
among those received 6EH and 4RH regimens. The majority of the smear positives (69.9% vs
79.8% respectively from the 6EH and 4RH regimens, p=0.09) converted to negative at the end of
second month treatment (Table 5).
A total of 695(88%)[95% CI;85.5%,90.1%] of the patients had successful treatment outcomes
with significantly higher treatment success (90.6% vs 85.3%,p=0.02) among those received
6HE and 4RH continuation phase treatment , respectively (Table 5). Similarly, 324 (90.3%), 208
(85.4%) and 163 (91.1%) of pulmonary positive, pulmonary negative and extra pulmonary TB
cases respectively had successful outcomes, P=0.03. Besides, statistically significant differences
(P=0.01) treatment success was observed among HIV co-infected 64 (83.1%), HIV negative 482
(90.1%) and cases with unknown HIV status 149(83.7%.
Table 5; Follow-up characteristics and outcomes of TB cases, 2008 to 2014, Southwest Ethiopia
Variables Continuation phase treatment
regimen
Total
(N=790)
N(%)
6EH(n=395)
n(%)
4RH(n=395)
n (%)
P value
Weight at 2nd
month Mean +SD 49.9 +8.9 50.8 +8.2 50.4+8.6 0.2
Weight at 5th
month Mean +SD 51.4 + 8.6 51.3 +7.3 51.3+ 7.9 0.9
Weight at 6/7th
month Mean +SD 51.1 +8.9 52.5 +6.5 51.7 +7.9 0.3
Change in weight end
of 2nd
month
Not increased 49(12.4) 61(15.4) 110(13.9) 0.4
Increased 191(48.4) 177(44.8) 368(46.6)
Unknown 155(39.2) 157(39.7) 312(39.5)
Sputum smear end of
2nd
month (n=359)
Positive 4(2.2) 2(1.2) 6(1.7) 0.09
Negative 130(69.9) 138(79.8) 268(74.7)
Unknown 52(28) 33(19.1) 85(23.7)
Sputum smear end of
5th
month(n=359)
Positive 1(0.5) 0(0) 1(0.3) 0.03
Negative 83(44.6) 100(57.8) 183(51)
Unknown 102(54.8) 73(42.2) 175(48.7)
Sputum smear end of
6/7th
month (n=359)
Positive 0(0) 0(0) 0(0) 0.8
Negative 94(50.5) 85(49.1) 179(49.9)
Unknown 92(49.5) 88(50.9) 180(50.1)
Sputum smear during
treatment (n=359)
No 44(23.7) 33(19.1) 77(21.4) 0.3
At least once 142(76.3) 140(80.9) 282(78.6)
Treatment outcome Successful 337(85.3) 358(90.6) 695(88) 0.02

54
Cured 77(19.5) 85(21.5) 162(20.5)
Completed 260(65.8) 273(69.1) 533(67)
Unsuccessful 58(14.7) 37(9.4) 95(12)
Died 28(7.1) 18(4.6) 46(5.8)
Defaulted 29(7.3) 19(4.8) 48(6.1)
Failure 1(0.3) 0(0) 1(0.1)
6.2.3. Association between treatment regimen and outcomes
In multivariate analysis 4RH continuation phase treatment regimen [AOR (95% CI)
0.55(0.34,0.89)], treatment center being health center [AOR (95% CI) 0.37(0.14,0.97)] and
gained weight at the end of the second month [AOR (95% CI) 0.28(0.11,0.72)] predicted lower
odds of unsuccessful outcome. Patient age [AOR (95% CI) 1.02(1.001,1.022)], rural residence
[AOR (95% CI) 2.1(1.18,3.75)] and HIV co-infection [AOR (95% CI 2.38(1.12,5.07)],
independently predicted higher odds of unsuccessful treatment outcome (Table 6). Treatment
with 4RH continuation phase predicted lower odds of unsuccessful outcome compared to those
treated with 6EH regimen. Thus, cases treated with 4RH continuation phase regimen are 45%
less likely to have unsuccessful outcome compared to those treated with the 6EH regimen. On
the other hand, higher chance of unsuccessful outcome was observed among the elders, rural
residents and HIV co-infected cases compared to respectively younger, urban residents and HIV
negative cases. The likelihood of having unsuccessful outcome increase by 2% for every one
year increase in age (AOR=1.02). Patients followed anti-TB treatment at health center had about
63% lower odds of unsuccessful outcome compared to those followed at hospital (AOR=0.37).
HIV co infected TB patients are more than twice as likely to have unsuccessful outcomes
compared to HIV negatives (AOR=2.39). Those patients gained weight at the end of the second
month of treatment have 72% lower odds of unsuccessful outcomes compared to those with
reduced or unchanged weight (AOR=0.28).

55
Table 6; Predictors of unsuccessful TB treatment outcomes, 2008-2014, Southwestern Ethiopia
Variables Treatment outcomes Odds ratio (OR)
Unsuccessful
n (%)
Successful
n (%)
Crude OR
95% CI
Adjusted OR
95% CI
Age (years) Mean(SD) 33.5(14) 30.4(12.0) 1.02(1.002,1.03) 1.02(1.001,1.022)*
Gender Male 60(13.4) 387(86.6) 1.00 1.00
Female 35(10.2) 308(89.8) 0.73(0.47.1.14) 0.63(0.38,1.03)
Residence Urban 32(9.1) 318(90.9) 1.00 1
Rural 63(14.3) 377(85.7) 1.66(1.06,2.61) 2.1(1.18,3.75)*
Zone Kaffa 34(16.2) 176(83.8) 1.00 1
Bench Maji 50(12.2) 359(87.8) 0.72(0.45,1.14) 1.41(0.73,2.75)
Sheka 11(6.4) 160(93.6) 0.36(0.17,0.73) 1.2(0.44,3.32)
Treatment
center
HC** 78(11.4) 608(88.6) 0.66(0.37,1.16) 0.37(0.14,0.97)*
Hospital 17(16.3) 87(83.7) 1.00 1.00
Type of TB Pulmonary 78(12.8) 530(87.2) 1 1
EPTB** 17(9.3) 165(90.7) 0.70(0.40,1.22) 0.57(0.32,1.04)
HIV status Negative 53(9.9) 482(90.1) 1.00 1.00
Positive 13(16.9) 64(83.1) 1.85(0.95,3.57) 2.39(1.12,5.07)*
Unknown 29(16.3) 178(83.7) 1.77(1.08,2.88) 2.26(1.23,4.11)*
Weight
change end
of 2nd
month
No increase 11(8.2) 357(91.8) 1.00 1
Increased 9(3) 101(97) 0.35(0.14,0.86) 0.28(0.11,0.72)*
Unknown 75(24) 237(76) 3.55(1.71,7.37) 3.48(1.60,7.54)*
Continuatio
n phase
regimen
6EH 58(14.7) 337(85.3) 1.00 1.00
4RH 37(9.4) 358(90.6) 0.60(0.39,0.93) 0.55(0.34,0.89)*
*statistically significant at p<0.05,*HC=Health center***=Extra pulmonary Tuberculosis,
A subgroup analysis among smear positive pulmonary cases showed having a sputum checkup at
least once during treatment independently predicted 96% lower odds of unsuccessful outcomes
compared to those unchecked (AOR= 0.04,95% CI, 0.01-0.12),P<0.001).
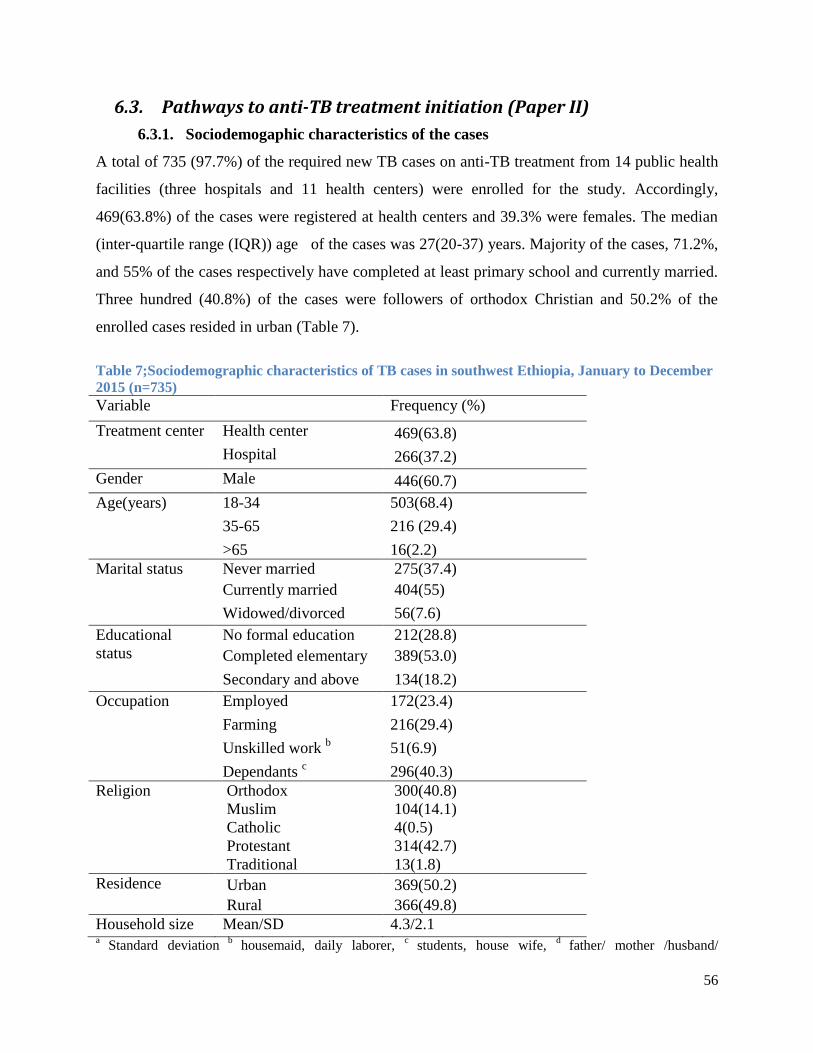
56
6.3. Pathways to anti-TB treatment initiation (Paper II)
6.3.1. Sociodemogaphic characteristics of the cases
A total of 735 (97.7%) of the required new TB cases on anti-TB treatment from 14 public health
facilities (three hospitals and 11 health centers) were enrolled for the study. Accordingly,
469(63.8%) of the cases were registered at health centers and 39.3% were females. The median
(inter-quartile range (IQR)) age of the cases was 27(20-37) years. Majority of the cases, 71.2%,
and 55% of the cases respectively have completed at least primary school and currently married.
Three hundred (40.8%) of the cases were followers of orthodox Christian and 50.2% of the
enrolled cases resided in urban (Table 7).
Table 7;Sociodemographic characteristics of TB cases in southwest Ethiopia, January to December
2015 (n=735)
Variable Frequency (%)
Treatment center Health center 469(63.8)
Hospital 266(37.2)
Gender Male 446(60.7)
Age(years) 18-34 503(68.4)
35-65 216 (29.4)
>65 16(2.2)
Marital status Never married 275(37.4)
Currently married 404(55)
Widowed/divorced 56(7.6)
Educational
status
No formal education 212(28.8)
Completed elementary 389(53.0)
Secondary and above 134(18.2)
Occupation Employed 172(23.4)
Farming 216(29.4)
Unskilled work b 51(6.9)
Dependants c 296(40.3)
Religion Orthodox 300(40.8)
Muslim 104(14.1)
Catholic 4(0.5)
Protestant 314(42.7)
Traditional 13(1.8)
Residence Urban 369(50.2)
Rural 366(49.8)
Household size Mean/SD 4.3/2.1 a
Standard deviation b
housemaid, daily laborer, c
students, house wife, d
father/ mother /husband/

57
wife/brother/sister/employer
6.3.2. Healthcare seeking practices and patient delay
At the onset of illness, 563(76.6%) and 345(46.9%) of the cases had respectively encountered
cough and night sweating. Subsequent to the symptoms, 139(18.9%) took actions including self-
treatment and consulting traditional healer prior to healthcare facility (HCF) visit. Ultimate
decision to visit health facility was made upon referral and/or advice from relatives (38.6%),
Health Extension Worker (HEW) (4.5%) and TB patients on treatment (4.2%). Two hundred and
seventy six (37.6%) first visited to HCFs not providing TB DOTS service including private
clinics and health posts. Since onset of the illness, a median 25(15-36) days had been elapsed to
initiate formal healthcare seeking. Nearly a third, 240(32.6%) of the cases had made first
consultation within 15 days of the onset of illness. Of the cases, 317(43.1%) perceived their first
visit was delayed for which 256(80.8%) and 109(26.1%) reasoned expecting the illness to limit
by itself and lack of money respectively. Among the cases, 545(74.1%) had relatively good
knowledge about TB illness and its treatment (Table 8).
Table 8; Healthcare seeking practices among TB cases, Southwestern Ethiopia, January to
December 2015 (n=735)
Variable Frequency (%)
First symptoms encountered * Cough 563(76.6)
Night sweat 345(46.9)
Fever 300(40.8)
Loss of appetite 279(38)
Chest pain 267(36.3)
Weight loss 236(32.1)
Haemoptysis 144(19.6)
Othersa 62(8.4)
First action to illness Visit HCF 596(81.1)
Self-treatment 98(13.3)
Visit holy water 26(3.5)
Consult traditional healer 15(2.0)
Perceived reason for not
visiting HCF first (n=149)* Thought illness limit by itself 97(65.1)
Perceived long waiting time at HCF 37(24.8)
Perceived expensive service fee 37(24.8)
HCF too far 29(19.5)
Other b 22(14.8)
First HCF visited Private clinic 260(35.4)
Health center 238(32.4)

58
Hospital 221(30.1)
Health post 16(2.2)
Source of advice/referral to
visit first HCF Self 472(64.2)
Parent/relative 280(38.1)
HEW c 32(4.4)
TB patient 30(4.1)
HIV care clinic 16(2.2)
Otherd 31(4.2)
Travel time to treatment center <=1hour 582(79.2)
>1hour 153(20.8)
Knowledge towards TB Good 545(74.1)
Poor 190(25.9)
Patient delay (days) Median(IQR) 25(15-36)
Median (95%CI) 25(22,28)
*percentage total beyond 100% due to multiple response
a neck swelling, head ache, joint pain, back
pain, wound ,bHCF closed, mistrust health care provider, bad previous experience at HCF, fear of HIV
test and fear of TB diagnosis, cHEW= Health Extension worker(trained females those provide
household package of health care to household), ddrug shop(13),holy water(14),traditional healer(4)
6.3.3. Health system delays and clinical characteristics of the cases
After the first formal healthcare consultation, diagnosis and initiation of anti-TB treatment took a
median (IQR) 22(8-48) days (provider or health system delay). The provider delay is
significantly correlated with patient delay (r=0.2, P<0.001). Patients made a median (IQR) of
3(2-4) visits to median (IQR) 2(1-3) healthcare facilities until TB diagnosis. Diagnosis of 61.0%
of the cases was made at hospital (Table 9) and in 373(50.7%), diagnosis was bacteriologically
confirmed with sputum smear microscopy. Thus 586(79.7%) of the cases had pulmonary TB of
whom 373(63.2%) were smear positive. Before commencement of treatment, all of the cases
were offered HIV screening test of whom 68 (9.3%) tested positive [95% CI (7.2%-11.3%)].
Following the diagnosis of TB, 613(83.4%) of the cases were put on anti-TB treatment
immediately and the rest after a median (range) 2(1-7) days. Of the total cases, 162(22%) started
anti-TB treatment within 30days of the onset of illness. Since onset of the illness, a median
(IQR) of 55(32-100) days had undergone until anti-TB treatment initiation (total delay). More
than half (54.6%) of the total delay was attributed to provider and the rest to the patient.

59
Table 9: Clinical characteristics and delays to treatment among TB patients, January to December
2015, Southwest Ethiopia
Variable Frequency (%)
Place TB diagnosis made Hospital 448(61.0)
Health center 188(25.6)
Private clinic 99(13.5)
Type of TB Smear positive Pulmonary 373(50.3)
Smear negative Pulmonary 213(29.0)
Extra pulmonary 149(20.3)
Mode of diagnosis Bacteriological 373(50.7)
Clinical 362(49.3)
HIV status Positive 68(9.3)
Negative 667(90.7)
Number of HCF visited a Median (IQR) 2(1-3)
Number of visits made b
Median (IQR) 3(2-4)
Provider delay (days) Median (IQR) 22(8-48)
Median(95%CI) 22(19,25)
Total delay (days) Median (IQR) 55(32-100)
Median (95%CI) 55(49,61)
Hospitalized during treatment Yes 19(2.6) a number of HCF visited until diagnosis of TB is made,
b number of total visits made to different HCF
until TB diagnosis
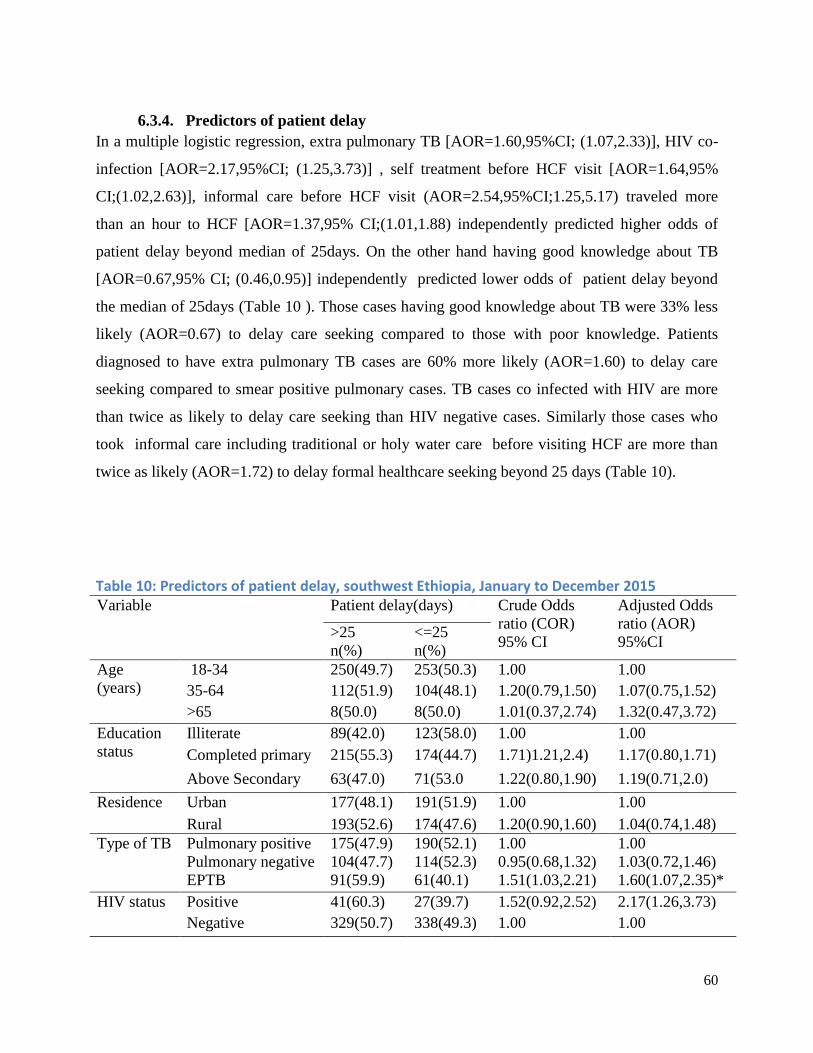
60
6.3.4. Predictors of patient delay
In a multiple logistic regression, extra pulmonary TB [AOR=1.60,95%CI; (1.07,2.33)], HIV co-
infection [AOR=2.17,95%CI; (1.25,3.73)] , self treatment before HCF visit [AOR=1.64,95%
CI;(1.02,2.63)], informal care before HCF visit (AOR=2.54,95%CI;1.25,5.17) traveled more
than an hour to HCF [AOR=1.37,95% CI;(1.01,1.88) independently predicted higher odds of
patient delay beyond median of 25days. On the other hand having good knowledge about TB
[AOR=0.67,95% CI; (0.46,0.95)] independently predicted lower odds of patient delay beyond
the median of 25days (Table 10 ). Those cases having good knowledge about TB were 33% less
likely (AOR=0.67) to delay care seeking compared to those with poor knowledge. Patients
diagnosed to have extra pulmonary TB cases are 60% more likely (AOR=1.60) to delay care
seeking compared to smear positive pulmonary cases. TB cases co infected with HIV are more
than twice as likely to delay care seeking than HIV negative cases. Similarly those cases who
took informal care including traditional or holy water care before visiting HCF are more than
twice as likely (AOR=1.72) to delay formal healthcare seeking beyond 25 days (Table 10).
Table 10: Predictors of patient delay, southwest Ethiopia, January to December 2015
Variable Patient delay(days) Crude Odds
ratio (COR)
95% CI
Adjusted Odds
ratio (AOR)
95%CI >25
n(%)
<=25
n(%)
Age
(years)
18-34 250(49.7) 253(50.3) 1.00 1.00
35-64 112(51.9) 104(48.1) 1.20(0.79,1.50) 1.07(0.75,1.52)
>65 8(50.0) 8(50.0) 1.01(0.37,2.74) 1.32(0.47,3.72)
Education
status
Illiterate 89(42.0) 123(58.0) 1.00 1.00
Completed primary 215(55.3) 174(44.7) 1.71)1.21,2.4) 1.17(0.80,1.71)
Above Secondary 63(47.0) 71(53.0 1.22(0.80,1.90) 1.19(0.71,2.0)
Residence Urban 177(48.1) 191(51.9) 1.00 1.00
Rural 193(52.6) 174(47.6) 1.20(0.90,1.60) 1.04(0.74,1.48)
Type of TB Pulmonary positive 175(47.9) 190(52.1) 1.00 1.00
Pulmonary negative 104(47.7) 114(52.3) 0.95(0.68,1.32) 1.03(0.72,1.46)
EPTB 91(59.9) 61(40.1) 1.51(1.03,2.21) 1.60(1.07,2.35)*
HIV status
Positive 41(60.3) 27(39.7) 1.52(0.92,2.52) 2.17(1.26,3.73)
Negative 329(50.7) 338(49.3) 1.00 1.00

61
First action
to illness
Self treatment 60(61.2) 38(38.8) 1.84(1.17,2.85) 1.64(1.02,2.63)*
Informal care** 29(70.7) 12(29.3) 2.70(1.35,5.40) 2.54(1.25,5.17)*
Consult HCP 281(47.1) 315(52.9) 1.00 1.00
First
visited
HCF
Health post 13(81.3) 3(18.8) 1.00 1.00
Health center 130(54.6) 108(45.4) 0.26(0.07,0.95) 0.28(0.10,1.05)
Hospital 98(44.3) 123(55.7) 0.18(0.0,0.64) 0.19(0.05,0.71)*
Private clinic 129(49.6) 131(50.4) 0.22(0.06,0.79) 0.24(0.06,0.87)*
Travel time
to HCF
<=1hour 205(46.9) 232(53.1) 1.00 1.00
>1hour 165(55.4) 133(44.6) 1.37(1.02,1.84) 1.37(1.01,1.88)*
Knowledge
towards TB
Good 264(48.4) 281(51.6) 0.77(0.55,1.07) 0.67(0.46,0.98)*
Poor 106(55.8) 84(44.2) 1.00 1.00 *statistically significant at p<0.05,** Traditional care or Holy water
6.3.5. Predictors of provider delay
First visiting non DOTS HCF [AOR=1.42,95% CI;(1.01, 2.0)], visited more than one HCF
AOR=2.34, 95% CI;(1.69, 3.24) and sought care after 25days from onset of illness
AOR=1.81,95% CI;(1.33, 2.5) independently predicted higher odds of provider delays exceeding
22 days (Table 11). Those cases first visited non-DOTS center including health post or private
clinics are 42% more likely to have delayed diagnosis and treatment compared to those visited
DOTS providing facilities. Cases who delayed beyond 25days are 81% more likely to have
provider delay beyond the median of 22days. Cases who visited more than one HCF until
diagnosis are more than twice as likely to have diagnosis and treatment delay beyond 22 days.
Table 11: Predictors of provider delay among TB cases, southwest Ethiopia, January to December 2015
Variable Provider delay(days) COR( 95% CI) AOR( 95%CI)
>22 n(%) <=22 n(%)
TB type PPosa
182(49.9) 183(50.1) 1.00 1.00
PNegb
10347.2) 115(52.8) 0.9(0.64,1.26) 0.87(0.60,1.25)
Extra pulmonary 82(53.9) 70(46.1) 1.18(0.81,1.72) 1.08(0.72,1.62)
HIV status
Positive 39(57.4) 29(42.6) 1.38(0.84,2.30) 1.33(0.78,2.27)
Negative 328(49.2) 339(50.8) 1.00 1.00
First
action to
illness
Self treatment 44 (44.9) 54(55.1) 0.81(0.53,1.25) 0.75(0.47,1.19)
Traditional care 9(60.0) 6(40.0) 1.5(0.53,4.27) 1.19(0.47,3.51)
Holy water 16(61.5) 10(38.5) 1.6(0.71,3.58) 1.28(0.55,2.99)
Consult HCPc
298(50.0) 298(50.0) 1.00 1.00
First DOTS center 203(44.2) 256(55.8) 1.00 1.00
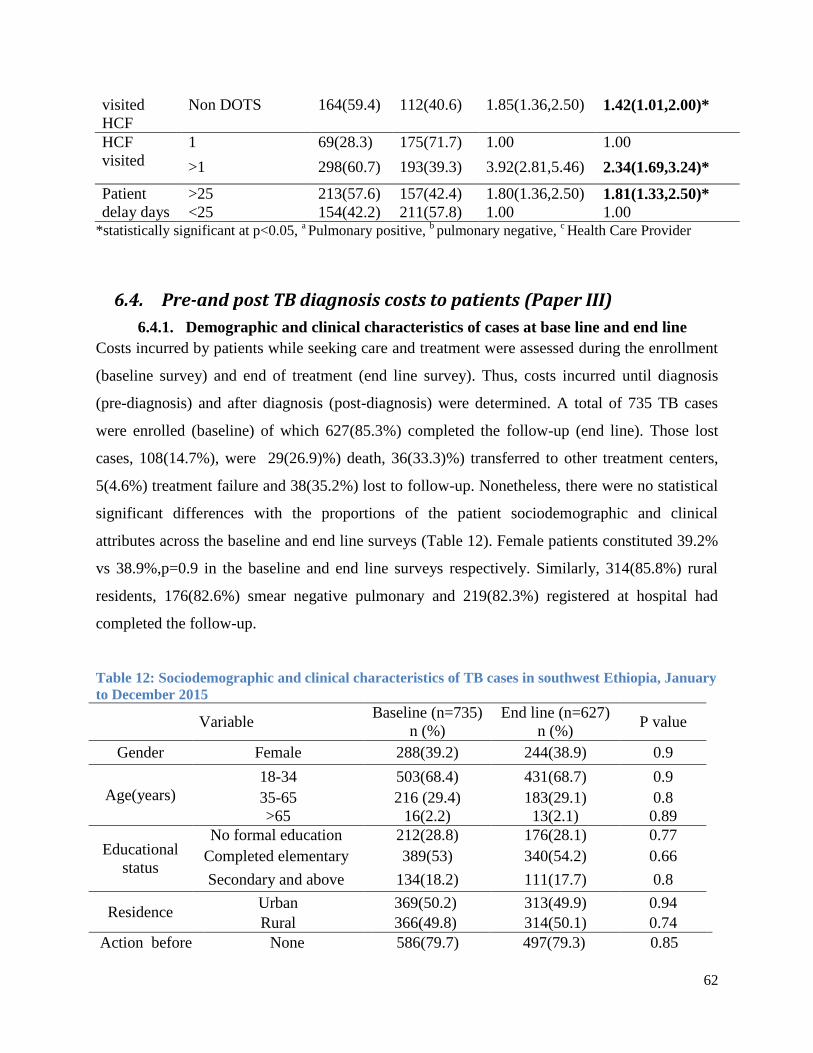
62
visited
HCF
Non DOTS 164(59.4) 112(40.6) 1.85(1.36,2.50) 1.42(1.01,2.00)*
HCF
visited
1 69(28.3) 175(71.7) 1.00 1.00
>1 298(60.7) 193(39.3) 3.92(2.81,5.46) 2.34(1.69,3.24)*
Patient
delay days
>25 213(57.6) 157(42.4) 1.80(1.36,2.50) 1.81(1.33,2.50)*
<25 154(42.2) 211(57.8) 1.00 1.00 *statistically significant at p<0.05,
a Pulmonary positive,
b pulmonary negative,
c Health Care Provider
6.4. Pre-and post TB diagnosis costs to patients (Paper III)
6.4.1. Demographic and clinical characteristics of cases at base line and end line
Costs incurred by patients while seeking care and treatment were assessed during the enrollment
(baseline survey) and end of treatment (end line survey). Thus, costs incurred until diagnosis
(pre-diagnosis) and after diagnosis (post-diagnosis) were determined. A total of 735 TB cases
were enrolled (baseline) of which 627(85.3%) completed the follow-up (end line). Those lost
cases, 108(14.7%), were 29(26.9)%) death, 36(33.3)%) transferred to other treatment centers,
5(4.6%) treatment failure and 38(35.2%) lost to follow-up. Nonetheless, there were no statistical
significant differences with the proportions of the patient sociodemographic and clinical
attributes across the baseline and end line surveys (Table 12). Female patients constituted 39.2%
vs 38.9%,p=0.9 in the baseline and end line surveys respectively. Similarly, 314(85.8%) rural
residents, 176(82.6%) smear negative pulmonary and 219(82.3%) registered at hospital had
completed the follow-up.
Table 12: Sociodemographic and clinical characteristics of TB cases in southwest Ethiopia, January
to December 2015
Variable Baseline (n=735)
n (%)
End line (n=627)
n (%) P value
Gender Female 288(39.2) 244(38.9) 0.9
Age(years)
18-34 503(68.4) 431(68.7) 0.9
35-65 216 (29.4) 183(29.1) 0.8
>65 16(2.2) 13(2.1) 0.89
Educational
status
No formal education 212(28.8) 176(28.1) 0.77
Completed elementary 389(53) 340(54.2) 0.66
Secondary and above 134(18.2) 111(17.7) 0.8
Residence Urban 369(50.2) 313(49.9) 0.94
Rural 366(49.8) 314(50.1) 0.74
Action before None 586(79.7) 497(79.3) 0.85
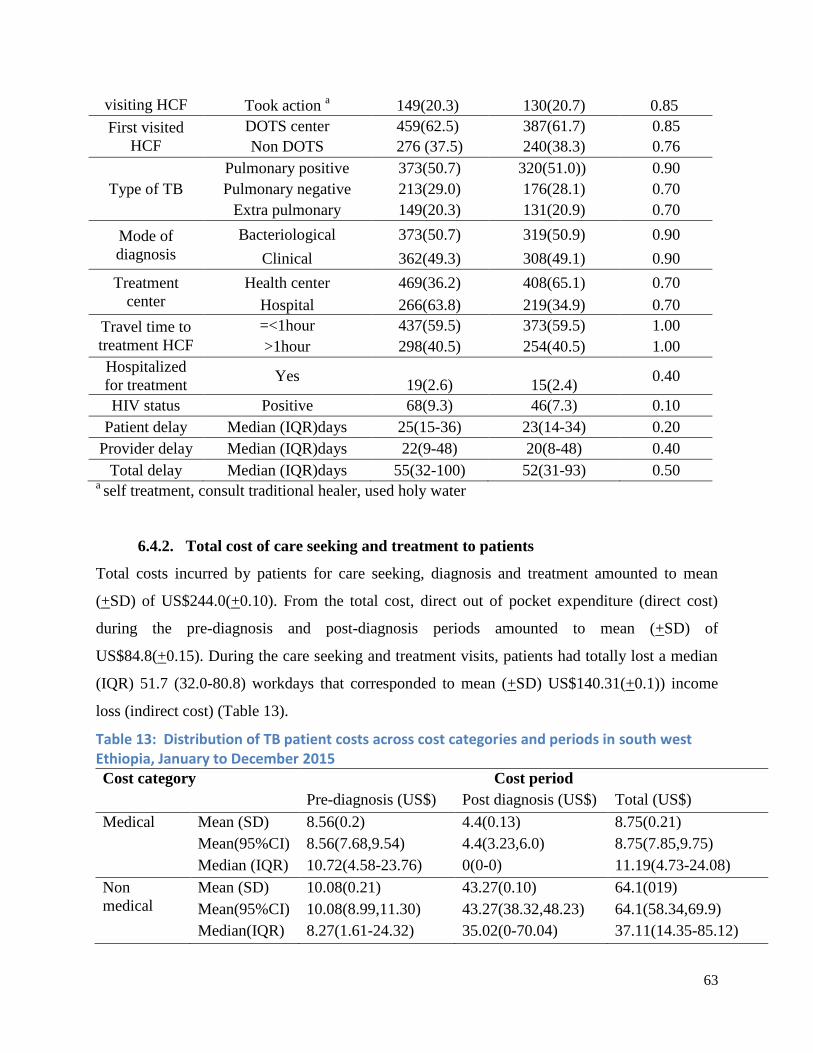
63
visiting HCF Took action a 149(20.3) 130(20.7) 0.85
First visited
HCF
DOTS center 459(62.5) 387(61.7) 0.85
Non DOTS 276 (37.5) 240(38.3) 0.76
Type of TB
Pulmonary positive 373(50.7) 320(51.0)) 0.90
Pulmonary negative 213(29.0) 176(28.1) 0.70
Extra pulmonary 149(20.3) 131(20.9) 0.70
Mode of
diagnosis
Bacteriological 373(50.7) 319(50.9) 0.90
Clinical 362(49.3) 308(49.1) 0.90
Treatment
center
Health center 469(36.2) 408(65.1) 0.70
Hospital 266(63.8) 219(34.9) 0.70
Travel time to
treatment HCF
=<1hour 437(59.5) 373(59.5) 1.00
>1hour 298(40.5) 254(40.5) 1.00
Hospitalized
for treatment Yes
19(2.6)
15(2.4) 0.40
HIV status Positive 68(9.3) 46(7.3) 0.10
Patient delay Median (IQR)days 25(15-36) 23(14-34) 0.20
Provider delay Median (IQR)days 22(9-48) 20(8-48) 0.40
Total delay Median (IQR)days 55(32-100) 52(31-93) 0.50 a self treatment, consult traditional healer, used holy water
6.4.2. Total cost of care seeking and treatment to patients
Total costs incurred by patients for care seeking, diagnosis and treatment amounted to mean
(+SD) of US$244.0(+0.10). From the total cost, direct out of pocket expenditure (direct cost)
during the pre-diagnosis and post-diagnosis periods amounted to mean (+SD) of
US$84.8(+0.15). During the care seeking and treatment visits, patients had totally lost a median
(IQR) 51.7 (32.0-80.8) workdays that corresponded to mean (+SD) US$140.31(+0.1)) income
loss (indirect cost) (Table 13).
Table 13: Distribution of TB patient costs across cost categories and periods in south west Ethiopia, January to December 2015 Cost category Cost period
Pre-diagnosis (US$) Post diagnosis (US$) Total (US$)
Medical Mean (SD) 8.56(0.2) 4.4(0.13) 8.75(0.21)
Mean(95%CI) 8.56(7.68,9.54) 4.4(3.23,6.0) 8.75(7.85,9.75)
Median (IQR) 10.72(4.58-23.76) 0(0-0) 11.19(4.73-24.08)
Non
medical
Mean (SD) 10.08(0.21) 43.27(0.10) 64.1(019)
Mean(95%CI) 10.08(8.99,11.30) 43.27(38.32,48.23) 64.1(58.34,69.9)
Median(IQR) 8.27(1.61-24.32) 35.02(0-70.04) 37.11(14.35-85.12)
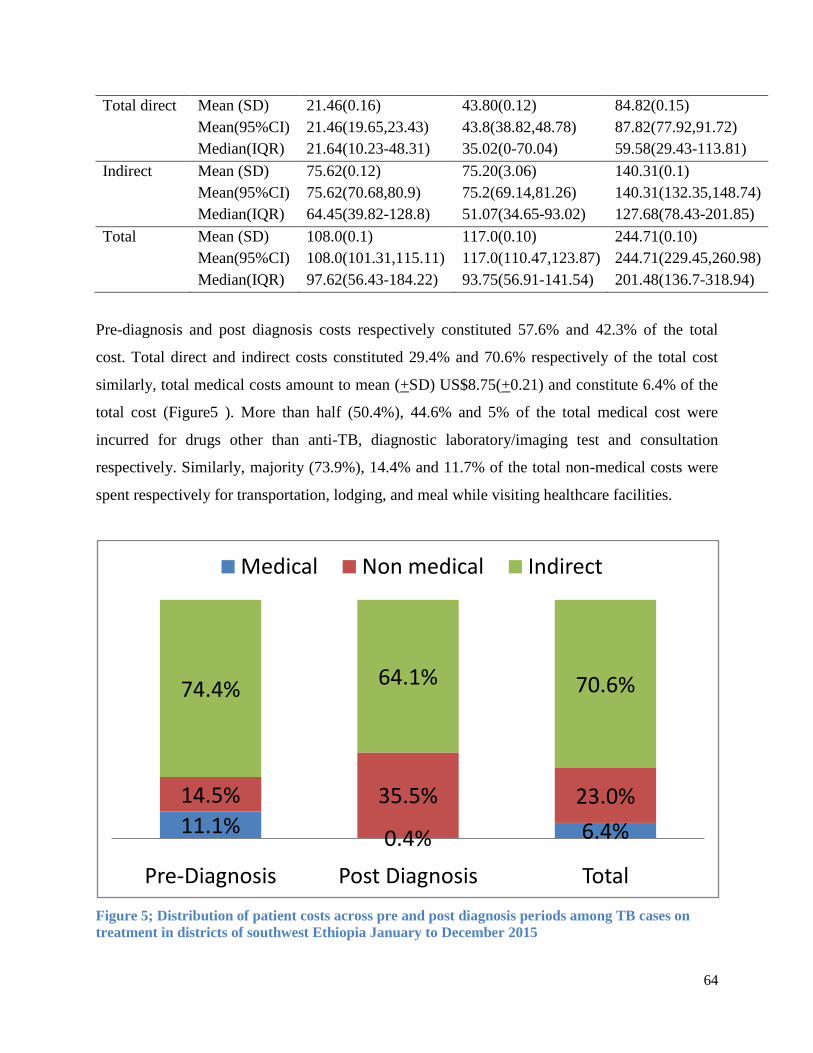
64
Total direct Mean (SD) 21.46(0.16) 43.80(0.12) 84.82(0.15)
Mean(95%CI) 21.46(19.65,23.43) 43.8(38.82,48.78) 87.82(77.92,91.72)
Median(IQR) 21.64(10.23-48.31) 35.02(0-70.04) 59.58(29.43-113.81)
Indirect Mean (SD) 75.62(0.12) 75.20(3.06) 140.31(0.1)
Mean(95%CI) 75.62(70.68,80.9) 75.2(69.14,81.26) 140.31(132.35,148.74)
Median(IQR) 64.45(39.82-128.8) 51.07(34.65-93.02) 127.68(78.43-201.85)
Total Mean (SD) 108.0(0.1) 117.0(0.10) 244.71(0.10)
Mean(95%CI) 108.0(101.31,115.11) 117.0(110.47,123.87) 244.71(229.45,260.98)
Median(IQR) 97.62(56.43-184.22) 93.75(56.91-141.54) 201.48(136.7-318.94)
Pre-diagnosis and post diagnosis costs respectively constituted 57.6% and 42.3% of the total
cost. Total direct and indirect costs constituted 29.4% and 70.6% respectively of the total cost
similarly, total medical costs amount to mean (+SD) US$8.75(+0.21) and constitute 6.4% of the
total cost (Figure5 ). More than half (50.4%), 44.6% and 5% of the total medical cost were
incurred for drugs other than anti-TB, diagnostic laboratory/imaging test and consultation
respectively. Similarly, majority (73.9%), 14.4% and 11.7% of the total non-medical costs were
spent respectively for transportation, lodging, and meal while visiting healthcare facilities.
Figure 5; Distribution of patient costs across pre and post diagnosis periods among TB cases on
treatment in districts of southwest Ethiopia January to December 2015
11.1%0.4% 6.4%
14.5% 35.5% 23.0%
74.4%64.1% 70.6%
Pre-Diagnosis Post Diagnosis Total
Medical Non medical Indirect

65
6.4.3. Pre-diagnosis patient cost and its predictors
Until diagnosis of TB (pre-diagnosis), patients incurred a mean (+SD) US$108.0 (+0.1) for care
seeking and diagnosis (Table 13). Of the total pre-diagnosis cost, direct out-of-pocket
expenditures (direct cost) amounted to mean (+SD) US$21.46(+0.16) and constituted 25.6% of
the total pre diagnosis costs (Figure 5). Patients had lost median (IQR) of 24.7(15.1-48.4)
workdays until diagnosis that corresponded to mean (+SD) US$75.62(+0.12) income loss. Out of
the total pre-diagnosis medical costs, more than half (52.5%), 41.3% and 6.2% were incurred for
drugs other than anti-TB, diagnostic laboratory/imaging tests, and consultation fee respectively.
Similarly, 38.9%, 36.3% and 24.8% were respectively spent for transportation, meal and lodging
while visiting healthcare facilities. The pre-diagnosis cost is significantly correlated with patient
(γ=0.32,p<0.001), provider (γ =0.64,p<0.001) and total delays (γ =0.68,p<0.001) and number of
HCF visited until diagnosis (γ=0.42,p<0.001). The mean pre-diagnosis cost is significantly
different across type of TB (F=10.03,p<0.00), type of first visited HCF(p=0.002), type of HCF
where diagnosis made (p<0.001) and mode of diagnosis (p=0.001) (Table 14).
Table 14; Differences in pre and post TB diagnosis patient cost across different attributes, January
to December 2015, Southwest Ethiopia
Variable Total pre diagnosis
cost(US$)
Total post diagnosis
cost(US$) Total cost(US$)
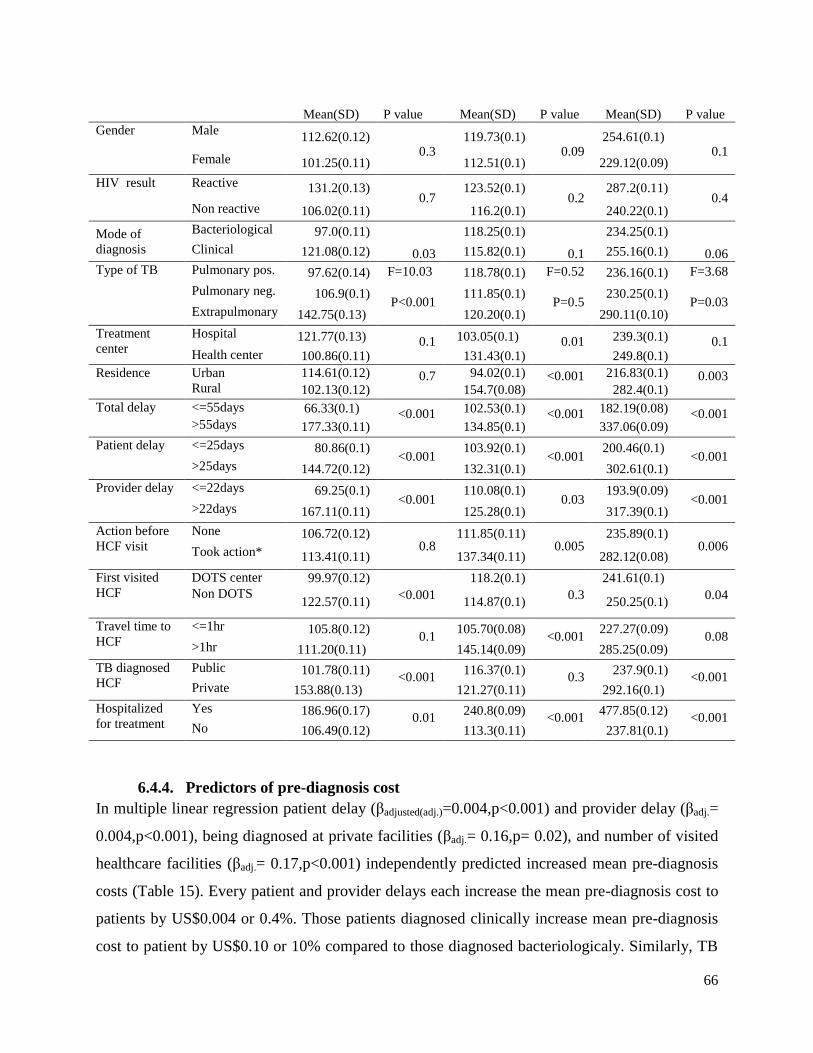
66
6.4.4. Predictors of pre-diagnosis cost
In multiple linear regression patient delay (βadjusted(adj.)=0.004,p<0.001) and provider delay (βadj.=
0.004,p<0.001), being diagnosed at private facilities (βadj.= 0.16,p= 0.02), and number of visited
healthcare facilities (βadj.= 0.17,p<0.001) independently predicted increased mean pre-diagnosis
costs (Table 15). Every patient and provider delays each increase the mean pre-diagnosis cost to
patients by US$0.004 or 0.4%. Those patients diagnosed clinically increase mean pre-diagnosis
cost to patient by US$0.10 or 10% compared to those diagnosed bacteriologicaly. Similarly, TB
Mean(SD) P value Mean(SD) P value Mean(SD) P value
Gender Male 112.62(0.12)
0.3
119.73(0.1) 0.09
254.61(0.1) 0.1
Female 101.25(0.11) 112.51(0.1) 229.12(0.09)
HIV result Reactive 131.2(0.13) 0.7
123.52(0.1) 0.2
287.2(0.11) 0.4
Non reactive 106.02(0.11) 116.2(0.1) 240.22(0.1)
Mode of
diagnosis
Bacteriological 97.0(0.11)
0.03
118.25(0.1)
0.1
234.25(0.1)
0.06 Clinical 121.08(0.12) 115.82(0.1) 255.16(0.1)
Type of TB Pulmonary pos. 97.62(0.14) F=10.03
P<0.001
118.78(0.1) F=0.52
P=0.5
236.16(0.1) F=3.68
P=0.03
Pulmonary neg. 106.9(0.1) 111.85(0.1) 230.25(0.1)
Extrapulmonary 142.75(0.13) 120.20(0.1) 290.11(0.10)
Treatment
center
Hospital 121.77(0.13) 0.1
103.05(0.1) 0.01
239.3(0.1) 0.1
Health center 100.86(0.11) 131.43(0.1) 249.8(0.1)
Residence Urban 114.61(0.12) 0.7
94.02(0.1) <0.001
216.83(0.1) 0.003
Rural 102.13(0.12) 154.7(0.08) 282.4(0.1)
Total delay <=55days 66.33(0.1) <0.001
102.53(0.1) <0.001
182.19(0.08) <0.001
>55days 177.33(0.11) 134.85(0.1) 337.06(0.09)
Patient delay <=25days 80.86(0.1) <0.001
103.92(0.1) <0.001
200.46(0.1) <0.001
>25days 144.72(0.12) 132.31(0.1) 302.61(0.1)
Provider delay <=22days 69.25(0.1) <0.001
110.08(0.1) 0.03
193.9(0.09) <0.001
>22days 167.11(0.11) 125.28(0.1) 317.39(0.1)
Action before
HCF visit
None 106.72(0.12) 0.8
111.85(0.11) 0.005
235.89(0.1) 0.006
Took action* 113.41(0.11) 137.34(0.11) 282.12(0.08)
First visited
HCF
DOTS center 99.97(0.12)
<0.001
118.2(0.1)
0.3
241.61(0.1)
0.04
Non DOTS 122.57(0.11) 114.87(0.1) 250.25(0.1)
Travel time to
HCF
<=1hr 105.8(0.12) 0.1
105.70(0.08) <0.001
227.27(0.09) 0.08
>1hr 111.20(0.11) 145.14(0.09) 285.25(0.09)
TB diagnosed
HCF
Public 101.78(0.11) <0.001
116.37(0.1) 0.3
237.9(0.1) <0.001
Private 153.88(0.13) 121.27(0.11) 292.16(0.1)
Hospitalized
for treatment
Yes 186.96(0.17) 0.01
240.8(0.09) <0.001
477.85(0.12) <0.001
No 106.49(0.12) 113.3(0.11) 237.81(0.1)

67
diagnosis at private facilities increase mean total pre-diagnosis cost to patient by US$0.18 or
18% compared to diagnosis at public healthcare facilities.
Table 15: Predictors of pre-diagnosis cost among TB cases southwest Ethiopia January to December 2015
Variable
Mean (SD)
(US$)a
Unadjusted b
coefficient
Adjusted
coefficientb
𝑒β (95%CI)
(β) (95% CI) (β)(95% CI)
Gender
Male 112.62(0.12) Ref. Ref. Ref.
Female 101.25(0.11) -0.05(-0.10,0.01) -0.065(-0.16,0.026) 0.94(0.86,1.03)
HIV
result Positive 131.2(0.13) 0.93(-0.01,0.19) 0.16(0.003,0.32)* 1.17(1.00,1.38)
Negative 106.02(0.11) Ref. Ref. Ref.
Mode of
diagnosis
Bacteriological 97.00(0.11) Ref. Ref.
Clinical 121.08(0.12) 0.97(0.04,0.15)* 0.08(0.011,0.17) 1.1(1.01,1.18)
Residence
Urban 114.61(0.12) Ref. Ref. Ref.
Rural 102.13(0.1) -0.05(-0.1,0.004) -0.014(-0.13,0.10) 0.96(0.88,1.06)
Patient delay c(days) 0.003(0.002,0.003)* 0.004(0.004,0.005)* 1.004(1.004,1.005)*
Provider delay c(days) 0.003(0.002,0.003)* 0.004(0.004,0.005)* 1.004(1.004,1.005)*
Action
before
HCF visit
None 106.72(0.12) Ref. Ref. Ref.
Took action d 113.41(0.11) 0.1(0.03,0.14)* 0.14(0.03,0.25)* 1.1(1.0,1.18)
First
visited
HCF
DOTS center 99.97(0.11) Ref. Ref. Ref.
Non DOTS
center 122.57(0.11) 0.1(0.03,0.14)* 0.013(-0.087,0.112) 1.01(0.92,1.12)
TB
diagnosed
HCF
Public 101.78(0.11) Ref. Ref. Ref.
Private 153.88(0.13) 0.18(0.1,0.26)* 0.16 (0.032,0.293)* 1.18(1.03,1.34)*
Number of HCF visited until Diagnosis b 0.15(0.13,0.17)* 0.17(0.13,0.32)* 1.18(1.13,1.23)*
Constant (95%CI) 3.04(2.97,3.10) *Statistically significant at p<0.05,
a mean total pre-diagnosis cost
b outcome variable is logpre-diagnosis
cost in US$ c variable treated as continuous,
d self treatment, used holy water, consult traditional healer
6.4.5. Post-diagnosis cost and its predictors
After the diagnosis of TB, patients totally incurred a mean (+SD) US$117.0(+0.09) until
completion of treatment (Table 13). During the post diagnosis period patients incurred total of
mean (+SD) 43.8(+0.12) for direct medical and non-medical expenses (direct cost). Thus, direct
out of pocket expenditure during the post diagnosis period constitutes 35.9% (Fig 5) of the total
post diagnosis cost. During the treatment, TB patients had lost median (IQR) of 21(13-35.3)
workdays that corresponded to mean (+SD) US$75.2(3.06) income loss (indirect cost). An
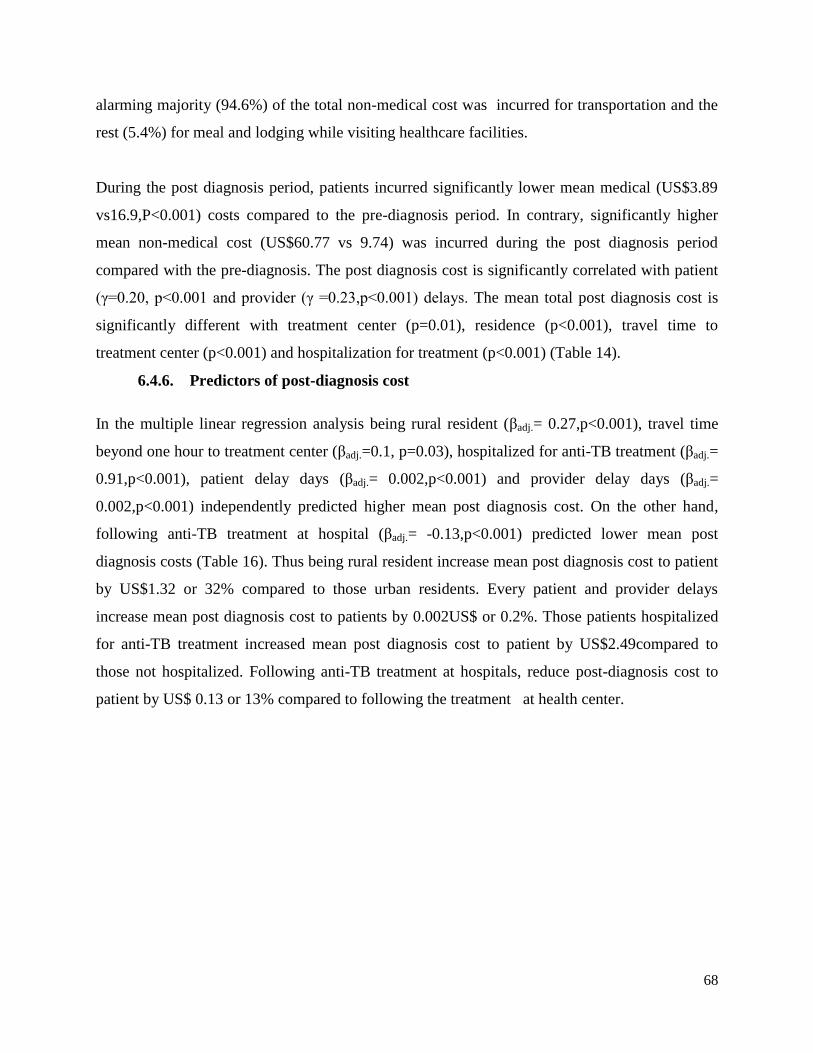
68
alarming majority (94.6%) of the total non-medical cost was incurred for transportation and the
rest (5.4%) for meal and lodging while visiting healthcare facilities.
During the post diagnosis period, patients incurred significantly lower mean medical (US$3.89
vs16.9,P<0.001) costs compared to the pre-diagnosis period. In contrary, significantly higher
mean non-medical cost (US$60.77 vs 9.74) was incurred during the post diagnosis period
compared with the pre-diagnosis. The post diagnosis cost is significantly correlated with patient
(γ=0.20, p<0.001 and provider (γ =0.23,p<0.001) delays. The mean total post diagnosis cost is
significantly different with treatment center (p=0.01), residence (p<0.001), travel time to
treatment center (p<0.001) and hospitalization for treatment (p<0.001) (Table 14).
6.4.6. Predictors of post-diagnosis cost
In the multiple linear regression analysis being rural resident (βadj.= 0.27,p<0.001), travel time
beyond one hour to treatment center (βadj.=0.1, p=0.03), hospitalized for anti-TB treatment (βadj.=
0.91,p<0.001), patient delay days (βadj.= 0.002,p<0.001) and provider delay days (βadj.=
0.002,p<0.001) independently predicted higher mean post diagnosis cost. On the other hand,
following anti-TB treatment at hospital (βadj.= -0.13,p<0.001) predicted lower mean post
diagnosis costs (Table 16). Thus being rural resident increase mean post diagnosis cost to patient
by US$1.32 or 32% compared to those urban residents. Every patient and provider delays
increase mean post diagnosis cost to patients by 0.002US$ or 0.2%. Those patients hospitalized
for anti-TB treatment increased mean post diagnosis cost to patient by US$2.49compared to
those not hospitalized. Following anti-TB treatment at hospitals, reduce post-diagnosis cost to
patient by US$ 0.13 or 13% compared to following the treatment at health center.

69
Table 16: Predictors of post diagnosis cost among TB cases on treatment in southwest Ethiopia, January to December 2015
Variable
Mean(SD)US$a
Unadjusted b
coefficient(β)
Adjusted b
coefficient(β) 𝑒β (95%CI)
(95% CI) (95% CI)
Gender Male 119.73(0.1) Ref. Ref. Ref.
Female 112.51(0.1) -0.03(-0.08,0.25) 0.12(-0.23,0.018) 0.92(0.87,1.02)
Residence Urban 94.02(0.11) Ref. Ref.
Rural 154.7(0.08) 0.21(0.17,0.26)* 0.27(0.16,0.39) 1.32(1.18,1.48)*
Educational
status
Illiterate 137.15(0.09) Ref Ref Ref.
Primary 117.35(0.09) -0.06(-0.13,-0.01)* 0.87(0.77,0.97) 0.91(0.81,1.03)
Secondary 97.79(0.08) -0.15(-0.22,-0.1)* 0.83(0.72,0.95) 0.89(0.76,1.04)
HIV result Positive 123.52(0.1) 0.02(-0.05,0.11) 0.08(-0.11,0.27) 1.08(0.90,1.31)
Negative 116.20(0.1) Ref. Ref. Ref.
Mode of
diagnosis
Bacteriological 118.25(0.1) Ref. Ref. Ref.
Clinical 115.82(0.1) -0.01(-0.06,0.04) 0.59(-0.04,0.16) 1.07(0.96,1.17)
Treatment
center
Hospital 103.05(0.1) -0.11(-0.15,-0.1)* -0.13(-0.22,-0.02) 0.88(0.80,0.98)*
Health center 131.43(0.1) Ref. Ref.
Travel time to
treatment
>1hour 105.7(0.08) 0.14(0.1,0.19)* 0.1(0.03,0.25) 1.11(1.03,1.28)*
<=1hour 145.14(0.09) Ref. Ref.
Patient delay c 0.001(0.001,0.002* 0.002(0.002,0.003) 1.002(1.001,1.003*
Provider delay c 0.001(0.001,0.002* 0.002(0.002,0.003) 1.002(1.001,1.003*
Action before
HCF visit
None 111.85(0.11) Ref. Ref.
Took action d 137.34(0.1) 0.1(0.03,0.15)* 0.14(0.021,0.27) 1.15(1.02,1.30)
TB diagnosed
HCF
Public 116.37(0.1) Ref. Ref.
Private 121.27(0.1) 0.02(-0.06,0.09) 0.04(-0.01,0.19) 1.04(0.90,1.20)
Hospitalized
for treatment
Yes 240.82(0.1) 0.33(0.21,0.45)* 0.91(0.59,1.24) 2.49(1.79,3.45)*
No 113.3(0.1) Ref. Ref. Ref.
Constant (95%CI) 7.22(7.01,7.40)
*statistically significant at p<0.05, a mean total post-diagnosis cost, b outcome variable is logpost-diagnosis cost in US$c variable

70
treated as continuous, c self treatment, used holy water, consult traditional healer
6.5. Delayed anti-TB treatment and patient outcomes (Paper IV)
A median (IQR) of 55 days had been elapsed since onset of illness to TB treatment initiation.
Thus 370 (50.3%) and 365(49.7%) had respectively initiated anti-TB treatment within and above
the median of 55days. The two groups, those initiated treatments above 55 days (exposed) and
within 55 days of onset (non-exposed) were followed for their treatment outcomes. As shown in
(Table 17), there were no statistically significant difference with gender (p=0.6), residence
(p=0.7), educational status (0=0.2) and HIV status (p=0.4) across the two groups (exposed and
non-exposed). In contrary, there were statistical significant difference in proportions of type of
TB (p=0.02), age group (p=0.04), and action before formal healthcare visit (p=0.04). At the start
of treatment, 723 (98.4%) of the cases were offered with information about the TB disease and
its treatment. Nonetheless, adequate information were provided for 357 (48.6%) of the cases
were offered adequate information.
Table 17 Characteristics of TB cases across time spent to initiate treatment in southwest Ethiopia
January to December 2015
Variable
Total delay(days)
P value
>55
(Exposed)
<=55
(Non exposed)
n(%) (n=365) N(%) (n=370)
Gender Male 219(60) 228(61.6) 0.6
Female 146(40) 142((30.4)
Age group
(years)
18-34 255(69.8) 248(67.0) 0.04
35-65 107(29.3) 109(29.5)
>65 3(0.9) 13(3.5)
Residence Urban 180(49.3) 188(50.8) 0.7
Rural 185(50.7) 182(49.2)
Educational
status
Illiterate 96(26.3) 116(31.4) 0.2
Completed primary 206(56.4) 183(49.5)
Above secondary 63(17.3) 71(19.1)
Type of TB Pulmonary positive 172(47.1) 201(54.3) 0.02
Pulmonary negative 104(28.5) 109(29.5)
Extra pulmonary 89(24.4) 60(16.2)
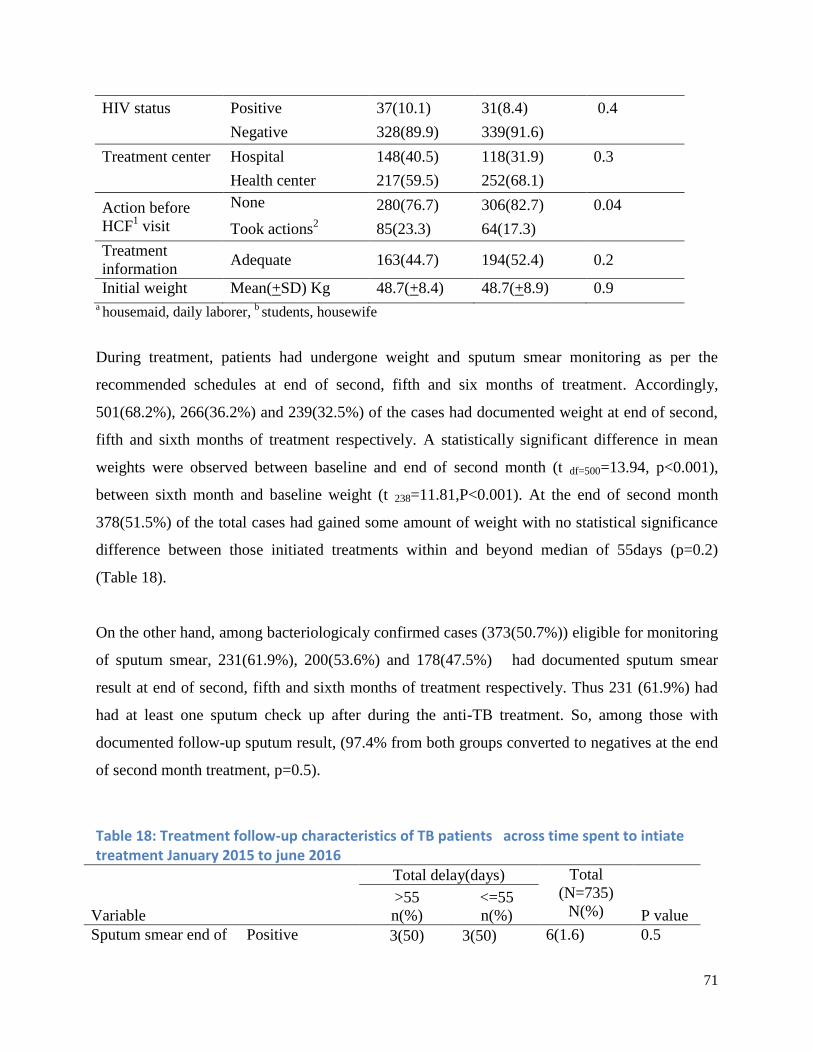
71
HIV status Positive 37(10.1) 31(8.4) 0.4
Negative 328(89.9) 339(91.6)
Treatment center Hospital 148(40.5) 118(31.9) 0.3
Health center 217(59.5) 252(68.1)
Action before
HCF1 visit
None 280(76.7) 306(82.7) 0.04
Took actions2 85(23.3) 64(17.3)
Treatment
information Adequate 163(44.7) 194(52.4) 0.2
Initial weight Mean(+SD) Kg 48.7(+8.4) 48.7(+8.9) 0.9 a housemaid, daily laborer,
b students, housewife
During treatment, patients had undergone weight and sputum smear monitoring as per the
recommended schedules at end of second, fifth and six months of treatment. Accordingly,
501(68.2%), 266(36.2%) and 239(32.5%) of the cases had documented weight at end of second,
fifth and sixth months of treatment respectively. A statistically significant difference in mean
weights were observed between baseline and end of second month (t df=500=13.94, p<0.001),
between sixth month and baseline weight (t 238=11.81,P<0.001). At the end of second month
378(51.5%) of the total cases had gained some amount of weight with no statistical significance
difference between those initiated treatments within and beyond median of 55days (p=0.2)
(Table 18).
On the other hand, among bacteriologicaly confirmed cases (373(50.7%)) eligible for monitoring
of sputum smear, 231(61.9%), 200(53.6%) and 178(47.5%) had documented sputum smear
result at end of second, fifth and sixth months of treatment respectively. Thus 231 (61.9%) had
had at least one sputum check up after during the anti-TB treatment. So, among those with
documented follow-up sputum result, (97.4% from both groups converted to negatives at the end
of second month treatment, p=0.5).
Table 18: Treatment follow-up characteristics of TB patients across time spent to intiate treatment January 2015 to june 2016
Variable
Total delay(days) Total
(N=735)
N(%)
>55
n(%)
<=55
n(%)
P value
Sputum smear end of Positive 3(50) 3(50) 6(1.6) 0.5
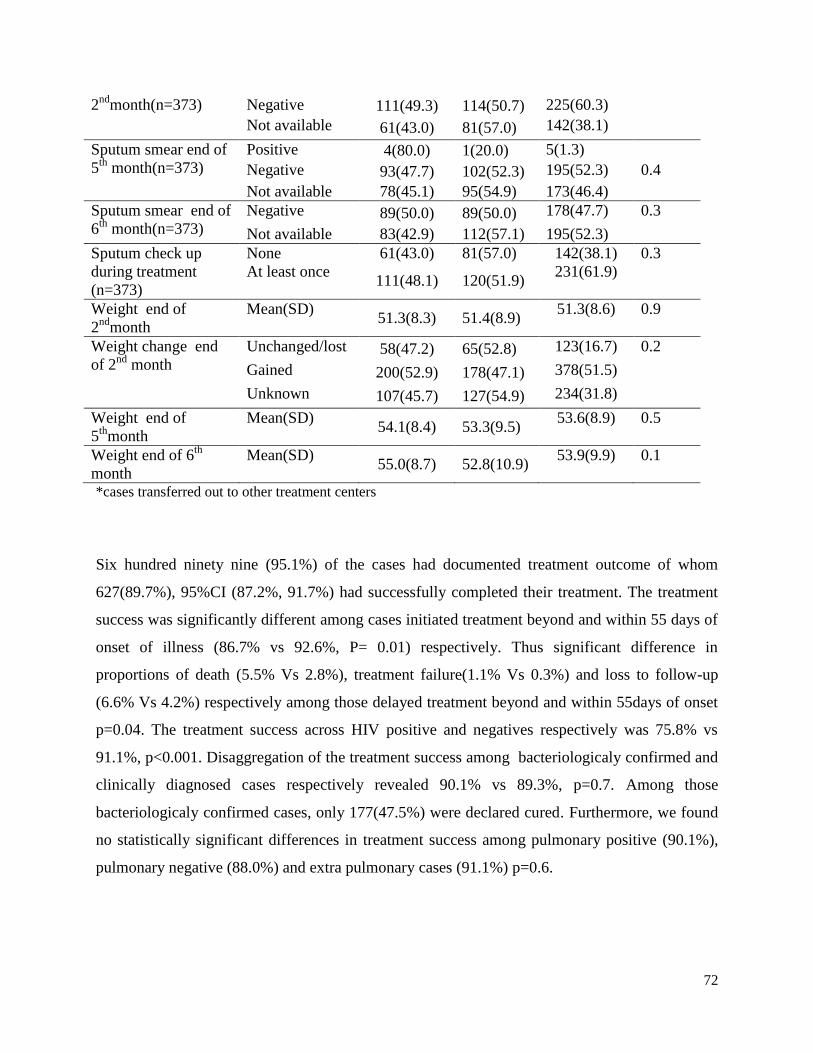
72
2nd
month(n=373) Negative 111(49.3) 114(50.7) 225(60.3)
Not available 61(43.0) 81(57.0) 142(38.1)
Sputum smear end of
5th
month(n=373)
Positive 4(80.0) 1(20.0) 5(1.3)
Negative 93(47.7) 102(52.3) 195(52.3) 0.4
Not available 78(45.1) 95(54.9) 173(46.4)
Sputum smear end of
6th
month(n=373)
Negative 89(50.0) 89(50.0) 178(47.7) 0.3
Not available 83(42.9) 112(57.1) 195(52.3)
Sputum check up
during treatment
(n=373)
None 61(43.0) 81(57.0) 142(38.1) 0.3
At least once 111(48.1) 120(51.9)
231(61.9)
Weight end of
2nd
month
Mean(SD) 51.3(8.3) 51.4(8.9)
51.3(8.6) 0.9
Weight change end
of 2nd
month
Unchanged/lost 58(47.2) 65(52.8) 123(16.7) 0.2
Gained 200(52.9) 178(47.1) 378(51.5)
Unknown 107(45.7) 127(54.9) 234(31.8)
Weight end of
5th
month
Mean(SD) 54.1(8.4) 53.3(9.5)
53.6(8.9) 0.5
Weight end of 6th
month
Mean(SD) 55.0(8.7) 52.8(10.9)
53.9(9.9) 0.1
*cases transferred out to other treatment centers
Six hundred ninety nine (95.1%) of the cases had documented treatment outcome of whom
627(89.7%), 95%CI (87.2%, 91.7%) had successfully completed their treatment. The treatment
success was significantly different among cases initiated treatment beyond and within 55 days of
onset of illness (86.7% vs 92.6%, P= 0.01) respectively. Thus significant difference in
proportions of death (5.5% Vs 2.8%), treatment failure(1.1% Vs 0.3%) and loss to follow-up
(6.6% Vs 4.2%) respectively among those delayed treatment beyond and within 55days of onset
p=0.04. The treatment success across HIV positive and negatives respectively was 75.8% vs
91.1%, p<0.001. Disaggregation of the treatment success among bacteriologicaly confirmed and
clinically diagnosed cases respectively revealed 90.1% vs 89.3%, p=0.7. Among those
bacteriologicaly confirmed cases, only 177(47.5%) were declared cured. Furthermore, we found
no statistically significant differences in treatment success among pulmonary positive (90.1%),
pulmonary negative (88.0%) and extra pulmonary cases (91.1%) p=0.6.

73
Treatment outcome of patients varied significantly across time elapsed for initiation of treatment.
Thus patients delayed to initiate treatment (>55days) had 92% higher risk of having unsuccessful
outcome, Adjusted relative risk (ARR)=1.92, 95%CI;(1.30, 2.81). Moreover HIV co infection
ARR=2.18,95% CI;(1.47, 3.25) and treatment center being hospital ARR=3.73,95% CI;(2.23,
6.25) independently predicted higher risk of unsuccessful outcomes. In contrast, weight gain at
the end of second month treatment, ARR=0.40,95% CI;(0.19, 0.83) predicted lower risk of
unsuccessful outcome. Those patients gained weight at the end of two-month treatment
compared to the baseline had about 60% lower risk of having unsuccessful outcome (Table 19).
Table 19: Predictors of unsuccessful treatment outcome among TB cases in southwest Ethiopia
January 2015 to June 2016 (N=699)
Unsuccessful
n(%)
Successful
n(%)
CRR(95%CI) ARR(95%CI)
Gender Male 44(10.3) 382(89.7) Ref. Ref.
Female 28(10.3) 245(89.7) 0.9(0.63,1.56) 0.78(0.53,1.16)
Age
group(years
18-34 48(10.0) 433(90.0) Ref. Ref.
35-65 20(9.9) 183(90.1) 0.9(0.60,.62) 0.83(0.59,1.16)
>65 4(26.7) 11(73.3) 2.67(1.11,6.45) 4.17(2.63,6.60)*
Educational
status
Illiterate 25(12.3) 178(87.7) Ref. Ref.
Primary 37(9.9) 338(90.1) 0.8(0.50,1.29) 0.81(0.49,1.31)
Secondary+
10(8.3) 111(91.7 0.67(0.33,1.35) 0.90(0.48,1.69)
Treatment
center
Hospital 31(12.6) 215(87.4) 1.39(0.9,2.16) 3.73(2.23,6.25)*
HC 41(9.1) 412(90.9) Ref. Ref.
Action
before HCF
None 57(10.3) 498(89.7) Ref. Ref.
Took action 15(10.4) 129(89.6) 1.01(0.59,1.74) 0.84(0.59,1.21)
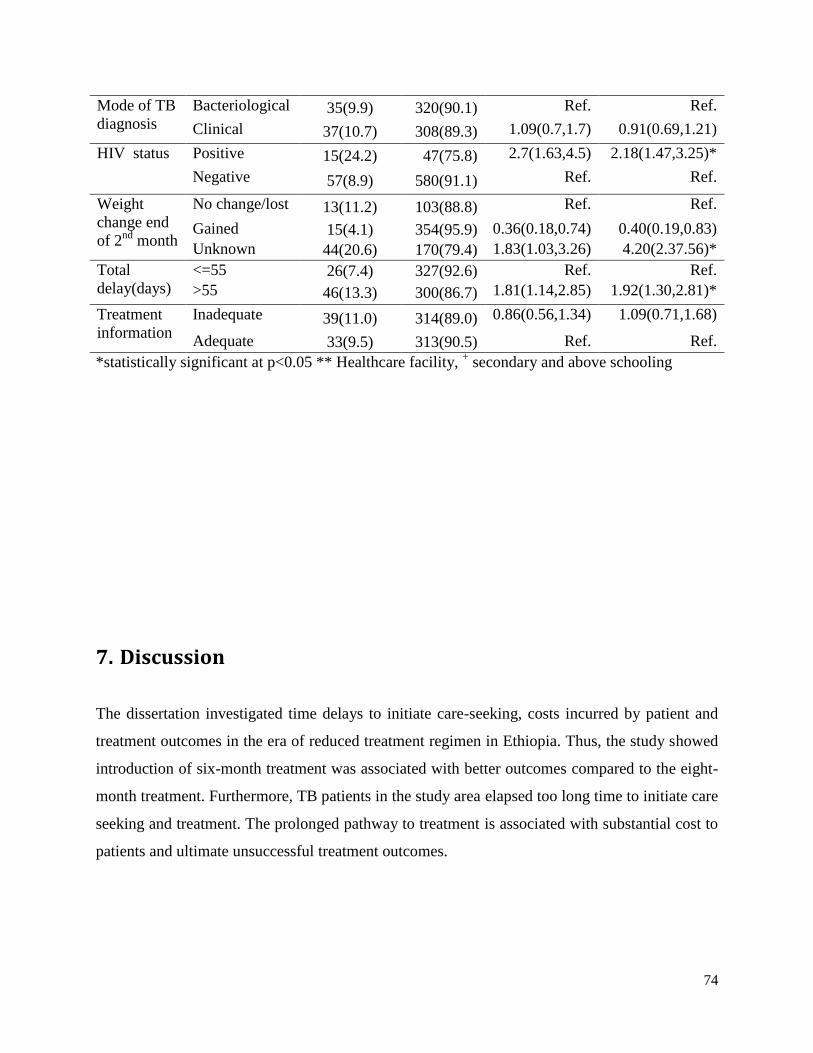
74
Mode of TB
diagnosis
Bacteriological 35(9.9) 320(90.1) Ref. Ref.
Clinical 37(10.7) 308(89.3) 1.09(0.7,1.7) 0.91(0.69,1.21)
HIV status Positive 15(24.2) 47(75.8) 2.7(1.63,4.5) 2.18(1.47,3.25)*
Negative 57(8.9) 580(91.1) Ref. Ref.
Weight
change end
of 2nd
month
No change/lost 13(11.2) 103(88.8) Ref. Ref.
Gained 15(4.1) 354(95.9) 0.36(0.18,0.74) 0.40(0.19,0.83)
Unknown 44(20.6) 170(79.4) 1.83(1.03,3.26) 4.20(2.37.56)*
Total
delay(days)
<=55 26(7.4) 327(92.6) Ref. Ref.
>55 46(13.3) 300(86.7) 1.81(1.14,2.85) 1.92(1.30,2.81)*
Treatment
information
Inadequate 39(11.0) 314(89.0) 0.86(0.56,1.34) 1.09(0.71,1.68)
Adequate 33(9.5) 313(90.5) Ref. Ref.
*statistically significant at p<0.05 ** Healthcare facility, + secondary and above schooling
7. Discussion
The dissertation investigated time delays to initiate care-seeking, costs incurred by patient and
treatment outcomes in the era of reduced treatment regimen in Ethiopia. Thus, the study showed
introduction of six-month treatment was associated with better outcomes compared to the eight-
month treatment. Furthermore, TB patients in the study area elapsed too long time to initiate care
seeking and treatment. The prolonged pathway to treatment is associated with substantial cost to
patients and ultimate unsuccessful treatment outcomes.
75
7.1. TB Treatment outcomes of eight and six month regimens (Paper I)
Treatment of new TB cases in Ethiopia had been for eight-months with combinations of four
drugs (2ERHZ) in the intensive phase and two drugs (6HE) during the continuation phase.
Following WHO recommendation of switching treatment regimen, the country introduced the
six-month treatment regimen as end of 2011. The change was on continuation phase treatment
where six months therapy (6HE) replaced with four months (4RH). Thus, comparison of new TB
patients treated with 6EH and 4RH during continuation phase revealed no statistically significant
difference with respect to socio-demographic, baseline clinical, sputum smear conversion at end
of intensive phase treatment. The indifference between the two groups of cases depicts
comparability of the groups. However, there was significant difference with treatment success
(90.6% vs. 85.3%) respectively among those received the 4RH and 6EH continuation phase
treatment. The finding portrays adoption of the continuation phase treatment regimen change
[23] in high prevalent and resource constrained settings is working well.
The 4RH continuation phase treatment predicted lower likelihood of unsuccessful treatment
outcome compared to 6EH regimen. Similarly, a study from Nigeria [144] reported higher odds
of unsuccessful outcome among those treated with 6EH. The explanation could be differences in
length and type of drugs used during the continuation phase treatment those influence adherence
and ultimate outcome. Studies reported that reduced continuation phase (from 6EH to 4HR)
treatment was associated with lower cost and expected mortality [30]. On the other hand, use of
rifampcin (R) for longer period for treatment of TB had been associated with better outcomes
[31] that might be related with efficacy of the drug. Though rifampicin works better for TB
treatment, it had not been recommended in developing countries owing to irregular treatments
and high absentee rates in the region [142, 177].To maintain the better outcome with rifampicin
throughout the TB treatment period, strong patient and provider relationship should be built for
optimum adherence. Optimum adherence is not only for sustaining better outcome to the patients
but also for avoidance resistance to this most potent anti-TB drug. Hence, there should be
continuous monitoring of adverse effect including drug resistance and adherence among both the
healthcare providers and patients.
76
7.2. Pathways to anti-TB treatment initiation (Paper II)
Prompt detection and treatment of cases has been a priority in the prevention and control of TB.
This depends on timely seeking care by patients and reaching at diagnosis within a reasonable
time by the health system. Nonetheless, patients in the study area had waited for a median of 25
days (patient delay) and 55 days (total delay) respectively to initiate seeking care and anti-TB
treatment. The patients and health system delays contributed nearly equally to the total delay
which is consistent with other studies from Ethiopia [42] and elsewhere [38]. The longer time
elapsed since onset of illness to treatment initiation implies increased risk of morbidity and
mortality among the cases and diseases transmission in the community [36, 53, 178, 179]. This
an unacceptably long delays to initiate care seeking and provider delays implies for the need for
multifaceted actions towards achieving ambitious targets of reducing TB 90% incidence and
mortality by 2035 [16].
Before visits to formal health care facility, patients had taken variety of actions those influenced
timing of care seeking. Consistent with other studies, patients who took self-treatment before the
formal care seeking were more likely to delay seeking care at the formal care units compared to
those first consulted health care providers [112, 116]. This could be due to use of some home
remedies or over the counter antibiotics or analgesics those might lessen the manifestation of the
illness for the time being [109]. Moreover, those patients first visited traditional healer and holy
water are more likely to have higher total delay. This could be due to the beliefs attached to the
traditional care and holy water those might inhibit timely presentation and diagnosis [45].
Patients had waited for a median of 25 days until seeking help at formal health care providers
which is consistent with 30 days in northern part of Ethiopia [41, 108], 28 days in Uganda [38]
and 30 days in Angola [34]. The relatively lower delay could be due to better access to HCF
where nearly 80% of the cases traveled less than an hour to reach the first HCF. However, only
less than a third (32%) of the cases had made first visit to formal health care within 15 days of
onset that is recommended optimum timeline for consultation [23]. Besides, more than half
(57%) of the cases did not perceive their care seeking was delayed which implies the symptoms
were taken as common and less severe to urge consultation of health care provider.
The first consultation at HCF was made primarily (69.9%) at lower level public health care units

77
(health posts and health centers) and private clinics. This is consistent with a study in
Mediterranean countries that reported two thirds of patients first visited private sectors [104].
Nonetheless, diagnosis of TB was made primarily at hospital (61%) despite only few had made
first visit to the hospitals. As a result, majority of the cases had made more than one visit to
different HCFs until diagnosis. Similarly, studies from Uganda [38] and China [119] reported
significant number of patients had visited more than one HCF until diagnosis. Subsequent to the
missed opportunities during the repeated visits, diagnosis of TB had been made after a median of
22 days from the first visit to HCF. This is consistent with 21 days in a study from Amhara
Region in Ethiopia [41] but higher than 6 days in Addis Ababa [42] and 9 days in Tigray,
northern Ethiopia [39]. The discrepancies could be due to the differences in accessibility to well-
equipped HCFs and skilled providers usually situated in cities like Addis Ababa. The longer
provider delays due to the repeated visits portray high level of missed opportunities of early
diagnosis that could have increased infectious period of the cases and costs incurred by the
patients and households. In addition, the longer provider delay shows TB diagnostic inefficiency
of lower level public and private healthcare facilities.
Longer provider delays had been reported among patients who first visited HCFs not providing
DOTS services including health posts and private clinics. This is consistent with a study from
Uzbekistan [112] and India [180].The higher provider delay at lower care units and private clinic
could be due to lack of supplies, guidelines and skilled providers that enhance adherence to the
national TB control program. In the current study, diagnosis of TB was mainly made at hospitals
despite many patients had made first visits at the lower public and private clinics. This depict
patients are being provided with unnecessary drugs and treatments at series of HCFs visits.
Besides, the medications at the repeated visits themselves lead to delays to diagnosis and serious
outcomes including drug resistance [181]. On the other hand, the lower health care units and
private clinics might lack proper logistics and skilled providers to timely diagnose the cases.
Hence, equipping the HCFs with cost effective and efficient rapid diagnostic tests along with
expansions of the DOTS package at the reach of community is required to curb the long delays.
Patients co-infected with HIV are more likely to delay care seeking compared to those non-
infected. This could be due to the alteration of classical clinical manifestations and signs of TB
among HIV co infected patients [182]. On the other hand, patients suspected or tested HIV
78
positive delay to present themselves to HCF due to fear of stigma attached to the co-occurrence
of TB and HIV [52, 113, 117] . As a result, the high mortality among HIV co infected TB
patients had been partly explained by the delays to TB treatment [34, 35]. Those extra pulmonary
cases patients are more likely to delay seeking care compared to the pulmonary cases. Similarly,
a study from northwest Ethiopia reported higher odds of delayed care seeking among EPTB [48].
This could be due to the fact that EPTB cases manifest with less severe and non-specific
symptoms so that patients consider their illness to be non-serious and do not deserve medical
attention [180].
Patient‟s perception and knowledge towards the TB disease and control activities do have impact
on the care seeking practices. The study revealed that patients with good knowledge towards the
TB disease and program are less likely to delay seeking care. Similarly, other studies have
reported lack of knowledge and mistrust of the TB program as a reason for delayed care seeking
[44, 104, 114]. In contrast, awareness and belief about TB‟s curability is associated with longer
patients delay [38, 50]. These imply need for awareness creation towards the TB illness and its
control program to clear the paradox between the belief and longer delay.
We found that patients delayed to seek care are also more likely to have delayed diagnosis and
treatment after they initiated care seeking. In contrast a study in Georgia [115] reported those
patients with increased patient delay are less likely to have prolonged diagnostic delay. The
discrepancy could be due to differences in measurement of the two delays. The higher odds of
provider delay among those delayed to seek care can be explained by patients use of different
forms of self-treatment and homemade remedies those might alter the manifestations of the TB
illness that pose difficulties in timely diagnosis [109, 115]. Those patients delayed to seek care
might have been ill for such long duration at which time productivity is compromised. Hence,
the patients might be unable to cope with the costs required to have timely diagnosis even after
initiating the care seeking. In addition, the long ill days are also associated with more severe
disease at presentation [53] which hinders timely diagnosis [43].
7.3. Pre –and post TB diagnosis costs to patients (Paper III)
79
The dissertation revealed that TB cases on DOTS incurred substantial cost across pathways to
TB treatment. Thus median out of pocket expenditure for the episode of TB illness amounted
US$59.58 that constitutes more than a quarter (29.4%) of the total cost. More than half (53.6%)
of total cost were incurred before diagnosis of TB and majority (70.6%) of the total cost were
attributed to nearly 52 lost workdays per patient. Compared to the post diagnosis, significantly
higher medical and indirect costs and lower non-medical costs were incurred during the pre-
diagnosis period. Patient and provider delays, taking informal treatment before HCF visit,
diagnosis at private facilities, clinical diagnosis, and number of visited health facilities predicted
increased pre-diagnosis cost. On the other hand, rural residence, hospitalization for treatment and
treated at health center predicted higher post diagnosis cost.
The substantial amount of money spent by patient despite the “free TB service” indicates the
difficulty of attaining global target of avoiding no families to face catastrophic cost due to TB
[16] by 2025. This is because only sputum smear test and anti-TB drugs are waived for patients.
However, an alarming majority (95%) of the medical costs was incurred for drugs other than
anti-TB and diagnostic tests showing patients are being administered with unnecessary drugs and
tests. Hence, there is a need to capacitate healthcare providers to early suspect TB and prescribe
standard diagnostic tests. Similarly, majority of non-medical costs were spent for transportation
depicting poor accessibility of HCF providing efficient TB diagnosis.
The total cost incurred across the care seeking and treatment pathways are significantly
correlated with both patient and provider delays. The increased pre-diagnosis cost with patient
delay could be due to increased risk of severe manifestation [53] that lead to hospitalization and
companion during care seeking and treatment. Furthermore, the patient delay is associated with
informal care including self-treatment and traditional cares [112, 135] incurring cost. The patient
delay is associated with longer lost workdays that might have reduced patient income. On the
other hand, delay at health system (provider delay) is associated with repeated visits to different
HCF incurring both medical and non-medical costs. Few patient in this study suggested lack of
money as a hindrance and delay care seeking in turn leads to increased cost for subsequent care.
This indicates interdependence between delay to care seeking and cost of care.
80
Those patients diagnosed clinically incur significantly higher pre diagnosis cost. This could be
due to national diagnostic algorithm that requires 2-8weeks follow-up for the clinical diagnosis
of TB [23]. The clinical diagnosis requires experienced clinician decisions guided with better
diagnostic facilities. Such facilities exist at few healthcare facilities situated in cities for which
patients need to travel repeatedly. The relatively lower cost of bacteriologicaly confirmed
diagnosis could be due to exemption of sputum smear microscopy and culture by the national TB
control program. Hence, ensuring efficient diagnostic algorithms and quality bacteriological tests
can reduce the financial burden of TB patients.
Consistent with other studies [140, 183] patients diagnosed at private facilities incur significantly
higher pre diagnosis cost compared to those at public. The different cost items and rates at the
private facilities can explain this, where every service including sputum microscopy is charged.
Since there were no PPM-DOTS in the study area at the time of study, the private HCF might not
implement the proper diagnostic algorithm that might lead to delay and extra cost. Furthermore,
public health facilities requirement of retesting positive sputum result from private facilities for
treatment initiation lead to delay and extra cost [184].
We found patients followed their ant-TB treatment at hospital had significantly lower post
diagnosis cost compared to those followed at health center. This could be due to full time staffs
that exclusively provide TB patient care at hospitals. However, at health centers, DOTS
providers carryout multiple duties other than TB DOTS that might have increased patient waiting
time and respective costs. In addition, health centers are situated in rural areas where there is no
transport access within villages in contrast to hospitals in urban areas easily accessible to patients
within the town. Thus statistically significant difference in mean total time (71.17minutes Vs
106.79minutes, p<0.001) had been respectively spent per each patient visit to hospitals and
health centers. Consistent with other studies [183, 185] we found significantly higher post
diagnosis cost incurred by patients from rural areas compared to those from urban. The reason
could be due to significantly higher mean time spent per each visits among patients from rural
and urban residents (119.51minute Vs. 68.35minutes,p<0.001) respectively.

81
7.4. Delayed anti-TB treatment and patient outcomes (Paper IV)
The study revealed patients elapsed too long time (median of 55 days) to initiate anti-TB
treatment since onset of the illness. Accordingly, the treatment success was significantly
different (92.6% vs 86.7%) respectively among those initiated treatment within and beyond
55days of onset. Those patients initiated anti-TB treatment beyond 55days of onset had higher
risk of unsuccessful outcomes including death, lost to follow up and treatment failure. Patients
initiated treatment within and beyond 55 days of onset had undergone significantly diverse
healthcare seeking practices, patient and provider delays. However, both groups of patients had
no significant differences in sputum smear conversion and weight changes at end of second
month treatment. The longer delays to initiate treatment accompanied by higher risk of
unsuccessful outcomes depict increased morbidity and mortality to patients and prolonged period
of transmission to the community. The finding suggests need for prompt detection and treatment
of cases to ensure better outcomes among patients and reduce burden in community.
The higher risk of unsuccessful outcome among those patients delayed to initiate anti-TB
treatment had been consistently reported in studies from Ethiopia [145] and elsewhere [54]. The
increased risk of unsuccessful outcome among patients delayed treatment initiation could be due
to various factors. First, delayed initiation of treatment had been reported to be associated with
severe clinical presentation [36, 53] which predict unsuccessful outcomes [146]. In this study,
patients delayed to initiate treatment had relatively higher rate of hospitalization (3% vs 2.1%)
that would be proxy measure of severe presentation. Second, a delay to treatment is associated
with both prescribed and self-treatment those lead to poor treatment outcome [115, 181, 186]. In
the current study, the majority (84.7%) of the cases had visited an average of 2.2 HCFs until
diagnosis of TB when patients were taking both self and prescribed medicines. Third, delays to
treatment often accompanied by higher direct and indirect costs that impoverish households [65,
187] and ultimately lead to poor treatment compliance and outcome [187]. In this study, we
observed significantly higher median pre-diagnosis (US$171.7 vs. 61.5,p=0.001) and post-
diagnosis (US$108.70 vs.75.2,p<0.001) costs respectively among those initiated treatment
which beyond and within 55 days of onset.

82
7.4.1. Other predictors of treatment outcome
In response to influences of HIV and TB on each other, TB/HIV collaborative interventions had
been recommended [85]. Thus systematic review in African context reported better outcomes
among concurrently screened and managed TB and HIV infected patients [188]. In the current
dissertation, 77.5% of those TB cases retrieved retrospectively (2008-2014) and 100% (for 2015)
of the cases enrolled prospectively had documented HIV status. Thus, TB/HIV co infection
ranged from 9.3% to 9.7% comparable to the national average of 8% for the year 2015. The
proportion of HIV screening among TB cases showed progress over the years and higher than a
national average of 77% for the year 2015[18]. Nonetheless, only few (39.7%) of those HIV co
infected TB cases had documented ART service provision which is far lower than the national
average of 79% for 2015 [18].
Consistent with studies in Ethiopia [145, 154, 155] and elsewhere [149, 150, 152, 153], HIV co-
morbidity increased risk of unsuccessful outcome among TB cases. Thus, treatment success
(75.8% vs 91.1%, p<0.001) was significantly lower among HIV co infected and negatives
respectively. The observed lower treatment success among HIV co infected is far below the
targeted 90% success to be met by 2020 [16]. The increased risk of unsuccessful outcome among
the HIV co infected could be due to longer median time to initiate care-seeking among HIV co
infected (29days) compared to 24 days among negatives. Studies reported that HIV co morbidity
delay anti-TB treatment initiation [52, 148] that explained the high mortality among HIV co
infected TB patients [34, 35]. In addition, HIV co infection independently increases risk of
unsuccessful outcome due the complex and overlapping drug interactions and toxicities and TB-
associated immune reconstitution inflammatory syndrome [189]. Furthermore the low uptake of
ART and CPT those predicted worse outcome elsewhere [149] can also explain the lower
treatment success among HIV co infected cases.
Socio-demographic attributes of TB cases play an important role of predicting outcome among
patients. Age of TB cases had an inverse relation with unsuccessful outcome where the odds of
unsuccessful outcome increase with age. The finding is consistent with reports from studies in
Ethiopia [165, 190] and elsewhere [152, 191, 192]. Similarly, several studies also reported that

83
older patients were more likely to have unsuccessful outcomes than those younger cases [163,
165, 190, 193]. The increased risk of unsuccessful outcome among the older could be due to
higher occurrence of age related co morbidities [191] those increase risk of unsuccessful
outcomes.
In this dissertation, patients took anti-TB treatment at hospital had higher risk of unsuccessful
outcome compared to those treated at health center. Similarly, Studies from Ethiopia [169] and
Nigeria [164] reported treatment centers predicted treatment outcomes. The higher unsuccessful
outcomes among those treated at hospitals could be due to significantly higher proportion of
delays to initiate anti-TB treatment (55.6% Vs46.3%,p=0.02), HIV co infection (14.3% Vs
6.4%,p<0.001) and hospitalization (5.3% Vs 1.1%,p=0.001) at hospitals than health centers.
Studies reported HIV co infection [149, 150], hospitalization [146] and delays to treatment[54, 145]
to predict higher risk of unsuccessful outcomes. Moreover, patients treated at hospitals were
more of pulmonary negative (36.5% vs 24.7%,p<0.001) and extra pulmonary (21.8% vs
19.4%,p<0.001) those predict unsuccessful outcome [165].
Regular monitoring of TB patients during treatment is vital to assess response to therapy and
facilitates treatment completion. Accordingly regular sputum and weight monitoring have been
recommended TB patients on treatment [27]. Despite, low sensitivity and modest specificity of
sputum results at the end of intensive phase to predict failure and relapse [194], sputum
conversion to negative had been among the indicators of TB program [27]. Consistent to findings
from African settings [195] majority of those patients undergone sputum checkup during
treatment converted to negative. In the current study there was no significant in sputum smear
conversion at end of second month treatment differences among patients initiated treatment
within and beyond 55days of onset. Studies from Ethiopia [165] and elsewhere [196] reported,
negative sputum smear conversion at the end of intensive phase treatment predicted lower risk of
unsuccessful outcome. In this study, 3/6(50%) of those treatment failure cases had positive smear
at the end of second month treatment. On the other hand, detection of sputum positive during
treatment trigger further patient assessment that influence treatment regimens and ultimate
outcome. The higher risk among those positives could be due to possible poor quality of initial
therapy and co morbid conditions that interfere with adherence or response [27].

84
Patients gained some amount of weight at the end of second month treatment had lower risk of
unsuccessful outcomes which is consistent with other studies [161, 162]. This could be due to
positive association between weight gain and level of improvement from the TB illness. Changes
in weight while on treatment might be an indication of appropriateness of the anti-TB drug dose
that affects the outcome. On the other hand, those with unknown weight change at the end of
first two months treatment had higher odds of unsuccessful outcomes compared to those gained
weight. The weight change might be unknown due to patients‟ treatment interruption subsequent
to treatment default or death those constitute unsuccessful outcome.
7.5. Validity and Generalizability
The validity (internal or external) of any study is dependent on study designs employed, tools for
data collection, appropriate methods to handle random and non random errors. Thus, various
designs including cross-sectional and longitudinal study designs were used to answer the
research questions. Besides, the dissertation employed different methods to control possible
influences of bias, chance, and confounding factors on the validity of the dissertation.
To minimize the role of selection bias, adequate and representative samples of TB cases were
enrolled consecutively from representative health facilities. In addition, the dropout rate for the
prospective cohort study was 9.7% that was nearly the same as stipulated rate of 10% during
sample size calculation. On the other hand, use of standard data collection instruments,
interviewing patients as soon as possible, recruitment of qualified data collectors (Nurses) and
supervisors (Public health specialists), thorough training, supervision and proper data
management minimized measurement bias.
85
To control for the effect of confounding factors; first the dissertation captured as much predictor
and confounding variables as possible guided by the literature review and conceptual framework.
Then eligible variables for multivariate analysis were selected based on strength of association
on bivariate analysis, clinical and practical importance. Finally different multiple regression
models including linear, logistic, and log-binomial were fitted for the selected variables to
identify independent predictors. In all the analysis, the role of chance was checked using proper
statistical significance tests at 5% significance level.
The dissertation was carried out among new TB cases registered at public health centers and
hospitals. The health facilities represented ten districts of three zones (Bench-Maji, Kaffa and
Sheka) in SNNPR. TB cases registered at public health facilities across the SNNPR in particular
and the country in general do exhibit similar characteristics. Hence, the findings of this
dissertation (healthcare seeking practices, costs incurred by patient and treatment outcomes) can
reasonably be generalizable to new TB cases registered at public healthcare facilities across the
SNNPR and Ethiopia with similar settings.
7.6. Strengths and limitations
The dissertation has some limitations. First assessment of healthcare seeking practices was
carried out on those cases ultimately sought care and on treatment at the time of the study.
Therefore, the finding might not reflect experiences of those did not seek care and initiate
treatment. Second assessment of time delays to treatment and costs incurred relied on patient
self-report, which was liable to recall bias. We minimized the bias by interviewing patients soon
after diagnosis and helping them to recall using local events. Third, there was no set optimum
time for delayed treatment; median time elapsed since onset of illness was used to ascertain
delayed treatment. Lastly, cost ascertainment employed patient perspective and prevalent
approach so that costs incurred by health system, households and community were not
determined.
For the comparison of treatment outcomes among six and eight month regimens, the study was
limited to control for possible changes in medical resources, polices and quality of care across
the study periods those could influence the treatment outcomes. However, the patients did not

86
have significant differences with socio-demographic and clinical factors. The other limitation
was lack of drug susceptibility pattern across the treatment regimens.
The study had several strengths. First, the study employed relatively large sample those were
consecutively enrolled that minimized selection bias. Second, patient costs were ascertained
longitudinally since onset of illness to treatment completion. Thus, predictors of costs incurred
before and after diagnosis of TB were assessed. Third, prospective assessment of effect of
delayed treatment on patient clinical outcome and direct estimation of risk were also strengths of
the study. Lastly, use of standard outcome definition and abstraction of clinical data from
standard registers were strengths of the dissertation.
8. Conclusion
The dissertation revealed that the switch of continuation phase TB treatment regimen from 6EH
to 4RH has brought significantly lower unsuccessful outcome. The findings verified applicability
of the WHO recommendation and national adoption of the regimen change to high prevalent and
resource constrained settings.
TB cases in the study area elapsed too long time to initiate care seeking and treatment in the era
of shortened regimen. The delays are at home (patient) and provider (health system) those are
positively correlated and contributed nearly equally to the total delay. The unacceptably long
delay at home is accompanied by high level of missed opportunities of early diagnosis at health
system. Both delays imply longer period of morbidity to the patients and transmission within the

87
community. The patient, provider and total delays are attributed to the patient, disease and health
system related factors reflecting need for multifaceted intervention.
Throughout the care seeking and treatment pathways, TB cases on DOTS incurred substantial
direct and indirect cost. Despite the “free service”, TB patients expended significant amount of
money for care seeking and following anti-TB treatment. The patients incurred significantly
higher cost during the pre-diagnosis period compared to the post diagnosis. Increased pre-
diagnosis costs are attributed to patient and provider delays, prior informal care, seeking care at
private healthcare facilities and clinical TB diagnosis. On the other hand, higher post diagnosis
costs were attributed to patient and provider delays and rural residence.
The delayed treatment initiation is associated with higher risk of unsuccessful outcome including
death, treatment failure and lost to follow-up. Apart from the delayed treatment, HIV co
infection, treatment center, weight change and sputum conversion at the end of second month
treatment independently predicted unsuccessful outcomes.
9. Recommendations
Policy and practical implications
Raise community level awareness about TB and promote early care seeking involving
health extension program and other related health programs
Intensify TB case finding involving the community, formal and informal providers
Engage traditional healers and priests at holy water in TB case finding
Decentralize efficient TB diagnostic and therapeutic services to lower level public and
private healthcare facilities
Revise the prolonged diagnostic algorithms for smear negative and extra pulmonary TBs
Scale up and decentralize rapid diagnostic technologies like GeneXpert MTB/RIF

88
Scale up of national community and social insurance schemes to the study area
Introduction of cost reimbursement mechanisims
Adopt and implement patient centered TB care to reduce the frequent patient visits
Strengthen the TB/HIV collaborative interventions
Further research directions
Design of effective and efficient early TB case finding strategies
Conduct active case finding through community based TB prevalence surveys
In-depth understanding of reasons for patient and provider delays using qualitative designs
Costs of TB care to health system and household employing societal perspective costing
Implications of the costs of TB care to patients and household impoverishment
Evaluation of sensitivity and specificity of Genexpert test in local settings
Readiness of private and public healthcare facilities to introduce rapid diagnostic tests
Level of patient and healthcare provider adherence to the six month treatment regimen
Instate drug resistance surveillance for the six month anti-TB treatment with rifampicin
combination throughout the course of treatment
References
1. Palomino Juan Carlos LCS, Ritacco Viviana, : Tuberculosis 2007: From basic science to patient care, first edn; 2007.
2. JH Bates: Transmission and pathogenesis of tuberculosis Clin Chest Med 1980, 1(2):167-174. 3. Kasper B. Fauce HLJ: Harrison’s principles of Internal Medicine, 16 edn. USA: McGraw-Hill
companies Medical publishing division; 2005. 4. Lienhardt C, Bennett S. , Del Prete G, Bah-Sow O. , Newport M. , Gustafson P. , Manneh K. ,
Gomes V. , Hill A., McAdam K.: Investigation of Environmental and Host-related Risk Factors

89
for Tuberculosis in Africa. Methodological Aspects of a Combined Design. Am J Epidemiology 2002, 155(11):1066-1073.
5. Bates Mn KA: Risk of tuberculosis from exposure to tobacco smoke: A systematic review and meta-analysis. In: Archives of internal medicine. vol. 167; 2007: 335-342.
6. Narasimhan Padmanesan, Wood James, MacIntyre Chandini Raina, Mathai Dilip: Risk Factors for Tuberculosis. Pulmonary Medicine 2013.
7. Fenton Kevin, Kenneth CG: Guidelines for the Investigation of Contacts of Persons with Infectious Tuberculosis;Recommendations from the National Tuberculosis Controllers Association and CDC. In., vol. 54: CDC; 2005: 1-37.
8. Glaziou Philippe , Falzon D.MPhil, Floyd Katherine , Mario R: Global Epidemiology of Tuberculosis. Seminars in Respiratory and Critical Care Medicine 2013, 34(1):3-16.
9. Arandottir T: Tuberculosis and public health: Policy and principles of Tuberculosis control. In. Paris: International Union Against Tuberculosis and Lung Disease; 2009.
10. Frieden TR ST, Munsiff SS, Watt CJ, Dye C: Tuberculosis The Lancet 2003, 362(9387):887-899. 11. World Health Organization: TB Aglobal emergency. In. Edited by Klaudt K. USA: WHO; 1994. 12. World Health Organization: An Expanded DOTS Framework for Effective Tuberculosis Control.
In.; 2002. 13. World Health Organization: WHO tuberculosis control program: Framework for effective
tuberculisis control. In.; 1994. 14. World Health Organization: Strategic framework to decrease the burden of TB/HIV. In. Edited
by HIV/AIDS STDaDo. Geneva - Switzerland: WHO; 2002. 15. World Health Organization: THE STOP TB STRATEGY: Building on and enhancing DOTS to meet
the TB-related Millennium Development Goals. In.: World Health Organization; 2006. 16. World Health Organization: The End TB strategy: Global strategy and targets for tuberculosis
prevention, care and control after 2015. In. Edited by WHO; 2015. 17. Dye C WC, Bleed DM, Hosseini SM, Raviglione MC: Evolution of tuberculosis control and
prospects for reducing tuberculosis incidence,prevalence, and deaths globally. J Am Med Assoc 2005, 293:2767-2775.
18. World Health Organization: Global Tuberculosis report. In. Switzerland: World Health Organization; 2016.
19. Maher D, Harries A. , Getahun H.: Tuberculosis and HIV interaction in sub-Saharan Africa: impact on patients and programmes; implications for policies. Trop Med Int Health 2005, 10(8):734-742.
20. Laxminarayan R, Klein E, Dye C, Floyd K, Darley S, Adeyi O: Economic Benefit of Tuberculosis Control. In.: The World Bank; 2007.
21. F HH, Espie, Aloo AO, Bastard M, et al: Adherence to Self-Administered Tuberculosis Treatment in a High HIV-Prevalence Setting:A Cross-Sectional Survey in Homa Bay, Kenya. . PLoS One 2012, 7(3).
22. Federal Minstry of Health of Ethiopia: Tuberculosis, Leprosy and TB/HIV Prevention and Control Programme Manual. In., 4th edn. Addis Ababa: Ministry of Health of Ethiopia 2008.
23. Federal Minstry of Health of Ethiopia: Guidelines for clinical and programmatic management of TB, Leprosy and TB/HIV in Ethiopia In., 5th edn. Addis Ababa: Ethiopian Federal Minstry of Health; 2012.
24. Getahun B, Ameni G, Medhin G, Biadgilign S: Mortality and associated risk factors in a cohort of tuberculosis patients treated under DOTS programme in Addis Ababa, Ethiopia BMC Infect Dis 2011, 11(127).
25. Federal Republic of Ethiopia Ministry of Health: Annual performance report. In. Addis Ababa: Federal Repubilic of Ethiopia Minstry of Health; 2016.
90
26. Federal Democratic Republic of Ethiopia Minstry of Health: Health and Health Related Indicators. In. Addis Ababa: Federal Democratic Republic of Ethiopia Minstry of Health; 2016.
27. World Health Organization: Treatment of tuberculosis: guidelines. In. Geneva: World Health Organization; 2010.
28. WHO: Treatment of Tuberculosis: Guidelines for National Programmes In. Geneva: World Health Organization.; 2003.
29. Birch S, Govender V, Fried J, Eyles J, Daries V, Moshabela M, Cleary S: Does treatment collection and observation each day keep the patient away? An analysis of the determinants of adherence among patients with Tuberculosis in South Africa. Health policy and planning 2016, 31(4):454-461.
30. Manabe YC, Hermans SM, Lamorde M, Castelnuovo B, Mullins CD, Kuznik A: Rifampicin for continuation phase tuberculosis treatment in Uganda: a cost-effectiveness analysis. PLoS One 2012, 7(6):e39187.
31. Menzies D, Benedetti A, Paydar A, Martin I, Royce S, Pai M, Vernon A, Lienhardt C, Burman W: Effect of duration and intermittency of rifampin on tuberculosis treatment outcomes: a systematic review and meta-analysis. PLoS medicine 2009, 6(9):e1000146.
32. World Health Organization: Global Tuberculosis Control Epidemiology, Strategy,Financing. In. Geneva: WHO/HTM/TB/2009 2009.
33. Stop TB Partnership: The global plan to stop TB 2011–2015. In.: World Health Organization; 2010.
34. Lusignani L, Quaglio G, Atzori A, Nsuka J, Grainger R, Da Conceiçao Palma M, Putoto G, Manenti F: Factors associated with patient and health care system delay in diagnosis for tuberculosis in the province of Luanda, Angola. BMC Infectious Diseases 2013, 13(168).
35. Kiwuwa M, Charles K, Harriet M: Patient and health service delay in pulmonary tuberculosis patients attending a referral hospital: a cross-sectional study. BMC Public Health 2005, 5(122).
36. Cheng S, Chen W, Yang Y, Chu P, Liu X, Zhao M, Tan W, Xu L, Wu Q, Guan H et al: Effect of Diagnostic and Treatment Delay on the Risk of Tuberculosis Transmission in Shenzhen, China: An Observational Cohort Study, 1993-2010. PLoS One 2013, 8(6):e67516.
37. Godfrey-Faussett PAH: The impact of HIV on Tuberculsosis control-towards concerted action. Lepr rev 2002, 73:376-385.
38. Sendagire I, Schim Van der Loeff M, Mubiru M K-LJ, Cobelens F: Long Delays and Missed Opportunities in Diagnosing Smear-Positive Pulmonary Tuberculosis in Kampala, Uganda: A Cross-Sectional Study. PLoS One 2010, 5(12).
39. Mesfin M, Tasew T, Tareke I, Kifle Y, Karen W, Richard M: Delays and care seeking behavior among tuberculosis patients in Tigray of northern Ethiopia. Ethiopian Journal of Health Development 2005, 19:7-12.
40. Mesfin M, Newel J, Walley J, Gessessew A, Madeley R: Delayed consultation among pulmonary tuberculosis patients: a cross sectional study of 10 DOTS districts of Ethiopia. BMC Public Health 2009, 9(53).
41. Yimer S, Bjune G, Alene G: Diagnostic and treatment delay among pulmonary tuberculosis patients in Ethiopia: a cross sectional study. BMC Infectious Diseases 2005, 5(112).
42. Demissie M, Lindtjorn B, Berhane Y: Patient and health service delay in the diagnosis of pulmonary tuberculosis in Ethiopia. BMC Public Health 2002, 2:23.
43. Hussen A, Biadgilign S, Tessema F, Mohammed S, Deribe K, Deribew A: Treatment delay among pulmonary tuberculosis patients in pastoralist communities in Bale Zone, Southeast Ethiopia. BMC Res Notes 2012, 5:320.
44. Storla G.Dag, Yimer Solomon, A.Gunnar B: A systematic review of delay in the diagnosis and treatment of tuberculosis. BMC Public Health 2008, 8(15).

91
45. Li Y, Ehiri J, Tang S, Li D, Bian Y, Lin H, Marshall C, Cao J: Factors associated with patient, and diagnostic delays in Chinese TB patients: a systematic review and meta-analysis. BMC medicine 2013, 11:156.
46. Tuberculosis Research Advisory committee: Roadmap for Tuberculosis Operational Research in Ethiopia. In. Edited by (TRAC/FMOH) TRAC. Addis Ababa: FMOH; 2013.
47. Yimer S, Holm-Hansen C, Yimaldu T, Bjune G: Health care seeking among pulmonary tuberculosis suspects and patients in rural Ethiopia: a community-based study. BMC Public Health 2009, 9:454.
48. Yimer S, Bjune G, Holm-Hansen C: Time to first consultation, diagnosis and treatment of TB among patients attending a referral hospital in Northwest, Ethiopia. BMC Infect Dis 2014, 14:19.
49. Salomon JA, Lloyd-Smith JO, Getz WM, Resch S, Sanchez MS, Porco TC, Borgdorff MW: Prospects for advancing tuberculosis control efforts through novel therapies. PLoS Med 2006, 3(8):e273.
50. Ford C, Bayer A, Gilman R, Onifade D, Acosta C, Cabrera L, Vidal C, Evans C: Factors Associated with Delayed Tuberculosis Test-seeking Behavior in the Peruvian Amazon. American Journal of Tropical Medicine and Hygeine 2009, 81(6):1097-1102.
51. Lusignani L, Quaglio G, Atzori A, Nsuka J, Grainger R, Da Conceiçao Palma M, Putoto G,
Manenti F: Factors associated with patient and health care system delay in diagnosis
for tuberculosis in the province of Luanda, Angola. BMC infectious diseases 2013, 13(168).
52. Finnie R, Khoza L, Van den Borne, Mabunda T, Abotchie P, Mullen P: Factors associated with patient and health care system delay in diagnosis and treatment for TB in sub-Saharan African countries with high burdens of TB and HIV. Tropical medicine & international health 2011, 16(4):394-411.
53. Virenfeldt J, Rudolf F, Camara C, Furtado A, Gomes V, Aaby P, Petersen E, Wejse C: Treatment delay affects clinical severity of tuberculosis: a longitudinal cohort study. BMJ Open 2014, 4(6):e004818.
54. Jianzhao H, Van den Hof S, Lin X, Yubang Q, Jinglong H, Van der Werf M: Risk factors for non-cure among new sputum smear positive tuberculosis patients treated in tuberculosis dispensaries in Yunnan, China. BMC health services research 2011, 11:97.
55. Mor Z, Kolb H, Lidji M, Migliori G, Leventhal A: Tuberculosis diagnostic delay and therapy outcomes of non-national migrants in Tel Aviv, 1998-2008. Euro surveillance : bulletin Europeen sur les maladies transmissibles = European communicable disease bulletin 2013, 18(12).
56. KNCV, WHO, JATA: The Tool to Estimate Patients’Costs In.: KNCV Tuberculosis Foundation,World Health Organization,Japan Anti-Tuberculosis Association; 2008.
57. Aspler A, Menzies D, Oxlade O, Banda J, Mwenge L, Godfrey-Faussett P, Ayles H: Cost of tuberculosis diagnosis and treatment from the patient perspective in Lusaka, Zambia. Int J Tuberc Lung Dis 2008, 12(8):928-935.
58. Liu X, Thomson R, Gong Y, Zhao F, Squire SB, Tolhurst R, Zhao X, Yan F, Tang S: How affordable are tuberculosis diagnosis and treatment in rural China? An analysis from community and tuberculosis patient perspectives. Trop Med Int Health 2007, 12(12):1464-1471.
59. Ndeikoundam Ngangro N, Chauvin P, Halley des Fontaines V: Determinants of tuberculosis diagnosis delay in limited resources countries. Revue d'epidemiologie et de sante publique 2012, 60(1):47-57.
60. Long Q, Smith H, Zhang T, Tang S, Garner P: Patient medical costs for tuberculosis treatment and impact on adherence in China: a systematic review. BMC Public Health 2011, 11:393.
61. Faustini A, Hall J, Perucci A: Risk factors for multidrug resistant tuberculosis in Europe: a systematic review. Thorax 2006, 61:158-161.
92
62. Pooran A, Pieterson E, Davids M, Theron G, Dheda K: What is the cost of diagnosis and management of drug resistant tuberculosis in South Africa? PLoS One 2013, 8(1):e54587.
63. Ukwaja KN, Alobu I, Lgwenyi C, Hopewell PC: The high cost of free tuberculosis services: patient and household costs associated with tuberculosis care in Ebonyi State, Nigeria. PLoS One 2013, 8(8):e73134.
64. Othman G, Ibrahim M, Raja'a Y: Costs associated with tuberculosis diagnosis and treatment in Yemen for patients and public health services. Eastern Mediterranean health journal = La revue de sante de la Mediterranee orientale = al-Majallah al-sihhiyah li-sharq al-mutawassit 2012, 18(4):393-398.
65. Mesfin M, Newell J, Madeley R, Mirzoev T, Tareke I, Kifle Y, Gessessew A, Walley J: Cost implications of delays to tuberculosis diagnosis among pulmonary tuberculosis patients in Ethiopia. BMC Public Health 2010, 10(173).
66. Federal Democratic Republic of Ethiopia Ministry of Health: Ethiopia’s Fourth National Health Accounts,2007/08. In. Addis Ababa: Federal Democratic Republic of Ethiopia Ministry of Health; 2010.
67. Datiko D, Lindtjorn B: Cost and cost-effectiveness of smear-positive tuberculosis treatment by Health Extension Workers in Southern Ethiopia: a community randomized trial. PLoS One 2010, 5(2):e9158.
68. Jensen A.Paul, Lambert A. Lauren, Iademarco F.Michael, Ridzon Renee: Guidelines for Preventing the Transmission of Mycobacterium tuberculosis in Health-Care Settings, 2005. In: Morbidity and Mortality Weekly Report (MMWR). vol. 54: CDC; 2005.
69. Tostmann A KS, Kalisvaart NA, Sebek MM, Verver S, Boeree MJ, van Soolingen D: Tuberculosis transmission by patients with smear-negative pulmonary tuberculosis in a large cohort in the Netherlands. Clin Infect Dis 2008, 47(9):1135.
70. Raza S, Sarfaraz M, Ahmad M: Practice of family and non-family based directly observed treatment for tuberculosis in Pakistan: A retrospective cohort study. theHealth 2012, 3(2):39-44.
71. Lambert Marie-Laurence, Hasker Epco, Van Deun Armand, Roberfroid Dominique, Boelaert Marleen, Van der Stuyft Patrick: Recurrence in tuberculosis: relapse or reinfection? The Lancet Infectious Diseases 2003, 3:282-287.
72. Jee Ha Sun, Golub E. Jonathan, Jo Jaeseong, Park Su Il, Ohrr Heechoul, M.Jonathan S: Smoking and Risk of Tuberculosis Incidence, Mortality, and Recurrence in South Korean Men and Women. American Journal of Epidemiology 2009, 170(12):1478–1485.
73. Lienhardt C , Fielding K , JS Sillah, et al: Investigation of the risk factors for tuberculosis: a case–control study in three countries in West Africa. International Journal of Epidemiology 2005, 34:914-923.
74. de Alencar Ximenes RA, de Fatima Pessoa Militao de Albuquerque M, Souza WV, Montarroyos UR, Diniz GTN, Luna CF, Rodrigues LC: Is it better to be rich in a poor area or poor in a rich area? A multilevel analysis of a case-control study of social determinants of tuberculosis. International Journal of Epidemiology 2009, 38(5):1285-1296.
75. Dunlap E.Nancy, Bass John , Fujiwara Paula , Hopewell Philip , Horsburgh C. Robert, Salfinger Max , Simone M.Patricia: Diagnostic Standards and Classification of Tuberculosis in Adults and Children. In. Edited by CDC Atsa; 1999.
76. MD Perkins, AL Kritski: Diagnostic testing in the control of tuberculosis Bull World Health Organ 2002, 80(6):512-513.
77. Birtish Medical Council: Streptomycin for treatment of pulmonary tuberculosis. British medical journal 1948, 2(4582):769-782.

93
78. Hill AB: Suspended judgment. Memories of the British Streptomycin Trial in Tuberculosis. The first randomized clinical trial. Controlled clinical trials 1990, 11(2):77-79.
79. Crofton J, Mitchison DA: Streptomycin resistance in pulmonary tuberculosis. British medical journal 1948, 2(4588):1009-1015.
80. Co-operative controlled trial of a standard regimen of streptomycin, PAS and isoniazid and three alternative regimens of chemotherapy in Britain. A report from the British Medical Research Council. Tubercle 1973, 54(2):99-129.
81. Obermeyer Ziad A-KJ, Christopher J. L. Murray: Has the DOTS Strategy Improved Case Finding or Treatment Success? An Empirical Assessment. PLoS One 2008, 3(3).
82. Leopold BJ: WHO response to resurgence of Tuberculosis: The DOTS strategy for effective control. Pacific Health Dialogue 1998, 5(1).
83. Dye Christopher, Garnett P Geoffrey, Sleeman Karen WGB: Prospects for worldwide tuberculosis control under the WHO DOTS strategy. The Lancet 1998, 352:1886-1891.
84. World Health Organization: Interim policy on collaborative TB/HIV activities In. Geneva: World Health Organization; 2002.
85. World Health Organization: WHO policy on collaborative TB/HIV activities Guidelines for national programmes and other stakeholders. In. Italy: WHO Library Cataloguing-in-Publication Data; 2012.
86. United Nations: United Nations millennium declaration: resolution adopted by the General Assembly. In.; 2000.
87. World Health Organization: Global tuberculosis report. In. France: WHO; 2013. 88. McLaren Zoë, Milliken Amanda, Meyer Amanda, Sharp Alana: Does directly observed therapy
improve tuberculosis treatment? More evidence is needed to guide tuberculosis policy. BMC Infectious Diseases 2016, 16(537).
89. World Health Organization: Global strategy and targets for tuberculosis prevention, care and control after 2015. In.; 2013.
90. Stop TB Partnership: The Global Plan to End TB 2016–2020. In.: UNOPS; 2015. 91. Federal Democratic Republic of Ethiopia Central Statistical Agency: Population Projection of
Ethiopia for All Regions At Wereda Level from 2014 – 2017. In. Addis Ababa: Central Statistical Authority; 2013.
92. Federal Democratic Republic of Ethiopia Ministry of Health: Ethiopia’s Fifth National Health Accounts,2010/11. In. Addis Ababa: Federal Democratic Republic of Ethiopia Ministry of Health; 2014.
93. Federal Minstry of Health of Ethiopia: Annual Bulletin of Tuberculosis,Leprosy and TB/HIV prevention and control program. In. Addis Ababa: Federal Minstry of Health 2012.
94. Federal Minstry of Health of Ethiopia: Annual performance report. In: Health sector development programme iv. Addis Ababa: Federal Minstry of Health; 2011.
95. Datiko Gemechu Daniel: Improving Tuberculosis Control in Ethiopia: performance of TB control programme,community DOTS and its cost-effectiveness. Norway: Bergen 2011.
96. Southern Nation Nationalities Peoples Region Health Bureau: Annual performance report In. Hawassa,Ethiopia: SNNPR HB; 2014.
97. Shargie B.Estifanos, Bernt L: DOTS improves treatment outcomes and service coverage for tuberculosis in South Ethiopia: a retrospective trend analysis. BMC Public Health 2005, 5(62).
98. Yassin MA, Datiko DG, Shargie EB: Ten-year experiences of the tuberculosis control programme in the southern region of Ethiopia. Int J Tuberc Lung Dis 2006, 10(10):1166-1171.
99. Ukwaja N.Kingsley, Alobu Isaac, Nweke O.Chibueze, Onyenwe C.Ephraim: Healthcare-seeking behavior, treatment delays and its determinants among pulmonary tuberculosis patients in rural Nigeria: a crosssectional study. BMC Health Serv Res 2013, 13(25).

94
100. Lin HP, Deng CY, Chou P: Diagnosis and treatment delay among pulmonary tuberculosis patients identified using the Taiwan reporting enquiry system, 2002-2006. BMC Public Health 2009, 9:55.
101. Sreeramareddy T.Chandrashekhar, Panduru V.Kishore, Menten Joris, Van den Ende J.: Time delays in diagnosis of pulmonary tuberculosis: a systematic review of literature. BMC Infect Dis 2009, 9(91).
102. Lorent N, Mugwaneza P, Mugabekazi J, Gasana M, Van Bastelaere S, Clerinx J, Van den Ende J: Risk factors for delay in the diagnosis and treatment of tuberculosis at a referral hospital in Rwanda. Int J Tuberc Lung Dis 2008, 12(4):392-396.
103. Rojpibulstit M, Kanjanakiritamrong J, Chongsuvivatwong V: Patient and health system delays in the diagnosis of tuberculosis in Southern Thailand after health care reform. Int J Tuberc Lung Dis 2006, 10(4):422-428.
104. Bassili Amal, Seita Akihiro, Baghdadi Samiha, AlAbsi Amin, Abdilai Ismail, Agboatwalla Mubina, Maamari Fadia, Mahshid N, Nasir Hashim, Soliman Sahar et al: Diagnostic and Treatment Delay in Tuberculosis in 7 Countries of the Eastern Mediterranean Region. Infect Dis Clin Pract 2008, 16:23-35.
105. Malbasa M, Pesut D: Is there delay in diagnosis of pulmonary tuberculosis in an intermediate-to-low TB incidence setting. Pneumologia (Bucharest, Romania) 2011, 60(3):138-142.
106. Wang W, Jiang Q, Abdullah AS, Xu B: Barriers in accessing to tuberculosis care among non-residents in Shanghai: a descriptive study of delays in diagnosis. European journal of public health 2007, 17(5):419-423.
107. Choudhari M, Jha N, Yadav DK, Chaudhary D: Factors associated with patient delay in diagnosis of pulmonary tuberculosis in a district. Journal of Nepal Health Research Council 2012, 10(22):234-238.
108. Belay M, Bjune G, Ameni G, Abebe F: Diagnostic and treatment delay among Tuberculosis patients in Afar Region, Ethiopia: a cross-sectional study. BMC Public Health 2012, 12:369.
109. Chikovore J, Hart G, Kumwenda M, Chipungu GA, Corbett L: 'For a mere cough, men must just chew Conjex, gain strength, and continue working': the provider construction and tuberculosis care-seeking implications in Blantyre, Malawi. Glob Health Action 2015, 8:26292.
110. Gershon AS, Wobeser W, Tu JV: Delayed tuberculosis treatment in urban and suburban Ontario. Canadian respiratory journal : journal of the Canadian Thoracic Society 2008, 15(5):244-248.
111. Leung EC, Leung CC, Tam CM: Delayed presentation and treatment of newly diagnosed pulmonary tuberculosis patients in Hong Kong. Hong Kong medical journal = Xianggang yi xue za zhi / Hong Kong Academy of Medicine 2007, 13(3):221-227.
112. Belkina T, Khojiev D, Tillyashaykhov M, Tigay Z, Kudenov M, Tebbens J, Vlcek J: Delay in the diagnosis and treatment of pulmonary tuberculosis in Uzbekistan: a cross-sectional study. BMC Infect Dis 2014, 14:624.
113. Daftary A, Padayatchi N: Social constraints to TB/HIV healthcare: accounts from coinfected patients in South Africa. AIDS care 2012, 24(12):1480-1486.
114. Long Q, Li Y, Wang Y, Yue Y, Tang C, Tang S, Squire SB, Tolhurst R: Barriers to accessing TB diagnosis for rural-to-urban migrants with chronic cough in Chongqing, China: a mixed methods study. BMC Health Serv Res 2008, 8:202.
115. Rabin A, Kuchukhidze G, Sanikidze E, Kempker R, Blumberg H: Prescribed and self-medication use increase delays in diagnosis of tuberculosis in the country of Georgia. The international journal of tuberculosis and lung disease : the official journal of the International Union against Tuberculosis and Lung Disease 2013, 17(2):214-220.
95
116. Takarinda KC, Harries AD, Nyathi B, Ngwenya M, Mutasa-Apollo T, Sandy C: Tuberculosis treatment delays and associated factors within the Zimbabwe national tuberculosis programme. BMC Public Health 2015, 15:29.
117. Mavhu W, Dauya E, Bandason T, Munyati S, Cowan FM, Hart G, Corbett EL, Chikovore J: Chronic cough and its association with TB-HIV co-infection: factors affecting help-seeking behaviour in Harare, Zimbabwe. Trop Med Int Health 2010, 15(5):574-579.
118. Fekih L, Boussoffara L, Abdelghaffar H, Hassene H, Fenniche S, Belhabib D, Zouari B, Megdiche ML: Effect of tobacco smoking on pulmonary tuberculosis. Revue medicale de Liege 2010, 65(3):152-155.
119. Yan F, Thomson R, Tang S, Squire SB, Wang W, Liu X, Gong Y, Zhao F, Tolhurst R: Multiple perspectives on diagnosis delay for tuberculosis from key stakeholders in poor rural China: case study in four provinces. Health Policy 2007, 82(2):186-199.
120. Chiang CY, Chang CT, Chang RE, Li CT, Huang RM: Patient and health system delays in the diagnosis and treatment of tuberculosis in Southern Taiwan. Int J Tuberc Lung Dis 2005, 9(9):1006-1012.
121. Molinier L, Bauvin E, Combescure C, Castelli C, Rebillard X, Soulie M, Daures JP, Grosclaude P: Methodological considerations in cost of prostate cancer studies: a systematic review. Value in health : the journal of the International Society for Pharmacoeconomics and Outcomes Research 2008, 11(5):878-885.
122. WHO: Guide to identifying the economic consequences of disease and injury. In. Geneva, Switzerland; 2009.
123. Single E. CD, Easton B., Harwood H., Lapsley H., Kopp P.,Wilson E., : International guidelines for estimating the costs of substance abuse 2edn: WHO Library Cataloguing-in-Publication Data 2003.
124. Changik Jo: Cost-of-illness studies: concepts, scopes, and methods. Clinical and Molecular Hepatology 2014, 20:327-337.
125. Glied S: Estimating the indirect cost of illness: an assessment of the forgone earnings approach. American Journal of Public Health 1996, 86(12):1723-1728.
126. Mogyorosy Zsolt SP: The main methodological issues in costing health care services In. York, UK: Centre for Health Economics Alcuin College University of York; 2005.
127. Chapple W, Katz AR, Li D: Associations between national tuberculosis program budgets and tuberculosis outcomes: an ecological study. The Pan African medical journal 2012, 12:66.
128. Pan HQ, Bele S, Feng Y, Qiu SS, Lu JQ, Tang SW, Shen HB, Wang JM, Zhu LM: Analysis of the economic burden of diagnosis and treatment of tuberculosis patients in rural China. The international journal of tuberculosis and lung disease : the official journal of the International Union against Tuberculosis and Lung Disease 2013, 17(12):1575-1580.
129. Umar NA, Fordham R, Abubakar I, Bachmann M: The indirect cost due to pulmonary Tuberculosis in patients receiving treatment in Bauchi State-Nigeria. Cost effectiveness and resource allocation : C/E 2012, 10(1):6.
130. Diel R, Vandeputte J, de Vries G, Stillo J, Wanlin M, Nienhaus A: Costs of tuberculosis disease in the European Union: a systematic analysis and cost calculation. The European respiratory journal 2014, 43(2):554-565.
131. Barter D, Agboola S, Murray M, Barnighausen T: Tuberculosis and poverty: the contribution of patient costs in sub-Saharan Africa--a systematic review. BMC Public Health 2012, 12:980.
132. Tanimura T, Jaramillo E, Weil D, Raviglione M, Lonnroth K: Financial burden for tuberculosis patients in low- and middle-income countries: a systematic review. The European respiratory journal 2014, 43(6):1763-1775.

96
133. Aye R, Wyss K, Abdualimova H, Saidaliev S: Household costs of illness during different phases of tuberculosis treatment in Central Asia: a patient survey in Tajikistan. BMC Public Health 2010, 10:18.
134. Laokri S, Drabo MK, Weil O, Kafando B, Dembele SM, Dujardin B: Patients are paying too much for tuberculosis: a direct cost-burden evaluation in Burkina Faso. PLoS One 2013, 8(2):e56752.
135. Laokri S, Amoussouhui A, Ouendo E, Hounnankan A, Anagonou S, Gninafon M, Kassa F, Tawo L, Dujardin B: A care pathway analysis of tuberculosis patients in benin: Highlights on direct costs and critical stages for an evidence-based decision-making. PLoS One 2014, 9(5):e96912.
136. Ukwaja KN, Modebe O, Igwenyi C, Alobu I: The economic burden of tuberculosis care for patients and households in Africa: a systematic review. The international journal of tuberculosis and lung disease : the official journal of the International Union against Tuberculosis and Lung Disease 2012, 16(6):733-739.
137. Bogale T, Haile Mariam D, Ali A: Costs of illness and coping strategies in a coffee-growing rural district of Ethiopia. J Health Popul Nutr 2005, 23(2):192-199.
138. Gurung GN, Chhetri PS, Jha N: Economic impact of pulmonary tuberculosis on patients and their families of Dharan municipality, Nepal. Nepal Medical College journal : NMCJ 2012, 14(3):196-198.
139. Umar NA, Abubakar I, Fordham R, Bachmann M: Direct costs of pulmonary tuberculosis among patients receiving treatment in Bauchi State, Nigeria. Int J Tuberc Lung Dis 2012, 16(6):835-840.
140. Lambert M, Delgado R, Michaux G, Volz A, Speybroeck N, Van Der Stuyft P: Delays to treatment and out-of-pocket medical expenditure for tuberculosis patients, in an urban area of South America. Annals of tropical medicine and parasitology 2005, 99(8):781-787.
141. Liu Q, Smith H, Wang Y, Tang S, Wang Q, Garner P: Tuberculosis patient expenditure on drugs and tests in subsidised, public services in China: a descriptive study. Trop Med Int Health 2010, 15(1):26-32.
142. World Health Organization: Adherence to long-term therapies: evidence for action In. Geneva: World Health Organization; 2003.
143. Mori T, Uchimura K, Shimao T: Impact of introducing rifampicin for the treatment of tuberculosis during the 1970's in Japan. Kekkaku : [Tuberculosis] 2013, 88(4):417-422.
144. Ukwaja KN, Oshi SN, Alobu I, Oshi DC: Six- vs. eight-month anti-tuberculosis regimen for pulmonary tuberculosis under programme conditions. Int J Tuberc Lung Dis 2015, 19(3):295-301, i-vii.
145. Gebreegziabher B, Bjune G, Yimer S: Total Delay Is Associated with Unfavorable Treatment Outcome among Pulmonary Tuberculosis Patients in West Gojjam Zone, Northwest Ethiopia: A Prospective Cohort Study. PLoS One 2016, 11(7):e0159579.
146. Sacks L, Pendle S: Factors related to in-hospital deaths in patients with tuberculosis. Archives of internal medicine 1998, 158(17):1916-1922.
147. World Health Organization: Strategic framework to decrease the burden of TB/HIV In. Geneva: World Health Organization; 2002.
148. de Albuquerque M, Ximenes R, Lucena-Silva N, de Souza W, Dantas A, T., Dantas O, Rodrigues L: Factors associated with treatment failure, dropout, and death in a cohort of tuberculosis patients in Recife, Pernambuco State, Brazil. Cadernos de saude publica 2007, 23(7):1573-1582.
149. Nglazi M, Bekker L-G, Wood R, Kaplan R: The impact of HIV status and antiretroviral treatment on TB treatment outcomes of new tuberculosis patients attending co-located TB and ART services in South Africa: a retrospective cohort study. BMC Infect Dis 2015, 15:536.
150. Karo B, Krause G, Hollo V, Van der Werf M, Castell S, Hamouda O, Haas W: Impact of HIV infection on treatment outcome of tuberculosis in Europe. AIDS 2016, 30(7):1089-1098.

97
151. Nik Nor Ronaidi NMNW, Mohammad Z Sharina, D Nik Rosmawati NH Factors associated with unsuccessful treatment outcome of pulmonary tuberculosis in Kota Bharu, Kelantan Malaysian Journal of Public Health Medicine 2011, 11(1):6-15.
152. Heunis C, Kigozi G, Chikobvu P, Botha S, van Rensburg HD: Risk factors for mortality in TB patients: a 10-year electronic record review in a South African province. BMC Public Health 2017, 17(1):38.
153. Sanchez M, Bartholomay P, Arakaki-Sanchez D, Enarson D, Bissell K, Barreira D, Harries A, nio Kritski A: Outcomes of TB Treatment by HIV Status in National Recording Systems in Brazil, 2003–2008. PLoS One 2012, 7(3).
154. Daniel OJ, Alausa OK: Treatment outcome of TB/HIV positive and TB/HIV negative patients on directly observed treatment, short course (DOTS) in Sagamu, Nigeria. Nigerian journal of medicine : journal of the National Association of Resident Doctors of Nigeria 2006, 15(3):222-226.
155. Shaweno D, Worku A: Tuberculosis treatment survival of HIV positive TB patients on directly observed treatment short-course in Southern Ethiopia: a retrospective cohort study. BMC Research Notes 2012, 5:682.
156. Jay K Varma, Sriprapa Nateniyom Somsak, Akksilp Wiroj Mankatittham, Chawin Sirinak, etal WS: HIV care and treatment factors associated with improved survival during TB treatment in Thailand: an observational study BMC Infect Dis 2009, 9(42).
157. Cain K, Anekthananon T, Burapat C, Akksilp S, Mankhatitham W, Srinak C: Causes of death in HIV-infected persons who have tuberculosis, Thailand Emerg Infect Dis 2009, 15(2).
158. Xianqin Ai KM, Liujia Guo,Tianhua Zhang,Yan Zhao,Xiaolu Sun,Hongwei Zhang,Marieke J van der
Werf,Susan van den Hof, Guangxue He: Factors associated with low cure rate of
tuberculosis in remote poor areas of Shaanxi Province, China: a case control study. BMC Public Health 2010, 10(112).
159. Xin Shen, Kathryn DeRiemer, Zheng'an Yuan, Mei Shen, Xiaohong Gui, Lili Wang, Mei J: Deaths among tuberculosis cases in Shanghai, China: who is at risk? BMC Infect Dis 2009, 9(95).
160. Benova L FK, Greig J, Nyang’wa B-T, Casas EC, et al,: Association of BMI Category Change with TB Treatment Mortality in HIV-Positive Smear-Negative and Extrapulmonary TB Patients in Myanmar and Zimbabwe. PLoS One 2012, 7(4).
161. Hoa N, Lauritsen J, Rieder H: Changes in body weight and tuberculosis treatment outcome in Viet Nam. The international journal of tuberculosis and lung disease : the official journal of the International Union against Tuberculosis and Lung Disease 2013, 17(1):61-66.
162. Bernabe-Ortiz Antonio, Carcamo Cesar P., Sanchez Juan F., Rios Julia: Weight Variation over Time and Its Association withTuberculosis Treatment Outcome: A Longitudinal Analysis. PLoS One 2011, 6(4).
163. Berhe G, Enquselassie F, Aseffa A: Treatment outcome of smear-positive pulmonary tuberculosis patients in Tigray Region,Northern Ethiopia. BMC Public Health 2012, 12:537.
164. Akinola A. Fatiregun, Abimbola S. Ojo, Bamgboye AE: Treatment outcomes among pulmonary tuberculosis patients at treatment centers in Ibadan, Nigeria Annals of African Medicine 2009, 8(2):100-104.
165. Munoz-Sellart M, Cuevas L, Tumato M, Merid Y, Yassin M: Factors associated with poor tuberculosis treatment outcome in the Southern Region of Ethiopia. The international journal of tuberculosis and lung disease : the official journal of the International Union against Tuberculosis and Lung Disease 2010, 14(8):973-979.
166. Manohar VB, Laxminarayan GP: Factors affecting tuberculosis retreatment defaults in India SOUTH EAST ASIAN J TROP MED PUBLIC HEALTH 2010, 41(5).
98
167. Finlay A. LJ, Timothy H Holtz, Weyer K., Miranda A., Walt M. van der: Patient- and provider-level risk factors associated with default from tuberculosis treatment, South Africa, a case-control study BMC Public Health 2012, 12(56).
168. Akhtar S, Rozi F, White H: Cohort analysis of directly observed treatment outcomes for tuberculosis patients in urban Pakistan Int J Tuberc Lung Dis 2011, 15(1):90-96.
169. Getahun B, Ameni G, Medhin G, Biadgilign S: Treatment outcome of tuberculosis patients under directly observed treatment in Addis Ababa, Ethiopia. The Brazilian journal of infectious diseases : an official publication of the Brazilian Society of Infectious Diseases 2013, 17(5):521-528.
170. World Health Organization: Priority research questions for tuberculosis/human immunodeficiency virus (TB/HIV) in HIV-prevalent and resource-limited settings. In. Edited by group THw. Geneva, Switzerland: WHO Library Cataloguing-in-Publication Data; 2010.
171. Soliman S, Nasehi M, Nassir A, Agboatwala M, Abdilai A, Maamary F, Al-Absi N: Diagnostic and treatment delay in tuberculosis:An in-depth analysis of the health-seeking behaviour of patients and health system response in seven countries of the Eastern Mediterranean Region. In. Egypt: WHO; 2006.
172. Federal Minstry of Health of Ethiopia: First Ethiopian National Population Based
Tuberculosis Prevalence Survey In. Addis Ababa: Federal Ministry of Health Ethiopia; 2011. 173. National Bank of Ethiopia: Inter-bank daily foriegn Exchange rate in (USD) -Archive. In.:
National Bank of Ethiopia; 2015. 174. World Health Organization: Definitions and reporting framework for tuberculosis – 2013
revision. In. Switzerland: WHO Library Cataloguing-in-Publication Data; 2013. 175. Council for International Organizations of Medical Sciences (CIOMS): International Ethical
Guidelines for Biomedical Research Involving Human Subjects. In., 3rd edn. Geneva; 2002. 176. Ethiopian Science and Technology Commission: National Health Research Ethics Review
Guideline. In., 4th edn. Addis Ababa, Ethiopia 2005.
177. World Health Organization: Treatment of tuberculosis: guidelines. In. Geneva: World Health Organization; 2003.
178. Tsai T-C, Hung MS, Chen IC, Chew G, Lee W-H: Delayed diagnosis of active pulmonary tuberculosis in emergency department. The American Journal of Emergency Medicine 2008, 26(8):888-892.
179. Lee CH, Lee MC, Lin HH, Shu CC, Wang JY, Lee LN, Chao KM: Pulmonary tuberculosis and delay in anti-tuberculous treatment are important risk factors for chronic obstructive pulmonary disease. PLoS One 2012, 7(5):e37978.
180. Grover M, Bhagat N, Sharma N, Dhuria M: Treatment pathways of extrapulmonary patients diagnosed at a tertiary care hospital in Delhi, India. Lung India : official organ of Indian Chest Society 2014, 31(1):16-22.
181. Chen Tc Fau - Lu P, Lu Pl Fau - Lin C, Lin Cy Fau - Lin W, Lin Wr Fau - Chen Y, Chen Y: Fluoroquinolones are associated with delayed treatment and resistance in tuberculosis: a systematic review and meta-analysis. International Journal of Infectious disease 2011(1878-3511 (Electronic)).
182. Rugina S, Dumitru IM, Resul G, Cernat RC, Petcu AE: Disseminated tuberculosis in HIV-infected patients from the Regional HIV/AIDS Center Constanta, Romania. Germs 2014, 4(1):16-21.
183. Ukwaja K, Alobu I, Lgwenyi C, Hopewell P: The high cost of free tuberculosis services: patient and household costs associated with tuberculosis care in Ebonyi State, Nigeria. PLoS One 2013, 8(8):e73134.

99
184. Yimer S, Hansen C, Bjune G: The perspective of private practitioners regarding tuberculosis case detection and treatment delay in Amhara Region, Ethiopia: a cross-sectional study. BMC Res Notes 2011, 4:285.
185. Ukwaja K, Alobu I, Abimbola S, Hopewell P: Household catastrophic payments for tuberculosis care in Nigeria: incidence, determinants, and policy implications for universal health coverage. Infectious diseases of poverty 2013, 2(1):21.
186. Wang J, Hsueh P, Jan I, Lee L, Liaw Y, Yang P, Luh K: Empirical treatment with a fluoroquinolone delays the treatment for tuberculosis and is associated with a poor prognosis in endemic areas. Thorax 2006, 61(10):903-908.
187. Wingfield T, Tovar M, Huff D, Boccia D, Saunders M, Datta S, Montoya R, Ramos E, Lewis J, Gilman R et al: Beyond pills and tests: addressing the social determinants of tuberculosis. Clinical medicine (London, England) 2016, 16(Suppl 6):s79-s91.
188. Uyei J, Coetzee D, Macinko J, Guttmacher S: Integrated delivery of HIV and tuberculosis services in sub-Saharan Africa: a systematic review. The Lancet Infectious Diseases 2011, 11:855-867.
189. Shankar E, Vignesh R, Ellegard R, Barathan M, Chong Y, Bador M, Rukumani D, Sabet N, Kamarulzaman A, Velu V et al: HIV-Mycobacterium tuberculosis co-infection: A 'danger-couple model' of disease pathogenesis. Pathogens and disease 2013.
190. Tessema B, Muche A, Bekele A, Reissig D, Emmrich F, Sack U: Treatment outcome of tuberculosis patients at Gondar University Teaching Hospital, Northwest Ethiopia. A five - year retrospective study. BMC Public Health 2009, 9:371.
191. Wang CS, Chen HC, Yang CJ, Wang WY, Chong IW, Hwang JJ, Huang MS: The impact of age on the demographic, clinical, radiographic characteristics and treatment outcomes of pulmonary tuberculosis patients in Taiwan. Infection 2008, 36(4):335-340.
192. Babalik Aylin, Kilicaslan Zeki , Caner S. Sevkan, Gokay Gungor1, Ortakoylu Gonenc M., Gencer Serap, McCurdy Stephen A.: A Registry-Based Cohort Study of Pulmonary Tuberculosis Treatment Outcomes in Istanbul, Turkey. Jpn J Infect Dis 2013, 66:115-120.
193. Feng Jia-Yih, Su Wei-Juin, Chiu Yu-Chi, Huang Shiang-Fen, Lin Yung-Yang, Huang Ruay-Ming, Lin Ching-Hsiung, Hwang Jhi-Jhu, Lee Jen-Jyh, Yu Ming-Chih et al: Initial Presentations Predict Mortality in Pulmonary Tuberculosis Patients - A Prospective Observational Study. Plose one 2011, 6(9):1-9.
194. Horne D, Royce S, Gooze L, Narita M, Hopewell P, Nahid P, Steingart K: Sputum Monitoring during Tuberculosis Treatment for Predicting Outcome: A Systematic Review and Meta-analysis. The Lancet Infectious Diseases 2010, 10(6):387-394.
195. Kayigamba Felix R. BMI, Mugisha Veronicah, Gasana Michel, Schim van der Loeff Maarten F., : Sputum completion and conversion rates after intensive phase of tuberculosis treatment: an assessment of the Rwandan control program. BMC research notes 2012, 5(357).
196. Djouma F, Nembot, Noubom M, Ateudjieu J, Donfack H: Delay in sputum smear conversion and outcomes of smear-positive tuberculosis patients: a retrospective cohort study in Bafoussam, Cameroon. BMC infectious diseases 2015, 15:139.

100
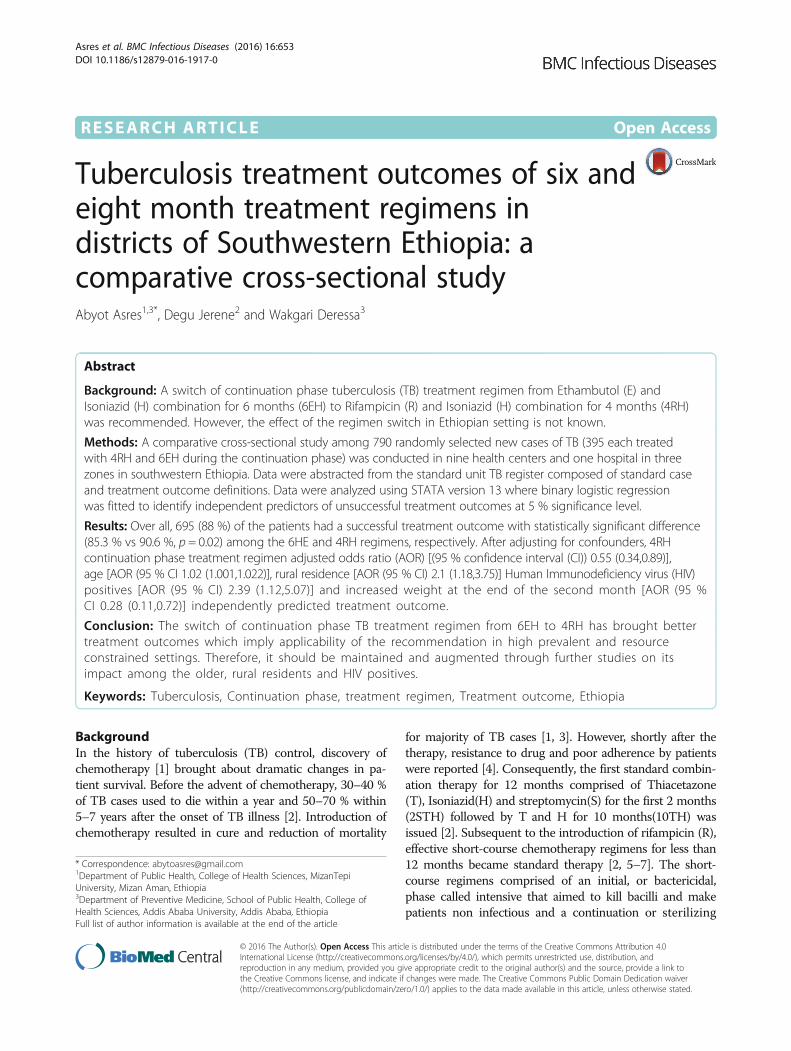
RESEARCH ARTICLE Open Access
Tuberculosis treatment outcomes of six andeight month treatment regimens indistricts of Southwestern Ethiopia: acomparative cross-sectional studyAbyot Asres1,3*, Degu Jerene2 and Wakgari Deressa3
Abstract
Background: A switch of continuation phase tuberculosis (TB) treatment regimen from Ethambutol (E) andIsoniazid (H) combination for 6 months (6EH) to Rifampicin (R) and Isoniazid (H) combination for 4 months (4RH)was recommended. However, the effect of the regimen switch in Ethiopian setting is not known.
Methods: A comparative cross-sectional study among 790 randomly selected new cases of TB (395 each treatedwith 4RH and 6EH during the continuation phase) was conducted in nine health centers and one hospital in threezones in southwestern Ethiopia. Data were abstracted from the standard unit TB register composed of standard caseand treatment outcome definitions. Data were analyzed using STATA version 13 where binary logistic regressionwas fitted to identify independent predictors of unsuccessful treatment outcomes at 5 % significance level.
Results: Over all, 695 (88 %) of the patients had a successful treatment outcome with statistically significant difference(85.3 % vs 90.6 %, p = 0.02) among the 6HE and 4RH regimens, respectively. After adjusting for confounders, 4RHcontinuation phase treatment regimen adjusted odds ratio (AOR) [(95 % confidence interval (CI)) 0.55 (0.34,0.89)],age [AOR (95 % CI 1.02 (1.001,1.022)], rural residence [AOR (95 % CI) 2.1 (1.18,3.75)] Human Immunodeficiency virus (HIV)positives [AOR (95 % CI) 2.39 (1.12,5.07)] and increased weight at the end of the second month [AOR (95 %CI 0.28 (0.11,0.72)] independently predicted treatment outcome.
Conclusion: The switch of continuation phase TB treatment regimen from 6EH to 4RH has brought bettertreatment outcomes which imply applicability of the recommendation in high prevalent and resourceconstrained settings. Therefore, it should be maintained and augmented through further studies on itsimpact among the older, rural residents and HIV positives.
Keywords: Tuberculosis, Continuation phase, treatment regimen, Treatment outcome, Ethiopia
BackgroundIn the history of tuberculosis (TB) control, discovery ofchemotherapy [1] brought about dramatic changes in pa-tient survival. Before the advent of chemotherapy, 30–40 %of TB cases used to die within a year and 50–70 % within5–7 years after the onset of TB illness [2]. Introduction ofchemotherapy resulted in cure and reduction of mortality
for majority of TB cases [1, 3]. However, shortly after thetherapy, resistance to drug and poor adherence by patientswere reported [4]. Consequently, the first standard combin-ation therapy for 12 months comprised of Thiacetazone(T), Isoniazid(H) and streptomycin(S) for the first 2 months(2STH) followed by T and H for 10 months(10TH) wasissued [2]. Subsequent to the introduction of rifampicin (R),effective short-course chemotherapy regimens for less than12 months became standard therapy [2, 5–7]. The short-course regimens comprised of an initial, or bactericidal,phase called intensive that aimed to kill bacilli and makepatients non infectious and a continuation or sterilizing
* Correspondence: [email protected] of Public Health, College of Health Sciences, MizanTepiUniversity, Mizan Aman, Ethiopia3Department of Preventive Medicine, School of Public Health, College ofHealth Sciences, Addis Ababa University, Addis Ababa, EthiopiaFull list of author information is available at the end of the article
© 2016 The Author(s). Open Access This article is distributed under the terms of the Creative Commons Attribution 4.0International License (http://creativecommons.org/licenses/by/4.0/), which permits unrestricted use, distribution, andreproduction in any medium, provided you give appropriate credit to the original author(s) and the source, provide a link tothe Creative Commons license, and indicate if changes were made. The Creative Commons Public Domain Dedication waiver(http://creativecommons.org/publicdomain/zero/1.0/) applies to the data made available in this article, unless otherwise stated.
Asres et al. BMC Infectious Diseases (2016) 16:653 DOI 10.1186/s12879-016-1917-0

phase which eliminates persisting mycobacteria toprevent relapse [1, 8]. Thus evidence based combina-tions of drugs for different categories of cases havebeen recommended for the two phases across thedifferent regimens [5–7].Introduction of Rifampicin has shortened TB treatment
duration [1, 9]. In 1991, an eight months treatment regi-men composed of 2 months intensive with Isoniazid(H),Rifampicin (R), Pyrazinamide(Z) and Ethambutol(E)(2RHZE/S) and 6 months continuation (6HE) phases wererecommended for all new cases of TB across the world[6]. To avoid resistance to the most potent drugs, isonia-zid and rifampcin and ensure patient adherence, directlyobserved treatment short course (DOTS) strategy waslaunched in 1994 [10]. Later in 2003, a directly observedintensive phase treatment followed by two continuationphase regimens, 6 months of isoniazid plus ethambutol(6HE) or 4 months of isoniazid plus rifampicin (4HR)were recommended. The 4HR continuation phase treat-ment regimen needed to be observed throughout thetreatment period whereas the 6EH regimen relied on selfadministered treatment [5]. As a result, regimens withoutrifampicin had been considered safer in developingcountries owing to irregular treatments and high ab-sentee rates [1, 5]. However, the latest World HealthOrganization (WHO) guideline recommends 2-monthinitial phase of (2RHZE) and a 4-month continuationphase (4RH) for the treatment of virtually all formsof new TB cases across the globe [7].The government of Ethiopia has adopted the switch of
4HR continuation phase TB treatment for all new casesand accommodated in the latest TB treatment guideline[11]. Though global strategies are relevant, investigationof the applicability to the local settings is highlyrequired. A continuation phase treatment with 4HRregimen elsewhere has demonstrated lower unsuccessfultreatment outcomes and costs as compared to 6EHcontinuation phase [12–15]. But well designed studiesevaluating effects of the introduction of 4RH for thecontinuation phase TB treatment in high TB burden andresource limited settings like Ethiopia are limited. Thus,we compared treatment outcomes of TB cases whoreceived 4RH and 6EH continuation phase regimensunder routine program condition in high burden andresource limited setting. Our objective was to comparebaseline patients’ bacteriologic, socio-demographics,clinical characteristics and treatment outcomes amongthose TB patients treated with the 4RH and 6EH con-tinuation phase treatment regimens.
MethodsStudy settingWe conducted this study in ten health facilities (onehospital and nine health centres) in three remote zones
of Southern Nation Nationalities and Peoples Region(SNNPR), one of the nine regions in Ethiopia with about18million population [16]. Ethiopia is among the 22 TBHigh Burden Countries (HBC) where 230,000 incidentcases of which 147,592 (64 %) were notified. In the sameyear, 16100 deaths and 90 % treatment success amongthe smear positives cases registered in 2011 werereported [17, 18]. The country has adopted and imple-mented the DOTS strategy for the treatment of all formsof TB. Accordingly new cases of TB had been treatedwith directly observed RHZE combinations for the first2 months (2RHZE) followed by self administered EHcombinations for six months (6EH) [19]. As of the endof 2011, the continuation phase treatment was switchedfrom 6EH to 4RH. Thus the regimen became directlyobserved 2RHZE/4RH combinations for all forms ofnew TB cases throughout the 6 months treatmentperiod [11].The three study Zones, Bench Maji, Kaffa and Sheka
are located at the southwestern border of the SNNPRwhere about 2,064,102 peoples reside [16]. The zones (anadministrative unit that liaison weredas with the region)are organized in to four town administrations and 26weredas (lowest administrative unit closer to the com-munity) those have three hospitals and 65 health centersthose provide TB DOTS services for free. However, thethree hospitals and only 27 health centers were provid-ing TB/Human Immunodeficeincy Virus (HIV) collab-orative activities [20].
Study design and samplingA comparative cross-sectional study among TB casestreated with 2RHZE/6EH and 2RHZE/4RH regimenswas carried out. New cases registered between 2008 and2014 were eligible of which those aged above 15 yearswere studied. Sample size was estimated using the StatCalc program of Epi Info version 7 [21] with 95 % confi-dence level, 80 % power and ratio of 6EH to 4RH (r = 1).Accordingly, 512 cases (256 from each group) wasrequired to detect 7 % difference [12] in the proportionof unsuccessful outcome among the 6EH and 4RHgroups. Finally, considering the design effect of 1.5 and10 % missing records, a total of 846 cases were required.The samples were selected through proportional alloca-tion to the three zones followed by selection of weredasand health facilities from the zone using probabilityproportional to size. The allocation and selection wasmade based on total number of cases reported from theweredas and health facilities during 2008 through 2014.Lastly, cases from the selected health facilities wereselected randomly using SPSS statistical software usingTB unit number of the cases.Data were extracted from a standard unit TB register
recommended by the WHO [11, 19, 22] using extraction
Asres et al. BMC Infectious Diseases (2016) 16:653 Page 2 of 8

format prepared for the study. Thus patients’ baselineattributes (age, gender, residence, sputum smear, type ofTB, HIV status) and follow-up measures (sputum smear,weight, drug regimen and treatment outcomes) wereextracted. The following standard case and outcomedefinitions were adopted and used for the study [11, 19].
� New case of TB a patient who never had treatmentfor TB, or had been on anti-TB treatment for lessthan four weeks in the past
� Other cases are those patients who do not fulfill thecriteria for new, relapse, and return after default ortreatment after failure.
� Cured: a patient whose sputum smear or culturewas positive at the beginning of the treatment butwho was smear or culture-negative in the last monthof treatment and on at least one previous occasion.
� Treatment completed: completed treatment butdoes not have a negative sputum smear or cultureresult in the last month of treatment and on at leastone previous occasion.
� Treatment failure: a patient whose sputum smear orculture is positive at 5 months or later duringtreatment or patients found to harbor MultidrugResistant (MDR) TB strain at any point of timeduring the treatment, whether they are smear-negativeor -positive.
� Died: a patient who dies for any reason during thecourse of TB treatment.
� Defaulter/loss to follow-up: a patient who has beenon treatment for at least 4 weeks and interruptedtreatment for eight or more consecutive weeks.
� Successful treatment: a treatment that ends up incure or treatment completion
� Unsuccessful treatment: a treatment that end up intreatment default or loss to follow up, treatmentfailure or death.
The extracted data were checked for consistency andcompleteness and entered in to Epinfo version 7 thatlater exported to STATA 12 [23] for analysis. Data weredescribed separately for the two groups (6EH and 4RH)using frequencies, mean, standard deviations and tables.Besides, crude comparisons of the baseline and followup measures among the 6EH and 4RH groups weremade using chi square (x2) or t-tests as appropriate.Subsequently, bivariate and multiple binary logistic regres-sion analysis were made to compute crude and adjustedodds ratios respectively between the explanatory andoutcome variables. Multiple logistic regression model wasfitted with those variables having p ≤ 0.2 on bivariateanalysis. Finally, statistical significance was judged atp < 0.05 and/or 95 % confidence interval (CI) of oddsratio (OR) excluding one.
Ethical considerationsWe received ethical approval from the institutionalreview board of the College of Health Sciences at AddisAbaba University. Accordingly, anonymous patient datawere extracted from routine service registry upon per-mission from the respective institutions.
ResultsDemographic and baseline clinical characteristicsWe retrieved 846 patient records of which 790 (93.4 %)with complete outcome records [395 each treated with2RHZE/6HE and 2RHZE/4RHregimens respectively]were described and analyzed. The mean age of the pa-tients was 30.8 (31.5 vs 30.9 years, p = 0. 5) respectively,for those treated with 6HE and 4HR (Table 1). Morethan half, 56.6 % and 55.7 % of the patients were maleand reside in rural areas, respectively, with no statisti-cally significant difference among the two groups. Withregard to the patient profile, 86.8 % and 77%were regis-tered at health center and had pulmonary TB, respect-ively. Of the patients, 765 (96.8 %) were new cases (378treated with 6EH vs387 with 4RH regimen) and the rest((25 (3.2 %) (17 from 6EH vs 8 from 4RH) were trans-ferred in and other cases treated with new case regimen.Human Immunodeficiency virus (HIV) test result wasavailable for 612 (77.5 %) with statistically significantdifference among the two groups [283 (71.6 %) from6EH and 329 (83.3 %) from 4RH, p < 0.001]. Amongthose tested HIV positives, 44 (57.1 %) received eitherCotrimoxazole Prophylactic Therapy (CPT) or Anti-retroviral Therapy (ART) with no statistically significantdifference among the regimens 24 (64.9 %) from 6EHand 20 (50 %), p = 0.2.
Patient follow-ups and treatment outcomesA total of 695 (88 %) of the patients had successful treat-ment outcomes with statistically significant difference(85.3 % vs 90.6 %, p = 0.02) among the 6HE and 4RHgroups, respectively (Table 2). A total of, 324 (90.3 %),208 (85.4 %) and 163 (91.1 %) of pulmonary positive,pulmonary negative and extra pulmonary TB casesrespectively had successful outcomes with statisticallysignificant difference, P = 0.03. Besides, statistically sig-nificant differences in successful outcomes, 64 (83.1 %),482 (90.1 %) and 149 (83.7 %, p = 0.005 were also foundamong HIV positive, HIV negatives and unknown HIVstatus TB cases, respectively.Measurements of patient weight at the end of second,
fifth and sixth/seventh months of treatment wereavailable for 504 (63.8 %), 145 (18.4 %) and 141 (17.8 %)respectively. Thus, 368 (46.6 %) or (48.4 % from 6EH and44.8 % from 4RH, p = 0.4) have gained some amount ofweight at the end of second month of treatment. Onthe other hand, of those initially smear positive pulmonary
Asres et al. BMC Infectious Diseases (2016) 16:653 Page 3 of 8
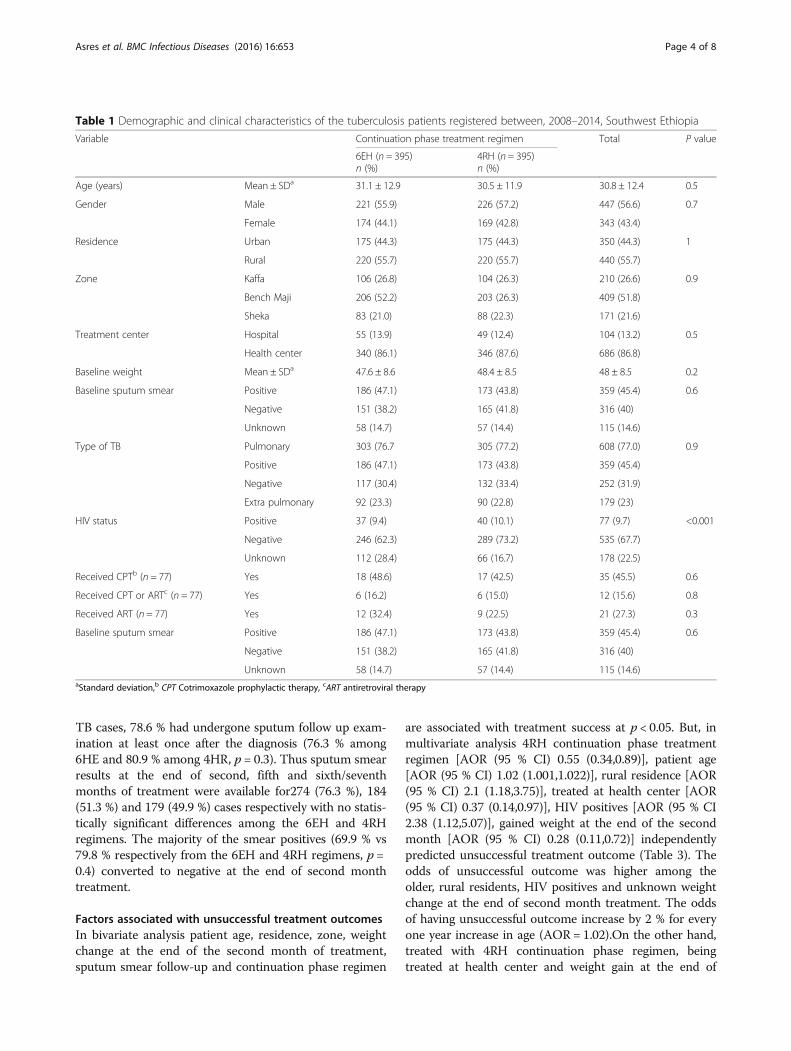
TB cases, 78.6 % had undergone sputum follow up exam-ination at least once after the diagnosis (76.3 % among6HE and 80.9 % among 4HR, p = 0.3). Thus sputum smearresults at the end of second, fifth and sixth/seventhmonths of treatment were available for274 (76.3 %), 184(51.3 %) and 179 (49.9 %) cases respectively with no statis-tically significant differences among the 6EH and 4RHregimens. The majority of the smear positives (69.9 % vs79.8 % respectively from the 6EH and 4RH regimens, p =0.4) converted to negative at the end of second monthtreatment.
Factors associated with unsuccessful treatment outcomesIn bivariate analysis patient age, residence, zone, weightchange at the end of the second month of treatment,sputum smear follow-up and continuation phase regimen
are associated with treatment success at p < 0.05. But, inmultivariate analysis 4RH continuation phase treatmentregimen [AOR (95 % CI) 0.55 (0.34,0.89)], patient age[AOR (95 % CI) 1.02 (1.001,1.022)], rural residence [AOR(95 % CI) 2.1 (1.18,3.75)], treated at health center [AOR(95 % CI) 0.37 (0.14,0.97)], HIV positives [AOR (95 % CI2.38 (1.12,5.07)], gained weight at the end of the secondmonth [AOR (95 % CI) 0.28 (0.11,0.72)] independentlypredicted unsuccessful treatment outcome (Table 3). Theodds of unsuccessful outcome was higher among theolder, rural residents, HIV positives and unknown weightchange at the end of second month treatment. The oddsof having unsuccessful outcome increase by 2 % for everyone year increase in age (AOR = 1.02).On the other hand,treated with 4RH continuation phase regimen, beingtreated at health center and weight gain at the end of
Table 1 Demographic and clinical characteristics of the tuberculosis patients registered between, 2008–2014, Southwest Ethiopia
Variable Continuation phase treatment regimen Total P value
6EH (n = 395)n (%)
4RH (n = 395)n (%)
Age (years) Mean ± SDa 31.1 ± 12.9 30.5 ± 11.9 30.8 ± 12.4 0.5
Gender Male 221 (55.9) 226 (57.2) 447 (56.6) 0.7
Female 174 (44.1) 169 (42.8) 343 (43.4)
Residence Urban 175 (44.3) 175 (44.3) 350 (44.3) 1
Rural 220 (55.7) 220 (55.7) 440 (55.7)
Zone Kaffa 106 (26.8) 104 (26.3) 210 (26.6) 0.9
Bench Maji 206 (52.2) 203 (26.3) 409 (51.8)
Sheka 83 (21.0) 88 (22.3) 171 (21.6)
Treatment center Hospital 55 (13.9) 49 (12.4) 104 (13.2) 0.5
Health center 340 (86.1) 346 (87.6) 686 (86.8)
Baseline weight Mean ± SDa 47.6 ± 8.6 48.4 ± 8.5 48 ± 8.5 0.2
Baseline sputum smear Positive 186 (47.1) 173 (43.8) 359 (45.4) 0.6
Negative 151 (38.2) 165 (41.8) 316 (40)
Unknown 58 (14.7) 57 (14.4) 115 (14.6)
Type of TB Pulmonary 303 (76.7 305 (77.2) 608 (77.0) 0.9
Positive 186 (47.1) 173 (43.8) 359 (45.4)
Negative 117 (30.4) 132 (33.4) 252 (31.9)
Extra pulmonary 92 (23.3) 90 (22.8) 179 (23)
HIV status Positive 37 (9.4) 40 (10.1) 77 (9.7) <0.001
Negative 246 (62.3) 289 (73.2) 535 (67.7)
Unknown 112 (28.4) 66 (16.7) 178 (22.5)
Received CPTb (n = 77) Yes 18 (48.6) 17 (42.5) 35 (45.5) 0.6
Received CPT or ARTc (n = 77) Yes 6 (16.2) 6 (15.0) 12 (15.6) 0.8
Received ART (n = 77) Yes 12 (32.4) 9 (22.5) 21 (27.3) 0.3
Baseline sputum smear Positive 186 (47.1) 173 (43.8) 359 (45.4) 0.6
Negative 151 (38.2) 165 (41.8) 316 (40)
Unknown 58 (14.7) 57 (14.4) 115 (14.6)aStandard deviation,b CPT Cotrimoxazole prophylactic therapy, cART antiretroviral therapy
Asres et al. BMC Infectious Diseases (2016) 16:653 Page 4 of 8

second month have lower likelihood of unsuccessfuloutcome. Patients put on 4RH continuation phase oftreatment regimen are 45 % less likely to have unsuc-cessful outcome compared to those put on 6EH regi-men. Patients treated at health center have about63 % lower odds of unsuccessful outcome as com-pared to those treated at hospitals. HIV co infectedTB patients have more than two fold higher risk ofunsuccessful outcomes compared to HIV negatives(AOR = 2.38). Those patients gained weight at the endof the second month of treatment have 72 % lowerodds of unsuccessful outcomes compared to thosewith reduced or unchanged weight (AOR = 0.28). Asubgroup analysis among smear positive pulmonarycases showed having a sputum checkup at least onceduring treatment independently predicted 96 % lowerodds of unsuccessful outcomes compared to thoseunchecked (AOR 0.04 (95 % CI, 0.01–0.12), P < 0.001)(Additional file 1).
DiscussionTreatment outcomes among TB patients treated withRHZE for the first 2 months, followed by HE for6 months (2RHZE/6EH) and RH for 4 months (2RHZE/4RH) was compared. Both groups of the cases had nostatistically significant difference with respect to socio-demographic, baseline clinical, bacteriologic and followup measures that depict comparability of the groups.The comparison was made between regimens usedduring the continuation phase treatment (4RH vs 6EH).Thus a lower rate of unsuccessful outcomes wasreported among those treated with 4RH continuationphase regimen.A statistically significant difference in treatment out-
comes where lower unsuccessful treatment outcome(9.4 % vs 14.7 %) was observed among patients treatedwith 4RH and 6EH regimen respectively. Similarly, astudy conducted in Nigeria [14] reported higher odds ofunsuccessful outcome among those treated with 6EH.
Table 2 Patient follow-up measures and treatment outcomes of TB patients registered during 2008–2014, Southwest Ethiopia
Variables Continuation phase treatment regimen
6EH (n = 395)n (%)
4RH (n = 395)n (%)
TotalN (%)
P value
Weight at 2nd month Mean ± SD 49.9 ± 8.9 50.8 ± 8.2 50.4 ± 8.6 0.2
Weight at 5th month Mean ± SD 51.4 ± 8.6 51.3 ± 7.3 51.3 ± 7.9 0.9
Weight at 6/7th month Mean ± SD 51.1 ± 8.9 52.5 ± 6.5 51.7 ± 7.9 0.3
Change in weight at 2nd month Not increased 49 (12.4) 61 (15.4) 110 (13.9) 0.4
Increased 191 (48.4) 177 (44.8) 368 (46.6)
Unknown 155 (39.2) 157 (39.7) 312 (39.5)
Sputum smear end of 2nd month (n = 359) Positive 4 (2.2) 2 (1.2) 6 (1.7) 0.09
Negative 130 (69.9) 138 (79.8) 268 (74.7)
Unknown 52 (28) 33 (19.1) 85 (23.7)
Sputum smear end of 5th month (n = 359) Positive 1 (0.5) 0 (0) 1 (0.3) 0.03
Negative 83 (44.6) 100 (57.8) 183 (51)
Unknown 102 (54.8) 73 (42.2) 175 (48.7)
Sputum smear end of 6/7th month (n = 359) Positive 0 0 0 0.8
Negative 94 (50.5) 85 (49.1) 179 (49.9)
Unknown 92 (49.5) 88 (50.9) 180 (50.1)
Sputum smear done during treatment (n = 359) No 44 (23.7) 33 (19.1) 77 (21.4) 0.3
At least once 142 (76.3) 140 (80.9) 282 (78.6)
Continuation phase visit Mean ± SD 5.8 ± 1.1 5.4 ± 3.1 0.09
Treatment outcome Successful 337 (85.3) 358 (90.6) 695 (88) 0.02
Cured 77 (19.5) 85 (21.5) 162 (20.5)
Completed 260 (65.8) 273 (69.1) 533 (67)
Unsuccessful 58 (14.7) 37 (9.4) 95 (12)
Died 28 (7.1) 18 (4.6) 46 (5.8)
Defaulted 29 (7.3) 19 (4.8) 48 (6.1)
Failure 1 (0.3) 0 1 (0.1)
Asres et al. BMC Infectious Diseases (2016) 16:653 Page 5 of 8
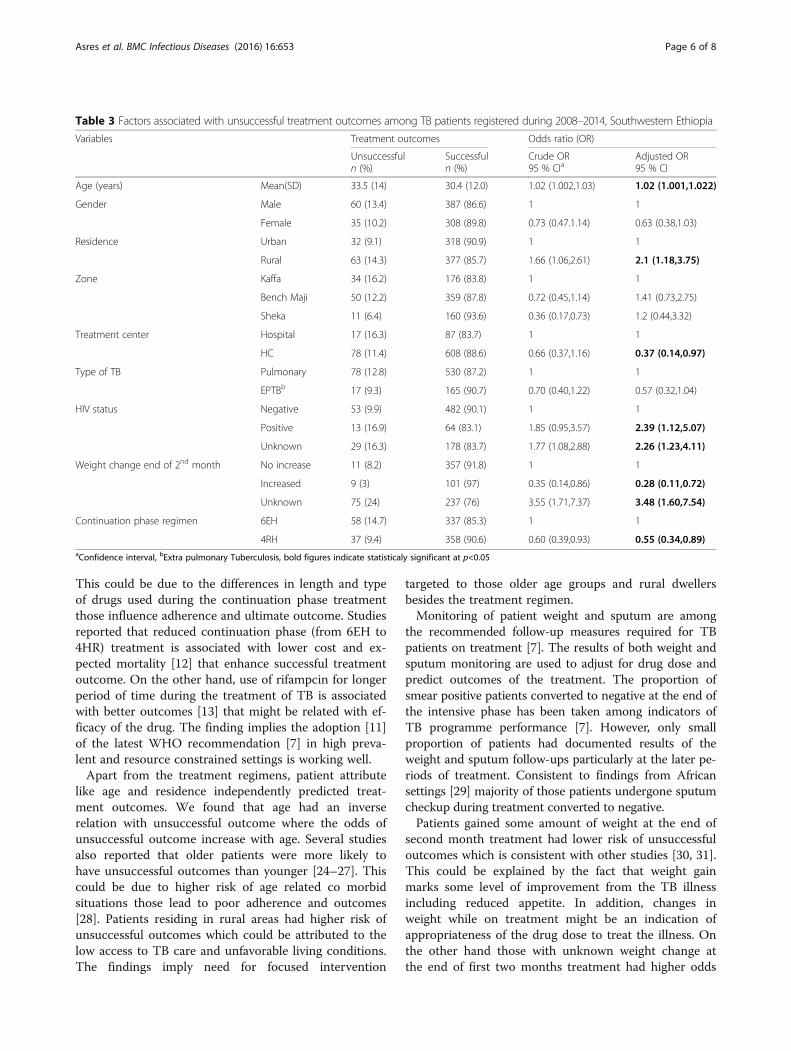
This could be due to the differences in length and typeof drugs used during the continuation phase treatmentthose influence adherence and ultimate outcome. Studiesreported that reduced continuation phase (from 6EH to4HR) treatment is associated with lower cost and ex-pected mortality [12] that enhance successful treatmentoutcome. On the other hand, use of rifampcin for longerperiod of time during the treatment of TB is associatedwith better outcomes [13] that might be related with ef-ficacy of the drug. The finding implies the adoption [11]of the latest WHO recommendation [7] in high preva-lent and resource constrained settings is working well.Apart from the treatment regimens, patient attribute
like age and residence independently predicted treat-ment outcomes. We found that age had an inverserelation with unsuccessful outcome where the odds ofunsuccessful outcome increase with age. Several studiesalso reported that older patients were more likely tohave unsuccessful outcomes than younger [24–27]. Thiscould be due to higher risk of age related co morbidsituations those lead to poor adherence and outcomes[28]. Patients residing in rural areas had higher risk ofunsuccessful outcomes which could be attributed to thelow access to TB care and unfavorable living conditions.The findings imply need for focused intervention
targeted to those older age groups and rural dwellersbesides the treatment regimen.Monitoring of patient weight and sputum are among
the recommended follow-up measures required for TBpatients on treatment [7]. The results of both weight andsputum monitoring are used to adjust for drug dose andpredict outcomes of the treatment. The proportion ofsmear positive patients converted to negative at the end ofthe intensive phase has been taken among indicators ofTB programme performance [7]. However, only smallproportion of patients had documented results of theweight and sputum follow-ups particularly at the later pe-riods of treatment. Consistent to findings from Africansettings [29] majority of those patients undergone sputumcheckup during treatment converted to negative.Patients gained some amount of weight at the end of
second month treatment had lower risk of unsuccessfuloutcomes which is consistent with other studies [30, 31].This could be explained by the fact that weight gainmarks some level of improvement from the TB illnessincluding reduced appetite. In addition, changes inweight while on treatment might be an indication ofappropriateness of the drug dose to treat the illness. Onthe other hand those with unknown weight change atthe end of first two months treatment had higher odds
Table 3 Factors associated with unsuccessful treatment outcomes among TB patients registered during 2008–2014, Southwestern Ethiopia
Variables Treatment outcomes Odds ratio (OR)
Unsuccessfuln (%)
Successfuln (%)
Crude OR95 % CIa
Adjusted OR95 % CI
Age (years) Mean(SD) 33.5 (14) 30.4 (12.0) 1.02 (1.002,1.03) 1.02 (1.001,1.022)
Gender Male 60 (13.4) 387 (86.6) 1 1
Female 35 (10.2) 308 (89.8) 0.73 (0.47.1.14) 0.63 (0.38,1.03)
Residence Urban 32 (9.1) 318 (90.9) 1 1
Rural 63 (14.3) 377 (85.7) 1.66 (1.06,2.61) 2.1 (1.18,3.75)
Zone Kaffa 34 (16.2) 176 (83.8) 1 1
Bench Maji 50 (12.2) 359 (87.8) 0.72 (0.45,1.14) 1.41 (0.73,2.75)
Sheka 11 (6.4) 160 (93.6) 0.36 (0.17,0.73) 1.2 (0.44,3.32)
Treatment center Hospital 17 (16.3) 87 (83.7) 1 1
HC 78 (11.4) 608 (88.6) 0.66 (0.37,1.16) 0.37 (0.14,0.97)
Type of TB Pulmonary 78 (12.8) 530 (87.2) 1 1
EPTBb 17 (9.3) 165 (90.7) 0.70 (0.40,1.22) 0.57 (0.32,1.04)
HIV status Negative 53 (9.9) 482 (90.1) 1 1
Positive 13 (16.9) 64 (83.1) 1.85 (0.95,3.57) 2.39 (1.12,5.07)
Unknown 29 (16.3) 178 (83.7) 1.77 (1.08,2.88) 2.26 (1.23,4.11)
Weight change end of 2nd month No increase 11 (8.2) 357 (91.8) 1 1
Increased 9 (3) 101 (97) 0.35 (0.14,0.86) 0.28 (0.11,0.72)
Unknown 75 (24) 237 (76) 3.55 (1.71,7.37) 3.48 (1.60,7.54)
Continuation phase regimen 6EH 58 (14.7) 337 (85.3) 1 1
4RH 37 (9.4) 358 (90.6) 0.60 (0.39,0.93) 0.55 (0.34,0.89)aConfidence interval, bExtra pulmonary Tuberculosis, bold figures indicate statisticaly significant at p<0.05
Asres et al. BMC Infectious Diseases (2016) 16:653 Page 6 of 8
of unsuccessful outcomes. This might have occurred dueto possible misclassification of cases with reduced orremains unchanged to unknown. The weight changemight be unknown due to patients’ treatment interrup-tion subsequent to treatment default or death thoseconstitute unsuccessful outcome. So that patient’s statusof weight during treatment might be left undetermined.Having sputum checkup at least once during treat-
ment among initially smear positives predicted lowerrisk of unsuccessful outcome. However, reviews showedlow sensitivity and modest specificity of sputum resultsat the end of intensive phase to predict failure andrelapse [32]. On the other hand, detection of sputumpositive during treatment trigger further patient assess-ment that influence treatment regimens and ultimateoutcome. Hence, the routine sputum monitoringadopted by the country [11] during treatment should beimproved as it is an indicator of program performanceand trigger for patient assessment.Consistent with other studies [33, 34], HIV positive TB
patients are more likely to have unsuccessful outcomescompared to those negatives. This could be due tomultifaceted influences of HIV on TB diagnosis andresponse to TB treatment those negatively affect the out-comes of TB treatment [35]. Consequently, collaborativeservices have been recommended in order to curb theinfluence of HIV on TB and vice versa [36]. Evidencesfrom systematic review in African context supported therecommendation and reported better outcomes amongconcurrently screened and managed TB and HIV in-fected patients [37]. Nonetheless, we found no statisti-cally significant difference in treatment success amongthose infected TB patients provided with CPT and/orART. The indifference could be explained by the low up-take of integrated TB/HIV collaborative services amongthe studied patients. In this study, more than threequarter of the patients were offered HIV test which islittle higher than the national average of 65 % [18] and9.7 % TB/HIV co infected patients which is almost simi-lar to the national average of 10 %. However, only fewHIV co infected patients (45 % on CPT and 27.3 % onART) were found to have documented service provision.[18]. The discrepancies could be due to differences inreporting periods where the national average is a singleyear attainment but that of this study is over a period ofsix years including the nationally reported year. Over all,the targets set for the TB/HIV service collaboration hasnot yet met which calls for in depth understanding andfocused intervention that suit local settings. On theother hand, unknown HIV status predicted higher oddsof unsuccessful outcomes. This could be due to possiblemisclassification of HIV positive cases those predictworse outcome in to unknown. The study is limited tocontrol for changes in medical resources, polices and
quality of care across the study periods. Since only fewvariables were captured on the register, we could notcontrol for possible confounding effect of socio-economic, lifestyle and co morbid illness. Furthermoreresistance pattern of the treatment regimens could notbe evaluated which is recommended for the assessmentof impact of treatment regimens. On the other hand therandom selection of relatively large sample from bothgroups minimized risk of selection bias. The groupstreated with 4RH and 6EH had insignificant differenceswith regard to baseline and follow-up clinical and bacte-riologic attributes that enhanced comparability of thegroups. Besides, we extracted data from a standardizedroutine programme register that reflect operationalreality. In general, our study is valid and can apply insimilar settings given the limitations.
ConclusionIn conclusion, the switch of continuation phase TB treat-ment regimen for new cases from 6EH to 4RH has broughtbetter treatment outcomes. The findings verified the applic-ability of latest WHO recommendation and national adop-tion to the high prevalent and resource constrainedsettings. However, the unsuccessful outcome among theolder, rural dwellers and HIV positives is higher independ-ent of the treatment regimen that need further investigationand focused intervention. Therefore, the recommendedswitch of treatment regimen should be maintained andprogressively assessed for outcomes, including drug resist-ance survey or surveillance. Moreover, further studiesshould be carried out on the impact of treatment regimensamong older, rural residents and HIV positives.
Additional file
Additional file 1: Table 4: Factors associated with unsuccessful treatmentoutcome among smear positive pulmonary TB cases registered during2008-2014, southwestern Ethiopia (n=359). Table 5: Factors associated withunsuccessful outcome among clinically diagnosed (smear negative 10.1186/s12879-016-1917-0 pulmonary and extra pulmonary) TB cases registeredduring 2008-2014, Southwestern Ethiopia (n=431). (DOCX 17 kb)
AbbreviationsART: Antiretroviral therapy; CI: Confidence interval; CPT: Cotrimoxazoleprophylactic therapy; DOTS: Directly Observed Treatment Short course;EH: Ethambutol and Isoniazid combination; HIV: Human ImmunodeficiencyVirus; OR: Odds ratio; RH: Rifampicin and Isoniazid combination;RHZE: Rifampicin, Isoniazid, Pyrazinamide and Ethambutol combination;TB: Tuberculosis; WHO: World Health Organization
AcknowledgmentWe are indebted to Addis Ababa and MizanTepi Universities for financial andmaterial supports for the study. We are also grateful to the staffs of studydistricts and health facilities for their all rounded supports during the dataabstraction.
FundingFinancial and material supports were obtained from Addis Ababa and MizanTepi Universities based in Ethiopia.
Asres et al. BMC Infectious Diseases (2016) 16:653 Page 7 of 8

Availability of data and materialsThe datasets analyzed during the current study will be available from thecorresponding author on reasonable request.
Authors’ contributionsAA conceived, designed the study, analyzed data and prepared manuscript.WD and DJ critically reviewed for intellectual content of the study protocoland manuscript as primary and co-supervisors respectively. All authorsapproved the final version of the manuscript.
Competing interestsThe authors declare that they have no competing interests.
Consent for publicationNot applicable.
Ethics approval and consent to participateThe study protocol was approved by the institutional review board of the collegeof health sciences at Addis Ababa University (protocol number 045/14/sph). Sincewe did not carry out patient interview or examination, consent of participationwas not sought as the patients were not on treatment at the time of study.Accordingly an anonymous patient data from routine service registry (unit TBregister) were abstracted upon formal permissions of the health facilities.
Author details1Department of Public Health, College of Health Sciences, MizanTepiUniversity, Mizan Aman, Ethiopia. 2Management Science for Health, HEAL TBproject, Addis Ababa, Ethiopia. 3Department of Preventive Medicine, Schoolof Public Health, College of Health Sciences, Addis Ababa University, AddisAbaba, Ethiopia.
Received: 26 September 2015 Accepted: 11 October 2016
References1. Hill AB. Suspended judgment. Memories of the British Streptomycin
Trial in Tuberculosis. The first randomized clinical trial. Control Clin Trials.1990;11(2):77–9.
2. Arandottir T. Tuberculosis and public health: Policy and principles ofTuberculosis control. Paris: International Union Against Tuberculosis andLung Disease; 2009.
3. British Medical council. Streptomycin for treatment of pulmonarytuberculosis. Br Med J. 1948;2(4582):769–82.
4. Crofton J, Mitchison DA. Streptomycin resistance in pulmonary tuberculosis.Br Med J. 1948;2(4588):1009–15.
5. WHO. Treatment of Tuberculosis: Guidelines for National Programmes.Geneva: World Health Organization; 2003.
6. WHO. Guidelines for tuberculosis treatment in adults and children innational tuberculosis programmes. Geneva: World Health Organization;1991.
7. World Health Organization. Treatment of tuberculosis: guidelines. Geneva:World Health Organization; 2010.
8. Fauce KB, Jameson HL. In: Kasper DL, Fauci AS, Longo DL, Braunwald E,Hauser SL, Jameson JL, editors. Harrison’s principles of Internal Medicine.In tuberculosis,16 edn. USA: McGraw-Hill companies Medical publishingdivision; 2005. p. 2783.
9. Mori T, Uchimura K, Shimao T. Impact of introducing rifampicin for thetreatment of tuberculosis during the 1970's in Japan. Kekkaku [Tuberculosis].2013;88(4):417–22.
10. World Health Organization. WHO tuberculosis control program: Frameworkfor effective tuberculosis control. 1994.
11. Federal Ministry of Health of Ethiopia. Guidelines for clinical andprogrammatic management of TB, Leprosy and TB/HIV in Ethiopia. 5th ed.Addis Ababa: Ethiopian Federal Ministry of Health; 2012.
12. Manabe YC, Hermans SM, Lamorde M, Castelnuovo B, Mullins CD,Kuznik A. Rifampicin for continuation phase tuberculosis treatment inUganda: a cost-effectiveness analysis. PLoS One. 2012;7(6):e39187.
13. Menzies D, Benedetti A, Paydar A, Martin I, Royce S, Pai M, Vernon A,Lienhardt C, Burman W. Effect of duration and intermittency of rifampin ontuberculosis treatment outcomes: a systematic review and meta-analysis.PLoS Med. 2009;6(9):e1000146.
14. Ukwaja KN, Oshi SN, Alobu I, Oshi DC. Six- vs. eight-month anti-tuberculosisregimen for pulmonary tuberculosis under programme conditions. Int JTuberc Lung Dis. 2015;19(3):295–301. i-vii.
15. Fox W, Ellard GA, Mitchison DA. Studies on the treatment of tuberculosisundertaken by the British Medical Research Council tuberculosis units, 1946–1986,with relevant subsequent publications. Int J Tuberc Lung Dis. 1999;3:231–79.
16. Federal Democratic Republic of Ethiopia Central Statistical Agency.Population Projection of Ethiopia for All Regions At Wereda Level from2014 – 2017. Addis Ababa: CSA; 2013.
17. Federal Ministry of Health of Ethiopia. Annual performance report. In: Health sectordevelopment programme iv. Addis Ababa: Federal Ministry of Health; 2011.
18. World Health Organization. Global tuberculosis report. In. France: WHO; 2013.19. Federal Ministry of Health of Ethiopia. Tuberculosis, Leprosy and TB/HIV
Prevention and Control Programme Manual. 4th ed. Addis Ababa: Ministryof Health of Ethiopia; 2008.
20. Southern Nation Nationalities Peoples Region Health Bureau (2014). "Healthprofile of Southern Nation Nationalities Peoples Region." Tuberculosis. 2015,from http://www.SNNPRHB.gov.et. Accessed 28 Oct 2015.
21. Centers for Disease Control and Prevention(CDC) (2011). "Epi Info™, adatabase and statistics program for public health professionals." 7. fromhttp://www.cdc.gov/epiinfo.
22. World Health Organization. Definitions and reporting framework fortuberculosis – 2013 revision. In. Switzerland: WHO Library Cataloguing-in-Publication Data; 2013.
23. StataCorp. Stata: Release 13. Statistical Software. 13th ed. College Station:StataCorp LP; 2011.
24. Tessema B, Muche A, Bekele A, Reissig D, Emmrich F, Sack U. Treatment outcomeof tuberculosis patients at Gondar University Teaching Hospital, NorthwestEthiopia. A five - year retrospective study. BMC Public Health. 2009;9:371.
25. Munoz-Sellart M, Cuevas LE, Tumato M, Merid Y, Yassin MA. Factorsassociated with poor tuberculosis treatment outcome in the SouthernRegion of Ethiopia. Int J Tuberc Lung Dis. 2010;14(8):973–9.
26. Berhe G, Enquselassie F, Assefa A. Treatment outcome of smear-positivepulmonary tuberculosis patients in Tigray Region, Northern Ethiopia.BMC Public Health. 2012;12:537.
27. Feng J-Y, Su W-J, Chiu Y-C, Huang S-F, Lin Y-Y, Huang R-M, Lin C-H,Hwang J-J, Lee J-J, Yu M-C, et al. Initial presentations predict mortalityin pulmonary tuberculosis patients - a prospective observational study.PloS One. 2011;6(9).
28. Wang CS, Chen HC, Yang CJ, Wang WY, Chong IW, Hwang JJ, Huang MS.The impact of age on the demographic, clinical, radiographic characteristicsand treatment outcomes of pulmonary tuberculosis patients in Taiwan.Infection. 2008;36(4):335–40.
29. Kayigamba FR, Bakker MI, Mugisha V, Gasana M, Schim van der Loeff MF.Sputum completion and conversion rates after intensive phase oftuberculosis treatment: an assessment of the Rwandan control program.BMC Res Notes. 2012;5(357).
30. Bernabe-Ortiz A, Carcamo CP, Sanchez JF, Rios J. Weight variation over timeand its association with tuberculosis treatment outcome: a longitudinalanalysis. PLoS One. 2011;6(4).
31. Hoa NB, Lauritsen JM, Rieder HL. Changes in body weight andtuberculosis treatment outcome in Viet Nam. Int J Tuberc Lung Dis.2013;17(1):61–6.
32. Horne DJ, Royce SE, Gooze L, Narita M, Hopewell PC, Nahid P, Steingart KR.Sputum monitoring during tuberculosis treatment for predicting outcome:a systematic review and meta-analysis. Lancet Infect Dis. 2010;10(6):387–94.
33. Daniel OJ, Alausa OK. Treatment outcome of TB/HIV positive and TB/HIVnegative patients on directly observed treatment, short course (DOTS) inSagamu, Nigeria. Niger J Med. 2006;15(3):222–6.
34. Shaweno D, Worku A. Tuberculosis treatment survival of HIV positiveTB patients on directly observed treatment short-course in SouthernEthiopia: a retrospective cohort study. BMC Res Notes. 2012;5:682.
35. Maher D, Harries A, Getahun H. Tuberculosis and HIV interaction in sub-SaharanAfrica: impact on patients and programmes; implications for policies. Trop MedInt Health. 2005;10(8):734–42.
36. World Health Organization. WHO policy on collaborative TB/HIV activitiesGuidelines for national programmes and other stakeholders. Italy: WHOLibrary Cataloguing-in-Publication Data; 2012.
37. Uyei J, Coetzee D, Macinko J, Guttmacher S. Integrated delivery of HIV andtuberculosis services in sub-Saharan Africa: a systematic review. LancetInfect Dis. 2011;11:855–67.
Asres et al. BMC Infectious Diseases (2016) 16:653 Page 8 of 8

Pathways to anti-tuberculosis treatment initiation among cases on Directly Observed
Treatment Short course in districts of Southwestern Ethiopia. A cross-sectional study
Abyot Asres1,3*
, Degu Jerene2,Wakgari Deressa
3
1Department of Public Health, College of Health sciences, Mizan Tepi University, Mizan Aman,
Ethiopia
2Management Science for Health, Addis Ababa, Ethiopia
3Department of Preventive Medicine, School of Public Health, College of Health Sciences,
Addis Ababa University, Addis Ababa, Ethiopia
* Corresponding author
Email: [email protected] (AA), [email protected] (DJ), [email protected] (WD)

Abstract
Background: Delayed tuberculosis (TB) diagnosis and treatment increase morbidity, mortality,
expenditure, and transmission in the community. The aim of this study was to assess time delays
to initiate care seeking and treatment for TB and factors associated with the delays.
Methods: A cross-sectional study was conducted among 735 consecutive new adult TB cases
registered between January to December 2015 in 10 woredas (districts) of southwestern
Ethiopia. Data were collected through face-to-face interview of patients within the first two
months of treatment initiation. Three forms of delay were assessed; as number of days elapsed
between 1) onset of TB symptoms to first formal healthcare seeking (patient delay), 2) first
consultation to treatment initiation (provider delay) and 3) onset of illness to treatment initiation
(total delay). Days spent beyond median were used to define the delays.
Result: The median (inter-quartile range) of patient, provider and total delays were 25(15-36),
22(9-48) and 55(32-100) days, respectively. More than half (54.6%) of the total delay was
attributed to health system and the rest to patient. Prior self-treatment [adjusted Odds
Ratio(aOR)] : 1.72, 95% confidence interval [CI]:1.07-2.75), HIV co-infection (aOR:1.8, 95%
CI :1.05-3.1) and extra-pulmonary TB (aOR: 1.54,95% CI:1.03-2.29)were independently
associated with increased odds of patient delay. However, initial visits to health posts or private
clinics (aOR: 1.42, 95% CI: 1.01, 2.0) and delayed to seek care (aOR: 1.81, 95% CI: 1.33-2.5)
significantly predicted longer provider delay. Finally, having extra pulmonary TB (aOR: 1.6,
95% CI: 1.07-2.38), prior consultation of traditional healer (aOR: 3.72, 95% CI: 1.01-13.77) and
use of holy water (aOR: 2.73, 95% CI: 1.11, 6.7) independently predicted longer total delay.
Conclusion: TB patients waited too long time to initiate care seeking and treatment reflecting
longer periods of morbidity and disease transmission. The delays are attributed to the patient,
disease and health system related factors. Hence, involving informal providers, improving
diagnostic efficiencies of healthcare facilities, and community awareness can reduce the delays.
Key words: Tuberculosis, healthcare seeking, patient delay, provider delay, total delay, Ethiopia

Introduction
Tuberculosis (TB) has been recognized as a global public health problem since 1993 when an
estimated 7-8 million cases and 1.3-1.6 million deaths occur each year [1] . Since then, different
global strategies have been designed and implemented for the control of TB, including Directly
Observed Treatment Short course (DOTS), “Stop TB” and “End TB” strategies[1-4]. Thus
between 2000 and 2015effective diagnosis and treatment of TB saved an estimated 49 million
lives[5]. Despite such achievement and the fact that nearly all cases can be cured, TB remained
to be among the major global public health problems. Globally, 10.4 million incident cases were
estimated to occur in2015, of which 6.1 million (58.6%) were notified to National TB programs
(NTPs) [5].
Tuberculosis has been recognized as major public health problem in Ethiopia and efforts to
control it has begun since early 1960s . Nonetheless, TB remained among the major public health
problems in the country that account for third cause of hospital admission and second cause of
death[6]. The first national TB prevalence survey in 2011 revealed smear positive pulmonary
TB(PTB) prevalence of 108/100,000, of which 55% were not detected by the routine passive
case finding [7]. In 2015, about 205,463 new cases and 29,000 deaths were estimated to occur in
the country[5].Thus Ethiopia has been among the 22 TB High Burden Countries (HBC) and 27
multiple drug resistant TB (MDR TB) high priority countries. Of the estimated cases in 2015,
125,801 (61%) were notified to NTP and a treatment success of cases registered in the 2014 was
89% [8].
Early case detection and treatment of cases under proper case management conditions have been
a priority in the prevention and control of TB [9].When diagnosis of TB is delayed, patients go
without treatment for long and transmit the disease. Each infectious case can result in as many as
20 to 28 secondary infections [10, 11]. Moreover, delays to diagnosis and treatment of TB result
in more serious illness by the time of diagnosis, increased length of infectiousness and poor
treatment outcomes including mortality and drug resistance [12-16]. On the other hand, delays
represent a time span in which additional costs are incurred [17]. Consequently, analysis of TB
transmission dynamics has emphasized that delays to diagnosis present a major obstacle to TB
control [10].The delay to TB treatment can be categorized into: 1) patient delay as time span
between onset of TB symptoms to first time formal care seeking, 2) provider delay a time
elapsed between first consultation to anti-TB treatment initiation and 3) total delay as time
elapsed between onsets of TB symptoms to anti-TB treatment initiation.
Delays to TB treatment have been studied in different parts of the world and Ethiopia. Thus
reviews of the studies reported median patient delay of 30days and provider delay of 7-28days
[10, 18]. On the other hand, diagnostic delays ranging from a median of 8-191days at different
levels of health care delivery systems [12, 13, 19-22] were reported. Studies from different parts
of Ethiopia also reported longer delays to initiate treatment for TB with median patient delay of
20- 90 days[20, 21, 23] and provider delay of 6-34days [21, 23-25]. Moreover nationwide[7] and
pocket [26] prevalence surveys in Ethiopia respectively reported 55% and about two-thirds of
active TB cases were not detected timely. The long delays are attributed to female gender, older
age, low awareness about TB, repeated visits to health facilities, visiting lower level health care
facilities and traditional healer[27, 28].
The available studies in Ethiopia are limited to smear positive PTB cases [25], focused on cases
presenting to either health centers [24] or hospitals [29] but not both. Thus complete picture of
the patterns of delay at different health care setups is scanty in the country. As a result,
identification of barriers for the different forms of delays to TB treatment have been set as a
national priority research agenda [30]. Shorter treatment regimens could dramatically accelerate
the reductions in TB incidence and mortality that can motivate those suspects to early seek care
and treatment [31]. In Ethiopia, treatment regimen of six months was introduced in 2011 and
studies describing patterns of delay in the era of reduced regimen is very scanty. In particular no
studies have been conducted in southwestern parts of the country. Therefore this study
investigated time delays to initiate care seeking, diagnosis and treatment along with factors
associated with the delays among TB cases on DOTS in districts of southwestern Ethiopia.
Methods
Study setting
The study was conducted in 14 health facilities (3 hospitals and 11 health centers) in three zones
of Southern Nation Nationalities and Peoples Region (SNNPR), one of the nine Regional States
in Ethiopia with an estimated 18million inhabitants [32].The three study Zones, Bench Maji,
Kaffa and Sheka are located at the southwestern border of the country where about 2,064,102
peoples reside[32]. The zones (an administrative unit that liaison weredas with the region) are
organized in to four town administrations and 26 weredas(lowest administrative unit closer to the
community). During the study there were 3 hospitals and 65 health centers providing TB DOTS
services .
Diagnosis and treatment of all forms of TB across the country is based on the adopted national
TB control guidelines [33, 34] that specifies case definitions, diagnostic and treatment standards.
Previously, diagnosis and treatment of TB had been limited to public hospitals and health centers
but in recent years public private mix (PPM) DOTS to private health care facilities and
community DOTS to health posts have been introduced. Currently, diagnosis and treatment of
TB are solely being provided at public and private hospitals, public health centers and higher
level private clinics in an integrated manner. Thus in 2011, 92% of public hospitals and 95% of
health centers, 2100 health posts and 317 PPM –DOTS centers were providing DOTS based
diagnosis and/or treatment of TB cases [35]. .
Study design and sampling
A cross-sectional study among TB cases on DOTS registered from January to December 2015 in
the 14 health facilities was carried out. The sample size required to identify factors associated
with delays to seek care was computed using StatCalc program of EpiInfo using 95%
significance level, 80% power, expected frequency of exposure (illiteracy)among controls
(delayed for less than 30 days) of 38% and odds ratio (OR) 1.7[36]. The calculation provided
486 cases, considering design effect of 1.5 and non-response of 10% a total of 802 new cases
were required. The samples were proportionally allocated to the zones, weredas and health
facilities based on the caseloads reported during the preceding year. Finally, consecutive
consenting cases from the respective health facilities were prospectively enrolled until the
required sample was reached. Those new cases, older than 18 years of age, on intensive phase of
treatment were included in the study and those transferred out and died before the interview were
excluded.
Data collection and analysis
A structured questionnaire adapted from tools used elsewhere [7, 17, 37]was used to gather the
data. Besides, data abstraction checklist was prepared to draw clinical profiles of the patients
from TB register and individual clinical chart. The questionnaire was translated into national
language (Amharic) spoken by almost all residents in the study area. Training manual comprised
of aim and implementation of the study, basics of TB control, TB case definitions, components
of questionnaire and interviewing techniques was prepared. Ten diploma graduate nurse data
collectors and three public health specialist (MPH) supervisors were recruited and trained for
three days. The training included description of questionnaire details, interviewing techniques,
role play and pretest among TB cases on DOTS at nearby health facilities not included in the
study. Modifications on the questionnaire were made to suit local expressions and wordings
those were found during the pretesting. Finally, new cases of TB on intensive phase treatment
(the first two months of treatment) were traced from the unit TB register of the selected facility
and interviewed for their sociodemographic, health care seeking practices and knowledge
towards TB.
Patient delay was assessed by asking the participants to recall/estimate the date or number of
days elapsed between onset of TB constitutional symptoms (cough, fever, night sweats, chest
pain, weight loss, loss of appetite ) until they seek care. Similarly, provider delay was estimated
by asking date or number of days elapsed between first formal health care facility visit to final
diagnosis and treatment initiation with anti-TB treatment. Finally, total delay was computed as a
sum of patient and provider delay or number of days elapsed between onsets of illness to
initiation of anti-TB treatment. The dates were recorded in Ethiopian calendar and later
converted in to corresponding Gregorian calendar to be used by different statistical software.
Knowledge about TB was assessed using eight items with “yes” or “no” questions including
cause of TB(microbe,bacteria,germ),TB is hereditary, TB is contagious, mode of TB
transmission [(breathing, sneezing, coughing, raw milk intake), symptoms of TB,TB is curable,
length of treatment (6 month=yes, otherwise no) and TB treatment modalities as free=yes or for
charge=no. The responses were coded as 0=no and 1=yes). The items internal consistency was
checked (Cronbach's Alpha ( α)=0.75) before computing an index.
Data were checked for consistency and completeness and entered into Epi data, and then
exported to SPSS version 21for cleaning and analysis. Subsequently, the cleaned data were
described using frequency, proportions, mean, median, standard deviation and inter-quartile
range, tables and graphs. In addition, numeric variables were further explored for skeweness,
kurtosis, normality plots (Q-Q plots and/or histograms) or Kolmogorov-Smirnov test to check for
normality. The distribution of number of days elapsed across different time points were not
normal and median days were used as a cutoff point to define delays. Thus patient, provider and
total delays were defined based on median days elapsed between onset of illness to first visit,
first visit to treatment initiation and onset of illness to treatment initiation respectively. For the
assessment of knowledge towards TB, correct responses were summed up and distribution was
explored for normality. The score did not show normality and median was used to dichotomize
good and poor knowledge. Accordingly those scored above median are labeled as having good
knowledge and below median as having poor knowledge.
Comparisons of proportions among categorical variables was made using Chi-squared and
Manwhitney U and Kruskual Walis tests were used to compare medians across different groups
for those variables did not exhibit normality. Finally, bivariate and multiple binary logistic
regression models were fitted to compute crude and adjusted odds ratios that reflect strength of
association and identify independent predictors of delays. Selection of the variables for multiple
regression were made based on p value <=0.25 on crude analysis. The logistic models fitness
was checked using Hosmer and Lemeshow test. In all the statistical tests, statistical significance
was judged at p<0.05.
Ethical issues
The study was ethically approved by Institutional Review Board (IRB) of the College of Health
Sciences at Addis Ababa University. Written informed consent was sought from each study
participant before the interview. Patient clinical profile from records and unit register was
retrieved upon permission from respective health care facilities.
Results
Sociodemographic characteristics of the patients
A total of 735 TB cases from 14 public health facilities (three hospitals and 11 health centers) of
the selected 10 weredas in the three zones (Kaffa, Bench Maji and Sheka) participated in the
study. Accordingly, 469(63.8%) and 266(37.2%) of the cases were registered at health centers
and hospitals, respectively. Of the cases, 221(30.1%), 199(27.1%) and 140(19%) respectively
were from Kafficho, Bench and Amhara ethnic groups. The median age (inter-quartile range
(IQR)) and mean (±standard deviation/SD) of the cases was 27(20-37) and 30.8(12.9) years,
respectively. Among the cases, 52.9% and 29.4% had completed elementary school and involved
in subsistence farming respectively (Table1).
Health care seeking practices
As an onset of illness, 563(76.6%), 345(46.9%) and 300(40.8%) of the cases had respectively
encountered cough, night sweating and fever (Table 2). Thus, 596(81.1%) cases visited
healthcare facility (HCF) as first action to the illness but the rest 139(18.9%) took some informal
care including self-treatment and consulting traditional healer before visiting HCF. Ultimate
decision to visit health facility was made upon referral and/or advice from relatives (38.6%),
Health Extension Worker (HEW) (4.5%) and TB patients on treatment (4.2%). Thus, 35.4% and
32.4% first visited private clinics and public health centers respectively. The first visit to HCFs
among 276(37.6%) were made at HCFs not providing DOTS service. The type of first HCF
visited as DOTS providing or not is statistically significantly associated with source of
advice/referral received (p=0.009) before deciding to visit HCF. Among the cases 210(28.6%),
suspected their illness to be TB.
TB diagnosis of 448(61%) and 99 (13.5%) cases were made at hospital and private clinics
respectively. The diagnosis among 244(33.2%) was made at the first visited HCF and the rest

491(66.8%) of the cases were referred or went by themselves to other facilities. One hundred
twelve (15.2%) cases were diagnosed at their first visit and the rest were diagnosed after an
average (SD) of 3.6(2.4) visits to an average (±SD) of 2.2(1.2) healthcare facilities at which time
the patients had been treated with different medicines. Proportion of cases diagnosed at their first
visit significantly differ across the type of visited HCFs (58/206(28.2%), 44/224(19.6%) and
7/236(4.2%) at hospital, health center and private clinics respectively (p<0.001). Both the
median number of visits and HCFs visited significantly differ across the first visited HCFs
(P<0.001). After diagnosis, 529(72%) of the cases were put on anti-TB treatment immediately
and the rest started treatment after an average of 0.48days (range 0-8 days).
Sputum smear result during commencement of treatment was available for 629(85.6%) cases of
whom 373(50.7% tested positive (Table 3).Thus, diagnosis of 373(50.7%) cases were
bacteriologically confirmed and the rest 362(49.3%) were clinically diagnosed. Generally,
586(79.7%) of the cases had pulmonary TB [373 (63.2%) smear positive and 213(36.8%)] and
the rest, 149 (20.3%) were extra pulmonary (EPTB) cases. All of the cases were offered HIV
screening test of whom 68 (9.3%) tested positive (95% CI (7.2%-11.3%)). The HIV status is
significantly associated with marital status ((x2=15.1,p=0.001) and educational status
(x2=10.6,p=0.01). Of those TB/HIV co infected cases, 27(39.7%) and 32(47.1%) were
respectively receiving antiretroviral therapy (ART) and Cotrimoxazole prophylactic therapy
(CPT).The types of TB cases as bacteriologically or clinically diagnosed is significantly
associated with where the diagnosis of TB was made (x2=20.7,p<0.001). However, there were no
statistically significant difference across HIV status (x2=1.2, p=0.3), age groups (x
2=3.2,p=0.2)
and gender (x2=1.5,p=0.2).The mean (SD) weight of the cases at the commencement of anti-TB
treatment was 48.8(8.3) kg.
Knowledge towards tuberculosis
Almost all 721(98.1%) of the cases mentioned the illness they were being treated as TB. But
only 539(73.3%) had ever heard about TB before they were diagnosed as TB case. Among those
ever heard about TB, 253(48.3%), 200(38.1%), 191(36.4%) and 190(35.3%) had heard from
mass media, health facilities, TB patients and relatives respectively. The aggregated knowledge
score about TB revealed, 545(74.1%) had scored above a median of 4.5 out of the eight items
and labeled as having good knowledge.
Delays to seek care and treatment
Patient delay
The median (IQR) days elapsed between onset of illness to first health facility visit (patient
delay) was 25 (15-36) and median (95% CI) 25(21, 28). Nearly a third, 240(32.6%) of the cases
made first consultation within 15 days of the onset of illness. Of the cases, 317(43.1%) perceived
their first visit was delayed for which 256(80.8%) and 109(26.1%) reasoned expecting the illness
to limit by itself and lack of money respectively. The median patient delay is significantly
different with type of TB (P=0.03), educational status (p=0.04), marital status (p=0.01) and
knowledge towards TB (p=0.002). But, the median patient delay is not significantly different
with HIV status, gender, residence and occupation (Table 3).
In a multiple logistic regression, those extra pulmonary TB AOR (95%CI) 1.54(1.03,2.29), HIV
positives AOR(95%CI) 1.80(1.05,3.1) , took self treatment before HCF visit AOR(95% CI)
1.72(1.07,2.75), first visited other than health post, traveled more than an hour to nearby HCF
AOR(95% CI) 1.37(1.01,1.88) and good knowledge about TB AOR(95% CI) 0.67 (0.46,0.95)
cases were independently associated with patient delay beyond the median (Table 4 ). Those
cases travelled more than an hour to reach the first visited HCF are 37% more likely to delay
care seeking compared to their counter parts. Extra pulmonary TB cases are 54% more likely to
delay seeking care compared to smear positive pulmonary cases. TB cases co infected with HIV
are 80% more likely to delay care seeking than HIV negative TB cases.
Provider delay
After the first visit, diagnosis of TB spent a median (IQR) 22(8-48) and median (95% CI) 22(19,
24) days at the HCFs. Following the diagnosis of TB, 613(83.4%) of the cases were put on anti-
TB treatment immediately and the rest delayed for a median (range) 2(1-7) days until treatment
initiation. In general, median (IQR) days elapsed between first HCF visit to initiation of anti-TB
treatment (provider delay) was 22(9-48) days. Provider delay is significantly correlated with
patient delay (r=0.2, P<0.001). The median provider delay is significantly different with type of
TB (p=0.02), type of first visited HCF (p<0.001) and HCF where final diagnosis was made
(p=0.01)(Table 3). However the median provider delay is not significantly different with HIV
status, first action taken to the illness and knowledge towards TB. In multiple logistic regression
analysis, first visiting non DOTS HCF AOR (95% CI) 1.42(1.01, 2.0), visited more than one
HCF AOR (95% CI) 2.34(1.69, 3.24) and sought care after 25days from onset of illness AOR
(95% CI) 1.81(1.33, 2.5) independently predicted provider delays exceeding 22 days(Table 5).
Those cases first visited non DOTS center are 42% more likely to have delayed diagnosis
compared to those visited DOTS providing facilities. Cases who delayed beyond 25days are 81%
more likely to have provider delay beyond the median of 22days.
Total delay
The median (IQR) days undergone since onset of illness to TB treatment initiation (total delay)
was 55(32-100) with median (95% CI) 55(49, 60) days. More than half (54.6%) of the total delay
was attributed to provider (health system) and the rest to patient. Of the cases, 162(22%) were
put on anti-TB treatment within 30days of the onset of illness. The median total delay is
significantly different with type of TB (p<0.001), first action taken to illness (p=0.001) and first
visited HCF (p=0.04)(Table 3).On the other hand, those extra pulmonary AOR (95% CI)
1.60(1.07, 2.38), consult traditional healer AOR (96%CI) 3.72(1.01, 13.77) or went to holy water
AOR (95% CI) 2.73(1.11, 6.7) before visiting HCF and visited non DOTS center AOR (95% CI)
1.63(1.19, 2.24) independently predicted total delay beyond the median (55 days)(Table 6).
Discussion
Prompt detection and treatment of TB cases has been a priority in the prevention and control of
the disease. This would be attained upon timely seeking care by patients and reaching at
diagnosis within a reasonable time by the health system. We assessed the delay and associated
factors with the diagnosis and treatment of TB in rural districts of southwestern Ethiopia. Thus
this study revealed long delays to seek care, diagnosis and treatment initiation among cases on
treatment. Patients in the study area had waited for a median of 25 days and 55 days respectively
until seeking care and initiation of anti-TB treatment since the onset of illness. Both patients and
health system delays contribute nearly equally to the total delay which is consistent with other
studies from Ethiopia [24] and elsewhere [18].The longer time elapsed since onset of illness to
treatment initiation implies increased risk of morbidity and mortality among the cases and
diseases transmission in the community [11, 15, 38, 39].All forms of the delays are affected by
patient, disease and health system related factors. This implies the delays are multifaceted that
calls for intensified TB case finding through health promotion activities and expansion of DOTS.
Patients had waited for a median of 25 days until seeking help at formal health care providers
which is consistent with 30 days in northern part of Ethiopia [21, 36, 40], 28 days in Uganda
[18]and 30 days in Angola [10].The relatively lower delay could be due to better access to HCF
where nearly 80% of the cases traveled less than an hour to reach the first HCF. However, only
less than a third (32%) of the cases had made visits to formal health care within 15 days of
recommended timeline for TB suspects to visit HCF [33].Besides, more than half (57%) of the
cases did not perceive their care seeking was delayed which implies the symptoms are taken as
common and less severe to urge consultation of health care provider.
Before visits to formal health care facility, patients had taken variety of actions those influence
timing of care seeking. Consistent with other studies, patients who took self-treatment before the
formal care seeking were more likely to delay seeking care at the formal care units compared to
those first consulted health care providers[41, 42]. This could be due to use of some home
remedies or over the counter antibiotics or analgesics those might lessen the manifestation of the
illness for the time being [43]. Moreover, those patients first visited traditional healer and holy
water are more likely to have higher total delay. This could be due to the beliefs attached to the
traditional care and holy water those might inhibit timely presentation and diagnosis [28].
Patients co infected with HIV are more likely to delay care seeking compared to those non-
infected. This could be due to the alteration of classical clinical manifestations and signs of TB
among HIV co infected patients [44]. On the other hand, patients suspected or tested HIV
positive delay to present themselves to HCF due to fear of stigma attached to the co-occurrence
of TB and HIV[14, 45, 46]. As a result the high mortality among HIV co infected TB patients is
partly explained by the delays to TB treatment [10, 47]. Those extra pulmonary cases patients are
more likely to delay seeking care compared to the pulmonary cases. A similar finding was also
reported form a study in northwest Ethiopia [29]. This could be due to the fact that extra
pulmonary cases manifest with less severe and non-specific symptoms that urge patients to
perceive the illness to be non-serious[48].
Patient’s perception and knowledge towards the TB disease and control activities do have impact
on the care seeking practices. The study revealed that patients with good knowledge towards the
TB disease and program are less likely to delay seeking care. Similarly, other studies have
reported lack of knowledge and mistrust of the TB program as a reason for delayed care seeking
[27, 49, 50]. In contrast, awareness and belief about TB’s curability is associated with longer
patients delay [12, 18]. These imply need for awareness creation towards the TB illness and its
control program to clear the paradox between the belief and longer delay.
The first consultation at HCF was made primarily (69.9%) at lower level public health care units
(health posts and health centers) and private clinics. This is consistent with a study in
Mediterranean countries that reported two thirds of patients first visited private sectors [50].
Nonetheless, diagnosis of TB was made primarily at hospital (61%) despite only few had made
first visit to the hospitals. As a result, majority of the cases had made more than one visit to
different HCFs until diagnosis. Similarly, studies from Uganda [18] and China [51]reported
significant number of patients had visited more than one HCF until diagnosis. Subsequent to the
missed opportunities during the repeated visits, diagnosis of TB had been made after a median of
22 days from the first visit to HCF. This is consistent with 21 days in a study from Amhara
Region in Ethiopia [21] but higher than 6 in Addis Ababa [24] and 9 days in Tigray, northern
Ethiopia [23]. The discrepancies could be due to the differences in accessibility to well equipped
HCFs and skilled providers usually situated in cities like Addis Ababa. The longer provider
delays due to the repeated visits portray high level of missed opportunities of early diagnosis that
could have increased infectious period of the cases and costs incurred by the patients and
households.
Longer provider delays had been reported among patients who first visited HCFs not providing
DOTS services including health posts and private clinics. This is consistent with a study from
Uzbekistan[42] and India [48].The higher provider delay at lower care units and private clinic
could be due to lack of supplies, guidelines and skilled providers that enhance adherence to the
national TB control program. In the current study, diagnosis of TB was mainly made at hospitals
despite many patients had made first visits at the lower public and private clinics. This depict
patients are being provided with unnecessary drugs and treatments at series of HCFs incurring
extra cost. Besides the cost incurred, medications at the repeated visits themselves lead to delays
to diagnosis and serious outcomes including drug resistance [52].On the other hand, the lower
health care units and private clinics might lack proper logistics and skilled providers to timely
diagnose the cases. Hence expansions of the DOTS package to the lower and private clinic is
required to curb the prevailing long delays.
We found that patients delayed to seek care are also more likely to have delayed diagnosis and
treatment after they initiated care seeking. In contrast a study in Georgia [53] reported those
patients with increased patient delay are less likely to have prolonged diagnostic delay. The
discrepancy could be due to differences in measurement of the two delays. The higher odds of
provider delay among those delayed to seek care can be explained by patients use of different
forms of self-treatment and homemade remedies those might alter the manifestations of the TB
illness that pose difficulties in timely diagnosis [43, 53]. Those patients delayed to seek care
might have been ill for such long duration at which time productivity is compromised. Hence the
patients might be unable to cope with the costs required to have timely diagnosis even after
initiating the care seeking. In addition, the long ill days are also associated with more severe
disease at presentation [15] which hinders timely diagnosis[25].
Our study has several limitations. First the study was carried out on those cases ultimately sought
care and on treatment at the time of the study. Thus measurement of delays relied on patient self-
report which is liable to recall bias. We minimized this bias through interviewing patients soon
after diagnosis and helping them to recall using local events. Second, the assessment of patients’
knowledge towards the TB diseases and its control program might be influenced by the
information provided during treatment initiation. So this could have brought egg and chicken
dilemma as the knowledge or care seeking preceded one to other. Third, we studied only new
and adult cases so that the findings cannot be generalized to all forms of TB cases among all age
groups. Lastly our study lacked qualitative assessment of patients and health system those would
have supplemented the quantitative data. On the other hand, consecutive enrollment of cases that
minimized selection bias and triangulation of data sources from patient interview and chart
reviews could be mentioned as strength of the study. Finally, our study is valid and genralizable
to new adult cases in similar settings.
Conclusions
The study revealed that TB patients on DOTS in the study area have passed too long journey to
initiate anti TB treatment. Thus majority of the patients waited too long time to initiate care
seeking, diagnosis and commence the treatment. The patient and provider delays are positively
correlated and contributed nearly equally to the total delay. On the other hand, the elapsed too
long time until treatment initiation was accompanied by repeated visits to both formal and
informal care units where costs were incurred. This portrays high level of missed opportunities
of early diagnosis at different levels that would have reduced severity of illness among the cases,
transmission to the community and household impoverishment. The study further revealed the
patient, provider and total delays are attributed to the patient, disease and health system related
factors reflecting need for intervention at all levels. Therefore, intensified TB case finding as
early as possible involving the community, formal and informal providers is required to avert the
prevailing long journeys to initiate TB treatment. To this end, engagement of informal providers,
strengthening health care facilities capacity and community level awareness creation about the
disease and its control strategies may reduce the delays.
Declarations
Ethics statement
The study was ethically approved by Institutional Review Board (IRB) of the College of Health
Sciences at Addis Ababa University (protocol number: 045/14/sph). Written informed consent
was sought from each study participant before the interview. Patient clinical profile from records
and unit register was retrieved upon permission from respective health care facilities.

Source of funding
Financial and material support was obtained from Addis Ababa and Mizan Tepi Universities
based in Ethiopia.
Competing interest
We declare that we do not have any competing interests.
Author’s contributions
AA conceived and designed the study, collected and analyzed data, prepared manuscript:
WD and DJ critically reviewed for intellectual content of the study protocol and manuscript as
primary and co-supervisors respectively. All authors approved the final version of the
manuscript.
Availability of data and materials
The data from which the paper was built will be available from corresponding author upon
request.
Abbreviations
ART Antiretroviral Therapy
CI Confidence Interval
CPT Cotrimoxazole Prophylactic Therapy
DOTS Directly Observed Treatment Short course
EPTB Extra pulmonary Tuberculosis
HBC High Burden Countries
HCF Healthcare Facility
HIV Human Immunodeficiency Virus
IQR Inter-quartile Range
OR Odds Ratio
PTB Pulmonary Tuberculosis
TB Tuberculosis
WHO World Health Organization
Acknowledgements
We are indebted to Addis Ababa and MizanTepi Universities for financial and material supports
for the study. We are also grateful to the staffs of study districts and health facilities for their all
rounded supports during the data collection.

References
1. World Health Organization: TB Aglobal emergency. In. Edited by Klaudt K. USA:
WHO; 1994.
2. World Health Organization: Interim policy on collaborative TB/HIV activities In.
Geneva: World Health Organization; 2002.
3. World Health Organization: THE STOP TB STRATEGY: Building on and
enhancing DOTS to meet the TB-related Millennium Development Goals. In.:
World Health Organization; 2006.
4. World Health Organization: The End TB strategy: Global strategy and targets for
tuberculosis prevention, care and control after 2015. In. Edited by WHO; 2015.
5. WHO: Global Tuberculosis report. In. Switzerland: World Health Organization;
2016.
6. Federal Minstry of Health of Ethiopia: Tuberculosis, Leprosy and TB/HIV
Prevention and Control Programme Manual. In., 4th edn. Addis Ababa: Ministry of
Health of Ethiopia 2008.
7. Federal Minstry of Health of Ethiopia: First Ethiopian National Population Based
Tuberculosis Prevalence Survey In. Addis Ababa: Federal Ministry of Health
Ethiopia; 2011.
8. Federal Republic of Ethiopia Ministry of Health: Annual performance report. In.
Addis Ababa: Federal Repubilic of Ethiopia Minstry of Health; 2016.
9. World Health Organization: The global plan to stop TB 2011–2015. In.: World
Health Organization; 2010.
10. Lusignani LS, Quaglio G, Atzori A, Nsuka J, Grainger R, Da Conceiçao Palma M,
Putoto G, Manenti F: Factors associated with patient and health care system delay
in diagnosis for tuberculosis in the province of Luanda, Angola. BMC Infect Dis
2013, 13(1).
11. Cheng S, Chen W, Yang Y, Chu P, Liu X, Zhao M, Tan W, Xu L, Wu Q, Guan H et
al: Effect of Diagnostic and Treatment Delay on the Risk of Tuberculosis
Transmission in Shenzhen, China: An Observational Cohort Study, 1993-2010.
PLoS One 2013, 8(6):e67516.
12. Ford M. Carolyn, Bayer M.Angela, Gilman H. Robert, Onifade Dami, Acosta Colleen, Cabrera Lilia, Vidal
Carlos, Evans A. Carlton: Factors Associated with Delayed Tuberculosis Test-seeking
Behavior in the Peruvian Amazon. Am J Trop Med Hyg 2009, 81(6):1097-1102.
13. Lusignani S. Luigi, Quaglio Gianluca , Atzori Andrea , Nsuka Joseph , Grainger
Ross, Palma Maria Da Conceiçao, Giovanni Putoto, Manenti Fabio: Factors
associated with patient and health care system delay in diagnosis for tuberculosis in
the province of Luanda, Angola. BMC Infect Dis 2013, 13(168).
14. Finnie RK, Khoza LB, van den Borne B, Mabunda T, Abotchie P, Mullen PD:
Factors associated with patient and health care system delay in diagnosis and
treatment for TB in sub-Saharan African countries with high burdens of TB and
HIV. Tropical medicine & international health : TM & IH 2011, 16(4):394-411.
15. Virenfeldt J, Rudolf F, Camara C, Furtado A, Gomes V, Aaby P, Petersen E, Wejse
C: Treatment delay affects clinical severity of tuberculosis: a longitudinal cohort
study. BMJ Open 2014, 4(6):e004818.
16. Jianzhao H, van den Hof S, Lin X, Yubang Q, Jinglong H, van der Werf MJ: Risk
factors for non-cure among new sputum smear positive tuberculosis patients treated
in tuberculosis dispensaries in Yunnan, China. BMC Health Serv Res 2011, 11:97.
17. KNCV, WHO, JATA: The Tool to Estimate Patients’Costs In.: KNCV Tuberculosis
Foundation,World Health Organization,Japan Anti-Tuberculosis Association; 2008.
18. Sendagire I, Schim Van der Loeff M, Mubiru M K-LJ, Cobelens F: Long Delays
and Missed Opportunities in Diagnosing Smear-Positive Pulmonary Tuberculosis in
Kampala, Uganda: A Cross-Sectional Study. PLoS One 2010, 5(12).
19. Sreeramareddy T.Chandrashekhar, Panduru V.Kishore, Menten Joris, Van den
Ende J.: Time delays in diagnosis of pulmonary tuberculosis: a systematic review of
literature. BMC Infect Dis 2009, 9(91).
20. Mesfin M.Mengiste, Newel N. James, Walley D.John, Gessessew Amanuel, Madeley
J.Richard: Delayed consultation among pulmonary tuberculosis patients: a cross
sectional study of 10 DOTS districts of Ethiopia. BMC Public Health 2009, 9(53).
21. Yimer Solomon, Bjune Gunnar, Alene Getu: Diagnostic and treatment delay among
pulmonary tuberculosis patients in Ethiopia: a cross sectional study. BMC Infect Dis
2005, 5(112).
22. Lorent N, Mugwaneza P, Mugabekazi J, Gasana M, Van Bastelaere S, Clerinx J,
Van den Ende J: Risk factors for delay in the diagnosis and treatment of
tuberculosis at a referral hospital in Rwanda. Int J Tuberc Lung Dis 2008, 12(4):392-
396.
23. Mesfin M.Mengiste, Tasew W.Tesfay, Tareke G.Israel, Kifle T.Yohannes, Karen
H.Witten, Richard J.Madeley: Delays and care seeking behavior among tuberculosis
patients in Tigray of northern Ethiopia. EthiopJHealth Dev 2005, 19:7-12.
24. Demissie M, Lindtjorn B, Berhane Y: Patient and health service delay in the
diagnosis of pulmonary tuberculosis in Ethiopia. BMC Public Health 2002, 2:23.
25. Hussen A, Biadgilign S, Tessema F, Mohammed S, Deribe K, Deribew A: Treatment
delay among pulmonary tuberculosis patients in pastoralist communities in Bale
Zone, Southeast Ethiopia. BMC Res Notes 2012, 5:320.
26. Tadesse Takele, Demissie Meaza, Berhane Yemane, Kebede Yigzaw, Abebe
Markos: Long distance travelling and financial burdens discourage tuberculosis
DOTs treatment initiation and compliance in Ethiopia: a qualitative study. BMC
Public Health 2013, 13(424).
27. Storla G.Dag, Yimer Solomon, A.Gunnar B: A systematic review of delay in the
diagnosis and treatment of tuberculosis. BMC Public Health 2008, 8(15).
28. Li Y, Ehiri J, Tang S, Li D, Bian Y, Lin H, Marshall C, Cao J: Factors associated
with patient, and diagnostic delays in Chinese TB patients: a systematic review and
meta-analysis. BMC Med 2013, 11:156.
29. Yimer SA, Bjune GA, Holm-Hansen C: Time to first consultation, diagnosis and
treatment of TB among patients attending a referral hospital in Northwest,
Ethiopia. BMC Infect Dis 2014, 14:19.
30. Tuberculosis Research Advisory committee: Roadmap for Tuberculosis Operational
Research in Ethiopia. In. Edited by (TRAC/FMOH) TRAC. Addis Ababa: FMOH;
2013.
31. Salomon JA, Lloyd-Smith JO, Getz WM, Resch S, Sanchez MS, Porco TC,
Borgdorff MW: Prospects for advancing tuberculosis control efforts through novel
therapies. PLoS Med 2006, 3(8):e273.
32. Federal Democratic Republic of Ethiopia Central Statistical Agency: Population
Projection of Ethiopia for All Regions At Wereda Level from 2014 – 2017. In. Addis
Ababa: Central Statistical Authority; 2013.
33. Federal Minstry of Health of Ethiopia: Guidelines for clinical and programmatic
management of TB, Leprosy and TB/HIV in Ethiopia In., 5th edn. Addis Ababa:
Ethiopian Federal Minstry of Health; 2012.
34. World Health Organization: Treatment of tuberculosis: guidelines. In. Geneva:
World Health Organization; 2010.
35. Federal Minstry of Health of Ethiopia: Annual performance report. In: Health
sector development programme iv. Addis Ababa: Federal Minstry of Health; 2011.
36. Mesfin MM, Newell JN, Walley JD, Gessessew A, Madeley RJ: Delayed consultation
among pulmonary tuberculosis patients: a cross sectional study of 10 DOTS districts
of Ethiopia. BMC Public Health 2009, 9:53.
37. Soliman S.Sahar NM, Nassir A. H, Agboatwala M., Abdilai A.I., Maamary F.,Al-
Absi N., : Diagnostic and treatment delay in tuberculosis:An in-depth analysis of the
health-seeking behaviour of patients and health system response in seven countries
of the Eastern Mediterranean Region. In.; 2006.
38. Tsai T-C, Hung MS, Chen IC, Chew G, Lee W-H: Delayed diagnosis of active
pulmonary tuberculosis in emergency department. The American journal of
emergency medicine 2008, 26(8):888-892.
39. Lee CH, Lee MC, Lin HH, Shu CC, Wang JY, Lee LN, Chao KM: Pulmonary
tuberculosis and delay in anti-tuberculous treatment are important risk factors for
chronic obstructive pulmonary disease. PLoS One 2012, 7(5):e37978.
40. Belay M, Bjune G, Ameni G, Abebe F: Diagnostic and treatment delay among
Tuberculosis patients in Afar Region, Ethiopia: a cross-sectional study. BMC Public
Health 2012, 12:369.
41. Takarinda KC, Harries AD, Nyathi B, Ngwenya M, Mutasa-Apollo T, Sandy C:
Tuberculosis treatment delays and associated factors within the Zimbabwe national
tuberculosis programme. BMC Public Health 2015, 15:29.
42. Belkina TV, Khojiev DS, Tillyashaykhov MN, Tigay ZN, Kudenov MU, Tebbens
JD, Vlcek J: Delay in the diagnosis and treatment of pulmonary tuberculosis in
Uzbekistan: a cross-sectional study. BMC Infect Dis 2014, 14:624.
43. Chikovore J, Hart G, Kumwenda M, Chipungu GA, Corbett L: 'For a mere cough,
men must just chew Conjex, gain strength, and continue working': the provider
construction and tuberculosis care-seeking implications in Blantyre, Malawi. Global
health action 2015, 8:26292.
44. Rugina S, Dumitru IM, Resul G, Cernat RC, Petcu AE: Disseminated tuberculosis
in HIV-infected patients from the Regional HIV/AIDS Center Constanta, Romania.
Germs 2014, 4(1):16-21.
45. Daftary A, Padayatchi N: Social constraints to TB/HIV healthcare: accounts from
coinfected patients in South Africa. AIDS care 2012, 24(12):1480-1486.
46. Mavhu W, Dauya E, Bandason T, Munyati S, Cowan FM, Hart G, Corbett EL,
Chikovore J: Chronic cough and its association with TB-HIV co-infection: factors
affecting help-seeking behaviour in Harare, Zimbabwe. Tropical medicine &
international health : TM & IH 2010, 15(5):574-579.
47. Kiwuwa S. Mpungu, Charles Karamagi, Harriet K.Mayanja: Patient and health
service delay in pulmonary tuberculosis patients attending a referral hospital: a
cross-sectional study. BMC Public Health 2005, 5(122).
48. Grover M, Bhagat N, Sharma N, Dhuria M: Treatment pathways of
extrapulmonary patients diagnosed at a tertiary care hospital in Delhi, India. Lung
India : official organ of Indian Chest Society 2014, 31(1):16-22.
49. Long Q, Li Y, Wang Y, Yue Y, Tang C, Tang S, Squire SB, Tolhurst R: Barriers to
accessing TB diagnosis for rural-to-urban migrants with chronic cough in
Chongqing, China: a mixed methods study. BMC Health Serv Res 2008, 8:202.
50. Bassili Amal, Seita Akihiro, Baghdadi Samiha, AlAbsi Amin, Abdilai Ismail,
Agboatwalla Mubina, Maamari Fadia, Mahshid N, Nasir Hashim, Soliman Sahar et
al: Diagnostic and Treatment Delay in Tuberculosis in 7 Countries of the Eastern
Mediterranean Region. Infect Dis Clin Pract 2008, 16:23-35.
51. Yan F, Thomson R, Tang S, Squire SB, Wang W, Liu X, Gong Y, Zhao F, Tolhurst
R: Multiple perspectives on diagnosis delay for tuberculosis from key stakeholders
in poor rural China: case study in four provinces. Health policy (Amsterdam,
Netherlands) 2007, 82(2):186-199.
52. Chen Tc Fau - Lu P-L, Lu Pl Fau - Lin C-Y, Lin Cy Fau - Lin W-R, Lin Wr Fau -
Chen Y-H, Chen YH: Fluoroquinolones are associated with delayed treatment and
resistance in tuberculosis: a systematic review and meta-analysis. Int J Infect Dis
2011(1878-3511 (Electronic)).
53. Rabin AS, Kuchukhidze G, Sanikidze E, Kempker RR, Blumberg HM: Prescribed
and self-medication use increase delays in diagnosis of tuberculosis in the country of
Georgia. Int J Tuberc Lung Dis 2013, 17(2):214-220.
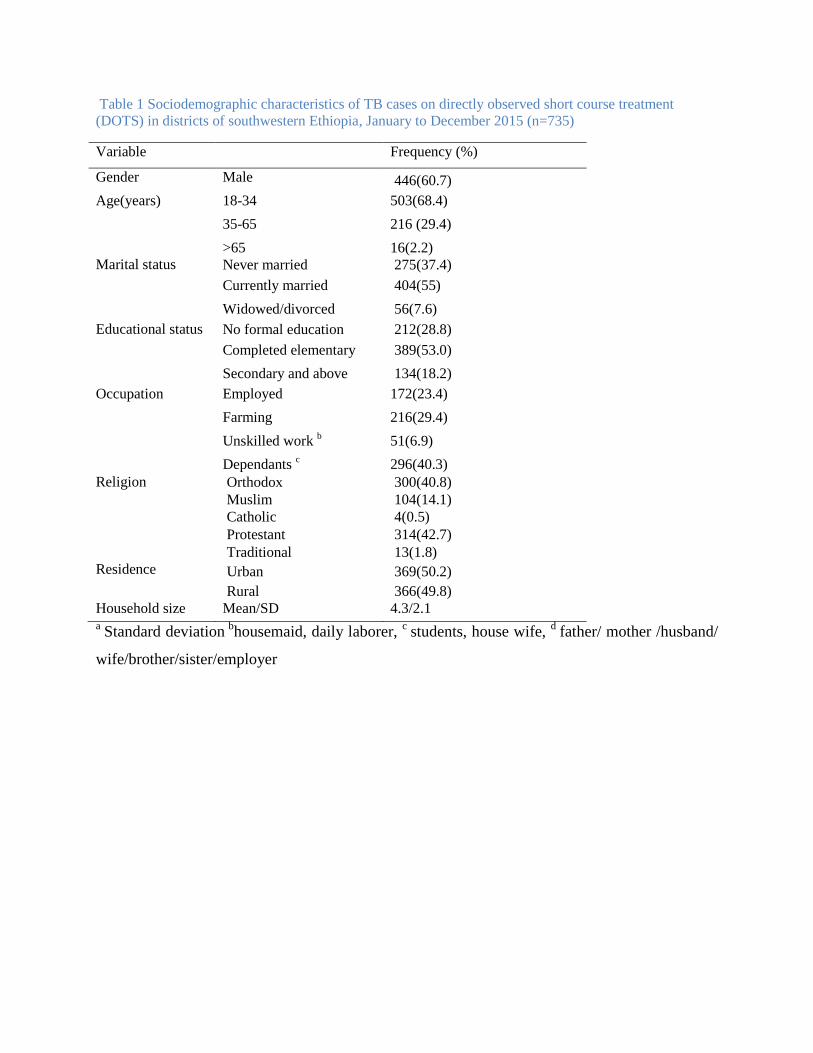
Table 1 Sociodemographic characteristics of TB cases on directly observed short course treatment
(DOTS) in districts of southwestern Ethiopia, January to December 2015 (n=735)
Variable Frequency (%)
Gender Male 446(60.7)
Age(years) 18-34 503(68.4)
35-65 216 (29.4)
>65 16(2.2)
Marital status Never married 275(37.4)
Currently married 404(55)
Widowed/divorced 56(7.6)
Educational status No formal education 212(28.8)
Completed elementary 389(53.0)
Secondary and above 134(18.2)
Occupation Employed 172(23.4)
Farming 216(29.4)
Unskilled work b 51(6.9)
Dependants c 296(40.3)
Religion Orthodox 300(40.8)
Muslim 104(14.1)
Catholic 4(0.5)
Protestant 314(42.7)
Traditional 13(1.8)
Residence Urban 369(50.2)
Rural 366(49.8)
Household size Mean/SD 4.3/2.1 a
Standard deviation b
housemaid, daily laborer, c
students, house wife, d
father/ mother /husband/
wife/brother/sister/employer

Table 2: Health care seeking practices among new TB cases on directly observed short course therapy (DOTS), Southwestern Ethiopia, January to December 2015 (n=735)
Variable Frequency (%)
Initial symptoms encountered Cough 563(76.6)
Night sweat 345(46.9)
Fever 300(40.8)
Loss of appetite 279(38)
Chest pain 267(36.3)
Weight loss 236(32.1)
Haemoptysis 144(19.6)
Othersa 62(8.4)
First action to illness Visit HCF 596(81.1)
Self-treatment 98(13.3)
Visit holy water 26(3.5)
Consult traditional healer 15(2.0)
Perceived reason for not visiting
HCF first (n=149)
Thought illness limit by itself 97(65.1)
Perceived long waiting time at HCF 37(24.8)
Perceived expensive service fee 37(24.8)
HCF too far 29(19.5)
Other b 22(14.8)
First HCF visited Private clinic 260(35.4)
Health center 238(32.4)
Hospital 221(30.1)
Health post 16(2.2)
Source of advice/referral to visit
first HCF
Self 472(64.2)
Parent/relative 280(38.1)
HEW c 32(4.4)
TB patient 30(4.1)
HIV care clinic 16(2.2)
Otherd 31(4.2)
Travel time to first HCF visited <=1hour 582(79.2)
>1hour 153(20.8)
Place TB diagnosis made Hospital 448(61.0)
Health center 188(25.6)
Private clinic 99(13.5) a neck swelling, head ache, joint pain, back pain, wound ,
bHCF closed, mistrust health care provider, bad previous
experience at HCF, fear of HIV test and fear of TB diagnosis, cHEW= Health Extension worker(trained females
those provide household package of health care to household), ddrug shop(13),holy water(14),traditional healer(4)
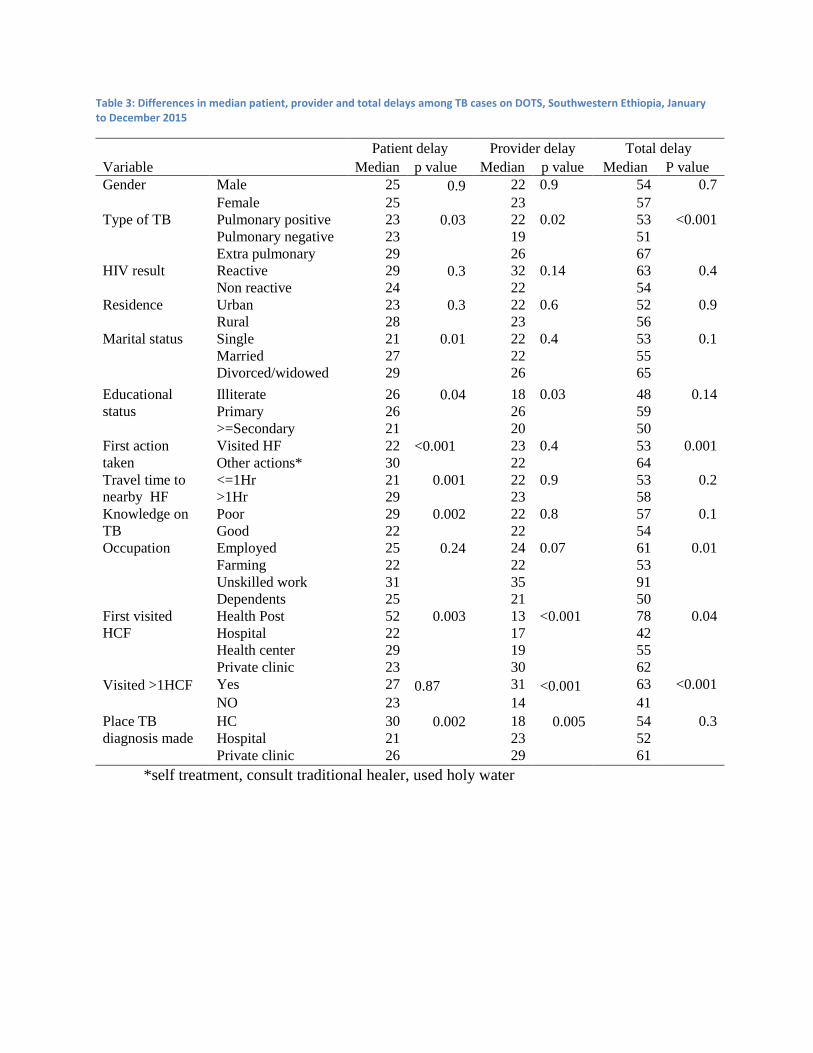
Table 3: Differences in median patient, provider and total delays among TB cases on DOTS, Southwestern Ethiopia, January to December 2015
Variable
Patient delay Provider delay Total delay
Median p value Median p value Median P value
Gender Male 25 0.9 22 0.9 54 0.7
Female 25 23 57
Type of TB Pulmonary positive 23 0.03 22 0.02 53 <0.001
Pulmonary negative 23 19 51
Extra pulmonary 29 26 67
HIV result Reactive 29 0.3 32 0.14 63 0.4
Non reactive 24 22 54
Residence Urban 23 0.3 22 0.6 52 0.9
Rural 28 23 56
Marital status Single 21 0.01 22 0.4 53 0.1
Married 27 22 55
Divorced/widowed 29 26 65
Educational
status
Illiterate 26 0.04 18 0.03 48 0.14
Primary 26 26 59
>=Secondary 21 20 50
First action
taken
Visited HF 22 <0.001 23 0.4 53 0.001
Other actions* 30 22 64
Travel time to
nearby HF
<=1Hr 21 0.001 22 0.9 53 0.2
>1Hr 29 23 58
Knowledge on
TB
Poor 29 0.002 22 0.8 57 0.1
Good 22 22 54
Occupation Employed 25 0.24 24 0.07 61 0.01
Farming 22 22 53
Unskilled work 31 35 91
Dependents 25 21 50
First visited
HCF
Health Post 52 0.003 13 <0.001 78 0.04
Hospital 22 17 42
Health center 29 19 55
Private clinic 23 30 62
Visited >1HCF Yes 27 0.87 31 <0.001 63 <0.001
NO 23
14
41
Place TB
diagnosis made
HC 30 0.002 18 0.005 54 0.3
Hospital 21 23 52
Private clinic 26 29 61
*self treatment, consult traditional healer, used holy water
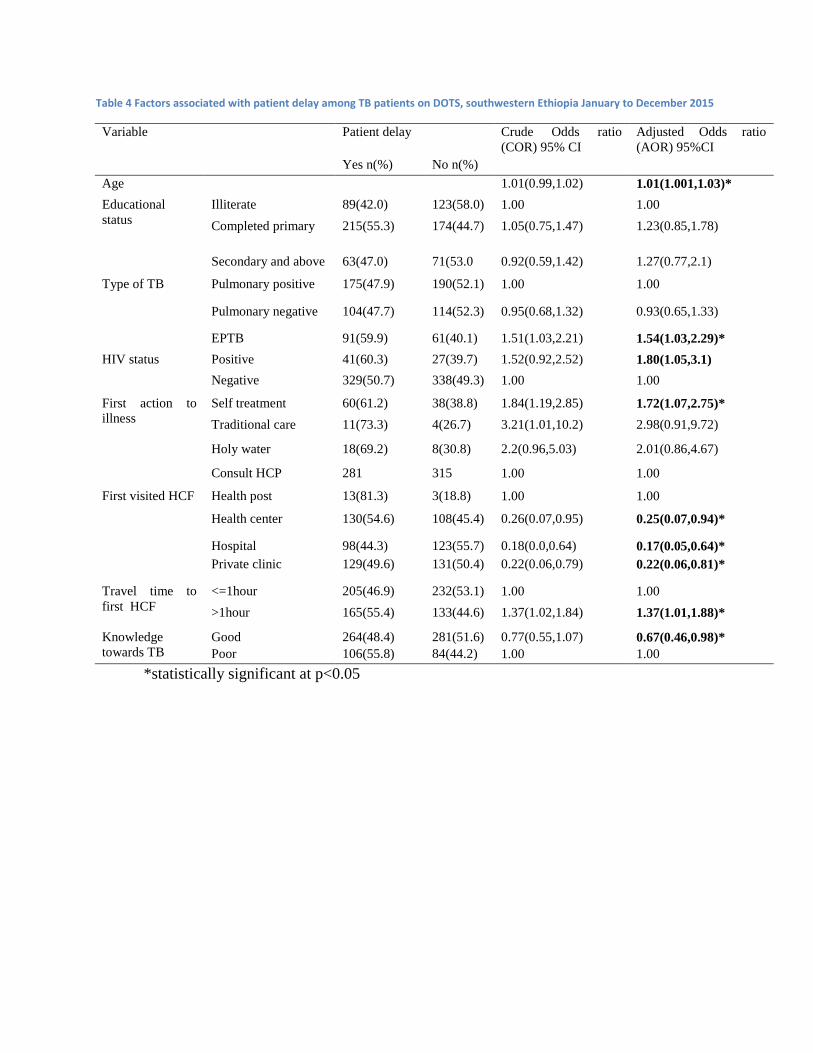
Table 4 Factors associated with patient delay among TB patients on DOTS, southwestern Ethiopia January to December 2015
Variable
Patient delay
Crude Odds ratio
(COR) 95% CI
Adjusted Odds ratio
(AOR) 95%CI
Yes n(%) No n(%)
Age 1.01(0.99,1.02) 1.01(1.001,1.03)*
Educational
status
Illiterate 89(42.0) 123(58.0) 1.00 1.00
Completed primary 215(55.3) 174(44.7) 1.05(0.75,1.47) 1.23(0.85,1.78)
Secondary and above 63(47.0) 71(53.0 0.92(0.59,1.42) 1.27(0.77,2.1)
Type of TB Pulmonary positive 175(47.9) 190(52.1) 1.00 1.00
Pulmonary negative 104(47.7) 114(52.3) 0.95(0.68,1.32) 0.93(0.65,1.33)
EPTB 91(59.9) 61(40.1) 1.51(1.03,2.21) 1.54(1.03,2.29)*
HIV status
Positive 41(60.3) 27(39.7) 1.52(0.92,2.52) 1.80(1.05,3.1)
Negative 329(50.7) 338(49.3) 1.00 1.00
First action to
illness
Self treatment 60(61.2) 38(38.8) 1.84(1.19,2.85) 1.72(1.07,2.75)*
Traditional care 11(73.3) 4(26.7) 3.21(1.01,10.2) 2.98(0.91,9.72)
Holy water 18(69.2) 8(30.8) 2.2(0.96,5.03) 2.01(0.86,4.67)
Consult HCP 281 315 1.00 1.00
First visited HCF
Health post 13(81.3) 3(18.8) 1.00 1.00
Health center 130(54.6) 108(45.4) 0.26(0.07,0.95) 0.25(0.07,0.94)*
Hospital 98(44.3) 123(55.7) 0.18(0.0,0.64) 0.17(0.05,0.64)*
Private clinic 129(49.6) 131(50.4) 0.22(0.06,0.79) 0.22(0.06,0.81)*
Travel time to
first HCF
<=1hour 205(46.9) 232(53.1) 1.00 1.00
>1hour 165(55.4) 133(44.6) 1.37(1.02,1.84) 1.37(1.01,1.88)*
Knowledge
towards TB
Good 264(48.4) 281(51.6) 0.77(0.55,1.07) 0.67(0.46,0.98)*
Poor 106(55.8) 84(44.2) 1.00 1.00
*statistically significant at p<0.05

Table 5 Factors associated with provider delay among TB patients on DOTS southwest Ethiopia, January to December 2015
Variable Provider delay COR( 95% CI) AOR( 95%CI)
Yes n(%) No n(%)
Type of TB Pulmonary positive 182(49.9) 183(50.1) 1.00 1.00
Pulmonary negative 10347.2) 115(52.8) 0.9(0.64,1.26) 0.87(0.60,1.25)
Extra pulmonary 82(53.9) 70(46.1) 1.18(0.81,1.72) 1.08(0.72,1.62)
HIV status
Positive 39(57.4) 29(42.6) 1.38(0.84,2.30) 1.33(0.78,2.27)
Negative 328(49.2) 339(50.8) 1.00 1.00
First action
to illness
Self treatment 44 (44.9) 54(55.1) 0.81(0.53,1.25) 0.75(0.47,1.19)
Traditional care 9(60.0) 6(40.0) 1.5(0.53,4.27) 1.19(0.47,3.51)
Holy water 16(61.5) 10(38.5) 1.6(0.71,3.58) 1.28(0.55,2.99)
Consult HCP 298(50.0) 298(50.0) 1.00 1.00
First visited
HCF
DOTS center 203(44.2) 256(55.8) 1.00 1.00
Non DOTS 164(59.4) 112(40.6) 1.85(1.36,2.50) 1.42(1.01,2.00)*
Number of
visited HCF
1 233(62.0) 143(38.0) 2.77(2.05,3.73) 2.34(1.69,3.24)*
>1 133(37.2) 225(62.8) 1.00 1.00
Patient delay Yes 213(57.6) 157(42.4) 1.80(1.36,2.50) 1.81(1.33,2.50)*
No 154(42.2) 211(57.8) 1.00 1.00
HCP=Health Care Provider, *statistically significant at p<0.05
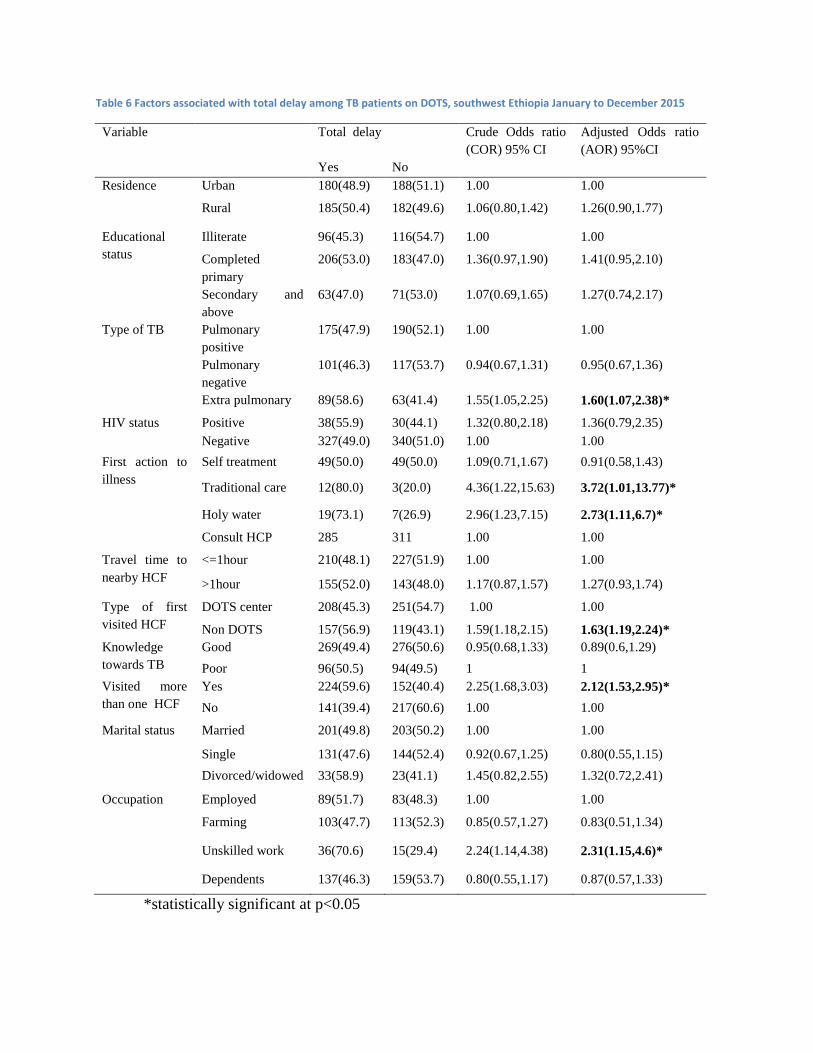
Table 6 Factors associated with total delay among TB patients on DOTS, southwest Ethiopia January to December 2015
Variable Total delay Crude Odds ratio
(COR) 95% CI
Adjusted Odds ratio
(AOR) 95%CI
Yes No
Residence Urban 180(48.9) 188(51.1) 1.00 1.00
Rural 185(50.4) 182(49.6) 1.06(0.80,1.42) 1.26(0.90,1.77)
Educational
status
Illiterate 96(45.3) 116(54.7) 1.00 1.00
Completed
primary
206(53.0) 183(47.0) 1.36(0.97,1.90) 1.41(0.95,2.10)
Secondary and
above
63(47.0) 71(53.0) 1.07(0.69,1.65) 1.27(0.74,2.17)
Type of TB Pulmonary
positive
175(47.9) 190(52.1) 1.00 1.00
Pulmonary
negative
101(46.3) 117(53.7) 0.94(0.67,1.31) 0.95(0.67,1.36)
Extra pulmonary 89(58.6) 63(41.4) 1.55(1.05,2.25) 1.60(1.07,2.38)*
HIV status Positive 38(55.9) 30(44.1) 1.32(0.80,2.18) 1.36(0.79,2.35)
Negative 327(49.0) 340(51.0) 1.00 1.00
First action to
illness
Self treatment 49(50.0) 49(50.0) 1.09(0.71,1.67) 0.91(0.58,1.43)
Traditional care 12(80.0) 3(20.0) 4.36(1.22,15.63) 3.72(1.01,13.77)*
Holy water 19(73.1) 7(26.9) 2.96(1.23,7.15) 2.73(1.11,6.7)*
Consult HCP 285 311 1.00 1.00
Travel time to
nearby HCF
<=1hour 210(48.1) 227(51.9) 1.00 1.00
>1hour 155(52.0) 143(48.0) 1.17(0.87,1.57) 1.27(0.93,1.74)
Type of first
visited HCF
DOTS center 208(45.3) 251(54.7) 1.00 1.00
Non DOTS 157(56.9) 119(43.1) 1.59(1.18,2.15) 1.63(1.19,2.24)*
Knowledge
towards TB
Good 269(49.4) 276(50.6) 0.95(0.68,1.33) 0.89(0.6,1.29)
Poor 96(50.5) 94(49.5) 1 1
Visited more
than one HCF
Yes 224(59.6) 152(40.4) 2.25(1.68,3.03) 2.12(1.53,2.95)*
No 141(39.4) 217(60.6) 1.00 1.00
Marital status Married 201(49.8) 203(50.2) 1.00 1.00
Single 131(47.6) 144(52.4) 0.92(0.67,1.25) 0.80(0.55,1.15)
Divorced/widowed 33(58.9) 23(41.1) 1.45(0.82,2.55) 1.32(0.72,2.41)
Occupation Employed 89(51.7) 83(48.3) 1.00 1.00
Farming 103(47.7) 113(52.3) 0.85(0.57,1.27) 0.83(0.51,1.34)
Unskilled work 36(70.6) 15(29.4) 2.24(1.14,4.38) 2.31(1.15,4.6)*
Dependents 137(46.3) 159(53.7) 0.80(0.55,1.17) 0.87(0.57,1.33)
*statistically significant at p<0.05
RESEARCH ARTICLE Open Access
Pre- and post-diagnosis costs of tuberculosisto patients on Directly Observed TreatmentShort course in districts of southwesternEthiopia: a longitudinal studyAbyot Asres1,3*, Degu Jerene2 and Wakgari Deressa3
Abstract
Background: Financial burden on tuberculosis (TB) patients results in delayed treatment and poor compliance. Weassessed pre- and post-diagnosis costs to TB patients.
Methods: A longitudinal study among 735 new TB cases was conducted from January 2015 through June 2016 in10 woredas (districts) of southwestern Ethiopia. Direct out-of-pocket, payments, and lost income (indirect cost) weresolicited from patients during the first 2 months and at the end of treatment. Thus, we ascertained direct medical,nonmedical, and indirect costs incurred by patients during pre- and post-diagnosis periods. We categorized costsincurred from onset of illness until TB diagnosis as pre-diagnosis and that incurred after diagnosis throughtreatment completion as post-diagnosis. Pre- and post-diagnosis costs constitute total cost incurred by the patients.We fitted linear regression model to identify predictors of cost.
Results: Between onset of illness and anti-TB treatment course, patients incurred a median (inter-quartile range (IQR)) ofUS$201.48 (136.7–318.94). Of the total cost, the indirect and direct costs respectively constituted 70.6 and 29.4%. TB patientsincurred a median (IQR) of US$97.62 (6.43–184.22) and US$93.75 (56.91–141.54) during the pre- and post-diagnosis periods,respectively. Thus, patients incurred 53.6% of the total cost during the pre-diagnosis period. Direct out-of-pocket expensesduring the pre- and post-diagnosis periods respectively amount to median (IQR) of US$21.64 (10.23–48.31) and US$35.02(0–70.04). Patient delay days (p< 0.001), provider delay days (p< 0.001), number of healthcare facilities visited until TBdiagnosis (p< 0.001), and TB diagnosis at private facilities (p= 0.02) independently predicted increased pre-diagnosis cost.Similarly, rural residence (p< 0.001), hospitalization during anti-TB treatment (p< 0.001), patient delay days (p< 0.001), andprovider delay days (p< 0.001) predicted increased post-diagnosis costs.
Conclusion: TB patients incur substantial cost for care seeking and treatment despite “free service” for TB. Therefore,promoting early care seeking, decentralizing efficient diagnosis, and treatment services within reach of peoples, andintroducing reimbursement system for direct costs can help minimize financial burden to the patient.
Keywords: TB, Direct cost, Indirect cost, Longitudinal, Pre-diagnosis, Post-diagnosis, Ethiopia
* Correspondence: [email protected] of Public Health, College of Health Sciences, Mizan-TepiUniversity, PO Box 260, Mizan Aman, Ethiopia3Department of Preventive Medicine, School of Public Health, College ofHealth Sciences, Addis Ababa University, Addis Ababa, EthiopiaFull list of author information is available at the end of the article
© The Author(s). 2018 Open Access This article is distributed under the terms of the Creative Commons Attribution 4.0International License (http://creativecommons.org/licenses/by/4.0/), which permits unrestricted use, distribution, andreproduction in any medium, provided you give appropriate credit to the original author(s) and the source, provide a link tothe Creative Commons license, and indicate if changes were made. The Creative Commons Public Domain Dedication waiver(http://creativecommons.org/publicdomain/zero/1.0/) applies to the data made available in this article, unless otherwise stated.
Asres et al. Journal of Health, Population and Nutrition (2018) 37:15 https://doi.org/10.1186/s41043-018-0146-0

BackgroundTuberculosis (TB) remained among the major globalpublic health problems. In 2015, an estimated 10.4million cases and 1.4 million deaths occurred globally.The African Region constitutes 28% of the global casesand the most severe burden relative to population (281cases per 100,000 people) [1]. TB morbidity and mortalitypose an enormous economic burden to patients, household,and society. Each year, a TB patient loses on average 3 to4 months of work and up to 30% of household earnings [2].Efforts to control TB have three distinct, but overlap-
ping humanitarian, public health, and economic dimen-sions. The efforts imply timely diagnosis and treatmentof patients and reduction of costs due to TB [3]. The lat-est TB control strategy, End TB, underlined the need foruniversal access to health services without financialhardship, social protection for income replacement, andsupport in the event of illness [4]. Accordingly, a globaltarget has been set to have no TB-affected family facingcatastrophic costs due to TB by 2020 [4, 5]. Costs in-curred by a TB patient include either direct or indirectcosts. The direct costs comprise out-of-pocket expensesfor medical and nonmedical services whereas the indir-ect costs constitute foregone income because of lostworkdays [6].Despite the free TB diagnosis and treatment, TB
patients and families incur high direct and indirect costsdue to TB illness [5]. Systematic reviews across low- andmiddle-income countries showed mean total costs of TBranging from fewer than I$1 to I$8198 [5, 7]. The reviewfurther reported indirect and direct costs incurred forTB care respectively constituted 60 and 40% of the totalcost [5]. Studies also reported that seeking care andtreatment of TB costs a median of United States ofAmerica Dollar (US$) 592 in Nigeria [8] and mean costof US$108.4 in Yemen [9] per household. The high costof TB care seeking and treatment result in delays todiagnoses [10, 11] and poor outcome [12, 13]. The pooroutcome lead to development of drug resistant TB [14]that require much higher cost of care [15].Implementation of global TB control strategies in
Ethiopia have led to improvements in access to TB care,decline in TB morbidity, and mortality [16]. Nonethe-less, Ethiopia belongs to the 14 TB, TB/human immuno-deficiency virus (HIV), and multi-drug resistant (MDR)TB high-burden countries [1]. Out of a total US$47.8million spent for TB control in 2008, household out-of-pocket expenses constituted 62% [17]. A cost and epi-demiological modelling in Ethiopia, showed out-of-pocket medical cost for TB amounted to US$49 per pa-tient that led households to fall below poverty line [18].A study in Tigray, Northern Ethiopia from patient per-spective reported median cost incurred for care seekingto be US$16 [19]. A community randomized trial using
societal perspective in southern Ethiopia revealed a suc-cessful treatment of a smear-positive patient costsUS$158.9 at a health facility compared to that within thecommunity (US$61.7) [20].It is important to understand the financial burden of
TB patients to adapt and realize a global target of havingno households incurring catastrophic costs because ofTB [1]. However, only few studies exist in Ethiopia,those dealt on the financial burden of TB patients. Thefew studies dealt on cost of care seeking and diagnosis[19] or cost of treatment [20] but not both. The studieswere conducted during the 8 months of treatment regi-men. However, the current 6-month regimen requiresfrequent visits (daily to weekly) to health facilitiesthroughout the course of treatment [21]. Furthermore,none of the studies analyzed cost predictors across thecontinuum of care. Generally, evidences on financialburden posed to TB patients across the pathways totreatment are limited in Ethiopia. Therefore, we studiedcosts incurred by TB patients across the pre- and post-diagnosis periods including cost drivers in districts ofsouthwestern Ethiopia.
MethodsStudy setting and designA longitudinal study among new TB cases on DirectlyObserved Treatment Short course (DOTS) was carriedout from January 2015 through June 2016. We included14 public healthcare facilities (three hospitals and 11health centers) from 10 woredas (an administrative unitequivalent to district) in three zones (an administrativestructure that oversees woredas and report to regionalstates). The zones, Bench Maji, Kaffa, and Sheka, areamong the 15 zones in Southern Nations Nationalitiesand Peoples Region (SNNPR). The zones are located atthe southwestern border of the region where anestimated 2,064,102 people reside [22]. The zones areorganized into four town administrations and 26woredas. During the study, three hospitals and 65 healthcenters were providing TB DOTS [23].Diagnosis and treatment for all forms of TB in
Ethiopia is according to a national guidelines [21, 24]that specify case definitions, diagnostic, and treatmentstandards. Diagnosis based on sputum microscopy, spu-tum follow-up test, and anti-TB drugs are free of chargein all public and selected private facilities. Since the endof 2011, all forms of new TB cases are treated for6 months with combination of rifampicin (R), isoniazid(H), pyramidal (Z), and ethambutol (E) for the first2 months (intensive phase) (2RHZE) followed by rifam-picin (R) and isoniazid (H) for 4 months (4RH). Thus,patients need to visit a DOTS center daily and weeklyduring intensive and continuation phase treatments,respectively.
Asres et al. Journal of Health, Population and Nutrition (2018) 37:15 Page 2 of 11
Sample size and samplingThe sample size needed for the study was calculatedusing STATA V13 considering a mean (SD) patient costof care seeking of US$29(14) [19] to detect a US$5 dif-ference which revealed 250 cases. This study is part of adoctoral dissertation aimed at assessing time delays,cost, and outcomes of TB patients on DOTS. Thus,among the sample sizes calculated for each objective ofthe dissertation, which required for assessing predictorsof delay, 802 cases was the largest. Since similar caseswere studied for all the objectives, the largest sample,802 cases was used for this study.We selected the region (SNNPR) and zones (Bench
Maji, Kaffa, and Sheka) conveniently. Considering theavailable resources and representativeness, we decidedto study 10 woredas of the three zones. Thus, throughproportional allocation, we determined the number ofworedas from each zone. Considering the number of TBcases notified in the preceding year to the study time,we selected the woredas from each zones. Then, all pub-lic health facilities providing diagnosis and treatment ofTB in the selected woredas were included for the study.We included 14 health facilities (three hospitals and 11health centers). Therefore, we allocated the 802 casesproportionally to the zones, woredas, and health facilitiesbased on their preceding year TB case notification. Finally,successive consenting cases were enrolled until therequired sample reaches. Those new cases, older than18 years and on intensive phase treatment, were includedand those on continuation phase, transferred to othertreatment center, lost to follow-up, and died before theenrollment were excluded from study.
Data collectionData were collected using structured questionnaire(Additional file 1) adapted from the tool to estimate TBpatients’ cost developed by the WHO and other partners[6]. Similarly, data abstraction checklist was prepared toextract data from the standard unit TB register. Thequestionnaire was translated in to the national language(Amharic) to ease the understanding among both thedata collectors and participants. Then, 10 diplomagraduate nurse data collectors and three master holdersupervisors were recruited and trained for 3 days. Thetraining included the basics of TB control, details ofquestionnaire, data abstraction, interviewing techniques,and pretest of the tool at health facilities not included inthe study. Finally, eligible cases were traced from theunit TB register, and face-to-face interview was heldwithin the intensive phase and end of treatment. Thefirst interview-included patients’ sociodemographic,healthcare-seeking practices, and costs incurred until TBdiagnosis (pre-diagnosis cost). The follow-up interview
inquired costs incurred after the diagnosis of TBthrough completion of the treatment (post-diagnosiscost).
Cost ascertainmentCost data were ascertained from patient perspectiveusing prevalent approach that estimate financial burdenof an illness to patients at specified period of time [25].So costs incurred by patients for care seeking and treat-ment of TB were collected at two-time points, duringthe first 2 months of treatment and at the end of thetreatment. Both direct out-of-pocket expenses (formedical and nonmedical services) and indirect costswere measured. Direct costs consisted of out-of-pocketcharges for medical services (consultation, drugs, labora-tory tests, X-ray, and hospitalization) and nonmedicalservices (transportation, meal, and accommodation)while visiting healthcare facilities.Direct out-of-pocket patient expenses during the pre-
diagnosis period (incurred from onset of illness to treat-ment initiation) were determined by asking patientexpense at each visit for consultation, laboratory tests,drugs, transportation, meals, and lodging. In the sameway, post-diagnosis direct costs (incurred from initiationto completion of the prescribed treatment) were measuredby inquiring patients’ medical and nonmedical expensesduring visits for anti-TB treatment. The number of visitsfor the pre-diagnosis period was solicited from patients,and post-diagnosis visits were taken from attendancerecords on a unit register. Thus, transportation cost wascalculated by multiplying the number of visits with the feeper trip.The indirect costs were estimated using the human
capital approach. Patients were requested to estimatetime lost due to sickness and visits for consultation,hospitalization, drug collection, and trip journey. Thetime spent second or minute were converted to hoursand then to days at an average of eight working hours ina day (8 h = 1 day). Finally, the number of days wasmultiplied by an average daily wage rate of US$2.43 = 50Ethiopian Birr for those unemployed and daily ratecalculated from their gross monthly salary for thoseformally employed. Monthly income of formallyemployed cases was inquired from patients by askingtheir monthly salary. For self-employed, self-estimatedaverage monthly earning was used to calculate daily rate.An average wage rate estimated by the social affairoffices was used for unemployed cases.For cost items with no charge, it was recorded as
zero. All the costs were inquired in local currency,Ethiopian Birr (ETB), and then converted into USdollars (US$) using the average exchange rate of(US$1 = 20.56 ETB) during January through December2015 [26].
Asres et al. Journal of Health, Population and Nutrition (2018) 37:15 Page 3 of 11
Data managementData were entered into EpiData v3.1 then exported toSPSS version 21 for cleaning and then to STATA 13 foranalysis. The data were described using frequency, pro-portions, mean (standard deviation), and median (inter-quartile range), and normality of the cost data werechecked using plots (Q-Q plots and/or histograms) orKolmogorov-Smirnov test. The cost data were rightskewed and became log normal upon log transformationto base 10. Hence, all the statistical tests were done withthe lognormal data and reported by back transformingto its anti-log.Proportion and mean differences across categorical
variables were tested using chi-square and independent ttests respectively. Associations between continuousvariables were tested with simple correlation. Meandifference between pre- and post-diagnosis costs weretested with paired t test. Finally, simple and multiplelinear regression models were fitted to identify predic-tors of pre- and post-TB diagnosis costs. Assumptionsand fitness for the linear regression model were assessedand ensured. In all the statistical tests, significance wasjudged at p < 0.05.
Ethical issuesThe Institutional Review Board of the College of HealthSciences at Addis Ababa University approved the studyprotocol. Therefore, patients consented in written for theinterview and clinical records of patients were retrievedupon permission from the respective health facilities.
Operational definitionsPatient delay is days elapsed between onsets of illness tothe first formal healthcare seeking.Health system/provider delay is the number of days
spent between the first consultations to initiation oftreatments.Total delay is the number of days elapsed since onset
of illness to anti-TB treatment initiation.Medical cost is costs incurred for medical services
including consultation, laboratory tests, drugs other thananti-TB, X-ray, and related services.Nonmedical cost is costs incurred for transportation,
accommodation, meal, and related services while seekingcare for TB and visiting to collect anti-TB drugs.Direct cost is out-of-pocket patient expenses for
medical or nonmedical services while seeking care,diagnosis, and treatment for TB.Indirect cost is lost earning because of inability to work
or lost workdays while traveling to seek care, diagnosis,and treatment for TB.Pre-diagnosis cost is the cost incurred since onset of
illness until anti-TB treatment initiation.
Post-diagnosis cost is the cost incurred since the beginningup to the completion of anti-TB treatment.Total cost is both direct and indirect costs incurred for
care seeking, diagnosis, and treatment of TB.
ResultsA total of 735 TB cases were enrolled of which 627(85.3%)completed the follow-up. Those lost included 29(3.9%)deaths, 36(4.9%) transferred to other treatment centers,5(0.7%) treatment failure, and 38(5.2%) lost to follow-up.Nonetheless, there were no statistical significant differ-ences with the proportions of the attributes across thebaseline and end line surveys (Table 1). The median age(inter-quartile range (IQR)) of the cases during enrollment(baseline) was 27(20–37) years. Of the cases enrolled, 53and 29.4% completed elementary school and are involvedin farming, respectively. The mean (+ SD) of size andmedian annual income of the households were 4.3(+ 2.1)and US$466.93, respectively.
Care-seeking pathwaysTB patients first visited a healthcare facility after a medianof 25 days from onset of illness (patient delay). Thus, 35.4and 32.4% of the cases first visited private clinics and publichealth centers, respectively (Table 2). The rest of the casesfirst visited hospitals (30.1%) and health posts (2.1%). TBdiagnosis of 448(61%) cases was made at a hospital, and for244(33.2%), the diagnosis was made at the first visitedhealth facility. Diagnosis of 491(66.8%) were reached afteran average (+SD) of 3.6(+ 2.4) visits to an average (+SD) of2.2(+ 1.2) healthcare facilities (HCF). Since the first consult-ation, a median of 22 days had been elapsed to initiate anti-TB treatment. Among the cases, 586(79.7%) had pulmonaryTB and 362(49.3%) were diagnosed clinically. All of thecases were offered HIV screening test of whom 68 (9.3%)tested positive, 95% CI (7.2–11.3%).
Pre-diagnosis costUntil diagnosis of TB, patients incurred a median (IQR)cost of US$97.6 (56.4–184.2) (Table 3). Direct costamount to median (IQR) US$21.64 (10.23–48.31) andconstitute 25.6% (Fig. 1) of the total pre-diagnosis costs.Patients had lost median (IQR) of 24.7(15.1–48.4) work-days until diagnosis of TB that corresponded to median(IQR) US$64.45 (39.8–128.8) income loss.The pre-diagnosis cost was positively correlated with
patient (γ = 0.32, p < 0.001), provider (γ = 0.64, p < 0.001)and total delays (γ = 0.68, p < 0.001), and the number ofHCF visited until diagnosis (γ = 0.42, p < 0.001). Themean pre-diagnosis cost was significantly differentacross the types of TB (F = 10.03, p < 0.00), type of firstvisited HCF (p = 0.002), HCF where diagnosis wasmade (p < 0.001), and mode of diagnosis (p = 0.001)(Additional file 2: Table S1).
Asres et al. Journal of Health, Population and Nutrition (2018) 37:15 Page 4 of 11

In a multiple regression patient and provider delays,being clinically diagnosed, TB diagnosis at private fa-cilities and the number of visited healthcare facilitiesindependently predicted higher mean pre-diagnosiscosts (Table 4). Every single patient and providerdelay days each increased the mean pre-diagnosis costby 0.5%. Those patients’ diagnosed clinically incurred11% higher mean pre-diagnosis costs compared tothose diagnosed bacteriologically. Similarly, patientsdiagnosed at private HCFs incurred 18% higher meanpre-diagnosis cost compared to those diagnosed atpublic HCFs.
Post-diagnosis costAfter the diagnosis of TB, patients incurred a total me-dian (IQR) of US$93.75 (56.9–141.54) until the comple-tion of the treatment (Table 3). The direct costamounted to a median (IQR) of US$35.02 (0–70.04) andconstitutes 35.9% (Fig. 1) of the total post-diagnosis cost.During the treatment, TB patients had lost a median(IQR) of 21(13–35.3) workdays that corresponded to amedian (IQR) of US$51.0 (34.6–97.0) income loss (in-direct cost). Thus, significantly lower medical and in-direct costs and higher nonmedical costs were
incurred during the post-diagnosis period comparedto the pre-diagnosis. The post-diagnosis cost waspositively correlated with patient (γ = 0.20, p < 0.001)and provider (γ = 0.23, p < 0.001) delays.In the multiple regression analysis, being a rural resi-
dent, having a travel time beyond 1 h to the treatmentcenter, being admitted for anti-TB treatment, patientand provider delays independently predicted highermean post-diagnosis cost. On the other hand, com-pleting primary and higher educational status andbeing treated at a hospital predicted lower meanpost-diagnosis costs (Table 5). Thus, being a ruralresident was associated with an increase in meanpost-diagnosis cost by 48% compared to those beingurban residents. Every patient and provider delaydays increases the mean post-diagnosis cost by 0.3and 0.2%, respectively. Those patients hospitalizedfor anti-TB treatment had more than twofold highermean post-diagnosis cost compared to those patientsnever hospitalized for anti-TB treatment. Patientswho followed their course of anti-TB treatment athospitals had about 18% lower mean post-diagnosiscost compared to those who received the anti-TBtreatment at health centers.
Table 1 Sociodemographic characteristics of TB cases in districts of southwestern Ethiopia, January to December 2015
Variable Baseline (n = 735)n(%)
End line (n = 627)n(%)
P value
Gender Female 288(39.2) 244(38.9) 0.9
Age(years) 18–34 503(68.4) 431(68.7) 0.9
35–65 216 (29.4) 183(29.1) 0.8
> 65 16(2.2) 13(2.1) 0.89
Marital status Never married 275(37.4) 235(37.5) 0.97
Currently married 404(55) 342(54.5) 0.85
Widowed/divorced 56(7.6) 50(8) 0.78
Educational status No formal education 212(28.8) 176(28.1) 0.77
Completed elementary 389(53) 340(54.2) 0.66
Secondary and above 134(18.2) 111(17.7) 0.8
Occupation Employed 172(23.4) 147(23.4) 1.00
Farming 216(29.4) 188(30.0) 0.81
Unskilled worka 51(6.9) 43(6.9) 1.00
Dependentsb 296(40.3) 249(39.7) 0.82
Residence Urban 369(50.2) 313(49.9) 0.94
Rural 367(49.9) 314(50.1) 0.74
Household main income earner Self 370(50.3) 310(49.4) 0.74
Otherc 365(49.7) 317(50.6) 0.8
Household income ≤ US$466.93 288(50.6) 242(50.3) 0.9
> US$466.93 281(49.4) 239(49.7) 0.9aHousemaid, daily laborerbStudents, housewifecFather/mother/husband/wife/brother/sister/employer
Asres et al. Journal of Health, Population and Nutrition (2018) 37:15 Page 5 of 11

Total cost of TB care seeking and treatmentTotal costs incurred by patients for care seeking, diagnosis,and treatment amount to a median (IQR) of US$201.48(136.70–318.94) (Table 3). Pre- and post-diagnosis costs re-spectively constituted 53.6 and 46.4% of the total cost. Totaldirect cost constituted 29.4% (Fig. 1) of the total cost andamounted to a median (IQR) of US$59.58 (29.43–113.81).Drugs other than anti-TB and diagnostic tests (laboratory
or imaging tests) corresponded to 49.7 and 44.6% of thetotal medical costs, respectively. During the care seekingand treatment visits, patients had totally lost a median(IQR) 51.7 (32.0–80.8) workdays that corresponded to amedian (IQR) of US$127.68 (78.43–201.85) income loss(indirect cost). Out of the total forgone income due to theTB illness, the loss due to lost workdays following care-seeking visits amounted to a median (IQR) of US$18.02
Table 2 Care-seeking pathways and clinical characteristics of TB cases on treatment in districts of southwestern Ethiopia, January toDecember 2015
Variable Baseline (n = 735) End line (n = 627) P value
n(%) n(%)
Action to illness before visiting HCF None 586(79.7) 497(79.3) 0.85
Took actiona 149(20.3) 130(20.7) 0.85
First visited HCF DOTS center 459(62.5) 387(61.7) 0.85
Non-DOTS 276 (37.5) 240(38.3) 0.76
Diagnosis made HCF Public 636(86.5) 537(85.6) 0.76
Private 99(13.5) 90(14.4) 0.70
Type of TB Pulmonary positive 373(50.7) 320(51.0)) 0.90
Pulmonary negative 213(29.0) 176(28.1) 0.70
Extra pulmonary 149(20.3) 131(20.9) 0.70
Mode of diagnosis Bacteriological 373(50.7) 319(50.9) 0.90
Clinical 362(49.3) 308(49.1) 0.90
Treatment center Health center 469(36.2) 408(65.1) 0.70
Hospital 266(63.8) 219(34.9) 0.70
Travel time to treatment center ≤ 1 h 437(59.5) 373(59.5) 1.00
> 1 h 298(40.5) 254(40.5) 1.00
Hospitalized for treatment Yes 19(2.6) 15(2.4) 0.40
HIV co-infection Yes 68(9.3) 46(7.3) 0.10
Patient delay Median (IQR) days 25((15–36) 23(14–34) 0.20
Provider delay Median (IQR) days 22(9–48) 20(8–48) 0.40
Total delay Median (IQR) days 55(32–100) 52(31–93) 0.50aSelf-treatment, consult traditional healer, used holy water
Table 3 Distribution of TB patient costs across cost categories and periods in districts of southwestern Ethiopia, January to December 2015
Cost category Cost period
Pre-diagnosis (US$) Post-diagnosis (US$) Total (US$)
Medical Mean (95% CI) 8.56 (7.68, 9.54) 4.4 (3.23, 6.0) 8.75 (7.85, 9.75)
Median (IQR) 10.72 (4.58, 23.76) 0 (0) 11.19 (4.73–24.08)
Nonmedical Mean (95% CI) 10.08 (8.99, 11.30) 43.27 (38.32, 48.23)) 64.1 (58.34, 69.9)
Median (IQR) 8.27 (1.61, 24.32) 35.02 (0–70.04) 37.11 (14.35, 85.12)
Total direct Mean (95% CI) 21.46 (19.65, 23.43) 43.80 (38.82, 48.78) 84.82 (77.92, 91.72)
Median (IQR) 21.64 (10.23, 48.31) 35.02 (0–70.04) 59.58 (29.43, 113.81)
Indirect Mean (95% CI) 75.62 (70.68, 80.90) 75.20 (69.14, 81.26)) 140.31 (132.35, 148.74)
Median (IQR) 64.45 (39.82, 128.80) 51.07 (34.65, 93.02) 127.68 (78.43, 201.85)
Total Mean (95% CI) 108.0 (101.31, 115.11) 117.0 (110.47, 123.87) 244.71 (229.45, 260.98)
Median (IQR) 97.62 (56.43, 184.22) 93.75 (56.91, 141.54) 201.48 (136.7, 318.94)
Asres et al. Journal of Health, Population and Nutrition (2018) 37:15 Page 6 of 11
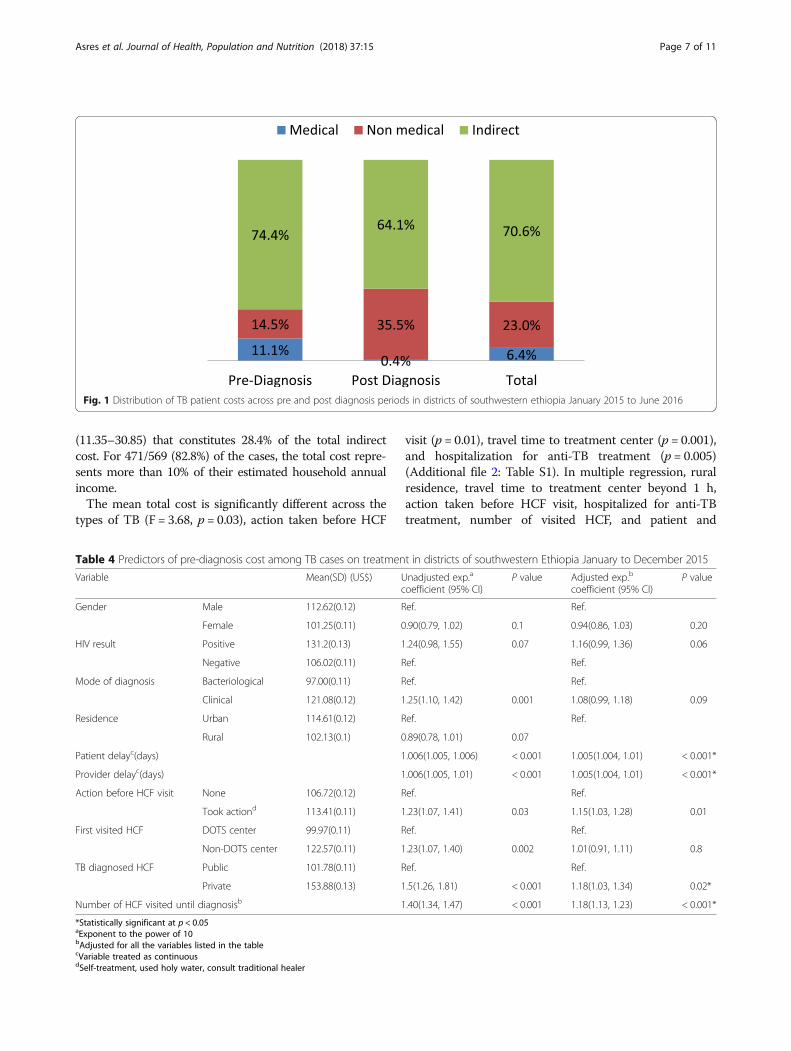
(11.35–30.85) that constitutes 28.4% of the total indirectcost. For 471/569 (82.8%) of the cases, the total cost repre-sents more than 10% of their estimated household annualincome.The mean total cost is significantly different across the
types of TB (F = 3.68, p = 0.03), action taken before HCF
visit (p = 0.01), travel time to treatment center (p = 0.001),and hospitalization for anti-TB treatment (p = 0.005)(Additional file 2: Table S1). In multiple regression, ruralresidence, travel time to treatment center beyond 1 h,action taken before HCF visit, hospitalized for anti-TBtreatment, number of visited HCF, and patient and
Fig. 1 Distribution of TB patient costs across pre and post diagnosis periods in districts of southwestern ethiopia January 2015 to June 2016
Table 4 Predictors of pre-diagnosis cost among TB cases on treatment in districts of southwestern Ethiopia January to December 2015
Variable Mean(SD) (US$) Unadjusted exp.a
coefficient (95% CI)P value Adjusted exp.b
coefficient (95% CI)P value
Gender Male 112.62(0.12) Ref. Ref.
Female 101.25(0.11) 0.90(0.79, 1.02) 0.1 0.94(0.86, 1.03) 0.20
HIV result Positive 131.2(0.13) 1.24(0.98, 1.55) 0.07 1.16(0.99, 1.36) 0.06
Negative 106.02(0.11) Ref. Ref.
Mode of diagnosis Bacteriological 97.00(0.11) Ref. Ref.
Clinical 121.08(0.12) 1.25(1.10, 1.42) 0.001 1.08(0.99, 1.18) 0.09
Residence Urban 114.61(0.12) Ref. Ref.
Rural 102.13(0.1) 0.89(0.78, 1.01) 0.07
Patient delayc(days) 1.006(1.005, 1.006) < 0.001 1.005(1.004, 1.01) < 0.001*
Provider delayc(days) 1.006(1.005, 1.01) < 0.001 1.005(1.004, 1.01) < 0.001*
Action before HCF visit None 106.72(0.12) Ref. Ref.
Took actiond 113.41(0.11) 1.23(1.07, 1.41) 0.03 1.15(1.03, 1.28) 0.01
First visited HCF DOTS center 99.97(0.11) Ref. Ref.
Non-DOTS center 122.57(0.11) 1.23(1.07, 1.40) 0.002 1.01(0.91, 1.11) 0.8
TB diagnosed HCF Public 101.78(0.11) Ref. Ref.
Private 153.88(0.13) 1.5(1.26, 1.81) < 0.001 1.18(1.03, 1.34) 0.02*
Number of HCF visited until diagnosisb 1.40(1.34, 1.47) < 0.001 1.18(1.13, 1.23) < 0.001*
*Statistically significant at p < 0.05aExponent to the power of 10bAdjusted for all the variables listed in the tablecVariable treated as continuousdSelf-treatment, used holy water, consult traditional healer
Asres et al. Journal of Health, Population and Nutrition (2018) 37:15 Page 7 of 11
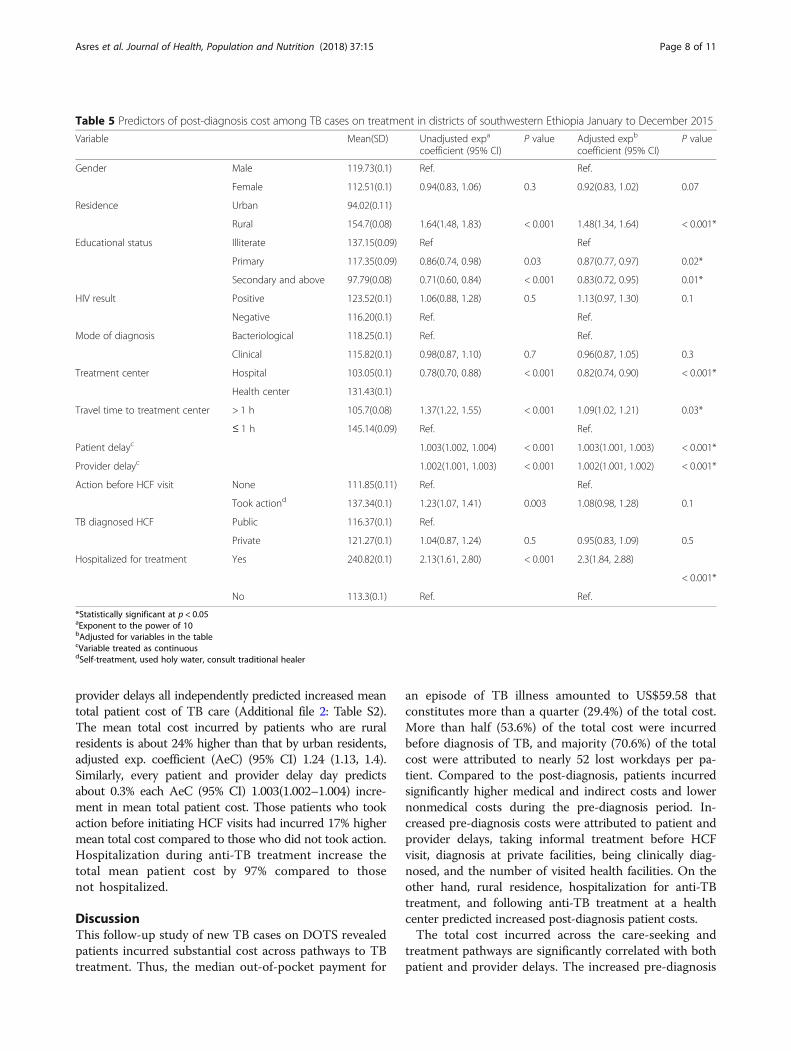
provider delays all independently predicted increased meantotal patient cost of TB care (Additional file 2: Table S2).The mean total cost incurred by patients who are ruralresidents is about 24% higher than that by urban residents,adjusted exp. coefficient (AeC) (95% CI) 1.24 (1.13, 1.4).Similarly, every patient and provider delay day predictsabout 0.3% each AeC (95% CI) 1.003(1.002–1.004) incre-ment in mean total patient cost. Those patients who tookaction before initiating HCF visits had incurred 17% highermean total cost compared to those who did not took action.Hospitalization during anti-TB treatment increase thetotal mean patient cost by 97% compared to thosenot hospitalized.
DiscussionThis follow-up study of new TB cases on DOTS revealedpatients incurred substantial cost across pathways to TBtreatment. Thus, the median out-of-pocket payment for
an episode of TB illness amounted to US$59.58 thatconstitutes more than a quarter (29.4%) of the total cost.More than half (53.6%) of the total cost were incurredbefore diagnosis of TB, and majority (70.6%) of the totalcost were attributed to nearly 52 lost workdays per pa-tient. Compared to the post-diagnosis, patients incurredsignificantly higher medical and indirect costs and lowernonmedical costs during the pre-diagnosis period. In-creased pre-diagnosis costs were attributed to patient andprovider delays, taking informal treatment before HCFvisit, diagnosis at private facilities, being clinically diag-nosed, and the number of visited health facilities. On theother hand, rural residence, hospitalization for anti-TBtreatment, and following anti-TB treatment at a healthcenter predicted increased post-diagnosis patient costs.The total cost incurred across the care-seeking and
treatment pathways are significantly correlated with bothpatient and provider delays. The increased pre-diagnosis
Table 5 Predictors of post-diagnosis cost among TB cases on treatment in districts of southwestern Ethiopia January to December 2015
Variable Mean(SD) Unadjusted expa
coefficient (95% CI)P value Adjusted expb
coefficient (95% CI)P value
Gender Male 119.73(0.1) Ref. Ref.
Female 112.51(0.1) 0.94(0.83, 1.06) 0.3 0.92(0.83, 1.02) 0.07
Residence Urban 94.02(0.11)
Rural 154.7(0.08) 1.64(1.48, 1.83) < 0.001 1.48(1.34, 1.64) < 0.001*
Educational status Illiterate 137.15(0.09) Ref Ref
Primary 117.35(0.09) 0.86(0.74, 0.98) 0.03 0.87(0.77, 0.97) 0.02*
Secondary and above 97.79(0.08) 0.71(0.60, 0.84) < 0.001 0.83(0.72, 0.95) 0.01*
HIV result Positive 123.52(0.1) 1.06(0.88, 1.28) 0.5 1.13(0.97, 1.30) 0.1
Negative 116.20(0.1) Ref. Ref.
Mode of diagnosis Bacteriological 118.25(0.1) Ref. Ref.
Clinical 115.82(0.1) 0.98(0.87, 1.10) 0.7 0.96(0.87, 1.05) 0.3
Treatment center Hospital 103.05(0.1) 0.78(0.70, 0.88) < 0.001 0.82(0.74, 0.90) < 0.001*
Health center 131.43(0.1)
Travel time to treatment center > 1 h 105.7(0.08) 1.37(1.22, 1.55) < 0.001 1.09(1.02, 1.21) 0.03*
≤ 1 h 145.14(0.09) Ref. Ref.
Patient delayc 1.003(1.002, 1.004) < 0.001 1.003(1.001, 1.003) < 0.001*
Provider delayc 1.002(1.001, 1.003) < 0.001 1.002(1.001, 1.002) < 0.001*
Action before HCF visit None 111.85(0.11) Ref. Ref.
Took actiond 137.34(0.1) 1.23(1.07, 1.41) 0.003 1.08(0.98, 1.28) 0.1
TB diagnosed HCF Public 116.37(0.1) Ref.
Private 121.27(0.1) 1.04(0.87, 1.24) 0.5 0.95(0.83, 1.09) 0.5
Hospitalized for treatment Yes 240.82(0.1) 2.13(1.61, 2.80) < 0.001 2.3(1.84, 2.88)
< 0.001*
No 113.3(0.1) Ref. Ref.
*Statistically significant at p < 0.05aExponent to the power of 10bAdjusted for variables in the tablecVariable treated as continuousdSelf-treatment, used holy water, consult traditional healer
Asres et al. Journal of Health, Population and Nutrition (2018) 37:15 Page 8 of 11

cost with patient delay could be due to increased risks ofsevere manifestation [27] that lead to hospitalization andcompanion during care seeking and treatment. Besides,the patient delay is associated with informal care includingself-treatment and traditional cares [28, 29] that pose coststo patients. The patient delays are accompanied by longerlost workdays that reduced patient income. On the otherhand, the delay at health system (provider delay) is associ-ated with repeated visits to different HCF when patientsincur for both medical and nonmedical services.Those patients diagnosed clinically incur significantly
higher pre-diagnosis cost. This could be due to nationaldiagnostic algorithm that respectively requires 2–4 and4–8 weeks follow-up for the clinical diagnosis of smearnegative and extra pulmonary TB [21]. The higher costsfor the clinical diagnosis could be due to the require-ment of experienced clinician decisions guided by betterdiagnostic facilities. Such experts and facilities exist atonly few healthcare facilities situated in cities very farfrom the majority of the people that lead to highertransportation and lodging costs to patients. The re-peated consultations and diagnostic tests until diagnosisof TB all incur cost to the patients. The relatively lowercost of bacteriologically confirmed diagnosis could be dueto exemption of sputum smear microscopy and culture bythe national TB control program. Hence, ensuring effi-cient diagnostic algorithms and quality bacteriologicaltests can reduce the financial burden of TB patients.Consistent with other studies [8, 30] patients diagnosed
at private facilities incur significantly higher pre-diagnosiscost compared to those diagnosed at public facilities. Thedifferent cost items and rates at the private facilities whereevery services including sputum microscopy is chargedcan explain the relatively higher cost at the private. Sincethere were no public-private mix (PPM)-DOTS in thestudy area at the time of study, the private HCF might notimplement the proper diagnostic algorithm that mightlead to delay and extra cost. Furthermore, public healthfacilities requirement of retesting a positive sputum resultfrom private facilities for treatment initiation leads todelay and extra cost [31].We found patients treated at hospitals had signifi-
cantly lower post-diagnosis cost compared to thosetreated at health center. This could be due to thepresence of full-time staff that exclusively provides TBpatient care at hospitals. However, at health centers,providers are given multiple duties other than TBDOTS that increase patient waiting time and costs. Inaddition, health centers are situated in rural areaswhere there is no transport access within villages incontrast to hospitals in urban areas easily accessibleto patients within the town. Thus, statistically signifi-cant difference in mean total time (71.17 vs 106.79 min, p < 0.001) had been respectively spent per
each patient visit to hospitals and health centers.Consistent with other studies [8, 32], we found sig-nificantly higher post-diagnosis cost incurred by pa-tients from rural areas compared to those from urbanareas. The reason could be due to significantly highermean time spent per each visit among patients thatare rural and urban residents (119.51 vs. 68.35 min,p < 0.001), respectively.Our study had some limitations. First, cost measure-
ments relied on patient recall, which was liable to recallbias. However, we did the baseline interview within thefirst 2 months of treatment when patients are highlylikely to recall about the costs they incurred. Second, thestudy employed only patient perspective so that we werenot able to determine costs incurred by health systems,households, and communities. Lastly, we determined thecost based on a prevalent approach that measure costsfor an episode of illness so that we could not determinelifetime cost of TB illness. On the other hand, our studyemployed a longitudinal design involving a relativelylarge sample recruited consecutively. As a result, selec-tion bias was minimized and patient costs from careseeking through treatment completion were determined.The findings in the paper are valid but need to be inter-preted cautiously considering the limitations. Given theinternal validity, the findings can be applied to patientsin similar settings since the characteristics of patientsand the health systems in similar settings might not dif-fer significantly.
ConclusionThe study revealed TB patients on DOTS incur sub-stantial cost across the pathways to anti-TB treatmentdespite the “free service.” Significantly, higher costwas incurred during the pre-diagnosis period com-pared to the post-diagnosis period showing longerpathways of care seeking. Increased pre-diagnosiscosts are attributed to patient and provider delays,informal care before consultation, seeking care atprivate healthcare facilities, and clinical diagnosis.Higher post-diagnosis costs are attributed to patientand provider delays, rural residence, and being treatedat health center. Thus, implementation of patient-centered TB care introducing reimbursement mecha-nisms and scaling up of national community andsocial insurance initiatives to the study area are vitalto reduce patients’ out-of-pocket expenditures. Inaddition, introducing reimbursement of direct costs,promoting early care seeking, equipping healthcarefacilities with the necessary equipments, and staffingwith qualified health work force, and decentralizing effi-cient diagnosis and treatment within reach of patients canminimize the patient costs.
Asres et al. Journal of Health, Population and Nutrition (2018) 37:15 Page 9 of 11
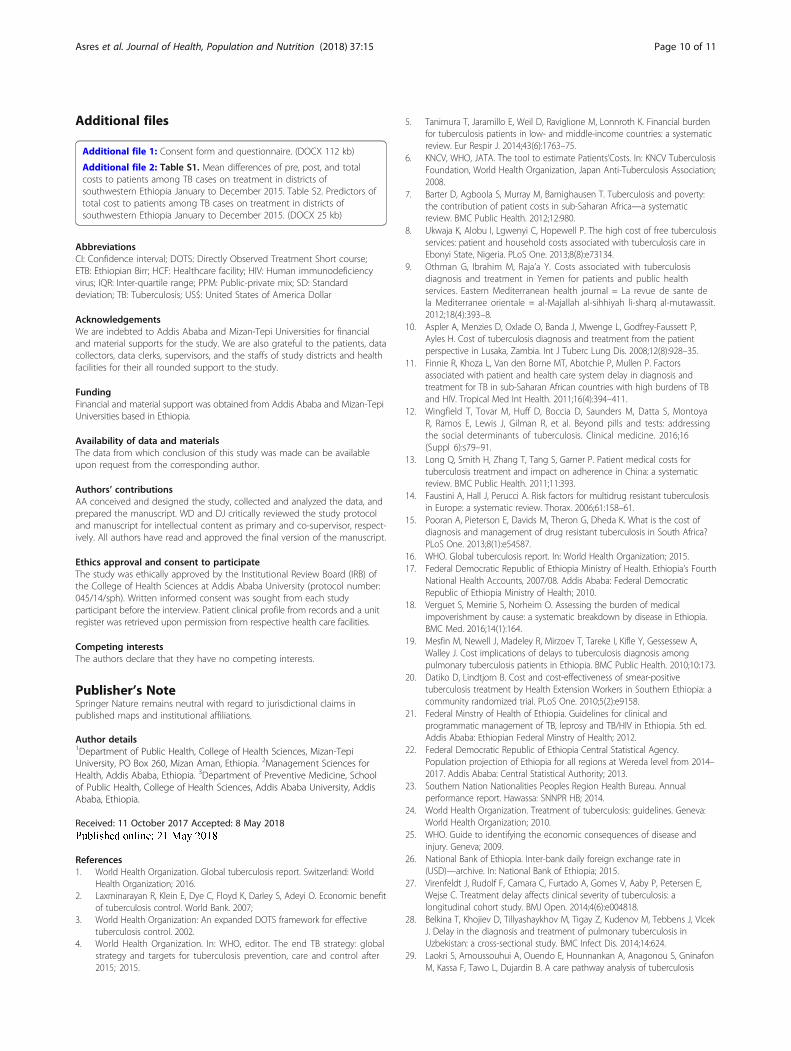
Additional files
Additional file 1: Consent form and questionnaire. (DOCX 112 kb)
Additional file 2: Table S1. Mean differences of pre, post, and totalcosts to patients among TB cases on treatment in districts ofsouthwestern Ethiopia January to December 2015. Table S2. Predictors oftotal cost to patients among TB cases on treatment in districts ofsouthwestern Ethiopia January to December 2015. (DOCX 25 kb)
AbbreviationsCI: Confidence interval; DOTS: Directly Observed Treatment Short course;ETB: Ethiopian Birr; HCF: Healthcare facility; HIV: Human immunodeficiencyvirus; IQR: Inter-quartile range; PPM: Public-private mix; SD: Standarddeviation; TB: Tuberculosis; US$: United States of America Dollar
AcknowledgementsWe are indebted to Addis Ababa and Mizan-Tepi Universities for financialand material supports for the study. We are also grateful to the patients, datacollectors, data clerks, supervisors, and the staffs of study districts and healthfacilities for their all rounded support to the study.
FundingFinancial and material support was obtained from Addis Ababa and Mizan-TepiUniversities based in Ethiopia.
Availability of data and materialsThe data from which conclusion of this study was made can be availableupon request from the corresponding author.
Authors’ contributionsAA conceived and designed the study, collected and analyzed the data, andprepared the manuscript. WD and DJ critically reviewed the study protocoland manuscript for intellectual content as primary and co-supervisor, respect-ively. All authors have read and approved the final version of the manuscript.
Ethics approval and consent to participateThe study was ethically approved by the Institutional Review Board (IRB) ofthe College of Health Sciences at Addis Ababa University (protocol number:045/14/sph). Written informed consent was sought from each studyparticipant before the interview. Patient clinical profile from records and a unitregister was retrieved upon permission from respective health care facilities.
Competing interestsThe authors declare that they have no competing interests.
Publisher’s NoteSpringer Nature remains neutral with regard to jurisdictional claims inpublished maps and institutional affiliations.
Author details1Department of Public Health, College of Health Sciences, Mizan-TepiUniversity, PO Box 260, Mizan Aman, Ethiopia. 2Management Sciences forHealth, Addis Ababa, Ethiopia. 3Department of Preventive Medicine, Schoolof Public Health, College of Health Sciences, Addis Ababa University, AddisAbaba, Ethiopia.
Received: 11 October 2017 Accepted: 8 May 2018
References1. World Health Organization. Global tuberculosis report. Switzerland: World
Health Organization; 2016.2. Laxminarayan R, Klein E, Dye C, Floyd K, Darley S, Adeyi O. Economic benefit
of tuberculosis control. World Bank. 2007;3. World Health Organization: An expanded DOTS framework for effective
tuberculosis control. 2002.4. World Health Organization. In: WHO, editor. The end TB strategy: global
strategy and targets for tuberculosis prevention, care and control after2015; 2015.
5. Tanimura T, Jaramillo E, Weil D, Raviglione M, Lonnroth K. Financial burdenfor tuberculosis patients in low- and middle-income countries: a systematicreview. Eur Respir J. 2014;43(6):1763–75.
6. KNCV, WHO, JATA. The tool to estimate Patients’Costs. In: KNCV TuberculosisFoundation, World Health Organization, Japan Anti-Tuberculosis Association;2008.
7. Barter D, Agboola S, Murray M, Barnighausen T. Tuberculosis and poverty:the contribution of patient costs in sub-Saharan Africa—a systematicreview. BMC Public Health. 2012;12:980.
8. Ukwaja K, Alobu I, Lgwenyi C, Hopewell P. The high cost of free tuberculosisservices: patient and household costs associated with tuberculosis care inEbonyi State, Nigeria. PLoS One. 2013;8(8):e73134.
9. Othman G, Ibrahim M, Raja’a Y. Costs associated with tuberculosisdiagnosis and treatment in Yemen for patients and public healthservices. Eastern Mediterranean health journal = La revue de sante dela Mediterranee orientale = al-Majallah al-sihhiyah li-sharq al-mutawassit.2012;18(4):393–8.
10. Aspler A, Menzies D, Oxlade O, Banda J, Mwenge L, Godfrey-Faussett P,Ayles H. Cost of tuberculosis diagnosis and treatment from the patientperspective in Lusaka, Zambia. Int J Tuberc Lung Dis. 2008;12(8):928–35.
11. Finnie R, Khoza L, Van den Borne MT, Abotchie P, Mullen P. Factorsassociated with patient and health care system delay in diagnosis andtreatment for TB in sub-Saharan African countries with high burdens of TBand HIV. Tropical Med Int Health. 2011;16(4):394–411.
12. Wingfield T, Tovar M, Huff D, Boccia D, Saunders M, Datta S, MontoyaR, Ramos E, Lewis J, Gilman R, et al. Beyond pills and tests: addressingthe social determinants of tuberculosis. Clinical medicine. 2016;16(Suppl 6):s79–91.
13. Long Q, Smith H, Zhang T, Tang S, Garner P. Patient medical costs fortuberculosis treatment and impact on adherence in China: a systematicreview. BMC Public Health. 2011;11:393.
14. Faustini A, Hall J, Perucci A. Risk factors for multidrug resistant tuberculosisin Europe: a systematic review. Thorax. 2006;61:158–61.
15. Pooran A, Pieterson E, Davids M, Theron G, Dheda K. What is the cost ofdiagnosis and management of drug resistant tuberculosis in South Africa?PLoS One. 2013;8(1):e54587.
16. WHO. Global tuberculosis report. In: World Health Organization; 2015.17. Federal Democratic Republic of Ethiopia Ministry of Health. Ethiopia’s Fourth
National Health Accounts, 2007/08. Addis Ababa: Federal DemocraticRepublic of Ethiopia Ministry of Health; 2010.
18. Verguet S, Memirie S, Norheim O. Assessing the burden of medicalimpoverishment by cause: a systematic breakdown by disease in Ethiopia.BMC Med. 2016;14(1):164.
19. Mesfin M, Newell J, Madeley R, Mirzoev T, Tareke I, Kifle Y, Gessessew A,Walley J. Cost implications of delays to tuberculosis diagnosis amongpulmonary tuberculosis patients in Ethiopia. BMC Public Health. 2010;10:173.
20. Datiko D, Lindtjorn B. Cost and cost-effectiveness of smear-positivetuberculosis treatment by Health Extension Workers in Southern Ethiopia: acommunity randomized trial. PLoS One. 2010;5(2):e9158.
21. Federal Minstry of Health of Ethiopia. Guidelines for clinical andprogrammatic management of TB, leprosy and TB/HIV in Ethiopia. 5th ed.Addis Ababa: Ethiopian Federal Minstry of Health; 2012.
22. Federal Democratic Republic of Ethiopia Central Statistical Agency.Population projection of Ethiopia for all regions at Wereda level from 2014–2017. Addis Ababa: Central Statistical Authority; 2013.
23. Southern Nation Nationalities Peoples Region Health Bureau. Annualperformance report. Hawassa: SNNPR HB; 2014.
24. World Health Organization. Treatment of tuberculosis: guidelines. Geneva:World Health Organization; 2010.
25. WHO. Guide to identifying the economic consequences of disease andinjury. Geneva; 2009.
26. National Bank of Ethiopia. Inter-bank daily foreign exchange rate in(USD)—archive. In: National Bank of Ethiopia; 2015.
27. Virenfeldt J, Rudolf F, Camara C, Furtado A, Gomes V, Aaby P, Petersen E,Wejse C. Treatment delay affects clinical severity of tuberculosis: alongitudinal cohort study. BMJ Open. 2014;4(6):e004818.
28. Belkina T, Khojiev D, Tillyashaykhov M, Tigay Z, Kudenov M, Tebbens J, VlcekJ. Delay in the diagnosis and treatment of pulmonary tuberculosis inUzbekistan: a cross-sectional study. BMC Infect Dis. 2014;14:624.
29. Laokri S, Amoussouhui A, Ouendo E, Hounnankan A, Anagonou S, GninafonM, Kassa F, Tawo L, Dujardin B. A care pathway analysis of tuberculosis
Asres et al. Journal of Health, Population and Nutrition (2018) 37:15 Page 10 of 11

patients in Benin: highlights on direct costs and critical stages for anevidence-based decision-making. PLoS One. 2014;9(5):e96912.
30. Lambert M, Delgado R, Michaux G, Volz A, Speybroeck N, Van Der Stuyft P.Delays to treatment and out-of-pocket medical expenditure for tuberculosispatients, in an urban area of South America. Ann Trop Med Parasitol. 2005;99(8):781–7.
31. Yimer S, Hansen C, Bjune G. The perspective of private practitionersregarding tuberculosis case detection and treatment delay in Amhararegion, Ethiopia: a cross-sectional study. BMC Res Notes. 2011;4:285.
32. Ukwaja K, Alobu I, Abimbola S, Hopewell P. Household catastrophicpayments for tuberculosis care in Nigeria: incidence, determinants, andpolicy implications for universal health coverage. Infectious Disease ofPoverty. 2013;2(1):21.
Asres et al. Journal of Health, Population and Nutrition (2018) 37:15 Page 11 of 11
RESEARCH ARTICLE Open Access
Delays to treatment initiation is associatedwith tuberculosis treatment outcomesamong patients on directly observedtreatment short course in SouthwestEthiopia: a follow-up studyAbyot Asres1,3*, Degu Jerene2 and Wakgari Deressa3
Abstract
Background: Despite reported long delays to initiate anti-TB treatment and poor outcomes in different parts ofEthiopia and elsewhere, evidences on association between the delay and treatment outcomes are scanty.
Methods: A follow up study among 735 new TB cases registered at health facilities in districts of southwest Ethiopiawas conducted from January 2015 to June 2016. Patients reported days elapsed between onset of illnessand treatment commencement of 30 days cutoff was considered to ascertain exposure. Thus, those elapsedbeyond 30 days to initiate anti-TB treatment since onset of illness were exposed and otherwise non-exposed.The cases were followed until earliest outcome was observed. Treatment outcomes was ascertained as perthe World Health Organization standard definitions and dichotomized into ‘successful’ when cured or treatmentcompleted and ‘unsuccessful’ when lost to follow-up or died or treatment failure. Bivariate and multiple log-binomialmodels were fitted to identify predictors of unsuccessful outcomes.
Results: The overall treatment success among the treatment cohort was 89.7% (88.4% vs. 94.2%, p = 0.01 respectivelyamong those initiated treatment beyond and within of 30 days of onset of illness. Higher risk of unsuccessful outcomewas predicted by treatment initiation beyond 30 days of onset [Adjusted Relative Risk (ARR) = 1.92, 95%CI:1.30, 2.81],HIV co-infection (ARR = 2.18, 95%CI:1.47, 3.25) and received treatment at hospital (ARR = 3.73, 95%CI:2.23, 6.25). On theother hand, lower risk of unsuccessful outcome was predicted by weight gain (ARR = 0.40, 95%CI:0.19, 0.83)and sputum smear negative conversion (ARR = 0.17,95% CI:0.09, 0.33) at the end of second month treatment.
Conclusion: Higher risk of unsuccessful outcome is associated with prolonged days elapsed between onset ofillness and treatment commencement. Hence, promotion of early care seeking, improving diagnostic and caseholding efficiencies of health facilities and TB/HIV collaborative interventions can reduce risk of unsuccessful outcome.
Keywords: TB, Delay, Follow-up, Log-binomial, Ethiopia
* Correspondence: [email protected] of Public Health, College of Health Sciences, Mizan TepiUniversity, Mizan Aman, Ethiopia3Department of Preventive Medicine, School of Public Health, College ofHealth Sciences, Addis Ababa University, Addis Ababa, EthiopiaFull list of author information is available at the end of the article
© The Author(s). 2018 Open Access This article is distributed under the terms of the Creative Commons Attribution 4.0International License (http://creativecommons.org/licenses/by/4.0/), which permits unrestricted use, distribution, andreproduction in any medium, provided you give appropriate credit to the original author(s) and the source, provide a link tothe Creative Commons license, and indicate if changes were made. The Creative Commons Public Domain Dedication waiver(http://creativecommons.org/publicdomain/zero/1.0/) applies to the data made available in this article, unless otherwise stated.
Asres et al. BMC Pulmonary Medicine (2018) 18:64 https://doi.org/10.1186/s12890-018-0628-2

BackgroundDespite the fact that nearly all cases can be cured, tuber-culosis (TB) remained to be among the major globalpublic health problems. Globally, 10.4 million incidentcases, of whom 6.1million notified and 1.4 million deathswere estimated to occur in 2015 [1]. Thus, the lateststrategy, “End TB” has been designed in line with thesustainable development goals (SDG). The strategyaimed at reaching 90% case detection and treatmentsuccess by 2025 [2].Tuberculosis has been recognized as a major public
health problem in Ethiopia and efforts to control the dis-ease has begun since early 1960s [3]. Nonetheless, TBhas remained among the major public health problemsin the country [4]. Accordingly, Ethiopia has been listedamong the 14 TB, TB/HIV (Human ImmunodeficiencyVirus) and Multi-Drug Resistant TB (MDR TB) HighBurden Countries (HBC) [1]. The first national TBprevalence survey conducted in 2011 revealed smearpositive pulmonary TB(PTB) prevalence of 108/100,000;of which 55% were not detected before the survey [5] .In 2015, about 205,463 new cases [6] and 29,000 deathswere estimated to occur in the country [1] when only125,801 (61%) were notified to National TB control Pro-gram (NTP) [6].The ultimate goal of any TB control program is reduc-
tion of morbidity and mortality among patients and stoptransmission through curing infectious cases [7]. Henceearly detection and treatment of cases have been a pillarfor the end TB strategy [2]. Nonetheless, studies fromdifferent parts of Ethiopia reported patients elapse toolong time to initiate care seeking and treatment. TB pa-tients elapse median of 30 [8, 9] in Northern Ethiopiaand 63 days in Bale [10] to initiate care seeking and me-dian of six in Addis Ababa [11] and 34 days in Bale [10]to commence treatment.Delays to diagnosis and treatment of TB result in more
serious illness, increased length of infectiousness and poortreatment outcomes including mortality and drug resist-ance [12–16]. It is also reported that the high mortalityrate among people living with HIV is also partly explainedby delays to TB treatment [16, 17]. In contrast, a study inTel Aviv reported no association between treatment suc-cess and delay in treatment initiation [18].Achieving high cure rates help to reduce transmission
of TB and attract the great majority of existing cases toseek treatment [19]. As a result, treatment of TB is be-yond treating an individual patient, rather it is consid-ered as a public health intervention. Globally, 83% ofcases successfully completed their treatment in 2015,andeffective diagnosis and treatment of TB saved an esti-mated 49 million lives between 2000 through 2015 [1].In Ethiopia, 89% (range: 69%–95%)of treatment cohortin different regions attained successful TB treatment [6].
However, cure rates of 81% (range: 38% to 92%) [4]across regions of the country have been reported.Studies uncovered that patient demographics, clinical,
bacteriologic and HIV co morbidity were associated withunsuccessful TB treatment outcomes [20–23]. Despitethe prevailing long delays to initiate anti-TB treatmentand poor outcomes in different parts of Ethiopia andelsewhere, evidences on effect of the delay on treatmentoutcomes are scanty. Hence, this study assessed effect ofdelayed treatment initiation on outcomes of TB. Evi-dences on the association between treatment delay andoutcome is crucial to realize the targets of ending TBepidemic [2].
MethodsStudy settingThe study was conducted in 14 health facilities (threehospitals and 11 health centers) in three zones of South-ern Nation, Nationalities, and Peoples Region (SNNPR)of Ethiopia. The SNNPR is one of the nine RegionalStates in the country with an estimated 15.7millionpopulation in 2017 [24]. The three study Zones (BenchMaji, Kaffa and Sheka) are located at the southwesternpart of Ethiopia bordering South Sudan and harbor anestimated 1.8million peoples [24]. The zones (an admin-istrative unit that liaison woredas with the region) areorganized into four town administrations and 26 wore-das(administrative unit equivalent to districts). At thetime of the study, three hospitals and 65 health centerswere providing TB Directly Observed Treatment Shortcourse (DOTS) services. However, all the hospitals andonly 25 health centers were providing TB/HIV collabora-tive interventions [25].Diagnosis and treatment of all forms of TB across
Ethiopia has been based on national TB control guide-lines that specify case definitions, diagnostic and treat-ment standards [26]. Thus all TB cases enrolled for thisstudy were diagnosed using either sputum smear micro-copy or clinical signs aided with x-ray. Those cases withsputum smear positive were labeled as smear positivepulmonary TB and negatives were smear negative pul-monary TB. Diagnosis of smear negative and extra-pulmonary TB were made using diagnostic algorithmrecommended by the national guideline [26]. Detail defi-nitions for each cases presented in definition of termssection. Previously, TB diagnosis and treatment had beenlimited to public hospitals and health centers, but publicprivate mix (PPM) DOTS and community DOTS topublic health posts have been recently introduced. Thus,in 2011, 92% of public hospitals and 95% of health cen-ters, 2100 health posts and 317 PPM–DOTS centerswere providing DOTS based diagnosis and/or treatmentof TB in the country [27].
Asres et al. BMC Pulmonary Medicine (2018) 18:64 Page 2 of 11
Study design and samplingA prospective cohort study among new TB cases wascarried out from January 2015 through June 2016. Thetreatment cohorts were recruited from baseline surveydesigned to determine delays to initiate treatment. Sinceno standard cutoff point for delay to treatment, a clinicalsound cutoff of 30 days was used to ascertain exposure.Thus TB cases who elapsed beyond 30 days to initiatetreatment since onset of illness were labeled as exposedand those started treatment within 30 days of onset ofillness were non exposed. Then the cases were followeduntil earliest treatment outcome. The sample size wascomputed using StatCalc program of EpiInfo at 95% sig-nificance level, 80% power, expected outcome (unsuc-cessful of 3% [15] among those delayed beyond 30 days)to detect a difference of 7% with those initiated treat-ment earlier and considering design effect of 1.5 and10% lost to follow up a total of 640 cases were required.,However, the sample size for assessing predictors ofdelaycomputed using the same procedure provided atotal of 802 new cases . Hence, the same cases werefollowed for the outcome; the larger sample of 802 wastaken the final sample size.The sample was proportionally allocated to the zones,
woredas and health facilities based on TB cases reportedduring the year preceding the study. Finally, consecutiveconsenting cases from were prospectively enrolled untilthe required sample was reached and followed untilcompletion of the six-month treatment or earliest out-come. During the enrollment those new cases, olderthan 18 years of age, on intensive phase treatment wereincluded and those transferred out and died before theinterview were excluded from the study.
Data collectionA structured questionnaire adapted from tools used else-where [5, 28] and standard TB register book [26] wasused to gather the data. Besides, data abstraction check-list was prepared to draw clinical, bacteriologic andtreatment outcomes of the patients from TB register.The questionnaire was translated into national language(Amharic) spoken by almost all residents in the studyarea. Ten diploma graduate nurse data collectors andthree public health specialist supervisors were recruitedand trained for 3 days. The training included descriptionof questionnaire, interviewing techniques and pretestamong TB cases on DOTS at nearby health facilities notincluded in the study. Finally, eligible cases were tracedfrom the unit TB register and interviewed for sociode-mographic, health care seeking, and treatment practices.
Exposure ascertainmentThe main exposure variable was delays to treatmentmeasured by days elapsed between onsets of illness to
initiation of anti-TB treatment (total delay). The totaldelay comprises both patient and provider delays. Pa-tient delay was assessed by asking patients to recall andestimate date or number of days elapsed between onsetof TB constitutional symptoms such as cough, fever,night sweats, chest pain, weight loss and loss of appetiteuntil formal care seeking. Similarly, provider delay wasestimated by asking date or number of days elapsed be-tween first formal health care facility visits to anti-TBtreatment initiation. Finally, total delay was computed asa sum of patient and provider delay or number of dayselapsed between onsets of illness to initiation of anti-TBtreatment. Since no standard cut off for delay, a clinic-ally sound cut off of 30 days delay was taken to defineexposure status. Therefore, cases who delayed beyond30 days were categorized as exposed and those initiatedwithin 30 days were grouped as non-exposed.
Outcome ascertainmentThe main outcome variable was treatment outcome whichwas ascertained based on standard definitions [26, 29]. Ac-cordingly, outcomes were categorized into successfulwhen the TB patient completed treatment with or withoutevidence of cure and unsuccessful when died or lost tofollow-up or treatment failure. So that, coding was madeas unsuccessful outcomes = 1 and successful = 0.
Data processingData were entered in to Epi-Data V 3.5 and processedon SPSS version 21 and/or STATA version 13. The datawere described using frequencies, proportions, mean,median, inter-quartile range and standard deviation asappropriate. Both the baseline and follow-up data weredescribed and compared across the exposed and non-exposed groups. Categorical variables were comparedusing chi square test and numeric variables using inde-pendent and paired t tests as appropriate.Information provision adequacy during treatment initi-
ation was assessed based on 15 items constructed fromTB treatment guidelines. The internal consistency of theitems was checked by Cronbach’s Alpha (α) =0.87). Ascore of one is given for proper information and zerootherwise. So that information adequacy index was com-puted and labeled adequate when above median and in-adequate when below median scores.Association between the exposure (exposed vs, non-
exposed) and outcome (unsuccessful vs. successful) wasdetermined by log-binomial regression. Accordingly, bi-variate and multiple log-binomial regression modelswere fitted to estimate crude and adjusted relative risk(RR) of unsuccessful outcome. In all the statistical tests,significance was judged at p value < 0.05.
Asres et al. BMC Pulmonary Medicine (2018) 18:64 Page 3 of 11

Ethical issuesThe study was ethically approved by the Institutional Re-view Board (IRB) of college of Health Sciences at AddisAbaba University. Informed written consent was soughtfrom patients before the two interviews, during the in-tensive phase and end of treatment.
Definition of terms
� New case those never been treated for TB or havetaken anti-TB drugs for less than 1 month.
� Smear positive PTB is a patient with at least twosputum smear examinations positive for Acid FastBacilli (AFB) by direct microscopy.
� Smear negative pulmonary TB is a patient havingsymptoms suggestive of TB with at least three initialsmear examinations negative for AFB by directmicroscopy, and no response to a course of broad-spectrum antibiotics, and again three negative smearexaminations by direct microscopy and radiologicalabnormalities consistent with pulmonarytuberculosis, and decision by a clinician totreat with a full course of anti- tuberculosis
� Extra pulmonary TB is TB in organs other than thelungs, proven by histo-pathological evidence from abiopsy, Or based on strong clinical evidence consistentwith active EPTB and the decision by a physician totreat with a full course of anti-TB therapy.
� Cured: A bacteriologically confirmed pulmonary TBcase at the beginning of treatment who was smearor culture-negative at last month of treatment andon at least one previous occasion.
� Treatment completed: A TB patient who completedtreatment without evidence of failure BUT with norecord to show that sputum smear or culture resultsin the last month of treatment and on at least oneprevious occasion were negative
� Treatment failure: TB patient whose sputum smearor culture is positive at month 5 or later duringtreatment.
� Died: TB patient who dies for any reason during thecourse of treatment.
� Lost to follow up: TB patient interrupted treatmentfor 2 or more consecutive months.
� Treatment outcome not evaluated TB patient forwhom no treatment outcome is assigned includingcases “transferred out” to another treatment unit.
ResultsProfile of study participantsA total of 735 (91.6%) of TB cases required were enrolledfrom 11 health centers and 3 hospitals. The rest of cases67(8.4%) were not retrieved due to refusals (9), inability torespond (3) and end of the survey time (55). Of the cases
574 (78.4%) and 161(21.9%) had initiated anti-TB treat-ment within and above 30 days of onset of illness, respect-ively. Of the cases enrolled, 699 (95.1%) had documentedtreatment outcome and analyzed (Fig. 1).
Baseline sociodemographic characteristics of studyparticipantsThe median age [inter-quartile range (IQR)] and of thecases was 27(20–37) years. Among the cases, 52.9% and29.4% had completed elementary school and involved insubsistence farming respectively (Table 1).
Care seeking and treatment practicesPatients initially presented to healthcare facility after amedian (IQR) 25(15–36) days (patient delay) since theonset of illness. Diagnosis of 623(84.7%) of the caseswere made after an average (±SD) of 3.6(±2.4) visits toan average (±SD) of 2.2(±1.2) healthcare facilities atwhich time the patients had been treated with differentmedicines. The rest of the cases, 112(15.3%) were diag-nosed at their first visit to the first health facilities. Thusdiagnosis and initiation of anti-TB treatment took a me-dian (IQR) of 22(9–48) days (provider delay) since thefirst visit to health care facilities. Generally, a median(IQR) 55(32–100) days (total delay) had been elapsed toinitiate treatment since the onset of illness. Of the totalcases, 373(50.7% were smear positive pulmonary inwhom diagnosis was bacteriologicaly confirmed usingsputum smear microscopy. All of the cases were offeredHIV screening test, of whom 68 (9.3%) tested positive(95% CI: 7.2%–11.3%)). Of those TB/HIV co infectedcases, 27(39.7%) and 32(47.1%) were respectively receiv-ing antiretroviral therapy (ART) and CotrimoxazoleProphylactic Therapy (CPT)(Table 2).
Follow-up and treatment outcomesAfter initiation of treatment, patients had undergoneweight and sputum smear monitoring as per the recom-mended schedules. Accordingly, 501(68.2%), 266(36.2%)and 239(32.5%) of the cases had documented weight atend of second, fifth and sixth months of treatment re-spectively. Thus, a statistically significant difference inmean weights were observed between baseline and endof second month (t df = 500 = 13.94, p < 0.001), betweensixth month and baseline weight (t 238 = 11.81, P < 0.001). On the other hand, among those smear positivepulmonary TB cases (373(50.7%)) eligible for monitoringof sputum smear, 231(61.9%), 200(53.6%) and 178(47.5%) had documented sputum smear result at end of sec-ond, fifth and sixth months of treatment respectively. So,among those with documented follow-up sputum result,225 (97.4%) from both groups converted to negatives atthe end of second month treatment p = 0.5) (Table 3).
Asres et al. BMC Pulmonary Medicine (2018) 18:64 Page 4 of 11

Fig. 1 Flow chart of exposure and outcome ascertainment of TB cases Southwest Ethiopia,January 2015 to June 2016
Table 1 Socidemographic characteristics and delays to treatment in southwest Ethiopia January to December 2015
Variable Total delay(days) P value Total N(%)
> 30 (Exposed) N = 574 <=30 (Non exposed) N = 161
n(%) n(%)
Gender Male 345(60.1) 102(63.4) 0.6 447(60.8)
Female 229(39.9) 59(36.6) 288(39.2)
Age group (years) 18–34 389(67.8) 114(70.8) 0.04 503(68.4)
35–65 173(30.1) 43(26.7) 216(29.4)
> 65 12(2.1) 4(2.5) 16(2.2)
Residence Urban 280(48.9) 88(54.7) 0.7 368(50.1)
Rural 294(51.1) 73(45.3) 367(49.9)
Marital status Never married 208(36.2) 67(41.6) 0.3 275(37.4)
Currently married 315(54.8) 89(55.3) 404(55.0)
Divorced/widowed 51(9) 5(3.1) 56(7.6)
Educational status Illiterate 168(29.3) 44(27.3) 0.2 212(28.8)
Completed primary 309(53.8) 80(49.7) 389(52.9)
Secondary & above 97(16.9) 37(23.0) 134(18.2)
Occupation Employed 134(23.3) 38(23.6) 0.01 172(23.4)
Farming 163(28.4) 53(32.9) 216(29.4)
Unskilled work a 42(7.3) 9(5.6) 51(6.9)
Dependents b 235(40.9) 61(37.9) 296(40.3)ahousemaid, daily laborer, bstudents, housewife
Asres et al. BMC Pulmonary Medicine (2018) 18:64 Page 5 of 11

At the end of follow-up, 699(95.1%) TB patients haddocumented treatment outcome of whom 627(89.7%,95%CI:87.2–91.7%) had successfully completed theirtreatment. However, among those smear positive TBcases, only 177(47.5%) were declared cured. The treat-ment success is significantly different among cases initi-ated treatment beyond and within 30 days of onset ofillness (88.4% vs 94.2%, P = 0.01), respectively. Thus, sig-nificant difference in proportions of death (4.8% Vs 1.9%), treatment failure (0.7% Vs 0.6%) and loss to follow-up (6.1% vs. 3.2%), respectively, among those initiatedtreatments beyond and within 30 days of onset p = 0.04.The treatment success across HIV positive and negativesrespectively was 75.8% vs 91.1%, p < 0.001. Disaggrega-tion of the treatment success among bacteriologicalyconfirmed (smear positive pulmonary) and clinically di-agnosed cases respectively revealed 90.1% vs 89.3%, p =0.7. Furthermore, we found no statistically significantdifferences in treatment success among smear positivepulmonary (90.1%), smear negative pulmonary (88.0%)and extra pulmonary cases (91.1%) (p = 0.6).
Predictors of unsuccessful treatment outcomesTreatment outcome of the study patients varied signifi-cantly across time elapsed for initiation of treatment.Patients delayed for > 30 days to initiate treatment hadmore than twice higher risk of having unsuccessfuloutcome Adjusted relative risk [(ARR) = 2.02, 95% confi-dence interval (CI); 1.03,3.95). Moreover, being olderthan 65 years, (ARR = 3.83,95% CI; 2.04,6.1), HIV co in-fection (ARR = 1.93,95% CI; 1.23,3.01) and treatmentcenter being hospital (ARR = 3.78, 95% CI;2.25,6.36) in-dependently predicted higher risk of unsuccessful out-comes. On the other hand, weight gain at the end ofsecond month treatment (ARR = 0.45,95% CI;0.22,0.91)predicted lower risk of unsuccessful outcome. Those pa-tients gained weight at the end of two-month treatmentcompared to the baseline had about 60% lower risk ofhaving unsuccessful outcome (Table 4).Subgroup analysis among smear positive pulmonary
cases revealed delays to initiate treatment (ARR = 1.56,95%CI;1.46,1.65), HIV co infection (ARR = 3.73,95%CI:1.68,5.97), treatment center being hospital (ARR = 1.
Table 2 Patient characteristics and time delays to treatment southwest Ethiopia January to December 2015
Variable Total delay(days) Total
> 30 (Exposed) N = 574 <=30(non exposed) N = 161
n(%) n(%) P value n(%)
Type of TB Pulmonary positive 277(48.3) 96(59.6) 0.02 373(50.7)
Pulmonary negative 167(29.1) 46(28.6) 213(29.0)
Extra pulmonary 130(22.6) 19(11.8) 149(20.3)
HIV status Positive 57(9.9) 11(6.8) 0.4 68(9.3)
Negative 517(90.1) 150(93.2) 667(90.7)
Mode of TB diagnosis Bacteriological 277(48.3) 96(59.6) 0.04 373(50.6)
Clinical 297(51.7) 65(40.4) 363(49.4)
Treatment center Hospital 206(35.9) 60(37.3) 0.02 266(36.2)
Health center 368(64.1) 101(62.7) 469(63.8)
Action before HCFa visit None 440(76.7) 146(90.7) 0.04 586(79.7)
Took actionsb 134(23.3) 15(9.3) 149(20.3)
Place TB diagnosis made Public 493(85.9) 143(88.8) 0.09 636(86.5)
Private 81(14.1) 18(11.2) 99(13.5)
Hospitalized for TB illness Yes 15(2.6) 4(2.5) 0.5 19(2.6)
Knowledge about TB Poor 159(27.7) 31(19.3) 0.8 190(25.8)
Good 415(72.3) 130(80.7) 545(74.2)
Patient delay Median(IQR)days 30(16–57) 14(10–17) < 0.001 25(15–36)
Provider delay Median (IQR)days 31(16–64) 7(3–10) < 0.001 22(9–48)
Pre-diagnosis cost Median(IQR) US$c 119.1(74.0–221.6) 48.2(36.3–66.8) < 0.001
Post-diagnosis cost Median(IQR) US$c 93.7(56.9–141.3) 78.8(41.5–113.7) < 0.001
Treatment information adequate Yes 279(48.6) 78(48.4) 0.04 357(48.6)
No 295(51.4) 83(51.6) 378(51.4)
Initial weight Mean(±SD) Kg 49.0(8.6) 47.7(8.5) 0.9 48.7(± 8.6)aHealthcare Facility, bself treatment, traditional healer, holy water, c(1US$ = 20.56Birr)
Asres et al. BMC Pulmonary Medicine (2018) 18:64 Page 6 of 11
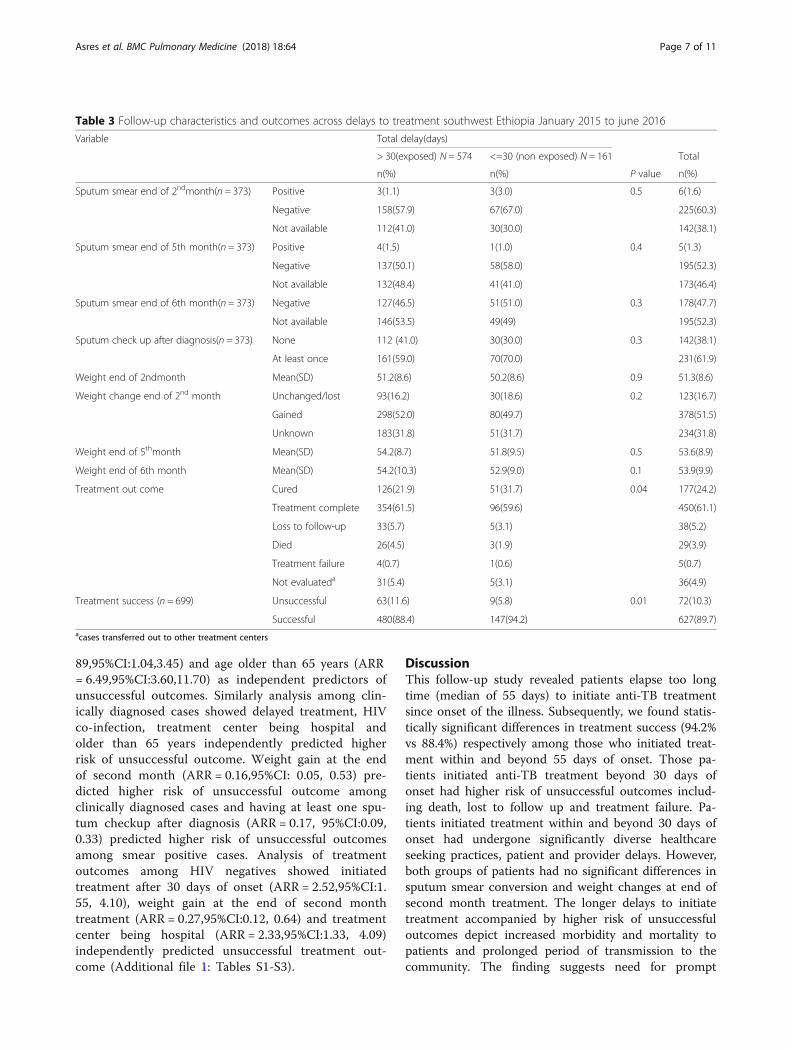
89,95%CI:1.04,3.45) and age older than 65 years (ARR= 6.49,95%CI:3.60,11.70) as independent predictors ofunsuccessful outcomes. Similarly analysis among clin-ically diagnosed cases showed delayed treatment, HIVco-infection, treatment center being hospital andolder than 65 years independently predicted higherrisk of unsuccessful outcome. Weight gain at the endof second month (ARR = 0.16,95%CI: 0.05, 0.53) pre-dicted higher risk of unsuccessful outcome amongclinically diagnosed cases and having at least one spu-tum checkup after diagnosis (ARR = 0.17, 95%CI:0.09,0.33) predicted higher risk of unsuccessful outcomesamong smear positive cases. Analysis of treatmentoutcomes among HIV negatives showed initiatedtreatment after 30 days of onset (ARR = 2.52,95%CI:1.55, 4.10), weight gain at the end of second monthtreatment (ARR = 0.27,95%CI:0.12, 0.64) and treatmentcenter being hospital (ARR = 2.33,95%CI:1.33, 4.09)independently predicted unsuccessful treatment out-come (Additional file 1: Tables S1-S3).
DiscussionThis follow-up study revealed patients elapse too longtime (median of 55 days) to initiate anti-TB treatmentsince onset of the illness. Subsequently, we found statis-tically significant differences in treatment success (94.2%vs 88.4%) respectively among those who initiated treat-ment within and beyond 55 days of onset. Those pa-tients initiated anti-TB treatment beyond 30 days ofonset had higher risk of unsuccessful outcomes includ-ing death, lost to follow up and treatment failure. Pa-tients initiated treatment within and beyond 30 days ofonset had undergone significantly diverse healthcareseeking practices, patient and provider delays. However,both groups of patients had no significant differences insputum smear conversion and weight changes at end ofsecond month treatment. The longer delays to initiatetreatment accompanied by higher risk of unsuccessfuloutcomes depict increased morbidity and mortality topatients and prolonged period of transmission to thecommunity. The finding suggests need for prompt
Table 3 Follow-up characteristics and outcomes across delays to treatment southwest Ethiopia January 2015 to june 2016
Variable Total delay(days)
> 30(exposed) N = 574 <=30 (non exposed) N = 161 Total
n(%) n(%) P value n(%)
Sputum smear end of 2ndmonth(n = 373) Positive 3(1.1) 3(3.0) 0.5 6(1.6)
Negative 158(57.9) 67(67.0) 225(60.3)
Not available 112(41.0) 30(30.0) 142(38.1)
Sputum smear end of 5th month(n = 373) Positive 4(1.5) 1(1.0) 0.4 5(1.3)
Negative 137(50.1) 58(58.0) 195(52.3)
Not available 132(48.4) 41(41.0) 173(46.4)
Sputum smear end of 6th month(n = 373) Negative 127(46.5) 51(51.0) 0.3 178(47.7)
Not available 146(53.5) 49(49) 195(52.3)
Sputum check up after diagnosis(n = 373) None 112 (41.0) 30(30.0) 0.3 142(38.1)
At least once 161(59.0) 70(70.0) 231(61.9)
Weight end of 2ndmonth Mean(SD) 51.2(8.6) 50.2(8.6) 0.9 51.3(8.6)
Weight change end of 2nd month Unchanged/lost 93(16.2) 30(18.6) 0.2 123(16.7)
Gained 298(52.0) 80(49.7) 378(51.5)
Unknown 183(31.8) 51(31.7) 234(31.8)
Weight end of 5thmonth Mean(SD) 54.2(8.7) 51.8(9.5) 0.5 53.6(8.9)
Weight end of 6th month Mean(SD) 54.2(10.3) 52.9(9.0) 0.1 53.9(9.9)
Treatment out come Cured 126(21.9) 51(31.7) 0.04 177(24.2)
Treatment complete 354(61.5) 96(59.6) 450(61.1)
Loss to follow-up 33(5.7) 5(3.1) 38(5.2)
Died 26(4.5) 3(1.9) 29(3.9)
Treatment failure 4(0.7) 1(0.6) 5(0.7)
Not evaluateda 31(5.4) 5(3.1) 36(4.9)
Treatment success (n = 699) Unsuccessful 63(11.6) 9(5.8) 0.01 72(10.3)
Successful 480(88.4) 147(94.2) 627(89.7)acases transferred out to other treatment centers
Asres et al. BMC Pulmonary Medicine (2018) 18:64 Page 7 of 11
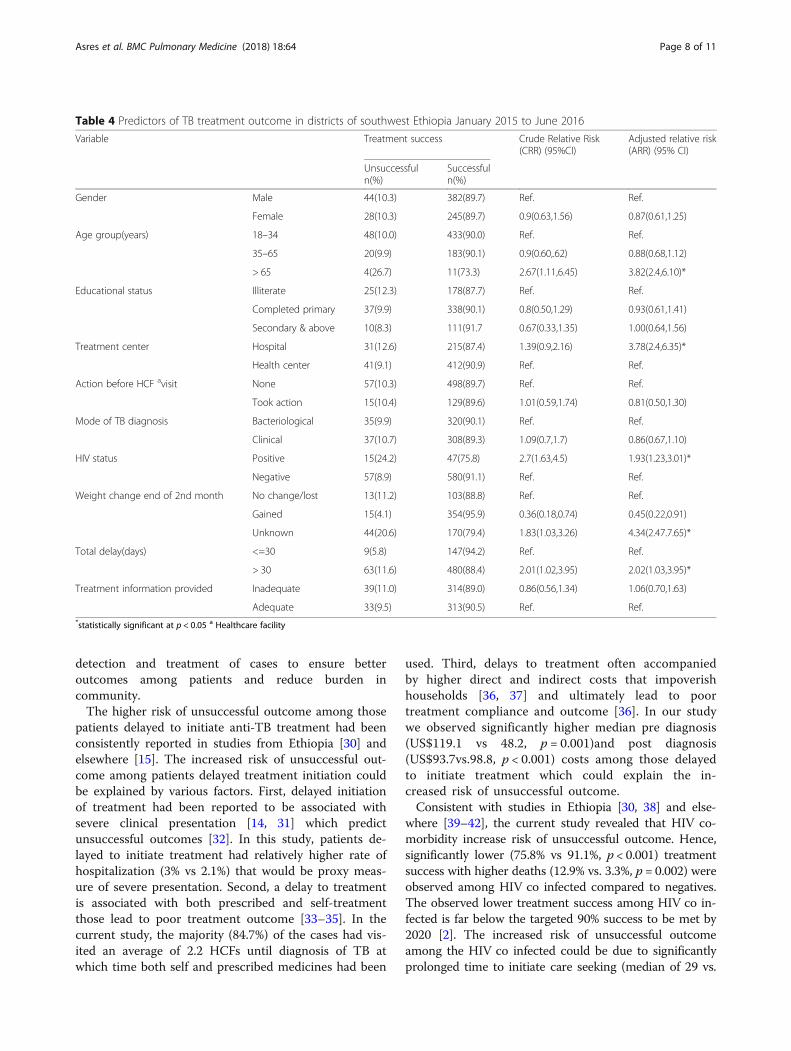
detection and treatment of cases to ensure betteroutcomes among patients and reduce burden incommunity.The higher risk of unsuccessful outcome among those
patients delayed to initiate anti-TB treatment had beenconsistently reported in studies from Ethiopia [30] andelsewhere [15]. The increased risk of unsuccessful out-come among patients delayed treatment initiation couldbe explained by various factors. First, delayed initiationof treatment had been reported to be associated withsevere clinical presentation [14, 31] which predictunsuccessful outcomes [32]. In this study, patients de-layed to initiate treatment had relatively higher rate ofhospitalization (3% vs 2.1%) that would be proxy meas-ure of severe presentation. Second, a delay to treatmentis associated with both prescribed and self-treatmentthose lead to poor treatment outcome [33–35]. In thecurrent study, the majority (84.7%) of the cases had vis-ited an average of 2.2 HCFs until diagnosis of TB atwhich time both self and prescribed medicines had been
used. Third, delays to treatment often accompaniedby higher direct and indirect costs that impoverishhouseholds [36, 37] and ultimately lead to poortreatment compliance and outcome [36]. In our studywe observed significantly higher median pre diagnosis(US$119.1 vs 48.2, p = 0.001)and post diagnosis(US$93.7vs.98.8, p < 0.001) costs among those delayedto initiate treatment which could explain the in-creased risk of unsuccessful outcome.Consistent with studies in Ethiopia [30, 38] and else-
where [39–42], the current study revealed that HIV co-morbidity increase risk of unsuccessful outcome. Hence,significantly lower (75.8% vs 91.1%, p < 0.001) treatmentsuccess with higher deaths (12.9% vs. 3.3%, p = 0.002) wereobserved among HIV co infected compared to negatives.The observed lower treatment success among HIV co in-fected is far below the targeted 90% success to be met by2020 [2]. The increased risk of unsuccessful outcomeamong the HIV co infected could be due to significantlyprolonged time to initiate care seeking (median of 29 vs.
Table 4 Predictors of TB treatment outcome in districts of southwest Ethiopia January 2015 to June 2016
Variable Treatment success Crude Relative Risk(CRR) (95%CI)
Adjusted relative risk(ARR) (95% CI)
Unsuccessfuln(%)
Successfuln(%)
Gender Male 44(10.3) 382(89.7) Ref. Ref.
Female 28(10.3) 245(89.7) 0.9(0.63,1.56) 0.87(0.61,1.25)
Age group(years) 18–34 48(10.0) 433(90.0) Ref. Ref.
35–65 20(9.9) 183(90.1) 0.9(0.60,.62) 0.88(0.68,1.12)
> 65 4(26.7) 11(73.3) 2.67(1.11,6.45) 3.82(2.4,6.10)*
Educational status Illiterate 25(12.3) 178(87.7) Ref. Ref.
Completed primary 37(9.9) 338(90.1) 0.8(0.50,1.29) 0.93(0.61,1.41)
Secondary & above 10(8.3) 111(91.7 0.67(0.33,1.35) 1.00(0.64,1.56)
Treatment center Hospital 31(12.6) 215(87.4) 1.39(0.9,2.16) 3.78(2.4,6.35)*
Health center 41(9.1) 412(90.9) Ref. Ref.
Action before HCF avisit None 57(10.3) 498(89.7) Ref. Ref.
Took action 15(10.4) 129(89.6) 1.01(0.59,1.74) 0.81(0.50,1.30)
Mode of TB diagnosis Bacteriological 35(9.9) 320(90.1) Ref. Ref.
Clinical 37(10.7) 308(89.3) 1.09(0.7,1.7) 0.86(0.67,1.10)
HIV status Positive 15(24.2) 47(75.8) 2.7(1.63,4.5) 1.93(1.23,3.01)*
Negative 57(8.9) 580(91.1) Ref. Ref.
Weight change end of 2nd month No change/lost 13(11.2) 103(88.8) Ref. Ref.
Gained 15(4.1) 354(95.9) 0.36(0.18,0.74) 0.45(0.22,0.91)
Unknown 44(20.6) 170(79.4) 1.83(1.03,3.26) 4.34(2.47.7.65)*
Total delay(days) <=30 9(5.8) 147(94.2) Ref. Ref.
> 30 63(11.6) 480(88.4) 2.01(1.02,3.95) 2.02(1.03,3.95)*
Treatment information provided Inadequate 39(11.0) 314(89.0) 0.86(0.56,1.34) 1.06(0.70,1.63)
Adequate 33(9.5) 313(90.5) Ref. Ref.*statistically significant at p < 0.05 a Healthcare facility
Asres et al. BMC Pulmonary Medicine (2018) 18:64 Page 8 of 11
24 days, P = 0.04) among HIV co infected patients. ThusHIV co morbidity had been reported to delay anti-TBtreatment initiation [13, 43]that explain the high mortalityamong HIV co infected TB patients [16, 17]. In addition,HIV co infection independently increases risk of unsuc-cessful outcome due the complex and overlapping druginteractions and toxicities and TB-associated immune re-constitution inflammatory syndrome [44]. Furthermorethe increased risk could also be explained by the low up-take of TB/HIV collaborative interventions (39.7% and 47.1% on ART and CPT, respectively) those proved to bringbetter outcome [45]and predict worse outcome in theirabsence [40].We found patients took anti-TB treatment at hospital
had higher risk of unsuccessful outcome compared to thosetreated at health center. This could be due to significantlyhigher proportion of delays to initiate anti-TB treatment(55.6% Vs46.3%, p = 0.02), HIV co infection (14.3% Vs 6.4%,p < 0.001) and hospitalization (5.3% Vs 1.1%, p = 0.001)among patients treated at hospitals. Studies reported HIVco infection [39, 40], hospitalization [32] and delays totreatment [15, 30] to predict higher risk of unsuccessfuloutcomes. Moreover, patients treated at hospitals weremore of pulmonary negative (36.5% vs 24.7%, p < 0.001)and extra pulmonary (21.8% vs 19.4%, p < 0.001) those hadbeen reported to predict unsuccessful outcome [46].Regular monitoring of TB patients during treatment is
among standard of TB care, which is used to assess re-sponse to therapy and facilitates treatment completion.Accordingly regular sputum and weight monitoring havebeen recommended TB patients on treatment [47]. Des-pite low sensitivity and modest specificity of sputum re-sults at the end of intensive phase to predict failure andrelapse [48], sputum conversion to negative among thosepositive at initiation of treatment had been taken as oneof the indicator TB control program performance [47].In the current study no significant differences was ob-served in sputum smear conversion at end of secondmonth treatment in both patients initiated treatmentwithin and beyond 30 days of onset. Consistent withstudies in Ethiopia [46]and elsewhere [49] smear conver-sion to negative at the end of second month treatmenthad lower risk of unsuccessful outcome. In this study, 3/6(50%) of those treatment failure cases had positivesmear at the end of second month treatment. The higherrisk among those positives could be due to possible poorquality of initial therapy and co morbid conditions thatinterfere with adherence or response [47]. Similarly,weight gain at the end of second month treatment pre-dicted lower risk of unsuccessful outcomes which is inline with reports from Vietnam [50].This study has some limitations. First, exposure assess-
ment relied upon patient recall of the onset of illnessthat might be subjected to recall bias and ultimate
misclassification bias. But efforts had been made tominimize the bias through use of local and nationalevent listing. The second limitation was inability tomeasure treatment adherence that could have effect ontreatment outcome. Third, we did not test for drugsusceptibility so that we could not associate delay withresistance. Lastly, we studied only new adult TB cases sothat the findings will not apply to all TB cases. On theother hand, relatively large sample and geographiccoverage, reduced selection bias through consecutiveenrolment, being prospective design, direct estimation ofrisk and use of standard outcome ascertainment couldbe mentioned as strength of the study. Therefore, thestudy is valid and applies to new TB cases in similarsettings.
ConclusionTB patients in the study area elapse too long time to ini-tiate anti-TB treatment. The delayed treatment initiationwas associated with higher risk of unsuccessful outcomeincluding death, treatment failure and lost to follow-up.Apart from the delayed treatment, HIV co infection,treatment center being hospital, weight change and spu-tum conversion at the end of second month treatmentindependently predicted unsuccessful outcomes. There-fore, promotion of early care seeking within community,improving diagnostic, and case holding efficiencies ofHCF and TB/HIV collaborative interventions could en-hance the TB treatment success. Time delays to TBdiagnosis can be reduced by raising community levelawareness on TB suggestive symptoms, involving trad-itional healer, religious and private healthcare institu-tions in TB case finding, equipping healthcare facilitieswith rapid diagnostic tests and building capacities ofhealthcare providers to suspect and diagnose TB.
Additional file
Additional file 1: Table S1. Predictors of unsuccessful outcomesamong new smear positive pulmonary TB cases in districts southwestEthiopia January 2015 to June 2016 (n = 355). Table S2 Predictors ofunsuccessful outcomes among new clinically diagnosed TB cases indistricts southwest Ethiopia January 2015 to June 2016 (n = 344). Table S3Predictors of unsuccessful outcomes among not HIV coinfected TB casesin districts of southwest Ethiopia January 2015 to June 2016.(DOCX 20 kb)
AbbreviationsARR: Adjusted relative risk; ART: Antiretroviral therapy; CI: Confidence Interval;CPT: Cotrimoxazole prophylactic therapy; DOTS: Directly Observed TreatmentShort course; HCF: Healthcare Facility; HIV: Human Immunodeficiency Virus;IQR: Inter-quartile Range; SD: Standard deviation; TB: Tuberculosis;US$: United States dollar
AcknowledgementsWe are indebted to the data collectors, supervisors, study participants, andstaffs of the study districts and health facilities for their cooperation andsupports for realization of the study.
Asres et al. BMC Pulmonary Medicine (2018) 18:64 Page 9 of 11

FundingFinancial and material support was obtained from Addis Ababa and Mizan-TepiUniversities based in Ethiopia. The funders did not have role in data collection,analysis, write up and publication of the manuscript.
Availability of data and materialsThe datasets used and/or analyzed during the current study are available fromthe corresponding author on reasonable request.
Authors’ contributionsAA conceived and designed the study, collected and analyzed data, preparedmanuscript:WD and DJ critically reviewed for intellectual content of the study protocoland manuscript as primary and co-supervisors respectively. All authorsapproved the final version of the manuscript for submission.
Ethics approval and consent to participateThe study was ethically approved by Institutional Review Board (IRB) of theCollege of Health Sciences at Addis Ababa University (protocol number: 045/14/sph). Written informed consent was sought from each study participantbefore the interview. Patient clinical profile from records and unit registerwas retrieved upon permission from respective health care facilities.
Competing interestsThe authors declare that they have no competing interests.
Publisher’s NoteSpringer Nature remains neutral with regard to jurisdictional claims in publishedmaps and institutional affiliations.
Author details1Department of Public Health, College of Health Sciences, Mizan TepiUniversity, Mizan Aman, Ethiopia. 2Management Science for Health, AddisAbaba, Ethiopia. 3Department of Preventive Medicine, School of PublicHealth, College of Health Sciences, Addis Ababa University, Addis Ababa,Ethiopia.
Received: 8 February 2018 Accepted: 23 April 2018
References1. World Health Organization. Global Tuberculosis report. Switzerland: World
Health Organization; 2016.2. World Health Organization. The end TB strategy: global strategy and targets
for tuberculosis prevention, care and control after 2015. Geneva: WHO;2015.
3. Federal Minstry of Health of Ethiopia. Tuberculosis, leprosy and TB/HIVprevention and control Programme manual. 4th ed. Addis Ababa: Ministryof Health of Ethiopia; 2008.
4. Federal Democratic Republic of Ethiopia Minstry of Health. Health andhealth related indicators. Addis Ababa: Federal Democratic Republic ofEthiopia Minstry of Health; 2016.
5. Federal Minstry of Health of Ethiopia. First Ethiopian National PopulationBased Tuberculosis Prevalence Survey. Addis Ababa: Federal Ministry ofHealth Ethiopia; 2011.
6. Federal Republic of Ethiopia Ministry of Health. Annual performance report.Addis Ababa: Federal Repubilic of Ethiopia Minstry of Health; 2016.
7. Arandottir T. Tuberculosis and public health: policy and principles oftuberculosis control. Paris: International Union Against Tuberculosis andLung Disease; 2009.
8. Mesfin M, Newel J, Walley J, Gessessew A, Madeley R. Delayed consultationamong pulmonary tuberculosis patients: a cross sectional study of 10 DOTSdistricts of Ethiopia. BMC Public Health. 2009;9:53.
9. Yimer S, Bjune G, Alene G. Diagnostic and treatment delay amongpulmonary tuberculosis patients in Ethiopia: a cross sectional study. BMCInfect Dis. 2005;5:112.
10. Hussen A, Biadgilign S, Tessema F, Mohammed S, Deribe K, Deribew A.Treatment delay among pulmonary tuberculosis patients in pastoralistcommunities in bale zone, Southeast Ethiopia. BMC Res Notes. 2012;5:320.
11. Demissie M, Lindtjorn B, Berhane Y. Patient and health service delay inthe diagnosis of pulmonary tuberculosis in Ethiopia. BMC Public Health.2002;2:23.
12. Ford C, Bayer A, Gilman R, Onifade D, Acosta C, Cabrera L, Vidal C,Evans C. Factors associated with delayed tuberculosis test-seekingbehavior in the Peruvian Amazon. Am J Trop Med Hyg. 2009;81(6):1097–102.
13. Finnie R, Khoza L, Van den Borne B, Mabunda T, Abotchie P, Mullen P.Factors associated with patient and health care system delay in diagnosisand treatment for TB in sub-Saharan African countries with high burdens ofTB and HIV. Tropical Med Int Health. 2011;16(4):394–411.
14. Virenfeldt J, Rudolf F, Camara C, Furtado A, Gomes V, Aaby P, Petersen E,Wejse C. Treatment delay affects clinical severity of tuberculosis: alongitudinal cohort study. BMJ Open. 2014;4(6):e004818.
15. Jianzhao H, Van den Hof S, Lin X, Yubang Q, Jinglong H, Van der Werf M.Risk factors for non-cure among new sputum smear positive tuberculosispatients treated in tuberculosis dispensaries in Yunnan, China. BMC HealthServ Res. 2011;11:97.
16. Lusignani L, Quaglio G, Atzori A, Nsuka J, Grainger R, Da Conceiçao PalmaM, Putoto G, Manenti F. Factors associated with patient and health caresystem delay in diagnosis for tuberculosis in the province of Luanda,Angola. BMC Infect Dis. 2013;13:168.
17. Kiwuwa M, Charles K, Harriet M. Patient and health service delay inpulmonary tuberculosis patients attending a referral hospital: a cross-sectional study. BMC Public Health. 2005;5:122.
18. Mor Z, Kolb H, Lidji M, Migliori G, Leventhal A. Tuberculosis diagnostic delayand therapy outcomes of non-national migrants in Tel Aviv, 1998-2008.Euro Surveill. 2013;18(12):43–50.
19. World Health Organization: An expanded DOTS framework for effectivetuberculosis control. 2002.
20. Tessema B, Muche A, Bekele A, Reissig D, Emmrich F, Sack U. Treatmentoutcome of tuberculosis patients at Gondar University teaching hospital,Northwest Ethiopia. A five - year retrospective study. BMC Public Health.2009;9:371.
21. Getahun B, Ameni G, Medhin G, Biadgilign S. Mortality and associated riskfactors in a cohort of tuberculosis patients treated under DOTS programmein Addis Ababa, Ethiopia. BMC Infect Dis. 2011;11:127.
22. Berhe G, Enquselassie F, Aseffa A. Treatment outcome of smear-positivepulmonary tuberculosis patients in Tigray Region,Northern Ethiopia. BMCPublic Health. 2012;12:537.
23. Shaweno D, Worku A. Tuberculosis treatment survival of HIV positive TBpatients on directly observed treatment short-course in southern Ethiopia: aretrospective cohort study. BMC Research Notes. 2012;5:682.
24. Federal Democratic Republic of Ethiopia Central Statistical Agency.Population projection of Ethiopia for all regions at Wereda level from 2014–2017. Addis Ababa: Central Statistical Authority; 2013.
25. Southern Nation Nationalities Peoples Region Health Bureau. Annualperformance report in. Hawassa: SNNPR HB; 2014.
26. Federal Minstry of Health of Ethiopia. Guidelines for clinical andprogrammatic management of TB, leprosy and TB/HIV in Ethiopia in. 5th ed.Addis Ababa: Ethiopian Federal Minstry of Health; 2012.
27. Federal Minstry of Health of Ethiopia. Annual performance report. In:Health sector development programme iv. Addis Ababa: Federal Minstryof Health. p. 2011.
28. Soliman S, Nasehi M, Nassir A, Agboatwala M, Abdilai A, Maamary F, Al-AbsiN. Diagnostic and treatment delay in tuberculosis:an in-depth analysis ofthe health-seeking behaviour of patients and health system response inseven countries of the eastern Mediterranean region. Egypt: WHO; 2006.
29. World Health Organization. Definitions and reporting framework fortuberculosis – 2013 revision. Switzerland: WHO Library Cataloguing-in-Publication Data; 2013.
30. Gebreegziabher B, Bjune G, Yimer S. Total delay is associated withunfavorable treatment outcome among pulmonary tuberculosis patients inwest Gojjam zone, Northwest Ethiopia: a prospective cohort study. PLoSOne. 2016;11(7):e0159579.
31. Cheng S, Chen W, Yang Y, Chu P, Liu X, Zhao M, Tan W, Xu L, Wu Q, GuanH, et al. Effect of diagnostic and treatment delay on the risk of tuberculosistransmission in Shenzhen, China: an observational cohort study, 1993-2010.PLoS One. 2013;8(6):e67516.
32. Sacks L, Pendle S. Factors related to in-hospital deaths in patients withtuberculosis. Arch Intern Med. 1998;158(17):1916–22.
Asres et al. BMC Pulmonary Medicine (2018) 18:64 Page 10 of 11
33. Wang J, Hsueh P, Jan I, Lee L, Liaw Y, Yang P, Luh K. Empiricaltreatment with a fluoroquinolone delays the treatment for tuberculosisand is associated with a poor prognosis in endemic areas. Thorax.2006;61(10):903–8.
34. Chen TC, Lu PL, Lin CY, Lin WR, Chen YH. Fluoroquinolones are associatedwith delayed treatment and resistance in tuberculosis: a systematic reviewand meta-analysis. Int J Infect Dis. 2011;15(3):211–6.
35. Rabin A, Kuchukhidze G, Sanikidze E, Kempker R, Blumberg H. Prescribedand self-medication use increase delays in diagnosis of tuberculosis in thecountry of Georgia. Int J Tuberc Lung Dis. 2013;17(2):214–20.
36. Wingfield T, Tovar M, Huff D, Boccia D, Saunders M, Datta S, Montoya R,Ramos E, Lewis J, Gilman R, et al. Beyond pills and tests: addressing thesocial determinants of tuberculosis. Clin Med. 2016;16(Suppl 6):s79–91.
37. Mesfin M, Newell J, Madeley R, Mirzoev T, Tareke I, Kifle Y, Gessessew A,Walley J. Cost implications of delays to tuberculosis diagnosis amongpulmonary tuberculosis patients in Ethiopia. BMC Public Health. 2010;10:173.
38. Asres A, Jerene D, Deressa W. Tuberculosis treatment outcomes of six andeight month treatment regimens in districts of southwestern Ethiopia: acomparative cross-sectional study. BMC Infect Dis. 2016;16(1):653.
39. Karo B, Krause G, Hollo V, Van der Werf M, Castell S, Hamouda O, Haas W.Impact of HIV infection on treatment outcome of tuberculosis in Europe.AIDS. 2016;30(7):1089–98.
40. Nglazi M, Bekker L-G, Wood R, Kaplan R. The impact of HIV status andantiretroviral treatment on TB treatment outcomes of new tuberculosispatients attending co-located TB and ART services in South Africa: aretrospective cohort study. BMC Infect Dis. 2015;15:536.
41. Heunis C, Kigozi G, Chikobvu P, Botha S, van Rensburg HD. Risk factors formortality in TB patients: a 10-year electronic record review in a southAfrican province. BMC Public Health. 2017;17(1):38.
42. Sanchez M, Bartholomay P, Arakaki-Sanchez D, Enarson D, Bissell K, BarreiraD, Harries A, Kritski A. Outcomes of TB treatment by HIV status in NationalRecording Systems in Brazil, 2003–2008. PLoS One. 2012;7(3):e33129.
43. de Albuquerque M, Ximenes R, Lucena-Silva N, de Souza W, Dantas AT,Dantas O, Rodrigues L. Factors associated with treatment failure, dropout,and death in a cohort of tuberculosis patients in Recife, Pernambuco state,Brazil. Cad Saude Publica. 2007;23(7):1573–82.
44. Shankar E, Vignesh R, Ellegard R, Barathan M, Chong Y, Bador M, Rukumani D,Sabet N, Kamarulzaman A, Velu V, et al. HIV-mycobacterium tuberculosis co-infection: A ‘danger-couple model’ of disease pathogenesis. Pathog Dis. 2013;70(2):110–8.
45. Kigozi G, Heunis C, Chikobvu P, Botha S, van Rensburg D. Factorsinfluencing treatment default among tuberculosis patients in a high burdenprovince of South Africa. Int J Infect Dis. 2017;54:95–102.
46. Munoz-Sellart M, Cuevas L, Tumato M, Merid Y, Yassin M. Factors associatedwith poor tuberculosis treatment outcome in the southern region ofEthiopia. Int J Tuberc Lung Dis. 2010;14(8):973–9.
47. World Health Organization. Treatment of tuberculosis: guidelines. Geneva:World Health Organization; 2010.
48. Horne D, Royce S, Gooze L, Narita M, Hopewell P, Nahid P, Steingart K.Sputum monitoring during tuberculosis treatment for predicting outcome:a systematic review and meta-analysis. Lancet Infect Dis. 2010;10(6):387–94.
49. Djouma FN, Noubom M, Ateudjieu J, Donfack H. Delay in sputum smearconversion and outcomes of smear-positive tuberculosis patients: a retrospectivecohort study in Bafoussam, Cameroon. BMC Infect Dis. 2015;15:139.
50. Hoa N, Lauritsen J, Rieder H. Changes in body weight and tuberculosistreatment outcome in Viet Nam. Int J Tuberc Lung Dis. 2013;17(1):61–6.
Asres et al. BMC Pulmonary Medicine (2018) 18:64 Page 11 of 11
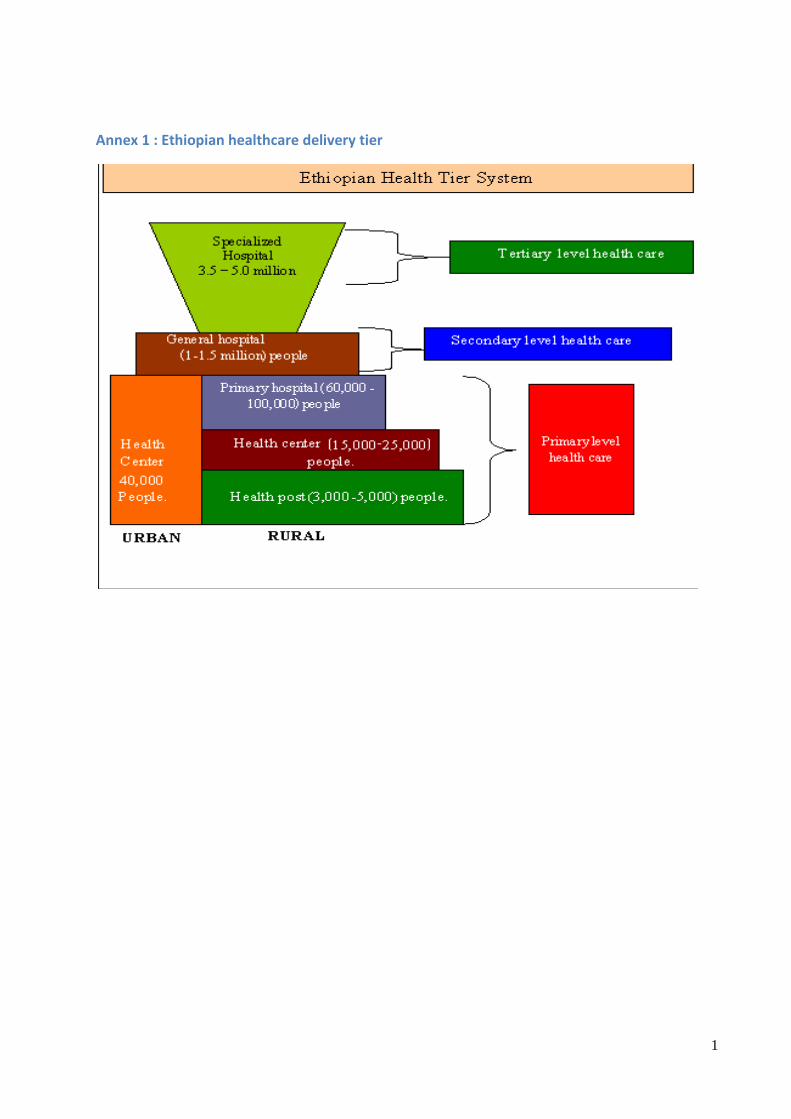
1
Annex 1 : Ethiopian healthcare delivery tier
2
Annex 2: English version information sheet, consent form and questionnaire
Title of the project: Tuberculosis treatment delays, cost and outcomes in districts of
southwestern Ethiopia
Principal Investigator: Abyot Asres
Primary supervisor: Wakgari Deressa (PhD, Associate Professor)
Secondary supervisor: Degu Jerene (MD, PhD)
Coordinating office: Addis Ababa University, School of Public Health
Introduction: Tuberculosis (TB) is an infectious disease that poses varieties of burden on
patients, public and the economy. Consequently, global efforts to alleviate the overlapping
humanitarian, public health, and economic dimensions have been devised and adopted across the
nations. Thus, prompt diagnosis and proper treatment that ultimately cure patients and reduce
transmission in the community is the corner stone in the prevention and control of TB. However
long delays in seeking care and diagnoses have been reported in Ethiopia and elsewhere for
which comprehensive evidences on the barriers are lacking. Hence evidences on the barriers,
economic burdens and subsequent effect on treatment outcomes of the delay is highly required to
enable the current control strategies envisioned to eliminate TB.
Purpose: The aim of this study is to investigate the patient and health facility barriers of early
care seeking for TB illness, the effects of longer delay on treatment outcomes, and the direct and
indirect cost of TB care seeking and treatment. This research undertaking is a Doctoral degree in
public health partial fulfillment dissertation.
Procedure and participation: The method of the research involves cross-sectional and
prospective cohort studies so that you will be asked at four different times throughout your
treatment period including this interview. Your particular participation is affirmed by probability
sampling technique which was carried out on the basis of chance and the interview will take
about 30minutes. You will be asked to participate in this research because the trustful
information, which you will provide, is important for the understanding of the proposed subject
matter. You will be asked about your socio-demographic, socioeconomic, income and
expenditure, care-seeking practices about your current illness, current treatment, and cost you

3
incurred for seeking care and treatment and other related questions that are very important for the
fulfillment of the research.
Confidentiality: The information you provide will be kept confidential so that any of your
personal identifications including name or phone numbers will not be recorded. Rather codes
will be assigned to your data for processing. Moreover, the original data will be locked in
cabinets until processing and no person other than the principal investigator and supervisors’
access. The use of information for any purpose other than that to which participants consented is
unethical so that your income and expenditure data will not be disclosed to tax administrator or
anyone else for tax purpose. The information you provide will not be disclosed in a way it
identified your personal characteristics and privacy rather aggregate findings will be reported.
Particularly, s and Finally all the data you provide will be incinerated in secure manner upon
finalizing the research work and public defense that will be due when approved by the school of
public health academic commission and university senate.
Benefit: The research does not have a short term financial, health care and capacity building
benefit to the research participant as an individual or as a group. However in the long run,
different stakeholders will use the evidence for designing strategies that alleviate burden posed
by TB on TB patients, household and health system. Subsequently, control and ultimate
elimination of the TB disease will be realized that will benefit all peoples across world. On the
other hand, information related to the TB disease and its treatment will be provided for the
participants while gathering the data.
Risk: The proposed research does not have any inhumane treatment of research participants and
any physical harm, social discrimination, psychological trauma and economic loss. Your
participation or not in the study will not interrupt or affect in any way the treatment you are
currently receiving.
Inducement, incentive and Compensation: This study process has not any form of inducement,
coercion and the study does not bring any risks that incur compensation.
Results dissemination: The researcher is responsible for dissemination of findings and fully
accountable to provide feedback to the concerned health departments and districts in the area.
Besides, presentations at national and international scientific conferences and publication in
reputable scientific journal of the findings will be attempted.
4
Freedom to withdraw: If you don’t want to participate in the study, you have full right to with
draw from the study any time you wish. This would have no effect at all on your health benefit or
other administrative effect that you get from the health facilities and nobody will enforce you to
explain the reason of withdrawal.
Person to Contact: The participant has the right to ask information that is not clear about the
research context and content before and/or during the research work. You can contact the
principal investigator and supervisors via the addresses provided below. Since this research has
undergone ethical review and approval by Addis Ababa University College of Health Sciences
IRB that is responsible for ensuring adherence of ethical principles to avoid harm on participants,
you can also contact the board.
If you want more information about the project, you can contact the following;
Addis Ababa University College of Health Sciences IRB Secretary
Office Tel. 0115512876
Principal Investigator:
Abyot Asres , Mizan Tepi University ,Mob: +251 911905554 ,E-mail: [email protected]
Supervisors: Wakgari Deressa (PhD, Associate prof.)
Cell phone: +251 911483714
School of Public Health, College of Health Science, Addis Ababa University
Degu Jerene (MD, PhD), Cell phone: +251 911546407

5
Annex 1: Consent Form
My name is ____________________________. I am working with a research team from Addis
Ababa University. The purpose of the study is to assess delays in care seeking and treatment for
TB, the cost incurred for the care seeking that is helpful to design interventions for the delays
and financial burden posed by TB. We are interviewing systematically selected TB patients on
treatment about their care seeking practices, treatment practices, and cost incurred for care
seeking and treatment. I am going to ask you some questions regarding your sociodemographics,
care seeking practices, and cost incurred for the care seeking and treatment that are crucial for
the proposed research. Thus, your honest responses will enable design and implementation of
interventions that enhance control of the TB disease. Your responses will be completely
confidential which will be ensured by avoiding your name or other identifications in connection
with any of the information you tell me. You do not have to answer any question that you do not
want to answer, and you may end this interview at any time you wish. We would greatly
appreciate your help in responding to this survey.
Person to contact:
Principal Investigator:
Abyot Asres (Mizan Tepi University, Mob: +251911905554 E-mail: [email protected])
Supervisors: Dr. Wakgari Deressa (School of Public Health, College of Health Science, Addis
Ababa University, Cell phone: +251 911483714) and;
Dr. Degu Jerene (Cell phone: +251 911546407)
A. Are the information/ objectives clear?
1. Yes 2. No explain again
B. Would you be willing to participate?
1. Yes continue the interview
2. No Stop and go to the next patient
Thank him/her
C. Interviewer’s signature certifying that, the informed consent has been given by the
respondent
Name____________________ Signature _____________ Date_____________

6
Baseline Engilish version questionnaire
1.1. General information about questionnaire
1.2. Medical record review checklist
Medical record number
_________________
Date of recent visit:________________________
Duration of illness (dd,week,mm)
Chief complaint 1. Cough
2. Fever
3. Chest pain
4. Night sweating
5. Swelling over neck
6. Other specify-----------------------
Key physical findings 1. HEENT
2. LGS
3. Chest
4. CVS
5. Abdomen
6. Other specify-------------------------
Investigations requested
,their results and unit cost
Investigation Result Unit cost of the investigation
1. Sputum for AFB
2. Xpert MTB/RIF
3. CXR(chest x ray)
4. ESR
5. WBC
6. Other specify
Diagnosis/Assessement Diagnosis Date of diagnosis
1. TB
2. Pneumonia
Questionnaire ID
Name of Zone/ 1. Kaffa 2. Bench Maji 3. Sheka
Name of wereda 1. Bonga town
2. Decha
3. Chena
4. Mizan Aman
5. Shey Bench
6. North Bench
7. Meinet Goldiya
8. Tepi town
9. Yeki
10. Masha
Name of Health Facility
Type of Health facility 1. Hospital 2. Health center 3. Health post 4. Other (specify)------
Interviewee 1. Patient 2. Treatment supporter 3. Other specify------
Date of interview Follow-up visit schedule:
Name and signature of interviewer Name and signature of supervisor:
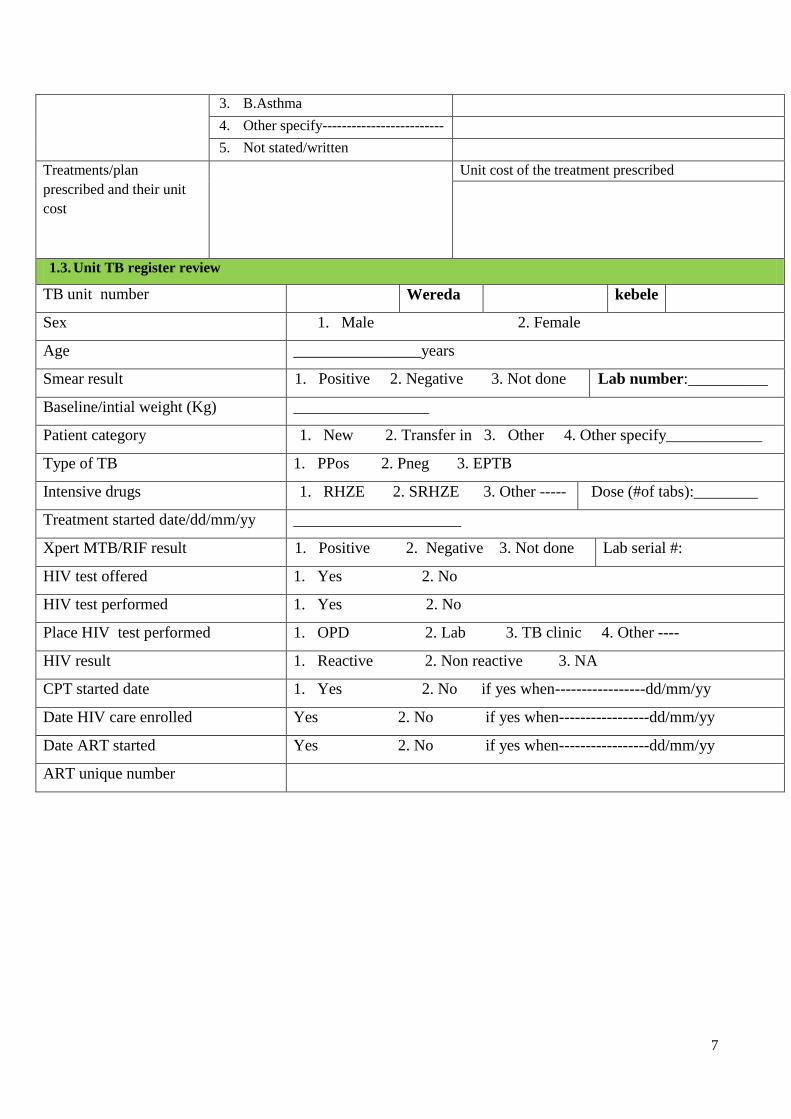
7
3. B.Asthma
4. Other specify-------------------------
5. Not stated/written
Treatments/plan
prescribed and their unit
cost
Unit cost of the treatment prescribed
1.3. Unit TB register review
TB unit number Wereda kebele
Sex 1. Male 2. Female
Age ________________years
Smear result 1. Positive 2. Negative 3. Not done Lab number:__________
Baseline/intial weight (Kg) _________________
Patient category 1. New 2. Transfer in 3. Other 4. Other specify____________
Type of TB 1. PPos 2. Pneg 3. EPTB
Intensive drugs 1. RHZE 2. SRHZE 3. Other ----- Dose (#of tabs):________
Treatment started date/dd/mm/yy _____________________
Xpert MTB/RIF result 1. Positive 2. Negative 3. Not done Lab serial #:
HIV test offered 1. Yes 2. No
HIV test performed 1. Yes 2. No
Place HIV test performed 1. OPD 2. Lab 3. TB clinic 4. Other ----
HIV result 1. Reactive 2. Non reactive 3. NA
CPT started date 1. Yes 2. No if yes when-----------------dd/mm/yy
Date HIV care enrolled Yes 2. No if yes when-----------------dd/mm/yy
Date ART started Yes 2. No if yes when-----------------dd/mm/yy
ART unique number

8
Part I; Patients’ general background information (socidemographic and Socioeconomic characteristics)
Q no Questions Options/responses Skip
101 Your usual residence 1. Urban
2. Rural (woreda-----kebele----
102 Your current marital status 1. Never married
2. Married
3. Widowed
4. Divorced/Separated
103 To which religion do you belong? 1. Orthodox Christian
2. Muslim
3. Catholic
4. Protestant Christian
5. Traditional
6. Other specify--------
104 To which ethnic group do you belong? 1. Kafficho
2. Bench
3. Shekacho
4. Sheko
5. Amhara
6. Tigire
7. Oromo
8. Meinit
9. Other (specify
105 What is your highest level of education
completed?
1. Never attended formal school
2. 1-4 (First cycle primary
3. 5-8 (2nd
cycle primary)
4. 9-10/12
5. Graduate/certificate (10+1/2/3 or 12+1/2/3/4)
6. Other (specify--------
106 What is your main occupation? 1. Government employee
2. Private employee
3. Self employed
4. Housemaid
5. House wife
6. Student
7. Farmer

9
8. Daily laborer
9. Merchant
10. Other (specify--
Part II. Care seeking practices and costs incurred for the illness until diagnosis of TB
201 When was the current illness you are being
treated started?
1. -------/---------/-------dd/mm/yy
2. I donot know/remember
202 What was/were your chief symptoms and date of
onset of the current illness?
Note for interviwer: More than one response
possible and check for that without reading
options
1. Cough (dd/mm/yy): [ ] [ ] [ ]
2. Fever (dd/mm/yy): [ ] [ ] [ ]
3. Loss of Weight:(dd/mm/yy): [ ] [ ] [ ]
4. Haemoptysis (dd/mm/yy): [ ] [ ] [ ]
5. Chest pain : (dd/mm/yy): [ ] [ ] [ ]
6. Others (specify) (dd/mm/yy): [ ] [ ] [ ]
203 Which symptom(s) made you seek care?
Note for interviwer: More than one response
possible and check for that without reading
options
1. Cough
2. Fever
3. Loss of Weight
4. Haemoptysis
5. Chest pain
6. Others (specify--------------------------------------
204 Where and when did you first seek care for the
complaints?
Action taken Date of visit/action
206
1. Self medication
2. Used traditional medicine
3. Used holly water
4. Consult HEW
5. Consult HCP at HF
6. Other (specify--------------)
205 Why did not you consult health facility first during
the onset of symptoms?
Note for interviwer: Health facility is to mean
private clinic or hospital, public health center,
or hospital or health post
More than one response possible and check
for that without reading options
1. Thought it was mild and relived by it self
2. Health facilities were too far
3. Facility do not provide the service
4. Too busy/long waiting time
5. Previous bad experiences
6. Fear of being diagnosed for TB
7. TB is common and cure by itself
8. Fear of HIV test
9. I don’t know service is provided there
10. I thought the cost is too expensive
11. Mistrust of health services provision
12. My belief system don’t allow
13. Other (specify)--------------------
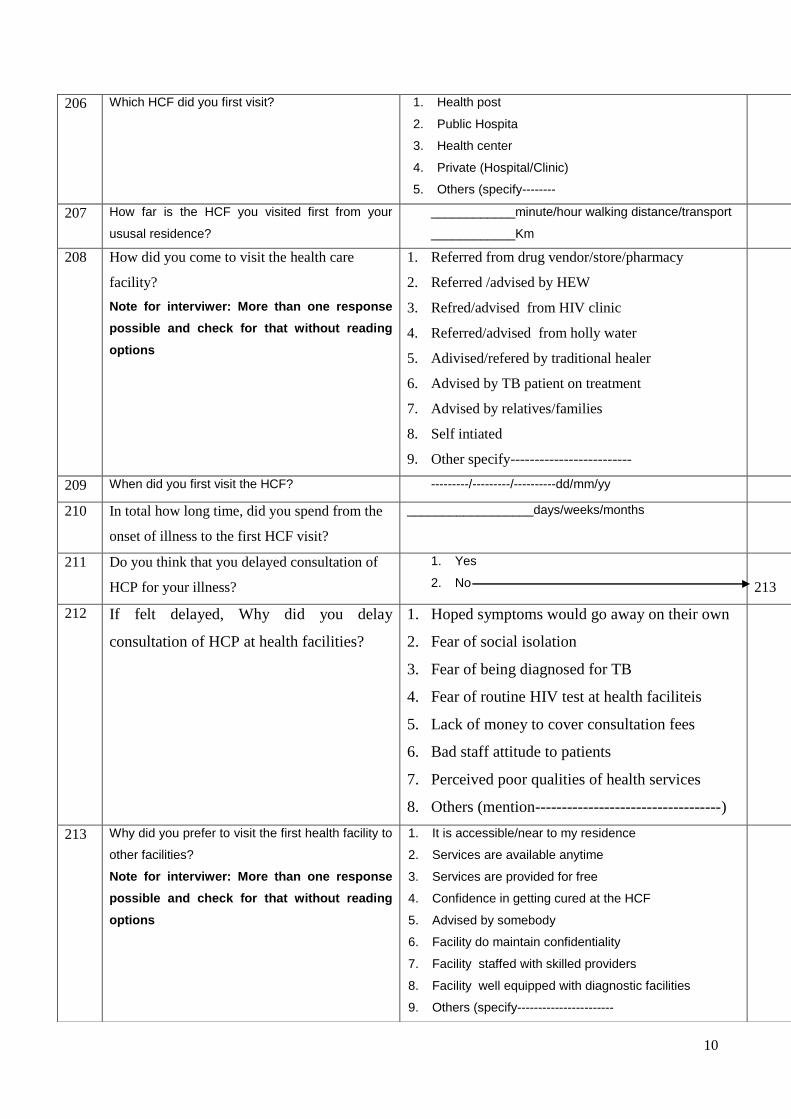
10
206 Which HCF did you first visit? 1. Health post
2. Public Hospita
3. Health center
4. Private (Hospital/Clinic)
5. Others (specify--------
207 How far is the HCF you visited first from your
ususal residence?
____________minute/hour walking distance/transport
____________Km
208 How did you come to visit the health care
facility?
Note for interviwer: More than one response
possible and check for that without reading
options
1. Referred from drug vendor/store/pharmacy
2. Referred /advised by HEW
3. Refred/advised from HIV clinic
4. Referred/advised from holly water
5. Adivised/refered by traditional healer
6. Advised by TB patient on treatment
7. Advised by relatives/families
8. Self intiated
9. Other specify-------------------------
209 When did you first visit the HCF? ---------/---------/----------dd/mm/yy
210 In total how long time, did you spend from the
onset of illness to the first HCF visit?
__________________days/weeks/months
211 Do you think that you delayed consultation of
HCP for your illness?
1. Yes
2. No
213
212 If felt delayed, Why did you delay
consultation of HCP at health facilities?
1. Hoped symptoms would go away on their own
2. Fear of social isolation
3. Fear of being diagnosed for TB
4. Fear of routine HIV test at health faciliteis
5. Lack of money to cover consultation fees
6. Bad staff attitude to patients
7. Perceived poor qualities of health services
8. Others (mention-----------------------------------)
213 Why did you prefer to visit the first health facility to
other facilities?
Note for interviwer: More than one response
possible and check for that without reading
options
1. It is accessible/near to my residence
2. Services are available anytime
3. Services are provided for free
4. Confidence in getting cured at the HCF
5. Advised by somebody
6. Facility do maintain confidentiality
7. Facility staffed with skilled providers
8. Facility well equipped with diagnostic facilities
9. Others (specify-----------------------
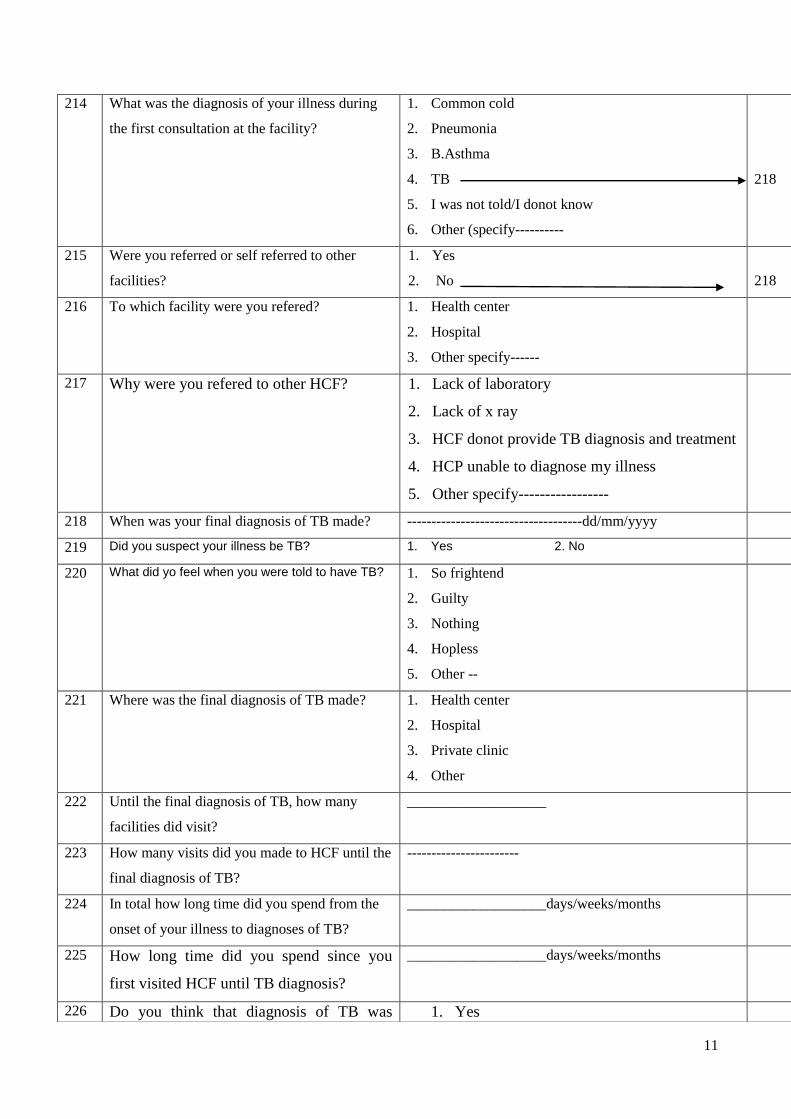
11
214 What was the diagnosis of your illness during
the first consultation at the facility?
1. Common cold
2. Pneumonia
3. B.Asthma
4. TB
5. I was not told/I donot know
6. Other (specify----------
218
215 Were you referred or self referred to other
facilities?
1. Yes
2. No
218
216 To which facility were you refered? 1. Health center
2. Hospital
3. Other specify------
217 Why were you refered to other HCF? 1. Lack of laboratory
2. Lack of x ray
3. HCF donot provide TB diagnosis and treatment
4. HCP unable to diagnose my illness
5. Other specify-----------------
218 When was your final diagnosis of TB made? ------------------------------------dd/mm/yyyy
219 Did you suspect your illness be TB? 1. Yes 2. No
220 What did yo feel when you were told to have TB? 1. So frightend
2. Guilty
3. Nothing
4. Hopless
5. Other --
221 Where was the final diagnosis of TB made? 1. Health center
2. Hospital
3. Private clinic
4. Other
222 Until the final diagnosis of TB, how many
facilities did visit?
___________________
223 How many visits did you made to HCF until the
final diagnosis of TB?
-----------------------
224 In total how long time did you spend from the
onset of your illness to diagnoses of TB?
___________________days/weeks/months
225 How long time did you spend since you
first visited HCF until TB diagnosis?
___________________days/weeks/months
226 Do you think that diagnosis of TB was 1. Yes
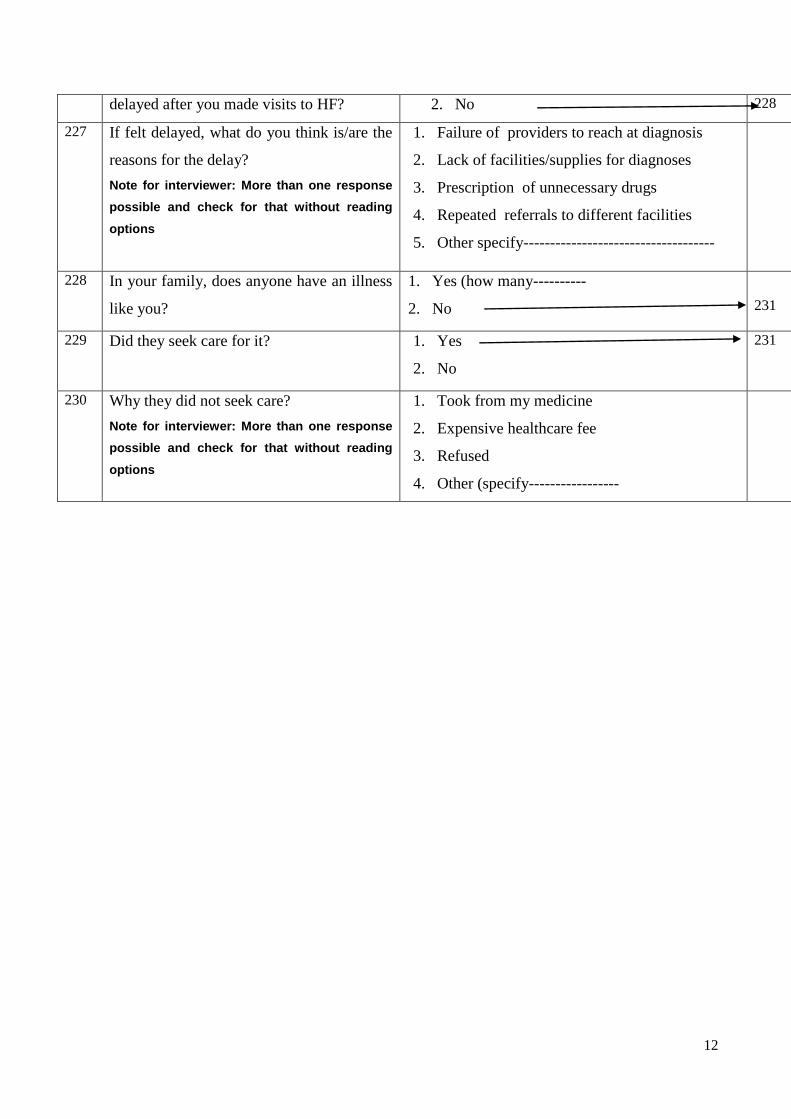
12
delayed after you made visits to HF? 2. No 228
227 If felt delayed, what do you think is/are the
reasons for the delay?
Note for interviewer: More than one response
possible and check for that without reading
options
1. Failure of providers to reach at diagnosis
2. Lack of facilities/supplies for diagnoses
3. Prescription of unnecessary drugs
4. Repeated referrals to different facilities
5. Other specify------------------------------------
228 In your family, does anyone have an illness
like you?
1. Yes (how many----------
2. No
231
229 Did they seek care for it? 1. Yes
2. No
231
230 Why they did not seek care?
Note for interviewer: More than one response
possible and check for that without reading
options
1. Took from my medicine
2. Expensive healthcare fee
3. Refused
4. Other (specify-----------------
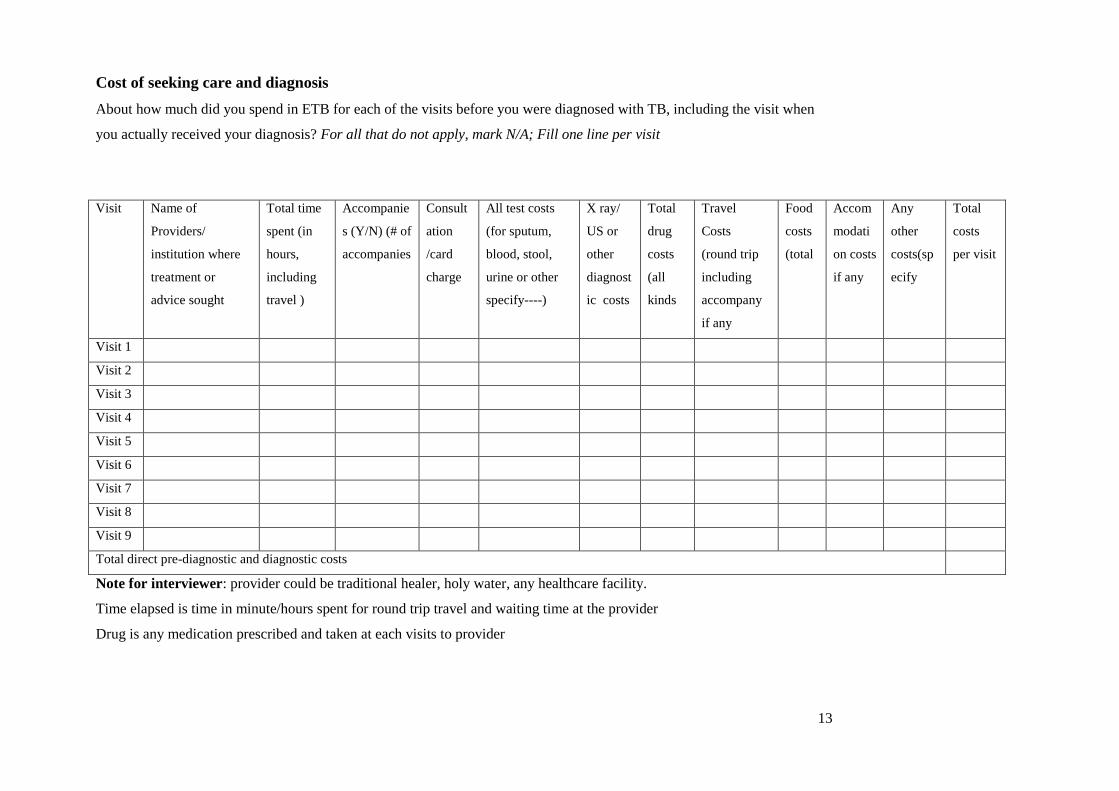
13
Cost of seeking care and diagnosis
About how much did you spend in ETB for each of the visits before you were diagnosed with TB, including the visit when
you actually received your diagnosis? For all that do not apply, mark N/A; Fill one line per visit
Note for interviewer: provider could be traditional healer, holy water, any healthcare facility.
Time elapsed is time in minute/hours spent for round trip travel and waiting time at the provider
Drug is any medication prescribed and taken at each visits to provider
Visit Name of
Providers/
institution where
treatment or
advice sought
Total time
spent (in
hours,
including
travel )
Accompanie
s (Y/N) (# of
accompanies
Consult
ation
/card
charge
All test costs
(for sputum,
blood, stool,
urine or other
specify----)
X ray/
US or
other
diagnost
ic costs
Total
drug
costs
(all
kinds
Travel
Costs
(round trip
including
accompany
if any
Food
costs
(total
Accom
modati
on costs
if any
Any
other
costs(sp
ecify
Total
costs
per visit
Visit 1
Visit 2
Visit 3
Visit 4
Visit 5
Visit 6
Visit 7
Visit 8
Visit 9
Total direct pre-diagnostic and diagnostic costs

14
Part III; Anti-TB treatment practices and patient cost of care
Q no Question Options /response Skip
301 When did you start antiTB treatment? _____________________dd/mm/yy
302 How long it takes you to start TB treatment since
first HCP consultation?
--------------------days/weeks/months
303 How long after the diagnosis of TB that you
commenced anti-TB treatment?
1. Immediately
2. ---------------------days/weeks
305
304 Why you did not start treatment immediately? 1. I was reluctant to initiate the treatment
2. Fear of long treatment
3. Lack of anti-TB drugs at the facility
4. TB clinic was closed
5. Absence of DOT provider
6. Failure to present treatment supporter
7. Inability to arrange accommodation at nearby
8. Too ill to initiate early
9. Other (specify---------------------------
305 At which health facility did you start the anti-TB
treatment?
1. In this facility
2. Other facility(specify------
308
306 If started elsewhere, why you did you start
treatment there?
1. It was must to start at diagnosed HCF
2. I was too ill and told to be admitted there
3. Treatment was not available here at the time
4. I was near to that facility at the time
5. Other specify---------------
307 For how long did you take the treatment there? ______________days/weeks/months
308 How were you taking the anti-TB drugs? 1. Hospitalized
2. Ambulatory
312
309 For how long did you stay at the hospital? ______________days/weeks/months
310 Did someone accompany you during
hospitalization?
1. Yes (for -----------------days/weeks/months
2. No
311 During the hospitalization, how much did you pay
in total for the following items?
1. Food ------------
2. Accommodation ---------
3. Laboratory tests------------
4. Drugs ------------
5. Service charge---------
6. Other(specify------
7. I did not pay
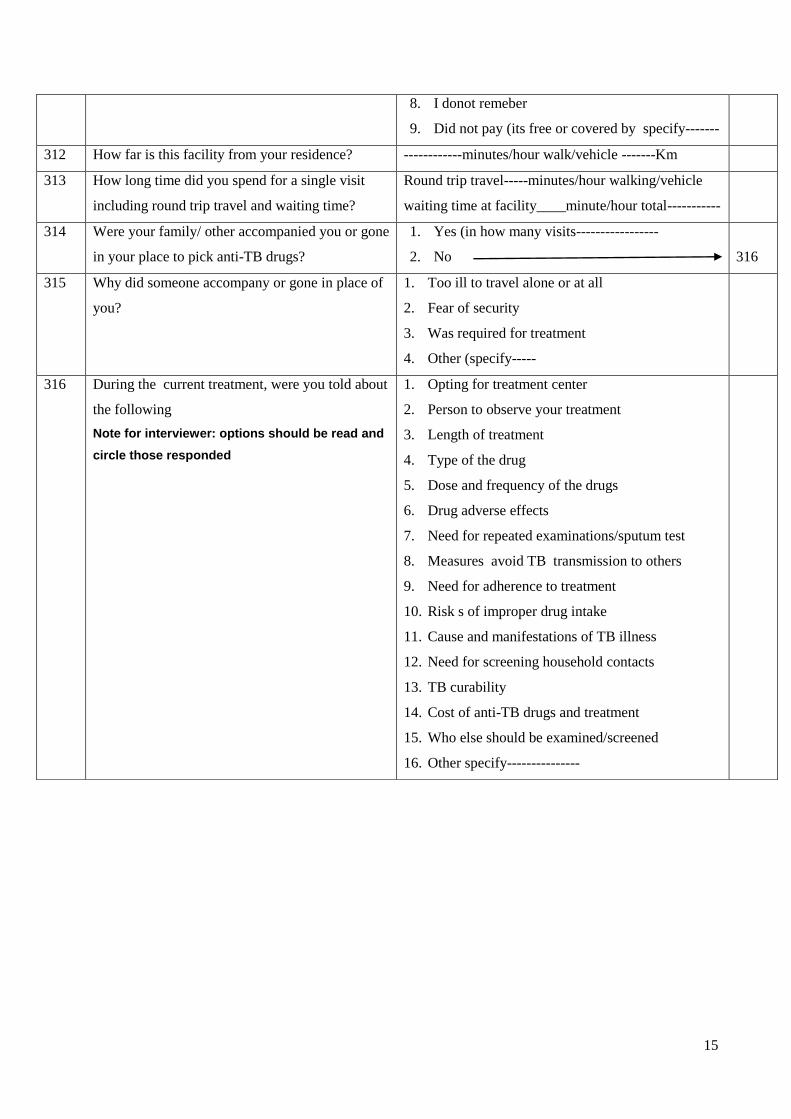
15
8. I donot remeber
9. Did not pay (its free or covered by specify-------
312 How far is this facility from your residence? ------------minutes/hour walk/vehicle -------Km
313 How long time did you spend for a single visit
including round trip travel and waiting time?
Round trip travel-----minutes/hour walking/vehicle
waiting time at facility____minute/hour total-----------
314 Were your family/ other accompanied you or gone
in your place to pick anti-TB drugs?
1. Yes (in how many visits-----------------
2. No
316
315 Why did someone accompany or gone in place of
you?
1. Too ill to travel alone or at all
2. Fear of security
3. Was required for treatment
4. Other (specify-----
316 During the current treatment, were you told about
the following
Note for interviewer: options should be read and
circle those responded
1. Opting for treatment center
2. Person to observe your treatment
3. Length of treatment
4. Type of the drug
5. Dose and frequency of the drugs
6. Drug adverse effects
7. Need for repeated examinations/sputum test
8. Measures avoid TB transmission to others
9. Need for adherence to treatment
10. Risk s of improper drug intake
11. Cause and manifestations of TB illness
12. Need for screening household contacts
13. TB curability
14. Cost of anti-TB drugs and treatment
15. Who else should be examined/screened
16. Other specify---------------
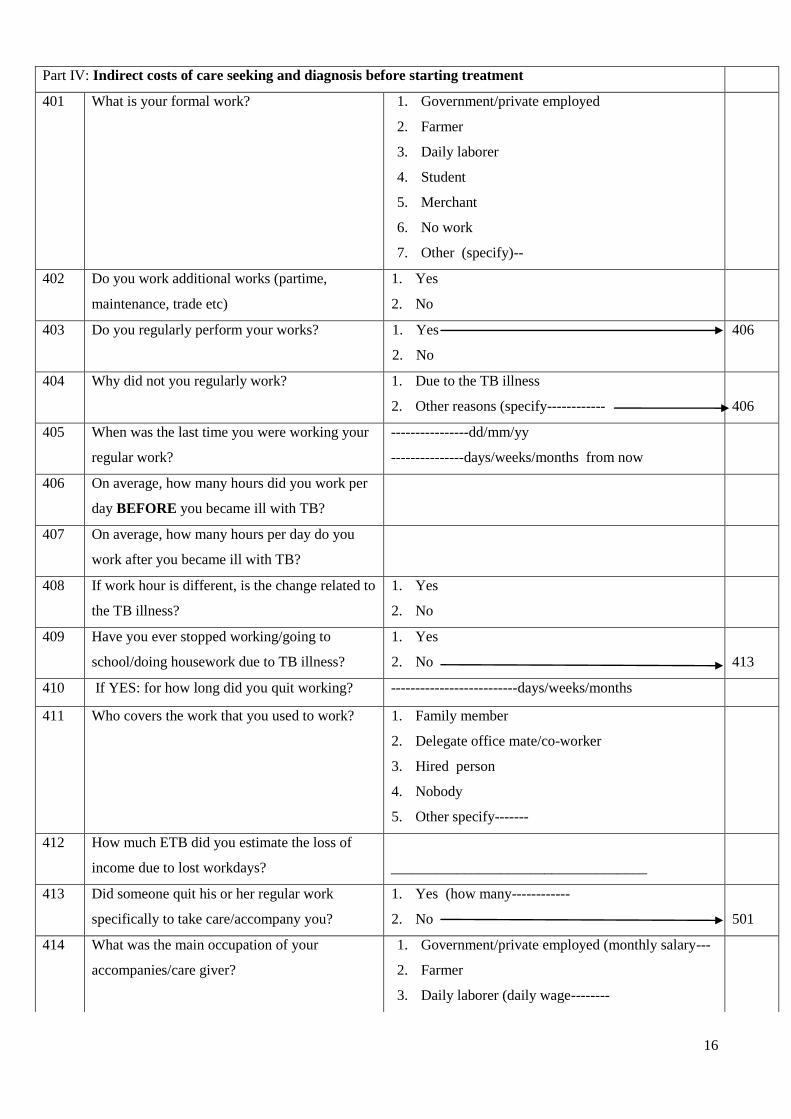
16
Part IV: Indirect costs of care seeking and diagnosis before starting treatment
401 What is your formal work? 1. Government/private employed
2. Farmer
3. Daily laborer
4. Student
5. Merchant
6. No work
7. Other (specify)--
402 Do you work additional works (partime,
maintenance, trade etc)
1. Yes
2. No
403 Do you regularly perform your works? 1. Yes
2. No
406
404 Why did not you regularly work? 1. Due to the TB illness
2. Other reasons (specify------------
406
405 When was the last time you were working your
regular work?
----------------dd/mm/yy
---------------days/weeks/months from now
406 On average, how many hours did you work per
day BEFORE you became ill with TB?
407 On average, how many hours per day do you
work after you became ill with TB?
408 If work hour is different, is the change related to
the TB illness?
1. Yes
2. No
409 Have you ever stopped working/going to
school/doing housework due to TB illness?
1. Yes
2. No
413
410 If YES: for how long did you quit working? --------------------------days/weeks/months
411 Who covers the work that you used to work? 1. Family member
2. Delegate office mate/co-worker
3. Hired person
4. Nobody
5. Other specify-------
412 How much ETB did you estimate the loss of
income due to lost workdays?
___________________________________
413 Did someone quit his or her regular work
specifically to take care/accompany you?
1. Yes (how many------------
2. No
501
414 What was the main occupation of your
accompanies/care giver?
1. Government/private employed (monthly salary---
2. Farmer
3. Daily laborer (daily wage--------
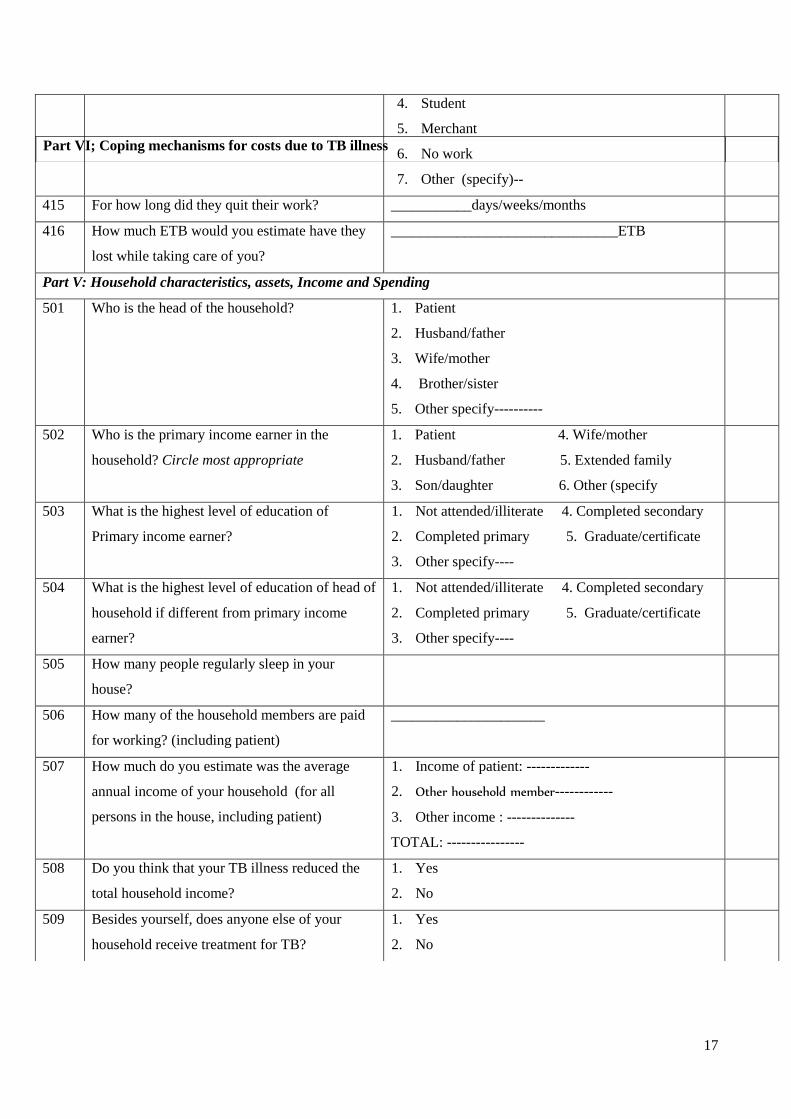
17
4. Student
5. Merchant
6. No work
7. Other (specify)--
415 For how long did they quit their work? ___________days/weeks/months
416 How much ETB would you estimate have they
lost while taking care of you?
_______________________________ETB
Part V: Household characteristics, assets, Income and Spending
501 Who is the head of the household? 1. Patient
2. Husband/father
3. Wife/mother
4. Brother/sister
5. Other specify----------
502 Who is the primary income earner in the
household? Circle most appropriate
1. Patient 4. Wife/mother
2. Husband/father 5. Extended family
3. Son/daughter 6. Other (specify
503 What is the highest level of education of
Primary income earner?
1. Not attended/illiterate 4. Completed secondary
2. Completed primary 5. Graduate/certificate
3. Other specify----
504 What is the highest level of education of head of
household if different from primary income
earner?
1. Not attended/illiterate 4. Completed secondary
2. Completed primary 5. Graduate/certificate
3. Other specify----
505 How many people regularly sleep in your
house?
506 How many of the household members are paid
for working? (including patient)
_____________________
507 How much do you estimate was the average
annual income of your household (for all
persons in the house, including patient)
1. Income of patient: -------------
2. Other household member------------
3. Other income : --------------
TOTAL: ----------------
508 Do you think that your TB illness reduced the
total household income?
1. Yes
2. No
509 Besides yourself, does anyone else of your
household receive treatment for TB?
1. Yes
2. No
Part VI; Coping mechanisms for costs due to TB illness

18
601 How much do you estimate that your household
incurred your TB care seeking?
1. --------------------ETB
2. I donot Know
602 How would you describe the expenditure for your TB
care?
1. Expensive
2. Fair
3. Cheap
4. Free
603 How did you cover the costs incurred for TB
illness and care seeking?
Note: more than one response is possible and
put amount of money generated with each
coping mechanisms
1. Sold assets/products
2. Received financial assistance from outside----
3. Withdrew saving----------------
4. Borrow money---------------
5. Changed jobs
6. Reduced food consumption
7. Drop out of school
8. Other specify--------------------
607
604 If you sold assets, what did you sell? Circle most
appropriate
1. Land 5. Vehicle
2. Livestock 4. Farm produce
3. Household item 6. Other----
605 What is the estimated market value of the property
you sold?
606 How much did you earn from the sale? ______________________
607 Has the TB illness affected your social or private
life in any way?
1. Yes
2. No
609
608 If Yes, what did it brought on you? 1. Divorce
2. Disruption of sexual life
3. Drop out of school
4. Loss of Job
5. Reduced income
6. Other------
609 If the government could provide you with some
service to ease the burden of TB on you and your
household, what would you prefer to have? State
options, choose one
1. Transport vouchers
2. food vouchers
3. More efficient service
4. Other (specify):
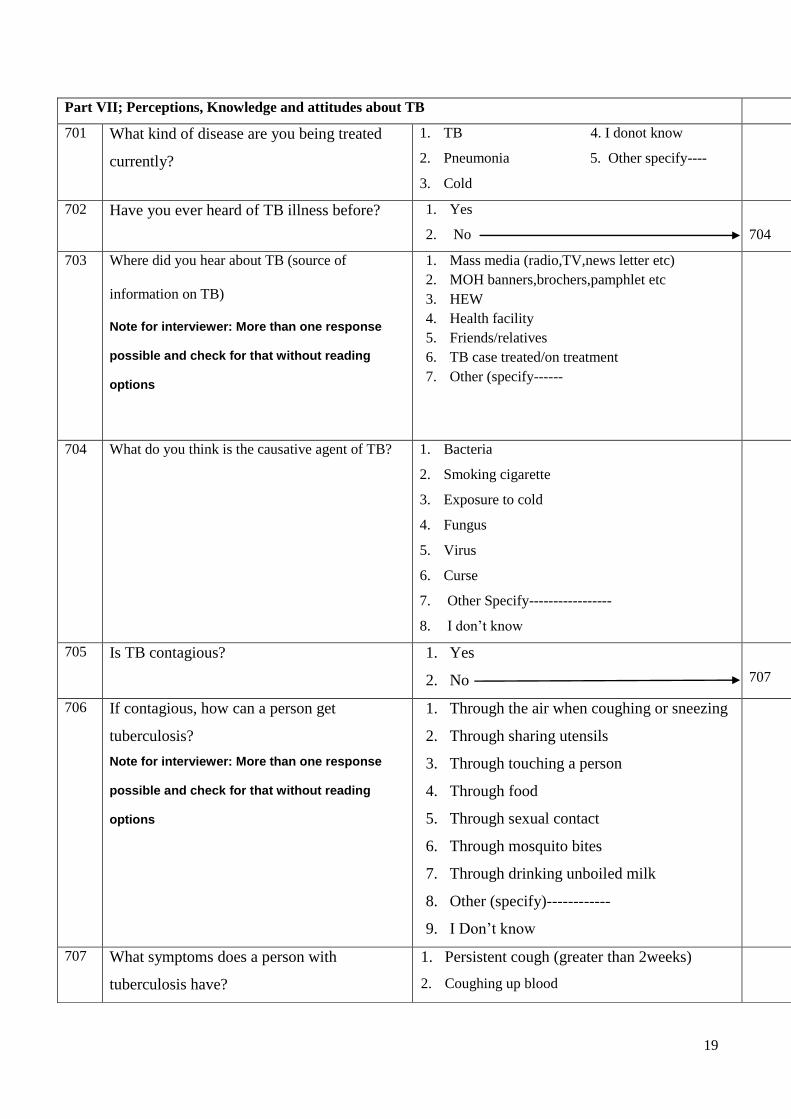
19
Part VII; Perceptions, Knowledge and attitudes about TB
701 What kind of disease are you being treated
currently?
1. TB 4. I donot know
2. Pneumonia 5. Other specify----
3. Cold
702 Have you ever heard of TB illness before? 1. Yes
2. No
704
703 Where did you hear about TB (source of
information on TB)
Note for interviewer: More than one response
possible and check for that without reading
options
1. Mass media (radio,TV,news letter etc)
2. MOH banners,brochers,pamphlet etc
3. HEW
4. Health facility
5. Friends/relatives
6. TB case treated/on treatment
7. Other (specify------
704 What do you think is the causative agent of TB? 1. Bacteria
2. Smoking cigarette
3. Exposure to cold
4. Fungus
5. Virus
6. Curse
7. Other Specify-----------------
8. I don’t know
705 Is TB contagious? 1. Yes
2. No
707
706 If contagious, how can a person get
tuberculosis?
Note for interviewer: More than one response
possible and check for that without reading
options
1. Through the air when coughing or sneezing
2. Through sharing utensils
3. Through touching a person
4. Through food
5. Through sexual contact
6. Through mosquito bites
7. Through drinking unboiled milk
8. Other (specify)------------
9. I Don’t know
707 What symptoms does a person with
tuberculosis have?
1. Persistent cough (greater than 2weeks)
2. Coughing up blood

20
Note for interviwer: More than one response
possible and check for that without reading
options
3. Weight loss
4. Poor appetite
5. Night sweating
6. Chest pain
7. Fever
8. Other (specify-----------------
9. Don’t know
708 Is TB hereditary? 1. Yes 2. No
709 Do you know if there is a vaccine for TB? 1. Yes 2. No
710 How is treatment of TB provided? 1. For free 2. For charge
711 Do you know the approximated duration of
TB treatment?
1. Yes (specify----------- 2. No
712 Do you know the kind of TB drugs? 1. Yes 2. No
713 Is tuberculosis curable? 1. Yes 2. No

21
Annex 3: Amharic version information sheet, consent form, and questionnaires አባሪ 1፡ ሇጥናት ተሳታፊዎች የሚሰጥ መረጃ
የጥናቱ ርዕስ፡ የቲቢ ህሙማን ህክምና መዘግየት፣ ወጪያቸዉና ህክምና ዉጤት
ዋና አጥኚ፤ አብዮት አስረስ(የህ/ሰብ ጤና አጠባበቅ እስፐሻሌስት)
ዋና አማካሪ፤ ድ/ር ዋቅጋሪ ዳሬሳ(ተባባሪ ፕሮፈሰር)
ሁሇተኛ አማካሪ፤ ድ/ር ዯጉ ጀረኔ (ረዲት ፕሮፈሰር)
አስተባባሪ መ/ቤት፤ በአዴስ አበባ ዩኒቨርሲቲ የህ/ሰብ ጤና አጠባበቅ ት/ቤት
መግቢያ፤ ቲቢ በተዋሲያን የሚመጣ በሽታ ሲሆን በታማሚዎች፣በማህበረሰቡና በኢኮኖሚ ሊይ ከፍተኛ ጫና ያሳዴራሌ፡፡
በመሆኑም ይህንን የተዯራረቡ ሰባዊ፣ማህበረሰባዊና ኢኮኖሚያዊ ጉዲዮችን ሇመቅረፍና ሇመቆጣጠር አሇም አቀፍ ጥረቶች
በአገራት ስተገበሩ ቆይተዋሌ፡፡ ሇዚሁም ህሙማንን በቶል መሇየትና ተገቢዉን ህክምና ሰጥቶ ማዲን በማህበረሰቡ ዉስጥ
የበሽታዉን መዛመት ስሇሚቀንስ ዋነኛዉ የቲቢ በሽታ መከሊከሌና መቆጣጠር መንገዴ ነዉ፡፡ ይሁን እንጂ ህሙማን
ሳይመረመሩና ሳይታከሙ ሇረጅም ጊዜ እንዯሚቆዩ በኢትዪጵያና ላልች ሀገሮች የተሰሩ ጥናቶች አሳይተዋሌ፡፡ ይህ ሆኖ ሳሇ
ግን የታማሚዎች መዘግየት ምክንያቶችን የሚሳይ የተJሊ መረጃ በስፋት አይገኝም፡፡ የህሙማን በቶል አሇመመርምርና
መታከም መሰናክልች፣በህክምና ዉጤት ሊይ የሚስከትሇዉን ችግርና የበሽታዉ ኢኮኖሚያዊ ጫና መረጃዎች አሁን
እየተሰራበት ያለትንና ቲቢን በእጅጉ ቀንሶ ሇማጥፋት ያሇሙት ስትራተጂዎችን በከፍተኛ ሁኔታ ይዯግፋሌ፡፡
የጥናቱ ዓሊማ፤ የዚህ ጥናት አሊማ በታማሚዎች፣በጤና ተ ማትና በማ/ሰቡ ዘንዴ ያለትን የምርመራና ህክምና መዘግየት
መሰናክልች፤ መዘግየታቸዉ በህክምና ዉጤታቸዉ ሊይ የሚያመጣዉን ችግርና ሇቲቢ በሽታ ምርመራና ህክምና በቀጥታም
ሆነ በተዘዋዋሪ የሚወጡ ወጪዎችን መሇየት ነዉ፡፡
የጥናቱ አፈጻጸምና ተሳትፎ፤ ጥናቱ የመጀመሪያ ዲሰሳና ተከታታይነት ያሇዉ መረጃ አሰባሰብ ዜዯ ይጠቀማሌ፡፡ በመሆኑም
እስከ ህክምናዉ ፍፃሜ ዴረስ አራት በተሇያዩ ጊዜያት መረጃዎች ይሰበሰባሌ፡፡ የዕርስዎ በጥናቱ መሳተፍ የተፈሇገዉ
የሚሰጡን ተአማኒ መረጃ እየተጠና ያሇዉን ጉዲይ ሇመረዲት እጅግ አስፈሊጊ ስሇሆነ ነዉ፡፡ ተሳትፎዎትም የተወሰነዉ
በዕዴሌ ሊይ ተመስርቶ በተዯረገዉ የመረጣ ስሌት ሲሆን በየጊዜያቱ የሚዯረጉ መጤይቆች በአማካይ 30ዯቂቃዎችን
ይፈጃለ፡፡ በመጠይቁም ወቅት የዕርስዎ ማህበራዊ፣ኢኮኖሚያዊ፣ የግሌና በተሰብ ገቢና ወጪዎችን፣ስሇአሁኑ ህመምዎ
ምርመራና ህክምና ህዯቶችንና ወጪዎችን ይጠየቃለ፡፡
የምስጥር አጠባበቅ፤ የሚሰጡን ማናቸዉም መረጃዎች ምስጥሩ የተጠበቀ ሇማዴረግ የግሌ መግሇጫ የሆኑት ስምዎትና ስሌክ
ቁጥሮት ሳይመዘገቡ በሚሰጦት መሇያ መሰረት ተተንትኖ ማንነቶን በማይገፅ መሌኩ ብቻ ይሰራጫሌ፡፡ በተጨማሪም
መረጃዉ ከአጥኝዎች ዉጭ ማንም በማይዯርስበት ቦታ ተቆሌፎ ይቀመጣሌ፡፡ የሚሰጡንን መረጃ ከጥናቱ አሊማ ዉጪ
ማዋሌ የጥናት ስነምግባር ስሊሌሆነ ሇላሊ ጉዲይ አይዉሌም፡፡ ስሇሆነም የገቢዎትና ወጪዎች መረጃ ሇግብር ሰብሳቢ መ/ቤት
ተሊሌፎ አይሰጥም፡፡ በመጨረሻም የተሰበሰበዉ መረጃ ጥናቱ መጠናቀቁ በህ/ሰብ ጤና አጠባበቅ ት/ቤትና ዩኒቨርሲተዉ
የት/ርት ጉባኤ ሲረጋገጥ ዯህንነቱ በተረጋገጠ ቦታ ሊይ ይቃጠሊሌ፡፡
የሚያገኙት ጥቅም፤ ጥናቱ የአጭር ጊዜ የገንዘብ፣የጤና አገሌግልትም ሆኔ አቅም ግንባታ ጥቅማጥቅሞች ሇተሳታፊዎች
በግሌም ሆኔ በቡዴን አይኖርም፡፡ ይሁን እንጂ ወዯፊት የሚመሇከታቸዉ ክፍልች መረጃዉን በመጠቀም የቲቢ በሽታ
በበተሴብ እና ጤና አገሌግልት ሊይ የሚያሳዴረዉን ጫና የሚቀንሱ ስትራቴጅዎችን ይቀርፁበታሌ፡፡ በመሆኑም የቲቢ
በሽታን በእጅጉ የመቆጣጠርና ማጥፋት ራዕይን በማሳካት መሊዉ የዓሇም ህዝቦች ከቲቢ በሽታ ጫና ነጻ እንዱሆኑ
ያዯርጋሌ፡፡ በላሊ መሌኩ መረጃዉ በሚሰበሰብበት ወቅት ሇተሳታፊዎች ስሇ ቲቢ በሽታና ህክምና መረጃዎች ይሰጣቸዋሌ፡፡

22
የሚያስከትሇዉ አዯጋ፤ የታሰበዉ ጥናት በሚሳተፉ ሰዎች ሊይ ምንም ዓይነት ኢሰባዊ ዴርጊቶች፣አካሊዊ ጉዲት፣ማህበራዊ፣
ኢኮኖሚያዊ እና ስነ ሌቦናዊ ጉዲቶችን አያመጣም፡፡ በተጨማሪም በጥናቱ መሳተፎ ወይም አሇመሳተፎ የሚያገኙት
ህክምናን በምንም መሌኩ አይጎዲም፡፡
ስጦታዎች፤ የጥናቱ ህዯት ምንም ዓይነት መዯሇያ ወይም ማስገዯጃ ዴርጊት ወይም ስጦታ የሇላዉ ከመሆኑም በሊይ ጥናቱ
ካሳ የሚያስከፍሌ ህዯትም የሇዉም፡፡
መረጃ ስሇማሰራጨት፤ አጥኚዎቹ የጥናቱን ዉጤቶች የማሰራጨት ሙለ ኃሊፊነት የሚኖራቸዉ ሲሆን ሇሚመሇከታቸዉ
ጤና መምሪያዎችና ወረዲዎች ተገቢዉን ግብረ መሌስ ይሰጣለ፡፡ በተጨማሪም የጥናቱን ዉጤቶች በተሇያዩ አገርዊና አሇም
አቀፋዊ ሳይንሳዊ ጉባኤያት ሊይ በማቅረብ እንዱሁም በተዓማኒ የጥናት መፅሄቶች ሊይ በማሳተምም ይሰራጨሌ፡፡
ከጥናቱ ስሇማ ረጥ፤ በጥናቱ መሳተፍ ካሌፈሇጉ በማንኛዉም ጊዜ የማ ረጥ መብት አሇዎት፡፡ ይህን በማዴረጎም ምንም
ዓይነት የጤና አገሌግልትና አሰተዲዯራዊ ችግሮች አይዯርስቦትም፤ የሚያ ርጡብትንም ምክንያት እንዱገሌጹ ማንም
አያስገዴድትም፡፡
መረጃ ስሇመጠየቅ፤ የጥናቱ ተሳታፊዎች ማናቸዉንም ስሇጥናቱ ያሌገባቸዉንም ሆነ ጥናቱ የሚያካትታቸዉን ጉዲዮች
የመጠየቅ መብት አሊቸዉ፡፡ ስሇሆነም መረጃ ከፈሇጉ ከዚህ በታች በተዘረዘሩ የዋና አጥኚ፣ አማካሪዎች ወይም አዴስ አበባ
ዩኒቨርሲቲ ጤና ሣይንስ ኮሇጅ የተ Jዊ ጥናት ስነ ምግባር አጣሪ ቦርዴ አዴራሻዎች መጠየቅ ይችሊለ፡፡
1. አዴስ አበባ ዩኒቨርሲቲ ጤና ሳይንስ ኮሇጅ ተ Gዊ የጥናት ስነምግባር አጣሪ ቦርዴ ጽ/ቤት
ስሌክ ቁጥር፡ 0115512876
2. ዋና አጥኚ-አብዮት አስረስ (ሚዛን ቴፒ ዩኒቨርሲቲ፣ስሌክ ቁጥር፡ 0911905554)
3. አማካሪዎች
ድ/ር ዋቅጋሪ ዯሬሳ (አዴስ አበባ ዩኒቨርሲቲ የህ/ሰብ ጤና አጠባበቅ ት/ቤት፣ ስሌክ ቁጥር ፡0911483714)
ድ/ር ዯጉ ጀረኔ ስሌክ ቁጥር፡ 0911546
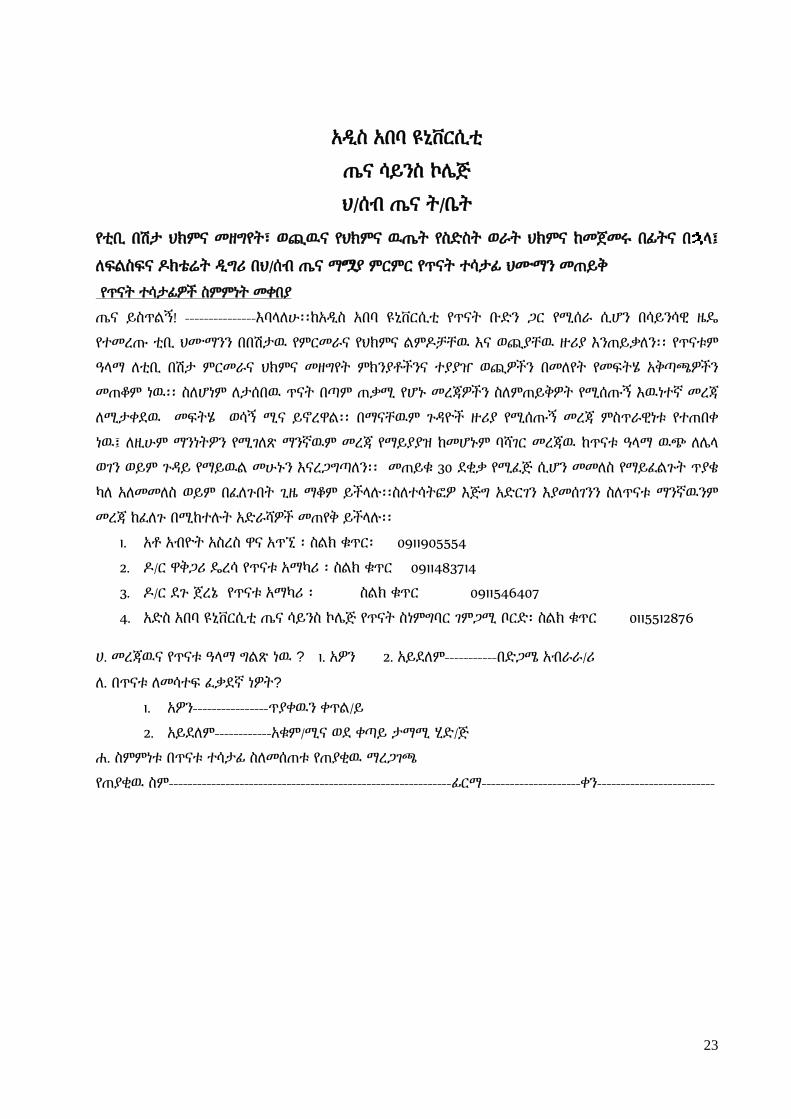
23
አዱስ አበባ ዩኒቨርሲቲ
ጤና ሳይንስ ኮላጅ
ህ/ሰብ ጤና ት/ቤት
የቲቢ በሽታ ህክምና መዘግየት፣ ወጪዉና የህክምና ዉጤት የስዴስት ወራት ህክምና ከመጀመሩ በፊትና በ ሊ፤
ሇፍሌስፍና ድክቴሬት ዱግሪ በህ/ሰብ ጤና ማJያ ምርምር የጥናት ተሳታፊ ህሙማን መጠይቅ
የጥናት ተሳታፊዎች ስምምነት መቀበያ
ጤና ይስጥሌኝ! ---------------እባሊሇሁ፡፡ከአዱስ አበባ ዩኒቨርሲቲ የጥናት ቡዴን ጋር የሚሰራ ሲሆን በሳይንሳዊ ዜዳ
የተመረጡ ቲቢ ህሙማንን በበሽታዉ የምርመራና የህክምና ሌምድቻቸዉ እና ወጪያቸዉ ዙሪያ እንጠይቃሇን፡፡ የጥናቱም
ዓሊማ ሇቲቢ በሽታ ምርመራና ህክምና መዘግየት ምክንያቶችንና ተያያዠ ወጪዎችን በመሇየት የመፍትሄ አቅጣጫዎችን
መጠቆም ነዉ፡፡ ስሇሆነም ሇታሰበዉ ጥናት በጣም ጠቃሚ የሆኑ መረጃዎችን ስሇምጠይቅዎት የሚሰጡኝ እዉነተኛ መረጃ
ሇሚታቀዯዉ መፍትሄ ወሳኝ ሚና ይኖረዋሌ፡፡ በማናቸዉም ጉዲዮች ዙሪያ የሚሰጡኝ መረጃ ምስጥራዊነቱ የተጠበቀ
ነዉ፤ ሇዚሁም ማንነትዎን የሚገሇጽ ማንኛዉም መረጃ የማይያያዝ ከመሆኑም ባሻገር መረጃዉ ከጥናቱ ዓሊማ ዉጭ ሇላሊ
ወገን ወይም ጉዲይ የማይዉሌ መሁኑን እናረጋግጣሇን፡፡ መጠይቁ 30 ዯቂቃ የሚፈጅ ሲሆን መመሇስ የማይፈሌጉት ጥያቄ
ካሇ አሇመመሇስ ወይም በፈሇጉበት ጊዜ ማቆም ይችሊለ፡፡ስሇተሳትፎዎ እጅግ አዴርገን እያመሰገንን ስሇጥናቱ ማንኛዉንም
መረጃ ከፈሇጉ በሚከተለት አዴራሻዎች መጠየቅ ይችሊለ፡፡
1. አቶ አብዮት አስረስ ዋና አጥኚ ፡ ስሌክ ቁጥር፡ 0911905554
2. ድ/ር ዋቅጋሪ ዳረሳ የጥናቱ አማካሪ ፡ ስሌክ ቁጥር 0911483714
3. ድ/ር ዯጉ ጀረኔ የጥናቱ አማካሪ ፡ ስሌክ ቁጥር 0911546407
4. አዴስ አበባ ዩኒቨርሲቲ ጤና ሳይንስ ኮላጅ የጥናት ስነምግባር ገምጋሚ ቦርዴ፡ ስሌክ ቁጥር 0115512876
ሀ. መረጃዉና የጥናቱ ዓሊማ ግሌጽ ነዉ ? 1. አዎን 2. አይዯሇም-----------በዴጋሜ አብራራ/ሪ
ሇ. በጥናቱ ሇመሳተፍ ፈቃዯኛ ነዎት?
1. አዎን----------------ጥያቀዉን ቀጥሌ/ይ
2. አይዯሇም------------አቁም/ሚና ወዯ ቀጣይ ታማሚ ሂዴ/ጅ
ሏ. ስምምነቱ በጥናቱ ተሳታፊ ስሇመሰጠቱ የጠያቂዉ ማረጋገጫ
የጠያቂዉ ስም------------------------------------------------------------ፊርማ---------------------ቀን-------------------------
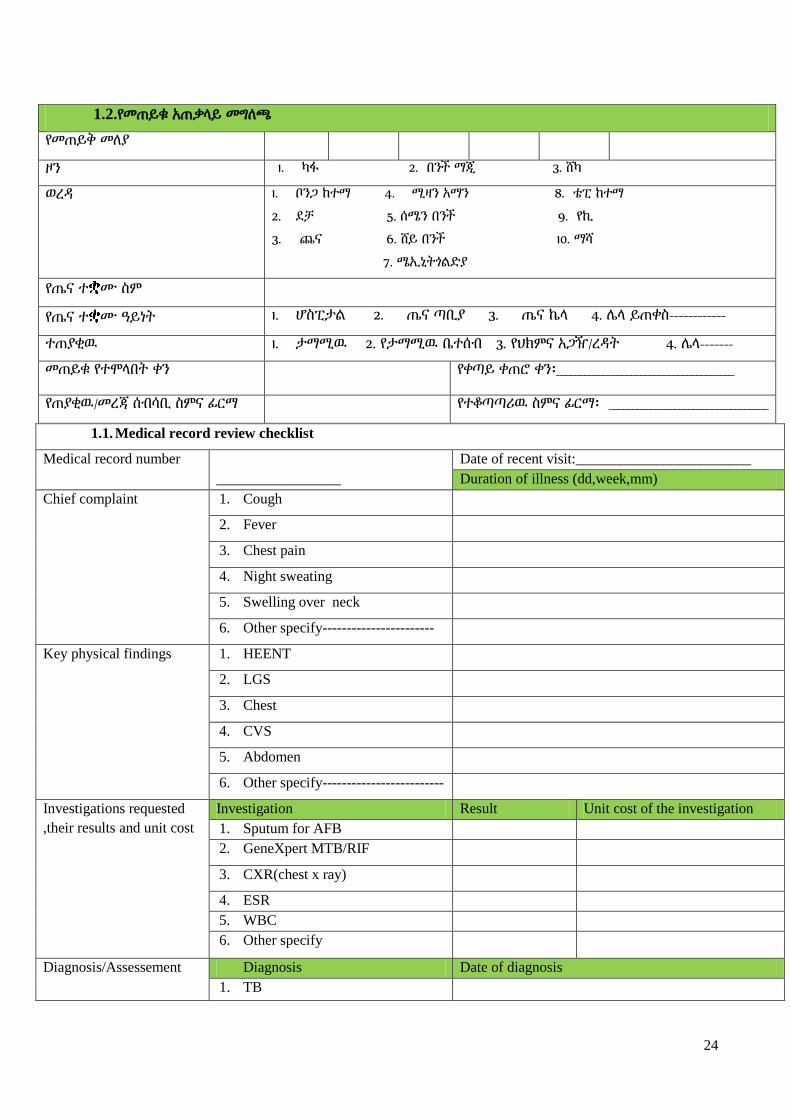
24
1.1. Medical record review checklist
Medical record number
_________________
Date of recent visit:________________________
Duration of illness (dd,week,mm)
Chief complaint 1. Cough
2. Fever
3. Chest pain
4. Night sweating
5. Swelling over neck
6. Other specify-----------------------
Key physical findings 1. HEENT
2. LGS
3. Chest
4. CVS
5. Abdomen
6. Other specify-------------------------
Investigations requested
,their results and unit cost
Investigation Result Unit cost of the investigation
1. Sputum for AFB
2. GeneXpert MTB/RIF
3. CXR(chest x ray)
4. ESR
5. WBC
6. Other specify
Diagnosis/Assessement Diagnosis Date of diagnosis
1. TB
1.2.የመጠይቁ አጠቃሊይ መግሇጫ
የመጠይቅ መሇያ
ዞን 1. ካፋ 2. በንች ማጂ 3. ሸካ
ወረዲ 1. ቦንጋ ከተማ 4. ሚዛን አማን 8. ቴፒ ከተማ
2. ዯቻ 5. ሰሜን በንች 9. የኪ
3. ጨና 6. ሸይ በንች 10. ማሻ
7. ሜኢኒትጎሌዴያ
የጤና ተ ሙ ስም
የጤና ተ ሙ ዓይነት 1. ሆስፒታሌ 2. ጤና ጣቢያ 3. ጤና ኬሊ 4. ላሊ ይጠቀስ------------
ተጠያቂዉ 1. ታማሚዉ 2. የታማሚዉ ቤተሰብ 3. የህክምና አጋዥ/ረዲት 4. ላሊ-------
መጠይቁ የተሞሊበት ቀን የቀጣይ ቀጠሮ ቀን፡______________________________________
የጠያቂዉ/መረጃ ሰብሳቢ ስምና ፊርማ የተቆጣጣሪዉ ስምና ፊርማ፡ __________________________________

25
2. Pneumonia
3. B.Asthma
4. Other specify-------------------------
5. Not stated/written
Treatments/plan
prescribed and their unit
cost
Unit cost of the treatment precribed
1.2. Unit TB register review
TB unit number Wereda kebele
Sex 1. Male 2. Female
Age ________________years
Smear result 1. Positive 2. Negative 3. Not done Lab number:__________
Baseline/intial weight (Kg) _________________
Patient category 1. New 2. Transfer in 3. Other 4. Other specify_________________
Type of TB 1. PPos 2. Pneg 3. EPTB
Intensive drugs 1. RHZE 2. SRHZE 3. Other ----- Dose (#of tabs):________
Treatment started date/dd/mm/yy _____________________
Xpert MTB/RIF result 1. Positive 2. Negative 3. Not done Lab serial #:
HIV test offered 1. Yes 2. No
HIV test performed 1. Yes 2. No
Place HIV test performed 1. OPD 2. Lab 3. TB clinic 4. Other ----
HIV result 1. Reactive 2. Non reactive 3. NA
CPT started date 1. Yes 2. No if yes when-----------------dd/mm/yy
Date HIV care enrolled Yes 2. No if yes when-----------------dd/mm/yy
Date ART started Yes 2. No if yes when-----------------dd/mm/yy
ART unique number
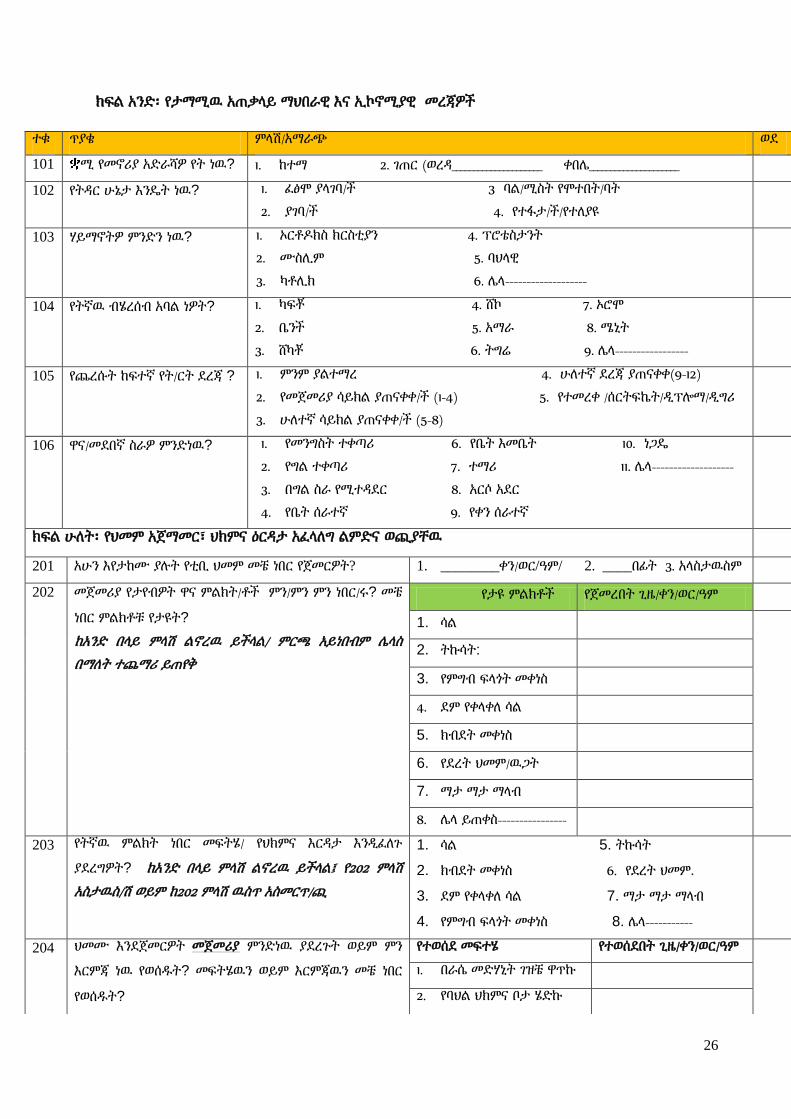
26
ክፍሌ አንዴ፡ የታማሚዉ አጠቃሊይ ማህበራዊ እና ኢኮኖሚያዊ መረጃዎች
ተቁ ጥያቄ ምሊሽ/አማራጭ ወዯ
101 ሚ የመኖሪያ አዴራሻዎ የት ነዉ? 1. ከተማ 2. ገጠር (ወረዲ_____________________ ቀበላ_____________________
102 የትዲር ሁኔታ እንዳት ነዉ? 1. ፈፅሞ ያሊገባ/ች 3 ባሌ/ሚስት የሞተበት/ባት
2. ያገባ/ች 4. የተፋታ/ች/የተሇያዩ
103 ሃይማኖትዎ ምንዴን ነዉ? 1. ኦርቶድክስ ክርስቲያን 4. ፕሮቴስታንት
2. ሙስሉም 5. ባህሊዊ
3. ካቶሉክ 6. ላሊ-------------------
104 የትኛዉ ብሄረሰብ አባሌ ነዎት? 1. ካፍቾ 4. ሸኮ 7. ኦሮሞ
2. ቤንች 5. አማራ 8. ሜኒት
3. ሸካቾ 6. ትግሬ 9. ላሊ-----------------
105 የጨረሱት ከፍተኛ የት/ርት ዯረጃ ? 1. ምንም ያሌተማረ 4. ሁሇተኛ ዯረጃ ያጠናቀቀ(9-12)
2. የመጀመሪያ ሳይክሌ ያጠናቀቀ/ች (1-4) 5. የተመረቀ /ሰርትፍኬት/ዱፕልማ/ዱግሪ
3. ሁሇተኛ ሳይክሌ ያጠናቀቀ/ች (5-8)
106 ዋና/መዯበኛ ስራዎ ምንዴነዉ? 1. የመንግስት ተቀጣሪ 6. የቤት እመቤት 10. ነጋዳ
2. የግሌ ተቀጣሪ 7. ተማሪ 11. ላሊ-------------------
3. በግሌ ስራ የሚተዲዯር 8. አርሶ አዯር
4. የቤት ሰራተኛ 9. የቀን ሰራተኛ
ክፍሌ ሁሇት፡ የህመም አጀማመር፣ ህክምና ዕርዲታ አፈሊሇግ ሌምዴና ወጪያቸዉ
201 አሁን እየታከሙ ያለት የቲቢ ህመም መቼ ነበር የጀመርዎት? 1. ________ቀን/ወር/ዓም/ 2. ____በፊት 3. አሊስታዉስም
202 መጀመሪያ የታየብዎት ዋና ምሌክት/ቶች ምን/ምን ምን ነበር/ሩ? መቼ
ነበር ምሌክቶቹ የታዩት?
ከአንዴ በሊይ ምሊሽ ሌኖረዉ ይችሊሌ/ ምርጫ አይነበብም ላሊስ
በማሇት ተጨማሪ ይጠየቅ
የታዩ ምሌክቶች የጀመረበት ጊዜ/ቀን/ወር/ዓም
1. ሳሌ
2. ትኩሳት:
3. የምግብ ፍሊጎት መቀነስ
4. ዯም የቀሊቀሇ ሳሌ
5. ክብዯት መቀነስ
6. የዯረት ህመም/ዉጋት
7. ማታ ማታ ማሊብ
8. ላሊ ይጠቀስ----------------
203 የትኛዉ ምሌክት ነበር መፍትሄ/ የህክምና እርዲታ እንዱፈሇጉ
ያዯረግዎት? ከአንዴ በሊይ ምሊሽ ሌኖረዉ ይችሊሌ፤ የ202 ምሊሽ
አስታዉስ/ሽ ወይም ከ202 ምሊሽ ዉስጥ አስመርጥ/ጪ
1. ሳሌ 5. ትኩሳት
2. ክብዯት መቀነስ 6. የዯረት ህመም.
3. ዯም የቀሊቀሇ ሳሌ 7. ማታ ማታ ማሊብ
4. የምግብ ፍሊጎት መቀነስ 8. ላሊ-----------
204 ህመሙ እንዯጀመርዎት መጀመሪያ ምንዴነዉ ያዯረጉት ወይም ምን
እርምጃ ነዉ የወሰደት? መፍትሄዉን ወይም እርምጃዉን መቼ ነበር
የወሰደት?
የተወሰዯ መፍተሄ የተወሰዯበት ጊዜ/ቀን/ወር/ዓም
1. በራሴ መዴሃኒት ገዝቼ ዋጥኩ
2. የባህሌ ህክምና ቦታ ሄዴኩ
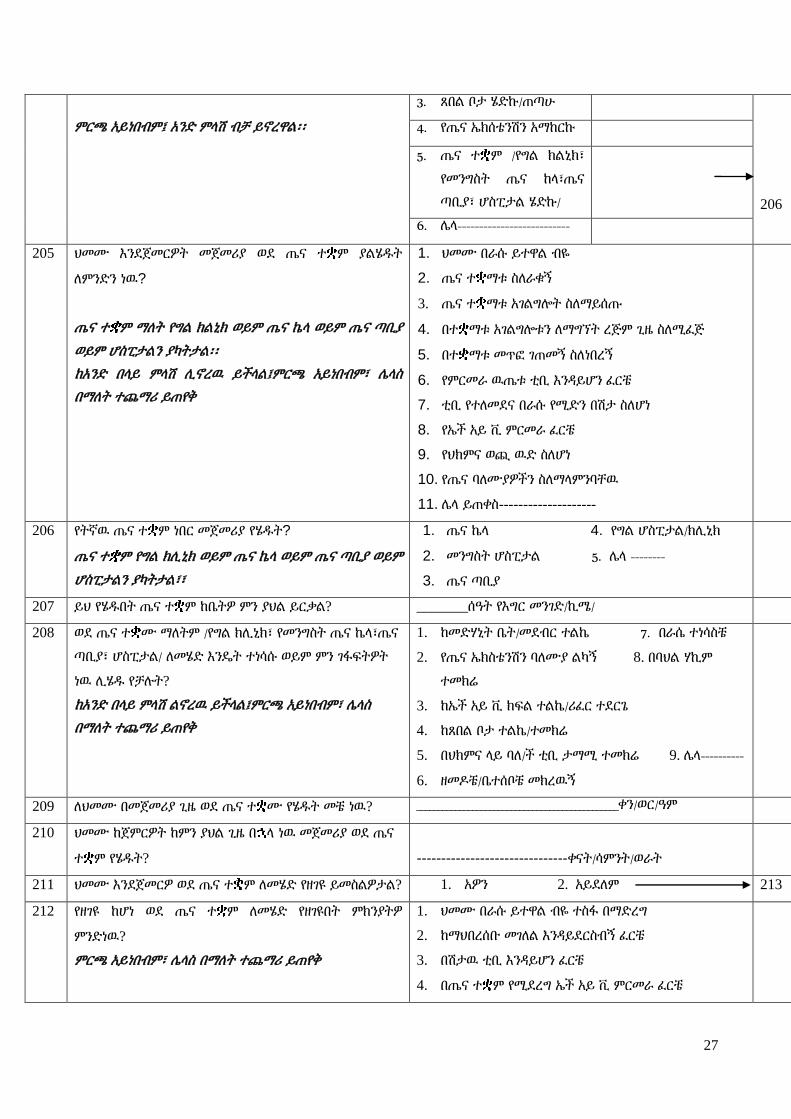
27
ምርጫ አይነበብም፤ አንዴ ምሊሽ ብቻ ይኖረዋሌ፡፡
3. ጸበሌ ቦታ ሄዴኩ/ጠጣሁ
206
4. የጤና ኤክሰቴንሽን አማከርኩ
5. ጤና ተ ም /የግሌ ክሌኒክ፣
የመንግስት ጤና ከሊ፣ጤና
ጣቢያ፣ ሆስፒታሌ ሄዴኩ/
6. ላሊ--------------------------
205 ህመሙ እንዯጀመርዎት መጀመሪያ ወዯ ጤና ተ ም ያሌሄደት
ሇምንዴን ነዉ?
ጤና ተ ም ማሇት የግሌ ክሌኒክ ወይም ጤና ኬሊ ወይም ጤና ጣቢያ
ወይም ሆስፒታሌን ያካትታሌ፡፡
ከአንዴ በሊይ ምሊሽ ሉኖረዉ ይችሊሌ፤ምርጫ አይነበብም፣ ላሊስ
በማሇት ተጨማሪ ይጠየቅ
1. ህመሙ በራሱ ይተዋሌ ብዬ
2. ጤና ተ ማቱ ስሇራቁኝ
3. ጤና ተ ማቱ አገሌግልት ስሇማይሰጡ
4. በተ ማቱ አገሌግልቱን ሇማግኘት ረጅም ጊዜ ስሇሚፈጅ
5. በተ ማቱ መጥፎ ገጠመኝ ስሇነበረኝ
6. የምርመራ ዉጤቱ ቲቢ እንዲይሆን ፈርቼ
7. ቲቢ የተሇመዯና በራሱ የሚዴን በሽታ ስሇሆነ
8. የኤች አይ ቪ ምርመራ ፈርቼ
9. የህክምና ወጪ ዉዴ ስሇሆነ
10. የጤና ባሇሙያዎችን ስሇማሊምንባቸዉ
11. ላሊ ይጠቀስ--------------------
206 የትኛዉ ጤና ተ ም ነበር መጀመሪያ የሄደት?
ጤና ተ ም የግሌ ክሉኒክ ወይም ጤና ኬሊ ወይም ጤና ጣቢያ ወይም
ሆስፒታሌን ያካትታሌ፣፣
1. ጤና ኬሊ 4. የግሌ ሆስፒታሌ/ክሉኒክ
2. መንግስት ሆስፒታሌ 5. ላሊ --------
3. ጤና ጣቢያ
207 ይህ የሄደበት ጤና ተ ም ከቤትዎ ምን ያህሌ ይርቃሌ? _______ሰዓት የእግር መንገዴ/ኪሜ/
208 ወዯ ጤና ተ ሙ ማሇትም /የግሌ ክሉኒክ፣ የመንግስት ጤና ኬሊ፣ጤና
ጣቢያ፣ ሆስፒታሌ/ ሇመሄዴ እንዳት ተነሳሱ ወይም ምን ገፋፍትዎት
ነዉ ሉሄደ የቻለት?
ከአንዴ በሊይ ምሊሽ ሌኖረዉ ይችሊሌ፤ምርጫ አይነበብም፣ ላሊስ
በማሇት ተጨማሪ ይጠየቅ
1. ከመዴሃኒት ቤት/መዯብር ተሌኬ 7. በራሴ ተነሳስቼ
2. የጤና ኤክስቴንሽን ባሇሙያ ሌካኝ 8. በባህሌ ሃኪም
ተመክሬ
3. ከኤች አይ ቪ ክፍሌ ተሌኬ/ሪፈር ተዯርጌ
4. ከጸበሌ ቦታ ተሌኬ/ተመክሬ
5. በህክምና ሊይ ባሇ/ች ቲቢ ታማሚ ተመክሬ 9. ላሊ----------
6. ዘመድቼ/ቤተሰቦቼ መክረዉኝ
209 ሇህመሙ በመጀመሪያ ጊዜ ወዯ ጤና ተ ሙ የሄደት መቼ ነዉ? _______________________________________________ቀን/ወር/ዓም
210 ህመሙ ከጀምርዎት ከምን ያህሌ ጊዜ በ ሊ ነዉ መጀመሪያ ወዯ ጤና
ተ ም የሄደት? -------------------------------ቀናት/ሳምንት/ወራት
211 ህመሙ እንዯጀመርዎ ወዯ ጤና ተ ም ሇመሄዴ የዘገዩ ይመስሌዎታሌ? 1. አዎን 2. አይዯሇም 213
212 የዘገዩ ከሆነ ወዯ ጤና ተ ም ሇመሄዴ የዘገዩበት ምክንያትዎ
ምንዴነዉ?
ምርጫ አይነበብም፣ ላሊስ በማሇት ተጨማሪ ይጠየቅ
1. ህመሙ በራሱ ይተዋሌ ብዬ ተስፋ በማዴረግ
2. ከማህበረሰቡ መገሇሌ እንዲይዯርስብኝ ፈርቼ
3. በሽታዉ ቲቢ እንዲይሆን ፈርቼ
4. በጤና ተ ም የሚዯረግ ኤች አይ ቪ ምርመራ ፈርቼ

28
5. የገንዘብ ችግር ስሇገጠመኝ
6. በጤና ተ ም ያለ ባሇሙያዎች አመሇካከት ጥሩ ስሊሌሆነ
7. በጤና ተ ም የሚሰጡ አገሌግልት ጥራት ስሇላሊቸዉ
8. ላሊ ይጠቀስ-----------------------------------
213 መጀመሪያ የሄደበትን ጤና ተ ም ሇምን መረጡ?
የ206ን ምሊሽ አስታዉስ/ሽ ከአንዴ በሊይ ምሊሽ ሉኖረዉ ይችሊሌ/
ምርጫ አይነበብም፣ ላሊስ በማሇት ተጨማሪ ይጠየቅ
1. ቅርብ ስሇሆነ
2. አገሌግልቱ ሁሌ ጊዜ/በማንኛዉም ጊዜ ሰሇሚገኝ
3. አገሌግልቱ በነጻ ስሇሚሰጥ
4. በተ ሙ እንዯምዴን ስሇተማመንኩ
5. በላሊ ሰዉ ተመክሬ
6. በተ ሙ ሚስጥር ስሇሚጠበቅ
7. ብቁ ባሇሙያዎች በተ ሙ ስሇሚገኙ
8. የተJሊ የምርመራ መሳሪያዎች በተ ሙ ስሇሚገኙ
9. ላሊ ይጠቀስ-----------------------
214 መጀመሪያ ጤና ተ ም በሄደበት ወቅት የህመምዎ የምርመራ ዉጤት
ምን ነበር?
1. ጉንፋን 4. ቲቢ
2. ሳንባ ምች 5. አሌተነገረኝም/አሊዉቅም
3. አስም 6. ላሊ------------------------
218
215 ወዯ ላሊ ተ ም ሪፈር ተዯርገዉ ወይም በራስዎ ሄዯዉ ነበር? 1. አዎን 2. አይዯሇም 218
216 ወዯ የትኛዉ ተ ም ነበር የተሊኩትወይም በራስዎ የሄደት? 1. ጤና ጣቢያ 2. ሆሰፒታሌ 3. ላሊ ይጠቀስ------
217 ሇምን ነበር ሪፈር የተዯረጉት ወይም በራስዎ የሄደት? 1. ሊቦራቶሪ ስሊሌነበር 4. በሽታዬን ማወቅ ስሊሌቻለ
2. ኤክስሬይ ስሊሌነበር 5. ላሊ ይጠቀስ--------------
--
3. ተ ሙ የቲቢ ምርምራና ህክምና ስሇማይሰጥ
218 ህመምዎ ቲቢ መሆኑ የተረጋገጠዉ መቼ ነበር? _____________ቀን/ወር/ዓም / ------------ቀናት/ሳምንት/ወር
በፊት
219 ህመምዎ ቲቢ አንዯሚሆን ጠርጥረዉ ነበር? 1. አዎን 2. አይዯሇም
220 ህመምዎ ቲቢ ነዉ ሲባለ ምን ተሰማዎ? 1. ፍርሃት 4. ተስፋ መቁረጥ
2. ሃፍረት 5. ላሊ-----------------
3. ምንም አሌተሰማኝም
221 ህመምዎ ቲቢ መሆኑ የተረጋገጠዉ የት ነበር? 1. ጤና ጣቢያ 3. የግሌ ክሉኒክ/ሆስፒታሌ
2. ሆስፒታሌ 4. ላሊ-------
222 ቲቢ እስኪረጋገጥ ዴረስ በአጠቃሊይ ወዯ ስንት ጤና ተ ማት ሄደ? ___________________ የሄደባቸዉን ተ ማት ብዛት ያስታዉሱ
223 ቲቢ እስኪረጋገጥ ዴረስ በአጠቃሊይ ወዯ ጤና ተ ም ስንት ጊዜ
ተመሊሇሱ? /የሄደባቸዉን ተ ማት በማስታወስ እርዲ/ጂ
----------------------- በየተ ማቱ ያዯረጉትን ምሌሌስ ብዛት
ይጠይቁ
224 በአጠቃሊይ ህመሙ ከጀመርዎ አንስቶ ቲቢ እስኪረጋግጥ ዴረስ ምን
ያህሌ ጊዜ ፈጀብዎ? ___________________ቀናት/ሳምንት/ወራት
225 ሇህመሙ የጤና ተ ም መጀመሪያ ከሄደ ጊዜ አንስቶ ቲቢ ___________________ቀናት/ሳምንት/ወራት

29
እስኪረጋገጥ ምን ያህሌ ጊዜ ፈጀብዎ?
226 ወዯ ጤና ተ ም ከሄደ በ ሊ ቲቢ እስኪረጋገጥየዘገዩ ይመስልታሌ? 1. አዎን 2. አይዯሇም 228
227 የዘገዩ ወይም ረጅም ጊዜ የወሰዯ ከመሰሌዎት የዘገየበት ወይም ቶል
ያሌተረጋገጠበት ምክንያት ምንዴነዉ ይሊለ?
ምርጫ አይነበብም፣ ላሊስ በማሇት ተጨማሪ ይጠየቅ
1. ባሇሙያዎች በሽታዉን መሇየት ስሊሌቻለ
2. ሇምርመራ የሚያስፈሌጉ ግብዏቶች እጥረት
3. አሊስፈሊጊ መዴሃኒቶች መስጠታቸዉ
4. ወዯ ተሇያዩ ጤና ተ ማት ሪፈር ሲዯረግ ቆይቼ
5. ላሊ ይጠቀስ------------------------------------
228 በቤተሰብዎ ዉስጥ የእርስዎን ዓይነት ህመም የሚያመዉ ሰዉ አሇ? 1. አዎን/ስንት ናቸዉ----------- 2. አይዯሇም 231
229 የታመመ ካሇ ወዯ ህክምና ተ ም ሄዯዋሌ/ተመርምረዋሌ? 1. አዎን
2. አይዯሇም
231
230 ወዯህክምና ያሌሄደት ሇምንዴነዉ?
ምርጫ አይነበብም፣ ላሊስ በማሇት ተጨማሪ ይጠየቅ
1. ከእኔ መዴሃኒት ስሇወሰደ
2. የህክምና ወጪዉ ዉዴ ስሇሆነ
3. ታማሚዎቹ እምቢ ብሇዉ
4. ላሊ---------------

30
231. የቲቢ በሽታ እስኪረጋገጠሌዎ ዴረስ ወዯ ተሇያዩ ቦታዎች ወይም ጤና ተ ም በተመሊሇሱበት ወቅት ቲቢ የተረጋገጠበትን ዕሇት ጨምሮ ምን
ያህሌ ከፈለ፡፡
መግሇጫ፤ ህክምና የተሰጠበት ቦታ ማሇት ባህሌ ህክምና፣ጸበሌ፣ ጤና ተ ም ወይም ላሊ ቦታ ማሇት ነዉ፡፡ የፈጀዉ ጊዜ ማሇት መንገዴ ሊይና በቦታዉ
የተቆየበት ማሇት ነዉ፡፡ መዴሃኒት ማሇት በየምሌሌሱ የታዘዙ መዴሃኒቶች ነዉ፡፡
ምሌሌስ ምርመራ/ህክምና
የተሰጠበት ቦታ
የፈጀብዎት
ጊዜ(ቆይታ
ጉዞን
ጨምሮ)
አብሮዎት
ላሊ ሰው
ነበር(ስንት
ሰዎች)
ሇካርዴ
የከፈለት
ብር
ሇተሇያዩ ሊቦራቶሪ
ምርመራዎች
(ዯም፣አክታ፣ሽንት)
}ÅUa ÃVL
ሇራጅ
ምርመራ
ሇመዴሃኒት ሇዯርሶ
መሌስ
ትራንስፖርት
አብሮዎት
ከነበሩት
ሰዉ ጭምር
ሇምግብና
መጠጥ
መንገዴ
ሊይና
ዉጤት
ሲጠብቁ
ሇአሌጋ ሇላልች
ወጪዎች
አጠቃሊይ
የአንዴ
ምሌሌስ
ወጪ
1
2
3
4
5
6
7
9
አጠቃሊይ ወጪዎች ዴምር በብር
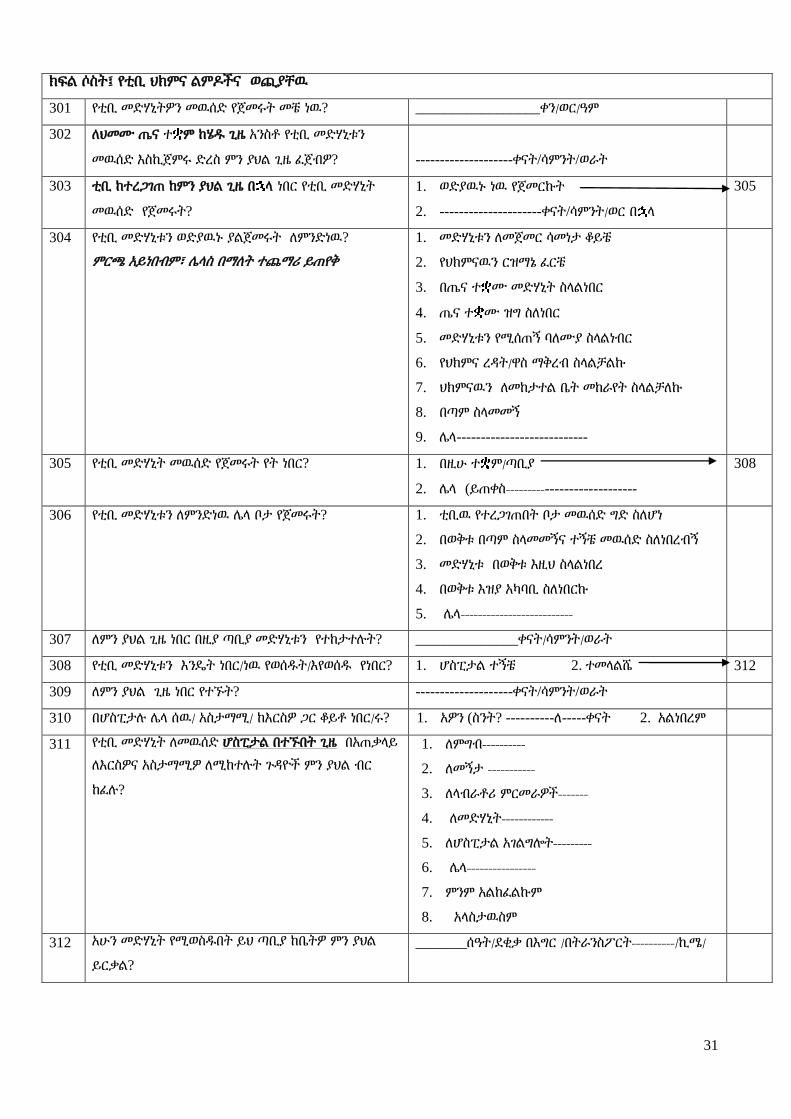
31
ክፍሌ ሶስት፤ የቲቢ ህክምና ሌምድችና ወጪያቸዉ
301 የቲቢ መዴሃኒትዎን መዉሰዴ የጀመሩት መቼ ነዉ? _________________ቀን/ወር/ዓም
302 ሇህመሙ ጤና ተ ም ከሄደ ጊዜ አንስቶ የቲቢ መዴሃኒቱን
መዉሰዴ እስኪጀምሩ ዴረስ ምን ያህሌ ጊዜ ፈጀብዎ? --------------------ቀናት/ሳምንት/ወራት
303 ቲቢ ከተረጋገጠ ከምን ያህሌ ጊዜ በ ሊ ነበር የቲቢ መዴሃኒት
መዉሰዴ የጀመሩት?
1. ወዴያዉኑ ነዉ የጀመርኩት
2. ---------------------ቀናት/ሳምንት/ወር በ ሊ
305
304 የቲቢ መዴሃኒቱን ወዴያዉኑ ያሌጀመሩት ሇምንዴነዉ?
ምርጫ አይነበብም፣ ላሊስ በማሇት ተጨማሪ ይጠየቅ
1. መዴሃኒቱን ሇመጀመር ሳመነታ ቆይቼ
2. የህክምናዉን ርዝማኔ ፈርቼ
3. በጤና ተ ሙ መዴሃኒት ስሊሌነበር
4. ጤና ተ ሙ ዝግ ስሇነበር
5. መዴሃኒቱን የሚሰጠኝ ባሇሙያ ስሊሌነብር
6. የህክምና ረዲት/ዋስ ማቅረብ ስሊሌቻሌኩ
7. ህክምናዉን ሇመከታተሌ ቤት መከራየት ስሊሌቻሇኩ
8. በጣም ስሊመመኝ
9. ላሊ---------------------------
305 የቲቢ መዴሃኒት መዉሰዴ የጀመሩት የት ነበር? 1. በዚሁ ተ ም/ጣቢያ
2. ላሊ (ይጠቀስ----------------------------
308
306 የቲቢ መዴሃኒቱን ሇምንዴነዉ ላሊ ቦታ የጀመሩት? 1. ቲቢዉ የተረጋገጠበት ቦታ መዉሰዴ ግዴ ስሇሆነ
2. በወቅቱ በጣም ስሊመመኝና ተኝቼ መዉሰዴ ስሇነበረብኝ
3. መዴሃኒቱ በወቅቱ እዚህ ስሊሌነበረ
4. በወቅቱ እዝያ አካባቢ ስሇነበርኩ
5. ላሊ--------------------------
307 ሇምን ያህሌ ጊዜ ነበር በዚያ ጣቢያ መዴሃኒቱን የተከታተለት? ______________ቀናት/ሳምንት/ወራት
308 የቲቢ መዴሃኒቱን እንዳት ነበር/ነዉ የወሰደት/እየወሰደ የነበር? 1. ሆስፒታሌ ተኝቼ 2. ተመሊሌሼ 312
309 ሇምን ያህሌ ጊዜ ነበር የተኙት? --------------------ቀናት/ሳምንት/ወራት
310 በሆስፒታለ ላሊ ሰዉ/ አስታማሚ/ ከእርስዎ ጋር ቆይቶ ነበር/ሩ? 1. አዎን (ስንት? ----------ሇ-----ቀናት 2. አሌነበረም
311 የቲቢ መዴሃኒት ሇመዉሰዴ ሆስፒታሌ በተኙበት ጊዜ በአጠቃሊይ
ሇእርስዎና አስታማሚዎ ሇሚከተለት ጉዲዮች ምን ያህሌ ብር
ከፈለ?
1. ሇምግብ----------
2. ሇመኝታ -----------
3. ሇሊብራቶሪ ምርመራዎች-------
4. ሇመዴሃኒት------------
5. ሇሆስፒታሌ አገሌግልት---------
6. ላሊ----------------
7. ምንም አሌከፈሌኩም
8. አሊስታዉስም
312 አሁን መዴሃኒት የሚወስደበት ይህ ጣቢያ ከቤትዎ ምን ያህሌ
ይርቃሌ?
_______ሰዓት/ዯቂቃ በእግር /በትራንስፖርት----------/ኪሜ/
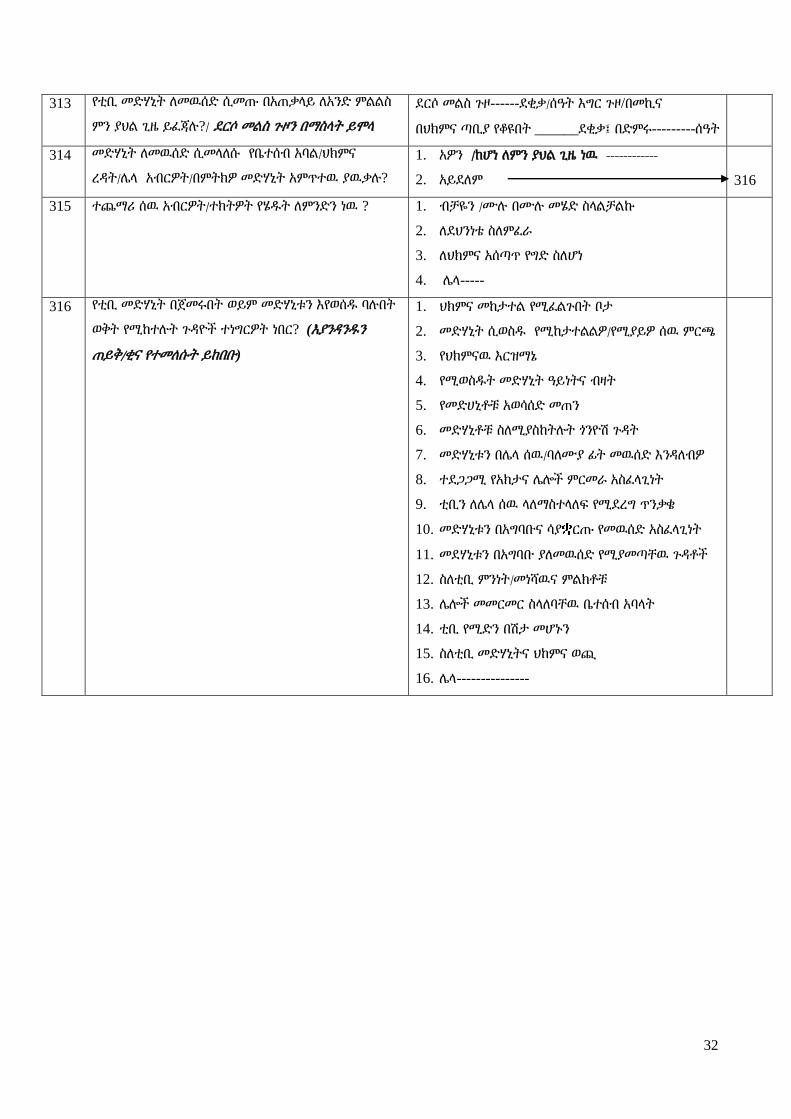
32
313 የቲቢ መዴሃኒት ሇመዉሰዴ ሲመጡ በአጠቃሊይ ሇአንዴ ምሌሌስ
ምን ያህሌ ጊዜ ይፈጃለ?/ ዯርሶ መሌስ ጉዞን በማስሊት ይሞሊ
ዯርሶ መሌስ ጉዞ------ዯቂቃ/ሰዓት እግር ጉዞ/በመኪና
በህክምና ጣቢያ የቆዩበት ______ዯቂቃ፤ በዴምሩ---------ሰዓት
314 መዴሃኒት ሇመዉሰዴ ሲመሊሇሱ የቤተሰብ አባሌ/ህክምና
ረዲት/ላሊ አብርዎት/በምትክዎ መዴሃኒት አምጥተዉ ያዉቃለ?
1. አዎን /ከሆነ ሇምን ያህሌ ጊዜ ነዉ ------------
2. አይዯሇም
316
315 ተጨማሪ ሰዉ አብርዎት/ተክትዎት የሄደት ሇምንዴን ነዉ ?
1. ብቻዬን /ሙለ በሙለ መሄዴ ስሊሌቻሌኩ
2. ሇዯህንነቴ ስሇምፈራ
3. ሇህክምና አሰጣጥ የግዴ ስሇሆነ
4. ላሊ-----
316 የቲቢ መዴሃኒት በጀመሩበት ወይም መዴሃኒቱን እየወሰደ ባለበት
ወቅት የሚከተለት ጉዲዮች ተነግርዎት ነበር? (እያንዲንደን
ጠይቅ/ቂና የተመሇሱት ይከበቡ)
1. ህክምና መከታተሌ የሚፈሌጉበት ቦታ
2. መዴሃኒት ሲወስደ የሚከታተሌሌዎ/የሚያይዎ ሰዉ ምርጫ
3. የህክምናዉ እርዝማኔ
4. የሚወስደት መዴሃኒት ዓይነትና ብዛት
5. የመዴሀኒቶቹ አወሳሰዴ መጠን
6. መዴሃኒቶቹ ስሇሚያስከትለት ጎንዮሽ ጉዲት
7. መዴሃኒቱን በላሊ ሰዉ/ባሇሙያ ፊት መዉሰዴ እንዲሇብዎ
8. ተዯጋጋሚ የአክታና ላልች ምርመራ አስፈሊጊነት
9. ቲቢን ሇላሊ ሰዉ ሊሇማስተሊሇፍ የሚዯረግ ጥንቃቄ
10. መዴሃኒቱን በአግባቡና ሳያ ርጡ የመዉሰዴ አስፈሊጊነት
11. መዯሃኒቱን በአግባቡ ያሇመዉሰዴ የሚያመጣቸዉ ጉዲቶች
12. ስሇቲቢ ምንነት/መነሻዉና ምሌክቶቹ
13. ላልች መመርመር ስሊሇባቸዉ ቤተሰብ አባሊት
14. ቲቢ የሚዴን በሽታ መሆኑን
15. ስሇቲቢ መዴሃኒትና ህከምና ወጪ
16. ላሊ---------------

33
ክፍሌ አራት፤ ቀጥተኛ ያሌሆኑ የቲቢ ህክምና አገሌግልት ፍሇጋ፤ ምርመራና ህክምና ወጪዎች
401 መዯበኛ ስራዎ ምንዴነዉ? 1. የመንግስት/ግሌ ተቀጣሪ 7. ተማሪ 7. ላሊ----------
2. አርሶ አዯር 5. ነጋዳ
3. የቀን ሰራተኛ 6. የሇኝም
402 ከመዯበኛ ስራ ዉጭ ላሊ ተጨማሪ /የትርፍ ሰዓት ስራ፣
ስሌጠና፣ጥገናዎች፣ ንግዴ ላሊ / ስራ ይሰራለ?
1. አዎን 2. አሌሰራም
403 መዯበኛም ሆነ ተጨማሪ ስራዎን ሁሌ ጊዜ ይሰራለ? 1. አዎን
2. አይዯሇም
406
404 መዯበኛ/ተጨማሪ ስራዎን ሁሌጊዜ ያሌሰሩት ሇምንዴነዉ? 1. በቲቢ ህመም ምክንያት 2. ላሊ----------------------
405 መዯበኛ ስራዎን ሙለ በሙለ ሲሰሩ የነበሩት መቼ ነዉ ? 1. ---------------ቀን/ወር/ዓም 2. ---------ቀናት/ሳምንት/ወር በፊት
406 ቲቢ ከመታመምዎ በፊት በቀን ምን ያህሌ ሰዓት ይሰራለ? -------------------------------ሰዓት በቀን
407 ቲቢ ከታመሙ በ ሊስ በቀን ምን ያህሌ ሰዓት ይሰራለ? ------------ሰዓት በቀን
408 የስራ ሰዓቱ ሌዩነት ካሇዉ፤ ሌዩነቱ በቲቢ ምክንያት ነዉ? 1. አዎን 2. አይዯሇም
409 በቲቢ ህመምና ህክምና ምክንያት ስራ አቁመዉ ነበር? 3. አዎን 2. አይዯሇም 413
410 አቁመዉ ከሆነ፤ ሇምን ያህሌ ጊዜ ነበር ያቆሙት? -----------------------ቀን/ሳምንት/ወራት
411 በእርስዎ ይሸፈን የነበረዉን የቤት ወይም ላሊ ስራ ማን
ነበር የሚሰራሌዎ?
1. የቤተሰብ አባሌ 3. የተቀጠረ ቅጥረኛ 5. ላሊ
2. ተወካይ 4. ማንም አሌሰራሌኝም
412 ስራዎትን በማቆምዎ ምን ያህሌ ገቢ ያጡ ይመስሌዎታሌ? 1. ከመዯበኛ ስራ----------------------- ብር በቀን/ወር/ ዓመት
2. ከተጨማሪ ስራ--------------------------ብር በቀን/ወር/ ዓመት
413 ከቤተሰብ አባሌዎ በእርስዎ ቲቢ ህመም ምክንያት መዯበኛ
ስራቸዉን አቁመዉ ነበር?
1. አዎን /ስንት ናቸዉ-------------------------
2. አይዯሇም
501
414 ስራቸዉን ያቆሙት ዋና ስራቸዉ ምንዴነዉ? 1. የመንግስት/ግሌ ተቀጣሪ 7. ተማሪ 7. ላሊ----------
2. አርሶ አዯር 5. ነጋዳ
3. የቀን ሰራተኛ 6. የሇኝም
415 ሇምን ያህሌ ጊዜ ነበር ስራቸዉን ያቆሙት? --------------------ቀናት/ሳምንት/ወራት
416 የቤተሰብ አባሌዎ ስራቸዉን ባሇመስራታቸዉ ምን ያህሌ
ገቢ ያጡ ይመስልታሌ?/ አባሊቱን በመዘርዘር ይጠየቅ
1. ____________ብር 2. አሊዉቅም
ክፍሌ 5፡ የቤተሰብ ገቢ፣ ወጪና አጠቃሊይ ሁኔታዎች
501 የቤታችሁ አባወራ ማን ነዉ? 1. እኔ/ታማሚዉ 3. አባቴ 5. ወንዴሜ/እህቴ
2. ባሇቤቴ 4. እናቴ 6. ላሊ----------
502 የቤተሰቡ ዋና ገቢ ምንጭ/ዋና ገቢ የሚያገኝ ማን ነዉ? 1. እኔ/ታማሚዉ 3. አባቴ 5. ወንዴሜ/እህቴ
2. ባሇቤቴ 4. እናቴ 6. ላሊ----------
503 የቤቱ ዋና ገቢ ምንጭ ከፍተኛ የት/ርት ዯረጃዉ ምንዴነዉ?
1. ምንም ያሌተማረ
2. የመጀመሪያ ሳይክሌ ያጠናቀቀ/ች (1-4)
3. ሁሇተኛ ሳይክሌ ያጠናቀቀ/ች (5-8)
4. ሁሇተኛ ዯረጃ ያጠናቀቀ(9-12)
5. የተመረቀ /ሰርትፍኬት/ዱፕልማ/ዱግሪ
504 የቤቱ አባወራ ከፍተኛ የት/ርት ዯረጃ 1. ምንም ያሌተማረ
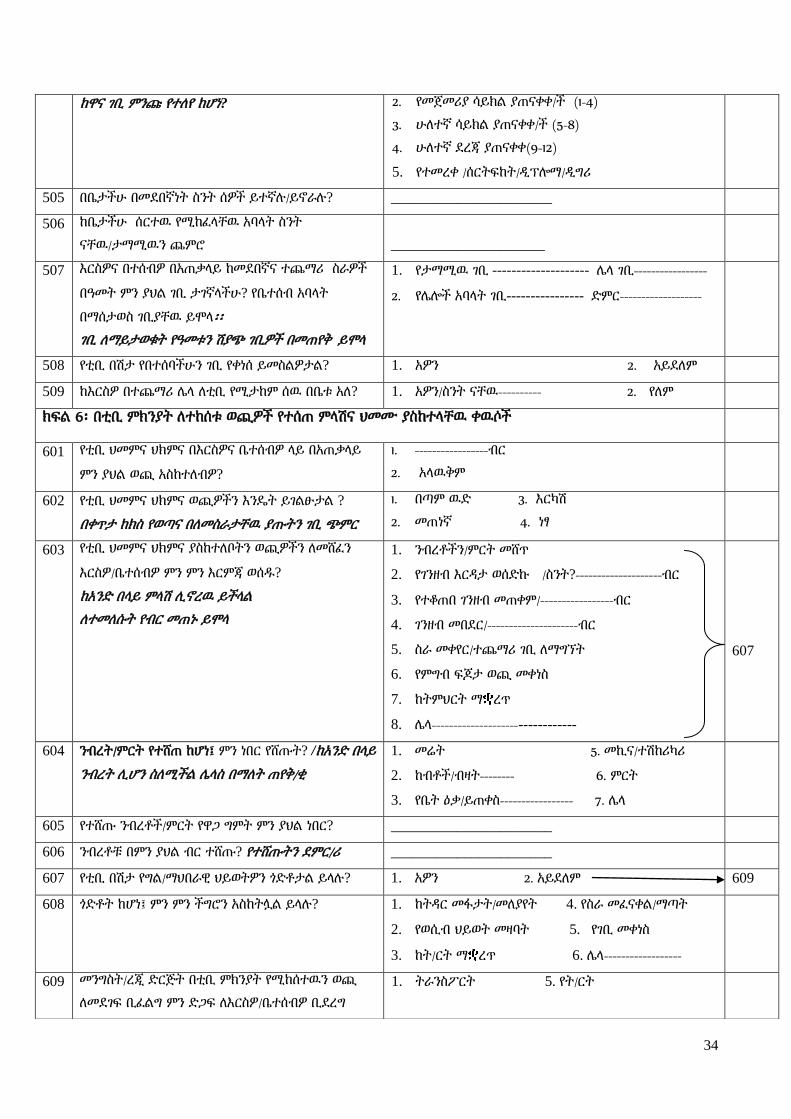
34
ከዋና ገቢ ምንጩ የተሇየ ከሆነ? 2. የመጀመሪያ ሳይክሌ ያጠናቀቀ/ች (1-4)
3. ሁሇተኛ ሳይክሌ ያጠናቀቀ/ች (5-8)
4. ሁሇተኛ ዯረጃ ያጠናቀቀ(9-12)
5. የተመረቀ /ሰርትፍከት/ዱፕልማ/ዱግሪ
505 በቤታችሁ በመዯበኛነት ስንት ሰዎች ይተኛለ/ይኖራለ? ______________________
506 ከቤታችሁ ሰርተዉ የሚከፈሊቸዉ አባሊት ስንት
ናቸዉ/ታማሚዉን ጨምሮ _____________________
507 እርስዎና በተሰብዎ በአጠቃሊይ ከመዯበኛና ተጨማሪ ስራዎች
በዓመት ምን ያህሌ ገቢ ታገኛሊችሁ? የቤተሰብ አባሊት
በማሰታወስ ገቢያቸዉ ይሞሊ፡፡
ገቢ ሇማይታወቁት የዓመቱን ሽያጭ ገቢዎች በመጠየቅ ይሞሊ
1. የታማሚዉ ገቢ -------------------- ላሊ ገቢ-----------------
2. የላልች አባሊት ገቢ---------------- ዴምር-------------------
508 የቲቢ በሽታ የበተሰባችሁን ገቢ የቀነሰ ይመስሌዎታሌ? 1. አዎን 2. አይዯሇም
509 ከእርስዎ በተጨማሪ ላሊ ሇቲቢ የሚታከም ሰዉ በቤቱ አሇ? 1. አዎን/ስንት ናቸዉ---------- 2. የሇም
ክፍሌ 6፡ በቲቢ ምክንያት ሇተከሰቱ ወጪዎች የተሰጠ ምሊሽና ህመሙ ያስከተሊቸዉ ቀዉሶች
601 የቲቢ ህመምና ህክምና በእርስዎና ቤተሰብዎ ሊይ በአጠቃሊይ
ምን ያህሌ ወጪ አስከተሇብዎ?
1. -----------------ብር
2. አሊዉቅም
602 የቲቢ ህመምና ህክምና ወጪዎችን እንዳት ይገሌፁታሌ ?
በቀጥታ ከክስ የወጣና በሇመስራታቸዉ ያጡትን ገቢ ጭምር
1. በጣም ዉዴ 3. እርካሽ
2. መጠነኛ 4. ነፃ
603 የቲቢ ህመምና ህክምና ያስከተሇቦትን ወጪዎችን ሇመሸፈን
እርስዎ/ቤተሰብዎ ምን ምን እርምጃ ወሰደ?
ከአንዴ በሊይ ምሊሽ ሉኖረዉ ይችሊሌ
ሇተመሇሱት የብር መጠኑ ይሞሊ
1. ንብረቶችን/ምርት መሸጥ
2. የገንዘብ እርዲታ ወሰዴኩ /ስንት?--------------------ብር
3. የተቆጠበ ገንዘብ መጠቀም/-----------------ብር
4. ገንዘብ መበዯር/---------------------ብር
5. ስራ መቀየር/ተጨማሪ ገቢ ሇማግኘት
6. የምግብ ፍጆታ ወጪ መቀነስ
7. ከትምህርት ማ ረጥ
8. ላሊ--------------------------------
607
604 ንብረት/ምርት የተሸጠ ከሆነ፤ ምን ነበር የሸጡት? /ከአንዴ በሊይ
ንብረት ሉሆን ስሇሚችሌ ላሊስ በማሇት ጠየቅ/ቂ
1. መሬት 5. መኪና/ተሽከሪካሪ
2. ከብቶች/ብዛት-------- 6. ምርት
3. የቤት ዕቃ/ይጠቀስ----------------- 7. ላሊ
605 የተሸጡ ንብረቶች/ምርት የዋጋ ግምት ምን ያህሌ ነበር? ______________________
606 ንብረቶቹ በምን ያህሌ ብር ተሸጡ? የተሸጡትን ዯምር/ሪ ______________________
607 የቲቢ በሽታ የግሌ/ማህበራዊ ህይወትዎን ጎዴቶታሌ ይሊለ? 1. አዎን 2. አይዯሇም 609
608 ጎዴቶት ከሆነ፤ ምን ምን ችግሮን አስከትሎሌ ይሊለ? 1. ከትዲር መፋታት/መሇያየት 4. የስራ መፈናቀሌ/ማጣት
2. የወሲብ ህይወት መዛባት 5. የገቢ መቀነስ
3. ከት/ርት ማ ረጥ 6. ላሊ------------------
609 መንግስት/ረጂ ዴርጅት በቲቢ ምክንያት የሚከሰተዉን ወጪ
ሇመዯገፍ ቢፈሌግ ምን ዴጋፍ ሇእርስዎ/ቤተሰብዎ ቢዯረግ
1. ትራንስፖርት 5. የት/ርት
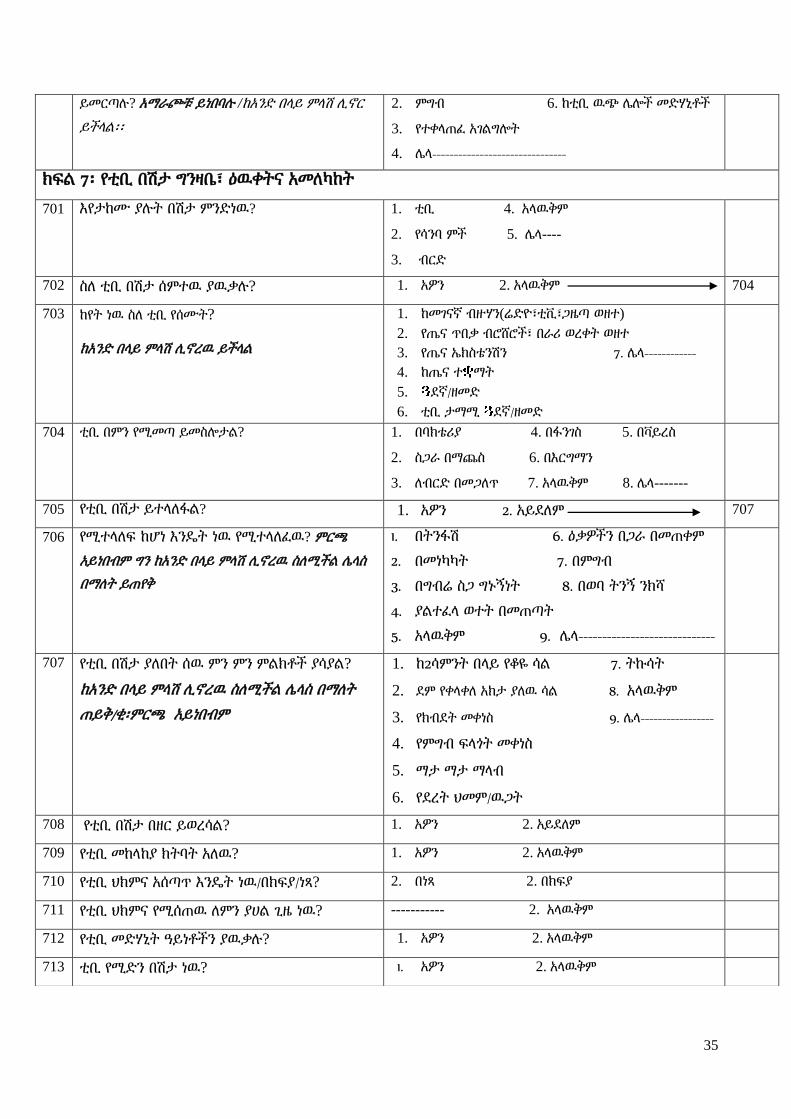
35
ይመርጣለ? አማራጮቹ ይነበባለ /ከአንዴ በሊይ ምሊሽ ሉኖር
ይችሊሌ፡፡
2. ምግብ 6. ከቲቢ ዉጭ ላልች መዴሃኒቶች
3. የተቀሊጠፈ አገሌግልት
4. ላሊ-------------------------------
ክፍሌ 7፡ የቲቢ በሽታ ግንዛቤ፣ ዕዉቀትና አመሇካከት
701 እየታከሙ ያለት በሽታ ምንዴነዉ? 1. ቲቢ 4. አሊዉቅም
2. የሳንባ ምች 5. ላሊ----
3. ብርዴ
702 ስሇ ቲቢ በሽታ ሰምተዉ ያዉቃለ? 1. አዎን 2. አሊዉቅም 704
703 ከየት ነዉ ስሇ ቲቢ የሰሙት?
ከአንዴ በሊይ ምሊሽ ሉኖረዉ ይችሊሌ
1. ከመገናኛ ብዙሃን(ሬዴዮ፣ቲቪ፣ጋዜጣ ወዘተ)
2. የጤና ጥበቃ ብሮሸሮች፣ በራሪ ወረቀት ወዘተ
3. የጤና ኤክስቴንሽን 7. ላሊ------------
4. ከጤና ተ ማት
5. ዯኛ/ዘመዴ
6. ቲቢ ታማሚ ዯኛ/ዘመዴ
704 ቲቢ በምን የሚመጣ ይመስልታሌ? 1. በባክቴሪያ 4. በፋንገስ 5. በቫይረስ
2. ስጋራ በማጨስ 6. በእርግማን
3. ሇብርዴ በመጋሇጥ 7. አሊዉቅም 8. ላሊ-------
705 የቲቢ በሽታ ይተሊሇፋሌ? 1. አዎን 2. አይዯሇም 707
706 የሚተሊሇፍ ከሆነ እንዳት ነዉ የሚተሊሇፈዉ? ምርጫ
አይነበብም ግን ከአንዴ በሊይ ምሊሽ ሉኖረዉ ስሇሚችሌ ላሊስ
በማሇት ይጠየቅ
1. በትንፋሽ 6. ዕቃዎችን በጋራ በመጠቀም
2. በመነካካት 7. በምግብ
3. በግብሬ ስጋ ግኑኝነት 8. በወባ ትንኝ ንክሻ
4. ያሌተፈሊ ወተት በመጠጣት
5. አሊዉቅም 9. ላሊ-----------------------------
707 የቲቢ በሽታ ያሇበት ሰዉ ምን ምን ምሌክቶች ያሳያሌ?
ከአንዴ በሊይ ምሊሽ ሉኖረዉ ስሇሚችሌ ላሊስ በማሇት
ጠይቅ/ቂ፡ምርጫ አይነበብም
1. ከ2ሳምንት በሊይ የቆዬ ሳሌ 7. ትኩሳት
2. ዯም የቀሊቀሇ አክታ ያሇዉ ሳሌ 8. አሊዉቅም
3. የክብዯት መቀነስ 9. ላሊ-----------------
4. የምግብ ፍሊጎት መቀነስ
5. ማታ ማታ ማሊብ
6. የዯረት ህመም/ዉጋት
708 የቲቢ በሽታ በዘር ይወረሳሌ? 1. አዎን 2. አይዯሇም
709 የቲቢ መከሊከያ ክትባት አሇዉ? 1. አዎን 2. አሊዉቅም
710 የቲቢ ህክምና አሰጣጥ እንዳት ነዉ/በክፍያ/ነጻ? 2. በነጻ 2. በክፍያ
711 የቲቢ ህክምና የሚሰጠዉ ሇምን ያሀሌ ጊዜ ነዉ? ----------- 2. አሊዉቅም
712 የቲቢ መዴሃኒት ዓይነቶችን ያዉቃለ? 1. አዎን 2. አሊዉቅም
713 ቲቢ የሚዴን በሽታ ነዉ? 1. አዎን 2. አሊዉቅም
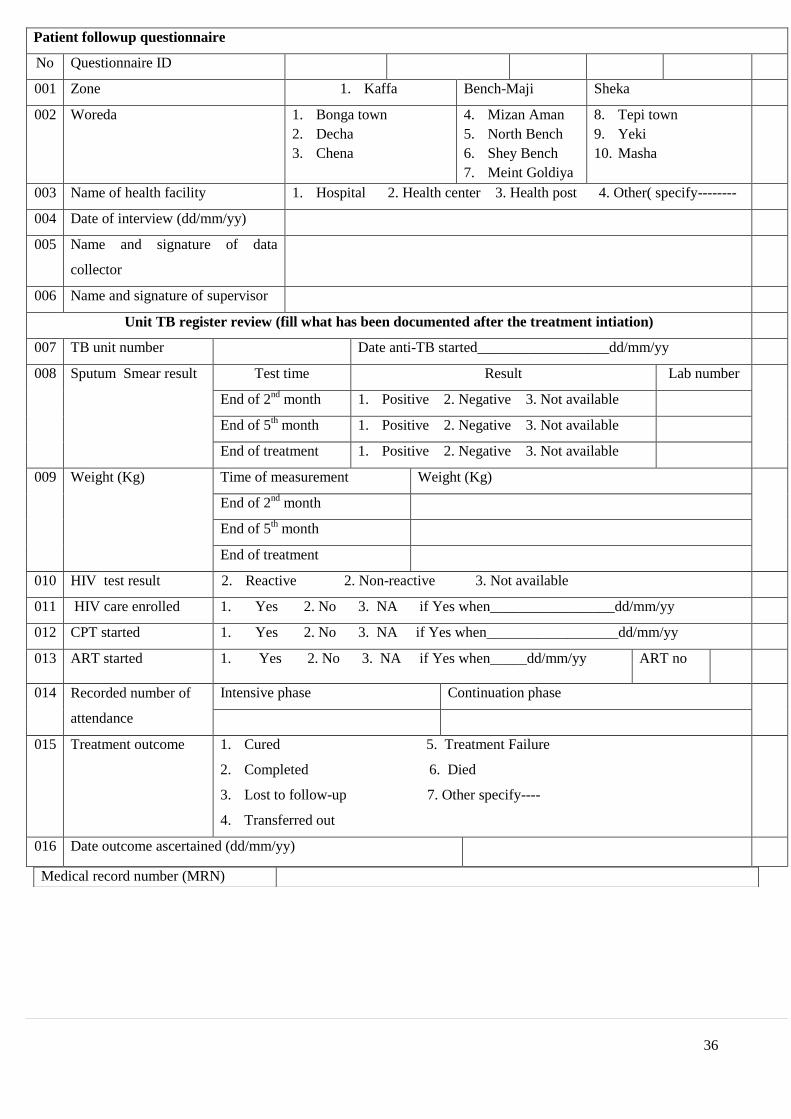
36
Patient followup questionnaire
No Questionnaire ID
001 Zone 1. Kaffa Bench-Maji Sheka
002 Woreda 1. Bonga town
2. Decha
3. Chena
4. Mizan Aman
5. North Bench
6. Shey Bench
7. Meint Goldiya
8. Tepi town
9. Yeki
10. Masha
003 Name of health facility 1. Hospital 2. Health center 3. Health post 4. Other( specify--------
004 Date of interview (dd/mm/yy)
005 Name and signature of data
collector
006 Name and signature of supervisor
Unit TB register review (fill what has been documented after the treatment intiation)
007 TB unit number Date anti-TB started__________________dd/mm/yy
008 Sputum Smear result Test time Result Lab number
End of 2nd
month 1. Positive 2. Negative 3. Not available
End of 5th month 1. Positive 2. Negative 3. Not available
End of treatment 1. Positive 2. Negative 3. Not available
009 Weight (Kg) Time of measurement Weight (Kg)
End of 2nd
month
End of 5th month
End of treatment
010 HIV test result 2. Reactive 2. Non-reactive 3. Not available
011 HIV care enrolled 1. Yes 2. No 3. NA if Yes when_________________dd/mm/yy
012 CPT started 1. Yes 2. No 3. NA if Yes when__________________dd/mm/yy
013 ART started 1. Yes 2. No 3. NA if Yes when_____dd/mm/yy ART no
014 Recorded number of
attendance
Intensive phase Continuation phase
015 Treatment outcome 1. Cured 5. Treatment Failure
2. Completed 6. Died
3. Lost to follow-up 7. Other specify----
4. Transferred out
016 Date outcome ascertained (dd/mm/yy)
Medical record number (MRN)

37
Number of Visits after TB DX
Date of Visit (dd/mm/yy) Reason for visit /diagnosis Investigations/
Treatment prescribed
Unit cost
Patient follow-up interview questionnaire
801 Date of follow up (dd/mm/yy)
802 Place follow up made 1. Home 2. Health facility
803 Outcome of follow up 1. Patient traced and interviewed
2. Patient transferred to other treatment center
3. Patient lost to follow-up
4. Treatment failed and regimen changed
5. Patient died
Stop
804 Person interviewed 1. Patient
2. Parents/care giver
3. Treatment supporter
4. Other (specify-----------------------
805 From where were you getting the required drugs? During intensive phase Continuation phase
1. This center
2. Health post
3. Other (--------
1. This center
2. Health post
3. Other (--------
806 How frequent were you picking the anti-TB
drugs
During intensive phase Continuation phase
1. Daily
2. Every three days
3. Weekly
4. Other --------------
1. Daily
2. Every three days
3. Weekly
4. Monthly
807 Were you ever been observed by someone while
you took the anti-TB drugs
1. Yes
2. No
810
808 While you were taking your medicines, During intensive phase Continuation phase
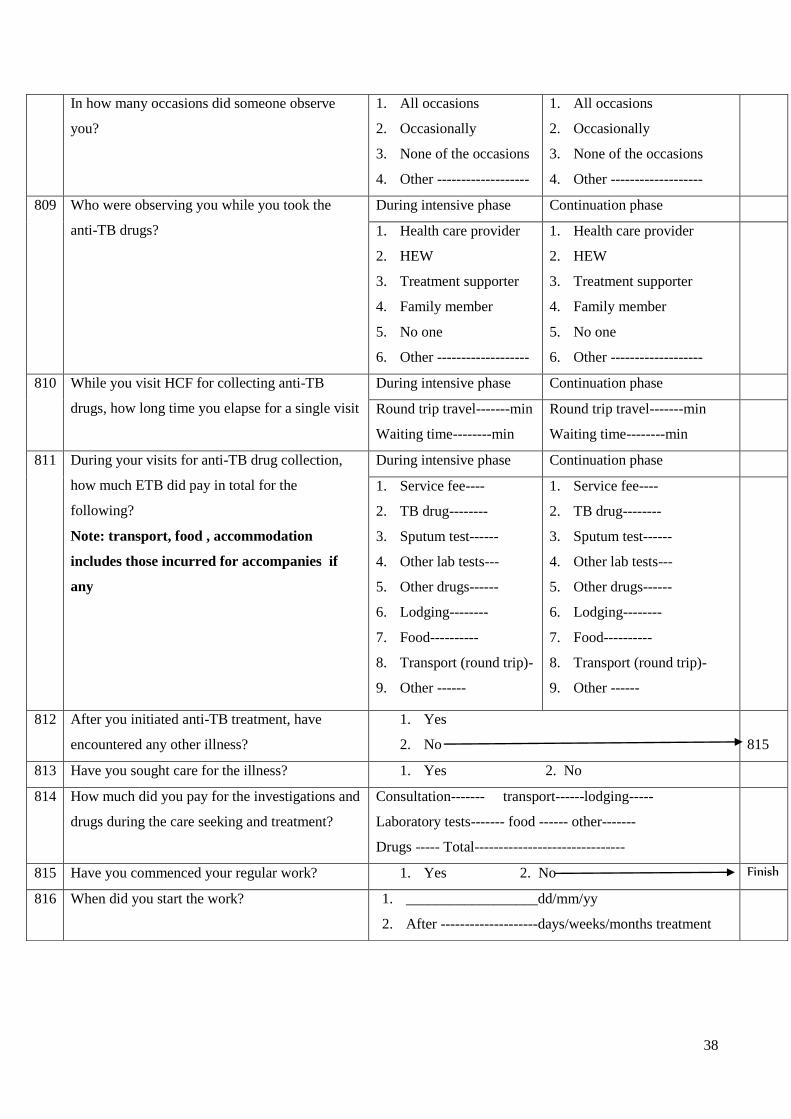
38
In how many occasions did someone observe
you?
1. All occasions
2. Occasionally
3. None of the occasions
4. Other -------------------
1. All occasions
2. Occasionally
3. None of the occasions
4. Other -------------------
809 Who were observing you while you took the
anti-TB drugs?
During intensive phase Continuation phase
1. Health care provider
2. HEW
3. Treatment supporter
4. Family member
5. No one
6. Other -------------------
1. Health care provider
2. HEW
3. Treatment supporter
4. Family member
5. No one
6. Other -------------------
810 While you visit HCF for collecting anti-TB
drugs, how long time you elapse for a single visit
During intensive phase Continuation phase
Round trip travel-------min
Waiting time--------min
Round trip travel-------min
Waiting time--------min
811 During your visits for anti-TB drug collection,
how much ETB did pay in total for the
following?
Note: transport, food , accommodation
includes those incurred for accompanies if
any
During intensive phase Continuation phase
1. Service fee----
2. TB drug--------
3. Sputum test------
4. Other lab tests---
5. Other drugs------
6. Lodging--------
7. Food----------
8. Transport (round trip)-
9. Other ------
1. Service fee----
2. TB drug--------
3. Sputum test------
4. Other lab tests---
5. Other drugs------
6. Lodging--------
7. Food----------
8. Transport (round trip)-
9. Other ------
812 After you initiated anti-TB treatment, have
encountered any other illness?
1. Yes
2. No
815
813 Have you sought care for the illness? 1. Yes 2. No
814 How much did you pay for the investigations and
drugs during the care seeking and treatment?
Consultation------- transport------lodging-----
Laboratory tests------- food ------ other-------
Drugs ----- Total-------------------------------
815 Have you commenced your regular work? 1. Yes 2. No Finish
816 When did you start the work? 1. __________________dd/mm/yy
2. After --------------------days/weeks/months treatment

39
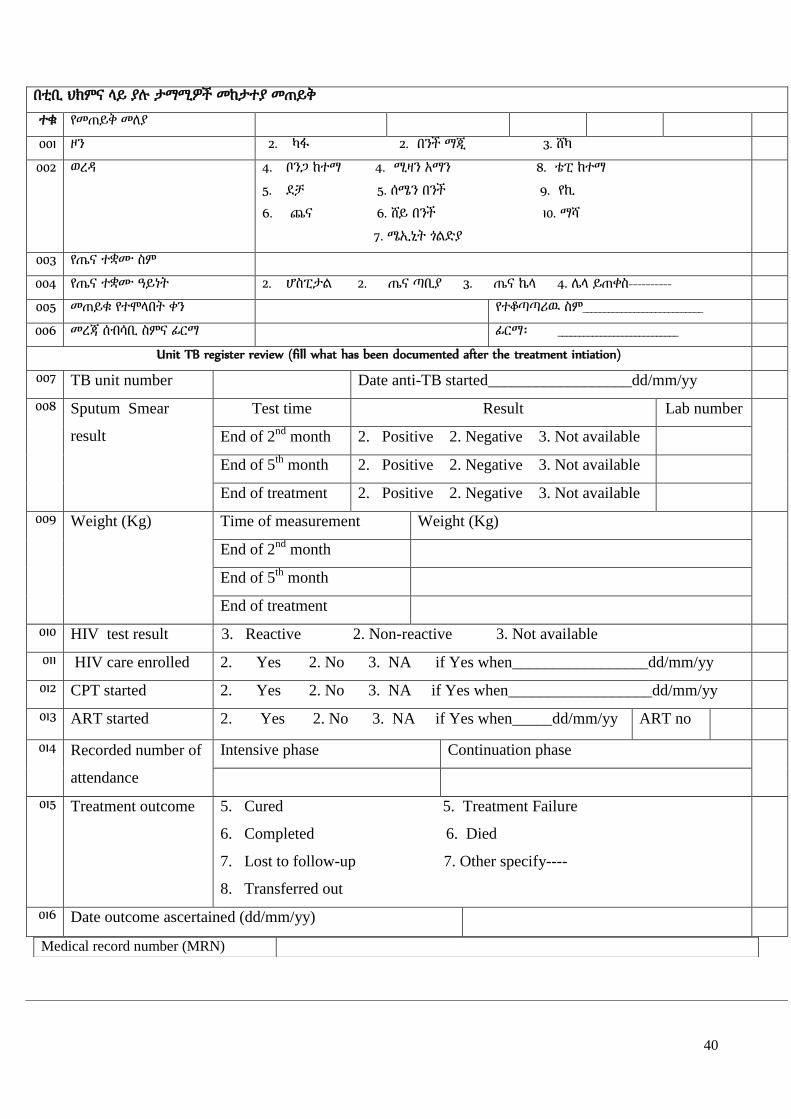
40
በቲቢ ህክምና ሊይ ያለ ታማሚዎች መከታተያ መጠይቅ
ተቁ የመጠይቅ መሇያ
001 ዞን 2. ካፋ 2. በንች ማጂ 3. ሸካ
002 ወረዲ 4. ቦንጋ ከተማ 4. ሚዛን አማን 8. ቴፒ ከተማ
5. ዯቻ 5. ሰሜን በንች 9. የኪ
6. ጨና 6. ሸይ በንች 10. ማሻ
7. ሜኢኒት ጎሌዴያ
003 የጤና ተቋሙ ስም
004 የጤና ተቋሙ ዓይነት 2. ሆስፒታሌ 2. ጤና ጣቢያ 3. ጤና ኬሊ 4. ላሊ ይጠቀስ----------
005 መጠይቁ የተሞሊበት ቀን የተቆጣጣሪዉ ስም____________________________
006 መረጃ ሰብሳቢ ስምና ፊርማ ፊርማ፡ ____________________________
Unit TB register review (fill what has been documented after the treatment intiation)
007 TB unit number Date anti-TB started__________________dd/mm/yy
008 Sputum Smear
result
Test time Result Lab number
End of 2nd
month 2. Positive 2. Negative 3. Not available
End of 5th
month 2. Positive 2. Negative 3. Not available
End of treatment 2. Positive 2. Negative 3. Not available
009 Weight (Kg) Time of measurement Weight (Kg)
End of 2nd
month
End of 5th
month
End of treatment
010 HIV test result 3. Reactive 2. Non-reactive 3. Not available
011 HIV care enrolled 2. Yes 2. No 3. NA if Yes when_________________dd/mm/yy
012 CPT started 2. Yes 2. No 3. NA if Yes when__________________dd/mm/yy
013 ART started 2. Yes 2. No 3. NA if Yes when_____dd/mm/yy ART no
014 Recorded number of
attendance
Intensive phase Continuation phase
015 Treatment outcome 5. Cured 5. Treatment Failure
6. Completed 6. Died
7. Lost to follow-up 7. Other specify----
8. Transferred out
016 Date outcome ascertained (dd/mm/yy)
Medical record number (MRN)

41
Number of Visits after TB DX
Date of Visit (dd/mm/yy) Reason for visit /diagnosis Investigations/
Treatment prescribed
Unit cost
የታማሚ ወይም አስታማሚዎች ክትትሌ መጠይቅ
801 ክትትለ የተዯረገበት ጊዜ/ቀን/ወር/ዓም/
802 ክትትለ የተዯረገበት ቦታ 2. የታማሚ ቤት 2. በጤና ተቀም 3. ላሊ ካሇ ይገሇፅ----
803 የክትትለ ዉጤት 6. ታማሚዉ ተግኝቶ ተጠይቋሌ
7. ታማሚዉ ወዯ ላሊ ህክምና ጣቢያ ተዛዉሯሌ /ይጠቀስ-----------
8. ታማሚዉ ህክምናዉን አቋርጧሌ
9. ታማሚዉ ህክምናዉን ቀይሯሌ
10. ታማሚዉ ሞቷሌ
አቁም
804 ቃሇ መጠየቁ የተዯረገሇት ሰዉ 5. ታማሚዉ 3. የህክምና ረዲት
6. የቤተሰብ አባሌ/ይጠቀስ---------- 4. ላሊ ይገሇፅ-----------------
805 የሚያስፈሌጎትን መዴሃኒት መጠን ከየት ነበር የሚያገኙት ? በመጀመሪያ ሁሇት ወራት ቀጣይ አራት ወራት
4. እዝሁ ጣቢያ
5. ጤና ከሊ
6. ላሊ --------------------
1. እዝሁ ጣቢያ
2. ጤና ከሊ
3. ላሊ --------------------
806 የሚያስፈሌጎትን መዴሃኒት መጠን በምን ያህሌ ጊዜ ነበር
የሚያገኙት ?
በመጀመሪያ ሁሇት ወራት ቀጣይ አራት ወራት
5. በየቀኑ
6. በየሶስት ቀን
7. በየሳምንቱ
8. ላሊ ይጠቀስ……….
5. በየቀኑ
6. በየሶስት ቀን
7. በየሳምንቱ
8. በየወሩ
807 መዴሃኒት በሚዉጡበት ጊዜ ላሊ ሰዉ አይቶት ያዉቃሌ? 1. አዎን
2. አይዯሇም
810
808 ባሇፉት የመዴሃኒት አወሳሰዴ ወቅት መዴሃኒትዎን ሲዉጡ ላሊ
ሰዉ ሇምን ያህሌ ጊዜ ነበር ያየዎት?
በመጀመሪያ ሁሇት ወራት ቀጣይ አራት ወራት
5. ሁለም ጊዜ
6. አሌፎ አሌፎ
7. አንዴም ቀን አሌታየሁም
8. ላሊ----------------------
1. ሁለም ጊዜ
2. አሌፎ አሌፎ
3. አንዴም ቀን አሌታየሁም
4. ላሊ----------------------
809 መዴሃኒትዎን ሲዉጡ አብዛኛዉን ጊዜ የሚከታተሌዎ/ በመጀመሪያ ሁሇት ወራት ቀጣይ አራት ወራት

42
የሚያይዎ ማን ነበር? 7. የጤና ባሇሙያ
8. ጤና ኤክስቴንሸን ሰራተኛ
9. የህክምና ረዲት
10. ቤተሰብ/ዘመዴ
11. ማንም አሊየኝም
12. ላሊ-------------
1. የጤና ባሇሙያ
2. ጤና ኤክስቴንሸን ሰራተኛ
3. የህክምና ረዲት
4. ቤተሰብ/ዘመዴ
5. ማንም አሊየኝም
6. ላሊ-------------
810 መዴሃኒት ሇመዉሰዴ ሲመሊሇሱ በአንዴ ምሌሌስ ሇጉዞ
በመንገዴ ሊይና መዴሃኒት ሇመዉሰዴ በአጠቃሇይ ምን ያህሌ
ጊዜ ይወስዴበዎት ነበር?
በመጀመሪያ ሁሇት ወራት ቀጣይ አራት ወራት
ዯርሶ መሌስ ጉዞ----------ዯቂቃ
በጣቢያዉ-----------------ዯቂቃ
ዯርሶ መሌስ ጉዞ----------ዯቂቃ
በጣቢያዉ-----------------ዯቂቃ
811 ቲቢ መዴሃኒት መዉሰዴ ከጀመሩ በኋሊ መዴሃኒት ሇመዉሰዴ
ሲመሊሇሱ እስካሁን ሇሚከተለት ጉዲዮች ምን ያህሌ ብር
ከፈለ?
/ትራንሰፖርት፣ ምግብ፣ መኝታ ላሊ ተጨማሪ ሰዉ አብረዉ
ከነበሩ የእነሱን ጭምር ይሞሊ
በመጀመሪያ ሁሇት ወራት ቀጣይ አራት ወራት
10. አገሌግልት ክፍያ----------
11. ሇቲቢ መዴሃኒት---------
12. ሇአክታ ምርመራ---------
13. ላሊ ሊብራቶሪ ምርመራ------
14. ከቲቢ ዉጭ መዴሃኒት -----
15. ሇመኝታ/ማዯሪያ-------------
16. ምግብ በመንገዴ ሊይ--------
17. ሇትራንስፖርት
/አንዴ ዯርሶ መሌስ /----------
18. ላሊ------------------
1. አገሌግልት ክፍያ----------
2. ሇቲቢ መዴሃኒት---------
3. ሇአክታ ምርመራ---------
4. ላሊ ሊብራቶሪ ምርመራ------
5. ከቲቢ ዉጭ መዴሃኒት -----
6. ሇመኝታ/ማዯሪያ-------------
7. ምግብ በመንገዴ ሊይ--------
8. ሇትራንስፖርት
/አንዴ ዯርሶ መሌስ /----------
9. ላሊ------------------
812 የቲቢ መዴሃኒት መዉሰዴ ከጀመሩ በኋሊ ላሊ ህመም አመዎት
ያዉቃሌ?
3. አዎን
4. አይዯሇም
815
813 ሇህመሙ ህክምና እርዲታ አግኝተዉ ነበር? 1. አዎን 2. አይዯሇም
814 ሇህመሙ ህክምና፣ ምርመራና መዴሃኒት ምን ያህሌ ብር
ከፈለ?
ሇካርዴ-------- ሇትራንስፖርት--------- ላልች ወጪዎች---------
ሊብራቶሪ-------- ሇምግብና መጠጥ------- ዴምር---------------
መዴሃኒት-------- ሇማዯሪያ-----------
815 የቲቢ መዴሃኒት ከጀመሩ በኋሊ የዘወትር ተግባርዎን/ስራዎን
ይሰራለ?
2. አዎን
3. አይዯሇም
ጨርስ
816 መቼ ነዉ የዘወትር ተግባርዎን/ስራዎን የጀመሩት? ------------------ቀን/ወር----------------ቀናት/ሳምንታት/ ወራት በኋሊ

43
Patient record review/data extraction checklist
Name of data collector Name of supervisor
Name of the facility Type of facility 1. Hospital 2. Health center 3. Health post
4. Other-----)
Zone 1. Kaffa
2. Bench Maji
3. Sheka
Wereda 1. Bonga Town 5. Mizan Aman 9. Semen Bench
2. Decha 6. Debub Bench 10. Tepi town
3. Ginbo 7. Sheybench 11. Yeki
4. Chena 8. Sheko
Patient serial number 01 02 03 04 05 06 07 08 09 10
Date of extraction (dd/mm/yy)
Patient Unit TB registration number
Sex (1. Male 2. Female) 1
Age 2
Wereda of patient 3
Kebele of patient 4
Smear result ( 1. Pos 2. Neg. 3.not
available (NA)
5
Baseline weight 6
Treatment category 1. New 2.
Transfer in 3. Other
7
Type of TB 1. PTB+ 2. PTBN 3. EP 8
Drugs 1. ERHZ 2. Other --- 9
Dose (# of tabs) 10
Date treatment started 11
# of attendance counts (intensive) 12
Date intensive ended (dd/mm/yy) 13
HIV test offered (1. Yes 2. No) 14
44
HIV test result 1. R 2. NR 22 15
Enrolled for HIV care 1. Yes 2. No 16
CPT started 1. Yes 2. No 17
Date CPT started 18
ART started (1. Yes 2. No) 19
ART unique number 20
Date ART started 21
Weight 2nd
month 22
Weight 5th
month 23
Weight 6th
/7th
month 24
Sputum result end of 2nd
month
1. Positive 2. Negative 3.NA
25
Sputum result end of 5th
month
1. Positive 2. Negative 3.NA
26
Sputum result end of 6th
/7th
month
1. Positive 2. Negative 3.NA
28
Date continuation started 29
Drugs (continuation) 1. HE 2. RH 30
Dose/#of tabs 31
# of visits recorded 32
Treatment outcome
1. Cure 2.Complete
3.Default 5. Death
6. TO 7. Failure
33
Date outcome ascertained
(dd/mm/yy)
34

45
Annex 4: Assurance of principal investigator
I, the undersigned, declare that this is my original work, has never been presented in this or any
other University for fulfillment of any degree, and that all the resources and materials used for
the thesis, have been fully acknowledged.
Name of the PhD student: Abyot Asres
Signature: ____________________________________________________
Date: _________________________________________________________
Approval of the primary Supervisor
Name of the primary Supervisor: Wakgari Deressa (PhD, Associate professor)
Signature: _____________________________________________________
Date: _________________________________________________________