MALAYSIA - AsiaConstruct Conference |
102
21 st AsiaConstruct Conference Tokyo, Japan 24 & 25 November 2016 Country Report MALAYSIA Construction Industry Development Board (CIDB) Malaysia Level 10, Menara Dato’ Onn Putra World Trade Centre (PWTC) No. 45, JalanTun Ismail 50480 Kuala Lumpur Malaysia [email protected] October 2016
-
Upload
khangminh22 -
Category
Documents
-
view
1 -
download
0
Transcript of MALAYSIA - AsiaConstruct Conference |
21st
AsiaConstruct Conference
Tokyo, Japan
24 & 25 November 2016
Country Report
MALAYSIA
Construction Industry Development Board (CIDB) Malaysia
Level 10, Menara Dato’ Onn
Putra World Trade Centre (PWTC)
No. 45, JalanTun Ismail
50480 Kuala Lumpur Malaysia
October 2016
21th
AsiaConstruct Conference, Tokyo, Japan
Country Report - MALAYSIA 2
CONTENT
EXECUTIVE SUMMARY
MACROECONOMIC REVIEW AND OUTLOOK
Overview of the National Economy
Main Economic Indicator
OVERVIEW OF THE CONSTRUCTION INDUSTRY
Construction Project Review
Contractor Registration
Construction Personnel
Construction Productivity
Construction Cost
Export and Import of Construction Services
CONSTRUCTION INDUSTRY OUTLOOK IN 2016 AND 2017
21th
AsiaConstruct Conference, Tokyo, Japan
Country Report - MALAYSIA 3
EXECUTIVE SUMMARY
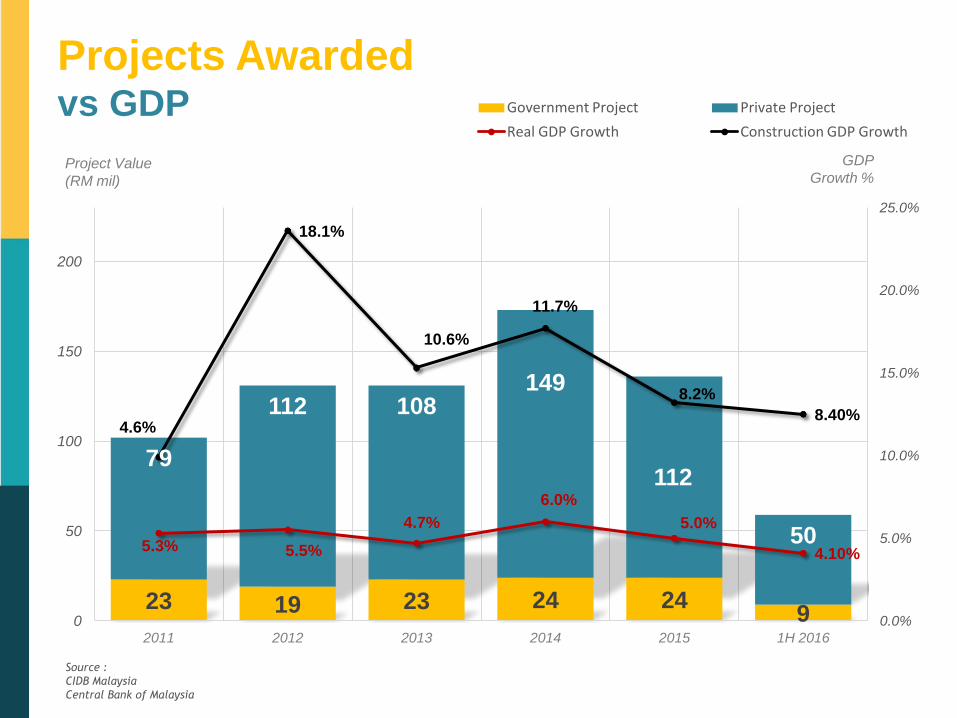
The Malaysian economy grew by 5.0% in 2015, with the construction sector
expanded at 8.2% (2014: 11.7%). The private sector continues to dominate with a
huge share of 82.5% or equivalent to RM111.7 billion from the total value of projects
awarded in 2015 (RM135.4 billion). The government sector contributes lesser at
17.5% or RM23.7 billion. Material prices for major building materials such as
aggregate, sand, ready-mixed concrete and reinforcement iron mesh A10 increased
marginally. Wages of construction personnel were also stable in 2015 showing the
same upward trend. However, the number of registered construction workers decrease
slightly. In 2016, the Malaysian economy is forecasted to grow moderately between
4.0% and 4.5%. It is estimated that the construction sector will continue to grow at a
respectable 8.7%. In terms of projects awarded, CIDB estimated that the value may
reach RM130.0 billion in 2016 and RM136.0 billion in 2017.
MACROECONOMIC REVIEW AND OUTLOOK
Main Economic Indicator 2015
In 2015, the Malaysian economy grew by 5.0% (2014: 6.0%). The growth was
supported by continued expansion of domestic demand at 5.1% (2014: 5.9%), which
was primarily driven by the private sector. Private consumption continue to expand by
6.0% (2014: 7.0%), as households adjusted their spending to the higher cost of living
from the implementation of Goods and Services Tax (GST), adjustments in
administrative prices, and the depreciation in Ringgit. Private investment registered a
lower growth of 6.4% (2014: 11.0%), weighed down partly by the moderation in
domestic demand and cautious business sentiments. In the public sector, public
consumption recorded sustained growth of 4.3% (2014; 4.4%), reflecting the
continued efforts by the government to provide support to the economy. Public
investment managed to reduce the negative growth to -1.0% (2014: -4.7%) following
the near completion of several large projects.
On the supply side, majority of the economic sectors registered moderate growth. In
2015, the construction sector grew at 8.2% (2014: 11.8%), due to the slower growth in
the residential subsector. This was followed by the services sector at 5.1% (2014:
6.6%); manufacturing sector at 4.9% (2014: 6.2%), the mining and quarrying sector at
4.7% (2014: 3.5%); and the agriculture sector at 1.2% (2014: 2.1%).
21th
AsiaConstruct Conference, Tokyo, Japan
Country Report - MALAYSIA 4
Expansion in economic activity across all sectors drives the demand for labour.
Labour force participation rate was stable at 67.6% (2014: 67.5%), while the
unemployment rate rise to 3.2% (2014: 2.9%), as cautious business sentiments led to
softer employment prospects.
The inflation rate decline to 2.1% (2014: 3.2%) as the impact of lower global energy
and commodity price, coupled with the effects from a weaker Ringgit; the
implementation of GST; and several upward adjustments in administrative prices. The
Monetary Policy Committee (MPC) maintained the Overnight Policy Rate (OPR) at
3.3% throughout 2015, while the Base Lending Rate (BLR) of commercial banks
remained at 6.8%. The Ringgit depreciated by 18.9% in 2015, and ended the year at
RM4.29 against the US Dollar.
21th
AsiaConstruct Conference, Tokyo, Japan
Country Report - MALAYSIA 5
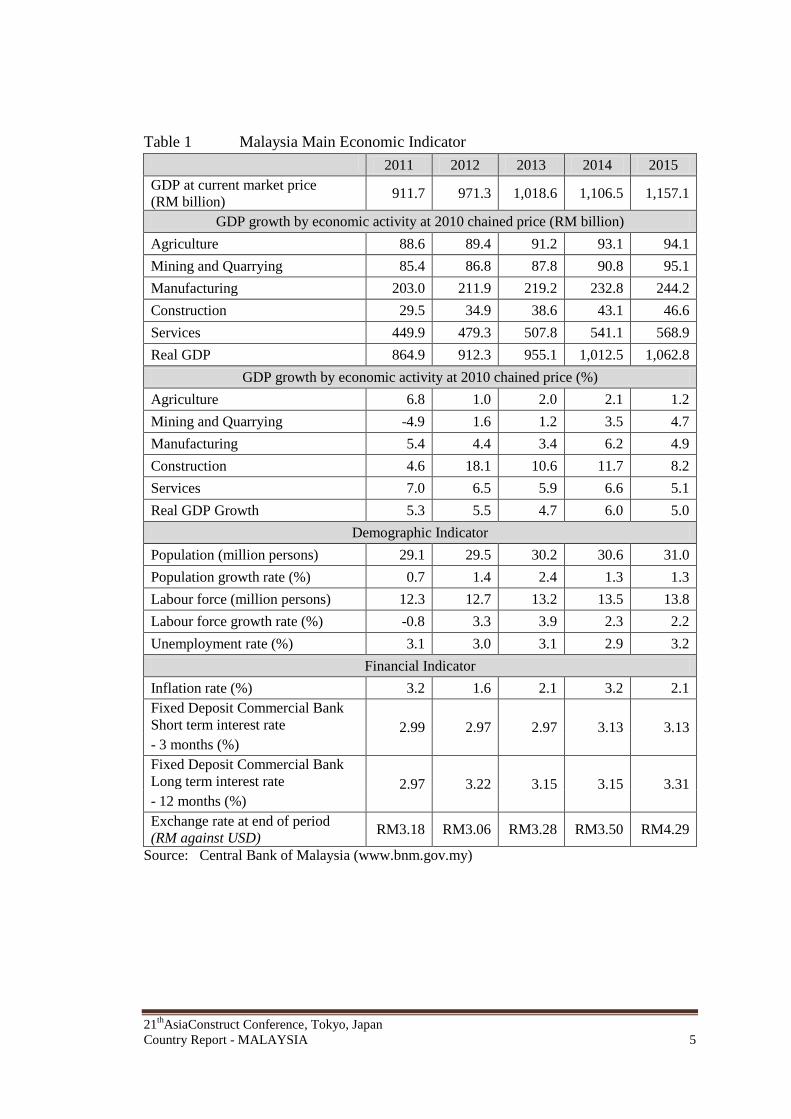
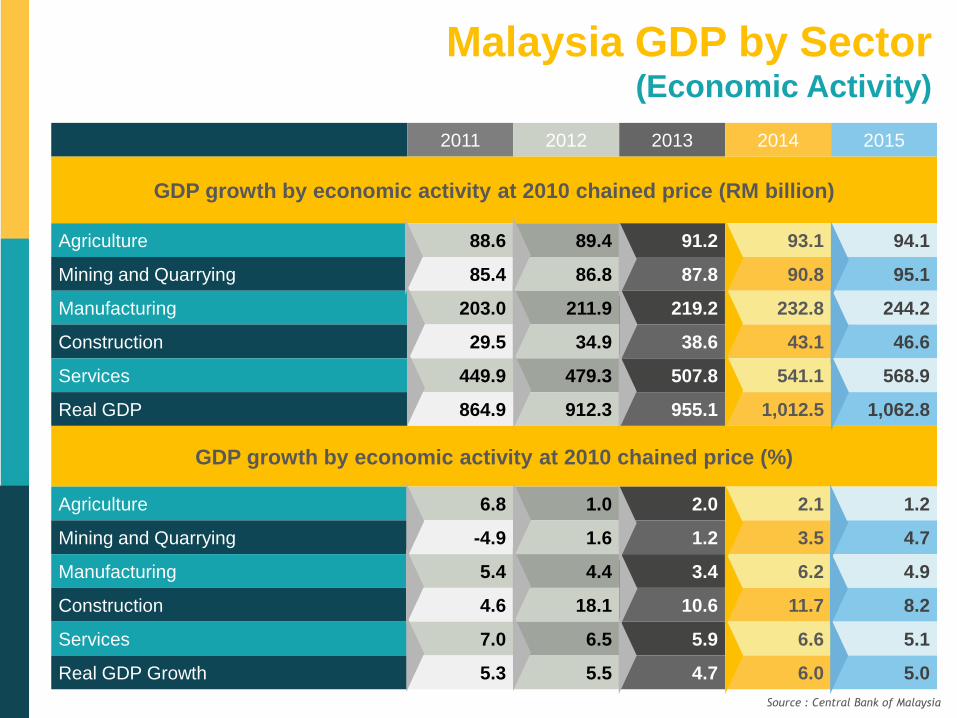
Table 1 Malaysia Main Economic Indicator
2011 2012 2013 2014 2015
GDP at current market price
(RM billion) 911.7 971.3 1,018.6 1,106.5 1,157.1
GDP growth by economic activity at 2010 chained price (RM billion)
Agriculture 88.6 89.4 91.2 93.1 94.1
Mining and Quarrying 85.4 86.8 87.8 90.8 95.1
Manufacturing 203.0 211.9 219.2 232.8 244.2
Construction 29.5 34.9 38.6 43.1 46.6
Services 449.9 479.3 507.8 541.1 568.9
Real GDP 864.9 912.3 955.1 1,012.5 1,062.8
GDP growth by economic activity at 2010 chained price (%)
Agriculture 6.8 1.0 2.0 2.1 1.2
Mining and Quarrying -4.9 1.6 1.2 3.5 4.7
Manufacturing 5.4 4.4 3.4 6.2 4.9
Construction 4.6 18.1 10.6 11.7 8.2
Services 7.0 6.5 5.9 6.6 5.1
Real GDP Growth 5.3 5.5 4.7 6.0 5.0
Demographic Indicator
Population (million persons) 29.1 29.5 30.2 30.6 31.0
Population growth rate (%) 0.7 1.4 2.4 1.3 1.3
Labour force (million persons) 12.3 12.7 13.2 13.5 13.8
Labour force growth rate (%) -0.8 3.3 3.9 2.3 2.2
Unemployment rate (%) 3.1 3.0 3.1 2.9 3.2
Financial Indicator
Inflation rate (%) 3.2 1.6 2.1 3.2 2.1
Fixed Deposit Commercial Bank
Short term interest rate 2.99 2.97 2.97 3.13 3.13
- 3 months (%)
Fixed Deposit Commercial Bank
Long term interest rate 2.97 3.22 3.15 3.15 3.31
- 12 months (%)
Exchange rate at end of period
(RM against USD) RM3.18 RM3.06 RM3.28 RM3.50 RM4.29
Source: Central Bank of Malaysia (www.bnm.gov.my)

21th
AsiaConstruct Conference, Tokyo, Japan
Country Report - MALAYSIA 6
Malaysian Economy Outlook
In the first half of 2016, the Malaysian economy expanded by 4.1% (1Q2016: 4.2%;
2Q2016: 4.0%). Private sector expenditure remained the key driver of growth and
contributed towards the continued expansion in domestic demand. On the supply side,
all sectors continued to expand except the agriculture sector. Construction sector grew
by 8.4% in the first half of 2016, following a moderate growth at 7.9% in the first
quarter and subsequent improvement at 8.8% in the second quarter of 2016. Other
economic sectors posted a gradual increase in the second quarter, with the services
sector at 5.4% (1Q2016: 5.1%; 2Q2016: 5.7%); the manufacturing sector at 4.3%
(1Q2016: 4.5%; 2Q2016: 4.1%); and the mining and quarrying sector at 1.4%
(1Q2016: -0.3%; 2Q2016: 2.6%). The only contraction happen in agriculture sector
which fall to -0.6% (1Q2016: -3.8%; 2Q2016: -7.9%).
The Malaysian economy is expected to remain stable with a projected growth of
between 4.0% and 4.5% in 2016; and between 4.0% and 4.5% in 2017. In 2016, all
economic sectors are expected to grow moderately, except for the agriculture sector.
As with the past few years, the growth will be led by the construction sector at 8.7%.
The services and manufacturing sector are projected to grow at 5.6% and 4.0%
respectively. The mining and quarrying sector is expected to grow at 1.1%, while the
agriculture sector is expected to contract by 3.3%.
Table 2 GDP Growth by Economic Activity Malaysia Economic Outlook 2016
2016 2017ᶠ
1H Annualᶠ
Agriculture -6.0 -3.3 1.5
Mining and Quarrying 1.4 1.1 1.4
Manufacturing 4.3 4.0 4.1
Construction 8.4 8.7 8.3
Services 5.4 5.6 5.7
Real GDP Growth 4.1 4.0 – 4.5 4.0 – 5.0
Note: ᶠ Forecast
21th
AsiaConstruct Conference, Tokyo, Japan
Country Report - MALAYSIA 7
OVERVIEW OF THE CONSTRUCTION INDUSTRY
Construction Project Review
In 2015, the value of construction projects awarded declined by 21.5% to RM135.4
billion (2014: from RM172.5 billion). The number of projects also decline by 9.6%
to 7,217 projects worth (2014: 7,983 projects). Based on trends, the actual number of
projects is expected to grow more as more projects get reported and recorded into the
CIDB’s database, including those projects awarded earlier in 2015.
In terms of value, the private sector commands the larger portion of the construction
projects at 82.5% (RM111.7 billion) compared to the government sector at 17.5%
(RM23.7 billion). In terms of numbers, private sector secured 74.8% (5,395 projects)
compared to 25.2% (1,822projects) by the government sector in 2015.
Overall, the largest portion of construction works came from the non-residential
projects at 39.6% (RM53.5 billion); followed by residential projects at 36.7%
(RM49.7 billion); infrastructure projects at 19.5% (RM26.4 billion); and social
amenities projects at 4.2% (RM5.7 billion). A total of 92.5% (RM49.5 billion) of the
non-residential projects were driven by the private sector, due to the high-value
projects awarded under the industrial and commercial subsection.
The major impact to Malaysian construction projects in 2015 came from the
implementation of 11 mega projects cost more than RM1.0 billion accounts for
RM17.2 billion. 5 biggest projects are:
1. Mixed Development Project in Kuala Lumpur
Award: October 2015; Expected completion: 2019
2. Independent Deepwater Petroleum Terminal in Pengerang, Johor
Award: January 2015; Expected completion: 2019
3. Piping and Associated Facilities at PETRONAS LNG Complex in Bintulu,
Sarawak
Award: January 2015; Expected completion: 2017
4. Office Building Towers in Putrajaya
Award: September 2015; Expected completion: 2018
5. Upgrading Facilities of Double Tracking Track Infrastructure in Klang Valley
Award: March 2015; Expected completion: 2019
21th
AsiaConstruct Conference, Tokyo, Japan
Country Report - MALAYSIA 8
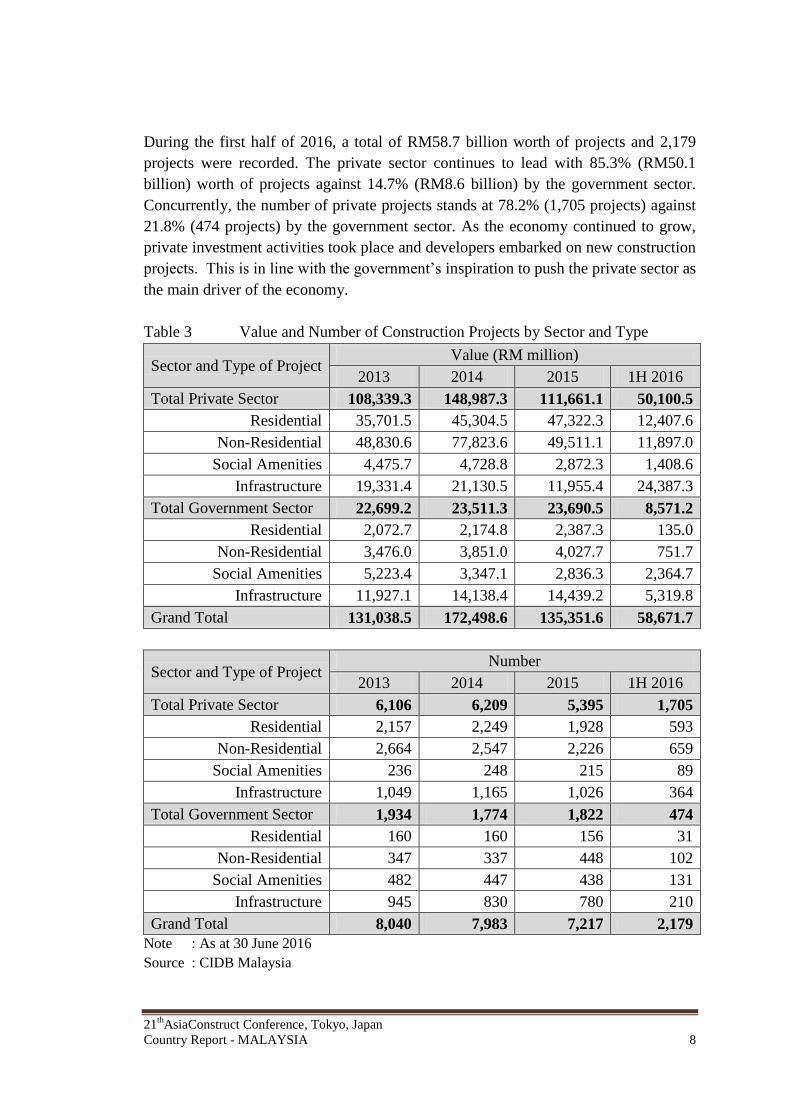
During the first half of 2016, a total of RM58.7 billion worth of projects and 2,179
projects were recorded. The private sector continues to lead with 85.3% (RM50.1
billion) worth of projects against 14.7% (RM8.6 billion) by the government sector.
Concurrently, the number of private projects stands at 78.2% (1,705 projects) against
21.8% (474 projects) by the government sector. As the economy continued to grow,
private investment activities took place and developers embarked on new construction
projects. This is in line with the government’s inspiration to push the private sector as
the main driver of the economy.
Table 3 Value and Number of Construction Projects by Sector and Type
Sector and Type of Project Value (RM million)
2013 2014 2015 1H 2016
Total Private Sector 108,339.3 148,987.3 111,661.1 50,100.5
Residential 35,701.5 45,304.5 47,322.3 12,407.6
Non-Residential 48,830.6 77,823.6 49,511.1 11,897.0
Social Amenities 4,475.7 4,728.8 2,872.3 1,408.6
Infrastructure 19,331.4 21,130.5 11,955.4 24,387.3
Total Government Sector 22,699.2 23,511.3 23,690.5 8,571.2
Residential 2,072.7 2,174.8 2,387.3 135.0
Non-Residential 3,476.0 3,851.0 4,027.7 751.7
Social Amenities 5,223.4 3,347.1 2,836.3 2,364.7
Infrastructure 11,927.1 14,138.4 14,439.2 5,319.8
Grand Total 131,038.5 172,498.6 135,351.6 58,671.7
Sector and Type of Project Number
2013 2014 2015 1H 2016
Total Private Sector 6,106 6,209 5,395 1,705
Residential 2,157 2,249 1,928 593
Non-Residential 2,664 2,547 2,226 659
Social Amenities 236 248 215 89
Infrastructure 1,049 1,165 1,026 364
Total Government Sector 1,934 1,774 1,822 474
Residential 160 160 156 31
Non-Residential 347 337 448 102
Social Amenities 482 447 438 131
Infrastructure 945 830 780 210
Grand Total 8,040 7,983 7,217 2,179
Note : As at 30 June 2016
Source : CIDB Malaysia
21th
AsiaConstruct Conference, Tokyo, Japan
Country Report - MALAYSIA 9
Contractor Registration
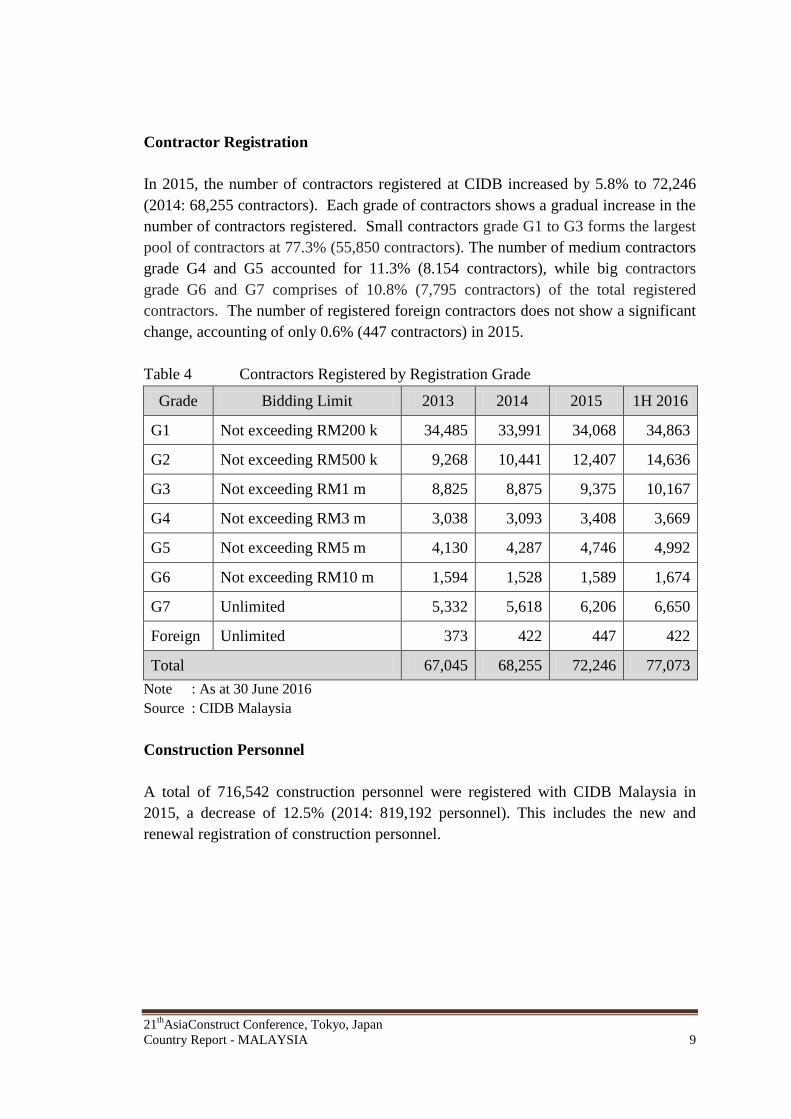
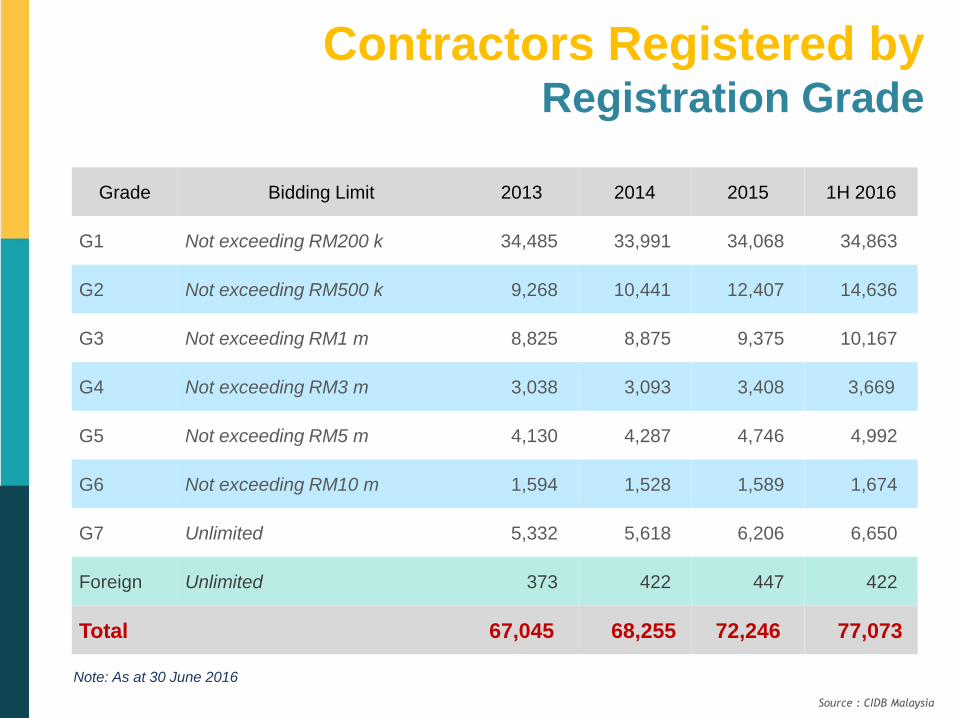
In 2015, the number of contractors registered at CIDB increased by 5.8% to 72,246
(2014: 68,255 contractors). Each grade of contractors shows a gradual increase in the
number of contractors registered. Small contractors grade G1 to G3 forms the largest
pool of contractors at 77.3% (55,850 contractors). The number of medium contractors
grade G4 and G5 accounted for 11.3% (8.154 contractors), while big contractors
grade G6 and G7 comprises of 10.8% (7,795 contractors) of the total registered
contractors. The number of registered foreign contractors does not show a significant
change, accounting of only 0.6% (447 contractors) in 2015.
Table 4 Contractors Registered by Registration Grade
Grade Bidding Limit 2013 2014 2015 1H 2016
G1 Not exceeding RM200 k 34,485 33,991 34,068 34,863
G2 Not exceeding RM500 k 9,268 10,441 12,407 14,636
G3 Not exceeding RM1 m 8,825 8,875 9,375 10,167
G4 Not exceeding RM3 m 3,038 3,093 3,408 3,669
G5 Not exceeding RM5 m 4,130 4,287 4,746 4,992
G6 Not exceeding RM10 m 1,594 1,528 1,589 1,674
G7 Unlimited 5,332 5,618 6,206 6,650
Foreign Unlimited 373 422 447 422
Total 67,045 68,255 72,246 77,073
Note : As at 30 June 2016
Source : CIDB Malaysia
Construction Personnel
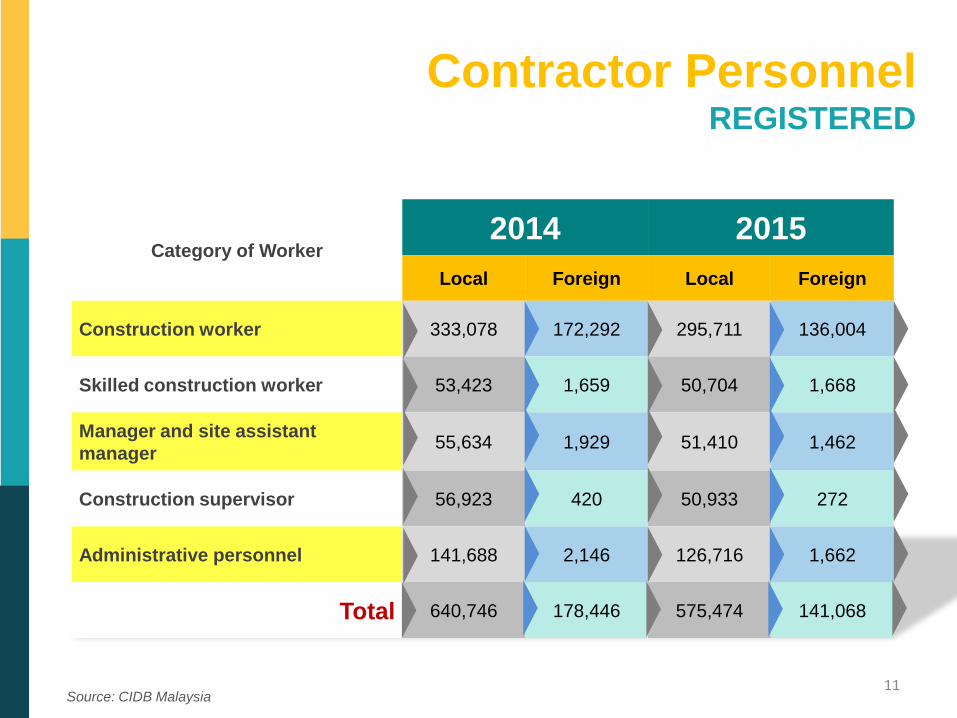
A total of 716,542 construction personnel were registered with CIDB Malaysia in
2015, a decrease of 12.5% (2014: 819,192 personnel). This includes the new and
renewal registration of construction personnel.
21th
AsiaConstruct Conference, Tokyo, Japan
Country Report - MALAYSIA 10
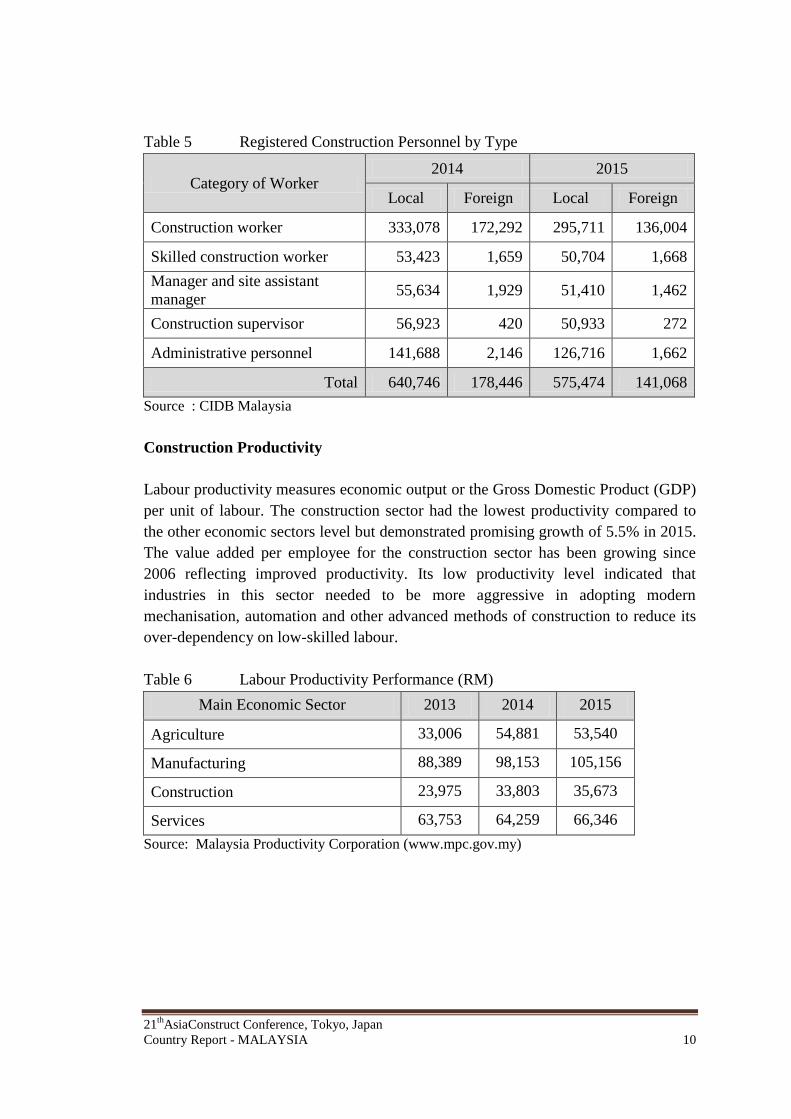
Table 5 Registered Construction Personnel by Type
Category of Worker 2014 2015
Local Foreign Local Foreign
Construction worker 333,078 172,292 295,711 136,004
Skilled construction worker 53,423 1,659 50,704 1,668
Manager and site assistant
manager 55,634 1,929 51,410 1,462
Construction supervisor 56,923 420 50,933 272
Administrative personnel 141,688 2,146 126,716 1,662
Total 640,746 178,446 575,474 141,068
Source : CIDB Malaysia
Construction Productivity
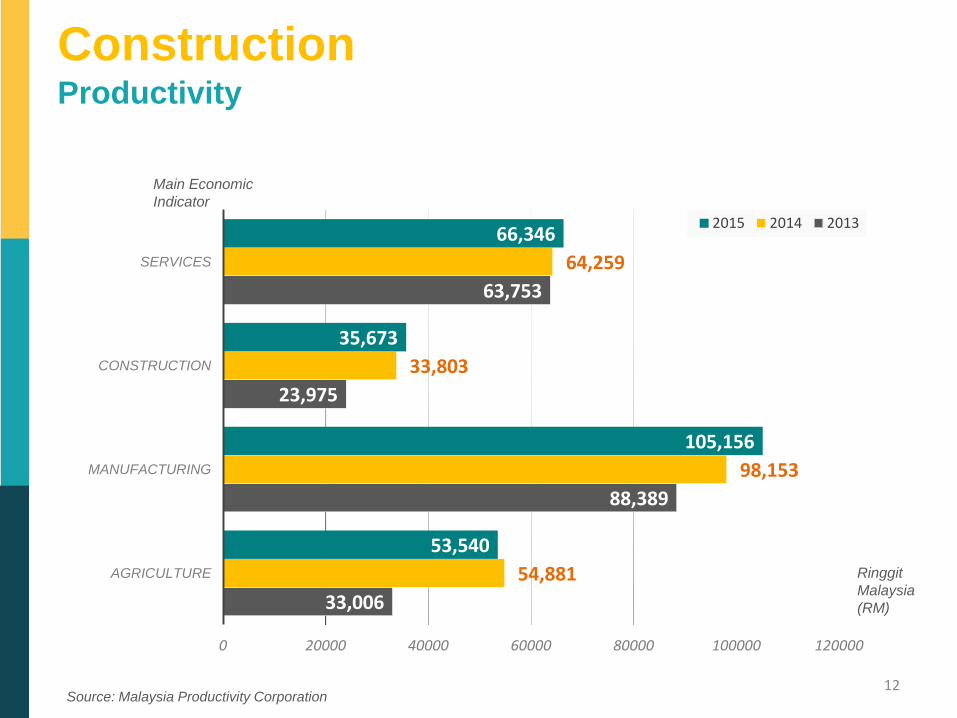
Labour productivity measures economic output or the Gross Domestic Product (GDP)
per unit of labour. The construction sector had the lowest productivity compared to
the other economic sectors level but demonstrated promising growth of 5.5% in 2015.
The value added per employee for the construction sector has been growing since
2006 reflecting improved productivity. Its low productivity level indicated that
industries in this sector needed to be more aggressive in adopting modern
mechanisation, automation and other advanced methods of construction to reduce its
over-dependency on low-skilled labour.
Table 6 Labour Productivity Performance (RM)
Main Economic Sector 2013 2014 2015
Agriculture 33,006 54,881 53,540
Manufacturing 88,389 98,153 105,156
Construction 23,975 33,803 35,673
Services 63,753 64,259 66,346
Source: Malaysia Productivity Corporation (www.mpc.gov.my)
21th
AsiaConstruct Conference, Tokyo, Japan
Country Report - MALAYSIA 11
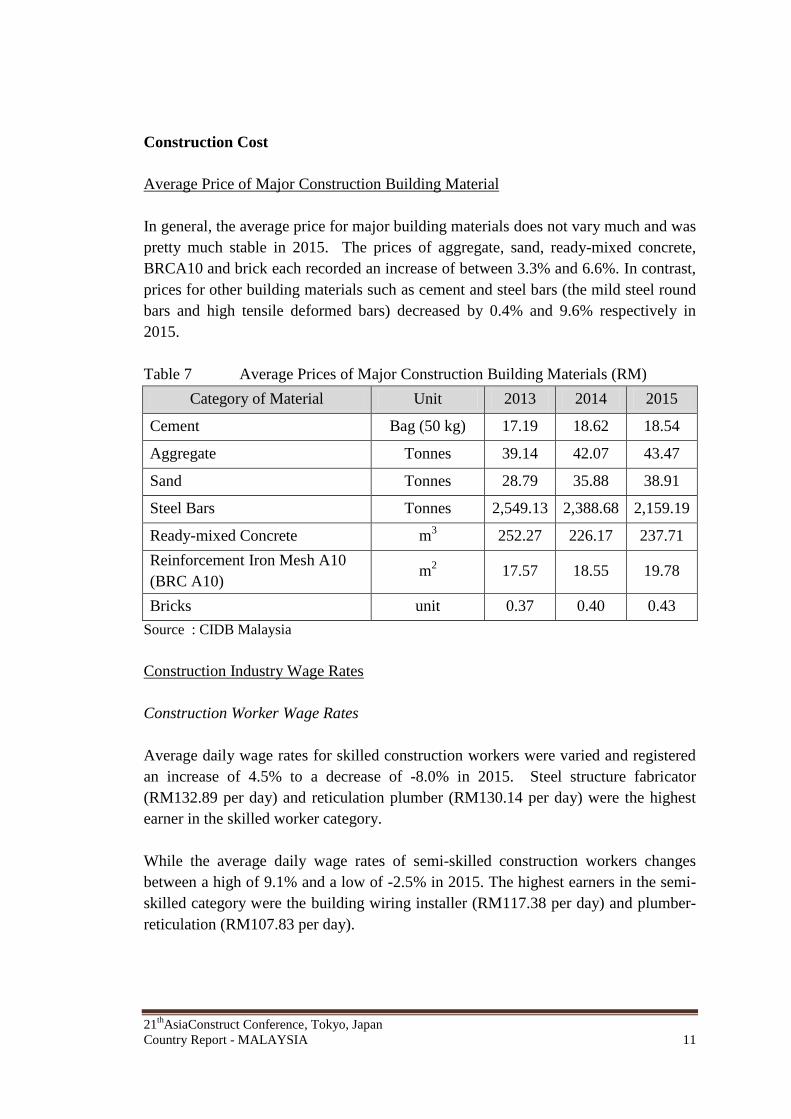
Construction Cost
Average Price of Major Construction Building Material
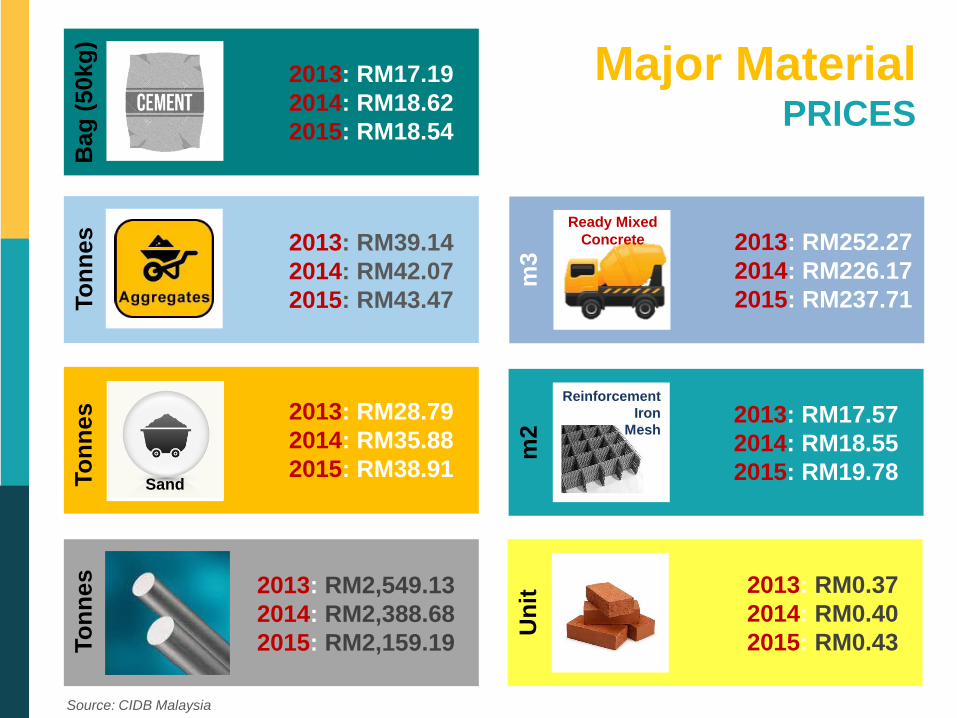
In general, the average price for major building materials does not vary much and was
pretty much stable in 2015. The prices of aggregate, sand, ready-mixed concrete,
BRCA10 and brick each recorded an increase of between 3.3% and 6.6%. In contrast,
prices for other building materials such as cement and steel bars (the mild steel round
bars and high tensile deformed bars) decreased by 0.4% and 9.6% respectively in
2015.
Table 7 Average Prices of Major Construction Building Materials (RM)
Category of Material Unit 2013 2014 2015
Cement Bag (50 kg) 17.19 18.62 18.54
Aggregate Tonnes 39.14 42.07 43.47
Sand Tonnes 28.79 35.88 38.91
Steel Bars Tonnes 2,549.13 2,388.68 2,159.19
Ready-mixed Concrete m3 252.27 226.17 237.71
Reinforcement Iron Mesh A10
(BRC A10) m
2 17.57 18.55 19.78
Bricks unit 0.37 0.40 0.43
Source : CIDB Malaysia
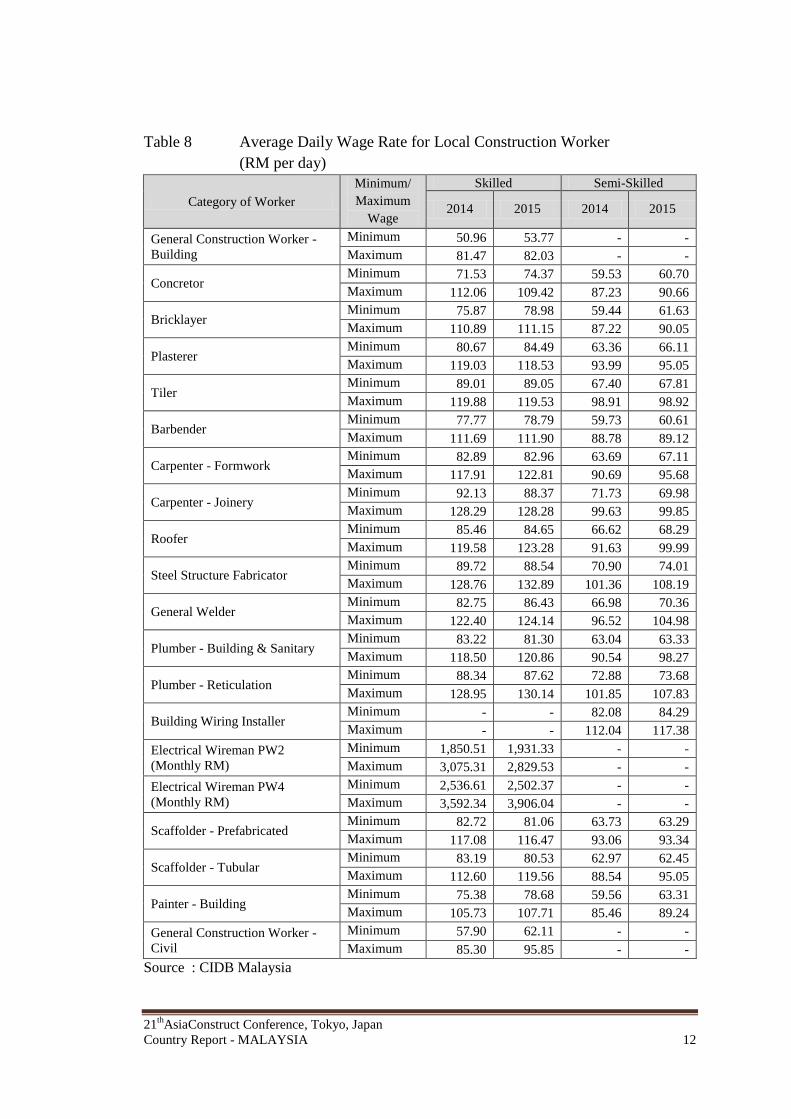
Construction Industry Wage Rates
Construction Worker Wage Rates
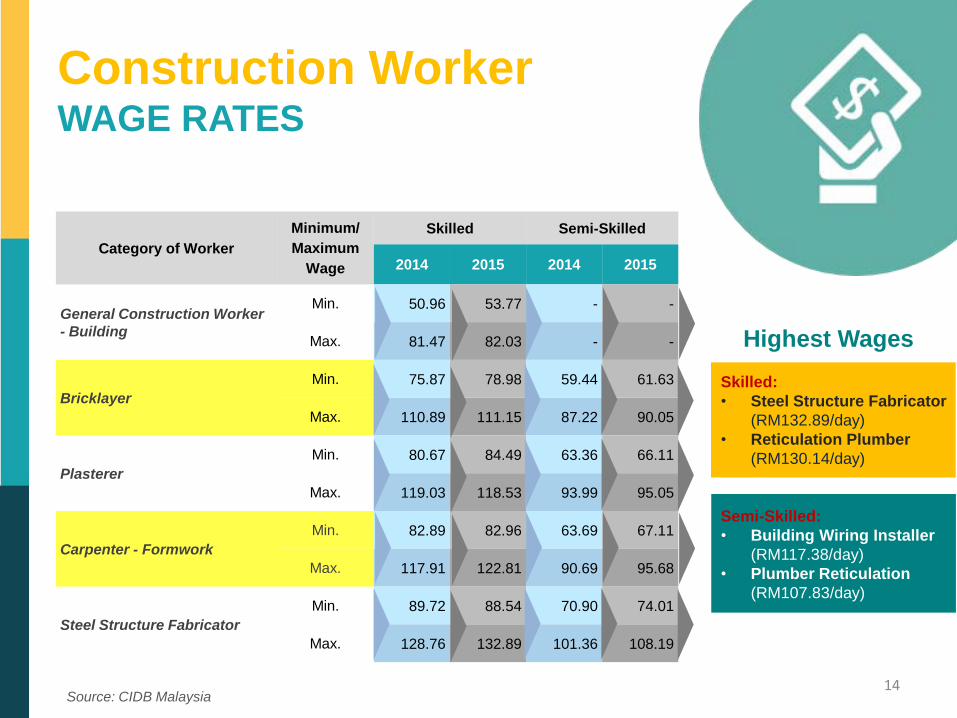
Average daily wage rates for skilled construction workers were varied and registered
an increase of 4.5% to a decrease of -8.0% in 2015. Steel structure fabricator
(RM132.89 per day) and reticulation plumber (RM130.14 per day) were the highest
earner in the skilled worker category.
While the average daily wage rates of semi-skilled construction workers changes
between a high of 9.1% and a low of -2.5% in 2015. The highest earners in the semi-
skilled category were the building wiring installer (RM117.38 per day) and plumber-
reticulation (RM107.83 per day).
21th
AsiaConstruct Conference, Tokyo, Japan
Country Report - MALAYSIA 12
Table 8 Average Daily Wage Rate for Local Construction Worker
(RM per day)
Category of Worker
Minimum/
Maximum
Wage
Skilled Semi-Skilled
2014 2015 2014 2015
General Construction Worker -
Building
Minimum 50.96 53.77 - -
Maximum 81.47 82.03 - -
Concretor Minimum 71.53 74.37 59.53 60.70
Maximum 112.06 109.42 87.23 90.66
Bricklayer Minimum 75.87 78.98 59.44 61.63
Maximum 110.89 111.15 87.22 90.05
Plasterer Minimum 80.67 84.49 63.36 66.11
Maximum 119.03 118.53 93.99 95.05
Tiler Minimum 89.01 89.05 67.40 67.81
Maximum 119.88 119.53 98.91 98.92
Barbender Minimum 77.77 78.79 59.73 60.61
Maximum 111.69 111.90 88.78 89.12
Carpenter - Formwork Minimum 82.89 82.96 63.69 67.11
Maximum 117.91 122.81 90.69 95.68
Carpenter - Joinery Minimum 92.13 88.37 71.73 69.98
Maximum 128.29 128.28 99.63 99.85
Roofer Minimum 85.46 84.65 66.62 68.29
Maximum 119.58 123.28 91.63 99.99
Steel Structure Fabricator Minimum 89.72 88.54 70.90 74.01
Maximum 128.76 132.89 101.36 108.19
General Welder Minimum 82.75 86.43 66.98 70.36
Maximum 122.40 124.14 96.52 104.98
Plumber - Building & Sanitary Minimum 83.22 81.30 63.04 63.33
Maximum 118.50 120.86 90.54 98.27
Plumber - Reticulation Minimum 88.34 87.62 72.88 73.68
Maximum 128.95 130.14 101.85 107.83
Building Wiring Installer Minimum - - 82.08 84.29
Maximum - - 112.04 117.38
Electrical Wireman PW2
(Monthly RM)
Minimum 1,850.51 1,931.33 - -
Maximum 3,075.31 2,829.53 - -
Electrical Wireman PW4
(Monthly RM)
Minimum 2,536.61 2,502.37 - -
Maximum 3,592.34 3,906.04 - -
Scaffolder - Prefabricated Minimum 82.72 81.06 63.73 63.29
Maximum 117.08 116.47 93.06 93.34
Scaffolder - Tubular Minimum 83.19 80.53 62.97 62.45
Maximum 112.60 119.56 88.54 95.05
Painter - Building Minimum 75.38 78.68 59.56 63.31
Maximum 105.73 107.71 85.46 89.24
General Construction Worker -
Civil
Minimum 57.90 62.11 - -
Maximum 85.30 95.85 - -
Source : CIDB Malaysia
21th
AsiaConstruct Conference, Tokyo, Japan
Country Report - MALAYSIA 13
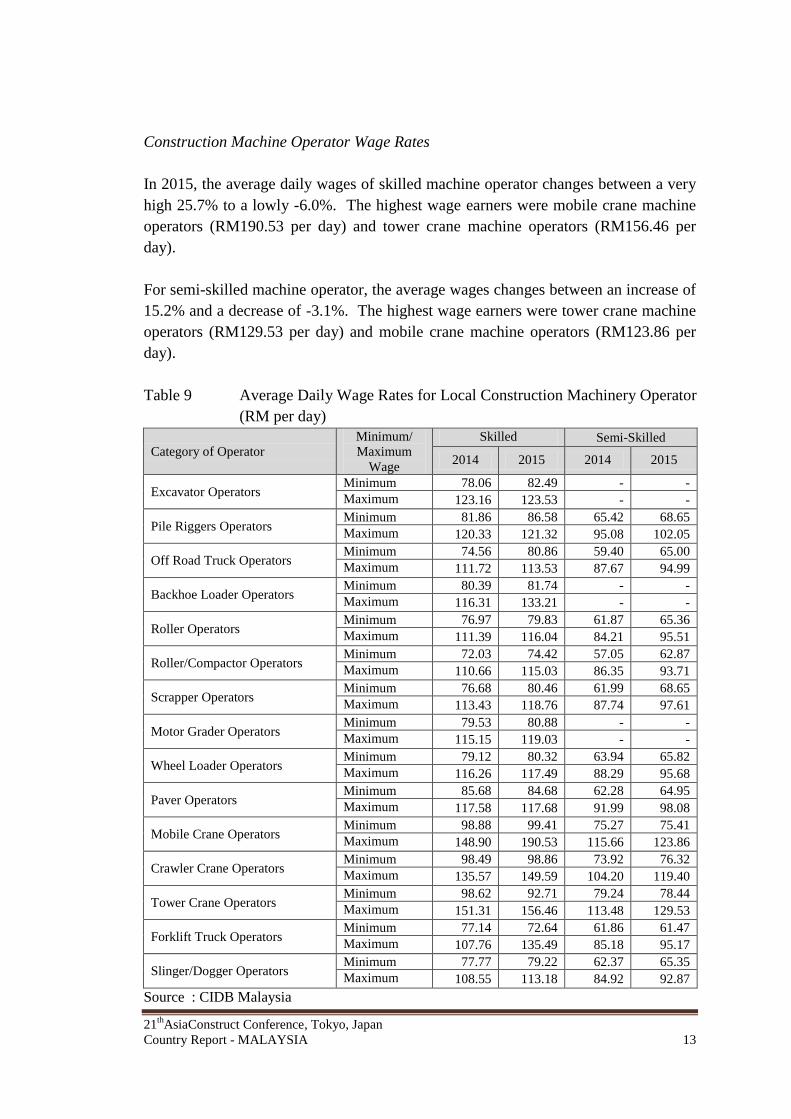
Construction Machine Operator Wage Rates
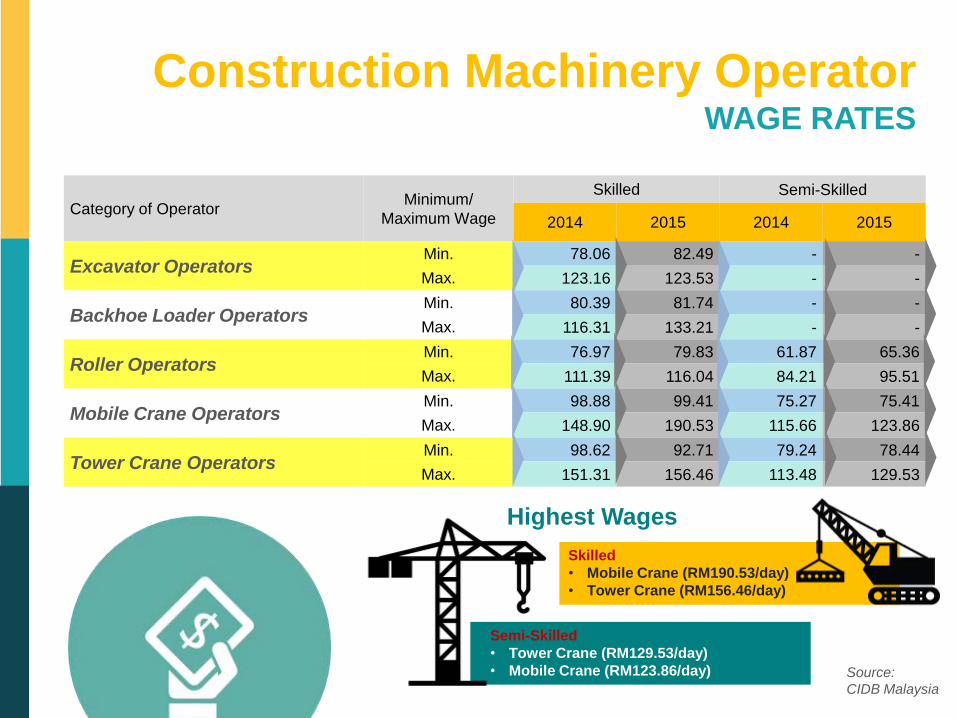
In 2015, the average daily wages of skilled machine operator changes between a very
high 25.7% to a lowly -6.0%. The highest wage earners were mobile crane machine
operators (RM190.53 per day) and tower crane machine operators (RM156.46 per
day).
For semi-skilled machine operator, the average wages changes between an increase of
15.2% and a decrease of -3.1%. The highest wage earners were tower crane machine
operators (RM129.53 per day) and mobile crane machine operators (RM123.86 per
day).
Table 9 Average Daily Wage Rates for Local Construction Machinery Operator
(RM per day)
Category of Operator
Minimum/
Maximum
Wage
Skilled Semi-Skilled
2014 2015 2014 2015
Excavator Operators Minimum 78.06 82.49 - -
Maximum 123.16 123.53 - -
Pile Riggers Operators Minimum 81.86 86.58 65.42 68.65
Maximum 120.33 121.32 95.08 102.05
Off Road Truck Operators Minimum 74.56 80.86 59.40 65.00
Maximum 111.72 113.53 87.67 94.99
Backhoe Loader Operators Minimum 80.39 81.74 - -
Maximum 116.31 133.21 - -
Roller Operators Minimum 76.97 79.83 61.87 65.36
Maximum 111.39 116.04 84.21 95.51
Roller/Compactor Operators Minimum 72.03 74.42 57.05 62.87
Maximum 110.66 115.03 86.35 93.71
Scrapper Operators Minimum 76.68 80.46 61.99 68.65
Maximum 113.43 118.76 87.74 97.61
Motor Grader Operators Minimum 79.53 80.88 - -
Maximum 115.15 119.03 - -
Wheel Loader Operators Minimum 79.12 80.32 63.94 65.82
Maximum 116.26 117.49 88.29 95.68
Paver Operators Minimum 85.68 84.68 62.28 64.95
Maximum 117.58 117.68 91.99 98.08
Mobile Crane Operators Minimum 98.88 99.41 75.27 75.41
Maximum 148.90 190.53 115.66 123.86
Crawler Crane Operators Minimum 98.49 98.86 73.92 76.32
Maximum 135.57 149.59 104.20 119.40
Tower Crane Operators Minimum 98.62 92.71 79.24 78.44
Maximum 151.31 156.46 113.48 129.53
Forklift Truck Operators Minimum 77.14 72.64 61.86 61.47
Maximum 107.76 135.49 85.18 95.17
Slinger/Dogger Operators Minimum 77.77 79.22 62.37 65.35
Maximum 108.55 113.18 84.92 92.87
Source : CIDB Malaysia
21th
AsiaConstruct Conference, Tokyo, Japan
Country Report - MALAYSIA 14
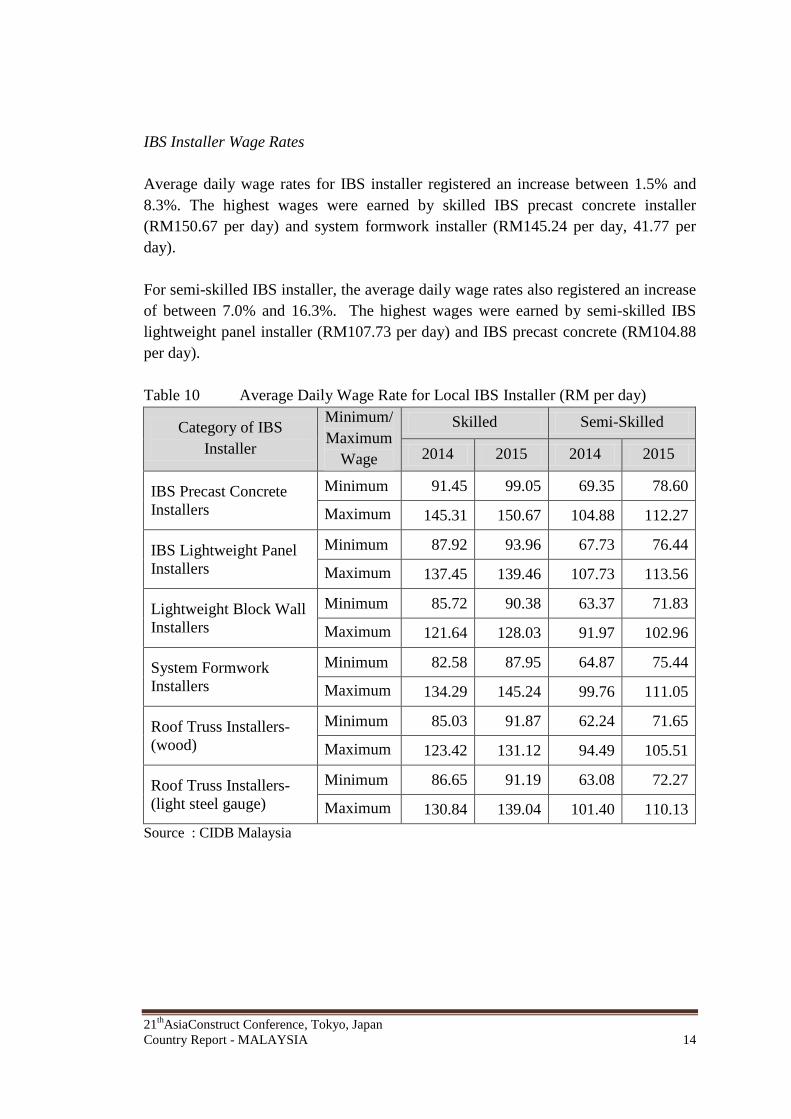
IBS Installer Wage Rates
Average daily wage rates for IBS installer registered an increase between 1.5% and
8.3%. The highest wages were earned by skilled IBS precast concrete installer
(RM150.67 per day) and system formwork installer (RM145.24 per day, 41.77 per
day).
For semi-skilled IBS installer, the average daily wage rates also registered an increase
of between 7.0% and 16.3%. The highest wages were earned by semi-skilled IBS
lightweight panel installer (RM107.73 per day) and IBS precast concrete (RM104.88
per day).
Table 10 Average Daily Wage Rate for Local IBS Installer (RM per day)
Category of IBS
Installer
Minimum/
Maximum
Wage
Skilled Semi-Skilled
2014 2015 2014 2015
IBS Precast Concrete
Installers
Minimum 91.45 99.05 69.35 78.60
Maximum 145.31 150.67 104.88 112.27
IBS Lightweight Panel
Installers
Minimum 87.92 93.96 67.73 76.44
Maximum 137.45 139.46 107.73 113.56
Lightweight Block Wall
Installers
Minimum 85.72 90.38 63.37 71.83
Maximum 121.64 128.03 91.97 102.96
System Formwork
Installers
Minimum 82.58 87.95 64.87 75.44
Maximum 134.29 145.24 99.76 111.05
Roof Truss Installers-
(wood)
Minimum 85.03 91.87 62.24 71.65
Maximum 123.42 131.12 94.49 105.51
Roof Truss Installers-
(light steel gauge)
Minimum 86.65 91.19 63.08 72.27
Maximum 130.84 139.04 101.40 110.13
Source : CIDB Malaysia
21th
AsiaConstruct Conference, Tokyo, Japan
Country Report - MALAYSIA 15
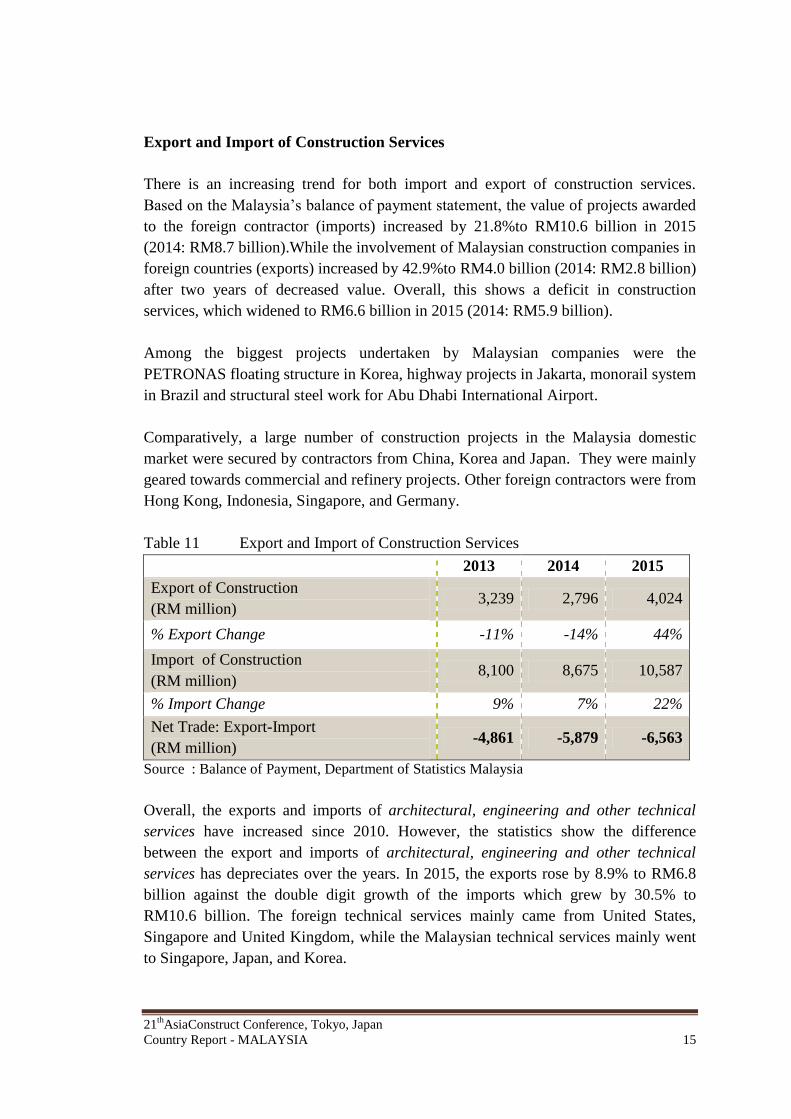
Export and Import of Construction Services
There is an increasing trend for both import and export of construction services.
Based on the Malaysia’s balance of payment statement, the value of projects awarded
to the foreign contractor (imports) increased by 21.8%to RM10.6 billion in 2015
(2014: RM8.7 billion).While the involvement of Malaysian construction companies in
foreign countries (exports) increased by 42.9%to RM4.0 billion (2014: RM2.8 billion)
after two years of decreased value. Overall, this shows a deficit in construction
services, which widened to RM6.6 billion in 2015 (2014: RM5.9 billion).
Among the biggest projects undertaken by Malaysian companies were the
PETRONAS floating structure in Korea, highway projects in Jakarta, monorail system
in Brazil and structural steel work for Abu Dhabi International Airport.
Comparatively, a large number of construction projects in the Malaysia domestic
market were secured by contractors from China, Korea and Japan. They were mainly
geared towards commercial and refinery projects. Other foreign contractors were from
Hong Kong, Indonesia, Singapore, and Germany.
Table 11 Export and Import of Construction Services
2013 2014 2015
Export of Construction
(RM million) 3,239 2,796 4,024
% Export Change -11% -14% 44%
Import of Construction
(RM million) 8,100 8,675 10,587
% Import Change 9% 7% 22%
Net Trade: Export-Import
(RM million) -4,861 -5,879 -6,563
Source : Balance of Payment, Department of Statistics Malaysia
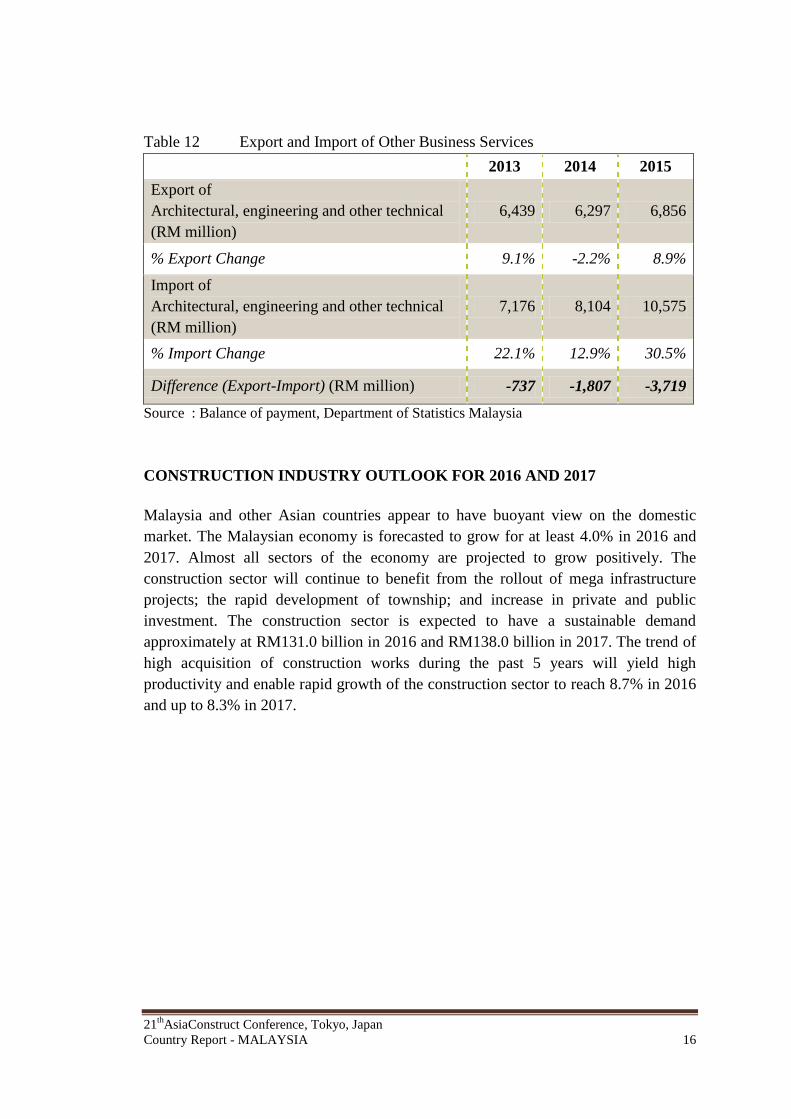
Overall, the exports and imports of architectural, engineering and other technical
services have increased since 2010. However, the statistics show the difference
between the export and imports of architectural, engineering and other technical
services has depreciates over the years. In 2015, the exports rose by 8.9% to RM6.8
billion against the double digit growth of the imports which grew by 30.5% to
RM10.6 billion. The foreign technical services mainly came from United States,
Singapore and United Kingdom, while the Malaysian technical services mainly went
to Singapore, Japan, and Korea.
21th
AsiaConstruct Conference, Tokyo, Japan
Country Report - MALAYSIA 16
Table 12 Export and Import of Other Business Services
2013 2014 2015
Export of
Architectural, engineering and other technical
(RM million)
6,439 6,297 6,856
% Export Change 9.1% -2.2% 8.9%
Import of
Architectural, engineering and other technical
(RM million)
7,176 8,104 10,575
% Import Change 22.1% 12.9% 30.5%
Difference (Export-Import) (RM million) -737 -1,807 -3,719
Source : Balance of payment, Department of Statistics Malaysia
CONSTRUCTION INDUSTRY OUTLOOK FOR 2016 AND 2017
Malaysia and other Asian countries appear to have buoyant view on the domestic
market. The Malaysian economy is forecasted to grow for at least 4.0% in 2016 and
2017. Almost all sectors of the economy are projected to grow positively. The
construction sector will continue to benefit from the rollout of mega infrastructure
projects; the rapid development of township; and increase in private and public
investment. The construction sector is expected to have a sustainable demand
approximately at RM131.0 billion in 2016 and RM138.0 billion in 2017. The trend of
high acquisition of construction works during the past 5 years will yield high
productivity and enable rapid growth of the construction sector to reach 8.7% in 2016
and up to 8.3% in 2017.
21st AsiaConstruct Conference
Tokyo, Japan
24 & 25 November 2016
Theme Paper
Sustainable Construction
Policy and Market
In Malaysia
Construction Industry Development Board (CIDB) Malaysia
Level 10, Menara Dato’ Onn
Putra World Trade Centre (PWTC)
No. 45, Jalan Tun Ismail
50480 Kuala Lumpur
Malaysia
November 2016
21th
AsiaConstruct Conference, Tokyo, Japan
Theme Paper - MALAYSIA 2
CONTENT
EXECUTIVE SUMMARY 2
INTRODUCTION
2
MAIN ISSUES WITH CONSTRUCTION INDUSTRY AND MARKET
6
Financial Constraints of Private Practitioners
8
Ignorance of Private Practitioners on the Importance of Sustainable
Construction
8
Insufficient Level of Consciousness from Government Implementing
Agencies
9
EFFOTTS MADE ACCORDING TO THE SURROUNDING
CONDITIONS OF CONSTRUCTION INDUSTRY
10
Construction Industry Transformation Programme (CITP)
13
CITP Strategic Thrust 2: Environmental Sustainability 15
Malaysian Carbon Reduction and Environmental Sustainability Tool
(MyCREST)
17
FUTURE DEVELOPMENT FOR CONSTRUCTION SUSTAINABLE
POLICY AND MARKET
18
CONCLUSION
20
21th
AsiaConstruct Conference, Tokyo, Japan
Theme Paper - MALAYSIA 3
EXECUTIVE SUMMARY
Sustainable construction addresses two major global challenges: the significant
environmental impact of the construction industry and balanced against the industry's
economic and social benefits. To ensure the achievability of these challenges in a
successful manner, various types of sustainable-related initiatives, techniques and
rating tools have been developed for the construction industry worldwide. This paper
aims to identify sustainability construction policy and market, available in Malaysia by
looking thoroughly into current issues that are being highlighted in the industry practice
as well as current efforts made according to the surrounding conditions and future
development related to sustainable construction policy and market in Malaysia. Thus,
numerous sustainability construction-related initiatives and policies have been made
available in the Malaysian construction industry market over the years, from the
Industrialised Building System (IBS) Roadmap 2003-2010 to the most recent
environmental sustainability tool known as Malaysian Carbon Reduction and
Environmental Sustainability Tool (MyCREST), which prioritises carbon emission
reduction. The Construction Industry Transformation Programme (CITP) has also been
developed to prepare Malaysia’s construction industry towards a robust competition at
the global level where an extensive emphasis being placed on environmental
sustainability as one of its key thrusts.
INTRODUCTION
Sustainability focuses on living within the limitations, equitable distribution of
resources and opportunities as well as understanding the interconnections between
economy, society and the environment that includes areas like energy, transportation,
water use, recycling, and natural resource life cycles. To be sustainable as an
individual, an organization ought to manage resources in a responsible manner, with
minimal impact on the natural surroundings and climate. A sustainable way of living
can be assessed in many forms from controlling living conditions and sustainable
cities to green building and sustainable technologies that able minimize the
consumption of resources. Sustainable construction is development that meets the
needs of the present without compromising the ability of future generations to meet
their own needs. It comprises of 2 key concepts, namely the concept of needs, the
essential needs of the world's poor, to which overriding priority should be given; and
the idea of limitations imposed by the state of technology and social organization on
the environment's ability to meet present and future needs. Sustainable construction,
which is also known as green construction or sustainable building, refers to a structure,
the construction process and occupancy processes that are environmentally
responsible and resource efficient throughout a building's life-cycle from location to
design, construction, operation, maintenance, renovation, and demolition. Sustainable
construction should also enhance living; working and leisure environments for
21th
AsiaConstruct Conference, Tokyo, Japan
Theme Paper - MALAYSIA 4
individuals and communities; consume minimum energy over its life cycle; generate
minimum waste over its life cycle; and integrate with the natural environment as well
as utilizing renewable resources where possible.
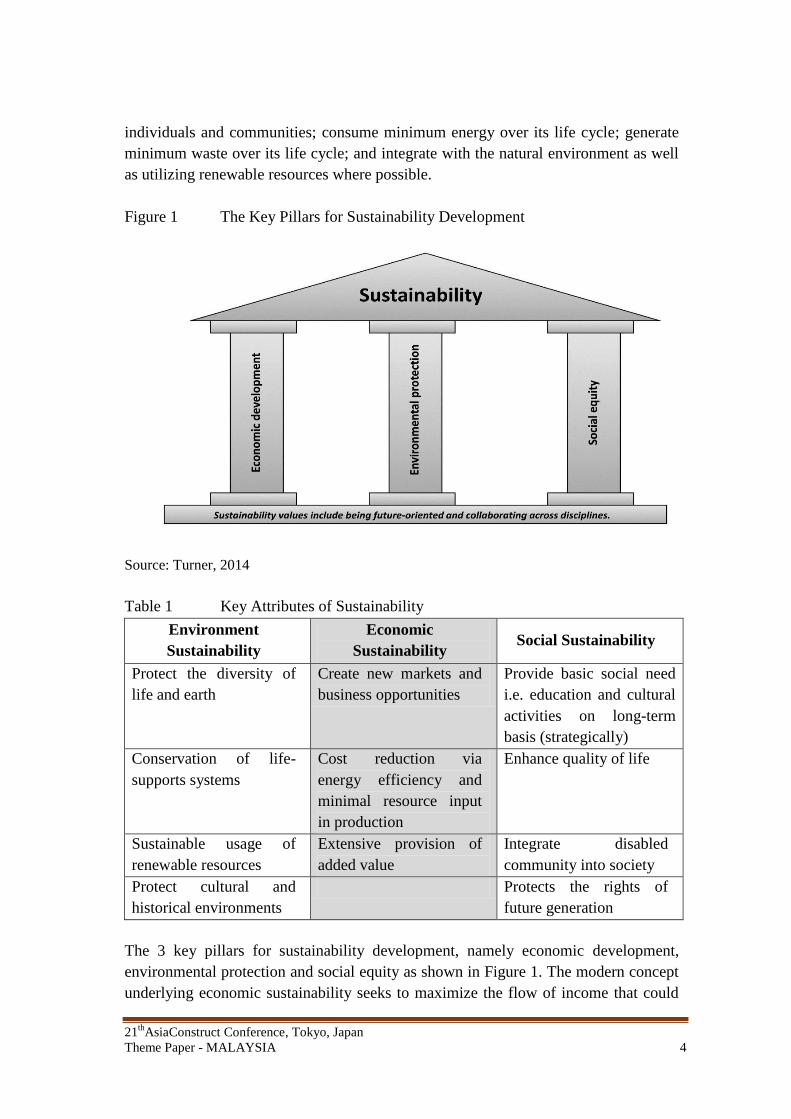
Figure 1 The Key Pillars for Sustainability Development
Source: Turner, 2014
Table 1 Key Attributes of Sustainability
Environment
Sustainability
Economic
Sustainability Social Sustainability
Protect the diversity of
life and earth
Create new markets and
business opportunities
Provide basic social need
i.e. education and cultural
activities on long-term
basis (strategically)
Conservation of life-
supports systems
Cost reduction via
energy efficiency and
minimal resource input
in production
Enhance quality of life
Sustainable usage of
renewable resources
Extensive provision of
added value
Integrate disabled
community into society
Protect cultural and
historical environments
Protects the rights of
future generation
The 3 key pillars for sustainability development, namely economic development,
environmental protection and social equity as shown in Figure 1. The modern concept
underlying economic sustainability seeks to maximize the flow of income that could
21th
AsiaConstruct Conference, Tokyo, Japan
Theme Paper - MALAYSIA 5
be generated while at least maintaining the stock of assets (or capital) which yield this
income. The interpretation of environmental sustainability focuses on the overall
viability and health of living systems, which being defined in terms of a
comprehensive, multi-scale, dynamic, hierarchical measure of resilience, vigor and
organization. Social sustainability reflects improvements related to individual well-
being or the overall social welfare, which resulted from an increase in social capital
that involve people such as leadership, public relations and human resources. Table 1
summarizes the findings on key attributes required within these 3 key pillars for
sustainability development.
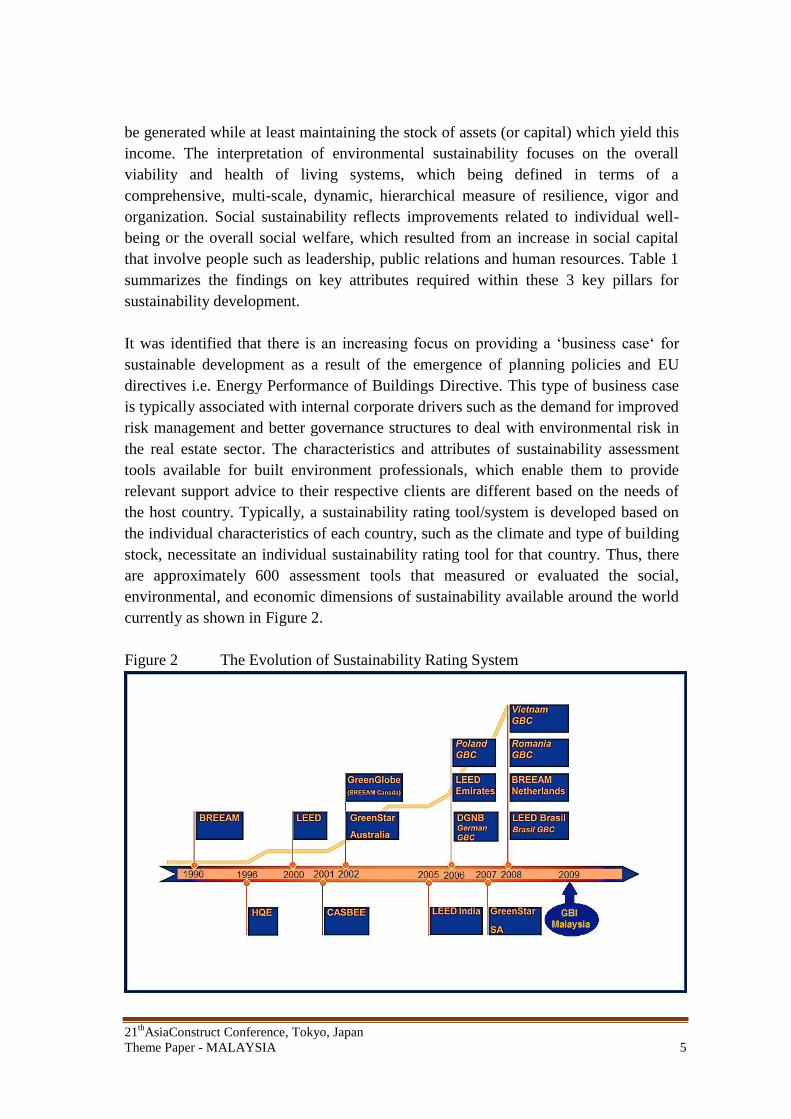
It was identified that there is an increasing focus on providing a ‘business case‘ for
sustainable development as a result of the emergence of planning policies and EU
directives i.e. Energy Performance of Buildings Directive. This type of business case
is typically associated with internal corporate drivers such as the demand for improved
risk management and better governance structures to deal with environmental risk in
the real estate sector. The characteristics and attributes of sustainability assessment
tools available for built environment professionals, which enable them to provide
relevant support advice to their respective clients are different based on the needs of
the host country. Typically, a sustainability rating tool/system is developed based on
the individual characteristics of each country, such as the climate and type of building
stock, necessitate an individual sustainability rating tool for that country. Thus, there
are approximately 600 assessment tools that measured or evaluated the social,
environmental, and economic dimensions of sustainability available around the world
currently as shown in Figure 2.
Figure 2 The Evolution of Sustainability Rating System
21th
AsiaConstruct Conference, Tokyo, Japan
Theme Paper - MALAYSIA 6
The Malaysian construction industry has taken a major step towards embracing
sustainable and green development particularly in building projects by propelling its
own 'Green Building Index' (GBI), which was established jointly by the Malaysian
Institute of Architects and Association of Consulting Engineers Malaysia (ACEM) in
2009. The GBI rating tool focuses on expanding the productivity of asset utilization in
terms of energy, water, and materials while lessening building effect on human
wellbeing. Thus, the six distinctive criteria being evaluated under the GBI rating tool
are energy efficiency, indoor environmental quality, reasonable site planning,
management, material & resources, water efficiency and innovation.
MAIN ISSUES WITH CONSTRUCTION INDUSTRY AND MARKET
The development of the construction industry in Malaysia started in 1970 when the
government-of-the-day introduced a 20-year “New Economic Policy (NEP)” plan,
which include extensive acceleration on infrastructure projects through public sector
expenditure. The growth of the construction industry in Malaysia has been further
enhanced through the introduction of “Vision 2020” in 1991 that resulted in extensive
procurement of several large-scale infrastructure and building projects en route to
achieving all the goals envisaged in the vision. Consequently, the rapid expansion on
the construction activities has led towards excessive shortages in terms of building
materials and labours, which also require appropriate machinery and equipment to be
imported from outside Malaysia.
Issues related to sustainable development and green construction have surfaced as early
as in the year 2000 where the Malaysian government started to realize the importance
of sustainable construction that able to utilize resources to meet the needs is the present
without compromising the future generation’s ability to meet their own needs. Hence
sustainable development and green construction have been included as among the top
issues addressed in the 8th
Malaysia Plan (2001-2005). The plan also states that
concerted efforts are needed in the construction planning processes to improve energy
efficiency as well as waste and environmental management. The Malaysian
government continues to address the issue on sustainable development and green
construction in the 10th
Malaysia Plan (2011–2015) to ensure that the future generation
of Malaysia is not compromised as the country remains to develop promptly in the
construction industry. In the 10th
Malaysia Plan (2011–2015), the construction sector
has recorded an annual average growth rate of 11.1%, which is even higher than the
national GDP of 6.3%.
However, the paradigm shift to adopt new sustainable development and green
construction in Malaysia is still at a slower pace compared to other advanced countries
due to several reasons. Amongst them, include issues such as financial constraints of
private practitioners as well as their ignorance towards the importance of sustainable
21th
AsiaConstruct Conference, Tokyo, Japan
Theme Paper - MALAYSIA 7
construction and insufficient level of consciousness from government implementing
agencies.
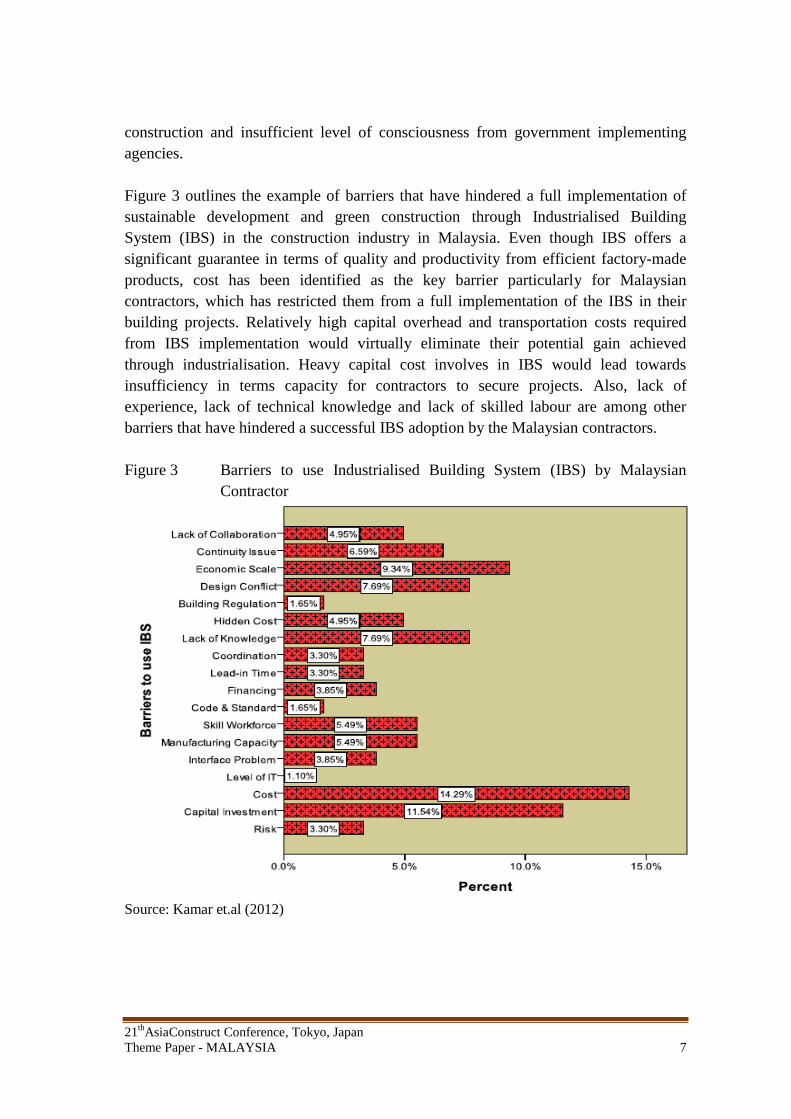
Figure 3 outlines the example of barriers that have hindered a full implementation of
sustainable development and green construction through Industrialised Building
System (IBS) in the construction industry in Malaysia. Even though IBS offers a
significant guarantee in terms of quality and productivity from efficient factory-made
products, cost has been identified as the key barrier particularly for Malaysian
contractors, which has restricted them from a full implementation of the IBS in their
building projects. Relatively high capital overhead and transportation costs required
from IBS implementation would virtually eliminate their potential gain achieved
through industrialisation. Heavy capital cost involves in IBS would lead towards
insufficiency in terms capacity for contractors to secure projects. Also, lack of
experience, lack of technical knowledge and lack of skilled labour are among other
barriers that have hindered a successful IBS adoption by the Malaysian contractors.
Figure 3 Barriers to use Industrialised Building System (IBS) by Malaysian
Contractor
Source: Kamar et.al (2012)
21th
AsiaConstruct Conference, Tokyo, Japan
Theme Paper - MALAYSIA 8
Financial Constraints of Key Practitioners
Implementing sustainable practices need significant amount of time and cost
investment. Subsequently these requirements would significantly decrease the interests
of contractors and developers in doing so. There is a common perception that the cost
required for sustainable and green alternatives are always higher than the conventional
construction method, which mainly due to the cost of a building is often measured in
terms of the construction cost instead of the life cycle cost. It has been stated that the
cost efficient would ultimately benefit the owner and not the developer. The financial
capability of a developer depends on its size; large-sized developers have greater
financial capacity to pursue for sustainable practices. Thus, large-sized companies are
more aware of the sustainable issues and requirements through proper execution of
construction process particularly those activities related to planning, design and
allocation of budget.
In Malaysia, contractors and developers are mainly made up of medium and small-
sized companies, which are mostly financially constrained even though they are fully
aware of issues pertaining sustainability. It is their preference to build to just meet the
regulatory criteria and to gain optimum profit rather than putting effort in giving more
consideration to environmental and social aspects. For this reason, unless there is an
increase of market demand for green buildings; most of the construction stakeholders
will be reluctant to transform the industry towards sustainability.
Ignorance of Private Practitioners on the Importance of Sustainable Construction
The deficiency of knowledge and awareness among practitioners in the industry
practice could be an obstacle in achieving sustainable construction, as it would lead
towards a potential failure in reaching a consensus among experienced developers and
possibly clients. Thus, it is important that all general stakeholders in the construction
industry such as developers, contractors, consultants and clients are fully aware about
the importance of sustainable construction, which would cultivate interest between and
further serves as a motivation to pursue appropriate knowledge and awareness on
sustainability development and green construction as a result. Having due diligence
helps in their decision making which benefits every party while contributing the least
damage to the environment.
In the Malaysia context, the request for sustainability is recognized as “always there”
particularly through various government programmes and initiatives but the
implementation is very poor because of insufficient knowledge and awareness among
client, consultants and contractors. Even though it may be a major hindrance towards a
comprehensive implementation, having a substantial knowledge and awareness on this
matter also does not necessarily guarantee a successful delivery of sustainable
21th
AsiaConstruct Conference, Tokyo, Japan
Theme Paper - MALAYSIA 9
development and green construction in the construction industry in Malaysia at the
desired level. The level of knowledge and awareness on the sustainability concept
among the developers and contractors is still moderate where there is still a huge
knowledge and awareness gaps between well-established big companies with the small-
medium ones.
Insufficient Level of Consciousness from Government Implementing Agencies
The intervention from relevant government implementing agencies is necessary to
ensure a comprehensive adoption of sustainable and green construction practices in the
construction industry. Majority of the stakeholders in the construction industry around
the world believe that sustainable development and green construction can be promoted
only if the government and its relevant implementing agencies are committed of doing
so. This can be achieved by introducing appropriate standards related to sustainability
and green construction practices, which then should be enforced as compulsory for any
project development in Malaysia. If the government enforces standards for the
environment and green buildings in the construction industry then its implementation is
likely to progress quickly to overcome a typical behaviour of practitioners, which pay
little attention or even ignore anything that is not a mandatory requirement for
implementation. The government could even offer incentives and rewards for
construction industries and consumers for constructing sustainable energy and cost
efficient green buildings.
In Malaysia, it is a common for contractors to comply exactly with the statement of
needs and project specification as issued by clients through explicit detail briefing. This
has somehow restricted contractors from the flexibility to innovate through sustainable
and green construction in the real project practice. Even though the Malaysian
government have introduced various programmes and initiatives related to
sustainability in construction, the insufficient level of consciousness of some
government implementing agencies has become an issue in the construction industry in
Malaysia. It has surfaced as a result from lack of understanding on the significance of
sustainable construction due to inadequate training on the related matter. Subsequently
there is minimal emphasis have been imposed by some government implementing
agencies towards the implementation of a comprehensive sustainable construction
practice in Malaysia.
21th
AsiaConstruct Conference, Tokyo, Japan
Theme Paper - MALAYSIA 10
EFFORTS MADE ACCORDING TO THE SURROUNDING CONDITIONS OF
CONSTRUCTION INDUSTRY
Malaysia has set a target to become an advanced economy by 2020. However, if
restricted available natural resources have not been used efficiently, it will result in
irretrievable loss and hence putting the nation’s development at risk particularly on
socio-economic, which is vital in raising the quality of lives of the Malaysians. This
long-term national target can be achieved through a resilient, low-carbon, resource-
efficient, and socially-inclusive manner. In the 10th
Malaysia Plan (2011-2015), the
Malaysian government prioritised the importance of environmental sustainability as
part of a comprehensive socio-economic development plan where relevant measures
that addressed all the issues related to climate change, environmental degradation and
sustainable utilisation of Malaysia’s natural endowment have been highlighted as
national agenda in the plan.
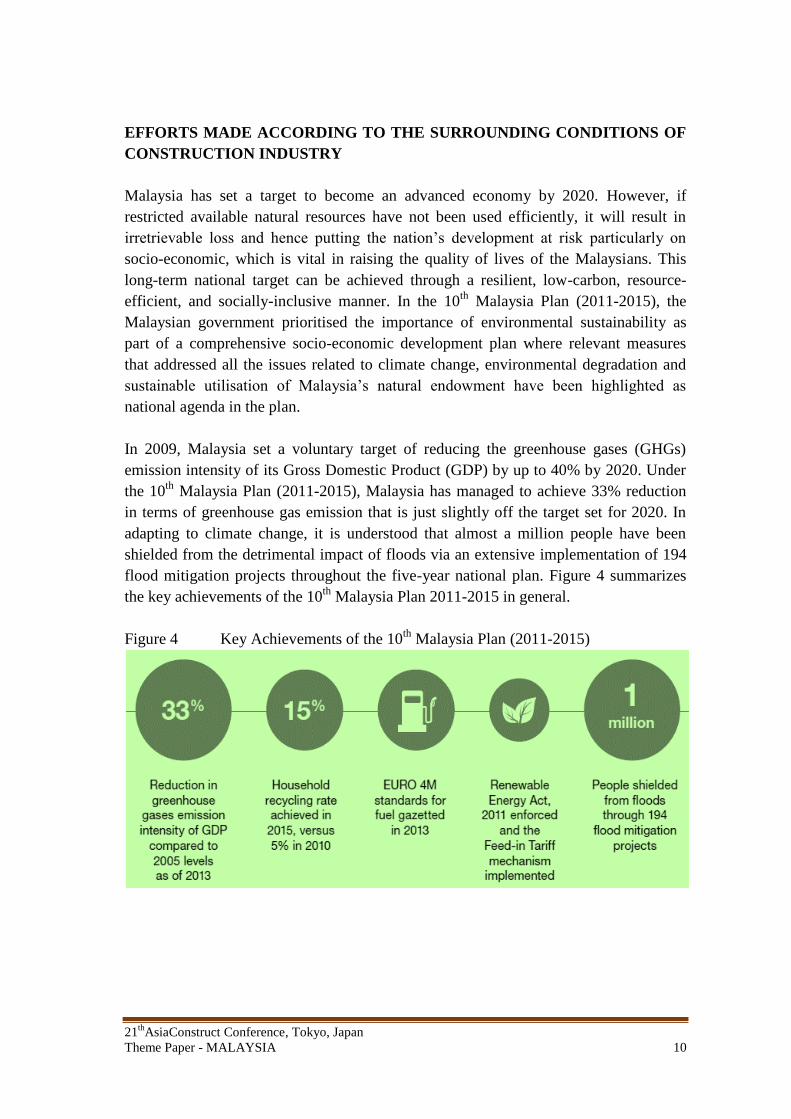
In 2009, Malaysia set a voluntary target of reducing the greenhouse gases (GHGs)
emission intensity of its Gross Domestic Product (GDP) by up to 40% by 2020. Under
the 10th
Malaysia Plan (2011-2015), Malaysia has managed to achieve 33% reduction
in terms of greenhouse gas emission that is just slightly off the target set for 2020. In
adapting to climate change, it is understood that almost a million people have been
shielded from the detrimental impact of floods via an extensive implementation of 194
flood mitigation projects throughout the five-year national plan. Figure 4 summarizes
the key achievements of the 10th
Malaysia Plan 2011-2015 in general.
Figure 4 Key Achievements of the 10th
Malaysia Plan (2011-2015)
21th
AsiaConstruct Conference, Tokyo, Japan
Theme Paper - MALAYSIA 11
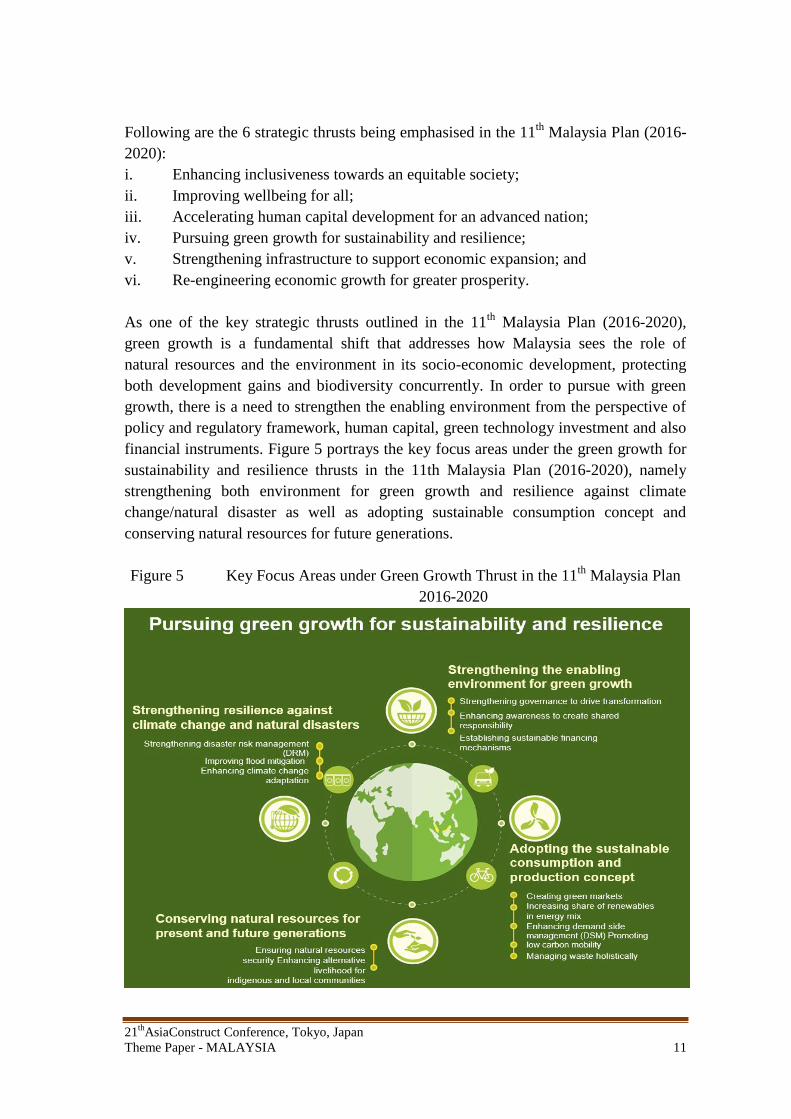
Following are the 6 strategic thrusts being emphasised in the 11th
Malaysia Plan (2016-
2020):
i. Enhancing inclusiveness towards an equitable society;
ii. Improving wellbeing for all;
iii. Accelerating human capital development for an advanced nation;
iv. Pursuing green growth for sustainability and resilience;
v. Strengthening infrastructure to support economic expansion; and
vi. Re-engineering economic growth for greater prosperity.
As one of the key strategic thrusts outlined in the 11th
Malaysia Plan (2016-2020),
green growth is a fundamental shift that addresses how Malaysia sees the role of
natural resources and the environment in its socio-economic development, protecting
both development gains and biodiversity concurrently. In order to pursue with green
growth, there is a need to strengthen the enabling environment from the perspective of
policy and regulatory framework, human capital, green technology investment and also
financial instruments. Figure 5 portrays the key focus areas under the green growth for
sustainability and resilience thrusts in the 11th Malaysia Plan (2016-2020), namely
strengthening both environment for green growth and resilience against climate
change/natural disaster as well as adopting sustainable consumption concept and
conserving natural resources for future generations.
Figure 5 Key Focus Areas under Green Growth Thrust in the 11th
Malaysia Plan
2016-2020
21th
AsiaConstruct Conference, Tokyo, Japan
Theme Paper - MALAYSIA 12
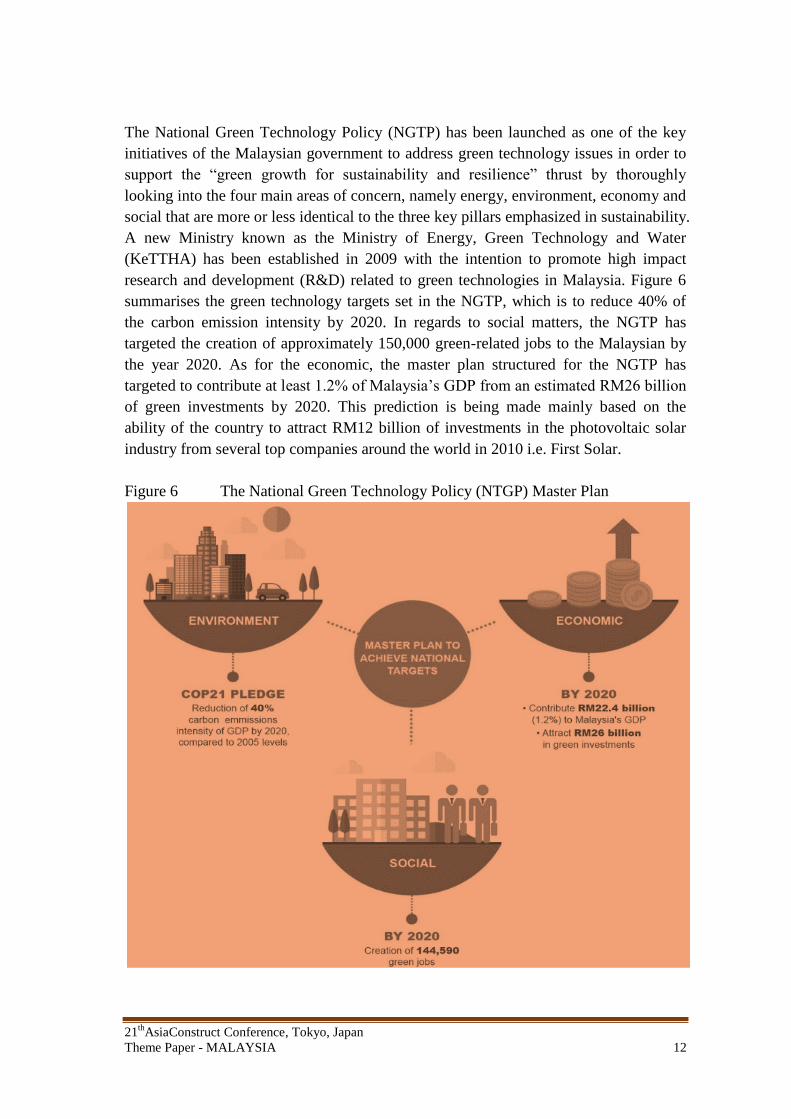
The National Green Technology Policy (NGTP) has been launched as one of the key
initiatives of the Malaysian government to address green technology issues in order to
support the “green growth for sustainability and resilience” thrust by thoroughly
looking into the four main areas of concern, namely energy, environment, economy and
social that are more or less identical to the three key pillars emphasized in sustainability.
A new Ministry known as the Ministry of Energy, Green Technology and Water
(KeTTHA) has been established in 2009 with the intention to promote high impact
research and development (R&D) related to green technologies in Malaysia. Figure 6
summarises the green technology targets set in the NGTP, which is to reduce 40% of
the carbon emission intensity by 2020. In regards to social matters, the NGTP has
targeted the creation of approximately 150,000 green-related jobs to the Malaysian by
the year 2020. As for the economic, the master plan structured for the NGTP has
targeted to contribute at least 1.2% of Malaysia’s GDP from an estimated RM26 billion
of green investments by 2020. This prediction is being made mainly based on the
ability of the country to attract RM12 billion of investments in the photovoltaic solar
industry from several top companies around the world in 2010 i.e. First Solar.
Figure 6 The National Green Technology Policy (NTGP) Master Plan
21th
AsiaConstruct Conference, Tokyo, Japan
Theme Paper - MALAYSIA 13
The construction industry in Malaysia is expected to undergo a full transformation from
conventional into a modern, highly productive and sustainable industry under the
Construction Industry Transformation Programme (CITP) blueprint. The CITP
blueprint, which forms part of the 11th Malaysia Plan (2016–2020), comprises of 18
initiatives from four key strategic thrusts: quality, safety and professionalism;
environment sustainability; productivity; and internalisation. Besides ensuring the
Malaysian construction industry as a low carbon, sustainable building and
infrastructure model country especially to ASEAN counterparts through the
implementation of sustainable construction systems and practices via CIDB’s centre of
excellence, the CITP blueprint also considers initiatives that able to inspire faster
adoption of the IBS construction technique via the establishment of appropriate
economic mechanisms and modern practices.
Construction Industry Transformation Programme (CITP) 2016 - 2020
Despite many initiatives and programmes being implemented over the years, real and
substantial issues persist in the construction industry. In line to the national agenda set
in the 11th
Malaysia Plan (2016-2020), which acts as the core of our nation’s aspirations
towards a robust and dynamic economy, the Construction Industry Development Board
(CIDB) Malaysia has launched the Construction Industry Transformation Programme
(CITP) (2016–2020) to contribute to and align with these national transformation
strategies, to ensure continuity and consistency with the national agenda. The
implementation of the CITP is expected to address all the 6 strategic thrusts outlined in
the 11th
Malaysia Plan (2016-2020). The CITP has been developed mainly based on
persistent issues and problems that continue to take place in the construction industry
practice in Malaysia despite the implementation of relevant initiatives and programmes
over the years such as limited emphasis on quality in workmanship and quality
assessments resilience of construction works to natural disasters, high carbon emissions
and energy use coupled with high contribution of construction waste to landfills. Thus,
the CITP comprises of 4 key strategic thrusts;
CITP Strategic Thrust 1: Quality, safety & professionalism;
CITP Strategic Thrust 2: Environmental sustainability;
CITP Strategic Thrust 3: Productivity; and
CITP Strategic Thrust 4: Internationalisation.
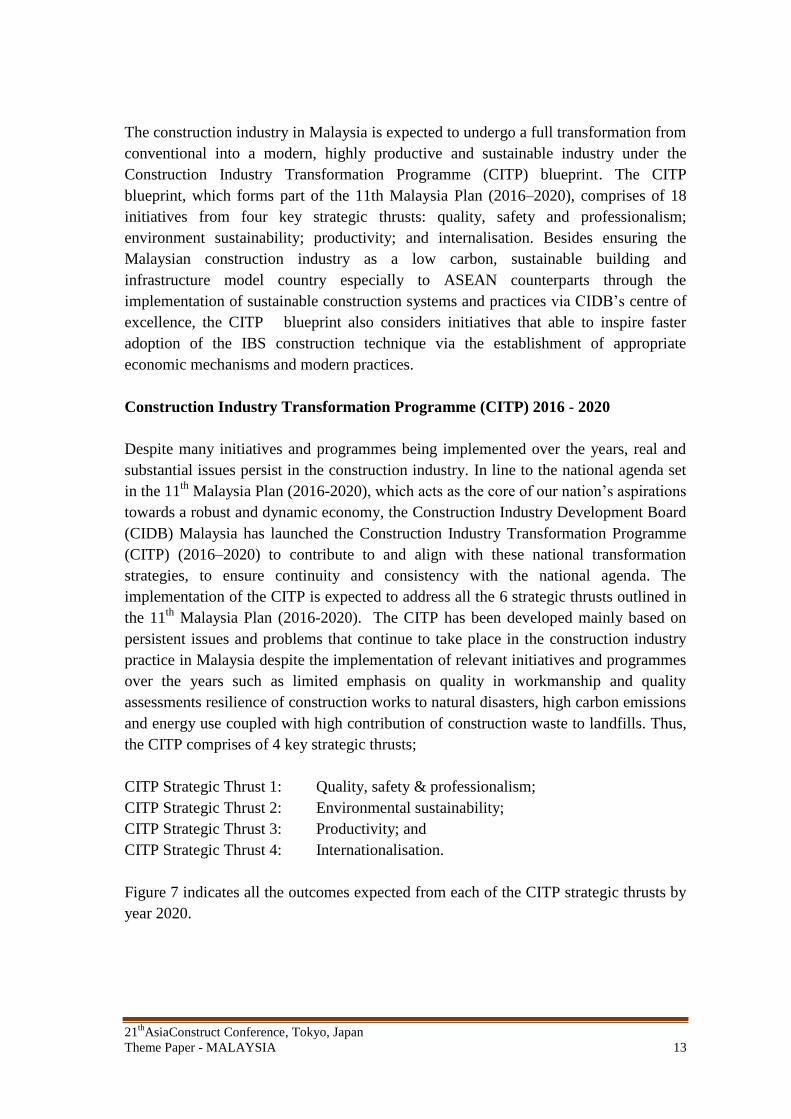
Figure 7 indicates all the outcomes expected from each of the CITP strategic thrusts by
year 2020.
21th
AsiaConstruct Conference, Tokyo, Japan
Theme Paper - MALAYSIA 14
Figure 7 Expected Outcomes from the Four Strategic Thrusts of the CITP
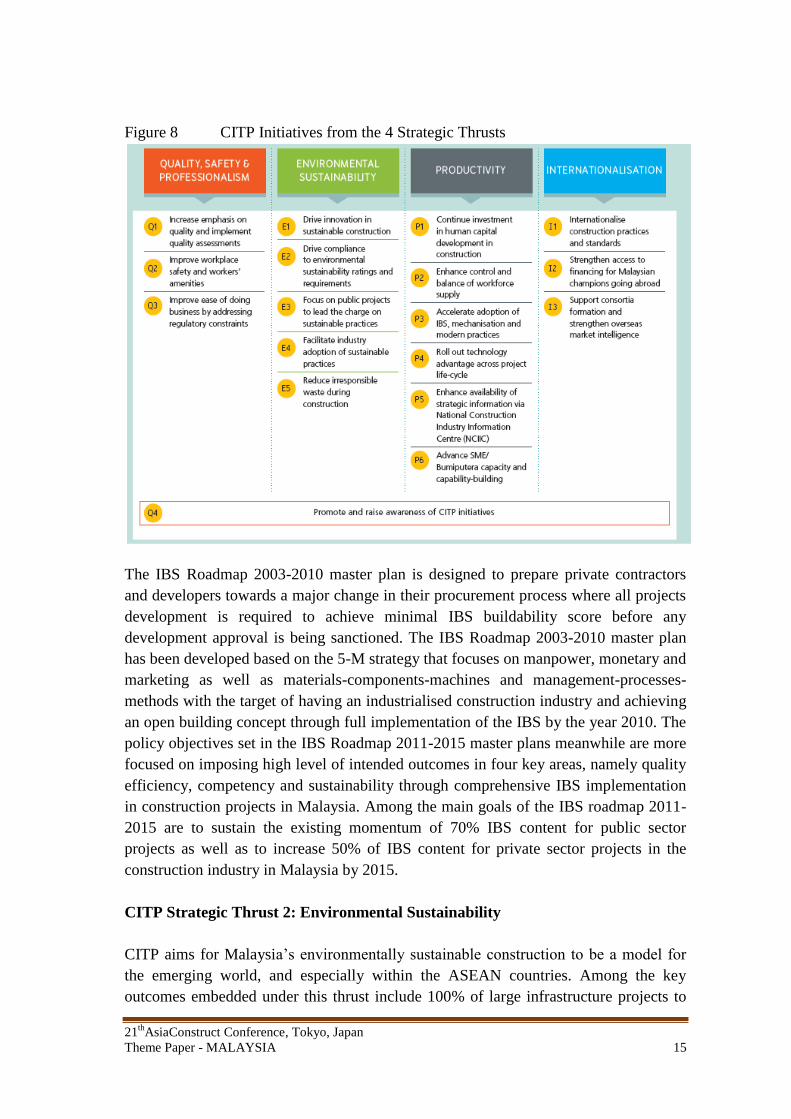
Figure 8 portrays all the potential initiatives that should be addressed by each of the
four strategic thrusts in the CITP by 2020. The productivity thrust has the highest
number of initiatives that must be achieved within the next 5 years including full
adoption of the Industrialised Building System (IBS). In the Malaysian context, IBS is
described as a construction technique in which components are manufactured in a
controlled environment (on or off site), transported, positioned and assembled into a
structure with minimal additional site work. Among the key national iconic landmarks
that have been procured using the IBS technique include KL Tower (steel beams and
columns for tower head), the Kuala Lumpur International Airport (steel roof structure)
and the PETRONAS Twin Towers (steel beams and steel decking for the floor system).
The IBS technique offers minimal wastage; fewer site materials; a cleaner and neater
environment; controlled quality; and lower total construction costs. The CIDB, which is
responsible to courage the standardisation and improvement of construction techniques
and materials in Malaysia, has been given the priority to be the first champion of a
coordinated national level programme to promote the IBS implementation policy in the
construction industry in Malaysia through IBS Roadmap 2003-2010 and IBS Roadmap
2011-2015 master plans.
21th
AsiaConstruct Conference, Tokyo, Japan
Theme Paper - MALAYSIA 15
Figure 8 CITP Initiatives from the 4 Strategic Thrusts
The IBS Roadmap 2003-2010 master plan is designed to prepare private contractors
and developers towards a major change in their procurement process where all projects
development is required to achieve minimal IBS buildability score before any
development approval is being sanctioned. The IBS Roadmap 2003-2010 master plan
has been developed based on the 5-M strategy that focuses on manpower, monetary and
marketing as well as materials-components-machines and management-processes-
methods with the target of having an industrialised construction industry and achieving
an open building concept through full implementation of the IBS by the year 2010. The
policy objectives set in the IBS Roadmap 2011-2015 master plans meanwhile are more
focused on imposing high level of intended outcomes in four key areas, namely quality
efficiency, competency and sustainability through comprehensive IBS implementation
in construction projects in Malaysia. Among the main goals of the IBS roadmap 2011-
2015 are to sustain the existing momentum of 70% IBS content for public sector
projects as well as to increase 50% of IBS content for private sector projects in the
construction industry in Malaysia by 2015.
CITP Strategic Thrust 2: Environmental Sustainability
CITP aims for Malaysia’s environmentally sustainable construction to be a model for
the emerging world, and especially within the ASEAN countries. Among the key
outcomes embedded under this thrust include 100% of large infrastructure projects to
21th
AsiaConstruct Conference, Tokyo, Japan
Theme Paper - MALAYSIA 16
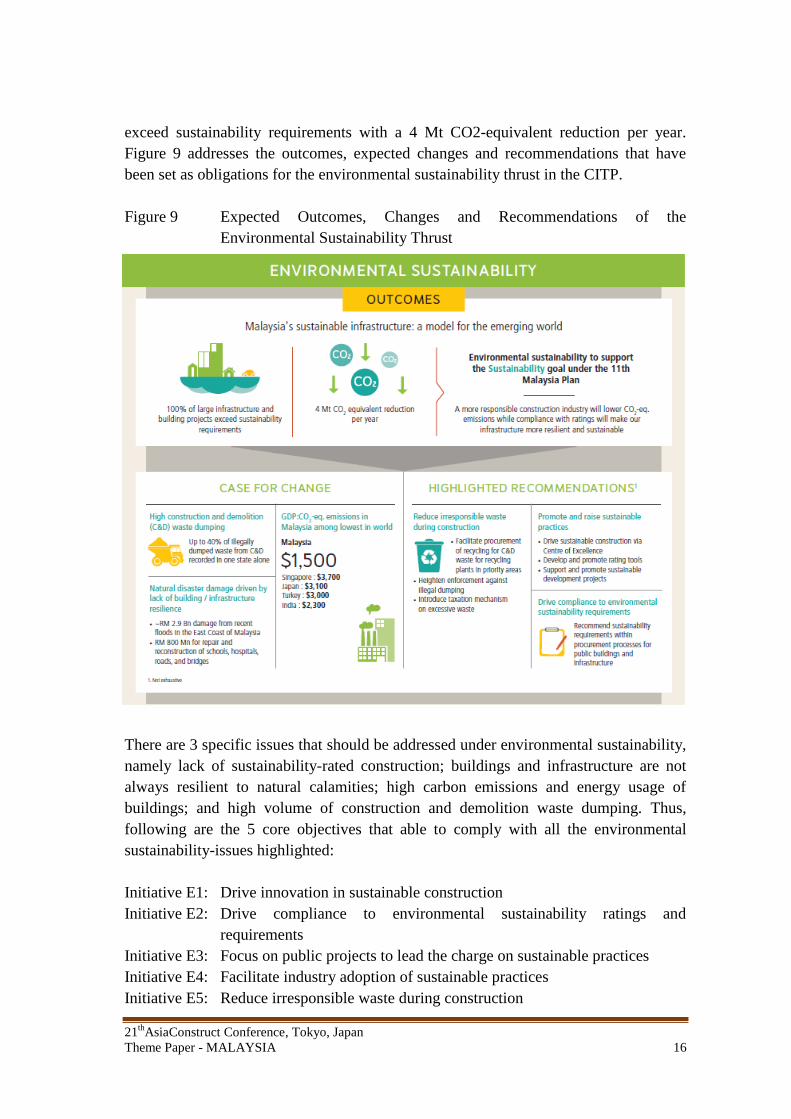
exceed sustainability requirements with a 4 Mt CO2-equivalent reduction per year.
Figure 9 addresses the outcomes, expected changes and recommendations that have
been set as obligations for the environmental sustainability thrust in the CITP.
Figure 9 Expected Outcomes, Changes and Recommendations of the
Environmental Sustainability Thrust
There are 3 specific issues that should be addressed under environmental sustainability,
namely lack of sustainability-rated construction; buildings and infrastructure are not
always resilient to natural calamities; high carbon emissions and energy usage of
buildings; and high volume of construction and demolition waste dumping. Thus,
following are the 5 core objectives that able to comply with all the environmental
sustainability-issues highlighted:
Initiative E1: Drive innovation in sustainable construction
Initiative E2: Drive compliance to environmental sustainability ratings and
requirements
Initiative E3: Focus on public projects to lead the charge on sustainable practices
Initiative E4: Facilitate industry adoption of sustainable practices
Initiative E5: Reduce irresponsible waste during construction
21th
AsiaConstruct Conference, Tokyo, Japan
Theme Paper - MALAYSIA 17
Initiative E1 focuses improving the three sustainability pillars on long-term basis
including the preservation of required resources as well as protecting natural function
and the ecosystem. Initiative E2 aims to ensure the availability of sustainability rating
tool that suits with minimum sustainability standards in the Malaysian context prior to
driving its full adoption into large-scale public projects. Initiative 3 mainly look into
improving sustainability standards for construction particularly on procurement
specifications, resource allocation, and resource performance. Initiative 4 meanwhile
addresses all the important mechanisms and incentives that able to expedite the
adoption of environmentally sustainable development by the private sector. Enhancing
waste efficiency and waste management practices in the construction industry practice
in Malaysia are the primary objectives of Initiative 5 embedded under environmental
sustainability thrust in the CITP blueprint.
Initiatives E1 and E2 are expected to have a significant contribution towards achieving
the fourth strategic thrust of 11th
Malaysia Plan: ‘Pursuing green growth for
sustainability and resilience’. The Centre of Excellence (CoE) for Sustainable
Construction has been initiated as the “home” for driving sustainability in construction
through a number of host of initiatives and functions. Apart from developing,
promoting, and implementing sustainable construction systems and practices in
Malaysia and beyond. Besides that, the CoE is responsible to enhance awareness to
create shared accountability by setting up a platform for knowledge sharing and
collaboration.
Malaysian Carbon Reduction and Environmental Sustainability Tool (MyCREST)
In terms of environmental responsibility, buildings are one of the key sources to reduce
carbon emissions around the world due to the fact that residential and commercial
buildings are one of the largest consumers of energy and water as well as producers of
emissions and waste. In Malaysia, residential and commercial buildings are estimated
to consume 15% of the total energy and have been identified as key contributor towards
the greenhouse gas emissions. Moreover, less than 2% of buildings in this country has
been rated with a sustainability tool and many local construction businesses have yet to
adopt more environmentally friendly practices of the kind that are already common in
neighbouring countries like Singapore. The Ministry of Works through the Public
Works Department (JKR) and CIDB introduced the Malaysian Carbon Reduction and
Environmental Sustainability Tool (MyCREST) as a sustainability rating tool, which
aims to quantify and reduce carbon emissions in the construction sector particularly on
building projects. MyCREST would act as guidelines for industry players to
incorporate greater environmentally sustainable practices in their projects
21th
AsiaConstruct Conference, Tokyo, Japan
Theme Paper - MALAYSIA 18
One of the key objectives of MyCREST is to ensure that the target set in the CITP for
the construction industry to achieve a reduction of 4 mega tonnes (MT) of CO2 (carbon
dioxide) emissions per year can be achieved in line with the Malaysian government's
commitment to reduce greenhouse emissions by 40% by 2020. As a result, all public
projects that are worth RM50 million and above must be assessed via MyCREST as
one of the initiatives by the Malaysian government in a bid to reduce carbon emissions
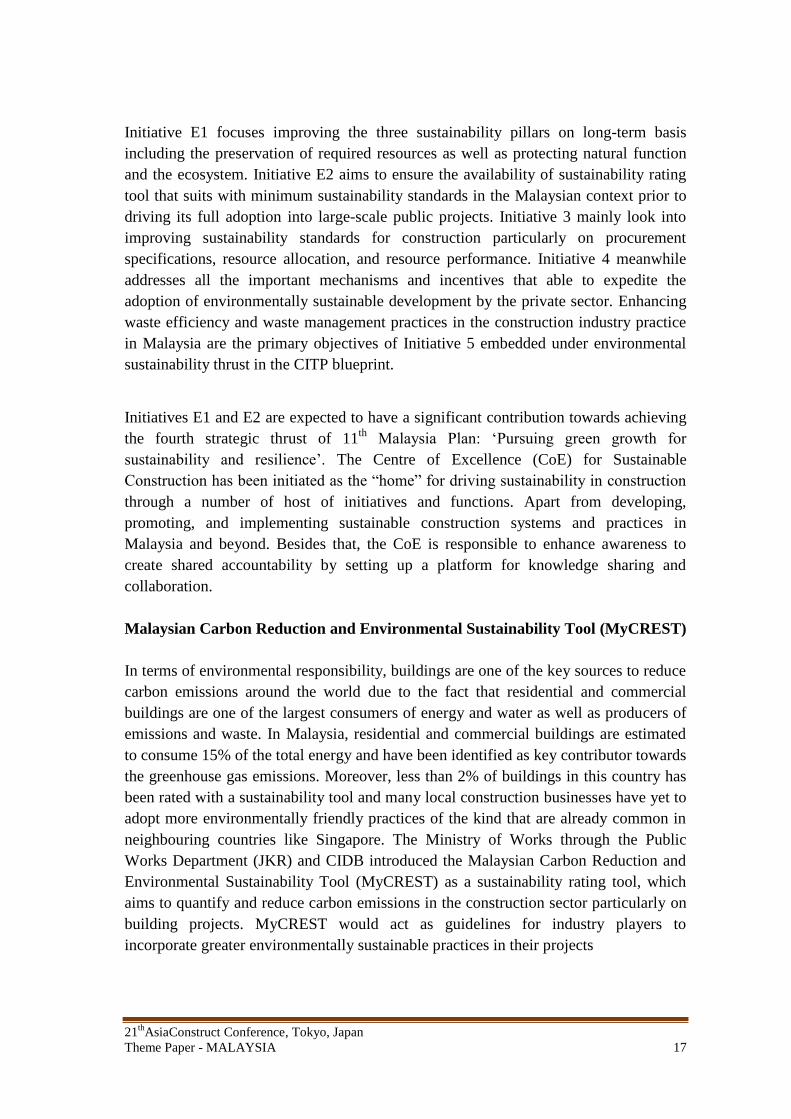
in the construction industry. MyCREST considers 11 assessment criteria that range
from the pre-design phase up to the stage of sustainable facility management where
points are usually being awarded based on carbon emission reduction efforts by the
projects assessed. Figure 10 portrays all the 11 criteria set for the assessment of
MyCREST.
Figure 10 The 11 Assessment Criteria of MyCREST
FUTURE DEVELOPMENT FOR CONSTRUCTION SUSTAINABLE POLICY
AND MARKET
Currently in Malaysia, there is no sustainable infrastructure rating tool in Malaysia to
assess and preclude usage of materials and practices that are not aligned with
sustainability, unlike buildings where there are a few in use such as the Green Building
Index (GBI) and most recently, MyCREST. Only less than 2% of buildings and
infrastructure are rated for environmental sustainability. This is driven partly by the
lack of overarching policies and regulations that require these ratings or assessments,
and is exacerbated further by the perception that ‘green’ is more expensive. Wherever
there are supporting green and sustainability-related policies, relatively inability to
enforce contributes to a low take-up of sustainable practices.
21th
AsiaConstruct Conference, Tokyo, Japan
Theme Paper - MALAYSIA 19
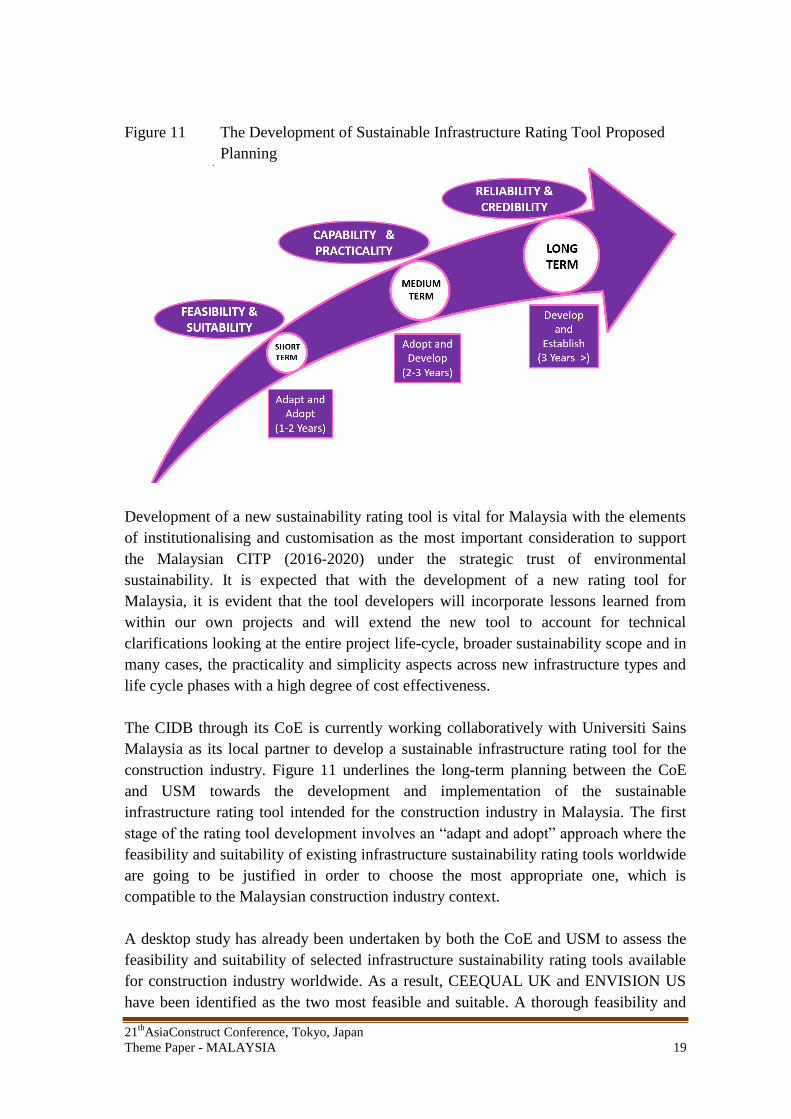
Figure 11 The Development of Sustainable Infrastructure Rating Tool Proposed
Planning
Development of a new sustainability rating tool is vital for Malaysia with the elements
of institutionalising and customisation as the most important consideration to support
the Malaysian CITP (2016-2020) under the strategic trust of environmental
sustainability. It is expected that with the development of a new rating tool for
Malaysia, it is evident that the tool developers will incorporate lessons learned from
within our own projects and will extend the new tool to account for technical
clarifications looking at the entire project life-cycle, broader sustainability scope and in
many cases, the practicality and simplicity aspects across new infrastructure types and
life cycle phases with a high degree of cost effectiveness.
The CIDB through its CoE is currently working collaboratively with Universiti Sains
Malaysia as its local partner to develop a sustainable infrastructure rating tool for the
construction industry. Figure 11 underlines the long-term planning between the CoE
and USM towards the development and implementation of the sustainable
infrastructure rating tool intended for the construction industry in Malaysia. The first
stage of the rating tool development involves an “adapt and adopt” approach where the
feasibility and suitability of existing infrastructure sustainability rating tools worldwide
are going to be justified in order to choose the most appropriate one, which is
compatible to the Malaysian construction industry context.
A desktop study has already been undertaken by both the CoE and USM to assess the
feasibility and suitability of selected infrastructure sustainability rating tools available
for construction industry worldwide. As a result, CEEQUAL UK and ENVISION US
have been identified as the two most feasible and suitable. A thorough feasibility and
21th
AsiaConstruct Conference, Tokyo, Japan
Theme Paper - MALAYSIA 20
suitability assessment on both rating tools is currently underway through an extensive
pilot project evaluation on selected highway projects in Malaysia. Once the most
feasible and suitable infrastructure sustainability rating tool has been identified, the
second stage of the Malaysian sustainable infrastructure rating tool will involve the
assessment on the capability and practicality of the selected rating tool towards the
construction industry practice in Malaysia. This is the stage where various types of
infrastructure projects in Malaysia such as bridges and airports are going to be tested to
determine the reliability and credibility of the proposed model prior to establishing a
new sustainable infrastructure rating tool for construction industry in Malaysia by 2020.
CONCLUSION
The government has initiated various ways to promote substantial implementation of
green and sustainable construction in the industry practice in Malaysia through robust
national plans over the years. The government has even shifted its main emphasis from
the conventional and costly ‘grow first, clean-up later’ approach onto a greener course
of “Green Growth” in the most recent Malaysia plan to ensure that most of the projects
procured are environmentally sustainable. In line with the national agenda, several
sustainable construction-related initiatives have been made available “by the industry
and for the industry” such as the GBI for green buildings. The government has also
strategized the ambition to transform the Malaysian construction industry into using
modern and sustainable method of construction through the Construction Industry
Master Plan (CIMP) 2006 – 2015. CIDB has been addressing issues on sustainable and
green construction in line with the CIMP’s agenda through its IBS Roadmap.
The construction industry in Malaysia is expected to undergo a full transformation from
conventional into a modern, highly productive and sustainable industry by 2020 under
the Construction Industry Transformation Programme (CITP) blueprint. The CITP
blueprint, which forms part of the 11th Malaysia Plan (2016–2020), comprises of 18
initiatives from four key strategic thrusts: quality, safety and professionalism;
environment sustainability; productivity; and internalisation. Besides ensuring the
Malaysian construction industry as a low carbon, sustainable building and
infrastructure model country especially to ASEAN counterparts through the
implementation of sustainable construction systems and practices via CIDB’s centre of
excellence, the CITP blueprint also consider initiatives that able to inspire faster
adoption of the IBS construction technique via the establishment of appropriate
economic mechanisms and modern practices.
To ensure a successful delivery of the more recent transformation plan like the CITP
and sustainability assessment tool such as MyCREST, a robust approach should be
initiated to enhance understanding and awareness of the industry practitioners in
regards to the importance of green and sustainable construction that able to increase the

21th
AsiaConstruct Conference, Tokyo, Japan
Theme Paper - MALAYSIA 21
efficiency of resources while sustaining natural resources for the future generation and
also reduce impact on human for better tomorrow. Moreover, a sustainable
infrastructure rating tool is currently under development by the CIDB to ensure that all
building and infrastructure projects in the construction industry in Malaysia are
sustainable and green by 2020.

COUNTRY REPORT
MALAYSIA 21st AsiaConstruct Conference
Ms. Che Saliza Che Soh Senior Manager of Business Division
Construction Industry Development Board (CIDB) Malaysia
Tokyo, Japan
24 & 25 November 2016
2
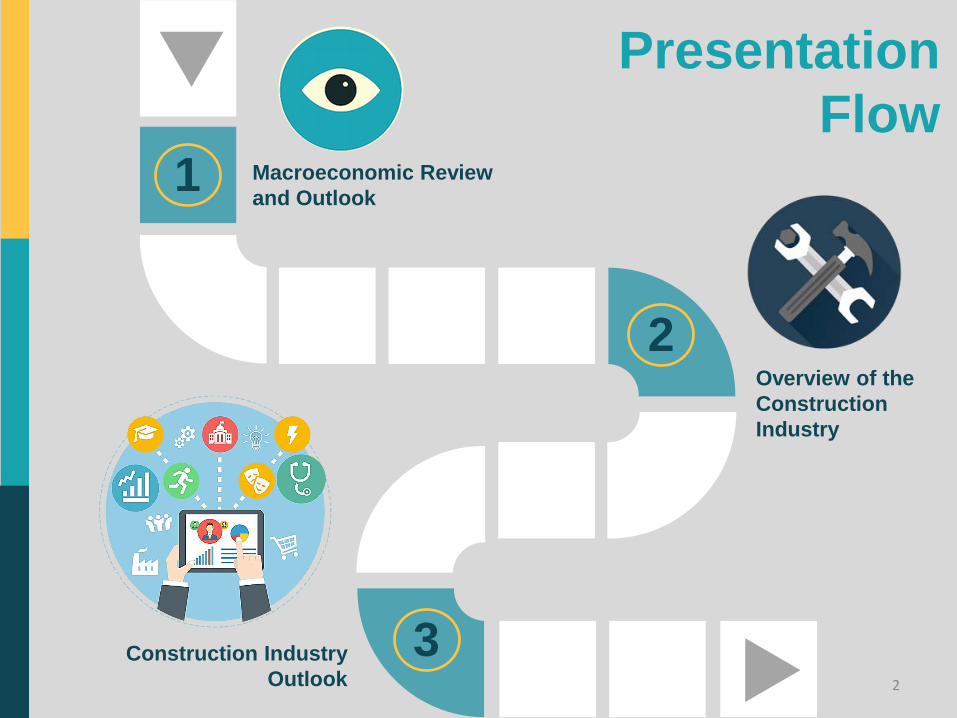
Presentation
Flow Macroeconomic Review
and Outlook
Overview of the
Construction
Industry
Construction Industry
Outlook
1
2
3

MACROECONOMIC
REVIEW AND OUTLOOK
3
1
EXPORT
• Singapore (15%)
• China (12%),
• USA (11%)
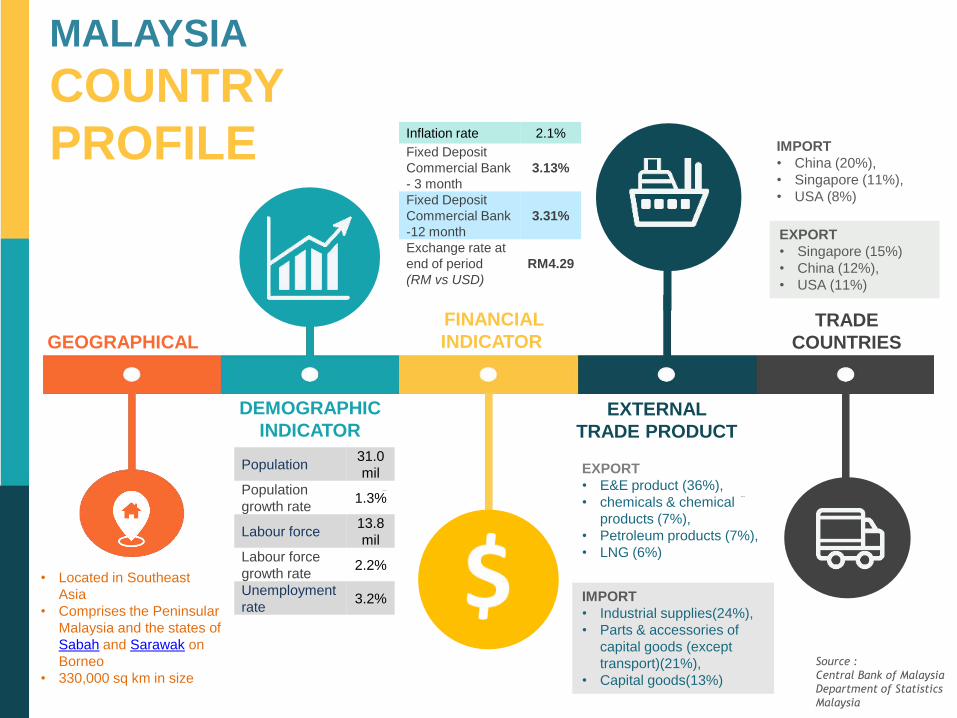
MALAYSIA
COUNTRY
PROFILE
GEOGRAPHICAL
• Located in Southeast
Asia
• Comprises the Peninsular
Malaysia and the states of
Sabah and Sarawak on
Borneo
• 330,000 sq km in size
DEMOGRAPHIC
INDICATOR
FINANCIAL
INDICATOR
IMPORT
• Industrial supplies(24%),
• Parts & accessories of
capital goods (except
transport)(21%),
• Capital goods(13%)
EXTERNAL
TRADE PRODUCT
TRADE
COUNTRIES
IMPORT
• China (20%),
• Singapore (11%),
• USA (8%)
EXPORT
• E&E product (36%),
• chemicals & chemical
products (7%),
• Petroleum products (7%),
• LNG (6%)
Population 31.0
mil
Population
growth rate 1.3%
Labour force 13.8
mil
Labour force
growth rate 2.2%
Unemployment
rate 3.2%
Inflation rate 2.1%
Fixed Deposit
Commercial Bank
- 3 month
3.13%
Fixed Deposit
Commercial Bank
-12 month
3.31%
Exchange rate at
end of period
(RM vs USD)
RM4.29
Source :
Central Bank of Malaysia
Department of Statistics
Malaysia
2011 2012 2013 2014 2015
GDP growth by economic activity at 2010 chained price (RM billion)
Agriculture 88.6 89.4 91.2 93.1 94.1
Mining and Quarrying 85.4 86.8 87.8 90.8 95.1
Manufacturing 203.0 211.9 219.2 232.8 244.2
Construction 29.5 34.9 38.6 43.1 46.6
Services 449.9 479.3 507.8 541.1 568.9
Real GDP 864.9 912.3 955.1 1,012.5 1,062.8
GDP growth by economic activity at 2010 chained price (%)
Agriculture 6.8 1.0 2.0 2.1 1.2
Mining and Quarrying -4.9 1.6 1.2 3.5 4.7
Manufacturing 5.4 4.4 3.4 6.2 4.9
Construction 4.6 18.1 10.6 11.7 8.2
Services 7.0 6.5 5.9 6.6 5.1
Real GDP Growth 5.3 5.5 4.7 6.0 5.0
Malaysia GDP by Sector (Economic Activity)
Source : Central Bank of Malaysia
Projects Awarded vs GDP
23 19 23 24 24 9
79
112 108 149
112
50 5.3% 5.5%
4.7%
6.0%
5.0%
4.10%
4.6%
18.1%
10.6%
11.7%
8.2%
8.40%
0.0%
5.0%
10.0%
15.0%
20.0%
25.0%
0
50
100
150
200
2011 2012 2013 2014 2015 1H 2016
Government Project Private Project
Real GDP Growth Construction GDP Growth
Source :
CIDB Malaysia
Central Bank of Malaysia
Project Value
(RM mil)
GDP
Growth %
OVERVIEW OF THE CONSTRUCTION INDUSTRY
7
2
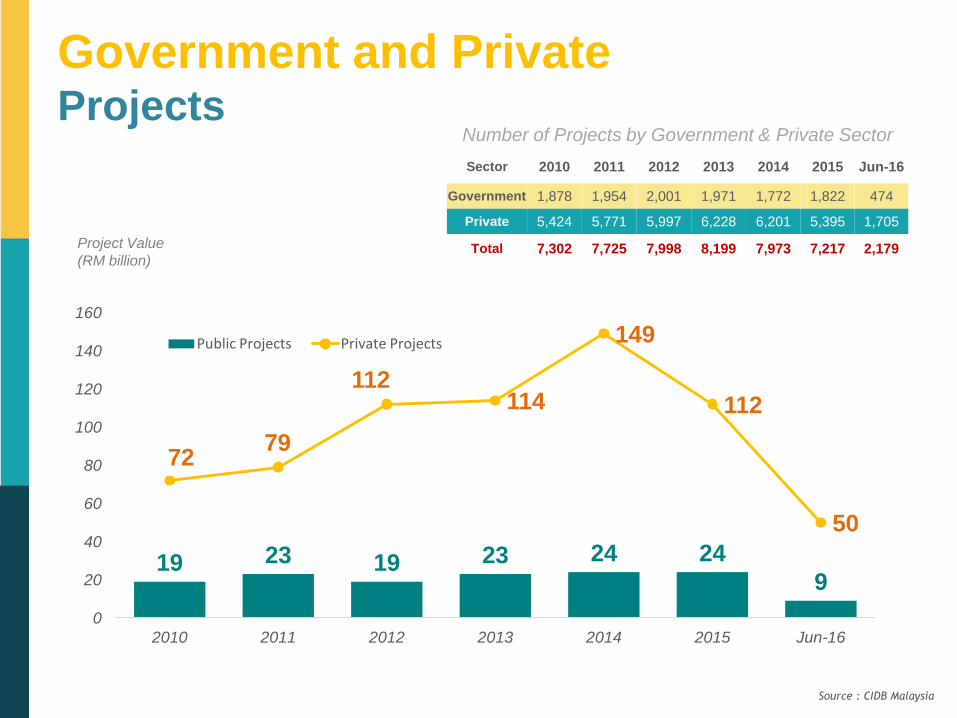
Number of Projects by Government & Private Sector
Sector 2010 2011 2012 2013 2014 2015 Jun-16
Government 1,878 1,954 2,001 1,971 1,772 1,822 474
Private 5,424 5,771 5,997 6,228 6,201 5,395 1,705
Total 7,302 7,725 7,998 8,199 7,973 7,217 2,179
Government and Private Projects
Source : CIDB Malaysia
19 23 19 23 24 24
9
72 79
112 114
149
112
50
0
20
40
60
80
100
120
140
160
2010 2011 2012 2013 2014 2015 Jun-16
Public Projects Private Projects
Project Value
(RM billion)
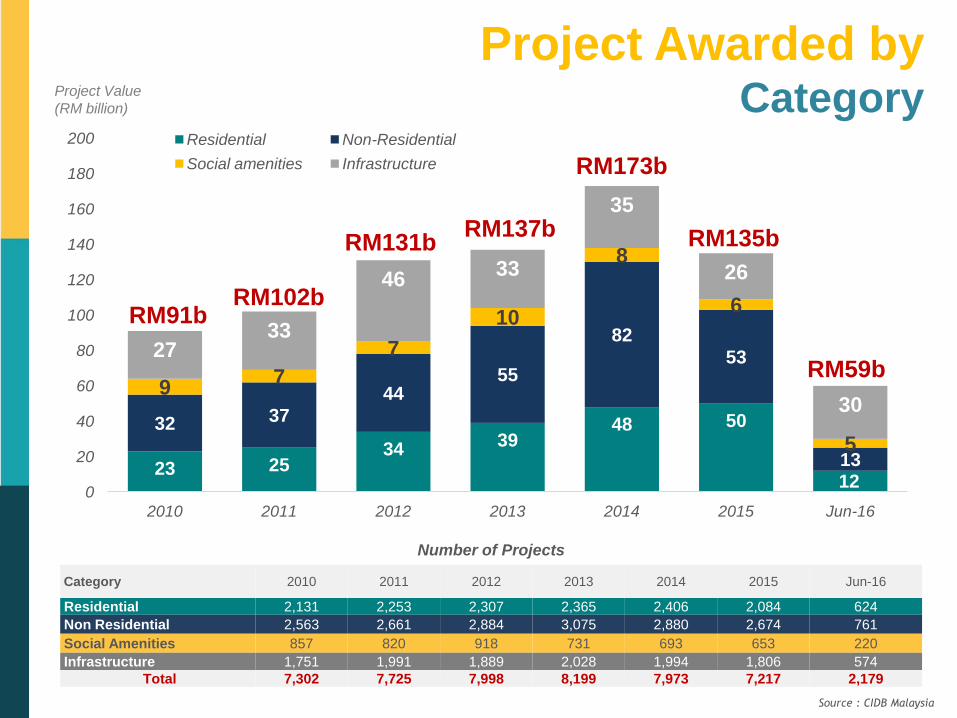
Project Awarded by Category
Source : CIDB Malaysia
Number of Projects
Category 2010 2011 2012 2013 2014 2015 Jun-16
Residential 2,131 2,253 2,307 2,365 2,406 2,084 624
Non Residential 2,563 2,661 2,884 3,075 2,880 2,674 761
Social Amenities 857 820 918 731 693 653 220
Infrastructure 1,751 1,991 1,889 2,028 1,994 1,806 574
Total 7,302 7,725 7,998 8,199 7,973 7,217 2,179
23 25 34
39 48 50
12
32 37
44 55
82
53
13
9 7
7
10
8
6
5
27 33
46 33
35
26
30
0
20
40
60
80
100
120
140
160
180
200
2010 2011 2012 2013 2014 2015 Jun-16
Residential Non-Residential
Social amenities Infrastructure
Project Value
(RM billion)
RM91b RM102b
RM173b
RM131b RM137b RM135b
RM59b
Contractors Registered by Registration Grade
Source : CIDB Malaysia
Grade Bidding Limit 2013 2014 2015 1H 2016
G1 Not exceeding RM200 k 34,485 33,991 34,068 34,863
G2 Not exceeding RM500 k 9,268 10,441 12,407 14,636
G3 Not exceeding RM1 m 8,825 8,875 9,375 10,167
G4 Not exceeding RM3 m 3,038 3,093 3,408 3,669
G5 Not exceeding RM5 m 4,130 4,287 4,746 4,992
G6 Not exceeding RM10 m 1,594 1,528 1,589 1,674
G7 Unlimited 5,332 5,618 6,206 6,650
Foreign Unlimited 373 422 447 422
Total 67,045 68,255 72,246 77,073
Note: As at 30 June 2016
Contractor Personnel REGISTERED
11
Category of Worker 2014 2015
Local Foreign Local Foreign
Construction worker 333,078 172,292 295,711 136,004
Skilled construction worker 53,423 1,659 50,704 1,668
Manager and site assistant
manager 55,634 1,929 51,410 1,462
Construction supervisor 56,923 420 50,933 272
Administrative personnel 141,688 2,146 126,716 1,662
Total 640,746 178,446 575,474 141,068
Source: CIDB Malaysia
Construction Productivity
12
33,006
88,389
23,975
63,753
54,881
98,153
33,803
64,259
53,540
105,156
35,673
66,346
0 20000 40000 60000 80000 100000 120000
AGRICULTURE
MANUFACTURING
CONSTRUCTION
SERVICES
2015 2014 2013
Main Economic
Indicator
Source: Malaysia Productivity Corporation
Ringgit
Malaysia
(RM)
Major Material PRICES
13
2013: RM17.19
2014: RM18.62
2015: RM18.54
2013: RM39.14
2014: RM42.07
2015: RM43.47
2013: RM28.79
2014: RM35.88
2015: RM38.91
2013: RM2,549.13
2014: RM2,388.68
2015: RM2,159.19
Sand
2013: RM0.37
2014: RM0.40
2015: RM0.43
2013: RM17.57
2014: RM18.55
2015: RM19.78
2013: RM252.27
2014: RM226.17
2015: RM237.71
Reinforcement
Iron
Mesh
Bag
(50kg
) To
nn
es
To
nn
es
To
nn
es
m3
m2
Un
it
Ready Mixed
Concrete
Source: CIDB Malaysia
Construction Worker WAGE RATES
14
Category of Worker
Minimum/
Maximum
Wage
Skilled Semi-Skilled
2014 2015 2014 2015
General Construction Worker
- Building
Min. 50.96 53.77 - -
Max. 81.47 82.03 - -
Bricklayer
Min. 75.87 78.98 59.44 61.63
Max. 110.89 111.15 87.22 90.05
Plasterer
Min. 80.67 84.49 63.36 66.11
Max. 119.03 118.53 93.99 95.05
Carpenter - Formwork
Min. 82.89 82.96 63.69 67.11
Max. 117.91 122.81 90.69 95.68
Steel Structure Fabricator
Min. 89.72 88.54 70.90 74.01
Max. 128.76 132.89 101.36 108.19
Highest Wages
Skilled:
• Steel Structure Fabricator
(RM132.89/day)
• Reticulation Plumber
(RM130.14/day)
Semi-Skilled:
• Building Wiring Installer
(RM117.38/day)
• Plumber Reticulation
(RM107.83/day)
Source: CIDB Malaysia
Construction Machinery Operator WAGE RATES
Category of Operator Minimum/
Maximum Wage
Skilled Semi-Skilled
2014 2015 2014 2015
Excavator Operators Min. 78.06 82.49 - -
Max. 123.16 123.53 - -
Backhoe Loader Operators Min. 80.39 81.74 - -
Max. 116.31 133.21 - -
Roller Operators Min. 76.97 79.83 61.87 65.36
Max. 111.39 116.04 84.21 95.51
Mobile Crane Operators Min. 98.88 99.41 75.27 75.41
Max. 148.90 190.53 115.66 123.86
Tower Crane Operators Min. 98.62 92.71 79.24 78.44
Max. 151.31 156.46 113.48 129.53
Highest Wages
Skilled
• Mobile Crane (RM190.53/day)
• Tower Crane (RM156.46/day)
Semi-Skilled
• Tower Crane (RM129.53/day)
• Mobile Crane (RM123.86/day) Source:
CIDB Malaysia
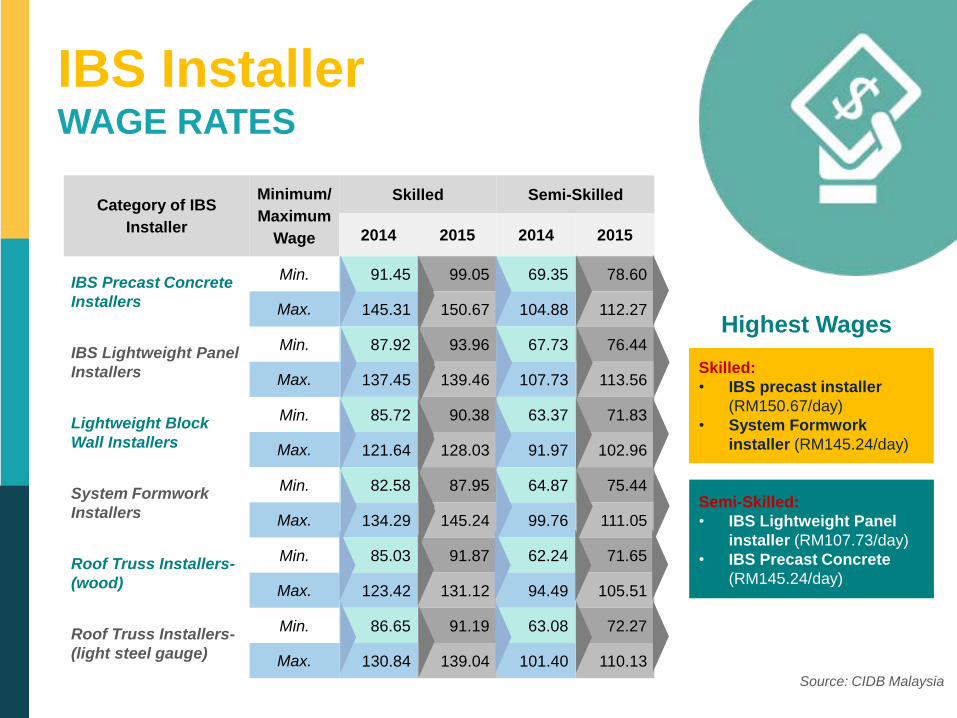
IBS Installer WAGE RATES
Category of IBS
Installer
Minimum/
Maximum
Wage
Skilled Semi-Skilled
2014 2015 2014 2015
IBS Precast Concrete
Installers
Min. 91.45 99.05 69.35 78.60
Max. 145.31 150.67 104.88 112.27
IBS Lightweight Panel
Installers
Min. 87.92 93.96 67.73 76.44
Max. 137.45 139.46 107.73 113.56
Lightweight Block
Wall Installers
Min. 85.72 90.38 63.37 71.83
Max. 121.64 128.03 91.97 102.96
System Formwork
Installers
Min. 82.58 87.95 64.87 75.44
Max. 134.29 145.24 99.76 111.05
Roof Truss Installers-
(wood)
Min. 85.03 91.87 62.24 71.65
Max. 123.42 131.12 94.49 105.51
Roof Truss Installers-
(light steel gauge)
Min. 86.65 91.19 63.08 72.27
Max. 130.84 139.04 101.40 110.13
Highest Wages
Skilled:
• IBS precast installer
(RM150.67/day)
• System Formwork
installer (RM145.24/day)
Semi-Skilled:
• IBS Lightweight Panel
installer (RM107.73/day)
• IBS Precast Concrete
(RM145.24/day)
Source: CIDB Malaysia
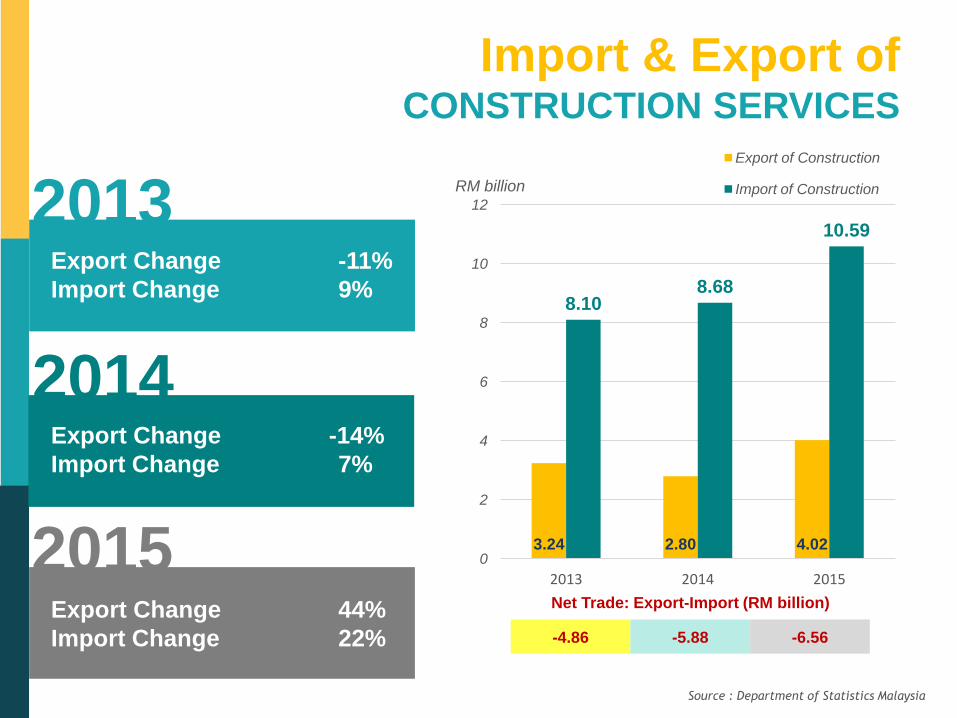
Import & Export of CONSTRUCTION SERVICES
3.24 2.80 4.02
8.10 8.68
10.59
0
2
4
6
8
10
12
2013 2014 2015
Export of Construction
Import of Construction RM billion
2013
2014
2015
Export Change -11%
Import Change 9%
Export Change -14%
Import Change 7%
Export Change 44%
Import Change 22%
Net Trade: Export-Import (RM billion)
-4.86 -5.88 -6.56
Source : Department of Statistics Malaysia
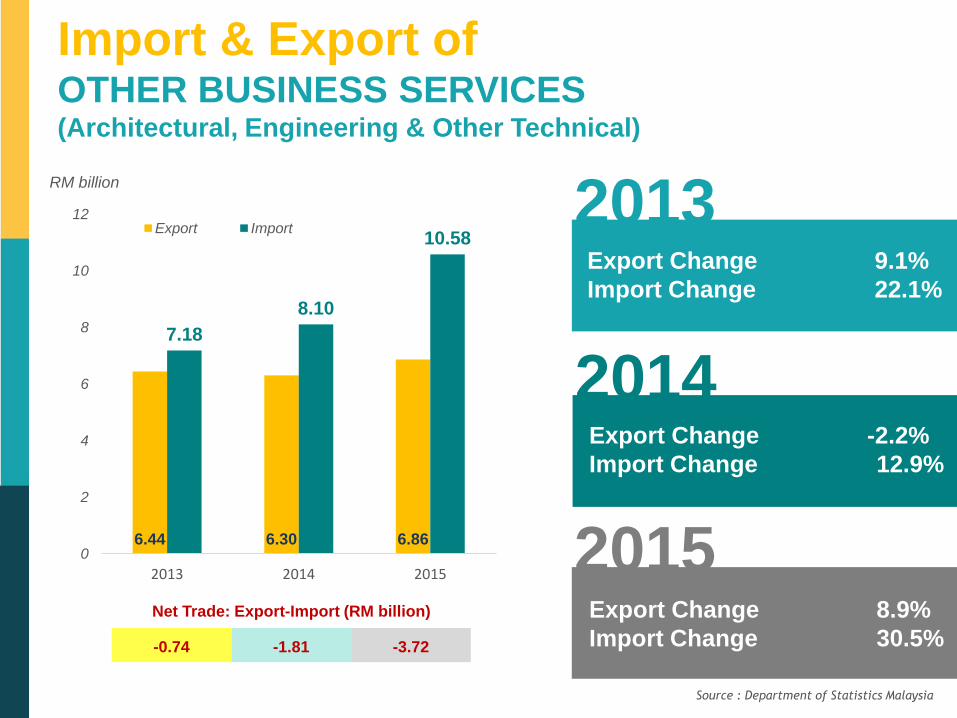
Import & Export of OTHER BUSINESS SERVICES (Architectural, Engineering & Other Technical)
6.44 6.30 6.86
7.18
8.10
10.58
0
2
4
6
8
10
12
2013 2014 2015
Export Import
RM billion
2013
2014
2015
Export Change 9.1%
Import Change 22.1%
Export Change -2.2%
Import Change 12.9%
Export Change 8.9%
Import Change 30.5%
Net Trade: Export-Import (RM billion)
-0.74 -1.81 -3.72
Source : Department of Statistics Malaysia
19
3
CONSTRUCTION
INDUSTRY
Outlook
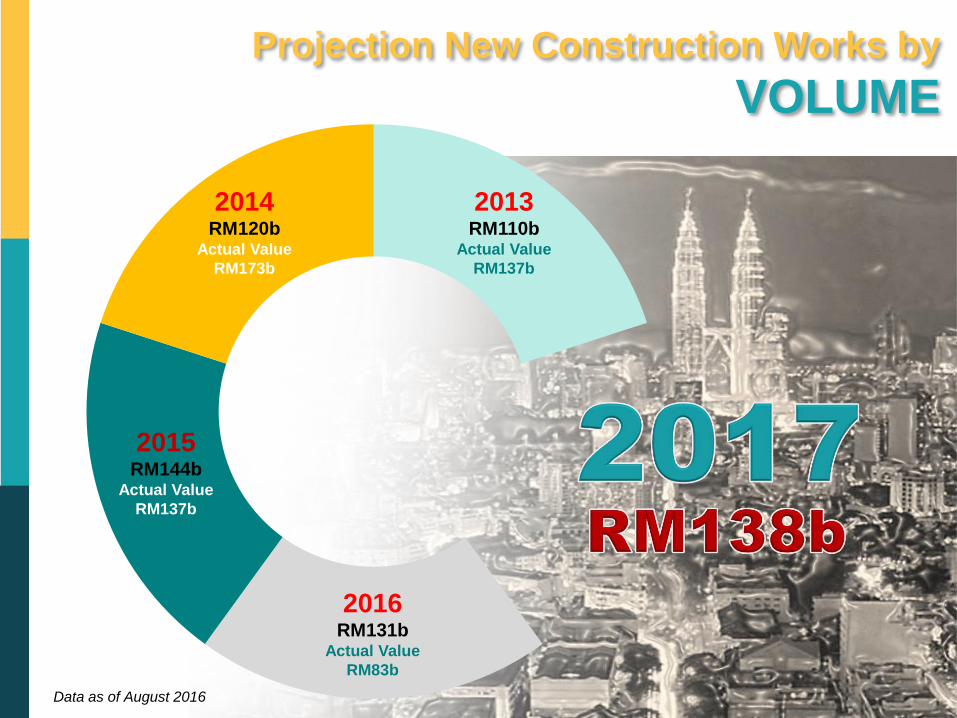
20
Projection New Construction Works by
VOLUME
Data as of August 2016
2013 RM110b
Actual Value
RM137b
2014 RM120b
Actual Value
RM173b
2015 RM144b
Actual Value
RM137b
2016 RM131b
Actual Value
RM83b
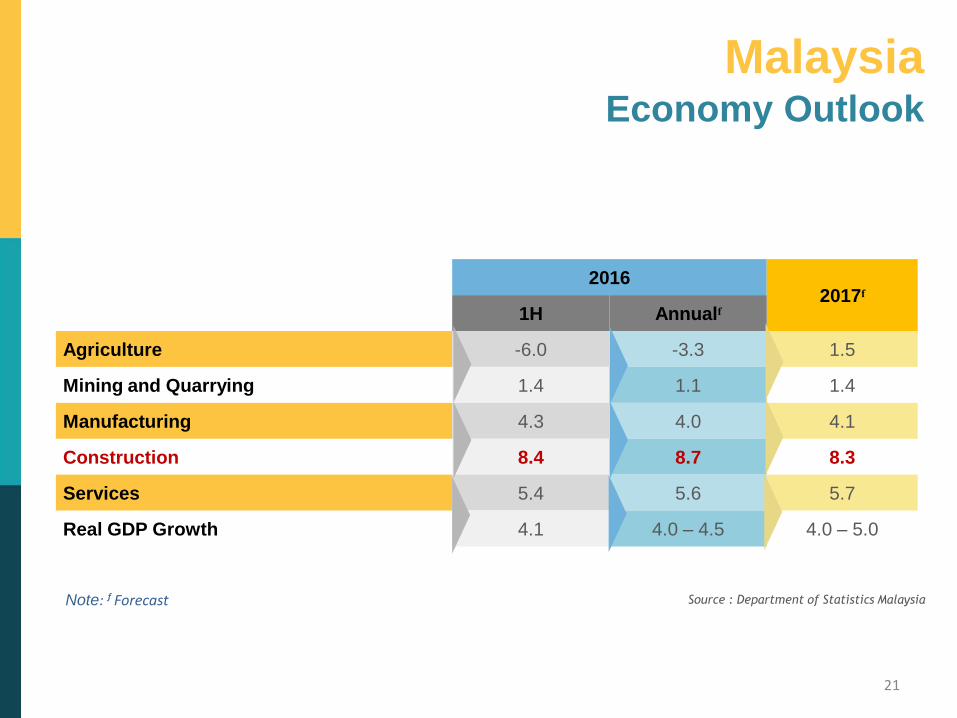
Malaysia Economy Outlook
21
2016 2017ᶠ
1H Annualᶠ
Agriculture -6.0 -3.3 1.5
Mining and Quarrying 1.4 1.1 1.4
Manufacturing 4.3 4.0 4.1
Construction 8.4 8.7 8.3
Services 5.4 5.6 5.7
Real GDP Growth 4.1 4.0 – 4.5 4.0 – 5.0
Note: ᶠ Forecast Source : Department of Statistics Malaysia
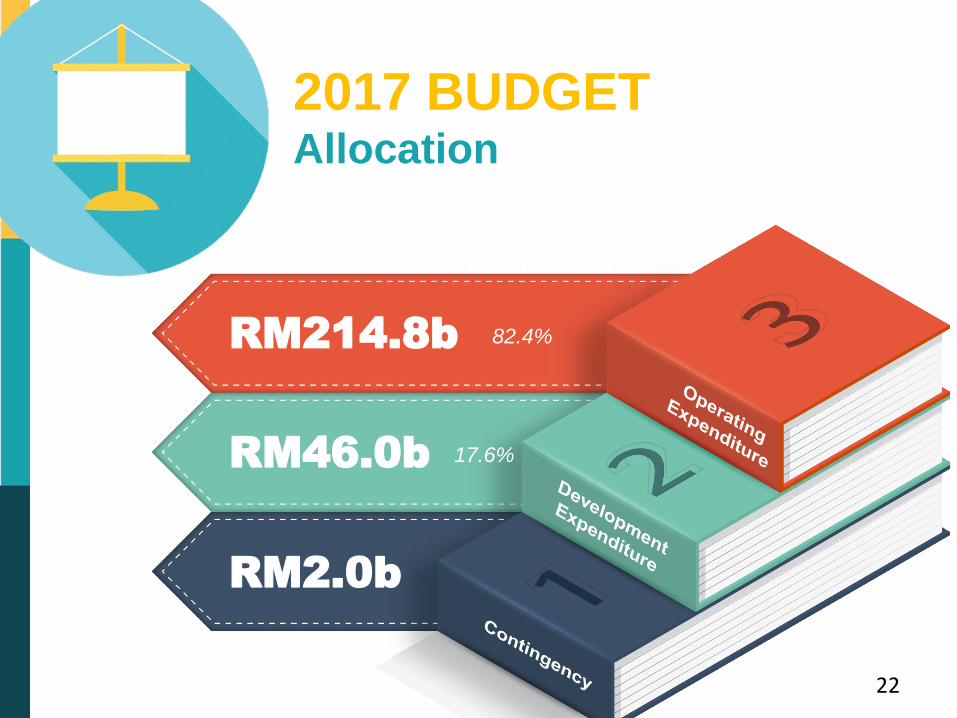
2017 BUDGET Allocation
22
RM214.8b
RM46.0b
RM2.0b
82.4%
17.6%
23
MEGA PROJECTS
Awarded
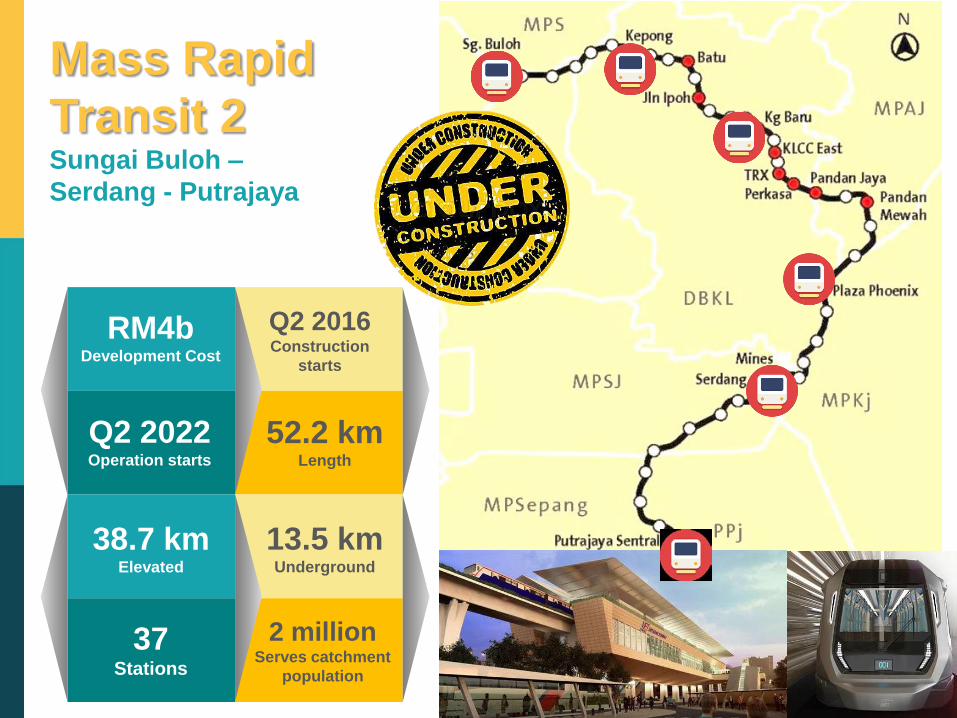
24
Mass Rapid
Transit 2 Sungai Buloh –
Serdang - Putrajaya
RM4b Development Cost
Q2 2022 Operation starts
38.7 km Elevated
37 Stations
Q2 2016 Construction
starts
52.2 km Length
13.5 km Underground
2 million Serves catchment
population
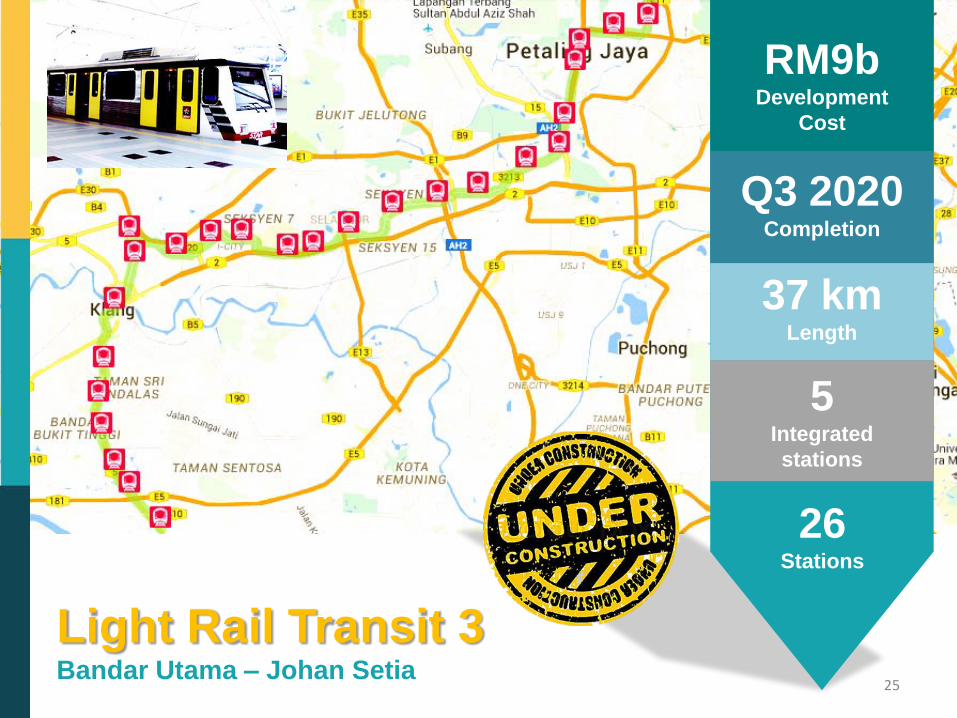
25
Light Rail Transit 3 Bandar Utama – Johan Setia
RM9b Development
Cost
Q3 2020 Completion
37 km Length
5 Integrated
stations
26 Stations
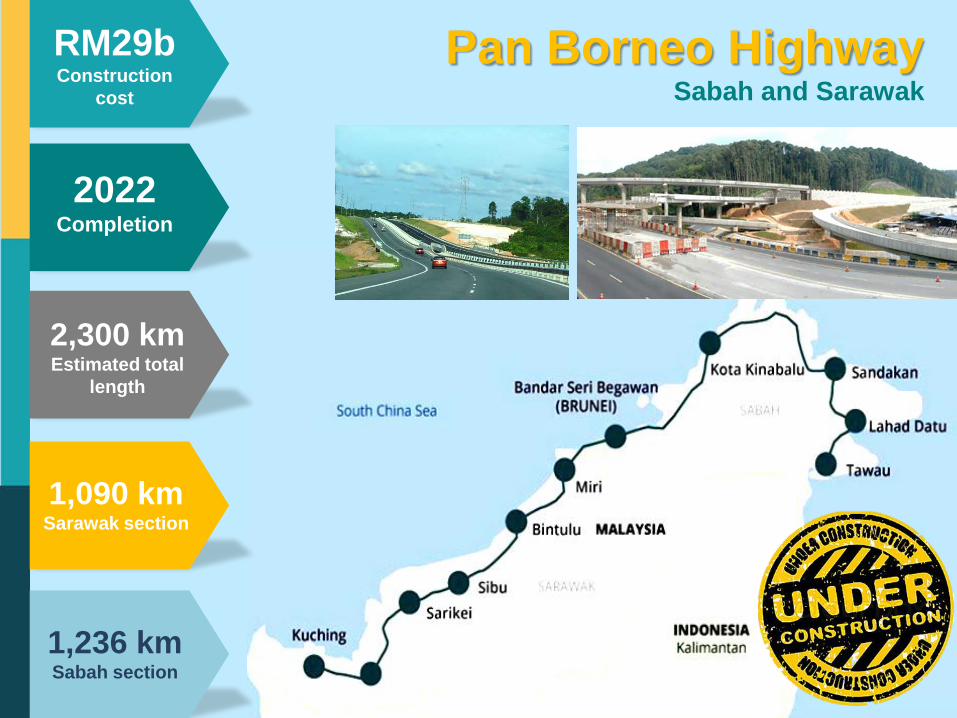
26
Pan Borneo Highway Sabah and Sarawak
RM29b Construction
cost
2022 Completion
2,300 km Estimated total
length
1,090 km Sarawak section
1,236 km Sabah section
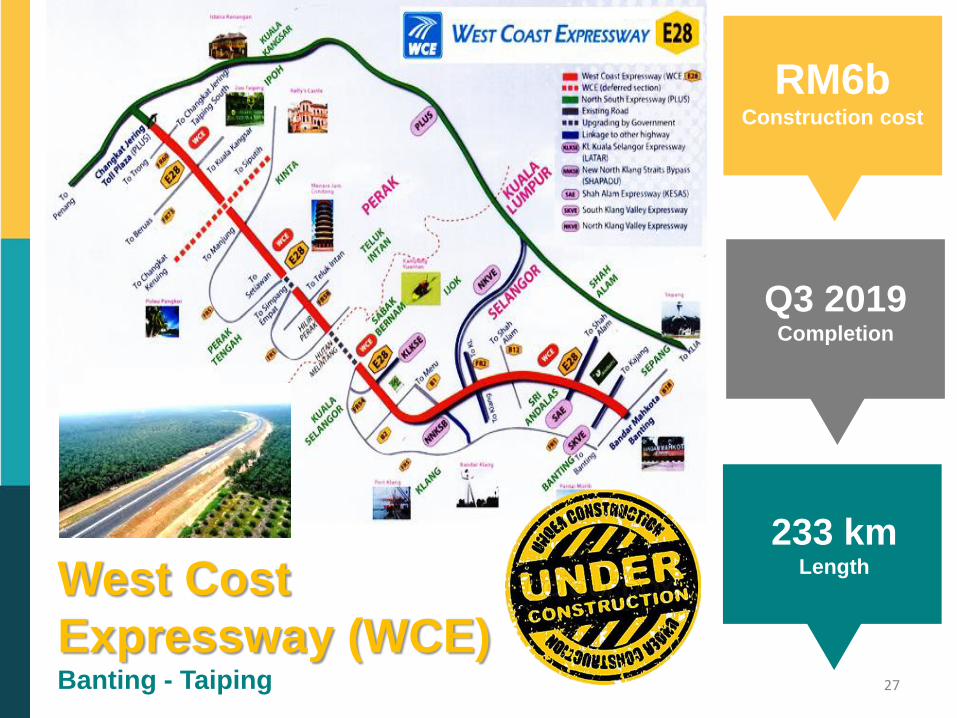
27
West Cost
Expressway (WCE) Banting - Taiping
RM6b Construction cost
Q3 2019 Completion
233 km Length
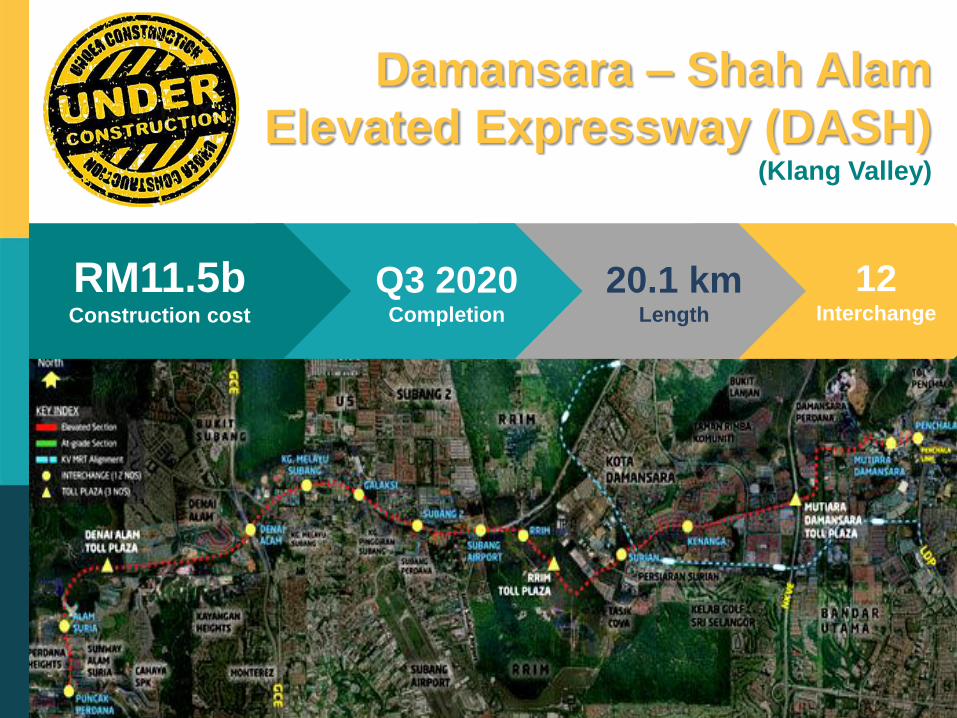
28
Damansara – Shah Alam
Elevated Expressway (DASH) (Klang Valley)
RM11.5b Construction cost
Q3 2020 Completion
20.1 km Length
12 Interchange
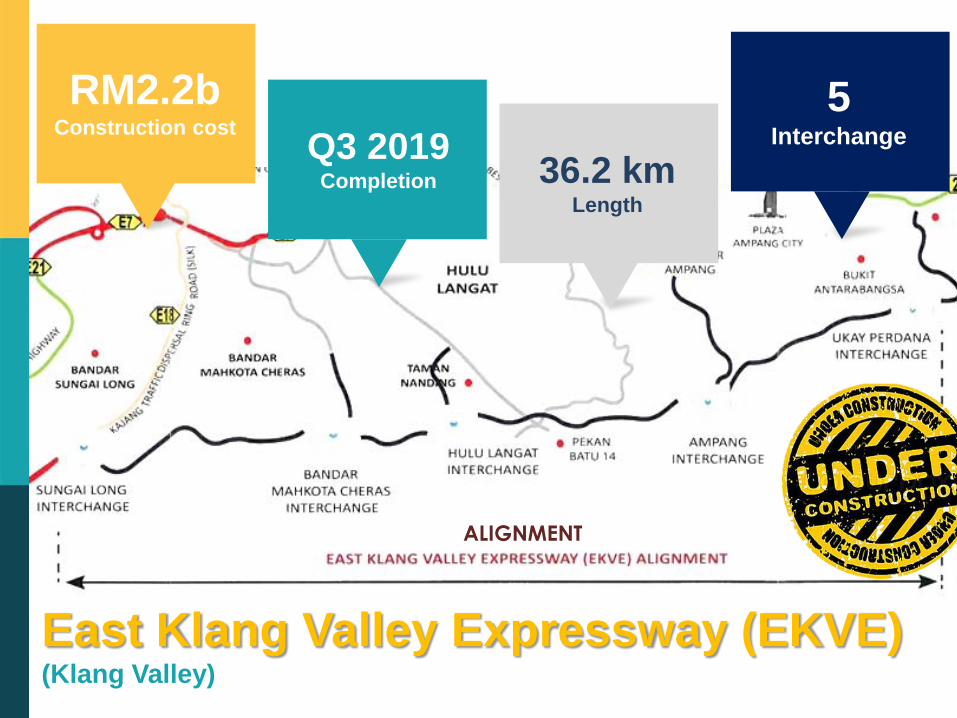
East Klang Valley Expressway (EKVE) (Klang Valley)
RM2.2b Construction cost
Q3 2019 Completion 36.2 km
Length
5 Interchange
ALIGNMENT
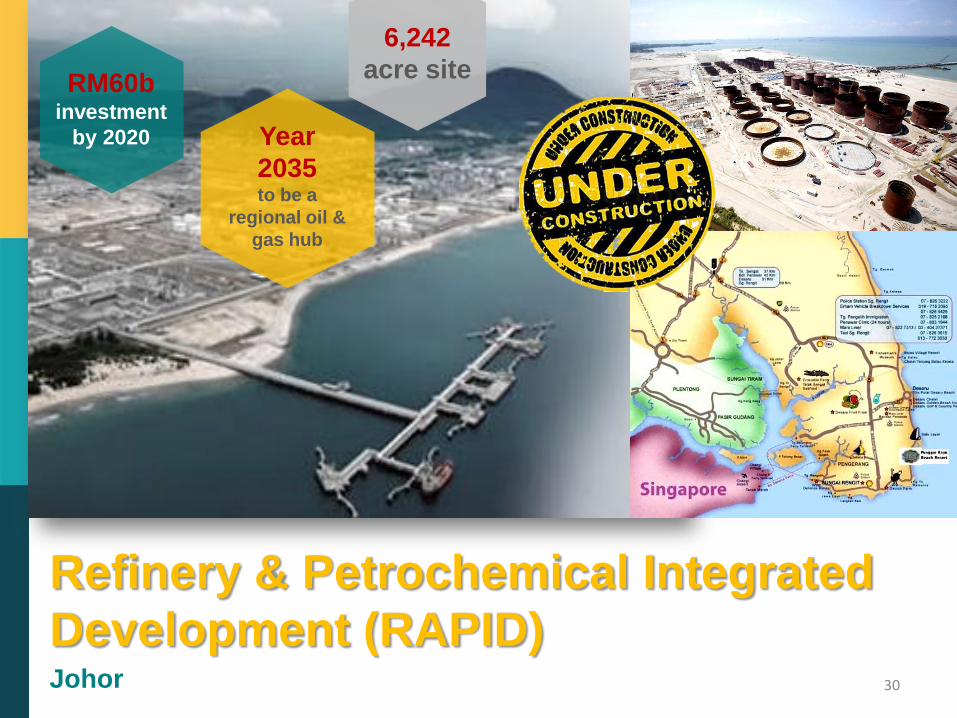
30
Refinery & Petrochemical Integrated
Development (RAPID) Johor
6,242
acre site RM60b
investment
by 2020 Year
2035 to be a
regional oil &
gas hub
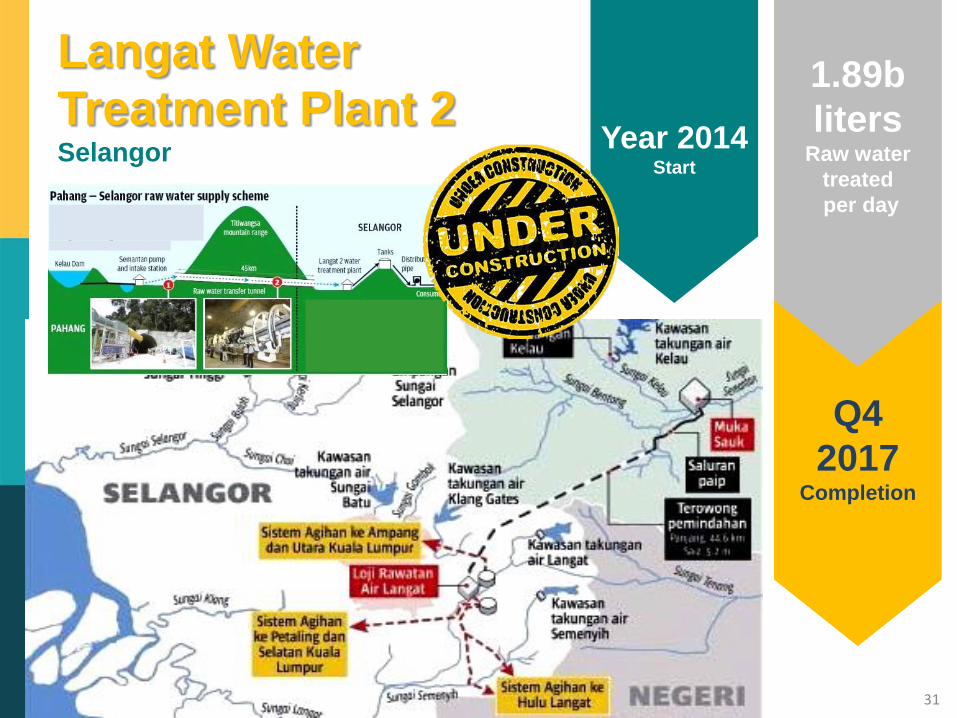
31
Langat Water
Treatment Plant 2 Selangor
Year 2014 Start
Q4
2017 Completion
1.89b
liters Raw water
treated
per day
32
FUTURE MEGA PROJECTS
Awarded
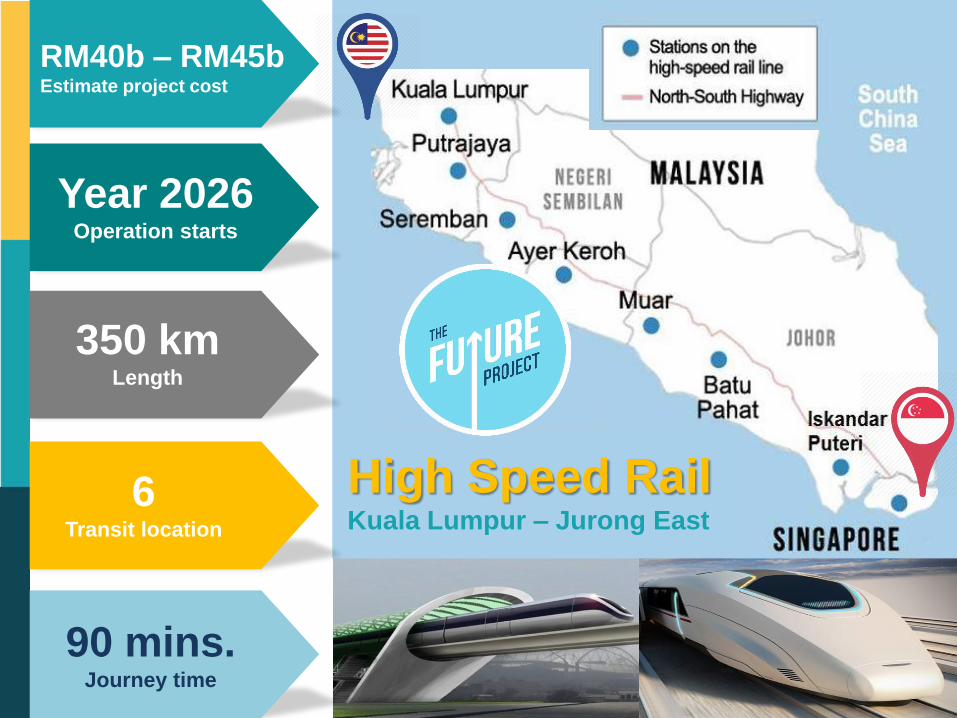
High Speed Rail Kuala Lumpur – Jurong East
RM40b – RM45b Estimate project cost
Year 2026 Operation starts
350 km Length
6 Transit location
90 mins. Journey time
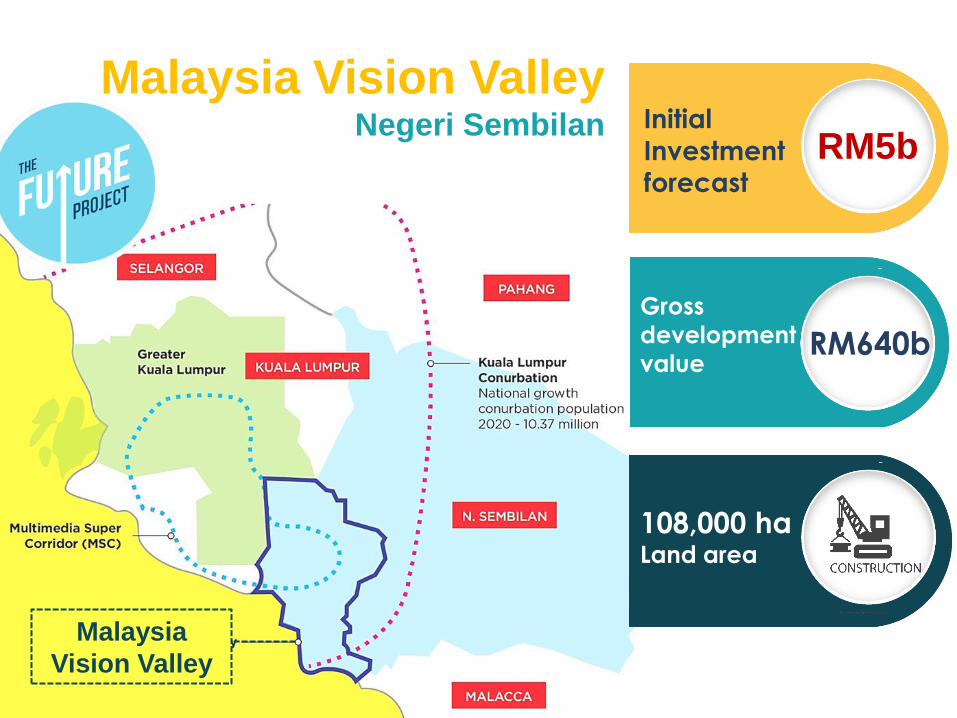
Malaysia
Vision Valley
Malaysia Vision Valley Negeri Sembilan
RM5b
Initial
Investment forecast
108,000 ha Land area
RM640b
Gross
development
value
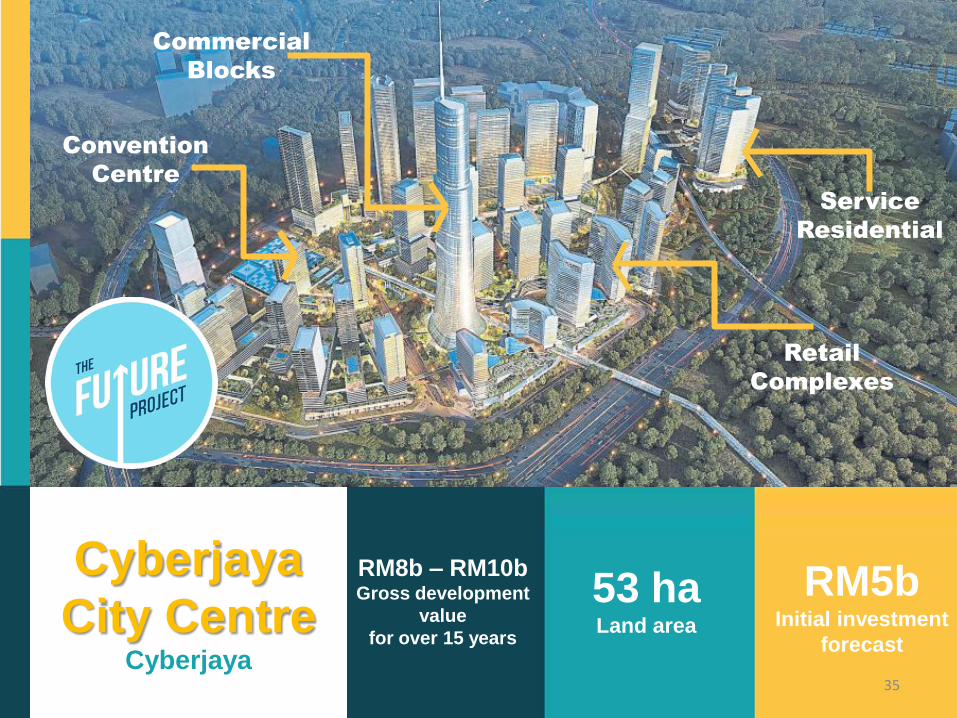
Cyberjaya
City Centre Cyberjaya
35
RM5b Initial investment
forecast
RM8b – RM10b Gross development
value
for over 15 years
53 ha Land area
Commercial
Blocks
Convention
Centre
Retail
Complexes
Service
Residential
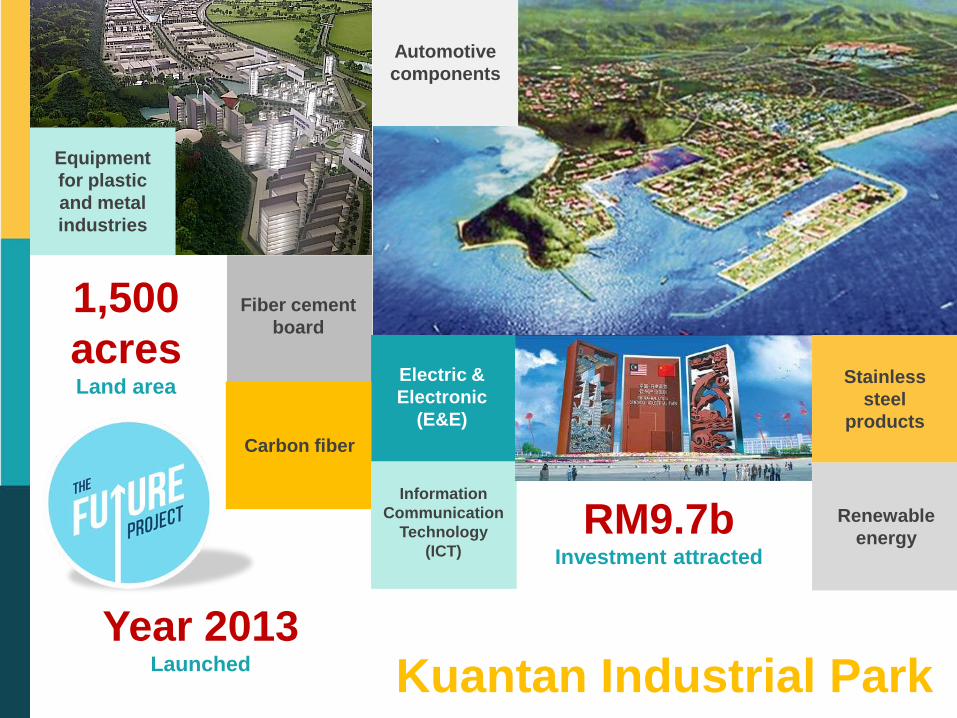
Kuantan Industrial Park
Equipment
for plastic
and metal
industries
Automotive
components
Fiber cement
board
Stainless
steel
products
Carbon fiber
Electric &
Electronic
(E&E)
Information
Communication
Technology
(ICT)
Renewable
energy RM9.7b
Investment attracted
1,500
acres Land area
Year 2013 Launched
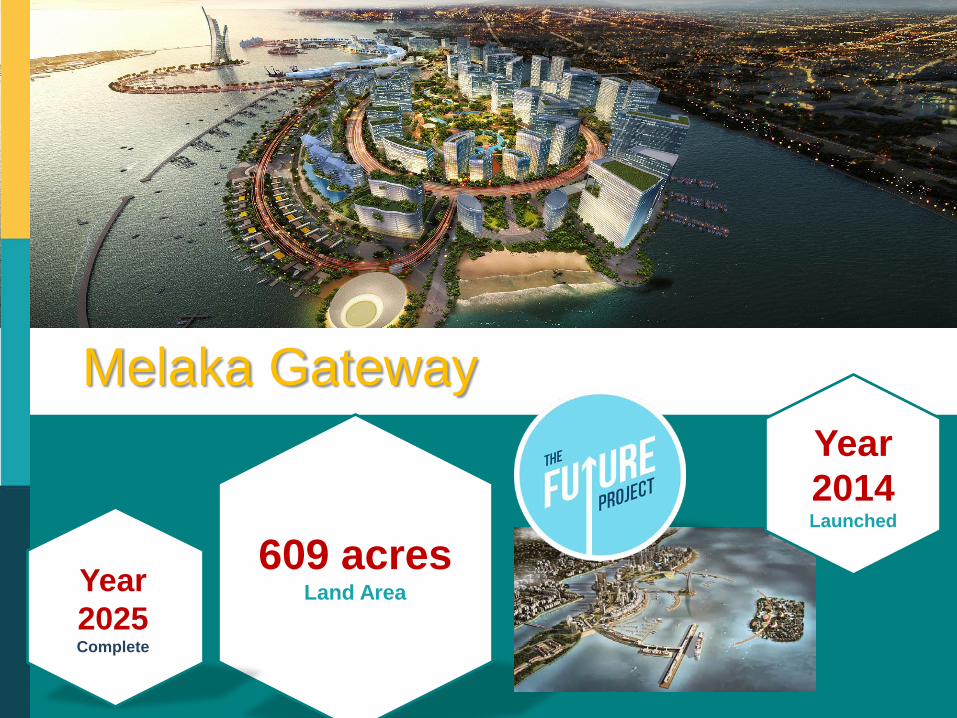
37
Melaka Gateway
609 acres Land Area Year
2025 Complete
Year
2014 Launched
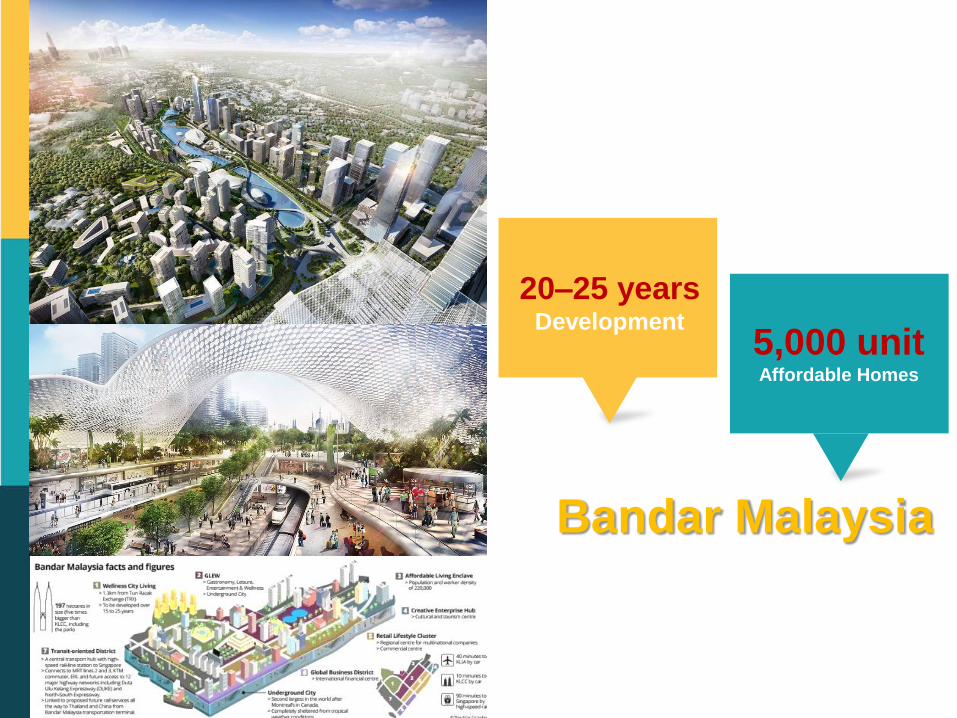
Bandar Malaysia
20–25 years Development
5,000 unit Affordable Homes
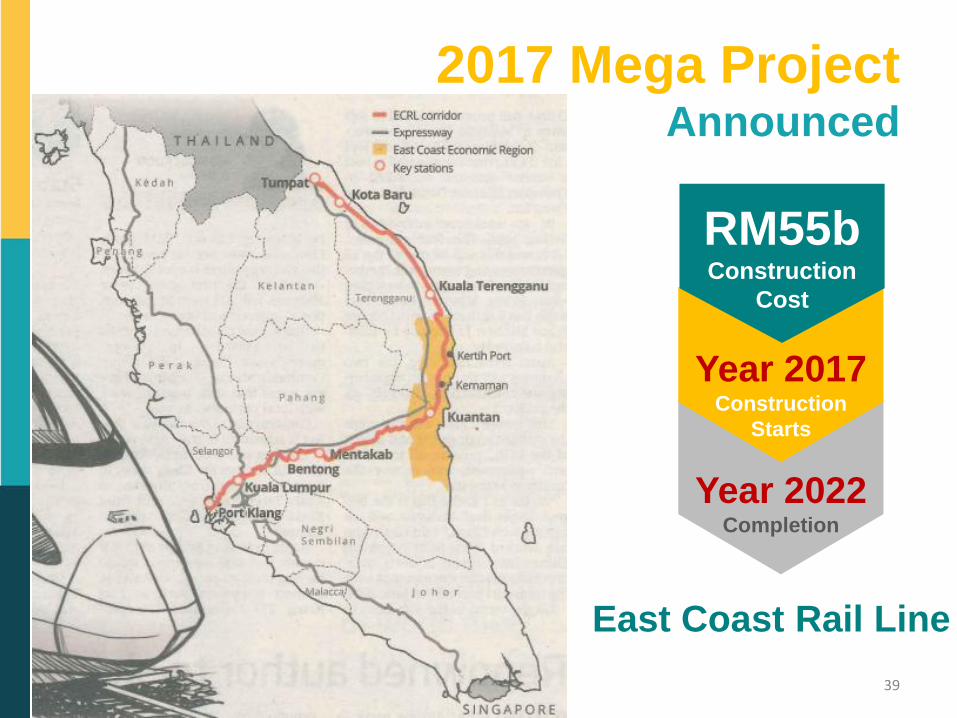
2017 Mega Project Announced
39
East Coast Rail Line
RM55b Construction
Cost
Year 2017 Construction
Starts
Year 2022 Completion

www.cidb.gov.my
Thank you
SUSTAINABILITY CONSTRUCTION POLICY
AND MARKET IN MALAYSIA
Sr Sariah Abd. KaribSenior General ManagerPolicy & Corporate Sector
CIDB Malaysia
21st AsiaConstruct24 November 2016
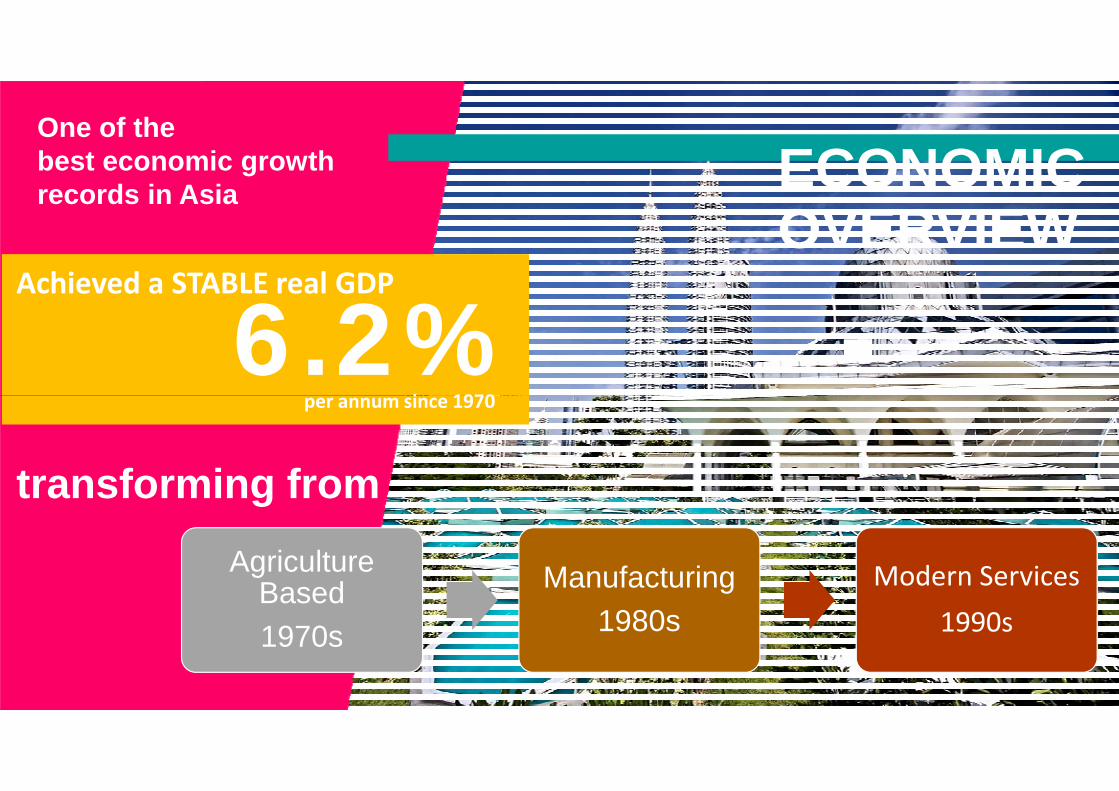
One of the best economic growth records in Asia ECONOMIC
OVERVIEW
6.2%Achieved a STABLE real GDP
i 1970per annum since 1970
transforming from
Agriculture Based1970s
Manufacturing1980s
Modern Services1990s
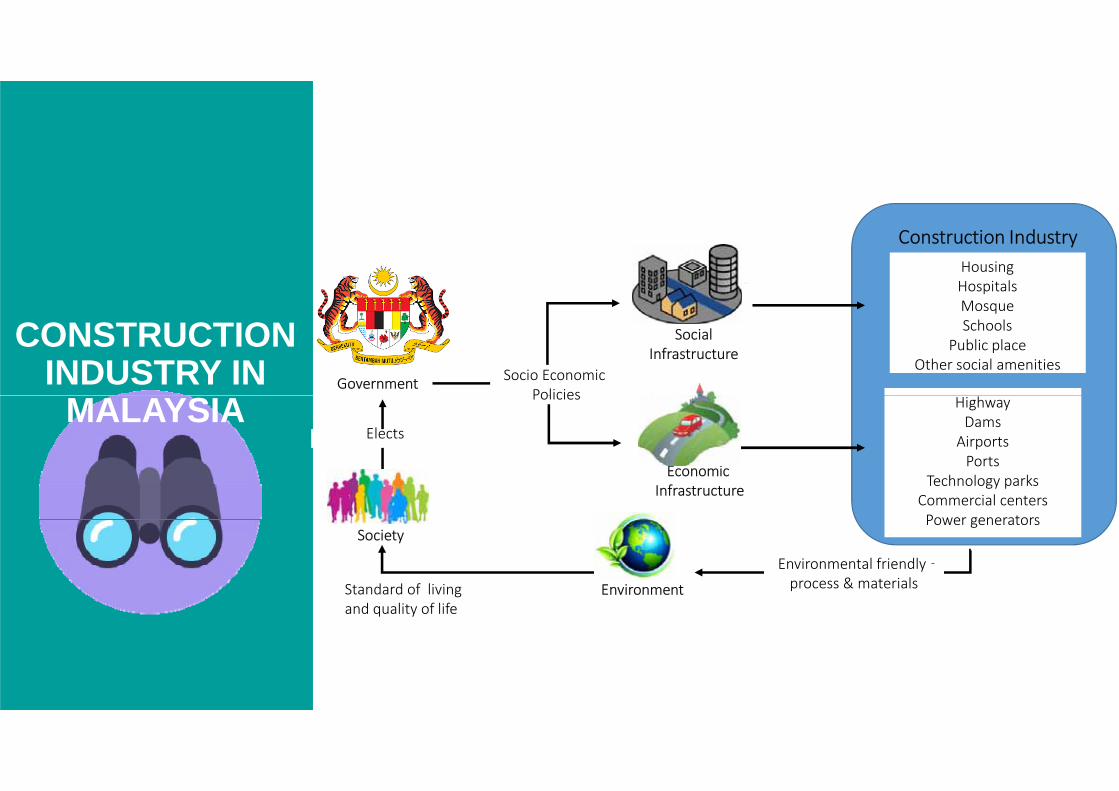
CONSTRUCTION INDUSTRY IN Government
Social Infrastructure
HousingHospitalsMosqueSchools
Public placeOther social amenities
Construction Industry
Socio Economic PoliciesMALAYSIA Highway
DamsAirportsPorts
Technology parksCommercial centersPower generators
Society
Environment
Economic Infrastructure
Environmental friendly process & materials
‐
Standard of living and quality of life
Elects
Policies
SUSTAINABLE CONSTRUCTION IN
MALAYSIA
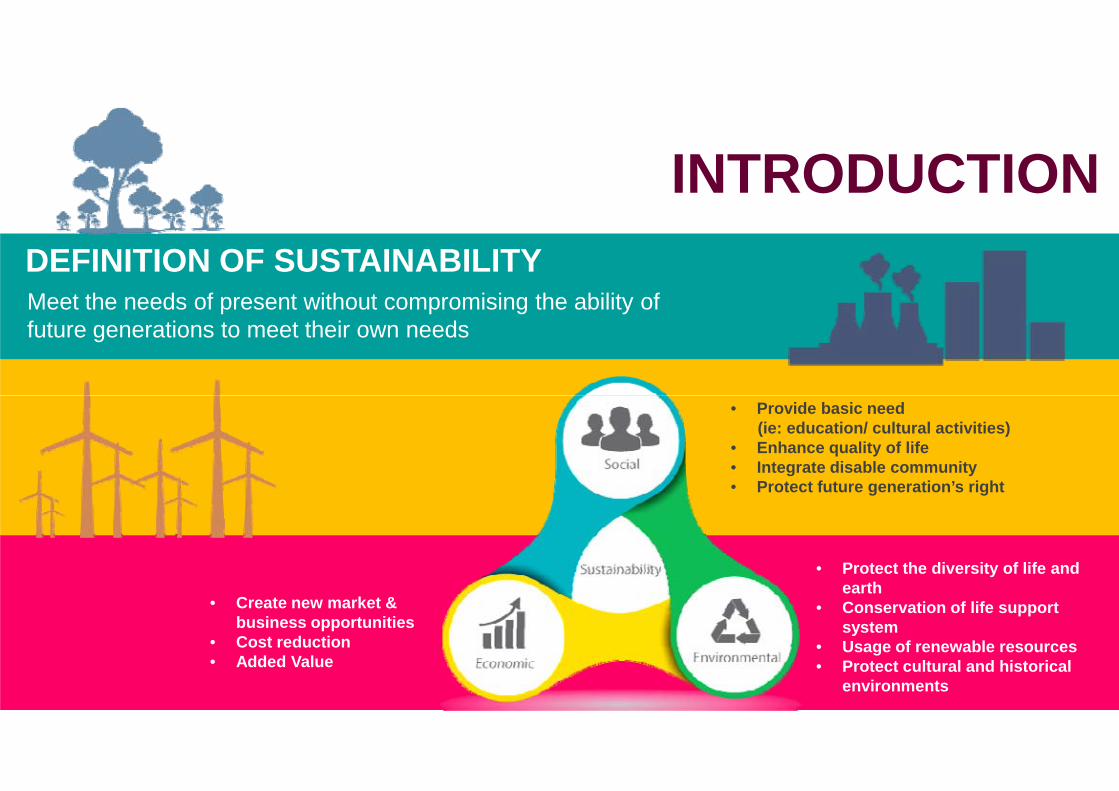
INTRODUCTIONDEFINITION OF SUSTAINABILITYMeet the needs of present without compromising the ability of future generations to meet their own needs
• Provide basic need(ie: education/ cultural activities)
• Enhance quality of life• Integrate disable community• Protect future generation’s right
• Create new market & business opportunities
• Cost reduction• Added Value
• Protect the diversity of life and earth
• Conservation of life support system
• Usage of renewable resources• Protect cultural and historical
environments
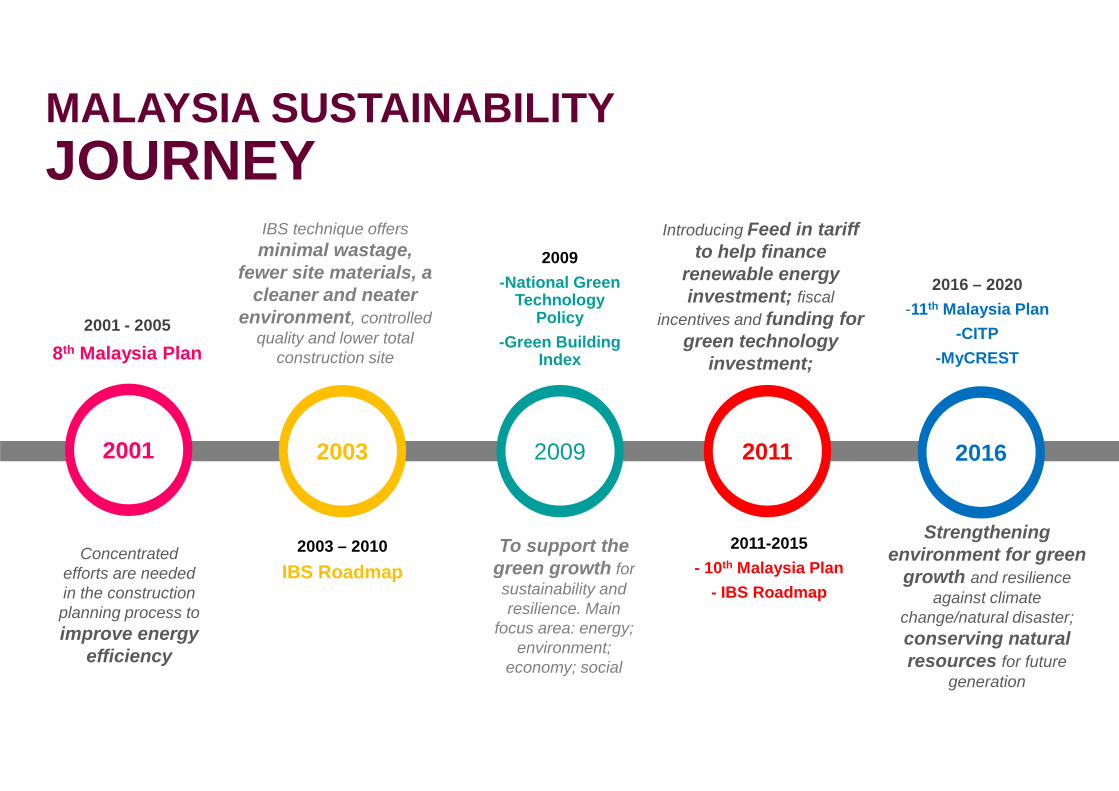
2001 - 2005
8th Malaysia Plan
2016 – 2020-11th Malaysia Plan
-CITP-MyCREST
Introducing Feed in tariff to help finance
renewable energy investment; fiscal
incentives and funding for green technology
investment;
IBS technique offers minimal wastage,
fewer site materials, a cleaner and neater
environment, controlled quality and lower total
construction site
2009-National Green
Technology Policy
-Green Building Index
MALAYSIA SUSTAINABILITY JOURNEY
2001 20092003 2011 2016
Concentrated efforts are needed in the construction planning process to improve energy
efficiency
2003 – 2010IBS Roadmap
To support the green growth for sustainability and resilience. Main
focus area: energy; environment;
economy; social
2011-2015- 10th Malaysia Plan
- IBS Roadmap
Strengthening environment for green
growth and resilience against climate
change/natural disaster; conserving natural resources for future
generation
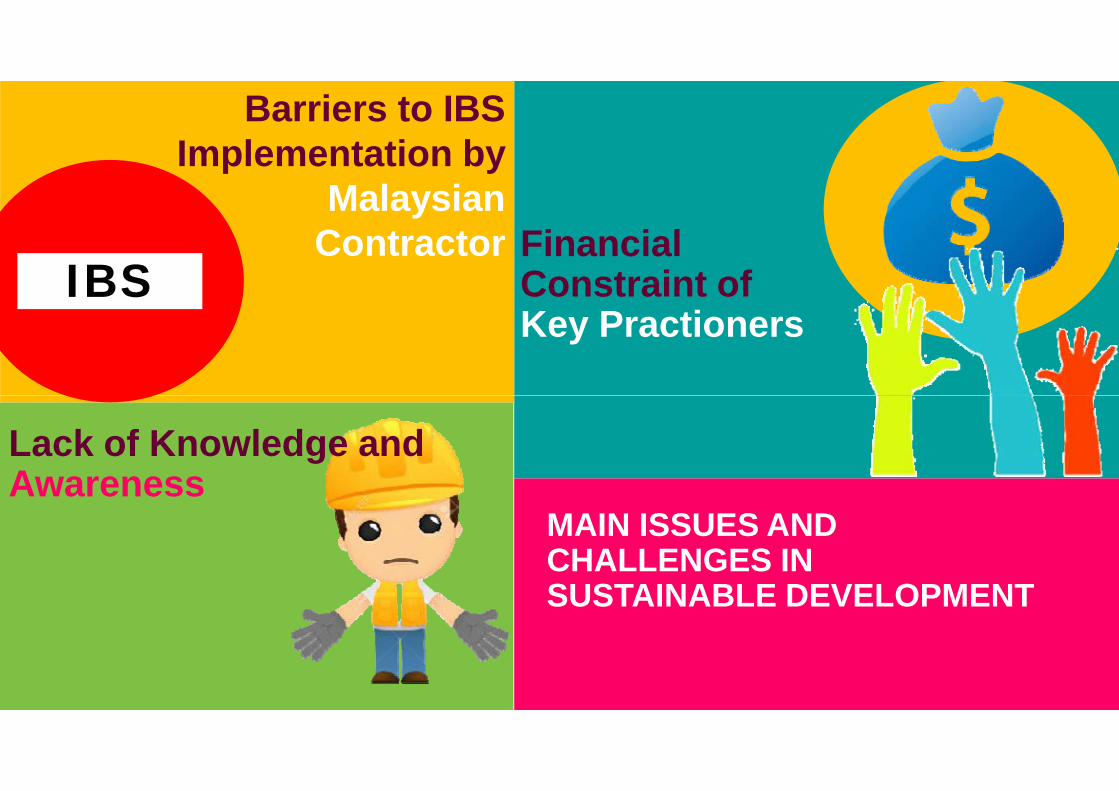
Barriers to IBS Implementation by
Malaysian Contractor
IBSFinancial Constraint of Key Practioners
MAIN ISSUES AND CHALLENGES IN SUSTAINABLE DEVELOPMENT
Lack of Knowledge and Awareness
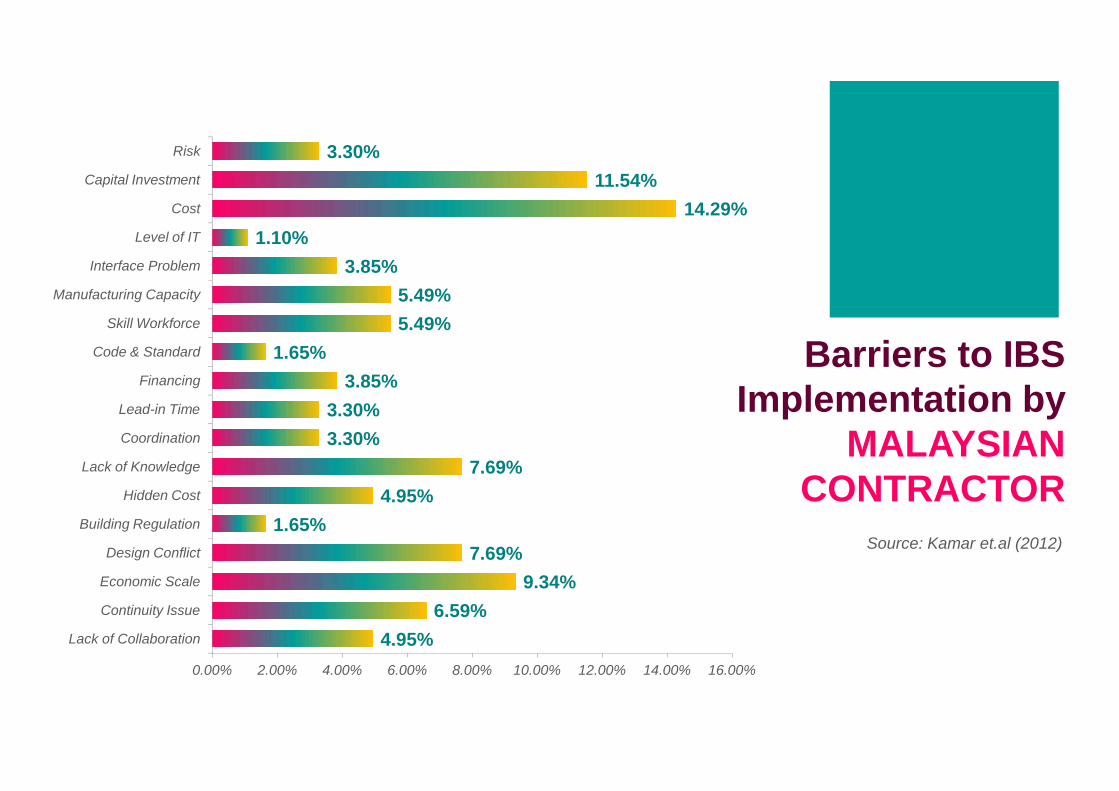
Barriers to IBS Implementation by3.85%
1.65%5.49%5.49%
3.85%1.10%
14.29%11.54%
3.30%
Financing
Code & Standard
Skill Workforce
Manufacturing Capacity
Interface Problem
Level of IT
Cost
Capital Investment
Risk
Implementation by MALAYSIAN
CONTRACTORSource: Kamar et.al (2012)
4.95%6.59%
9.34%7.69%
1.65%4.95%
7.69%3.30%3.30%
0.00% 2.00% 4.00% 6.00% 8.00% 10.00% 12.00% 14.00% 16.00%
Lack of Collaboration
Continuity Issue
Economic Scale
Design Conflict
Building Regulation
Hidden Cost
Lack of Knowledge
Coordination
Lead-in Time
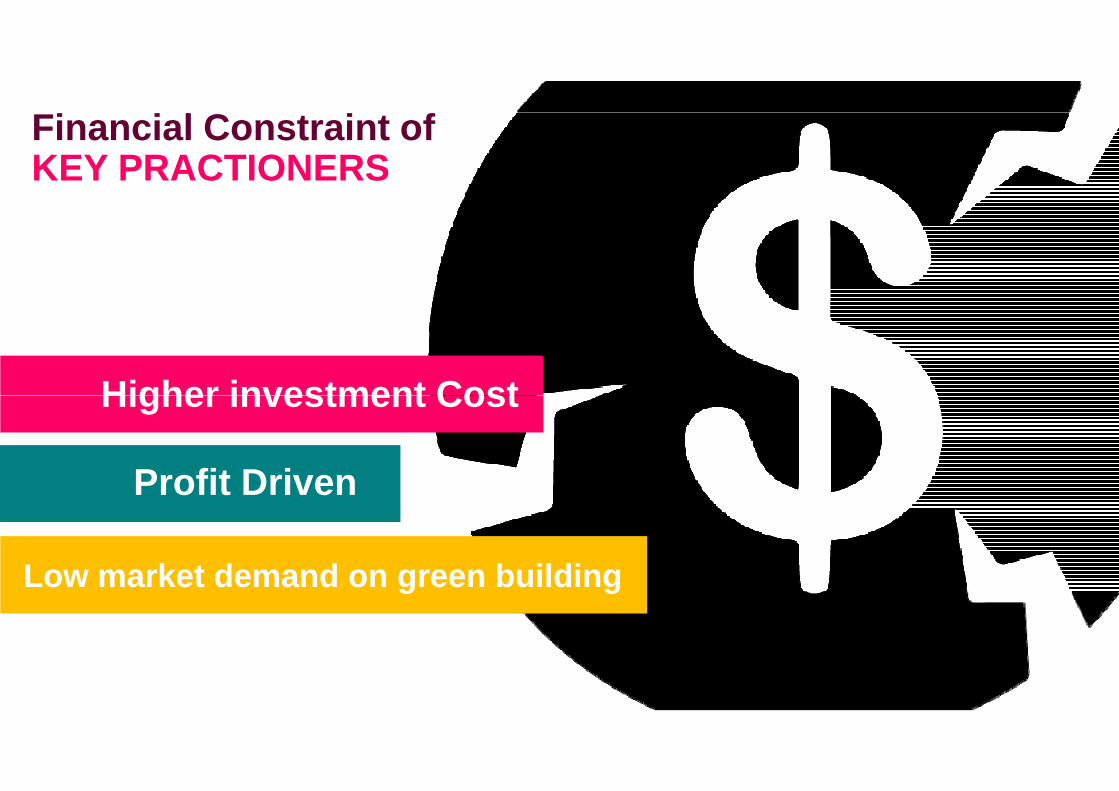
Higher investment Cost
Financial Constraint of KEY PRACTIONERS
Higher investment Cost
Profit Driven
Low market demand on green building
SUSTAINABILITY INITIATIVES IN MALAYSIA CONSTRUCTION
INDUSTRY
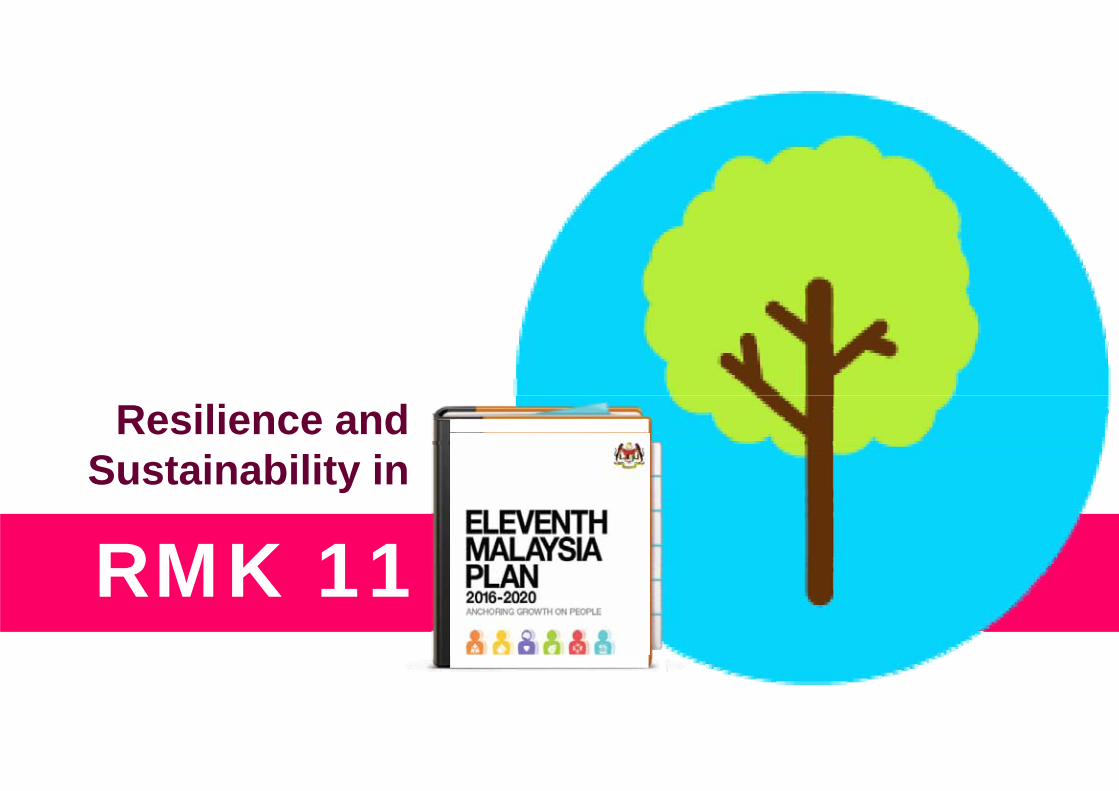
Resilience and Sustainability in
RMK 11
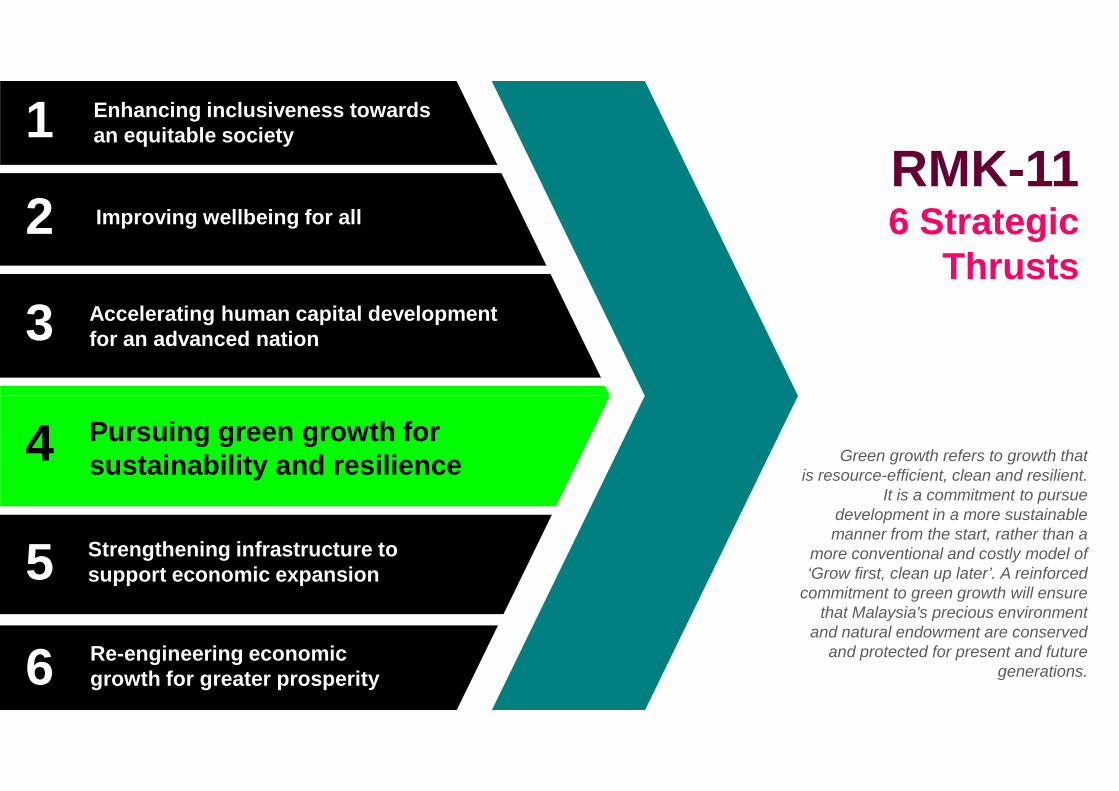
RMK-116 Strategic
Thrusts
Enhancing inclusiveness towards an equitable society
Improving wellbeing for all
Accelerating human capital development for an advanced nation
1
2
3
Green growth refers to growth that is resource-efficient, clean and resilient.
It is a commitment to pursue development in a more sustainable manner from the start, rather than a
more conventional and costly model of ‘Grow first, clean up later’. A reinforced
commitment to green growth will ensure that Malaysia's precious environment
and natural endowment are conserved and protected for present and future
generations.
Pursuing green growth for sustainability and resilience
Strengthening infrastructure to support economic expansion
Re-engineering economic growth for greater prosperity
4
5
6
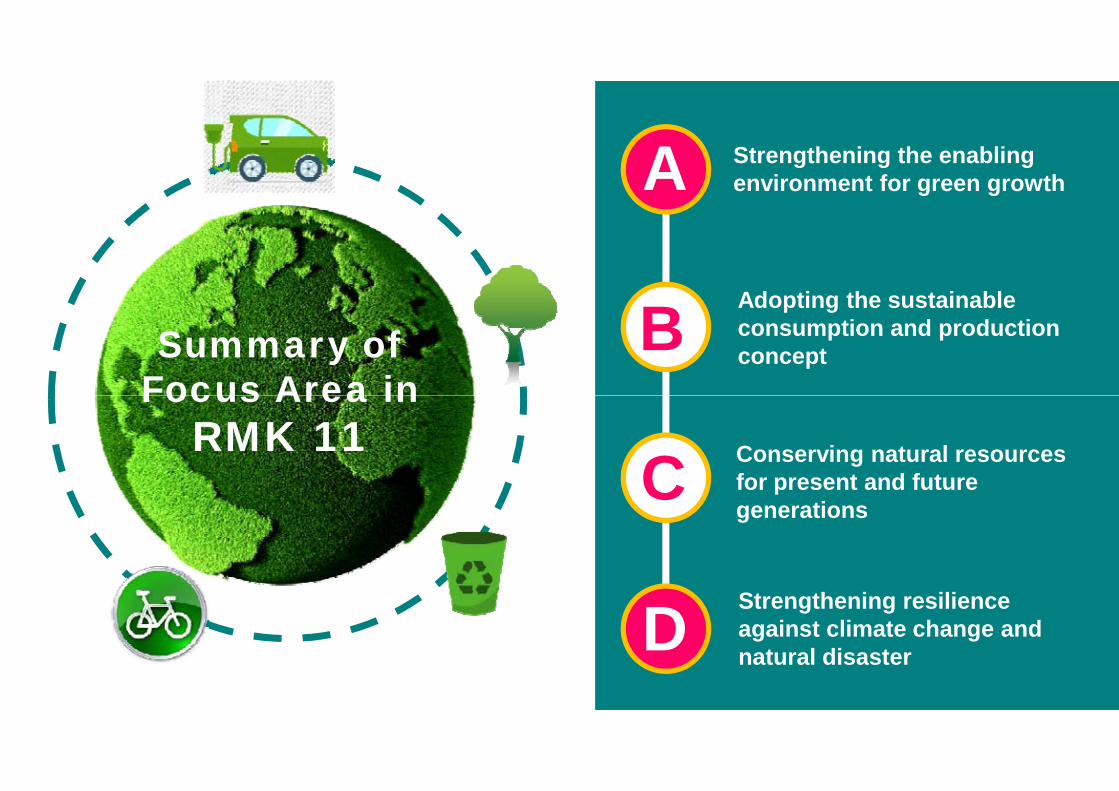
Summary of Focus Area in
A
B
Strengthening the enabling environment for green growth
Adopting the sustainable consumption and production concept
Focus Area in RMK 11
C
D
Conserving natural resources for present and future generations
Strengthening resilience against climate change and natural disaster
14
CITP 2016 - 2020
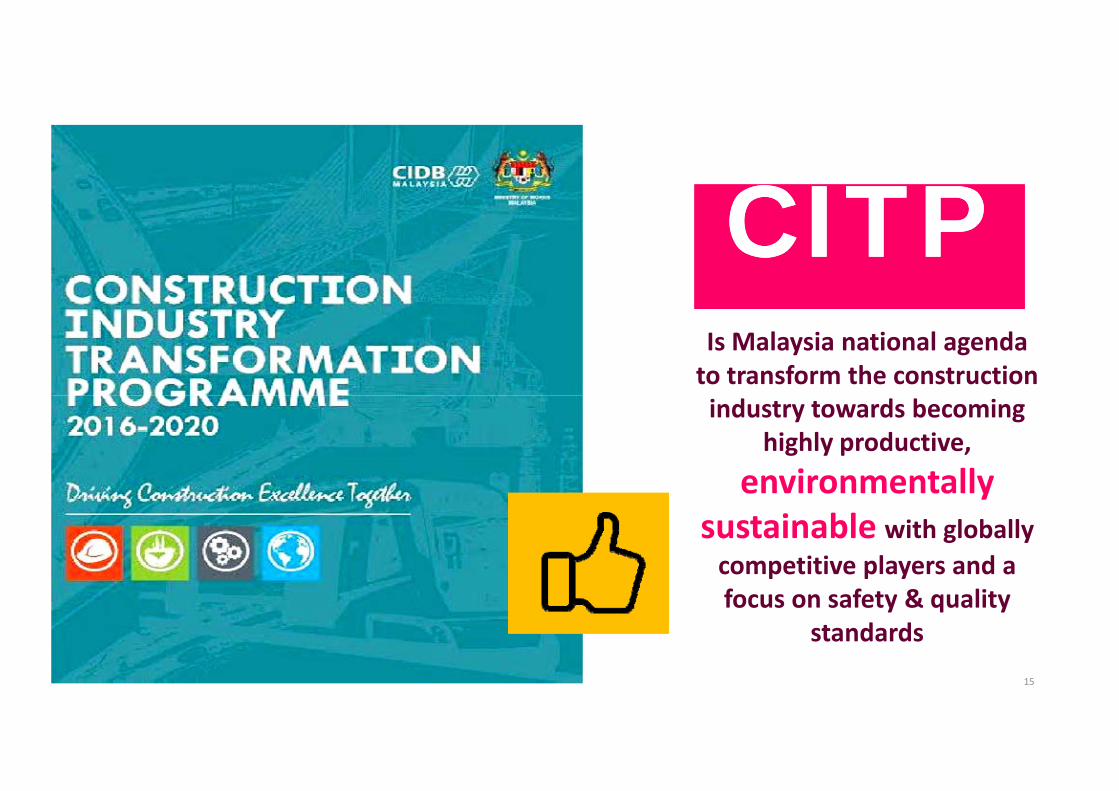
Is Malaysia national agenda to transform the construction
CITPCITP
15
industry towards becoming highly productive,
environmentally sustainable with globally competitive players and a focus on safety & quality
standards
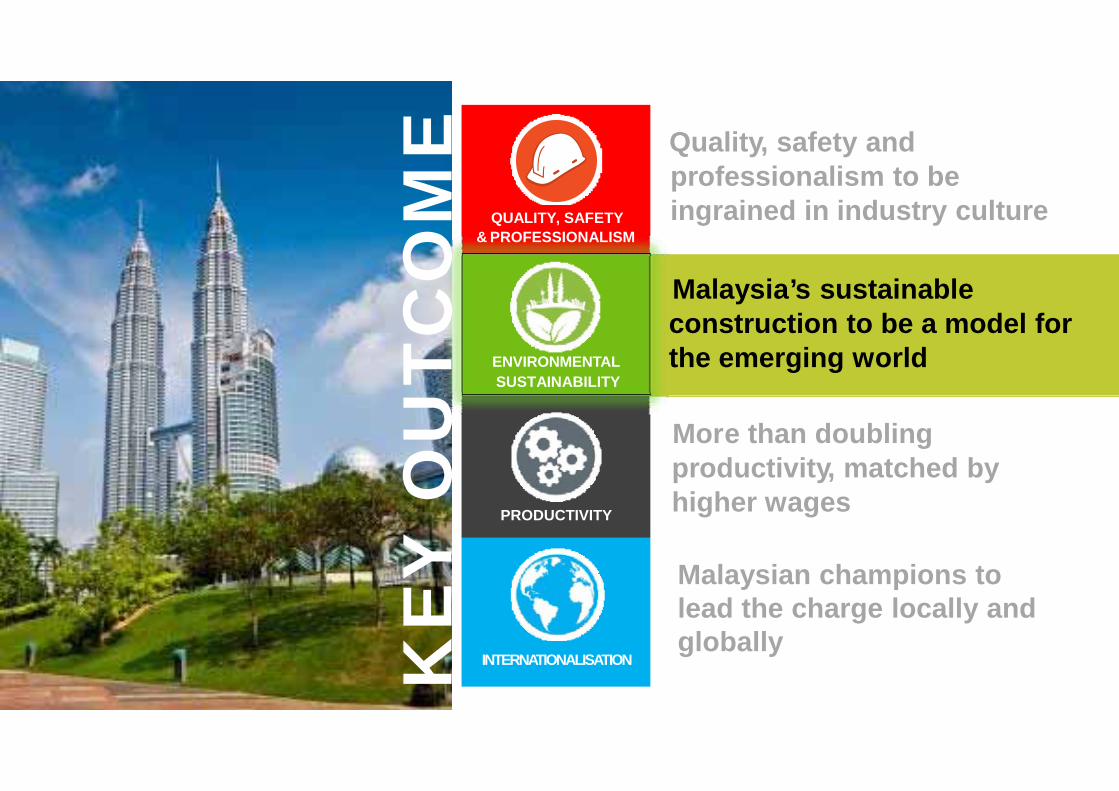
QUALITY, SAFETY& PROFESSIONALISM
ENVIRONMENTALSUSTAINABILITY
UTC
OM
E Quality, safety and professionalism to be ingrained in industry culture
Malaysia’s sustainable construction to be a model for the emerging world
PRODUCTIVITY
INTERNATIONALISATIONKE
Y O
U More than doubling productivity, matched by higher wages
Malaysian champions to lead the charge locally and globally
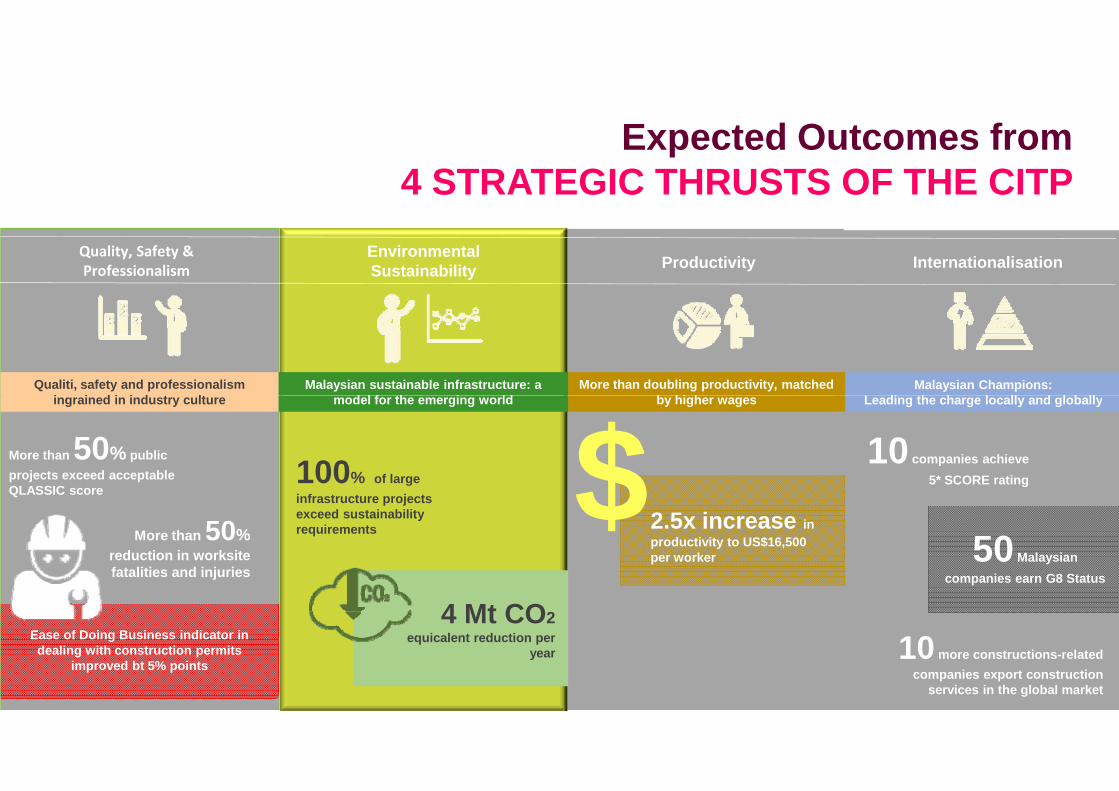
Quality, Safety & Professionalism
Environmental Sustainability Productivity Internationalisation
Qualiti, safety and professionalism i i d i i d t lt
Malaysian Champions:L di th h l ll d l b ll
More than doubling productivity, matched b hi h
Malaysian sustainable infrastructure: a d l f th i ld
Expected Outcomes from 4 STRATEGIC THRUSTS OF THE CITP
ingrained in industry culture
More than 50% public projects exceed acceptable QLASSIC score
More than 50%reduction in worksite fatalities and injuries
100% of large infrastructure projects exceed sustainability requirements
10companies achieve 5* SCORE rating
10 more constructions-related companies export construction
services in the global market
Leading the charge locally and globallyby higher wagesmodel for the emerging world
Ease of Doing Business indicator in dealing with construction permits
improved bt 5% points
4 Mt CO2 equicalent reduction per
year
2.5x increase in productivity to US$16,500 per worker 50Malaysian
companies earn G8 Status
$
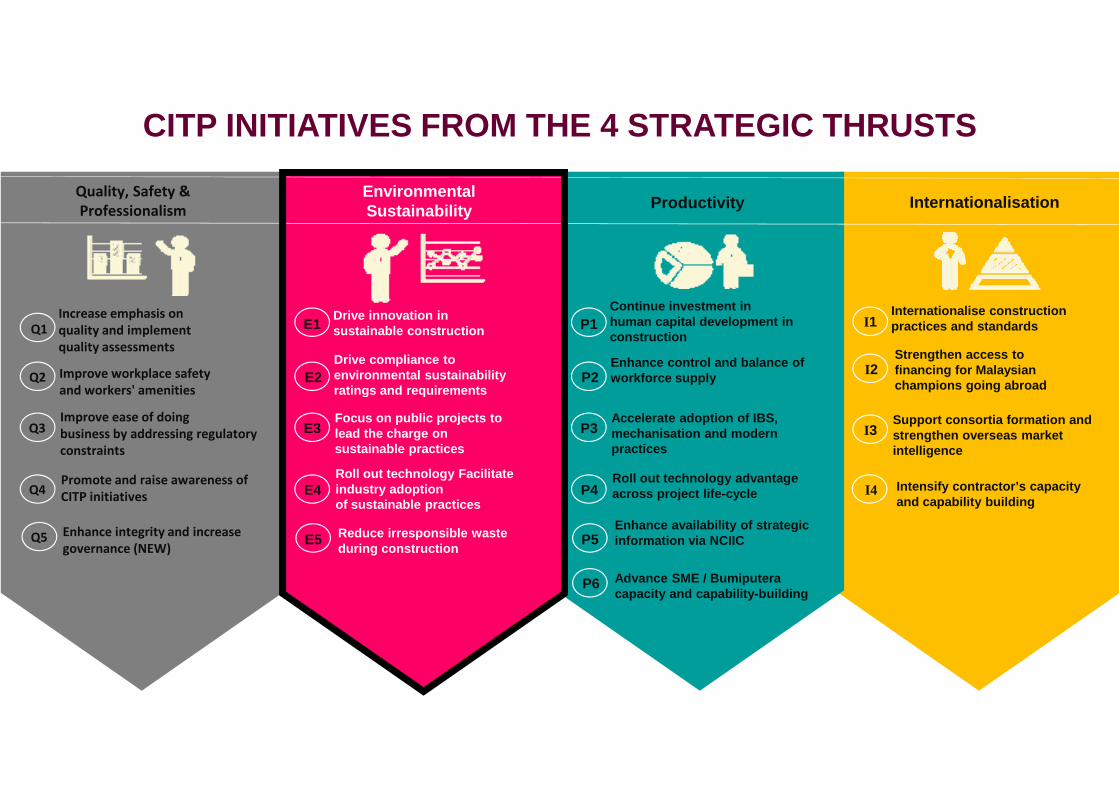
Quality, Safety & Professionalism
Environmental Sustainability Productivity Internationalisation
Continue investment in human capital development in construction
Enhance control and balance of workforce supplyP2
P1Drive innovation in sustainable construction
Drive compliance to environmental sustainability ratings and requirements
E2
E1Increase emphasis on quality and implement quality assessments
Improve workplace safety and workers' amenities
Q2
Q1Internationalise construction practices and standards
Strengthen access to financing for Malaysian champions going abroad
I2
I1
CITP INITIATIVES FROM THE 4 STRATEGIC THRUSTS
Accelerate adoption of IBS, mechanisation and modern practices
Roll out technology advantage across project life-cycle
Enhance availability of strategic information via NCIIC
Advance SME / Bumiputera capacity and capability-building
P6
P5
P4
P3
g q
Focus on public projects to lead the charge onsustainable practices
Roll out technology Facilitate industry adoption of sustainable practices
Reduce irresponsible waste during constructionE5
E4
E3Improve ease of doing business by addressing regulatory constraints
Promote and raise awareness of CITP initiativesQ4
Q3 Support consortia formation and strengthen overseas market intelligence
I3
Q5
I4
Enhance integrity and increase governance (NEW)
Intensify contractor’s capacity and capability building
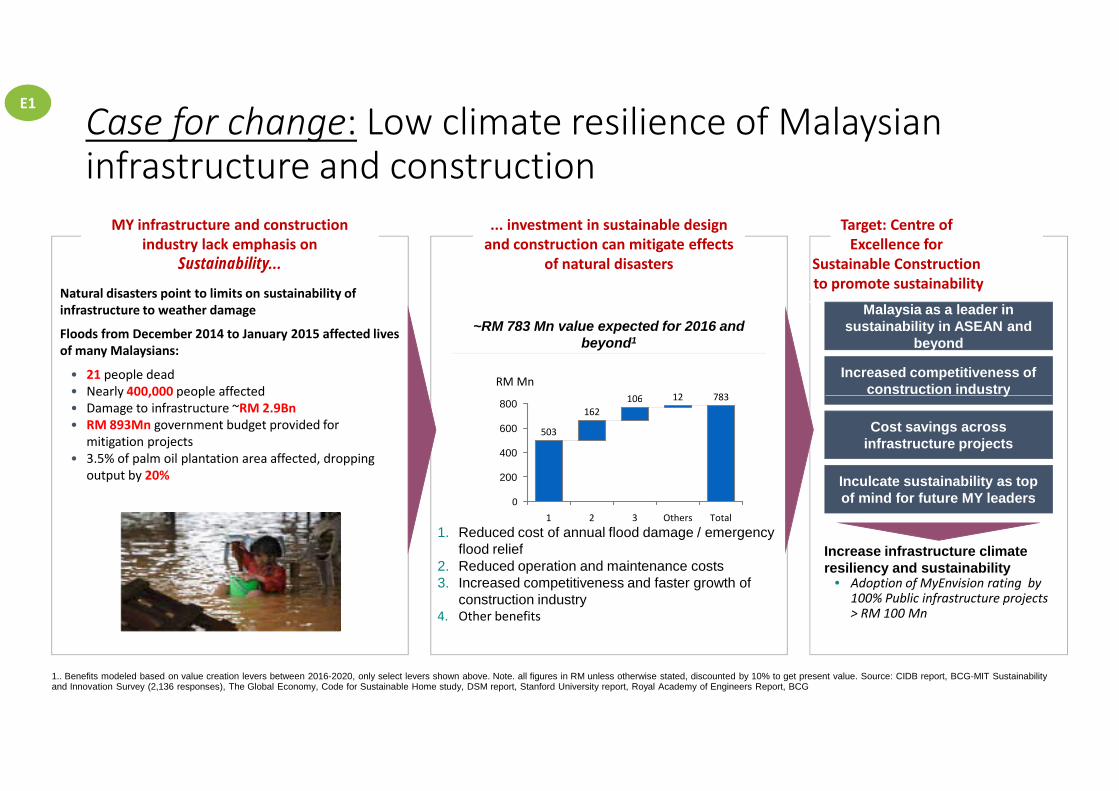
Case for change: Low climate resilience of Malaysian infrastructure and construction
MY infrastructure and construction industry lack emphasis on
Sustainability...
... investment in sustainable design and construction can mitigate effects
of natural disasters
Target: Centre of Excellence for
Sustainable Construction to promote sustainability
Malaysia as a leader in sustainability in ASEAN and
beyond
Increased competitiveness of construction industry
Natural disasters point to limits on sustainability of infrastructure to weather damage
Floods from December 2014 to January 2015 affected lives of many Malaysians:
• 21 people dead• Nearly 400,000 people affected 12 783106
RM Mn
~RM 783 Mn value expected for 2016 and beyond1
E1
Increase infrastructure climate resiliency and sustainability
• Adoption of MyEnvision rating by 100% Public infrastructure projects > RM 100 Mn
y
Cost savings across infrastructure projects
Inculcate sustainability as top of mind for future MY leaders
Nearly 400,000 people affected• Damage to infrastructure ~RM 2.9Bn• RM 893Mn government budget provided for
mitigation projects• 3.5% of palm oil plantation area affected, dropping
output by 20%
600
800
200
400
0
12
Others Total
783
3
106
2
162
1
503
1.. Benefits modeled based on value creation levers between 2016-2020, only select levers shown above. Note. all figures in RM unless otherwise stated, discounted by 10% to get present value. Source: CIDB report, BCG-MIT Sustainability and Innovation Survey (2,136 responses), The Global Economy, Code for Sustainable Home study, DSM report, Stanford University report, Royal Academy of Engineers Report, BCG
1. Reduced cost of annual flood damage / emergency flood relief
2. Reduced operation and maintenance costs3. Increased competitiveness and faster growth of
construction industry4. Other benefits
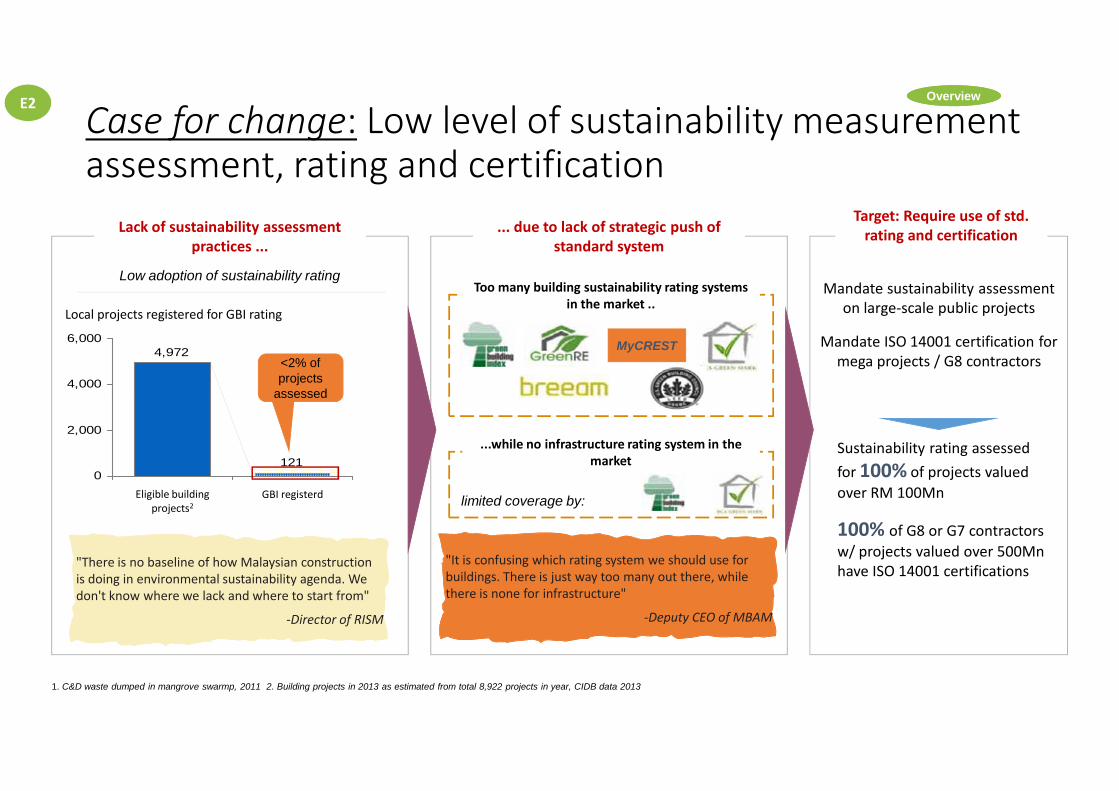
Case for change: Low level of sustainability measurement assessment, rating and certification
Lack of sustainability assessment practices ...
... due to lack of strategic push of standard system
Target: Require use of std. rating and certification
Low adoption of sustainability rating
4,972
4,000
6,000
Local projects registered for GBI rating
<2% of projects
assessed
MyCREST
Too many building sustainability rating systems in the market ..
Mandate sustainability assessment on large‐scale public projects
Mandate ISO 14001 certification for mega projects / G8 contractors
E2 OverviewOverview
1. C&D waste dumped in mangrove swarmp, 2011 2. Building projects in 2013 as estimated from total 8,922 projects in year, CIDB data 2013
1210
2,000
Eligible building projects2
GBI registerd
assessed
Director of RISM
"There is no baseline of how Malaysian construction is doing in environmental sustainability agenda. We don't know where we lack and where to start from"
‐Director of RISM
...while no infrastructure rating system in the market
limited coverage by:
there is none for infrastructure"
Deputy CEO of MBAM
"It is confusing which rating system we should use for buildings. There is just way too many out there, while there is none for infrastructure"
‐Deputy CEO of MBAM
Sustainability rating assessed for 100% of projects valued over RM 100Mn
100% of G8 or G7 contractors w/ projects valued over 500Mn have ISO 14001 certifications
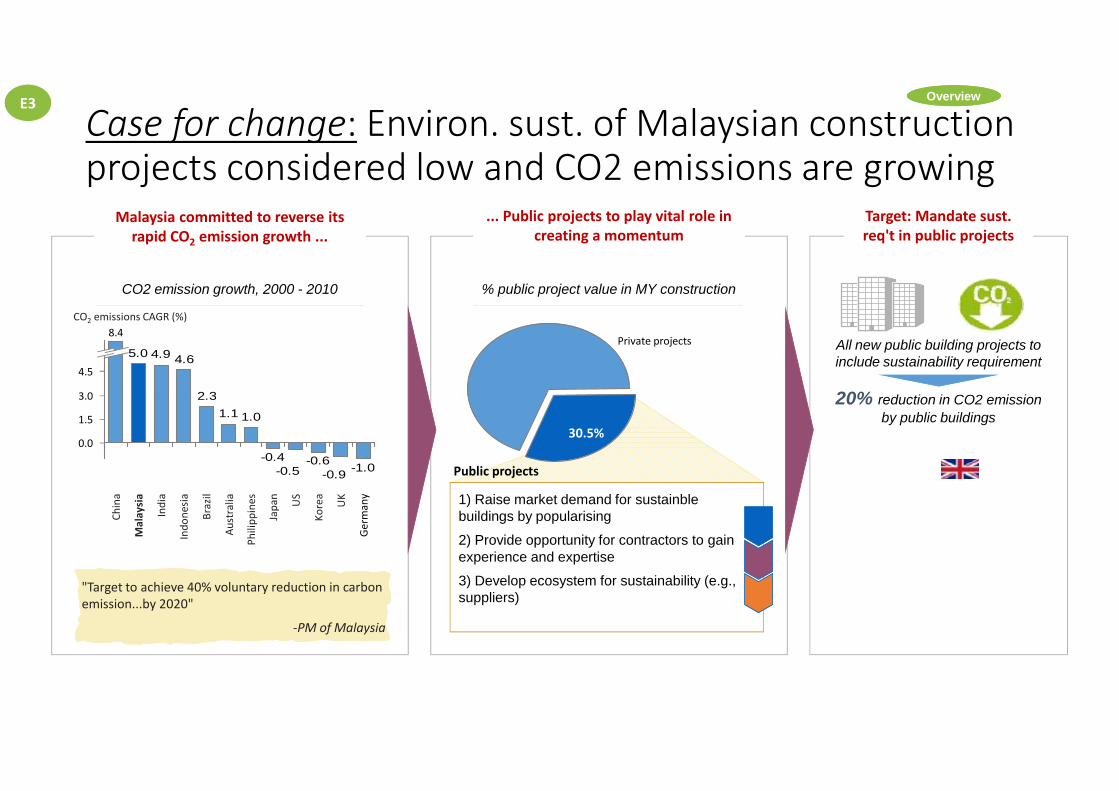
Case for change: Environ. sust. of Malaysian construction projects considered low and CO2 emissions are growing
Malaysia committed to reverse its rapid CO2 emission growth ...
... Public projects to play vital role in creating a momentum
Target: Mandate sust. req't in public projects
CO2 emission growth, 2000 - 2010
2 3
4.64.95.04.5
3 0
8.4CO2 emissions CAGR (%)
Private projects
% public project value in MY construction
All new public building projects to include sustainability requirement
20% d ti i CO2 i i
E3 OverviewOverview
-1.0-0.9-0.6
-0.5-0.4
1.01.12.3
1.5
0.0
3.0
Indo
nesia
India
Malaysia
Korea
US
Japan
China
Philipp
ines
Australia
Brazil
Germany
UK
of Malaysia
"Target to achieve 40% voluntary reduction in carbon emission...by 2020"
‐PM of Malaysia
Public projects
30.5%
1) Raise market demand for sustainble buildings by popularising
2) Provide opportunity for contractors to gain experience and expertise
3) Develop ecosystem for sustainability (e.g., suppliers)
20% reduction in CO2 emission by public buildings
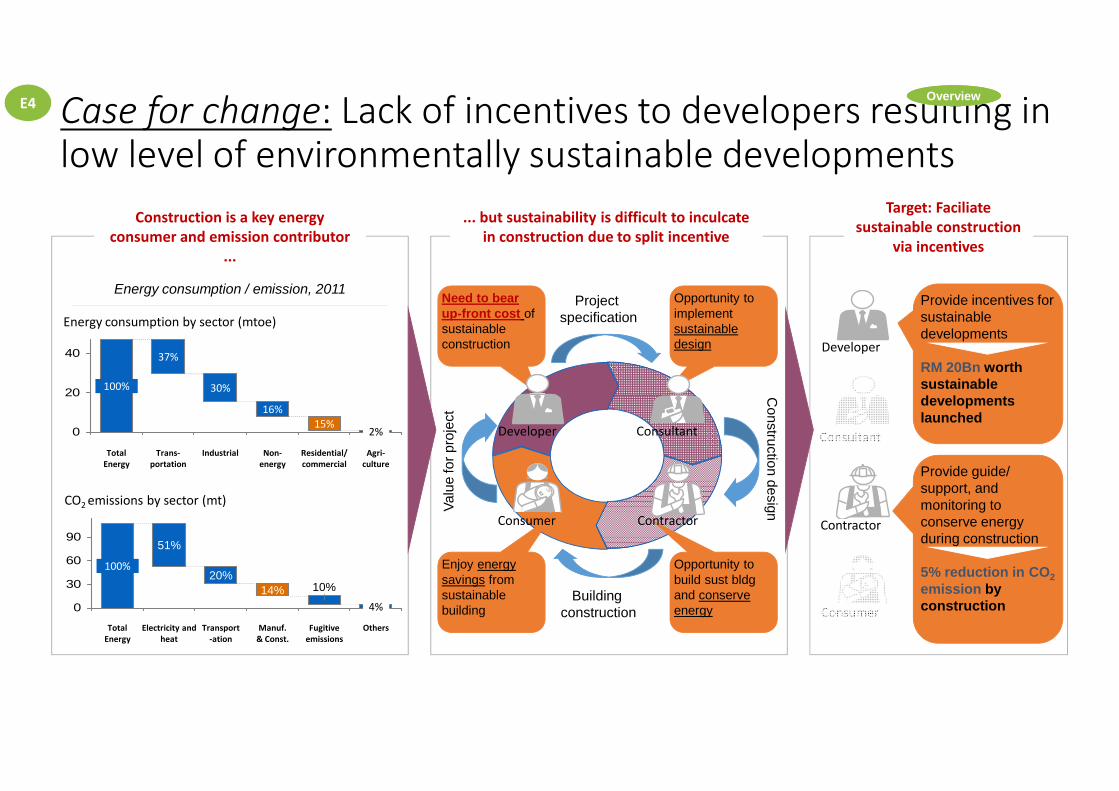
Case for change: Lack of incentives to developers resulting in low level of environmentally sustainable developments
Energy consumption / emission, 2011
20
40
30%
37%
100%
Energy consumption by sector (mtoe)
Construction is a key energy consumer and emission contributor
...
... but sustainability is difficult to inculcate in construction due to split incentive
Target: Faciliate sustainable construction
via incentives
Project specification
Opportunity to implementsustainable design
Need to bear up-front cost of sustainable construction
Provide incentives for sustainable developments
RM 20Bn worth sustainable d l
Developer
E4 OverviewOverview
Consultant
0
30
60
90
Others
4%
Fugitive emissions
10%
Manuf.& Const.
14%
Transport‐ation
20%
Electricity and heat
51%
TotalEnergy
100%
CO2 emissions by sector (mt)
0
20
Trans‐portation
Non‐energy
16%
Industrial
2%
Residential/ commercial
15%
TotalEnergy
Agri‐culture
Developer Consultant
Construction design
Building construction
Valu
e fo
r pro
ject
Opportunity to build sust bldg and conserve energy
Enjoy energy savings from sustainable building
ContractorConsumer
Consumer
developments launched
Provide guide/ support, and monitoring to conserve energy during construction
5% reduction in CO2emission by construction
Contractor
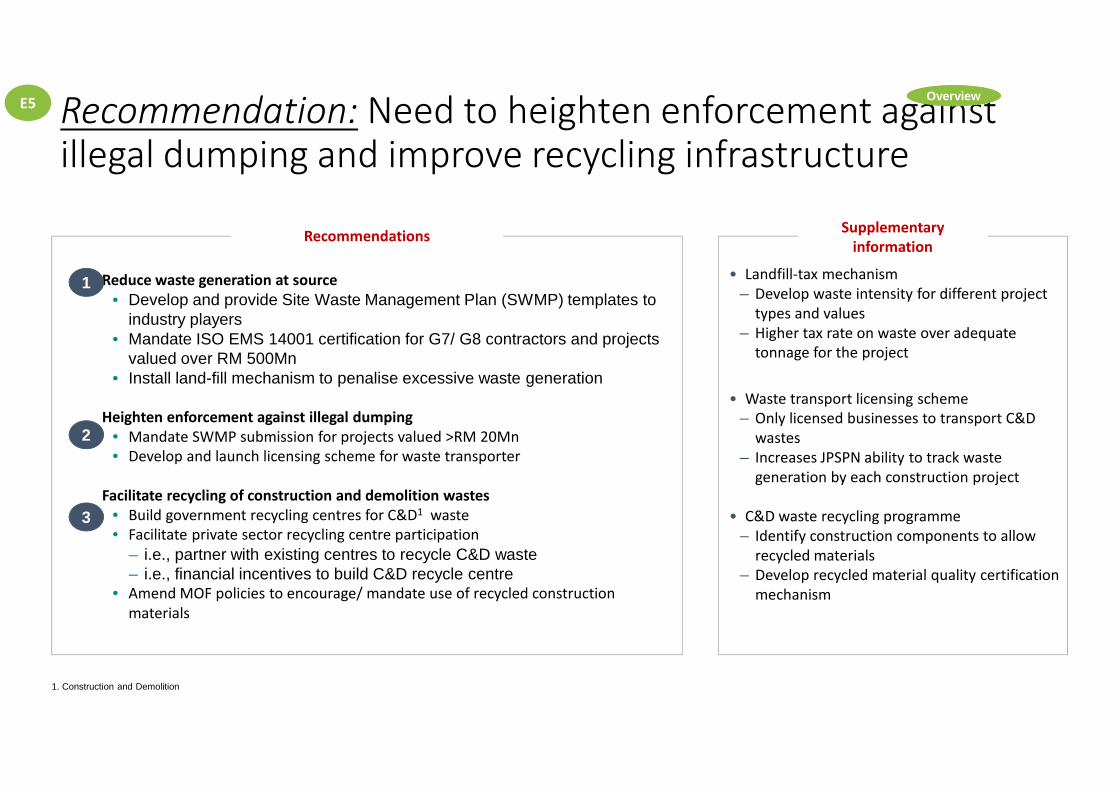
Reduce waste generation at source• Develop and provide Site Waste Management Plan (SWMP) templates to
industry players• Mandate ISO EMS 14001 certification for G7/ G8 contractors and projects
valued over RM 500Mn• Install land-fill mechanism to penalise excessive waste generation
• Landfill‐tax mechanism– Develop waste intensity for different project types and values
– Higher tax rate on waste over adequate tonnage for the project
W t t t li i h
Recommendations Supplementary information
1
Recommendation: Need to heighten enforcement against illegal dumping and improve recycling infrastructure
E5 OverviewOverview
Heighten enforcement against illegal dumping• Mandate SWMP submission for projects valued >RM 20Mn• Develop and launch licensing scheme for waste transporter
Facilitate recycling of construction and demolition wastes• Build government recycling centres for C&D1 waste• Facilitate private sector recycling centre participation
– i.e., partner with existing centres to recycle C&D waste– i.e., financial incentives to build C&D recycle centre
• Amend MOF policies to encourage/ mandate use of recycled construction materials
• Waste transport licensing scheme– Only licensed businesses to transport C&D wastes
– Increases JPSPN ability to track waste generation by each construction project
• C&D waste recycling programme– Identify construction components to allow recycled materials
– Develop recycled material quality certification mechanism
2
3
1. Construction and Demolition
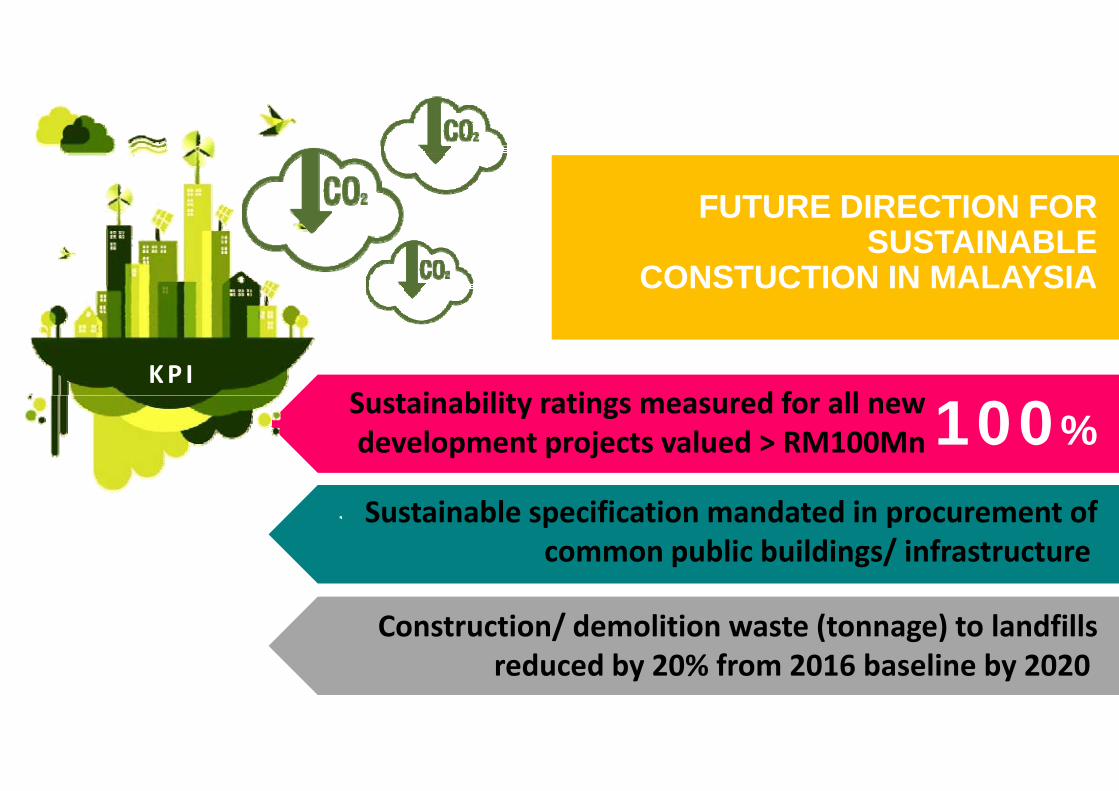
S t i bilit ti d f llKP I
FUTURE DIRECTION FOR SUSTAINABLE
CONSTUCTION IN MALAYSIA
Sustainability ratings measured for all newdevelopment projects valued > RM100Mn100%
Sustainable specification mandated in procurement ofcommon public buildings/ infrastructure
Construction/ demolition waste (tonnage) to landfillsreduced by 20% from 2016 baseline by 2020