Prepared for Los Angeles County Flood Control District Flood ...
Upload
khangminh22Category
view
1download
0
University of KentuckyUKnowledge
KWRRI Research Reports Kentucky Water Resources Research Institute
1968
Planning Flood Control Measures by DigitalComputerDigital Object Identifier: https://doi.org/10.13023/kwrri.rr.11
James Norris ClineUniversity of Kentucky
L. Douglas JamesUniversity of Kentucky
Right click to open a feedback form in a new tab to let us know how this document benefits you.
Follow this and additional works at: https://uknowledge.uky.edu/kwrri_reports
Part of the Computer Sciences Commons, Emergency and Disaster Management Commons,Environmental Indicators and Impact Assessment Commons, Environmental MonitoringCommons, and the Water Resource Management Commons
This Report is brought to you for free and open access by the Kentucky Water Resources Research Institute at UKnowledge. It has been accepted forinclusion in KWRRI Research Reports by an authorized administrator of UKnowledge. For more information, please [email protected].
Repository CitationCline, James Norris and James, L. Douglas, "Planning Flood Control Measures by Digital Computer" (1968). KWRRI ResearchReports. 182.https://uknowledge.uky.edu/kwrri_reports/182
•
r ,, ..
I
\
\ . '·
Research Report No. 11
PLANNING FLOOD CONTROL MEASURES BY DIGITAL COMPUTER
\ James Norris Cline \
)\
WASHJNOTON WATIII RESEARCH CENTER L19RAltY
University of Kentucky Water Resources Institute Lexington, Kentucky
Project Number A-001-KY Dr. L. Douglas James, Principal Investigator
1968


'
........__ --
INTRODUCTION
"Planning Flood Control Measures by Digital Computer" is
based on research performed as part of a project entitled "Economic
Analysis of Alternative Flood Control Measures" (OWRR Project No.
A-001-KY) sponsored by the University of Kentucky Water Resources
Institute and supported in part by funds provided by the United
States Department of Interior as authorized under the Water Resources
Research Act of 1964, Public Law 88-379. Special thanks must also
be extended to the Louisville District office of the U. S. Army Corps
of Engineers for help in data,gathering and the University of Kentucky
Computing Center for use of their facilities.
The research goal is a practical means for economic evaluation
of alternative combinations of structural and nonstructural measures
for flood control for use in flood control project formulation. The
result has been a pair of computer programs designed to ease the
computational burden of comparing measure combinations by repro
ducing the mathematical steps in the design process. The programs
are described in a series of four reports.
1. Rachford, Thomas M., "Economic Analysis of
Alternative Flood Control Measures by Digital
Computer," Research Report No. 1
iii

2. Villines, James R., "Economic Analysis of Flood Deten-
tion Storage by Digital Computer," Research Report
No. 9 .. 3. Dempsey, Clyde R., "The Effects of Geographical
and Climatic Setting on the Economic Advantages of
Alternative Flood Control Measures," Research Report
No. 10
4. Cline, James Norris, "Planning Flood Control Measures
by Digital Computer," Research Report No. 11
The last three of these reports may be read as a unit for a thorough
understanding of the research results.
The computer program as described is continuously being
revised and updated as new experience is gained by applying it in
different circumstances. Any comments or suggestions the reader
may have will be sincerely appreciated and should be addressed to
L. Douglas James, Project Director.
f l
iv

'
ABSTRACT
The purpose of this study was to develop adequate guidelines
whereby those interested in flood control planning would be able
to apply a pair of digital computer programs known as the University
of Kentucky Flood Control Planning Programs to ease the computa
tional burden of evaluating specific flood control sitila lions.
Program II determines the economically optimum combination of
channel improvement, land use restriction, and flood proofing for flood
damage abatement. Program III also incorporates reservoir storage
into the planning process. The Programs are not intended to provide
a finished design b9t rather to select the optimum combination of
flood control measures and residual flooding with regard to both
time and space.
Application of Computer Programs to flood control planning is
guided by presenting first a general description of the application
process then a detailed description of the input required and the
output produced by the Planning Programs. Input was developed
and results interpreted to determine the optimum flood control
plan for the upper reaches of the North Fork of the Kentucky River
near Hazard, Kentucky.
v

,.
' .....
TABLE OF CONTENTS
INTRODUCTION
ABSTRACT
LIST OF TABLES
LIST OF ILLUSTRATIONS
Chapter
I. SELECTING ALTERNATIVE FLOOD CONTROL MEASURES
Introduction Measure Evaluation Flood Damage Structural Measures Nonstructural Measures Dynamic Analysis Methodology of Analysis
II. COMPUTER PROGRAMS DEVELOPED FOR FLOOD MEASURE ANALYSIS
Program II Program III
III. APPLICATION OF COMPUTER PROGRAMS TO SOLVING A FLOOD CONTROL PROBLEM
Problem Definition . • . . . . • Alternative Methods of Analysis Planning Situations Varying Controls • Limitations . . . .
vii
Page
iii
v
·xi
xiL
1 2 4
10 14 18 20
23 31
33 36 38 44 46

TABLE OF CONTENTS (Continued)
Chapter Page
IV, DEVELOPMENT OF INPUT DATA
Introduction . . . . . . . . • The Study Area . . . • • • . The Data Collection Process
Program Control Parameters Physical Characteristics of Drainage Area and Channels . Hydrology •..•.... Flood Damages •••.. General Design Variables Design Data for Subwatershed Measures Urbanization and Land Value Projections Design Data for Dam and Reservoir
V. INTERPRETATION OF OUTPUT
Program II •...•.. Program III • • . • . . . Kentucky River Analysis
VI, SUMMARY OF FINDINGS
Significance of Findings Nature of Application . Potential for Expansion
Appendix
A. FORTRAN IV LISTING OF THE UNIVERSITY OF KENTUCKY FLOOD CONTROL PLANNING PROGRAM II ..•.....•....•..
B. DICTIONARY OF VARIABLES USED IN THE UNIVERSITY OF KENTUCKY FLOOD CONTROL PLANNING PROGRAMS . . . . . . . . . . .
viii
. . . .
49 50 56 57
62 67 79 95 98
121 125
156 167 184
197 198 199
200
254

l
TABLE OF CONTENTS (Continued)
Appendix Page
C. INPUT DATA FOR THE UNIVERSITY OF KENTUCKY FLOOD CONTROL PLANNING PROGRAM II . . . . 290
D. INPUT DATA FOR THE UNIVERSITY OF KENTUCKY FLOOD CONTROL PLANNING PROGRAM III . 296
LIST OF REFERENCES . . . . • . . . . . . . . . . . 3 09
ix

Table
1.
2.
3.
4.
5.
6.
7.
8.
9.
10.
11.
12.
13.
14.
15.
16.
17.
18.
19.
L
LIST OF TABLES
Agricultural Land Use in Perry County
Percent of Total Crop Value Destroyed by Flooding
Relative Flood Threat by Month ....
Annual Cost of Land Use Management.
Flood Plain Measures Considered ...
Alternative Flood Plain Measure Combinations
Stage Analysis Summary ..... .
Summary of Channel Improvements
Summary of Flood Proofing Measures
Summary of Location Measures ...
Summary of Right-of-Way Preserved for Future Channel Construction in Stage 2
Average.Annual Cost Over All Stages
Flood Hydrograph . . .
Hydrograph Parameters
Flow and Water Surface Elevation at Flood Beginning
Reservoir Outflow . . . . . . . . . . . . .
Reservoir Data Used in Routing Procedure
Reservoir Routing Table
Dam Quantities ....
xi
Page
87
89
89
158
159
160
160
162
163
164
165
166
165
169
170
171
172
173
174

Table
20.
21.
22.
23.
24.
25.
26.
27.
28.
29.
30.
31.
32.
33.
34.
35.
LIST OF TABLES (Continued)
Trial Flow Depths . . . .
Stilling Basin Quantities
Emergency Spillway Quantities
Principal Spillway Quantities
Dam and Reservoir Cost Summary
Dam Design Details
Subwa tershed Flood Peaks
On Line Cost Summary
Summary for Reservoir Trial
Cost of Justified Reservoir
Description of Computer Runs
Dam and Reservoir Data (Program III)
Dam and Reservoir Data (Corps of Engineers) .
Reservoir Effect on 200-Year Flood Peak at Hazard
Benefit Cost Analysis of Reservoir Alternatives
Optimum Flood Proofing Program
xii
Page
175
175
176
177
178
179
179
180
181
182
186
188
189
190
192
195

LIST OF ILLUSTRATIONS
Figure Page
1. General Location Map 51
2. Specific Location Map 52
3. Variation of Crop Damage with Depth of Flooding 90
A. Emergency Spillway Profile 306
B. Dam Cross Section 307
c. Spillway Cross Section 308
xiii

Chapter I
SELECTING ALTERNATNE FLOOD CONTROL MEASURES
INTRODUCTION
The people of the United States suffer an average of roughly
$1,000,000,000 in flood damage each year. In Kentucky, the aver
age annual damage is between $10,000,000 and $12,000,000 (21,
p, 9). These figures, large as they are, do not satisfactorily portray
the full economic impact of flood events. Flood damages do not
occur in uniform annual amounts equally distributed over the popu
lation; instead, they come unexpectedly in amounts which vary from
year to year from minor annoyance to major disasters, and they
afflict a relatively small number of people. The impact of a major
flood can be seen from the event of January, 195 7, when approxi
mately 6,000 residents of the area around Hazard, Kentucky, an
area already suffering an economic and population decline, suffered
$6,813,300 in flood damages, more than $1,000 per capita or 40
per cent of the median annual per capita income (21, p. 11). In
1937, 60 per cent of the city of Louisville was inundated by flood
waters from the Ohio River (2 8, p. 2).
The more than $10,000,000,000 that has been spent for
structural measures to confine flood waters since passage of the

Flood Control Act of 1936 has certainly reduced flood damages below
what they would have been otherwise. However, the expected
annual flood damage is still increasing every year. The most
promising approach to reverse the rising trend in flood damages is
incorporation of nonstructural measures into flood control projects.
In explanation, flood damages result from an interaction between
two factors. The streamflow must exceed the stream's carrying
capacity, and damageable property must be located in the area flooded.
A flood damage mitigation program may work on changing either of
the two factors.
Measures designed to change the first factor, hence to prevent
the stream from leaving its channel, are called structural measures,
the most common examples being reservoir storage and channel improve
ment. The second type of flood damage abatement measures, the
nonstructural measures, are designed to reduce the damage caused
by the flood water that leaves the channel. This is accomplished
by either modifying damageable flood plain property so that it suffers
less damage during inundation (flood proofing) or by keeping poten
tially damageable property from the flood plain (land use mangement).
MEASURE EVALUATION
Following a report by the Task Force on Federal Flood Control
Policy in 1966 (25), the President issued Executive Order 11296
- 2 -

requiring federal agencies to determine the optimum combination of
structural and nonstructural measures for application in each flood
plain studied.
Both broad categories of measures reduce flood damages, but
both have economic costs associated with their implementation.
Flood control planning seeks that combination of measures, each
specified by area and .level of implementation, that will yield the
maximum flood control benefits net of the cost of the measures.
Another way of describing this optimum flood control program is to
say that it is the combination of measures, specified by area and
level of implementation, that minimizes the sum of the cost of the
damage reduction measures and flood damage residual to these
measures.
"Level of protection" is the magnitude of the maximum flood
event a flood control measure is designed to handle, usually
expressed as the probability of the design flood occurring in any
given year or as a return period, the long-term average interval
between such floods. For example, a channel improvement providing
a one per cent level of protection physica11y prevents flood water
from spilling into the flood plain during all floods not exceeding
the largest flood expected to occur, over an indefinitely long
period of time, an average of once each 100 years.
- 3 -

Project planners are required to search for the optimum combina
tion of structural and nonstructural measures for application in each
watershed they study, They can only do so by evaluating the damage
reduction each measure produces and the cost installation of each
measure requires.
FLOOD DAMAGE
Four flood damage categories are generally recognized: direct
damages, indirect damages, secondary damages, and intangible
damages. More recent research has suggested uncertainty damage
as a fifth category,
Intangible damages, as the name implies, are those conse
quences of flooding that cannot be assigned a monetary value, hence
can only be considered qualita lively in flood control planning. Loss
of life and health, the temporary interruption of essential services
during flood periods, and the insecurity from living under perpetual
flood threat are examples.
Secondary damages result from economic rather than physical
or technological linkages. For example, damage inflicted by a flood
may prevent a family from being financially able to purchase a new
automobile, Some automobile dealer loses a potential sale and
thus suffers a secondary damage. Some auto manufacturer also
loses a sale - more secondary damage. Such damages are difficult
- 4 -

I
L
to quantify and are at least partially offset by secondary benefits
(for example, those realized by the suppliers of the building mater-
ials and new furniture to the flooded family),
For many water-resource project purposes, the favorable
secondary effects are experienced locally while the unfavorable
effects are dispersed over a wide area, A project whose local
secondary benefits equal widely dispersed adverse secondary conse-
quences may be regarded favorably because of a desirable income
redistribution. However, this effect may not be as significant for
flood control as for other project purposes because damage prevention
shifts local expenditure from one group of merchants to another. In
any event, the net secondary economic effect is usually close to
· zero from the national viewpoint.
Indirect damages are inflicted by some physical or techno-
logical linkage other than direct physical contact with the flood
water. A good example of an indirect damage is the extra cost
required to transport goods around a flooded area. The time and
expense necessary to trace and evaluate indirect damages is seldom
justified for planning individual projects. Consequently, indirect
damages are usually taken as the fixed percentage of direct damages
determined by pilot studies, For example, the Soil Conservation
Service has developed the following values (37, p, 25):
- 5 -

Agricultural damages 5 to 10 per cent Residential damages 10 to 15 per cent Commercial and industrial damages 15 to 20 per cent
Direct damages result from direct physical contact of damage-
able property with flood water. Direct urban damages are taken as
the cost of restoring damaged property to its condition before it was
inundated or its loss in market value if restoration is not worthwhile.
The damage to totally destroyed property is its market value at the
time of the loss.
While the damages caused by a flood of given severity to
structures, contents, and surrounding landscaping vary greatly
among individual properties, a relationship may be derived for plan-
ning purposes to express the average damage inflicted by shallow
flooding (Cf) in dollars per foot of flood depth per dollar of structure
market value for a representative composite combination of residen-
tial, industrial., and commercial property. A representative value
for Cf of 0.052 has been determined (13, pp. 85-88) for estimating
total damage in the flood plain by the equation:
where $ is the urban flood damage in dollars per acre, M is u s
the market value of structures in dollars per acre, and dis the
average depth of flooding in feet. Total urban and structural damage
is the product of$ , the total acres flooded, and fraction of the u
- 6 -

area flooded subject to urban or structural damage. Higher values
of Cf should be used for flood flows of high velocity or sediment
content. The value may also be modified to include indirect or
secondary damages by using an appropriate percentage increase or
through a more exhaustive analysis where warranted. For flood
depths exceeding four or five feet, flood damage no longer increases
linearly with depth as indicated by eq. 1, and a curved relationship
should be substituted (1).
Crop damage depends on the productivity and distribution of
various soil types within the flood plain, the value of the crops
grown and their susceptibility to flood damage at various times
during the year, the relative probability of flooding at various times
of the year, and the depth of flooding.
The damage wrought by a flood of given frequency is deter
mined by summing the various kinds of damage. However, in
determining the economic feasibility of a flood damage abatement
measure, the benefits to be realized must be compared with the
cost of the measure. To be comparable, the benefits and costs
must be determined on the same time basis, for example, average
annual values. The average annual benefits from a damage abate
ment measure is the difference in the average annual damage with
and without the measure.
- 7 -

The frequency with which floods of various magnitudes (hence
various depths and areas flooded) occur can be determined by
hydrologic analysis (13, pp. 10-15). From relationships between
flood magnitude and frequency and others relating flood magnitude
and damage, damage can be plotted as a function of frequency.
The average annual damage is the area under the damage-frequency
curve.
Hydro.logic studies can be used to determine how the flood
frequency relationship varies with such other factors as the degree
of urbanization of the tributary drainage area and the amount of
channel improvement in the upstream channels (4). The change in
average annual flood damage with time is caused partly by upstream
urban development and channel improvement and partly by changes
in flood plain land use, The increase in downstream flood damage
induced by channel improvement is an important consideration in
project planning.
Several years with no flooding at all may be followed by a
year with extremely high damage. Due to their psychological aver
sion to not knowing in advance when a flood will occur and their
financial aversion to very large infrequent damages, most people
would be willing to pay an annual "flood damage bill" in excess
of the average annual damage they suffer to be free from the
- 8 -

uncertainty. This excess may be called the uncertainty damage,
and its reduction may be considered another goal of flood control
measures. H. A. Thomas (5, pp. 150-152) developed a procedure for
quantifying this aversion to uncertainty, and Bhavnagri and
Bugliarello (1, pp. 149-173) showed how Thomas' method (called the
Thomas Uncertainty Fund method) could be applied to flood control
project formulation.
The Thomas Uncertainty Fund is a hypothetical sinking fund
into which is deposited annually an amount of money large enough
to cover expected flood damages with a fixed probability of having
the fund exhausted by a series of unexpectedly large floods. In
years of below average flood damage, the fund grows. In years of
greater damage, the fund is depleted. If the probability of having
the fund run out is set at less than 50 per cent, which will be the
case if there is any aversion to uncertainty, the annual Thomas
Uncertainty Fund payment will be more than the average annual flood
damage. This excess is the uncertainty damage suffered by flood
victims solely because of the variability of flood damages from
year to year.
The uncertainty damage may be calculated by the equation:
c = (V ) (a) I £r (2) u ti!
where C is the present worth of the uncertainty damage, V is u ~
- 9 -

the normal deviate with a probability a. of being exceeded, a is the
probability of having the hypothetical fund exhausted, a is the
standard deviation of the flood damage time series, and r is the
project discount rate. Higher levels of protection by structural or
nonstructural measures will cause a decrease in a, which in turn
decreases C . If C is included in the total measure and residual u u
damage cost that is minimized in the optimum project, the decrease
in uncertainty helps to justify flood control measures that cause the
decrease. Selection of a low value of a. for calculating uncertainty
damage can be used to increase the optimum level of protection above
that specified by the reduction in average annual damages where
believed warranted because of intangible considerations.
STRUCTURAL MEASURES
Structural measures are designed to prevent the stream from
leaving its banks. Reservoir storage prevents floods by holding
floodwater within upstream reservoirs to dampen downstream flood
pea ks. Channel improvement prevents floods by increasing the
flood peak required to overtop the stream bank.
In determining what (if any) level of protection should be
supplied by reservoir storage, it is necessary to estimate average
annual damage were no measures used at all. Then various levels
of protection by reservoir detention may be assumed, beginning
- 10 -
with no flood control storage and proceeding to the highest level of
protection to be considered. For each storage amount, the economi-
cally optimum combination and levels of protection of the downstream
measures used to complement detention storage may be determined
as that having the smallest total cost, including the costs of
structural and nonstructura.l measures, residual flooding, and uncer-
tainty. The optimum reservoir storage is associated with the minimum
sum of reservoir and downstream cost. Should no combination be
found whose total cost is lower than the damages if no measures
are implemented, the optimum policy is to bear the damages.
Detention storage can be economically justified only when
the downstream flood plain suffers relatively large damages and a
reservoir site providing substantial low cost storage can be found.
The cost of detention storage is comprised mainly of the dam cost,
the cost of relocations, and of right-of-way. Consequently, de ten-
tion storage can be used to the greatest advantage when the dam
site provides maximum storage for a given dam size and has a
suitable foundation and emergency spillway site and when the
upstream area to be inundated by the reservoir has relatively few
highways, railroads, transmission lines, etc., that would require
re.location, and is relatively sparsely populated, thus avoiding
expulsion of many people from their homes at a high social and
- 11 -
I l
financial right-of-way cost.
Annual storage benefits are taken as the difference in the
annual cost of the optimum combination of the other measures con
sidered (including residual damages and uncertainty) with and without
detention storage. The initial storage cost is evaluated from unit
costs and quantities used in dam construction (including materials,
engineering, design, and contingencies), relocations. and right-of-way.
The initial cost is distributed over the project design life, using the
project discount rate, and is added to the annual maintenance to
determine the total annual cost. The right-of-way cost includes,
in addition to the financial cost of acquiring real property, additional
cost components to account for the difference between the project
discount rate and the private interest rate (7) and the social and
psychological cost of forcing unwilling residents to sell and leave
their homes and farms (11).
The second means of keeping streamflows from leaving the
channel, hence a structural measure, is by increasing the capacity
of the channel. This can be accomplished by channel enlargement
accompanied by lining or drop structures as required to prevent
excessive scour by high flow velocities.
The capacity for uniform flow in an open channel, an index
of its ability to dispose of flood water as efficiently and safely as
- 12 -

possible, is given by the Manning equation:
Q = 1.49 A RZ/3 8 1/2 n
where Q is the discharge in cfs, n is the Manning roughness co-
efficient, A is the cross sectional area of the stream, R is the
hydraulic radius of the stream, and S is the slope of the hydraulic
gradient which can be assumed, for our purposes, to equal the
slope of the channel bottom. From this equation, it can be seen
(3)
that enlarging the channel increases its capacity by increasing A and
Rand that lining the channel also increases its capacity by reducing
the Manning roughness coefficient.
Annual benefits from a proposed channel improvement are
taken as the difference in the average annual damages with and
without the measure in place. Determination of the annual cost
of channel improvement is analogous to that for reservoir detention
storage, both being the sum of products of quantities and unit costs.
Channel improvement reduces the dampening effect of flood plain
storage. Consequently it makes the downstream flood peaks more
severe. To account for this effect, the damage increase in
downstream reaches or the cost of improving the downstream channel
to handle the increased flow, whichever is smaller, should be
calculated and treated as a negative benefit,
- 13 -

Channel improvement is likely to be found advantageous where
there is a considerable amount of urbaniza lion to provide potential
benefits, particularly when a reservoir is not feasible upstream, The
flood plain must be wide enough so that the right-of-way required
will not be an excessively large fraction of the flood plain, In
cases where right-of-way is relatively inexpensive, channel enlarge
ment is most likely to be utilized. With increasingly urban areas
abutting the stream, thus placing higher premiums on right-of-way,
trapezoidal and then rectangular lined channels will become advan
tageous, their higher construction costs being offset by savings in
right-of-way required,
NONSTRUCTURAL MEASURES
Nonstructural measures make no attempt to prevent floods -
only to reduce the damage inflicted by floods when they do occur.
These are tpe measures that have been too often overlooked in plan
ning flood control projects. A major cause of their neglect has
probably been the difficulty involved in determining their effect on
flood damages and their costs,
Those nonstructural measures designed to reduce the flood
damage to property located in the flood plain are called flood
proofing measures. Only those flood proofing measures involving
structural modification of buildings lend themselves to economic
- 14 -

analysis. Examples include sealing of foundation cracks to keep
water out, removable bulkheads for doors and windows to reduce
water entry and glass breakage, elevation or covering of damageable
equipment, and use of building materials that are not particularly
susceptible to flood damage. Flood proofing, unlike structural
measures, can be implemented by individuals acting alone or on a
community-wide basis as has been done in Bristol, Tennessee-
Virginia. The average cost of flood proofing a large number of
buildings (13, pp. 110-115) may be estimated by the equation:
Cp = C M h p s
(4)
where Cp is the installation cost of the measures, Ms is the market
value of the structures, and h is the flood proofing design depth.
C is an average cost of flood proofing that must be estimated from p
flood proofing measures designed for a large number of buildings
and is analagous in units to Cf in eq. 1.
In determining flood proofing benefits, the damage residual
to flood proofing measures must be taken as some fraction of the
flood damage to the structures not flood proofed to account for
damage outside the buildings, plus the damage outside the area
protected, plus all the damage inflicted by floods larger than the
measure design flood. Quantitative data on the cost of flood
proofing is scarce since so few programs have been undertaken.
- 15 -

The most significant use of flood proofing, hence the best data source,
is probably that in Bristol, Tennessee-Virginia reported by Sheaffer
(24).
Flood proofing applies only to structures and since it can be
implemented on a "per building" basis is often applicable in areas
where urbanization is too scattered to merit structural measure protec
tion. Flood proofing promises to have widespread applicability to
the flood problem in Appalachia where the valleys are too narrow
for levee construction and are filled with homes, towns, highways,
railroads, etc., thus making economical reservoir sites scarce,
and where all the feasible building sites are in the flood plain,
thus ruling out the second nonstructural measure, land use
restriction.
Land use restriction measures are those that keep out of the
flood plain property that is more subject to damage and that gains
little benefit from its flood plain location. The idea of land use
regulation is not new. In March, 1937, "Engineering News Record"
asked, "Is it sound economics to let such property be damaged
year after year, to rescue and take care of the occupants, to spend
millions for their 'local protection', when a slight shift in location
would assure safety?" (8, p. 385). But it was not until 1966
that the President issued Executive Order 11296, which now
- 16 -

requires all Federal planning agencies to include nonstructural
measures in their economic analyses of possible flood control projects.
The annual cost of land use management depends on the
relative value of the flood plain land if it were free from the threat
of flood damage (13, pp. 122-124). The pertinent factors may be
condensed into the equation:
c1
= CRFi (MV - PWFj MVt) - IA - IP t O t
where c1
is the annual cost of preventing urban development for a
period of t years, MV is the market value of the land at the 0
beginning and MVt at the end of the t year period, i is the interest
(5)
rate for project evaluation, j is the rate of return required by private
investors in land, CRF is a capital recovery factor, PWF is a present
worth factor, IA is the average value of agricultural income one
would expect if the land were farmed, and IP is a monetary expres-
sion of the average annual satisfaction the community loses when
urban land displaces aesthetically pleasing open spaces. The
cost of enforcing land use restrictions should also be included in
the analysis.
Damage residual to land use measures include the damage to
developments that were in the flood plain before new construction
was restricted, damage to the land in its restricted use (usually
agriculture), and damage to development outside the restricted
- 17 -

area when the design flood is exceeded.
Land use measures are applicable when future urban develop
ment is expected to encroach on the flood plain, providing there are
alternative sites available for this development. It is not applicable
when no urbanization is foreseen or when the flood plain is already
intensely urbanized.
DYNAMIC ANALYSIS
In planning a flood damage mitigation program having a
design life of 50 to 100 years, it is necessary to project future
population and future urbanization patterns. However, projections
of the future are uncertain at best. For this reason, it is desirable
to keep development plans as dynamic and flexible as possible.
One of the best ways to fulfill this need is to introduce into the
analysis of alternative measures the concept of planning stages.
The total planning period, usually taken as the design life of
structural measures, may be divided into planning stages. Based
on the current conditions and the expected trends through the first
stage, the analysis should begin by determining the optimum flood
control measures to be installed now. If desired, and as based
on the current projections, the further measures that should be
adopted at the start of each subsequent planning stage may also
be determined. The current as well as projected future action
- 18 -

' .
'----
should also be checked to insure that it forms a logical sequence
when viewed over the entire planning period. The advantage of
dynamic analysis is that at any time during the planning period that
the urbanization and land use patterns are seen to be varying signifi
cantly from the original projections, revised estimates can be used
to bring the flood control plan up to date. Projection errors do not
produce an unneeded, large fixed investment. Details of optimum
timing in stage construction are described by Dorfman (5, pp, 152-158).
Another problem in dynamic flood plain analysis is determina
tion of whether one should hold extra right-of-way for future project
construction. Whenever the cost of land is increasing at a faster
rate than the project discount rate, it is economically advantageous
for the planning agency to obtain and hold right-of-way that it
expects to be required for construction in subsequent stages. James
(16, p. 252) found that in a typical growing urban fringe this
option should be exercised whenever the surrounding land is
between 2 per cent and 70 per cent urban and the eventual need
for the land is reasonably certain. In areas that are less than 2
per cent urban, land is too inexpensive to make holding worthwhile;
for percentages larger than 70, the land is too expensive to justify
taking a chance on buying land ahead of the time it is needed.
- 19 -

METHODOLOGY OF ANALYSIS
The first procedure for selecting the optimum combination and
level of protection of both structural and nonstructural measures
(excluding reservoir storage) while including in the analysis all the
considerations described above was developed by James at Stanford
University and was presented in 1964 as his doctoral dissertation,
"A Time-Dependent Planning Process for Combining Structural
Measures, Land Use, and Flood Proofing to Minimize the Economic
Cost of Floods" {13). In his research, James performed all the
optimization calculations by slide rule or desk calculator. Roughly
six hours was required for the calculations for just one channel
reach in one planning stage. Consequently, the first in this series
of research projects, designed to develop a practical means of
executing and extending the procedure, was a project to convert the
computational techniques into a computer program. This work was
done by Rachford and is described by him in Research Report No. l
(22). His initial computer program was dubbed "The University of
Kentucky Flood Control Planning Program I", abbreviated hereafter
UKFCPPI. At this point, the calculations that had taken six hours
long-hand could be completed by the IBM 7040, then at the U. K.
Computing Center, in about six seconds. Installation of the new
IBM 360/50 computer along with improvements in program efficiency
- 20 -

'~
have made the analysis even faster,
Addition of new program fea lures, generalizations to make
the program applicable to additional situations and improvements
in computational efficiency, all to be described in the next chapter,
were the steps leading to UKFCPPII. Program II is capable of
analyzing up to 25 flood plain reaches or subwatersheds in virtually
any complex arrangement. For example, part of the subwatersheds
may be on each of several tributary streams and others on the main
stream.
Program III (UKFCPPIII) has now been developed to determine
the optimum flood control plan for a series of subwa tersheds in
sequence downstream. The most significant difference in Programs
II.and III is the inclusion of reservoir detention storage into the
Program III analysis. The details of Program III are given by
Villines (38).
In both Programs II and III, the hydrology is a vitally impor
tant factor. In Program III the routing procedures used require
that the program not only be supplied with the flood peak data
required by Program II but also similar information on flood volumes
and flood hydrograph timing (see Chapter 4). This need for more
hydrolog ic data, coupled with the sensitivity of the program
results to hydrology, has led to a detailed study of the hydrology
- 21 -

involved in implementing the Flood Control Planning Programs.
Details of this study are presented by Dempsey (4).
In their up-to-date form, both Flood Control Planning Programs
II and III are in Fortran IV computer language suitable for execution
on the IBM 3 60/50 sys tern at the University of Kentucky Computing
Center. Program II requires 83 ,300 computer storage bytes,
exclusive of system core storage, while the more complex Program
III takes 132,500 bytes.
- 22 -

i L
Chapter II
COMPUTER PROGRAMS DEVELOPED FOR FLOOD MEASURE ANALYSIS
PROGRAM II
Those responsible for flood control planning have been
given what would by traditional computational methods be a very
time consuming task. A thorough economic analysis considering
many levels of protection by many different measures, both
structural and nonstructural, should be used to determine what flood
control measures should be employed. The optimum measures vary
in time and space, and the chosen plan should be sufficiently flexible
so it can be adjusted to changing conditions.
These planning refinements are essential to proper project
formulation but multiply the complexity of the analysis. Flood
control planning agencies were worked to ca pa city in planning for
structural flood control measures alone. A shift to a more thorough
analysis would increase their work load many fold. The only solu-
tion to this problem is in expanding the use made of high speed
digital computers. The computer makes possible more than an
acceleration of conventional computations. It permits use of many
numerical methods of analysis which once could not be used

because of the required computational time. Programming the basic
procedure for economic analysis allows comparison of many more
alternatives than could ever be done by hand while freeing the
planner from tedious computations so more time can be devoted to
data collection and analysis interpretation.
The University of Kentucky Flood Control Planning Program II
determines the combination and level of channel improvement, flood
proofing, land use measures, and residual flooding that minimize the
economic cost of flooding. The Program requires input which is
either currently being collected for evaluating structural measures
or will necessarily have to be collected for evaluating nonstructurat
measures in compliance with Executive Order 11296.
Program II consists of a main or "central program" and 14
subroutines. Each subroutine has a specific function to perform
and may be called by the main program or by other subroutines to
perform computations based on conditions currently being considered.
A complete listing of the Program is in Appendix A. A dictionary
defining all the variables used is in Appendix B. The reader
should refer to this appendix for definitions of program variables
subsequently used in the text,
The approach of Program II is that developed by James (13)
and programmed into Program I as described in detail by Rachford (22).
- 24 -

'---
Modifications made to Program I to develop Program II include
consideration of new planning alternatives, generalizations to make
the Program applicable to additional situations, and improvements
to increase computational efficiency. Since these changes,
Program I has become obsolete and is no longer applied. These
changes, exclusive of minor changes to improve computational
efficiency, follow.
The average annual damage is the area under the damage
frequency curve. The Program determines average annual damages
from damages caused by floods of a number of different frequencies.
Each flood damage figure is then multiplied by a frequency range
centered around that frequency for which the damage was calculated.
The summation of these products approximates the area under the
damage-frequency curve, hence, approximates the average annual
damages. In Program I, the damage was based on floods of 100
different frequencies. Program II follows the same technique but
uses only 16 flood frequencies. This change was found to save
a great deal of computing time with negligible loss of accuracy.
The main program as presented by Rachford was quite long.
To simplify program development, the original main program was
divided into a much smaller central control program and four
subroutines. The new subroutines and that part of the function of
- 25 -

the old main program assumed by each are:
(1) CHDATA - reads all the input data,
(2) CHHYDR - determines the relationship between flood peak
and frequency, and the frequency at which flooding
begins.
(3) CHOPTM - selects the optimum combination of channel
improvement and nonstructural measures for a given
subwatershed stage.
(4) STROUT - prints out a summary of selected channel
improvements,
A new feature of Program II was the addition of a right-of-way
holding option, If this option is used, the Program determines
whether or not right-of-way should be purchased in the early stages
of the analysis for channel construction anticipated in subsequent
stag es. If the holding of extra right-of-way is found to be economi
cal, the Program also determines the amount that should be held,
the annual cost of holding the right-of-way, and the duration for
which the land should be held before resale if the anticipated
future improvements do not materialize, Details of the theory
behind this option are presented by James (16),
The input data include the length of channel in each sub-
wa tershed that was improved prior to the beginning of the planning
- 26 -

period. A new subroutine, CHFIX, was added in Program II to
establish the dimensions these previously improved channels
would have according to the design criteria used by the Program
for new channels. These dimensions are selected to provide a
channel large enough to contain the design discharge specified by
the data. It is desirable that the dimensions of channels improved
before and during the planning period be based on the same criteria
so that the cost of enlarging channels initially improved before
the planning period began will be consistent with the cost of
enlarging those initially improved during the period of analysis.
CHFIX is also used in Program III, hence its details are presented
by Villines (3 8).
A second new subroutine incorporated into both Programs II
and III is CALCLU. This subroutine calculates the location (land
use restriction) cost per acre for each subwatershed. Intuitively,
the location cost should increase with the growing scarcity of land
as the subwatershed becomes more urbanized. CALCLU, therefore,
is designed to check whether or not the cost increases monotoni
cally with urbanization. If it does not, the high early land value
is probably caused by country estates and land speculation. In
such cases, the Program reduces the high early value to the
lowest location cost calculated for any subsequent stage.
- 27 -

Villines (38) presents the details of subroutine CALCLU.
Program I only applied flood proofing measures to urban
structures. Provision was made in Program II to consider flood
proofing for protection of farm buildings as well. The evaluation
of flood proofing farm structures follows the same procedure used
for urban structures (13, pp. 110-115).
The data for Program I was not grouped by related variables
and was read using standard Fortran formats. The data have since
been regrouped into the order presented in Chapter IV so data having
related significance will appear together. A special READ sub
routine was also added to read the data in a free format. Data
need only match the variable type and be punched on the data cards
in the proper order. Comments may be placed on the data cards to
the right of an asterisk. The advantage of this free format becomes
readily apparent by reviewing the input data listings in Appendices
C and D.
In Program I, crop damage was assumed to be independent of
the depth of flooding. The crop damage per acre of each soil type
flooded was weighted according to the fraction of the flood plain
in the respective soil types, and the composite per acre damage
was multiplied by the area flooded to get the total crop damage.
In Program II there are two per acre damage factors for each soil
- 28 -

type. The first is the damage per acre flooded to a minimal depth
(fixed); the second is the additional damage per acre for each
incremental foot of flood depth (variable) . The composite variable
damage factor is multiplied by the depth of flooding, and their
product is added to the fixed damage factor. The total crop damage
is the product of this sum and the area of crops flooded.
The two flood parameters, Kl and K2, used to relate the
area and depth of flooding to the discharge in excess of channel
capacity are described in detail by James {13, pp. 80-85). In
Program I, the values for Kl and K2 for each subwa tershed were
calculated manually and included in the data. Program II is
designed to calculate Kl and K2 from input subwatershed values
of the discharge, depth, and area (QK12, DK12, and AK12 respec
tively) flooded by some historical flood event and from the existing
channel capacity.
It was shown by the Manning equation (eq. 3) that lining,
as well as enlargement, increases channel capacity. The narrower
lined channels are particularly economical in areas of high right
of-way cost. Once a channel was improved using an unlined
section, Program I only considered enlarging to provide the
additional capacity as needed in later stages. Program II also
considers lining the previously improved section without further
enlargement.
- 29 -

In Program I, eq. 1 (Cf= COEFDM) was used without regard
to the depth of flooding or the calculated damage. Consequently,
a very deep flood would be estimated as doing more damage to a
building than the building was worth. This fallacy is corrected in
Program II by assuming the damage to increase at COEFDM dollars
per foot of depth per dollar of structure value until 25 per cent of
the structure's value is destroyed. Then the damage is assumed to
increase at half this rate until the damage reaches 75 per cent of the
structure's value. It is finally assumed that no increase in damage
is caused by greater depths, or regardless of the flood severity,
25 per cent of the value of a structure can be salvaged.
Because channel improvement benefits the local subwatershed
at the expense of increased damages in those subwatersheds down
stream, the downstream effect must be considered before channel
improvement can be justified. This damage increase was estimated
as the cost of enlarging downstream channels to handle the
increase in the design frequency flood peak in Program I. However,
such an estimate was found excessive in some cases. A new
subroutine, QCST, was made a part of Program II to estimate the
net increase indownstream flood damages brought about by the
increase in flood peaks induced by the upstream channel improvement.
Each time subroutine QCST is utilized, it calculates the net
- 30 -

average annual induced damage in one downstream subwatershed.
The induced damage is calculated from the relationship between
flood peak and damage and the set of 16 flood peaks as they would
be with and without the upstream channelization. Since one down-
stream s ubwa ters hed is evaluated each time, subroutine QCS T is
called once for each subwatershed downstream from the subwatershed
being analyzed. Each time, the increase in damage with upstream
channelization over that without is evaluated and compared with
the cost of improving the downstream channel to accommodate the
flow increase as determined by subroutine COST. The smaller of
these costs is deducted from the benefits that the channel improve-
ment being considered provides in its flood plain.
PROGRAM III
WASHtNGTON WATER RESEARCH CENTER LallAltY
The main difference between Program II and Program III is
that the latter considers reservoir storage as an alternative
structural measure, while the former has as its only structural
measure, channel improvement. Because reservoir storage only
affects flow in channels directly downstream, Program III is
limited to a single line of up to 15 subwatershed flood plains
numbered in sequence downstream. Program II may be used to
analyze up to 25 subwatersheds arranged in any "tree" or con-
fluent pattern.
- 31 -

The theory of Program III as well as a listing of the Program
are given by Villines (38). The dictionary in Appendix B of this
report also applies to Program III.
The increase in downstream flood damage induced by upstream
channel improvement is not figured in Program III as it is in Program
II. There are two basic reasons for this. First, Program III incor
porates reservoir storage, which far more than offsets any channel
induced increase in flood pea ks . Second, estimation of downstream
effects of upstream main line channelization would require routing
of entire hydrographs rather than mere estimation of a peak flow as
done in Program IL The use of the extra computer time was not
considered justified in Prog:am III in view of the few times the
decision to build was found reversed by downstream costs from
experience with Program II. Furthermore, Program II could be applied
to the flood plain where downstream costs were believed significant.
- 32 -

Chapter III
APPLICATION OF COMPUTER PROGRAMS TO SOLVING
A FLOOD CONTROL PROBLEM
PROBLEM DEFINITION
Due to the presence of water and other locational advantages,
man has in the past and will continue into the future to concentrate
his centers of civilization on rivers. In addition, local runoff
often inundates low lying land far from any major watercourse.
Consequently, flooding is currently and will continue into the
indefinite future to be a very widespread problem. It is obvious,
however, that the flood problem cannot be solved by one giant
project for all the world and for all time. Each flood control project
must be aimed at reducing damages in a preselected area for a
limited period of time.
The limits on space and time to which analysis of a particular
flood problem is to be confined are usually rather arbitrarily picked
and may vary widely. In terms of space, the question might be
whether or not to zone a given 20-acre tract against urban encroach
ment, or it might be to determine the optimum flood damage abate
ment plan for a complex river syst-em where every conceivable
flood control measure is potentially applicable. In terms of time,

the planner might be trying to determine the best thing to do right
now, or he might be engaged in long-run planning to determine the
optimum measures and installation timing for the next SO or 100
years. Senate Document 97 requires that planning agencies base
their economic analyses on the smallest practical independent units
of time and space and that the measures prescribed for each time
and space unit be justified by the resulting benefits (31).
In applying the Flood Control Planning Programs, the problem
is first bounded in time and space by determining the total area and
the total period of time over which the analysis is to be extended.
The preliminary analysis should also include examination of the
tributary area for promising reservoir sites. The space units or
subareas into which the total selected problem area is divided are
called subwatersheds, The subwatershed divisions are made by
inspecting a topographic map of the flood plain and subdividing
it into areas, each one having a relatively homogeneous flood
problem. If the analysis is to be confined to flooding by a single
major watercourse or if reservoir storage is to be analyzed, the
subwatersheds will be in a single line pattern, If, however, flood
control measures are to be considered for tributary channels as well
as the main channel, the subwatersheds will lie in a "tree" type
arrangement.
- 34 -

To assure homogeneity of the flood problem within each subwater
shed, a subwatershed boundary should be placed:
1. at the junction of major tributaries because a confluence
causes a sudden change in the tributary drainage area and
thus in the flood frequency relationship;
2. at dam sites to be studied (applies to Program III only);
3. at major breaks in flood plain geometry or channel
capacity because these will change the local flood
hazard;
4. at major breaks in flood plain development, such as
at the upstream and downstream end of urbanized areas
because these will change the amount of local damage;
5. at the ends of existing channel improvements;
6. whenever needed to prevent the subwatershed flood plain
from becoming too big geographically to be reasonably
considered as a small homogeneous unit.
If Program III is being used for the analysis, a maximum of 15 sub
wa tersheds may be used, and they must be arranged in a single line
and numbered consecutively downstream. Program II can analyze
as many as 25 subwa tersheds along channels of any complex
arrangement.
The total planning period is next divided into shorter time
- 35 -

periods called planning stages. By examining immediate needs
through relatively short planning stages, project justification is no
longer dependent on economic and demographic projections applying
to the distant future, and revised projections can be used to bring
the flood control plan up to date before determining what measures
to take at the beginning of each subsequent stage. If the economic
and demographic projections show the economy and population to be
static, a single stage analysis is all that is needed. Ten-year plan
ning stages work well for growing communities.
ALTERNATIVE METHODS OF ANALYSIS
The traditional flood planning approach has been to determine
the least cost combination of structural measures. However, since
this approach ignores nonstructural measures, it does not meet the
requirements of Executive Order 11296. Agency experience has shown
planning structural measures to be a very time consuming process.
Others have demonstrated the inadequacy of plans that ignore
nonstructural measures. Inclusion of nonstructural measures into
the economic optimization promises to make manual (slide rules or
desk calculators) analysis hopelessly long and involved.
The tremendous speed with which digital computers perform
repetitive computations appears to make their use a promising solu
tion to this time problem. Furthermore, use of the computer for
- 36 -

routine work frees the engineers to devote more time to collecting
more reliable data and to comparing a larger number of measure
combinations.
The data required by the computer programs presented in this
report are roughly those already gathered by planning agencies
except for the additional data required to evaluate nonstructural
measures and for stage construction analysis. It will, however,
be necessary for agencies to begin collecting data to evaluate non
structural measures in order to comply with Executive Order 11296,
whether the analysis is to be by computer or not. The time and
effort spent in making the intermediate projections (USUBW, UTOTR,
and VALUE) for stage by stage analysis will be recouped many fold
due to the more economically efficient plans implemented. If the
planning agency elects not to consider stage construction, the
Program options can be used to prevent consideration of more than
one planning stage, and the intermediate projections will not be
necessary.
It is not necessary for everyone involved in input data
development and output interpretation to be familiar with all the
theory and programming involved in the analysis. Consequently,
relatively short training programs will be sufficient for a large
part of the planning staff.
- 37 -

However, individual planning agencies may find it desirable
to revise some of the programming to conform to their own policy and
design standards. This can be accomplished by making minor
changes in the Planning Programs. Agencies desiring greater accuracy
in the estimating procedure than is currently provided could refine or
add new features to the Programs and the data collection process to
attain the desired degree of accuracy.
The Flood Control Planning Programs are designed strictly for
planning, not for final design of water resource projects. The Programs
determine what measures should be installed, the degree of protection
to be provided by each measure, and the optimum project timing.
Final design of the selected flood control measures is still required.
The data should be revised and the Program rerun where final cost
estimates vary substantially from planning estimates.
PLANNING SITUATIONS
Every flood problem encountered by a planning agency is
different. The method for collecting data and applying the two
Programs must be varied accordingly. To guide potential users
in how to deal with different flood situations efficiently, several
cases are given here along with a suggested technique for deter
mining the optimum planning policy using the University of
Kentucky Flood Control Planning Programs.
- 38 -

CASE 1: SPOT ANALYSIS
The simplest planning application is probably one that applies
to one small area. For example, a local channel capacity restriction
might cause local flooding, or a city zoning board may need to know
whether or not flood plain zoning should be made applicable to a
newly annexed section of the city. In such cases as these, where
reservoir storage is certainly not feasible, Program II should be used
for one subwatershed (MW= l) and probably for one planning stage
(NSTEMX = 1). Data for the local area should be developed and
supplied as described in Chapter IV.
CASE 2: MAIN STREAM ANALYSIS
Another situation might be one in which all the flood damage
of any significance occurs in the flood plain along the main channel,
the tributaries posing no particular damage threat. For such a main
stream analysis the planner should utilize Program III. If there is
a feasible reservoir site upstream from the flood area, the data for
this site and for the flood plain subwatersheds through the down
stream end of the flood problem area should be developed and used.
If no feasible reservoir site is available, fictitious reservoir data
might be supplied for a hypothetical site upstream from the problem
area along with the other data required for all the subwatersheds
within the flood problem area being analyzed. The fictitious
- 39 -

reservoir may be eliminated from consideration by the NODAM option
described in Chapter IV.
It should probably be noted here that "main channel" as far as
the analysis by Program III is concerned is not necessarily the
largest channel, nor does "tributary" necessarily refer to a small
stream flowing into a larger one, For example, no potential reser
voir site may be available on a relatively large river, while a very
good site might exist on a smaller creek. In such a case, the "main
channel" analyzed by Program III would be the creek from the proposed
dam site down to the confluence with the river and the river from
this point downstream through the problem area. The "tributary"
area would include that drained by the river upstream from the
confluence.
CASE 3: MAIN STREAM ANALYSIS WITH SEVERAL RESERVOIR SITES
If the flood problem is like the one just described in that it is
confined to the main channel flood plain but differs in that more
than one potential reservoir site exists on the main channel,
Program III should be used. as described in the previous case,
once for each feasible reservoir site. The results may then be
compared to find the combination of reservoir and other measures
having the smallest total cost.
- 40 -

L
CASE 4: TRIBUTARY FLOODING WITH NO RESERVOIR SITES
In cases where flooding is prevalent along a number of confluent
streams rather than just along the main channel, and where no poten
tial reservoir sites are available, a single application of Program II
will suggest the optimum flood control plan.
CASE 5: TRIBUTARY FLOODING WITH ONE RESERVOIR SITE
The flood damage may occur along several confluent streams,
but there may be only one potentially feasible dam and reservoir site.
Since neither Program will solve this problem alone, both Programs
must be applied in a coordinated manner. Program II should be applied
first for the entire problem area. The measures found optimum by
this analysis would apply to all the subwatersheds upstream from
the reservoir site or tributary to the main channel downstream from
the reservoir site. After incorporating any channel improvement found
optimum by Program II into the total channelization data (CTOTR),
Program III may then be used to determine whether the potential
reservoir is justified and, if it is, the optimum measures to be
implemented along the main line channel downstream from the dam
site.
CASE 6: RESERVOIR SITES ON A NUMBER OF TRIBUTARIES
If the flood problem under study is not entirely along the main
channel and if there are several potential reservoir sites available,
- 41 -

application of the Programs becomes more complex. Program II may
still be initially used for an analysis of the entire problem area.
Program III may then be applied to each potential reservoir site
assuming no other site is utilized. Those sites not justified are
dropped from the analysis, and the reservoirs that are found feasible
are listed in order of decreasing net benefit (effected reduction in
downstream cost net of incremental reservoir cost for flood control).
Any reservoir in this list would be justified if installed inde
pendently of the others, but it is unlikely that installation of all
the listed reservoirs could be justified without double counting the
benefits. The next step, then, is to determine the best combination
of these independently justified sites. The first site to be selected
should be that producing the highest benefit. Program III should
then be successively applied to the other reservoir sites on the
list, beginning with the reservoir having the second highest net
benefit, and assuming the reservoirs higher on the list to be in
place. For example, the first of these runs would be based on the
second best reservoir site with the reservoir having the highest net
benefit assumed in place. If this second reservoir proved economi
cal, the second run with Program III would be based on the third
best reservoir site with the two best reservoirs being assumed in
place. This process would continue until the next reservoir on the
- 42 -

L
list could not be justified. Any previously untried combination of
reservoirs that looks particularly promising should also be tried and
should be selected if it reduces the total cost of the previously
selected optimum combination. Once the optimum combination of
reservoirs has been selected, the optimum downstream measures
may be determined by the methodology of Case 8.
By efficient operation during floods, reservoir outflow can be
reduced to very low values when runoff from subwatersheds down
stream is at its peak. Consequently, for the purpose of applying
the Programs, assuming a justified reservoir to be in place is
accomplished by reducing the area contributing to the flooding in
each subwatershed by the tributary area upstream from the "in place"
reservoir. Where gating is not used to make flood storage so
effective, the reduction in the tributary area should be an appropriate
fraction as hydrologically determined.
CASE 7: A NEW RESERVOIR TO SUPPLEMENT AN EXISTING RESERVOIR
If the flooding is along a single stream having one or more
existing reservoirs on its tributary streams, Program III should be
used. Again, the existing reservoirs are accounted for by
deducting all or part of the drainage area the reservoirs control
from the area of the subwa tershed in which they are located.
- 43 -

CASE 8: FLOOD PLAIN ANALYSIS DOWNSTREAM FROM EXISTING
RESERVOIRS
The final case is that of seeking the optimum combination of
local measures to complement an existing group of upstream reser
voirs. The best approach is probably to first apply Program II,
deducting all or an appropriate part of the drainage area controlled
by each existing dam and reservoir. The measures found economical
in this analysis are applied to the tributaries not downstream from
any storage reservoir. Then, for the main channel downstream from
each reservoir, Program III should be used, the dam and reservoir
data supplied being that for the existing facilities. Mainline
analysis downstream from the smaller reservoirs should be discon
tinued at the point where a junction occurs with a stream more
effectively controlled by another larger reservoir. The minimum
reservoir design flood (MRDF) used in the Program III analysis
should be the flood frequency requiring the design flood storage
pool (FLDS TR) in the existing reservoir.
VARYING CONTROLS
By making minor changes in the input data, users of the Flood
Control Planning Programs can incorporate a great deal of variation
into the analysis. For example, the program control parameters
specify which alternative measures should be considered in the
- 44 -

analysis; and the value assigned to LINING determines what types
of channel improvement will be considered.
It is suggested that for the first analysis the planner use the
input data he feels best describe the existing situation and the
measures most likely to prove economical. In subsequent runs,
the data can be varied to test the sensitivity of the output to
variations in the input so that the data having the most significant
effect on the optimum plan can be reviewed and revised as needed.
The planner should, of course, avoid wasting computer time on
consideration of impractical measures. For example, if all the
damage is to agricultural crops, flood proofing should certainly be
omitted from the analysis.
The very low cost of repeating the computations with different
input data makes the Planning Programs valuable tools for testing
different design standards. For example, an agency should
consider in its review of a policy on the maximum allowable
tractive force used in channel design by soil type the effect of
alternative choices on the cost and nature of the optimum combina
tion of measures.
An agency that does not currently employ some of the available
options might run the Programs, first without, then with, the
particular option included in the analysis. Comparison of the
- 45 -
costs would aid agency evaluation of current planning practices, A
prime example of this use of the Programs is the question of stage
construction. It is suggested that the Program applicable to the
patticular situation being analyzed be run first for a single stage
whose duration is that of the entire planning period (NSTEMX = l and
TIME = TIMST), The same analysis should then be run with stage
construction made available (NSTEMX planning stages, each of dura
tion TIME = TIMST I NSTEMX). Cost comparison of the two optimum
plans devised will show whether or not stage construction should be
employed.
LIMITATIONS
The University of Kentucky Flood Control Planning Programs
are by no means capable of analyzing all potential measures in all
possible flood damage situations, As does any newly developed
procedure, this innovation has limitations and weaknesses, many
of which will be overcome by future research.
Although the Programs may be applied to channels and flood
problems of any magnitude, they provide the greatest savings in
computational time for flood problems on smaller channels where
the flood plain is not yet urban but is expected to develop rapidly
during the planning period. Such a situation reaps the full benefits
of the stage cons true lion and dynamic analysis offered by the Programs.
- 46 -
The method proposed to account for existing reservoirs (deducting
all or part of the area they control) and the failure to account for flood
routing interaction among reservoirs make the analysis an approximate
one for multi-reservoir systems. More sophisticated combined routing
procedures need to be developed.
The construction of levees is not included in the analysis.
Neither is detention storage other than that to be provided by earth
dams with an open channel emergency spillway and conduit principal
spillway. The handling of gate opening and closing in the Program is
rather crude, the only information used being the number of hours that
the reservoir release is held at a constant low value after the storm
begins. The optimum operating policy would incorporate a more
sophisticated procedure for opening and closing gates according to
whether flood damages are minimized by increasing reservoir releases
to provide more storage for an impending flood or reducing releases
to reduce current damage. Such an operating policy optimization
may ultimately be incorporated into the Planning Programs.
As more experience is gained in using the Programs. and as
more physical and cost data become available, particularly for
nonstructural measures, the optimizing equations and also the
input data can be made more accurate. This increased accuracy
in input and programming will naturally result in more refined
- 47 -

selection of the optimum damage abatement measures.
Benefits as well as adverse project consequences that are
not related to flood control must be evaluated outside the computer
program. Only flood control benefits are taken into account by
Program III in its economic justification of a reservoir.
Finally, at this time, the right-of-way holding option is
available only for right-of-way for channel improvements. Inclusion
of a similar option for acquiring right-of-way for future reservoir
sites is another potential improvement.
- 48 -

Chapter N
DEVELOPMENT OF INPUT DATA
INTRODUCTION
The policy selected by any optimization procedure is a
product of the input data. The more reliable the data, the greater
confidence one can have in the results. The central purpose of
this chapter is to describe the data collection procedures required
to insure dependable results from both Programs.
As a practical matter, use of the Programs is going to depend
on the ability of potential users to develop the required input infor
mation from readily available sources without spending an unreason
able amount of time and effort. Most of the required data is
currently collected by Federal agencies analyzing alternative
combinations of structural measures for flood control. Even with
the extra data collected to comply with Executive Order 11296,
the much faster computational process realized from computer
analysis will speed total planning time many fold.
The data development process may be best described through
an example. Other studies have described application of the programs
to expanding urban areas (13, 4) and to farming areas (38). The
different environment selected for this study was a narrow flood-prone

Appalachian Valley. A location whose flood problem had been studied
by a Federal agency was thought to be advantageous because the
derived flood control plan would provide an independent check for
the results of this study. Finally, a sita where reservoir storage
provided reasonable promise of proving economical was needed to
test Program III.
THE STUDY AREA
One area which meets these criteria quite well is located along
the upper reaches of the North Fork of the Kentucky River in Breathitt,
Knott, Letcher, and Perry Counties near Hazard, Kentucky (Fig. 1).
The study area was more precisely defined as the flood plain of the
North Fork of the Kentucky River upstream from the mouth of Trouble
some Creek in Breathitt County to the proposed Kingdom Come Dam
Site in Letcher County plus the flood plain of Carr Fork upstream to
the dam currently under construction by the U. S. Army Corps of Engi
neers in Knott County (Fig. 2). The problem comes under Case 6 of
Chapter III as three reservoir sites on two s trea.ms were selected for
analysis; however, no tributary flooding other than that on the two
mainline streams was considered. The third dam site studied was
at Cornettsville on the North Fork of the Kentucky River.
The total study area was divided into twelve subwatersheds
(outlined on Fig. 2) following the criteria presented in Chapter III.
- 50 -
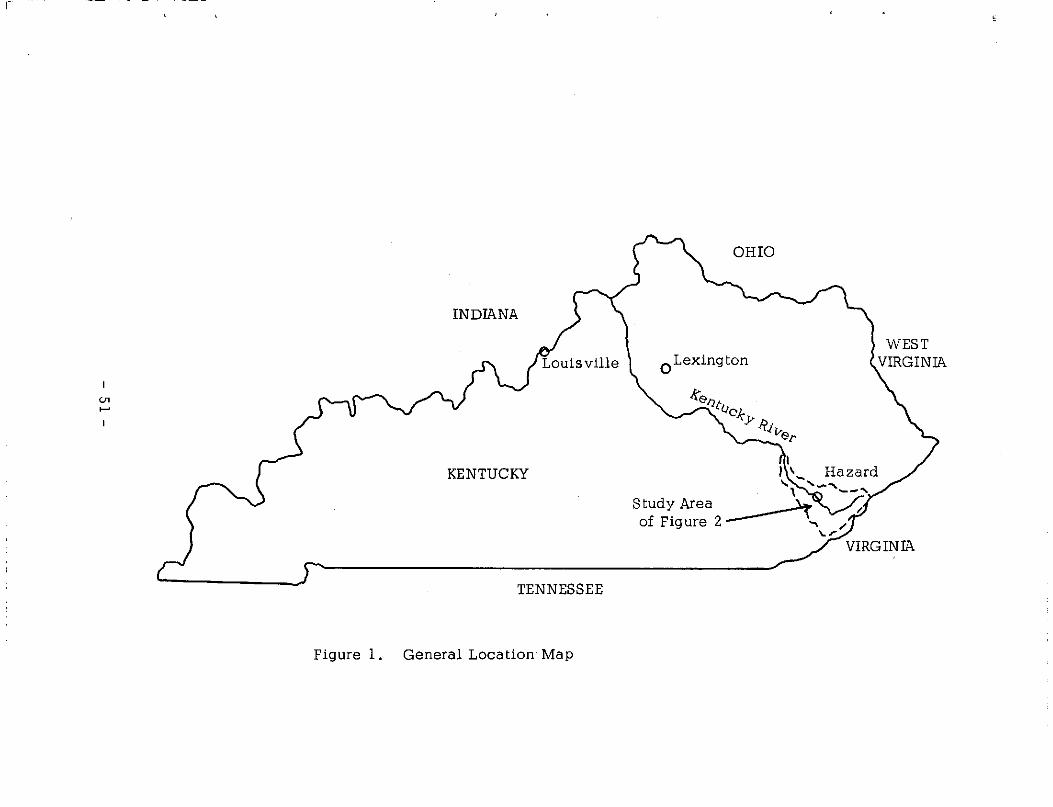
1-
c.n ......
INDIANA
KENTUCKY
TENNESSEE
Figure 1. General Location Map
OHIO
01exington
f:el)t/.Jc1-".v b.
'•./i,er
Study Area of Figure 2-
WEST

Scale Hazard
l" =< 8 Miles
Figure 2. Specific Location Map
- 52 -
Legend
Subwatershed Boundary
Kentucky River

Of the total, nine (4, 5, 6, combined 1-3 and 7, 8, 9, 10, 11, and
12) applied to the Carr Fork Dam site, nine (1, 2, 3, combined 4-7,
8, 9, 10, 11, and 12) applied to the Kingdom Come Dam site, and
eight (combined 1-2, 3, combined 4-7, 8, 9, 10, 11, and 12)
applied to the Cornetts ville Dam site.
A comprehensive study of flood plain development and flood
losses along the Kentucky River was begun in 1955 by the Corps of
Engineers. Extensive damage surveys were also taken in the area
following the floods of 1957 and 1963 (27, pp. 72-73). The severity
of the flood problem at Hazard is demonstrated by the storm of
1957, when the river rose almost 30 feet between midnight and
6:00 P.M. on January 29. The flood crest of 37.5 feet was nearly
20 feet above flood stage. Damage in the Hazard area alone was
estimated at $6,813 ,000 (21, p. 80}.
The dam site is some 8. 8 miles upstream from the confluence
of Carr Fork with the North Fork of the Kentucky River. A flood
control reservoir was economically justified at this site in the
study by the Corps of Engineers. The majority of the flood damage
reduction benefits are expected to accrue in Hazard. The drainage
area tributary to the reservoir site is 58 square miles out of the
466 square miles upstream from Hazard. It is estimated that Carr
Fork Reservoir would have reduced the 1957 flood peak at Hazard
by three feet (29).
- 53 -

The tributary watershed is covered by U. S. Geological Survey
7. 5 minute topographical maps which were very helpful in developing
much of the data. The reservoir site and the downstream flood plain
are also included in the "Reconnaissance Soil Survey; Fourteen
Counties in Eastern Kentucky" (20). Agricultural data, population
trends and other pertinent information were readily available.
The entire drainage area involved is in the mountains of
eastern Kentucky, on the western margin of the Appalachian Plateau.
The physiography is characteristically made up of sharp-crested ridges,
separated by deep narrow valleys. The land use distribution is as
follows: 5.5% cropland, 3.2% pasture, 81.0% forest, 0.3% Federal
land, 1. 7% urban and other built-up areas, and 8. 3% idle land (20,
p. 2).
The economy of the area has been centered around the mining
of soft coal. Forest products, farming, and a small amount of light
industry supplement the economic base. Due to mechanization of
mining and agriculture, unemployment is rising. As a result, the
population is decreasing. For example, in Perry County, where
most of the study area is located, the population decreased from
4 7, 828 in 1940 to 46, 566 in 1950 and further to 34, 961 in 1960 (12).
The Corps of Engineers states that people are leaving their mountains
and remote hollow homes and are moving into the flood plains along
- 54 -

the larger streams (2 7, pp. 7 8-7 9) . However, even the population of
Hazard, the chief urban center of the area, has dropped from 7 ,397
in 1940 to 6,985 in 1950 and further to 5,958 in 1960 (33).
Much of the population is scattered over the ridges, valleys,
and hollows and into remote areas having very limited access.
School facilities are inadequate, with many one- and two-room
schools still in operation because of the difficulty in running busses
over many rural mountain roads. Less than 36 percent of the children
entering the first grade finish high school. In 1958, there was about
one doctor for each 2, 000 people (20, p. 3).
The steepness of the mountain ridges has forced nearly all
intensive agricultural and urban development into the only level land,
the flood plains adjacent to the rivers. Most of the existing commer
cial and industrial development is in the flood plain and is subject
to severe and frequent flooding. While the local people have learned
to adjust to this problem, the absence of level flood free land is a
major deterrent to new economic development. As a result, potential
flood benefits, both from reducing direct damages and from land
enhancement, are very high. High unemployment rates and low
income levels also provide a large potential for local secondary
and income redistribution (23) benefits.
However, the concentration of population and transportation
- 55 -

arteries in the valleys also causes a very high cost for reservoir
storage. Major railway and highway routes would have to be
relocated. The large nurmer of people living along the river would be
forced to move at a high social cost (11). Many potential reservoir
sites contain large underground coal reserves. Thus the cost of
reservoir storage is also very high.
The size of the river and the high cost of right-of-way along
its banks also make channel improvement very costly. Land use
control is not effective in preventing existing damage to a community
of decreasing population. Flood proofing, however, is already
employed informally and could potentially effect substantially more
flood damage reduction.
Agriculture within the flood plain has also adjusted to the flood
threat. Farm houses are most often found on the outer edge of the flat
area on higher ground in poorer soil. The higher valued crops are
grown at lower elevations on better soil but high enough to be free
of frequent flooding. Much of the best soil is in areas of highest
flood hazard and is inundated too frequently to realize its full
agricultural potential.
THE DATA COLLECTION PROCESS
A complete set of inpµt data for both University of Kentucky
Flood Control Planning Programs was developed for the North Fork of
- 56 -
the Kentucky River Flood Plain and the Carr Fork Reservoir site.
The data for Program II is listed in Appendix C and that for Program
III is listed in Appendix D. Description of the data compilation will
be handled by presenting each input variable in the order it is read.
Discussion of each variable will include the physical significance
of the variable, how numerical values may be obtained, and how
the values read are used by the computer programs.
PROGRAM CONTROL PARAMETERS
Each flood hazard area has its own peculiar characteristics.
For this reason, the Programs were made flexible so that a wide
variety of situations could be handled without changing the program-
ming (Chapter III). The program control parameters help provide this
flexibility by specifying the inclusion or exclusion of any of the
damage abatement: measures. They also control the amount of output
printed according to the needs of the planner.
1 Ll, B : If this variable is read as integer 1 the damage attributable
to the uncertainty of flood occurrence is calculated by eq. 2 and
1Notation: "2" indicates variable is used in Program II (Appendix C). "3" indicates variable is used in Program III (Appendix D). "B" indicates variable is used in both Program II and
Program III (Both Appendices).
- 57 -

added to the average annual flood damage. If the input data for 11
is integer O, uncertainty damages are ignored.
12, B: If this variable is read as integer l, the Programs evaluate
flood proofing. If the value is read as integer O, flood proofing is not
considered.
13, B: If this variable is read as integer 1, the Programs evaluate
land use measures. An integer O value causes the Programs to omit
land use measures from the analysis.
14, B: If this variable is read as integer 1, the Programs consider
channel improvement in the overall flood damage abatement plan.
An integer O value eliminates channel improvement from consideration.
LS, B: The analysis of the optimum flood control program for each
subwatershed-stage considers up to ten alternative levels of protec
tion against floods by each individual structural and nonstructural
measure and also examines various combinations of these measures.
If the user assigns integer 1 to this variable, the Programs state
which measures are being considered each time a new combination
of channel improvement (S), flood proofing (P), and land use adjust
ment (L) is tried in the subwatershed-stage. The results provide
some idea as to the value of each of the three measures because
- 58 -

measures that are almost justified will be tried at many alternative
levels in the hope some level will be accepted while measures whose
cost is way out of line will be dismissed after the first trial.
L6, B: The Programs analyze a subwatershed-stage by first estimating
the annual flood damage if no measures at all are implemented and
then trying various measure combinations in a search for the least
expensive. This option causes the Programs to print each new
combination of measures having a smaller total cost than any group
of measures tried previously in the subwatershed-stage. An example
of this output is shown in Chapter V. Reading an integer O will
cause only the finally selected optimum consideration to be printed.
L 7, B: If the user desires the Programs to consider purcl,asing right
of-way for channel construction in stages before it is actually
required, he should assign an integer 1 to this variable. The
Programs determine and write out whether or not the extra land
should be obtained and if so, the optimum number of acres to be
acquired and the number of years the land should be held if it is
not subsequently used. An integer O value assigned to L7 eliminates
consideration of holding extra right-of-way from the analysis.
LS, 3: The major difference between Planning Programs II and III
is that Program III considers reservoir storage as one flood control
- 59 -
alternative. If 18 is read integer 1, the Program will print a number
of additional structural details describing each dam analyzed.
Tables summarizing these details are shown in Chapter V. An integer
O value instructs the Program not to write this information.
19, 3: When Program III is determining reservoir feasibility, the
procedure is to first route a series of flood hydrographs defined by
frequency through the downstream subwatersheds. Then the floods
are routed through the reservoir, and the less severe outflow hydro
graph is then routed through the downstream subwatersheds. The
difference between the cost of the optimum combination of downstream
measures associated with the natural floods and that with the floods
as reduced by the reservoir storage is the benefit attributable to the
dam and reservoir. An integer 1 value assigned to 19 causes the
Program to print hydrograph formulation parameters, reservoir routing
details, and downstream flood hydrographs as shown in Chapter V.
If an integer O is supplied, these details are not included in the output.
110, 3: Inspection of the listings of Program III (38) will reveal
that it is comprised of a "main" or central control program and
several subroµtines. Each subroutine has a specific function and
may be called to perform that function many times. If the user
feels that it would be helpful in reviewing the output to be able to
- 60 -

determine where each subroutine was called, he should assign an
integer 1 to this variable. The Program will then print a statement
each time execution passes from one subroutine to another telling
which subroutine is involved and whether it is being entered or left.
An example can be seen in Chapter V. If LIO is made integer O,
subroutine entry and exit is not included in the output.
Lll, 3: Even though Program III is designed to consider construction
of a dam and reservoir, the user may want a run where the downstream
flood situation is evaluated without any upstream storage effects.
Such output is obtained by assigning an integer O to Lll. The Program
will then determine the optimum combination of measures specified
by Program control parameters LZ, L3, and L4 for each subwatershed
stage. If integer 1 is supplied for Lll, a flood control reservoir
will be considered in the analysis.
NSTEMX, B: To the variable NSTEMX, the user assigns the number
of planning stages to be used. The Program determines the optimum
mix of measures to be implemented at the present and at the beginning
of each subsequent stage. The Program uses NSTEMX primarily as
a loop index to determine how much input data should be read and
how many times the Program should proceed through the stage
analysis loop. The Program can handle as many as five planning stages.
- 61 -
MW, B: For MW, the user supplies the number of subwa tersheds into
which he has divided the flood plain. The Programs use the value
to determine how many times to go through the subwatershed flood
measure optimization computations. Each subwatershed must be
assigned a higher number than any subwatershed upstream from it.
Subwatershed 1 for Program III is the area tributary to the reservoir
site.
PHYSICAL CHARACTERISTICS OF DRAINAGE AREA AND CHANNELS
Each drainage basin has its own unique physical configuration
of subwatersheds of varying sizes, shapes, and arrangement.
Particularly important, due to their effect on the flood hydrology,
are the size and shape of the drainage areas and the length, arrange-
ment, and state of improvement of the channels.
1 AW(MW) , B: The analysis of flood hydrology requires subdividing
the total flood plain into reasonably homogeneous segments. The
drainage area in square miles contributing to the flood peak to be
estimated from the subscripted subwatershed area is read into this
array. In Program II, all tributary upstream area is included
because each flood peak by frequency is developed without routing.
1 Value(s) in parentheses is(are) variable dimensions. Variable names not followed by parentheses are single-value variables.
- 62 -

In Program III, only the tributary area added between the upstream and
the downstream end of the subwatershed is included because the
added area is needed to develop the local inflow hydrograph to add
to the main line hydrograph routed downstream through the subwater
shed. Drainage areas are measured from watershed boundaries plotted
on topographic maps. The areas are used in Program II for estimating
flood peaks and in Program III for estimating flood peaks, flood
volumes, and the time to flood peak; all intermediate steps in
developing the flood hydrogra ph.
INDEX (2, MW), 2: Program II is designed to handle complex channel
arrangements having flood plains on two or more confluent branches.
The arrangement applying to a particular study area must be read by
the program. This array acts as an "index" to the upcoming array
ID. The first row of values in INDEX gives the first and the second
row gives the last locations in array ID containing numbers of the
subwatersheds that are located downstream from the subwatershed
specified by the column. Array ID should first be developed from
the subwatershed arrangement. INDEX values can then be determined
by noting which values in ID apply to each subwatershed. Zeroes
are used for the most downstream subwatershed to indicate that
there are no subwatersheds further downstream.
- 63 -

NID, 2: This variable specifies the ntmber of elements in array ID.
The program uses NID to determine the number of ID values to read.
ID(NID), 2: Into this array is read the identifying numbers of all the
subwatersheds downstream from each of the MVv subwa tersheds.
There is no data for the last subwatershed because no subwatersheds
are further downstream. The program uses these values to determine
which downstream subwatersheds are hydrologically affected by
channel improvement in an upstream watershed as the first step in
estimating the cost of contending with the resulting increase in flood
peaks.
LC(MW), B: Each subwatershed contains watercourses through which
the flood flows travel and which can be improved to reduce flood
damages. In Program II, the length of channel within the subwatershed
along which channel improvement is to be considered is read into
this array. In Program III, no channel improvement is considered
upstream from the reservoir site and only channel improvement on
the mainline stream is considered downstream. Thus in Program III,
the data read is the length of the mainline stream through the subwater
shed. In both cases, the length should be measured along the route
any channel improvement would be expected to follow, thus elimi
nating major meanders. Lengths in miles may be measured once
- 64 -

i L
the channel alignments have been plotted on a project map. In both
programs, this array is used to estimate the length of channel and thus
indirectly the cost of channel improvement.
TCL(MW), B: Upstream channel improvement increases downstream
flood peaks by creating a more rapid concentration of flows. The
Programs estimate the magnitude of this effect from the fraction of
the tributary channels which are improved. For any given subwater-
shed, the fraction equals the length of tributary improved channels
divided by the length of all tributary channels. This array provides
the stream length in miles for the denominator of the fraction for the
subscripted subwatershed. In Program II, all upstream channels are
included. In Program III, only channels within the area tributary to
the mainline stream between the upstream and downstream encl of the
subscripted subwatershed are needed to develop the local inflow
h ydrogra ph.
All channels draining a tributary area greater than one square
mile were counted in evaluating the fraction. A piece of paper
having an area of one square mile to the scale of the topographic
map was cut and used as a standard for estimating the point where
channel tributary area reached this size. A map measurer was then
used to determine downstream channel lengths.
- 65 -

The channelization fractions calculated using the data in this
array are used in both programs for estimating the channel induced
increase in flood peaks and in Program III for also estimating the
increase in flood volumes and the reduction in time to peak.
SIC(MW), B: In some cases channel improvement will have been
completed prior to the beginning of the period of analysis within the
computer program. The data read into this array provide the length
in miles of array LC(MW) which has already been improved, Normally
the value will either be zero or equal to LC(MW) but may be some
intermediate value if subwatershed boundaries were not placed at
breaks between improved and natural channels. The existence
and limits of channel improvement can be determined by field
inspection, and detailed plans can usually be obtained from the
constructing agency. The program increases the values in SIC(MW)
as new channel improvement is found economical in one stage
before preceding to analyze a subsequent stage. Values of SIC (MW)
are used in estimating the channelization fraction for hydrologic
analysis as well as in determining whether right-of-way has already
been purchased.
TIC(MW), 2: TIC represents the cumulative improved channel
lengths, or the total length of improved channels tributary to the
- 66 -

downstream end of each subwatershed at the beginning of the first
planning stage. The values are obtained by summing the improved
channel lengths upstream from the successive subwatersheds. The
program divides cumulative improved channel length by cumulative
total channel length to arrive at a value for channelization of the
total tributary area.
CTOTR(NW-1,NSTEMX), 3: The channelization fraction for Program
III depends not only on mainstream channelization but also on
channel improvement on the tributary streams. The program has
already read the length of any initial mainline channel improvements
(SIC). So that the program can know the overall degree of channeliza
tion for establishing local inflow hydrographs, it also needs the
lengths of improvements by stage within the subscripted subwatershed
but not on the main stream. The lengths of existing improved channels
may be determined by field inspection of the watershed and read into
the first column of the array. The lengths of expected future channel
improvements should be determined by economic analysis of the
flood hazard in the tributary area. Application of Program II to the
area is recommended for this purpose.
HYDROLOGY
The magnitude of a flood peak of specified frequency expected
- 67 -

within a particular watershed depends on the precipitation patterns
experienced, the interaction of the precipitation with the watershed
surface, and the speed with which the runoff is able to flow down
stream. Flood control measures have relatively little effect on
precipitation, but urban development increases runoff and channel
improvement accelerates flow concentration. A comprehensive flood
planning program must incorporate changes in flood peak with time,
caused by urbanization, into its dynamic analysis and consider the
effects of upstream channel improvement on downstream flood damage.
The analysis begins with the flood peak, flood volume, and
time to peak expected from a one square mile watershed containing
no urban development or channel improvements and experiencing
(1) a mean annual flood and (2) a 2 00-year flood. Use of this single
set of five base values (time to peak is assumed independent of
frequency) implies relatively homogeneous basin shape, soil cover,
and soil conditions for basins of a given size within the study area.
Where such conditions are known to vary drastically, the Programs
should be individually applied to the separate hydrologic regimes.
Correction arrays are provided to adjust the five basic values
according to drainage area, urban development in the tributary area,
and improvement of tributary channels.
The development of the hydrologic data has been based on use
- 68 -

l
of the Stanford Watershed Model (3) to study the hydrologic effects
of urbanization and channelization in different locales (4). Although
a lot of work goes into deriving the urbanization and channelization
arrays, they can be used verbatum over a wide area having similar
climatic patterns.
Flood Peaks: The maximum water surface elevation and thus the maxi
mum depth of flooding and area inundated occurs at the flood peak.
In Program II, flood peak is calculated directly as a function of
frequency, drainage area, urbanization, and channelization, thus
the balance of the data described in this section is not needed. In
Program III, flood peaks are one item of data required to develop a
local flood hydrograph:for combining and routing downstream to deter
mine the main line flood peak. The Programs assume the peaks follow
a Gumbel extreme value distribution to interpolate peaks for flood
frequencies for which values are not directly calculated. The mean
annual and ZOO-year flood peaks are always directly calculated, and
the flood peak for the reservoir design frequency is also calculated
where it is not one of the above two values.
QB43, B: This variable provides the basic flood peak for the mean
annual flood from a one-square-mile area containing no urbanization
or channelization. It is corrected to the mean annual flood peak for
- 69 -

a watershed of known area, urbanization, and channelization by
multiplying by the product of the drainage area, an urbanization and
channelization factor interpolated from array Q43, and an area factor
interpolated from array AFCTR.
The value of QB43 should be developed from a regional plot of
mean annual flood peak against drainage area based on available
s treamflow records. The ordinate of the curve at 1. 0 square mile is
QB43. McCabe (19, p. 10, Fig. 1) has developed relationships
between mean annual flood peak and drainage area for various regions
of Kentucky. The study area falls in Region 2 (19, p. 21). Assuming
that Curve 2 on Fig. 1 represents an area having zero channelization
and urbanization, which is very nearly the case, a value for QB43
of 177 cfs is read at a drainage area of one square mile.
QBOS, B: QBOS is the flood peak discharge from one square mile
with no urbanization or channelization for the 200-year flood
frequency. It may be read from a regional plot of 200-year flood
peak versus drainage area or obtained by adjusting QB43 by an
appropriate ratio (18, p. 264). McCabe does not plot discharge
against drainage area for this frequency but does for the 25- and
SO-year return periods (19, p. 29:;, Fig. 13). These two curves
provided the 25- and SO-year flood peaks from one square mile.
Since flood peaks are assumed within the Programs to follow a
- 70 -
Gumbel distribution, the 25- and SO-year peak discharges were
plotted against frequency on Gumbel probability paper. The line
was extended and a peak discharge for the 200-year return period
(QB05) of 550 cfs was read.
Q43 (11, 11), B: The ratios of mean annual flood peaks from a given
drainage area for various degrees of urbanization and channelization
to the flood peaks from the same area with no urbanization or
channelization are read into this array. One ratio is required for
each combination of urbanization and channelization fractions
ranging from 0,0 to 1.0 in increments of one tenth. The program
uses double interpolation to establish the proper multiple of QB43
to correct for urbanization and channel improvement. Dempsey (4)
developed the array used for analyzing the Hazard flood plain based
on the relationship between urbanization and channelization and
input parameters to the Stanford Watershed Model determined from
historical runoff trends in an urbanizing area just sou th of Louisville.
Q05{11,ll), B: Array QOS is analogous to array Q43, but it
applies to the 200-year instead of the mean annual flood. Generally
speaking, multiples are smaller for larger floods where moisture
tosses are a relatively smaller fraction of total rainfall. Dempsey's
analysis for Louisville also established these values.
- 71 -

AFCTR(3, 11), B: The flood peaks are corrected for the variation of
the actual drainage area from one square mile by multiplication by
two quantities. The first is the drainage area in square miles; the
second is AFCTR.
The peak discharge from a 100-square-mile drainage area is
less than 100 times the discharge from a one-square-mile area. In
other words, the larger the drainage area, the less the flow generated
per square mile (measured in cubic feet per second per square mile,
or csm). AFCTR values are the ratios of csm from a given drainage
area to csm from one square mile. AFC TR is a three by eleven array.
The first row con ta ins eleven drainage areas, the second row
contains the csm ratios for the mean annual flood for the drainage
area in the corresponding column, and the third row contains the
same ratio for the 200-year flood.
The data contained in the AFCTR array should essentially
describe the curve of flood peak in csm versus drainage area
characteristic of the drainage basin under analysis. A curve
plotting as a straight line on semilog paper (logarithm scale on
the area axis) can be adequately described by two points. A curved
line can be represented by as many as eleven points taken at
breaks or changes in direction of curvature"
McCabe's curves for the region containing the upper reaches
- 72 -

of the Kentucky River plot as a straight line on semilog paper and
thus can be defined by two points. The second set of values is
repeated nine times in Program III to fill the array dimension require
ment. A third set of values to provide for larger drainage areas
was used in Program II.
The first of the AFCTR sets selected is for a drainage area
of one square mile, both the mean annual and the 200-year ratio
being 1. 0. The second point should represent an area larger than
the largest subwatershed being analyzed so that the program can
interpolate between the two points. For the 400 square miles
selected for the Kentucky River study, the mean annual discharge is
15,800 cfs (19, p. 10, Fig. 1). From each square mile the flow is
15,800/400 = 39.50 csm. The mean annual flow from one square
mile (QB43) is 177 cfs. Hence the mean annual AFCTR ratio is
39.50/177 = 0.223. Since McCabe gives no information for the
200-year flood, the 50-year value was computed by the same
procedure as was used for the mean annual ratio, the csm value
being 3 8, 500 cfs/400 square miles = 96. 25, and the AFCTR ratio
being 96.25/437 = 0.220. Since previous studies (13, p. 77) have
shown the factor for the 50-year flood to nearly equal that for the
200-year flood, 0.220 was used for the 200-year AFCTR.
Flood Volumes: Because a complete hydrograph rather than a flood
- 73 -

peak alone is needed for "with and without" routing to determine the
effectiveness of reservoir storage, Program III contains a subroutine
which generates hydrographs from flood peaks, flood volumes, times
to flood peak, and typical hydrograph shapes (38, Subroutine RSHYDR).
The data used to estimate an appropriate flood volume for a particular
drainage area are analogous in format and physical significance to
the flood peak data. Program III uses the data to evaluate an appropri
ate flood volume for any desired combination of frequency, drainage
are9 , urbanization, and channelization.
VB43, 3: The volume of the mean annual flood from one square mile
is defined as the average flow during the peak TBW hours of the flood
hydrograph, roughly for a simple hydrograph, the time from when the
flow begins to rise until it drops to about 10 percent of the peak.
VB43 may be determined by reading the value for 1. 0 square mile,
on a curve of flood volume plotted against drainage area. Dempsey
describes how such a plot can be estimated from a long-term record
of recorded or synthesized flood hydrographs (4). For the Kentucky
River study, a more approximate value was developed from the ratio
of VB43 to QB43 found by Dempsey (4) and Villines (38).
VBOS, 3: The volume of the 200-year flood from one square mile
is also defined as the average flow during the peak 1BWhours of
- 74 -

l
the flood hydrograph, The method of evaluation parallels that for
VB43.
V43(11, 11), 3; This urbanization-channelization correction array
for mean annual flood volumes was developed, and is described
in detail, by Dempsey (4).
VOS(ll, 11), 3; The 200-year flood volume correction array for
urbanization and channelization was also developed and described
by Dempsey (4).
AFCTRV(2, 11) , 3: The data in this array is used to correct average
flood flows estimated for one-square-mile drainage areas to drainage
areas of larger size in a manner analogous to that described for
flood peaks in presenting AFCTR. The first row contains factors for
the mean annual flood, and the second row contains factors for the
200-year flood. Both rows correspond to the drainage areas read
into the first of the three rows of AFC TR.
The values in the array may be based on the curves of mean
annual flood volume and 200-year flood volume versus drainage area
used to determine VB43 and VBOS respectively,
Flood Peak Timing: Program III develops the flood hydrograph at
the mouth of each mainline channel reach by combining the hydrograph
- 75 -

being routed down the channel with the local inflow hydrograph (the
hydrograph of the flow contributed by the local subwatershed). The
way the two combine depends on their rela live timing. The program
assumes runoff from a storm of given frequency to begin simultaneously
over the entire watershed.
Calculation of a time to peak for a given watershed is based
on the same basic procedure of applying correction factors to a
time for a one square mile watershed containing neither urbanization
nor channelization as used for flood volumes and flood peaks. Flood
peak timing was found by Dempsey not to be appreciably affected
by urbanization. It does, however, vary significantly with channel
ization and drainage area.
TPB, 3: The basic parameter of flood peak timing is the number of
hours into the flood hydrograph from one square mile with no channel
ization at which the flood peak occurs. It is best determined from
a plot of drainage area versus time to peak developed by analyzing
regional hydrographs. The value used for the Hazard study has been
developed and is presented by Dempsey (4). The program multiplies
TPB by factors from the two arrays which follow to determine the time
to peak of the hydrograph from a given drainage area having a given
fraction of its channel lengths improved.
- 76 -

TP{l l), 3: The increase in streamflow velocity caused by channel
ization causes the flood hydrograph to reach its peak earlier. The
more channel improvement, the shorter will be the time to peak. This
eleven-element array contains the ratios of time to peak with various
degrees of channelization, ranging in tenths from O. 0 to l. 0, to the
time to peak with no channel improvement. Again, the values were
developed from studies based on the Stanford Watershed Model by
Dempsey (4). The TP value corresponding to the existing channeliza
tion is interpolated from the array and multiplied by TPB.
AFCTRT(ll), 3: This array is analogous to AFCTR (for peaks) and
AFCTRV (for volumes) in that it corrects for the deviation of the
drainage area from one square mile; but in this case, the Program
estimates the time to peak by multiplying AFCTRT directly by TPB
instead of including drainage area in the product. Each point is
still based on the areas contained in the first row of AFCTR. Each
point may be read from the curve of time to peak versus drainage
area used to determine TPB. The curve should reflect the decrease
in slope as one proceeds downstream through the drainage basin.
The relationships developed by Dempsey and Villines were used
in this study.
Hydrograph Shape: Program derived flood hydrographs may take on
- 77 -

many different shapes. A small, urbanized and channelized area
would be expected to produce a sharp, short duration hydrograph.
A large, rural watershed with poor channels would produce a very
flat (low peak, long duration) hydrograph. Between these extremes
are an infinite number of possible shapes.
HYDINT, 3: A hydrograph is a curve obtained by plotting streamflow
against time. The curve is specified within the computer analysis
by a series of flows separated by a time interval of HYDINT hours.
For convenience in combining main channel and local inflow hydro
graphs, the horizontal spacing, or the time interval between points
on the hydrograph, is held constant for all subwatersheds. The
value of HYDINT (two hours was selected for the Carr Fork site)
should be such that the fifty element hydrographs developed by
Program III describe reasonably completely the rising and receding
limbs.
HYDBAS(21,S), 3: The user of Planning Program III supplies five
alternative simple hydrograph shapes, and the program selects
and uses the shape appropriate for a particular combination of
flood peak and flood volume. The five hydrograph shapes are
given as flows at each five-percent of the total hydrograph base
time, the discharge being expressed as a multiple of the peak
- 78 -

discharge. The twenty-first array element gives the ratio of average
flow to peak flow for that particular shape. The Program calculates
the ratio derived for the subwatershed at hand and interpolates
hydrograph elements between the bounding pair of ratios in HYDBAS.
The five shapes, called "sharper, sharp, average, flat, and flatter,"
were developed by Dempsey (4).
FLOOD DAMAGES
The Programs try various levels of design and various combina
tions of measures and calculate expected annual flood damages
residual to each combination in seeking the minimum sum of measure
cost and residual flood damages. The parameters in this section
provide the data necessary for estimating the area inundated to
various depths by a given flood peak and the amount of flood damage
to be expected when each flood peak occurs.
Depth-Area-Discharge: The Programs estimate the area and depth
of flooding caused by a given discharge by interpolation between
two known sets of depth-area-discharge data. The first set is
zero depth and area of flooding for a flood peak equalling the
existing channel capacity. The second set is the data read into
the three variables described in this section and obtained for some
flood of record. Normally, the largest historical flood for which
- 79 -

reliable information on flood peak, depth of flooding, and area flooded
can be obtained should be used so the interpolation range bounds as
many flood peaks as possible. The Programs can extrapolate data
for larger floods, but some accuracy is lost.
The interpolation is based on the assumption that the area and
depth of flooding is determined by the flow in excess of channel
capacity and that the flood plain can be represented by two uniform
cross slopes toward the channel (13, pp. 80-85).
QO (MW), 2; QO(MW-1), 3: Flood damage is caused by flows in
excess of the channel capacity. The planner must supply, through
array QO, values for the existing capacity of each subwatershed
channel. Where the channel within a subwatershed varies substan
tially in capacity along its length, the minimum capacity or the flow
at which water first leaves the channel should be used.
Channel capacities may be most accurately determined by
taking periodic cross sections and running a backwater profile.
As a more approximate method, profile sheets for the Kentucky
River and Carr Fork channels, showing the stream bottom, low
bank, and high water profiles for selected floods (including the
1957 flood) were obtained from the Corps of Engineers. However,
the low bank line was modified due to the absence of damageable
property in the extremely low-lying bottom land. From "Surface
- 80 -

Water Records of Kentucky" for 1964 and 1965 (35), stream discharges
and the corresponding stages at the stream gage near the Carr Fork
dam sire were used to plot a stage-discharge curve. Taking the
smallest vertical distance from the stream bottom to the revised low
bank in each subwatershed as the stage corresponding to the channel
capacity for that subwatershed, 00 values for Carr Fork were read
from the stage-discharge curve.
The largest flood recorded by the Hazard stream gage occurred
in 1957 when the stage (z57
) was 37 .54 feet and the corresponding
discharge (057
) was 47 ,800 cfs (35). Stage (Z) and discharge (0)
values for smaller floods (36, p. 339) were used to plot z/z57
against 0/057
. Taking Z for each subwatershed from the Kentucky
River profiles as the minimum height of the revised low bank above
the stream bottom, and taking z57
as the 1957 high water stage at
the same point, a z/z57
value was calculated for each subwatershed
on the Kentucky River. The corresponding Q/057
value was read
from the plot and multiplied by 057
to yield the channel capacity
(00) for each subwatershed channel. 057
for each subwatershed
was estimated from the relationship between flood peak and
drainage area (see OK12).
The .Program subtracts the QO value from each flood peak to
determine flow excess responsible for flood damages. The Programs
- 81 -

internally increase QO to correspond to planned channel improvements.
QK12(MW), 2; QK12(MW-l), 3: The user, through this variable,
relates to the Programs the. peak discharge in each subwatershed for
a known flood event. The 1957 flood was selected for our analysis
as the largest historical flood for which a high-water profile was
available for estimating depth and area of flooding. McCabe (19,
p. 23) gives the peak 1957 discharge for three stream gaging stations
(Whitesburg, Hazard, and Jackson) along the North Fork of the
Kentucky River. The drainage area tributary to each of these gages
was determined (35), and a plot was made of the 1957 flood peak
as a function of contributing drainage area. A QK12 value for each
subwatershed was then read from the plot corresponding to the area
tributary to the downstream end of the subwatershed.
AK12(MW), 2; AK12(MW-l), 3: The AK12 values represent the
area inundated by the selected flood event, in this case the 1957
flood. The high water profiles for the 1957 flood were used to plot
the area flooded on topographic maps. AK12 values were obtained
by measuring from the map the flooded area outside the stream
banks outlined within each subwatershed. The Program uses
AK12 along with QK12 to correlate flood discharges with the corres
ponding area flooded.
- 82 -

DK12 (MW), 2; DK12 (MW-1), 3: The third group of subwatershed
values for the known historical flood contains the maximum depth of
flooding'. in each subwatershed, The maximum overbank depth is
desired, so the values are obtained by scaling, within each subwa ter
shed, the largest vertical distance from the revised low bank up to
the 1957 flood profile. The Program, using corresponding values of
QK12 and DK12, can approximate subwatershed flood depth from the
flood discharge.
Urban: The expected value of flood damages are separately esti
mated for urban and agricultural property. Damage to urban
structures flooded to a given depth depends on the susceptibility of
the property to damage as roughly indexed by its value and by the
fraction of the total value that is destroyed as a function of the
depth of flooding.
VLURST, B: This variable represents the average value of urban
structures in the urban fraction of the flood plain expressed in
· dollars per acre, The Programs multiply it by the urban area
inundated to estimate the total value of the urban structures flooded.
As an arbitrary rule, any structure located on a parcel
smaller than two acres was considered urban. From a random
sample of 39 properties supplied by the Knott, Letcher, Perry,
- 83 -

and Breathitt County tax assessors, structures having a total value of
$882, 850 were found to occupy 23. 86 acres. Division gave a value
for VLURST of $37 ,000 per acre.
COEFDM, B: Flood damage to urban structures increases with the
value of the buildings and with the depth of flooding. The user
supplies here the unit damage per foot of flood depth per dollar of
building market value (Cf in Eq. 1). The value of 0.052 was derived
by James {13, pp. 85-88) as the sum of direct and indirect damage
for composite residential, commercial, and industrial urbanization.
The damage used assumes no flood proofing as this alternative is
one of the program decision variables. The coefficient used assumes
moderate to low flow velocity, flood duration, and flow sediment
content and should be raised for more adverse conditions.
The Program multiplies the total value of urban structures
flooded by COEFDM and by the average depth of flooding to estimate
the damage to urban structures inflicted by shallow floods. A
curved depth-damage relationship is used in Subroutines CDl and
CD2 to estimate damages from deeper floods. The sensitivity of
planning decisions to COEFDM has been studied and presented
by James {14).
Agricultural: Flood damages to crops and farm structures are termed
- 84 -

agricultural damages. The crop damage depends on the types of crops
grown within the flood plain as determined in part by the agricultural
productivity of the soil. The Programs thus provide separate crop
damage estimates for up to three soil classifications, Farm structure
damage is calculated in the same manner used for urban structure
damage except that the structural market value per acre of land would
naturally be much lower than that found in urban areas.
D (MW, 3) , 2; D(MW- 1, 3) , 3: Different soil types have different
agricultural productivities and are suited for growing different crops.
These arrays provide the fraction of each subwatershed flood plain
that is in each of up to three soil types. The soil maps of Knott,
Letcher, Perry, and Breathitt Counties (20) indicate the three major
soil associations in the flood plains to be: (1) Pope-Stendal
Allegheny (most productive), (2) Jefferson-Muskingum-Holston
Dekalb (intermediate), and (3) Dekalb-Muskingum-Berkes (least
productive). In each subwatershed, the length of main channel
abutted by each soil association was measured and divided by the
total subwatershed main channel length to arrive at the fraction of
the subwatershed flood plain in each soil type.
The Program determines the crop damage per acre to each soil
type when flooded, multiplies these values by the fraction of the
subwatershed flood plain in each respective soil type, sums these
- 85 -

products and multiplies by the area in farmland to determine the
subwatershed crop damage.
CDA, B: The fixed crop damage is caused by the fact of flooding.
This damage is due to elimination of soil, air and sediment erosion
and deposition. As the depth of flooding increases, so does the
damage because more of the plant is submerged for a longer dura
tion by greater velocity flows. This is the variable damage. CDA
represents the fixed damage in dollars per acre that is inflicted on
crops in the most productive soil by a flood of minimal depth. The
variable CDAV represents the additional damage per foot of flood
depth.
Crop damage has two aspects. A certain cropping pattern
exists within the flood plain under flood hazard conditions prevail
ing without the project. CDA is the fixed damage, and CDAV is
the variable damage to this cropping pattern. If the flood hazard
is reduced, the cropping pattern may shift to higher valued crops.
Where such a shift can be reasonably expected, the resulting
increase in farm income (often called a land enhancement benefit)
may be added to CDA.
Since the agricultural data needed to determine crop pattern
by soil type is published by county, and the majority of the study
- 86 -

area flood plain lies in Perry County, this, as well as the next five
crop damage values, were based on Perry County data as being most
representative of flood-plain cropping patterns.
By summing AK12 values within Perry County, 2, 296 acres
were found in the flood plain under analysis. Because the steep
mountain relief forces all significant commercial agriculture into
the flat lands along the streams, the total available farm land in
Perry County was estimated from the ratio of the total length of
Perry County channels to the study area flood plain channel lengths
to give 6, 165 acres as the approximate area of the flood plain in
the county. From urbanization data to be described later, it was
found that 85. 8 percent of these 6, 615 acres, or 5, 280 acres, were
not in urban use. From the 1964 U. S. Census of Agriculture (32),
the most important crops in Perry County, the number of acres
dedicated to each crop, and the corresponding percentage of the
total non-urban area are as shown on Table 1,
TABLE 1
AGRICULTURAL LAND USE IN PERRY COUNTY
Crop
Corn Hay Fruit Vegetables Tobacco Pasture
Acres
700 260 280 100
40 1000
- 87 -
Percent of Total Agricultural Land
13. 3 4.9 5.3 1. 0 0.8
18.9

The help of those familiar with local farming practice was used
in estimating the suitability of each of the three soil types to growing
each crop. This information was then combined with that on Table 1
to develop a composite crop acre by soil type. The Soil Conservation
Service provided approximate crop yields and prices applicable to
the Hazard area as well as a group of tables (Table 2 is an example)
giving the fraction of the total crop value destroyed by flooding as
determined by depth of flooding, crop yield, and the month during
which flooding occurred. It was assumed that the damage for a depth
range of "0' - 2"' applied at 1 foot and that the value given for "over
2"' applied at 3 feet. Information on the relative flood threat by
month of the year was developed from benefit by month values
developed by Dowell for Central Kentucky and expressed on a
fractional basis in Table 3 (6, p. 58, Table 12). A crop damage
value in dollars per acre for the given month, flood depth, crop, and
soil type is evaluated as the product of the damage fraction (Table
2), flood threat probability {Table 3), crop yield per acre (county
farm records), and crop price. For example, for corn in "A" soil,
flooded to a depth of one foot in June, the values are:
CDAl = 0.30 x 0.052 x 60 bushels/acre (corn, June) (6)
x $1. 11/bushel = $1.03/acre.
This is repeated for each month, the summation being CDAl( ) . corn
- 88 -
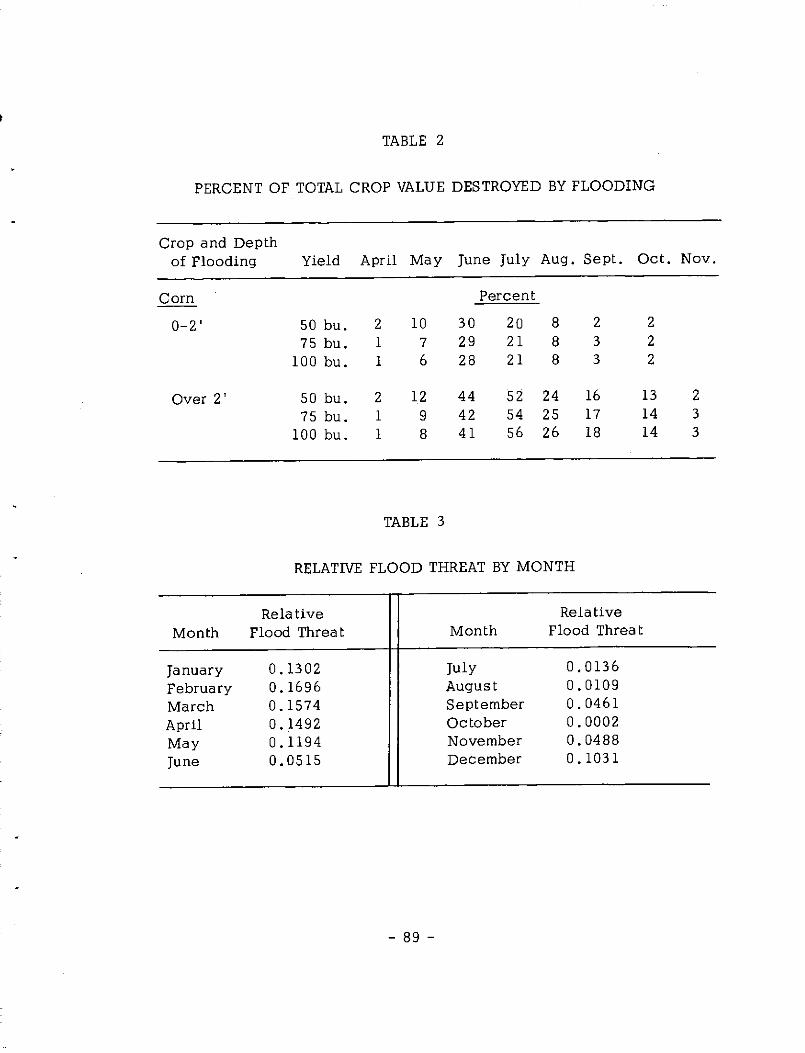
TABLE 2
PERCENT OF TOTAL CROP VALUE DESTROYED BY FLOODING
Crop and Depth of Flooding Yield April May June July Aug. Sept. Oct. Nov.
Corn Percent
0-2' 50 bu. 2 10 30 20 8 2 2
75 bu. 1 7 29 21 8 3 2 100 bu. 1 6 28 21 8 3 2
Over 2' 50 bu. 2 12 44 52 24 16 13 2
75 bu. 1 9 42 54 25 17 14 3
100 bu. 1 8 41 56 26 18 14 3
TABLE 3
RELATIVE FLOOD THREAT BY MONTH
Relative Relative
Month Flood Threat Month Flood Threat
January 0.1302 July 0.0136
February 0.1696 August 0.0109
March 0.1574 September 0.0461
April 0.1492 October 0.0002
May 0 .1194 November 0. 0488
June 0.0515 December 0. 1031
- 89 -

Repeating the calculations for depths "greater than two feet" (hence
w three feet), CDA3 ( ) is developed. Values for CDA( ) and corn corn
CDAV( ) are derived as shown in Fig. 3. Finally, the CDA value corn
for each crop was multiplied by the fraction of the most productive
soil devoted to that crop, and the products were summed to give the
composite crop acre value for CDA. An analogous approach was used
to obtain the composite crop acre value of CDAV.
The Program multiplies CDAV by the average flood depth, adds
the product to CDA, and multiplies the sum by the product of the
area flooded, the fraction of the subwatershed in type "Ai' soil, and
the fraction of the available land farmed to arrive at the total crop
Q) .... C)
~ <Jl-
c: -~ Q) 0, co 6 co Q
r-0
<>:
l 2 3 Flood Depth in Feet
CDAV = CDA3 - CDAl 2
CDA = CDAl - CDAV
Figure 3. Variation of Crop Damage with Depth of Flooding
- 90 -

damage in the most productive soil type. For flood depths greater
than about five feet, crop damage is assumed to have reached a
near maximum value, and the variable damage is not increased
further (3 8, CDl) .
COB, B: The significance, development, and Program use of this
value are the same as those for CDA except that CDB refers to the
intermediate, or "B" type, soil rather than the most productive soil.
Crop yields must be reduced in going to soils of lesser
productivity. For the productivity variation between the two soil
groups as defined for this study, the crop yields for "B" soil were
taken as 80 percent of the "A" soil values. This yield change, in
addition to its direct effect on the monthly crop damage values
(Eq. 6), also changed the fraction of the crop value destroyed by
flooding (Table 2).
CDC, B: The discussion of CDA can also be applied to CDC,
keeping in mind that the "fixed" crop damage is for the least
productive instead of the most productive soil. The crop yield
was taken as 50 percent of that for the best soil for this study.
CDAV, B: The physical significance, numerical evaluation, and
Program use of the incremental increase in crop damage per foot
- 91 -

of additional depth of flooding have already been discussed under
CDA.
CDBV, B: The discussion of CDAV also applies to CDBV with the
single modification of being associated with the intermediate rather
than the most productive soil.
CDCV, B: This variable, too, is analogous to CDAV, the only
difference being that it refers to the least productive soil.
FRU(ll), B: As urban development expands into an agricultural
area, an increasingly large percentage of the remaining open land
is no longer farmed. James (13, pp. 207-208) developed the data
used in this study to express, for each 10 percent urbanization
interval from O to 100 percent, the ratio of the fraction of the avail
able open land which is farmed to the fraction which would exist
if there were no urbanization. The initial study was based on a
detailed study of farm land use on the fringes of Sacramento,
California. The data was not revised for this study because urban
ization in the Hazard area is too minor to warrant a detailed study.
The Program interpolates from this array an FRU value appropriate
for the degree of urbanization and uses the resulting fraction as a
multiplier for crop income and damages.
- 92 -

VLAGST, B: When farms are flooded, structures as well as crops
are damaged. Damage to agricultural structures is calculated by
the Program by using the same unit damage factor (COEFDM) and
the same methodology (38, CDl) as for urban structural damage,
The only difference is that a new average value of agricultural
structures, in dollars per acre, is needed and is supplied through
VLAGST.
The evaluation of VLAGST may be similar to that of VLURST.
That is, the total value of structures in the flood plain on plots of
land having an area in excess of two acres (from data supplied by
county tax assessors) may be divided by the total area on which they
are located to give the value desired, In developing the Carr Fork
data a different approach was taken to avoid the necessity of
distinguishing between urban and agricultural structures when
urbanization was evaluated for USUBW. The total value of
structures outside the Hazard subwatershed ($393,850) was
divided by the 78 such structures in the sample to get an average
value of $5, 050 per structure. This value was then divided into
VLURST ($37 ,000/urban acre) to determine that 7 ,33 rural houses
could be considered equivalent to one urban acre. In determining
the degree of urbanization for subwatersheds outside Hazard,
the total number of houses in the flood plain was divided by 7 ,33
- 93 -

to give the number of urban acres. Thus, since agricultural
structures were included in determining urbanization, their damage
is included with urban structure damage; and VLAGST was made zero,
Uncertainty: Because of financial, social, and psychological
problems involved in suffering large, infrequent damages, most
people would be willing to pay a fixed annual sum in excess of
the expected mean annual damage they actually suffer. This excess
is called uncertainty damage and is evaluated by the Program by
use of the Thomas Uncertainty Fund,
VA, B: In calculating uncertainty by the Thomas Uncertainty Fund,
a decision is made as to the chance (probability) one is willing to
take that the hypothetical fund will be exhausted by several large
floods, VA is the normal deviate having this probability of being
exceeded. The normal deviate for various probabilities can be
found from any normal distribution table. A positive value would
usually be taken, but a negative value could be used for reflecting
the point of view of the gambler willing to use the flood plain on
the chance a flood will not occur while he is there. The value
used in the Carr Fork data corresponds to a probability of O. 50
percent and is 2, 575,
- 94 -

•
GENERAL DESIGN VARIABLES
Most of the remaining input data is used to design and deter
mine the cost of the alternative flood contro1 measures. The variables
presented in this section are used in evaluation of a number of the
alternatives and thus cannot be assigned to any of the more specific
headings to follow.
R, B: Anyone would prefer a dollar today to a dollar one year from
now because of a time preference pattern that favors the present over
the future. For this reason, determining the present worth of future
benefits and costs requires discounting. R is the normative discount
rate for use in project analysis. The literature abounds in discussion
of selection of an appropriate discount rate, but a federal agency is
required to use the rate currently paid on outstanding long-term U. S.
government bonds, a rate of 0.03125 in 1967. One of the major
advantages of being able to use the Programs is that alternative
values of such controversial parameters can be used readily to
determine the resulting policy effects. The Program uses the
discount rate in all conversions among present, future, and average
values involved in the planning process.
TIMST, B: The design life of structural measures represented by
this variable name is used by the Program in distributing the initial
- 95 -

cost of structural measures over the design life to determine the
annual cost. Fifty years is a commonly used value for structural
design life.
TIME, B: The flood control Planning Programs determine the economi
cally optimum dynamic plan based on separate evaluation by planning
stage. The duration of one planning stage is represented by TIME.
The duration selected should divide into TIMST an even number of
times not greater than five. In the Kentucky River study, no signifi
cant change in flood plain conditions was predicted; therefore, one
fifty-year stage was used to avoid repetition of identical calculations
in each stage. If, for any other reason, multi-stage analysis is not
desired TIME can be set equal to the total planning period, or TIMST.
TIME is used by the Program in converting from present worth to
average annual costs within a planning stage and is divided into
TIMST to determine the number of stages to be analyzed.
MRDF, 3: The design frequencies considered by the Program are
read into array DF beginning with the most frequent and ending with
the rarest event to be considered in selecting the design yielding
the maximum net benefit. The planner may not consider it acceptable
to design a flood storage reservoir that can contain only a frequently
occurring event such as the mean annual flood because of the extra
- 96 -

economic consequences associated with underdevelopment of a
reservoir site and a false sense of security which may be given to
those living downstream, Use of a rarer design storm might also
make the difference between whether or not it is necessary to line
the emergency spillway because of its more infrequent use. On the
other hand, design of channel improvement and nonstructural meas
ures against a lesser design flood may be acceptable, so low design
frequencies are read into array DF. The user supplies for MRDF
the location in the frequency array of the smallest flood for which
reservoir storage is to be considered. In analyzing the possibility
of reservoir detention for flood control, those frequencies to the
left of that in location MRDF are ignored. MRDF was made 1 in the
Carr Fork data; thus flood storage analysis began with the most
frequent flood.
NDF, B: The number of flood frequencies to be considered in
design of damage abatement measures is represented by NDF. Any
desired value from one to ten may be used. The Program uses the
value to know how many data values are to be read into the flood
frequency array.
DF(NDF), B: In seeking the optimum flood control policy, the
Programs consider different levels of protection by each measure.
- 97 -

The levels of protection to be considered are specified by the planner
by supplying to this array the desired design frequencies. Any set
of NDF frequencies of monotonically increasing rarity may be
specified for Program II, but Program III requires that the most frequent
flood used be the mean annual and that the rarest be the 200-year.
DESIGN DATA FOR SUBWATERSHED MEASURES
Flood damage reduction measures may be employed either up
stream, as in the case of reservoir detention storage, or within the
individual subwatersheds, Among the possible subwatershed meas
ures are channel improvement, flood proofing, and land use measures.
The data supplied in this section pertains to these measures,
Channel Improvement - Physical Factors: Since flood damage is
caused by the flow in excess of channel capacity, channel improve
ment to increase capacity is an effective flood damage abatement
measure. Channel improvement may involve enlarging the cross
section, installing drop structures for grade stabilization, or
lining. The Programs select the least expensive method by esti
mating the cost of alternative designs. The data contained in this
section are used to develop design quantities and cost estimates
for alternative channel improvement schemes.
AO(MW), 2; AO(MW-1), 3: In estimating the quantity of
- 98 -

•.
excavation involved in channel enlargement within a subwatershed,
the average initial channel cross sectional area for the subwatershed
(represented by AO) is subtracted from the cross sectional area of the
enlarged channel. The difference is multiplied by the length of
the proposed enlargement to yield the excavation volume. The area
needed is the average existing channel cross section area along
the alignment selected for improvement. It will normally be zero
where a new alignment is proposed and can be determined from
channel cross sections at other locations.
The initial area for each subwatershed in our study was eval
uated by measuring the channel top widths (the measurements being
made across bridges), selecting a representative depth from the
stream bottom to the low bank from the stream profiles, and by
observing that the channel banks had approximately a 1: 1 slope.
The area was calculated as that of a trapezoid, whose long base,
height and side slopes were known.
LINING(MW), 2; LINING(MW-1), 3: The Programs consider four
alternative methods of channel improvement: a prismatic unlined
section, a prismatic unlined section with drop structures to increase
stability, a pneumatically placed concrete lining on a trapezoidal
section, and a structurally reinforced concrete lining on a rectangu
lar section. Unless instructed otherwise, the Program will
- 99 -

automatically select the least expensive of the four methods. The
prismatic unlined section will be selected unless more expensive
initial construction is justified to maintain channel stability or
conserve expensive right-of-way.
However, in order to avoid the possibility of the Program
selecting a method of channel improvement varying from one subwater
shed to another, to signify a previously constructed type of channel
improvement, or for other policy reasons, the planner may wish to
specify the types of improvements he Wants considered by the Program
in each subwatershed. The numbers that may be used are as follows:
"O" - All four types of improvement are considered,
the type having the largest net benefit being
implemented.
"l" - This ca uses the Programs to consider only unlined
prismatic channels, but drop structures may be
required if they are needed as indicated by the
channel design tractive force.
"2" - This number causes the Programs to go directly
to consideration of drop structures without first
considering unlined prismatic sections where
drop structures are known to be required or are
already existing.
- 100 -

"3" - Construction of trapezoidal lined channels only
is considered.
"4" - This considers only construction of rectangular
lined channels.
FQ(MW), 2: As the stream flows through each subwatershed, local
inflow causes the discharge to increase. Hence, the subwatershed
outflow is greater than the flow at any other point in the reach.
The user can account for this effect by supplying, for each subwater
shed, an FQ value expressing the average design flow for the channel
reach as a fraction of the design flow at the downstream end of the
reach. When Program II was tested downstream from Carr Fork, a
conservative value of 1.0 was used for each subwatershed, thus
designing the subwa tershed measures for the outflow discharge.
The Program develops the flood peak for the downstream end of
each subwatershed, then multiplies by the appropriate FQ value
to determine the average design flow for the subwatershed.
MANNU, B: The dimensions of the channel section required by
a given design flow are determined by successive trial enlargement
of cross section dimensions until sufficient capacity is available
as estimated by Eq. 3 in which MANNU is the value of the rough
ness coefficient for unlined prismatic channels. Values for
- 101 -

various channel conditions can be found in most hydraulics text
books or handbooks.
MANNT, B: This variable is the roughness coefficient that applies
to trapezoidal lined channels and is smaller than MANNU since
lined channels are smoother than unlined ones. A look at the
Manning equation shows that lining increases channel capacity.
MANNR, B: MANNR is the roughness coefficient for rectangular
lined channels and is normally still smaller than MANNT.
ZU, B: The cross section of improved, unlined channels is trape
zoidal in shape. ZU represents the side slope expressed as the
ratio of the horizontal to the vertical dimensions. The design value
depends on the soil stability (17, pp. 205-208), 1. 5 being the
value for this study. The program uses the ZU value in determining
the cross sectional area of a channel of given flow depth and
bottom width.
ZT, B: Due to the increased stability of lined channel sides, the
side slopes can be made steeper than unlined slopes. This effect
combines with the lower hydraulic roughness to reduce the channel
top width and hence the amount of right-of-way required. For ZT
the planner supplies the channel side slope to be used in design of
- 102 -

trapezoidal lined channels, The value should be determined from
soil slope stability and the practicality of placing lining on steep
slopes.
S(MW), 2; S(MW-1), 3: In using the Manning equation, the slope
of the hydraulic grade line through each subwatershed channel
reach is required. This slope is very closely approximated by the
average channel bed slope through the reach and is supplied for each
flood plain subwatershed through this array. Values were obtained
from the channel profiles by dividing the loss of channel bed elevation
through the reach by the length of the subwatershed channel over
which the drop took place.
TF(MW), 2; TF(MW-1), 3: As flood water rushes over the channel
bed, a drag force known as the tractive force tends to scour away
the bed material. For each trial unlined prismatic channel design,
the Program compares the tractive force developed by the flow with
the maximum tractive force the bed material can withstand without
scour; this second value is supplied to the Program through this TF
array. If the force is greater than the channel bed can withstand,
it must be reduced by making the hydraulic grade line flatter than
the natural channel slope by installing drop structures to concen-
tra te elevation loss in local protected areas, These drop structures
- 103 -
I
r i I
I
I

are overflow weirs with concrete energy dissipators downstream to
prevent the falling water from eating away the channel. The maximum
allowable tractive force depends on soil properties with grain size
being the determining factor for noncohesive soils and plastic index
being the most widely used index for cohesive soils (2, 1 7: 9).
The tractive force limitation is not a factor in the Hazarc:j area
because most channel beds are in solid rock. For this reason, an
arbitrary very large TF value of 2. 5 pounds per square foot was used
for each subwatershed.
BDMAX, B: BDMAX represents the maximum ratio of bottom width
to depth allowed in design of improved channels. Very wide shallow
channels are undesirable because low flows will meander around the
bottom. A maximum bottom width to depth ratio of 10.0 is commonly
used in channel design. The program initially tries a minimum ratio
(BDMIN) and calculates, based on the Manning equation, the depth
of flow required to carry the design discharge. If this depth exceeds
HMAX, a larger ratio is tried, and the process is repeated until
the depth is acceptable. This repetition is cons trained by the fact
that the Program will not allow the ratio to exceed BDMAX even if
the prescribed HMAX must be exceeded. However, none of the
three factors were critical in the Kentucky River example because
channel improvement was at no time found economical.
- 104 -

BDMIN, B: The minimum allowable ratio for bottom width to depth
in channel design is represented by BDMIN. It is difficult for most
construction equipment to excavate a channel of too narrow bottom
width. It is the ratio at which the channel sizing calculations begin
as described under BDMAX. A value commonly used in channel design
is 4. 0.
HMAX, B: This is the variable name for the maximum design channel
depth allowed. The value was determined by inspection of the
stream profiles. The design depth is limited to approximately the
natural channel depth to avoid expensive excavation into the channel
bed over the entire bottom width and to prevent adverse stream bed
gradients at the downstream end of improved reaches. HMAX is used
by the Program as explained under BDMAX above.
NIN, B: Drainage inlets must be provided to get local storm water
into the improved channels. The number of these inlets required
per mile of channel is represented by NIN. The value is determined
by looking at a topographic map or the existing storm drainage
system in urban areas and approximating the number of small
streams or natural drainage ditches that must enter the channel,
per mile. The Program multiplies NIN by the cost of one drainage
inlet structure and by the improved channel length to estimate the
- 105 -

inlet cost in determining the total cost of channel improvement.
CAP(MW,8), 2; CAP(MW-1,8), 3: It is necessary to eliminate any
existing channel constrictions that cannot accommodate the design
channel flow. The most common constrictions are at bridge openings.
In the CAP array, the planner provides the Programs with the capaci-
ties, in cfs, of all bridges in each flood-plain subwatershed. The
Programs can handle up to six highway bridges and two railroad
bridges per subwatershed. The first six values read pertain to
highway and the last two to railway bridges. The values within
each subwa tershed and bridge category must be listed in descending
order. If there are fewer than six highway or two railroad bridges
in a subwatershed, values of -1. are used to fill the array. In
case of fords or proposed new road or railroad stream crossings, a
CAP value of O. will cause the Programs to include the cost of
building a new bridge whenever any subwatershed channel improve-
ment can be justified. The capacities of existing bridges were
calculated by the approximate formula:
1. 5 Q = 4. Sbd , (7)
used by James (13, p. 65) to indicate the maximum flow which can
pass through an opening without excessive backwater. In eq. 7,
b is the clear bridge span measured perpendicular to the flow, in
- 106 -

feet, and d is the vertical distance from the stream bed to one foot
below the underside of the bridge deck. The Programs, as they
evaluate channel improvement possibilities in each subwatershed,
compare the design flow With each bridge capacity. Each time a
bridge is found that does not have ample capacity, the cost of
replacing the bridge is included in the channel improvement cost.
BW, B: BW represents the design width in feet of the new highway
bridges proposed to replace old ones of insufficient capacity.
The value is determined by noting the width of existing bridges on
the general type of roads that will cross the channel. Since the roads
in the study area are all two-lane, a 30-foot width was specified
based on 12-foot lanes with 3-foot shoulders. A four-lane highway
could be handled by specifying two bridges.
The Program multiplies BW by the new bridge length, measured
as the water surface width of the design channel, and by the unit
cost of highway bridges to arrive at the cost of building a new
bridge.
Channel Improvement - Cost Factors: The cost of channel improvement
is estimated by multiplying estimated construction quantities by
unit costs and the sum of the products by some factor to account
for incidental or minor i terns, contingencies, engineering, etc.
- 107 -

Unit costs and cost multipliers are supplied to the Program by the
data in this section.
ex, B: When the channel is enlarged, excavation is required. The
unit cost of channel excavation in dollars per cubic yard is repre
sented by ex. The value is determined from contract bid prices
on similar excavation in the same general area. The Programs
multiply the number of cubic yards of excavation by ex to determine
the basic cost of channel enlargement.
FM, B: Unlined channel construction usually requires riprap at
points of expected erosion on curves, transitions, and junctions
and seeding the banks to establish a protective grass cover. The
multiplier applied to the channel excavation cost to account for
these and any other similar items is supplied through FM. The
value is obtained from contract bid prices for similar channels by
dividing the total contract cost of the earth channel by the cost of
excavation alone.
erN, B: eIN represents the cost of installing each drainage
inlet. If lump sum bid prices are available on inlets of a suitable
type, a representative price can be directly selected for eIN.
If none are available, a value for eIN may be developed from
the unit costs and approximate quantities of materials and labor
- 108 -

required for each inlet. The Program multiplies CIN by the number
of inlets to arrive at their total cost. This cost is then included in
the total cost of channel improvement.
CLSF, B: Since the sides of trapezoidal channels lie at some
slope, the lining of these channels is a type of paving operation.
The unit cost of placing the lining material plus wire mesh reinforce
ment if desired is expressed in dollars per square foot by CLSF.
Contract bid prices on similar work are again the source cf data.
The program multiplies the wetted perimeter plus freeboard allowance
times the lined channel length to obtain the area to be lined. This
area is then multiplied by CLSF to evaluate the total cost of lining
trapezoidal channels.
CCY, B: Installation of rectangular channels, with their vertical
walls, requires structura I concrete. The unit cost of placing this
concrete including reinforcement and structural excavation and
backfill, represented by CCY, is given in dollars per cubic yard.
The cost may be estimated from contract bids on similar structural
concrete work. The Program multiplies twice the wall height to
the top of the freeboard plus the bottom width by a one foot slab
thickness and multiplies the sum of the products by the improve
ment length to determine the concrete quantity. This volume is
- 109 -
then multiplied by CCY to yield the cost of rectangular lining.
CBR, B: The value supplied for this variable is the total cost of
highway bridge construction in dollars per square foot of bridge deck.
A value can be derived from contract bid prices or other available
construction cost information. In determining the value, the total
cost of bridge construction should be divided by the area of the
corresponding bridge deck. If culvert rather than bridge construc
tion is planned, the Programs can still be used by evaluating CBR
as culvert cost per square foot of theoretical bridge deck, The
Program multiplies CBR by the area of the new bridge deck (the
product of BW and the design water surface width) to determine
the cost of highway bridge construction.
CRR, B: The cost of railroad bridges varies with the length of the
bridge and the number of pairs of track on the railway. The unit
cost, represented by CRR, is expressed in dollars per linear foot
of the bridge. The unit cost, like CBR, may be estimated by
dividing the total contract construction cost associated with
similar raUroad bridge construction by the bridge length. The
Programs can handle a mixture of single line and double line
bridges by providing CRR for single line bridges and reading two
bridges of identical capacity into array CAP. The Programs
- 110 -

multiply the CRR value by the length of any required new railroad
bridges to get this component of channel improvement cost.
AQR, B: From land values and quantities of right-of-way to be
purchased, the Programs estimate the amount which will have to be
paid to purchase land and improvements for right-of-way. AQR is
the ratio of the total economic cost of acquired right-of-way to the
price of land and improvements. The value may be approximated by
:first determining the total financial cost of right-of-way (including
damages, value of mineral rights, severance damages, resettlement
costs, and agency cost in transacting the purchase) and dividing
by the cost of land and improvements. For the Kentucky River study,
an additional component of AQR, develo,ied by Higgins (11), was
included to account for the personal value of the pro,ierty to the
owner above the fair market price. Higgins found social and
psychological attachments to real property to comprise a real
economic value to the unwilling seller, and the value he found,
expressed as a fraction of the sale price, for Dewey Reservoir in
a not her Appalachian valley was also used for this study. The
value for AQR of 3 .584 used for this study was obtained by adding
the personal value factor (0.861) to the ratio of the total financial
cost associated with right-of-way acquisition to the cost of land
and improvements (2. 723) as determined from the Corps of
- 111 -

Engineers project report on the Carr Fork project. The numerator of
the ratio includes, in addition to the cost of land and improvements,
isolation and severance damages, mineral rights, resettlement,
and acquisition costs. The Program multiplies the cost of land and
improvements by AQR to approximate the total cos:of right-of-way.
SAFC, B: As a safety factor to overcome difficulty in forecasting
future requirements for channel right-of-way, it may be wise to
purchase more right-bf-way than current estimates indicate to
actually be required for holding for future channel construction.
Provision for this is made by the variable SAFC, which is the ratio
of the right~of-way width to be held to that width expected to be
required. The Program forecasts the area of right-of-way needed
for channel construction in future stages and multiplies by SAFC
to determine the area of right-of-way to be purchased now.
RWF, 2: Cost estimates during planning are always subject to
error. The planner may wonder what the effects would be on the
optimum flood control policy if his best estimate were in fact in
error. RWF is an arbitrary multiple of right-of-way cost that
may be used for this purpose. Program II multiplies RWF by
all computed right-of-way costs before selecting the optimum
policy. The value used in this study of 1. 0 should normally be
- 112 -

used in the first run for any study area. If the planner later wishes
to analyze the effects on his analysis of varying right-of-way costs,
he may then run the Program again after changing the value of RWF.
CSM, B: Most agencies include a contingency allowance in their
cost estimates by adding a fixed percentage to the estimated
installation cost. CSM is a multiplier (1. 0 plus the contingency
percentage) for channel construction cost. The purpose of this
factor is to protect against having the preliminary cost estimates
be too low as a result of unforeseen difficulties and costly delays
in construction. The 1.15 value used by the Corps of Engineers in
planning Carr Fork reservoir was used for this study.
ESM, B: ESM is another multiplier for channel construction cost,
in this case accounting· for the cost of desi,gn, administration, and
supervision of construction. The factor is best evaluated by
dividing chaneel improvement costs, including these items, from
previous project records by the cost of construction alone on the
projects. The value of 1.45 used in this study was obtained by
assuming that the value calculated for ESMD from the Corps of
Engineers project report on Carr Fork for the dam also applied to
ESM for channel construction. The Programs multiply the sum of
all other construction costs, including contingencies, by ESM.
- 113 -

MIN, B: Once flood control measures are employed, they must be
maintained if they are to continue to perform their design function.
Maintenance cost varies widely with measure type, but for measures
of a given type the greater the initial cost, the greater the annual
maintenance cost. For this reason, the annual maintenance cost
may, for planning estimates, be expressed as a fraction of the first
cost. MIN is this fraction for concrete structures. The value is
approximated from records on annual maintenance costs and initial
installation cost for existing structures. An alternative approach
is to develop and estimate the cost of a suitable maintenance
program. The Programs estimate the annual maintenance cost by
multiplying MIN by the first cost of the concrete structure. This
cost is then added to the other annual costs of channel improvements
distributed over the structure life by the Program.
MCH, B: MCH accounts for the annual maintenance cost of earth
channels. MCH can be expected to be considerably larger than
MIN since earth channels are much less durable than concrete
structures. For a channel improvement including concrete drop
structures and drainage inlets in an otherwise unlined channel,
total maintenance cost is estimated by adding the product of MCH
and the initial excavation cost to the product of MIN and the
initial concrete structure cost. Bridge maintenance is not included
- 114 -

in the flood control cost as it may be fairly allocated to the total
cost of the transportation facility, particularly since flood control
should reduce bridge maintenance by reducing bridge flood damage.
MTLCH, B: MTLCH accounts for annual maintenance cost of
trapezoidal lined channels. MTLCH values will probably be inter
mediate between MIN and MCH.
SF, 2: SF is a cost sensitivity study factor analogous to RWF
except that it applies to channel installation rather than right-of
way cost.
Flood Proofing - Cost Factors: Flood proofing comprises various
flood damage reduction measures taken by individual property
owners as described in Chapter 1. Research into flood proofing
alternatives, as well as the concentrated use of proofing to abate
flood damages, has been very limited; and consequently cost
data is very scarce. While additional research is needed to
obtain firmer cost estimates, the flood proofing cost estimates
made for Bristol, Tennessee-Virginia, provide the values used
in this study (15, 24).
FP, B: FP represents the cost of flood proofing per foot of design
flood depth per dollar of building market value. In units and
- 115 -

application, it is analogous to COEFDM. Both should be inter
preted as a statistical average for a large number of buildings
rather than a reliable estimate for any individual structure. Detailed
analysis of flood proofing on a building by building basis is not
warranted during prnliminary planning, but some preliminary field
observations to determine the practicality of flood proofing under
local conditions should precede setting a value on FP. The value
derived from the Bristol studies (13, pp. 110-113) of 0.035 was
used in the Kentucky River study. In determining the cost of flood
proofing, he Program multiplies FP by the area to be flood proofed,
the value of buildings per unit area, and by the average depth of
flooding.
VF, B: In some parts of the country, particularly in flat or arid
regions, floods of the same magnitude may not inundate the same
area each time they occur. This is due to sediment scour and
deposition, changing channel vegetation patterns, and changing
bank conditions, As. a result, it may be necessary, in protecting
against floods of a given frequency, to flood proof an area larger
than that inundated by any one flood of this frequency. VF is the
ratio of the area requiring flood proofing to the area inundated by
the design flood. The value is obtained by inspecting maps or
records showing the area flooded by different floods of similar
- 116 -

magnitude. The Program multiplies the area flooded by the design
flow by VF to determine the area requiring flood proofing.
DD, B: DD is the multiplier for flood proofing installation cost to
account for design and contingencies. A value is probably best
determined by dividing the cost including these items by the basic
construction cost for projects similar in nature and scope to flood
proofing installation. Data will become more reliable and easy to
obtain as more flood proofing measures are installed.
MFP, B: MFP is the factor for estimating annual maintenance cost
for flood proofing measures as a fraction of initial cost. Where no
data is available on maintenance of flood proofing measures as
such, data from other improvements of similar durability should be
used.
PF, 2: PF is another cost sensitivity study factor. It is analogous
to RWF except that it applies to flood proofing cost.
Location Adjustment Cost Factors: While a great deal of publicity
has recently been given to reducing flood damages by keeping
people out of the flood plain, a community cannot sacrifice the
development of its flood plain without cost. Some of the cost
accrues in establishing and enforcing the land use restriction.
- 117 -

The bulk of the cost comes from depriving the economy of beneficial
use of land which may have a number of desirable characteristics.
As a general rule, flood plain land should hot be developed if the
expected flood damage exceeds its value in use. The land should
be developed if its value in use exceeds the expected flood damage.
The Programs develop a statistical average cost. More refined
studies would show some kinds of development economical within
a given flood plain while others are not. The information required
to estimate the cost of keeping urban development out of a particular
flood plain is provided the Programs by the data described in this
section.
CLEN, B: Legal restrictions on flood plain 1.and use cannot
effectively control flood damage unless they are implemented in a
prescribed manner and strictly enforced. For this variable the
planner supplies the annual cost of implementing and enforcing
land use restrictions, expressed in dollars per acre. No agency
is known to have collected the data necessary to evaluate this
variable, but theoretically a value could be approximated by esti
mating the legal fees, costs of maintaining an inspection team,
and a proportional share of other costs of operating a planning and
zoning board. A value of one dollar per acre per year was used
for this study; however, the land use restriction measure did not
- 118 -

apply because no urban growth was forecast in the flood plain. The
Program adds CLEN to the other land use management cost specified
by Eq. 5,
RPI, B: The method used by the Programs for estimating the cost to
the community of restricting development from the flood plain is
based on Eq. 5. RPI is represented by j in Eq. 5. It is the rate
of return expected by private investors in real property. A rate of
0. 08 was used in this study (13, P. 122). The rate prevailing in
a given farm area may be estimated as that discount rate which
equates the present worth of expected future farm income to the
prevailing market prices of farm land per acre.
FIA, B: When land use measures are implemented to abate flood
damages, urban development is excluded from the area. This
leaves the land open for agricultural use, which is allowed under
use restrictions. The agricultural income derived from this land
must be subtracted from the expected urban income which would
otherwise occur to obtain the net cost of land use restriction
measures (Eq. 5).
FIA is the variable name for the farm income expected
annually per acre of the most productive soil type, provided no
flooding occurs. Under variable CDA, it was c:lescribed how a
- 119 -

composite crop acre by soil type was developed along with expected
crop yields. Gross income (in dollars per acre) is estimated by
multiplying yields by price. Those familiar with local farming
practice can help provide farm budgets for determining .the approxi
mate net incomes from each crop, based on the gross incomes
already calculated. For each crop, the fraction of the most produc
tive soil used in growing this crop is multiplied by the corres
ponding net income per acre. This is the farm income per acre
for this crop. Re pea ting the process for each crop, multiplying
each value by the fraction of the soil type in the crop, and taking
the sum gives the FIA value. The Program multiplies FIA by the
fraction of the flood plain in "A" soil and combines this product
with analogous values for "B" and "C" soils to evaluate IA in
Eq. 5.
FIB, B: FIB is analogous to FIA except that it applies to the soil
of intermediate productivity.
FIC, B: FIC is also analogous to FIA except that it applies to the
least productive soil.
!PP, B: Areas from which urban development has been prohibited
as a means of flood damage reduction have a value as green
belts, historical sites, or parks. People in the surrounding
- 120 -

community enjoy these "nature spots" more than they would enjoy
the urban developments displaced. The value they attach on this
enjoyment (13, pp. 46-49) is a favorable effect of land use
restriction measures, which increases as the surrounding areas
become more urbanized. IPP (IP in Eq. 5) represents this annual
value in dollars per acre expressed as a multiple of the fraction
of surrounding land that is urban. Attaching a dollar va.lue to IPP
is a value judgment for which the planner has little guidance other
than referring to pertinent literature (9, 10). A value of O. 0 was
used for our study site because green areas are so abundant around
Hazard. The Program multiplies IPP by the urban fraction cf the
subwatershed and by the area whose land use is to be controlled
to determine the value for IP applying to the subwatershed.
LF, 2: LF is the multiple for use in sensitivity studies to evalu
ate the effect of varying land use restriction cost on the optimum
project selected. It works in the way presented for variable RWF
for right-of-way cost.
URBANIZATION AND LAND VALUE PROJECTIONS
The dynamic aspect of flood control planning is introduced
by analysis of the effects of changing flood plain conditions on
the optimum combination of damage reduction measures. The
- 121 -

analysis requires data on the magnitude of these changing conditions.
Information on changing flood damage potential through changing
flood plain urban development is supplied through array USUB'W.
Information on changing flood hazard through the hydrologic effects
of changing urbanization in the tributary watershed is supplied
through array UTOTR. Information on the changing cost of right-of
way and its resultant effect on the cost of land use restriction
(Eq. 5) is supplied through array VALUE. Where a single stage
rather than dynamic analysis is used, values for each variable at
the beginning and ending of the project life are required, and
analysis is based on discounted average annual values assuming
a uniformly varying gradient.
USUBW(MW,NSTEMX+l), B: In the USUBW array, the planner
supplies the fraction of each subwatershed flood plain in urban
land use at the beginning and end of each planning stage. For the
first subwatershed in Program III, that upstream from the reservoir
site, the probable area required for right-of-way rather than the
flood plain should be used.
The area inundated by the 1957 flood was used for calculating
the urban fractions for this study. It was determined (see VLAGST)
that 7 .33 houses could be considered equivalent to one urban acre.
The nurmber of houses in each subwatershed flood plain shown
- 122 -

on the topographic map was counted and divided by 7. 33 to deter
mine the number of urban acres in that flood plain. Where individual
buildings were not shown, the entire acreage shown in red on the
tppographic maps was counted as urban. The urban acreage was
divided by the total subwatershed flood plain area to get USUBW.
Since past population trends and future projections indicate no
future urbanization increase in the study area, USUBW values for
the end of each stage are the same as the current value. Dempsey
(4) and James (13, pp. 218-232) describe projection procedures that
can be used in areas of increasing population.
The Program uses USUBW values to estimate expected flood
damage and to multiply by IPP in determining open space amenities
from land use restriction. Urban damages and the value of open
space increase with urbanization while crop damages decrease.
UTOTR(MW, NSTEMX+l}, B: Dempsey (4) presents the effect of
urbanization on the hydrology of a drainage area. This effect on
mean annual and 200-year flood volumes, is quantified in arrays
Q43, QOS, V43 and VOS respectively. UTOTR is the fraction of
the drainage area contributing to the flow being calculated that
is in urban development. Therefore, in Program II, UTOTR is the
degree of urbanization of all the area tributary to the downstream
end of the subscripted subwatershed while in Program III, the
- 123 -

value is the urban fraction within the area used to develop the local
inflow hydrograph.
Individual isolated houses do not have much effect on runoff;
it is rather larger groups of urban buildings draining directly into a
water course. Thus, a different approach than that used to calculate
USUBW was required. Closely spaced structures are characteristic
of an urban area. From urban lot size data obtained for the Hazard
area from the Perry County tax assessor, an average lot depth was
taken to be about fifty feet. This depth implies one urban acre for
every row of closely spaced houses 800 feet long shown on the topo
graphic map. Smaller concentrations of houses or other buildings
were ignored. The total number of urban acres in each subwatershed
was determined, including the Hazard urban area measured directly,
and divided by the subwatershed area to get UTOTR for Program III.
For Program II, urban area as well as total area was cumulatively
summed through the subscripted subwatershed, UTOTR being the
ratio of urban to total area in each case. Projections again indi
cated no change in UTOTR values during project life, but the
projection methodology presented by Dempsey (4) and James {13,
pp. 218-232) should be used where applicable.
The program uses UTOTR values for interpolating to find the
effect of urbanization on flood peaks in both Programs and on
flood volumes in Program III.
- 124 -

VALUE(MW,NSTEMX+l), B: The unit value per acre of land
(excluding buildings and improvements) in the subwatershed flood
plains is supplied the Program through array VALUE. For subwa ter
sheds 7, 8, and 9, those near Hazard, urban development plays
an important role in determining land value. For these three flood
plains, land value was obtained by dividing the total assessed value
by the acreage of the land represented in therandom sample of 41
properties obtained from the tax assessor offices. In the more
rural subwatersheds, the land value depends more on agricultural
potential. For the current land values in each of these subwatersheds,
the expected annual farm income from each soil type is multiplied
by the fraction of the flood plain in the corresponding soil type.
The summation of these values, representing the expected overall
annual farm income, is divided by RPI. Thus the land value is
taken as the present worth of all future net farm income. Projec-
tion methods for use in areas having a growing economy are
presented by Dempsey (4) and James (13, pp. 218-232). Current
and future flood plain land values are used by the Program in
determining costs of right-of-way and values of MV O
and MVt
in Eq. 5 for evaluating land use regulation measures.
DESIGN DATA FOR DAM AND RESERVOIR
The main difference between Planning Program II.and III is the
- 125 -

fact that Program III considers construction of a flood control reser
voir in addition to the subwatershed measures studied by Program II.
Following are data required by Program III for its analysis of flood
detention storage.
Reservoir Hydrology: In determining whether or not flood control
storage is economically feasible, the Program determines the effect
that a proposed reservoir would have on downstream floods. The
analysis requires routing of the design flood downstream through the
reservoir and through the main line channel, first without, then
with, the reservoir in place. The data presented in this section is
used in routing as well as in determining the amount of conservation
and flood control storage to be made available.
HYDMLT, 3: In order to ensure dam safety, it is necessary to route
through the reservoir a very rare flood to make sure it will not be
overtopped. HYDMLT is the variable name given to the ratio of the
emergency spillway design flood peak to the 200-year flood peak.
The value depends on the policy of the planning agency in emer
gency spillway design and the consequences of dam failure.
The value used in this study was picked so the Program would
provide the design emergency spillway capacity planned for Carr
Fork by the Corps of Engineers. Program III might be used to
- 126 -

analyze the cost of increasing the emergency spillway design flood
to increase dam safety by varying HYDMLT.
AWG, 3: AWG represents the drainage area in square miles used
to develop the cumulative runoff curve, CUMVOL, described below.
CUMVOL is developed from streamflow records so AWG is the
drainage area tributary to the location of the selected stream gage.
The value is generally given along with the streamflow data for
the gaging station (35). The cumulative runoff needed by the
Program is that tributary to the reservoir site. There will probably
not be sufficient streamflow records at the reservoir site to develop
the curve directly, and a record from a tributary area as close as
possible to that desired should be selected. The Program assumes
cumulative runoff is directly proportional to drainage area in
adjusting the figures in CUMVOL from AWG to AW(l).
IMPTY, 3: A major problem in operating a flood control reservoir
centers around the question of whether flood inflow should be
held in the reservoir to reduce the current peak or released to
provide for the possibility of a second even larger flood closely
following the first. The longer water can be held in the reservoir,
the greater is the effected reduction in the current peak but also
the greater is the risk of a new flood occurring on top of partially
- 127 -

filled flood storage.
IMPTY is the integer number of days that the design flood is
detained in the flood control reservoir. The value depends on the
design policy of the planning agency and should ideally be based
on analysis of the probability of back to back floods in the local
hydrologic area. Twenty days was used for this study. The Program
uses IMPTY in sizing the principal spillway so flood storage can be
emptied by the required time.
CUMVOL(26), 3: In any flow sequence, the longer the flow dura
tion considered the smaller will be the average flow. For example,
the instantaneous peak flow is larger than the average flow over
the maximum day, and both are larger than the average flow over a
five-day period. CUMVOL contains, for the mean annual flood,
the average flow in cfs for various durations in days.
The stream gage at Sassafrass, Kentucky, very near the Carr
Fork reservoir site, has been there a rela lively short time. Since
at least ten years of record are needed to insure with any degree
of confidence that the average value over the years will approxi
mate the mean annual values, streamflow records on the North
Fork- of the Kentucky River at Hazard were used in developing
CUMVOL {3 5). For each year from 1957 through 1966 the
instantaneous peak flow was recorded (O days duration) as well
- 128 -

...
as the largest average flow over each duration from one to twenty
days. For example, the largest total flow in any ten consecutive
day period during the year was divided by ten to get the ten-day
CUMVOL value in each year. The average CUMVOL value over
the ten year record for each duration is used as the mean annual
CUMVOL at Hazard. Similarly, a CUMVOL value was determined
for each duration from O (instantaneous) to 20 days for the Sassa
frass stream gage, using only the 1965 Sassafrass record. The
ratio of 1965 Sassafrass CUMVOL to 1965 Hazard CUMVOL for
each duration was multiplied by the mean annual Hazard CUMVOL
for that duration to obtain the mean annual Sassafrass CUMVOL
value desired. The first few CUMVOL values were plotted against
duration, and CUMVOL values for 0.25, 0.50, O. 75, 1.25, 1.50,
and 1. 75 days were read from the graph.
The CUMVOL array is used by the Program to determine the
total inflow to the reservoir that can be expected over the pre
scribed drawdown period of IMPTY days. CUMVOL (corrected
for frequency) for IMPTY days is used to size the principal
spillway. The first estimate of the required volume of flood
storage is based on the maximum amount of water that would
accumulate in the reservoir as the flow, expressed by CUMVOL
for durations shorter than IMP TY, entered while discharge occurred
- 129 -

through the principal spillway. Routing the design frequency flood
later refines this initial estimate. CUMVOL, again adjusted for
frequency, is also used to estimate inflow into the reservoir at
the time the storm begins as the average flow during the IMP1Yth
largest flow day of the year.
IB, 3; Program III provides for conservation storage (water saved
in the reservoir for any type of beneficial use) in its analysis of
reservoir cost. Flood control storage is justified if the resulting
benefit exceeds the inc rem en ta I cost of enlarging the reservoir to
provide it. In the event conservation storage is being considered
but the Program cannot justify flood storage, two possibilities
exist. If the reservoir is to be built for conservation storage any
way, IB is read as 1. The Program then goes on to complete the
reservoir design on this basis and determine the effect of surcharge
storage on flood peaks before evaluating the optimum combination
of measures for each downstream subwatershed. If no reservoir
is to be built unless flood storage can be justified, IB is read as O.
The value to use for IB should be determined from a benefit
cost analysis for project purposes other than flood control. The
value of 1 was used in the Kentucky River studies, but additional
runs were alro made to evaluate flooding with no conservation
storage (NODAM=l).
- 130 -
•

GDELAY, 3: The flood damage reduction benefit from reservoir
storage can usually be increased by operating the reservoir using
a gated principal spillway so that the peak reservoir release does
not coincide with downstream inflow peaks. Full advantage of
such gates is only realized by a complex set of operating rules
based on flood forecasting and reservoir system response. It
was not feasible to program a complex operating procedure, but
GDELAY provides for holding back reservoir releases until down
stream runoff has subsided. Reading a positive value of GDELAY
will cause the Program to hold reservoir flood releases constant at
the base flow value for GDELAY hours after the storm begins, hour
zero in the hydrograph time to peak calculations.
Use of the variable is most advantageous where the reservoir
is located on one leg of a Y and the release can be delayed until
flow subsides on the other leg. Delaying the release is less bene
ficial where no major tributary enters the main stream between the
dam site and the area of primary benefit or where one of the tribu
taries is so large that holding the mainline flows back would make
them more likely to coincide with tributary peaks. The best policy
is to read O. 0 for GDELAY for the initial run and then try larger
values in later runs to see if any significant advantage is gained.
GDELAY did not help in justification of flood control storage at
- 131 -

the two dam sites on the Kentucky River.
CHKN(MW-1), 3: Program III determines the flood hydrograph in
any subwatershed by routing the main channel flow hydrograph
through the channel reach and combining it with the local inflow
hydrograph. The channel routing is accomplished by the Muskin
gum method (18, pp. 228-229). In order to have flood peaks with
and without a potential channel improvement for estimating
resulting flood control benefits, it is necessary to route the flows
through both natural and improved channels. CHKN is the
Muskingum storage constant for natural channel reaches and is
approximated by the time of travel of the flood through the reach.
The Corps of Engineers provided estimates of travel time
between the Carr Fork site and various points downstream based
on analysis of recorded hydrographs at various points along the
river. The river length between these points was divided by the
corresponding travel time to get the average flow velocity. The
length of each subwatershed channel reach was divided by this
velocity to determine the travel time through the natural channel
reach, or CHKN.
CHKY(MW-1), 3: CHKY is the Muskingum storage constant used
by the Program in routing flood flows through improved channel
- 132 -

reaches. Since both n (Eq. 3) and travel time are inversely propor
tional to streamflow velocity, travel time must be directly
proportional to Manning's n value. It was estimated that Manning's
n for improved channels was approximately 25 percent lower than
that for natural channels like those in the study area. Thus the
CHKY value for each subwatershed was taken as 0, 75 x CHKN for
that subwa tershed,
CHXN(MW-1), 3: CHXN is the value, for natural channels, of
the Muskingum constant that expresses the relative importance of
channel reach inflow and outflow in routing. Values may be deter
mined graphically from historical hydrographs (18, p, 228). The
values used for Carr Fork were developed for natural channels in
Central Kentucky by the Soil Conservation Service. The Program
uses CHXN in routing floods through the natural channels by the
Muskingum method.
CHXY(MW-1), 3: The inflow-outflow constant for improved channel
reaches is represented by CHXY. The derivation is similar to
that for CHXN, the values used again being supplied by the Soil
Conservation Service .
Dam Site Properties: To select the optimum reservoir and dam
dimensions, the Program must be supplied the topographic and
- 133 -

geometric properties of the proposed dam site. The arrays that
follow provide the Program pertinent physical dimensions of the dam,
reservoir, and emergency spillway as well as relocation cost& all
as functions of elevation.
IMAX, 3: IMAX represents the total number of elevations and corres
ponding dam site properties sup plied. The channel bed at the Carr
Fork dam site is at an elevation of 948 feet; hence this was the
first elevation used. Elevations used were then increased in ten
foot increments from 950 to 1, 080 and in forty-foot increments from
1, 080 to 1, 20 0 to make a total of 18 elevations. The Program can
handle a maximum of 25. The Program uses IMAX to determine how
many sets of elevations and corresponding dam site properties to
read and to use in later computations.
NHILSD, 3: For many potential reservoir sites, the emergency
spillway site suitable for a dam of one height will not be suitable
for a dam of another hi:iight. Because the planner cannot know
ahead of time which reservoir size will prove optimum, he may
desire to read data pertaining to NHILSD alternative spillway
locations. The number can be determined by examining topographic
maps for possible saddle sites for an emergency spillway at
increasing elevations. The Program can handle up to three
- 134 -

different locations. If more than one location is to be considered,
the dam top elevations at which the Program would shift from one
site to another should also be read. The Program reads NHILSD-1
break point elevations and NHILSD site cross sections.
HBRLM, 3: HBRLM represents the break-point dam top elevation
between the lowest and intermediate emergency spillway locations.
The value is determined by inspection of the topographic map of
the dam site. At dam top elevations below HBRLM, the Program
uses the emergency spillway cross section data from array HLSIDL.
When the top elevation reaches HBRLM, the cross section used is
taken from the HLSIDM array. HBRLM is not read unless NHJLSD
equals two or three.
HBRMH, 3: HBRMH refers to the break-point elevation between
the intermediate and highest emergency spillway sites. Conse
quently, the Program, upon reaching a dam top elevation of HBRMH,
shifts the emergency spillway cross section it uses from HLSIDM
to HLSIDH. HBRMH is not read unless NHILSD equals 3.
ELEVA(IMAX), 3: ELEVA is the array of IMAX elevations for which
the dam site properties are supplied. The first value should be
the stream bed elevation at the dam site. The second should be
a higher contour plotted on a topographic map of the site, and
- 135 -

successive higher contours should follow until an elevation higher
than the expected catch point of the hillside cut above the emergency
spillway is reached. The contours used need not be evenly spaced,
but should be close enough together to portray site characteristics.
ELEVA functions solely to provide the Program the elevations to
which the data in the eight following arrays apply.
RESACR(IMAX), 3: RESACR provides for each water surface elevation
in ELEVA the corresponding reservoir surface area in acres. RESACR
values can be obtained by measuring the area bounded by the
appropriate contour line on the topographic map. For the Carr
Fork site, a curve relating surface area and elevation was supplied
by the Corps of Engineers. The Program uses RESACR in determining
the reservoir storage volume versus water surface elevation, the
acres of right-of-way required by the reservoir, and the number of
acres to be cleared.
LGDAM(IMAX), 3: For this array the planner supplies the crest
length required for a dam, at the proposed site, having a top
elevation equal to the corresponding ELEVA value. Values are
obtained by scaling the shortest distance, at the reservoir site,
between contours on opposite sides of the stream. Lengths of
saddle dams where required should also be added to the total.
- 136 -

The Pr9gram uses LGDAM in calculating the dam embankment volume
and the area on the upstream face of the dam to be riprapped.
LGEMSP(IMAX), 3: For LGEMSP the user supplies the emergency
spillway lengths required for dams having as their top elevations
the corresponding ELEVA values. In evaluating LGEMSP, the
user approximates on the topographic map, for each ELEVA, the
location of the emergency spillway. The spillway length is
measured from the map as the distance from the spillway crest
or high point on the ridge through which the spillway is cut, to
the point downstream from the dam site where flow over the spill
way will re-enter the channel. Normally, LGEMSP should be
measured in a straight line. The Program uses LGEMSP to deter
mine the excavation and concrete quantities required by spillway
construction.
LGAPCH(IMAX), 3: LGAPCH represents, for a dam having the
corresponding ELEVA as its top elevation, the length of the
emergency spillway approach channel. The spillway having
been located for each ELEVA in determining LGEMSP, LGAPCH
is measured from the map as the horizontal distance from the point
at which cutting into the hillside upstream from the emergency
spillway begins to the spillway crest. LGAPCH may be measured
- 137 -

along either a straight or a curved line depending on which requires
the less excavation. LGAPCH is used by the Program in calculating
approach channel excavation quantities.
CRELOC(IMAX), 3: CRELOC represents the cost of relocations
made necessary by construction of a dam whose top elevation is
the corresponding ELEVA value. It should be determined by a survey
of the types and length of facilities requiring relocation and assoc
iated cost estimates. Highways and railroads usually comprise
the bulk of the cost, but powerlines, cemetaries, telephone lines,
etc. may also be involved.
At Carr Fork, the Corps of Engineers plans to relocate all high
ways previously located more than approximately twenty feet below
the dam top. The total cost of relocations was $8,308,000, the
majority of which was for relocating 19.91 miles of highways. The
number of miles of required highway relocations up to various
contours was measured and multiplied by $8,308,000/19.91 miles
to estimate the total cost of relocations up to these contour eleva
tions. The method assumes total relocation cost to be proportional
to the length of highways relocated. The relocation cost was then
plotted against relocation elevation. By adding twenty feet to
each value on the elevation axis, the plot became CRELOC as a
function of ELEVA. Intermediate values of CRELOC were read from
- !38 -

the curve. The cost of relocations made necessary by the design
dam height is included in the total cost.
HLSIDL(IMAX), 3: HLSIDL contains a cross section of the lowest
of the alternative emergency spillway sites (the only site if just one
is used). If the site is on the side of a hill monotonically rising
above the stream, the array should contain the horizontal distance
from the center of the stream to the point on the hillside having
the elevation specified in ELEVA. If the site is on a side saddle,
a value of O. 0 should be used for all elevations below the bottom
of the saddle, and the appropriate saddle width should be used for
higher elevations.
Values are obtained by scaling on the topographic map.
The Program uses HLSIDL in locating the emergency spillway
cut catch points, figuring the crest excavation cross section,
and determining the excavation quantities.
HLSIDM(IMAX), 3: The discussion of HLSIDL applies here also
except that HLSIDM refers to the second lowest alternative
emergency spillway site. No data is read into the array unless
NHILSD equals 2 or 3.
HLSIDH(IMAX), 3: HLSIDH is also analogous to HLSIDL, referring
to the highest alternative emergency spillway site. No data is
- 139 -

read unless NHILSD equals 3.
NWH, 3: Retaining walls are required for the sides of vertically
walled emergency spillways and stilling basins built in earth.
Rather than executing a wall design for each wall height required,
the Program is provided data describing the quantity of wall con
crete as a function of required wall height. The data should be
based on a retaining wall design appropriate for the soil conditions
at hand.
Villines {38) determined for various wall heights (HWAL)
the volume of concrete (CONWAL) per foot of length of the wall.
The Program, having calculated the wall height, uses this height
to interpolate or extrapolate CONWAL values to determine the
concrete volume per foot of wall length. NWH represents the
number·of wall heights and corresponding unit volumes that are
supplied, and hence the number of each to be read.
HWAL(NWH), 3: For HWAL the user supplies the wall heights
for which the corresponding unit concrete quantities are provided
in CONWAL. HWAL values should cover the entire range of wall
heights expected to be encountered in design.
CONWAL(NWH), 3: CONWAL represents the unit volume of
concrete, in cubic yards per foot of length, of a retaining wall
- 140 -

having a height equal to the corresponding value of HWAL. Values
may be determined for various wall heights by standard foundation
design procedures (26). Since the Carr Fork emergency spillway
is in solid rock, no retaining walls are needed. Thus a value of
0. 0 is used for CONWAL for each wall height. The Program multi
plies the value interpolated from CONWAL by the wall length and
by the unit cost of structural concrete to determine the cost of
retaining walls .
Physical Factors: A number of physical characteristics of the
proposed dam site and design dimensions for the dam and reservoir
must be supplied the Program. These are used by the Program in
arriving at the dimensions and cost of the optimum flood control
reservoir.
BYVERT, 3: For BYVERT the Program user supplies the vertical
distance in feet above the dam top to the right-of-way purchase
line. If the line is lower than the dam top, BYVERT is negative.
The value depends on the right-of-way purchasing policy of the
planning agency. The Program adds BYVERT to the dam top eleva
tion to get the right-of-way purchase elevation. This elevation
is taken into RESACR to interpolate the number of acres of right-of
way to be purchased.
- 141 -

CONBOT, 3: CONBOT represents the thickness in feet of the
concrete in the emergency spillway chute bottom. The value is
determined by structural design or more approximately from standards
used by the planning agency. The emergency spillway at Carr Fork
is in solid rock so no concrete bottom is needed. The Program
uses CONBOT in determining the volume and hence the cost of
emergency spillway concrete.
CTBW, 3: When dams are built on pervious material, a cutoff
trench is dug and backfilled with impervious material to prevent
seepage water from undermining the dam. CTBW represents the
bottom width of this cutoff trench, A value may be selected by
analysis of seepage flow nets. CTBW is used by the Program in
calculating the trench volume. The cost of excavating and back
filling the cutoff trench with impervious material is calculated
by multiplying the trench volume by the combined unit cost of
excavation and backfilling.
CWEIR, 3: The emergency spillway discharge associated with
a given reservoir water surface elevation is based on the equation:
Q = KLH3/Z,
where Q is the discharge in cfs, L is the weir length (in this
case the spillway width) in feet, H is the head on the weir in
- 142 -
(8)

feet and K (CWEIR) is the weir coefficient. A value may be obtained
from tables in hydraulic texts or handbooks (34, pp, 270-282),
model studies, or analysis of flow over weirs of known profile at
existing dams. The Program applies Eq, 8 to get the emergency
spillway discharge.
DMTPW, 3: The top width of the dam in feet is read as DMTPW.
Criteria for determining the top width (34, pp, 201-203) depend on
dam height and whether a public or only a maintenance road is built
across its top. The Program uses DMTPW in its calculation of the
volume of dam embankment.
DPRCKH, 3: DPRCKH represents the mean depth in feet to bedrock
at the site of the emergency spillway, This depth is determined
by subsurface exploration of the spillway site, The DPRCKH value
is used by the Program in determining how much of the spillway
excavation will be in earth and how much will be in rock. The
Program always sets the spillway crest control section in rock,
DPRCKV, 3: DPRCKV represents the mean depth in feet to bedrock
under the dam as determined by subsurface exploration of the
stream bed and adjacent alluvium, DPRCKV determines the cutoff
trench depth and thus is used by the Program in determining the
volume of earth excavation and backfill that will be required to
- 143 -

provide the dam with an adequate impervious foundation.
DPRP, 3: Large rocks, called riprap, or some other surface protec-
tion is usually placed on the upstream face of earth dams to prevent
washing and sloughing of the embankment material. DPRP represents
its depth in feet measured perpendicular to the upstream face of
the dam. The depth used should depend on the severity of the
erosive forces, the quality of the protective surface, and the eroda-
bility of the dam embankment material. DPRP is multiplied by the
area covered and by the unit cost of riprap to get the total cost.
FPIPE, 3: The Darcy friction factor, represented by this variable
name, is used in determining the size of principal spillway pipe
required to accommodate a given flow. The basic equation is:
where hf is the head drop through the pipe, L is the length and
D the diameter of the pipe, and v2 /4g is the velocity head, all
in feet, and f (FPIPE) is the friction factor. A value for FPIPE
may be obtained from curves found in hydrau'lics texts or hand-
books based on probable pipe size and concrete pipe. Taking the
difference in the reservoir surface and tailwater elevations as
hf, and knowing f, L, and g, the Program calculates the principal
spillway flow velocity and discharge for a trial D to see whether
- 144 -
it is adequate .
QRATIO, 3: QRATIO is the ratio of the peak to the average principal
spillway discharge during the IMPTY day drawdown period. An
approximate value is obtained from the ratio of discharge through
the principal spillway when the flood storage is full to discharge
when half full. QRATIO is used in sizing the principal spillway to
estimate average flow during the design storm (see CUMVOL).
SEDIN, 3: Soil particles displaced by rainfall and runoff are
carried along in turbulent streams and deposited in quiescent reser
voirs. In reservoir design, extra storage must be allocated for this
sediment deposit. Otherwise, the capacity of the reservoir would
gradually be reduced with time until it would no longer function
properly. SEDIN is the annual sediment inflow to the reservoir in
acre-feet per square mile of tributary drainage area. The value
depends primarily on ground slope, soil erodability, rainfall inten
sity, and vegetative cover (2, pp. 17:2-17:33). SEDIN is multiplied
by the drainage area tributary to the reservoir site and by the design
life of the reservoir to get the storage reserved for sediment.
STLBOT, 3: At the point where the emergency spillway flow
re-enters the stream channel, a stilling basin may be required to
dissipate the energy and prevent excessive channel erosion.
- 145 -

STLBOT represents the thickness in feet of the bottom of the stilling
basin, and is determined by the structural design standards of the
planning agency. Greater hydraulic forces usually require STLBOT
to exceed CONBOT. Because of an infrequently used emergency
spillway with a rock bottom, a value of O. 0 was supplied for STLBOT
in our study. The Program uses STLBOT in calculating the quantities
and hence the cost of providing the stilling basin.
TRV, 3: A trashrack or bar screen is provided at the principal spill
way inlet to keep debris from entering and clogging the pipe or
damaging the gates. TRV is the design velocity in feet per second of
flow through the trashrack. The need for and the design of trash
racks is based primarily on the size of the conduit and the nature of
the trash burden (34, pp. 360-361). The Program divides the peak
principal spillway flow by TRV to determine the inlet opening area
required through the trashrack, which is in turn used to estimate
the cost of the required inlet structure to the principal spillway.
TWELEV, 3: For TWELEV the Program user supplies the design
tailwater elevation for use in design of the emergency spillway
stilling basin and sizing the principal spillway. The design eleva
tion can be taken from stream flood profiles or backwater computa
tions as the stream water surface elevation predicted during the
- 146 -

spillway design flood.
WDEMSP, 3: The Program assumes a constant emergency spillway
width from the crest downstream through the stilling basin. It deter
mines the economically optimum emergency spillway width by
balancing increased spillway cost against a smaller dam and right
of-way requirement. For WDEMSP the user supplies the initial
width to be tried by the Program. The Program calculates the cost
involved in using an emergency spillway of width WDEMSP, then
tries smaller or larger spillways until the least costly width is
determined. After the first run, computer time is saved by adjusting
WDEMSP to the determined optimum value.
XTRSTR, 3: If the planning agency wishes to incorporate, within
the reservoir, storage for purposes other than flood control such
as recreation or water supply, the required capacity in acre-feet
is supplied for XTRSTR. If such storage is not required, XTRSTR
is assigned a value of 0.0. The Program uses XTRSTR in its deter
mination of the size and cost of a conservation storage dam and
reservoir. Flood storage is then justified if it produces benefits
in excess of the cost of adding the additional required storage to
the conservation storage reservoir. No provision is made for
seasonal variation in flood storage requirement in multipurpose
reservoirs.
- 147 -
ZCT, 3: ZCT represents the side slope (ratio of horizontal to
vertical) of the cutoff trench described under CTBW. The value
depends on the stability of the soil at the dam site. ZCT is used
by the Program in calculating the excavation and backfill quantities
involved in installing the cutoff trench.
ZDN, 3: The slope (ratio of horizontal to vertical) of the downstream
face of the earth dam is represented by this variable name. The
value is selected by a slope stability analysis of the dam face
based on known soil properties and expected seepage rates (17,
pp. 205-208). The program does not directly provide for benching
the dam face, but an equivalent flatter slope can be substituted.
The Program uses ZDN in its calculation of the dam embankment
quantities.
ZES, 3: For this variable name, the user supplies the cut slope
(again, the horizontal to vertical ratio) in the hillside above the
emergency spillway. The slope depends on the stability of the
in place soil. In solid rock hillsides, the slope may be nearly
vertical (0. 25 at Carr Fork). An equivalent average slope may be
used where strata of varying stability are exposed or where
benching is desirable. The Program uses ZES to calculate the
quantities of emergency spillway excavation.
- 148 -

ZUP, 3: The statements made about ZDN also apply here except
that ZUP represents the upstream rather than the downstream slope of
the dam embankment. The slope stability study is generally based
on forces on the dam face during rapid reservoir drawdown.
Unit Cost Factors: In determining the optimum level of flood protec
tion, the Program maximizes the net benefits realized from flood
storage. Net benefits are determined by subtracting the cost of pro
viding flood control storage from the net reduction achieved in down
stream cost. The cost of reservoir storage is calculated by
multiplying quantities by unit costs. The user supplies these unit
costs for the variables described below.
UCDAM, 3: UCDAM represents the unit cost of the dam embankment
material in dollars per cubic yard. The value should also include
the cost of items not otherwise accounted for in the subsequent
unit costs. Such items might include sand filters, base and
surface materials for appurtenant roads, guardrails, etc. The
value of UCDAM is determined by referring to cost reports or
contract bid prices for similar work in the vicinity. The total
cost of items to be included under UCDAM is divided by the volume
of the corresponding dam. The Program multiplies UCDAM by the
calculated embankment volume to estimate the cost of the in place
- 149 -

dam embankment.
UCCT, 3: UCCT is the variable name for the unit cost of cutoff
trench excavation and backfill, given in dollars per cubic yard.
The value is derived from bid prices on similar work in the same
area. The Program multiplies UCCT by the calculated cutoff trench
volume to get.the total cost of _providing the trench.
UCRP, 3; For UCRP the Program user supplies the unit cost of
riprap or other protective material for use on the upstream face of
the dam expressed in dollars per cubic yard, again evaluated from
local bid prices on previous work. The Program calculates the cost
of providing riprap for the upstream dam face by multiplying the area
to be protected by the riprap depth (DPRP) and by the unit cost (UCRP).
UCSPEX, 3; The cost in dollars per cubic yard of earth excavation
for the emergency spillway is supplied for UCSPEX. The value,
obtained from bid prices on similar excavation work, is multiplied
by the volume of earth (as contrasted with rock) to be removed in
forming the emergency spillway channel to determine the earth
excavation cost to be included in the total emergency spillway cost.
UCRKEX, 3: UCRKEX is the unit cost of rock excavation required
in emergency spillway construction.
- 150 -

UCSPCN, 3: UCSPCN represents the unit cost in dollars per cubic
yard of in place structural concrete including reinforcing and
structural backfill used in construction of the emergency spillway.
The value, obtained from bid prices on similar work, is multiplied
by the volume of concrete in the emergency spillway walls and
slabs to get the total cost of concrete construction.
UCPRCN, 3: This variable supplies the unit cost of principal
spillway conduit construction in dollars per cubic yard of the spill
way pipe. The value is determined by inspecting bid prices on
similar work or from cost reports of completed projects. The total
cost involved in installing the principal spillway conduit, including
such items as excavating, installing seepage collars, the cost of
the pipe, and backfilling around the pipe, is divided by the volume
of the conduit itself in cubic yards to obtain UCPRCN. The Program
determines for the proposed dam and corresponding principal spill
way flow, the length, diameter and wall thickness of the conduit.
From these values, the pipe volume is calculated and multiplied
by UCPRCN to get the total conduit cost.
UCCNID, 3: UCCNID is similar to UCPRCN except that UCCNID
alludes to those items that pertain to the principal spillway outlet
works or energy dissipator. The bid items that should be included
- 151 -

here include the concrete and reinforcement in the outlet works as
well as appurtenant items such as riprap and guardrails. The
Program multiplies the concrete volume in the design outlet works
by UCCNID to get the cost.
UCTRK, 3: UCTRK represents the unit cost of the entire principal
spillway inlet structure incbllars per square foot of the opening.
From contract bid prices or cost reports on completed projects,
the total cost of items pertaining to the principal spillway inlet is
divided by the approximate area of the inlet opening to estimate
UCTRK. Items comprising the cost may include the operating tower
structure, antivortex device, service bridge, and inlet gates
including the electrical mechanisms for opening and closing. The
opening area is approximated by dividing the design discharge by
the design trashrack velocity. The Program calculates the trashrack
area required for each design flow and multiplies the area by
UCTRK to obtain the total cost of the principal spillway inlet
structure and trashrack.
UCCLR, 3: Again, from contract bid prices, the Program user deter
mines the unit cost of clearing the reservoir site in dollars per acre
to provide this value. The Program multiplies UCCLR by the area
between an elevation five feet below the top of the conservation
- 152 -
storage pool and the emergency spillway crest elevation, A
weighted average cost must thus be used where only spot clearing
is required,
CSMD, 3: CSMD is a contingency factor used for reservoir installa
tion cost analogous to CSM used for channel improvement. The
Program multiplies the cost of constructing the dam and reservoir
by CSMD to account for contingencies in dam construction,
ESMD, 3: ESMD is the multiplier for the dam and reservoir con
struction cost to account for the cost of project engineering, admin
istration, and inspection analogous to ESM for channel construction.
The Program multiplies the construction cost including contingencies
by ESMD to get the total cost including engineering,
MDAM, 3: This variable supplies the annual maintenance cost
for the dam and reservoir as a fraction of the construction cost.
A value can be obtained from records of maintenance cost on
completed facilities. The value used at Carr Fork was that derived
by Rosenbaum (23) for Dewey Reservoir where annual maintenance
cost divided by the construction cost gave an MDAM value of 0,008.
The Program multiplies the reservoir construction cost by MDAM
and includes this annual maintenance cost in the total annual cost
of flood damage reduction,
- 153 -

Downstream Benefits: Program III calculates the project flood control
benefits derived in up to 14 subwatershed flood plains downstream
from the reservoir site. Actually, some beneficial effect may extend
all the way downstream to the ocean. Data describing benefits
realized downstream from the study area are read in this section. The
benefits accruing downstream from the study area will increase with
future flood plain development.
DMBN(2, 10), 3: Array DMBN supplies estimates of the annual
benefits (the second row) accruing downstream from the area analyzed
directly by the Program as a function of flood control storage (the
first row). The Corps of Engineers has made studies relating benefit
to storage for major river systems (30). Values for intermediate reaches
between the study area and a major river may be estimated by routing
the flood flows for various reservoir sizes through the downstream
reaches and using the change in flood peak to approximate the
benefits in the flood plains. The Program, using the design flood
storage, interpolates the corresponding DMBN value from the array.
These benefits are added to the annual benefits realized in the
study area as calculated by the Program.
DMBNF(NSTEMX), 3: To account for changes in the average annual
downstream benefits with time, the planner supplies a DMBNF
- 154 -

value for each planning stage. This value represents the ratio of
the average annual downstream benefits in the stage to the average
annual downstream benefits over the entire planning period.
Values for the array may be determined from population projections
over the project life. The assumption that flood benefits are
roughly proportional to population could be used to plot benefits
versus time. Discounting computations provide average annual
values during each stage and an average annual value for the whole
.Project life. The Program multiplies the average annual downstream
benefits over the entire planning period (interpolated by storage
from DMBN) by the DMBNF va Lue for the stage being analyzed to
get the average annual downstream benefits during that stage.
- 155 -

Chapter V
INTERPRETATION OF OUTPUT
The findings of the University of Kentucky Flood Control
Planning Programs are expressed in the output printed by the com
puter. The findings, once properly interpreted by the planner, form
the basis for beginning the more intensive final project analysis
leading to formation of formal construction plans and specifications.
In order to guide the Program user in this interpretation, this chapter
is divided into two main parts. First, each output provided by the
Programs is presented and explained on illustrative tables. Second,
the results of the study on the Upper Kentucky River are provided in
order to illustrate the kinds of decisions which can be based on
Program results in the context of a specific flood problem.
PROGRAM II
Since the output varies between the two Programs, each will
be presented individually. Program II does not include consideration
of a flood control dam and reservoir and thus has less output. Even
so, the complete text of the computer output could not feasibly be
presented here because of its great length. The output that is
presented must thus take the form of tables illustrating each

output type. The order in which the output is printed varies substan
tially with Program findings, but the reader can get a good idea of
output sequence by following the order in which WRITE statements
appear in the listing of Program II in Appendix A.
While table headings and comments within the output are
largely self explanatory, each type of output will be presented by
an illustrative table copying exactly the format of typical computer
output along with additional explanatory comments as needed. Since
the Kentucky River studies did not find a number of potential flood
measures to be economically justified, many of the numbers on the
following tables were obtained from other studies. Furthermore,
all are out of context with respect to the balance of the output.
Thus, the reader should not attempt to attach any particular signifi
cance to the actual numbers on the following tables. They are
unimportant for the purpose at hand.
UNIT COST OF LAND USE MANAGEMENT
Unit cost of restricting all urban development from the flood
plain as estimated from Eq. 5 is developed and printed by sub
routine CALCLU. Table 4 presents, for each subwatershed in each
planning stage, the annual cost in dollars per acre. This output is
printed only when L6 is read as 1.
- 157 -

TABLE 4
ANNUAL COST OF LAND USE MANAGEMENT
LOCATION ADJUSTMENT COST IN $/ACRE BY SUBWATERSHED-STAGE
NW STAGE 1 1 27. 84 2 23.34
TRACE OUTPUT
STAGE 2 27.84
338.88
STAGE 3 33,54
701.13
STAGE 4 47.83
742.64
STAGE 5 106.91 765.21
The TRACE output is obtained by reading LS as an integer 1
value. The TRACE output shows the combination of channel improve-
ment (S), flood proofing (P), and land use adjustment (L) being tried
currently in CHOPTM, whether the measures are found economical or
not. Each combination tried is represented in the output by the
number of the subwatershed and a mnemonic for each measure.
Repeated appearance of a letter in the output indicates a measure that
is almost economically justified if it is not selected. The same
mnemonic may be repeated several times for increasingly higher
levels of protection. An example of TRACE output is shown on
Table 5.
CHECK OUTPUT
CHOPTM systematically compares alternative combinations
of the three flood plain measures. If the planner is interested in
knowing each new combination tried that has a lower total cost
- 158 -

TABLES
FLOOD PLAIN MEASURES CONSIDERED
2 s 2 S+P 2 S+P 2 S+P 2 S+P 2 S+L 2 S+L+P 2 S+L+P 2 S+L+P
than any other combination tried thus far, he reads 16 as integer 1
and receives CHECK output. This output (Table 6) shows the number
of the subwatershed, a mnemonic for the combination of measures
being tried, the frequency at which flooding begins in the subwater-
shed, and the design flood frequency, corresponding design discharge,
and annual cost of channel improvement (S), land use (L), and flood
proofing (P) measures respectively. The final three values are the
cost of residual flooding, the cost of uncertainty, and the total cost
associated with the measure combination, Since each combination
costs less than that before as one goes down the page, the total
cost in the last column will monotonically decrease. A mnemonic
of LN indicates consideration of lining a previously improved
channel, while BG indicates no new channel improvement and no
nonstructural measures are being considered. In cases where the
- 159 -

TABLE 6
ALTERNATIVE FLOOD PLAIN MEASURE COMBINATIONS
FOLLOWING OPTIMIZATION THROUGH INNER LOOPS CHANNELS LOCATION PROOFING COST OF COST OF TOTAL
BEG S QS CS L QL CL P QP CP FLOODING UNCERTAINTY COST
lBG 90.897 0.0 so. 0. 0.0 0. 0. 0.0 0. 0. 768239. 89322. 857561, 1 P 90.897 0.0 so. o. 0.0 0. o. 43,0 419. 14711. 472531, 133209. 620451. 1 P 90.897 0.0 so. 0. 0,0 0. o. 20.0 654. 21291. 300807. 118926. 441025. lLP 90,897 0.0 so. 0. 43,0 419. 10776. 43,0 419. 1878. 79763. 29341. 121758. lLP 90.897 0.0 so. o. 43.0 419. 10776. 20.0 654, 4368. 60781. 29658. 105583. 1 S 90.897 0.050 2257. 36384. . 0 o. 0. 0.0 o. o. 0. o. 363 84.
I
>---' C1' a
TABLE 7
STAGE ANALYSIS SUMMARY
SUMMARY FOR STAGE 3
SUMMARY OF MEASURES AND COSTS CHANNELS LOCATION PROOFING COST OF COST OF TOTAL
UNIT BEG s QS cs L QL CL p QP CP FLOODING UNCERTAINTY COST 1 90,90 0,050 2257. 36384. 0,0 0.0 0.0 0,0 0,0 0.0 0.0 0,0 363 84. 2 0.05 0. 050 2733. 100010. 0,0 o. 0 0,0 0.0 0,0 0,0 0,0 0.0 100010.
TOTAL COSTS 136394. 0,0 0.0 0,0 0.0 136394.

economically optimum measures cannot be implemented because of
intangible considerations, the output in Table 6 is valuable in evalu
ating alternative potential combinations which might be substituted.
SUMMARY BY STAGE
This output (Table 7) summarizes the optimum combination of
measures found in all subwatersheds at the end of each stage. Conse
quently, it is identical to the last line of CHECK output except that
no mnemonic is printed. At the bottom of the table are also printed
sums of the cost columns. Where right-of-way holding is being
exercised, its cost is included in the total for channel construction
and in the grand total but not in the individual subwatershed totals.
SUMMARY OF CHANNEL IMPROVEMENTS
The channel improvements incorporated by the program in the
optimum combination of measures are presented for all the subwater
sheds evaluated in the planning stage on a single summary table
(Table 8). No output is printed on the table for subwatersheds
where no Channel improvement proves economical. No output at
all is printed under the table heading if channel improvement is
not economical in any subwatershed.
The summary of channel improvements relates to the planner
pertinent data on the optimum channel found for the subwatershed-
- 161 -

TABLE 8
SUMMARY OF CHANNEL IMPROVEMENTS
X-SECTION TOP ROW TYPE OF
UNIT CHANNEL STAGE CAPACITY AREA
SQ. FT. WIDTH WIDTH
ACTION CFS.
1 TRAPEZOIDAL LINED BUILT 2257. 2 RECTANGULAR LINED ENLARGED 2733.
180.6 234.1
FT. FT.
36.1 63.5 30,2 50.2
stage. This data includes the unit (subwatershed number), the type
of channel (such as unlined with drop structures), the stage action
(whether the improved channel described was initially built, enlarged,
or unchanged during the current stage), the capacity in cfs, cross
sectional area in square feet, and top width in feet of the channel,
the width in feet of right-of-way to be purchased, the channel design
depth in feet, the number and height in feet of drop structures in the
reach, and the number of highway and railroad bridges that remain the
same, are built, or are extended during the subwa tershed-s tage.
TRACTIVE FORCE OUTPUT
When construction of an unlined prismatic channel is being
considered, the actual tractive force developed by the design flow
(TFF) is determined and compared with the maximum allowable trac-
tive force in the subwatershed (TF). If the actual tractive force is
found excessive, its value in pounds per square foot is printed (for
example: "TFF = 1. 3 7 "), and a drop structure is added to reduce
- 162 -

TABLE 8 (Continued)
SUMMARY OF CHANNEL IMPROVEMENTS
DROP STRUCTURES DEPTH NUMBER HEIGHT HIGHWAY BRIDGES RAILROAD BRIDGES
FT, FT, SAME BUILT EXTEND SAME BUILT EXTEND
6.0 0 0,0 0 2 0 0 1 0
7,8 0 0.0 8 0 0 0 0 0
tractive force, The new tractive force is then calculated and checked
against the allowable value. If it is still excessive, a larger drop
structure is installed, and the second TFF value is printed. This
process is repeated until the tractive force developed is less than
the maximum allowed.
SUMMARY OF FLOOD PROOFING
This output (Table 9) is developed and printed by Program II as
s stage summary whenever flood proofing is incorporated into the
optimum flood control policy in any sub.watershed-stage. The infor-
mation given is the number of the sub.watershed and the nunber of
acres within the sub.watershed flood plain within which all buildings
TABLE 9
SUMMARY OF FLOOD PROOFING MEASURES
UNIT 1 2
AREA PROTECTED 499 .. ACRES 307, ACRES
- 163 -

should be flood proofed, This area is that inundated by the flood
proofing design flood shown on Table 6, If no flood proofing is
selected in any subwatershed, the statement "NO FLOOD PROOFING
CAN BE JUSTIFIED ECONOMICALLY IN THIS STAGE" is substituted
for Table 9.
SUMMARY OF LOCATION ADJUSTMENT
This stage summary (Table 10) is similar to that for flood
proofing. The output consists of the subwatershed number and the
number of acres within the subwa tershed flood plain from which
urban development should be restricted. The statement "NO LAND
USE ADJUSTMENT CAN BE JUSTIFIED ECONOMICALLY IN THIS
STAGE" is substituted for Table 10 if no land use management
practices are selected in any subwatershed.
SUMMARY OF RIGHT-OF-WAY HOLDING
If the Program finds it economical to purchase right-of-way
in earlier stages for future channel construction, a stage summary
of the holding (Table 11) is included in the Program output. The
UNIT 1 2
TABLE 10
SUMMARY OF LOCATION MEASURES
AREA OF RESTRICTED LAND USE 318. ACRES 197. ACRES
- 164 -
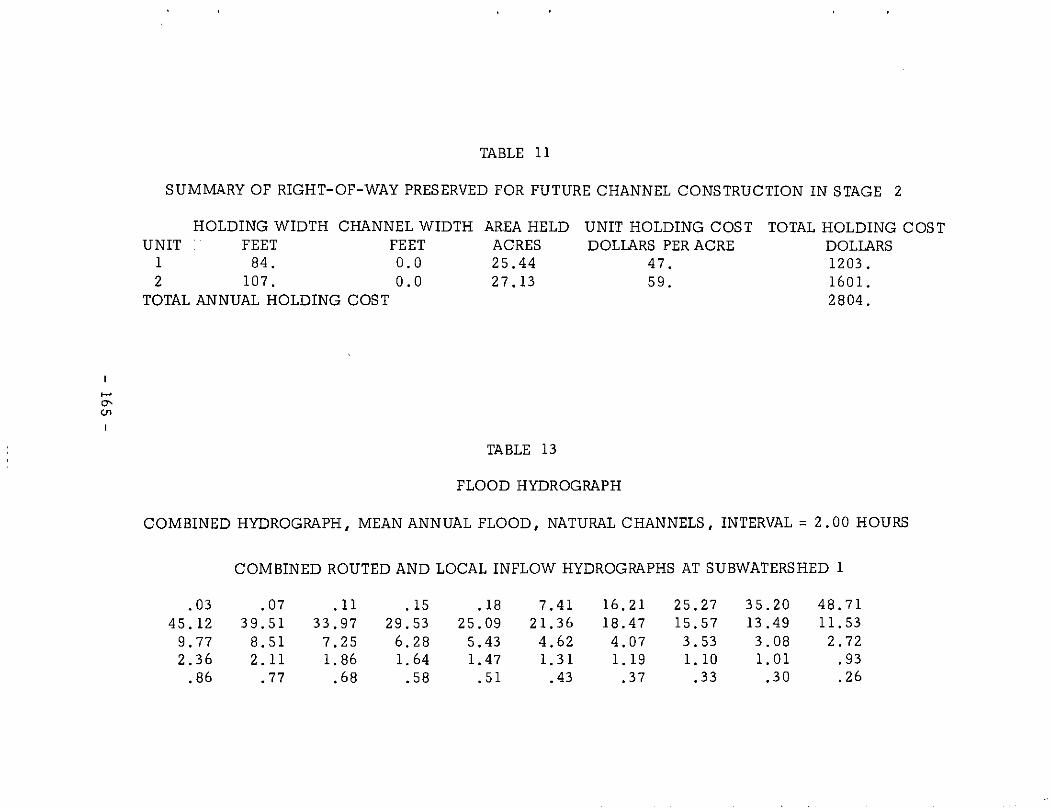
..... O'
"'
TABLE 11
SUMMARY OF RIGHT-OF-WAY PRESERVED FOR FUTURE CHANNEL CONSTRUCTION IN STAGE 2
HOLDING WIDTH CHANNEL WIDTH AREA HELD UNIT HOLDING COST TOTAL HOLDING COST UNIT FEET FEET
1 84. 0.0 2 107. 0.0
TOTAL ANNUAL HOLDING COST
ACRES 25.44 27.13
TABLE 13
DOLLARS PER ACRE 47. 59.
FLOOD HYDROGRAPH
DOLLARS 1203. 1601. 2804 .
COMBINED HYDROGRAPH, MEAN ANNUAL FLOOD, NATURAL CHANNELS, INTERVAL= 2.00 HOURS
COMBINED ROUTED AND LOCAL INFLOW HYDROGRAPHS AT SUBWATERSHED 1
.03 .07 . 11 . 15 .18 7. 41 16.21 25.27 35.20 48.71 45.12 39.51 33.97 29.53 25.09 21. 36 18.47 15.57 13.49 11. 53
9.77 8.51 7.25 6.28 5.43 4.62 4.07 3.53 3.08 2.72 2.36 2. 11 1.86 1. 64 1.47 1. 31 1. 19 1. 10 1. 01 .93
.86 .77 .68 .58 . 51 .43 .37 .33 .30 .26

summary contains for each s ubwa tershed its number, the total width
in feet of the right-of-way to be held, the width of any existing
improved channel (right-of-way may be held for potential future
channel enlargement), the number of acres of right-of-way held,
the economic cost of holding in dollars per acre, and the total holding
cost in dollars. The stage total for all subwatersheds is printed at
the bottom and added into the grand total on Table 7.
AVERAGE ANNUAL COST OVER ALL STAGES
The final summary presented by the Program II output
contains the discounted average annual cost totaled for all subwater-
sheds over the entire planning period for the measures found
optimum in the analysis (Table 12). The summary consists of a list
of the measures implemented (potentially channel improvement, land
use, and flood proofing) and the average annual cost involved in
implementing the optimum level of each. Also shown are the average
TABLE 12
AVERAGE ANNUAL COST OVER ALL STAGES
COST OF CHANNEL IMPROVEMENT COST OF LAND USE COST OF FLOOD PROOFING COST OF RESIDUAL FLOODING COST OF UNCERTAINTY TOTAL COST
- 166 -
DOLLARS/YEAR 82777.
2186. 3226. 6526.
938. 95654.

annual costs of residual flooding, uncertainty, and the average
annual total cost associated with the flood control plan.
PROGRAM III
All the output discussed for Program II except the "Summary by
Stage" of Table 7 and the "Average Annual Cost Over All Stages" of
Table 12 is also produced by Program III. The format and presenta
tion of Tables 4, 5, and 6 are identical between the two Programs.
Tables 8, 9, 10, and 11 are found in Program III printed out one line
at a time for each subwatershed-stage rather than as single stage
summary tables. In the event the line does not apply to a specific
subwatershed-stage, no line is printed.
Program III also prints out many other output tables related to
flood hydrograph development and routing as well as estimating
quantities and cos ts for the dam and reservoir. Some of this output
is optional upon request by the user through variables LB, 19, and
110, and some is automatically printed.
HYDROGRAPH PRINTOUT
Program III determines the flood peak by routing hydrographs
of various frequencies through the reservoir, if there is one, and
thence through the downstream channel reaches, adding in each
subwa tershed the hydrograph of the flow generated within its
- 167 -

tributary area. If the user so specifies through variable 19,
included in the output will be the reservoir outflow and each sub
watershed mouth hydrograph developed by the Program. Each hydro
graph is headed in the output by an explanation of the channel
conditions and frequency used in its development. All the hydro
graphs are given as 50 values of discharge separated ·by time
interval HYDINT. An example of this output is on Table 13.
HYDROGRAPH PARAMETERS
In developing a hydrograph, the Program determines the mean
annual and the 200-year flood peak and flood volume based on the
frequency, the drainage area, and the degree of urbanization and
channelization. Where the reservoir design flood frequency is
neither of the above two values, its peak and volume is also deter
mined. Based on the peak-volume relationship and the time to peak,
a hydrograph shape is interpolated from HYDBAS. The HYDBAS
values are expressed as a fraction of the peak flow so the actual
hydrograph is developed by multiplying the HYDBAS values by the
design flood peak. Included in the hydrologic details supplied by
the Program are the parameters used in developing each hydrograph.
These parameters (Table 14) are: the mean annual, 200-year, and
design flood peaks and flood volumes in cfs (QF43, QFOS, QFDS,
VF43, VFOS, and VFDS respectively); the time to peak (TPW); the
- 168 -

TABLE 14
HYDROGRAPH PARAMETERS
FLOOD PEAKS QF43 = 7364. 7 AVERAGE FLOOD FLOWS VF43 = 1131.2 TPW = 9.4 HOURS
QF05 = 17014.4
VF05 = 3744.1
BASIC HYDROGRAPH PARAMETERS AW= 23.53 u = o.oo c = a.so
QFDS = 8287. 5
VFDS = 1381. 2
MEAN ANNUAL FLOOD AFQ = 0.59 QT= 3.00 AFV = 0.65 VT= 1,59 200-YEARFLOOD AFQ= 0.59 QT= 2.23 AFV= 0.66 VT= 1.83
subwatershed tributary area in square miles (AW); the fraction of
subwatershed urbanization and channelization (U and C respectively);
and for both the mean annual and the 200-year flood, the area correc-
tion factor for the flood peak (AFQ - interpolated from AFCTR), the
urbanization-channelization correction factor for the peak (QT -
interpolated from Q43 and Q05), the area correction factor for the flood
volume (AFV - interpolated from AFCTRV), and the urbanization-
channelization correction factor for the flood volume (VT - interpolated
from V43 and VOS).
BASE FLOW
This output relates the flow expected to be passing through
the reservoir at the beginning of each flood to be routed. It also
provides a corresponding water surface elevation. These two items
provide the initial reservoir flood routing conditions. A base flow
- 169 -

and water surface elevation are given for the mean annual, the
design flood, and the 200-year frequencies (Table 15). The base
flow is printed before the reservoir routing output. The water surface
elevation at the beginning of a routing is printed just before the
routing to which it pertains. Baseflow and water surface elevations
increase for rarer floods because low as well as high flows can be
expected to be larger on a frequency basis.
ROUTING SUM MARY
For each reservoir design, the floods are routed in the order:
the reservoir design frequency hydrograph to size the flood storage,
the emergency spillway design flood to size the dam and appur-
tenances, and the 200-year, mean annual, and design flood frequency
hydrographs to develop three outflow hydrographs for routing down-
stream to define the flood frequency relationship at downstream points.
After routing a flood through a potential reservoir, the Program prints
a summary of the most important characteristics of the reservoir
outflow hydrograph. This summary (Table 16) consists of the peak
TABLE 15
FLOW AND WATER SURFACE ELEVATION AT FLOOD BEGINNING
BSFL43 = 677. 0 CFS BSFLDS = 801. 3 CFS BSFL05 = 1973. 7 CFS
ELFDBG = 998.30 ELFDBG= 998.64 ELFDBG = 1001.08
- 170 -

TABLE 16
RESERVOIR OUTFLOW
PEAK DISCHARGE = 37416.
ELEVATION OF PEAK= 1037. 79
TIME TO PEAK = 2 0 •
TIME INCREMENT = 2. 00
discharge in cfs, the water surface elevation at the peak outflow,
the time to peak (in hours from the beginning of the flood hydrogra]Xl),
and the time increment used in developing the SO-element reservoir
outflow hydrograph.
ROUTING DATA
The procedure used by Program III to route floods through a
reservoir is presented by Linsley, Kohler, and Paulhus (18, pp. 224-
225). In this technique, reservoir outflow as well as the quantity
(S/T + 0/2) used in the routing are dependent on the reservoir surface
elevation. In the expression above, S is reservoir storage, T is
time interval, and O is reservoir outflow. If printing hydrograph
details is specified by reading 1 for L9, the Program prints, for
each reservoir routing, a table of values for (S/T + 0/2) and outflow,
along with the corresponding reservoir water surface elevations
(Table 17). The Program interpolates, from this reservoir routing
data, the values used in developing the routing table described
- 171 -

TABLE 17
RESERVOIR DATA USED IN ROUTING PROCEDURE
ELEVATION S/T + 0/2 OUTFLOW 1016.45 97945 .44 0.0 1016.50 98116.37 0.88 1017.00 99851.75 32.67 1018.00 103351.81 154.69 1019.00 106876.75 326.46 1020.00 110348.37 391. 64 1021.00 114516. 13 394.65 1022.00 118683. 87 397. 63 1023.00 122851. 56 400.60 1024.00 127019.31 403.54 1025.00 131187. 00 406.46 1027.00 139522. 37 412.25 1029.00 147857.75 417. 95 1034.00 171701. 75 431. 87 1039.00 196296.94 445.37 1044.00 224334.00 458.46 1049.00 253231.44 4 71. 19 1059.00 320433.94 495.67 1069.00 399480.06 519.00 1079.00 491179.06 541. 32 1099.00 738260.19 583. 41 1119.00 988557.81 622.66 1139.00 1336722.00 659.58 1179.00 2141221.00 727.82 1219.00 3053889.00 790.19
subsequently. If GDELAY exceeds 1, the table is repeated for condi-
tions with the gate closed.
ROUTING TABLE
Each time a design hydrograph is routed through a reservoir,
the Program, upon request by the user through variable 19, prints a
detailed table of the routing. This output consists of inflow and
- 172 -
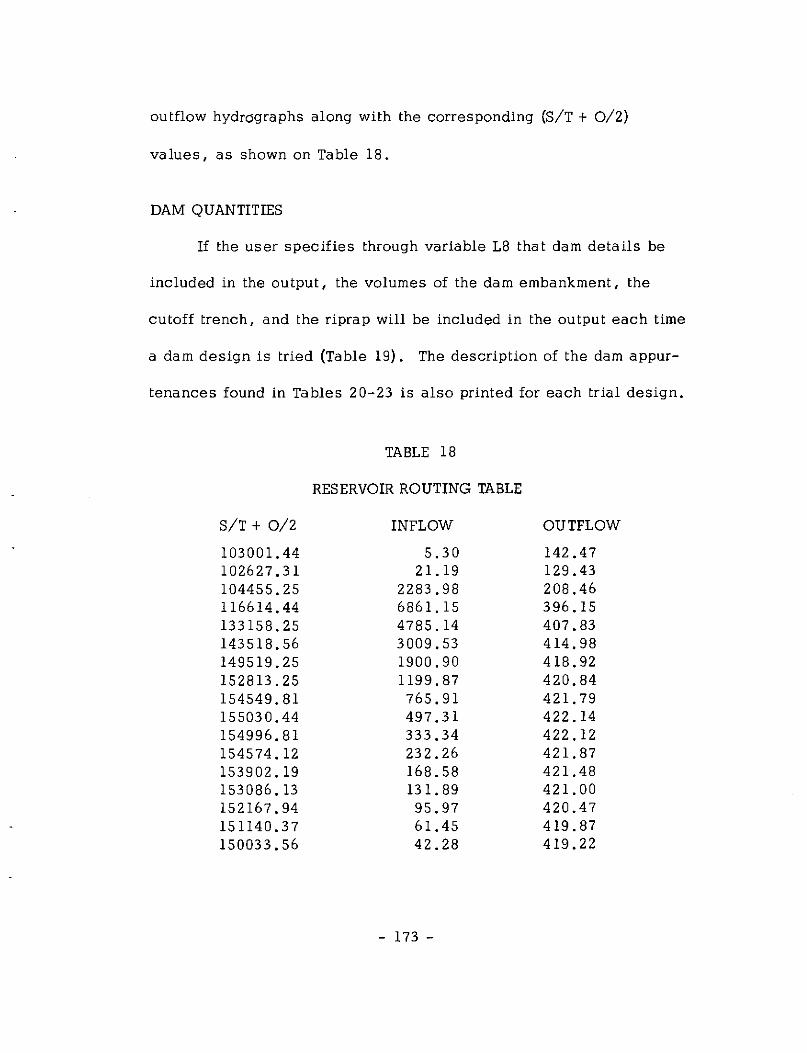
outflow hydrographs along with the corresponding (S/T + 0/2)
values, as shown on Table 18.
DAM QUANTITIES
If the user specifies through variable 18 that dam details be
included in the output, the volumes of the dam embankment, the
cutoff trench, and the riprap will be included in the output each time
a dam design is tried (Table 19). The description of the dam appur-
tenances found in Tables 20-23 is also printed for each trial design.
TABLE 18
RESERVOIR ROUTING TABLE
S/T + 0/2 INFLOW OUTFLOW
103001.44 5. 30 142.47 102627.31 21.19 129.43 104455. 25 2283.98 208.46 116614.44 6861.15 396.15 133158. 25 4785.14 407.83 143518.56 3009.53 414.98 149519.25 1900.90 418.92 152813. 25 1199.87 420.84 154549.81 765.91 421. 79 155030.44 497.31 422.14 154996.81 333.34 422.12 154574.12 232.26 421. 87 153902.19 168.58 421.48 153086.13 131. 89 421.00 152167.94 95.97 420.47 151140.37 61.45 419.87 150033.56 42.28 419.22
- 173 -

DAM QUANTITIES VOLUME OF DAM =
TABLE 19
CUTOFF TRENCH VOLUME = RIPRAP VOLUME=
DEPTH OF FLOW IN EMERGENCY SPILLWAY
323864. CUBIC YARDS 7496. CUBIC YARDS 4854. CUBIC YARDS
In solving for the depth of flow in the emergency spillway,
Program III uses an energy equation, which turns out to be cubic
and is solved by trial and error (38). By successively closer approxi-
mations, the Program determines the design flow depth at selected
points in the emergency spillway. The depths tried by the Program in
this trial and error solution are a part of the output (Table 20). If the
spillway slope turns out to be too flat to support critical flow, the
statement SUPERCRITICAL FLOW OVER EMERGENCY SPILLWAY is printed,
and the planner may wish to modify the input data. If for any reason
the Program cannot solve the cubic equation, the statement NO CHANGE
OF SIGN UP TO Dl = 0. 65 (FALL). Dl WILL BE SET = 0. 1 (FALL) SO
THAT COMPUTATIONS MAY PROCEED. will be printed. The planner
should again reevaluate his input data to make sure they are realistic.
STILLING BASIN QUANTITIES
A stilling basin is provided at the downstream end of the emer-
gency spillway to force a hydraulic jump and thus dissipate much of
- 174 -

TABLE 20
TRIAL FLOW DEPTHS
DEPTH = 1. 982 DEPTH = 1. 803 DEPTH = 1. 796
the energy acquired by the water in its flow down the chute, Energy
dissipation is necessary to prevent excessive scour in the down;..
stream channel. If LS is read as 1, descriptive output data (Table
21) include the flow depths just upstream and downstream from the
jump, the elevation of the stilling basin bottom, and the volume of
excavation and structural concrete involved in stilling basin
construction.
EMERGENCY SPILLWAYS QUANTITIES
For each dam and reservoir design tried, the pertinent details
of the accompanying emergency spillway are also obtained by reading
LS as 1. This information includes the following items: total
excavation, its division between rock and earth excavation, volume
TABLE 21
STILLING BASIN QUANTITIES
FLOW JUMPS FROM DEPTH OF O, 74 FEET TO A DEPTH OF 15. 4 7 FEET STILLING BASIN BOTTOM ELEVATION= 939, 98 FEET STILLING BASIN QUANTITIES
CONCRETE = 0. 0 CY EXCAVATION = 14835. 75 CY
- 175 -

of concrete in the spillway, horizontal distance from the spillway
crest to the stilling basin, area of the approach channel excavation
cross section at the spillway crest, length of the approach channel,
area of the spillway excavation cross section at the spillway crest,
longitudinal slope of the spillway (vertical to horizontal), average
height of the spillway walls, and finally the reference horizontal
dimensions and elevations of the spillway excavation catch points
{Table 22).
PRINCIPAL SPILLWAY QUANTITIES
The dam details, which can be requested by reading 18 as l,
describing the principal spillway are the head on the spillway during
TABLE 22
EMERGENCY SPILLWAY QUANTITIES
EMERGENCY SPILLWAY QUANTITIES TOTAL SPILLWAY EXCAVATION = SPILLWAY ROCK EXCAVATION = SPILLWAY EARTH EXCAVATION "" SPILLWAY CONCRETE VOLUME= DISTANCE FROM CREST TO BASIN= AREA APP. CHANNEL AT CREST= APPROACH CHANNEL LENGTH = SPILLWAY CREST AREA = SPILLWAY SLOPE = MEAN WALL HEIGHT =
CATCH POINTS OF HILLSIDE CUT
INNER OUTER
DISTANCE 423. 11
1188. 79
ELEVATION 1040.3-1 1076.40
- 176 -
192694.19 CU. YD. 18143 0. 94 CU. YD.
11263.24 CU .• YD. 1127. 78 CU. YD. 218.30 FEET
26199.57 SQ.FT. 201. 58 FEET
21925. 69 SQ. FT. 0.30 1.42 FEET

the design flood (water surface at the emergency spillway crest),
the corresponding flowrate through the spillway, the pipe diameter,
the volume of concrete in the spillway pipe and in the impact
dissipator, and the area of the inlet trashrack (Table 23).
COST SUMMARY
An example of a dam and reservoir cost summary as requested
by 18 is shown on Table 24. The first subtotal is the installation
cost summing the cost of constructing the dam and reservoir and the
engineering and contingency costs involved. The construction cost
is further subdivided into the dam embankment cost, the emergency
spillway cost, the stilling basin cost, the principal spillway cost,
and the cost of clearing the reservoir site. The second subtotal
includes the financial cost, along with the nunber of acres, o'f
right-of-way purchased (the actual price of land and improvements),
the "acquisition" costs (see AQR, Chapter IV), and the relocation
costs (see CIIBLOC, Chapter IV). The total cost of project installa-
tion is then multiplied by the capital recovery factor for the project
TABLE 23
PRINCIPAL SPILLWAY QUANTITIES
FOR THE DESIGN PRINCIPAL SPILLWAY HEAD= 77. FEET FLOWRATE = 483. CFS PIPE DIAMETER= 4. 00 FEET PIPE CONCRETE = 395. 84 CUBIC YARDS IMPACT DISSIPATOR CONCRETE =67. 50 CUBIC YARDS TRASHRACK AREA = 231.36 SQUARE FEET
- 177 -

TABLE 24
DAM AND RESERVOIR COST SUMMARY
DAM EMBANKMENT COSTS EMER. SPILLWAY COSTS STILLING BA.SIN COSTS PRIN. SPILLWAY COSTS RESR. CLEARING COSTS
CONSTRUCTION COSTS ENGR + CONTINGENCIES
SUBTOTAL
$ 574735.69 $ 339191. 75 $ 6919.27 $ 237069.31 $ 74665.56
RIGHT OF WAY COSTS $ 1419276.00 1036.35 ACRES PURCHASED
ACQUISITION COSTS $ 5881478.00 RELOCATION COSTS $ 4238033. 00
SUBTOTAL
TOTAL INSTALLATION COST
ANNUAL CAPITAL RECOVERY COST = ANNUAL RESERVOIR MAINTENANCE =
RESERVOIR STORAGE CONTAINING THE
$ 1232581. 00 $ 822746.06 $ 2055327 .00
$11538787. 00
$ 13594114.00
$ 540950,06 $ 16442.61
7.00 PERCENT FLOOD HAS AN ANNUAL COST OF $557392.62
design life and planning discount rate the annual cost of initial
installation is then given along with the annual maintenance cost,
the total of these two being the overall cost of the project as given
on the last line together with the frequency of the reservoir design
flood.
DAM DESIGN DETAILS
The printed physical characteristics of each dam considered
include: principal and emergency spillway design flows; sediment,
conservation, and flood storage; and the elevations of the principal
- 178 -
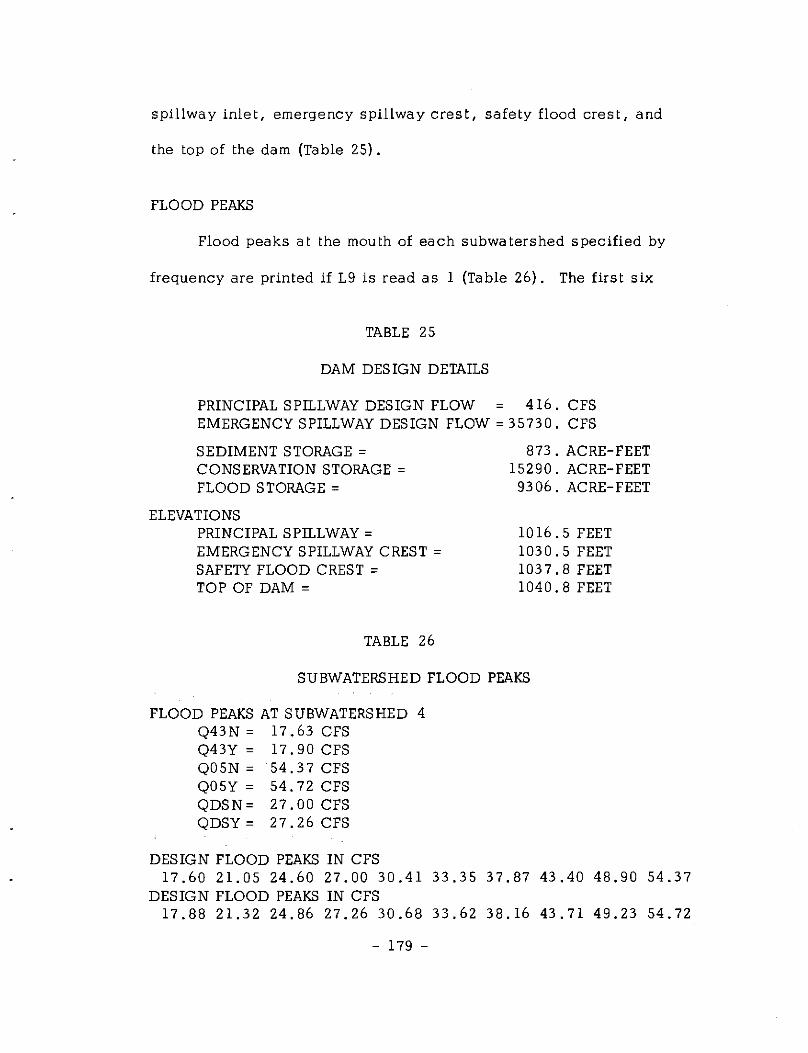
spillway inlet, emergency spillway crest, safety flood crest, and
the top of the dam (Table 25).
FLOOD PEAKS
Flood peaks at the mouth of each subwatershed specified by
frequency are printed if L9 is read as 1 (Table 26). The first six
TABLE 25
DAM DESIGN DETAILS
PRINCIPAL SPILLWAY DESIGN FLOW = 416. CFS EMERGENCY SPILLWAY DESIGN FLOW= 35730. CFS
SEDIMENT STORAGE = CONSERVATION STORAGE = FLOOD STORAGE=
ELEVATIONS PRINCIPAL SPILLWAY= EMERGENCY SPILLWAY CREST = SAFETY FLOOD CREST = TOP OF DAM=
TABLE 26
873. ACRE-FEET 15290. ACRE-FEET 9306. ACRE-FEET
1016.5 FEET 1030,5 FEET 1037. 8 FEET 1040, 8 FEET
SUBWATERSHED FLOOD PEAKS
FLOOD PEAKS AT SUBWATERSHED 4 Q43N = 17.63 CFS Q43Y= 17.90CFS Q05N= 54.37CFS Q05Y = 54. 72 CFS QDSN= 27 .00 CFS QDSY = 27. 26 CFS
DESIGN FLOOD PEAKS IN CFS 17.60 21.05 24.60 27.00 30.41 33.35 37.87 43,40 48.90 54.37
DESIGN FLOOD PEAKS IN CFS 17.88 21.32 24.86 27.26 30.68 33.62 38.16 43.71 49.23 54.72
- 179 -

values given are the mean annual flood peak for unimproved (Q43N)
and improved (Q43Y) channels in the subwatershed and corresponding
200-year and design frequency peaks (QOSN, QOSY, QDSN, and QDSY
respectively). The next group of values are the flood peaks in the
subwatershed for the NDF flood frequencies specified in array DF for
unimproved subwa tershed channels. The final NDF values are for
the same frequencies but for improved channels.
ON LINE COST SUMMING
For each trial reservoir design, floods of various frequencies
are routed through the reservoir and then downstream. The Program
determines for each flood-plain subwatershed the economically
optimum combination of measures and level of protection provided
by each to complement the reservoir storage in the overall damage
reduction program. When the best policy for a subwarershed has
been selected, details of this policy are printed out in the format
of Table 6. Also, a running total is kept and printed that shows,
in addition to the annual cost incurred in the current subwatershed,
the total annual cost incurred in the stage for all subwatersheds
downstream through the one currently being analyzed (Table 27).
TABLE 27
ON LINE COST SUMMARY
TOTAL COST OF MEASURES WITHIN SUBWATERSHED = $13684.91 TOTAL COST OF MEASURES ON LINE TO THIS POINT= $17276.44
- 180 -

SUMMARY FOR RESERVOIR TRIAL
After the optimum channel improvement and nonstructural
measures have been determined for all the subwatersheds downstream
from a proposed reservoir, a cost summary is printed for the reservoir
trial (Table 28). It includes the annual costs of measures installed
and of residual flooding in the flood plain, the annual cost of the
reservoir, the annual benefits attributable to the flood storage that
accrues downstream from the area of primary analysis, and the total
annual cost (benefits count as a negative cost) associated with this
reservoir trial.
JUSTIFIED RESERVOIR
The first flood control reservoir considered by the Program is
designed to protect against a flood of the frequency in location
MRDF of array DF. If the total cost of this reservoir trial (Table 28)
is lower than the total cost of the optimum flood--plain measure,mix
with no reservoir, this first reservoir is justified; and a cost summary
of the justified reservoir is printed (Table 29). Subsequent trials
TABLE 28
SUMMARY FOR RESERVOIR TRIAL
FLOOD PLAIN COST = RESERVOIR COST = DOWNSTREAM BENEFIT = TOTAL COST =
- 181 -
$ 1170444.00 $ 531706.44 $ $
28187.61 1673962.00

TABLE 29
COST OF JUSTIFIED RESERVOIR
CONSTRUCTION OF A RESERVOIR IN STAGE 1 TO CONTAIN A FLOOD HAVING A RETURN PERIOD OF 6 . 6 7 YEARS
COST OF DAM DOWNSTREAM COST DOWNSTREAM BENEFIT TOTAL COST
= $ = $ = $ = $
531706. 1170444.
28188. 1673962.
are for reservoirs providing greater degrees of protection. Each
reservoir trial yielding a lower total cost than any trial thus far
is justified, and its cost is also summarized on a like table. The
analysis stops when a tria 1 yields a higher cost than the previous
trial, and this output is not printed for the last, unjustified reser-
voir. It will never be printed if none of the reservoirs tried are
justified.
SUBROUTINE ENTRY AND EXIT
This output is described under variable 110 in Chapter IV.
The output enables the planner to know when subroutines are
entered and left during program execution. Examples of the output
are SUBROUTINE RETWAL ENTERED or SUBROUTINE RETWAL LEFT.
UCFIX OUTPUT
Subroutine UCFIX determines and prints out if 19 is read
as 1, the discounted average urbanization fraction over the first
- 182 -
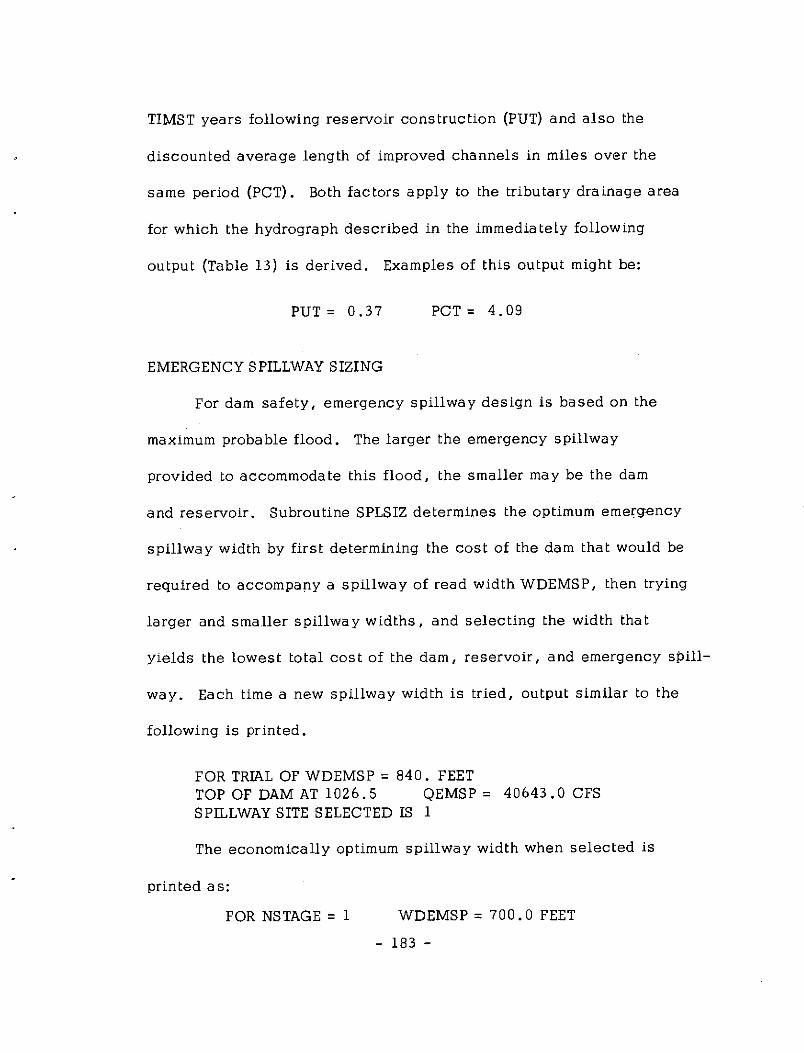
TIMST years following reservoir construction (PUT) and also the
discounted average length of improved channels in miles over the
same period (PCT). Both factors apply to the tributary drainage area
for which the hydrograph described in the immediately following
output (Table 13) is derived. Examples of this output might be:
PUT= 0.37 PCT= 4.09
EMERGENCY SPILLWAY SIZING
For dam safety, emergency spillway design is based on the
maximum probable flood. The larger the emergency spillway
provided to accommodate this flood, the smaller may be the dam
and reservoir. Subroutine SPLSIZ determines the optimum emergency
spillway width by first determining the cost of the dam that would be
required to accompany a spillway of read width WDEMSP, then trying
larger and smaller spillway widths, and selecting the width that
yields the lowest total cost of the dam, reservoir, and emergency spill-
way. Each time a new spillway width is tried, output similar to the
following is printed.
FOR TRIAL OF WDEMSP = 840. FEET TOP OF DAM AT 1026.5 QEMSP = 40643.0 CFS SPILLWAY SITE SELECTED IS 1
The economically optimum spillway width when selected is
printed as:
FOR NSTAGE = 1 WDEMSP = 700. 0 FEET
- 183 -

If the greater flood storage required by design for a larger flood
event changes the specified spillway site to a higher saddle loca lion,
the Program prints REOPTIMIZE SPILLWAY WIDTH FOR A NEW SITE
and proceeds to do so.
KENTUCKY RIVER ANALYSIS
The application of the University of Kentucky Flood Control
Planning Programs to the flood plain along the upper reaches of the
North Fork of the Kentucky River followed the basic methodology of
Chapter III or more specifically Case 6 (pp. 41-43). The total area
was divided into subwatersheds (Fig. 2), and the necessary input
data of Appendix C for Program II and Appendix D for Program III
were developed. The analysis was based on conditions existing
before construction began at Carr Fork.
COMPUTER RUNS
Program II was initially applied to the problem area downstream
from the Carr Fork reservoir site and indicated the optimum solution
to be a flood proofing program s iinilar to that presented later from
Program III on Table 35. However, with only main line flooding, the
hydrology is better handled by Program III where flood routing better
incorporates the effect of basin shape.
Program III was applied individually to each of the three
- 184 -

reservoir sites as suggested in Chapter III (p. 42). Only flood
storage at the Carr Fork site plus a flood proofing program along the
Kentucky River wrre economically justified. The reduction in the sum
of downstream flood damages and flood proofing cost was insufficient
at the other sites to justify the cost of reservoir construction. How
ever, a number of runs (Table 3 O) were made at all three sites in an
attempt to better evaluate the overall situation.
The data used for evaluating the Carr Fork site by Program III
we:e as listed in Appendix D except for the variation of three varia
bles as shown on Table 30. The first run was for the purpose of
evaluating downstream flooding if no reservoir were built. The second
run added uncertainty damages to this evaluation. The third selected
the optimum dam size were no flood proofing employed downstream.
The fourth selected the optimum dam size supplementary to downstream
flood proofing. The fifth selected the optimum dam size supplementary
to downstream flood proofing if uncertainty damages were also con
sidered. The same reservoir size was selected in two_ of the last
three cases (Table 31), but a larger one was selected in Case 5.
The runs made for Cornettsville were based on data like that
in Appendix D except as modified for the differences in downstream
subwatersheds. The options used are indicated on Table 30. The
NODAM run to evaluate downstream flooding with no reservoir was
- 185 -

TABLE 30
DESCRIPTION OF COMPUTER RUNS
CARR FLOOD OPTION RUN FORK PROOFING NO DAM BYVERT UNC VARIABLE NO. AW() 12 111 BYVERT 11
CARR FORK SITE
1 Yes Yes +s No
2 Yes Yes +s Yes
3 No No +s No
4 Yes No +s No
5 Yes No +s Yes
CORNETTSVILLE SITE
1 No No No -11 No
2 No Yes No -11 No
3 Yes No No +s No
4 Yes Yes No -11 No
5 Yes Yes No -11 Yes
KINGDOM COME SITE
1 No Yes Yes +s No
2 No Yes No -11 No
3 Yes Yes Yes +s No
4 Yes Yes No -11 No
- 186 -

not required because the results would be identical to that for the
NODAM run for the Kingdom Come Reservoir further upstream. The
Cornettsville Reservoir could not be justified, but the size shown
on Table 31 had the minimum negative net benefits. The cost data
is based on reducing BYVERT from +5 to -11 in an attempt to minimize
the costly right-of-way requirement. Runs reducing XTRSTR from
35,000 to 10,000 and increasing GDELAY from Oto 36 were also
tried, but net benefits were not increased. Runs without Carr Fork
were based on eliminating from the input the entire area tributary to
that dam.
The runs for Kingdom Cam:e were based on data like that for
Cornettsville but modified to add the one additional downstream
subwatershed. Program options varied are also listed on Table 30.
The Kingdom Come Reservoir had an even more negative net benefit
than did that at Cornettsville, but the size having the minimum
negative value is shown on Table 31.
COST DATA ON RESERVOIRS STUDIED
The cost data presented on Table 31 is that determined by
Program III for the dam and reservoir at each site having the largest
positive or the smallest negative benefit. The results may be
compared with those found by the Corps of Engineers (Table 32).
- 187 -

TABLE 31
DAM AND RESERVOIR DATA (PROGRAM III)
Reservoir: Carr Fork Kingdom Come Cornettsville
TRIBUTARY AREA: 58. 18 MI2 194. 56 MI2
271.73MI2
STORAGE:
Sediment 873 AF 2,918 AF 4,076 AF
Conservation 15 ,290 AF 32,760AF 35,000 AF
Flood 10,406 AF 18,460 AF 21,900 AF
ELEVATIONS:
Conservation Pool 1,016.S 1, OS 1. 4 1,011.3
Flood Pool 1,031. 9 1,065.S 1,027.6
Top of Dam 1,042.2 1,082.1 1,044.5
TOTAL COST DATA:
Dam $ 2,003,000 $ 5,455,000 $ 6,513,000
Right-of-Way 6,957,000 14,170,000 8,471,000
Relocations 3,999,000 20,525,000 18,152,000
Total $12,959,000 $ 40,JS0,000 $ 33,136,000
ANNUAL COST DATA:
Total 532,000 1,641,000 1,371,000
Incremental to Flood Control 135, 000 365,000 403,000
- 188 -

TABLE 32
DAM AND RESERVOIR DATA (Corps of Engineers)
STORAGE:
Minimum Pool
Flood Control
ELEVATIONS:
Minimum Pool
Flood Pool
Top of Dam
TOTAL COST DATA
Dam
Right-of-Way
Reloca lions
Total
Carr Fork (under Cons true tion)
11, 83 0
31,660
1,009
1,055
1,081
$ 6,167,000
5,300,000
8,308,000
$19,775,000
Kingdom Come (Preliminary Findings)
32,610
95,790
1,048
1,100
1, 130
$ 12 ,960,000
10,000,000
32,540,000
$ 55 ,500,000
The main difference between the two studies is caused by use
by the Corps of Engineers of much morn flood storage than the economic
optimum suggested by Program III. However, the Program could have
been forced to select more flood storage by increasing uncertainty
damages (VA). The cost figures agree well considering the difference
in dam size except for a much lower estimate of the economic value
of right-of-way as made by the Corps of Engineers.
- 189 -

The value of right-of-way for the Cornettsville site would be
significantly higher than that shown on Table 31 if the permanent •
pool were to prevent mining significant coal reserves inundated by
the proposed reservoir. However, since flood control storage is
normally empty, much of the coal could still be extracted by proper
coordination of mining with reservoir operation. The value of mineral
rights may be adjusted in the Program by varying AQR.
RESERVOIR EFFECT ON.HAZARD 200-YEAR FLOOD PEAK
Table 33 summarizes the effects of various combinations of
the three proposed reservoirs on the 200-year flood peak flow and
stage at Hazard. Based on 24 years of the Hazard streamflow record,
the 100-year flood peak was estimated by assuming a Gumbel extreme
value distribution to be 58,500 cfs. Program III estimated the 100-
year peak at the downstream end of the Hazard subwatershed to be
TABLE 33
RESERVOIR EFFECT ON 200-YEAR FLOOD PEAK AT HAZARD
Flow Stage
No Reservoir Storage 70,480 50.3 Carr Fork Only 59,190 44.1 Kingdom Come Only 54,350 41. 4 Cornettsville Only 42,430 34,7 Carr Fork and Kingdom Come 43,450 35.3 Carr Fork and Cornettsville 35,870 30,5
- 190 -

63 ,450 cfs assuming no upstream reservoir storage. At least part
of the discrepancy may be attributed to local inflow between the
Hazard gage and the downstream end of the subwa tershed.
Furthermore, the Corps of Engineers (29) estimates that the
reservoir currently under construction at Carr Fork and the reservoir
proposed for construction at Kingdom Come, each acting alone,
would have reduced the peak 1957 flood stage (frequency about 6%)
by 3 and 8 feet respectively. Table 33 reveals that the reservoirs
proposed for installation at these two sites by Program III would
reduce the stage of the much rarer 200-year flood by approximately
6 and 9 feet respectively. Flood stages were estimated from the
flood peaks developed by the Program through the stage discharge
relationship published with the 1957 stream gage record ( 36) as
extrapolated by assuming the relationship (18, pp. 68-69):
(10)
where Q is the flow in cfs, G is the gage stage in feet, and K
and n are constants derived for the published curve to be 392 and
1. 325 respectively.
BENEFIT EVALUATION
Analysis of the relative economic merit of the three reservoir
sites (Table 34) was based on direct and indirect primary flood
- 191 -

TABLE 34
BENEFIT COST ANALYSIS OF RESERVOIR ALTERNATIVES
Benefits Surcharge Flood Storage Storage Costs B/C
Carr Fork 14,000 215,000 135,000 1. 59
Kingdom Come Without Carr Fork 130,000 163,000 365,000 0.45 With Carr Fork 132,000 254,000 365,000 0.70
Cornettsville Without Carr Fork 228,000 228,000 403, 000 0.57 With Carr Fork 211,000 303,000 403,000 0.75
control benefits. The surcharge storage benefits are based on
downstream flood effects of a reservoir containing the conservation
storage of Table 31. The flood storage benefits are additional bene-
fits which accrue by adding the flood storage specified on Table 31,
The benefit-cost ratio is thus based on incremental effects of
adding the flood storage.
All reservoir benefits were based on flood damage reduction
residual to the cptimum flood proofing program (channel improvement
and land use control were analyzed but never justified) and also,
in some cases of the Kingdom Come and Cornettsville analysis,
residual to reservoir flood storage at Carr Fork.
Greater benefits were realized from the Kingdom Come and
• Cornettsville reservoirs with than without Carr Fork because
- 192 -
flood storage controlling one major upstream tributary still leaves
Hazc1r"d exposed to major flooding from the other. Furthermore,
combinations of reservoirs operated together are more effective in
reducing flood peaks, thus flood damages, than when operated
separately.
SECONDARY BENEFITS
Secondary benefits based on developing the economic poten
tial of the local area or raising the income level of the local people
may be used for project justification if they can be shown to stem
directly from the project and not be offset by detrimental conse
quences elsewhere in the nation. Two types of secondary benefits
were evaluated for the flood control features of the Cornettsville
site with Carr Fork:
1. Income redistribution benefits, based on factors
developed by Rosenbaum (20) for Dewey Reservoir in another
Appalachian Valley, were estimated to be $36, 100/year.
2. Uncertainty benefits, for a one percent exhaustion
probability (ypJ, as effected by Cornettsville flood storage were
found to be $157, 900/year.
EVALUATION OF UPSTREAM SITES
The analysis showed the Cornettsville to be the superior
- 193 -

of the two Kentucky River sites (Table 34). As the two sites are
mutually exclusive (they back water over much the same area),
the Cornettsville site should be selected over the Kingdom Come
site subject to re-evaluation after obtaining more detailed topo
graphic and geologic information and better cost estimates on
mineral rights and highway and railway relocations. One of the
major values rea)ized from use of Program III is that the whole
analysis can be repeated at a cost of 10 to 20 dollars to assess
the effects of more recently gathered information on project justifica
tion,
For flood control at the Cornettsville site, annual costs amount
to $403, 000/year, primary annual benefits amount to $303, 000/year,
and secondary annual benefits amount to $194, 000/year, The total
benefit is $497, 000/year to give a benefit cost ratio of 1. 23.
However, the total annual cost of the reservoir was found to
be $1, 3 71, 000/year, The sum of primary flood control, secondary
flood control, and surcharge flood control benefits was found to be
$709, 000/year. Thus even though adding flood control storage to a
35,000 AF reservoir can be economically justified, the reservoir
as a whole cannot be economically justified without $663 ,000/year
in demonstrated benefits from such other project purposes as recrea
tion and low flow augmentation, These benefits were not evaluated
- 194 -

as part of this analysis.
EVALUATION OF FLOOD PROOFING
The optimum flood proofing program found by Program III for
the subwatersheds along the Kentucky River with Carr Fork Reservoir
assumed in place is summarized on Table 35. Flood proofing was
thus found to be potentially capable of substantially reducing
gross flood damage in nearly every subwatershed. The finding
should be followed by a more detailed investigation of existing
buildings in the flood plain to design applicable flood proofing
measures.
TABLE 35
OPTIMUM FLOOD PROOFING PROGRAM (Supplemental to Carr Fork Reservoir)
Flood Proofing Program
None Optimal nnua Design Annual Annual Annual
Subwatershed Damage Flow Cost Damage Total
2 123,100 3 6, 9 00 39,900 21,800 61,700 3 101,200 45,700 3.1,200 18,700 49,900 7 74,300 49,200 29,000 15,100 44,100 8 631,700 49,500 264,100 125,200 389,300 9 222,800 40,300 80,700 81,900 162,600
10 77,400 41, 2 00 29,700 29,100 58,700 11 48,200 53,800 21, 3 00 10,700 32,000 12 78,100 53,200 31,800 16,000 47,800
- 196 -
Flood proofing generally becomes less effective with more
infrequent flooding (15). The measure thus could not be justified
along Carr Fork downstream from an in-place reservoir because of
its high degree of flood control. It was likewise not justified with both
Carr Fork and Cornettsville reservoirs in place except in the extreme
downstream subwatersheds where relatively less of the drainage
area is controlled.
CONCLUSIONS
1. Construction of Carr Fork Reservoir is economically justified.
2. Construction of reservoir storage on the Kentucky River
appears to be more economical at the Cornettsville than at the
Kingdom Come site.
3. The Cornettsville Reservoir cannot be economically justified
without $663, ODO/year demonstrated benefits from recreation, low flow
augmentation, and other non-flood-control purposes.
4. A flood proofing program would substantially reduce flood
damage in Hazard. A detailed flood proofing study is especially
recommended for downtown Hazard in light of the high flood damages
currently suffered and the good chance reservoir storage upstream on
the Kentucky River cannot be justified.
5. Channel improvement and land use management are not
effective flood damage reduction measures in the study area.
- 196 -

Chapter VI
SUMMARY OF FINDINGS
SIGNIFICANCE OF FINDINGS
The design and economic evaluation of alternative measures
for flood control is an extremely complicated and very time con
suming task. Many of the most time consuming computational
procedures lend themselves to digital computer analysis. Planning
agencies systematically use computer programs to evaluate
individual design components, but a great deal of time is still
required to piece the components into an overall economic evaluation
of the total flood problem. The two Programs described in this
report comprise the first comprehensive attempt to combine the
entire flood control planning process into a single computer
operation.
While the Programs can provide a comprehensive project
formulation, the results still need to be refined as the formulated
project proceeds into the final design and construction stages.
A major advantage of the computer analysis is that if the additional
studies indicate a need for revising the design the economic conse
quences can be readily evaluated by a single computer run with
modified input data.

The savings in planning cost made possible by use of the
Programs is brought about through the virtual elimination of the
burden of arithmetic computation. Planning time can be concen
trated on gathering data, interpreting output, and revising planning
options to test alternative approaches. The many more alternatives
that can be evaluated provide the planner with much greater insight
into the nature of the total problem. The computational savings
can be illustrated by the fact that the 14 computer runs described
on Table 30 used to evaluate alternative flood control measures
along the Upper Kentucky River took a total of 44 minutes of 360/50
computer time.
NATURE OF APPLICATION
The Fortran IV listings of the Programs are found in Appendix
A of this report for Program II and in Appendix A of Villines' report
{38) for Program III. They can be adapted to any compiler that
reads Fortran IV and any computer system capable of handling
132, 500 bytes of program storage. Those interested in applying
the Programs may obtain punched card decks .. or listings on sub
mitted tapes from the University of Kentucky Water Resources
Institute, Lexington, Kentucky.
With the Program available, its use then hinges on ability
to develop the required input data and to interpret the results.
- 198 -
.•

Chapter IV guides the first step as Chapter V does the second. Help
is available here, also, from the Institute for those who may exper
ience difficulty.
POTENTIAL FOR EXPANSION
The limitations of the Planning Programs as previously
presented (pp. 46-48) comprise the major directions for future
Program changes. The changes may move toward even more compre
hensive analysis by incorporating other project alternatives and other
project purposes as computers with larger storage capacity become
available. They may move toward more exhaustive project design
where only very approximate methods are now used.
In any case, the current Programs should be regarded as no
more than a base on which to build. Each application to a new
problem will suggest refinements to increase the accuracy or the
comprehensiveness of the analysis. Any help or suggestions you as
the reader may have to improve the approach will be sincerely
appreciated.
- 199 -

APPENDIX A
FORTRAN IV LISTING
OF
THE UNIVERSITY OF KENTUCKY FLOOD CONTROL PLANNING PROGRAM II
C CENTRAL CONTROL DECK C UNIVERSITY OF KENTUCKY FLOOD CONTROL PLANNING PROGRAM II C VERSION OF JANUARY 27, 1968
COMMON A0(25l,Alt25l,A2(25l,A3125l,A4125l,AODCS(25l,AFCTR(3,lll, 1 AFW12,25l,AWl25l,CAP(25,lll,CH(25l,CHANEL(25l,CLOC(25,5l,0(3,25J, 2 DF(l0l,DFQR(l6l,DQCKl16l,FOA(25l,FQ(25l,FRU{lll,IDC100l,IHE(25), 3 IHN(25l,IHOL0(25l,IMPROV(25l,INOEXl25,21,IREl25l,IRN(25l,Kll25}, 4 K2(25l,LCl25l,LINING(251,LOCl25l,NOT(25l,OUTPUT(25,131,QOl25l, 5 Q05111,lll,Q43!11,lll,QQ12,1Dl,QX12,16l,RCl25J,Sl25l,SICl251, 6 TOl251,TCL(251,TF(25l,TIC125l,USUBWl25,6l,UTOTRl25,6l, 7 VALUE( 25,6) ,WO( 25 l ,WT{ 251,XFll 25 l ,XF2( 25), XF3{ 25 I ,XF4( 25 l, Y( 161, 8 YY(lOl
COMMON A,AG,ATEMP,8DMAX,BOMIN,CD,CDA,COAV,COB,COBV,COC,CDCV,CDST, 1 CHECK,CLEN,COEFDM,CPF,CRF,CRFSM,CS,CU,F,FA,FO,FOTEMP,FIA,FIB,FIC, 2 FTOP,GA,GSF,HE,HETEMP,HMAX,HN,HOLONG,HTEMP,IPP,ITOP,LA,LF,LGTEMP, 3 LINED,LL,LTF,MANNR•MANNT•MANNU,MW,ND,NOF,NOTEMP,NSTAGE,NSTEMX,NW, 4 PA,PB,PC,PP,PTF,PWF,Q805,QB43,Ql,QLINED,QP,QS,R,RE,RETEMP,RN, 5 RTEMP,SAFC,SK1,SK2,SK3,SK4,SK5,SK6,SK7,SK8,SPWF,SPWFAC,SS,STEMP, 6 STF,T,TIME,TIMST,TRACE,TTEMP,UN,UNC,UZ,VA,VLAGST,VLURST,W,WTEMP, 7 XF,YCOMP,ZT,ZU
REAL Kl,K2,MANNU,MANNR,MANNT,IA,IPP,LA,LC LOGICAL CHANEL,PP,LL,SS,LG,PTF,LTF,STF,TRACE,CHECK,LINED,HOLONG
C READS INPUT DATA CALL CHOATA
C INITIALIZES LOOP CONTROL FOR FLOOD DAMAGE ANALYSIS I TOP= 16 FTOP=9.210
C INITIALIZE TOTAL COST OF PLANNING PROGRAM ACP=O. ACS=O. ACU=O. ACO=O. ACF=O. ACL=O.
C DETERMINES WHICH TYPES OF MEASURES TO BE CONSIDERED PP=PTF
- 200 -
•
•

.,
. '
LL=LTF SS=STF 00 20 I=l,MW
C INITIALIZE FACTORS IN GUMBEL EQUATION FOR EACH SUBWATERSHED XF4( I l=O. XF31Il=O. XF2(1l=O. XFl!Il=O. A411l=O. A3(I):O. A2lI l=O. A.l I I l=O.
C INITIALIZE OTHER CONDITIONS FOR FACH SUBWATERSHED CH{Il = O.O LDC( fl=-1 AODCS{ I l=O. · IHOLOIJ l=O WO( l}=O.O TO(Il=O.O NOT! I l=O FOAII)=O.O DO 10 K=l,13
10 OUTPUT!I,Kl=O.O DO 20 J=CJ,11
20 CAP(l,Jl=O. C CALCULATE EACH SUBWATERSHEO AREA FACTOR FIRST FOR 43 ANO THEN FOR 0.5 C PERCENT FLOOD
DO 50 K=l,l'W 00 30 J=l,10 IF{AFCTR(l,II .LE. A\HKl .AND. I\FCTR(l,I+ll .GT. AW!Kll GO TO 40
30 CONTINUE 40 AFW I 1, K) =AFC TR ( 2, I ) + ( Al nG t AW (Kl l-ALOG (AFC TR { l, I l I JI { ALOG t AFC TR I 1, I
l+l l l-ALOGIAFCTR( 1, J) l )*(AFCTRl2, J+t J-AFCTR!2, Ill AFWl2,Kl=AFCTR!3,Il+IALOG(AW(Kll-ALOG(AFCTR!l,Illl/(ALOG!AFCTR11,I
l+ll)-ALOG(AFCTR11,Illl*{AFCTR!3,T+ll-AFCTR(3,I)l 50 CONTINUE
C PROBABILITY OF OCCURANCE OF 16 FLOODS SPECIFIED FOR USE IN C COMPUTING ANNUAL DAMAGES.
DQCKlll=0.0005 DQCK(Z)=0.003 DQCK(:ll=0.0075 DQCK!4l=0.015 OQCK!Sl=0.025 DQCK(6l=0.035 DQCK(7l=0.05 OQCK(8l=0.07 DQCK(9l=O.OCJ DQCK(lOl=0.125 OQCK{lll=0.175 DQCK{lZl=0.25 DQCKl131=0.35 !1QCK(l4l=0.5
- 201 -

DQCK( 151=0. 7 DQCKl161=0.9 DO 70 1=1,16
C GUMBEL FACTORS FOR 16 SPECIFIED FLOODS PN=l.0-(DQCKll)l TEMP=l.0/ALOG(l.O/PN)
70 Y(It=ALOG(TEMPl C GUMBEL FACTORS - POTENTIAL DESIGN FLOODS
DO 90 I= l , NOF PN=l.00-IDF!Ill TEMP=l./ALOG(l./PNI YY(Il=ALOG(TEMPl
90 CONTINUE C GUMBEL FACTOR FOR TESTING FOR IN STAGE UPSTREAM CHANNELIZATION
TEMP=l.O/ALOG(l.0/0.9951 YCOMP=ALOG(TEMPI
C DETERMINING WHICH CHANNELS WERE IMPROVED PRIOR TO TIME OF STUDY DO 110 NW=l,MW IFlSICCNWl .GE. LC(NWll GO TO 100 CHANEL(NWl=.FALSE. GO TO 110
100 CHANEL(NW)=.TRUE. C FIX THE DIMENSIONS OF CHANNELS IMPROVED BEFORE BEGINNING OF PLANNING C PERIOD FOR THE PURPOSE OF ESTIMATING THE COST OF CHANNEL C ENLARGEMENT. EVEN IF THE DESIGN CRITERIA USED IN BUILDING ~
C THE EXISTING CHANNEL DO NOT CONFORM TO THOSE USED IN THIS C PROGRAM, THIS SUBROUTINE CAUSES All COSTS TO BE BASED ON THE C SAME DESIGN CRITERIA.
CALL CHFIX 110 CONTINUE
C CALCULATE LOCATION COST IN EACH SUBWATERSHED-STAGE UNLESS IT IS C NOT NEEDED
IF (.NOT. LTF .OR. HOLONGI CALL CALCLU NSTAGE=l
C POINT OF RETURN WITH NEW STAGE C INITIALIZES VALUES FOR NEW STAGE
120 00 130 NW=l,MW IHNlNWl=O IHECNWl=O IRNINWl=O IRECNWl=O IMPROVINWl=l
130 RCINWl=-1. TSWCS=O. TSWCL=O. TSWCP=O. TSWCD=O. TSWCU=O. TSWCF=O. 00 140 I=l,MW DO 140 J=4,13
140 OUTPUT(I,~l=O.O - 202 -
1

C BEGINS WITH MOST UPSTREAM SUBWATERSHED AND PROCEEDS DOWNSTREAM IF (CHECK .AND. I.NOT. TRACE)! WRITE16,5000l
5000 FORMATl1Hl//30X,42HFOLLOWING OPTIMIZATION THROUGH INNER LOOPS /lX l4H BEG,13X,8HCHANNELS,16X,8HLOCATION,16X,8HPROOFING,12X,7HCOST OF, 22X,7HCOST OF,5X,5HTOTAL/11X,2H S,9X,2HQS,8X,2HCS,1X,2H L,9X,2HQL, 38X,2HCL,1X,2H P,9X,2HQP,8X,2HCP,4X,25HFLOODING UNCERTAINTY COST l
NW=l C POINT OF RETURN WITH NEW SUBWATERSHEO C DISCOUNTED AVERAGE URBANIZATION DURING SUBWATERSHED STAGE
150 UN=USUBWINW,NSTAGEJ+(GSF*IUSUBW!NW,NSTAGE+l)-USUBWINW,NSTAGElll/ I TIME
C URBANIZATION AT TIME LOCATION ALTERNATIVE FIRST IMPLEMENTED IF!LOCINWJ .GT. Ol GO TO 160 UZ=USUBWINW,NSTAGEl GO TO 170
160 MN=LOCINW) UZ=USUBW{NW,MNI
C FACTORS FOR COMPUTING FLOOD PROOFING COST 170 PA=CPF*IUN+VLAGST/VLURST*ll.O-UNll*K2(NWl*Kl(NWl**2
PB=CPF* (UZ+VLAGST /VLURST*f 1.0-UZ) l*K2 (NW l*K 1( NW 1**2 PC=PA-PB
C SELECT URBANIZATION INTERVAL AND CORRESPONDING PER ACRE VALUES C OF AGR JCUL TUR AL INCOME ANO FLOOD DAMAGE
IF (UN .LT. 1.00) GO TO 180 FUQ=FRU( 11 J. GO TO 190
C INTERPOLATION IF LESS THAN FULL URBANIZATION 180 UR=lO.O*UN+l.O
I=UR UQ=I FUQ=FRU(Il+(UQ-UR}*(FRU(Il-FRU(I+lJl
190 IA=FUQ*(FIA*Dfl,NWJ+FIB*Ol2,NWJ+FIC*013,NWI) FA=FUQ*(COA*D{l,NWl+COB*D(2,NWl+CDC*Dl3,NWll GA= FUQ*ICDAV*Dll,NWJ+CDBV*Dl2,NWJ+CDCV*D13,NWJJ IF (LTF.ANO •• NOT. HOLDNGl GO TO 240
C CALCULATE LOCATION COST MULTIPLE OF Q**0.375 LA=CLOCINW,NSTAGEl*Kl(NWl*K2(NWJ
C DETERMINE WHETHER ·RIGHT-OF-WAY SHOULD BE HELO FOR LATER USE IF(.NOT. HOLONGl GO TO 240 IF ICHANELINWll GO TO 200 RBEG=VALUE(NW,NSTAGEl+VLURST*USUBW(NW,NSTAGE)/3.0 REND=VALUE(NW,NSTAGE+l)+VLURST*USUBW(NW,NSTAGE+l113.0 GO TO 210
C NO ADDITIONAL RIGHT-OF-WAY NEEDED IF IMPROVED CHANNEL IS C RECTANGULAR RElNFORCEO CONCRETE
200 IF ILININGINWI.EQ.41 GO TO 230 RBEG=VALUEINW,NSTAGEl+VLURST*USUBWCNW,NSTAGEI RENO=VALUEINW,NSTAGE+ll+VLURST*USUBWINW,NSTAGE+ll
C HOLD EXTRA RIGHT-OF-'--WAY ONLY IF COST OF LANO ANO BUILDINGS C THEREON INCREASING FASTER THAN DISCOUNT RATE
210 IF (RENO.LE.RBEG*(l.O+Rl**TIMEl GO TO 230 C RIGHT-OF-WAY SHOULD BE HELD
- 203 -
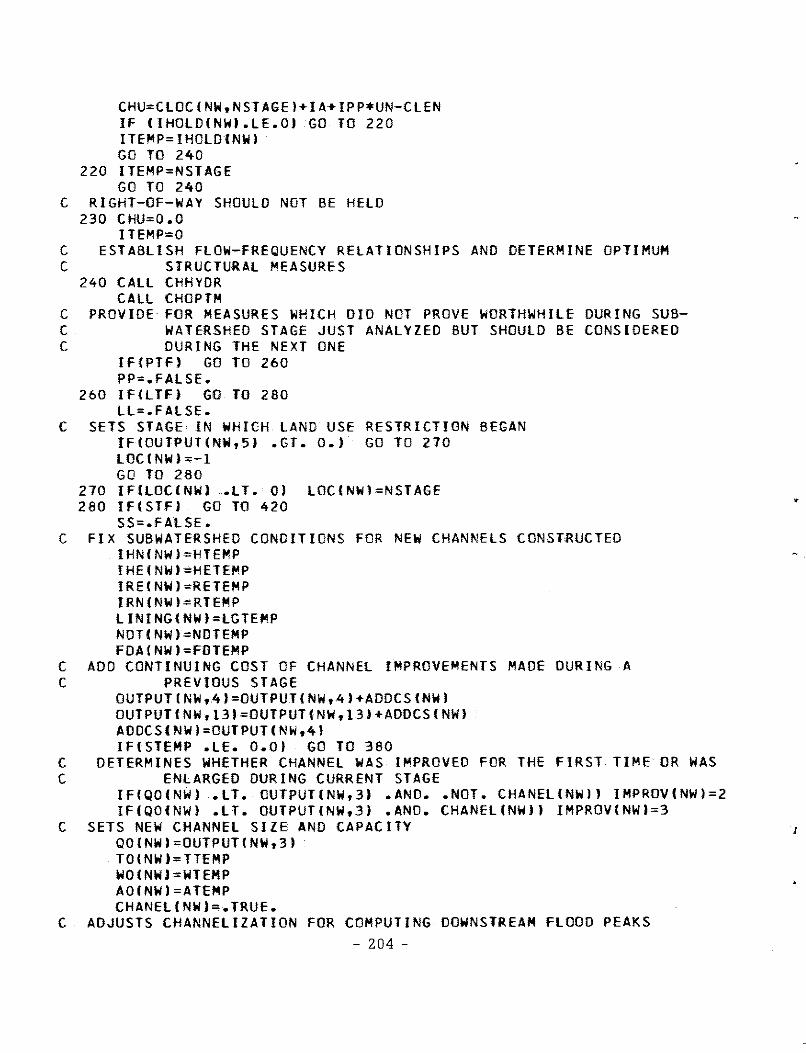
CHU=CLOCINW,NSTAGEl+IA+IPP*UN-CLEN IF CIHOLD(NW).LE.OJ GO TO 220 ITEMP=IHOLDINWl GO TO 240
220 ITEMP=NSTAGE GO TO 240
C RIGHT-OF-WAY SHOULD NOT BE HELO 230 CHU-=O.O
ITEMP=O C ESTABLISH FLOW-FREQUENCY RELATIONSHIPS AND DETERMINE OPTIMUM C STRUCTURAL MEASURES
240 CALL CHHYDR CALL CHOPTM
C PROVIDE FOR MEASURES WHICH DID NOT PROVE WORTHWHILE DURING SUB-C WATERSHED STAGE JUST ANALYZED BUT SHOULD BE CONSIDERED C DURING THE NEXT ONE
IF(PTFJ GO TO 260 PP=.FALSE.
260 IFILTFJ GO TO 280 LL=.FALSE.
C SETS STAGE IN WHICH LANO USE RESTRICTION BEGAN IFIOUTPUTINW,5l .GT. O.J GO TO 270 LOCINWJ;-1 GO TO 280
270 IF(LOCINWI .LT. Ol LOC(NWl=NSTAGE 280 If(STFJ GO TO 420
SS=.FALSE. C FIX SUBWATERSHEO CONOITIONS FOR NEW CHANNELS CONSTRUCTED
IHNINWl-=HTEMP IHE(NWl:HETEMP IRE!NWl=RETEMP IRN(NWJ,,,RTEMP LINING(NWl=LGTEMP NOTC NW l-=NDTEMP FDA!NWl=FDTEMP
C ADD CONTINUING COST OF CHANNEL IMPROVEMENTS MADE DURING A C PREVIOUS STAGE
OUTPUT(NW,4l=OUTPUT!NW,4l+AODCS(NWl OUTPUTINW,13l-=OUTPUTINW,13J+ADDCSINWl AOOCS(NWl=OUTPUTINW,41 IFfSTEMP .LE. O.Ol GO TO 380
C DETERMINES WHETHER CHANNEL WAS IMPROVED FOR THE FIRST TIME OR WAS C ENLARGED DURING CURRENT STAGE
IFIQO(NWJ .LT. OUTPUT(NW,31 .ANO •• NOT. CHANELCNWJJ IMPROVCNWl=2 IFCQO(NWl .LT. OUTPUT(NW,3) .AND. CHANEL!NWll IMPROVINWl-=3
C SETS NEW CHANNEL SIZE ANO CAPACITY QO(NWl"'OUTPUTINW,31 TOINWJ=TTEMP WOINW)=WTEMP AOINWl=ATEMP CHANELINWJ=.TRUE.
C ADJUSTS CHANNELIZATION FOR COMPUTING DOWNSTREAM FLOOD PEAKS - 204 -
•
I

N=INOEX (NW, 11 J=INOEX!NW,2l IFIN .EQ. 01 GO TO 310 00 300 I=N,J NWO=IO(I) TIC!NWO)=TIC(NWDJ+(LC!NWl-SIC(NWll
C ADJUSTS CHANNELIZATION FOR COMPUTING SUBWATERSHED FLOOD PEAKS 300 CONTINUE 310 TIClNWl=TICINWl+lLCINWl-SICINWll
SIC(NWl=LC(NWl C ACCOUNTS FOR BRIDGE CHANGES C CAPl9l - NUMBER OF HIGHWAY BRIDGES BUILT ANO/OR ENLARGED WITHIN C PROGRAM C CAP(lOl - NUMBER Of RAILWAY BRIDGES BUILT ANO/OR ENLARGED WITHIN C PROGRAM C CAPllll - CAPACITY OF All CHANGED BRIDGES IN CFS
CAP(NW,lll=OUTPUTINW,3} IF(CAP(NW,91 .LT. HETEMPJ GO TO 320 CAP(NW,9l=CAP(NW,9)+HTEMP GO TO 330
320 CAP(NW,9l=HETEMP+HTEMP 330 CAP(NW,10l=CAPINW,10l+RTEMP
DO 350 I=l,6 IFICAP(NW,I> .LT. O.l GO TO 360
350 IF! ICAPINW, I l .LT. OUTPUT(NW,3l*FQ(NW) I .ANO. (.NOT. LINED} l 1 CAP(NW,Il=-1.0
360 00 370 1=7,8 IflCAP(NW.I}" .LT. O.l GO TO 380
370 Ifl(CAP(NW,Il .LT. OUTPUT(NW,3l*FQ(NWJl .ANO. (.NOT. LINEOll 1 CAP!NW,Il=-1.0
C IF HOLDING OF RIGHT-OF-WAY FOR FUTURE CHANNELS IS DESIRED, THE WIOTH C ANO COST Of HOLDING THE LANO IS CALCULATED
380 IF (.NOT. HOLONG) GO TO 420 C CASES WHERE HOLDING NOT WARRANTED
IF ILINING(NWI.EQ.4.AND.(CHANELINW).OR.STEMP.GT.O.Ol) ITEMP=O IF (OUTPUTINW,21 .LE. 0.025 .ANO. CHANELINWJ) ITEMP=O
IF tITEMP.EQ.Ol GO TO 410 IF (WT!NWJ.NE.0.01 GO TO 390 Q=QQ(2,NOFl*FQ(NWl IF ILINING(NW).EQ.31 Q=Q*MANNT/MANNU
C WIDTH OF EXTRA RIGHT-Of WAY IF (LININGINWl.NE.41 WT(NWJ=SAFC*(30.0+0.822*(1Q/SQRT(S(NW1l)**0.4
115 l l IF ILINING(NW1.EQ.4l WT(NWl=SAFC*l20.0+BOMIN*IIQ*MANNR*(X+2.0l**O•
l667/(SQRT(SCNWl)*l.49*BDMIN**l•667ll**0.375ll 390 IF IWTINWl .GE. WO!NWll GO TO 400
C HAVE ENOUGH WITHOUT HOLDING EXTRA ITEMP=O GO TO 410
C COST Of HOLDING EXTRA RIGHT-OF-WAY 400 CH(NWl=CHU*(WTINWl*LCINWJ~WD(NWl*SICINWll*0~1212
C NO NEED TO HOLD RIGHT-Of~WAY WHERE FLOOD DAMAGES ARE SO SMALL - 205 -

C CHANNEL IMPROVEMENT CAN PROBABLY NEVER BE JUSTIFIED IFICH(NWI .GE. 0.333*0UTPUTINW,131l ITEMP=O
410 IHOLOINWl=ITEMP IF IIHOLO(NWI .NE. 01 GO TO 420 WT(NW)=O.O CH(NWl=O.O
420 NW=NW+l C RETURN TO NEXT SUBWATERSHEO UNLESS All HAVE BEEN ANALYZED
IF(NW .LE. MW) GO TO 150 C ADD HOLDING COSTS TO OTHER COSTS
IF IHOLONGI OUTPUTINW,13l=OUTPUT(NW,13l+CHINWI C WRITE SUMMARY OF MEASURES EMPLOYED DURING STAGE
WRITEl6,501-0I NSTAGE 5010 FORMAT{1Hl//////18H SUMMARY FOR STAGE 121
WRITEl6,5020l 5020 FORMAT(lH ,43X,29HSUMMARY OF MEASURES ANO COSTS/1X,4HUNIT,1X,4H BE
1G,13X,8HCHANNELS,16X,8HLOCATION,16X,8HPROOFING,8X,7HCOST OF,2X,7HC 2GST OF,5X,5HTOTAL/15X,2H S,5X,2HQS,BX,2HCS,5X,2H l,5X,2HQL,8X,2HCL 3,5X,2H P,5X,2HQP,8X,2HCP,4X,28H FLOODING UNCERTAINTY COST I
00 440 NW=l,MW WRITE(6,50301 NW,(OUTPUTINW,ll,I=l,13)
5030 FORMATl1X,I2,2PF7.2,2X,F6.3,0P2FB.0,2X,2PF6.3,0P2F8.0,2X,2PF6.3,0P 12F8.0,3Fll.O/l
440 CONTINUE 00 450 NW=l,MW
C SUM All THE INDIVIDUAL SUBWATERSHEO COSTS TSWCS=TSWCS+OUTPUTINW,4) +CHINWI TSWCL=TSWCL+OUTPUT(NW,71 TSWCP=TSWCP+OUTPUT(NW,101 TSWCO=TSWCD+OUTPUT(NW,111 TSWCU=TSWCU+OUTPUTINW,12l TSWCF=T SWCP+ TSWCL + TSWC S+ TSWCU+ T SWCO
450 CONTINUE C WRITE TOTALS AT BOTTOM OF TABLE
WRITE 16,5040) TSWCS, TSWCL,TSWCP,TSWCD,TSWCU,TSWCF 5040 FORMAT(lX,llHTOTAL COSTS,14X,F8.0,16X,F8.0,16X,FB.0,3X,FB.0,3X,F8.
10,3X,F8.0/// II IF (HOLDNGl WRITEl6,5050J
5050 FORMAT(5X,76HTOTAL COST OF CHANNELS ANO GRANO TOTAL COST INCLUDE H !OLDING COST SHOWN BELOW J
C SUM PRESENT WORTH OF COSTS FOR STAGES STUDIED THUS FAR RNSTMX = NSTEMX XTIME=NSTAGE-1 PWFAC=l./1(1.+Rl**ITIME*XTIMEll PSUM=ISPWFAC*PWFACI/ITIME*RNSTMXl IF(R .GT. 0.00011 PSUM=IR*ll.+Rl**ITIME*RNSTMX)J/1(1.+Rl**ITIME*
1 RNSTMXl-1.l*SPWFAC*PWFAC ACP=ACP+PSUM*TSWCP ACS=ACS+PSUM*TSWCS ACU=ACU+PSUM*TSWCU ACO=ACO+PSUM*TSWCO ACL=ACL+PSUM*TSWCL
- 206 -

C WRITE OUT SUMMARY TABLE OF CHANNEL IMPROVEMENTS IF (.NOT. STF) CALL STROUT
C WRITE OUT SUMMARY TABLE OF LOCATION MEASURES IFILTFI GO TO 480 K=l DD 470 NW=l,MW IFILOCINWl .LT. Ol GO TO 470 K=K+l IF (K .EQ. 21 WRITE (6,50601
5060 FORMATIIH /// 1 40X,28HSUMMARY OF LOCATION MEASURES//,35X,4HUNIT,10X 1,27HAREA OF RESTRICTED LAND USE l
AREA=KllNWl*K2(NW)*IOUTPUT(NW,61-0UTPUT(NW,3)}**0.375 WRITEl6,50701 NW,AREA
5070 FORMAT(36X,I2,15X,FI0.0,6H ACRES! 470 CONTINUE
IF (K .EQ. 11 WRITE (6,50801 5080 FORMATllH ///,10X,67HNO LAND USE ADJUSTMENT CAN 8E JUSTIFIED ECOND
lMICALLY IN THIS STAGE I C WRITE OUT SUMMARY TABLE OF FLOOD PROOFING MEASURES
480 IF(PTFl GO TO 500 K=l DD 490 NW=l,MW IFIOUTPUTINW,91 .EQ. O.) GD TD 490 K=K+l IF (K .EQ. 21 WRITE 16,50901
5090 FORMATtlH ///,40X,34HSUMMARY OF FLOOD PROOFING MEASURES//,35X,4HUN llT,lOX,14HAREA PROTECTED l
AREA=Kl(NWl*K2(NWl*IOUTPUT(NW,91-0UTPUT(NW,3ll**0.375 WRITE(6,5100l NW,AREA
5100 FORMATl36X,12,15X,Fl0.0,6H ACRES) 490 CONTINUE
IF (K .EQ. 1) WRITE 16,51101 5110 FORMAT(lH ///,10X,67HNO FLOOD PROOFING CAN BE JUSTIFIED ECONOMICAL
llY IN THIS STAGE I 500 NSTAGE=NSTAGE+l
IFINSTAGE ~GT. NSTEMXl GO TO 510 C RETURN TO NEXT STAGE UNLESS All STAGES HAVE BEEN ANALYZED
GO TO 120 C WRITE DISCOUNTED ANNUAL COSTS FOR ENTIRE STUDY PERIGO
510 ACF=ACP+ACL+ACS+ACU+ACO WRITE(6,5120l ACS,ACL,ACP,ACD,ACU,ACF
5120 FDRMAT(1Hl,40X,35HAVERAGE ANNUAL COST OVER All STAGES//45X,4HITEM, 118X,12HOOLLARS/YEAR/35X,27HCOST OF CHANNEL IMPROVEMENT,7X,F8.0/35X 2,16HCOST OF LANO USE,18X,F8.0/35X,22HCOST OF FLOOD PROOFING,12X,F8 3.0/35X,25HCOST OF RESIDUAL FLOOOING,9X,F8.0/35X,19HCOST OF UNCERTA 4INTY,15X,F8.0/35X,10HTOTAL COST,24X,F8.0l
STOP ENO
SUBROUTINE 8RlOGECCII - 207 -

C UNIVERSITY OF KENTUCKY FLOOD CONTROL PLANNING PROGRAM II C VERSION OF JANUARY 27, 1968 C DETERMINES NUMBER OF BRIDGES TO BE ENLARGED OR REPLACED. EXISTING C BRIDGES WHICH BECOME TOO SMALL ARE REPLACED. BRIDGES BUILT C IN PROGRAM ARE ENLARGED. HIGHWAY BRIDGES BUILT TO SERVE C NEW URBAN DEVELOPMENT ARE ENLARGED AS NECESSARY, BUT INITIAL C CONSTRUCTION COST IS NOT CHARGED TO FLOOD CONTROL. C Q IS THE CURRENT REQUIRED CHANNEL CAPACITY
COMMON A0(25l,Al(25J,A21251,A31251,A4(251,ADOCSl251,AFCTR{3,111, l AFW(Z,25l,AW(25l,CAPl25,lll,CH!251,CHANELl25l,CLOC(25,5l,D(3,251, 2 DFl10l,DFQR(l61,0QCKl161,FOA(Z5l,FQ(Z5l,FRU(l1l,IDC100l,IHEl251, 3 IHNl25l,IHOL0(25l,IMPROV(251,INDEX{25,Zl,IRE(25l,IRNt25l,Kl!25l, 4 K2(251,LC!25l,LINING{25l,LOC!251,NOTC251,0UTPUTl25,13l,QOl25l, 5 Q05{11,lll,Q43(11,lll,QQ{2,10l,QX{Z,161,RC!25l,Sl25l,SICl25l, 6 T0!25l,TCL(251,TFl25l,TIC(251,USUBW(Z5,6l,UTOTR(25,6l, 7 VALUE(Z5,6l;W0!25l,WT!251,XF1125J,XF2{25l,XF3125l,Xf41251,Y(l6l, 8 YY(lOI
COMMON A,AG,ATEMP,BOMAX,BOMIN,CO,CDA,COAV,COB,COBV,CDC,CDCV,CDST, l CHECK,CLEN,COEFOM,CPF,CRF,CRFSM,CS,CU,f•FA,FO,FOTEMP,FIA,FIB•FIC, 2 FTOP,GA,GSF,HE,HETEMP,HMAX,HN,HOLONG,HTEMP,IPP,ITOP,LA,LF,LGTEMP, 3 LINED,LL,LTF,MANNR,MANNT,MANNU,MW,NO,NDF,NOTEMP,NSTAGE,NSTEMX,NW, 4 PA,PB,PC,PP,PTF,PWF,QB05,QB43,QL,QLINEO,QP,QS,R,RE,RETEMP,RN, 5 RTEMP,SAFC,SK1,SK2,SK3,SK4,SK5,SK6,SK7,SK8,SPWF,SPWFAC,SS,STEMP, 6 STF,T,TIME,TIMST,TRACE,TTEMP,UN,UNC,UZ,VA,VLAGST,VLURST,W,WTEMP, 7 XF,YCOMP,ZT,ZU
REAL LC LOGICAL CHANEL
C FORGET OLD VALUES HA=O. RE = O. HE =O. RN = O. HN = o.
C COUNT ADEQUATE (HA) ANO INADEQUATE (HNJ HIGHWAY BRIDGES. INADEQUATE C HIGHWAY BRIDGES ARE TO BE REPLACED.
00 20 J=l,6 IF(CAP(NW,Jl .LT. O.l GO TO 30 IF(CAPINW,Jl .GE. QI GO TO 10 HN = HN+l. GO TO 20
10 HA=HA+l. 20 CONTINUE
C COUNT RAILWAY BRIDGES NEEDING REPLACEMENT (RNI 30 00 40 J=7,8
IF!CAP(NW,Jl .LT. O.J GO TO 50 IFICAP(NW,Jl .GE. Ql GO TO 40 RN= RN+l.
40 CONTINUE C NUMBER OF BRIDGES BUILT IN PROGRAM TO BE EXTENDED
50 IFICAP(NW,lll .GT.O •• ANO. CAPINW,111 .LT. Q) GO TO 60 GO TO 70
60 HE= CAP(NW,91 - 208 -
'

'
RE = CAPINW,101 70 IFINSTAGE .EQ. 11 RETURN
C ESTIMATE NUMBER OF HIGHWAY CROSSINGS WHICH WILL BE BUILT FOR FUTURE C URBANIZATION BUT BEFORE THE BEGINNING OF THE STAGE UNDER C ANALYSIS
IFIUSUBW(NW,NSTAGEl .LT •• 251 RETURN C IF SUBWATERSHEO IS BETWEEN 25 PER CENT ANO 50 PER CENT URBANIZED C THERE SHOULD BE AT LEAST TWO HIGHWAY BRIDGES PER MILE C OF CHANNEL
IFIUSUBWINW,NSTAGEl .LT •• 501 GO TO 80 C IF SUBWATERSHEO IS MORE THAN 50 PER CENT URBANIZED THERE SHOULD C BE AT LEAST THREE HIGHWAY BRIDGES PER MILE OF CHANNEL
NBR = LC(NWl*3.0 + 0.5 GO TO 90
80 NBR = LC(NWl*2.0 + 0.5 90 BRN = NBR
!Fl.NOT. CHANEL(NWI I GO TO 100 IF !BRN .GT. HN+HE+HAl HE=BRN-(HN+HAl RETURN
100 IF (BRN .GT. HN+HE+HAl HN=8RN-(HE+HAI RETURN ENO
SUBROUTINE CALCLU C UNIVERSITY OF KENTUCKY FLOOD CONTROL PLANNING PROGRAM II C VERSION OF JANUARY 21, 1968 C CALCULATES LOCATION COST PER ACRE FOR EACH SUBWATERSHEO IN EACH C STAGE AND MAKES SURE THAT LOCATION COST WILL INCREASE AS THE C SUBWATERSHEO BECOMES MORE URBANIZED
COMMON A0{25l,Al(25l,A2{25l,A3(251,A4(25l,AOOCS!251,AFCTRl3,lll, 1 AFWl2,251,AWl25},CAP{25,111,CH{251,CHANEL(25),CLOC(25,5l,0(3,251, 2 OF{ 10 I , OFQR I 16 l, OQCK 116 I , FDA ( 25 I , FQ( 25 l , FRU I 11 l, ID(l 00 l, I HE ( 251, 3 IHNl251,IHOLDl25l,IMPROV(25l,INOEXl25,21,IRE(251,IRN{251,Kl(25l, 4 K2125l,LC{25l,LININGl25l,LOCl251,NOT(25),0UTPUT{25,13l,Q0(251, 5 Q05!11,lll,Q43!11,lll,QQ12,101,QX12,16l,RCl25l,S!25J,SICl25l, 6 TOf251,TCL!25l,TF!25l,TIC(25l,USUBWl25,6l,UTOTRl25,6l, 7 VALUEl25,6l,WOl251,WT(25l,XF1125l,XF21251,XF3(25J,XF4(25J,Y{l61, 8 YY{lOl
COMMON A,AG,ATEMP,BDMAX,BDMIN,CO,CDA,CDAV,COB,CDBV,COC,CDCV,COST, l CHECK,CLEN,COEFOM,CPF,CRF,CRFSM,CS,CU,F,FA,FD,FDTEMP,FIA,FIB,FIC, 2 FTOP,GA,GSF,HE,HETEMP,HMAX,HN,HOLONG,HTEMP,IPP,ITOP,LA,LF,LGTEMP, 3 LINED,LL,LTF,MANNR,MANNT,MANNU,MW,ND,NDF,NOTEMP,NSTAGE,NSTEMX,NW, 4 PA,PB,PC,PP,PTF,PWF,QB05,QB43,QL,QLINEO,QP,QS,R,RE,RETEMP,RN, 5 RTEMP,SAFC,SK1,SK2,SK3,SK4,SK5,SK6,SK7,SKB,SPWF,SPWFAC,SS,STEMP, 6 STF,T,TIME,TIMST,TRACE,TTEMP,UN,UNC,UZ,VA,VLAGST,VLURST,W,WTEMP, 7 XF,YCOMP,ZT,ZU
REAL LF,IPP,IA LOGICAL CHECK
C FILLS ARRAY Of PER ACRE LOCATION ADJUSTMENT COST FOR All SUB-C WATERSHED STAGES
- 209 -

00 30 NSTAGE=l,NSTEMX 00 30 NW=l,MW
C DISCOUNTED URBANIZATION OVER THE STAGE OUN=USUBWINW,NSTAGEl+IGSF•JUSUBWINW,NSTAGE+ll-USUBWINW,NSTAGEJIJ/TI lME
IF (UN .LT. 1.001 GO TO 10 FUQ=FRU( 111 GO TO 20
C INTERPOLATION 10 UR=lO.O*UN+l.O
l=UR UQ=I FUQ=FRUI I l+IUQ-URl*{FRU(I 1-FRU(l+l.l I
C AGRICULTURAL INCOME 20 IA=FUQ*IFIA*D(l,NWl+FlB*Ol2,NWl+FIC*013,NWll
OCLUT=LF*CRF*fVALUEINW,NSTAGEl-PWF*VALUEINW,NSTAGE+ll-SPWF*llA+IPP* lUNJl
IF (CLUT.LT.0.01 CLUT=O.O C TOTAL LOCATION COST, INCLUDING COST OF ENFORCING LANO USE C RESTRICTIONS
30 CLOC(NW,NSTAGEl=CLUT+CLEN IF INSTEMX.EQ.l) RETURN
C IF IT IS HIGHER, REDUCES SUBWATERSHEO VALUE TO THAT IN NEXT STAGE 00 50 NW= 1, MW DO 50 NRS=2,NSTEMX NRT=NSTEMX+l-NRS
50 IFICLOC{NW,NRTJ.GT. CLOCINW,NRT+l}I CLOCINW,NRTl=CLOC!NW,NRT+l) IF I.NOT. CHECK) RETURN WRITE (6,BO)
BO FORMAT 11Hl,15X,56HLOCATION ADJUSTMENT COST IN $/ACRE BY SUBWATERS 1HEO-STAGE/lOX,2HNW,2X,7HSTAGE l,2X,7HSTAGE 2,2X,7HSTAGE 3,2X,7HSTA 2GE 4,2X,7HSTAGE 5)
DO 70 NW=l,MW 70 WRITE 16,601 NW,ICLOCINW,NSTAGEl, NSTAGE=l,NSTEMXl 60 FORMAT (10X,12,5J2X,F7.21l
RETURN END
SUBROUTINE CDl!NNJ C UNIVERSITY OF KENTUCKY FLOOD CONTROL PLANNING PROGRAM II C VERSION OF JANUARY 27, 1968 C EVALUATES AVERAGE ANNUAL VALUES FOR FLOOD DAMAGE AND UNCERTAINTY C DAMAGE FOR CASES WHERE LAND USE ADJUSTMENT IS NOT INVOLVED. C FLOOD DAMAGE IS EVALUATED BY SEPARATING STRUCTURAL FROM CROP C DAMAGE. CROP DAMAGE EQUALS $FA PER ACRE PLUS $GA C PER ACRE PER FOOT OF FLOOD DEPTH. STRUCTURAL DAMAGE EQUALS C COEFDM*DEPTH*AREA*IMARKET VALUE! UNTIL THE FLOOD DEPTH IS GREAT C ENOUGH TO DESTROY 0.25*1MARKET VALUE}. STRUCTURAL DAMAGE THEN C INCREASES AT HALF THIS RATE WITH ADDITIONAL DEPTH UNTIL THE FLOOD C DEPTH IS GREAT ENOUGH TO DESTROY 0.75*(MARKET VALUE!. NO
- 210 -
'

C ADDITIONAL DAMAGE IS ADDED FOR STILL GREATER DEPTHS. DAMAGES C ARE SEPARATELY DETERMINED FOR AREAS IN EACH OF THE THREE DEPTH C RANGES ANO THEN ADDED.
COMMON A0{25l,Al(25l,A2125J,A3125l,A4(251,ADDCSl25l,AFCTRl3,lll, l AFW12,251,AWl25l,CAPl25,lll,CHl251,CHANELf25J,CLOCl25,51,Dl3,251, 2 DF{l01,DFQRC16l,DQCKl16l,FDAl251,FQl25l,FRUClll,IO(lOOl,IHEl25l, 3 IHNl25l,IHOLD(25l,IMPROVl251,INDEX(25,21,IRE!251,IRNl25l,Kll251, 4 K2(251,LC{251,LININGl251,LOC(251,NOTl251,0UTPUTl25,13J,QOl25l, 5 Q05111,lll,Q43111,11),QQ12,101,QXC2,16l,RCC25J,Sl25J,SICl25l, 6 TOl251,TCLl25l,TF{25),TICl25l,USUBW(25,61,UTOTRl25,6J, 7 VALUE(25,6J,W0(251,WTl25l,XF11251,XF2125l,XF31251,XF41251,Y(l61, 8 YY(lO)
COMMON A,AG,ATEMP,BDMAX,BOMIN,CD,COA,CDAV,CDB,COBV,COC,COCV,COST, 1 CHECK,CLEN,COEFDM,CPF,CRF,CRFSM,CS,CU,F,FA,FD,FOTEMP,FIA,FIB,FIC, 2 FTOP,GA,GSF,HE,HETEMP,HMAX,HN,HOLDNG,HTEMP,IPP,ITOP,LA,LF,LGTEMP, 3 LINED,LL,LTF,MANNR,MANNT,MANNU,MW,ND,NOF,NDTEMP,NSTAGE,NSTEMX,NW, 4 PA,PB,PC,PP,PTF,PWF,QB05,QB43,QL,QLINEO,QP,QS,R,RE,RETEMP,RN, 5 RTEMP,SAFC,SK1,SK2,SK3,SK4,SK5,SK6,SK7,SKB,SPWF,SPWFAC,SS,STEMP, 6 STF,T,TIME,TIMST,TRACE,TTEMP,UN,UNC,UZ,VA,VLAGST,VLURST,W,WTEMP, 7 XF,YCOMP,ZT,ZU
REAL Kl,K2 LOGICAL UNC
C DESIGN FLOWS LESS CHANNEL CAPACITY QSS=QS-QOINWl QPP=QP-QO(NWI
C UNIT DAMAGE FACTORS C URBAN STRUCTURES WITH FLOOD PROOFING
Cl=O.llll*VLURST•UN•COEFOM C ADDITIONAL FOR URBAN STRUCTURES WITHOUT FLOOD PROOFING
C2=8.0*Cl C AGRICULTURAL STRUCTURES WITH FLOOD PROOFING
C3=0.llll*VLAGST*(l.O-UNl*COEFDM C ADDITIONAL FOR AGRICULTURAL STRUCTURES WITHOUT FLOOD PROOFING
C4=8.0*C3 C CROP DAMAGE
C5=FA*(l.O-UNI CSG = GA*(l.0-UN)
C COMBINED STRUCTURES WITH FLOOD PROOFING C6=Cl+C3
C ADDITIONAL FOR COMBINED STRUCTURES WITHOUT FLOOD PROOFING C7=C2+C4
C EVALUATE DAMAGES FOR 16 FLOODS BEGINNING WITH THE BIGGEST 00 100 J=l,ITOP
C NO DAMAGE IF FLOOD CONTAINED IN CHANNEL DFQRIJl=O.O I = l CA=C6 CB=C5 CBG = C5G IF (QSS .GE. QX(NN,J)l GO TO 100
C EXCESS FLOW QXC=QX(NN,Jl~QSS
- 211 -

C ESTIMATE MAXIMUM DEPTH OF FLOODING 2 OMAX=Kl(NWl*QXC**0.375
C TEST WHETHER MAXIMUM FRACTION OF MARKET VALUE DESTROYED EXCEEDS 0.25 FMAX=COEFDM*OMAX AZl=O.O AZ2=0.0 AZ3=0.0 DZl=O.O OZ2=0.0 023=0.0 IF IFMAX .LE. 0.251 GO TO 4
C DEPTH ANO AREA OF FLOODING IN ZONE l DZl=0.25/COEFOM GO TO 6
4 DZl=DMAX 6 AZl=K2(NWl*OZ1
C DAMAGE IN ZONE 1 DFQRlJl = OFQR(Jl • 0.5*(CA•CBGl*OZl*AZl. • CB*AZl IF IFMAX .LE. 0.251 GO TO 50
C TEST WHETHER MAXI~UM FRACTION OF MARKET VALUE DESTROYED EXCEEDS 0.75 FMAX = 0.25 • 0.5*COEFDM*CDMAX-0Zll IF (FMAX .LE. 0.751 GO TO 8
C DEPTH ANO AREA OF FLOODING IN ZONE 2 OZZ = OZl • 1.0/COEFOM GO TO 10
8 OZ2 = OMAX 10 AZZ = K21NWl*DZ2 - AZl
C DAMAGE IN ZONE 2 DFQRIJ) = DFQR(Jl + CA*IDZl+0.25*1DZ2-DZlll*AZ2+1C8+5.0*C8Gl*AZ2 IF IFMAX .LE. 0.751 GO TO 50
C DEPTH ANO AREA OF FLOODING IN ZONE 3 OZ3 = OMAX AZ3 = K21NWl*DZ3 - AZZ
C DAMAGE IN ZONE 3 DFQR(Jl = DFQR(Jl + CA*(DZl•0.5*10Z2-DZll l*AZ3+1CB+5.0*CBGl*AZ3
C NO ADDITIONAL DAMAGE IF All STRUCTURES IN FLOODED AREA ARE FLOOD C PROOFED
50 CONTINUE IF II .EQ. 21 GO TO 100 I = 2 IF IQPP .GE. QXINN,Jll GO TO 100
C RETURNS TO FIGURE ADDITIONAL DAMAGE IF FLOOD PROOFING IS OVERTOPPED QXC = QXINN,Jl - QSS CB= 0.0 CBG = O.O CA= C7 GO TO 2
100 CONTINUE C MEAN ANNUAL DAMAGE FROM FLOODS OF 16 SPECIFIED FREQUENCIES
OC0=0.2*1DFQR(l6l+OFQRl15l+OFQR(l41l+O.l*IDFQR(l3l+DFQR(l2ll•0.05*1 lOFQRllll+OFQR(lOll+0.02*1DFQR(9J+OFQRl8l+OFQRl7ll+O.Ol*IOFQR(61+DF 2QRf51+0FQRl4ll+0.005*DFQR(3l+0.004*0FQRl21+0.00l*DFQR(ll
- 212 -

CU=O.O !Ft.NOT. UNCI RETURN
C STANDARD DEVIATION OF FLOODS OF 16 SPECIFIED FREQUENCIES OSIGMA=SQRTI0.2*1(0FQRl16l-CDl**2+(DFQRl15l-CDl**2+1DFQRl141-CDl**2 ll+O.l*l{DFQR(l3l-COl**2+(0FQRl12l-COl**2l+0.05*(1DFQR{lll-CDl**2+( 20FQR(lOJ-CDl**2l+0.02*11DFQR(9)-CDl**2+lOFQR(8l-CDl**2+1DFQR(7)-CO 3l**2l+O.Ol*IIDFQR(6l-CDl**2+{DFQR(51-CDl**2+!0FQR{4)-CDl**2l+0.005 4*{DFQRl3l-CDl**2+0.004*!0FQR{2)-CDl**2+0.00l*(DFQR(ll-CD)**2l
C COST OF UNCERTAINTY BASED ON THOMAS UNCERTAINTY FUND CU=VA*SIGMA*CRFSM/SQRTl2.0*RI RETURN END
SUBROUTINE CD2(NNI C UNIVERSITY OF KENTUCKY FLOOD CONTROL PLANNING PROGRAM II C VERSION OF FEBRUARY 26, 1968 C EVALUATES AVERAGE ANNUAL VALUES FOR FLOOD DAMAGE ANO UNCERTAINTY C DAMAGE FOR £ASES WHERE LAND USE ADJUSTMENT IS INVOLVED. C FLOOD DAMAGE IS EVALUATED BY SEPARATING STRUCTURAL FROM CROP C DAMAGE. CROP DAMAGE EQUALS $FA PER ACRE PLUS $GA C PER ACRE PER FOOT OF FLOOD DEPTH. STRUCTURAL DAMAGE EQUALS C COEFOM*DEPTH*AREA*IMARKET VALUE) UNTIL THE FLOOD DEPTH JS GREAT C ENOUGH TD DESTROY 0.25*lMARKET VALUE). STRUCTURAL DAMAGE THEN C INCREASES AT HALF THIS RATE WITH ADDITIONAL DEPTH UNTIL THE FLOOD C DEPTH IS GREAT ENOUGH TO DESTROY 0.75*(MARKET VALUEJ. NO C ADDITIONAL DAMAGE IS ADDED FOR STILL GREATER DEPTHS. DAMAGES C ARE SEPARATELY DETERMINED FOR AREAS IN EACH OF THE THREE DEPTH C RANGES AND THEN ADDEO.
COMMON A0(251,A1(25l,A2125l,A3(25l,A4125l,ADDCS(25l,AFCTRl3,lll, 1 AFWt2,251,AW(251,CAP(25,11),CHl25l,CHANEL{25l,CLOCl25,5l,D(3,25l, 2 OFl10l,DFQR(l6l,DQCK(l61,FDAC25l,FQ(25l,FRU(lll,ID!lOOl,IHEl251, 3 IHN{25l,IHOLDl251,IMPROVl25l,INOEX!25,2l,IRE(25l,IRNl25l,Kll251, 4 K2125l ,LCl25l ,LININGl25l ,LOCl251,NOTl25l ,OUTPUT(25,13J ,Q0{25l, 5 Q05(11,111,Q43(11,lll,QQ!2,101,QX12,161,RC(25l,S(25l,SlC(251, 6 TOl25l,TCL!25),Tf(25l,TIC(25l,USUBWl25,6l,UTOTR(25,6l, 7 VALUEl25,6l,W0(25l,WTl25l,XF1(25J,Xf2125l,XF3!25l,XF4125l,Y(l61, 8 YYllOI
COMMON A,AG,ATEMP,BDMAX,BOMIN,CD,CDA,COAV,COB,CDBV,COC,COCV,COST, l CHECK,CLEN,COEFOM,CPF,CRF,CRFSM,CS,CU,F,FA,FO,FDTEMP,FIA,FIB,FIC, 2 FTOP,GA,GSF,HE,HETEMP,HMAX,HN,HOLDNG,HTEMP,IPP,ITOP,LA,LF,LGTEMP, 3 LINED,LL,LTF,MANNR,MANNT,MANNU,MW,ND,NOF,NDTEMP,NSTAGE,NSTEMX,NW, 4 PA,PB,PC,PP,PTF,PWF,QB05,QB43,QL,QLINEO,QP,QS,R,RE,RETEMP,RN, 5 RTEMP,SAFC,SK1,SK2,SK3,SK4,SK5,SK6,SK7,SK8,SPWF,SPWFAC,SS,STEMP, 6 STF,T,TIME,TIMST,TRACE,TTEMP,UN,UNC,UZ,¥A,VLAGST,VLURST,W,WTEMP, 7 XF,YCOMP,ZT,ZU
REAL Kl,K2 LOGICAL UNC
C DESIGN FLOWS LESS CHANNEL CAPACITY QSS=QS-QOINWI QPP=QP-QOINWJ
- 213 -

QLL=QL-QO(NWl C UNIT DAMAGE FACTORS C URBAN STRUCTURES WITH FLOOD PROOFING
Cl=O.llll*VLURST*UZ*COEFOM C ADDITIONAL FOR URBAN STRUCTURES WITHOUT FLOOD PROOFING
C2=8.0*Cl C AGRICULTURAL STRUCTURES WITH FLOOD PROOFING
C3=0.llll*VLAGST*ll.O-UZl*COEFDM C ADDITIONAL FOR AGRICULTURAL STRUCTURES WITHOUT FLOOD PROOFING
C4=8.0*C3 C CROP DAMAGE
CS=FA*( 1.0-UZJ CSG = GA*(l.O-UZJ
C COMBINED STRUCTURES WITH FLOOD PROOFING C6=Cl+C3
C ADDITIONAL FOR COMBINED STRUCTURES WITHOUT FLOOD PROOFING C7=C2+C4
C URBAN STRUCTURES WITH FLOOD PROOFING OUTSIDE THE RESTRICTED LAND USE CB= O.llll*VLURST*IUN-UZl*COEFOM
C ADDITIONAL FOR URBAN STRUCTURES WITHOUT FLOOD PROOFING OUTSIDE THE C RESTRICTED LAND USE AREA
C9 = 8.0*CB C CORRECTION FOR AGRICULTURAL STRUCTURES DISPLACED BY URBAN STRUCTURES C OUTSIDE THE RESTRICTED AREA !FLOOD PROOFING)
ClO = -0.llll*VLAGST*IUN-UZl*COEFDM C CORRECTION FOR AGRICULTURAL STRUCTURES DISPLACED BY URBAN STRUCTURES C OUTSIDE THE RESTRICTED AREA (NO FLOOD PROOFING!
Cll = B.O*ClO C CORRECTION FOR CROPS DISPLACED BY URBAN STRUCTURES OUTSIDE THE C RESTRICTED AREA
C12 = -FA*IUN - UZI Cl2G = -GA*(UN - UZl
C COMBINED ACCOUNTING FOR FLOOD PROOFED STRUCTURES OUTSIDE THE RESTRICT Cl3 = CB + C 10
C COMBINED ACCOUNTING FOR STRUCTURES NOT FLOOD PROOFED OUTSIDE THE C RESTRICTION
014 = C9 + Cll C EVALUATE DAMAGES FOR 16 FLOODS BEGINNING WITH THE BIGGEST
DO 100 J=l,ITOP C NO DAMAGE IF FLOOD CONTAINED IN CHANNEL
DFQR(JJ=O.O CA= C6 CB= CS CBG = CSG I -= 1 IF IQSS .GE. QX(NN,Jll GO TO 100
C EXCESS FLOW QXC=QXCNN,Jl-QSS
C ESTIMATE MAXIMUM DEPTH OF FLOODING 2 DMAX=Kl(NWl*QXC**0.375
C TEST WHETHER MAXIMUM FRACTION OF MARKET VALUE DESTROYED EXCEEDS 0.25 FMAX=COEFDM*DMAX
- 214 -
',

t
All :=: O.O AZ2 = 0.0 AZ3 = 0.0 DZl = 0.0 DZ2 = O.O 023 = o.o IF lFMAX .LE. 0.251 GO TO 4
C DEPTH AND AREA OF FLOODING IN ZONE 1 OZl=0.25/COEFOM GO TO 6
4 OZl=DMAX 6 A2l=K21NWl*DZl
C DAMAGE IN ZONE l IF !I.NE.4.ANO.I.NE.6) GO TO 7
C SUBTRACTING OUT DAMAGES FROM AZS DEEPEST FLOODED ACRES WHICH DO NOT C ACCRUE BECAUSE OF LAND USE RESTRICTION
AZll=AZl IF (AZl.GE.AZDl GO TO 201 AZl=O.O GO TO 7
201 A2l=A211-AZD D2L=AZD/K2{NWI DFQRIJ)=DFQR(Jl+I0.5*(CA+CBGl*IDZl+OZLJ+C-Bl*AZl GO TO 202
7 DFQRIJl = DFQR(Jl + 0.5*(CA+CBGl*DZl*AZl + CB*AZl 202 CONTINUE
IF (FMAX .LE. 0.25l GO TO 50 C TEST WHETHER MAXIMUM FRACTION OF MARKET VALUE OESTROYtD EXCEEDS 0.75
FMAX = 0.25 + 0.5*COEFDM*{OMAX-DZ1) IF (FMAX .LE. 0.751 GO TO 8
C DEPTH ANO AREA OF FLOODING IN ZONE 2 022 • DZl + 1.0/COEFDM GO TO 10
8 022 = DMAX 10 AZ2 = K21NWl*DZ2 - All
C DAMAGE IN ZONE 2 If (I.NE.4.ANO.I.NE.61 GO TO 203 A22l=K21NWl*DZ2-A2ll AZ2•AZ21 If lAZll.GE.AZDl GO TO 203 IF (AZll+AZ2l.GE.AZO) GO TO 204 AZ2•0.0 GO TO 203
204 DZL=AZO/K21NW) AZ2=A2ll+AZ21-AZD DFQR!Jl=OFQRIJ)+lCA*(OZl+0.25*1DZL+OZ2-2.0*0Zll}+CB+5.0*C8Gl*AZ2 GO TO 205
203 DFQR(JJ = DFQR!JI + CA*IDZl+0.25*1DZ2-0Zlll*AZ2+(CB+5.0*CBGl*AZ2 205 CONTINUE
IF (FMAX .LE. 0.75} GO TO 50 C DEPTH AND AREA Of FLOODING IN ZONE 3
023 = OMAX - 215 -

AZ3 = K2lNWl*DZ3 - AZ2 C DAMAGE IN ZONE 3
IF ( I.NE.4.AND.I.NE.61 GO TO 206 AZ3l=K2(NWl*DZ3-AZ21 AZ3=AZ3 l IF IAZll+AZ21.GE.AZDI GO TO 206 AZ3=AZll+AZ2l+AZ31-AZD
206 DFQR{Jl = OFQRIJJ + CA*(DZl+0.5*10Z2-DZll)*AZ3+(CB+5.0*CBGl*AZ3 C NO ADDITIONAL DAMAGE IF ALL STRUCTURES IN FLOODED AREA ARE FLOOD C PROOFED
50 CONT I NUE IF ( I • NE. 11 GO TO 60 I = 2 IF IQPP .GE. QXINN,JII GO TO 60
C RETURNS TO FIGURE ADDITIONAL DAMAGE IF FLOOD PROOFING IS OVERTOPPED QXC = QX(NN,JI - QSS CB= 0.0 CBG = 0.0 CA= C7 GO TO 2
60 IF (I .NE. 2l GO TO 70 I = 3
C NO FLOODING OUTSIDE RESTRICTED AREA IF {QX(NN,Jl .LE. QLLJ GO TO 100
C RETURNS TO FIGURE DA~AGE TO URBAN STRUCTURES (FLOOD PROOFED) C OUTSIDE THE RESTRICTED AREA
QXC = QXINN,Jl - QSS CB= Cl2 CBG = Cl2G CA = Cl3 GO TO 2
70 IF(I .NE. 31 GO TO 75 I = 4
C RETURNS TO REDUCE DAMAGE TOTAL BECAUSE OF RESTRICTED AREA IF lQSS .GE. QLLl GO TO 75 QXCS = QLL - QSS AZS=K2lNW)*Kl(NWl*OXCS**0.375 AZL=K2(NWl*KllNWl*QXC**0.375 AZD=AZL-AZS CB= -C12 CBG = -Cl2G CA= -Cl3 GO TO 2
75 IF!I .NE. 41 GO TO BO I = 5
C DETERMINE IF FLOOD PROOFING IS OVERTOPPED IF IQPP .GT. QX(NN,Jll GO TO 100
C RETURNS TO FIGURE DAMAGE TO URBAN STRUCTURES WITH FLOOD PROOFING C OVERTOPPED OUTSIDE THE RESTRICTED AREA
QXC = QXINN,Jl - QSS CB= 0.0 CBG = 0.0
- 216 -

CA = C 14 GO TO 2
80 IFII .GE. 6l GO TO 100 I = 6
C RETURNS TO REDUCE DAMAGE TOTAL BECAUSE OF RESTRICTED AREA IF lQSS .GE. Qlll GO TO 100 QXCS = QLL - QSS AZS=K21NWl*KllNWl*QXCS**0.375 AZL=K2(NWl*KllNWl*QXC**0.375 AZO=AZL-AZS CA= -C14 GO TO 2
100 CONTINUE C MEAN ANNUAL DAMAGE FROM FLOODS OF 16 SPECIFIED FREQUENCIES
OCD=0.2*(DFQR(l6J+DFQRl15l+DFQR(l4)l+O.l*{DFQRll3l+OFQRtl2ll+0.05*1 lDFQRllll+DFQR{lO}l+0.02*1DFQR(91+DFQRl8l+OFQRl71J+O.Ol*IDFQRl6l+OF 2QR(5l+OFQRl4ll+0.005*DFQR!3l+0.004*DFQR!2l+0.00l*DFQRlll
CU=O.O !Fl.NOT. UNCl RETURN
C STANDARD DEVIATION OF FLOODS OF 16 SPECIFIED FREQUENCIES OSIGMA=SQRT(0.2*IIOFQRl16l-CDl**2+1DFQRll5l-CDl**2+10FQR(l4l-CDl**2 ll +O. l *I ( OFQR t 13 )-CO l**2+t OFQR I 121-CD) **21 +0.05*1 IOFQR( l ll~CDl**2+( 20FQRl10l-COl**2l+0.02*110FQR{91-C0)**2+10FQR(8l-CDl**2+(0FQR{7l-CD 3l**2l+O.Ol*! IDFQR16l-CDl**2+1DFQR(5l-CDl**2+1DFQRl41-CDl**2l+0.005 4*(DFQRl31-COl**2+0.004*1DFQR(21-COl**2+0.00l*IDFQRill-CDl**2l
C COST OF UNCERTAINTY BASED ON THOMAS UNCERTAINTY FUND CU=VA*S1GMA*CRFSM/SQRT(2.0*Rl. RETURN FND
SUBROUTINE CHOATA C UNIVERSITY OF KENTUCKY FLOOD CONTROL PLANNING PROGRAM II C VERSION OF JANUARY 27, 1968 C READS IN DATA REQUIRED TO OPTIMIZE CHANNEL IMPROVEMENT IN CONJUNCTION C WITH NONSTRUCTURAL MEASURES
COMMON AOl251,Al(25),A21251,A3(25l,A41251,ADOCS(251,AFCTR13,lll, 1 AFW(2,251,AW(251,CAP(25,11J,CH(25l,CHANEL(251,CLOC(25,5J,013r251, 2 DF(l01,0FQRl16l,DQCK!l6l,FDA(25l,FQ!25l,FRUl111,IO(l00),IHE(251, 3 IHNl251,IHOLD!25l,IMPROV(25l,INDEXl25,2J,IRE!25l,IRN!251iK1(251, 4 K2(25l,LCl25l,LINING(25l,LOCl25l,NOTl25),0UTPUTl25,131,Q0(25l, 5 Q05111,lll,Q43111,lll,QQ(2,101,QX12,161,RCl25l,Sl251,SIC!25l, 6 T0!25l,TCL(Z5l,TFl25J,TIC(251,USUBWl25,61,UTOTRl25,6l, 7 VALUEl25,61,WOl25l,WTl25J,XF1125l,XF2!251,XF3(25l,XF4(251,Y(l6), 8 YY(lOl
COMMON A,AG,ATEMP,BOMAX,BOMIN,CD,CDA,CDAV,CDB,CDBV,COC,COCV,COST, l CHECK,CLEN,COEFOM,CPF,CRF,CRFSM,CS,CU,F,FA,FO,FOTEMP,FIA,FIB,FIC, 2 FTOP,GA,GSF,HE,HETEMP,HMAX,HN,HOLONG,HTEMP,IPP,ITOP,LA,LF,LGTEMP, 3 LINED,LL,LTF,MANNR,MANNT,MANNU,MW,NO,NOF,NOTEMP,NSTAGE,NSTEMX,NW, 4 PA,PB,PC,PP,PTF,PWF,QB05,QB43,QL,QLINEO,QP,QS,R,RE,RETEMP,RN, 5 RTEMP,SAFC,SK1,SK2,SK3,SK4,SK5,SK6,SK7,SK8,SPWF,SPWFAC,SS,STEMP,
- 217 -

6 STF,T,TIME,TIMST,TRACE,TTEMP,UN,UNC,UZ,VA,VLAGST,VLURST,W,WTEMP, 7 XF,YCOMP,ZT,ZU
REAL Kl,K2,MANNU,MANNR,MANNT,IPP,LC,MFP,MIN,MCH,NIN,MTLCH,LF LOGICAL UNC,PTF,LTF,STF,TRACE,CHECK,HOLONG DIMENSION QK12(251,AK12(25l,DK12125J
C INFORMATION IS READ USING A SPECIAL READ SUBROUTINE WHICH ALLOWS C GREATER FORMAT FREEDOM AND ALSO ALLOWS COMMENTS TO BE C WRITTEN ON THE DATA CARDS. C PROGRAM CONTROL PARAMETERS
CALL READ (Ll,L2,L3,L4,L5,L6,L1,NSTEMX,MWl IF Ill .EQ. 11 UNC=.TRUE. IF Ill .NE. 11 UNC=.FALSE. IF IL2 .NE. ll PTF=.TRUE. IF IL2 .EQ. 11 PTF=.FALSE. IF (L3 .NE. 11 LTF=.TRUE. IF (L3 .EQ. 11 LTF=.FALSE. IF (L4 .NE. 11 STF=.TRUE. IF IL4 .EQ. 1) STF=.FALSE. If (LS .EQ. 11 TRACE=.TRUE. IF (LS .NE. ll TRACE=.FALSE. IF {L6 .EQ. 11 CHECK=.TRUE. IF (L6 .NE. ll CHECK=.FALSE. IF (L7 .EQ. ll HOLONG=.TRUE. IF (L7 .NE. 11 HOLONG=.FALSE.
C SIZE ANO ARRANGEMENT OF WATERSHED 00 80 K=l,MW
80 CALL READ IAW{Kll DO 110 J=l,2 00 110 K=l,MW
110 CALL READ lINOEX(K,Jll CALL READ INJDJ DO 120 K=l,NIO
120 CALL READ (IDIK)J DO 140 K=l,MW
140 CALL READ !LC(Kll DO 190 K=l,MW
190 CALL READ {SIC(Kll DO 200 K=l,MW
200 CALL REAO (TCLIKI) 00 220 K=l,MW
220 CALL REAO !TIC{Kll C HYDROLOGY
CALL READ {QB43,08051 DO 50 IC =1,11 00 50 JU =1,11
50 CALL READ !Q431IC,JUIJ DO 60 IC =l,11 DO 60 JU =1,11
60 CALL READ lQ05!IC,JUll DO 30 I=l,3 DO 30 J=l,ll
30 CALL READ CAFCTRII,JI} - 218 -
'

}
C FLOOD DAMAGES - GENERAL DO 160 K=l,MW
160 CALL READ (QOCKJ) C READ MAGNITUDE OF ANY KNOWN FLOOD PEAK ANO ASSOCIATED MAXIMUM C DEPTH OF FLOODING AND AREA FLOODED
00 130 K=l,MW 130 CALL READ (QK12(Kl,AK121Kl,DK12(Kll
CALL READ (VA) C FLOOD DAMAGES - URBAN
CALL READ (VLURST,COEFDMl C FLOOD DAMAGES - AGRICULTURAL
00 20 K=l,MW 00 20 J=l,3
20 CALL READ (O(J,Kll CALL READ !COA,CCB,CDC,COAV,CDBV,COCVJ 00 10 I=l,11
10 CALL READ IFRU( JI) CALL READ (VLAGST)
C GENERAL DESIGN VARIABLES CALL READ tR,TIMST,TIME,NDFI 00 40 l=l,NDF
40 CALL READ (OFIIII C CHANNEL IMPROVEMENT - PHYSICAL FACTORS
00 70 K=l,MW 70 CALL READ (AOIKll
00 150 K=l,M?l 150 CALL READ (LINING(Kll
DO 100 K=l,MW 100 CALL READ IFQ(KJl
CALL READ !MANNU,MANNT,MANNR,ZU,ZTI 00 170 K=l,MW
170 CALL READ (S(Kll DO 210 K=l,MW
210 CALL READ (TF(Kll CALL READ {BOMAX,BDMIN,HMAX,NIN) 00 90 K=l,MW DO 90 J=l,8
90 CALL READ (CAP(K,Jll CALL READ {BWl
C CHANNEL lMPROVEMENT - COST FACTORS CALL READ (CX,FM,CIN,CLSF,CCY,CBR,CRR,AQR,SAFC,RWF,CSM,ESM,MIN,MCH
1,MTLCH, SFl C FLOOD PROOFING - COST FACTORS
CALL READ tFP,VF,DD,MFP,PFl C LOCATION ADJUSTMENT - COST FACTORS
CALL READ (CLEN,RPI,FIA,FIB,FIC,IPP,LFI C DEGREE Of URBANIZATION
NOFF=NSTEMX+l DO 230 K=l,MW 00 230 J=l,NDFF
230 CALL READ CUSUBW(K,J)l 00 240 K=l,MW
- 219 -

00 240 J=l,NOFF 240 CALL READ IUTOTR(K,Jll
C LANO VALUE 00 250 K=l,MW 00 250 J=l,NOFF
250 CALL READ IVALUE(K,Jll C DISCOUNTING CORRECTION TO RIGHT-OF-WAY COST
AQR = AQR + RPI/R - 1.0 C CALCULATE COMPOUND INTEREST FACTORS !SPECIAL FORMULAS FOR ZERO C DISCOUNT RATE!
PWF=l./111.+RPil**TIMEI SPWF=(ll.+RPil**TIME-1.l/lRPI*~l.+RPit**TIME) IF IR .GE. 0.00011 GO TO 260 CRF=l./TIME CRFSM=l./TIMST GSF=-O.S+TIME/2.0 SPWFAC=TIME GO TO 270
260 CRF=IR*ll.+Rl**TIMEl/((1.+Rl**llME-l.l CRFSM=IR*(l.+Rl**TIMSTl/!tl.+Rl**TIMST-1.l GSF=l./R-ITIME*Rl/(R*l(l.+Rl**TIME-1.)l SPWFAC=l./CRF
C CALCULATE FACTORS FOR COMPUTING COST OF STRUCTURAL MEASURES 270 SK1=195.6*CSM*ESM*FM*CX*ICRFSM+MCHl*SF
SK2=NIN•CIN*ESM*CSM*fCRFSM+MINl*SF SK3=0.12l*AQR*CRFSM*RWF SK4=BW*CBR*CSM*CRFSM*SF SK5=CRR*CSM*CRFSM*SF SK6=0.037*CSM*ESM*FM*CCY*(CRFSM+MINl*Sf SK7=5280.*CLSf*CSM*ESM*(CRFSM+MTLCHl*Sf SK8=5280.*SK6/FM
C CALCULATE FACTOR FOR COMPUTING COST OF FLOOD PROOFING CPF=0.5*0D*VF*fP*(CRF+MFPl*VLURST*Pf
C CALCULATE SUBWATERSHEO VALUES OF C Kl= (MAXIMUM FLOODING OEPTHI/IQ**0.3751 C K2 = (ACRES FLOOOEDI/IMAXIMUM FLOODING DEPTH)
DO 280 K = 1,MW KllKl = OK121Kl/llQK12{KI~ QOIKll**0.375)
280 K2(Kl = AK121KI/OK121Kl RETURN ENO
SUBROUTINE CHFIX C UNIVERSITY OF KENTUCKY FLOOD CONTROL PLANNING PROGRAM II C VERSION OF JANUARY 27, 1968 C FIX THE DIMENSIONS OF CHANNELS IMPROVED BEFORE BEGINNING Of PLANNING C PERIOD FOR THE PURPOSE OF ESTIMATING THE COST OF CHANNEL C ENLARGEMENT. EVEN IF THE DESIGN CRITERIA USED IN BUILDING C THE EXISTING CHANNEL 00 NOT CONFORM TO THOSE USED IN THIS C PROGRAM, THIS SUBROUTINE CAUSES All COSTS TO BE BASED ON THE
- 220 -

C SAME DESIGN CRITERIA. COMMON AOl25l,Al(251,A2(25l 1 A3(25l,A4(251,ADOCSl25l,AFCTR!3,lll,
1 AFWl2,251,AW(25),CAP(25,lll,CH{25),CHANEL{251,CLOCl25,5l,0(3,25), 2 DF(lOJ,OFQR{l6l,OQCK{l6l,FOAl251,FQl25l,FRUtlll,ID(lOOl,IHE(25l, 3 IHNf25l,IHOLOl25l,IMPROV{25l,INDEX{25,21,IRE(251,IRNl25l,Klt25l, 4 K2(25),LCl25l,LININGl25l,LOC{251,NDTl25l,OUTPUTl25,13J,Q0(251, 5 Q05(11,lll,Q43111,111,QQl2,10l,QX!2,16l,RC(25l,Sl25l,SICl25l, 6 TOl251,TCLl25l,TF(251,TICl25l,USUBW(25,6l,UTOTR(25,61, 7 VALUE(25,61,WOl25),WTl25l,XF1(25l,XF2(25),XF3(25l,XF4(251,Y(l61, 8 YY{lOl
COMMON A,AG,ATEMP,BOMAX,BDMIN,CO,CDA,COAV,CDB,COBV,CDC,COCV,COST, 1 CHECK,CLEN,COEFOM,CPF,CRF,CRFSM,CS,CU,F,FA,FO,FDTEMP,FIA,FIB,FIC, 2 FTOP,GA,GSF,HE,HETEMP,HMAX,HN,HOLDNG,HTEMP,IPP,ITOP,LA,LF,LGTEMP, 3 LINED,LL,LTF,MANNR,MANNT,MANNU,MW,ND,NDF,NOTEMP,NSTAGE,NSTEMX,NW, 4 PA,PB,PC,PP,PTF,PWF,QB05,QB43,QL,QLINED,QP,QS,R,RE,RETEMP,RN, 5 RTEMP,SAFC,SK1,SK2,SK3,SK4,SK5,SK6,SK7,SK8,SPWF,SPWFAC,SS,STEMP, 6 STF,T,TIME,TIMST,TRACE,TTEMP,UN,UNC,UZ,NA,VLAGST,VLURST,W,WTEMP, 7 XF,YCOMP,ZT,ZU
REAL MANNU,MANNR,MANNT Q=QOINWl*FO(NWJ IF ILINING!NWl .GE. 31 GO TO 30
C FIX FOR UNLINED CHANNELS X=BOMIN
10 H={IO*MANNU*IX+2.*ISQRT(l.+ZU*ZUlll**0.667l/lSQRT(S(NW)l*l•49*lX+l 1Ul**l.667ll**0.375
IFIH .LE. HMAX .OR. X .GE. BDMAXI GO TO 20 X=X+0.5 GO TO 10
20 TO(NWJ=H*{X+Z.O*ZU) AOINWl=0.5*H*(X*H+TO(NWJI WO(NWl=H*(X+2.4*ZU)+3o.o RETURN
30 IF(LINING!NWJ .EQ. 41 GO TO 60 C FIX FOR TRAPEZOIDAL LINED CHANNELS
X=BOMIN 40 H=!IO*MANNT*IX+2.*(SQRT(l.+lT*ZTlll**0.667)/ISQRTIS(NWl1*1•49*(X+l
1Tl**l.667ll**0.375 IF(H.LE. HMAX .OR. X .GE. BOMAXl GO TO 50 X=X-+0.5 GO TO 40
50 TOINWl=H*(X+2.0*ZTI AO(NWJ=0.5*H*IX*H+TO(NWll WOINWl=H*(X-+2.4*ZTl+25•0 RETURN
C FIX FOR RECTANGULAR LINED CHANNELS 60 X=BOMIN
H=IQ*MANNR*IX+2.0l**0.667 /ISQRTISINWll*l•49*X**l•667ll**0.375 TO(NWJ=X*H AO{NWl=H*TO(NW) WO{NWl=TOINWl+20.0 RETURN ENO
- 221 -

SUBROUTINE CHHYOR C UNIVERSITY OF KENTUCKY FLOOO CONTROL PLANNING PROGRAM II C VERSION OF JANUARY 27, 1968 C DETERMINES RELATIONSHIP BETWEEN FLOOD PEAK ANO FREQUENCY ANO C FREQUENCY AT WHICH FLOODING BEGINS
COMMON A0(251,Al!25l,A2(251,A3{25l~A4l25l,AOOCS(251,AFCTR(3,lll, l AFW12,25J,AW(25l,CAP(25,lll,CH(25l,CHANEL(251,CLOCl25,5l,0(3,25l, 2 OF(lOJ,OFQR(l61,0QCK{l61,FOA(251,FQ(25l,FRU(llJ,IO(lOOl,IHE(251, 3 IHN(25l,IHOL0(251,IMPROV(251,INDEX(25,2l,IRE(251,IRN(251,Kl(25l, 4 K2(25l,LC(25l,LINING(251,LOC(25J,NOT(251,0UTPUT(25,13l,Q0(25l, 5 Q05(11,lll,Q43111,11J,QQ12,10l,QX(2,161,RCC25l,S(251,SIC(251, 6 TOl25l,TCLl25l,Tf(25l,TICl25l,USUBWf25~6J,UTOTR{25,6), 7 VALUE(25,6l,W0(25l,WT(251,XF1(251,XF2(25l,XF3(251,XF4(251,Y(l6l, 8 YY(lOl
COMMON A,AG,ATfp,tP,BOMAX,BDMIN,CD,COA,COAV,COB,CDBV,COC,COCV,COST, 1 CHECK,CLEN,COEFDM,CPF,CRF,CRFSM,CS,CU,F,FA,FO,FOTEMP,FIA,FIB,FIC, 2 FTOP,GA,GSF,HE,HETEMP,HMAX,HN,HOLONG,HTEMP,IPP,ITOP,LA,LF,LGTEMP, 3 LINEO,LL,LTF,MANNR,MANNT,MANNU,NW,ND,NOF-NOTEMP,NSTAGE,NSTEMX,NW, 4 PA,PB,PC,PP,PTF,PWF,QB05,QB43,QL,QLINEO,QP,QS,R,RE,RETEMP,RN, 5 RTEMP,SAFC,SKI,SK2,SK3,SK4,SK5,SK6,SK7,SK8,SPWF,SPWFAC,SS,STEMP, 6 STF,T,TIME,TIMST,TRACE,TTEMP,UN,UNC,UZ,NA,VLAGST,VLURST,W,WTEMP, 7 XF,YCOMP,ZT,ZU
REAL LC LOGICAL CHANEL
C FLOOD FLOWS lN CFS ARE CALCULATED FOR THE 16 FREQUENCIES C SPECIFIED IN ARRAY DQCK(l6l ANO ALSO THE 10 FREQUENCIES C SPECIFIED IN ARRAY OF(lOI. FLOWS ARE CALCULATED AT THE C BEGINNING AND ENO OF EACH STAGE AND DISCOUNTED TO OBTAIN C MEAN FLOWS DURING THE STAGE.
IF(NSTAGE .EQ. 11 GO TO 20 IFlCHANELINWII GO TO 10
C CONVERTING ENO OF STAGE FLOWS FOR PRECEDING STAGE TO BEGINNING OF C STAGE FLOWS FOR CURRENT STAGE BY CHANGING GUMBEL FACTORS
XF3tNWl=XF4lNWl A3(NWl=A4(NWl
10 XFl(NWJ=XF2(NWJ AUNWl=A2(NWl
C NO NEED TO DETERMINE UNIMPROVED CHANNEL FLOW IF CHANNEL IS C ALREADY IMPROVED.
20 IFICHANEL(NWII GO TO 30 C CALCULATE END OF STAGE GUMBEL FACTORS FOR UNIMPROVED C CHANNEL CONDITIONS BASED ON CURRENT DEGREE OF URBANIZATION C AND CHANNELIZATION
C=TICINWI/TCLINWI U=UTOTR(NW,NSTAGE+ll CALL PLACEA(QX1,U,C,Q43l CALL PLACEA(QY1,U,C,Q05J QXX= AWINWl*AFWfl,NWl*QXl *QB43 QY= AW(NWl*AFW12,NWl*QY1*0805
- 222 -

XF4lNWl=((QY*0.579)-!0XX*5.296ll/(-4.7181 A4lNWl=(4.718l/lOY-OXXl
C CALCULATE BEGINNING OF STAGE GUMBEL FACTORS FOR C UNIMPROVEO CHANNEL CONDITIONS BASED ON CURRENT DEGREE OF C URBANIZATION ANO CHANNELIZATION
U=UTOTRINW,NSTAGEI CALL PLACEAIOYl,U,C,0051
C TESTING TO SEE WHETHER UPSTREAM CHANNELS HAVE BEEN IMPROVED IN C THIS STAGE. IF THEY HAVE, GUMBEL FACTORS AT ENO OF C PREVIOUS STAGE NO LONGER APPLY
IF (NSTAGE .NE. ll OYC=YCOMP/A31NW)+XF3(NWI OY= AWINWl*AFW!2,NWl*OYl*OB05 IFINSTAGE .NE. l .ANO. QYC .GE. 0.999*0Yl GO TO 30 CALL PLACEAIQXl,U,C,0431 OXX-= AW(NIO*AFWI l,NWl*QXl *0843 XF31NWl=llOY*0.5791~(QXX*5.296ll/(-4.718l A31NWl=l4.718)/(QY-QXXl
C CALCULATE END OF STAGE GUMBEL FACTORS FOR IMPROVED C CHANNEL CONDITIONS BASED ON CURRENT DEGREE OF URBANIZATION C ANO CHANNELIZATION
30 C=ITIC(NWl+LC(NWl-SJC(NWl)/TCL(NWI U=UTOTR(NW,NSTAGE+ll CALL PLACEA{0Xl,U,C,043J CALL PLACEA!OYl,U,C,0051 OXX= AW(NWl*AFW(l,NWl*OXl *0843 OY= AWlNWl*AFW12,NWl*OYl*OB05 XF2(NWl=l(OY*0.579l-lQXX*5.296)l/l-4.718l A2(NWl=(4.718l/(OY-QXXl
C CALCULATE BEGINNING OF STAGE GUMBEL FACTORS FOR IMPROVED C CHANNEL CONDITIONS BASED ON CURRENT DEGREE OF URBANIZATION C ANO CHANNELIZATION
U=UTOTR.NW,NSTAGEI CALL PLACEA(QY1,U,C,Q05l IF (NSTAGE .NE. ll QYC=YCOMP/Al(NWl+XFllNWl OY= AWINWl*AFW(2,NWl*OY1*0805 IFINSTAGE .NE. 1 .ANO. QYC .GE. 0.999*QY) GO TD 40 CALL PLACEAIOX1,U,C,Q43l QXX= AWINWl*AFW(l,NW)*QXl *0843 XFl!NWl=(IOY*0.5791-(0XX*5·296ll/(-4.718l AllNWl=(4.7181/IQY-QXXl
40 IF!CHANEL(NWll GO TO 60 C CALCULATE FLOWS FOR USE IN ESTIMATING FLOOD DAMAGES C CALCULATE DISCOUNTED FLOWS IN EXCESS OF CHANNEL CAPACIFY FOR C UNIMPROVED CHANNELS.
00 50 l=l,ITOP Q3=YII}/A3(NWl+XF3{NWl Q4=Ytll/A4(NWl+XF4(NW) QOIS=Q3+1GSF*{04-Q~IJ/TIME QX!l,I)=QOIS-Q-O(NWl IFIQX(l,11 .LT. O.I QXll,Il=O.
50 CONTINUE C CALCULATE DISCOUNTED FLOWS IN EXCESS OF CHANNEL CAP~CITY FOR
- 223 -

C IMPROVED CHANNELS. 60 DO 70 [=1,ITOP
Ql=Y(Il/Al(NWl+XFl(NWl Q2=Y{Il/A2{NWl+XF21NWI QDIS=Ql+(GSF*!Q2-Qlll/TIME QX12,I)=QDIS-QO(NWI IFlQX!2,Il .LT. O.l QX(2,Il=O.
70 CONTINUE C CALCULATE DISCOUNTED DESIGN FLOOD FLOWS FOR SELECTED ALTERNATIVE C LEVELS OF PROTECTION. If CHANNEL IS UNIMPROVED CALCULATE FLOWS C FOR BOTH UNIMPROVED AND IMPROVED CONDITIONS, IF CHANNEL IS C IMPROVED CALCULATE FLOWS FOR IMPROVED CONDITIONS ONLY.
IF(CHANELINW)J GO TO 90 00 80 l=l,NDF Q4=YY!II/A4tNWJ+XF41NWI Q3=YY(Il/A3(NWl+XF3(NWl
80 QQ11, l)=Q3+(GSF*{Q4-Q3l }/TIME 90 00 100 l=l,NOF
Q2=YY!ll/A21NWl+XF21NW) Ql=YY(I)/Al(NWl+XFllNWI
100 QQ(2,Il=Ql+!GSF*fQ2-Ql))/TIME C USING GUMBELS EQUATION CALCULATE THE FREQUENCY AT WHICH FLOODING C BEGINS.
II=l IF!CHANEL!NWll 11=2 YOIF=YY(l}-YY!NOFI XF=IQQ(II,NOFl*YY!l1/(YOIFIJ-(QQ(lI,ll*YY(NOFJ/(YOIFll AG=-YOIF/IQQIIl,NOF)-QQIII,ll) YF=AG*IQO(NWl-XF) IF (YF .LT. FTOPI GO TO 110 f=O.O GO TO 120
110 TEMP=EXP(-YFl PN=EXP(-TEMPl F=l.-PN
120 CONTINUE RETURN ENO
SUBROUTINE CHOPTM C UNIVERSITY OF KENTUCKY FLOOD CONTROL PLANNING PROGRAM II C VERSION OF JANUARY 27, 1968 C PROCEDURE FOR OPTIMIZING CHANNEL IMPROVEMENT IN CONJUNCTION WITH C NONSTRUCTURAL MEASURES WITHIN A GIVEN SUBWATERSHEO-STAGE
COMMON AO( 251,All25) ,A2( 25) ,A3( 25l ,A4(25l ,AODCS(25l ,AFCTRl3,lll, 1 AFW!2,251,AW(25J,CAPl25,11),CHl251,CHANELl25l,CLOC(25,5l,D(3,251, 2 DF(lO),DFQRl16J,DQCKl16l,FOAl25),FQ(25l,FRUllll,10{1001,IHE(25l, 3 IHN(25l,IHOL0125l,IMPROVl251,INOEXl25,21,IRE(25),IRNl25l,Kll25), 4 K2125l,LCl251,LINING!251,LOCl251,NOTl25l,OUTPUTl25,13l,Q0(25l, 5 Q05!11,lll,Q43(11,lll,QQ!2,10l,QX12,16l,RCl251,Sl25l,SICl251,
- 224 -

6 TOl25l,TCL(251,TFl25l,TICl25l,USUBW!25,6l,UTOTRl25,6l, 7 VALUEl25,6l,W0(25l,WT!25l,XF11251,XF2(25l,XF3(25),XF41251,Yll6l, 8 YY(lOl
COMMON A,AG,ATEMP,BOMAX,BDMIN,CD,CDA,COAV,COB,COBV,CDC,CDCV,COST, l CHECK,CLEN,COEFDM,CPF,CRF,CRFSM,CS,CU,F,FA,FD,FOTEMP,FIA,FIB,FIC, 2 FTOP,GA,GSF,HE,HETEMP,HMAX,HN,HDLONG,HTEMP,IPP,ITOP,LA,LF,LGTEMP, 3 LINED,LL,LTF,MANNR,MANNT,MANNU,MW,ND,NOF,NOTEMP,NSTAGE,NSTEMX,NW, 4 PA,PB,PC,PP,PTF,PWF,QB05,QB43,QL,QLINEO,CP,QS,R,RE,RETEMP,RN, 5 RTEMP,SAFC,SKl,SK2,SK3,SK4,SK5,SK6,SK7,SK8,SPWF,SPWFAC,SS,STEMP, 6 STF,T,TIME,TIMST,TRACE,TTEMP,UN,UNC,UZ,VA,VLAGST,VLURST,W,WTEMP, 7 XF,YCOl'P,ZT,ZU
REAL L,LA,ND LOGICAL CHANEL,PP,LL,SS,CDSTE,LG,SG,PG,TRACE,CHECK,LINED,LlNEX
C SETS INITIAL VALUES FOR SUBWATERSHEO STAGE C DESIGN CHANNEL DIMENSIONS ANO KIND
ST=O.O NO=O.O FO=O.O HN=O.O HE=O.O RN=O.O RE=O.O T=O.O W=O.O A=O.O NDTEMP=NDT{NW) FOTEMP=FOA (NIO ATEMP=O. HETEMP=O. HTEMP=O. RTEMP=O. RETEMP=O. STEMP=O. TTEMP=O. WTEMP=O. LGTEMP=LINING{NWI QP=QO(NWl QL=QO(NWI QS=QO{NWl CTT=O.
C SETS WHETHER DOWNSTREAM COSTS HAVE BEEN CALCULATED AND LOCATION, C STRUCTURAL, AND FLOOD PROOFING MEASURES HAVE BEEN PROVEN C TO BE ECONOMICAL DURING SUBWATERSHED STAGE
CDSTE=.FALSE. LINEX=.FALSE. LG=.FALSE. SG=.FALSE. PG=.FALSE.
C FLOOD FREQUENCY AND DISCHARGE EXISTING CHANNEL WILL CONTAIN OUTPUT(NW,ll=F IFlCHANEL(NWll OUTPUT(NW,2l=F OUTPUTINW,3l=QO(NW)
- 225 -
/
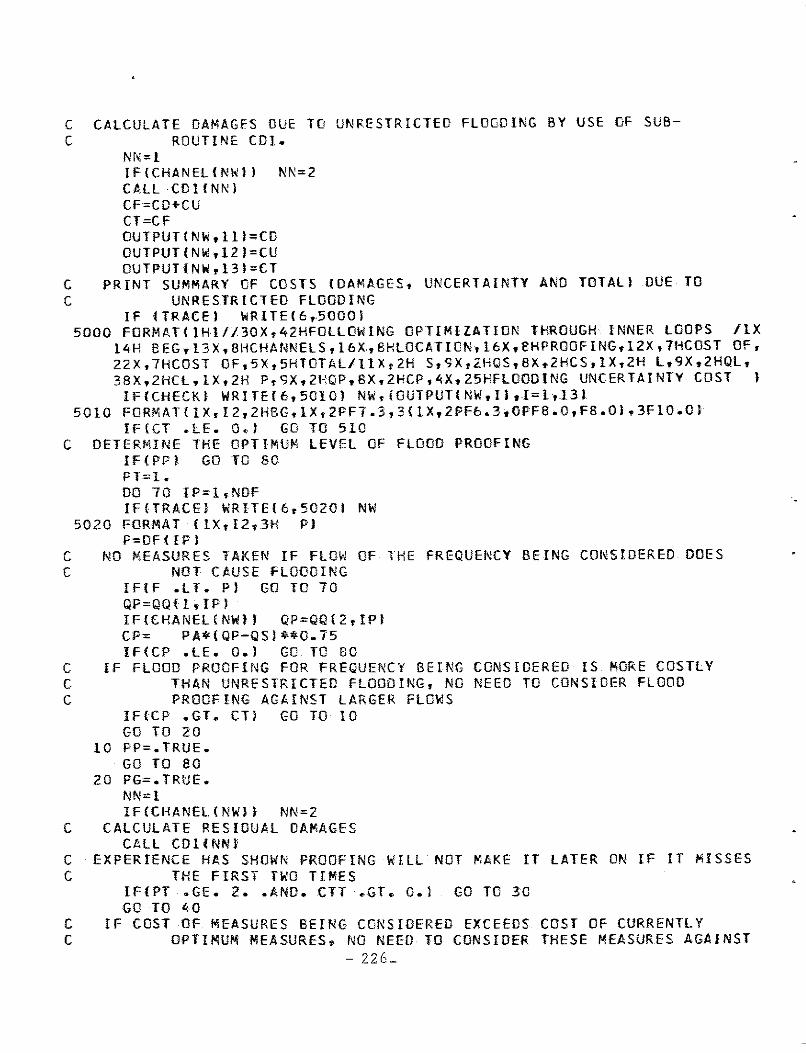
C CALCULATE DAMAGES DUE TC UNRESTRICTED FLOODING BY USE OF SUB-C ROUTINE CDI.
NN=l !F!CHANEL{NWI I NN=2 Cft,LL COHNN) CF=CO+CU CT=CF OUTPUTINW,lll=CD OUTPUT{NW,12l=CU OUTPUT(NW,131=CT
C PRINT SUMMARY OF COSTS (DAMAGES, UNCERTAINTY AND TOTAL! DUE TO C UNRESTRICTED FLOODING
IF tTRACEI WRITE16r50GOI 5000 FORMAT! 1Hl//30X,42HFOLLOWING OPTIMIZATION THROUGH INNER LOOPS /lX
l4H BEGrl3X,8HCHANNELS,16X,BHLOCATICN,16X,BHPROOFING,12X,7HCOST OF, 22X,7HCOST OF,5X 1 5HTOTAL/11X 1 2H S1 9X,2HQS,BX,2HCS11X,2H L,9X,2HQL, 3BX,2HCL,1X,2H P,9X,2HQP,BX,2HCP,4X,25HFLOODING UNCERTAINTY COST l
IFICHECK) WRITEI6,50101 NW,IOUTPUT(NW,Il,I=l,131 5010 FORMAT(1X,I2,2HBG,1X,2PF1.3,3(1X,2PF6.3,0PF8.0,f8.0l,3Fl0.0I
IFICT .LE. O.l GO TO 510 C DETERMINE THE OPTIMUM LEVEL OF FLOOD PROOFING
IF(PPl GO TO 80 PT=l. DO 70 IP=l,NOF IF(TRACEI WRITEl6,5020l NW
5020 FORMAT 11X,I2,3H Pl P=DF<lFl
C NO MEASURES TAKEN IF FLOW OF THE FREQUENCY BEING CONS[DERED DOES C NOT CAUSE FLOODING
IF!F .LT. Pl GO TO 10 QP=QQ{l,IPl IF{CHANEL(NW} I QP=QQf2, IPI CP= PA*(QP-QSl**0.75 IF(CP .LE. O. l GO TO 80
C IF FLOOD PROOFING FOR FREQUENCY BEING CONSIDERED IS MORE COSTLY C THAN UNRESTRICTED FLOODING, NO NEED TO CONSIDER FLOOD C PROOFING AGAINST LARGER FLOWS
IFfCP .GT. CTI GO TO 10 GO TO 20
10 PP=.TRUE. GO TO 80
20 PG=.TRUE. NN=l IF(CHANELINW)t NN=2
C CALCULATE RESIDUAL DAMAGES CALL CDl(NNf
C EXPERIENCE HAS SHOWN PROOFING WILL NOT MAKE IT LATER ON IF IT MISSES C THE FIRST TWO TIMES
IFIPT .GE. 2 •• ANO. CIT .GT. O.l GO TC 30 GO TO 40
C IF COST OF MEASURES BEING CONSIDERED EXCEEDS COST OF CURRENTLY C OPTIMUM MEASURES. NO NEED TO CONSIDER THESE MEASURES AGAINST
- 226-

'
C EVfN LARGER FLOWS 30 IF!CTT .LT. CO+CP+CU) GO TO 80 40 CTT=CO+CP+CU
C If TOTAL COST ASSOCIATED WITH MEASURES BEING CONSIDERED IS LESS C THAN COST OF PREVIOUS OPTIMUM, PRINTS SUMMARY Of THESE NEW C OPTIMUM MEASURES
IFICTT .LT. CTI GO TO 50 GO TO 60
50 CT=CTT OUTPUT(NW,5l=O.O OUTPUT(NW,6)=0.0 OUTPUT(NW,7)=0.0 OUTPUT(NW,8l=P OUTPUT(NW,9l=QP OUTPUTINW,lOl=CP OUTPUT(NW,lll=CD OUTPUTINW,12l=CU OUTPUTINW,13l•CT IFICHECKl WRITE(6,5030J NW,tOUTPUT(NW,11,1•1,131
5030 FORMAT(lX,12,2H P,lX,2PF7.3,3ClX,2Pf6.3,0PF8•0,F8.0l,3FlO.Ol 60 PT=PT+l. 70 CONTINUE
C DETERMINE THE OPTIMUM LEVEL Of LANO USE ADJUSTMENT 80 IF(LLl GO TO 170
DO 160 IL=l,NOf If(TRACEl WRITE!6 1 5040l NW
5040 FORMAT {1X,I2,3H LI L•Df( IL l tFIF .LT. LI GO TD 160 QP=QO(NWI QL•QQ(l,ILl lflCHANEl(NWI) Ol=QQ(2,Ill Cl= LA*IOL-QSl**0.375 IFICL .GT. CT .ANO •• NOT. LG) LL=.TRUE. IFICL .GT. CTI GO TO 170 LG=.TRUE. NN=l IF(CHANELINWll NN=2 CALL C02!NNJ CTT=CO+Cl+CU IF(CTT .LT. CT} GO TO 90 GO TO 100
90 CT=CTT OUTPUT(NW,5l=l OUTPUT(NW,6l=QL OUTPUT! NW, 7 J •Cl OUTPUTINW,81=0.0 OUTPUT(NW,91=0.0 OUTPUT(NW,10}=0.0 OUTPUT{NW,lll=CO OUTPUT(NW,12l=CU OUTPUT(NW,131=CT
- 227 -

!F(CHECK) WRITEl6,50501 NW,(OUTPUTINW,Il,l=l,13) 5050 FORMAT(1X,I2,2H L,1X,2PF7.3,3(1X,2PF6.3,0PF8.0,F8.0l,3Fl0.0l
C DETERMINE THE OPTIMUM COMBINATION OF FLOOD PROOFING AND LAND USE C ADJUSTMENT
100 IFIPPl GO TO 160 PT=l. 00 150 !P=l,NOF IF(TRACEl WRITEl6,50601 NW
5060 FORMAT (1X,I2,5H L+PI P:OF(IP) IF(F .LT. Pl GO TO 150 QP=QQll,lPl [FICHANELINWll QP:QQl2,IPJ CP= PB*{QP-QSl**0.15 IF(QP .GT. Qll CP=CP+ PC*((QP-QSl**0.375-(QP-QL>**0.3751**2 IF(CP .LE. O.J GO TO 160 IF(CP+CL .GT. CT .AND •• NOT. PG) PP=.TRUE. IF(CP+CL .GT. CTI GO TG 160 PG=.TRUE. NN=l IF(CHANEL(NWll NN=Z CALL CD2(NNI IF(PT .GE. 2.l GO TO 110 GO TO 120
110 IF!CTT .LT. CP+CL+CO+CUJ GO TO 160 120 CTT=CO+CL+CP+CU
IF!CTT .LT. CTI GO TO 130 GO TO 140
130 CT=CTT OUTPUTINW,5l=L OUTPUTlNW,6l=Ql OUTPUT(NW,7)=Cl OUTPUT{NW,BJ:p OUTPUTINW,9l=QP OUTPUT(NW,lOl=CP OUTPUT(NW,lll=CD OUTPUTINW,12l=CU OUTPUT(~W,13l=CT IF!CHECKl WRITEl6,507Gl NW,IOUTPUT(NW,Il,I=l,131
5070 FORMAT(lX,12,2HLP,1X,2PF7.3,3(1X,2PF6.3,0PF8.0,F8.0l,3FlO.Ol 140 PT=PT+l. 150 CONTINUE
!Fill} GO TO 170 160 CONTINUE
C DETERMlNE THE OPTIMUM LEVEL OF CHANNEL IMPROVEMENT 170 IF!SSJ GO TO 510
DO 500 IS=l,NDF IIS=fS+l IF(TRACEJ WRITE(6,5080l NW
5080 FORMAT (1X,l2,3H SI ST=OF!fS! IF!F .LT.ST) GO TO 500
- 228 -

QP=QQ12,ISl QL=QP QS=QP
C SELECTS LEAST COSTLY TYPE OF CHANNEL IMPROVEMENT, CALCULATES C COSTS AND DIMENSIONS
CALL STR IF!CS .GT. CTI GO TD 510
C RESIDUAL DAMAGES ALREADY CALCULATED IN "SIR" IF LINED= .TRUE. IF (.NOT. LINED) CALL COl(Zl IF(CS+CO+CU .GT. CTI GO TO 230 IF(CHANELINWI .OR. SGl GO TO 180 GO TO 190
180 CDST=O.O GO TO 200
190 IF(COSTEJ GO TO 200 C CALCULATES COST INCURRED IN DOWNSTREAM SUBWATERSHEOS DUE TO C CHANNELIZATION IN CURRENT SUBWATERSHEO, UNLESS THIS WAS C ALREADY CALCULATED
CALL COST COSTE=.TRUE.
200 CTT=CS+CO+CU IF (CS+COST .GT. CTI GO TO 510 IFtCTT+CDST .LT. CTI GO TO 210 GO TO 230
C LINING OF PREVIOUSLY CONSTRUCTED CHANNELS 210 IF ILINEDt GO TO 520
CT=CTT SG=.TRUE. LINEX=.FALSE. OUTPUT!NW,Zl=ST OUTPUTlNW,3l=QS OUTPUTINW,4l=CS OD 220 M=5,10
220 OUTPUTINW,Ml=O. OUTPUTINW,lll=CO OUTPUTINW,12l=CU OUTPUT(NW,13l=CT
C PRESERVES DIMENSIONS OF OPTIMUM CHANNEL IN ORDER TO RETURN TO THEM C IF SUBSEQUENT TRIAL CHANNEL ODES NOT WORK OUT
LGTEMP=LININGINWI STEMP=ST NDTEMP=ND FOTEMP=FO HTEMP=HN HETEMP=HE RTEMP=RN RETEMP=RE TTEMP=T WTEMP=W ATEMP=A !F(CHECKJ WRITEl6,5090l NW,(OUTPUT(NW,Il,I=l.131
5090 FORMATl1X,12,2H S,1X,2PF7.3,3tlX,2PF6.3,0PF8.0,F8.0l,3FlO.O) - 229 -

C EVALUATE FLOOD PROOFING TO SUPPLEMENT CHANNEL IMPROVEMENT 230 IF(IS .EQ. NOFl GO TO 510
IF(PPl GO TO 330 PT=l. 00 320 IP=IIS,NDF IFITRACEI WRITEl6,51001 NW
5100 FORMAT 11X,I2,5H S+Pl P=OF (IP I QP=QQ12, IP I CP= PA*IQP-QSl**0.75 IF(CP .LE. 0.1 GO TO 330 IFICP+CS .GT. CTI GO TO 330 CALL COU2l IFIPT .GE. 2.l GO TO 240 GO TO 250
240 IF(CTT .LT. CO+CP+CS+CU} GO TO 330 250 CTT=CO+CP+CS+CU
IF(SG .OR. CHANEL(NWll GO TO 260 GO TO 270
260 IF(CTT .LT. CTI GO TO 300 GO TO 310
270 IF-<.NOT. COSTE! GO TO 280 GO TO 290
280 CALL COST COSTE=.TRUE. IF {CS+COST .GT. CTI GO TO 510
290 IF{CTT+COST .LT. CT) GO TO 300 GO TO 310
300 CT=CTT SG=.TRUE. LINEX=.FALSE. OUTPUTINW,2l=ST OUTPUTINW,3l=QS OUTPUTlNW,4l=CS OUTPUTINW,5l=O.O OUTPUT{NW,6l=O.O OUTPUT{NW,71=0.0 OUTPUTINW,81=P OUTPUTINW,9l=QP OUTPUT(NW,lOl=CP OUTPUT(NW,lll=CO OUTPUTINW,121=CU OUTPUTINW,13l=CT LGTEMP=LINING(NWI STEMP:ST NOTEMP=NO FOTEMP=FD HTEMP=HN HETEMP=HE RTEMP=RN RETEMP=RE TTEMP=T
- 230 -
•

WTEMP=W ATEMP=A IF!CHECK) WRITE{6,5110l NW,(OUTPUTINW,Il,I=l,131
5110 FORMATtlX,I2,2HSP,1X,2PF7.3,3(1X,2PF6.3,0PFB.O,F8.0l,3FlO.OI 310 PT=PT+l. 320 CONTINUE
C EVALUATE LOCATION ADJUSTMENT TO SUPPLEMENT CHANNEL IMPROVEMENT 330 IFILL) GO TO 500
DO 490 IL=IIS,NDF IF!TRACE) WRITE(6,5120l NW
5120 FORMAT 11X,I2,5H S+ll L=DF( IL I QP=QS Ql=QQ!2,Il.l Cl= LA*IOL-QSl**0.375 IFICL+CS .GT. CT) GO TO 500 CALL CD2121 CTT=CO+Cl +CS+CU IFISG .OR. CHANELi NW) l GO TO 340 GO TO 350
340 IF{CTT .LT. CTl GO TO 380 GO TO 390
350 !Ft.NOT. COSTE! GO TO 360 GO TO 370
360 CALL COST CDSTE=.TRUE. IF ICS+COST .GT. CTI GO TC 510
370 IFlCTT+CDST .LT. CTI GO TO 380 GO TO 390
380 CT=CTT SG=.TRUE. LINEX=.FALSE. OUTPUT(NW,2l=ST OUTPUT(NW,31-=QS OUTPUTINW,4l=CS OUTPUT(NW,5)=L OUTPUT(NW,61=QL OUTPUTINW,7l=Cl OUTPUTINW,8l=O•O OUTPUT(NW,9l=O.O OUTPUT(NW,lOl=O.O OUTPUTINW,lll=CD OUTPUT(NW,12l=CU OUTPUT(NW,13l=CT LGTEMP=LININGINWI STEMP=ST NDTEMP=ND FDTEMP=FO HTEMP=HN HETEMP=HE RTEMP=RN RETEMP=RE
- 231 -

'
TTEMP=T WTEMP=W ATEMP=A IFICHECKl WRITE(6,5130l NW,(OUTPUTINW,IJ,!=1,13)
5130 FORMATC1X,I2,2HSL,1X,2PF7.3,311X,2PF6.3,0PFB.O,F8.0l,3Fl0.0l C EVALUATE ALL THREE TYPES OF MEASURES IN COMBINATION
390 IFIPP} GO TO 490 PT=l. DO 480 lP=IIS,NDF IFITRACEl WRITE(6,5140l NW
5140 FORMAT {1X,I2,7H S+L+PI P=DF{ !Pt QP=QQ(2.IPI CP= PB*(OP-QSl**0.75 IF!QP .GT. QLl CP=CP+ PC*((QP-QSl**0.375-(QP-QLl**0.3751**2 IF ( C P • E Q. 0. J GO TO 4'10 IF ICP+CL+CS .GT. CTI GO TO 490 CALL COZ(Zl If!PT .GE. 2. l GO TO 400 GO TO 410
400 IF{CTT .LT. CD+CP+CL+CS+CUJ GO TO 490 410 CTT=CD+CP+CS+CL+CU
lf (SG .OR. CHANELlNW)I GO TO 420 GO TO 430
420 IFCCTT .LT. CTl GO TO 460 GO TO 470
430 IF (.NOT. COSTE! GO TO 440 GO TO 450
41<-0 CALL COST COSTE=.TRUE. If {CS+CDST ,GT. CTl GO TO 510
450 IF (CTT+COST .LT. CTI GO TO 460 GO TO 470
460 CT=CTT .SG=.TRUE. LINEX=.FALSE. OUTPUT(NW,21=ST OUTPUT(NW,3l=QS OUTPUT(NW,4l=CS OUTPUT{NW,5J-=L OUTPUT!NW,6l=QL OUTPUT(NW,7l=CL OUTPUT(NW,Bl=P OUTPUTfNW,9l=QP OUTPUTINW,lOl=CP OUTPUTINW,lll=CO OUTPUT(NW,12l=CU OUTPUT(NW,13l=CT LGTEMP=LININGINWI STEMP=ST NOTEMP=NG FDTEMP=FO
- 232 -

HT EMP=HN HE TEMP=HE RTEMP=RN RETEMP=RE TTEMP=T WTEMP=W ATEMP=A IFICHECKJ WRITEl6,5150) NW,(OUTPUTtNW,Il,I=l,13)
5150 FORMAT(lX,I2,3HSLP,2PFl.3,311X,2PF6.3,0PF8.0,F8.0l,3FlO.Ol 410 PT=PT+l. 480 CONTINUE 490 CONTINUE
C END OF CHANNEL IMPROVEMENT LOOPS 500 CONTINUE
C POINT OUTSIDE All MEASURE ANALYSIS LOOPS 510 CONTINUE
If (LINEXi LINED= .TRUE. RETURN
C SET OUTPUT If LINING PREVIOUSLY CONSTRUCTED CHANNEL 520 OUTPUT(NW,3)=QLINEO
OUTPUTINW,4)=CS 00 530 K=5,10
530 OUTPUT(NW,KJ=O.O C DETERMINE FREQUENCY OF WATER LEAVING LINED CHANNEL
YF=AG*lOLINED-Xfl C OUTPUT WITH CHANNEL Of VERY LARGE CAPACITY
IF (VF .LT. fTOPJ GO TO 540 OUTPUT{NW,2)=0.0005 OUTPUTINW,111=0.0 OUTPUTINW,121=0.0 OUTPUT(NW,13l=CS GO TO 5.50
C OUTPUT WITH SMALLER CHANNEL 540 TEMP=EXPI-YF)
OUTPUTINW,21=1.0-EXP(~TEMPl OUTPUTINW,lll=CO OUTPUT{NW,12l=CU OUTPUTlNW,13l=CTT
550 LGTEMP=3 CT=OUTPUTINW,131 STEMP=OUTPUT(NW,2) NOTEMP=O.O FOTEMP=O.O HTEMP=O.O HETEMP=O.O RTEMP=O.O RETEMP=O.O TTEMP=T WTEMP=W ATEMP=A IFICHECK) WRITE(6,5160l NW,(OUTPUT(NW,Il,I=l,131
5160 FORMATl1X,I2,2HLN,1X,2PFl.3,311X,2PF6.3,0PF8.0,F8.0),3FlO.OI - 233 -
C RETURN TO SEE IF ENLARGING TO A GREATER OESIGN FREQUENCY IS MORE C ECONOMICAL THAN LINING TO A SMALLER ONE
F=DF ( IS I ISX=IS+2 IF (ISX .LE. NDFl F=DF(ISXI LINEX = • TRUE. GO TO 170 END
SUBROUTINE COST C UNIVERSITY OF KENTUCKY FLOOD CONTROL PLANNING PROGRAM II C VERSION OF JANUARY 27, 1968 C CALCULATE COSTS INCURRED IN DOWNSTREAM SUBWATERSHEDS WHEN UPSTREAM C SUBWATERSHEDS ARE CHANNELIZED. COST INCURRED IS ESTIMATED C FROM THE COST WHICH WOULD BE REQUIRED TO ENLARGE DOWNSTREAM C CHANNELS TO HANDLE THE INCREASE IN THE PEAK OF THE DES1GN C FLOOD OR THE INCREASE IN EXPECTED FLOOD DAMAGE WROUGHT BY C THE LARGER FLOWS, WHICHEVER OF THE TWO IS SMALLER.
COMMON A0(25l,All25l,A21251,A3(25l,A4(25l,ADOCS(25l,AFCTR(3,111, l AFW12,25l,AW(25l,CAPl25,lll,CH(25l,CHANELl25l,CLOCl25,51,D(3,25l, 2 OF( 10 l ,OFQR( 161,DQCK( 161,FDA I 25 J ,FQ( 25 l ,FRU! 1 ll d D( 100 I, IHE 1251, 3 IHN(251,IHOLD(251,JMPROV(251,INOEXl25,2l,IREl25l,IRNl25l,Kl(25l, 4 K2(25l,LCl25l,LINING(251,LOCl25l,NOTl25l,OUTPUTl25,13l,Q0{251, 5 Q05!11,11J,Q43(11,11J,QQ12,10l,QX(2,l6l,RCl25l,Sl25J,SICl25l, 6 TOl251,TCL(251,TF{25),TICl25l,USUBWl25,6l,UTOTR(25,6l, 7 VALUE(25,61,WOl25l,WTl25J,XF1(251,XF2(25l,XF3(25l,XF4(251,Yll6l, 8 YYllOJ
COMMON A,AG,ATEMP,BOMAX,BOMIN,CO,CDA,CDAV,COB,CDBV,COC,CDCV,CDST, 1 CHECK,CLEN,COEFDM,CPF,CRF,CRFSM,CS,CU,F,FA,FO,FOTEMP,FIA,F[B,FIC, 2 FTOP,GA,GSF,HE,HETEMP,HMAX,HN,HOLDNG,HTEMP,IPP,1TOP,LA,LF,LGTEMP, 3 LINEO,LL,LTF,MANNR,MANNT,MANNU,MW,ND,NOF,NOTEMP,NSTAGE,NSTEMX,NW, 4 PA,PB,PC,PP,PTF,PWF,QB05,QB43 1 QL,QLINED,QP,QS,R,RE,RETEMP,RN, 5 RTEMP,SAFC,SK1,SK2,SK3,SK4,SK5,SK6,SK7,SK8,SPWF,SPWFAC,SS,STEMP, 6 STF,T,TIME,TIMST,TRACE,TTEMP,UN,UNC,UZ,VA,VLAGST,VLURST,W,WTEMP, 7 XF,YCOMP,ZT,ZU
REAL MANNU,MANNR,MANNT,LC,NO LOGICAL CHANEL,LLL,HOLDNG,CHECK
C LOOK UP NUMBER OF DOWNSTREAM SUBWATERSHEOS JL = INOEX(NW,11 JH = INDEX(NW,21 COST= O. IF(JL.EQ. Ol RETURN LLL=.FALSE.
C SUM DOWNSTREAM SUBWATERSHEOS ONE AT A TIME DO 220 I= Jl, JH CPRT=O.O DPRT=O.O NWD= !O(II
C DOWNSTREAM FLOW INCREASED BY CHANGE IN CHANNELIZATION FROM C TO CI C = TIC(NWOl/TCL{NWOl
- 234 -

U=UTOTR(NWD,NSTAGE) Cl=ITIC(NWOl+ILCtNWI-SICINWll)/TCL(NWDl
C RECTANGULAR CHANNELS WILL NOT REQUIRE LARGER BRIDGES OR MORE C RIGHT-OF-WAY.
IFlllNINGINWDl .EQ. 41 GO TO 50 C SUMS AFFECTED BRIDGES IN DOWNSTREAM SUBWATERSHEOS
BH = O. BR= O. 00 10 J=l,6
10 IFICAP(NWD,Jl .GE. O.l BH=BH+l. 00 20 J=7,8
20 IF{CAP!NWO,J) .GE. O.) BR=BR+l. BH = BH+CAP(NW0,9l BR= BR+CAP(NWD,101
C RIGHT-OF-WAY COST IF IRC{NWOJ.GE.O.Ol GO TO 50 LTA=NSTAGE LTB=NSTAGE IF ILOCINWOJ.GT.Ol LTB=LOCINWOl IF(.NOT. HOLDNGl GO TO 30 IF IIHOLO{NWOI.LE.Ol GO TO 30 LTA=IHOLO(NWO) LTB=LTA
30 IF(CHANEL(NWDll GO TO 40 RCINWDl=VALUE(NWO,LTA)+VLURST*USUBWINWO,LTBJ/3.0 GO TO 50
40 RC(NWDl=VALUE(NWD,LTAl+VLURST*USUBWINWO,LTBJ C FLOW FREQUENCY RELATIONSHIP IF UPSTREAM WERE NOT CHANNELIZED
50 CALL PLACEA(QX1,U,C,Q431 CALL PLACEAIQY1,U,C,Q051 QXX=AWINWD)*AFW{l,NWDl*QXl*QB43 QY=AWINWOl*AFWl2,NWDl*QYl*Q805 XF=!(QY*0.578l-(QXX*5.296ll/(-4.718l AF=(4.7181/(QY-QXXJ
C SAVES PARAMETERS FOR ESTIMATING DOWNSTREAM DAMAGES XfL=XF AFL=AF
C 'LRG' SUFFIX INDICATES ENLARGED CHANNEL REQUIRED TO HANDLE FLOW C AS INCREASED BY UPSTREAM CHANNELIZATION C 'SML' SUFFIX INDICATES CHANNEL REQUIRED TO HANDLE FLOW WITH NO C UPSTREAM CHANNELIZATION C LOOKS UP DIMENSIONS IF CHANNEL WAS IMPROVED
!Fl.NOT. CHANEL(NWDII GO TO 60 YF=AF*IQO(NWDI-XFJ IF IYF.GT.FTOPJ GO TO 210 QSML=QO!NWDl*FQ(NWDI ASML=AO ( NWll) TSML=TO{NWDI WSML=WO(NWlll GO TO 100
C IF CHANNEL NOT IMPROVED, PICKS A LIKELY CHANNEL DESIGN FLOW BASED ON C THE EXTENT OF URBAN DEVELOPMENT
- 235 -

60 PN=0.96 IFIU-0.07 .GT. O.} PN=0.99 IF {U-0.20 .GT. 0.1 PN=0.995 TEMP=l./ALOG(l./FNl YF=ALOG(TEMPl QSML={YF/AF+XFl*FQ(NWDJ Q=QSML
C SIZES CHANNEL FOR THIS DESIGN FLOW 70 X=BDMIN 80 H=IIQ*MANNU*CX+2.*ISQRT!l.+ZU*ZUlll**0•6671/ISQRTIS{NWDll*l.49*(X+
lZUl**l.667ll**0.375 IFtH .LE. HMAX .OR.X .GE. BDMAXI GO TO 90 X=X+O. 5 GO TO 80
90 B=X*H IF(LLLl GO TO 110 TSML=B+2.0*ZU*H ASMl=0.5*H*{B+TSMLl WSML=B+2.4*ZU*H+30.0
C FLOW FREQUENCY RELATIONSHIP IF UPSTREAM WERE CHANNELIZED 100 CALL PLACEA{QX1,U,CI,Q43l
CALL PLACEAIQY1,U,CI,Q05l QXX=AWINWDl*AFW11,NWOl*QXl*QB43 QY=AWINWDl*AFN12,NWDl*QYl*QB05 XF=l(QY•0.579l-lQXX*5.296ll/C-4.ll8) AF=l4.7181/C~Y-QXXJ
C FINDS DPRT = INCREASE IN DOWNSTREAM FLOOD DAMAGES CALL QCST(NWO,AF,AFL,XFL,DPRT,U}
C FINDS DESIGN FREQUENCY FLOOD PEAK IF UPSTREAM CHANNELIZED QLRG={YF/AF+XFl*FO!NNO) IFILININGiNWDI .GE. 2 .ANO. CHANELINWOJJ GO TO 120 LLL=.TRUE. Q=QLRG
C BACK TO SIZE CHANNEL FOR LARGER FLOW GO TO 70
110 LLL=.FALSE. IFILINING!NWOl .EQ. 2 .ANO. CHANEllNNOll GO TO 130 TLRG=B+2.0*ZU*H ALRG=0.5*H*!B+TLR6l WLRG=B+2.4*2U*H+30.0
C COST FOR UNLINED CHANNEL - NO DROPS CPRT = SKl*LC(NNDl*(ALRG-ASMLl+SK3*RCCNWOl*LC!NWOl*(WLRG-WSML}+
l(SK4*BH+SK5*8Rl*(TLRG-TSMLl GO TO 210
120 IF(LINING{NNOl .NE. 21 GO TO 150 C UNLINED CHANNEL WITH DROPS
LLl=.TRUE. Q=QLRG
C BACK TO SIZE CHANNEL FOR LARGER FLOW GO TO 70
130 SLOPE= S ( NWD l C ADJUST CHANNEL SLOPE ANO B/H RA,TIO IF NECESSARY TO AVOID EXCEEDING
- 23 6 -

C ALLOWABLE TRACTIVE FORCE 140 X=l.05*X
SLOPE=0.95*SLOPE H=IIQ•MANNU*IX+2.•ISQRT!l.+ZU*ZUlll**0•667l/lSQRTISLOPEl*l.49*tX+Z
lUl**l.667)1**0.375 TFF=6Z.4*H*SlOPE IFITFF .GT. TFINWOl) GO TO 140 B=X*H TLRG=B+Z. O*ZU*H ALRG=0.5*H*(B+TLRGI WLRG=B+Z.4*H*ZU+30.
C DETERMINING NUMBER ANO FALL OF DROP STRUCTURES FT=5280.*LC(NWDl*!S(NWO)-SLOPE) NO=AINT(0.25*Fl+0.5) !FINO .EQ. O.J NO=l.O FO=F/NO HSML=lTSML-SQRTlTSML*TSML-4.0*ZU*ASML))/(2.0*ZUl BSML=TSML-2.0*ZU*HSML CPRT = SKl*LCINWD}*(ALRG-ASMLl+SK3*RC(NWOl*LC(NWDl*(WLRG-WSMLI+
llSK4*BH+SK5*BRl*ITLRG-TSMLI CPRT=CPRT+SK6*ND*l5.2*B*H+4.3*B*FD+9.5*B+5.5*ZU*H*H+2.0*ZU*H*F0+32
l.O*ZU*H+2.0•ZU*FD+l3.0*ZU+l4•l*H*H+l4.6*H*FD+3.3*FD*FO+l4.l*H+0.05 Z6*B*H*H+O.l88*H*H*H+0.132*FO*H*H+9.9l
H=HSML B=BSML CPRT=CPRT-SK6*ND*l5.2*B*H+4.3*B*F0+9.5*B+5.5*ZU*H*H+2.0*ZU*H*F0+32
l.O*ZU*H+Z.O*ZU*FD+l3.0*ZU+l4.l*H*H+l4.6*H*FD+3.3*FD•FD+l4.l*H+0.05 26*B*H*H+O.l88*H*H*H+0.13Z*FO*H*H+9.9)
GO TO 210 C TRAPEZOIDAL LINED CHANNEL
150 IFILINING(NWOl .EQ. 41 GO TO 180 HSML=(TSML-SQRT(TSML*TSML-4.0*ZT*ASMLll/(Z.O*ZTI BSML=TSML-2.0*ZT*HSML PSML=BSML+Z.Z*HSML*SQRT(l.+ZT*ZT) Q5=QSML HT=HSML Hl=l.05*HSML
160 Q6=1l.49*SQRTISINWD)l*l(BSML+ZT*Hll*Hll**l•667l/(MANNT*IBSML+Z.•Hl l*SQRT(l.+ZT*ZTll**0.667)
IF (Q6 .GE. QLRGJ GO TO 170 Q5=Q6 HT=Hl Hl=l.05*Hl GO TO 160
170 HLRG=HT+((Hl-HTl*!OLRG-Q5ll/(Q6-Q5l TLRG=BSML+2.•ZT*HLRG ALRG=0.5*HLRG*{BSML+TLRG) WLRG=BSML+2.4*HLRG*ZT+25. PLRG=BSML+2.2*HLRG*SQRT(l.+ZT*ZT) CPRT = SKl*LCINWOl•(ALRG-ASML)+SK3*RC(NWOl* LC(NWOl*{WLRG-WSMLl
l+ISK4*BH+SK5*BRl*ITLRG-TSMLl+SK7*1PlRG-PSMLl*LC(NWOI GO TO 210
- 237-

C RECTANGULAR LINED CHANNEL 180 HSML=ASML/TSML
QS=QSML HT=HSML Hl=l.l*HSML
190 Q6=1l.49*SQRT!SINWll*ITSML*Hll**l.667l/(MANNR*lTSML+2.0*Hll**0.667 lJ
IF IQ6 .GE. QLRGJ GO TO 200 Q5=Q6 HT=Hl Hl=l.l*Hl GO TO 190
200 HLRG=HT+((Hl-HTl*iQLRG-Q5ll/lQ6-Q5l CPRT = SK8*2.0*{HLRG-HSMLl*LCINWOl
C DETERMINES LESSER COST - INCREASED FLOOD DAMAGES OR ENLARGING CHANNEL C (CPRT IS LESS THAN O.O WHEN LINING IS ADDED BECAUSE ITS EVALUATION C DOES NOT RECOGNIZE USE Of SIDE SLOPE ZU FOR A LINED CHANNEL).
210 lF{OPRT .LT. CPRT .OR. CPRT .LT. O.Ol CPRT = OPRT C ENO OF LOOP SUMMING DOWNSTREAM SUBWATERSHEOS
IF (CHECK! WRITEt6,5000l NW,NWO,CPRT 5000 FORMAT(lOX,3HNW=,I2,5X,4HNWD=,I2,5X,16HDOWNSTREAM COST=,FB.21
220 CDST=CDST+CPRT RETURN ENO
SUBROUTINE PLACEACQR,UU,CC,Xl C UNIVERSITY OF KENTUCKY FLOOD CONTROL PLANNING PROGRAM II C VERSION OF JANUARY 27, 1968 C ARITHMETIC INTERPOLATION SUBROUTIN£. UU=TOTAL TRIBUTARY C URBANIZATION, CC=TOTAL TRIBUTARY CHANNELIZATION, X=TWO DIMENSIONAL C ARRAY WITH FLOW AS A FUNCTION OF CC AND UU, 1 QR 1 =VALUE RETURNED TO C MAIN PROGRAM. UU AND CC ARE DECIMAL VALUES. 1 QR' IS IN CFS.
U=UU C=CC DIMENSION X!ll,111 U=U*lO.+l. C=C*lO.+l. I=C J=U C I=I · UJ=J QA=X(I,Jl+!C-Cil*(XII+l,Jl-X(l•Jll QB=X!I,J+ll+IC-Cll*IX{I+l,J+ll-X!I,J+lll QR•QA+IU-UJl*lCB-QAl RETURN ENO
SUBROUTINE QCST(NWD,AF,AFL,XFL,DPRT,UJ - 238 -

C UNIVERSITY OF KENTUCKY FLOOD CONTROL PLANNING PROGRAM II C VERSION OF JANUARY 27, 1968 C ESTIMATES INCREASE IN FLOOD DAMAGE IN DOWNSTREAM SUBWATERSHED NWO C WHICH WOULD RESULT IF THE CHANNELS IN UPSTREAM SUBWATERSHED C NW WERE IMPROVED ASSUMING NO DAMAGE REOUCTION MEASURES WERE C TAKEN C RESULT IS COMPARED WITH COST OF DOWNSTREAM CHANNEL IMPROVEMENT IN C SUBROUTINE COST, THE SMALLER OF THE TWO COSTS IS TAKEN
COMMON A0(25),Al(251,A21251,A31251,A4!251,ADDCS(25l,AFCTRl3,lll, 1 AFW12,251,AWl25l,CAP(25,lll,CH(251,CHANELl251,CLOC(25,5t,D13,251, 2 DFl10l,DfQRfl61,DQCK{l6l,FDAl25J,FQl25),FRUllll,ID(lOOl.IHE(25l, 3 IHNl25l,IHOLOl25l,IMPROV(25l,INOEX!25,21,IREl25l,IRNl25l,Kll251, 4 K2125l,LC(25l,LININGl25l,LOCl25l,NDTl25),0UTPUTl25,13l,Q0125l, 5 Q05{11,lll,Q43111,11),QQ12,10l,QX12,16l,RCl251,St25l,SIC(25l, 6 TOl25J,TCLl251,TFt251,TIC(25l,USUBWl25,6),UTOTR(25,61, 7 VALUE!25,61,WOl25l,WT(25l,XF1125l,XF2125l,XF3(251,XF4(25l,Y(l6l, 8 YYllOI
COMMON A,AG,ATEMP,BDMAX,BDMIN,CO,COA,COAV,CDB,COBV,COC,COCV,COST, 1 CHECK,CLEN,COEFDM,CPF,CRF,CRFSM,CS,£U,F,FA,FO,FOTEMP,FIA,FlB,FIC, 2 FTOP,GA,GSF,HE,HETEMP,HMAX,HN,HOLONG,HTEMP,IPP,ITOP,LA,LF,LGTEMP, 3 LINEO,LL,LTF,MANNR,MANNT,MANNU,MW,NO,NOF,NOTEMP,NSTAGE,NSTEMX,NW, 4 PA,PB,PC,PP,PTF,PWF,QB05,QB43,QL,QLINEO,QP,QS,R,RE,RETEMP,RN, 5 RTEMP,SAFC,SK1,SK2,SK3,SK4,SK5,SK6,SK7,SKB,SPWF,SPWFAC,SS,STEMP, 6 STF,T,TIME,TIMST,TRACE,TTEMP,UN,UNC,UZ,VA,VLAGST,VLURST,W,WTEMP, 7 XF,YCOMP,ZT,ZU
REAL Kl,K2 LOGICAL UNC
C UNIT DAMAGE FACTORS C STRUCTURES
C6 = IVLURST*U + VLAGST*{l.0-Ull*COEFOM C CROPS
C5 = FA*ll.O - Ul C5G = GA*( 1.o-u1
C EVALUATE DAMAGES FOR 16 FLOODS BEGINNING WITH THE BIGGEST 00 100 J=l,ITOP
C NO DAMAGE IF FLOOD CONTAINED IN CHANNEL OFQR!Jl=O.O I = 1
C FLOW ANO FLOOD DAMAGE WITH UPSTREAM CHANNEL IMPROVED QLRG = Y(J)/AF + XF - QO{NWOI IF {QLRG .LE. O.Ol GO TO 100 QXC = QLRG
C ESTIMATE MAXIMUM DEPTH OF FLOODING 2 OMAX=Kl(NWl*QXC**0.375
C TEST WHETHER MAXIMUM FRACTION OF MARKET VALUE DESTROYED EXCEEDS 0.25 FMAX=COEFOM*OMAX If IFMAX .LE. 0.251 GO TO 4
C DEPTH ANO AREA OF FLOODING IN ZONE 1 OZ l=O. 25/COEFOM GO TO 6
4 OZl=OMAX 6 AZl=K21NWl*OZl
- 239 -

C DAMAGE IN ZONE 1 DFQRIJ) = OFQR(Jl + 0.5*(C6+C5Gl*DZl*AZl + C5*AZ1 IF (FMAX .LE. 0.25) GO TO 50
C TEST WHETHER MAXIMUM FRACTION OF MARKET VALUE DESTROYED EXCEEDS 0.75 FMAX = 0.25 + 0.5*COEFOM*IDMAX-DZll IF IFMAX .LE. 0.751 GO TO 8
C DEPTH ANO AREA OF FLOODING IN ZONE 2 OZ2 = DZl + 1.0/COEFOM GO TO 10
8 OZ2 = DMAX 10 AZ2 = K2(NWl*DZ2 - All
C DAMAGE [N ZONE 2 DFQR(Jl = OFQR(J) + C6*!0Zl+0.25*fDZ2-DZlll*AZ2+IC5+5.0*C5Gl*AZ2 IF IFMAX .LE. 0.751 GO TO 50
C DEPTH AND AREA OF FLOODING IN ZONE 3 DZ3 = OMAX AZ3 = K21NWl*DZ3 - AZ2
C DAMAGE IN ZONE 3 DFQRIJl = DFQR{J) + C6*(0Zl+0.5*1DZ2-0Zlll*AZ3+1C5+5.0*C5Gl*AZ3
50 CONTINUE IF (I .EQ. 21 GO TO 100 I = 2 QSML = Y(Jl/AFL +XFL - QO(NWDl IF {QSMl .LE. 0.0) GO TO 100 QXC = QSMl ' C6 = -C6 cs = -cs C5G = -C5G GO TO 2
100 CONTINUE C MEAN ANNUAL FLOOD DAMAGE FROM FLOODS OF 16 SPECIFIED FREQUENCIES
ODV=0.2*(DFQR{l6l+DFQRl15l+DFQRl141l+O.l*IOFQRfl3l+DFQR{l2l)+0.05*1 lDFQRllll+OFQR{l0ll+0.02*(0fQRl9l+OFQR(81+0FQRl7)1+0.0l*tDFQR{6l+Df 2QRl5l+DFQR(41l+O.OOS*DFQRl3l+0.004*0FQR(21+0.00l*DFQR{ll
!Ft.NOT. UNCl GO TO 150 C STANDARD DEVIATION OF FLOODS Of 16 SPECIFIED FREQUENCIES
OSIGMA=SQRT(0.2*1(DFQRl16l-CDl**2+{0FQRl15l-CDl**2+10FQR(l4)-CDl**2 ll+O.l*l(DFQAll3l-COl**2+1DFQRll2l-CDl**2l+0.05*((0FQRllll-CDl**2+1 20FQRllOJ-CDl**2)+0.02*!1DFQR(9)-COl**2+(0FQR(81-CDl**2+1.0FQR(7)-CO 3l**2l+O.Ol*l(DFQRl6)-CDl**2+(0FQRl51-CDl**2+!0FQR(4l-CDl**2J+O.OOS 4*1DFQR!3l-CDl**2+0.004*(DFQRl2l-COl**2+0.00l*!OFQA1ll-COl**2l
C TOTAL DAMAGE INCLUDING UNCERTAINTY DV=DV+VA*SIGMA*CRFSM/SQRT(2.0*RI
150 OPRT = DY RETURN ENO
SUBROUTINE STR C UNIVERSITY Of KENTUCKY FLOOD CONTROL PLANNING PROGRAM II C VERSION Of JANUARY 27, 1968
- 240 -

C SELECT THE LEAST COSTLY TYPE OF CHANNEL IMPROVEMENT AND DETERMlNE THE C RESULTING DESIGN DIMENSIONS ANO COSTS
COMMON AOl251,Al(25l,A2125l,A3(25l,A4125l,ADOCSl25l,AFCTRC3,111, l AFW12,25l,AW(25l,CAP125,lll,CH(25l,CHANEL(25l,CLOC(25,5),Dl3,25l, 2 DFl10l,DFQR(l6l,OQCK(l6l,FDA!25l,FQ(25l,FRU(lll,IO{l001,IHEl25), 3 IHNl251,IHOLDl25l,IMPROV!251,INDEXl25,2l,IRE(25l,IRN{251,Kll25l, 4 K2125l,LCt25l,LININGl251,LOC(25l,NDT(25l,OUTPUTl25,13l,QOl25l, 5 Q05111,lll,Q43111,111,QQ12,10l,QX(2,161,RC(25l,St25J,SICl25l, 6 TOl25l,TCL(25l,TFl25l,TIC(25l,USUBWl25,6l,UTOTRl25,61, 7 VALUE(25,6),W0(25l,WTl25l,XF1(25l,XF2125l,XF3(25l,XF4(25l,Y(l6l, 8 YYllOJ
COMMON A,AG,ATEl'P,BDMAX,B!JMIN,CD,C!JA,CDAV,COB,COBV,CDC,C!JCV,C!JST, 1 CHECK,CLEN,COEFOM,CPF,CRF,CRFSM,CS,CU,F,FA,FO,FOTEMP,FIA,FIB,FIC, 2 FTOP,GA,GSF,HE,HETEMP,HMAX,HN,HOLDNG,HTEMP,IPP,ITOP,LA,LF,LGTEMP, 3 LINEO,LL,LTF,MANNR,MANNT,MANNU,MW,ND,NDF,NDTEMP,NSTAGE,NSTEMX,NW, 4 PA,PB,PC,PP,PTF,PWF,QB05,QB43,QL,QLINEO,QP,QS,R,RE,RETEMP,RN, 5 RTEMP,SAFC,SK1,SK2,SK3,SK4,SK5,SK6,SK7,SK8,SPWF,SPWFAC,SS,STEMP, 6 STF,T,TIME,TIMST,TRACE,TTEMP,UN,UNC,UZ,VA,VLAGST,VLURST,W,WTEMP, 7 XF,YCOMP,ZT,ZU
REAL MANNU,MANNR,MANNT,LC,ND LOGICAL CHANEL,LINED,HOLONG LINEO=.FALSE. ND=NOTlNWl FO=FDA(NWl
C CALCULATE RIGHT-OF-WAY COST IN $/ACRE IF THIS WAS NOT DONE PREVIOUSLY JF(RC(NWl.GE.O.Ol GO TO 30 LTA=NSTAGE L TB=NSTAGE
C DETERMINE STAGE WHEN NEW BUILDING FIRST RESTRICTED FROM FLOOD PLAIN IF (LOC(NWJ.GT.Ol LTB=LOCINWl
C DETERMINE STAGE WHEN LANO PURCHASED FOR HOLDING !Fl.NOT. HDLONGl GO TO 10 IF!IHOLOCNWJ.LE.Ol GO TO 10 LTA=IHOLD(NWl LTB=LTA
10 IFlCHANEL(NWll GO TO 20 C RIGHT-OF-WAY COST= LAND VALUE+ STRUCTURES' VALUE C IF NEW CHANNEL IS BEING BUILT, CAN SELECT ALINEMENT TO AVOID DIS-C PLACING BUILDINGS. THUS ASSUME 1/3 OF REGULAR VALUE OF C STRUCTURES
RC!NW)=VALUEINW,LTAl+VLURST*USUBWINW,LTBl/3.0 GO TO 30
C IF CHANNEL IS ALREADY IMPROVED, ALINEMENT IS FIXED, MORE STRUC-C TURES DISPLACED. THUS ASSUME FULL VALUE OF STRUCTURES
20 RCINWl=VALUEINW,LTAl+VLURST*USUBW(NW,LTBl C DETERMINE SUBWATERSHED WEIGHTED AVERAGE DESIGN FLOW
30 Q=QS*FQ(NWJ C CALL BRIDGE UNLESS RECTANGULAR LINED CHANNEL HAS ALREADY BEEN BUILT
IF{LININGINWl .NE. 4 .OR •• NOT. CHANELtNWll CALL BRIDGE(QJ C GO TO SECTION ON CHANNEL TYPE DESIRED
IFILININGINWl .EQ. 31 GO TO 160 lF(LININGINWl .EQ. 4l GO TO 230
- 241 -

C SELECT DIMENSIONS FOR UNLINED CHANNEL X=6DMIN
40 H=IIQ*MANNU*{X+2.*{SQRTl1.+ZU*ZUlll**0.667l/lSQRTISINWll*l•49*(X+Z lUl**l.667)1**0.375
IF!H .LE. HMAX .OR. X .GE. BDMAXl GO TO 50 X=X+0.5 GO TO 40
C CHECK DEVELOPED AGAINST CRITICAL TRACTIVE FORCE 50 TFF=62.4*H*S(NWl
IF(TFF .GT. TFINWll GO TO 90 C CALCULATE FINAL UNLINED CHANNEL OI~ENSIONS
B=X*H T=6+2.*ZU*H A=O.S*H*(B+Tl AEXTRA = A - AO{NWI IF IAEXTRA .LT. 0.2*Al AEXTRA = 0.2*A W=B+2.4*H*ZU+30.
C CALCULATE UNLINED CHANNEL COST CS•SKl*LCINWI* AEXTRA +SK2*LC(NWl+SK3*RCINWl*!W-WO(NWll*LC{NWl+
lSK4*{HN*T+HE*(T-TO(NWll)+SKS*IRN*T+RE*{T-TOINW}ll IF (LINtNGiNWl.EQ.U GO TO 60 LINING(NWl=l TT=T AA=A WW=W
C IF NOT COMMITTED TO CHANNEL TYPE, TRY OTHERS TO SEE IF THEY ARE LESS C EXPENSIVE
GD TO 160 60 IF(.NOT. CHANEL{NWll RETURN
C IT MAY 6E LESS EXPENSIVE TO INCREASE CHANNEL CAPACITY BY LINING THAN C BY ENLARGING
AZ=A A=AO(NWI SLOPE=S!NWI HU=(TO(NW}-SQRT{TOINWl**2 -4.0*ZU*All/(2.0*ZUI BU=TO(NWl-2.0*ZU*HU
70 PU1=2.0*HU*SQRT(l.O+ZU*ZUl PU=BU+l.l*PUl
C CAPACITY OF CHANNEL IF LINED QLINED=(l.49*A*IIA/tBU+PUlll**0.667l•SQRTISLOPEll/MANNT
C LINING ALSO REDUCES RESIDUAL DAMAGES BY INCREASING CAPACITY MORE C THAN DOES ENLARGING
QSS=QS QPP=QP QLL=QL CALL C01(2l CDZ=CO CUZ=CU QS=QLINED QP=QS QL=QS CALL CDI(21
- 242 -

C GO BACK TO ENLARGING IF THAT IS LESS EXPENSIVE IF ICS.LE.SK7*PU*LCINW)+CD+CU-CDZ-CUZJ GO TO BO
C SET COSTS AND CONSTANTS FOR LINED CHANNEL CS=SK7*PU*LC(NWl T=TOfNWl W=WO(NWJ A=AOINWl LINED=.TRUE. RETURN
C RESTORE FLOWS ALTERED TO ESTIMATE RESIDUAL DAMAGES 80 QS=QSS
QL=QLL QP=QPP A=AZ RETURN
C DETERMINE SLOPE REDUCTION REQUIRED TO REDUCE TRACTIVE FORCE TO C CRITICAL
90 SLOPE=SINWJ 100 WRITEl6,3131 TFF 313 FORMATllOX,SHTFF =,FS.21
X=l.OS*X SLOPE=0.95*SLOPE H=llQ*MANNU*IX+2.*lSQRT{l.+ZU*ZUlll**0.667J/CSQRTISLOPEl*l.49*(X+Z
lUl**l.66711**0.375 TFF=62.4*H*SLOPE IF!TFF .GT. TF(NWII GO TO 100
C CALCULATE FINAL DIMENSION OF UNLINED CHANNEL WITH DROP STRUCTURES B=X*H T=B•-2. *ZU*H A=O.S*H*(B+TI AEXTRA = A - AOINWl IF IAEXTRA .LT. 0.2*Al AEXTRA = 0.2*A W=8+2.4*H*ZU+30.0
C AMOUNT OF FALL PROVIDED BY AND NUMBER OF DROP STRUCTURES FT=5280.*LCINWl*ISlNWl-SLOPE)
C FALL LIMITED TO FIVE FEET PER DROP STRUCTURE !F (FT .GT. 5.0J GO TO 110 FD=FT NO=l.O GD TO 130
110 IF (FT .GT. 10.0l GO TO 120 FD=O.S*FT NO=Z.O GO TO 130
120 ND=AINT(0.25*FT+0.51 FD=FT/ND
C COST OF BUILDING NEW OR ENLARGING OLD DROP STRUCTURES 130 CS=SKl*LCINWl* AEXTRA +SKZ*LCINWl+SK3*RC(NWl*IW-WO!NW1l*LCINWI+
lSK4*1HN*T+HE*IT-TO(NWlll+SK5*1RN*T+RE*IT-TO(NWlll C FORMULA FOR COST OF SCS TYPE C DROP STRUCTURE
CS=CS+SK6*ND*!5.2*B*H+4.3*B*FD+9.5*B+5.5*ZU*H*H+2.0*ZU*H*FD+32.0*Z lU*H+Z. O*ZU*FO+ 13. O*ZU+l4. l*H*1-i+ 14· .6*H*FD+3. 3*FD*FD+ 14. l *H+O .056*B-*
- 243 -

2H*H+0.188*H*H*H+0.132*FD*H*H+9.9l !Fl.NOT. CHANEL(NWl .OR. LININGINWl .NE. 21 GO TO 140 H={TOlNWl-SQRT(TOINWl*TO{NWJ-4.0*ZU*AO!NWlll/(2.0*ZUl B=TO!NWl-2.0*ZU*H CS=CS-SK6*ND*l5.2*B*H+4.3*B*FD+9.5*B+5.5*ZU*H*H+2.0*ZU*H*F0+32.0*Z
1U*H+2.0*ZU*FD+l3.0*ZU+l4.l*H*H+l4.6*H*FD+3.3*FD*FD+l4.l*H+0.056*B* 2H*H+O.l88*H*H*H+C.132*FD*H*H+9.91
C SEE IF LESS EXPENSIVE TO INCREASE CAPACITY BY LINING IF {.NOT. CHANEL{NWIJ GO TO 140 AZ=A HU=H BU=B A=AO( NWl GO TO 70
140 IFIL!NING(NWJ .EQ. 21 RETURN IF(LINING(NWl .EQ. 01 GO TO 150 LINING(NWl =2 RETURN
150 LINING(NWl=2 TT=T A.A=A WW=W
C TRAPEZOIDAL LINED CHANNELS 160 IFICHANEL(NWll GO TO 200
C BUILDING NEW ONES C MAKE X IB/Hl AS SMALL AS POSSIBLE WITHIN LIMITS TO HOLD DOWN C RIGHT-OF-WAY COST
X=BDMIN 170 H=l(Q*MANNT*(X+2.*{SQRT(l.+ZT*ZTlll**0.667l/(SQRT(S(NWll*l.49*(X+Z
lTl**l.66711**0.375 IF(H.LE. HMAX .OR. X .GE. BDMAXI GO TO 180 X=X+0.5 GO TO 170
180 B=X*H T=8+2.*ZT*H A=O. 5*H* ( B+ TI AEXTRA = A - AO(NWl IF lAEXTRA .LT. 0.2*Al AEXTRA = 0.2*A W=B+2.4*H*ZT+25. PR=8+2.2*H*SQRT(l.+ZT*ZTI CSL=SKl*LC(NWl* AEXTRA +SK2*LC(NWJ+SK3*RC(NWl*lW-WO!NWll*lCINWl+
lSK4*(HN*T+HE*IT-TO(NWl I l+SK5*lRN*T+RE*IT-TO(NWJ} l CSL=CSL+SK7*PR*LC(NWl IF(CSL.GT.CS .ANC. LINING(NWI.EQ.l .OR. LINING(NWJ.EQ.2) GO TO 270 IF ILININGINWl .EQ. 3l GO TD 190 LINING{NWl=3 TT=T AA=A WW=W CS=CSL GO TO 230
190 CS=CSL - 244 -

RETURN C ENLARGING TRAPEZOIDAL LINED CHANNELS
200 HO=ITO(NWJ-SQRT{TOINWl*TOINWJ-4.0*ZT*AOINWJll/(2.0*ZTJ BO=TO!NW)-2.0*ZT*HO P0=80+2.2*HO*SQRT(l.+ZT*ZT) Q5=QOINW) HT=HO
C ENLARGE IN fIVE PERCENT INCREMENTS ANO TEST TO SEE iF LARGE ENOUGH Hl=l.05*HO
210 Q6=tl.49*SQRT(SINWll*IIBO•ZT*Hll*Hll**l.667)/(MANNT*IB0•2.D*Hl*SQR lT{l.+ZT*ZTll**0.6671 If IQ6 .GE. Q) GC TC 220 Q5=Q6 HT=Hl Hl=l.05*Hl GO TO 210
C INTERPOLATION FOR PROPER DEPTH ONCE IT HAS BEEN BOUNDED 220 H=HT•IIHl-HTl*lQ-Q5ll/lQ6-Q51
B=BO T=B•2.*ZT*H A=0.5*H*IB+Tl W=B+2.4*H*ZT+25. PR=B+2.2*H*SQRT(l.+ZT*ZTl WEXTRA=W-WO(NWl IF IWEXTRA .LT. o.ol WEXTRA=O.O CS=SKl*LCINWl*IA-AO(NWJ)+SK2*LCINWl+SK3*RC(NWl*WEXTRA *LCINWJ+
1SK4*CHN*T+HE*IT-TO(NW)ll+SK5*1RN*T•RE*IT-TOINWIJI CS=CS+SK7*(PR-POl*LC(NW) RETURN
C RECTANGULAR LINED CHANNELS 230 IFICHANELINWll GO TO 240
C BUILDING NEW ONES X=BOMIN H=IQ•MANNR*IX+2.Dl**D.667 /ISQRTISINWll*l.49*X**l·6671l**0.375 T=X*H A=H*T AEXTRA = A - AO(NWJ IF IAEXTRA .LT. 0.2*Al AEXTRA = 0.2*A W=T+20.0 PR=T+2. l*H CSR=SKl*LCINWl* AEXTRA +SK2*LCINWl+SK3*RC(NWJ•IW-WO(NWll*LC!NWI+
lSK4*(HN*T+HE*(T~rotNW)l)+SK5*{RN*T+RE*(T-TO{NWlll CSR=CSR+SKB*IPR+2.0l*LCINWJ IF (CSR .GT. CS .ANO. LININGINW) .NE. 41 GO TO 270 LININGINWl=4 CS=CSR RETURN
C ENLARGING RECTANGULAR LINEO CHANNELS 240 HO=AO(NWJ/TO(NWJ
BO=TOINW> Q5=QOINWI HT=HO
- 245 -

Hl=l.05*HO 250 Q6=1l.49*SQRT(S(NWJJS!80*Hl)**l.667l/(MANNR*l80+2.0*Hll**0.667l
IF (Q6 .GE. Q) GO TO 260 Q5=Q6 HT=Hl Hl=l.05*Hl GO TO 250
260 H=HT+{(Hl-HTl*{O-Q5Jl/tQ6-Q5l CS=SK8*2.0*IH-HOl*LClNWl T=TO(NWl W=WO(NW) A=H*T RETURN
270 T=TT A=AA W=WW RETURN END
SUBROUTINE STROUT C UNIVERSITY OF KENTUCKY FLOOD CONTROL PLANNING PROGRAM II C VERSIDN OF JANUARY 27, 1968 C PRINTS OUT SUMMARY OF CHANNEL IMPROVEMENTS
COMMON AOl251,All25!,A2125l,A3{25l,A41251,ADDCSl251,AFCTR13,lll, 1 AFWIZ,25l,AW(25l,CAP{25,lll,CHIZ5l,CHANELl25l,CLOCl25,5l,0(3,25l, 2 DF(lOl,DFQRl16J,DQCKl161,FDAl25l,FQl251,FRUClll,IO(l00l,IHEl251, 3 IHNC251,1HOLDl25l,IMPROVl25l,INOEXl25,ZJ,IREl25},IRN(25l,Kl(25), 4 K2125l,LC(25J,LININGt25l,LOCl25l,NDT(25l,OUTPUT(25,13l,Q0(25l, 5 Q05111,lll,Q43(11,111,QQ!Z,1Dl,QXl2,16J,RC!25l,S125l,SIC(25l, 6 T0!25J,TCLl25l,TF!251,TICl251,USU8Wf25,61,UTOTRl25,61, 7 VALUEl25 1 61,WOl25l,WT{251,XF1!25J,XF2125l,XF3(251,XF4f251,Y(l6t, 8 YY!lOl
COMMON A,AG,ATEMP,BDMAX,BOMTN,CD,CDA,COAV,COB,CDBV,CDC,CDCV,CDST, l CHECK,CLEN,COEFDM,CPF,CRF,CRFSM,CS,CU,F,FA,FD,FDTEMP,FIA,FIB,FIC, 2 FTOP,GA,GSF,HE,HETEMP,HMAX,HN,HOLONG,HTEMP,IPP,ITOP,LA,Lf,LGTEMP, 3 l!NED,Ll,LTF,MANNR,MANNT,MANNU,MW,ND,NDF,NOTEMP,NSTAGE,NSTEMX,NW, 4 PA,P8,PC,PP,PTf,PWF,Q805,Q843,QL,QLINED,QP,QS,R,RE,RETENP,RN, 5 RTEMP,SAFC,SK1,SK2,SK3,SK4,SK5,SK6,SK7,SKB,SPWF,SPWFAC,SS,STEMP, 6 STF,T,TIME,TIMST,TRACE,TTEMP,UN,UNC,UZ,VA,VLAGST,VLURST,W,WTEMP, 7 XF,YCOMP,ZT,ZU
REAL LC LOG[CAL CHANEL,HOLDNG WRITE(6,5000l
5000 FORMATtlHl,40X,31HSUMMARY OF CHANNEL IMPROVEMENTS//128H UNIT T lYPE OF STAGE CAPACITY X-SECTION TOP ROW DEPTH O 2ROP STRUCTURES HIGHWAY BRIDGES RAILROAD BRIDGES l
WRITEl6,5010) 5010 FORMATl10X,7HCHANNEL,7X,7H ACTION,16X,4HAREA,5X,12HWIDTH WIOTH,9X
1,55HNUM8ER HEIGHT SAME BUILT EXTEND SAME BUILT EXTEND I WRITE{6,50ZOJ
- 246 -

5020 FORMAT!37X,4HCFS.,5X,7HSQ. FT.,4X,3HFT.,4X,3HFT.,4X,3HFT.,12X,3HFT 1.11
DO 260 NW=l,MW C If CHANNEL NOT IMPROVED, NO CHANNEL IMPROVEMENT SUMMARY WRITTEN
!Fl.NOT. CHANEL(NWJJ GO TO 260 ND=NDT!NW) FD=FDAlNWl
C DEPTH OF FLOW DEPENDS ON CHANNEL TYPE IFILININGINWI .LE. 21 HO=(TOINWI-SQRT(TOINWl**2-4.0*ZU*AOINWlJl/l
12.o•zu, IF!L!NINGINW! .EQ. 31 HO=(TO(NWl-SQRTITO{NWl**2-4.0*ZT*AO{NWlll/l
12.0*ZTl IFILININGINWl .EQ. 4) HO=AOINWl/TOINWl ICAP9=CAP!NW,9l ICDIF=IHN(NWl+IHEINW) IUH = IABSlICAP9 - ICDIFJ 00 10 I= 1, 6 IF (CAP{NW,11 .LT. O.Ol GO TO 20
10 IUH=IUH+l 20 IF (NSTAGE .EQ. l .OR. USUBWINW,NSTAGEl .LT. 0.251 GO TO 50
C IF SUBWATERSHED IS BETWEEN 25 PER CENT AND 50 PER CENT URBANIZED C THERE SHOULD BE AT LEAST TWO BRIDGES PER MILE OF CHANNEL
IF IUSUBWINW,NSTAGEI .LT. 0.501 GO TO 30 C IF SUBWATERSHED IS MORE THAN 50 PER CENT URBANIZED THERE SHOULD C BE AT LEAST THREE BRIDGES PER MILE OF CHANNEL
NBR=3.0*LC!NWl+0.5 GO TO 40
30 NBR=Z.O*LCINWl+0.5 40 IF (IUH+ICDIF .LT. NBRl IUH=NBR-ICDIF 50 lUR=O
IF !IMPROV(NWl .EQ. 11 IUR=CAP!NW,10) 00 60 1=7,8 IFICAPlNW,11 .LT. O.l GO TO 70
60 IUR=IUR+l 70 III=LINING(NWI
C PRINT SUMMARY OF CHANNEL IMPROVEMENTS DEPENDING ON TYPE OF LINING C ANO WHETHER CHANNEL WAS UNCHANGED, BUILT, ENLARGED OR C LINED DURING THE CURRENT SUBWATERSHED STAGE
GO TO 180,90,100,llOJ,III 80 lFIIMPROVINWl-2} 120,130,140 90 IFCIMPROV!NWJ-2) 150,160,170
100 IFIIMPROV(NWJ-21 180,190,200 110 IF(JMPROV!NW)-2) 230,240,250 120 WR1TE16,5030l NW,QO(NWJ ,AO(NWl, TOINWI ,WO(NWI ,HO,ND,FD, IUH,IHN{NW),
1 IHEINWl,IUR,IRN(NWl,IRE{NWl 5030 FORMAT! 1X,I2,2X,17HUNLINED \UC OROPS,2X,9HUNCHANGED,F8.0,Flhl,F9.
ll,F7.l,F6.l,5X,I2,FB.l,4X,I2,3X,I2,5X,I2,5X,12,3X,12,5X,I21 GO TO 260
130 WRITEl6,50401 NW,QO(NWJ,AO!NWl,TO!NWl,WO!NWl,HO,ND,FD,IUH,IHNINWI, 1 IHE!NWJ,IUR,IRN(NW},IRE{NWI
5040 fORMATl1X,12,2X,17HUNLINEO W/0 OROPS,2X,9HBUILT ,F8.0,Fll.1,f9. 11,F7.l,f6.1,5X,I2,F8.l,4X,12,3X,I2,5X,I2,5X,I2,3X,I2,5X,I21
- 247 -
GO TO 260 140 WRITEC6,50501 NW,QO(NWl,AOINWl,TO(NWl,WOINWl,HO,ND,FD,IUH,IHNINWl,
1 IHEINWl,IUR,IRNCNW),IRE(NWJ 5050 FORMAT{lX,12,2X,17HUNLINEO W/0 OROPS,2X,9HENLARGED ,F8.0,Fll.l,F9.
11,F7.l,F6.l,5X,I2,F8.1,4X,12,3X,I2,5X,I2,5X,12,3X,12,5X,I21 GO TO 260
150 WRITE!6,5060l NW,QOINWl,AOINWl,TOINWJ,WOINWl,HO,NO,FD,IUH,IHN(NW), 1 IHEINWl,IUR,IRN(NWl,IRE(NWl
5060 FORMAT(1X,12,2X,17HUNLINEO W DROPS ,2X,9HUNCHANGED,F8.0,Fll•l,F9. 11,F7.l,F6.l,5X,I2,FB.1,4X,12,3X,I2,5X,I2,5X,I2,3X,I2,5X,12l
GO TO 260 160 WRITE( 6,50701 NW,QO(NWl ,AO(NWI ,TOINWl ,WO(NWI ,HO,NO,FO, IUH, I HNI NW),
1 IHEINWl,IUR,IRN{NWl,IRE(NWl 5070 FORMATtlX,I2,2X,17HUNLINED W DROPS ,2X,9HBUILT ,FB.O,Fll.1,F9.
11,F7-l,F6.l 1 5X,I2,F8.l,4X,I2,3X,I2,5X,I2,5X,I2,3X,12,5X,l2l GO TO 260
170 WRITE16,5080l NW,QO(NWl,AO(NWl,TOINWl,WO(NWl,HO,ND,FD,IUH,IHN(NWl, l IHE{NWl,IUR,IRN(NWl,IRE(NWJ
5080 FORMAT(lX,I2,2X•l7HUNLINED W DROPS ,2X,9HENLARGEO ,F8.0,Fll.l,F9. 11,F7.l,F6.l,5X,I2,F8•l,4X,12,3X,I2,5X,12,5X,l2,3X,I2,5X,I21
GO TO 260 180 WRITEl6,5090l NW,QOINWl,AO(NWl,TO(NWl,WOINWl,HO,NO,FO,IUH,IHN(NWl,
l IHE(NWl,IUR,IRNINWl,IRE(NWI 5090 FORMAT!lX,12,2X,17HTRAPEZOIOAL LINED,2X,9HUNCHANGED,FB.O,Fll•l,F9.
ll,F7.l,F6.l,5X,12,FB.1,4X,I2,3X,12,5X,I2,5X,I2,3X,l2,5X,I2l GO TO 260
190 WRITEl6,51001 NW,QOlNWJ,AO(NWl,TOINWl,WOINWl,HO,NO,FD,IUH,IHN(NWJ, l IHEINW1,IUR,IRN{NWl,IRECNW)
5100 FORMAT{1X,I2,2X,17HTRAPEZOIDAL LINE0,2X,9HBUILT ,F8.0,Fll.1,F9. 11,F7.1,F6~1,5X,I2,FB.1,4X,I2,3X,12,5X,I2,5X,12,3X,12,5X,I2l
GO TO 260 C TRAPEZOIDAL LINING ADDED - DISCOVERED BY A DESIGN FREQUENCY C NOT IN ARRAY Of
200 DO 210 KOF=l,NDF IF IOUTPUT(NW,21 .EQ. OFIKOFJI GO TO 220
210 CONTINUE WRITE(6,51101 NW,QO(NWl,AO(NWl,TOINWl,WOINWJ,HO,NO,FD,IUH,IHN(NWI,
l IHE(NWl,IUR,IRN(NWl,IREINWI 5110 FORMAT{lX,I2,2X,28HTRAPEZOIOAL LINING ADDED ,F8.0,Fll.l,F9.
11,F7.1,F6.l,5X,I2,F8.1,4X,I2,3X,I2,5X,12,5X,12,3X,12,5X,I2l GO TO 260
220 WRITEl6,5120l NW,QO(NWl,AOINWl,TO{NWl,WO(NWl,HO,ND,FO,IUH,IHN!NWl, 1 IHEINWl,IUR,IRN(NWl,IRE(NWI
5120 FORMAT!1X,12,2X,17HTRAPEZOIDAL LINE0,2X,9HENLARGED ~FBoO,Fll.l,F9. 11,F7.l,F6.l,5X,12,F8.l,4X,I2,3X,I2,5X,12,5X,I2,3X,I2,5X,I2)
GO TO 260 230 WRITE!6,5130l NW,QOINWl,AO(NWJ,TO(NWl,WO(NWl,HO,ND,FD,1UH,lHN(NWI,
1 IHE(NWl,IUR,IRNINWl,IRE(NWl 5130 FORMAT(lX,I2,2X,17HRECTANGULAR LINE0,2X,9HUNCHANGED,F8.0,Fll.1,F9.
11,F7.l,F6.l,5X,12,F8.l,4X,12,3X,12,5X,12,5X,12,3X•l2,5X,I2l GO TO 260
240 WRITE!6,5140l NW,QO(NWJ,AO(NWJ,TO{NW)~WO(NWliHO,ND,FO,IUH,IHN(NWl, - 248 -

1 IHEINWl,IUR,!RNINNl,lRElNW) 5140 FORMAT(lX,I2,2X,17HRECTANGULAR LINED,2X,9HBUILT ,F8.0,Fl1.1,F9.
11,F7.l,F6.l,5X,I2,F8ol,4X,I2,3X,I2,5X,I2,5X,I2,3X,12,5X,12l GO TO 260
250 WRITE!6,51501 NW,QOINNl,AOINWJ,TO(NWl,NO(NWl,HO,ND,FO,IUH,l~N!NWI, l IHEINWl,IUR,IRN(NWl,IRE(NWl
5150 FORMAT!1X,I2,2X,17HRECTANGULAR LINED,2X,9HENLARGED ,F8.0,Fll.1,F9. ll,F7.1,F6.l,5X,I2,FB.1,4X,I2,3X,I2,5X,I2,5X,I2,3X,12,5X,121
260 CONTINUE C WRITE OUT SUMMARY TABLE OF HOLDING COST
IF (.NOT. HOLONGl RETURN K=l DO 270 NW=l,MW IF IIHOLO{NN).EQ.01 GO TO 270 ACH=tWTtNWl*LC!NWl-WOtNWl*SIClNWll*0.1212 CHU=CHINWI/ACH IF !K.EQ.11 WRITE 16,5160) NSTAGE
5160 FORMATllH Ill, 1 1SX,76H SUMMARY OF RIGHT-OF-WAY PRESERVED FOR FUTURE CHANNE 2L CONSTRUCTION IN STAGE 12//2X,4HUNIT,3X,14H HOLDING WIOTH,2X,14H 3CHANNEL WIDTH,6X,10H AREA HEL0,2X,17HUNIT HOLDING COST,2X,18HTOTAL 4 HOLDING COST/16X,4HFEET,12X,4HFEET,12X,5HACRES,SX,16HDOLLARS PER SACRE,7X,7HOCLLARSJ
WRITE 16,51701 NW,WT(NWl,WOtNWI ,ACH,CHU,CH(NWI 5170 FORMAT l4X,I2,10X,F4.0,12X,F4o0,11X,F6.2,10X,F6.0,13X,F6.0l
K:K+l 270 CONTINUE
C SUM ALL SUBWATERSHEO HOLDING COSTS TOTHOO=O.O 00 280 NW:1,t'IW
280 TOTHOO=TOTHOO+CHtNWl WRITE(6,5180l TOTHOO
5180 FORMAT(2X,25HTOTAL ANNUAL HOLDING COST,5SX,F6.0J RETURN END
CDSK!P CSECT SAVE (14,121 .. * BALR 12,0 USING *, 12 LR 11,13 LA 13,SAVE sr 13,Bllll ST 11,4(131 L 6,=VlCAROSWl MVI 0161,X'O'
* L 13,SAVE+4 L 14,12(13l MVI 12(131,X'FF'
- 249 -
ENTRY ROUTINE
* * * * * * LOAD GR6 WITH ENTRY POINT IN READ SET THE SWITCH TO FORCE READING OF NEW CARO RETURN
* *

SAVE
READ
AREA OSRN PROBLEM
GETACARO
x MOVE
NONE WC
FOUND
RETURN OS
(15,121 18F *
ENO CSECT ENTRY SAVE BALR USING MVI · LR LA sr ST B OS DC LR LA LA L CLI BE LA LA L BALR DC SR STC MVI MVC EQU MVC MVC TR AR LA MVI MVI LA CLI BNE LA B CLJ BE CLC BE CLC BE CLC BE
CAROSW (14,121.,* 12,0 *,12 TRANSTAB+92,X 1 FF 1
11,13 13,AREA 13,8(111 11,4113) PROBLEM 18F AL4(5J 4, l 5,INAREA 6,BUFFER 7,COLPTR CAROSW, X' l' NONE WC 2,0SRN 7,1 I.=VIFIOCS#l 0,1 AL21240l 3,7 3,MOVE+l
* * * ENTRY- LINKAGE SETUP
REMOVE THIS CARD TO READ PAST'*'
* ·* * * * THIS PROGRAM'S SAVE AREA
SAVE CONTENTS OF ARG. PTR. SET UP ORIG. CARD PTR. SET UP TRANS. CARO PTR.
* * LINKAGE LOAD ADDRESS
LINK TO FORTRAN ROUTINE
IOCS
OF DATA SET REF NO
INAREA,C' 1 CLEAN OUT THE INAREA+l(2551,INAREA INPUT AREA l INAREA(XJ,0121 BUFFERl256),INAREA DUPLICATE THE CARO IN BUFFER BUFFER(2561,TRANSTAB TRANSLATE THE DUPLICATED CARD 3,7 2,013,61 0(21,X'FF' PUT END CAROSW,X 1 1 1 TURN 8,0(7,6) Ol8l,X 1 0' FOUND 7,110,7) NONE WC 0(8l,X 1 FF 1
GETACARO O(l,8) 1 TRY1 YESITIS 012,81,TRY2 YES I TIS 013,8J,TRY3 YESITIS
- 250 -
OF RECORD CHARACTER AFTER THE CARO ON THE GOT-A-CARX SWITCH PUT INDEXED COLUMN PTR. IN 8 CHECK CURRENT COL FOR SIGNIF. BRANCH IF SIGNIFICANT INCREMENT COL PTR. GO TRY AGAIN HAVE WE FINISHED THE CARO YES, GO GET ONE START OF A LEGAL NO(OIGITJ. YES, ELSE START OF A LEGAL NO(SIGN.OIGITJ YES, ELSE STRT OF A LEGAL NOlSIGN,PTR,OIGl YES, ELSE

CLC Ot2,8l,TRY4 START OF A LEGAL NUMBERIDPT,D!Gl
BE SET FT YES, ELSE B NONEWC+l2 GO BACK AND LOOK AGAIN
SET FT MVI FLTSW,X'i' YE SI TIS MVI DATA,X'l' WE HAVE FOUND LEGAL DATA
ST 8, START MVC OLOll),0!81 LA 7,117) SR 9,9 CLEAR GR9 ANO IC 9,0LO STICK THE OLD TRANS CHAR IN 18
LA 8,0(6,71 STORE THE NEW INDEXED COL PTR IN 8
CL I 0181 ,X'ff' BE NOTVALIO CLI ESW,X'l' HAVE WE FOUND AN 'E' BNE *+ 12 NO ELSE LA 10,0LIJTABEO PUT 'ED' TABLE ADD IN 10 B OUT AND GO ON CLI OSW,X'l' HAVE WE FOUND AN •o• BNE *+12 NO ELSE LA 10,0LDTABEO PUT •FT' TABLE ADO IN 10 B OUT ANO GO ON CLI Ft.TSW,X'l' ELSE LOAD 1 N0' TABLE ADO BNE *+12 NO. ELSE LA 10,0LDTABFT PUl 'fl' TABLE ADD IN 10 B OUT ANO GO ON LA 10,0LOTABNO ELSE LOAD •NO' TABLE ADO
OUT MVC HOLOERl51,0tlOI MOVE PROPER TABLE TO HOLDER SR 10,10 CLEAR GRlO IC 10,0(0,BJ ANO PUT THE NEW CHAR IN TI LA 11,NEWTAB-l PUT ADDRESS OF NEW CHAR IN 11
LA 11,0( 10,lll PUT INDEXED NEWT AB ADOR IN 11 MVC INST+l! ll,O(lll PUT PROP. MASK IN TM INST LA 9,HOLOER-1!9! PUT INDEXED HOLDER AODR IN GR9
INST TM OC'll ,X'O' TM INSTRUCTION Bl NOTVALID BRANCH IF NTO A VALID CHAR CLl 018l,X'3' IS THIS AN • EI
BNE T2 BRANCH If NOT MVI ESW,X'l' TURN ON • E • SWIICH 8 YESITIS+8 GO GET NEXT CHAR
TZ CLI C(8l,X 1 4' IS THIS A •o • BNE T3 BRANCH IF NOT MVl osw,x•1• TURN ON • 0. SWITCH B YESITIS+8 GO GET NEXT CHAR
T3 CLI 0{8l,X'2' IS THIS A ••• BNE YESITIS+8 GET NEXT CHAR IF NOT MVI FLTS~l,X 1 1' TURN ON FLTSW 8 YESITIS+8 GET NEXT CHAR
NOTVALIO CL I O(Bl,X'FF• IS THIS ENO-OF-CARD? BNE STA TRAN NO, GO CONVERT DATA CLI DATA,X'l' HAVE WE OF UNO DATA BNE GET AC ARD NO, THEN GET A CARO MVI CARDSW, x•o• WE NEEO A CARD
- 2 51 -
STATRAN ST 8,STOP S 8,START STC 8,LENGTH L 2,0(0,41 L 3,START S 3,:F•256' L 1,:V!AOCON#I CLI ESW,X'l' BE PERFEC CLI OSW,X'l' BE PERFOC CLI FLTSW,X'l' BE PERFFC
PERFIC MVC CONl+l(ll,LENGTH L 1, 4011 l BALR 0,1
CONl DC XL2'0400 1
B OONECONV PERFEC MVC CON2+1{1l,LENGTH
L 1,8( ll BALR 0,1
CON2 DC XL4'04000000' B OONECONV
PERFOC MVC CON3+l(ll,LENGTH L 1,8( ll BALR 0,1
CON3 OC XL4'08000000' B OONECONV
PERFFC MVC CON4+1{11,LENGTH L 1,01 ll BALR 0,1
CON4 DC XL4'04000000' OONECONV MVI. FLTSw,x•o•
MVI ESW,X'O' MVI OATA,X'O' MVI DSW,X'O' LA 4,4141 LTR 2,2 BP GETACARD-8 B TURNOFF+4
TURNOFF MVI CARDSW,X'O' ST 7,COLPTR l 13,AREA+4 l 14,12113). MVI 121131,X'FF' RETURN 115,12)
FORMAT DC CL8'(20A4l ' OS OF
INAREA OS CL256 BUFFER DS CL256
DC X' FF' DS 3X
- 252 -
STORE STOPPING ADDRESS COMPUTE LENGTH PUT LENGTH IN 'LENGTH' SET PTR TO CORR ARG IN GR2 PUT START AOOR IN 3
MOVE LINK AOOR IN GRl 'E' SWITCH ON? BRANCH IF YES
BRANCH IF YES '·' SWITCH ON BRANCH IF YES PERFORM I CONVERSION PUT LENGTH IN CONSTANT
LEAVE PERFORM E CONVERSION PUT LENGTH IN CONSTANT
LEAVE PERFORM D CONVERSION PUT LENGTH IN CONSTANT
LEAVE PERFORM F CONVERSION PUT LENGTH IN CONSTANT
TUNR OFF '•' TURN OFF 'E'
TRUN OFF 1 0 1 SWITCH INCREMENT POINTER TO ARG LIST CURRENY ARG LAST ARG
TURN ON NEW CARO SWITCH
LOAD RETURN AREA
TRANS TAB DC 75X'0' DC x•2• DC 2x•o• DC x. l' DC 17X'0' DC X'l' DC 99X'0' DC X'0403' DC 42X'0' DC 10X'5' DC 6X'0'
TRYl DC X'5' TRY2 DC X'0105' TRY3 DC X'010205' TRY4 DC Xl2 1 0205' CARD SW DC x•o• DATA DC x•o• START DS lF OLD OS Cll COLPTR OS lF STOP OS lF OLDTABFT DC X'0838888838 1
OLDTABNO DC X1 4838888878' OlOTABED DC X'0808888808 1
Fl TSW DC x•o• ESW DC x•o• DSW DC x•o• NEWT AB DC X'8040201008' HOLDER OS XLS LENGTH OS Cll
END READ
- 253 -

APPENDIX B
DICTIONARY OF VARIABLES
USED IN
THE UNIVERSITY OF KENTUCKY FLOCD CONTROL PLANNING PROGRAMS
ITEM 1 - VARIABLE NAME ITEM 2 - WHETHER VARIABLE IS USED IN PROGRIM 2, PROGRAM 3, OR
IN BOTH PROGRAMS ITEM 3 - WHETHER VARIABLE IS REAL, INTEGER, OR LOGICAL ITEM 4 - VARIABLE DIMENSIONS ITEM 5 - UNITS ITEM 6 - DEFINIT10N OF THE VARIABLE
1 2 ~ 4 5 6
A B R AO* BR
A 1 2 R
A2 2 R
A3 2 R
A4 2 R
AS 3 R
A7 3 R
AB 3 R
FOOTNOTES
1 \I
25
25
25
25
l
1
15
SF CROSS-SECTIONAL AREA Of DESIGN CHANNEL SF ARRAY OF AVERAGE CROSS-SECTIONAL AREA OF CHANNEL
IN SUBSCRIPTED SUBWATERSHED, TAKEN PERPENDICULAR TO DIRECTION Of FLOW
- SUBSCRIPTED SUBWATERSHED DISPERSION PARAMETER OF FLOWS USED IN THE GUMBEL ANALYSIS TO DETERMINE FLCW-FREQUENCY RELATIONSHIPS. n1n DENOTES BEGINNING Of STAGE FLOWS FOR IMPROVED CHANNELS
- DISPERSION PARAMETER LIKE Al EXCEPT FOR END Of STAGE FLOWS FOR IMPROVEC CHANNELS
- DISPERSION PARAMETER LIKE AZ EXCEPT FOR BEGINNING OF STAGE FLOWS FOR UNIMPROVED CHANNELS
- DISPERSION PARAMETER LIKE A3 EXCEPT FOR ENO Of STAGE FLOWS FOR UNIMPROVED CHANNELS
- NUMBER CF SUBWATERSHEC TIME INCREMENTS TO CURRENT POINT ON SLBWATERSHEC TIME BASE HYDROGRAPh
Sf TEMPORARY LOCATION FOR STORING A9 TO PRINT AS OUTPUT
SF CROSS SECTIONAL AREA CF OPTIMUM CHANNEL IN
* - INITIAL VALUE READ V - VALUE= 25 IN FRCGRAM 2, 15 !N PROGRAM 3.
- 254 -

A9 3 R
AA B R
ACD 2 R
ACF 2 R
ACH 8 R
ACL 2 R
ACP 2 R
ACS 2 R
ACU 2 R
ADD 3 R
ADDC8 3 R
15
l
l
1
l
l
l
l
1
1
15
SUBSCRIPTED SUBWATERSHED ASSOCIATEC WITH LEAST COST COMBINATION OF RESERVOIR STORAGE ANO DOWNSTREAM MEASURES TRIED THUS FAR
SF CROSS SECTIONAL AREA CF OPTIMUM CHANNEL IN SUBSCRIPTED SUEWATERSHEO DOWNSTREAM FROM RESERVOIR STORAGE CURRENTLY BEING EVALUATED
SF VALUE OF A HELO WHILE OTHER SECTION TYPES ARE TRIED TO SEE IF THEY COST LESS
$/YR SUM OF THE ANNUAL CCST OVER TIMST YEARS OF ALL RESIDUAL FLOOD DAMAGE COSTS FOR STA-GES STUDIED THUS FAR
$/YR SUM OF THE ANNUAL CCST OVER lIMST YEARS OF ALL FLOOD COSTS FOR STAGES STUDIED THUS FAR. TOTAL COST OF THE PLANNING PROGRAM TO PRESENT
AC AREA OF EXTRA RIGHT-OF-WAY BEING HELD FOR CHANNEL CONSTRUCTION IN FUTURE STAGES
$/YR SUM Of THE ANNUAL CCST OVER TIMST YEARS OF All LAND USE ADJUSTMENT FOR STAGES STUDIED THUS FAR
$/YR SUM OF THE ANNUAL CCST OVER TIMST YEARS OF All FLOOD PROCfII\G FOR STAGES STUDIED THUS FAR
$/YR SUM Of THE ANNUAL COST OVER TIMST YEARS Of All CHANNEL IMPROVEMENT FOR STAGES STUDIED THUS FAR
$/YR SUM OF THE ANNUAL COST OVER TIMSl YEARS CF All UNCERTAINTY FOR STAGES STUDIED THUS FAR
FT DEPTH OF WATER ADDED TC CURRENT RESERVOIR SURFACE ELEVATION TO DETERMINE THE NEXT SURFACE ELEVATION {RESELi FDR THE RESERVOIR ROUTING CURVE
$/YR CONTINUING lCARRYCVERt COST Cf OPTIMUM CHANNEL IMPROVEMENT IN SUBSCRIPTED SUBWATERSHED FOR LEAST COST COMBINATION OF RESERVOIR STORAGE AND CHANNEL IMPROVEMENT FOUND THUS FAR - SAVED FOR ADDING TO TOTAL COST IN SUBSEQUENT STAGES AS NEEDED
AEDC9 3 R 15 $/YR CONTINUING {CARRYOVER) COST CF CHANNEL IMPROVEMENTS IN SUBSCRIPTED SUBWATERSHED DOWNSTREAM FROM RESERVOIR STORAGE CURRENTLY UNDER CONSIDERATION
ADDCS B R V $/YR CCI\TINUING COST OF ChANNEL IMPROVEMENTS MADE DURING A PREVIOUS STAGE WITHIN THE SUBSCRIPTED SUBWATERSHED
AEXTRA BR l SF CRCSS-SECTIONAl AREA OF EXCAVATION REQUIRED FOR INITIAL CHANNEL IMPROVEMENT
AF 2 R 1 - DISPERSION PARAMETER (GUMBEL) FROM FLOOD FREQUENCY RELATIONSHIP FOR COMPUTING DOWNSTREAM COST
AFCTR* B R 3,11 - READ ARRAY EXPRESSING FOR THE 11 DRAINAGE AREAS IN SQ MI FOUND IN THE FIRST ROW, THE RATIOS OF THE FLOOD PEAK IN CFS/SQ MI TO THE CFS/SQ Ml FROM 1.0 SQ Ml FOR THE MEAN ANNUAL FLOOD (2ND ROW), ANO THE 200-YEAR FLOOD 13RD ROW)
AFCTRT* 3M 11 - RELATIONSHIP BETWEEN DRAINAGE AREA AND TIME-TO-PEAK - AFCTRT = l.O FOR A DRAINAGE AREA OF ONE SM
- 255 -

AFCTRT > 1.0 FGR LARGER DRAINAGE AREAS AFCTRV* 3 R 2,11 - MULTIPLIERS USED TG RELATE AVERAGE VOLUME OF
FLCW CAUSED BY 43% AND .5% FLOOD PEAKS TO DRAINAGE AREA - AFCTRV = 1.0 FOR AREA= ONE SM AFCTRV < 1.0 FOR LARGER AREAS
AFL 2 R l - DISPERSION PARAMETER -GUMBEL- WITHOUT CHANNELIZATION IN THE UPSTREAM SUBWATERSHEO
AFT 3 R 15 - USED TO RELATE TIME-TO-PEAK FOR ONE SM TO TIME-TO-PEAK FGR THE TOTAL AREA CF THE SUBSCRIPTED SUBWATERSHEO AS INTERPOLATED FROM AFCTRT
AFV 3 R 2,15 - FACTOR USED TO RELPTE AVERAGE VOLUME OF FLOW FROM 43% ANO .5% FLOOD PEAKS TO THE AREA OF A SUB-WATERSHED - INTERPOLATED FROM AFCTRV
AF k B R 2, V - FACTOR USED TO RELATE MAGNITUDE OF MEAN ANNUAL {FIRST ROW) AND 200-YEAR {SECOND ROW) FLOOD PEAKS, BOTH EXPRESSED IN CFS/SQ MI, OVER 1.0 SQ Mi AREA TC MAGNITUDE OF THE SAME PEAKS FOR THE AREA OF THE SUBSCRIPTED SUBWATERSHED
AG BR l - DISPERSION PARAMETER -GUMBEL- USED TO CALCULATE FREQUENCY AT ,MICH FLOODING BEGINS
AHN 3 R l - GUMBEL O ISPERS ION PARAMETER USED TO CALCULATE FLOWS FOR VARIOUS FREQUENCIES MORE RARE THAN THE RESERVOIR DESIGN FREQUENCY WHEN CHANNELS ARE NOT IMPROVED
AHY 3 R 1 - SAME AS A.liN BUT FOR IMPROVED CHANNELS AK12* BR V AC ARRAY INTO WHICH IS READ THE AREA FLOODED IN THE
SUBSCRIPTED SUBWATERSHED DURING FLOOD WHOSE PEAK FLOW IS READ INTO QK12
ALN 3 R 1 - GUMBEL DISPERSION PARAMETER USED IN CALCULATING FLOWS FOR VARIOUS FREQUENCIES LESS RARE THAN THE RESERVOIR DESIGN FREQUENCY WHEN CHANNELS ARE NOT IMPROVED
ALRG 2 R 1 SF ENLARGED CHANNEL CROSS SECTIONAL AREA REQUIRED TO HANDLE INCREASED FLOW CAUSED BY UPSTREAM CHANNELIZATION
ALY 3 R 1 - SAME AS ALN BUT FOR IMPROVED CHANNELS AMAX 3 R 1 SF CROSS SECTIONAL AREA OF THE LARGER DAM SECTION
TO WHICH PRISMO!CAL FORMULA IS BEING APPLIED TO COMPUTE VOLUME
AMEAN 3 R l SF CROSS SECTIONAL AREA OF THE MEAN SECTlCN TC WH[CH PRISMOIDAL FORMULA IS BEING APPLIED TO COMPUTE VOLUME
AMIN 3 R l Sf CROSS SECTIONAL AREA OF THE SMALLER DAM SECTION TO ~H[CH PRISMOIDAL FORMULA IS BEING APPLIED TO COMPUTE VOLUME
AMINM 3 R 1 SF MINIMUM CHANNEL CROSS SECTION ENLARGEMENT AN COST 3 R 1 $/YR DI SC OUN TED ANNUAL CCST OF 1 NSTALLING OAM ANO
RESERVOIR ANMAIN 3 R 1 $/YR ANNUAL MAINTENANCE COST OF THE DAM AND RESERVOIR APCHAR 3 R l SF AREA OF THE APPROACH CHANNEL AT THE SPILLWAY
CREST SECTION APCHEX 3 R 1 CY APPROACH CHANNEL EXCAVATION
- 256 -
'

APCHLG 3 R ACR* BR
AREA 8 R
ASML 2 R
ATEMP BF
AW* 2 R
AW* 3 R
AWG* 3 R
AZ B R
All 8 R
AZll 8 R AZ2 B R
AZ2 l B R AZ3 BR
A Z3 l B R AZD ll R
AZL B R AZS BR
8 8 R BOB R
BDMAX* B R
BDMIN* BR
BH 2 R
BLDNOW 3 L
BNFDST 3 R
BCTACR 3 R
BOTTOM 3 R
1 FT LENGTH OF APPRCACH CHANNEL TC EMERGENCY SPILLWAY 1 - FACTOR MULTIPLiED BY RIGHT-OF-WAY COST TO INCLUDE
CCST OF ACCUISITION l AC AREA PROTECTED BY FLCCD PROOFING CR LANC USE
ADJUSTMENT MEASURES 1 SF CHANNEL CROSS-SECTIONAL AREA REQUIRED TO HANDLE
FLOW WITHOUT UPSTREAM CHANNELIZATION l SF VALUE OF A FOR THE MOST ECONOMICAL CHANNEL
IMPROVEMENT FOUND SC FAR 25 SM ARRAY INTO WHICH IS READ THE TOTftL AREA TRIBUTARY
TO THE DOWNSTREAM END OF THE SUBSCRIPTED SUB WATER SHED
15 SM TRIBUTARY AREA ADDEO - AREA TRIBUTARY TO DOWNSTREAM LESS AREA TRIBUTARY TO UPSTREAM END OF SUBWATERSHED
1 SM DRAINAGE AREA AT STREAM GAGE USED TO DEVELOP CUMULATIVE RUNOFF CURVE
1 SF VALUE OF A FOR UNLINED CHANNEL WHILE LINING EXISTING CHANNEL IS TRIED
l AC AREA FLOODED TO DEPTHS DESTROYING LESS THAN 0.25 OF THE MARKET VALUE OF STRUCTURES FLOODED
l AC SAVED TOTAL All WHEN PARTIAL All IS BEING APPLIED l AC AREA FLOODED TO DEPTHS DESTROYING ~ORE THAN 0.25
BUT LESS THAN 0.75 OF THE MARKET VALUE OF STRUCTURES FLOODED
l AC SAVED TOTAL AZ2 WHEN PARTIAL AZ2 IS BEING APPLIED 1 AC AREA FLOODED TO DEPTHS GREAT ENOUGH TO DESTROY
0.75 OF THE MARKET VALUE CF STRUCTURES FLOODED l AC SAVED TOTAL AZ3 WHEN PARTIAL AZ3 IS BEING APPLIED 1 AC AREA FLOODED OUTSI[E BOUNDARY OF LAND USE
RESTRICTION 1 AC TOTAL AREA FLOODED 1 AC AREA FLOODED WITHIN Wl-:ICJ-. LANO USE RESTRICT ION
APPLIES 1 FT BOTTOM WIDTH OF CHANNEL l FT BOTTOM WIDTH CF CHANNEL BEFORE ENLARGEMENT 1 - MAXIMUM RATIO OF BOTTOM WIDTH TO DEPTH ALLOWED
IN CHANNEL DESIGN l - MINIMUM RAIIO CF BOTTOM WIDTH TO DEPTH ALLOWED IN
CHANNEL DESIGN l - NUl'BER OF HIGHiillY BRIDGES IN DOWNSTREAM
SUBWATERSHED AFFECTED BY UPSTREAM CHANNELIZATION 1 - TRUE IF RESERVOIR TO BE BUILT NOW FOR OTHER
PURPOSES EVEN IF FLCOD CONTROL CANNOT BE JUSTIFIED
1 $/YR FLOOD CONTROL BENEFITS REALIZED DOWNSTREAM FROM AREA OF FORMAL ANALYSIS
l AC RESERVOIR AREA THAT IS MORE THAN 5 FT BELOW TOP OF PERMANENT POOL AND THUS IS NOT CLEARED OF VE.GE TA TI VE· GROWTH
1 FT BOTTOM ELEVATION OF EMERGENCY SPILLWAY STILLING BASIN (FIG. Al
- 257 -

BR BR l - NUMBER OF RAILROAC eRICEES IN DOWNSTREAM SUBWATERSHED AFFECTED BY UPSTREAM CHANNELIZATION
BRIDGE B SUBROUTINE DETERMINES NUMBER OF BRIDGES TO BE ENLARGED OR REPLACED. EXISTING BRIDGES WHICH BECOME TOO • SMALL ARE REPLACED. BRIDGES BUILT IN PROGRAM ARE ENLARGED. HIGHWAY BRIDEES BUILT TO SERVE NEW URBAN DEVELOPMENT ARE ENLARGED AS NECESSARY, BUT INITIAL CONSTRUCTION COST IS NOT CHARGED TO FLCCD CONTROL.
BRN 8 R 1 - NUMBER OF HIGHWAY BRIDGES WITHIN A SUBWATERSHED 8SFL05 3 R l CFS EXPECTED FLOW AT BEGINNING OF 200-YEAR FLOOD BSFL43 3 R 1 CFS EXPECTED FLOW AT BEGINNING OF MEAN ANNUAL FLOOD BSFLOW 3 R l CFS EXPECTED FLOW AT BEGINNING OF RESERVOIR DESIGN
FLOOD BSML 2 R l FT BOTTOM WIDTH Of CHANNEL REQUIRED TO HANDLE FLOW
WITHOUT CHANNELIZATION IN A GIVEN UPSTREAM SUBWATERSHED
BTVOL 3 R 1 CY VOLUME Of CONCRETE IN STILLING BASIN BOTTOM BUB R 1 FT BOTTOM WIDTH OF UNLINED CHANNEL
BUILD 3 SUBROUTINE DETERMINES Tl-:E OPTIMUM FLOOD STORAGE FOR A GIVEN RESERVOIR SITE UPSTREAM FRCM A GIVEN FLOOD PLAIN IN A GIVEN STAGE
BW* BR l FT REQUIRED HIGHWAY BRIDGE WIDTH BYVERT* 3 R 1 FT VERTICAL DISTANCE ABOVE TOP Of DAM TO RIGHT-CF
WAY PURCHASE LINE CB R 1 - RATIO OF LENGTH CF IMPROVED CHANNEL TRIBUTARY TO
DOWNSTREAM END OF SUBWATERSHED TO TOTAL LENGTH Of TRIBUTARY CHANNEL
Cl BR 1 $/FT/AC LNIT DAMAGE FACTCl<. FCR URBAN STRUCTURES WITH FLOOD PROOFING - INSIDE RESTRICTED AREA IN CD2
CZ BR l $/FT/AC UNIT DAMAGE FACTCR FOR ADDITIONAL DAMAGE TO URBAN STRUCTURES WITHOUT FLOCO PROOFING - INSIDE RESTRICTED AREA IN CD2
C3 BR l $/FTIAC UNIT DAMAGE FACTOR FOR AGRICULTURAL STRUCTURES WITH FLOOD PROOFING - INSIDE RESTRICTED AREA IN CD2
C4 8 R l $/FT/AC UNIT DAMAGE FACTCR FOR ADDITIONAL DAMAGE TO AGRICULTURAL STRUCTURES WITHOUT FLOOD PROOflNG -INSIDE RESTRICTED AREA IN CD2
CS BR 1 $/AC UNIT DAMAGE FACTOR FCR CROP DAMAGE C5G 8 R 1 $/FT/AC VARIABLE UNIT CROP DAMAGE FACTOR
C6 BR 1 $/FT/AC Cl & C3 C7 B R l $/FT/AC C2 & C4 CB BR 1 $/FT/AC UNIT DAMAGE FACTOR FOR ADDITIONAL DAMAGE TO
URBAN STRUCTURES WITH FLOOD PROOFING OUTSIDE THE RESTRICTED AREA
C9 BR 1 $/FT/AC UNIT DAMAGE FACTOR FOR ADDITIONAL DAMAGE TO URBAN STRUCTURES WITHOUT FLOOD PROOFING OUTSIDE THE RESTRICTED AREA
010 8 R l $/FT/AC UNIT DAMAGE FACT CR CORRECT ING FOR FLOOD PROOFED AGRICULTURAL STRUCTURES DISPLACED BY URBAN STRUCTURES OUTSIDE THE RESTRICTED AREA
- 258 -

Cll B P
Cl2 B R
Cl2G B R
Cl3 B R Cl4 B R
CA B R
CA.7 3 R CAB 3 R
1
l
l
1 1 l
11 10,11
i,/FT/AC UNIT DAMAGE FACTCR CORRECTING FOR AGRICULTURAL STPUCTURES !\CT FLCCO fFCGFED DISPLACE[ BY URBAN STRUCTURES OUTSIDE THE RESTRICTED AREA
$/AC UNIT DAMAGE FACTOR CORRECTING FOR CROPS DISPLACED BY URBAN STRUCTURES CUTSIDE THE RESTRICTED AREA
$/FT/AC VARIABLE UNIT DAMAGE FACTOR FOR CROPS DISPLACED BY URBAN STRUCTURES OUTSIDE THE RESTRICTED AREA
$/FT/AC CB & ClO t/FT/AC C9 & Cll $/FT/AC CCMBINATIOI\ CF STRUCTURAL CAMAEE FACTORS
RELATED TO BOTH DEPTH AND AREA OF FLGODING - VALUE OF CA9 USED IN PRINTING OUTPUT
CFS ARRAY CONTAII\II\G THE CAPACITIES OF HIGHWAY AND RAILROAD BRIDGES IN THE SUBSCRiPlED SUBWATERSHED ASSOCIATED WITH THE LEAST COST COMBINATION Of RESERVOIR STORAGE AI\D DOWNSTREAM MEASURES TRIED THUS FAR
CA9 3 R 10,11 CFS ARRAY CONTAINING THE CAPACITIES CF HIGHWAY ANO RAILROAD BRIDGES IN THE SUBSCRIPTED SUBWATERSHED ASSOCIATED WITH THE RESERVOIR STORAGE CURRENTLY BEING EVALUATED
CALCLU B SUBROUTINE CALCULATES LOCATION COST PER ACRE FOR EACH SUBWATERSHED IN EACH STAGE ANO MAKES SURE THAT LOCATION COST WILL INCREASE AS THE SUBWATERSHED BECOMES MORE URBANIZED
CAP* BR V,11 CFS THE NUMBER AND CAPACITY OF HIGHWAY AND RAILROAD BRIDGES IN SUBWATERSHED OF FIRST SUBSCRIPT
CACR 3 R l $ COST OF ACQUISITION OF RESERVOIR RIGHT-OF-WAY CB BR l $/FT COMBINATION Cf CRDF UNIT DAMAGE FACTORS RELATEC
TO AREA ONLY CBG $/FT/AC CCMBINATICN Cf VARIAELE CROP UNIT DAMAGE
CBOT 3 R
CBR* B R cc 3 R
CCLR 3 R
CCY* 8 R CD B R
CDl B
CDZ 8
CDA* B R
CDAV* 8 R
COB* B R
FACTORS 1 CY VOLUME OF CONCRETE IN THE EMERGENCY SPILLWAY
BOTTOM 1 $/Sf UNIT COST Cf HIGHWAY BFIOGES 1 - VALUE OF C USED IN INTERPOLATION l $ COST OF CLEARING VEGETATIVE GROWTH FROM RESERVOIR
SI TE 1 $/CY UNIT COST OF IN PLACE STRUCTURAL CONCRETE 1 $/YR AVERAGE ANNUAL DAMAGE DUE TO FLOODING. CALCULATED
BY CD2 If LANO USE RESTRICTION IS BEING EVALUATE!: ANO ev CCI IF IT IS NOT
SUBROUTINE RESIDUAL DAMAGE PROCEDURE WHEN THE LOCATION ALTERNATIVE IS NOT INCLUDED
SUBROUTINE RESIDUAL DAMAGE PROCEDURE WHEN THE LOCATION ALTERNATIVE IS NOT INCLUDED
1 $/AC EXPECTED CROP DAMAGE WHEN MOST PRODUCTIVE SOIL IS FLOODED TO MINIMUM DEFTH
l I/AC/FT/YR INCREMENTAL CROP DAMAGE PER ADDITIONAL FOOT OF DEPTH OF FLOODING IN MOST PRODUCTIVE SOIL
1 $/AC EXPECTED CROP DAMAGE WHEN INTERMEDIATE SOIL IS FLOODED TO MINIMUM DEPTH
- Z59 -

CDBV* B R
CDC* B R
COCV* B R
COf B R
COST 2 R
COSTE 2 L
CDZ B R
CEMB 3 R
CENCN 3 R CF B R CG B R
CH B R
CH8 3 L
1 $/AC/FT/YR INCREMENTAL CROP DAMAGE PER ADDITIONAL FOOT OF DEPTH OF FluuOII\G II\ INTERMEDIATE SOIL
1 $/AC EXPECTED CROP DAMAGE WHEN LEAST PRODUCTIVE SOIL IS FLOODED TC MINIMUM DEPTH
1 $/AC/FT/YR INCREMENTAL CRCP DAMAGE PER ACDITIONAL FOOT OF DEPTH OF FLOODING lN LEAST PRODLCTIVE SOIL
V $/AC/YR WEIGHTED MEAN CROP DAMAGE WHEN FLOODED FROM THE SOIL TYPES IN SUBSCRIPTED SUBWATERSHEO
$/YR TOTAL COST OF INDUCED FLOODING IN ALL DOWNSTREAM SUBWATERSHEDS CAUSED BY CHANNELIZATION UPSTREAM
1 - SET TRUE WHEN COST IS CALCULATED FOR A PARTICULAR SUBWATERSHEO-STAGE TO PREVENT UNNECESSARY RECALCULATION
1 $/YR VALUE OF CO FOR UNLINED CHANNELS WHILE CDl FINDS LOWER RESIDUAL FLOODING COST (CDI WITH LINING
1 $ DAM EMBANKMENT COST INCLUDING THE DAM Fillo THE CUTOFF TRENCH ANO THE RIPRAP
l $ COST OF DAM ENGINEERING AND CONTINGENCIES 1 $/YR TOTAL COST OF ALL FLOOD MEASURES AND DAMAGES V $/AC/FT/YR WEIGHTED MEAN INCREMENTAL CROP DAMAGE PER
ADDITIONAL FOOT OF DEPTH OF FLOODING FOR THE SOJL TYPES IN SUBSCRIPTED SUBWATERSHED
V $/YR COST OF HOLDING RIGHT-OF-WAY IN SUBSCRIPTED SUBWATERSHED FOR FUTURE CHANNELS
15 - SET TRUE TO INDICATE THAT THE LEAST COST COMB I NA TI ON CF RESERVOIR STORAGE AND DOWNSTREAM MEASURES FOUND THUS fAR INCLUDES CHANNEL IMPROVEMENT
CH9 3 L 15 - SET TRUE TO INDICATE THAT CHANNEL IMPROVEMENT SHOULD BE IN EFFECT IN SUBSCRIPTED SUBWATERSHED DOWNSTREAM FROM RESERVOlR STORAGE CURRENTLY BEING EVALUATED
CHANEL BL V - SET TRUE IF THE ENTIRE CHANNEL LENGTH IN THE SUBSCRIPTED SUBWATERSHED IS IMPROVED
CHANYZ 3 SUBROUTINE PROCEEDS DOWNSTREAM ON MAIN LINE FROM RESERVOIR SITE TO SELECT OPTIMUM COMBINATION OF MEASURES IN EACH SUBWATERSHEO
CHOATA 2 SUBROUTINE READS IN DATA REQUIRED TO OPTIMIZE CHANNEL IMPROVEMENT IN CONJUNCTION WITH NONSTRUCTURAL MEASURES
CHECK Bl l - READ TRUE TO HAVE INTERMEDIATE OUTPUT PRINTED EACH TIME A NEW ALTERNATIVE IS FOUND TO BE LESS COSTLY THAN ANY CONSIDERED PREVIOUSLY
CHEX 3 R 1 CY EMERGENCY SPILLWAY CHUTE EXCAVATION CHFIX B SUBROUTINE FIX THE DIMENSIONS OF CHANNELS IMPROVED BEFORE
THE BEGINNING Of THE PLANNING PERIOD FOR THE PURPOSE OF ESTIMATING THE COST OF CHANNEL ENLARGEMENT. EVEN If THE DESIGN CRITERIA USED IN BUILDING THE EXISTING CHANNEL DO NOT CONFORM TO THOSE USED IN THIS PROGRAM, THIS SUBROUTINE CAUSES All COSTS TO BE BASED ON THE SAME DESIGN CRITERIA
- 260 -

CHFLDS 3 SUBROUTINE FILLS ARRAYS PROVI[INf FLOOD PEAKS FOR SELECTED FREQUENCIES
CHHYDR 2 SUBROUTINE DETERMINES JhE RELATIONSHIP BETWEEN FLOOD PEAK ANO FREQUENCY ANO FREQUENCY AT WHICH FLOODING BEGINS
CHK 3 R l - CALLING ARGUMENT FOR SUBROUTINE CHRTE REPRESENTING EITHER CHKN OR CHKY
CHKN* 3 R 15 HR MUSKINGUM CHANNEL ROUTING STORAGE CONSTANT (STORAGE/DISCHARGE) FOR UNIMPROVED CHANNELS -APPROXIMATELY EQUAL TO TRAVEL TIME THROUGH THE REACH
CHKY* 3 R 15 HR SAME AS CHKN BUT FOR IMPROVED CHANNELS CHLNG 3 R l FT LENGTH Of RAISED WALL SECTION IN STILLING BASIN
CHU T E ( FIG. A l CHOPTM B SUBROUTINE PROCEDURE FOR OPTIMIZING CHANNEL IMPROVEMENT IN
CONJUNCTION WITH NONSTRUCTURAL MEASURES CHRTE 3 SUBROUTINE ROUTES HYOROGRAPH THROUGH CHANNEL REACH
CHU B R l $/AC UNIT COST OF HOLDING RIGHT-CF-WAY FOR FUTURE CHANNELS
CHX 3 R l - CALLING ARGUMENT FOR SUBROUTINE CHRTE REPRESENTING EITHER CHXN OR CHXY
CHXN* 3 R 15 - VALUE USED IN MUSKINGUM METHOD OF CHANNEL
CHXY* 3 R CI 2 R
Cl 8 R
CIN* B R CK 3 R
Cl B R CLEN* B R
CLOC B R
CLRBOT 3 R
CLSF* B R Cl UT B R
CMD 3 R
CMl 3 R
CM2 3 R
COEFDM* B R
15 l
1
l I
l 1
V, 5
l
l l
l
1
l
l
ROUTING IN UNIMPROVED CHANNELS, EXPRESSING THE RELATIVE IMPORTANCE OF INFLOW ANO OUTFLOW IN DETERMINING STORAGE
- SAME AS CHXN BUT F(R IMFROVED CHANNELS - VALUE Of c FOR DOWNSTREAM sue~ATERSHEO IF CHANNEL
IS IMPROVED IN UPSTREAM SUBWATERSHED FOR WHICH DOWNSTREAM COSTS ARE BEING CALCULATED
- VALUE OF C ROUNDED TO THE NEXT LOWER DECILE FOR THE PURPOSE CF INTERFCLATICN
S COST PER DRAINAGE INLET CF AN INDEX CF VELOCITY ~EAD PLUS HEAD LOSS FOR FLOW
IN EMERGENCY SPILLWAY S/YR COST OF LANO USE ADJUSTMENT MEASURES
$/AC/YR ADMINISTRATIVE COST OF LAND USE RESTRICTION $/AC/YR LOCATION COST WITHIN SUBWATERSHED CF FIRST
SUBSCRIPT IN STAGE OF SECOND SUBSCRIPT FT THE ELEVATION 5 FT EELCW TOP OF PERMANENT POOL
ABOVE WHICH VEGETATIVE GROWTH MUST BE CLEARED FRCM THE RESERVOIR SITE
$/SF UNIT COST CF TRAPEZOIDAL PNEUMATIC LINING $/AC/YR PRELIMINARY ESTIMATE OF LOCATION COST NOT
INCLUDING ADMINISTRATIVE COST - MUSKINGUM ROUTING CONSTANT MULTIPLIED BY END CF
PER !OD INfLOW - MUSKINGUfi ROUTING CCNSTANT MULTIPLIED BY
BEGINNING Of PERIOD INFLOW MUSKINGUM ROUTING CONSTANT MULTIPLIED BY BEGINNING CF PERIOD OUTFLOW
$/FT/$ URBAN STRUCTURAL FLCOO DAMAGE PER FOOT OF FLOOD DEPTH PER DOLLAR OF MARKET VALUE OF BUILDING
- 261-

CONBOT* 3 R CONCl 3 R
CONC2 3 R
CONCB 3 R
CONCCH 3 R
CONC(Jl 3 R
CONCM 3 R
CONCST 3 R CONID 3 R
CONSTR 3 R
CONWAL* 3 R
1 FT TH[CKNESS OF CONCRETE CHUTE BOTTOM (FIG. Al 1 CY/FT VOLUME OF CONC~ETE PER LINEAR FOOT OF WALL OF
lcEIGHT WLHTl 1 CY/Fl VOLUME CF CONCRETE PER LINEAR FOOT Of WALL Of
HEIGHT WLHT2 l CY/FT VOLUME Cf CONCRETE FER LINEAR FOOT OF WALL OF
HEIGHT WLHTB l CY/FT VOLUME OF CONCRETE PER LINEAR FOGT
HEIGHT WLHTCH - (MEAN OF WLHTl ANO l CY/FT VOLUME OF CONCRETE PER LINEAR FOOT
HEIGHT IIIILHTDl
OF WALL CF WLHT D 11 OF WALL DF
l CY/FT VOLUME OF CCNDRETE PER LINEAR FOCT OF w•LL OF HEIGHT WLHTM
l l l
$ CONSTRUCTION COST OF DAM CY VOLUME OF CONCRETE IN IMPACT OISSIPATOR AF TOTAL STORAGE IN THE RESERVOIR TO THE TOP OF THE
FLCCD CONTROL POOL 25 CY/FT VOLUME OF RETAINING WALL CONCRETE FOR VARIOUS
WALL HEIGHTS COST 2 SUBROUTINE CALCULATES COSTS INCURRED IN DOWNSTREAM
SUBWATERSHEDS WHEN UPSTREAM SUBWATERSHEOS ARE CHANNELIZED. COST INCURRED IS ESTIMATED FROM COST WHICH WOULD BE REQUIRED TO ENLARGE DOWNSTREAM CHANNELS TO HANDLE THE INCREASE IN THE PEAK CF THE DESIGN FLOOD
COST CH COSTDM COSTFM
3 R 3 R 3 R
COSTFP 3 R
COSTFT 3 R
COSTSM 3 R
CP B R CPF BR
CPRSP 3 R CPRT 2 R
CRELO 3 R
CRELOC* 3 R
CRF BR
CRFSM BR
l 1 l
$/YR COST Of CHANNEL IMPROVEMENT $/YR COST OF DAM AND RESERVOIR $/YR TOTAL ECONOMIC COST (RESERVOIR AND FLOOD PLAIN)
ASSOCIATED WITH THE NOST ECONOMICAL RESERVOIR TRJEO THUS fAR
l $/YR TOTAL COST OF FLOOD PLAIN MEASURES AND RESIDUAL DAMAGES
1 $/YR TOTAL ECONOMIC COST ASSOCIATED WITH THE
l $/YR TOTAL ECONOMIC COST ASSOCIATED WITH THE TRIED
(RESERVOIR ANO FLOOD PLAIN! LAST RESERVOIR DESIGN TRIED (RESERVOIR ANO FLOOD PLAIN) RESERVOIR CURRENTLY BEING
l $/YR COST Of FLOOD PROOFING MEASURES 1 - FACTOR COMBINING TERMS USED IN COMPUTING THE
ANNUAL COST OF FLOOD PROOFING 1 $ CCST OF PRINCIPAL SPILLWAY l $/YR OOWNSTREAN COST INFLICTED BY UPSTREAM
CHANNELIZATION. LESSER OF INCREASED DOWNSTREAM OANAGES ANO COST Of IMPROVING DOWNSTREAM CHANNELS TO HANDLE INCREASED FLOW
1
25
l
1
$ COST Of RELOCATION MADE NECESSARY BY THE RESERVOIR AS INTERPOLATED FROM CRELGC ARRAY
$ RELOCATION COSTS AS DEPENDING ON WATER SURFACE ELEVATION
- UNIFORM SERIES CAPITAL RECOVERY DURATION TIME ANO DISCOUNT RATE
- UNIFORM SERIES CAPITAL RECOVERY - 262 -
FACTOR R FACTOR
FOR
FOR

CROW 3 R
CRR* B R CS BR
CSB 3 R CSL BR
CSM* BR
CSMD* 3 R
CSPL 3 R CSR BR
CSTLOW 3 R
CT BR
CTZ 3 R
CTBII* 3 R CTOT 3 R
CTOTl 3 R
CTOTZ 3 R
CTOTR* 3 R
CTT BR
CUBR
CUMVOD 3 R
CUMVCL* 3 R
CUZ BR
CWl 3 R
CW2 3 R
C WAL 3 R
DURATION 1IMST AND DISCOUNT RATER l $ COST OF RIGHT-O·F·-WAY PURCHASED FOR THE RESERVOIR
SITE l $/FT UNIT COST OF RAILRCAO BRIDGES l 1/YR COST OF CHANNEL IMPROVEMENT l S COST OF STILLING BASIN l $/YR COST OF BUILDING A NEW TRAPEZOIDAL LINED CHANNEL l - FACTOR MULTIPLIED BY CHANNEL CONSTRUCTION COS1
TO ACCOlNI FCR CONTINGENCIES l - FACTOR MULTIPLIED BY COST Of DAM AND RESERVOIR
TO INCLUDE CCNTINGENCIES l $ COST OF EMERGENCY SPILLWAY l $/YR COST OF BUILDING A NEW RECTANGULAR LINED CHANNEL l $ LEAST COST OF DAM FOR ANY EMERGENCY SPILLWAY
WIDTH TR I ED THUS FAR l $/YR TOTAL COST Of All MEASURES PLUS RESIDUAL FLOODING
FOR THE LEAST COST MEASURE COMBINATION FOUND SO FAR
l MI LENGTH OF IMPROVED CHANNEL DURING STAGE WITHIN TRIBUTARY AREA ADDEO BUT NOT ON MAIN LINE STREAM TAKEN FROM ARRAY CTOTR
l FT WIDTH OF CUTOFF TRENC~ BOTTOM (FIG. Bl 1 $ TOTAL INSTALLATION CCST OF DAM ANO RESERVOIR l $ FIRST SUBTOTAL Of CTOT VALUE, INCLUDING COSTS OF
CONSTRUCTION, ENGINEERING, AND CONTINGENCIES l $ SECOND SUBTOlAL OF CTOT VALUE, INCLUDING COSTS OF
RIGHT-OF-WAY, RIGHT-Of-WAY ACQUISITION, ANO RELOCAlICNS
15,5 MI ARRAY OF LENGTHS OF IMPROVED CHANNEL WITHIN TRIBUTARY AREA ADDED BUT NOT ON MAIN LINE STREAM - ONE VALUE fCR EACH SUBWATERSHED {FIRST SUBSORIPTI IN EACH STAGE !SECOND SUBSCRIPT)
l $/YR TOTAL COST OF All MEASURES PLUS RESIDUAL FLOODING FOR THE MEASURE COMBINATION CURRENTLY BEING TESTED
1 $/YR AVERAGE ANNUAL COST OF UNCERTAINTY AS CALOULJITED BY THE THOMAS UNCERTAINTY FUND METHOD
26 CFS CUMULATIVE RUNOFF ARRJIY FCR SPECIFIC DESIGN FREQUENCY AND KNOWN DEGREES OF CHANNELIZATION AND URBANIZATION - FLCW EIVEN IN CFS AS DEPENDING OF DURATION IN DAYS
26 CFS CUMULATIVE RUNOFF ARRAY FOR MEAN ANNUAL FLCW A~D O.O URBANIZATION ANO CHANNELIZATION - AVERAGE FLOW IN CFS BY DURATION IN DAYS
l $/YR VALUE OF CU WHILE CHANNEL IMPROVEMENT BY LINING IS BEING TRIED
l CY/FT WEIGHTED AVERAGE VOLUME Cf CHUTE WALlS UPSlREAM FRCM WLHTl (FIG. Al
l CY/Fl ll'EIGHTED AVERAGE V(LUl'E CF CHUTE WALLS BETWEEN Wl HT l AND W L HT O l ( F I G. A )
1 CY VOLUME OF CONCRETE IN EMERGENCY SPILLWAY WALLS - 263 -

ChEIR* 3 R CX* B
D* B R R
01 3 R
02 3 R
l - EMERGENCY SPILLWAY hEIR COEFFICIENT 1 $/CY UNIT COST OF CHANNEL EXCAVATION
3,V
l
1
- THE FRACTION OF THE fLCOD PLAIN IN THE SUBhATERSHED INDICATED BY THE SECCND SUBSCRIPT WITHIN THREE SOIL PRODUCTIVITY CLASSIFICATIONS
FT DEPTH OF FLCW COMING INTO HYDRAULIC JUMP IN STILLING BASIN
FT DEPTH OF FLOW AT AN INTERMEDIATE POINT IN THE EMERGENCY SPILLWAY
DAMBLD 3 SUBROUTINE DESIGNS AND DETERMINES THE CCST CF A DA~ DAMLNG 3 R l FT LENGTH OF CURRENT DAM SECTION FOR USE IN VOLUME
COMPUTATIONS DAMLTH 3 R 25 FT LENGTH OF DAM AT CORRESPONDING ELEVATION ELEVA DAMSIZ 3 SUBROUTINE DETERMINES DAM SIZE REQUIRED BY SPECIFIED NON
FLOOD CONTROL STORA.GE AND SPECIFIED DESIGN FLOOD FREQUENCY
DAMVOL 3 SUBROUTINE CO~PUTES QUANTITIES ASSOCIATED WITH DAM
DO* BR
DENOM 3 R
OF* BR
DfQR BR DFR 3 R
CK12* BR
DMAX B R
DMBN* 3 R
1
1
10
EMBANKMENT - FACTOR MULTIPLIED BY FLOOD PROOFING INSTALLATION
COST TO ACCCUNT FOR DESIGN AND CCNT ING ENC !ES HR DENOMINATOR OF THE FRACTIONS GIVING THE VALUES Of
CMO, CMl, AND CMZ IN THE MUSKINGUM CHANNEL ROUTING PROCEDURE
- THE FLOOD FREQUENCIES IN DECIMAL FORM CORRESPONDlNG TO LEVELS OF PROTECTION TO BE CONSIDERED FOR STRl.:CTURAL ANO NONSTRUCTURAL FLOOD CONTROL MEASURES BEGINNING WITH THE SMALLEST FLCCD
16 $ DAMAGE CAUSED BY Fl(OO OF SPECIFIED FREQUENCY 1 1/YR DESIGN FREQUENCY OF FLOOD AGAINST WHICH DAM IS
BEING DESIGNED TO FROTECT v
1
2, 10
FT MAXIMUM FLOOD DEPTH OCCURRING WITHIN SUBSCRIPTED SUBWATERSHEO CURING FLOOD WHOSE PEAK FLOW IS QK12
FT MAXIMUM FLOOD DEPTH CALSED BY FLCCD WHCSE DAMAGES ARE BEING ESTIMATED
$ DOWNSTREAM BENEFITS CFIRST ROW) AS A FUNCTICN Of FLOOD CONTROL STORAGE {SECOND ROWJ
OMBNF* 3 DMCOST 3 DMDTLS 3
R 5 - STAGE MULTIPLIERS FCR DOWNSTREAM BENEFITS DETERMINES THE COST CF THE DAM AND RESEflVD1R SUBROUTINE
L l
OMFRBD* 3 R
DMTPW* 3 R DNWS 3 R
DPRCKH* 3 R
DPRCKV* 3 R DPROCK 3 R
DPRP* 3 R DPRT 2 R
l
l 1
1
1 l 1 l
- LOGICAL VARIABLE SET TRUE TO CAUSE PRINTING OF DAM DETAILS
FT DAM FREEBOARD ABOVE PEAK CF EMERGENCY SPILLWAY FLOOD {FIG. Bl
FT WIDTH CF TOP OF DAM (FIG. Bl FT WATER SURFACE ELEVATICN DOWNSTREAM FRCM THE
STILLING BASIN (CHECKED TO MATCH TwELEVl FT DEPTH TO BEDROCK CN EMERGENCY SPILLWAY HILLSIDE
(FIG. Cl FT DEPTH TO BEDROCK UNDER DAM (FIG. Bl fl DEPTH TO BEDROCK FT DEPTH OF RIPRAP ON DAM FACE {FIG. Bl
$/YR INCREASE IN FLOOD DAMAGE WITH UPSTREAM - 264 -
•

0{;:CK 8 R
DRQ 3 R ORQA 3 R
DY 2 R
DZl BR DZ2 B R DZ3 BR DZL B R
EL 1 3 R Ell l 3 R
EL13 3 R
EL2 3 R EL3 3 R
EL4 3 R
ELOMTP 3 R ELEVA* 3 R
ELFB05 3 R
ELFB43 3 R
ELFCBG 3 R
ELG~ R
ELPEAK 3 R
ELPRFL 3 Jl ELRPBT 3 R
ELRPTP 3 R
CHANNELIZATICN OVER DAMAEE WITH NO UPSTREAM CHANNELIZATION'fN A GIVEN SUBWATERSHED (INCREASED FLUDD DAMAGE ATTRIBUTED TO SUBWATERSHED CHANNELIZATION)
16 - FREQUENCY OF !TOP FLOCDS USED IN CGMPUTING AVERAGE ANNUAL FLCCD DAMAGES
l CFS PRINCIPAL SPILLWAY DESIGN DISCHARGE l CFS AVERAGE DISCHARGE THROUGH PRINCIPAL SPILLWAY
DURING THE DESIGN fLCOD 1 $/YR INCREASE IN EXPECTED FLCCD DAMAGE CAUSED BY
UPSTREAM CHANNELIZATION INCLUDING UNCERTAINTY DAM·AGE
l FT MAXIMUM DEPTH CF FLOODING IN AREA All 1 FT MAXIMUM DEPTH OF FLOODING IN AREA AZ2 1 FT MAXIMUM DEPTH OF FLOODING IN AREA AZ3 1 FT DEPTH OF FLOODING AT CUTER BOUNDARY CF AREA IN
WHICH LAND USE IS RESTRICTED l FT ELEVATION CF TCP CF DIM IFIG. Cl l FT ELEVATION Of THE POINT Al WHICH THE EMERGENCY
SPILLWAY CUT SLCPE INTERSECTS THE UPHILL GROUND SURFACE !FIG. Cl
l FT ELEVATION OF THE POINT AT WHICH THE EMERGENCY SPILLWAY APPROtCH CHANNEL CUT SLOPE INTERSECTS THE UPHILL GROUND SURFACE (FIG. CJ
1 Fl ELEVATION Of EMERGENCl SPILLWAY CREST (FIG. Cl l FT ELEVATION CF EMERGENCY SPILUiAY APPROACr CHANNEL
BOTTOM (FIG. Cl l FT ELEVATION OF THE POINT AT WHICH THE EMERGENCY
SPILLWAY APPROACH CrANNEL CUT SLOPE INTERSECTS THE DOWNHILL GROUND SURFACE (FIG. CJ
1 FT ELEVATION OF DAM TCP {SAME AS TPELEVI 25 Fl ARRAY Of VALUES OF WATER SURFACE ELEVATIONS,
EACH OF WHICH HAS A KNOWN CORRESPONDING VALUE CF THE FOLLOWING: RESACR,LGDAM,LGEMSP,LGAPCH, CRELOC, HLSIDL, HLSIDM, ANO HLSIDH
l FT ELEVATION CF RESERVOIR WATER SURFACE AT BEGINNING OF 200-YEAR FLOOD
1 Fl ELEVATION OF RESERVOIR WATER SURFACE AT BEGINNING OF MEAN ANNUAL FLOOD
1 FT ELEVATION OF RESERVCIR WATER SURFACE AT BEGINNING CF DESIGN FLOOD
1 FT ELEVATION AT THE BCTTCM CF TrE SECTION CF RIPRAP ON THE CAM FACE WMJSE VOLUME IS BEING DETERMINED
1 FT PEAK WATER SURFACE ELEVATION REACHED AS A FLCOD IS ROUTED THROUGH TrE RESERVOIR
l FT ELEVATION CF PRINCIPAL SPILLWAY CREST (FIG. Bl l FT ELEVATION OF BOTTOM OF RIPRAP ON UPSTREAM FACE
OF DAM (FIG. Bl l FT ELEVATION OF TOP OF RIPRAP ON UPSTREAM FACE
OF DAM l FIG• B l - 265 -

ELSPFL 3 R l FT ELEVATION OF EMERGENCY SPILLWAY CREST (FIGS. A, B, Cl
ELSPTP 3 R 1 Fl ELEVATICN OF SAFETY FLCCC CREST (FIG. Bl ELT 3 R 1 Fl ELEVATION OF RESERVOIR WATER SURFACE AT
BEGINNING OF DESIGN FLOOD IF WEIR CONTROL ON PRINCIPAL SPILLWAY
ELT05 3 R l FT ELEVATION OF RESERVOIR WATER SURFACE AT BEGINNING OF 200-YEAR FLCOD IF WEIR CONTRCL ON PRINCIPAL SPILLWAY
ELT43 3 R l FT ELEVATION OF RESERVOIR WATER SURFACE AT BEGINNING OF MEAN ANNUAL FLCCD IF WEIR CONTROL ON PRINCIPAL SP ILL WAY
EMSPLG 3 R 1 FT LENGTH CF EMERGENCY SPILLWAY REQUIRED FOR GIVEN CONDITIONS AS INTERPCLATEO FROM ARRAY LGEMSP (FIG. Al
EMSPVL 3 SUBROUTINE DESIGNS .ANC CETERMll\ES QUANTITIES FOR THE EMERGENCY SPILLWAY
EREX 3 R 1 CY EMERGENCY SPILLWAY EARTH EXCAVATION ERROR 3 R l Fl ADJUSTMENT MADE TC 02 IN TRIII.L ANO ERROR
SOLUTION OF ENERGY EQUATION ESM* B R l - FACTCR MULTIPLIED EY Cl-'JINNEL CONSTRUCTION COST TO
ACCOUNT FOR DESIGN, ADMINISTRATION, AND SUPERVISION OF CONSTRUCTION
ESMO* 3 R l - FACTOR MULTIPLIED BY COST OF DAM ANO RESERVOIR TO INCLUDE COST OF ENGINEERING
F BR 1 - FREQUENCY AT WHICH FLOODING BEGINS IN THE SUBWATERSHED UNDER CCNSIDERaTlON e,sED ON THE EXISTING CHANNEL CAPACITY
F 3 R 28 CF INTERMEDiaTE VALUES IN SOLVING CUBIC ENERGY EQUATION AS APPLIED TO EMERGENCY SPILLWAY FLOW
FA BR l $/YR DAMAGE EXPECTED PER ACRE FROM WEIGHTED AVERAGE SOIL IN A YEAR WHEN THE CROPLAND JS FLOODED
FALL 3 R l FT THE APPROXIMATE FALL OF THE EMERGENCY SPILLWaY CHUTE BOTTOM TO POINT WHERE 02 IS BEING ESTIMATED
FD BR 1 FT FALL IN HYDRAULIC GRADIENT AT DESIGN DROP STRUCTURE
FD8 3 R 15 FT TOTAL FALL AT DROP STRUCTURES IN SUBSCRIPTED SUBWATERSHED ASSOCIATED WITH LEAST COST COMBINATION CF RESERVOIR STORAGE ANO DOWNSTREAM MEASURES TRIED THUS FAR
F09 3 R 15 FT TOTAL FALL OF OPTIMUM DROP STRUCTURES IN SUBSCRIPTED SUBWATERSHEO DOWNSTREAM FROM RESERVOIR STORAGE CURRENTLY BEING EVALUaTED
FDA BR V FT VALUES OF FD FOR DROP STRUCTURES IN SUBSCRIPTED SUB IIA T ER SHED
FOTEMF BR 1 FT VALUE OF FD FOR THE MOST ECONOMICAL CHANNEL IMPROVEMENT FOUND SC FAR
FIA* BR 1 $/AC/YR EXPECTED FARM INCOME FROM MOST PRODUCTIVE SOIL IF FLOODING DOES NOT OCCUR
FIB* 8 R 1 $/AC/YR EXPECTED FaRM INCOME FROM INTERMEDIATE SOIL IF FLOODING ODES NOT OCCUR
- 266 -

FIC* B R
FIF B R
FJ 3 R
FLDSTR 3 R FLO TRY 3 R
FLPL 1 3
FLPL2 3
FM* B fl
FMAX B R
FP* B R
FPCOST 3
FPIPE* 3 R FQ* 2 R
FRES 3 R FRNUM 3 R
FRU* B R
fl B R
FTOP B R
FUQ B R
l $/AC/YR EXPECTED Fil.RM INCOME FROM LEAST PRODUCTIVE SOIL IF FLOODING co~S N(T OCCUR
V f/AC/YR WEIGHTED AVERAGE FAPM INCOME FROM THE SOit TYPES IN SUBSCRIPTED SU8WATERSHED
1 - NUMBER Cf SIX-HOUR PERIODS CR DAYS UNTIL MAXIMUM FLDS1R IS REACHED IN RESERVOIR AS ESTIMATED FROM CUMULATIVE RUNOFF DATA
l AF RESERVOIR FLCOD STCfAGE (FIG. Bl l AF TRIAL VALUE OF FLOSTR WHILE SEEKING THE LARGEST
TO ESTIMATE FLDSTR FROM CUMULATIVE RUNOFF DATA l - COMMON STATEMENT CONTAINING All ARRAYS DEALING
WITH THE FtOUO PLAIN 1 - COMMON STATEMENT CONTAINING All SINGLE VALUE
VARIABLES DEALING WITH THE FLOOD PLAIN 1 - FACTOR MULTIPLIED BY CHANNEL EXCAVATION COST 10
ACCOUNT FOR RIPRAP AND SEEDING l - FRACTION OF STRUCTURAL MARKET VALUE DESTROYED BY
FLOODING TO A DEPTH DMAX l $/FT/$ COST OF FLCCD PRCCFING PEfl FOOT CF DESIGN FLOOD
DEPTH PER DOLLAR OF BUILDING MARKET VALUE SUBROUTINE DETERMINES THE OPTIMUM COMBINATION Of FLOOD
DAMAGE REDUCTION MEASURES FOR A GIVEN SUBWATERSHED-STAGE
l - DARCY FRICIICN FACTCR FOR PRINCIPAL SPILLWAY PIPE 25 - SUBSCRIPTED SUBWATERSHEO AVERAGE DESIGN FLOW FOR
CHANNEL IMPROVEMENTS AS A FRACTION OF THE FLOW AT THE MOUTH OF THE CHANNEL
l YR RETURN PERIOD OF RESERVOIR DESIGN FLOOD l - FROUDE NUMBER FOR FLOW IN EMERGENCY SPILLWAY
11 - FA{,TORS RELATING THE FRACTION OF THE CPEN LAND BEING FARMED TO THE FRACTION OF THE TOTAL LAND IN THE VICINITY IN URBAN DEVELOPMENT
1 FT TOTAL FALL PROVIDED BY ALL DROP STRUCTURES WITHIN THE SUB WAT ERSHE:D
1 - REDUCED VARIATE IN GUMBEL ANALYSIS Of THE RAREST OF THE ITOP Ft.COOS SPECIFIED IN DQCK( 161
l - FACTOR INIERPOLATED FROM ARRAY FRU RELATING THE FRACTION OF THE OPEN LAND BEING FARMED TO THE DEGREE OF URBANIZATION IN THE AREA WHERE THE FARM LAND IS LCCATEC
GA 8 R l S/FT/YR INCREASED FLOOD DAMAGE EXPECTED PER ACRE FROM WEIGHTED AVERAGE SOIL WHEN THE CROP IS FLOODED TO AN ADDITIONAL FOGT CF DEPTH
GBNF 3 R l S/YR STORED VALUE OF BNFDST POR CURRENTLY JUSTIFIED RESERVO!R SIZE WHILE A LARGER RESERVOIR IS BEING CONSIDERED
GCSTDM 3 R 1 $/YR STORED VALUE OF CDSTDM FOR CURRENTLY JUSTIFIED RESERVOIR SIZE WHILE A LARGER RESEl<VOIR IS BEING CDNSIDERED
GDELAY* 3 R 1 HR TIME AFTER BEGINNING OF STORM BEFORE FLOOD GATES ARE OPENED JG RELEASE FLOOD FLOWS
GDRQ 3 R 1 CFS STORED VALUE Of DRQ FOR CURRENTLY JlSTIFIED - 267 -

GELF05 3 R
GELF43 3 R
GELFOB 3 R
GELPRF 3 R
GELSPF 3 R
GFLOST 3 R
GOBIG 3 L
GOUTF 3 R
GRAOSP 3 R
GSF B R
GSTOR 3 R
H 8 R 1-10 8 R Hl 8 R
hA 8 R
HBRLM* 3 R
hBRMH* 3 R
HOPRSP 3 R HEB R
HETEMP B R
HL 11 3 R
1
l
1
l
l
1
1
25
1
l
25
1 l 1
1
l
1
1 1
1
1
RESERVOIR SIZE WHILE A LARGER RESERVOIR IS BEING CONSIDERED
FT STORED VALUE OF ELFB05 FOR CURRENTLY JUSTIFIED RESERVOIR SIZE WHILE A LARGER RESERVOIR IS BEJNG CONSIDERED
FT STORED VALUE OF ELFB43 FOR CURRENTLY JUSTIFIED RESERVOIR SIZE WHILE A LARGER RESERVOIR IS BEING CONSIDERED
FT STORED VALUE OF ELFOBG FOR CURRENTLY JUSTIFIED RESERVOIR SIZE WHILE A LARGER RESERVOIR IS BEING CONSIDERED
FT STORED VALUE OF ELPRFL FOR CURRENTLY JUSTIFIED RESERVOIR SIZE WHILE A LARGER RESERVOIR IS BEING CONSIDERED
FT STORED VALUE Of ELSPFL FOR CURRENTLY JUSTIFIED RESERVOIR SIZE WHILE A LARGER RESERVOIR IS BEING CONSIDERED
AF STORED VALUE Of FLDSTR FCR CURRENTLY JUSTIFIED RESERVOIR SIZE WHILE A LARGER RESERVOIR IS BEING COt,SIDEREC'
- TRUE IF EMERGENCY SPILLWAY TRIAL WIDTHS ARE INCREASING
CFS TOTAL OUTFLOW (PRINCIPAL AND EMERGENCY SPILLWAYS) UNDER HEAD INDICATED BY CORRESPONDING PCINT IN ELEVA WHEN PRINCIPAL SPILLWAY GATE IS BEING USED
- AVERAGE SLOPE OF THE EMERGENCY SPILLWAY (HORIZONTAL/VERTICAL I
- GRADIENT SERIES FACTCR FCR CONVERTING UNIFORMLY INCREASING GRADIENT SERIES TD EQUIVALENT UNIFORM ANNUAL SERIES FOR A DURATION TIME AND A DISCCUNT RATER
SFH S/T+0/2 TERM AS A FUNCTION CF WATER SURFACE ELE-VATION FOR RESERVOIR ROUTING WITH GATE BEING USED
Fl DEPTH OF FLOW IN DESIGN CHANNEL FT DEPTH OF FLOW IN EXISTING CHANNEL FT CHANNEL IS DESIGNEC BY INCREASING FLOW DEPTH IN
INCREMENTS AND DETERMINING CAPACITY. Hl IS THE VALUE Of HAT THE UPPER BOUND Of THE INCREMENT
- NUMBER OF HIGHWAY BRICGES HAVING ADEQUATE CAPACITY FOR THE DESIGN FLOW
FT ELEVATION OF LOWER BREAKPOINT GOVERNING CHOICE OF EMERGENCY SPILLWAY SITE
FT ELEVATION OF HIGHER BREAKPOINT GOVERNING CHOICE OF EMERGENCY SPILLWAY SITE
FT DESIGN PRINCIPAL SFILLWAY HEAD - NUMBER OF HIGHWAY BRIDGES THAT MUST BE MODIFIED
TO ACCOMMODATE CHANNEL DESIGN FLOW - VALUE OF HE FOR THE MOST ECONOMICAL CHANNEL
IMPROVEMENT FOUND SO FAR FT REFERENCE HORIZCNTAL DISTANCE TO THE UPHILL
CATCH POINT OF THE EMERGENCY SPU .. LkAY SIDE SLOPE (FIG. Cl
- 268 -
>
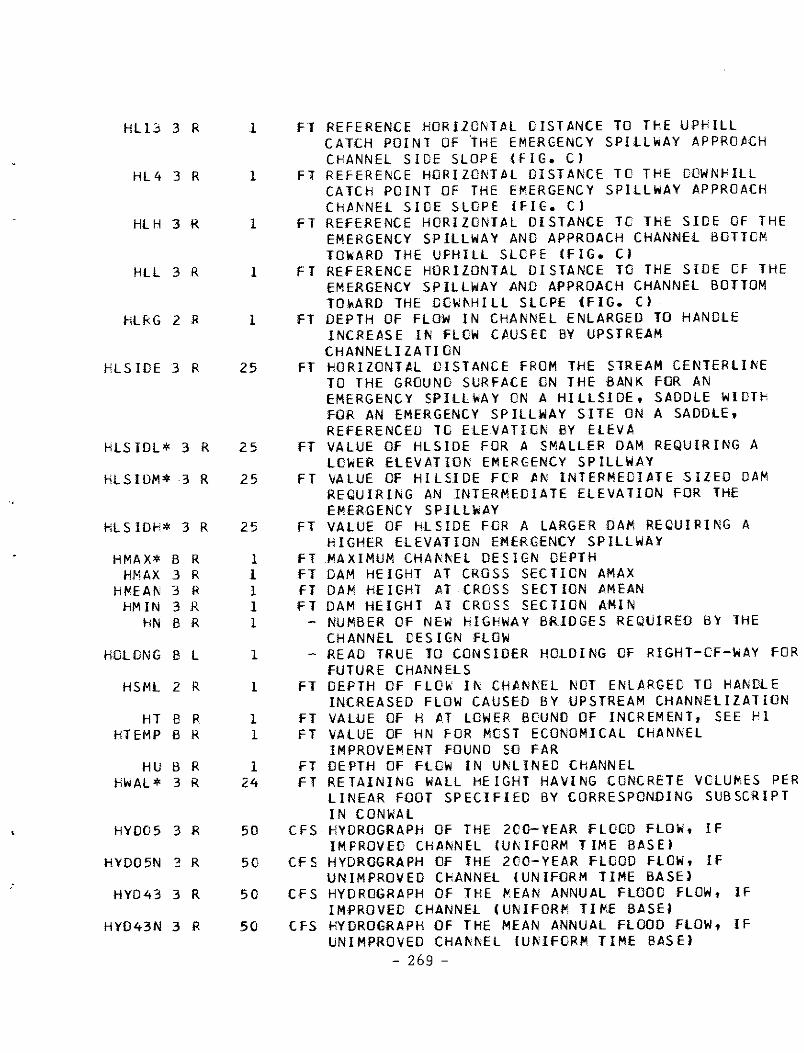
HL13 3 R
HL4 3 R
HLH 3 R
HLL 3 R
HLRG 2 R
1-iLSIDE 3 R
HLSIDL* 3 R
HLSIDM* 3 R
HLSIDH* 3 R
HMAX* B R HMAX 3 R
Hfll.EAN 3 R HM IN 3 R
HN BR
HOLDNG B L
HSMl 2 R
HT BR HTEMP BR
HU B R HWAL* 3 R
HYD05 3 R
HYD05N 3 R
HYD43 3 R
HYD43N 3 R
1
1
1
1
1
25
25
25
25
1 l 1 1 1
1
1
l 1
1 24
50
50
50
50
FT REFERENCE HORIZONTAL DISTANCE TO THE UPHILL CATCH POINl Of THE EMERGENCY SPILLWAY APPROACH CHANNEL SIDE SLOPE (FIG. CJ
fl REFERENCE HORIZCNTAL DISTANCE TO THE DOWNHILL CATCH POINT OF THE EMERGENCY SPILLWAY APPROACH CHANNEL SIDE SLOPE !FIG. Cl
FT REFERENCE HORIZONTAL DISTANCE TC THE SIDE OF THE EMERGENCY SPILLWAY AND APPROACH CHANNEL BOTTOM TOWARD THE UPHILL SLCFE (FIG. Cl
FT REFERENCE HORIZONTAL DISTANCE TO THE SIDE Of THE EMERGENCY SPILLWAY AND APPROACH CHANNEL BOTTOM TOWARD THE DCWI\HILL SLOPE (FIG. Cl
FT DEPTH OF FLOW IN CHANNEL ENLARGED TO HANDLE INCREASE IN FLOW CAUSED BY UPSTREAM
CH ANNE LIZA TI ON fl HORIZONTAL DISTANCE FROM THE STREAM CENTERLINE
TO THE GROUND SURFACE ON THE BANK FOR AN EMERGENCY SPILLWAY ON A HILLSIDE, SADDLE WIDTH FOR AN EMERGENCY SPILLWAY SITE ON A SADDLE, REFERENCED TO ELEVATION BY ELEVA
FT VALUE Of HLSIDE FOR A SMALLER DAM REQUIRING A LOWER ELEVATION EMERGENCY SPILLWAY
FT VALUE OF HILSIDE FCR AN INTERMEDIATE SIZED DAM REQUIRING AN INTERMEDIATE ELEVATION FOR THE EMERGENCY SPILLWAY
FT VALUE Of HLSIDE FOR A LARGER DAM REQUIRING A HIGHER ELEVATION EMERGENCY SPILLWAY
FT MAXIMUM CHANNEL DESIGN DEPTH FT DAM HEIGHT AT CROSS SECTION AMAX FT DAM HEIGHT AT CROSS SECTION AMEAN FT DAM HEIGHT Al CROSS SECTION AMIN
- NUMBER CF NEW HIGHWAY BRIDGES REQUIRED BY THE CHANNEL DESIGN FLOW
- READ TRUE TO CONSIDER HOLDING Of RIGHT-CF-WAY FOR FUTURE CHANNELS
FT DEPTH OF F LCW IN CHJI.NNEL NOT ENLARGE C TO HJINOL E INCREASED FLOW CAUSED BY UPSTREAM CHANNELIZATION
FT VALUE OF HAT LOWER BOUND OF INCREMENT, SEE Hl FT VALUE OF HN FOR MOST ECONOMICAL CHANNEL
IMPROVEMENT FOUND SO FAR FT DEFTH OF FLOW IN UNLINED CHANNEL FT RETAINING WALL HEIGHT HAVING CONCRETE VOLUMES PER
LINEAR FOOT SPECIFIED BY CORRESPONDING SUBSCRIPT IN CONWAL
CFS HYOROGRAPH OF THE 200-YEAR FLOOD FLOW, IF IMPROVED CHJINNEL (UNIFORM TIME BASE)
CFS HYDROGRAPH OF THE 200-YEAR FLOOD FLOW, If UNIMPROVED CHANNEL (UNIFORM TIME BASE)
CFS HYOROGRAPH OF THE MEAN ANNUAL FLOOD FLOW, IF IMPROVED CHANNEL (UNIFORM TIME BASE)
CFS HYOROGRAPH OF THE MEAN ANNUAL FLOOD FLOW, IF UNIMPROVED CHANNEL (UNIFORM TIME BASEi
- 269 -

HYOBAS* 3 R 5,21 - ARRAY INTO WHICH IS READ FIVE, 20 ELEMENT hYDRCGRAPHS {EXPRESSED AS FRACTIONS OF PEAK FlOWl ONE HYDROGRAPH FOR EACh OF ThE FOLLOWING CHARACTERISTIC SHAPES: SHARPER {COLUMN ll, SHARP {COLUMN2l, AVERAGE (COLUMN 31, FLAT (COLUMN 4), AND FLATTER {COLUMN 5)
HYDCOM 3 SUBROUTINE CONVERTS SUBWATERSHED TIME BASE HYDROGRAPH TO UNIFORM TIME BASE hYDROGRAPH ANO COMBINES WITH
HYDDS 3 R
HYDDSN 3 R
HYOEM 3 R
HYDIN 3 R HYO INT* 3 R
HYDLOC 3 R
HYDML T* 3 R HYDOUT 3 R
HVDTLS 3 L HYDTM 3 R
HYDTP 3 R
HYGRAF 3 R
HYIN 3 R
I B I 14 3 I
IA BR
18* 3 I l U B I IC 3 I
ICAP9 B l
ICOif BI
ID* 2 I
ID 3 l
IHE 8 1
50
50
50
20 1
l
1 50
l 20
20
50
50
1 l
MAIN LINE HYDROGRAPH ROUTED FROM UPSTREAM CFS hYDROGRAPH OF THE DESIGN FLOOD FLOW, IF IMPROVED
CHANNEL {UNIFORM TJME BASE) CFS HYOROGRAPH OF THE DESIGN FLOOD FLOW, IF
UNIMPROVED CHANNEL (UNIFORM TIME BASE) CFS EMERGENCY SPILLWAY FLOOD HYDROGRAPH (UNIFORM
TIME BASE I CFS LOCAL INFLCW HYDROGRAPh ,suewATERSHED TIME BASEi
HR TIME BETWEEN ELEMENTS IN UNIFORM TIME BASE STREAMFLOW HYDROGRAPHS
CFS HYDROGRAPH FLOW ELEMENT ON RECESSION CURVE AFTER BASIC CURVE HAS ENDED
- RATIO OF EMERGENCY SPILLWAY FLOW TO 200-VEAR FLOW CFS COMBINED {MAIN STREAM+ LOCAL INFLOW) HYDROGRAPH
(UNIFORM TIME BASE) - SET TRUE TO HAVE HYCRCLOGIC DETAILS PRINTED OUT
HR TIME TO POINTS ON LOCAL INFLOW HYOROGRAPH ISUeWATERSHEO TIME BASEi
CFS FLOW ELEMENTS FOR LCCAL INFLOW HYDROGRAPH ISUBWATERSHED TIME BASEi
CFS UNIFORM BASE TIME HYDROGRAPH ROUTED THROUGH A REACH OF CHANNEL BY THE MUSKINGUM METHOD
CFS UNIFORM TIME BASE HYDROGRAPH ENTERING CHANNEL REACH AS USED IN MUSKINGUM ROUTING
- LOOP COUNTER INDEX IN 00 STATEMENTS - STORED VALUE OF I, hOLDING THE SUBSCRIPl OF THE
ELEVA ELEMENT JUST BELOW THE DOWNHILL EDGE OF THE EMERGENCY SPILLWAY APPROACH CHANNEL
l $/AC/YR EXPECTED ANNUAL FARM INCOME FROM WEIGHTED AVERAGE SOIL IN A YEAR WHEN FLOODING DOES NOT OCCUR
l l 1 1
l
100
l
v
- INTEGER READ TO SET BLDNOW ll=TRUE, O=FALSEI - LOOP COUNTER INDEX IN OD sr1nEMENTS - LOWER END OF BRACKET IN TP FOR INTERPOLATION - NUMBER CF HIGHWAY BRIDGES BUILT OR ENLARGED SINCE
INITIAL INPUT DATA - TOTAL NUMBER OF HIGHWAY BRIDGES ENLARGED OR BUILT
DURING THE CURRENT STAGE - FOR EVERY SUBWATERSHED, THE IDENTIFYING NUMBERS
OF ALL DOWNSTREAM SUBWATERSHEOS - NUMBER OF ELEMENT IN CUMVOL CONTAINING VALUE AT
TIME IMPTY - NUMeER OF HIGHWAY BRIDGES EXTENDED IN SUBSCRIPTED
SUBWATERSHEO DURING A STAGE - 270 -
,

1HLD7 3 I 1 - STORED VALUE OF IHLO<; USED IN PRINTING RlGhT-OF-WAY HOLOING FOR.tHANNEL IMPROVEMENT OUTPUT
IHLDB 3 l 15 - VALUE OF !HOLD FOR ThE SUBSCRIPTED SUBWATERSHED FOR THE MOST ECONOMICAL COMBINATION CF RESERVOIR STORAGE AND CHANNEL IMPROVEMENT FOUND THUS FAR
JHLD9 3 I 15 - VALUE OF IHOLD FOR THE SUBSCRIPTED SUBWATERSHED FOR THE COMBINATION OF RESERVOIR STORAGE ANO CHANNEL IMPROVEMENT CURRENTLY UNDER ANALYSIS
IHN BI V - NUMBER OF NEW HIGHWAY BRIDGES BUILT IN SUBSCRIPTED SUBWATERSHED DURING A STAGE
!HOLD BI V - FOR THE SUBSCRIPTED SUEWATERSHED, THE NUMBER OF THE STAGE AT THE BEGINNING OF WHICH RIGHT-OF-WAY BEGAN TO BE HELO FOR FUTURE CHANNEL IMPROVEMENT
I I B I 1 - INDEX SET EQUAL TO l IF THE CHANNEL IN A GIVEN SUBWATERSHED IS NOT COMPLETELY IMPROVED AND SET EQUAL TO 2 IN CASE Of FULL IMPROVEMENT FOR DETERMINING WHICH RCW OF ARRAY QQ TO USE
Ill BI l - CURRENT VALUE OF LINING FOR USE IN A COMPUTED GO TO STATEMENT
IIS B I 1 - SUBSCRIPT OF NEXT FREC:UENCY IN ARRAY Df(NOFJ RARER THAN ONE FOR WHICH CHANNEL IMPROVEMENT IS CURRENTLY BEING ATTEMPTED, USED AS BEGINNING POINT FOR ANALYSIS OF FLOOD PROOFING AND LOCATION ALTERNATIVE
IL BI 1 - SUBSCRIPT OF FREQUENCY IN ARRAY DF(NDFI FOR WHICH A LAND USE RESTRICTION IS CURRENTLY BEING ATTEMPTED
IMAX* 3 I l - NUMBER CF ELEVATIONS USED IN INPUT CATA IMPROV e I V - INDEX SET EQUAL TO 1, 2, OR 3 FOR THE SUBSCRIPTED
SUBkATERSHED IF THE CHANNEL BEING CONSIDERED WAS UNCHANGED, INil!ALLY IMPROVED, CR ENLARGED RESPECTIVELY IN THE CURRENT STAGE
IMPTY* 3 I 1 DY NUMBER OF DAYS FLCCO STORAGE IS DETAINED IN THE RESERVOIR DURING THE DESIGN FLOOD
INDEX* 2 I 25,2 - THE FIRST AND LAST ELEMENTS IN ARRAY ID PERTAINING TO THE SUEWATERSHED INDICATED BY THE FIRST SUBSCRIPT
IP B I 1 - SUBCRIPT Cf FREQUEI\CY IN ARR,W DFINDFl FOR WHICH A FLOOD PROOFING DESIGN IS CURRENTLY BEING ATTEMPTED
lPP* BR 1 $/AC ANNUAL VALUE RECEIVED FROM THE AMENITIES OF OPEN SPACE EXPRESSED AS A MULTIPLE Of THE FRACTION OF ADJACENT LAND BEING URBAN
IRE BI V - NUMBER OF RAILROAD BRIDGES EXTENDED IN SUBSCRIPTED SUBWATERSHED DURING A STAGE
IRN BI V - NUMBER CF NEW RAILROAC BRIDGES BUILT IN SUBSCRIPTED SUBWATERSHED DURING A STAGE
IS BI 1 - SUBSCRIPT Of FREQUENCY IN ARRAY DFINDFI FOR kHICH A CHANNEL IMPROVEMENT DESIGN IS CURRENTLY BEING ATTEMPTED
IS 3 I 1 - NUMBER OF SELECTED EMERGENCY SPILLWAY SITE ISO 3 I l - NUMBER OF BEST EMERGENCY SPILLWAY SITE FOUND
- 271 -

ISG 3 I !STAGE 3 I
ISX BI ITEMP B I
ITOP B (
I UH B I
I UR B I
J B I Jl 3 I
JC 3 I
JH 2 I
JL 2 I
JU B I K B l
Kl B R
Kl 3 I
K2 B R
K2 3 I
K3 3 I
K4 3 I
K 5 3 I
KDf B I KDf-G 3 I
KNBOT 3 L
L B R
THUS FAR 1 - NUMBER OF TRIA[ EMERGENCY SPILLWAY SITE l - STAGE IN WHICH RESERVOIR WAS JUSTIFIED 1 - INDEX USED TO ADD 2 TO IS (FIRST DEFINITION) 1 VARIABLE ENTERING THE SUBWATERSHED-STAGE WITH
THE PERTAINING ELEMENT CF ARRAY IHOLD BUT SET TOO IF HOLDING NOT FOUND ADVANTAGEOUS
1 - NUMBER OF STORMS FCR WHICH FLOOD DAMAGES ARE ESTIMATED TO ESTABLISH AVERAGE •NNUAL FLOOD DAMAGES
1 - NUMBER OF HIGHWAY BRIDGES REMAINING UNCHANGED THROUGH THE CURRENT STAGE
1 - NUMBER OF RAILROAD BRIDGES REMAINING UNCHANGED THROUGH THE CURRENT STAGE
1 - LOOP COUNTER INDEX lN DO STATEMENTS l - SUBSCRIPT FOR QQ ARRAY TO DETERMINE WHICH ROW
SHOULD BE USED - l FOR UNIMPROVED AND 2 FOR IMPROVED CHANNELS
1 - VALUE OF IC+l IOR IC lf IC=ll) USED IN INTERPOLATING RELATIVE TIME-TO-PEAK FOR A SUBWATERSHED FROM TP ARRAY
l - POINT IN ARRAY ID WHERE NUMEER CF MOST DOWNSTREAM ON LINE SUBWATERSHED OCCURS
1 - POINT IN ARRAY ID WHERE NUMEER OF MOST UPSTREAM ON LINE SUBWATERSHED OCCURS
l - LOOP COUNTER INDEX IN 00 STATEMENT l - LOOP COUNTER INDEX IN DO STATEMENT v - ARRAY CONTAINING FOR THE SUBSCRIPTED suewATERSHED
THE RATIO Of MAXIMUM DEPTH OF FLOODING ANYWHERE IN THE FLOOD PLAIN TC THE CORRESPONDING FLOOD FLOW (IN EXCESS OF THE CHANNEL CAPACITYI TO THE 0.375 POWER
l - LOOP COUNTER FOR DEVELCFING VERY SHARP MEAN ANNUAL HYOROGRAPH
v AC/FT ARRAY CONTAINING FOR Tl'E suesCRIPTED SUBWATERSHED THE RATIO OF ACRES FLCCDEO TO THE CORRESPONDING MAXIMUM FLOODING DEPTH
1 - LOOP COUNTER FOR BRACKETING SHARPNESS Of SYNTHESIZED MEAN ANNUAL HYDROGRAPH IN HYDBAS
l - LOOP COUNTER FOR DEVELOPING BRACKETED MEAN ANNUAL HYDRCGRAPH
l - LOOP COUNTER FOR DEVELOPING VERY FLAT MEAN ANNUAL HYDROGRAPH
l - LOOP COUNTER FOR SETTING TIME TC EACH POINT ON SYNTHESIZED MEAN ANNUAL HYDROGRAPH
1 - LOCP COUNTER FOR C:OIN( THROUGH ARRAY OF 1 - VALUE OF KDF ASSOCIATED WITH OPTIMUM RESERVOIR
FLOOD STORAGE CAPACITY l - SET TRUE TO INDICATE THAT THE VALUE FOR BOTTOM
HAS BEEN ESTABLISHED l - THE OESI(N FREQUENCY REPRESENTING THE LEVEL OF
PROTECTION TO BE PROVIDED BY THE DEGREE OF LAND - 272 -

.\ " '
Ll* B I l l 3 I
l2* B I l2 3 I
L3* B I l3 3 I
L4* BI L4 3 I
LS* BI l6* B I L7* B I L 8* 3 I L9* 3 I
L 10* 3 I Lll* 3 I
LAB R
LACRE 2 R LC* B R LCB 3 I
LC9 3 I
LOF 3 I
LF* 2 R
LG 8 L
LGAPCH* 3 I
LGDAM* 3 I
LGEMSP* 3 I
LGTEMP BI
LINED BL
LINEX 8 t
1 1
l l
1 1
1 l
1 l 1 1 l 1 1 l
l v
15
15
1
1
1
25
25
25
1
1
1
USE RESlRICTION UNDER ANALYSIS - INTEGER READ TO SET u~c (l=TRUE, O=FALSEl - LOOP COUNTER FOR DEVEL(PING VERY SHARP 200-YEAR
hYUROGRAPH - INTEGER READ TO SET PTf {l=FALSE, O=TRUEl - LOOP COUNTER FCR BRACKETING SHARPNESS OF
SYNTHESIZED 200-YEAR HYDROGRAPH IN HYCBAS - INTEGER READ TO SET LTF (l=FALSE, O=TRUEl - LOOP COUNTER FOR DEVELOPING BRACKETED 200-YEAR
HYDROGRAPh - INTEGER READ TC SET STF tl=FALSE, O=TRUE l - LOOP COLNTER FOR DEVELOPING VERY FLAT 200-YEAR
HYOROGRAPH - INTEGER READ TO SET TRACE ll=TRUE, O=FALSEI - INTEGER READ TO SET CHECK ll=TRUE, O=FALSEl - INTEGER READ TO SET HOLDNG (l=TRUE, O=FALSEJ - INTEGER READ TO SET DMDTLS (l=TRUE, O=FALSEl - INTEGER READ TO SET HYOTLS (l=TRUE, O=fALSEl - INTEGER READ TO SET LOOPTR ll=TRUE, O=fALSE) - INTEGER READ TC SET NODAM (l=fALSE, O=TRUE) - FACTOR FOR ESTIMATING COST OF LOCATION
RESTRICTION BY MULTIPLYING BY Q**0.375 AC THE AREA Of RESTRICTED LAND USE MI CHANNEL LENGTH WITHIN SUBSCRIPTED SUBWATERSHEO
- VALUE CF LDC FOR THE LEAST CCST COMBINATION OF RESERVOIR STORAGE ANO CHANNEL IMPROVEMENT FOUND THUS FAR VAtUE CF LCC FOR THE COMBINATION OF RESERVOIR STORAGE ANO CHANNEL IMPROVEMENT CURRENTLY UNDER ANALYSIS
- SUBSCRIPT USED AS A DO STATEMENT LCOP CCNTROL INDEX { 1 TO NOf} INDICATING WHICH VALUE OF OF IS TO BE PRINTED BY STROUT
- MULTIPLE OF LAND USE ADJUSTMENT COST TO BE USED FOR SENSITIVITY STUDIES
- SET TRUE If LOCATION RESTRICTION MEASURES HAVE PROVED ECONOMICAL DURING THE CURRENT SU8WATERSHEO STAGE
FT LENGTH OF EMERGENCY SPILLWAY APPROACH CHANNEL REQUIRED FOR THE CORRESPONDING SUBSCRIPTED VALUE OF ELEVA
FT LENGTH OF DAM REQUIRED FOR THE CORRESPONDING SUBSCRIPTED VALUE CF ELEVA
fl LENGTH OF EMERGENCY SPILLWAY REQUIRED FOR THE CORRESPONDING SUBSCRIPTED VALUE OF ELEVA
- VALUE OF LINING FOR THE MOST ECONOMICAL CHANNEL IMPROVEMENT FOUND SO FAR
- SET TRUE IF THE CAPACITY OF THE CHANNEL IN THE SU8WATERSHEO BEING CONSIDERED CAN BE MORE ECONOMICALLY INCREASED BY LINING THAN BY ENLARGING
- SET TRUE IF LINED IS TRUE BUT MAY BE SET BACK TO - 273 -

LINING* BI
LL B L
LLL 2 L
ua 3 1
LN8 3 I
LN9 3 I
LOC B l
LOOPTR 3 L
LTA BI
L TB B I
LTF BL
M B I Ml 3 I
v
l
l
l
15
15
v
l
l
1
l
1 1
FALSE IF INCREASING THE CAPACITY BY LINING DOES NOT PROVIDE THt.OPTIMUM LEVEL OF PROTECTION FOR A STILL LARGER DESIGN FLCOO
- FOR THE SUBSCRIPTED SUBhATERSHEO, A VALUE INDICATING THE CHANNEL TYPES TO BE CONSIDERED FOR CHANNEL Il<PRCVEMENT AS FCLLOWS: 0 - CONSIDER ALL CHANNEL TYPES, l - CONSIDER ONLY UNLINED CHANNELS, 2 - CONSIDER ONLY UNLINED CHANNELS WITH DROP STRUCTURES, 3 - CONSIDER ONLY TRAPEZOIDAL PNEUMATICALLY LINED CHANNELS, 4 - CONSIDER ONLY REINFORCED CCNCRETE RECTANGULAR CHANNELS. ONCE A CHANNEL IS CONSTRUCTED, THAT TYPE IS FIXED FOR ALL LATER ANALYSES EXCEPT FOR POSSIBLE ADDITION CF DROP STRUCTURES
- SET TRUE TO ELIMINATE LANO USE MEASURES FROM FURTHER CCNSIOERATION IN A SUBWATERSHEO-STAGE WHERE IT HAS NO HOPE OF PROVING ECONOMICAL
- SET TRUE WHEN CHANNEL IS BEING DESIGNED FOR THE LARGER OF lHE TWO FLCWS USED TO ESTIMATE DOWNSTREAM COSTS
- STORED VALUE OF LN9 USED IN PRINTING CHANNEL IMPROVEMENT OUTPUT
- TYPE OF CHANNEL LINING FOR THE SUBSCRIPTED SUEWATERSHEC FCR THE LEAST COST COMBINATION OF RESERVOIR STORAGE At,,D CHANNEL IMPROVEMENT FOUND THUS FAR
- TYPE OF CHANNEL LININ!: FOR THE SUBSCRIPTED SUBWATERSHEO FOR THE COMBINATION OF RESERVOIR STORAGE AND CHANNEL IMPROVEMENT CURRENTLY UNDER ANALYSIS
- THE NUMBER OF THE STAGE SINCE THE BEGINN1NG Of WHICH LAND USE ADJUSTMENT HAS BEEN CONTINUOUSLY IMPLEMENTED IN THE SUBSCRIPTED suewATERSHEO. EQUAL TO -1 IF IT JS NOT CURRENTLY BEING IMPLEMENTED
- SET TRUE TO HAVE THE PROGRAM PRit,,T ITS ENTRY INTO AND EXIT FROM EACH SUBROUTINE
- USEO IN CALCULATING RIGHT-Of-WAY CCST ANO SET EQUAL TO THE STAGE AT THE BEGINNING OF WHICH THE LANO FOR RIGHT-Of-WAY WAS OBTAINED, EITHER THE CURRENT STAGE CF THE ST AGE IN WHICH HOLDING BEGAN
- US ED IN CAL CUL AT ING RIGHT-Of-WAY COSl ANO SET EQUAL TO THE STAGE AT THE BEGINNING Of WHICH THE URBAN BUILDINGS WOULD BE LOCATED ON THE RIGHTOF-WAY, THE NUMBER OF THE STAGE IN WHICH HOLDING BEGAN, LAND USE ADJUSTMENT WAS IMPLEMENTED, OR THE PRESENT STAGE, WHICHEVER CAME FIRST
- SET TRUE TO ELIMINATE LAND USE RESTRICTION FROM CONSIDERATION IN PLANNING
- LOOP COUNTER INDEX IN GO STATEMENTS - LOOP COUNTER FCR DEVELOPING VERY SHARP RESERVOIR
- 274 -

M2 3 I 1
M3 3 I 1
M4 3 I 1
MS 3 I 1
MANNR* BR 1
MANNT* 8 R l
MANNU* 8 R l
MCH* BR 1
MDAM* 3 R 1
MF P* B R l
MIN* B R l
MN 8 I l
l'R 3 I 1
MROF* 3 1 1
MTLCh* 8 R l
MI-<* 8 I l N 2 I l
Nl 3 I 1
NBR 8 I l NO 8 I & R l
NOS 3 I 15
ND9 3 £ 15
NOf-* B I l
N OF f B I l NCT 8 I V
DE5IGN HYORCGRAPH - LOCP COUNTER FOR BRACKETING SHARPNESS OF SYNTHE
SIZED 200-YEAR RESERVOIR DESIGN HYDROGRAPH LOOP COUNTER FCR DEVELOPING ERACKETED RESERVOIR DESIGN HYDROGRAPH
- LCCP COUNTER FCR CEVELOPING VERY FLAT RESERVOIR DESIGN HYDROGRAPH
- LOOP COUNTER FOR ZEROING VESTIGIAL RESERVOIR DESIGN HYDROGRAPH
- VALUE OF MANNINGS ''N" FOR RECTANGULAR LINED CHANNELS
- VALUE OF MANNINGS ''Nfl FOR FOR TRAPEZOIDAL PNEUMATICALLY LINED CHANNELS
- VALUE CF MANNI~GS •N• FOR PRISMATIC UNLINED CHANNELS
- ANNUAL MAINTENANCE COST OF EARTH CHANNELS AS A FRACTION Cf FIRST CCST
- ANNUAL MAINTENANCE COST FOR THE DAM AND RESERVOIR AS A FRACTION CF CCNSTRUCTION COST A FRACTION CF CCNSTRUCTICN CCST
- ANNUAL MAINTENANCE COST Of FLOOD PROOFING MEASURES AS A FRACTION OF FIRST COST
- ANNUAL MAINTENANCE COST Cf CONCRETE STRUCTURES AS A FRACTION OF FIRST COST
- INTERMEDIATE VARIAELE EXPRESSING THE CURRENT VALUE Of LDC
- NUMBER OF ELEMENT IN Df CONTAINING SECOND RE~ERVOIR DESIGN FLCCO FREQUENCY
- NUMBER OF THE ELEMENT IN ARRAY Of CONTAINING MINIMUM RESERVOIR CESIGN FLOOD FREQUENCY
- ANNUAL MAINTENANCE COST CF TRIPEZCICAL LINEC CHANNELS AS A FRACTION Of FIRST COST
- NUMBER OF SUEWATERSHEDS TO BE ANALYZED - CURRENT VALLE OF INDEX - LOOP COUNTER FOR flNOING PEAK ELEMENT IN BASIC
HYDROGRAPH - NUMBER OF HIGHkAY BRIDGES WITHIN A SUBk,TERSHEO - NUMBER CF ORCP STRUCTURES WITHIN A SUBWATERSHED
DESIGN CHANNEL - NUMBER OF DROP STRUCTURES IN THE SUBSCRIPlEO
suewATERSHEC FOR ThE MOSl ECONOMICAL COMBINATION CF RESERV01R STORAGE ANO CHANNEL IMPROVEMENT FOUND THUS FAR
- NUMBER CF CROP STRUClURES IN THE SUBSCRIPTED SUBWATERSHED FOR THE COMBINATION CF RESERVOIR STORAGE ANO CHANNEL IMPROVEMENT CURRENTLY UNDER ANALYSIS
- NUMBER OF DESIGN FLCCD FREQUENCIES TO BE CONSIDER EC
- CURRENT VALUE CF NSTEMX + l - NUMBER CF DROP STRUCTURES WITHIN THE SUBSCRIPTED
SUBWATERSHEO - 275 -
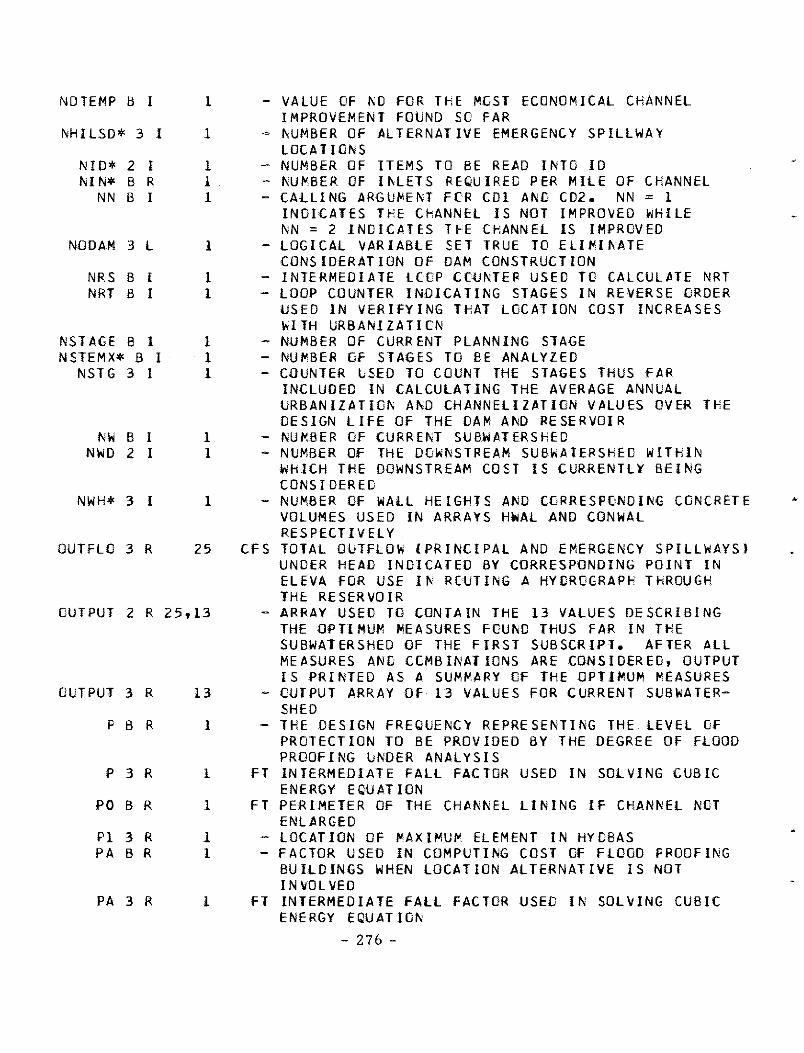
NDTEMP B I 1
NHILSD* 3 I 1
NI O* 2 I 1 NIN* B R 1
NN BI l
NODAM 3 L l
NRS B I 1 NRT B I 1
NSTAGE BI l NSTEMX* B I 1
NSTG 3 I 1
NW B I 1 NWO 2 I 1
NWH* 3 I 1
OUTFLO 3 R 25
OUTPUT 2 R 25,13
OUTPUT 3 R 13
P B R 1
P 3 R 1
PO B R 1
Pl 3 R l PA B R 1
PA 3 R l
- VALUE OF NO FOR THE MGST ECONOMICAL CHANNEL IMPROVEMENT FOUND SC FAR
- NUMBER OF ALTERNATIVE EMERGENCY SPILLWAY LOCATIGNS
- NUMBER OF ITEMS TO BE READ INTC ID - NUMBER CF INLETS REQUIRED PER MILE OF CHANNEL - CALLING ARGUMENT FOR COl ANO co2. NN = 1
INDICATES THE CHANNEL IS NOT IMPROVED WHILE NN = 2 INDICATES TFE CHANNEL IS IMPROVED
- LOGICAL VARIABLE SET TRUE TO ELIMINATE CONSIDERATION OF DAM CONSTRUCTION
- INTERMEDIATE LCCP COUNTER USED TC CALCUUHE NRT - LOOP COUNTER INDICATING STAGES IN REVERSE ORDER
USED IN VERIFYING THAT LOCATION COST INCREASES WITH URBANIZATION
- NUMBER OF CURRENT PLANNING STAGE - NUMBER OF STAGES TO BE ANALYZED - COUNTER USED TO COUNT THE STAGES THUS FAR
INCLUDED IN CALCULATING THE AVERAGE ANNUAL URBANIZATION AND CHANNELIZATION VALUES OVER THE DESIGN LIFE OF THE DAM ANO RESERVOIR
- NUMBER OF CURRENT SUBWATERSHED - NUMBER OF THE DGWNSTREAM SUBWATERSHED WITHIN
WHICH THE DOWNSTREAM COST IS CURRENTLY BEING CONSIDERED
- NUMBER OF WALL HEIGHTS ANO CORRESPONDING CONCRETE VOLUMES USED IN ARRAYS HWAL AND CONWAL RESPECTIVELY
CFS TOTAL OUTFLOW {PRINCIPAL ANO EMERGENCY SPILLWAYS) UNDER HEAD INDICATED BY CORRESPONDING POINT IN ELEVA FOR USE IN RCUTING A HYDROGRAPH THROUGH THE RESERVOIR
- ARRAY USED TO CONTAIN THE 13 VALUES DESCRIBING THE OPTIMUM MEASURES FOUND THUS FAR IN THE SUBWATERSHED OF THE FIRST SUBSCRIPT. AFTER ALL MEASURES AND COMBINATIONS ARE CONSIDERED, OUTPUT IS PRINTED AS A SUMMARY OF THE OPTIMUM MEASURES
- CUTPUT ARRAY Of 13 VALUES FOR CURRENT SUBWATERSHED
- THE DESIGN FREQUENCY REPRESENTING THE LEVEL OF PROTECTION TO BE PROVIDED BY THE DEGREE OF FLOOD PROOFING UNDER ANALYSIS
FT INTERMEDIATE FALL FACTOR USED IN SOLVING CUBIC ENERGY EQ-UAT ION
FT PERIMETER OF THE CHANNEL LINING IF CHANNEL NOT ENLARGED
- LOCATION OF MAXIMUM ELEMENT IN HYDBAS - FACTOR USED IN COMPUTING COST OF FLOOD PROOFING
BUILDINGS WHEN LOCATION ALTERNATIVE IS NOT INVOLVED
FT INTERMEDIATE FALL FACTOR USED IN SOLVING CUBIC ENERGY EQUATION
- 276 -
•
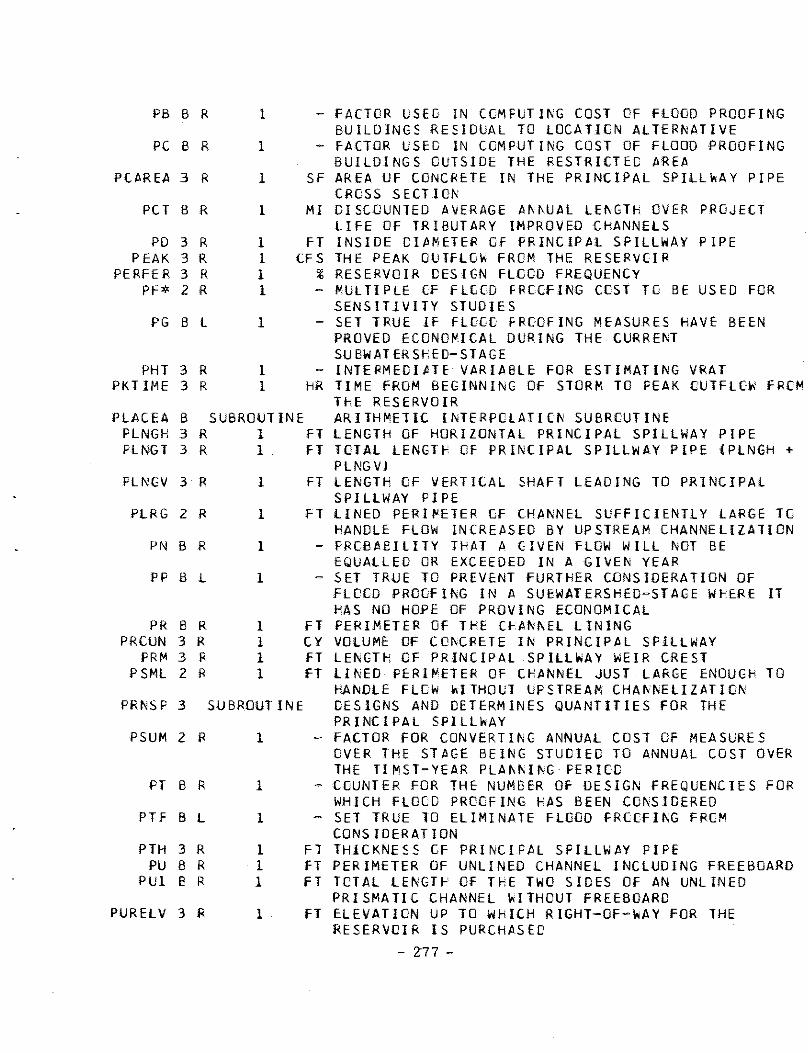
PB B R
PC B R
PCAREA 3 R
PCT BR
PD PEAK
PERFER PF*
3 R 3 R 3 R 2 R
PG BL
PHT 3 R PKTIME 3 R
1
1
l
l
1 1 1 l
1
1 l
- FACTOR USEC IN CCMFUTING COST CF FLOOD PROOFING BUILDINGS RESIDUAL TO LOCATION ALTERNATIVE
- FACTOR USEC lN COMPUTING COST OF FLOOD PROOFING BUILDINGS OUTSIDE THE RESTRICTED AREA
SF AREA OF CONCRETE IN THE PRINCIPAL SPILLhAY PIPE CROSS SECT ION
Ml DISCOUNTED AVERAGE ANiUAL LENGTH OVER PROJECT LIFE OF TRIBUTARY IMPROVED CHANNELS
FT INSIDE DIAMETER CF PRINCIPAL SPILLWAY PIPE CFS THE PEAK DUTFLCW FROM THE RESERVOIR
I RESERVOIR DESIGN FLOOD FREQUENCY - MULTIPLE CF FLCCD FRCCFING CCST TC BE USED FOR
SENSITIVITY STUDIES - SET TRUE IF FLCCC FRCCFING MEASURES HAVE BEEN
PROVED ECONOMICAL DURING THE CURRENT SU BWAT ER SHED-ST AGE
- INTERMEDIATE VARIABLE FOR ESTIMATING VRAT HR TIME FROM BEGINNING OF STORM TO PEAK CUTFLCW FRCM
THE RESERVOIR PLACEA
PLNGH PLNGT
B SUBROUlINE ARITHMETIC INTERPOLATION SUBROUTINE 3 R 1 Fl LENGTH OF HORIZONTAL PRlNCIPAL SPILLWAY PIPE
TOTAL LENGTH CF PRINCIPAL SPILLWAY PIPE CPLNGH + PLNG VJ
3 R l FT
PLNGV 3 R
PLRG 2 R
PN BR
PPB L
PR BR PRCON 3 R
PRM 3 R P SML 2 R
PRNSP 3
PSUM 2 R
FT B R
PTF BL
PTH 3 R PU B R
PUl BR
PURELY 3 R
l
1
l
1
1 1 1 1
SUBROUT !NE
1
1
1
l 1 1
l
FT LENGTH OF VERTICAL SHAFT LEADING TO PRINCIPAL SPILLWAY PIPE
FT LINED PERI,ETER CF CHANNEL SUFFICIENTLY LARGE TO HANDLE FLOW INCREASED BY UPSTREAM CHANNELlZAlION
- FROBABILITY THAT A GIVEN FLDW WILL NOT BE EQUALLED OR EXCEEDED IN A GIVEN YEAR
- SET TRUE TO PREVENT FURTHER CONSIDERATION OF FLOCD PROOFING IN A SUBWATERSHED-STAGE WHERE IT HAS NO HOPE OF PROVING ECONOMICAL
FT PERIMETER OF THE CHANNEL LINING CY VOLUME OF CONCRETE IN PRINCIPAL SPILLWAY FT LENGTH OF PRINCIPAL SPILLWAY WEIR CREST FT LINED PERIMETER OF CHANNEL JUST LARGE ENOUGH TO
HAJl<OLE FLCW WITHOUl UPSTREAM CHANNELIZATION DESIGNS AND DETERMINES QUANTITIES FOR THE PRINCIPAL SPILLWAY
- FACTOR FOR CONVERTING ANNUAL COST OF MEASURES OVER THE STAGE BEING STUDIED TO ANNUAL COST OVER THE TIMST-YEAR PLANNING PERIOD
- COUNTER FOR THE NUMBER OF DESIGN FREQUENCIES FOR WHICH FLOCD PROCFIN( HAS BEEN CONSIDERED
- SET TRUE 10 ELIMINATE FLOOD PROOFING FRCM CONSIDERATION
Fl THICKNESS CF PRINCIPAL SPILLWAY PIPE FT PERIMETER OF UNLINED CHANNEL INCLUDING FREEBOARO FT TOTAL LENGTH OF THE TWO SIDES OF AN UNLINED
PRISMATIC CHANNEL WITHOUT FREEBCARD FT ELEVATION UP TO WHICH RIGHT-OF-WAY FOR THE
RESERVOIR IS PURCHASED - Z77 -

PUT BR l
PWF B R l
PWFAC 2 R 1
PL<lFR 3 R l
Q B R 1 Q 3 R l
QO* BR V
QOS* B R 11,11
QOSN 3 R l
QOSY 3 R l Ql B R 1
Q2 BR l
C3 B R 1
Q4 B R 1
Q43* B R 11.11
Q43N 3 R 1
Q43Y 3 R l
QS BR l
Q6 BR 1
Q7 3 R l
QB 3 R 15
Q<;; 3 R 15
- DISCOUNTED AVERAGE ANNUAL TRIBUTARY URBANIZATION OVER PROJECT LIFE
- SINGLE PAYMENT PRESENT WORTH FACTOR FOR DURATION TIME AND DISCOUNT RATE RPI
- SINGLE PAYMENT PRESENT WORTH FACTOR FOR DURATION XlIHE*TIME ANO DISCOUNT RATER
- SINGLE PAYMENT PRESENT WORTH FACTOR FOR A DURATION TIME ANO DISCOUNT RATER
CFS WEIGHTED AVERAGE DESIGN FLOW FOR THE SUEWATERSHED CFS PRINCIPAL SPILLWAY DESIGN FLOWRATE CFS EXISTING CHANNEL CAPACITY FOR SUBSCRIPTED
SUB WATER SHED - ARRAY INTO WHICH IS READ THE RELATIONSHIP
EXPRESSING THE MAGNITUDE OF THE 200-YEAR FLOOD OVER ONE SQUARE MILE AS A FUNCTION CF TRIBUTARY CHANNELIZATION AND URBANIZATION
CFS 200-YEAR FLOCO PEAK IF LOCAL CHANNEL IS NOT IM PROVED
CFS 200-YEAR FLOOD PEAK IF LOCAL CHANNEL IS IMPROVED CFS EXPECTED FLOW CF GIVEN FREQUENCY FOR THE VALUES
OF U ANO CAT THE BEGINNING OF A PLANNING STAGE, FOR IMPROVED CHANNELS WITHIN THE SUBWATERSHED
CFS EXPECTED FLOW Of A GIVEN FREQUENCY FOR THE VALUES OF U ANO CAT THE END DF A PLANNING STAGE, FOR IMPROVED CHANNELS WITHIN THE SUBWATERSHEO
CFS EXPECTED FLOW CF A GIVEN FREQUENCY FOR THE VALUES OF U ANO CAT THE BEGINNING OF A PLANNING STAGE, FOR UNIMPROVED CHANNELS WITHIN THE SUeWATERShED
CFS EXPECTED FLOW OF A GIVEN FREQUENCY FOR THE VALUES OF U AND CAT THE ENO OF A PLANNING STAGE, FOR UNIMPROVED CHANNELS WITHIN Tl-iE SUBWATERSHED
- ARfiAY INTO WHICl-i IS READ THE RELATIONSHIP EXPRESSING THE MAGNITUDE OF THE MEAN ANNUAL FLOOD OVER ONE SQUARE MILE AS A FUNCTION OF TRIBUTARY CHANNELIZATION ANO URBANIZATION
CFS MEAN ANNUAL FLOOD PEAK IF LOCAL CHANNEL IS NCT IMPROVED
CFS MEAN ANNUAL fLCOO PEAK If LOCAL Cl-iANNEL IS IM PRO VEO
CFS SMALLER DESIGN FLOW USED TO BOUND INCREMENT BY WHICH LINED CHANNELS ARE SIZED
CFS LARGER DESIGN FLOW USED TO BOUND INCREMENT BY WHICH LINED CHANNELS ARE SIZED
CFS STORED VALUE CF Q9 USED IN PRINTING CHANNEL IMPROVEMENT OUTPUT
CFS CHANNEL CAPACITY FOR Tl-iE SUBSCRIPTED SUBWATERSHEO FOR THE MOST ECONOMICAL COMBINATION OF RESERVOIR STORAGE AND CHANNEL IMPROVEMENT FOUND THUS FAR
CFS CHANNEL CAPACITY FCR THE SUBSCRIPTED SUBWATERSHED - 278 -

QA BR l
QB BR l
QB05* BR l
QB43* B R l
FOR THE COMBINATION CF RESERVOIR STORAGE AND CHANNEL IMPROVEMENT CURRENTLY UNDER ANALYSIS
- A VALUE Cf Q43 OR Q05 INTERPOLATED FOR A GIVEN DEGREE OF URBANIZATION BETWEEN TWO VALUES OF THE DEGREE OF CHANNELIZATION. QR IS INTERPOLATED BETWEEN QA AND QB
- A VALUE Of Q43 OR QC5 INTERPOLATED FOR A GIVEN DEGREE CF URBANIZATION BETWE!:N TWO VALUES OF THE DEGREE OF CHANNELIZATION. QR IS INTERPOLATED BETWEEN AQ AND QB
CFS THE 200-YEAR FLOOD PEAK FROM A DRAINAGE AREA OF ONE SQUARE MILE
CFS MEAN ANNUAL FLOOD PEAK FROM A DRAINAGE AREA OF ONE SQUARE l'I LE
QCAP 3 R l CFS EXISTING CHANNEL CAPACITY QCST 2 SUBROUTit,E ESTIMATES INCREASE IN FLOOD DAMAGE IN DOWNSTREAM
SUBWATERSHEO NWD WHICH WOULD RESULT IF THE CHANNEL IN UPSTREAM SUBWATERSHEO NW WERE IMPROVED ASSUMING NO DAMAGE REDUCTION MEASURES WERE
QO IS B R
QOSN 3 R
QDSY 3 R
QEMSP 3 R Qf 05 3 R Qf43 3 R QFOS 3 R
QK12* BR
QL BR QLINED 8 R
QLL BR
QLRG 2 R
QN 3 R
QF BR QPP BR
QC B R
1
l
l
l l 1 l
v
l l l
l
l
l l
2,10
TAKEN. RESULT IS COMPARED WITH COST Of DOWNSTREAM CHANNEL IMPROVEMENT IN SUBROUTINE COST, THE SMALLER CF THE TWO COSTS BEING USED
CFS DISCOUNTED AVERAGE VALUE OVER A PLANNING STAGE OF A FLCCC PEAK Of GIVEN FREQUENCY
CFS FLOOD PEAK fCR RESERVCIR DESIGN FLOOD FREQUENCY lF LOCAL CHANNEL IS NOT IMPROVED
CFS FLCCO PEAK FOR RESERVOIR DESIGN FLOOD FREQUENCY IF LOCAL CHANNEL IS IMPROVED
CFS EMERGENCY SPILLWAY DESIGN FLOW CFS PEAK FLOW Cf THE 200-YEAR LOCAL HYDROGRAPH CFS PEAK FLOW OF THE MEAN ANNUAL LOCAL HYDROGRAPh CFS FEAK FLCW OF ThE RESERVOIR DESIGN FREQUENCY
LOCAL HYDRGGRAPH CFS THE FLOOD PEAK WIThIN JHE SUBSCRIPTED
SUBWATERSHED FOR WHICH THE VALUES OF DK12 ANO AK12 ARE ALSO KNOWN - ALL THREE ARRAYS ARE FILLED WITH DATA COLLECTED FROM HISTORICAL FLOODS
CFS DESIGN FLCW FOR LANC USE RESTRICTION MEASURES CFS CAPACITY Of CHANNEL IMPROVED BY LINING CFS THE EXCESS CF THE CESIGN FLOW FOR LANO USE
ADJUSTMENT OVER THE EXISTING CHANNEL CAPACITY CFS THE VALUE TO WHICH CHANNEL DISCHARGE IS INCREASED
BY UPSTREAM CHANNELIZATION CFS STCRAGE LCCATICN FCR VALUE Of Q05N, Q43N, GR
QDSN, WHICHEVER IS BEING USED AS A BASIS FOR CALCULATING THE QX AND QQ FLOODS FOR UNIMPROVED CHANNELS
CFS DESIGN FLOW FOR FLOOD PROOFING CFS THE EXCESS OF THE DESIGN FLOW FOR FLOOD PROOFING
OVER THE EXISTING CHANNEL CAPACITY CFS FOR EACH POTENTIAL DESIGN FREQUENCY, THE
DISCOUNTED AVERAGE EXPECTED FLOW FOR UNIMPROVED - 279 -

QR 8 R l
QRATIO* 3 R 1
QS BR 1 QS ML 2 R l
QSPILL 3 R l QSPLWR 3 R 1
QSS B R 1
QT05 3 R 1
QT43 3 R l
QWE IR 3 R 1
QX B R 2, 16
QXl BR l
QXC B R 1
QXCS B R 1
QXX B R 1 QY B R 1 QY 3 R 1
QYl B R 1
QYC 2 R 1
R* BR 1 RBEG BR 1
RBIG 3 L l
RC BR V
IROW ll ANO IMPROVED !ROW 21 CHANNEL CCNOITIGNS - THE VALUE INTERPOLATED BETWEEN QA AND QB
ACCORDING TC THE CURRENT VALUE CF URBANIZATION - RATIO OF THE PEAK TC THE AVERAGE PRINCIPAL
SPILLWAY DISCHARGE CFS DESIGN FLOW FOR CHANNEL IMPRCVEMENT CFS THE VALUE OF CHANNEL DISCHARGE WITHOUT
CHANNELIZATION IN THE SUBWATERSHED BEING EVALUATED
CFS CURRENT PRINCIPAL SPILLWAY DISCHARGE CFS CURRENT FLOW THROUGH PRINCIPAL SPILLWAY If WEIR
CONTROL CFS THE EXCESS OF CESICN CHANNEL FLOW OVER THE
EXISTING CHANNEL CAPACITY - MULTIPLIER INTERPOLATED FROM Q05 ACCORDING 10
EXISTING CHANNELIZATION ANO URBANIZATION TO DETERMINE QF05
- MULTIPLIER INTERPOLATED FROM Q43 ACCORDING TC EXISTING CHANNELIZATION AND URBANIZATION TO DETERMINE QF43
CFS EMERGENCY SPILLWAY DISCHARGE BASED ON A WEIR COEFFICIENT AND EQUATION
CFS DISCOUNTED AVERAGE FLOWS IN EXCESS OF CHANNEL CAPACITY FOR EACH OF THE !TOP FLOODS USED IN ESTIMATING ANNUAL FLOOD DAMAGES FOR BOTH UNIMPROVED (ROW lJ AND IMPROVED (ROW 21 CHANNELS
- THE VALUE INTERPCLAlEC FROM ARRAY Q43 ACCORDING TO THE DEGREE CF URBANIZATION AND CHANNELIZATION
CFS THE AMOUNT BY WHICH THE FLOOD FLOW EXCEEDS THE PRCPOSEC CHANNEL CESIGN FLOW
CFS MAXIMUM FLOW IN EXCESS OF CHANNEL CAPACITY THAT WILL NOT LEAVE THE AREA Of LANO USE RESTRICTION
CFS MEAN ANNUAL FLCGD PEAK FDR THE SUBWATERSHEO CFS 200-YEAR FLOOD PEAK FOR THE SUBWATERSHED CFS SAME AS QN BUT FOR IMPROVED CHANNELS
- THE VALUE INTERPOLATED FROM Q05 ACCORDING TO THE DEGREE OF URBANIZATION AND CHANNELIZATION
CFS 200-YEAR FLCCD PEAK CALCULATED FROM GUMBEL PARAMETERS AT THE END OF THE PREVIOUS STAGE IN ORDER TO TEST WHETHER UPSTREAM CHANNELS HAVE BEEN IMPROVED IN CURRENT STAGE
- DISCOUNT RATE FOR USE IN PROJECT PLANNING $/AC VALUE Cf URBAN LANC AND BUILDINGS AT THE
BEGINNING OF A PLANNING STAGE - SET TRUE IF SIZING RESERVOIR BASED ON DAMAGE
REDUCTION OVER PROJECT LIFE, FALSE IF JUSTIFYING RESERVOIR BASED ON DAMAGE REDUCTION IN CURRENT STAGE
$/AC RIGHT-OF-WAY CCST OF LANDS AND BUILDINGS WITHIN THE SUBSCRIPTED SUBWATERSHED - IT DEPENDS ON WHEN RIGHT-OF-WAY WAS PURCHASED AND SINCE WHEN LAND USE HAS BEEN CONTINUOUSLY RESTRICTED - SET
- 280 -
..

-1.0 IF NCT YET CALCULATED RO 3 R l CY IMPTY AS A REAL ~UMBER
RDDATA 3 SUBROUTINE READS INPUT CATA AN[ COMBINES SELECTED TERMS FOR LATER USE
RE BR l - NUMBER OF RAILkAY BRIDGES THAT MUST BE MODIFIED 10 ACCO~;MOOATE CHANNEL DESIGN FLOW
READ B SUBROUTINE USED TO READ INPUT DATA. ALLOWS FORMAT FREEDOM AND PLACING Of COMMENTS ON DATA CARDS
RENO B R l $/AC TOTAL VALUE Cf URBAJI LANO Ai'iC BUILCINGS ,IT ThE ENO OF A PLANNING STAGE
RESACR* 3 R 25 AC SURFACE AREA OF RESERVOIR HAVING THE CORRESPONDINGLY SUBSCRIPTED VALUE CF ELEVA AS ITS SURFACE ELEVATION
RESEL 3 R 25 FT RESERVOIR SURFACE ELEVATIONS FCR WHICh OUTFLOW AND STORAGE VALUES ARE COMPUTED FOR RESERVOIR ROUTING
RESIN 3 l l - SET TRUE If hYCROORAPh TO BE DEVELOPED REPRESENTS INFLOW TO A RESERVOlR
RESINF 3 R 50 CFS UNIFORM TIME BASE hYOROGRAPH FLOWING INTO RESERVOIR
RESOUT 3 R 50 CFS UNIFORM TIME BASE HYOROGRAPH FLOWING OUT OF l<ESERVOIR
RESRTE 3 SUBROUTINE ROUTES THE INFLCW HYDRCGRAPH THROUGH THE RESERVOIR
RESVOL 3 R 25 AF VOLUME OF WATER STCFEO IN RESERV-GIR WhEN THE SURFACE ELEVATION IS THE CORRESPONDINGLY SUBSCRIPTED VALUE OF ELEVA
RE TEMP B R 1 - \IALUE CF RE FOR THE !'CST ECONOMICAL CHANNEL
RETWAL 3 RK24 3 R
RN B R
RCNE 3 L
RCWACR 3 R RPI* B R
RSl 3
RS2 3
RSBLT 3 L
RSFLO 3 L
RSHYOR 3
RT EMP B R
SUBROliTII\E 1
l
1
l l
l
l
l
l
SUBROUTINE
1
IMPROVEMENT FOUND THUS FAR CALCULATES RETAINING WALL VOLUME
- DAILY TOTAL FLOW RECESSION CCNSTANT IMPTY DAYS AFTER STORM
- NU1"BER OF NEW RAILWAY BRIDGES REQUIRED BY THE CHANNEL DESIGN FLOW
- SET TRUE AS SOON AS THE DECISION TO BUILD A RESERVOIR HAS BEEN MADE
AC AREA OF RIGHT-OF-WAY TO BE PURCHASED - RATE Of RETURN REQUIRED BY PRIVATE INVESTORS
IN LANO - COMMON STATEMENT CONTAINING All ARRAYS DEALING
~ITH THE CAM ANO RESERVOIR - COMMON STATEMENT CONTAINING All SINGLE VALUE
VARIABLES DEALING WITH THE DAM AND RESERVOIR - SET TRUE IF A RESERVOIR CAN BE CONSIDERED IN
ANALYSIS AS HAVING BEEN BUILT - SET TRUE IF RESERVOIR CAN BE CONSIDERED IN
IN ANALYSIS AS HAVING BEEN BUILT TO CONTAIN FLOOD CONTROL STORAGE DEIIE:LOPS LOCAL INFLOW hYOROGRAPHS AND COMBINES INTO TOTAL HYDRCGRAFHS
- VALUE OF RN FOR THE MOST ECONOMICAL CHANNEL IMPROVEMENT FOUND THUS FAR
- 281 -

R TEST 3 l
RTRYD 3 L
Riff* 2 R
S* BR
SAFC* BR
SBCONC 3 R SBEX 3 R
SBLNG 3 R
SECCND 3 L
SEDIN* 3 R SEDSTR 3 R
SF* 2 R
SG B L
517 3 R
S 18 3 ·R
Sl9 3 R
SIC* 2 R
SIC* 3 R
SIGMA BR
SK 1 B R
SK2 B R
SK3 B R
SK4 BR
SK5 B R
SK6 BR
l - SET TRUE IF ANALYSIS CURRENTLY EVALUAT1NG CONSTRUCTION OF A RESERVOIR
l - SET TRUE IF SEPARATE hYDROGRAPHS (BESIDES MEAN ANNUAL AND 200-YEARt ARE REQUIRED FOR RESERVOIR DESIGN
1 - MULTIPLE OF RIGHT-OF-WAY COST TO BE USED FOR SENSITIVITY STUDIES
V - THE AVERAGE LONGITUDINAL CHANNEL SLOPE FOR THE SUBSCRIPTED SUEWATERSHED
l - RATIO OF RJGHT-CF-~AY WIDTH TO EE HELD TO RIGHT-OF-WAY WIDTH PREDICTED TO BE REQUIRED
l CY TOTAL VOLUME Of CONCRETE IN STILLING BASIN 1 CY EXCAVATION REQUIRED FOR STILLING BASIN
INSTALLATION 1 fl LENGTH OF EMERGENCY SPILLWAY STILLING BASIN
!FIG. Al l - SET TRUE IF hYDROGRAPHS BEING DEVELOPED ARE THOSE
FOR AN IMPROVED MAINLINE CHANNEL IN THE REACH l AF/SM ANNUAL SEDIMENT INFLGW INTO RESERVOIR l AF RESERVOIR SECIMENT STORAGE RESERVATION (FIG. Bl 1 - MULTIPLE CF CHANNEL CCNSTRUCTION CCST TO BE USED
FOR SENSITIVITY STUDIES l - SET TRUE IF STRUCTURAL MEASURES HAVE BEEN PROVED
ECONOMICAL DURING THE CURRENT SUBWATERSHED-STAGE l Ml TEMPORARY LOCATION FOR VALUE Of 519 USED IN
PRINTING OUTPUT 15 MI LENGTH OF MAIN CHANNEL IMPROVED IN SUBSCRIPTED
SUBWATERShED FOR TrE LEAST COST COMBINATION Of RESERVOIR STORAGE AND CHANNEL IMPROVEMENT FOUND THUS FAR
15 MI LENGTH OF MAIN CHANNEL IMPROVED IN SUBSCRIPTED SUBWATERSHED FOR RESERVOIR STORAGE BEING TRIED CURRENH. Y
V MI CHANNEL LENGTH WITHIN THE SUBSCRIPTED SUBWATERSHEO WHICH WAS IMPROVED PRIOR TO THE BEGINNING OF THE PLANNING STAGE
15 MI MAIN LINE CHANNEL LENGTH WITHIN SUBSCRIPTED suewATERShED WHICH WAS IMPROVED PRIOR TO THE BEGINNING Of THE PLANNING STAGE
l $/YR STANDARD DEVIATION Of EXPECTED FLOOD DAMAGES USED IN CALCULATING UNCERTAINTY COST
1 - FACTOR COMBINING TERMS USED IN COMPUTING ANNUAL COST OF CHANNEL EARTHWORK
1 - FACTOR COMBINING TERMS USED IN COMPUTING ANNUAL COST Of DRAINAGE INLETS
1 - FACTOR COMBINING TERMS USED IN COMPUTING ANNUAL COST OF RIGHT-Of-WAY
1 - FACTOR COMBINING TERMS USED IN COMPUTING ANNUAL COST OF HIGHWAY BRIDGES
l - FACTOR COMBINING TERMS USED IN COMPUTING ANNUAL COST OF RAILWAY BRIDGES
1 - FACTOR COMBINING TERMS USED IN COMPUTING ANNUAL - 282 -

COST OF CROP STRUCTURES SK7 BR l - FACTOR COMBINtNG TERMS USED IN COMPUTING ANNUAL
COST OF TRAPEZOIDAL LINING SKS BR l - FACTOR COMBINING TERMS USED IN COMPUTING ANNUAL
COST OF RECTANGULAR LINING SL 3 R l - SLCPE OF HILLSIDE ABOVE EMERGENCY SPILLWAY
BETWEEN TWO BOUNDING ELEVA ELEVATIONS SLC 3 R 1 MI CHANNEL LENGTH ALONG WHICH RJGHT~OF-WAY IS
ALREADY HELC SLG 3 R l FT AVERAGE LENGTH CF THE SECTION OF THE UPSTREAM
DAM FACE FOR WHICH RIPRAP QUANTITIES ARE BEING DETERMINED
SLGTH 3 R l FT INCREMENTAL LENGTH ADDED IN GOING TO CURRENT VERTICAL CAM SECTION IN CALCULATING THE VOLUME CF THE EMEANKM ENT
SLOPE BR l - THE AVERAGE LONGITUDINAL CHANNEL SLOPE FOR THE SUBWATERSHED AFTER BEING REDUCED BY ADDING DROP STRUCTURES
SLOPE 3 R 1 - AVERAGE SLOPE OF EMERGENCY SPILLWAY (VERTICAL/ HOR I ZONT Al I
SPCONC 3 R 1 CY VOLUME OF CONCRETE IN EMERGENCY SPILLWAY CHUTE SPCRAR 3 R 1 SF AREA OF THE EMERGENCY SPILLWAY EXCAVATION SECTION
AT THE SPILLWAY CREST SPEX 3 R 1 CY TOTAL VOLUME OF EMERGENCY SPILLWAY EXCAVATION
SPLNG 3 R 1 FT DISTANCE FRUM EMERGENCY SPILLWAY CREST TO BEGIN-NING OF SJILLING BASIN WALL IFIG. Al
SPLSIZ 3 SUBROUTINE SELECTS THE OPTIMUM EMERGENCY SPILLWAY WIDTH SPRKEX 3 R l CY VOLUME OF ROCK EXCAVATION REQUIRED FOR EMERGENCY
SPILLWAY COI\STRUCTION SPWF BR l - UNIFORM SERIES PRESENT WORTH FACTOR FOR DURATION
TIME AND DISCOUNT RATE RPI SPWFAC BR l - UNIFORM SERIES PRESENT WORTH FACTOR FCR DURATION
TI~E ANO DISCOUNT RATER SS BL 1 - SET TRUE TO ELIMINATE CHANNEL IMPROVEMENT FROM
FURTHER CONSIDERATION IN A SUBWATERSHED-STAGE WHERE IT HAS NO HOPE OF PROVING ECONOMICAL
ST BR l - FREQUENCY OF CHANNEL DESIGN FLOOD STEMP BR 1 - VALUE OF ST FOR THE MOST ECONOMICAL CHANNEL
IMPROVEMEI\T FOUNC THUS FAR STF BL 1 - SET TRUE TO ELIMINATE CHANNEL IMPROVEMENT FROM
CONSIDERATION IN PLANNING STFLOW 3 R l CFS FLOW THROUGH PRINCIPAL SPILLWAY IF PIPE CONTROL
AT STORM BEGINNING STLBAS 3 SUBROUTINE DESIGNS ANO DETERMINES QUANTITIES FOR THE
EMERGENCY SPILLWAY STILLING BASIN STLBOT* 3 R l FT THICKNESS OF CONCRETE IN STILLING BASIN BOTTOM
(FIG. Ill STOR 3 R 25 SFH S/T+0/2 TERM AS A FUNCTION OF WATER SURFACE
ELEVATION FOR RESERVOIR ROUTING WITH UNGATED SPILLWAYS
STOUT 3 R 50 SFH CURRENT VALUE CF S/T+0/2 IN RESERVOIR ROUTING STR B SUBROUTINE SELECTS THE LEAST COSTLY TYPE OF CHANNEL
- 283 -

IMPROVEMENT AND DETERMINES THE RESULTING DESIGN DIMENS!CNS Al\0 COSTS
STROUT B SUBROUTINE PRINTS OUT SUMMARY CF CHANNEL IMPROVEMENTS ST~EIR 3 R CFS FLCW THROUGH PRINCIPAL SPILLWAY IF WEIR CONTROL
AT STORM BEGINNING TB R 1 FT WIDTH OF DESIGN CHANNEL WATER SURFACE
TO BR V FT TOP WIDTH CF EXISTING CHANNEL IN SUBSCRIPTED SUBWATERSHED
T7 3 R l FT TEMPORARY LOCATION FOR VALUE OF CHANNEL TOP WIDTH USED IN PRINTING OUTPUT
TS 3 R 15 FT IMPROVED CHANNEL TOP WIDTH IN SUBSCRIPTED SUB-WATERSHED FGR LEAST COST COMBINATION OF RESERVOIR STORAGE AND DOWNSTREAM MEASURES FOUND THUS FAR
T9 3 R 15 FT IMPROVED CHANNEL TOP WIDTH IN SUBSCRIPTED SUB-WATERSHEO FOR RESERVOIR STORAGE BEING TRIED CURRENTLY
TBW 3 R 1 HR LENGTH OF LOCAL HYDROGRAPH BASE TCL* B R V MI TOTAL LENGTH OF CHANI\EL TRIBUTARY TO THE
DOWNSTREAM END OF SUBSCRIPTED SUBWATERSHEO TEMF BR l - INTERMEOltTE VARIABLE USED IN GUMBEL ANALYSIS IN
CALCULATll\G THE REDUCED VARIATE FRCM THE PROBABILITY Of NON-OCCURRENCE
TF* BR V PSf THE MAXIMUM ALLCWABLE TRACTIVE FORCE FOR SUBSCRIPTED SUBWATERSHED AS DETERMINED fRCM SOIL ANALYSIS
TFF BR 1 PSf THE TRACTIVE FORCE ACTUALLY CEVELCPEO BY A GIVEN FLOW
TIS 3 R 15 MI TOTAL LENGTH Of IMPROVED CHANNEL IN SUBSCRIPTED SUBWATERSHED ASSOCIATED WITH LEAST COST COMBINATION Of RESERVOIR STORAGE ANO DO~NSTREAM MEASURES FOUND THUS FAR
Tl9 3 R 15 Ml TOTAL LENGTH Of IMPRCVED CHANNEL IN SUBSCRIPTED SUBWATERShED ASSOCIATED WITH RESERVOIR STORAGE BEING TRIED CURRENTLY
TIA 3 R 1 MI TRIBUTARY LENGTH Of Jf',PRCVEO CHANNEL !l'CT CN MAIN LINE STREAM AS APPLIES TO HYOROGRAPH BEING DEVELOPED
TIC* 2 R 25 MI THE TOTAL LENGTH OF IMPROVED CHANNEL TRIBUTARY TO THE DOWNSTREAM ENO OF THE SUBSCRIPTED SUB WATER SHED
TIO 3 R 1 Ml TRIBUTARY LENGTH OF IMPROVED CHANNEL NOT CN MAIN LINE STREAM DURING CURRENT STAGE
TIM 3 R l HR TIME FROM BEGINNING Of STORM TO ENO TO CURRENT RESERVOIR ROUTING PERIOD
TIME* BR l YR DURATION OF CNE PLANNING STAGE TIMEP 3 R 1 HR TIME FROM BEGINNING Of STORM TO BEGINNING OF CUR-
RENT RESERVOIR ROUTING PERIOD TIMST* B R l YR THE PLANNING PERIOD AMOUNTING TO NSTEMX*TIME
YEARS, ALSO USED AS DESIGN LIFE Of CHANNEL ANO RESERVOIR MEASURES
TLRG 2 R l fl TOP WIDTH OF CHANNEL REQUIRED TO HANDLE FLOW INCREASED BY UPSTREAM CHANNELIZATION
- 284 -

TCFACR 3 R
TCTHOD 2 R
TF* 3 R
TP 3 R
TPB* 3 R
TPELEV 3 R TPW 3 R
TRACE BL
TRAREA 3 R TRIP 3 I
TRV* 3 R
TSML 2 F
TSWCD 2 R
TSWCF 2 R
TSWCL 2 R
TSWCP 2 R
TSWCS 2 R
TSWCU 2 R
TT B R
TTEMF BR
TWELEV* 3 R
U B R
UCCLR* 3 R UCCNID* 3 R
UCCI* 3 R
1 AC RESERVOIR SURFACE AREA AT EMERGENCY SPILLWA~ CRl::ST ELEVAT!Ct\' '(TOF CF RESERVOIR CLEARING)
1 I/YR TOTAL ANNLAL COST FOR ALL SUBkATERSHEOS OF HOLDING RIGHT-OF-WAY DURING STAGE
11
l
l
1 1 l
l l
l
1
- MULTIPLIERS 10 REDUCE TIME TC PEAK WITH TRIBUTARY CHANNELIZATION
FT ELEVATION CF GRCUN[ SURFACE AT POINT WHERE BEDROCK REACHES ELEVATION OF DAM TOF (FIG. Cl
HR TIME TO PEAK FOR ONE SQUARE MILE WATERSHED WITH NO TRIBUTARY CHANNELIZATION
FT ELEVATION OF DAM TOP (FIGS. A, B, Cl HR TIME TO PE:Al< FCR LOCAL hYDROGRAPH - READ TRUE IC HAVE EACH COMBINATION CF MEASURES
THAT IS CONSIDERED, PRINTED SF RECUIRED AREA OF PRINCIPAL SPILLWAY OPENING - COUNTER FOR NUMBER OF EMERGENCY SPILLWAY TR IPL
WIDTHS FPS DESIGN FLCW VELOCITY THROUGH PRINCIPAL SPILLWAY
TRASHRACK FT TOP WIDTH OF CHANNEL REQUIRED TO HANDLE FLOW WITH
NO CHANNELIZATION IN UPSTREAM SUBWATERSHED UNDER ANALYSIS
1 $/YR TOTAL ANNUAL COST OF FLOOD DAMAGES OVER THE ENTIRE WATERSHED DURING A PLANNING STAGE
l $/YR TOTAL ANNUAL VALUE OF ALL FLOOD CONTROL MEASURES ANO ALL RESIDUAL FLOOD DAMAGES DURING A PLANNING STAGE
l $/YR TOTAL ANNUAL COST OF LAND USE RESTRICTION OVER THE ENTIRE kATERSHED DURING A PL•NNJNG STIGE
l $/YR TOTAL ANNUAL COST CF FLOOD PROOF ING MEASURES OVER THE ENTIRE WATERSHED DURING• PLANNING STAGE
l $/YR TOTAL ANNUAL CCST CF CHANNEL IMPROVEMENT OVER THE ENTIRE WATERSHED DURING A PLANNING STAGE
l $/YR TOTAL ANNUAL COST OF UNCERTAINTY AS CALCULATED BY A THOMAS UNCERTAINTY FUND OVER THE ENTIRE WATERSHED CURING A PLANNING STAGE
l
l
l
l
1 l 1
FT STORED VALUE CF T WHILE CTHER SECTION TYPES ARE BEING TRIED TO SEE IF THEY COST LESS
FT VALUE OFT FOR THE MOST ECONOMICAL CHANNEL IMPROVEMENT FOUND THUS FAR
FT WATER SURVACE ELEVATION DOWNSTREAM FROM RESERVOIR DURING DESIGN FLOOD
- FRACTION OF THE TOTAL AREA TRJeUTARY TO A SUBWATERSHED IN URBAN LAND USE
$/AC AVERAGE UNIT COST CF CLEARING RESERVOIR SITE $/CY UNIT COST OF IN PLACE IMPACT ENERGY OISSIPATCR $/CY UNIT COST OF EXCAVATING CUTOFF TRENCH AND BACK-
FILLING WITH Jf,IPER\i!CUS MATERIAL (VOLCTl UCOAM* 3 R l $/CY LNIT COST OF IN PLACE DAM Ef,IBJlNKMENT CVOLOAf,IJ
UCFIX 3 SUBROUTINE DETERMINES AVERAGE ANNUAL URBANIZATION AND CHANNELIZATION CVER THE LIFE CF THE RESERVOIR
UCPRCN* 3 R l $/CY UNIT COST OF IN PLACE PRINCIPAL SPILLWAY CONDUIT
- 285 -

UCRKEX* 3 R 1
UCROW 3 R l UCRP* 3 R 1
UCSPCN* 3 R l
UCSPEX* 3 R l
UCTRK* 3 R 1
UJ 8 R 1
UN BR l
UNC B L 1
UC B R l
UR 8 R 1
USUBW* 8 R V,6
UT2 3 R l
UTOTR* BR V,6
UU B R l UZ BR 1
VOS* 3 R 11,11
V43* 3 R 11,11
VA* 8 R l
VALUE* BR V,6
VB05* 3 R 1
VB43* 3 R l
VEL 3 R l
PER CUBIC YARD OF PIPE CONCRETE (PRCONJ $/CY UNIT CCST CF ROCK EXCAVATION FOR EMERGENCY SPILL
WAY ( RKE X)
$/AC AVERAGE UNIT COST PAID FOR REAL PROPERTY $/CY UNIT COST OF PROTECTIVE COVERING CN UPSTREAM FACE
OF DAM $/CY UNIT COST OF IN PLACE STRUCTURAL CONCRETE IN EMER
GENCY SPILLWAY (SPCN, SBCCNCI $/CY UNIT CCST Of EARTH EXCAVATION FOR EMERGENCY
SPILLWAY (SPEX, SBEX} $/SF UNIT COST OF PRINCIPAL SPILLWAY ENTRANCE (INCLUD
ING TOWERI PER SQUARE FOOT OF OPENJNG (TRAREAJ - VALUE OF U ROUNDED TO THE NEXT LCWER DECILE FOR
THE PURPOSE OF INTERPOLATION - DISCOUNTED AVERAGE ANNUAL SUBWATERSHEO
URBANIZATION OVER THE PLANNING STAGE EXPRESSED AS A FRACTION OF TOTAL LAND AREA
- SET TRUE TO CALCULilTE FLOOD DAMAGE AS INCLUDING DAMAGE BASED CN THOMAS UNCERTAINTY FUND
- THE URBANIZATION TO THE NEAREST ROUNDED TENTH BELOW THE VALUE Cf UN+l.O USED TO INTERPOLATE A VALUE Of f LQ FROM FRU
- THE URBANIZATION UN+O.l EXPRESSED IN TENTHS USED IN INTERPOLATING FUQ VALUES FROM FRU
- THE FRACTION OF THE SUBSCRIPTED SUBWATERSHED FLOOD PLAIN IN URBAN LANO USE AT THE BEGINNING AND END OF EACH ST AGE
- DISCOUNTED AVERAGE ANNUAL URBAN FRACTION OVER STAGE
- THE FRACTION OF THE TCTAL AREA TRIBUTARY TO THE SUBSCRIPTED SUBWATERSHED IN URBAN LAND USE AT THE BEGINNING AND END OF EACH STAGE
- VALUE Of U USED IN INTERPOLATION - FLOOD PLAIN URBAN FRACTION PRESENT AT THE TIME
LAND USE RESTRICTION WAS INITIATED - MULTIPLIERS 10 CONVERT 200-YEAR FLCCO VOLUME WITH
NO TRIBUTARY URBANIZATICN OR CHANNELIZATION TO VOLUME FOR KNOWN URBANIZATION ANO CHANNELIZATION
- MULTIPLIERS TO CONVERT MEAN ANNUAL FLOOO VOLUME WITH NO TRIBUTARY URBANIZATICN OR CHANNELIZATION TO VOLUME f OR KNOWN URBANIZATION AND CHANNEL I ZAT ION
- THE NORMAL DEVIATE READ FOR USE IN CALCULATING UNCERTAINTY COSTS
$/AC MARKET VALUE Of LANO WITHIN THE SUBSCRIPTED SUBWATERSHED AT THE BEGINNING AND ENO OF EACH STAGE
CFS MEAN FLOW DURING 200-YEAR FLOOD FROM ONE SQUARE Ml LE
CFS MEAN FLOW DURING MEAN ANNUAL FLOOD FROM ONE S~UAR MILE
FPS FLOW VELOCITY THROUGH PRINCIPAL SPILLWAY - 286 -
.,
,,

VF* BR
VF05 3 R Vf43 3 R VfDS 3 R
VHEAD 3 R VK 3 R
VLAGST* B R VLURST* B R
VOL 3 R VOLCT 3 R
VOlDAM 3 R VOLRP 3 R
VRAT 3 R VT05 3 R
VT43 3 R
W B R WO B R
W7 3 R
WB 3 R
W9 3 R
WO 3 R
WDEMSP* 3 R WEXTRA BR
WflX 3 l
WFX 3 L
WLHTl 3 R
WLHT2 3 R
liiLHTB 3 R WLHTCH 3 R WLHTDl 3 R
WLHTM 3 R
l - RATIO Of AREA REQUIRING FLOOD PROOFING TO THAT INUNDATED BY THE DESIGN FLOOD
1 CFS MEAN FLOW DURING 200-YEAR LOCAL HYCRCGRAPH l CFS MEAN FLOW DURING MEAN ANNUAL LOCAL HYDROGRAPH l CFS MEAN FLCW DURING RESERVOIR DESIGN FREQUENCY LOCAL
HYDROGRAPH l FT VELOCITY HEAD OF FLOW THROUGH PRINCIPAL SPILLWAY l Fl VELOCITY HEAD OF FLOW AT BASE Of EMERGENCY SPILL-
WAY l $/AC VALUE Of BUILDINGS IN RURAL AREAS l $/AC VALUE OF BUILDINGS IN URBANIZED AREAS l AF VOLUME Of RESERVOIR STORAGE AT GIVEN ELEVATION l CY VOLUME OF CUTOFF TRENCH UNDER DAM l CY VOLUME OF DAM EMBANKMENT l CY VOLUME Of RIPRAP ON DAM FACE l - RATIO Of MEAN FLOW TC PEAK FLOW DURING HYOROGRAPH l - MULTIPLIER INTERPOLATED FROM V05 ACCORDING TO
EXISTING CHANNELIZATION AND URBANIZATION TO DETERMINE VF05
l - MULlIPLIER INlERPOLATEO FROM V43 ACCORDING TC EXISTING CHANNELIZATION AND URBANIZATION TO DETERMINE VF43
l FT CHANNEL RIGHT-OF-WAY WIDTH V FT CHANNEL RIGHT-OF-WAY WIDTH IN SUBSCRIPTED
SUBWATERSHEO l FT lEMPORARY LOCATION FOR VALUE OF CHANNEL RIGHl-OF
WAY WIDTH USED IN PRINTING OUTPUT 15 Fl CHANNEL RIGHT-CF-WAY WIDTH IN SUBSCRIPTED SUB-
WATERSHEO FOR LEAST COST COMBINATION Of RESERVOIR STORAGE AND OOWNSTl<EAM MEASURES FOUND TFUS FA.R
15 FT CHANNEL RIGHT-OF-WAY WIDTH IN SUBSCRIPTED SUBWATERSHEO FOR RESERVOIR STORAGE BEING TRIED CURRENTLY
1 FT MAXIMUM WIDlH Of EARTH EXCAVATION ABOVE EMERGENCY SPILLWAY {FIG. Cl
l FT EMERGENCY SPILLWAY WIDTH (FIG. Cl 1 FT EXTRA RIGHT-OF-WAY WIDTH REQUIRED WHEN A
TRAPEZOIDAL CHANNEL JS ENLARGED 5 - TRUE If EMERGENCY SPILLWAY WIDTH HAS BEEN
OPTIMIZED FOR SUBWATERSHED STAGE l - TRUE lf EMERGENCY SPILLWAY WIDTH HAS BEEN
OPTIMIZED FOR CURRENT STAGE 1 FT EMERGENCY SPILLWAY WALL HEIGFT NEAR UPSTREAM
ENO (FIG. AJ 1 FT ENERGENCY SPILLWAY WALL HEIGHT NEAR CREST
(FIG. Al l fl STILLING BASIN WALL HEIGrT (FIG. Al l FT MEAN EMERGENCY SPILLWAY WALL HEIGHT l FT EMERGENCY SPILLWAY WALL 1-'EIGl-'T NEAR DOWNSTREAM
ENO ( f I G • A l l FT SECT ION MEAN WALL 1-'E IGFT USED IN ESTIMATING
VOLUME - 287 -

WLRG 2 R l
Wl VOL 3 R 1 WSML 2 R 1
WT BR V
WT7 3 R 1
WT8 3 R 15
IH9 3 R 15
WTEMF BR 1
WU 3 R l
WW B R 1
X BR 11,11
X B R l XF B R l
XF l 2 R 25
XF2 2 R 25
XF3 2 R 25
XF4 2 R 25
XFL 2 R 1
XHN 3 R l
XHY 3 R 1
XLN 3 R 1
FT RIGHT-OF-WAY WIDTH RE,UIRED EY CHANNEL ENLARGED TO HANDLE FLOW AS INCREASED BY UPSTREAM CHANNELIZATION
CY VOLUME Of CONCRETE IN STILLING BASIN WALLS FT RIGHT-OF-WAY WIDTH REQUIRED BY A CHANNEL DESIGNED
TO HANDLE THE FLOW WITHOUT CHANNELIZATION IN THE SUBWATERSHED UNDER STUDY
FT EXTRA RIGHT-Of-WAY WIDTH HELD FOR FUTURE CHANNEL IMPROVEMENT IN SUBSCRIPTED sueWAJERSHED
FT TEMPORARY LOCATION FOR VALUE OF CHANNEL RIGHT-OfWAY HOLD ING WI OT H US ED IN PR INT ING OUTPUT
FT CHANNEL RIGHT-Gf-W1lY HOLDING WIDTH IN SUBSCRIPTED SUEWATERSl-'ED FOR LEAST COST COMBINATION OF RESERVOIR STORAGE ANO DOWNSTREAM MEASURES FOUND THUS FAR
fl CHANNEL RIGHT-Of-WAY 1-<0LOING WIDTH IN SUBSCRIPTED SUBWATERSHED FOR RESERVOIR STOR.t\GE BEING TRIED CURRENTLY
FT VALUE OF W FOR THE MOST ECONOMICAL CHANNEL IMPROVEMENT FOUND THUS FAR
FT MAXIMUM WIDTH Of EARTI-' EXCAVATION ABOVE EMERGENCY SPILLWAY APPROACH CHANNEL (FIG. CJ
FT STORED VALUE Of W WHILE OTHER SECTION TYPES ARE BEING TRIED TO SEE IF THEY COST LESS
- TWO DIMENSIONAL ARRAY BROUGHT INTO Pl.ACEA FOR DOUBLE INTERPOLATION
- RATIO OF CHANNEL BOTTOM WIDTH TO DEPTH Of FLOW CFS MODE Of DISTRIBUTION Of FLOWS USED IN Tl-<E GUMBEL
ANALYSIS TO DETERMINE THE FREQUENCY AT WHICH FLOODING llEGINS
CFS SUBSCRIPTED $UBWATERSHED MODE OF THE DISTRIBUTION Of FLOWS USED IN THE GUMBEL ANALYSIS TO DETERMINE FLOW-FREQUENCY RE LAT ION SHI PS - "l" OEN Cl ES BEGINNING Of STAGE FLOWS FOR IMPROVED CHANNELS
CFS SEE Xf - 112° DENOTES END Of STAGE FLOWS FOR IMPROVED CHANNELS
CFS SEE Xfl -•3n DENOTES BEGINNING Of STAGE FLOWS FOR UNIMPROVED CHANNELS
CFS SEE XFl -"4" DENOTES ENO Of STAGE FLOWS FOR UNIMPROVED CHANNELS
CFS MOOE OF THE ANNUAL SERIES OF EXPECTED FLOWS WITHOUT CHANNELIZATION IN UPSTREAM SU!lWATERSHED UNDER ANALYSIS
CFS MODE Of FLOWS IN fLCCO FREQUENCY RELATIONSHIP WITH NO MAIN LINE CHANNEL IMPROVEMENT IN SUBWATERSHED FOR FLOODS RARER THAN RESERVOIR DESIGN FREQUENCY
CFS MOOE Of FLOWS IN FLOOD FREQUENCY RELATIONSHIP WITH MAIN LINE CHANNEL IMPROVEMENT IN SUBWATERSHED FOR FLOODS RARER THAN RESERVOIR DESIGN FREQUENCY
CFS MOOE Of FLOWS IN FLCCD FREQUENCY RELATIONSHIP - 288 -

XL Y 3 R
XTIME 2 R
XTRSTR* 3 R
Y B R
y 3 R
YCOMP 2 R
YDIF B R
YDS 3 R
YF B R
YPRIME 3 R yy B R
YYTE ST 3 R
ZCT* 3 R
ZDN* 3 R
ZES* 3 R
ZM 3 R
ZT* B R ZU* B R
ZUP* 3 R
l
l
1
16
l
l
l
1
l
l 10
l
1
l
l
1
l 1 l
WITH ND MAIN LINE CHANNEL IMPROVEMENT IN SUBWATERSHED FOR FLOODS LESS RARE THAN RESERVOIR DESIGN FREQUENCY
CFS MODE OF FLOWS IN FLCOC FREQUENCY RELATIONSHIP WITH MAIN LINE CHANNEL IMPROVEMENT IN SUBWATERSHEO FOR FLOCDS LESS RARE THAN RESERVOIR DESIGN FREQUENCY NUMBER OF PLANNING STAGES WHICH HAVE ALREADY ELAPSED
AF DESIGN RESERVOIR STORAGE FOR PURPOSES OTHER THAN FLCOO CONTROL !FIG. 81
- REOL~EO VARIATE IN GU~BEL ANALYSIS CORRESPONDING TO THE FREQUENCY OF OCCURRENCE OF FLOODS Of THE ITCP FREQUENCIES SPECIFIED IN OQCK FOR ESTIMATING AVERAGE ANNUAL FLOOD DAMAGE
- INTERMEDIATE FACTOR IN APPLYING ENERGY EQUATION TO EMERGENCY SPILLWAY FLOW
- REDUCED VARIATE IN GUMBEL ANALYSIS FOR THE 200-YEAR fLCCD
- DIFFERENCE IN THE REDLCED VARIATE FOR THE MEAN ANNUAL FLOOD AND THAT FOR THE 2DO-YEAR FLOOD
- REDUCED VARIATE OF RESERVOIR DESIGN FLOOD FREQUENCY
- REDUCED VARIATE IN GUMBEL ANALYSIS OF FLOOD OF THE FREQUENCY AT WHICH FLOODING BEGINS
- FIRST DIFFERENTIAL Cf YIN ENERGY EQUATION - REDUCED VARIATE IN GUMBEL ANALYSIS CORRESPONDING
TO EACH Of THE NOF DESIGN FREQUENCIES SPECiflED IN OF
- REDUCED VARIATE OF RESERVOIR DESIGN FLOOD FREQUENCY
- HORIZONTAL TC VERTICAL SIDE SLOPE OF CUTOFF TRENC (FIG. Bl
- HORIZONTAL TO VERTICAL SLCPE CF DOWNSTREAM DAM FACE (FIG. Bl
- HORIZONTAL TC VERTICAL SLOPE CF CUT ABOVE EMERGENCY SPILLWAY iFIG. Cl
- MEAN Cf SLCFE DN UPSTREAM ANC DOWNSTREAM FACES OF DAM
- DESIGN SIDE SLOPE Cf TRAPEZOIDAL LINED CHANNELS - DESIGN SIDE SLCPE Cf UNLINED PRISMATIC CHANNELS - HORIZONTAL TO VERTICAL SLOPE CF UFSTREAM DAM FACE
(FIG. Bl - 289 -

APPENDIX C
INPUT DATA
FOR
THE UNIVERSITY OF KENTUCKY FLOOD CONTROL PLANNING PROGRAM II
* DATA INPUT TO UNIV. Of KENTUCKY FLOOD CONTROL PLANNING PROGRAM II *NORTHFORK Of THE KENTUCKY RIVER CARR FORK
* PROGRAM CONTROL PARAMETERS 0 * ll - •O" EXCLUDES UNCERTAINTY FROM DAMAGES l * L2 - "0" EXCLUDES CONSIDERATION OF FLOOD PROOFING 0 * L3 - "()" EXCLUDES CONSIDERATION OF LAND USE MEASURES l * l4 - "0" EXCLUDES CONSIDERATION OF CHANNEL IMPROVEMENT 1 * LS - "0" EXCLUDES PRINTING OF All COMBINATIONS TRIED 1 * L6 - "0" EXCLUDES PRINTING OF EACH NEW OPTIMUM
* COMBINATION 0 * L 7 - "0" EXCLUDES CONSIDERATION OF HOLDING EXTRA
* RIGHT-OF-WAY 5 * NSTEMX - NUMBER OF PLANNING STAGES 9 * MW - NUMBER Of SUBWATERSHEDS
* SIZE AND ARRANGEMENT OF WATERSHED * AW(l - AREA TRIBUTARY TO DOWNSTREAM END OF EACH SUBWATERSHEO * IN SQ. MILES
58.18 78.38 85.98 464.01 469.39 511.27 582.69 616.38 639.91 * INDE:XI l - INDEX TO ARRAY 'ID'
*SUBWATERSHEO NO. 1 2 3 4 5 6 1 8 9
36 * I 01 l
2 3 4 3 4 5 4 5 6 5 6 7 6 7 8 7 8 9 8 9 9
1 9 16 22 27 31 34 36 0 * FIRST VALUE B 15 21 26 30 33 35 36 0 * LAST VALUE
* NIO - NO. OF ITEMS IN DOWNSTREAM SUBWATERSHED ARRAY "10" - IDENTIFYING NUMBERS OF DOWNSTREAM SUBWATERSHEOS
5 6 7 8 9 *SUBWATERSHEDS DOWNSTREAM FROM SUBWATERSHEO l 6 7 8 9 *SUBWATERSHEOS DOWNSTREAM FROM SUBWATERSHEO 2 7 8 9 *SUBWAlERSHEDS DOWNSTREAM FROM SUBWATERSHEO 3 8 9 *SUBWATERSHEDS DOWNSTREAM FROM SUBWATERSHED 4 9 *SUBWATERSHEDS DOWNSTREAM FROM SUBWATERSHEO 5
*SUBWATERSHEOS DOWNSTREAM FROM SUBWATERSHEO 6 *SUBWATERSHEDS DOWNSTREAM FROM SUBWATERSHEO 7 *SUBkATERSHEOS DOWkSTREftM FROM SUEWATERSHEO 8 *SUBWATERSHEOS DOWNSTREAM FROM SUBWATERSHED 9
* LCU - LENGTH OF CHA.NNEl WITHIN EACH SUEWATERSHED IN MILES 17.90 3.84 4.97 4.78 3.74 7.53 17.28 9.66 12.31
* SIC() - LENGTH OF IMPROVED CHANNEL IN SUBWATERSHEO BEFORE - 290 -

* PLANNING BEGAN c.c o.o o.o o.o o~o c.o o.o o.o o.o
* TCLII - LENGTH Of CHANNEL lRIBUTARY TO DOWNSTREAM END CF EACH
* SUBWAT ER St-ED
*
50.2 66.2 73.6 407.4 412.3 452.5 525.2 * TlCI) - LENGTH Of IMPROVED CHANNEL TRIBUTARY
Of EACH SUBkATEASHED EEFCRE PLANNING o.o o.o o.o a.o o.o o.c o.o o.o a.a
* rYDRCLCGY
557.1 581.6 TO DOWNSTREAM BEGAN
ENO
177. * Q843 - MEAN ANNUAL FLCCD FEAK FROM ONE SQUARE MILE 550. * QB05 - 200-YEAR FLOOD PEAK FROM ONE SQUARE MILE
* Q43t) - RELATIONS!-IP AMONG URBANIZATION, CHANNELIZATION, AND MEAN * ANNUAL FLOOD PEAK FROM ONE SCUARE MILE, EXPRESSED AS * MULTIPLES OF THE PEAK WlTH U=O.O AND C=O.O
•o.oo 0.10 0.20 0.30 o.40 o.5C 0.60 0.10 o.80 0.90 1.00 = u l.OOC 1.005 1.029 1,068 1.108 1.156 l,19f 1,236 1.276 1.320 1.365 *C=,O 1.156 1,179 1.304 1.337 1,367 1,403 1.434 1.460 1.489 1.494 1,499 *C=.l 1,491 1.544 1.51e 1.614 1.655 1.103 1.150 1.789 1.838 1,848 1.858 •c=.2 1.978 2.029 2.069 2.113 2.153 2,195 2.237 2.276 2.324 2.361 2.384 *C=.3 2.496 2.507 2,545 2.587 2.606 2.677 2.731 2.791 2.856 2.927 3.006 *C=.4 2.990 3.026 3.063 3.C99 3.124 3.152 3.218 3,300 3.442 3.531 3.620 *C=.5 3.262 3.353 3.444 ~.536 3.627 3.718 3,810 3.901 3.991 4.053 4.131 •c=.6 3.429 3.518 3.520 3.628 3.735 3.844 3.955 4.073 4.184 4.289 4.474 *C=.7 3.533 3.560 3.596 3.722 3.844 3.97C 4.llC 4.247 4.378 4.525 4.705 *C=.8 3.588 3.602 3.672 3.815 3.952 4,109 4.26E 4.420 4.571 4.761 4.912 *C=.9 3.627 3.644 3.748 3.907 4.075 4.250 4.426 4.593 4.765 4.936 5.112 *C=l.
* Q05CI - RELATIONSHIP AMONG URBAN!lAlION, CHANNELIZATION, AND 200-* YEAR FLOOD PEAK FROM ONE SQUARE MILE, EXPRESSED AS * MLL l!PLES OF THE PEAK WITH U=O.O AND C=O.O
•o.oo 0.10 0.20 0.30 0.40 a.so 0,60 0.10 a.so 0.90 1.00 = u 1.000 1.004 1.013 1.029 1.045 1.062 1.079 1.096 1.113 1.130 1.147 *C=.O 1.059 1.143 1.1s4 1.16s 1.111 1.1so 1.204 1.213 1.221 1.230 1.24s •c=.1 1.308 1,441 1.455 1.470 1.486 1.502 1,519 1.532 1.548 1.556 1.578 *C=.2 1.614 1.739 1.757 1.775 1.795 1.814 1.834 1.851 1.870 1.882 1,910 *C=.3 1.919 2.031 2.059 2.ca1 2.103 2.126 2.14s 2.16s 2.192 2.2ca 2.242 *C=.4 2.221 2.336 2.361 2.386 2.412 2.438 2.464 2.488 2.513 2.534 2.575 •c=.5 2.533 2.634 2.663 2.692 2.121 2.150 2.119 2.so1 2.834 2.a61 2,907 •c=.6 2.835 2.932 2.965 2.997 3.030 3.06~ 3.094 3.126 3.156 3.187 3.240 •c=.1 3.146 3.230 3.267 3.302 3.338 3.374 3,409 3.444 3.478 3.513 3.572 *C=.8 3.455 3.52s 3.568 3.608 3.647 3.686 3.724 3.763 3.799 3.839 3.904 •c=.9 3.757 3.827 3.870 3.913 3.956 3.99€ 4.039 4.081 4.120 4.165 4.237 *C=l.
* AFCTRtl - RATJCS OF CSM FOR FLOCD PEAKS FROM STATED DRAINAGE AREA * TO CSM FOR FLOOD PEAKS FROM ONE SQ.MI. FOR TWC FLOOD * FRECUENCIES * DRAINAGE AREA IN SQ.Ml.
1.0 400.0 700.0 700.0 700.0 700.D 700.C 700.0 700.0 700.D 700.0 * MEAN ANNUAL flCCO
1.000 0.223 0.152 0.152 C,152 0.152 C.152 0.152 0.152 0.152 0.152 * 200-YEAR FLOOD
1.000 0.220 0.148 0.148 0.148 0.148 0.148 0.148 0.148 0.148 0.148 * FLOOD CAMAGES - EENERAL
* QO(l - EXISTING SUBWATERSHEO CHANNEL CAPACITY IN CFS - 291 -

1300. 3710. 2230. 14010. 15360. 18930. 20050. 17890. 16360. * l.lK{ l,AK( I.OKI J - MAGNITUDE Of ANY KNOl'iN FLOOD PEAK ANO ASSOCIATED * MAXIMUM DEPTH OF FLOODING ANO AREA FLOODED
* FLOOD PEAK AREA FLOODED MAXIMUM DEPTH * CFS ACRES FEET SUBWATERSHED
5400. 152. 5.0 * l 11600. 89. 3.0 * 2 13700. 154. ID. 2 * 3 47800. 174. 23.3 * 4 47900. 307. 22. 7 * 5 49300. 586. 22.8 * 6 50000. 953. 22.2 * 7 50400. 829. 24.6 * 8 50800. 946. 27.4 * 9
* FLOOD DAMAGES - UNCERTAINTY 2.575 * VA - NORMAL DEVIATE USED IN EVALUATING UNCERTAINTY
* FLOOD DAMAGES - URBAN 37000. * VLIJRST - MEAN VALUE Of URBA.N STRUCTURES, IN $/ ACRE 0.052 * COEFDM - FLOOD DAMAGE PER FOOT Of FLOOD DEPTH PER DOLLAR
* Of BUILDING MARKET VALUE * FLOOD DAMAGES - AGRICULTURAL
* Oil - FRACTION Of SUBWATERSHEO FLOOD PLAIN LANO WITHIN EACH OF * THREE SOIL CLASSES * BEST SOIL MED. SOIL WORST SOIL SUBWATERSHED
* l
1.02
1.24
0.01
0.368
0.149
0.009
0.86 0.01 0.13 0.55 0.40 0.05 0.10 0.04 0.26 1.00 o.oo o.oo 0.92 o.oo 0.08 0.82 o.oo 0.18 0.72 0.03 0.25 1.00 o.oo o.oo 0.93 0.01 o.oo
* CDA - CROP DAMAGE PER ACRE CF MCST * FLOODED TO A MINIMAL DEPTH
* 2 * 3 * 4 * 5 * 6 * 7 * 8 * 9
PRODUCTIVE SOIL WHEN
* COB - CROP DAMAGE PER ACRE Cf INTERMEDIATE SOIL WHEN * FLOODED TO A MINIMAL DEPTH * CDC - CROP DAMAGE PER ACRE OF LEAST PRODUCTIVE SOIL WHEN * FLOODED TO A MINIMAL DEPTH * CDAV - INCREMENTAL DAMAGE PER ACRE OF MOST PRODUCTIVE * SOIL PER ADDITIONAL FOOT Of FLOOD DEPTH * COBV - INCREMENTAL DAMAGE PER ACRE OF INTERMEDIATE * SOIL PER ADDITIONAL FOOT OF FLOOD DEPTH * COCV - INCREMENTAL DAMAGE PER ACRE OF LEAST PRODUCTIVE * SOIL PER ADDITIONAL FOGT Of FLOOD DEPTH
* FRU( l - RELATIONSHIP BETWEEN AGRICULTURAL PRODUCTIVITY AND
* URBANIZATION EXPRESSEO AS A MULTIPLE CF FULL RURAL VALUE * u=o.oo 0.10 0.20 0.30 0.40 o.so 0.60 0.10 o.ao 0.90 1.00
1.00 0.97 0.91 0.82 0.11 0.58 0.44 0.37 0.30 0.23 0.16 O.O * VLAGST - MEAN VALUE OF AGRICULTURAL STRUCTURES,
* IN $/ACRE * GENERAL DESIGN VARIABLES - 292 -
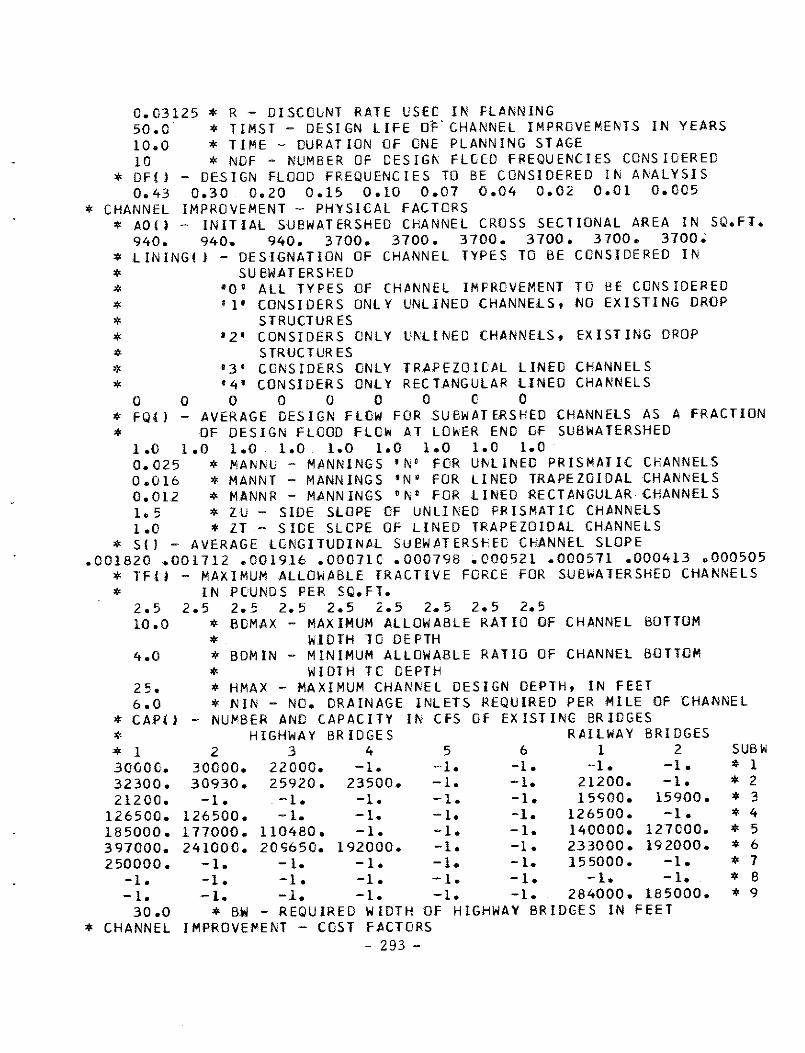
0.03125 * R - DISCOUNT RATE USEC IN FLANNING 50.0 * TIMST - DESIGN LIFE 0~°CHANNEL IMPROVEMENTS IN YEARS 10.0 * TIME - DURATION Of ONE PLANNING STAGE 10 * NDF - NUMBER OF DESIGN FLCCO FREQUENCIES CONSIDERED
* DFll - DESIGN FLOOD FREQUENCIES TO BE CONSIDERED IN ANALYSIS 0.43 0.30 0.20 0.15 0.10 0.01 0.04 0.02 0.01 0.005
* CHANNEL IMPROVEMENT - PHYSICAL FACTORS * AO( I - INITIAL SUBWATERSHED CHANNEL CROSS SECTIONAL AREA IN SQ.FT.
940. 940. 940. 3700. 3700. 3700. 3700. 3700. 3700. * L!NINGIJ - DESIGNATION OF CHANNEL TYPES TO BE CONSIDERED IN
* * * * * * * * 0
SUBWATERSHED •o• ALL TYPES Of CHINNEL IMPROVEMENT TO BE CONSIDERED 'l' CONSIDERS ONLY UNLINED CHANNELS, NO EXISTING DROP
STRUCTURES 1 2' CONSIDERS ONLY UNLINED CHANNELS, EXISTING DROP
STRUCTURES •3• CONSIDERS ONLY TRAPEZOI[AL LINED CHANNELS '4' CONSIDERS ONLY RECTANGULAR LINED CHANNELS
0 0 0 0 0 0 0 0
* FQ{l - AVERAGE DESIGN FLOW FOR SUBWATERSHED CHANNELS AS A FRACTION
* OF DESIGN FLOOD FLOW AT LOWER END Of SUBWATERSHED 1.0 1.0 1.0 1.0 1.0 1.0 1.0 1.0 1.0 0.025 * MANNU - MANNINGS 'N' FOR UNLINED PRISMATIC CHANNELS 0.016 * MANNI - MANNINGS 'N' FOR LINED TRAPEZOIDAL CHANNELS 0.012 * MANNR - MANNINGS 'N' FOR LINED RECTANGULAR CHANNELS 1.5 * ZU - SIDE SLOPE OF UNLINED PRISMATIC CHANNELS 1.0 * ZT - SIDE SLCPE OF LINED TRAPEZOIDAL CHANNELS
* S( l - AVERAGE LGNGITUDIN/lL SUBWATERShED CHANNEL SLOPE .001820 .001712 .001916 .000110 .000798 .000521 .000571 .000413 .000505
* TF!l - MAXIMUM ALLOWABLE TRACTIVE FORCE FOR SUBWATERSHED CHANNELS * lN PCUNOS PER SQ.FT.
2.5 2.5 2.s 2.5 2.5 2.5 2.5 2.5 2.5 lO .O * BOMAX - MAXIMUM ALLOWABLE RAT lO Of C H/lNNEL BOTTOM
* WIDTH TO DEPTH 4.0 * BDMIN - MINIMUM ALLOWABLE RATIO OF CHANNEL BOTTOM
* WIDTH TC DEPTH * HMAX - MAXIMUM CHANNEL DESIGN DEPTH, IN FEET 2 5. 6.0
* CAP!l * NIN - NO. DRAINAGE INLETS REQUIRED PER MILE OF CHANNEL
- NUMBER ANO CAPACITY IN CFS Of EXISTING BRIDGES
* * l 30000. 32300. 21200.
126500. 185000. 3 97000. 250000.
-1. -1.
30.0 * CHANNEL
HIGHWAY BRIDGES RAILWAY BRIDGES 2 3 4 5 6 l 2
30000. 22000. -1. -1. -1. -1. -1. 30930. 25920. 23500. -1. -1. 21200. -1. -1. -1. -1. -1. -1. 15900. 15900.
126500. -1. -1. -1. -1. 126500. -1. 177000. 110480. -1. -1. -1. 140000. 127000. 241000. 20S650. 192000. -1. -1. 233000. 192000.
-1. -1. -1. -1. -1. -1. * BW - REQUIRED
IMPROVE~ENT - COST
-1. -1. -1. 155000. -1. -1. -1. -1. -1. -1. -1. -1. -1. 284000. 185000.
WIDTH OF HIGHWAY BRIDGES IN FEET FACTORS - 293 -
SUBW * l * 2 * 3 * 4 * 5 * 6 * 7 * 8 * 9

0.45 1.10
c;oo. o 0. 70 60.0
15.0 300.0 3.584
1.00
1.0
1.15
l .45
0.005
o. 015
0.01
l. 0
* ex - UNIT CCST CF CHANNEL EXCAVATION IN $/C.Y. * FM - MULTIPLIER FOR ChANNEL EXCAVATION COST TC ACCOUNT * FOR RIPRAP ANC SEEDING * CIN - COST PER DRAINAGE INLET IN CCLLARS * CLSF - UNIT COST OF TRAPEZOIDAL LINING IN $/SQ.FT. * CCY - COST CF IN PLACE STRUCTURAL CCNCRETE FOR * REClANGULAR CHANNELS IN $/SQ.FT. * CeR - UNIT COST OF HIGHWAY BRIDGES IN $/SQ.FT. * CRR - UNIT COST OF RAILROAD BRIDGES IN $/LINEAR FT. * AQR - MULTIPLE OF RIGHT-OF-WAY COST USED TC INCLUDE * COSTS OTHER THAN FOR LAND AND IMPROVEMENTS * SAFC - RATIO OF RIGHT-CF-WAY WIDTH TO BE HELD TO * RIGHT-OF-WAY WIDTH EXPECTED TO BE REQUIRED * RWF - MULTIPLE Of RIGHT-OF-WAY COST TO EE USEO IN * PLANNING * CSM - MULTIPLE OF CHANNEL CONSTRUCTION COST TO ACCOUNT * FOR CONTINGENCIES * ESM - MULTIPLE OF CHANNEL CONSTRUCTION COST TC ACCOUNT * FOR DESIGN, ADMINISTRATION, AND SUPERVISION OF * CONSTRUCTION * MIN - ANNUAL MAINTENANCE COST OF CONCRETE STRUC JURE S AS * FRACTION OF FIRST COST * MCH - ANNUAL MAINTENANCE (CST OF EARTH CHANNELS AS A * FRACTION OF FIRST COST * MTLCH - ANNUAL MAINTENANCE CCST OF TRAPEZOIDAL LINED * CHANNELS AS A FRACTION OF FIRST COST * SF - MULTIPLE OF CHANNELIZATION COST ro BE USED IN * PL ANNI NG
* FLOOD PROOFING - COST FACTORS 0.035 * FP - COST OF FLOOD PROOFING PER FOOT OF DESIGN FLOOD
* DEPTH PER DOLLAR OF BUlLOING MARKET VALUE 1.00 * VF - RATIO OF AREA REQUIRING FLOOD PROOFING TO THAT
* INUNDATED BY THE DESIGN FLOOD 1. 30 * DO - MULTIPLIER FOR FLOOD PRCCFING INSTALLATION COST TO
* ACCOUNT FOR DESIGN ANO CONTINGENCIES 0.05 * MFP - ANNUAL MAII\TENANCE COST OF FLOOD PROOFING MEASURES
* AS A FRACTION OF FIRST COST l. 00 * Pf - MULTIPLE OF FLOOD PROOFING COST TO BE USEO IN
* PLANNING * LOCATION ADJUSTMENT - COST FACTORS 1.00
o.os 14.45
6.70
0.28
OoOO
1.00
* CLEN - ANNUAL COST OF ENFORCING LAND USE RESTRICTIONS IN * DOLLARS PER ACRE * RPI - RETURN RATE REQUIRED BY PRIVATE INVESTORS IN LANO * FIA - EXPECTED ANNUAL FARI' INCOME FROM MOST PRODUCT IVE * SOIL IF FLOODING DOES NOT OCCUR * FIB - EXPECTED ANNUAL fARI' INCOl'IE FROM INTERMEDIATE * SOIL IF FLOODING DOES NOT OCCUR * fIC - EXPECTED ANNUAL FARM INCOME FROM LEAST PRODUCTIVE * SOIL If FLOODING DOES NOT OCCUR * IPP - ANNUAL OPEN SPACE AMENITIES AS A MULTIPLE OF THE * FRACTION OF SURROUNDING LAND BEING URBAN * LF - MULTIPLE OF LAND USE CCST TO BE USED IN PLANNING
- 294 -

* DEGREE OF URBANIZATION * USUB~{l - FRACTION OF SUBWATERS~Eb FLCCD PLAIN IN URBAN LSE * AFTER AFTER AFTER AFTER AFTER * NOW TIME 21IME 3TIME 4TIME 5TIME * YEARS YEARS YEARS YEARS YEARS
0.0335 0.0335 0.0335 0.0335 0.0335 0.0335 0.1350 0.1350 0.1350 0.1350 0.1350 0.1350 0.0611 0.0611 0.0611 0.0611 0.0611 0.0611 o.0917 0.0911 0.0911 0.0911 0.0911 0.0911 0.4839 0.4B39 0.4839 0.4839 0.4839 0.4839 0.1039 0.1039 0.1039 0.1039 0.1039 0.1039 0.0241 0.0241 0.0241 0.0241 0.0241 0.0241 0.0128 0.0128 0.0128 0.0128 0.0128 0.0128 0.0154 0.0154 0.0154 o.01s4 0.0154 0.0154
* UTOTRll - FRACTION OF TRIBUTARY AREA ADDED IN URBAN * AFTER AFTER AFTER AFTER AFTER * NOW TIME 2TJME 3TIME 4TIME 5TIME * YEARS YEARS YEARS YEARS YEARS
0.0002 0.0002 0.0002 0.0002 0.0002 0.0002 0.0006 c.0006 0.0006 0.0006 0.0006 0.0006 0.0006 0.0006 0.0006 0.0006 C.0006 0.0006 0.0013 0.0013 0.0013 0.0013 0.0013 0.0013 0.0024 0.0024 0.0024 0.0024 0.0024 0.0024 0.0021 0.0027 0.0027 0.0027 0.0021 0.0021 0.0025 o.002s 0.0025 0.0025 0.0025 o.002s 0.0024 0.0024 0.0024 0.0024 o.co24 0.0024 0.0023 0.0023 0.0023 0.0023 0.0023 0.0023
* LAND VALUE * VALUE(! - VALUE
AFTER TIME
OF LAND AFTER 2TIME YEARS
IN SUBWATERSHED FLOOD PLAIN,
* * *
NOW
13(. 133. 131. 231.
50000. 3EO. 13 3. 181. 174
YEARS 13(. 133. 131. 231.
50000. 380. 13 3. 181. 174.
130. 133. 131. 231.
50000. 380. 133. 181. 174.
AFTER AFTER AFTER 3TIME 4TIME 5TIME YEARS YEARS YEARS
130. 130. 130. 13 3. 131. 231.
50000. 380 • 133. 181. 174.
- 295 -
133. 131. 231.
5COOC. 380. 133. 181. 174.
133. 131. 231.
5()000. 380. 133. 181. 174.
SUBl>ATERSHEO
* 1 * 2 * 3 * 4 * 5 * 6 * 7 * 8 * 9
DEVELOPMENT
SUBWATERSHEO
* l * 2 * 3 * 4 * 5 * 6 * 7 * 8 * 9
IN $/ACRE
SUBl>ATERSHEO
* 1 * 2 * 3 * 4 * 5 * 6 * 7 * 8 * 9
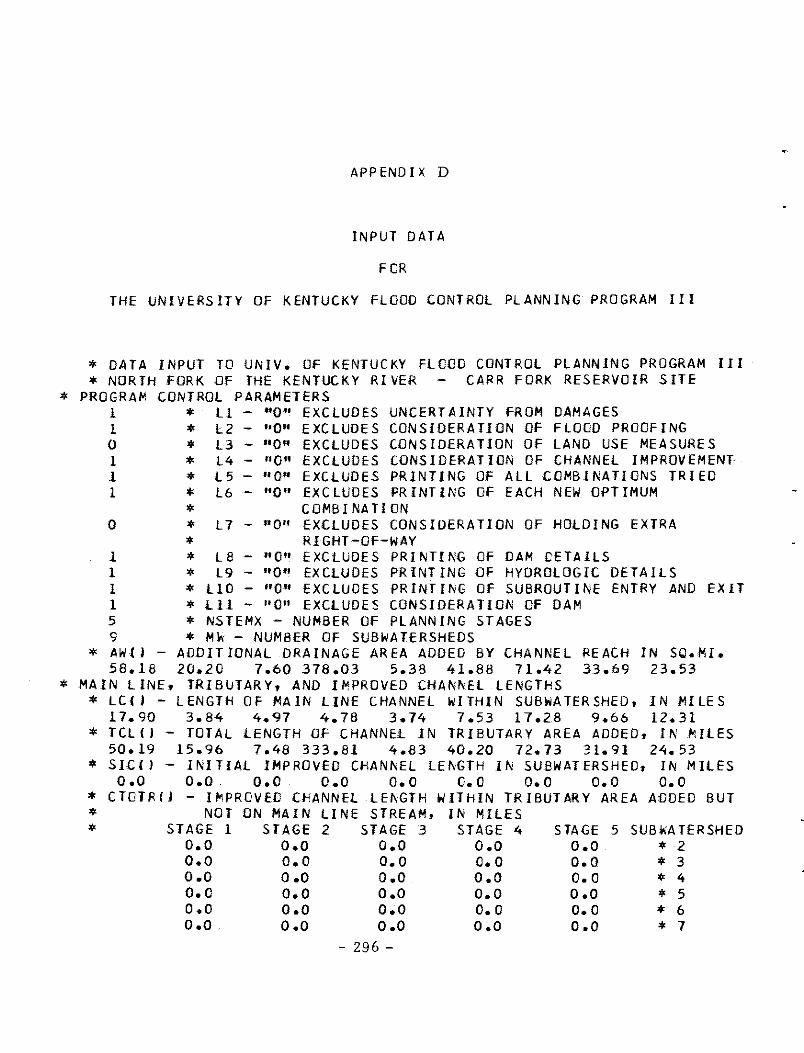
APPENDIX D
INPUT DATA
FCR
THE UNIV E:RS ITY OF KENTUCKY FLOOD CONTROL Pl ANN ING PROGRAM I I I
* DATA INPUT TO UNIV. OF KENTUCKY FLOOD CONTROL PLANNING PROGRAM III *NORTHFORK OF THE KENTUCKY RIVER CARR FORK RESERVOIR SITE
* PROGRAM CONTROL PARAMETERS l * ll - "0" EXCLUDES UNCERTAINTY FROM DAMAGES 1 * L2 - "0" EXCLUDES CONSIDERATION Of FLOOD PROOFING 0 * L3 - "0" EXCLUDES CONSIDERATION OF LAND USE MEASURES l * L4 - "0" EXCLUDES CONSIDERATION OF CHANNEL IMPROVEMENT l * l5 - •o• EXCLUDES PRINTING OF All COMBlNATIONS TRIED l * L6 - •o• EXCLUDES PRINTING OF EACH NEW OPTIMUM
* COMBINATION 0 * L7 - "0" EXCLUDES CONSIDERATION OF HOLDING EXTRA
* RIGHT-OF-WAY l * LB - "0" EXCLUDES PRINTING OF DAM CETAILS l * L9 - "0" EXCLUDES PRINTING OF HYDROLOGIC DETAILS 1 * LIO - "0" EXCLUDES PRINTING OF SUBROUTINE ENTRY AND EXIT l * Lll - "0" EXCLUDES CONSIDERATION Of DAM 5 * NSTEMX - NUMBER Of PLANNING STAGES 9 * Mk - NUMBER OF SUBWATERSHEDS
* AW() - ADDITIONAL DRAINAGE AREA ADDED BY CHANNEL REACH IN SQ.MI. 58.18 20.20 7.60 378.03 5.38 41.88 71.42 33.69 23.53
*MAINLINE, TRIBUTARY, AND IMPROVED CHANNEL LENGTHS * LC(J - LENGTH OF MAIN LINE CHANNEL WITHIN SUBWATERSHED, IN MILES
17.90 3.84 4.97 4.78 3.74 7.53 17.28 9.66 12.31 * TCL{l - TOTAL LENGTH OF CHANNEL IN TRIBUTARY AREA ADDED, IN MILES
50.19 15.96 7.48 333.81 4.83 40.20 72.73 31.91 24.53 * SIC() - INITIAL IMPROVED CHANNEL LENGTH IN SUBWATERSHED, IN MILES
o.o o.o o.o o.o o.o o.o o.o o.o o.o * CTDTR(J - !1'\PROVED CHANNEL LENGTH WITHIN TRIBUTARY AREA ADDED BUT * NOT ON MAIN LINE STREAM, IN MILES * STAGE 1 STAGE 2 STAGE 3 STAGE 4
o.o o.o o.o o.o o.o o.o o.o o.o o.o 0 .o o.o o.o o.o o.o o.o o.o o.o o.o o.o o. 0 o.o o.o o.o o.o
- 296 -
STAGE 5 o.o o.o o.o o.o o. 0 o.o
SUBkA TERSHEO * 2 * 3 * 4 * 5 * 6 * 7

o.o o.o o.o o.o o.o * 8 o.o o.o 0,0 0,0 o.o * 9
* FLOOD PEAK HYDROLOGY 177. * QB43 - MEAN ANNUAL FLCOD PEAK FROM ONE SQUARE MILE 550. * QB05 - ZOO-YEAR FLOOD PEAK FROM ONE SQUARE MILE
* Q43() - RELATIONSHIP AMONG URBANIZATION, CHANNELIZATION, AND MEAN * ANNUAL FLOOD PEAK FROM ONE SQUARE MILE, EXPRESSED AS * MULTIPLES OF THE PEAK WITH U=O.O AND C=O.O
*0.00 0,10 0,20 0.30 0,40 0.50 0,60 0,70 0,80 0,90 1,00 = U 1.000 1.005 1.029 1.068 1.1oe 1.156 1,196 1.236 1.216 1.320 1,365 *C=.o 1,156 l,179 l,304 1.337 1,367 1,403 1,434 l,460 1,489 1,494 1,499 *C=,l 1,491 1.544 1,578 1,614 1,655 1.703 1.750 1,789 1,838 1,848 1.858 *C=.2 1.978 2,029 2,069 2.113 2,153 2.195 2.237 2,276 2,324 2,361 2,384 *C=,3 2,496 2,507 2.545 2.587 2,606 2.677 2.731 2,791 2,856 2,921 3,006 *C=,4 2.990 3,026 3,063 3,099 3.124 3,152 3,210 3,300 3.442 3.531 3.620 •c=.5 3,262 3.353 3.444 3.~36 3,627 3,718 3.810 3,901 3,991 4,053 4,131 *C=,6 3.429 3,518 3,520 3,628 3,735 3,844 3,955 4.073 4,184 4.289 4,474 *C=,7 3,533 3.560 3,596 3,722 3.844 3,970 4.110 4,247 4,378 4.525 4.705 *C=.8 3.588 3.602 3.672 3,815 3,952 4,109 4,268 4.420 4.571 4,761 4,912 *C=,9 3.627 3,644 3. 74E 3.907 4,075 4.250 4,426 4,593 4,765 4,936 5.112 *C=l,
* Q051J - RELATIONSHIP AMONG URBANIZATION, CHANNELIZATION, ANO 200-* YEAR FLOOD PEAK FROM ONE SQUARE MILE, EXPRESSED AS * MULTIPLES OF THE PEAK WITH U=O.O ANO C=0,0
*0,00 0.10 0.20 0,30 0,40 0.50 0,60 0,70 0,80 0,90 1.00 = U 1.000 1,004 1.013 1,029 1,045 1.062 1,079 1,096 1.113 1.130 1,147 *C=.O 1,059 1.143 1.154 1,165 1.177 1,190 1,204 1.213 1.227 1,230 1.245 *C=.l 1.308 1.441 1,455 1.470 1,486 1,502 1,519 1.532 1.548 1.556 1.578 *C=.2 1.614 1.739 1.757 1,775 1.795 1,814 1,834 1,851 1,870 1.882 1.910 *C=.3 1,919 2.037 2,059 2.081 2,103 2,126 2.149 2,169 2.192 2.208 2,242 *C=.4 2.221 2,336 2.361 2.386 2.412 2.438 2,464 2.488 z.513 2,534 2.575 •c=.5 2.533 2.634 2,663 2,692 2.721 2,750 2.779 2.807 2,834 2.861 2.907 *C=.6 2.835 2,932 2,965 2,997 3,030 3.062 3.094 3.126 3,156 3,187 3,240 *C=,7 3.146 3,230 3.267 3,302 3.338 3,374 3.409 3.444 3,478 3,513 3,572 *C=,8 3.455 3,528 3,568 3,608 3.647 3.686 3.724 3.763 3.799 3.839 3.904 *C=,9 3,757 3,827 3,870 3.913 3,956 3,998 4.039 4.081 4.120 4,165 4.237 *C=l.
* AFCTR(l - RATIOS CF CSM FOR FLOOD PEAKS FROM STATED DRAINAGE AREA * TD CSM FOR FLOOD PEAKS FROM ONE SQ.Ml, FOR TWO FLOOD * FREQUENCIES * DRAINAGE AREA IN SQ.Ml.
1,0 400.0 400.0 400,0 400,0 400.0 400,0 400.0 400,0 400,0 400,0 * MEAN ANNUAL FLOOD
1.000 0.223 0.223 0,223 0.223 0.223 0,223 0.223 0,223 0,223 0.223 * 200-YEAR FLOOD
1.000 0.220 0,220 0,220 0.220 0.220 0.220 0.220 0.220 0.220 0.220 * FLUDD VOLUME HYDROLOGY
46.2 * VB43 - SFD IN MEAN ANNUAL HYDROGRAPH FROM ONE SQ. MILE 131,5 * VB05 - SFD IN 200-YEAR HYDRCGRAPH FROM ONE SQ. MILE
* V43(l - RELATIONSHIP AMONG URBANIZATION, CHANNELIZATION, AND MEAN * ANNUAL FLOOD VOLUME FROM ONE SQUARE MILE, EXPRESSED AS * MULTIPLES OF THE VOLUME WITH U=O.O ANO C=O.O
*0,00 0.10 0.20 0,30 0,40 0.50 0,60 0,70 0.80 0,90 1,00 = U 1,000 1,022 1.050 1,077 1.105 1,146 1.174 1.202 1,243 1,271 1.307 *C=,O
- 297 -

1.160 1.198 1.235 1.272 1.309 1.347 1.384 1.421 1.458 1.496 1.533 *C=.l 1.284 1.321 1.310 1.413 1.456 1.499 ).541 1.se4 1.t21 1.667 1.113 •c=.2 1.409 1.453 1.497 1.541 1.586 1.630 1.674 1.718 1.762 1.807 1.851 *C=.3 1.506 1.551 1.597 1.642 1.688 1.733 1.779 1.824 1.870 1.916 1.961 *C=.4 1.588 1.638 1.688 1.738 1.787 1.837 1.887 l.S3t l.S86 2.036 2.086 *C=.5 1.657 1.710 1.762 1.815 1.867 1.920 1.972 2.025 2.077 2.130 2.182 *C=.6 1.713 1.766 1.820 1.874 1.928 1.982 2.036 2.090 2.144 2.198 2.251 *C=.7 1.754 1.808 1.862 1.916 1.970 2.023 2.077 2.131 2.185 2.239 2.293 *C=.B 1.789 1.841 1.895 1.948 2.001 2.054 2.108 2.i60 2.214 2.266 2.320 *C=.9 1.796 1.892 1.961 2.016 2.072 2.113 ;.1s~ 2.196 2.~38 2.293 2.348 *C=l.
* V05(l - RELATICNSHIP AMONG URBANIZATICN, CHANNELIZATION, ANO 200-* YEAR FLOOD VOLUME FROM ONE SQUARE MILE, EXPRESSED AS * MULTIPLES OF THE VOLUME WITH U=O.O ANO C=O.O
*O.oo 0.10 0.20 0.30 0.40 a.so 0.60 0.10 0.80 0.90 1.00 = u 1.000 1.007 1.014 1.021 1.028 1.035 1.042 1.049 1.056 1.063 1.070 *C=.O 1.167 1.182 1.196 1.211 1.225 1.240 1.254 1.268 1.283 1.297 1.312 *C=.l 1.367 1.386 1.406 1.425 1.444 1.463 1.482 1.501 1.520 1.539 1.558 *C=.2 1.563 1.583 1.604 1.624 1.645 1.665 l.68c 1.706 1.726 1.747 1.767 *C=.3 1.121 1.140 1.160 1.180 1.800 1.819 1.838 1.858 1.a11 1.897 1.916 •c=.4 l.832 1.852 1.871 1.890 1.909 1.928 1.947 1.966 1.985 2.004 2.023 *C=.5 1.907 1.926 1.944 1.963 l.981 2.000 2.019 2.037 2.056 2.074 2.093 *C=.6 1.953 l.S12 1.991 2.009 2.028 2.046 2.065 2.084 2.102 2.121 2.140 *C=.7 1.986 2.004 2.022 2.040 2.os9 2.011 2.095 2.113 2.131 2.149 2.161 •c=.8 2.009 2.026 2.044 2.061 2.018 2.095 2.112 2.130 2.141 2.164 2.101 •c=.9 2.023 2.040 2.056 2.072 2.088 2.105 2.121 2.137 2.153 2.170 2.186 *C=l.
* AFCTRV{l - RATIOS Of CSM FOR FLOOD VOLUMES FROM STATED DRAINAGE * AREA TO CSM FOR FLOOD VOLUMES FROM ONE SQ.MI. FOR TWO * FLOOD FREQUENCIES * ORA INAGE A.REA IN SQUARE MILES * 1.0 400.0 400.0 400.0 400.0 400.0 400.0 400.0 400.0 400.0 400.0 * MEAN ANNUAL FLOOD
1.000 o.345 o.345 o.345 0.345 o.345 o.345 o.345 o.345 o.345 o.345 * 200-YEAR FLOOD
1.000 o.355 o.355 0.355 o.3ss o.355 o.355 o.355 o.355 o.355 o.355 * FLOOD PEAK TIMING DATA
9.0 * TPB - HOURS TO PEAK FOR HYOROGRAPH FROM ONE SQUARE MILE * TF!l - RELATIONSHIP BETWEEN TIME TO PEAK ANO CHANNELIZATION * EXPRESSED AS MULTIPLES Of TIME TO PEAK WITHOUT * CHANNELIZATION
* c = 0.000 0.100 0.200 0.300 0.400 o.soo o.600 0.100 0.800 0.900 1.000 1.000 o.892 o.786 o.682 o.587 0.521 o.5oo 0.500 o.500 o.soo o.soo
* AFCTRT(l - RELATIONSHIP BETWEEN DRAINAGE AREA ANO TIME TO PEAK * DRAINAGE AREA IN SQUARE MILES * 1.0 400.0 400.0 400.0 400.0 400.0 400.0 400.0 400.0 400.0 400.0 * TIME TO PEAK RATIO
1.00 2.92 2.92 2.92 2.92 2.92 2.92 2.92 2.92 2.92 2.92 * FLOOD HYDROGRAPH SHAPE DATA
2.0 * HYDINT - HOURS BETWEEN POINTS ON COMBINED HYOROGRAPHS * HYOBAS(I - FIVE BASIC HYDROGRAPH SHAPES - ALL FLOWS EXPRESSED AS * FRACTIONS OF FLOW AT PEAK * SHARPER SHARP AVERAGE FLAT FLATTER
0.002 0.008 0.024 0.265 0.013 • lTPW/4 - 298 -

0.004 0.010 0.084 0.472 0.488 0.470 1.000 1.000 1.000 0.102 0.816 0.892 o.466 o.567 o.654 0.312 o.390 o.515 0.208 0.267 0.411 0.141 0.188 0.310 0.096 0.135 0.240 0.067 0.101 0.194 o.048 0.018 0.163 0.035 0.064 0.149 0.026 0.055 0.142 0.021 0.048 0.133 0.011 o.043 0.125 0.012 0.041 0.118 0.008 0.039 0.112 0.006 0.037 0.106 0.004 0.036 0.101 0.180 0.221 0.297
* FLOOD DAMAGES - GENERAL
o. 503 0.777 1. 000 0.934 0.787 c. 642 0.552 0.445 0.367 0.313 0.274 0.246 0.224 o. 207 C.193 0.181 0.111 0 .162 0.153 0.420
o. 926 0.994 1.000 0.996 0.986 c. 970 0.951 0.927 0.902 0.874 0.844 o. 813 0.781 o. 750 0.718 0.686 0.654 0.624 o.594 o. 830
* 2TPW/4 * 3TPW/4 * PEAK * 5TPl../4 * 6TPW/4 * 7TPW/4 * 8TPW /4 * 9TPW/4 * lOTf'W/4 *llTPti/4 *l2TPW/4 *13TPW/4 *l4TPW/4 *l5TPW/4 *l6TPW/4 *17TPW/4 *lBTPW/4 *19TPIU4 *20TPW/4 *AVG/PEAK
* QOll - EXISTING SUBWATERSHED CHANNEL CAPACITY IN CFS 3710. 2230. 14010. 15380. 18930. 20050. 17890. 16360.
* QKIJ ,AKll,OK() - MAGNITUDE OF ANY KNCWN FLOOD PEAK ANO ASSOCIATED * MAXIMUM DEPTH OF FLOODING ANO AREA FLOODED
* FLOOD PEAK AREA FLOODED MAX !MUM DEPTH * CFS ACRES FEET SUBWATERSHED
11600. 89. 3.0 * 2 13700. 154. 10.2 * 3 47800. 174. 23.3 * 4 47900. 307. 22.1 * 5 49300. 586. 22.8 * 6 50000. 953. 22. 2 * 7 50400. 829. 24.6 * 8 50800. 946. 27.4 * 9
* FLOOD DAMAGES - URBAN 37000. * VLURST - MEAN VALUE OF URBAN STRUCTURES, IN $/ACRE 0.052 * COEFOM - FLOOD DAMAGE f'ER FCCT Of FLOOD DEPTH PER OOLLAR
* OF BUILDING MARKET VALUE * FLOOD DAMAGES - AGRICULTURAL * D(l - FRACTION OF SUBWATERSHED FLOOD PLAIN LAND WITHIN EACH OF
* THREE SOIL CLASSES * BEST SOIL ,ED. SOIL
o.55 o.40 0.10 0.04 1.00 0.92 0.82 0.12 1.00 0.93
* CDA - CROP
o.oo o.oo o.oo 0.03 o.oo 0.01 DAMAGE PER
- 299 -
WORST SOIL 0.05 0.26 o.oo o.oa 0 .18 0.25 c.oo o.oo
ACRE OF MOST
SU BWAT ERSHED * 2 * 3 * 4 * 5 * 6 * 7 * 8 * 9
PRODUCTIVE SOIL WHEN

* FLOODED TO A MINIMAL DEPTH 1,24 * CCB - CROP DAMAGE PER ACRE OF INTERMEDIATE SOIL WHEN
* FLOCDEO TO A MINIMAL DEPTH 0,01 * CCC - CROP DAMAGE PER ACRE OF LEAST PRODLCTJVE SOIL WHEN
* FLCCDEO TO A fl'ItdMAL DEPTH 0,368 * CDAV - INCREMENTAL DAMAGE PER ACRE CF MCST PRCDLCTIVE
* SOIL PER ADDITIONAL FOOT OF FLOOD DEPTH 0,149 * COBV - INCREMENTAL CAMAGE PER ACRE CF INTERMEDIATE
* SOIL PER ADDITIONAL FOGT OF FLOOD DEPTH 0,009 * CCCV - INCREMENTAL CAfl'AGE PER ACRE OF LEAST PRODLCTIVE
* SOIL PER ADDITICNAL FCOT OF FLOOC DEPTH * FRU(l - RELATIONSHIP BETWEEN AGRICULTURAL PRODUCTIVITY AND * URBANILATION EXPRESSED AS A MULTIPLE CF FULL RURAL VALUE * U;0,00 0,10 0,20 C,30 0,40 C,50 0,60 0,70 0,80 0,90 l,00
1.00 0,97 0,91 0,82 0,71 0,58 0,44 0,37 0,30 0,23 0,16 0,0 * VLAGST - MEAN VALUE OF AGRICULTURAL STRUCTURES,
* lN $/ACRE * FLOOD DAMAGES - UNCERTAINTY
2,575 * VA - NORMAL DEVIATE USED IN EVALUATING UNCERTAINTY * GENERAL DESIGN VARIABLES
0,03125 * R - DISCOUNT RATE USEC IN PLANNING 50,0 * TIMST - DESIGN LIFE OF CHANNEL IMPROVEMENTS IN YEARS 10,0 * TIME - DURATION OF ONE PLANNING STAGE 1 * MRDF - LOCATION IN ARRAY DF CF MINIMUM RESERVOIR
* DESlGN FLOOD 10 * NDF - NUMEER Of DESIGN FLCCO FREQUENCIES CONSIDERED
* OFll - DESIGN FLOOD FREQUENCIES TC BE CONSIDERED IN ANALYSIS 0,43 0,30 0,20 0.15 0,10 0,07 C,C4 0,02 0,01 0,005
* CHANNEL IMPROVEMENT - PHYSICAL FACTORS * AO(J - INITIAL SUBWATERSHED CHANNEL CROSS SECTIONAL AREA IN SC,FT,
940, 940, 3700, 3700, 3700, 3700, 3700, 3700, * LINING() - DESIGNATION OF CHANNEL TYPES TO BE CONSIDERED !N * SUBWATERSHED * •o• ALL TYPES OF CHANNEL IMPROVEMENT TO BE CONSIDERED * •1• CONSIDERS ONLY UNLINED CHANNELS, NO EXISTING DROP * STRUCTURES * •2• CONSIDERS ONLY UNL!NEC CHANNELS, EXISTING DROP * STRUCTURES * 1 3' CONSIDERS ONLY TRAPEZOIDAL LINED CHANNELS * '4' CONSIDERS ONLY RECTANGULAR LINED CHANNELS
0 0 0 0 C O C C 0,025 * MANNU - MANNINGS 'N' FOR UNLINED PRISMATIC CHANNELS 0,016 * MANNT - MANNINGS 'N' FOR LINED TRAPEZOICAL C~ANNELS 0,012 * MANNR - MANNINGS 1 N' FOR LINED RECTANGULAR CHANNELS 1.5 * ZU - SlDE SLCPE OF UNLINED PRISMATIC CHANNELS 1,0 * ZT - SIDE SLOPE OF LINED TRAPElCIOAL CHANNELS
* S(l - AVERAGE LONGITUDINAL SUBWATERSHED CHANNEL SLOPE ,001712 ,001916 ,000710 ,000798 .000521 ,000571 ,000413 ,000505
* Tfll - MAXIMUM ALLOWABLE TRACTIVE FORCE FOR SUBWATERSHEO CHANNELS * IN POUNDS PER SQ,FT,
2,5 2,5 2,5 2,5 2,5 2,5 2,5 2,5 10,0 * BCMAX - MAXIMUM ALLOWABLE RATIO OF CHANNEL BOTTOM
- 300 -

4.0
25. 6.0
* CAP I I
* * l 32300. 21200.
126500. 185000. 397000. 250000.
-1. -1.
30.0 * CHANNEL
0.45 1.10
900.0 0.70 60.0
15.0 300.0 3.584
1.00
1.15
1.45
0.005
0.015
o.o 1
* WIDTH TO DEPTH * BONIN - MINIMUM ALLO,fllBLE RATIO OF CHANNEL BOTTOM * WIDTH TO DEPTH * HMAX - MAXIMUM CHANNEL DESIGN DEPTH, IN FEET * NIN - NO. DRAINAGE INLETS REQUIRED PER MILE OF CHANNEL
- NUMBER ANO CAPACITY IN CFS OF EXISTING BRIDGES HIGHWAY BRIDGES RAILWAY BRIDGES
2 3 4 5 6 l 2 30930. 25920. 23500. -1. -1. 21200. -1. -1. -1. -1. -1. -1. 15900. 15900.
126500. -1. -1. -1. -1. 126500. -1. 177000. 110480. -1. -1. -1. 140000. 127000. 241000. 209650. 192000. -1. -1. 233000. 192000.
-1. -1. -1. -1. -1. 155000. -1. -1. -1. -1. -1. -1. -1. -1. -1. -1. -1. -1. -1. 284000. 185000. * BW - REQUIRED WIDTH OF HIGHWAY BRIDGES IN FEET
IMPROVEMENT - COST FACTORS * ex - UNIT COST OF CHANNEL EXCAVATION IN $/C.Y.
SUBW * 2 * 3 * 4 * 5 * 6 * 7 * 8 * 9
* FM - MULTIPLIER FOR CHANNEL EXCAVATION COST TO ACCOUNT * FOR RIPRAP ANO SEEDING * CIN - COST PER DRAINAGE INLET IN DOLLARS * CLSF - UNIT COST OF TRAPEZOIDAL LINING IN $/SQ.FT. * COY - COST OF IN PLACE STRUCIURAL CONCRETE FOR * RECTANGULAR CHANNELS IN $/SQ.FT. * CBR - UNIT COST OF HIGHWAY BRIDGES IN $/SQ.FT. * ORR - UNIT COST OF RA ILROAO BRIDGES IN $/LINEAR FT. * AQR - MULTIPLE OF fUGHT-OF-WAY COST USED TO INCLUDE * COSTS OTHER THAN FOR LANO ANO IMPROVEMENTS * SAFC - RATIO OF RIGHT-OF-WAY WIDTH TO BE HELO TO * RIGHT-OF-WAY WIDTH EXPECTED TO BE REQUIRED * CSN - MULTIPLE OF CHANNEL CONSTRUCTION COST TO ACCOUNT * FOR CONTINGENCIES * ESM - MULTIPLE OF CHANNEL CONSTRUCTION COST TO ACCOUNT * FOR DESIGN, ADMINISTRATION, AND SUPERVISION OF * CONSTRUCTION * MIN - ANNUAL MAINTENANCE CCST OF CONCRETE STRUCTURES AS * FRACTION OF FIRST COST * MOH - ANNUAL MAINTENANCE COST OF EARTH CHANNELS AS A * FRACTION Of FIRST COST * MILCH - ANNUAL MAINTENANCE COST OF TRAPEZOIDAL LINED * CHANNELS AS A FRACTION OF FIRST COST
* FLOOD PROOFING - COST FACTORS 0.035 * FP - COST Of FLOOD PROOFING PER FOOT Of DESIGN FLOOD
* DEPTH PER DOLLAR Of BUILDING MARKET VALUE 1.00 * VF - RATIO Of AREA REQUIRING FLGOD PROOFING TO THAT
* INUNDATED BY lHE DESIGN FLOOD 1.30 * DO - MULTIPLIER FOR FLOOD PROOFING INSTALLATION COST TO
* ACCOUNT FOR DESIGN AND CONTINGENCIES 0.05 * MFP - ANNUAL MAINTENANCE COST Of FLOOD PROOFING MEASURES
* AS A FRACTION OF FIRST COST * LOCATION ADJUSTMENT - COST FACTORS
- 301 -

1.00 * CLEN - ANNUAL COST OF ENFORCING LAND USE RESTRICTIONS II\ * DOLLARS PER ACRE
0.08 14.45
* RPI - RETURN RATE REQUIRED BY PRIVATE INVESTORS IN LANO * FIA - EXPECTED ANNUAL FARM INCOME FROM MOST PRODUCTIVE * SOil IF FLOODING ODES NOT OCCUR
6.70 * FIB - EXPECTED ANNUAL FARM INCOME FROM INTERMEDIATE * SOIL IF FLOODING DOES NOT OCCUR
0.28 * fIC EXPECTED ANNUAL FARM INCOME FROM LEAST PRODUCTIVE * SOIL IF FLOODING DOES NOT OCCUR
o.oo * IPP - ANNUAL OPEN SPACE AMENITIES AS A MULTIPLE OF THE * FRACTION OF SLRROUNDING LAND BEING URBAN
* DEGREE OF URBANIZATION * USUBW( I - FRACTION CF SUBWATERSHEO FLCOO PLAIN IN URBAN USE * AFTER AFTER AFTER AFTER AFTER * NOW TIME 2TIME 3TIME 4TIME 5TIME * YEARS YEARS YEARS YEARS YEARS
0.0335 0.0335 0.0335 0.0335 0.0335 0.0335 0.1350 0.1350 0.1350 0.1350 0.1350 0.1350 0.0611 0.0611 0.0611 C.0611 0.0611 0.0611 0.0917 0.0917 0.0917 0.0917 0.0917 0.0917 0.4839 0.4839 0.4839 0.4839 0.4839 0.4839 0.1039 0.1039 0.1039 C.1039 0.1039 0.1039 0.0241 0.0241 0.0241 0.0241 0.0241 0.0241 0.0128 0.0128 0.0128 0.0128 0.0128 0.0128 0.0154 0.0154 0.0154 0.0154 0.0154 0.0154
* UTOTR(I - FRACTION CF TRIBUTARY AREA ADDED IN URBAN * AFTER AFTER AFTER AFTER AFTER * NOW TIME 2TIME 3TIME 4TIME 5TIME * YEARS YEARS YEARS YEARS YEARS
0.0002 0.0002 0.0002 c.0002 0.0002 0.0002 0.0017 0.0011 0.0011 0.0011 0.0017 0.0017 0.0010 0.0010 0.0010 0.0010 0.0010 0.0010 0.0015 0.0015 0.0015 0.0015 0.0015 0.0015 0.0968 o.0968 o.0968 o.0968 0.0968 0.0968 0.0052 0.0052 0.0052 0.0052 0.0052 0.0052 0.0013 0.0013 0.0013 0.0013 0.0013 0.0013 0.0001 0.0001 0.0001 0.0001 0.0001 0.0001 0.0001 0.0001 0.0001 0.0001 0.0001 0.0001
* LAND VALUE * VALUE(J - VALUE OF LAND IN SUBWATERSHEO FLOOD PLAIN,
* AFTER AFTER AFTER AFTER AFTER
* NOW TI '1E 2TIME 3TIME 4TIME 5TIME
* YEARS YEARS YEARS YEARS YEARS 130. 130. 130. 130. 130. 130. 133. 133. 133. 133. 133. 133. 131. 131. 131. 131. 131. 131. 231. 231. 231. 231. 231. 231.
50000. 50000. 50000. 50000. 50000. 50000. 380. 380. 380. 380. 380. 380. 133. 133. 133. 133. 133. 133. 181. 181. 181. 181. 181. 181. 174 174. 174. 174. 174. 174.
- 302 -
SUBWATER SHED
* l * 2 * 3 * 4 * 5 * 6 * 7 * 8 * 9
DEVELOPMENT
SUBWATERSHED
* l * 2 * 3 * 4 * 5 * 6 * 7 * 8 * 9
IN $/ ACRE
SUBWATERSHED
* 1 * 2 * 3 * 4 * 5 * 6 * 7 * 8 * 9

* HYDRCLCGIC DATA FOR RESERVOIR DESIGN 2.ao * HYDMLl - RATIO OF EMERGENCY SFILLWAY DESIGN FLOOD PEAK
* TO THE 200-YEAR FLOOD PEAK 60.4 * AhG - DRAINAGE AREA IN SQ. Ml. USEC TO DEVELOP
* CUMULATIVE RUNOFF CURVE 20 * 11",PTY - NUMBER Of DAYS THE DESIGN FLOOD IS DETAINED IN
* THE RESERVOIR * CUMVOLII - CUMULATIVE RUNOFF CURVE - AVERAGE FLCh IN CFS BY * OURAT ION IN DAYS * 0.25 o.sc 0.75 1.00 1.25 1.50 1.75 2.00
2523. 2205. 2030. 1905. 1816. 1727. 1639. 1567. * 4.00 s.oo 6.oo 1.00 s.oo 9.oo 10.00 11.00
919. 876. 778. 709. 646. 591. 540. 500. *13.00 14.00 15.00 16.00 11.00 18.00 19.00 20.00
461. 444. 416. 398. 382. 366. 351. 340.
3.00 1168.
12.cc 475 •
0 * IB - WHETHER XTRSTR IS NEEDED NO~ - "0" INDICATES NC DAM * TO BE BUILT UNLESS JUSTIFIED BY FLOOD CONTROL
o.o * GOELAY - NUMBER CF hOURS hYOROGRAPH DELAYED BY * CLOSING GATES
* MUSKINGUM ROUTING PARAMETERS * K{NAT) KIIMPl X(NATl X(IMP) SUBWATERSHEO
1.27 C.95 0.24 0.36 * 2 1.65 1.24 0.24 0.36 * 3 1.59 1.19 0.24 0.36 * 4 1.24 0.93 0.24 0.36 * 5 2.50 1.87 0.24 0.36 * 6 5.73 4.30 C.24 0.36 * 7 3.21 2.40 0.24 0.36 * 8 4.09 3.06 0.24 0.36 * 9
* PROPERTIES Of ThE DAM SITE BY ELEVATION CONTOURS 18 * IMAX - NU~BER OF ELEVATIONS USED IN INPUT DATA 1 * NH!LSD - NUMBER OF ALTERNATIWE SPILLWAY LOCATIONS * ELEVA RESACR LGDAM LGEMSP LGAPCH CRELOC HLSIDL
948. o. o. 300. 200. o. o. 950. 2. 70. 300. 200. o. 35. 960. 23. 180. 300, 200. o. 100. 970. 99. 260. 300. 200. o. 140. 980, 188. 330. 300. 200. o. 160. 990. 292. 390. 300. 200. o. 180.
1000. 393. 430. 300. 200. o. 210. 1010. 508. 510. 300. 200. 1160000. 250. 1020. 627. 560. 300. 200. 2211000. 300. 1030. 748. 610. 300. 200. 3070000. 350. 1040. 875. 670. 300. 200. 3830000. 420. 1050. 1032. 700. 300. 220. 4610000. 520. 1060. 1220. 730. 300. 2~0. 5555000. 680. 1070. 1428. 770. 300. 260. 6810000. ICBC. 1080. 1640. 810. 300. 280. 8308000. 1250. 1120. 2490. 980. 350. 350. 12820000. 1530. 1160. 3340. 1200. 400. 420. 15850000. 1700, 1200. 4190. 1450. 450. 500. 18210000. 1850.
* VOLUME OF RETAINING WALL CONCRETE AS A FUNCTION OF WALL HEIGHT - 303 -

2 * NWh - NUMBER OF WALL hEIGHTS USED * WALL HEIGHT CONCRETE * FEET CY/FT
o.o o.o 50.C O.O
* PHYSICAL FACTORS USED IN DAM AND RESERVOIR DESIGN s.o
o.o 300.0 2.6 3.0
44.0 1. 0
* BYVERT - VERTICAL DISTANCE IN FEET FROM DAM TOP TO * RIGHT-OF-WAY PURCHASE L1NE * CONBOT - THICKNESS IN FEET OF CONCRETE CHUTE BOTTOM * CTBW - WIDTH IN FEET CF CUTOFF TRENCH BOTTOM * CWEIR - EMERGENCY SPILLWAY WEIR COEFFICIENT * DMFRBO - DAM FREEBOARD IN FEET ABOVE PEAK OF EMERGENCY * SPILLWAY FLOCD * OMTPW - WIDTH IN FEET OF TOP Of DAM * DPRCKH - DEPTH IN FEET TO BEDROCK ON EMERGENCY SPILLWAY * HILLSIDE
1.0 * DPRCKV - DEPTH IN FEET TO BEDROCK 3.0 * DPRP - DEPTH IN FEET CF RlPRAF ON 0.0133 * FPIPE - DARCY FRICTION FACTOR FOR
UNDER DAM DAM FACE PRINCIPAL SPILLWAY
1.25
0.30 o.o 3.0 955.2 700.0
* PIPE * QRATIO - RATIO OF PEAK TO AVERAGE PRINCIPAL SPILLWAY * DISCHARGE * SEDIN - ANNUAL SEDIMENT INFLOW IN ACRE-FEET/SQUARE MILE * STLBOT - THICKNESS IN FEET OP STILLING BASIN BOTTOM * TRV - DESIGN FLOW VELOCITY THROUGH TRASHRACK IN FEET/SEC * TWELEv - DESIGN TAILWATER ELEVATION * WDEMSP - INITIAL VALUE OF EMERGENCY SPILLWAY DESIGN * WIDTH IN FEET
152SO. * XlRSlR - CONSERVATION STORAGE IN ACRE-FEET 1.0 * ZCT - CUTOFF TRENCH SIDE SLOPE 2.5 0.25 3.0
* UNIT 1.50 0.75
4.00 0.50 1. 50 69.0 160.0 75.0 750.0
100.0 1.15 1.45 O.OOB
* ZDN - SLOPE Cf DOWNSTREAM FACE OF DAM * ZES - CUT SLOPE IN HILLSIDE ABOVE EMERGENCY SPILLWAY * ZUP - SLOPE OF UPSTREAM FACE OF DAM
COST FACTORS FOR ESTIMATING COST OF DAM AND RESERVOIR * UCOAM - COST Of DAM EMBANKMENT IN $JCY * UCCl - COST OF CUTOFF TRENCH EXCAVATION ANO BACKFILL * IN $/CY * UCRP - COST OF RIPRAP IN $/CY * UCSPEX - COST OF SPILLWAY EARTH EXCAVATION IN $/CY * UCRKEX - COST OF SPILLWAY ROCK EXCAVATION IN $/CY * UCSPCN - COST Of EMERGENCY SPILLWAY CONCRETE IN $/CY * UCPRCN - COST CF PRINCIPAL SPILLWAY CONCRETE IN $/CY * UCCNIO - COST OF IMPACT OISSIPATOR CONCRETE IN $/CY * UCTRK - CCST OF TRASH RACK AND INLET STRUCTURE IN * $/SQ.FT. OF OPENING * UCCLR - COST OF RESERVOIR SITE CLEARING IN $/ACRE * CSMD - COST MULTIPLIER TO INCLUDE CONTINGENCIES * ESMO - COST MULTIPLIER TO INCLUDE ENGINEERING * MDAM - ANNUAL MAINTENANCE COST AS A FRACTION OF * CONSTRUCTION COST
* DMBN(I - BENEFITS ACCRUING DOWNSTREAM FRCM AREA CF PRIMARY ANALYSIS AS A FUNCTION OF RESERVOIR FLOOD CONTROL STORAGE *
- 304 -

* FLOOD STORAGE IN ACRE-FEET o.o o.o 31600. 316000. 31tooo. 3160do. 31tooo. 316000. 316000. 310000.
* BENEFITS IN DOLLARS c.o o.o 85600. 856000. 856000. 856000. 856000. 856000. 856000. 856000.
* OMBNF() - STAGE MULTIPLIERS FOR DOwNSTREAM BENEFITS * STAGE l 2 3 4 5
0.8617 0.9522 1.0513 1.1616 1.2831
- 305 -

..,., 0
"' al E-1 :r: ~
E-1 0 al
~ BOTTOM
I· SPLNG • 1.. CHLNG • 1.. SBLNG__J
EMSPLG
Figure A. Emergency Spillway Profile (Not to scale)
-

w 0 --J
I
downstream
I" DMTPW" I ELRPTP
DPRP
i ELDMTP=TPELEV t DMFRBD
---------"---ELSPTP
-----ELSPFL
FLDSTR
---ELPRFL
XTRSTR
SEDSTR
....._----~-----~ZCT
I.. CTBW .. I
Figure B. Dam Cross Section (Not to scale)

"" 0 co I
WU ~~~~~~~~------1 13
Reference Distance to Marked Points
WD
HL4 HL 11
HL 13
HLH
HLL
r 11 ~ v ---~/~ ~----
TPELEV 1 .' ,I' DfRC<fl - / ___,- - /? ...... ,J....,~·I_::;.;-•~ / ---1 1 .11 /
~
, (us / 2 I• WDEMSP /
Elevations at Marked Points
i -..[_ ELS PPL ' I .,_f I
/
, ~ _____ I__j /ZES
ZES~3 / HLL ~ --- ___ .....//
HLH ., I Figure C. Emergency Spillway Cross Section
(Not to scale)
-
EL 1
EL 2
.EL 3
EL4
EL 11
EL 13

LIST OF REFERENCES
1. Bhavnagri, Viraf S. , and Bugliarello, George. "Ma the ma tica l Representation of an Urban Flood Plain," Proceedings of the American Society of Civil Engineers, 91, HY2, (March, 1965), 149-173.
2. Chow, V. T. Handbook of Applied Hydrology. New York: McGraw-Hill Book Co., Inc., 1964.
3. Crawford, N. H. , and Linsley, R. K. Digital Simulation in Hydrology; Stanford Watershed Model N. Stanford, California: Stanford University Department of Civil Engineering, Technical Report No. 39, July, 1966.
4. Dempsey, Clyde R. The Effects of Geographical and Climatic Setting on the Economic Advantages of Alternative Flood Control Measures. Lexington, Kentucky: University of Kentucky, Water Resources Institute, Research Report No. 10, 1968.
5. Dorfman, Robert. "Economic and Technologic Concepts," Maass, et.al., Design of Water-Resource Systems. Cambridge: Harvard University Press, 1962.
6. Dowell, Charles 0. Derivation of Reservoir Operating Rules by Economic Analysis. Lexington, Kentucky: University of Kentucky, Water Resources Institute, Research Report No. 6, 1967.
7. Eckstein, Otto. Water Resources Development - The Economics of Project Evaluation. Cambridge, Massachusetts: Harvard University Press, 1961.
8. Engineering News Record. Vol. 118 (March 11, 1937), 385.
9. Englebert, et. al. "The Rural Fringe Problem," Farm Policy Forum. Iowa State College, Winter, 1957.
- 309 -

LIST OF REFERENCES (Continued)
10, Herring, Frances W. Regional Parks and Open Space: Selected Conference Papers. Berkeley: University of California, Bureau of Public Adminis tra lion, June, 1961,
11. Higgins, John M, The Effect of Landowner Attitude on the Financial and the Economic Costs of Acquiring Land for a Large Public Works Project. Lexington, Kentucky: University of Kentucky, Water Resources Institute, Research Report No. 3, 1967,
12. Hillery, G. A. Population Growth in Kentucky: 1820-1960. Lexington, Kentucky: Agriculture Experiment Station, Department of Rural Sociology, 1966,
13. James, L. D. A Time-Dependent Planning Process for Combining Structural Measures, Land Use, and Flood Proofing to Minimize the Economic Cost of Floods. Stanford, California: Stanford University, Project on Engineering-Economic Planning, Report EEP-12, August, 1964.
14. James, L. D. "Economic Analysis of Alternative Flood Control Measures," Water Resources Research, Vol. 3 (Second Quarter, 1967), 333-343.
15. James, L. D. "Nonstructural Measures for Flood Control," Water Resources Research, Vol. 1 (First Quarter, 1965), 9-24.
16. James, L. D. "Preservation of Right-of-Way for Public Facilities," Proceedings of the American Society of Civil Engineers, Vol. 93, No. UP4 (December, 1967), 243-255.
17. Linsley, R. K., and Franzini, Joseph B. Water Resources Engineering. New York: McGraw-Hill Book Co., Inc., 1964,
18. Linsley, R. K., Kohler, M.A., and Paulhus, J. L. H. Hydrology for Engineers, New York: McGraw-Hill Book Co., Inc., 1958.
- 310 -
•

/
I
LIST OF REFEREJc'<ICES ' (Contir.,ued)
19. McCabe, John A. Flr.Jods in Kentucky - Magnitude and Frequency. Lex.1ngton, Kentucky: University of Kentucky, Kentucky Gec-J10gical Survey, 1962.
20. McDonald-, Herman P., and Blevins, Robert L. Reconnaissance Soil <;Survey of Fourteen Counties in Eastern Kentucky. We< shington, D. C.: U. S. Government Printing Office (:;:,oil Conservation Service, Series 1962, No. 1), 1965.
21. parker, Francis H. Flood Damage Abatement in Kentucky. Frankfort, Kentucky: Kentucky Department of Commerce, October, 1964.
22. Rachford, Thomas M. Economic Analysis of Alternative Flood Control Measures by Digital Computer. Lexington, Kentucky: University of Kentucky, Water Resources Institute, Research Report No. 1, 1966.
23. Rosenbaum, David H. Review of the Economic Benefits and Costs Resulting from Dewey Reservoir. Lexington, Kentucky: University of Kentucky, Water Resources Institute, Research Report No. 5, 1967.
24. Sheaffer, John R. Flood Proofing: An Element in a Flood Damage Reduction Program. Chicago, Illinois: University of Chicago, Department of Geography, Research Paper 65, 1960.
25. Task Force on Federal Flood Control Policy. A Unified National Program for Managing Flood Losses. Washington, D. C.: U. S. Government Printing Office (House Document No. 46 5, 89th Congress, 2nd Session), 1966.
26. Tomlinson, M. J. Foundation Design and Construction. New York: John Wiley and Sons, Inc. , 1963.
27. U. S. Army Corps of Engineers. Carr Fork Reservoir Design Memorandum 2: Pertinent Data. Louisville, Kentucky: Louisville District, U. S. Army Corps of Engineers, April, 1965.
- 311 -

I ,:
\
\
\
LIST\oF REFERENCES (c-.__,ritinued)
28. U.· S. Army Corps of Engineers. ,flood Plain Information: Ohio River. Louisville, Kentuc·,lcy: Louisville District, U. S. Army Corps of Engineers, June, 1967.
29. U. S. Army Corps of Engineers. Kingdom lJ.r,me Reservoir: Pertinent Data and Plan Considered. Louhnrille, Kentucky: Louisville District, U. S. Army Corps of Eng:,;.neers, January, 1968.
30,. U. S. Army Corps of Engineers, Mississippi River CL,mmission. Mississippi River Reservoir Benefit Study. Vicksburs,·, Mississippi: Vicksburg District, U. S. Army Corps of Engineers, 19 61.
31. U.S. Congress. Senate. Policies, Standards, and Procedures in the Formulation, Evaluation, and Review of Plans for Use and Development of Water and Related Land Resources, Document No. 97 and Supplement No. 1, 87th Congress, 2nd Session, 1962.
32. U. S. Department of Commerce, Bureau of the Census. United States Census of Agriculture: 1964. Vol. l, State and Counties, Part 30 Kentucky. Washington, D. C.: U. S. Government Printing Office, 19 6 7 .
33. U. S. Department of CommeECe, Bureau of the Census. United States Census of Population: 1960. Vol. 1, Characteristics of the Population, Part 19 Kentucky. Washington, D. C.: U. S. Government Printing Office, 1963.
34. U. S. Department of the Interior, Bureau of Reclamation. Design of Small Dams. Washington, D. C.: U.S. Government Printing Office, 1960.
35. U.S. Department of the Interior, Geological Survey. Surface Water Records of Kentucky. Louisville, Kentucky, 1961-1965.
36. U.S. Department of the Interior, Geological Survey. Surface Water Supply of the Ohio River Basin. Washington, D. C.:
- 312 -
•
Ii
.J

LIST OF REFERENCES (Continued)
U.S. Government Printing Office, 1939-1960.
37. United States Soil Conservation Service. Economics Guide for Watershed Protection and Flood Prevention. Washington, D. C.: U. S. Government Printing Office, 1958.
38. Villines, James R. Economic Analysis of Flood Detention Storage by Digital Computer. Lexington, Kentucky: University of Kentucky, Water Resources Institute, Research Report No. 9, 1968.
- 313 -

·•
•
Copyright © 2022 FDOKUMEN


![.Noah's Flood WTJ2004[1]](https://static.fdokumen.com/doc/165x107/631c39e73e8acd997705cf6b/noahs-flood-wtj20041.jpg)