Cadmos-serpent en Illyrie. Itinéraire d'un héros civilisateur, Pisa, Pisa University Press, 2010.
Upload
independentCategory
view
1download
0
ARTICLE IN PRESS
Nuclear Instruments and Methods in Physics Research A 519 (2004) 610–622
*Corresp
E-mail a
0168-9002/$
doi:10.1016
PISA – an experiment for fragment spectroscopyat the Internal Beam of COSY: application of an
Axial Ionization Chamber
R. Barnaa, V. Bollinib, A. Bubakb,g, A. Budzanowskic, D. De Pasqualea, D. Filgesb,S.V. F .ortschd, F. Goldenbaumb, A. Heczkoe, H. Hoddef, A. Italianoa, L. Jarczyke,B. Kamyse, J. Kisielg, M. Kistrync, St. Kistryne, St. Kliczewskic, A. Kowalczyke,P. Kulessab,c, H. Machnerb, A. Magierae, J. Majewskib,e, W. Migda"e, H. Ohmb,N. Paulb, B. Piskor-Ignatowicze, K. Pyszb,c,*, Z. Rudye, H. Schaalb, R. Siudakc,f,E. Stephang, G.F. Steynd, R. Sworste, T. Thovhogid, M.Wojciechowskie, W. Zipperg
a Institute of Physics, Messina University, Italyb Institut f .ur Kernphysik, Forschungszentrum J .ulich GmbH, GermanycH. Niewodnicza !nski Institute of Nuclear Physics, Krak !ow, Poland
d iThemba LABS, Somerset West, South AfricaeM. Smoluchowski Institute of Physics, Jagellonian University, Krak !ow, Poland
f Institut f .ur Strahlen- und Kernphysik, Bonn University, Germanyg Institute of Physics, University of Silesia, Katowice, Poland
Received 22 April 2003; received in revised form 7 October 2003; accepted 7 October 2003
Abstract
The Proton-Induced SpAllation (PISA) experiment performed at the internal beam facility of the COSY storage ring
in J .ulich, Germany, which is aimed at the precise measurement of double differential cross-sections over a broad range of
energies and angles for spallation reactions induced by protons of 200–2500 MeV energy in various targets, is presented.
In this paper the emphasis is put on the design, principles of operation and performance of a Bragg Curve Detector (BCD)
optimized for internal beam experiments at storage rings. Very clean and distinct product identification (with Z up to
B14) from reactions, in which a Ni target was bombarded with a 1:9 GeV circulating proton beam, is obtained. The
individual elements are resolved for emission energies higher than 0:5 MeV=nucleon: Moreover, due to the detector read-
out achieved by coupling a specially designed current sensitive preamplifier directly to a sampling ADC, the shape analysis
of the signals from the BCD allows the isotope identification of light particles with A up toB11: It is also found that theBCD can be used efficiently as a thin DE detector for the telescope consisting of the BCD and a series of silicon detectors.
r 2003 Elsevier B.V. All rights reserved.
PACS: 29.40.C; 25.40.S; 29.20.D
Keywords: Bragg curve detector; Spallation; Mass and charge spectroscopy; DE-E Technique; Storage ring
onding author.
ddress: [email protected] (K. Pysz).
- see front matter r 2003 Elsevier B.V. All rights reserved.
/j.nima.2003.10.084
ARTICLE IN PRESS
R. Barna et al. / Nuclear Instruments and Methods in Physics Research A 519 (2004) 610–622 611
1. Introduction
The basic problem of the disintegration of anucleus when its stability is disturbed by theenergy-momentum transfer from an energeticprojectile is still not fully understood and, more-over, there is even a severe lack of sufficientlyreliable models or parameterizations capable ofdescribing larger sets of experimental data.Various terminologies used for such decay
processes include: break-up, spallation, fragmen-tation, multifragmentation. In the low incidentenergy range, where the involved interactions arenot very violent, the processes are commonlyreferred to as ‘‘spallation’’ reactions in order todescribe the nature of the phenomenon.The existing reaction models attempt to repro-
duce the measured observables, like the yields ofvarious ejectiles, their energy and angular distribu-tions, the emission time sequence, the excitationenergy of the emitting source and the distributionsof the residua of the reactions, by taking intoaccount the amount of the transferred energy, thecomposition and structure of the nucleus, thepropagation modes of the excitation amongst theconstituents of the nucleus, the interaction time,etc. The complexity of the interacting many-bodysystem at present excludes a purely quantum-mechanical treatment of the problem. Instead,semi-classical approaches are being applied. Themost popular approach is to simulate the firstphase of the reaction by means of the so-calledintra-nuclear cascade (INC) model followed by theevaporation from the energetically equilibratedsystem [1]. More sophisticated approaches utilizethe method based on Boltzmann–Uehling–Uhlen-beck (BUU) or Vlasov–Uehling–Uhlenbeck(VUU) equations or use the Quantum MolecularDynamics (QMD) model [2,3]. In this regard arelatively simple parameterization was proposed inRef. [4].The development of theoretical models or even
the invention of parameterizations possessingstrong predictive power is however retarded bythe lack of sufficiently complete and preciseexperimental data. The Proton Induced SpAllation(PISA) collaboration has started an experimentalprogram, which will supply precise and extensive
experimental data sets, especially in areas wherethe experimental knowledge about the spallationprocess is rather sparse. The collected data willfacilitate the more reliable modeling of nuclideproduction in nucleon–nucleus collisions over abroad range of incident proton energies andtargets what is of great importance in manyapplications, both for fundamental studies innuclear physics and astrophysics as well as inapplied physics (material damage and radiationprotection, radiation therapy, spallation neutronsources and transmutation of nuclear waste,accelerator driven energy amplifier, etc.).In the next section the idea behind the fragment
spectroscopy in the PISA experiment is described,while Section 3 deals with the design, constructionand performance of the axial ionization chambers(Bragg curve detectors (BCD)) used as the maindetectors in the experiment. A summary andperspectives of the experimental development arepresented in Section 4.
2. PISA – a new experiment for spallation studies
The PISA experiment [5] is devoted to measuredouble differential cross-sections for spallationproducts coming from various targets (C, N, O,Si, Fe, Ni, Au, U), which are bombarded byprotons of energies in the range from 200 MeV upto 2:5 GeV: In order to obtain undistortedinformation about the mechanism of the primaryreactions, the use of thin targets ðB100 mg=cm2Þ isan important prerequisite. To compensate for thelow reaction rate due to the use of such thin targetsthe experiment is performed using the internalbeam of the COoler SYnchrotron (COSY) atForschungszentrum J .ulich, Germany. The circu-lating proton beam has an intensity of about 5�1010 protons. In average each proton can passthrough the target about 105 times before thebeam is used up as a result of the interactions withthe target. Then the storage ring is filled again. Thelength of the duty cycle can be easily adjusted inorder to obtain the optimal counting rate. In thePISA experiment this cycle lasts typically forseveral seconds. In effect, the achievable beam-target luminosity is some orders of magnitude
ARTICLE IN PRESS
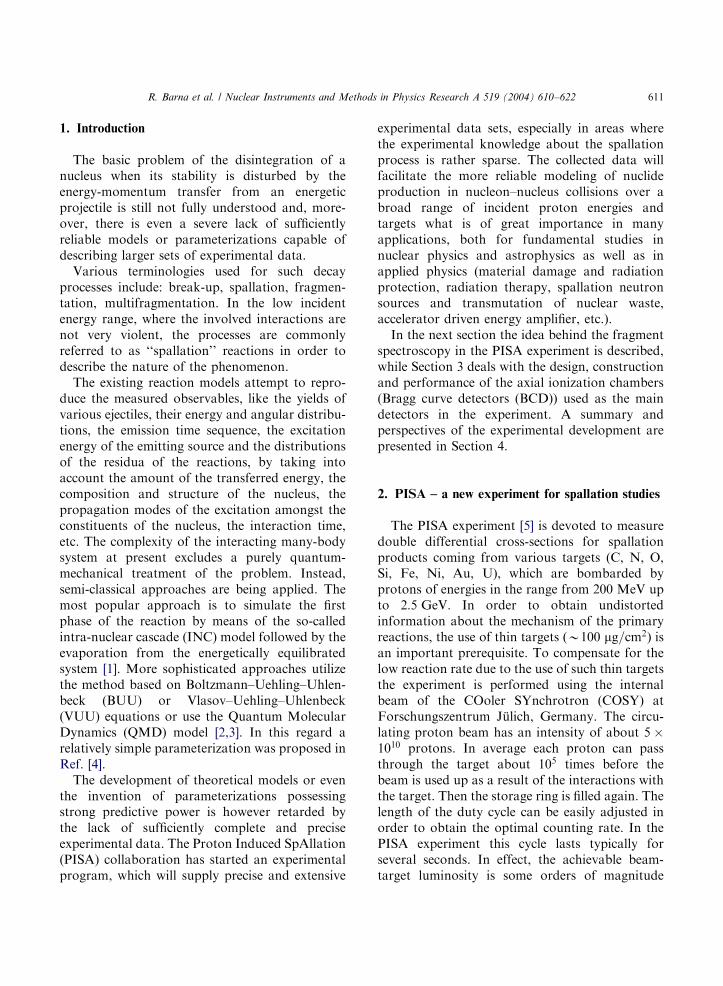
Fig. 1. Apparatus of the PISA experiment during the first
experimental run in October 2002. Two fully equipped
experimental arms, each containing a telescope for time-of-
flight measurement comprising two microchannel plate (MCP)
detectors followed by a Bragg curve detector and a semicon-
ductor detector telescope, were installed at laboratory detection
angles of 15� and 120�: At the detection angles of 35� and 100�
telescopes each consisting of four silicon detectors were used.
These telescopes were cooled down to a temperature of �10�C:At the end of each arm phoswich detectors were installed either
as a last detector in the detection arm or as an individual
detector. The beam-target luminosity is measured by counting
the d-electrons, which are knocked-out from the target. For
further details see text.
R. Barna et al. / Nuclear Instruments and Methods in Physics Research A 519 (2004) 610–622612
higher than that of conventional external beamfacilities.The purpose of the PISA detection system (Fig. 1)
is to register charged reaction products over thebroadest possible range of energies and masseswith special emphasis on detection and preciseidentification of low-energy particles. This is doneat eight fixed angles in the laboratory system whereindependent detection devices (so-called detectionarms) are installed in the reaction plane. Two ofthem—at 15� and 120� laboratory angles—con-tain telescopes for time-of-flight (TOF) measure-ments (two microchannel plate (MCP)-baseddetectors with carbon foils of 15 mg=cm2 thicknessworking as electron emitters) followed by a BCDdetector. Directly behind the BCD, still inside itshousing, a telescope of three silicon detectors isinstalled. These detection arms are ended with aphoswich detector. Detector telescopes each con-sisting of four silicon detectors are used at thedetection angles of 35� and 100�: These telescopesare cooled down to a temperature of �10�C: Thecooled Si-detector telescopes are also followed byphoswich detectors. Four additional phoswichdetectors are installed at angles of 20�; 50�; 65�
and 80� with respect to the beam direction. Allphoswich detectors are separated from the vacuumby 50 mm thick stainless-steel windows. With thefully equipped detection arm (telescope for TOFmeasurement, BCD, Si-detector telescope andphoswich detector) the identification of elementsis possible from Z ¼ 1 to ZB20; whereas theisotopes can be separated for Ap20: The detectionenergy ranges from 0:5 MeV=nucleon (for ZX2)up to 150 MeV=nucleon (including also thehydrogen isotopes). Two semiconductor detectortelescopes installed near the target are used asbeam luminosity monitors, which count the d-electrons ejected from the target. In order toachieve as small as possible forward detectionangles the target is shifted from the geometricalcentre of the scattering chamber upstream alongthe beam axis.The scattering chamber is equipped with a
movable target holder, a pincer grip and a targetmagazine, which can store up to eight targets. Thissetup allows targets to be exchanged during theexperiment without disturbing the ultra-high
vacuum (UHV) conditions in the chamber and inthe COSY ring. The targets are foil strips or wiresstretched horizontally across the target frames,which have a fork-like shape. During accelerationthe injected beam passes underneath the target,and as soon as the required energy is obtained, thebeam is shifted onto the target by steeringmagnets.In order to avoid a deterioration of the UHV in
the COSY ring due to continuous percolationof gas through the detector window an additional1.1 mm thick Mylar foil is installed in front of theBCDs, which separates the UHV region and aseparately pumped high vacuum volume closest tothe BCD. The detection arms, which contain theionization chambers, can be quickly separated
ARTICLE IN PRESS
R. Barna et al. / Nuclear Instruments and Methods in Physics Research A 519 (2004) 610–622 613
from the scattering chamber by emergency valves.In the case of any deterioration of the vacuumconditions either in the arms or in the ring thesevalves close automatically.It is intended to increase the efficiency of the
present setup by equipping also the other detectionarms of the PISA detection system with the fulldetector array allowing for the registration andidentification of the reaction products in the wholeenergy and mass range of interest over a widerangular range.
-100
0
100
200
300
400
500
600
700
800
0 20 40 60 80 100 120 140 160
Am
plitu
de [
mV
]
Time [Samples of FADC]
RE,
BP E
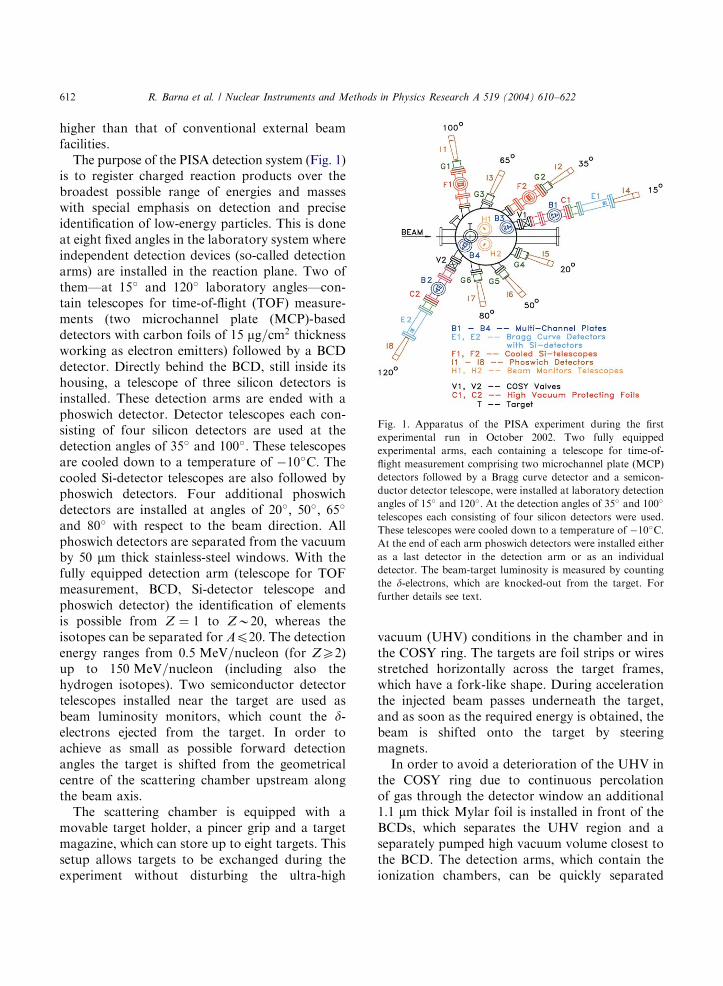
Fig. 2. Typical output signal from a BCD as sampled by a flash
ADC. The maximum of the curve gives the so-called Bragg
peak (BP) which is dependent on the charge of the particle. The
integral over the whole length of the signal reflects the kinetic
energy E of the particle. Other parameters like range of the
particle in the detector medium, R; or partial energy losses DE
can be also extracted from the shape of the curve (see Section
3.4). The sampling frequency of the used flash ADC results in a
length of a single sample of 0:1 ms:
3. Application of Bragg curve spectroscopy to the
(Z,A)-identification of spallation products
3.1. Description of the method
After first successful attempts to use the so-called Bragg Curve Spectroscopy (BCS) to identifyhighly ionizing particles [6,7] several detectorsexploiting characteristic features of the Braggcurve were built and used for various applications,proving their broad flexibility and usefulness [8–15]. Attractive features of such detectors areespecially: very good atomic number resolution,up to ZB20; energy resolution of the order of 1%,possibility to cover large solid angles, resistance toradiation damage and the adjustable energy rangeof the detected particles (by varying the gaspressure).A Bragg curve detector is a relatively simple
axial ionization chamber with a Frisch grid (FG),working typically at pressures of a few hundredmillibar and allowing to mirror the gradual energylosses of charged particles passing through the gasvolume of the detector in the time dependence ofthe anode signal. For a charged particle its specificenergy loss, dE=dx; in a given medium is describedby the Bethe–Bloch formula (see e.g. Ref. [16]).Since the energy loss per single collision is small,dE=dx increases slowly along the particle’s path.Only when the remaining energy is smaller than1 MeV=nucleon the value of dE=dx increasesrapidly forming the so-called Bragg Peak (BP).The amplitude of this peak depends solely on theparticle’s charge and thus allows identification ofthe particle’s atomic number. The integral of
dE=dx over the particle’s range gives the kineticenergy of the stopped particle. The principle ofBragg curve spectroscopy is illustrated in Fig. 2where a typical output signal from a BCD ispresented together with a set of relevant physicalinformation contained within this signal.A classical method of readout of the BCD was
to use a charge sensitive preamplifier followed bytwo spectroscopy amplifiers in parallel, each withdifferent time shaping constants t: The amplifierwith a short t ðB0:3 msÞ gives an output signalwith amplitude, which corresponds to the areaunder the BP. Integrating the charge with a longtime constant (B8 ms; depending on particulardetector dimensions) gives a signal with theamplitude being proportional to the particleenergy. Although with this method the exact shapeof the Bragg curve cannot be reproduced, theidentification of the atomic numbers of theparticles was nevertheless found to be satisfactory[7,8]. A later technique of sampling the ionization
ARTICLE IN PRESS
R. Barna et al. / Nuclear Instruments and Methods in Physics Research A 519 (2004) 610–622614
density over the particle’s path with the use of asampling (flash) ADC provided new possibilities ofextracting additional parameters (particle range R;or partial energy losses, DE) during the off-lineanalysis of the recorded data [14].
3.2. BCD design for spallation studies in internal
storage ring experiments
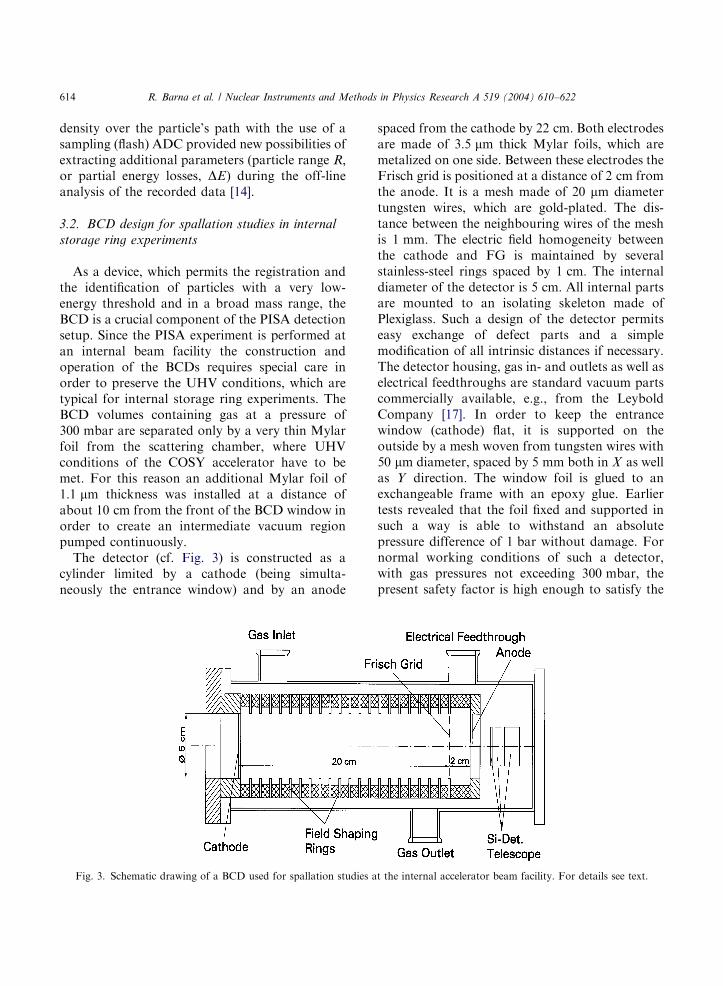
As a device, which permits the registration andthe identification of particles with a very low-energy threshold and in a broad mass range, theBCD is a crucial component of the PISA detectionsetup. Since the PISA experiment is performed atan internal beam facility the construction andoperation of the BCDs requires special care inorder to preserve the UHV conditions, which aretypical for internal storage ring experiments. TheBCD volumes containing gas at a pressure of300 mbar are separated only by a very thin Mylarfoil from the scattering chamber, where UHVconditions of the COSY accelerator have to bemet. For this reason an additional Mylar foil of1:1 mm thickness was installed at a distance ofabout 10 cm from the front of the BCD window inorder to create an intermediate vacuum regionpumped continuously.The detector (cf. Fig. 3) is constructed as a
cylinder limited by a cathode (being simulta-neously the entrance window) and by an anode
Fig. 3. Schematic drawing of a BCD used for spallation studies a
spaced from the cathode by 22 cm: Both electrodesare made of 3:5 mm thick Mylar foils, which aremetalized on one side. Between these electrodes theFrisch grid is positioned at a distance of 2 cm fromthe anode. It is a mesh made of 20 mm diametertungsten wires, which are gold-plated. The dis-tance between the neighbouring wires of the meshis 1 mm: The electric field homogeneity betweenthe cathode and FG is maintained by severalstainless-steel rings spaced by 1 cm: The internaldiameter of the detector is 5 cm: All internal partsare mounted to an isolating skeleton made ofPlexiglass. Such a design of the detector permitseasy exchange of defect parts and a simplemodification of all intrinsic distances if necessary.The detector housing, gas in- and outlets as well aselectrical feedthroughs are standard vacuum partscommercially available, e.g., from the LeyboldCompany [17]. In order to keep the entrancewindow (cathode) flat, it is supported on theoutside by a mesh woven from tungsten wires with50 mm diameter, spaced by 5 mm both in X as wellas Y direction. The window foil is glued to anexchangeable frame with an epoxy glue. Earliertests revealed that the foil fixed and supported insuch a way is able to withstand an absolutepressure difference of 1 bar without damage. Fornormal working conditions of such a detector,with gas pressures not exceeding 300 mbar; thepresent safety factor is high enough to satisfy the
t the internal accelerator beam facility. For details see text.
ARTICLE IN PRESS
R. Barna et al. / Nuclear Instruments and Methods in Physics Research A 519 (2004) 610–622 615
COSY vacuum requirements. However, whenoperating such a detector in less stringent safetyconditions the window thickness could be reduced.The tightness of the window ensures that thevacuum level of 10�6 mbar in front of the windowis maintained when the gas pressure inside theBCD is increased from 1 to 400 mbar:Various configurations of the voltage distribu-
tion were checked during the testing phase of thedetectors. The simplest and most convenientsolution with the cathode kept at negative andthe anode at positive potential while the FG isgrounded, allowed easy control and adjusting ofthe electric field strengths according to the currentgas pressure. However, it was decided that in orderto decrease the probability of electrical dischargesin the vicinity of the entrance window, the cathodeis grounded to the detector housing. In such a caseboth the FG as well as the anode have to besupplied with high positive potentials. The meshsupporting the entrance window is electricallyconnected to the cathode in order to avoidundesirable charge collection near the window.The voltages for the field shaping rings betweenthe cathode and the FG are reduced by means ofvoltage dividers made of high precision 1 MOresistors. The anode and the FG are supplied fromtwo separate HV channels through RC filters inorder to eliminate the influence of voltage ripples.
3.3. BCD operation characteristics
The main problem, which a designer of anionization chamber must deal with, is the smallamount of charge produced by the detectedparticles since no charge multiplication processoccurs in the detector. However, for the detectedfast heavy ions the number of secondary electronsreleased by ionization in the counting gas iso-butane is still 4:3� 104 per MeV energy loss, withseveral MeV to tenths of MeV being lost in theactive BCD volume and a fraction of theseelectrons defining the Bragg peak (cf. Figs. 2, 8,9). These electrons must drift over the substantialdetector length with little recombination and at theend form an output signal substantially higherthan any ambient noise. Therefore the detectorgeometry, the gas used, its pressure as well as the
applied voltages have to be carefully selected. Withthe P10 gas mixture (90% argon and 10%methane) used at the beginning of our tests weexperienced problems with obtaining reasonablesignals before reaching the discharge limit. Theseproblems extended over a broad range of gaspressures. We therefore decided later to useisobutane, which is characterized by a 12% lowermean energy needed for electron-ion pair produc-tion than in the P10 mixture [18,19], increasing thenumber of released electrons. In fact, by usingisobutane both the output signal amplitude as wellas the discharge limit increased.In order to avoid problems with sparking we
have taken special care about the internal con-struction of the detectors: materials, electricalcomponents, cables, connectors were carefullyselected and positioned, considering also possiblegas contaminations—see below. In effect weobtained a discharge free mode of operation withthe voltages up to 3 kV for isobutane pressuresfrom 100 to 300 mbar:The area of the anode and its distance to the FG
defines the capacity of the detector section, inwhich the output signal is created. Since thecurrent of primary electrons is very small, it isrequired to keep the electrical capacity of thisvolume as small as possible in order to obtain thebest signal to noise ratio. Unfortunately, byincreasing the grid–anode distance also the mini-mal energy of particles, which can be detected inthe detector, is increased [20]. As a reasonablecompromise, on the basis of tests performed, wehave chosen the anode-FG distance to be equal to2 cm; which proved to be an optimal solution inthe present design.A crucial aspect for proper performance of the
detector is a reliable gas flow control system. Weexperienced that effects of gas ageing can sig-nificantly reduce the detection efficiency of theBCD. When the gas is not refreshed continuously,after a short time the detection efficiency dropssignificantly, eventually even to zero. This iscaused by the admixture into isobutane remnantsof electronegative gases (generally O2 and vaporsof water), attached initially to the vessel walls andhidden in the pores of various parts of thedetector. Even a trace amount of such pollutants

ARTICLE IN PRESS
R. Barna et al. / Nuclear Instruments and Methods in Physics Research A 519 (2004) 610–622616
may capture a significant part of the drifting freeelectrons, making the detection impossible. It is forthis reason that all internal parts of the detectorhave to be maintained extremely clean and theirwalls have to be polished. The detector volumeitself should be pumped out to low pressure wellbefore use. Effects described above practicallyexclude using BCDs with a static gas volume.Instead, a system, which allows permanent gasrefreshing, has to be applied. In the case of ourBCDs the gas flow is sustained by a membranepump connected via a hand-operated fine valve tothe gas outlet of the detector. Gas is suppliedfrom a bottle containing high purity (99.95%)isobutane through a stable pressure reducerconnected with a hand-operated fine valve andfollowed by an electromagnetic dosage valve. Thepressure in the detector is kept stable (with anaccuracy better than 1%) by an electronic unit[21], which according to the readout of a pres-sure sensor controls the opening fraction ofthe electromagnetic valve. The apertures ofboth hand-operated valves have to be foundexperimentally.Due to the potential danger, which is created by
the use of BCDs in terms of the strict vacuumconditions inside the COSY ring, the gas pressurecontrol unit reacts to any deviation from thenarrow tolerance window by immediately shuttingoff the gas inlet to the detector. In such a case thehigh-voltage supply of the electrodes of thedetector is also instantly ramped down.In order to obtain undistorted information
about the energy losses of the detected particlesthe anode must be effectively screened from thepositive ion current flowing between the FG andthe cathode. The FG quality is described by itsscreening efficiency. The formula for calculatingthe screening inefficiency is given by Bunemannet al. [22]. In the case of our BCD, the gridscreening efficiency amounts to about 98%,which—as the results show—is sufficient forsatisfactory detector performance.The effectiveness of charge collection depends
on the used gas and on the reduced electricfield strength e=p (where e and p are the strengthof the electric field and the gas pressure,respectively), which enters in form of the
parameter r:
r ¼eðanode�FGÞ=p
eðcathode�FGÞ=p:
In practice, for a given gas pressure the voltages ofthe anode and the FG are increased until theamplitude of the output signal saturates and thesignal length is close to a minimum. This indicatesthat the recombination of the electrons travelingthrough the detector is minimal and that all ofthem are passing through the FG and are collectedat the anode. Values of r between 2.0 and 2.5 weremaintained in the present work. For the construc-tion of our BCD this ensures that all driftingelectrons will pass through the FG [22]. Dependingon the gas pressure the maximal collection ofelectrons were obtained for values ofeðcathode�FGÞ=p in the range of 0.4–1:3 V=cm mbar:
3.4. Signal readout and analysis
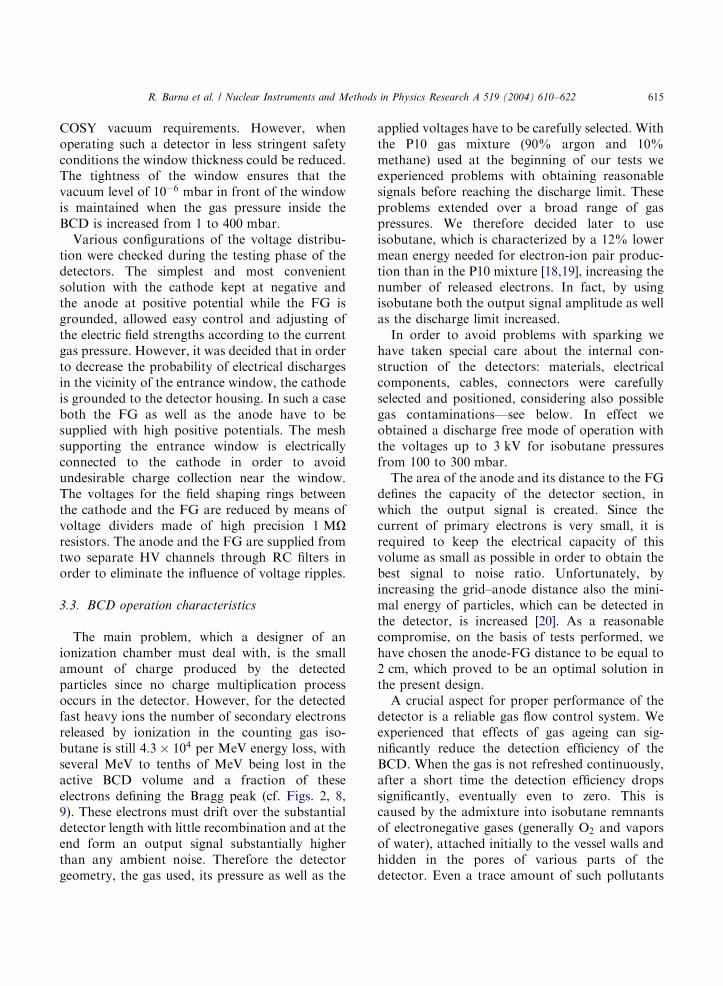
The aim of the signal processing in the readoutof BCDs is to record the ðdE=dxÞðxÞ function asundistorted as possible in order to be able toperform a detailed shape analysis of the registeredBragg curves. For this purpose the anode signal isread out into a specially constructed, highsensitivity current preamplifier (see Fig. 4), fromwhich a 40 MHz; 12-bit sampling ADC is fed via avoltage amplifier stage and an output buffer(CAEN, module V729A; in order to reduce theamount of recorded data, the 10 MHz frequencyof the FADC was selected). The amplitudedistributions of the samples reflect the particle’sstopping curve. The current preamplifier feeds alsoa charge integrator creating an output signalproportional to the total charge released by thedetected particle. In this way we have directinformation related to the kinetic energies of thestopped particles and, moreover, a separatechannel allowing the discrimination of the signals.From the output buffers of both channels positiveas well as negative signals are obtained in order tomake the front-end electronics more flexible forthe use with various discriminators and ADCs.The gain factor of 10 of the voltage amplifierallowed to feed the output signal from thepreamplifier directly to the sampling ADC. In this
ARTICLE IN PRESS
Fig. 4. Schematic diagram of the front-end electronics used in the PISA experiment for signal read-out of the BCD. For details
see text.
R. Barna et al. / Nuclear Instruments and Methods in Physics Research A 519 (2004) 610–622 617
way we avoided an additional shaping amplifier,which would obviously distort the shape of therecorded Bragg curve. The typical shape of aregistered Bragg curve is presented in Fig. 2. Therise and fall times of the preamplifier and of thevoltage amplifier have been adapted to theintegration through the drift time of about 0.4–0:5 ms in the 2 cm deep FG-anode gap in order toobtain an as little as possible distorted shape of theparticle’s energy-loss function. We learned, how-ever, that the performance of the preamplifier islimited by a reasonable choice of its sensitivity.While using a too sensitive preamplifier weobtained output signals contaminated with a verylarge noise superimposed on the recorded curve. Ineffect both the atomic number as well as the energyresolution were significantly reduced.Advantages of recording the shape of the Bragg
curve are described in Ref. [14]. Here we wouldlike to remind that by analyzing certain para-meters, particle identification is improved signifi-cantly. These are: total kinetic energy of theparticle, amplitude of the Bragg peak, range ofthe particle in the detector and partial energy lossvalues, which could be selected over any range ofthe whole particle path. Also other parameters likethe Bragg peak width or the initial energy of theparticle might be examined in order to obtainbetter isotope separation (cf. Ref. [20]).
3.5. Detector performance
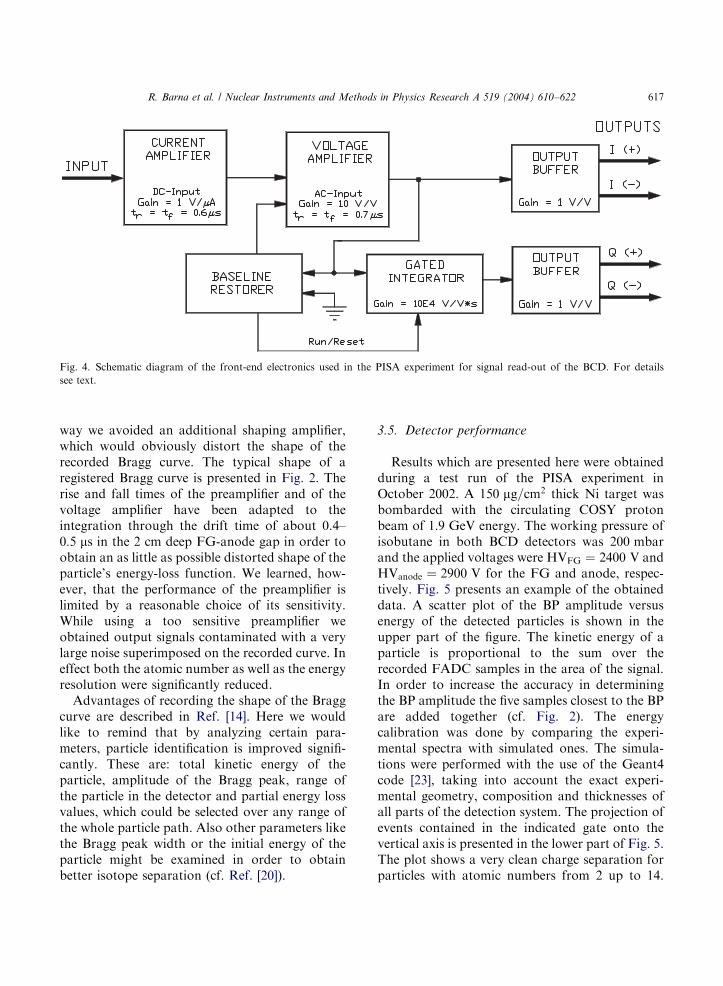
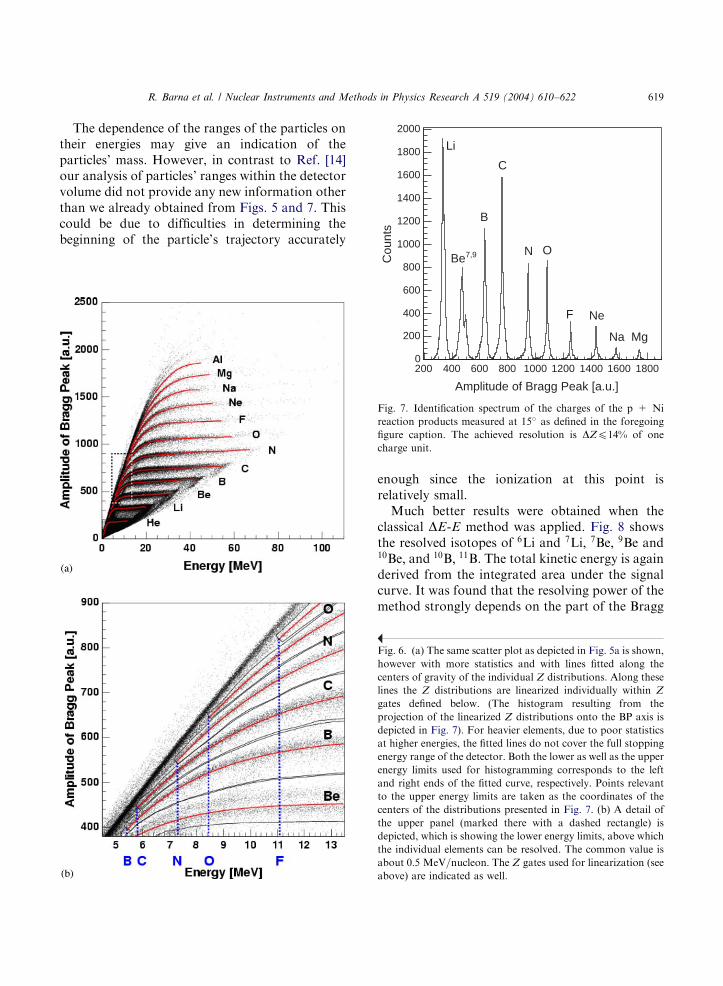
Results which are presented here were obtainedduring a test run of the PISA experiment inOctober 2002. A 150 mg=cm2 thick Ni target wasbombarded with the circulating COSY protonbeam of 1:9 GeV energy. The working pressure ofisobutane in both BCD detectors was 200 mbarand the applied voltages were HVFG ¼ 2400 V andHVanode ¼ 2900 V for the FG and anode, respec-tively. Fig. 5 presents an example of the obtaineddata. A scatter plot of the BP amplitude versusenergy of the detected particles is shown in theupper part of the figure. The kinetic energy of aparticle is proportional to the sum over therecorded FADC samples in the area of the signal.In order to increase the accuracy in determiningthe BP amplitude the five samples closest to the BPare added together (cf. Fig. 2). The energycalibration was done by comparing the experi-mental spectra with simulated ones. The simula-tions were performed with the use of the Geant4code [23], taking into account the exact experi-mental geometry, composition and thicknesses ofall parts of the detection system. The projection ofevents contained in the indicated gate onto thevertical axis is presented in the lower part of Fig. 5.The plot shows a very clean charge separation forparticles with atomic numbers from 2 up to 14.
ARTICLE IN PRESS
Fig. 5. (a) A scatter plot of events is shown where the
amplitude of the Bragg peak is plotted vs. the kinetic energy
of the registered particles. A Ni target was bombarded by
protons of 1:9 GeV energy. The reaction products were
registered at 15� in the LAB system. A clean separation of
elements from He up to Si is visible. Additionally, A ¼ 7 and
AX9 isotopes of Be are well resolved. (b) A projection of the
events from the area within the gate indicated in the upper
panel onto the vertical axis is shown in logarithmic scale.
R. Barna et al. / Nuclear Instruments and Methods in Physics Research A 519 (2004) 610–622618
Only due to poorer statistics the ions of the higheratomic numbers are not so well represented.Furthermore, since the 8Be isotopes decay in flight
before reaching the BCD, the events correspond-ing to 7Be and other Be isotopes, respectively, arewell separated. Another characteristic property ofthe BP amplitude versus energy plot is the presenceof clear ‘‘punch through’’ events corresponding tolight ions with higher energy, which are notstopped in the BCD. The lowest energy, whereindividual elements can be identified, is about0:5 MeV=nucleon and is common for all thedetected Z (cf. Fig. 6b).In Fig. 5a the linear part of the BP amplitude
versus energy E curves does not remain completelyhorizontal for each atomic number Z; i.e. theamplitude of the Bragg peak increases gradually asthe energy of the stopped particles increases. Thisphenomenon was quoted in earlier works describ-ing the general features of Bragg curve spectro-scopy (e.g. Ref. [14]) and it seems to beunavoidable. This effect is caused by partialrecombination of drifting electrons. For theionization induced by particles with low kineticenergies and stopping well in front of the FG theprobability of recombination of electrons is higherthan when the main stream of electrons is releasednear the FG and they have only a short path totravel. By recording the shapes of the signals thedescribed effect can however be compensated for,which allows to improve the energy resolution.In order to obtain charge identification
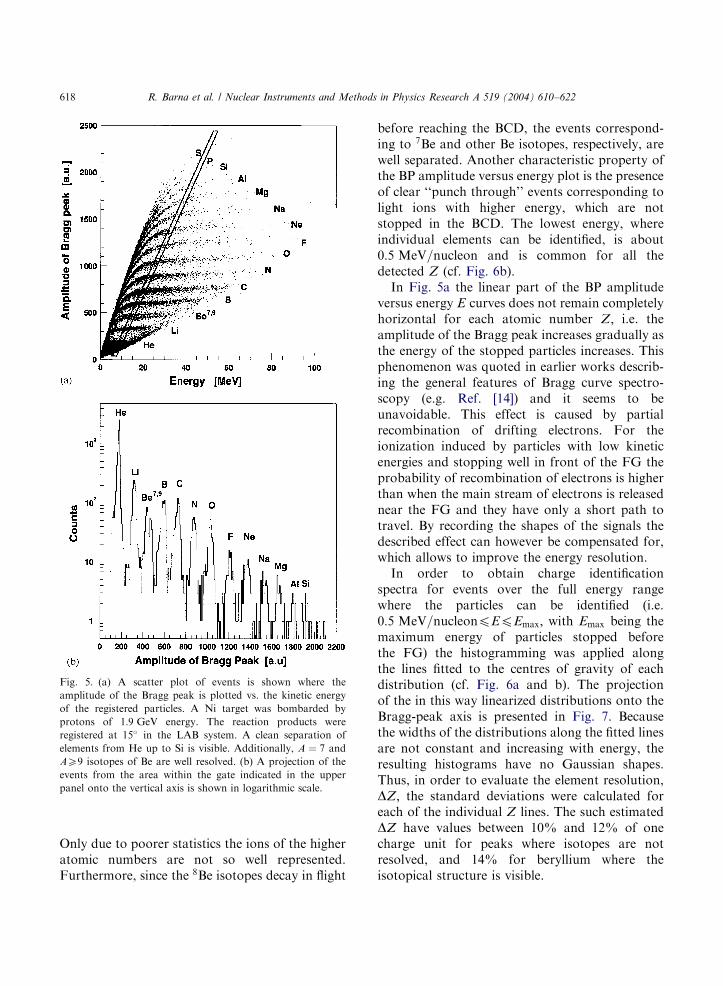
spectra for events over the full energy rangewhere the particles can be identified (i.e.0:5 MeV=nucleonpEpEmax; with Emax being themaximum energy of particles stopped beforethe FG) the histogramming was applied alongthe lines fitted to the centres of gravity of eachdistribution (cf. Fig. 6a and b). The projectionof the in this way linearized distributions onto theBragg-peak axis is presented in Fig. 7. Becausethe widths of the distributions along the fitted linesare not constant and increasing with energy, theresulting histograms have no Gaussian shapes.Thus, in order to evaluate the element resolution,DZ; the standard deviations were calculated foreach of the individual Z lines. The such estimatedDZ have values between 10% and 12% of onecharge unit for peaks where isotopes are notresolved, and 14% for beryllium where theisotopical structure is visible.
ARTICLE IN PRESS
unts
1000
1200
1400
1600
1800
2000
Li
B
C
R. Barna et al. / Nuclear Instruments and Methods in Physics Research A 519 (2004) 610–622 619
The dependence of the ranges of the particles ontheir energies may give an indication of theparticles’ mass. However, in contrast to Ref. [14]our analysis of particles’ ranges within the detectorvolume did not provide any new information otherthan we already obtained from Figs. 5 and 7. Thiscould be due to difficulties in determining thebeginning of the particle’s trajectory accurately
Amplitude of Bragg Peak [a.u.]
200 400 600 800 1000 1200 1400 1600 1800
Co
0
200
400
600
8007,9Be
N O
F Ne
Na Mg
Fig. 7. Identification spectrum of the charges of the p + Ni
reaction products measured at 15� as defined in the foregoing
figure caption. The achieved resolution is DZp14% of one
charge unit.
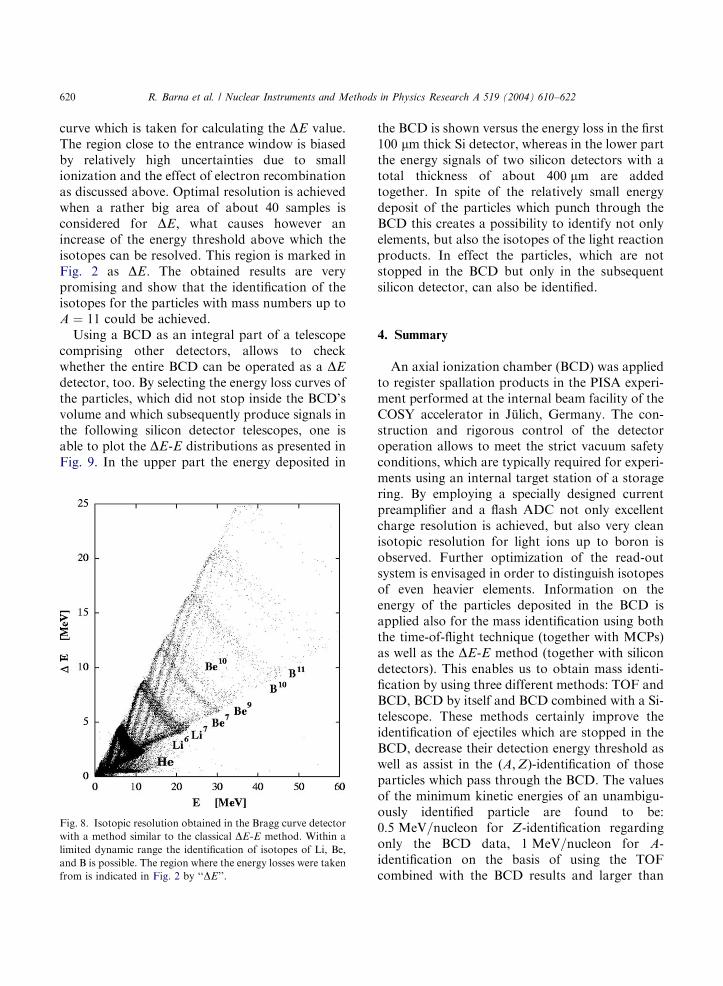
enough since the ionization at this point isrelatively small.Much better results were obtained when the
classical DE-E method was applied. Fig. 8 showsthe resolved isotopes of 6Li and 7Li; 7Be; 9Be and10Be; and 10B; 11B: The total kinetic energy is againderived from the integrated area under the signalcurve. It was found that the resolving power of themethod strongly depends on the part of the Bragg
Fig. 6. (a) The same scatter plot as depicted in Fig. 5a is shown,
however with more statistics and with lines fitted along the
centers of gravity of the individual Z distributions. Along these
lines the Z distributions are linearized individually within Z
gates defined below. (The histogram resulting from the
projection of the linearized Z distributions onto the BP axis is
depicted in Fig. 7). For heavier elements, due to poor statistics
at higher energies, the fitted lines do not cover the full stopping
energy range of the detector. Both the lower as well as the upper
energy limits used for histogramming corresponds to the left
and right ends of the fitted curve, respectively. Points relevant
to the upper energy limits are taken as the coordinates of the
centers of the distributions presented in Fig. 7. (b) A detail of
the upper panel (marked there with a dashed rectangle) is
depicted, which is showing the lower energy limits, above which
the individual elements can be resolved. The common value is
about 0:5 MeV=nucleon: The Z gates used for linearization (see
above) are indicated as well.
ARTICLE IN PRESS
R. Barna et al. / Nuclear Instruments and Methods in Physics Research A 519 (2004) 610–622620
curve which is taken for calculating the DE value.The region close to the entrance window is biasedby relatively high uncertainties due to smallionization and the effect of electron recombinationas discussed above. Optimal resolution is achievedwhen a rather big area of about 40 samples isconsidered for DE; what causes however anincrease of the energy threshold above which theisotopes can be resolved. This region is marked inFig. 2 as DE: The obtained results are verypromising and show that the identification of theisotopes for the particles with mass numbers up toA ¼ 11 could be achieved.Using a BCD as an integral part of a telescope
comprising other detectors, allows to checkwhether the entire BCD can be operated as a DE
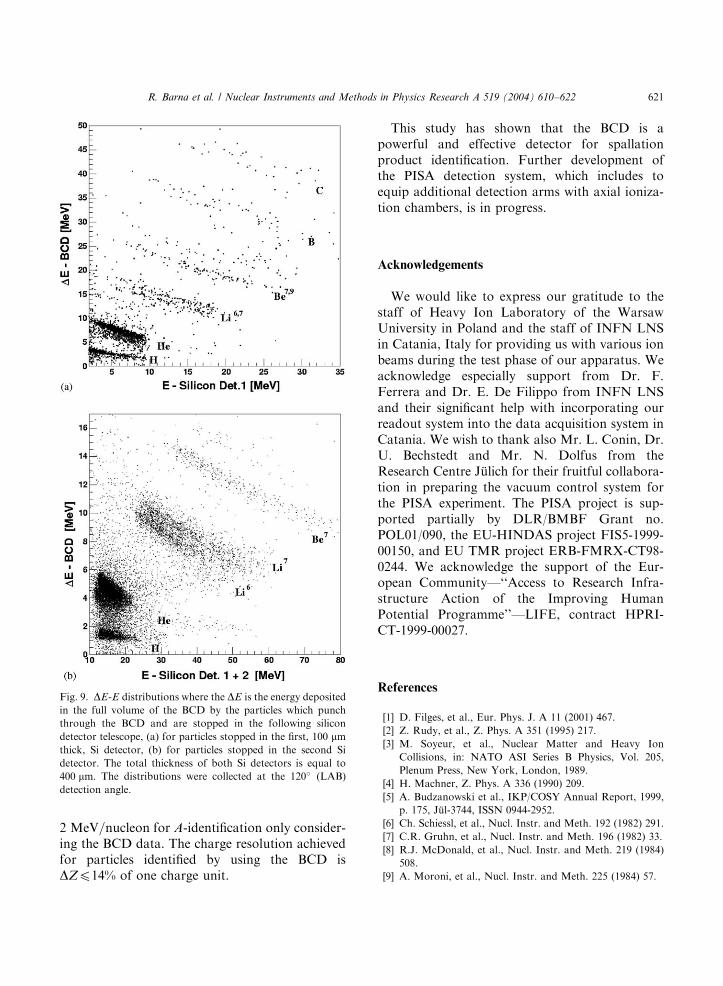
detector, too. By selecting the energy loss curves ofthe particles, which did not stop inside the BCD’svolume and which subsequently produce signals inthe following silicon detector telescopes, one isable to plot the DE-E distributions as presented inFig. 9. In the upper part the energy deposited in
Fig. 8. Isotopic resolution obtained in the Bragg curve detector
with a method similar to the classical DE-E method. Within a
limited dynamic range the identification of isotopes of Li, Be,
and B is possible. The region where the energy losses were taken
from is indicated in Fig. 2 by ‘‘DE’’.
the BCD is shown versus the energy loss in the first100 mm thick Si detector, whereas in the lower partthe energy signals of two silicon detectors with atotal thickness of about 400 mm are addedtogether. In spite of the relatively small energydeposit of the particles which punch through theBCD this creates a possibility to identify not onlyelements, but also the isotopes of the light reactionproducts. In effect the particles, which are notstopped in the BCD but only in the subsequentsilicon detector, can also be identified.
4. Summary
An axial ionization chamber (BCD) was appliedto register spallation products in the PISA experi-ment performed at the internal beam facility of theCOSY accelerator in J .ulich, Germany. The con-struction and rigorous control of the detectoroperation allows to meet the strict vacuum safetyconditions, which are typically required for experi-ments using an internal target station of a storagering. By employing a specially designed currentpreamplifier and a flash ADC not only excellentcharge resolution is achieved, but also very cleanisotopic resolution for light ions up to boron isobserved. Further optimization of the read-outsystem is envisaged in order to distinguish isotopesof even heavier elements. Information on theenergy of the particles deposited in the BCD isapplied also for the mass identification using boththe time-of-flight technique (together with MCPs)as well as the DE-E method (together with silicondetectors). This enables us to obtain mass identi-fication by using three different methods: TOF andBCD, BCD by itself and BCD combined with a Si-telescope. These methods certainly improve theidentification of ejectiles which are stopped in theBCD, decrease their detection energy threshold aswell as assist in the ðA;ZÞ-identification of thoseparticles which pass through the BCD. The valuesof the minimum kinetic energies of an unambigu-ously identified particle are found to be:0:5 MeV=nucleon for Z-identification regardingonly the BCD data, 1 MeV=nucleon for A-identification on the basis of using the TOFcombined with the BCD results and larger than
ARTICLE IN PRESS
Fig. 9. DE-E distributions where the DE is the energy deposited
in the full volume of the BCD by the particles which punch
through the BCD and are stopped in the following silicon
detector telescope, (a) for particles stopped in the first, 100 mmthick, Si detector, (b) for particles stopped in the second Si
detector. The total thickness of both Si detectors is equal to
400 mm: The distributions were collected at the 120� (LAB)
detection angle.
R. Barna et al. / Nuclear Instruments and Methods in Physics Research A 519 (2004) 610–622 621
2 MeV=nucleon for A-identification only consider-ing the BCD data. The charge resolution achievedfor particles identified by using the BCD isDZp14% of one charge unit.
This study has shown that the BCD is apowerful and effective detector for spallationproduct identification. Further development ofthe PISA detection system, which includes toequip additional detection arms with axial ioniza-tion chambers, is in progress.
Acknowledgements
We would like to express our gratitude to thestaff of Heavy Ion Laboratory of the WarsawUniversity in Poland and the staff of INFN LNSin Catania, Italy for providing us with various ionbeams during the test phase of our apparatus. Weacknowledge especially support from Dr. F.Ferrera and Dr. E. De Filippo from INFN LNSand their significant help with incorporating ourreadout system into the data acquisition system inCatania. We wish to thank also Mr. L. Conin, Dr.U. Bechstedt and Mr. N. Dolfus from theResearch Centre J .ulich for their fruitful collabora-tion in preparing the vacuum control system forthe PISA experiment. The PISA project is sup-ported partially by DLR/BMBF Grant no.POL01/090, the EU-HINDAS project FIS5-1999-00150, and EU TMR project ERB-FMRX-CT98-0244. We acknowledge the support of the Eur-opean Community—‘‘Access to Research Infra-structure Action of the Improving HumanPotential Programme’’—LIFE, contract HPRI-CT-1999-00027.
References
[1] D. Filges, et al., Eur. Phys. J. A 11 (2001) 467.
[2] Z. Rudy, et al., Z. Phys. A 351 (1995) 217.
[3] M. Soyeur, et al., Nuclear Matter and Heavy Ion
Collisions, in: NATO ASI Series B Physics, Vol. 205,
Plenum Press, New York, London, 1989.
[4] H. Machner, Z. Phys. A 336 (1990) 209.
[5] A. Budzanowski et al., IKP/COSY Annual Report, 1999,
p. 175, J .ul-3744, ISSN 0944-2952.
[6] Ch. Schiessl, et al., Nucl. Instr. and Meth. 192 (1982) 291.
[7] C.R. Gruhn, et al., Nucl. Instr. and Meth. 196 (1982) 33.
[8] R.J. McDonald, et al., Nucl. Instr. and Meth. 219 (1984)
508.
[9] A. Moroni, et al., Nucl. Instr. and Meth. 225 (1984) 57.

ARTICLE IN PRESS
R. Barna et al. / Nuclear Instruments and Methods in Physics Research A 519 (2004) 610–622622
[10] G.D. Westfall, et al., Nucl. Instr. and Meth. A 238 (1985)
347.
[11] R. Kotte, et al., Nucl. Instr. and Meth. A 257 (1987) 244.
[12] A.A. Kotov, et al., Exp. Technik der Phys. 36 (1988)
6,513.
[13] H.-G. Ortlepp, et al., Nucl. Instr. and Meth. A 403 (1998)
65.
[14] L.N. Andronenko, et al., Nucl. Instr. and Meth. A 312
(1992) 467.
[15] H. Ochiishi, et al., Nucl. Instr. and Meth. A 369 (1996)
269.
[16] Particle Physics Booklet, Particle Data Group, Editions
2001, p. 189; http://pdg.lbl.gov
[17] Leybold Vacuum, Catalog of vacuum parts,
http://www.leyboldvac.de.
[18] F. Sauli, Principles of Operation of Multiwire Proportional
and Drift Chambers, CERN 77-09, 1977.
[19] V.A. Zarubin, Nucl. Instr. and Meth. A 283 (1989) 409.
[20] N.J. Shenhav, H. Stelzer, Nucl. Instr. and Meth. 228
(1985) 359.
[21] H. Stelzer, Phys. Nachweisger.ate, Zimmernerstr. 9, 64409
Messel, Germany, fax: +49 6159 644.
[22] O. Bunemann, et al., Can. J. Res. A 27 (1949) 191.
[23] Geant4-A Simulation Toolkit, S. Agostinelli, et al.,
Nucl. Instr. and Meth. A 506 (2003) 250;
http://geant4.web.cern.ch/geant4/.
Copyright © 2022 FDOKUMEN