Pionic deuterium
19
EPJ manuscript No. (will be inserted by the editor) Pionic deuterium Th. Strauch 1 , F. D. Amaro 2 , D. F. Anagnostopoulos 3 , P.B¨ uhler 4 , D. S. Covita 2,7a , H. Gorke 5 , D. Gotta 1b , A. Gruber 4 , A. Hirtl 4c , P. Indelicato 6 , E.-O. Le Bigot 6 , M. Nekipelov 1 , J. M. F. dos Santos 2 , Ph. Schmid 4 , S. Schlesser 6 , L. M. Simons 7 , M. Trassinelli 6d , J. F. C. A. Veloso 8 , and J. Zmeskal 4 1 Institut f¨ ur Kernphysik, Forschungszentrum J¨ ulich, D-52425 J¨ ulich, Germany 2 Dept. of Physics, Coimbra University, P-3000 Coimbra, Portugal 3 Dept. of Materials Science and Engineering, University of Ioannina, GR-45110 Ioannina, Greece 4 Stefan Meyer Institut for Subatomic Physics, Austrian Academy of Sciences, A-1090 Vienna, Austria 5 Zentralinstitut f¨ ur Elektronik, Forschungszentrum J¨ ulich GmbH, D-52425 J¨ ulich, Germany 6 Laboratoire Kastler Brossel, UPMC-Paris 6, ENS, CNRS; Case 74, 4 place Jussieu, F-75005 Paris, France 7 Laboratory for Particle Physics, Paul Scherrer Institut, CH-5232 Villigen, Switzerland 8 I3N, Dept. of Physics, Aveiro University, P-3810 Aveiro, Portugal Received: date / Revised version: date Abstract. The strong-interaction shift πD 1s and broadening Γ πD 1s in pionic deuterium have been deter- mined in a high statistics study of the πD(3p - 1s) X-ray transition using a high-resolution crys- tal spectrometer. The pionic deuterium shift will provide constraints for the pion-nucleon isospin scattering lengths extracted from measurements of shift and broadening in pionic hydrogen. The hadronic broadening is related to pion absorption and production at threshold. The results are πD 1s =(-2356 ± 31) meV (repulsive) and Γ πD 1s = (1171 + 23 - 49 ) meV yielding for the complex πD scattering length aπD =[-(24.99 ± 0.33) + i (6.22 +0.12 -0.26 )] × 10 -3 m -1 π . From the imaginary part, the threshold parameter for pion production is obtained to be α = (251 +5 -11 ) μb. This allows, in addition, and by using results from pion absorption in 3 He at threshold, the determination of the effective couplings g0 and g1 for s-wave pion absorption on isoscalar and isovector NN pairs. PACS. 36.10.Gv, 25.80.Ls, 07.85.Nc Mesonic atoms, Pion inclusive scattering and absorption, X-ray spec- trometers 1 Introduction Hadronic atoms reveal the influence of the strong force by a shift and broadening Γ of the low-lying atomic levels with respect to the pure electromagnetic interaction. As atomic binding energies are negligibly small compared to the hadronic scale, a measurement of shift and width is equivalent to a scattering experiment at zero energy (threshold). Hence, such atomic data contain information on hadron-nucleus scattering lengths [1,2]. In pionic hydrogen, the atomic ground state level shift πH 1s and broadening Γ πH 1s are connected to the two isospin- separated pion-nucleon (πN ) scattering lengths. In the case of nuclei A(N,Z ) with A ≥ 2, πA 1s and Γ πA 1s are measures of the complex pion-nucleus scattering length a present address: I3N, Dept. of Physics, Aveiro University, P-3810 Aveiro, Portugal b corresponding author: [email protected] c present address: Universit¨ atsklinik f¨ ur Nuklearmedizin, Medizinische Universit¨ at Wien, 1090 Vienna, Austria d present address: Inst. des NanoSciences de Paris, CNRS UMR7588 and UMPC-Paris 6, F-75015 Paris, France a πA . The real part of a πA is attributed in leading order to scattering, whereas the imaginary part is due to pion absorption inducing itself a contribution to the shift [3,4]. It has been shown, that strong-interaction effects in low Z pionic atoms can be related unambiguously to pion- nucleon (πN ) scattering lengths as defined in modern field theoretical approaches of QCD [5]. Such threshold quan- tities are of great importance because they belong to the first scattering parameters accessible by lattice calcula- tions [6]. For the πN case, however, results are not yet available [7,8]. Pion-nucleus dynamics is understood to be built up from elementary πN → πN and πNN ↔ NN processes taking into account nuclear structure, multiple scatter- ing, and absorptive phenomena. Vice versa, precise pion- nucleus data could set constraints on elementary ampli- tudes. Generally, systematic uncertainties involved in the extraction of a πA from atom data, if available, are smaller than in the extrapolation of cross-section data to thresh- old. In this case, normalisation problems cease to exist and corrections owing to Coulomb bound states are bet- ter under control than for scattering states (see sect. 3). arXiv:1011.2415v2 [nucl-ex] 12 Jul 2011
-
Upload
independent -
Category
Documents
-
view
0 -
download
0
Transcript of Pionic deuterium

EPJ manuscript No.(will be inserted by the editor)
Pionic deuterium
Th. Strauch1, F. D. Amaro2, D. F. Anagnostopoulos3, P. Buhler4, D. S. Covita2,7a, H. Gorke5, D. Gotta1b, A. Gruber4,A. Hirtl4c, P. Indelicato6, E.-O. Le Bigot6, M. Nekipelov1, J. M. F. dos Santos2, Ph. Schmid4, S. Schlesser6, L. M.Simons7, M. Trassinelli6d, J. F. C. A. Veloso8, and J. Zmeskal4
1 Institut fur Kernphysik, Forschungszentrum Julich, D-52425 Julich, Germany2 Dept. of Physics, Coimbra University, P-3000 Coimbra, Portugal3 Dept. of Materials Science and Engineering, University of Ioannina, GR-45110 Ioannina, Greece4 Stefan Meyer Institut for Subatomic Physics, Austrian Academy of Sciences, A-1090 Vienna, Austria5 Zentralinstitut fur Elektronik, Forschungszentrum Julich GmbH, D-52425 Julich, Germany6 Laboratoire Kastler Brossel, UPMC-Paris 6, ENS, CNRS; Case 74, 4 place Jussieu, F-75005 Paris, France7 Laboratory for Particle Physics, Paul Scherrer Institut, CH-5232 Villigen, Switzerland8 I3N, Dept. of Physics, Aveiro University, P-3810 Aveiro, Portugal
Received: date / Revised version: date
Abstract. The strong-interaction shift επD1s and broadening ΓπD1s in pionic deuterium have been deter-mined in a high statistics study of the πD(3p − 1s) X-ray transition using a high-resolution crys-tal spectrometer. The pionic deuterium shift will provide constraints for the pion-nucleon isospinscattering lengths extracted from measurements of shift and broadening in pionic hydrogen. Thehadronic broadening is related to pion absorption and production at threshold. The results are
επD1s = (−2356 ± 31) meV (repulsive) and ΓπD1s = (1171+23− 49
) meV yielding for the complex πD scattering
length aπD = [−(24.99 ± 0.33) + i (6.22+0.12−0.26
)] × 10−3m−1π . From the imaginary part, the threshold
parameter for pion production is obtained to be α = (251 +5−11
)µb. This allows, in addition, and by using
results from pion absorption in 3He at threshold, the determination of the effective couplings g0 and g1 fors-wave pion absorption on isoscalar and isovector NN pairs.
PACS. 36.10.Gv, 25.80.Ls, 07.85.Nc Mesonic atoms, Pion inclusive scattering and absorption, X-ray spec-trometers
1 Introduction
Hadronic atoms reveal the influence of the strong forceby a shift ε and broadening Γ of the low-lying atomiclevels with respect to the pure electromagnetic interaction.As atomic binding energies are negligibly small comparedto the hadronic scale, a measurement of shift and widthis equivalent to a scattering experiment at zero energy(threshold). Hence, such atomic data contain informationon hadron-nucleus scattering lengths [1,2].
In pionic hydrogen, the atomic ground state level shiftεπH1s and broadening ΓπH
1s are connected to the two isospin-separated pion-nucleon (πN) scattering lengths. In thecase of nuclei A(N,Z) with A ≥ 2, επA
1s and ΓπA1s are
measures of the complex pion-nucleus scattering length
a present address: I3N, Dept. of Physics, Aveiro University,P-3810 Aveiro, Portugalb corresponding author: [email protected] present address: Universitatsklinik fur Nuklearmedizin,
Medizinische Universitat Wien, 1090 Vienna, Austriad present address: Inst. des NanoSciences de Paris, CNRS
UMR7588 and UMPC-Paris 6, F-75015 Paris, France
aπA. The real part of aπA is attributed in leading orderto scattering, whereas the imaginary part is due to pionabsorption inducing itself a contribution to the shift [3,4].
It has been shown, that strong-interaction effects inlow Z pionic atoms can be related unambiguously to pion-nucleon (πN) scattering lengths as defined in modern fieldtheoretical approaches of QCD [5]. Such threshold quan-tities are of great importance because they belong to thefirst scattering parameters accessible by lattice calcula-tions [6]. For the πN case, however, results are not yetavailable [7,8].
Pion-nucleus dynamics is understood to be built upfrom elementary πN → πN and πNN ↔ NN processestaking into account nuclear structure, multiple scatter-ing, and absorptive phenomena. Vice versa, precise pion-nucleus data could set constraints on elementary ampli-tudes. Generally, systematic uncertainties involved in theextraction of aπA from atom data, if available, are smallerthan in the extrapolation of cross-section data to thresh-old. In this case, normalisation problems cease to existand corrections owing to Coulomb bound states are bet-ter under control than for scattering states (see sect. 3).
arX
iv:1
011.
2415
v2 [
nucl
-ex]
12
Jul 2
011
2 Th. Strauch et al.: Pionic Deuterium
Assuming isospin conservation and charge symmetry,πN → πN scattering at threshold is described completelyby two real numbers, e.g., the isoscalar and isovector πNscattering lengths a+ and a−. They are defined in terms oftwo πN → πN reactions or isospin I = 1/2 and I = 3/2by
a+ =1
2(aπ−p→π−p + aπ+p→π+p) =
1
3(a1/2 + 2a3/2) ,
a− =1
2(aπ−p→π−p − aπ+p→π+p) =
1
3(a1/2 − a3/2). (1)
Furthermore, among others the relations aπ−n→π−n =aπ+p→π+p and aπ−p→π◦n = −
√2 a− hold.
The scattering lengths a+ and a− play a key role inthe modern low-energy approach of QCD based on effec-tive field theories (EFT). A perturbative method—chiralperturbation theory (χPT)—has been developed, whichis intimately related to the smallness of the pion’s massmπ due to its underlying nature as a Goldstone boson [9,10,11,12]. The interaction is calculated order by orderas an expansion in the—compared to the hadronic scaleof 1 GeV—”small” quantities momentum, pion mass, finestructure constant thus including the (isospin–breaking)electromagnetic interaction, and the light quark mass dif-ference md − mu (strong isospin breaking) [13,14,15,16,17,18,19]. In such a theory short–range contributions aresummarized in so called low-energy constants (LECs) whichmust be determined from πN experiments (for detailssee [5]).
From the scattering lengths a+ and a−, importantquantities of the πN interaction are derived [20]. The πNσ term [12,21,22] is a measure of explicit chiral symme-try breaking, and the πN coupling constant, obtainedfrom the Goldberger-Miyazawa-Oehme sum rule [23,24,25], is related to the strength of threshold photo pro-duction of charged pions [26,27,28] and the induced pseu-doscalar coupling gp as determined from muon capture inhydrogen [29,30,31].
Access to a+ and a− is available from the 1s level shiftand broadening in pionic hydrogen (πH):
επH1s ∝ aπ−p→π−p = a+ + a− + ... (2)
ΓπH1s ∝
(1 +
1
P
)(aπ−p→π0n)2 ∝ (a−)2 + ... . (3)
Ellipses stand for corrections owing to the fact that thepionic atom constitutes a Coulomb state as well as for elec-tromagnetic and strong isospin and non-isospin breakingcorrections, which are essential to extract a+ and a− in awell defined way from the data. These corrections may becalculated, e.g., within the framework of χPT and are ofthe order of a few per cent [5,32,33,34,35].
In the πH case, the level width is as well due to scatter-ing—the charge exchange reaction π−p→ π◦n—and, there-fore, is proportional to the square of a− [36]. The Panof-sky ratio P = Γ (π−p → π◦n)/Γ (π−p → γn) = 1.546 ±0.009 [37] accounts for the relative strength of radiativecapture, the second channel contributing to the total broad-ening. For a recent analysis of πH atomic data see ref. [38].
It is known already from current algebra, that a+ van-ishes in the chiral limit [9,10] acquiring a finite value onlybecause of chiral symmetry breaking [12,39]. Hence, thes-wave πN interaction is dominated by the isovector con-tribution with the consequence that it is difficult to extracta+ from pion-nucleon and nucleus data with I 6= 0.
Pionic deuterium (πD) is of particular interest beingthe first natural choice to test the interaction of pions withisoscalar nuclear matter. Here, the leading order (LO) one-body contribution to the real part of the pion-deuteronscattering length aπD depends only on the isoscalar quan-tity a+. Considering the deuteron as a free proton andneutron plus corrections, one may write
επD1s ∝ Re aπD
= aπ−p→π−p + aπ−n→π−n + ...
= 2a+ + ... . (4)
Besides the corrections mentioned for the case of πH, el-lipses include here terms arising from multiple scattering,depending both on a+ and a−, and absorptive contribu-tions. Noteworthy, that the second order correction, domi-nated by (a−)2, exceeds even the magnitude of the leadingorder term because of a+ � a− [9,10]. Nuclear structureis taken into account by folding with the deuteron wavefunction [40,41,42]. The exact relation between επD
1s andRe aπD is discussed in detail in sect. 3.1.
Hence, the isopin scattering lengths are accessible fromthe shift measurements in πH and in πD already with-out ultimately precise data for the hadronic broadeningin hydrogen being available [24]. An effective constrainton a+ and a−, however, is obtained when combining thetriple επH
1s , ΓπH1s , and επD
1s . A complete set of data has beenachieved for the first time during the last decade [43,44,45,46].
Such a constraint is highly desirable, because differentmethods exist to obtain the corrections needed for the ex-traction of the pure hadronic quantities a+ and a− fromπH and πD measurements. Recognising, among others,that corrections obtained using potential models were in-complete, significant effort went into calculations to estab-lish an unambiguous relation between atomic data and a+
and a−, in particular within the framework of χPT. It hasbeen proven to be extendable in a defined way to 3-bodyinteractions [47] and allows to treat electromagnetic andstrong isopin-breaking terms on the same footing [5,24,48,49,50,51,52,53,54,55,56,57,58,59]. For a discussion andcomparison of potential and EFT approaches see ref. [5].
As mentioned above, corrections for the πN scatteringlengths as obtained from πH amount to a few per centof the leading contribution in complete contrast to thereal part of the πD scattering length. Here, because ofthe smallness of a+, the isospin-breaking contribution wasfound to be as large as 40% in NLO χPT [58].
Finally, it turned out that for the extraction of thescattering lengths a+ from the atomic data within theframework of χPT, the accuracy achievable is determinedby one particular combination of LECs. It appears both inthe correction term for επH
1s and επD1s , and thus constitutes
a limit from the theoretical side [60]. In the case of ΓπH1s
Th. Strauch et al.: Pionic Deuterium 3
the LECs involved are known better [5,61]. Therefore, herethe uncertainty of a− is dominated by the experimentalaccuracy.
Being different from the πH case, the hadronic broad-ening in πD and, consequently, the imaginary part of theaπD is not related to πN scattering lengths a+ and a− butto the strength of s-wave pion absorption. Open channelsin negative pion absorption in deuterium at threshold are
π−d→ nn (5)
→ nnγ (6)
→ nne+e− (7)
→ nnπ0 . (8)
True absorption (5) represents the inverse reaction of pionproduction in nucleon-nucleon collisions, i.e., Im aπD isalso a measure of the strength of s-wave pion production atthreshold. For that reason, pion-production cross sectionswere used to estimate the πD level width before it wasexperimentally accessible [62]. First attempts have beenmade to calculate the production strength rigorously alsowithin the framework of χPT [63,64] to be compared withthe precise atomic data.
The relative strength of the dominant channels trueabsorption and radiative capture (6) was measured to beS = Γ (π−d → nn)/Γ (π−d → nnγ) = 2.83 ± 0.04 [65].The branching ratio of internal pair conversion (7) wasdetermined to be 0.7% [66]. Charge exchange (8) is parityforbidden from s states and, therefore, only odd partialwaves contribute which results in a fraction as small as(1.45±0.19) ·10−4 [67]. The corresponding partial 3p levelwidth can be neglected here. Hence, the relative strengthof true absorption to all other final states contributing tothe 1s level width is found from the measured branchingratios to be
S′ =Γ (nn)
Γ (nnγ) + Γ (nne+e−)= 2.76± 0.04 , (9)
i.e., about 2/3 of the hadronic width is related to the pionproduction/absorption process NN ↔ πNN . The exactrelation between pion-production strength and Im aπD isderived in sect. 3.2.
The aim of this experiment is to provide data on theπD hadronic shift and width at least at about the levelof accuracy achieved in recent or envisaged in ongoingtheoretical calculations. A precise value for the shift willprovide, together with the forthcoming new precision datafor πH [68,69], improved constraints for the πN scatteringlengths a+ and a−. As a first result of this experiment, thes-wave pion production strength derived from the widthhas been outlined recently [70].
2 Atomic cascade
After pion capture in hydrogen isotopes, a quantum cas-cade starts from main quantum numbers n ≈ 16 [71,72](Fig. 1). The upper and medium part of the atomic cas-cade is dominated by the collisional processes inducing
Stark mixing, Coulomb de-excitation, and ionization ofneighbouring atoms (external Auger effect). In the lowerpart, X-ray emission becomes more and more important.In light atoms, only electric-dipole transitions contributepreferring steps with maximal ∆n. The cascade time, es-timated to be of the order of 0.1 ns for densities around10 bar [73], is much shorter than the pion’s life time. In ad-dition, molecular formation πD + D2 → [(ddπ)d]ee mustbe considered. The influence of the above-mentioned pro-cesses is discussed in the following.
Radiative de-excitation is the only process where col-lisional effects on the line energy and width can be ne-glected. Doppler broadening from thermal motion is of theorder of 10 meV. Pressure broadening amounts at maxi-mum to 0.2 meV for the densities and temperatures usedin this experiment.
Stark mixing essentially determines the X-ray yieldsin exotic hydrogen. Because these systems are electricallyneutral and small on the atomic scale, they penetrate sur-rounding atoms and, thus, experience a strong Coulombfield. Non-vanishing matrix elements 〈nlm|E|nl′m′〉 inthe presence of the electric field mix atomic states of thesame principle quantum number n according to the selec-tion rules ∆l = ±1 and ∆m = 0 [74]. An induced s state,from where pions disappear by nuclear reactions, leads toa depletion of the X-ray cascade. As the Stark mixing rateis proportional to the number of collisions during the ex-otic atom’s life time, it explains the strong decrease ofthe X-ray yields with target density [73]. The yield of theπD(3p − 1s) X-ray transition has been measured at tar-
Fig. 1. De-excitation cascade in pionic deuterium. The en-ergy of the X-ray emitted in the πD(3p − 1s) transitions is3.075 keV. Hadronic shift ε1s and width Γ1s are of the orderof 2.5 and 1 eV, respectively. The hadronic shift is defined asε1s ≡ Eexp − EQED, i.e., a negative sign as is the case for πDcorresponds to a repulsive interaction.

4 Th. Strauch et al.: Pionic Deuterium
get densities equivalent to 15 bar and 40 bar STP to be(3.28± 0.43)% and (1.72± 0.16)%, respectively [75].
The natural line width of the atomic ground state tran-sition (3p − 1s) of about 1 eV is dominated by the lifetime of the 1s state. Nuclear reactions from the 3p levelcontribute with less than 1µeV and the 3p-level radiativewidth amounts to 28µeV only. An estimate for the in-duced width from Stark mixing (3p ↔ 3s) and externalAuger effect at the 3p state, based on transition rates forπH given in ref. [76], yields also negligibly small contribu-tions of ≤ 1µeV at the target densities considered here.With a hadronic shift in πD being a factor of about 3smaller than in πH, Stark mixing might be enhanced, butstrong effects are excluded because similar K yields havebeen observed for hydrogen and deuterium [75].
However, significant broadenings of the X-ray line in-duced by other cascade processes must be considered, inparticular in the case of Coulomb de-excitation [79]. Here,the energy release during the transition (n → n′) is con-verted into kinetic energy of the collision partners beingthe excited πD system and, predominantly, one atom ofan D2 molecule [76,77,78]. Such transitions dominate de-excitation from the start of the quantum cascade down ton ≈ 10 and have been found to contribute even at lowestdensities [80].
In lower-lying transitions, a significant energy gain oc-curs leading to a substantial Doppler broadening of sub-sequent X-ray transitions. The Doppler effect was directlyobserved in πH in time-of-flight spectra of monoenergeticneutrons from the charge exchange reaction at rest π−p→π0n [81,82] and in an additional broadening of the linewidth of the muonic hydrogen (3p − 1s) X-ray transi-tion [83]. The broadening turned out to be a superpositionof several Doppler contributions attributed to different de-excitation steps n → n′ of the initial µ−p system. Only∆n=1 transitions could be identified. A similar behaviourwas found for pionic hydrogen. Here, a significant increaseof the total line width is observed with decreasing n of theinitial state, which is attributed to the increasing energygain of preceding Coulomb de-excitation steps [69,84].
Acceleration due to Coulomb de-excitation is counter-acted by elastic and inelastic scattering. This leads to acontinuum of velocities below the ones well defined bya specific transition. Cascade calculations have been ex-tended to include the development of the velocity de-pendence during de-excitation and, therefore, are able topredict kinetic energy distributions at the time of X-rayemission from a specific level (extended standard cascademodel ESCM [76,77,78]). At present, calculations havebeen performed only for πH [76,77,78,85,86,87]. Figure 2shows such an ESCM prediction for the 3p state.
In the case of πD, the energies for the ∆n = 1 Coulombde-excitation transitions (7−6), (6−5), (5−4), and (4−3),are at 12, 20, 38, and 81 eV, respectively. Though kineticenergies differ only little from the πH case, velocities aresignificantly smaller (Fig. 2) possibly changing the balancebetween acceleration and slowing down.
In the analysis of a measurement of the µH(3p−1s) lineshape it turned out [83], that first ESCM predictions are
hardly able to describe the measured line width. There-fore, a model independent approach will be used to ex-tract the relative strength of Doppler contributions di-rectly from the X-ray data, which was applied success-fully first in the neutron time-of-flight [82] and also in theµH(3p− 1s) analysis. Here, the continuous kinetic energydistribution is replaced by a few narrow intervals at theenergies, where significant contributions are expected. Po-sitions and intensities of such contributions are then foundby comparing a Monte-Carlo generated line shape to thedata by means of a χ2 analysis. An approximation of thekinetic energy distribution by two narrow intervals, asused in the analysis of this experiment, is illustrated infig. 2. A detailed description is given in sect. 5.2.
Auger transitions prefer de-excitation steps as small aspossible, given that the energy gain exceeds the bindingof the electron. Auger emission contributes mainly in therange ∆n ≈ 6 − 10 with ∆n = 1 transitions, but rapidlydecreases for smaller n [73,77,78]. Because of the smallrecoil energies, Auger emission cannot contribute to thehigh energetic part of the kinetic energy distribution.
From muon-catalysed fusion experiments it is knownthat during µH + H2 collisions metastable hybrid moleculesare formed like [(ppµ)p]ee [88,89]. An analogous process
Fig. 2. Prediction for the kinetic energy distribution of the πHatom at the instant of (3p−1s) transition for a density equiva-lent to 10 bar gas pressure together with the velocity scale. Thevelocities for the heavier πD system owing to the correspondingenergy gains are given on the bottom. For the analysis of thisπD experiment, the energy distribution, after scaling the ener-gies from the πH to the πD case, was tentatively approximatedby two narrow intervals representing a low-energy component(0-2 eV) and a second one for the high-energy component stem-ming from the (4−3) Coulomb de-excitation transition (for de-tails see sect. 5.2). The low-energy component dominates thedistribution (note the broken vertical scale).
Th. Strauch et al.: Pionic Deuterium 5
is expected in πD + D2 collisions [89]. Evidence that res-onant molecular formation takes also place from excitedstates has been found in muonic hydrogen [90].
Such complex’ are assumed to stabilise non radiativelyby Auger emission. Possible X-ray transitions from weaklybound molecular states before stabilisation would falsifythe value for the hadronic shift determined from the mea-sured X-ray energy due to satellite lines shifted to lowerenergies, whereas Auger stabilised molecules emit X-raysof at least 30 eV energy less than the undisturbed tran-sition [92] and are easily resolved in this experiment. Ra-diative decay out of such molecular states has been dis-cussed and its probability is predicted to increase withatomic mass [91,92]. A weak evidence for an Auger sta-bilised transition is discussed in sect. 6.1.
As molecular formation is collision induced, the frac-tion of formed complex molecules and the X-ray rate shoulddepend on the target density. Hence, a measurement ofthe πD(3p − 1s) X-ray energy was performed at differ-ent densities to identify such radiative contributions (seesect. 5.1).
3 Strong interaction
In this section, the relations are introduced which willbe used to extract the complex pion-deuteron scatter-ing length aπD (sect. 6.5) and the threshold parameterfor s-wave pion production (sect. 6.6) from the measuredhadronic level shift and broadening.
3.1 Scattering length
The hadronic pion-nucleus scattering length aπA is relatedin leading order (LO) to the ns level shifts εns and widthsΓns by the Deser-Goldberger-Baumann-Thirring (DGBT)formula [1]
εns − iΓns2
= −2α3µ2c4
hc· Z3 · a
LOπA
n3, (10)
with µ being the reduced mass of the bound system ofpion and nucleus A(Z,N). In eqs. (10) - (13) α denotesthe fine structure constant.
Shift and width are measured using a Coulomb boundstate. Therefore, the complex quantity aLO
πA as extractedfrom eq. (10) is not identical with the pure hadronic scat-tering length aπA. Usually, the Coulomb interaction istaken into account by Trueman’s formula [93,94,95] whichexpresses the correction by an expansion in the ratio scat-tering length-to-Bohr radius. In the case of hydrogen (Z =1), the complete expansion can be written up to orderO(α4) in a compact form [5,33] yielding for the 1s state ofpionic deuterium [60]
ε1s − iΓ1s
2= −2α3µ2c4
hcaπD (11)
· [1− 2αµc2
hc(lnα− 1) · aπD + δvacD ] .
The term δvacD =0.51% accounts for the interference of vacu-um polarisation and strong interaction [96]. Its uncertaintyis assumed to be negligibly small compared to the exper-imental accuracy [5].
In the case of πD, the total correction to aπD is onlyabout 1% (see eqs. (24) and (25)). Hence, eq. (11) is solvedwith sufficient accuracy by inserting the leading order re-sult for aLO
πD as obtained from eq. (10) and the influenceof the experimental uncertainty must not be consideredhere.
Real and imaginary part of the pure hadronic πD scat-tering length are then given by
Re aπD = − hc
2α3µ2c4· ε1s (12)
· 1
1− 2αµc2
hc (lnα− 1) · (Re aLOπD
)2−(Im aLOπD
)2
Re aLOπD
+ δvacD
Im aπD = − hc
2α3µ2c4· Γ1s
2(13)
· 1
1− 2αµc2
hc (lnα− 1) · 2 Re aLOπD + δvacD
.
3.2 Threshold parameter α and pion production
The cross section for the reaction pp→ π+d is parametrisedat low energies by [97]
σpp→ π+d = αC20η + βC2
1η3 + ... , (14)
where η = p∗π/mπ is the reduced momentum of the pionin the πd rest frame. Here, α denotes the threshold pa-rameter representing pure s-wave pion production. Ap-proaching threshold, η → 0, higher partial waves (β, ...)vanish. A value for α is obtained by fits to the quantityσpp→ π+d/η and then extrapolated to zero energy. In par-ticular at low energy, the correction factors Ci which takeinto account the Coulomb interaction are an importantsource of uncertainty in the determination. For example,the leading order correction C2
0 has been calculated to beas large as 30% with the additional difficulty to obtain anaccurate error estimate [98,99].
A second experimental approach to α is to exploit theπD ground state broadening, where uncertainties stem-ming from Coulomb correction factors and normalisationof cross sections are avoided. In order to derive in a modelindependent way the relation between α and Im aπD asobtained from pionic deuterium, purely hadronic (non-measurable) cross sections σ are introduced to circumventthe problem of diverging Coulomb cross section at thresh-old. In this case Ci ≡ 1, and α and β are pure hadronicquantities calculable, e.g., in the framework of χPT. Thehadronic production cross section then reads
σpp→ π+d = αη + βη3 + ... . (15)
In addition, the reaction np→ π0d can be used because inthe limit of charge independence 2 ·σnp→ π0d = σpp→ π+d.Restricting to pion-deuteron s waves, in both processes the
6 Th. Strauch et al.: Pionic Deuterium
same transition of a nucleon pair 3P1(I = 1) → 3S1(I =0) occurs, where true pion absorption πd → nn inducesthe inverse reaction 3S1[ 3D1](I = 0) → 3P1(I = 1) onthe deuteron’s isospin 0 nucleon-nucleon pair.
Detailed balance relates pion production and absorp-tion by
σπ+d→ pp =2
3·(p∗pp∗π
)2
· σpp→ π+d (16)
with p∗p and p∗π being final state centre-of-mass (CMS)momenta [100]. Neglecting Coulomb and isospin breakingcorrections, charge symmetry requires for the transitionsπ−d → nn and π+d → pp
|Mπ−d→nn |=|Mπ+d→pp | . (17)
Isospin breaking effects are expected to be at most 1-2% [101,102].
A small difference in the transition rate results fromthe slightly larger phase space of the π+d→ pp reaction.
σπ−d→nnσπ+d→pp
=p∗np∗p
=
√λ(s,m2
n,m2n)
λ(s,m2p,m
2p)
= 0.982 , (18)
The CMS momenta of proton and neutron, expressed ininvariant variables using the triangle function λ, are givenby p∗p,n = λ1/2(s,m2
p,n,m2p,n)/2
√s [103]. The value corre-
sponds to π±d at threshold, where the total CMS energysquared is s = (md + mπ±)2. The atomic binding energyof the π−D system is neglected.
Combining optical theorem, charge invariance, detailedbalance and inserting the parametrisation of the pp →π+d cross section (15), the imaginary part of the π−d →nn scattering length reads in terms of the π+ productionthreshold parameter α
Im aπ−d→nn =p∗π4π· σπ−d→nn
=p∗π4π· σπ+d→pp ·
(p∗np∗p
)=p∗π4π· 2
3·(p∗pp∗π
)2
· σpp→π+d ·(p∗np∗p
)=
1
6π·
(p∗p · p∗n)
mπ· α . (19)
To relate Im aπ−d→nn given by pion production to theimaginary part of the pion-deuteron scattering lengthIm aπD as obtained from the atomic system πD, a cor-rection must be applied for the non true absorption chan-nels. Taking into account the relative strength S′ of trueabsorption to other s-state processes (9) and exploitingλ(x, y, y) = x(x− 4y) [103], one obtains
Im aπD = (1 +1
S′) · Im aπ−d→nn
= (1 +1
S′) ·
√(s− 4m2
p)(s− 4m2n)
24πmπ· α
= 2.48 · 10−5m−1π µb−1 · α . (20)
4 Experimental setup
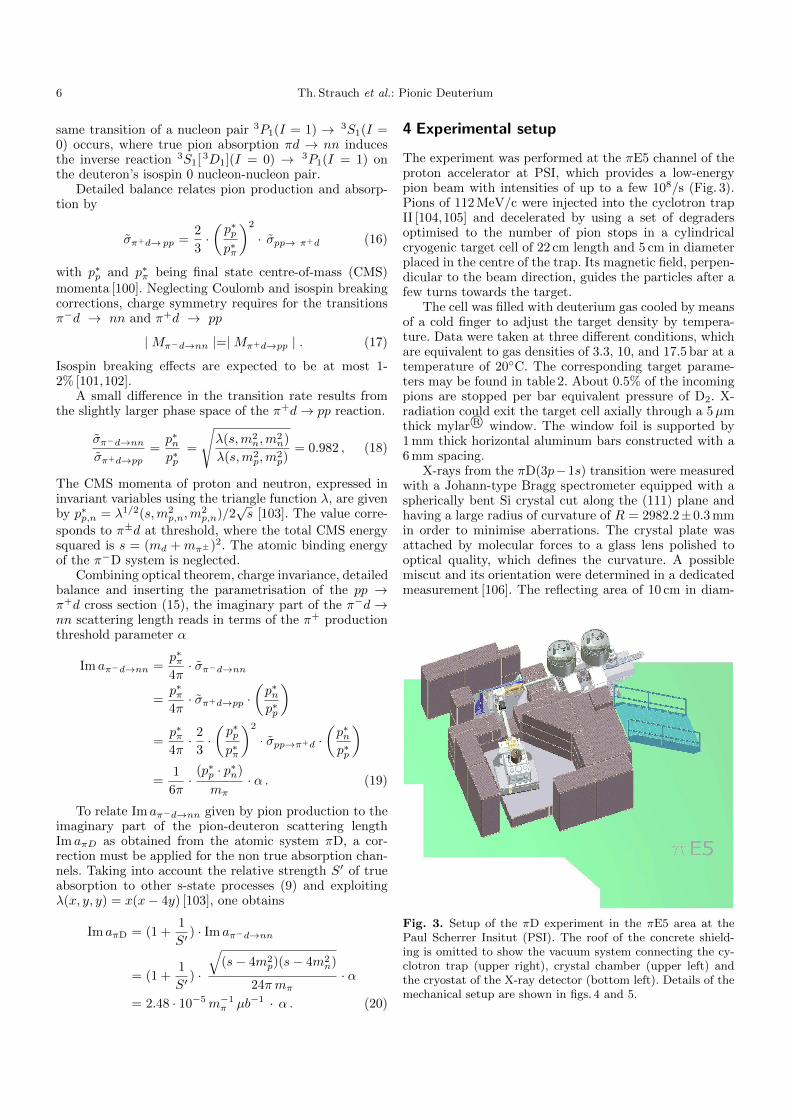
The experiment was performed at the πE5 channel of theproton accelerator at PSI, which provides a low-energypion beam with intensities of up to a few 108/s (Fig. 3).Pions of 112 MeV/c were injected into the cyclotron trapII [104,105] and decelerated by using a set of degradersoptimised to the number of pion stops in a cylindricalcryogenic target cell of 22 cm length and 5 cm in diameterplaced in the centre of the trap. Its magnetic field, perpen-dicular to the beam direction, guides the particles after afew turns towards the target.
The cell was filled with deuterium gas cooled by meansof a cold finger to adjust the target density by tempera-ture. Data were taken at three different conditions, whichare equivalent to gas densities of 3.3, 10, and 17.5 bar at atemperature of 20◦C. The corresponding target parame-ters may be found in table 2. About 0.5% of the incomingpions are stopped per bar equivalent pressure of D2. X-radiation could exit the target cell axially through a 5µmthick mylar R© window. The window foil is supported by1 mm thick horizontal aluminum bars constructed with a6 mm spacing.
X-rays from the πD(3p−1s) transition were measuredwith a Johann-type Bragg spectrometer equipped with aspherically bent Si crystal cut along the (111) plane andhaving a large radius of curvature of R = 2982.2±0.3 mmin order to minimise aberrations. The crystal plate wasattached by molecular forces to a glass lens polished tooptical quality, which defines the curvature. A possiblemiscut and its orientation were determined in a dedicatedmeasurement [106]. The reflecting area of 10 cm in diam-
Fig. 3. Setup of the πD experiment in the πE5 area at thePaul Scherrer Insitut (PSI). The roof of the concrete shield-ing is omitted to show the vacuum system connecting the cy-clotron trap (upper right), crystal chamber (upper left) andthe cryostat of the X-ray detector (bottom left). Details of themechanical setup are shown in figs. 4 and 5.
Th. Strauch et al.: Pionic Deuterium 7
eter was restricted by a circular aperture to 95 mm in di-ameter to avoid edge effects and to 60 mm horizontally inorder to keep the Johann broadening small [107,108].
Such a spectrometer is able to measure simultaneouslyan energy interval according to the width of the X-raysource when using a correspondingly extended X-ray de-tector. Being pixel detectors, charge-coupled devices(CCDs) are ideal detectors for X-rays in the few keV rangebecause they combine an intrinsic position resolution withthe good energy resolution of semiconductor detectors. Inthis setup an array of 3 × 2 CCDs was used covering intotal 72 mm in height and 48 mm in width [109].
Monte Carlo studies show that about 2/3 of the inten-sity of the reflection is covered by the height of the CCDarray. The solid angle of the crystal with respect to thetarget is ≈ 6 ·10−5 and the target fraction accepted by thecrystal’s angular width is ≈ 5 ·10−3. Including window ab-sorption and assuming a peak reflectivity of 40% for theBragg crystal, the overall efficiency of the spectrometerresults in about 10−7.
The CCDs are realised in open electrode architectureto minimise X-ray absorption in the surface structures anda depletion depth of about 30µm yields a quantum effi-ciency of about 80% in the 3-4 keV range. The pixel size of40µm provides a sufficient two-dimensional position res-olution to measure precisely the shape of the diffractionimage. The relative orientation of the individual CCDsas well as the pixel size at the operating temperature of−100◦C was obtained by means of an optical measure-ment using a nanometric grid [112]. The detector surfacewas oriented perpendicular to the direction crystal – de-tector.
In the Johann setup, the energy calibration must beprovided by a reference line of known energy. The best
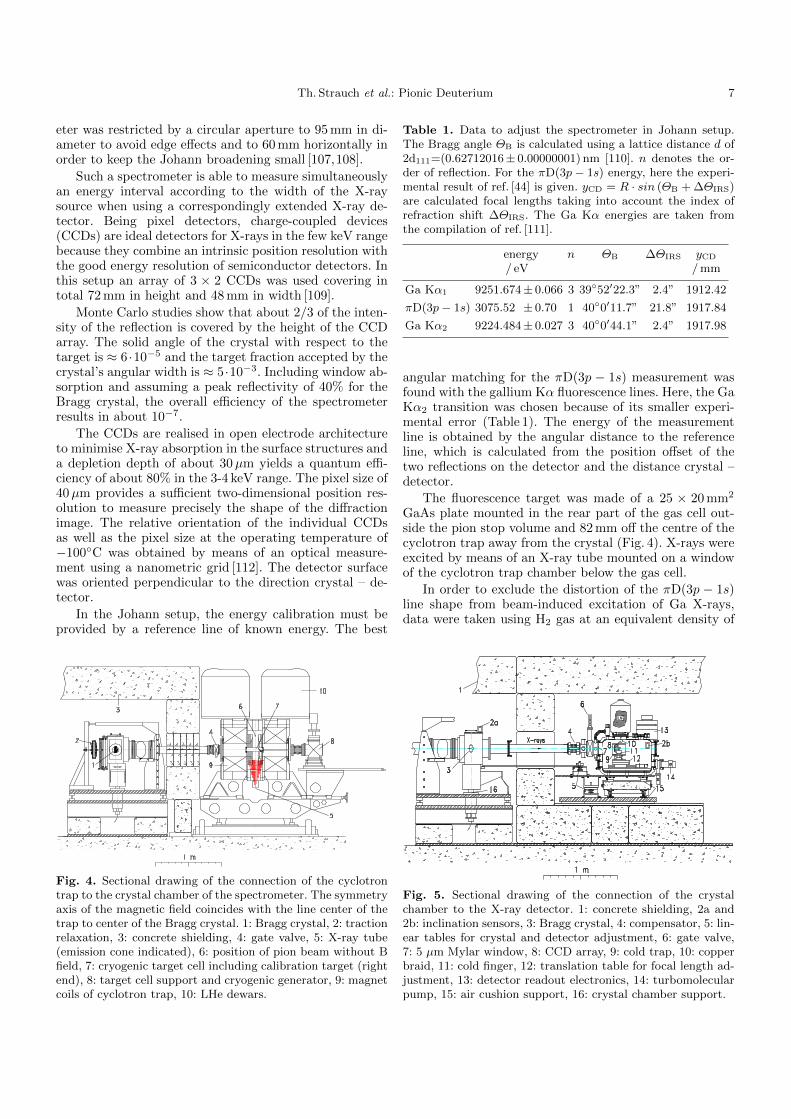
Fig. 4. Sectional drawing of the connection of the cyclotrontrap to the crystal chamber of the spectrometer. The symmetryaxis of the magnetic field coincides with the line center of thetrap to center of the Bragg crystal. 1: Bragg crystal, 2: tractionrelaxation, 3: concrete shielding, 4: gate valve, 5: X-ray tube(emission cone indicated), 6: position of pion beam without Bfield, 7: cryogenic target cell including calibration target (rightend), 8: target cell support and cryogenic generator, 9: magnetcoils of cyclotron trap, 10: LHe dewars.
Table 1. Data to adjust the spectrometer in Johann setup.The Bragg angle ΘB is calculated using a lattice distance d of2d111=(0.62712016± 0.00000001) nm [110]. n denotes the or-der of reflection. For the πD(3p− 1s) energy, here the experi-mental result of ref. [44] is given. yCD = R · sin (ΘB + ∆ΘIRS)are calculated focal lengths taking into account the index ofrefraction shift ∆ΘIRS. The Ga Kα energies are taken fromthe compilation of ref. [111].
energy n ΘB ∆ΘIRS yCD
/ eV / mm
Ga Kα1 9251.674± 0.066 3 39◦52′22.3” 2.4” 1912.42
πD(3p− 1s) 3075.52 ± 0.70 1 40◦0′11.7” 21.8” 1917.84
Ga Kα2 9224.484± 0.027 3 40◦0′44.1” 2.4” 1917.98
angular matching for the πD(3p − 1s) measurement wasfound with the gallium Kα fluorescence lines. Here, the GaKα2 transition was chosen because of its smaller experi-mental error (Table 1). The energy of the measurementline is obtained by the angular distance to the referenceline, which is calculated from the position offset of thetwo reflections on the detector and the distance crystal –detector.
The fluorescence target was made of a 25 × 20 mm2
GaAs plate mounted in the rear part of the gas cell out-side the pion stop volume and 82 mm off the centre of thecyclotron trap away from the crystal (Fig. 4). X-rays wereexcited by means of an X-ray tube mounted on a windowof the cyclotron trap chamber below the gas cell.
In order to exclude the distortion of the πD(3p − 1s)line shape from beam-induced excitation of Ga X-rays,data were taken using H2 gas at an equivalent density of
Fig. 5. Sectional drawing of the connection of the crystalchamber to the X-ray detector. 1: concrete shielding, 2a and2b: inclination sensors, 3: Bragg crystal, 4: compensator, 5: lin-ear tables for crystal and detector adjustment, 6: gate valve,7: 5 µm Mylar window, 8: CCD array, 9: cold trap, 10: copperbraid, 11: cold finger, 12: translation table for focal length ad-justment, 13: detector readout electronics, 14: turbomolecularpump, 15: air cushion support, 16: crystal chamber support.
8 Th. Strauch et al.: Pionic Deuterium
10 bar. Using a hydrogen filling guarantees similar stop-ping conditions for the pion beam. No Ga X-rays couldbe identified during a measuring time corresponding toabout 15% of the one used for D2 at the same density.Other sources of background are discussed in sect. 5.
The distance from the centre of the crystal to thecentre of the cyclotron trap was 2100 mm, about 10%outside the Rowland circle given by the focal conditionR · sinΘB. The advantage of placing the X-ray sourcesomewhat off the focal position is an averaging over nonuniformities of the target. Both GaAs and D2 target wereextended enough that no cuts in the tails of the reflec-tion occur. The distance crystal – detector (Fig. 5), cho-sen to be at the assumed πD focal length, was found tobe yCD = 1918.1 ± 0.5 mm from a survey measurement.
Alternating measurements of the Ga fluorescence ra-diation and the πD line were performed at least once perday. The Ga fluorescence X-rays were in addition used tomonitor the stability of the line position.
The spectrometer response was measured at the en-ergies 3104, 2765, and 2430 eV using the narrow M1 X-ray lines from helium-like argon, chlorine, and sulphurproduced in a dedicated electron-cyclotron ion resonancetrap (ECRIT) [113,114,115]. It turned out that the res-olution function at a given energy can be built up fromthe ideal response calculated from the dynamical theoryof diffraction for a perfect flat crystal (intrinsic resolu-tion) convoluted with the geometrical imaging at the mea-surement position by means of a Monte-Carlo ray-tracingcode and by folding in an additional Gaussian contribu-tion. The intrinsic resolution is calculated here with thecode XOP [116]. The Gaussian models possible imperfec-tions of the crystal material and mounting and was foundto be sufficiently precise, that no difference is visible byeye between data and Monte-Carlo simulations.
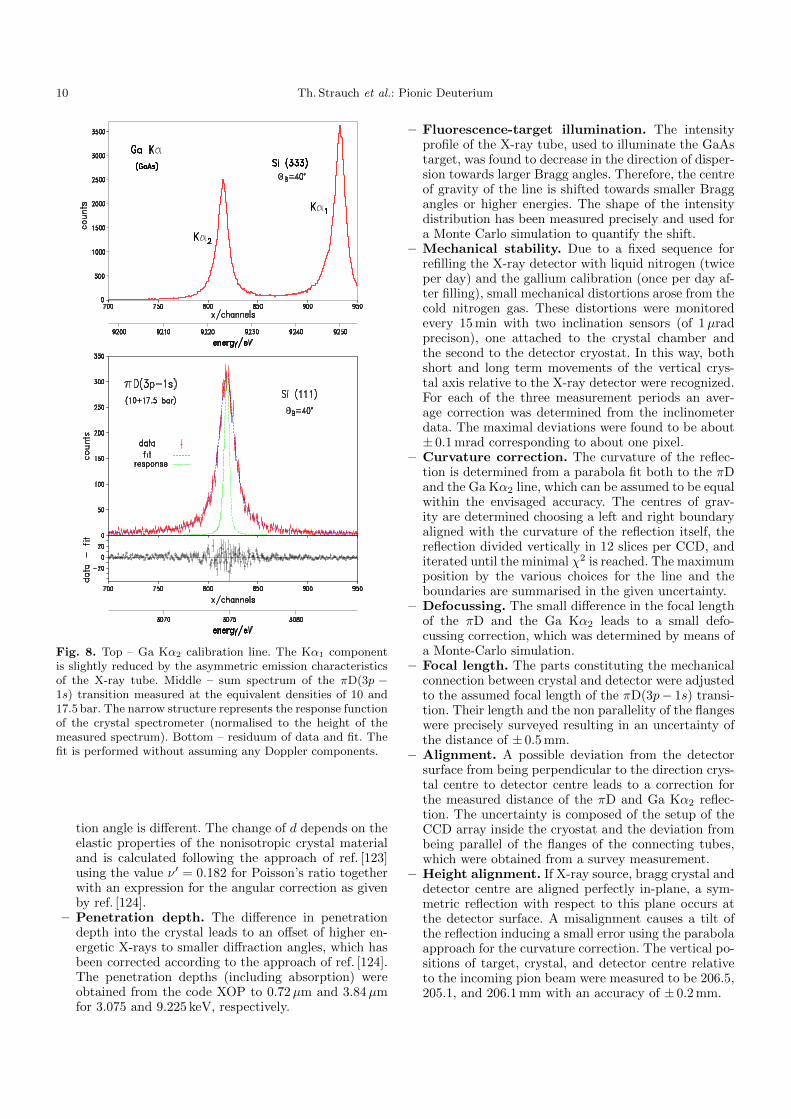
The value for the Gaussian width at the energy of theπD(3p− 1s) transition energy of 3075 eV was found fromthe fit to the results for argon, chlorine, and sulphur tobe (122±8) meV. The narrow structure in fig. 8 - middleshows the Monte-Carlo generated response for the setupof the πD experiment. The total width of this resolutionfunction is (436± 3) meV (FWHM) and close to the the-oretical limit of 403 meV—calculated by means of XOP—for the intrinsic resolution of a silicon crystal cut alongthe (111) plane.
Details on the experimental setup and analysis may befound elsewhere [117].
5 Analysis
Raw data of the X-ray detector consist of the digitizedcharge contents and a position index of the pixel. Thegranularity of the CCDs allows for efficient backgroundrejection by means of pattern recognition (cluster anal-ysis). Photoelectrons from few keV X-ray conversion arestopped within a few micrometer only and, therefore, de-posit charge in one or two pixels with one common bound-ary. Beam induced background, mainly high energetic pho-tons from neutrons produced in pion absorption and cap-
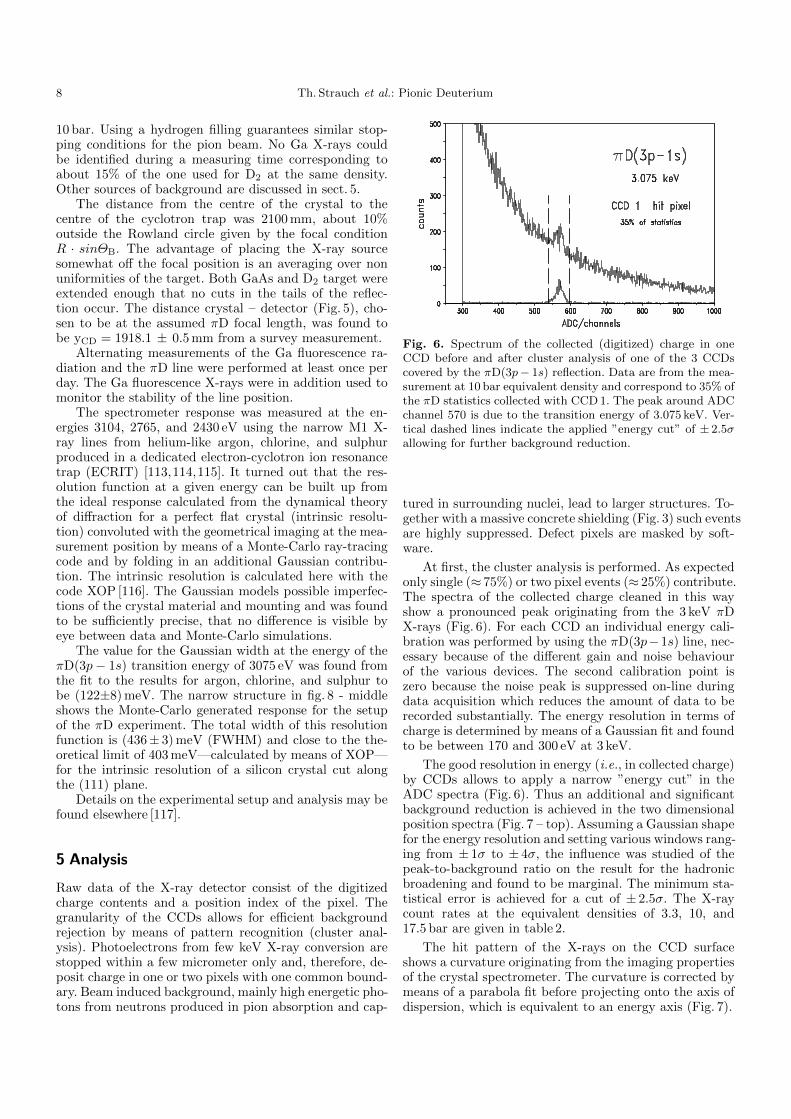
Fig. 6. Spectrum of the collected (digitized) charge in oneCCD before and after cluster analysis of one of the 3 CCDscovered by the πD(3p− 1s) reflection. Data are from the mea-surement at 10 bar equivalent density and correspond to 35% ofthe πD statistics collected with CCD 1. The peak around ADCchannel 570 is due to the transition energy of 3.075 keV. Ver-tical dashed lines indicate the applied ”energy cut” of ± 2.5σallowing for further background reduction.
tured in surrounding nuclei, lead to larger structures. To-gether with a massive concrete shielding (Fig. 3) such eventsare highly suppressed. Defect pixels are masked by soft-ware.
At first, the cluster analysis is performed. As expectedonly single (≈ 75%) or two pixel events (≈ 25%) contribute.The spectra of the collected charge cleaned in this wayshow a pronounced peak originating from the 3 keV πDX-rays (Fig. 6). For each CCD an individual energy cali-bration was performed by using the πD(3p−1s) line, nec-essary because of the different gain and noise behaviourof the various devices. The second calibration point iszero because the noise peak is suppressed on-line duringdata acquisition which reduces the amount of data to berecorded substantially. The energy resolution in terms ofcharge is determined by means of a Gaussian fit and foundto be between 170 and 300 eV at 3 keV.
The good resolution in energy (i.e., in collected charge)by CCDs allows to apply a narrow ”energy cut” in theADC spectra (Fig. 6). Thus an additional and significantbackground reduction is achieved in the two dimensionalposition spectra (Fig. 7 – top). Assuming a Gaussian shapefor the energy resolution and setting various windows rang-ing from ± 1σ to ± 4σ, the influence was studied of thepeak-to-background ratio on the result for the hadronicbroadening and found to be marginal. The minimum sta-tistical error is achieved for a cut of ± 2.5σ. The X-raycount rates at the equivalent densities of 3.3, 10, and17.5 bar are given in table 2.
The hit pattern of the X-rays on the CCD surfaceshows a curvature originating from the imaging propertiesof the crystal spectrometer. The curvature is corrected bymeans of a parabola fit before projecting onto the axis ofdispersion, which is equivalent to an energy axis (Fig. 7).

Th. Strauch et al.: Pionic Deuterium 9
The penetration depths of the πD(3p − 1s) and theGa X-rays differ significantly (5 and 105µm for 3.075and 9.224 keV, respectively [118]). Ga K X-rays also con-vert at or beyond the boundary of the depletion regionof the CCD, where charge diffusion is already significant.Therefore, in this case compact clusters up to size 9 wereaccepted. As the Ga calibration measurements were per-formed without pion beam in the experimental area, nobackground events occur and, hence, no suppression algo-rithm is necessary to clean the Ga spectra. For one Gacalibration measurement, typically 4000 Ga Kα2 eventswere recorded. The total line width was found to be (2.9±0.1) eV, which is two standard deviations above the natu-ral line width of (2.66± 0.13) eV as given in ref. [119].
Fig. 7. Top – Scatter plot of the πD(3p− 1s) reflection mea-sured at a density equivalent to 10 bar (NTP). Its curvatureis obtained by a parabola fit. Bottom – projection to the axisof dispersion after curvature correction. One channel (pixel) inthe direction of dispersion (x) corresponds in first order reflec-tion to 76.402±0.001 meV.
5.1 Energy calibration
The tabulated values for the Ga Kα energies [111] were ob-tained using the compound GaAs [120] – the same mate-rial used in this experiment, i.e., a possible chemical shiftis irrelevant for this calibration. The position of the Ga
Table 2. Experiment parameters. Rates (counts/Cb) aremeant for a detector width of 14 mm and normalised to theintegrated accelerator proton current (typically 2 mA) for ”en-ergy cut” of ± 2.5σ. The equivalent density of the target gas isexpressed as pressure value at a temperature of 20◦C (NTP).The number of Ga calibration runs for each density is indicatedin the last column. The backgound rate is density independentand scales linearly with the width of the ”energy cut”. Thebackground given here stems from a detector area of 17.28 cm2
corresponding to 3 CCDs.
D2 density target parameters counts no. of Ga(equivalent) T pressure πD(3p− 1s) calibrations
/ bar / K / bar total / Cb
3.3± 0.1 33 0.51 1448±49 1.98±0.07 1010.0± 0.3 27 1.09 4010±74 6.40±0.12 817.5± 0.4 25 1.36 4877±80 7.35±0.12 7
background 1.64±0.11
Kα2 line was determined applying a single Voigt profile inthe fit, which is also the procedure used for the tabulatedvalues [120]. The matching of the angular positions owingto the Ga Kα2 and πD(3p − 1s) energies is evident fromfig. 8.
The πD line was modeled both with a Voigt profile,where Doppler broadening and response function togetherare approximated by a single Gaussian, and the true re-sponse as determined from the ECRIT data convolutedwith the imaging properties by means of a ray tracingMC code and including the Doppler contributions fromCoulomb de-excitation. Both methods yield the same po-sition value within a few hundreds of one CCD pixel.
Various corrections to the measured line positions mustbe applied. Significant are, besides the index of refractionshift, bending and penetration correction, a shift of thegallium line due to the non-uniform illumination of thefluorescence target, and mechanical shifts from temper-ature changes from the nitrogen filling of the detector.These corrections are discussed in the following and listedtogether with less significant corrections in table 3.
– Index of refraction. The Ga calibration line and theπD(3p−1s) transition were measured in third and firstorder diffraction (table 1). As the index of refractionstrongly depends on the X-ray wave length a significantcorrection must be applied in order to obtain the rightBragg angle difference. The index of refraction ∆ΘIRS
is calculated here from the atomic scattering factorsas used by the code XOP [116]. The accuracy of suchamplitudes is claimed to be of the order of 1% for 3and 9 keV, respectively, as are the angular correctionsderived from them. The amplitudes of various sets varyby less than 0.5% [121,122].
– Crystal bending. Crystal bending leads to a depthdependence of the lattice spacing d, where close to thesurface the maximum lattice distance is assumed. Be-cause of the difference in energy and accordingly thedifferent mean penetration depth of the X-rays, theaverage lattice spacing and, consequently, the diffrac-
10 Th. Strauch et al.: Pionic Deuterium
Fig. 8. Top – Ga Kα2 calibration line. The Kα1 componentis slightly reduced by the asymmetric emission characteristicsof the X-ray tube. Middle – sum spectrum of the πD(3p −1s) transition measured at the equivalent densities of 10 and17.5 bar. The narrow structure represents the response functionof the crystal spectrometer (normalised to the height of themeasured spectrum). Bottom – residuum of data and fit. Thefit is performed without assuming any Doppler components.
tion angle is different. The change of d depends on theelastic properties of the nonisotropic crystal materialand is calculated following the approach of ref. [123]using the value ν′ = 0.182 for Poisson’s ratio togetherwith an expression for the angular correction as givenby ref. [124].
– Penetration depth. The difference in penetrationdepth into the crystal leads to an offset of higher en-ergetic X-rays to smaller diffraction angles, which hasbeen corrected according to the approach of ref. [124].The penetration depths (including absorption) wereobtained from the code XOP to 0.72µm and 3.84µmfor 3.075 and 9.225 keV, respectively.
– Fluorescence-target illumination. The intensityprofile of the X-ray tube, used to illuminate the GaAstarget, was found to decrease in the direction of disper-sion towards larger Bragg angles. Therefore, the centreof gravity of the line is shifted towards smaller Braggangles or higher energies. The shape of the intensitydistribution has been measured precisely and used fora Monte Carlo simulation to quantify the shift.
– Mechanical stability. Due to a fixed sequence forrefilling the X-ray detector with liquid nitrogen (twiceper day) and the gallium calibration (once per day af-ter filling), small mechanical distortions arose from thecold nitrogen gas. These distortions were monitoredevery 15 min with two inclination sensors (of 1µradprecison), one attached to the crystal chamber andthe second to the detector cryostat. In this way, bothshort and long term movements of the vertical crys-tal axis relative to the X-ray detector were recognized.For each of the three measurement periods an aver-age correction was determined from the inclinometerdata. The maximal deviations were found to be about± 0.1 mrad corresponding to about one pixel.
– Curvature correction. The curvature of the reflec-tion is determined from a parabola fit both to the πDand the Ga Kα2 line, which can be assumed to be equalwithin the envisaged accuracy. The centres of grav-ity are determined choosing a left and right boundaryaligned with the curvature of the reflection itself, thereflection divided vertically in 12 slices per CCD, anditerated until the minimal χ2 is reached. The maximumposition by the various choices for the line and theboundaries are summarised in the given uncertainty.
– Defocussing. The small difference in the focal lengthof the πD and the Ga Kα2 leads to a small defo-cussing correction, which was determined by means ofa Monte-Carlo simulation.
– Focal length. The parts constituting the mechanicalconnection between crystal and detector were adjustedto the assumed focal length of the πD(3p− 1s) transi-tion. Their length and the non parallelity of the flangeswere precisely surveyed resulting in an uncertainty ofthe distance of ± 0.5 mm.
– Alignment. A possible deviation from the detectorsurface from being perpendicular to the direction crys-tal centre to detector centre leads to a correction forthe measured distance of the πD and Ga Kα2 reflec-tion. The uncertainty is composed of the setup of theCCD array inside the cryostat and the deviation frombeing parallel of the flanges of the connecting tubes,which were obtained from a survey measurement.
– Height alignment. If X-ray source, bragg crystal anddetector centre are aligned perfectly in-plane, a sym-metric reflection with respect to this plane occurs atthe detector surface. A misalignment causes a tilt ofthe reflection inducing a small error using the parabolaapproach for the curvature correction. The vertical po-sitions of target, crystal, and detector centre relativeto the incoming pion beam were measured to be 206.5,205.1, and 206.1 mm with an accuracy of ± 0.2 mm.

Th. Strauch et al.: Pionic Deuterium 11
– Pixel size. The average pixel size of the CCDs wasdetermined in a separate experiment to be (39.9775 ±0.0006)µm at the operating temperature of −100◦C[112].
– Temperature normalisation. The crystal temper-ature was monitored regularly during the measure-ments. Though of minor impact, the lattice constanttabulated for 22◦C, was readjusted to the average tem-perature of 30◦C. The temperature was found to bestable within less than± 1◦C. Hence, any position vari-ation due to the change of the lattice constant can beneglected.
As described above, the total uncertainty in the determi-nation of the πD(3p− 1s) transition energy is dominatedby the one of the Ga calibration line (± 27 meV). The sys-tematic error of about 6 meV is about 50% of the statis-tical uncertainty (sect. 6.1) and comparable to the uncer-tainty of the calculated electromagnetic transition energy(sect. 6.2).
5.2 Line width
For comparison with data, the line shape is constructedby folding the response function (see sect. 4 and fig. 8)with the Doppler induced width derived from a given ki-netic energy distribution (e.g., as shown in fig. 2), and aLorentzian representing the natural width. Based on theexperience of the study of the µH(3p− 1s) line shape [83],in a cascade model free approach, the kinetic energy dis-tribution is approximated by narrow intervals of a feweV width at energies which are inspired by the energyrelease of Coulomb de-excitation transitions. Such an en-ergy spectrum assuming only a low-energy (0-2 eV) andone high-energy component (owing to the (4−3) Coulombde-excitation) is included in fig. 2.
Spectra constructed in this way are compared to databy means of a χ2 analysis using the MINUIT package [125].Natural line width, total intensity of the line, background,and relative weight of the Doppler contributions are freeparameters of the fit. The sum of the Doppler contribu-tions is normalised to one.
Following again the approach from the analysis of theµH(3p− 1s) transition, one tries to identify consecutivelyindividual Doppler contributions by using first a singlekinetic-energy component starting at energy zero and vari-able width. This corresponds to πD systems not being ac-celerated or already moderated down again by collisionsto energies of a few eV. The χ2 analysis shows that theupper boundary of the low-energy contribution must notexceed 8 eV. This result was achieved independently forthe spectra taken at 10 bar and the 17.5 bar equivalentdensity (Fig. 9). The result for the natural line width Γ1s
turned out to be insensitive to the upper boundary whenkeeping its value at 8 eV or below. Therefore, the low-energy component was fixed to the interval 0 – 2 eV in thefurther analysis.
The most important higher energetic components areexpected at about 80 and 115 eV stemming from the
Table 3. Angular corrections (in seconds of arc (”)) with as-sociated uncertainties as well as other sources of systematicand calibration errors occuring in the determination of theπD(3p − 1s) transition energy and hadronic shift ε1s. The to-tal angular correction being the sum of the individual termsand associated uncertainties are converted to meV. The to-tal systematic error owing to experiment and setup (errorsare assumed to be uncorrelated) is given conservatively as thequadratic sum and is calculated assuming on average the me-chanical stability of the 17.5 bar measurement. For comparison,the statistical error and the uncertainty of the QED transitionenergy (see sects. 6.1 and 6.2) is shown together with the oneof the Ga calibration line.
uncertainty πD Ga Kα total correctioncorrection / ” / ” / meV
index of refraction — 2.4 -42.6 ± 0.4
index of refraction 21.8 — 387.2 ± 3.9
crystal bending -3.73 -3.65 -1.4 +−
0.40.9
penetration depth -0.06 -0.32 4.6 +−
1.12.7
illumination GaAs target 0 -1.075 19.1 ± 3.8
mechanical stability 3.3 bar 0.24 4.2 ± 2.5mechanical stability 10 bar 0.71 12.6 ± 4.0mechanical stability 17.5 bar 0.80 14.2 ± 1.3
curvature correction ± 2.0
defocussing 0 -0.006 0.11 ± 0.01
focal length ± 0.05
alignment crystal-detector +−
00.015
height alignment +−
00.016
pixel size ± 0.14
temperature renormalisation ± 0.02
bias due to asymmetric errors -0.4
total systematic error +−
6.06.6
statistical error ± 10.9
EQED ± 7.9
Ga Kα2 ± 27
Coulomb de-excitation transitions (4 − 3) and (5 − 3).Searches for any of these contributions failed, even whenusing the sum spectrum of the two measurements at 10and 17.5 bar. Varying energy or width of the high-energyDoppler contribution did not change this result.
In this respect, pionic deuterium differs significantlyfrom pionic and muonic hydrogen. There, such high-energycontributions were clearly identified from the width anal-ysis of the X-ray transitions [46,69,83]. For that reason,the ESCM calculation of the kinetic energy distributionfor the πH(3p−1s) case, scaled to πD kinematics (Fig. 2),is unable to reproduce the πD(3p−1s) line shape, becauseit contains rather strong contributions from (4 − 3) and

12 Th. Strauch et al.: Pionic Deuterium
Fig. 9. Search for evidence of an extended low-energy com-ponent in the kinetic energy distribution by including in thefit of the data a uniform kinetic energy distribution of variablewidth starting at Tkin = 0. Allowing for kinetic energies aboveabout 8 eV increasingly downgrades the quality of the fit. Dia-monds (left χ2 scale) are due to the 10 bar data. Squares (rightscale) are from a combined fit to the two spectra taken at 10and 17.5 bar. Degrees of freedom in the fits are 487 (left scale)and 974 (right).
(5−3) Coulomb de-excitation. At present, no explanationhas been found for such an unequal behaviour.
It has been studied in detail which fraction of high-energy components may be missed in the fit by studyingMonte-Carlo generated spectra for the statistics collectedfor the sum of the 10 and 17.5 bar measurements. The in-tensity of the Doppler contributions was not restricted topositive values to allow an unbiased search for the mini-mum χ2 (Fig. 10 – top). The normalization to one is thenmaintained by a correspondingly increased value for theother component.
The probability to miss a Doppler component, stem-ming from kinetic energies around 80 eV and correspond-ing to the (4−3) transition, is displayed in fig. 10 – bottomas a function of its relative strength. It can be seen, thata contribution of 25% or larger can hardly be missed. For10% relative intensity, the chance is about 15% to find in-tensities≤ 0 in the fit. Taking symmetric limits around themaximum at about 10% relative frequency (Fig. 10 – top)corresponds to 1σ with respect to the full distribution. Foreach set of conditions 400 simulations were performed.
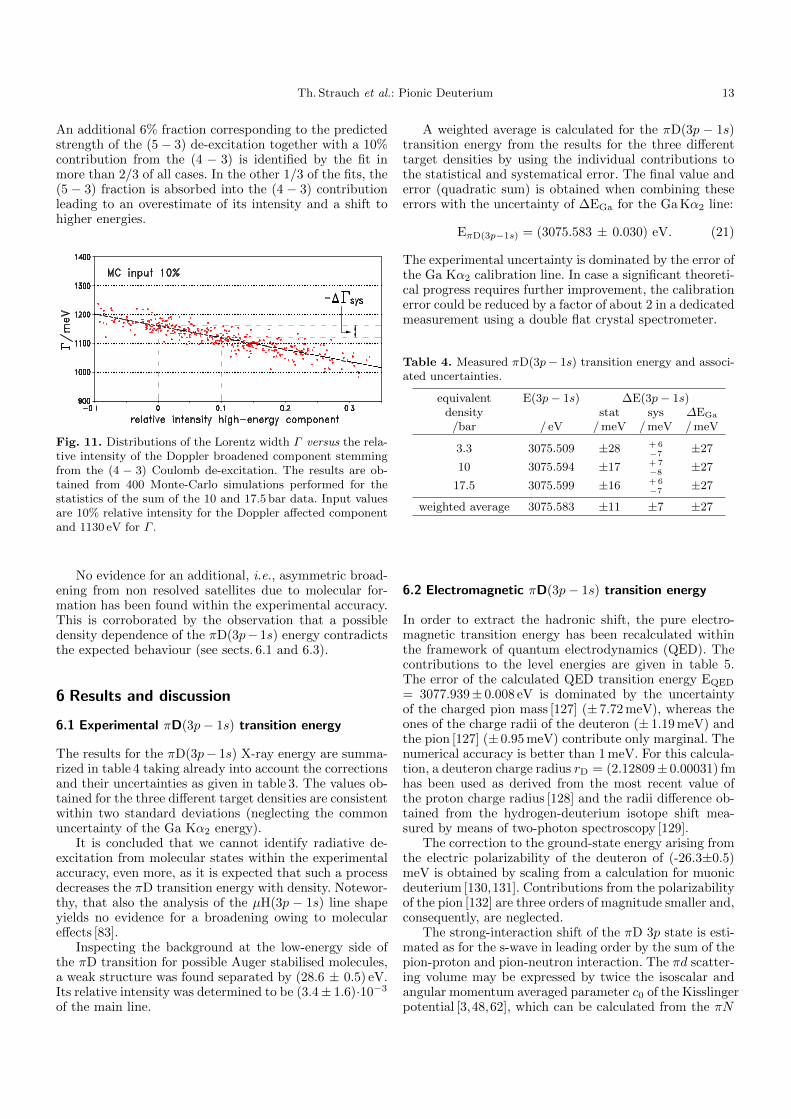
Assuming no Doppler components yields an upper limitfor Γ1s which is identical to the result obtained when usingonly the low-energy component of 0–2 eV. The residuumof such a fit is shown in fig. 8 – bottom. The limit of sen-sitivity for a component at 80 eV kinetic energy of 10%yields a lower bound for Γ1s (−4 Γsys) corresponding tothe above-mentioned 1σ criterium (Fig. 10). The distribu-tion of the results for the weight of this component andthe Lorentz width Γ reflects the fluctuations owing to thelimited statistics (Fig. 11).
From the various above-mentioned sets, each with 400simulations, a possible systematic deviation (bias) of theanalysis code was examined. Such a deviation stems froman imperfect description of the probability distributionby the fit model [126], here used to extract Γ1s, which
becomes more and more important with decreasing statis-tics. Where for the individual spectra measured at 3.3, 10,and 17.5 bar the bias was found to depend significantly onthe statistics ((-38±3), (17±2), and (11±2) meV), for thesum spectrum (10+17.5) bar it becomes almost negligible((-2±2) meV). The error of ≈ 2 meV of the bias is given bythe average of the results from the 400 Monte-Carlo spec-tra, which in turn determines the number of simulationsnecessary.
The behaviour of the bias is understood as follows.For lower statistics, the suppression of the tails resultsin smaller widths, whereas in the case of higher statis-tics the fit tends to include background into the tail. Thebackground has been found to be constant in all spectra.The systematical uncertainty of Γ1s due to different back-ground levels within the limits as obtained from the fit tothe data is estimated to below 1 meV by means of MonteCarlo simulations.
Again 400 Monte-Carlo generated spectra, based on acalculated ESCM energy distribution, were used to quan-tify the sensitivity to any further high-energy component.
Fig. 10. Top – distributions of relative intensity of a Dopplerbroadened component induced by the (4 − 3) Coulomb de-excitation transition found from fits to Monte-Carlo (MC) gen-erated spectra. The relative strength used for the simulations is10% (filled) and 25% (hatched) relative intensity, respectively.In both cases, the result is based on 400 spectra generated forthe statistics of the sum of the 10 and 17.5 bar data. Bottom– probability to miss a Doppler contribution corresponding tothe (4 − 3) Coulomb de-excitation (modeled by a uniform ki-netic energy distribution from (76−84) eV) as a function of itsrelative intensity.
Th. Strauch et al.: Pionic Deuterium 13
An additional 6% fraction corresponding to the predictedstrength of the (5− 3) de-excitation together with a 10%contribution from the (4 − 3) is identified by the fit inmore than 2/3 of all cases. In the other 1/3 of the fits, the(5 − 3) fraction is absorbed into the (4 − 3) contributionleading to an overestimate of its intensity and a shift tohigher energies.
Fig. 11. Distributions of the Lorentz width Γ versus the rela-tive intensity of the Doppler broadened component stemmingfrom the (4 − 3) Coulomb de-excitation. The results are ob-tained from 400 Monte-Carlo simulations performed for thestatistics of the sum of the 10 and 17.5 bar data. Input valuesare 10% relative intensity for the Doppler affected componentand 1130 eV for Γ .
No evidence for an additional, i.e., asymmetric broad-ening from non resolved satellites due to molecular for-mation has been found within the experimental accuracy.This is corroborated by the observation that a possibledensity dependence of the πD(3p− 1s) energy contradictsthe expected behaviour (see sects. 6.1 and 6.3).
6 Results and discussion
6.1 Experimental πD(3p− 1s) transition energy
The results for the πD(3p− 1s) X-ray energy are summa-rized in table 4 taking already into account the correctionsand their uncertainties as given in table 3. The values ob-tained for the three different target densities are consistentwithin two standard deviations (neglecting the commonuncertainty of the Ga Kα2 energy).
It is concluded that we cannot identify radiative de-excitation from molecular states within the experimentalaccuracy, even more, as it is expected that such a processdecreases the πD transition energy with density. Notewor-thy, that also the analysis of the µH(3p − 1s) line shapeyields no evidence for a broadening owing to moleculareffects [83].
Inspecting the background at the low-energy side ofthe πD transition for possible Auger stabilised molecules,a weak structure was found separated by (28.6 ± 0.5) eV.Its relative intensity was determined to be (3.4± 1.6)·10−3
of the main line.
A weighted average is calculated for the πD(3p − 1s)transition energy from the results for the three differenttarget densities by using the individual contributions tothe statistical and systematical error. The final value anderror (quadratic sum) is obtained when combining theseerrors with the uncertainty of ∆EGa for the Ga Kα2 line:
EπD(3p−1s) = (3075.583 ± 0.030) eV. (21)
The experimental uncertainty is dominated by the error ofthe Ga Kα2 calibration line. In case a significant theoreti-cal progress requires further improvement, the calibrationerror could be reduced by a factor of about 2 in a dedicatedmeasurement using a double flat crystal spectrometer.
Table 4. Measured πD(3p− 1s) transition energy and associ-ated uncertainties.
equivalent E(3p− 1s) ∆E(3p− 1s)density stat sys ∆EGa
/bar / eV / meV / meV / meV
3.3 3075.509 ±28 +6−7
±27
10 3075.594 ±17 +7−8
±27
17.5 3075.599 ±16 +6−7
±27
weighted average 3075.583 ±11 ±7 ±27
6.2 Electromagnetic πD(3p− 1s) transition energy
In order to extract the hadronic shift, the pure electro-magnetic transition energy has been recalculated withinthe framework of quantum electrodynamics (QED). Thecontributions to the level energies are given in table 5.The error of the calculated QED transition energy EQED
= 3077.939± 0.008 eV is dominated by the uncertaintyof the charged pion mass [127] (± 7.72 meV), whereas theones of the charge radii of the deuteron (± 1.19 meV) andthe pion [127] (± 0.95 meV) contribute only marginal. Thenumerical accuracy is better than 1 meV. For this calcula-tion, a deuteron charge radius rD = (2.12809± 0.00031) fmhas been used as derived from the most recent value ofthe proton charge radius [128] and the radii difference ob-tained from the hydrogen-deuterium isotope shift mea-sured by means of two-photon spectroscopy [129].
The correction to the ground-state energy arising fromthe electric polarizability of the deuteron of (-26.3±0.5)meV is obtained by scaling from a calculation for muonicdeuterium [130,131]. Contributions from the polarizabilityof the pion [132] are three orders of magnitude smaller and,consequently, are neglected.
The strong-interaction shift of the πD 3p state is esti-mated as for the s-wave in leading order by the sum of thepion-proton and pion-neutron interaction. The πd scatter-ing volume may be expressed by twice the isoscalar andangular momentum averaged parameter c0 of the Kisslingerpotential [3,48,62], which can be calculated from the πN

14 Th. Strauch et al.: Pionic Deuterium
Table 5. Contributions to the pure electromagnetic bindingand the (3p−1s) transition energies. The terms vac. pol. 11, 13,and 21 stand for Uehling, Wichmann-Kroll, and Kallen-Sabrycontributions. The shift value due to the polarizability of thedeuteron is derived from results given in refs. [130,131]. A ”0”indicates a negligibly small but finite value.
3p 1s EQED(3p− 1s)
/ eV / eV /eV
Coulomb -384.31079 -3458.52422 3074.21344self-energy + finite size 0 0.00220 -0.00220vac. pol. 11 -0.01432 -3.72948 3.71516muon vac. pol. 11 0 -0.00034 -0.00034vac. pol. 13 0 0.00002 -0.00002vac. pol. 21 -0.00013 -0.02793 0.02780recoil 1 -0.00004 -0.00297 0.00293relativistic recoil 0 0.00029 -0.00029two-loop vac. pol. 0 -0.00577 0.00577pion finite size 0 -0.04764 0.04764deuteron polarizability 0 -0.0263 0.0263ε3p -0.000008 — 0.000008atom recoil — — -0.00235
total -384.32528 -3462.26684 3077.93922
scattering volumes. Values are given, e.g., in ref. [133]. In-serting the result for 2 · c0 in the Trueman formula forthe 3p state [93,94], one obtains a negligibly small shift ofε3p ≈ 8µeV.
6.3 Strong-interaction shift ε1s
Subtracting measured and calculated QED transition en-ergies, the hadronic shift is obtained to
ε1s = − (2356 ± 31) meV. (22)
The negative sign indicates a repulsive interaction, i.e.,the strong interaction reduces the atomic 1s level bindingenergy.
Our result is compared to previous measurements intable 7 and fig. 12. Note that the electromagnetic transi-tion energy EQED differs slightly in the analysis of thevarious experiments. Worth mentioning, that the resultsof the three precision experiments are in good agreementthough three different calibration lines have been used.
Combining the results of this experiment and the onesgiven in refs. [44] and [45] yields a weighted average ofε1s = (−2379± 19) meV assuming any absence of a densitydependence for the πD(3p− 1s) transition energy.
Inspecting fig. 12 suggests that an extrapolation to den-sity zero yields the value aimed at. A linear fit yields aslope of (6.3±1.7) meV/bar and ε1s = (2445±27) meV atdensity zero. However, at present there is no explanationfor such a density dependence (see sect. 2), which might besubject for a next generation experiment and, therefore,we stick to the density independent average given in (22).
Fig. 12. Experimental information on the hadronic shift inpionic deuterium. The error of the individual measurementsat 3.3, 10, and 17.5 bar equivalent density and, therefore, alsoof the weighted average is dominated by the uncertainty ofthe Ga Kα2 energy. The results from the two previous experi-ments at 2.5 bar [45] and 15 bar [44] are adjusted according tothe new values for the pure electromagnetic transition energies(Table 7).
6.4 Strong-interaction width Γ1s
Corresponding to the discussion in sect. 5.2, the hadronicbroadening is extracted by introducing only a low-energycomponent from 0−2 eV in the kinetic energy distribution.The combined result is obtained by averaging according tothe statistical weight (Table 6). The large negative error isdominated by the uncertainty that a Doppler contributionof the level of about 10% might be missed in the analysis.
Combining all errors (quadratic sum), we obtain
Γ1s =
(1171
+ 23
− 49
)meV. (23)
The result is in good agreement with the earlier mea-surements, but a factor of about 3 more precise (Table 7and fig. 13). The weighted average of the results of this
experiment, [44], and [45] is Γ1s =(
1165 + 22− 38
)meV.
Table 6. Pionic deuterium ground state width Γ1s as obtainedfrom the individual measurements at 3.3, 10, and 17.5 bar andthe sum spectrum at (10+17.5) bar. The weighted average iscalculated from the result of the sum spectrum (10+17.5) barand the one of the 3.3 bar measurement.
equivalent Γ1s ∆Γ1s
density stat sys/ bar / meV / meV / meV
3.3 1246 ± 71 + 0− 152
10 1177 ± 38 + 0− 92
17.5 1121 ± 32 + 0− 81
(10 + 17.5) 1162 ± 24 + 0− 43
weighted average 1171 ± 23 + 0− 43
Th. Strauch et al.: Pionic Deuterium 15
Table 7. Transition energies and hadronic effects found for pionic deuterium and corresponding experimental conditions. Thetotal error of the measured transition energy Eexp is calculated quadratically from the statistical and systematical contributions.The hadronic shift is defined by ε1s ≡ Eexp − EQED. Note the change of EQED (∗) due to a new calculation performed for theanalysis of this experiment which shifts the result of [44] to ε1s = −2419 ± 100 meV. Also for the (2p − 1s) transition a newQED value of 2597.519±0.008 eV is obtained resulting in ε1s = −2461± 55 meV for the experiment of [45]. No uncertainties forthe QED values have been reported for the experiments decribed in refs. [45,135,136].
transition equivalent energy Eexp EQED ε1s Γ1s
density calibration/ bar / eV / eV / meV / meV
πD(2p− 1s) 4− 8.5 Bi MV edge 2592.8 +−
1.62.0
2597.61 ± 0.15 – 4800 +−
16002000
— [134]
πD(2p− 1s) ≈ 3.5 Cu Kα 2593.3 ± 2.3 2598.1 – 4800 ± 2300 — [135]πD(2p− 1s) ≈ 50 Cl Kα 2592.1 ± 0.9 2597.6 – 5500 ± 900 — [136]πD(3p− 1s) 15 Ar Kα 3075.52 ± 0.07 3077.95 ± 0.01∗ – 2430 ± 100 1020 ± 210 [44]πD(2p− 1s) 2.5 Cl Kα 2595.058 ± 0.055 2597.527∗ – 2469 ± 55 1194 ± 105 [45]
πD(3p− 1s) 3.3/10/17.5 Ga Kα2 3075.583 ± 0.030 3077.939 ± 0.008∗ – 2356 ± 31 1171 +−
2349
this exp.
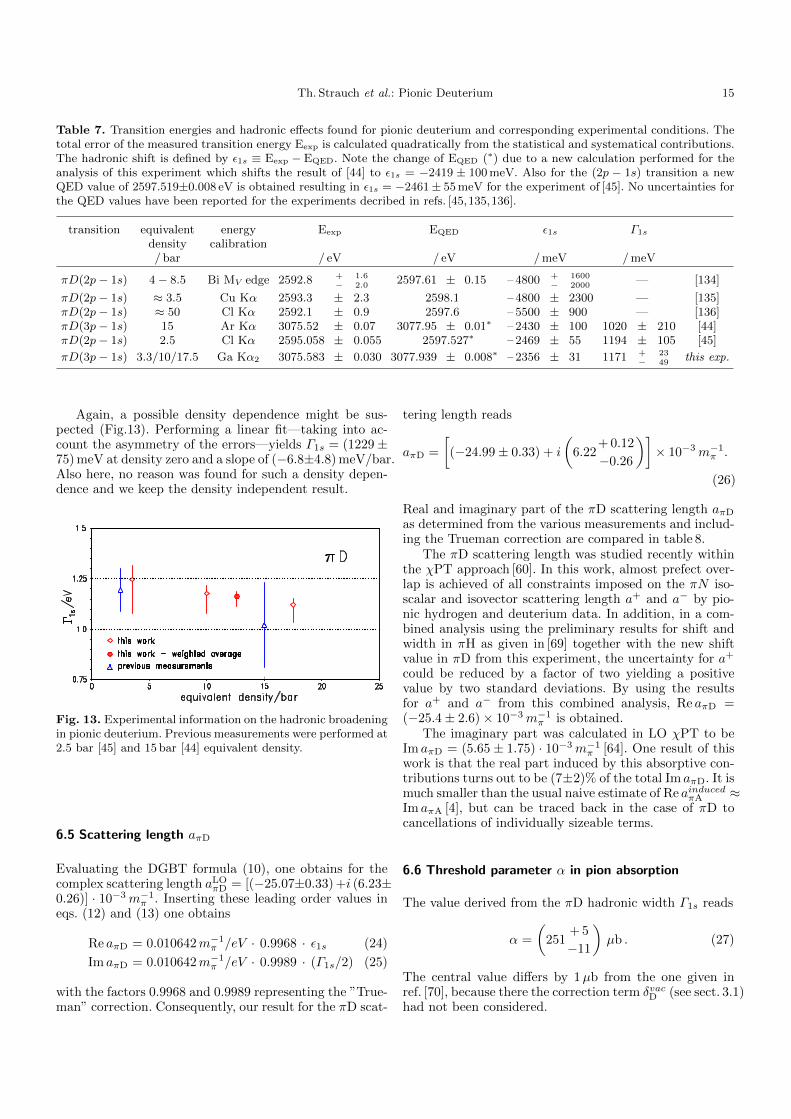
Again, a possible density dependence might be sus-pected (Fig.13). Performing a linear fit—taking into ac-count the asymmetry of the errors—yields Γ1s = (1229±75) meV at density zero and a slope of (−6.8±4.8) meV/bar.Also here, no reason was found for such a density depen-dence and we keep the density independent result.
Fig. 13. Experimental information on the hadronic broadeningin pionic deuterium. Previous measurements were performed at2.5 bar [45] and 15 bar [44] equivalent density.
6.5 Scattering length aπD
Evaluating the DGBT formula (10), one obtains for thecomplex scattering length aLO
πD = [(−25.07±0.33) +i (6.23±0.26)] · 10−3m−1
π . Inserting these leading order values ineqs. (12) and (13) one obtains
Re aπD = 0.010642m−1π /eV · 0.9968 · ε1s (24)
Im aπD = 0.010642m−1π /eV · 0.9989 · (Γ1s/2) (25)
with the factors 0.9968 and 0.9989 representing the ”True-man” correction. Consequently, our result for the πD scat-
tering length reads
aπD =
[(−24.99± 0.33) + i
(6.22
+ 0.12
−0.26
)]× 10−3m−1
π .
(26)
Real and imaginary part of the πD scattering length aπD
as determined from the various measurements and includ-ing the Trueman correction are compared in table 8.
The πD scattering length was studied recently withinthe χPT approach [60]. In this work, almost prefect over-lap is achieved of all constraints imposed on the πN iso-scalar and isovector scattering length a+ and a− by pio-nic hydrogen and deuterium data. In addition, in a com-bined analysis using the preliminary results for shift andwidth in πH as given in [69] together with the new shiftvalue in πD from this experiment, the uncertainty for a+
could be reduced by a factor of two yielding a positivevalue by two standard deviations. By using the resultsfor a+ and a− from this combined analysis, Re aπD =(−25.4± 2.6)× 10−3m−1
π is obtained.The imaginary part was calculated in LO χPT to be
Im aπD = (5.65 ± 1.75) · 10−3m−1π [64]. One result of this
work is that the real part induced by this absorptive con-tributions turns out to be (7±2)% of the total Im aπD. It ismuch smaller than the usual naive estimate of Re ainducedπA ≈Im aπA [4], but can be traced back in the case of πD tocancellations of individually sizeable terms.
6.6 Threshold parameter α in pion absorption
The value derived from the πD hadronic width Γ1s reads
α =
(251
+ 5
−11
)µb . (27)
The central value differs by 1µb from the one given inref. [70], because there the correction term δvacD (see sect. 3.1)had not been considered.
16 Th. Strauch et al.: Pionic Deuterium
Table 8. Real and imaginary part Re aπD and Im aπD of the πD scattering length as extracted from atomic data including theTrueman correction (12) and (13). Threshold parameter α for pion production and Im aπD are corrected for radiative captureand pair conversion (20) but omitting any isospin breaking contributions. Production experiments reporting only the statisticaluncertainty are marked (*). Arrows (← / →) indicate primary and derived quantities. The last line shows the result of acombined analysis of πH and πD data (see sect. 6.5). Theoretical approaches are listed in chronological order.
Re aπD Im aπD α/ 10−3 ·m−1
π / 10−3 ·m−1π /µb
Pionic deuterium
2p→ 1s - 52 +−
2217
— — [134]
2p→ 1s - 52 ± 25 — — [135]2p→ 1s - 84 ± 9 — — [136]3p→ 1s - 25.9 ± 1.1 5.45 ± 1.12 → 220 ± 45 [44]2p→ 1s - 26.3 ± 0.6 6.35 ± 0.56 → 257 ± 23 [45]
3p→ 1s - 24.99 ± 0.33 6.22 +−
0.120.26
→ 251 +−
511
this exp.
Pion production and absorption
pp→ dπ+ 3.33 ± 0.36 ← 138 ± 15∗ [138]pp→ dπ+ 5.80 ± 0.48 ← 240 ± 20∗ [139]pp→ dπ+ 4.35 ± 0.48 ← 180 ± 20∗ [140]pp→ dπ+ 5.5 ± 1.1 ← 228 ± 46 [141]pn→ dπ0 4.44 ± 0.12 ← 184 ± 5∗ [142]dπ+ → pp 4.20 ± 0.07 ← 174 ± 3∗ [143]ppolp→ dπ+ 5.02 ± 0.12 ← 208 ± 5∗ [144]pp→ dπ+ 4.95 ± 0.22 ← 205 ± 9∗ [145]
Theoretical approach
Watson-Brueckner 140 ± 50 [97]Rescattering 146 [146]Rescattering 201 [98]Faddeev (Reid soft core) 220 [147]Faddeev (Bryan-Scott) 267 [147]Coupled channels - 30 90 – 165 [148]Heavy meson exchange 203 ± 21 [149,150]Relativistic field theory - 57 [151]χPT NLO 5.46 ± 1.74 ← 220 ± 70 [63]χPT NLO 5.65 ± 1.60 → 228 ± 65 [64]χPT analysis combining πH and πD - 25.4 ± 2.6 [60]
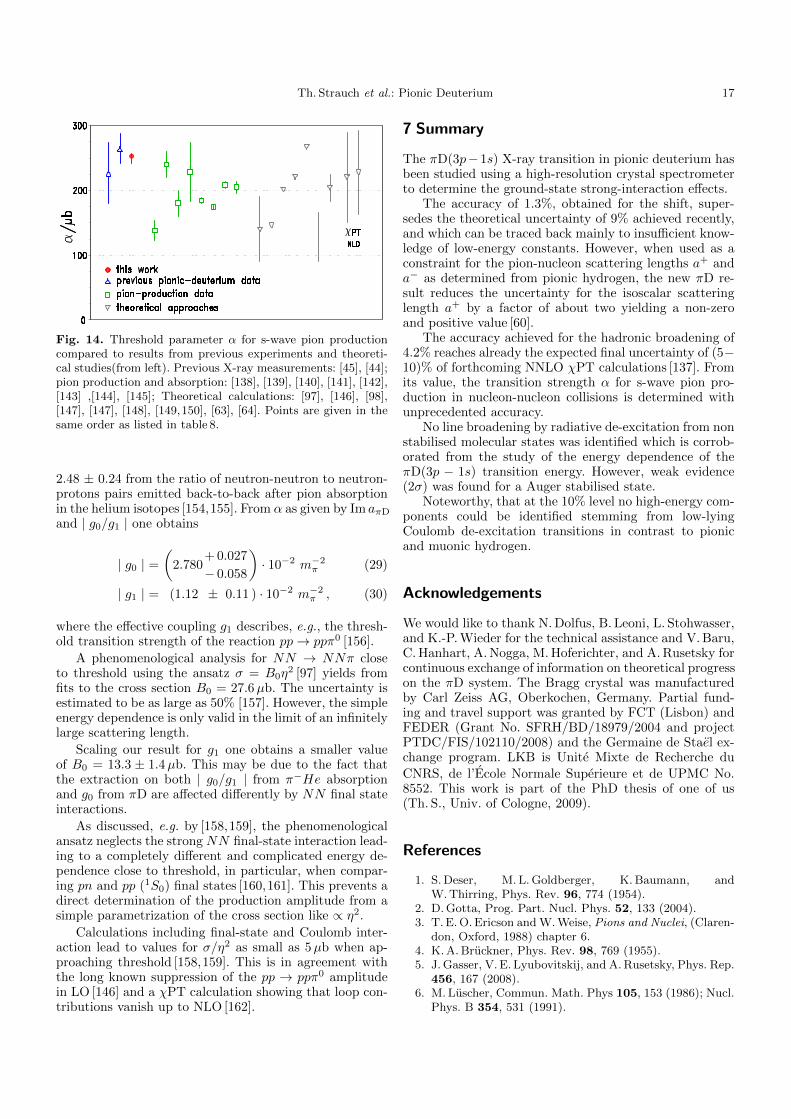
The theoretical understanding of NN ↔ NNπ reac-tion is continuously increasing. Within the approach ofχPT, a study of pion production including the terms inNLO yields αNLO = (220 ± 70)µb [63] in good agreementwith the pionic deuterium results (Table 8 and fig.14). Thetheoretical uncertainty is expected to decrease to below10% within a few years from forthcoming NNLO calcula-tions [137].
The parameter α when determined from pion produc-tion experiments shows wide fluctuations even when com-paring recent data. Often, only the statistical error is givenfor the cross section of the production experiments, butthe fluctuations suggest significant systematic uncertain-ties, which may arise from uncertainties in the normali-sation and/or Coulomb corrections. The expected orderof magnitude of isospin breaking effects is about or lessthe precision of this experiment, which is far below thevariation of the pion production data.
6.7 Pion absorption on nucleon-nucleon pairs
To describe the s-wave absorption strength on isoscalar(I=0) and isovector (I=1) nucleon-nucleon pairs (NN),effective couplings g0 and g1 have been introduced rep-resenting the transitions 3S1(I = 0) → 3P1(I = 1) (g0)and 1S0(I = 1) → 3P0(I = 1) (g1) [152]. The transitionstrength | g0 |2 is hence related to the imaginary part ofthe scattering length aπD as determined from Γ1s in πD byIm aπD = 1
3 (p∗n)3 | g0 |2 (1+1/S′) [153] and, consequently,also to the threshold parameter α by
| g0 |2=1
2πmπ·p∗pp∗n· 1
p∗n· α (28)
(see sect. 3.2). The CMS momentum of the neutrons ac-quired in the absorption reaction is p∗n = 2.6076mπ.
The relative strength of the coupling for absorption onisoscalar to isovector NN pairs was obtained to | g0/g1 |=
Th. Strauch et al.: Pionic Deuterium 17
Fig. 14. Threshold parameter α for s-wave pion productioncompared to results from previous experiments and theoreti-cal studies(from left). Previous X-ray measurements: [45], [44];pion production and absorption: [138], [139], [140], [141], [142],[143] ,[144], [145]; Theoretical calculations: [97], [146], [98],[147], [147], [148], [149,150], [63], [64]. Points are given in thesame order as listed in table 8.
2.48 ± 0.24 from the ratio of neutron-neutron to neutron-protons pairs emitted back-to-back after pion absorptionin the helium isotopes [154,155]. From α as given by Im aπD
and | g0/g1 | one obtains
| g0 | =(
2.780+ 0.027
− 0.058
)· 10−2 m−2
π (29)
| g1 | = (1.12 ± 0.11 ) · 10−2 m−2π , (30)
where the effective coupling g1 describes, e.g., the thresh-old transition strength of the reaction pp→ ppπ0 [156].
A phenomenological analysis for NN → NNπ closeto threshold using the ansatz σ = B0η
2 [97] yields fromfits to the cross section B0 = 27.6µb. The uncertainty isestimated to be as large as 50% [157]. However, the simpleenergy dependence is only valid in the limit of an infinitelylarge scattering length.
Scaling our result for g1 one obtains a smaller valueof B0 = 13.3 ± 1.4µb. This may be due to the fact thatthe extraction on both | g0/g1 | from π−He absorptionand g0 from πD are affected differently by NN final stateinteractions.
As discussed, e.g. by [158,159], the phenomenologicalansatz neglects the strong NN final-state interaction lead-ing to a completely different and complicated energy de-pendence close to threshold, in particular, when compar-ing pn and pp (1S0) final states [160,161]. This prevents adirect determination of the production amplitude from asimple parametrization of the cross section like ∝ η2.
Calculations including final-state and Coulomb inter-action lead to values for σ/η2 as small as 5µb when ap-proaching threshold [158,159]. This is in agreement withthe long known suppression of the pp → ppπ0 amplitudein LO [146] and a χPT calculation showing that loop con-tributions vanish up to NLO [162].
7 Summary
The πD(3p−1s) X-ray transition in pionic deuterium hasbeen studied using a high-resolution crystal spectrometerto determine the ground-state strong-interaction effects.
The accuracy of 1.3%, obtained for the shift, super-sedes the theoretical uncertainty of 9% achieved recently,and which can be traced back mainly to insufficient know-ledge of low-energy constants. However, when used as aconstraint for the pion-nucleon scattering lengths a+ anda− as determined from pionic hydrogen, the new πD re-sult reduces the uncertainty for the isoscalar scatteringlength a+ by a factor of about two yielding a non-zeroand positive value [60].
The accuracy achieved for the hadronic broadening of4.2% reaches already the expected final uncertainty of (5−10)% of forthcoming NNLO χPT calculations [137]. Fromits value, the transition strength α for s-wave pion pro-duction in nucleon-nucleon collisions is determined withunprecedented accuracy.
No line broadening by radiative de-excitation from nonstabilised molecular states was identified which is corrob-orated from the study of the energy dependence of theπD(3p − 1s) transition energy. However, weak evidence(2σ) was found for a Auger stabilised state.
Noteworthy, that at the 10% level no high-energy com-ponents could be identified stemming from low-lyingCoulomb de-excitation transitions in contrast to pionicand muonic hydrogen.
Acknowledgements
We would like to thank N. Dolfus, B. Leoni, L. Stohwasser,and K.-P. Wieder for the technical assistance and V. Baru,C. Hanhart, A. Nogga, M. Hoferichter, and A. Rusetsky forcontinuous exchange of information on theoretical progresson the πD system. The Bragg crystal was manufacturedby Carl Zeiss AG, Oberkochen, Germany. Partial fund-ing and travel support was granted by FCT (Lisbon) andFEDER (Grant No. SFRH/BD/18979/2004 and projectPTDC/FIS/102110/2008) and the Germaine de Stael ex-change program. LKB is Unite Mixte de Recherche duCNRS, de l’Ecole Normale Superieure et de UPMC No.8552. This work is part of the PhD thesis of one of us(Th. S., Univ. of Cologne, 2009).
References
1. S. Deser, M. L. Goldberger, K. Baumann, andW. Thirring, Phys. Rev. 96, 774 (1954).
2. D. Gotta, Prog. Part. Nucl. Phys. 52, 133 (2004).3. T. E. O. Ericson and W. Weise, Pions and Nuclei, (Claren-
don, Oxford, 1988) chapter 6.4. K. A. Bruckner, Phys. Rev. 98, 769 (1955).5. J. Gasser, V. E. Lyubovitskij, and A. Rusetsky, Phys. Rep.
456, 167 (2008).6. M. Luscher, Commun. Math. Phys 105, 153 (1986); Nucl.
Phys. B 354, 531 (1991).

18 Th. Strauch et al.: Pionic Deuterium
7. A. Torok et al., Phys. Rev. D 81, 074506 (2010).8. S. R. Beane, W. Detmold, K. Originos, and M. J. Savage,
Prog. Part. Nucl. Phys. 66, 1 (2011).9. S. Weinberg, Phys. Rev. Lett. 17, 616 (1966).
10. Y. Tomozawa, Nuovo Cim. A 46, 707 (1966).11. J. Gasser and H. Leutwyler, Phys. Rep. 87, 77 (1982).12. A. W. Thomas and W. Weise, The Structure of the Nu-
cleon, (WILEY–VCH, Berlin, 2001) chapter 7.13. S. Weinberg, Physica 96A, 327 (1979).14. J. Gasser and H. Leutwyler, Ann. Phys. 158, 142 (1984).15. J. Gasser and H. Leutwyler, Nucl. Phys. B 250, 465
(1985).16. G. Ecker, Prog. Part. Nucl. Phys. 35, 1 (1995).17. V. Bernard, N. Kaiser, and Ulf-G. Meißner, Int. J. Mod.
Phys. E 4, 193 (1995).18. S. Scherer, Introduction to Chiral Perturbation The-
ory, Adv. Nucl. Phys. 27, 277 (2003) (arXiv:hep-ph/0210398v1).
19. V. Bernard, Prog. Part. Nucl. Phys. 60, 82 (2008).20. T. Becher and H. Leutwyler, J. High En. Phys. 06, 017
(2001).21. J. Gasser, H. Leutwyler, and M. E. Sainio, Phys. Lett. B
253, 252 (1991).22. M. E. Sainio, Pion-nucleon σ-term – a review, in Proc. of
the 9 th Symp. on Meson-Nucleon Physics and the Struc-ture of the Nucleon (MENU’01), Washington D. C., 2001,πN newsletter 16, 138 (2002), ISSN 0942-4148, and ref-erences therein.
23. M. L. Goldberger, H. Miyazawa and R. Oehme, Phys. Rev.99, 986 (1955).
24. T. E. O. Ericson, B. Loiseau and A. W. Thomas, Phys.Rev. C 66, 014005 (2002).
25. V. V. Abaev, P. Metsa, and M. E. Sainio, Eur. Phys. J. A32, 321 (2007).
26. V. Bernard, N. Kaiser, and Ulf-G. Meißner, Phys. Lett. B383, 116 (1996).
27. M. A. Kovash et al., πN newsletter 12, 51 (1997).28. O. Hanstein, D. Drechsel, and L. Tiator, πN newsletter
12, 56 (1997).29. D. F. Measday, Phys. Rep. 354, 243 (2001) .30. T. Gorringe and H. W. Fearing, Rev. Mod. Phys. 76, 31
(2004).31. V. A. Andreev et al., Phys. Rev. Lett. 99, 032002 (2007).32. D. Sigg et al., Nucl. Phys. A 609, 310 (1996).33. V. E. Lyubovitskij and A. Rusetsky, Phys. Lett. B 494, 9
(2000).34. J. Gasser et al., Eur. Phys. J. C 26, 13 (2002).35. P. Zemp, Proc. of Chiral Dynamics 2003, p. 128,
Bonn, Germany, September 8–13, 2003, arXiv:hep-ph/0311212v1; Pionic Hydrogen in QCD+QED: Decaywidth at NNLO, Ph. D. Thesis, University of Bern (2004).
36. G. Rasche and W. S. Woolcock, Nucl. Phys., A 381, 405(1982).
37. J. Spuller et al., Phys. Lett. 67 B, 479 (1977).38. G. C. Oades, G. Rasche, W.S. Woolcock, E. Matsinos,
A. Gashi, Nucl. Phys. A 794, 73 (2007).39. T. E. O. Ericson and W. Weise, Pions and Nuclei, (Claren-
don, Oxford, 1988) chapter 9.40. ibidem, chapter 4.41. A. W. Thomas and R. H. Landau, Phys. Rep. B 58, 121
(1980).42. A. Deloff, Fundamentals in Hadronic Atom Theory,
(World Scientific, London, 2003) chapter 15.
43. D. Sigg et al., Nucl. Phys. A 609, 269 (1996).44. D. Chatellard et al., Phys. Rev. Lett. 74, 4157 (1995);
Nucl. Phys. A 625, 855 (1997).45. P. Hauser et al., Phys. Rev. C 58, R1869 (1998).46. H.-Ch. Schroder et al., Eur. Phys. J C 21, 473 (2001).47. S. Weinberg, Phys. Lett. B 295, 114 (1992).48. V. Baru and A. E. Kudryavtsev, Phys. of At. Nucl. 60,
1475 (1997).49. S. R. Beane, V. Bernard, T.-S. Lee, and U.-G. Meißner,
Phys. Rev. C 57, 424 (1998).50. V. E. Tarasov, V. V. Baru, and A. E. Kudryavtsev, Phys.
At. Nucl. 63, 801 (2000).51. A. Deloff, Phys. Rev. C 64 (2001) 065205.52. N. Kaiser, Phys. Rev. C 65, 057001 (2002).53. B. Burasoy and H. W. Grieshammer, Int. J. Mod. Phys. E
12, 65 (2003).54. S. R. Beane, V. Bernard, E. Epelbaum, U.-G. Meißner,
and D. R. Phillips, Nucl. Phys. A 720, 399 (2003).55. M. Doring, E. Oset, and M. J. Vicente Vacas, Phys. Rev.
C 70, 045203 (2004).56. B. F. Irgaziev and B. A. Fayzullaev, arXiv:hep-
ph/0404203v1 (2004).57. U.- G. Meißner, U. Raha, and, A. Rusetsky, Eur. Phys. J.
C 41, 213 (2005); Eur. Phys. J. C 45, 545 (2006).58. U.- G. Meißner, U. Raha, and, A. Rusetsky, Phys. Lett. B
639, 478 (2006).59. M. Hoferichter, B. Kubis and U.-G. Meißner, Phys. Lett.
B 678, 65 (2009); Nucl. Phys. A 833,18 (2010).60. V. Baru et al., Phys. Lett. B 694, 473 (2011) (arXiv:nucl-
th/1003.4444v2).61. M. Hoferichter, B. Kubis and U.-G. Meißner, PoS CD09,
014 (2009) (arXiv:hep-ph/0910.0736).62. J. Hufner, Phys. Rep. 21, 1 (1975).63. V. Lensky et al., Eur. Phys. J. A 27, 37 (2006).64. V. Lensky et al., Phys. Lett. B 648, 46 (2007).65. V. L. Highland et al., Nucl. Phys. A 365, 333 (1981).66. D. W. Joseph, Phys. Rev. 119, 805 (1960).67. R. MacDonald et al., Phys. Rev. Lett. 38, 746 (1977).68. PSI proposal R-98-01, www2.fz-juelich.de/ikp/exotic-
atoms.69. D. Gotta et al., Lect. Notes Phys. 745, 165 (2008).70. Th. Strauch et al., Phys. Rev. Lett. 104, 142503 (2010).71. F.J. Hartmann, Proceedings of Physics of Exotic Atoms
on Electromagnetic Cascade and Chemistry, Erice, Italy,1989 (Plenum Press, New York, 1990) p. 23 and p. 127,and references therein.
72. J.S. Cohen, Rep. Prog. Phys. 67, 1769 (2004).73. E. Borie and M. Leon, Phys. Rev. A 21, 1460 (1980).74. M. Leon and H. A. Bethe, Phys. Rev. 127, 636 (1962).75. R. al Hassani et al., Z. Phys. A 351, 113 (1995).76. T. S. Jensen and V. E. Markushin, Eur. Phys. J. D 19, 165
(2002).77. T. S. Jensen and V. E. Markushin, Eur. Phys. J. D 21, 261
(2002).78. T. S. Jensen and V. E. Markushin, Eur. Phys. J. D 21, 271
(2002).79. L. Bracci and G. Fiorentini, Nuovo Cim. A 43, 9 (1978).80. R. Pohl et al., Phys. Rev. Lett. 97, 193402 (2006).81. J. B. Czirr et al., Phys. Rev. 130, 341 (1963).82. A. Badertscher et al., Europhys. Lett. 54, 313 (2001), and
references therein.83. D. S. Covita et al., Phys. Rev. Lett. 102, 023401 (2009).

Th. Strauch et al.: Pionic Deuterium 19
84. M. Hennebach, Precision measurement of ground statetransitions in pionic hydrogen, Ph. D. thesis, Universitatzu Koln (2003), http://kups.ub.uni-koeln.de/744/.
85. V. N. Pomerantsev and V. P. Popov, Phys. Rev. A 73,040501(R) (2006).
86. T. S. Jensen, V. N. Pomerantsev, and V. P. Popov,arXiv:nucl-th/0712.3010v1 (2007).
87. V. P. Popov and V. N. Pomerantsev, arXiv:nucl-th/0712.3111v1 (2007).
88. D. Taqqu, AIP Conf. Proc. 181, 217 (1989).89. S. Jonsell, J. Wallenius, P. Froelich, Phys. Rev. A 59, 3440
(1999).90. R. Pohl, Hyperfine Int. 193, 115 (2009).91. E. Lindroth, J. Wallenius, S. Jonsell, Phys. Rev. A 68,
032502 (2003); Phys. Rev. A 69, 059903(E) (2004).92. S. Kilic, J.-P. Karr, L. Hilico, Phys. Rev. A 70, 042506
(2004).93. T. L. Trueman, Nucl. Phys. 26, 57 (1961).94. E. Lambert, Helv. Phys. Acta 42 (1969) 667; ibidem 43,
713 (1970).95. J. Mitroy and I. A. Ivallov, J. Phys. G 27, 1421 (2001).96. D. Eiras and J. Soto, Phys. Lett. B 491, 101 (2000).97. A. H. Rosenfeld, Phys. Rev. 96, 139 (1954).98. A. Reitan, Nucl. Phys. B 11, 170 (1969).99. H. Machner and J. Niskanen, Nucl.Phys. A 776, 172
(2006).100. K. Bruckner, R. Serber, and K. Watson, Phys. Rev. 81,
575 (1951).101. V. Baru, C. Hanhart, and A. Rusetski, priv. comm.102. A. Filin et al., Phys. Lett. B 681, 423 (2009).103. E. Byckling and K. Kajantie, Particle Kinematics, John
Wiley and Sons, London (1973) chapter II.6.104. L. M. Simons, Physica Scripta T22, 90 [1988).105. L. M. Simons, Hyperfine Int. 81, 253 (1993).106. D. S. Covita et al., Rev. Scient. Instr. 79, 033102 (2008).107. J. Eggs and K. Ulmer, Z. angew. Phys., 20(2), 118 (1965).108. G. Zschornack, Nucl. Instr. Meth. 200, 481 (1982).109. N. Nelms et al., Nucl. Instr. Meth. A 484, 419 (2002).110. G. Basile et al., Phys. Rev. Lett. 72, 3133 (1994).111. R. Deslattes et al., Rev. Mod. Phys., vol. 75, no. 1, 35
(2003).112. P. Indelicato et al., Rev. Sci. Instrum. 77, 043107 (2006).113. D. F. Anagnostopulos et al., Nucl. Instr. Meth. A 545,
217 (2005).114. M. Trassinelli et al., J. Phys., Conf. Ser. 58, 129 (2007).115. D. S. Covita, High-precision spectroscopy of the 3p – 1s
transition in muonic hydrogen, Ph. D. thesis, Universityof Coimbra (2008), http://hdl.handle.net/10316/7521.
116. M. Sanchez del Rio and R. J. Dejus, Proc. SPIE Int. Soc.Opt. Eng. 3448, 246 (1998); ibidem 5536, 171 (2004);http://www.esrf.eu/computing/scientific/xop2.1.
117. Th. Strauch, High-precision measurement of strong-interaction effects in pionic deuterium, Ph. D. the-sis, Universitat zu Koln (2009), http://kups.ub.uni-koeln.de/2813/.
118. WM. J. Veigele, At. Data Tables 5, 51 (1973).119. M. O. Krause and J. H. Oliver, J. Phys. Chem. Ref. Data
8, 329 (1979).120. T. Mooney, Argonne National Laboratory, priv. comm.
(2007).121. B. L. Henke, E. M. Gullikson, and J. C. Davies, At. Data
Nucl. Data Tables 54, 181 (1993).122. C. T. Chantler, J. Phys. Chem. Ref. Data 24, 71 (1995).
123. F. N. Chukhovskii, G. Holzer, O. Wehrhan, andE. Forster, J. Appl. Cryst. 29, 438 (1998).
124. F. Cembali et al., J. Appl. Cryst. 24, 424 (1992).125. F. James and M. Roos, Comput. Phys. Commun. 10, 343
(1975).126. U. C. Bergmann and K. Riisager, Nucl. Instrum. Meth. A
489, 444 (2002).127. C. Amsler et al. (PDG 2008), Phys. Lett. B 667, 1 (2008).128. R. Pohl et al., Nature 466, 213 (2010).129. C. G. Parthey et al., Phys. Rev. Lett. 104, 233001 (2010).130. Y. Lu and R. Rosenfelder, Phys. Lett. B 319, 7 (1993);
Phys. Lett. B 333, 564(E) (1994).131. W. Leidemann and R. Rosenfelder, Phys. Rev. B 51, 427
(1995).132. J. Ahrens et al., Eur. Phys. J. A 23, 113 (2005).133. R. Koch, Nucl. Phys. A 448, 707 (1986).134. J. Bailey et al., Phys. Lett. 50 B, 403 (1974).135. E. Bovet et al., Nucl. Instr. Meth. 190, 613 (1981).136. E. Bovet et al., Phys. Lett. 153 B, 231 (1985).137. C. Hanhart, priv. comm. (2010).138. F. S. Crawford and M. L. Stevenson, Phys. Rev. 97, 1305
(1955).139. C. M. Rose, Phys. Rev. 154, 1305 (1967).140. C. Richard-Serre et al., Nucl. Phys. B 20, 413 (1970).141. D. Aebischer et al., Nucl. Phys. B 108, 214 (1976).142. D. A. Hutcheon et al., Phys. Rev. Lett. 64, 176 (1990);
Nucl. Rev. A 535, 618 (1991).143. B. G. Ritchie et al., Phys. Rev. Lett. 66, 568 (1991).144. P. Heimberg et al., Phys. Rev. Lett. 77, 1012 (1996).145. M. Drochner et al., Nucl. Phys. A 643, 55 (1998).146. D. S. Koltun and A. Reitan, Phys. Rev. 141, 1413 (1966).147. I. R. Afnan and A. W. Thomas, Phys. Rev. C 10, 109
(1974).148. C. Fayard, G. H. Lamot, and T. Mizutani, Phys. Rev.
Lett. 45, 524 (1980).149. C. J. Horowitz, Phys. Rev. C 48, 2920 (1993).150. J. A. Niskanen, Phys. Rev. C 53, 526 (1996).151. A. N. Ivanov et al., Z. Phys. A 358, 81 (1997).152. S. G. Eckstein, Phys. Rev. 129, 413 (1963).153. J.-F. Germond and C. Wilkin, J. Phys. G 14, 181 (1988).154. D. Gotta et al., Phys. Rev. C 51, 469 (1995).155. E. Daum et al., Nucl. Phys. A 589, 553 (1995).156. J. Roginsky and C. Werntz, Phys. Rev. C 40, 2732 (1989).157. D. G. Long, M. Sternheim, and R. R. Silbar, Phys. Rev C
26, 586 (1982).158. G. A. Miller and P. Sauer, Phys. Rev. C 44, R1725 (1991).159. H. O. Meyer et al., Nucl. Phys. A 539, 633 (1992).160. C. Hanhart, Phys. Rep. 397, 155 (2004).161. V. Baru et al., Phys. Rev. C 80, 044003 (2009).162. C. Hanhart and N. Kaiser, Phys. Rev. C 66, 054005
(2002).


![Vibrational circular dichroism in the carbon-hydrogen and carbon-deuterium stretching modes of (S,S)-[2,3-2H2]oxirane](https://static.fdokumen.com/doc/165x107/63451201f474639c9b04ac34/vibrational-circular-dichroism-in-the-carbon-hydrogen-and-carbon-deuterium-stretching.jpg)