The Kinetics of the Hydrogen/Deuterium Exchange of Epidermal Growth Factor Receptor Ligands
15
The Kinetics of the Hydrogen/Deuterium Exchange of Epidermal Growth Factor Receptor Ligands Ibon Iloro,* Daniel Narva ´ ez,* Nancy Guille ´n, y Carlos M. Camacho, y Lalisse Guille ´n, y Elsa Cora,* z and Belinda Pastrana-Rı ´os* y *Center for Protein Structure Function and Dynamics, and y Department of Chemistry, University of Puerto Rico, Mayagu ¨ez Campus, Mayagu ¨ez, Puerto Rico 00681-9019; and z Department of Biochemistry, University of Puerto Rico, Medical Sciences Campus, San Juan, Puerto Rico 00936-5067 ABSTRACT Five highly homologous epidermal growth factor receptor ligands were studied by mass spectral analysis, hydrogen/ deuterium (H/D) exchange via attenuated total reflectance Fourier transform-infrared spectroscopy, and two-dimensional correlation analysis. These studies were performed to determine the order of events during the exchange process, the extent of H/D exchange, and associated kinetics of exchange for a comparative analysis of these ligands. Furthermore, the secondary structure com- position of amphiregulin (AR) and heparin-binding-epidermal growth factor (HB-EGF) was determined. All ligands were found to have similar contributions of 3 10 -helix and random coil with varying contributions of b-sheets and b-turns. The extent of exchange was 40%, 65%, 55%, 65%, and 98% for EGF, transforming growth factor-a (TGF-a), AR, HB-EGF, and epiregulin (ER), respectively. The rate constants were determined and classified as fast, intermediate, and slow: for EGF the 0.20 min 1 (Tyr), 0.09 min 1 (Arg, b-turns), and 1.88 3 10 3 min 1 (b-sheets and 3 10 -helix); and for TGF-a 0.91 min 1 (Tyr), 0.27 min 1 (Arg, b-turns), and 1.41 3 10 4 min 1 (b-sheets). The time constants for AR 0.47 min 1 (Tyr), 0.04 min 1 (Arg), and 1.00 x 10 4 min 1 (buried 3 10 -helix, b-turns, and b-sheets); for HB-EGF 0.89 min 1 (Tyr), 0.14 min 1 (Arg and 3 10 -helix), and 1.00 x 10 3 min 1 (buried 3 10 -helix, b-sheets, and b-turns); and for epiregulin 0.16 min 1 (Tyr), 0.03 min 1 (Arg), and 1.00 x 10 4 min 1 (3 10 -helix and b-sheets). These results provide essential information toward understanding secondary structure, H/D exchange kinetics, and solvation of these epidermal growth factor receptor ligands in their unbound state. INTRODUCTION There are at least eight different epidermal growth factor re- ceptor (EGFR) ligands, most of which are synthesized by the cell as transmembrane precursors that can be proteolytically cleaved and released to the extracellular matrix as soluble ligands which interact with the receptor (1). This interaction is a prerequisite step for the activation of the receptor and is followed by receptor dimerization and autophosphorylation, which in turn activate the microtubule-associated protein ki- nase pathway, leading to the signaling cascade which regu- lates cell differentiation, progression, and/or migration. The mechanism by which ligand binding occurs is summarized elsewhere (2–5). Lenferink (6) suggested that signal differ- entiation within the ErbB (i.e., EGFR) network occurs not only as a result of receptor differential expression but also as a result of different ligands activating the same receptor with different potencies. In this article, we present a com- parative analysis for five of the eight EGFR ligands in terms of their conformation, hydrogen/deuterium (H/D) exchange kinetics, and extent of exchange based on Fourier transform- infrared (FT-IR) and two-dimensional correlation spectros- copy (2DCOS) and the oligomeric state of these ligands via mass spectrometry (MS). This information is essential to understanding the structure solvent accessibility hydrogen- bonding relationship of these ligands in their unbound state. Amphiregulin (AR), whose structure has not yet been elucidated, and heparin binding-epidermal growth factor (HB-EGF) are ligands of the EGFR that are known to stim- ulate cell growth and proliferation and are often associated with oncogenesis (7–10). Amphiregulin, composed of 98 amino acids, and HB-EGF, composed of 86 residues (sec- ondary structure composition is discussed herein), share a significant homology to all EGF family members containing an EGF-like domain (11,12) (Fig. 1) and share the same heparin- binding affinity (10,13). Recently discovered epiregulin (ER) (14), composed of 47 residues, is a ligand for EGFR and ErbB4, which also shares more than 41% amino acid sequence identity with EGF. ER exhibits the bifunctional regulatory property of inhibiting the growth of several epithelial cell lines while stimulating the growth of fibroblasts and various other cell types (8,15,16). EGFR has a lower affinity for ER compared to EGF, AR, and HB-EGF (17), suggesting that EGFR is not the primary receptor for ER. Transforming growth factor-a (TGF-a) (18) is a mitogenic protein found in serum that is known to stimulate the growth of microvascular endothelial cells and doi: 10.1529/biophysj.107.125856 Submitted November 30, 2007, and accepted for publication December 21, 2007. Address reprint requests to Belinda Pastrana-Rı ´os, Dept. of Chemistry, University of Puerto Rico, Mayagu ¨ez Campus, PO Box 9019, Mayagu ¨ez, Puerto Rico 00681-9019. E-mail: [email protected]. This is an Open Access article distributed under the terms of the Creative Commons-Attribution Noncommercial License (http://creativecommons. org/licenses/by-nc/2.0/), which permits unrestricted noncommercial use, distribution, and reproduction in any medium, provided the original work is properly cited. Editor: Lukas K. Tamm. Ó 2008 by the Biophysical Society 0006-3495/08/05/4041/15 $2.00 Biophysical Journal Volume 94 May 2008 4041–4055 4041
-
Upload
independent -
Category
Documents
-
view
2 -
download
0
Transcript of The Kinetics of the Hydrogen/Deuterium Exchange of Epidermal Growth Factor Receptor Ligands

The Kinetics of the Hydrogen/Deuterium Exchange of Epidermal GrowthFactor Receptor Ligands
Ibon Iloro,* Daniel Narvaez,* Nancy Guillen,y Carlos M. Camacho,y Lalisse Guillen,y Elsa Cora,*z
and Belinda Pastrana-Rıos*y
*Center for Protein Structure Function and Dynamics, and yDepartment of Chemistry, University of Puerto Rico, Mayaguez Campus,Mayaguez, Puerto Rico 00681-9019; and zDepartment of Biochemistry, University of Puerto Rico, Medical Sciences Campus,San Juan, Puerto Rico 00936-5067
ABSTRACT Five highly homologous epidermal growth factor receptor ligands were studied bymass spectral analysis, hydrogen/deuterium (H/D) exchange via attenuated total reflectance Fourier transform-infrared spectroscopy, and two-dimensional correlationanalysis. Thesestudieswereperformed todetermine theorder of events during theexchangeprocess, theextent ofH/Dexchange,and associated kinetics of exchange for a comparative analysis of these ligands. Furthermore, the secondary structure com-position of amphiregulin (AR) and heparin-binding-epidermal growth factor (HB-EGF) was determined. All ligands were found tohave similar contributions of 310-helix and random coil with varying contributions of b-sheets and b-turns. The extent of exchangewas 40%, 65%, 55%, 65%, and 98% for EGF, transforming growth factor-a (TGF-a), AR, HB-EGF, and epiregulin (ER),respectively. The rate constants were determined and classified as fast, intermediate, and slow: for EGF the 0.20min�1 (Tyr), 0.09min�1 (Arg, b-turns), and 1.88 3 10�3 min�1 (b-sheets and 310-helix); and for TGF-a 0.91 min�1 (Tyr), 0.27 min�1 (Arg, b-turns),and 1.41 3 10�4 min�1 (b-sheets). The time constants for AR 0.47 min�1 (Tyr), 0.04 min�1 (Arg), and 1.00 x 10�4 min�1 (buried310-helix, b-turns, and b-sheets); for HB-EGF 0.89 min�1 (Tyr), 0.14 min�1 (Arg and 310-helix), and 1.00 x 10�3 min�1 (buried310-helix, b-sheets, and b-turns); and for epiregulin 0.16 min�1 (Tyr), 0.03 min�1 (Arg), and 1.00 x 10�4 min�1 (310-helix andb-sheets). These results provide essential information toward understanding secondary structure, H/D exchange kinetics, andsolvation of these epidermal growth factor receptor ligands in their unbound state.
INTRODUCTION
There are at least eight different epidermal growth factor re-
ceptor (EGFR) ligands, most of which are synthesized by the
cell as transmembrane precursors that can be proteolytically
cleaved and released to the extracellular matrix as soluble
ligandswhich interact with the receptor (1). This interaction is
a prerequisite step for the activation of the receptor and is
followed by receptor dimerization and autophosphorylation,
which in turn activate the microtubule-associated protein ki-
nase pathway, leading to the signaling cascade which regu-
lates cell differentiation, progression, and/or migration. The
mechanism by which ligand binding occurs is summarized
elsewhere (2–5). Lenferink (6) suggested that signal differ-
entiation within the ErbB (i.e., EGFR) network occurs not
only as a result of receptor differential expression but also as
a result of different ligands activating the same receptor
with different potencies. In this article, we present a com-
parative analysis for five of the eight EGFR ligands in terms
of their conformation, hydrogen/deuterium (H/D) exchange
kinetics, and extent of exchange based on Fourier transform-
infrared (FT-IR) and two-dimensional correlation spectros-
copy (2DCOS) and the oligomeric state of these ligands via
mass spectrometry (MS). This information is essential to
understanding the structure solvent accessibility hydrogen-
bonding relationship of these ligands in their unbound state.
Amphiregulin (AR), whose structure has not yet been
elucidated, and heparin binding-epidermal growth factor
(HB-EGF) are ligands of the EGFR that are known to stim-
ulate cell growth and proliferation and are often associated
with oncogenesis (7–10). Amphiregulin, composed of 98
amino acids, and HB-EGF, composed of 86 residues (sec-
ondary structure composition is discussed herein), share a
significant homology to all EGF family members containing an
EGF-like domain (11,12) (Fig. 1) and share the same heparin-
binding affinity (10,13). Recently discovered epiregulin (ER)
(14), composed of 47 residues, is a ligand for EGFR and
ErbB4, which also shares more than 41% amino acid sequence
identity with EGF. ER exhibits the bifunctional regulatory
property of inhibiting the growth of several epithelial cell lines
while stimulating the growth of fibroblasts and various other
cell types (8,15,16).
EGFR has a lower affinity for ER compared to EGF, AR,
and HB-EGF (17), suggesting that EGFR is not the primary
receptor for ER. Transforming growth factor-a (TGF-a) (18)is a mitogenic protein found in serum that is known to
stimulate the growth of microvascular endothelial cells and
doi: 10.1529/biophysj.107.125856
Submitted November 30, 2007, and accepted for publication December 21,
2007.
Address reprint requests to Belinda Pastrana-Rıos, Dept. of Chemistry,
University of Puerto Rico, Mayaguez Campus, PO Box 9019, Mayaguez,
Puerto Rico 00681-9019. E-mail: [email protected].
This is an Open Access article distributed under the terms of the Creative
Commons-Attribution Noncommercial License (http://creativecommons.
org/licenses/by-nc/2.0/), which permits unrestricted noncommercial use,
distribution, and reproduction in any medium, provided the original work is
properly cited.
Editor: Lukas K. Tamm.
� 2008 by the Biophysical Society
0006-3495/08/05/4041/15 $2.00
Biophysical Journal Volume 94 May 2008 4041–4055 4041

oncogenesis. Internalization of EGFR upon binding to TGF-
a occurs regularly. Furthermore, EGFR binding to TGF-ahas been associated with decreased ubiquitination and an
earlier dissociation of TGF-a from the receptor, as compared
to EGF, in the endosomal system, under low pH conditions,
resulting in enhanced recycling of EGFR (19). To date, the
pharmacological profiles of these ligands during their inter-
action with the ErbB family of receptors remains unclear
FIGURE 1 Solid surface Connolly models were generated for these ligands using their corresponding PDBs. (A) EGF (PDB:1EPJ), (C) TGF-a (PDB:1YUG),
(E) HB-EGF (modified from PDB:1XDT, HB-EGF peptide composed of 79 residues), and (G) epiregulin (PDB:1K37, ER peptide composed of 46 residues). In
white are the hydrophobic regions of the ligandwith IR active side chains: red, negatively charged (aspartates and glutamates); blue, positive charged (arginine); and
green for the tyrosine side chains. (A) The Kabash and Sander (34) rendition of these ligands is also shown to highlight the secondary structure differences (B) EGF,
(D) TGF-a, (F) HB-EGF, and (H) ER, although they all contain the EGF-like domain with the characteristic twob-strands and three loops. In blue are the amino and
in red are the carboxy terminal ends. (I) Sequence alignment: based on National Center for Biotechnology Information database sequences corresponding to
accession numbers AAS83395, NP_003227, BAA22146 or 1K37, NP_001936, AAA51773, for human EGF, TGF-a, ER, HB-EGF, and AR, respectively.
4042 Iloro et al.
Biophysical Journal 94(10) 4041–4055
(20). This small 50 amino acid peptide shares 45% sequence
identity to EGF (21) with similar secondary structure based
on the NMR and x-ray studies containing three disulfide
bridges, common in this family of growth factors (12,22–33).
Several models for these ligands using the corresponding
Protein Data Bank (PDB)s were generated (Fig. 1, A–H). Thefirst is a surface Connolly representation showing the charge
distribution (specifically glutamate, aspartate, and arginine)
and tyrosine residues, which can be monitored via FT-IR
spectroscopy for EGF, TGF-a, HB-EGF, and ER (Fig. 1, A,C, E, and G), respectively (21,26,27,30,31). Second is the
Kabash and Sander representation (34), which highlights the
structural motifs for four of the five ligands, with their re-
spective loops, varying length antiparallel b-sheets, shorthelical motif, and random coil contributions for EGF, TGF-a,HB-EGF, and ER (Fig. 1, B, D, F, and H), respectively. Thesequence comparison and dendogram (Fig. 1, I and J) is
summarized based on shared identity with EGF as 45%, 40%,
41%, and 43% forTGF-a, HB-EGF,ER, andAR, respectively.EGF and TGF-a have been further studied by disulfide
scrambling (35), site-directed mutagenesis (36,37), generation
of chimeras (38), circular dichroism (39), andNMR(12,30,31).
H/D exchange experiments using attenuated total reflec-
tion (ATR) (40–44) FT-IR spectroscopy (45) has been used
routinely to study proteins. The advantage of this study is that
H/D exchange does not perturb the protein’s secondary
structure (46,47). The amide I band in infrared spectroscopy
is very sensitive to backbone conformation and is able to
distinguish several structural motifs (48–52). Typically, spec-
tral band intensity changes are observed for the amide II
(1500–600 cm�1) and amide II9 (1400–1500 cm�1) bands
upon exposure of the protein to D2O vapor. The concomitant
band intensity changes are indicative of H/D exchange. In
addition to amide vibrational modes, which provide secondary
structure information, the arginine and the tyrosine side-chain
modes (53–55) have exchangeable protons that can provide
information on the extent of solvation in their immediate
surroundings, thus acting as an internal probe. The spectral
data analysis was performed using 2DCOS to enhance spectral
resolution and determine the order of events during the H/D
exchange process (41,42,56–58) for each ligand.
We report the results for the H/D exchange studies for
EGF, TGF-a, HB-EGF, AR, and ER, which are five of the
eight known ligands for the EGFR within the ErbB family of
tyrosine kinase receptors. These studies will be used for
future comparison with the receptor-ligand complexes. The
results summarized in this article, to our knowledge, provide
the first secondary structure information for AR and HB-EGF
in their unbound state. Also, we compared the available
FIGURE 2 MS analysis: TOF-ES MS spectra of (A) EGF, (B) TGF-a and
MALDI, (C) AR, (D) HB-EGF, and (E) ER. EGF and HB-EGF are in dimer
states, whereas TGF-a, AR, and ER are in their monomeric state.
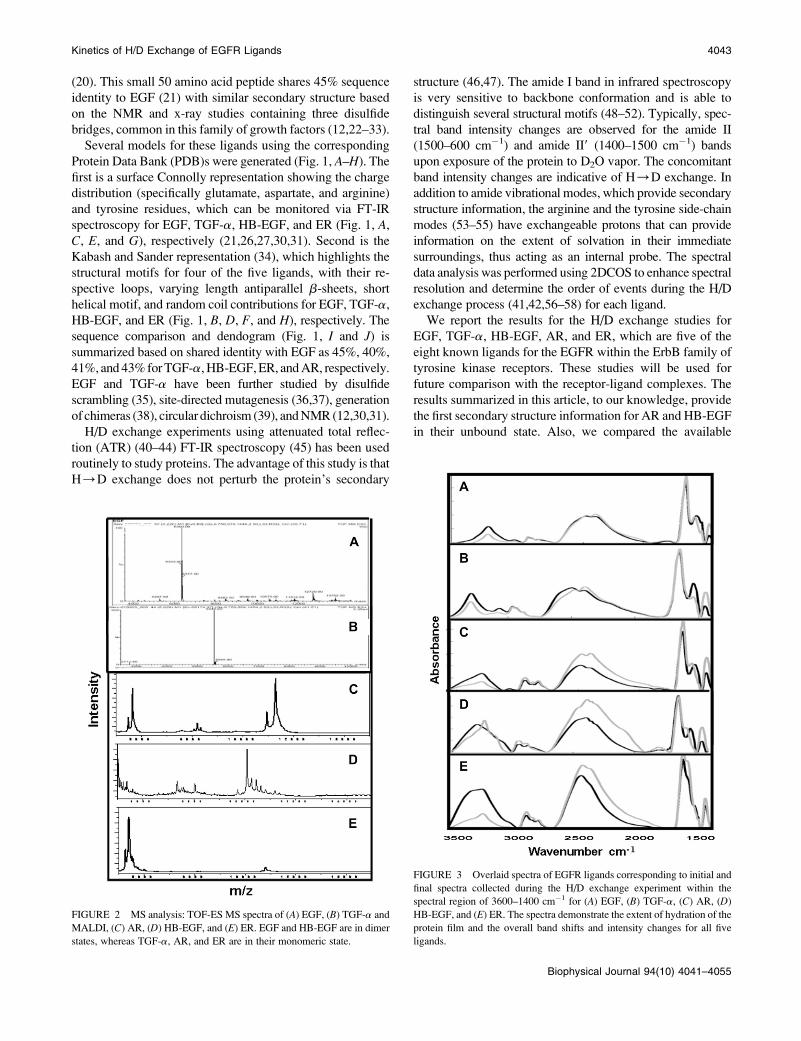
FIGURE 3 Overlaid spectra of EGFR ligands corresponding to initial and
final spectra collected during the H/D exchange experiment within the
spectral region of 3600–1400 cm�1 for (A) EGF, (B) TGF-a, (C) AR, (D)
HB-EGF, and (E) ER. The spectra demonstrate the extent of hydration of the
protein film and the overall band shifts and intensity changes for all five
ligands.
Kinetics of H/D Exchange of EGFR Ligands 4043
Biophysical Journal 94(10) 4041–4055

structural information for EGF, TGF-a, HB-EGF, and ER
with the FT-IR curve fitting analysis for percent secondary
structure determination. In addition, a comparative analysis
of the ligands’ H/D exchange kinetics and their extent of
exchange along with their oligomeric state via mass spectral
analysis are presented. Furthermore, the H/D exchange ki-
netics was only one aspect of the analysis since 2DCOS
analysis was also carried out and proven useful to determine
the differences in the exchange process of these ligands.
These results are essential to understanding the solvation
properties and their oligomeric state when unbound to their
receptor.
MATERIALS AND METHODS
Commercially pure (;97%) recombinant human EGF (6.3 kDa) and TGF-a
(6 kDa) expressed from Escherichia coli were purchased from Sigma-
Aldrich (St. Louis, MO) and lyophilized to remove residual acetonitrile
and trifluoroacetic acid. These ligands were then resuspended in 10 mM
HEPES, 100 mMNaCl buffer at pH 7.4. The other three human recombinant
ligands were of high purity (;97%) and purchased from R&D Systems
(Minneapolis, MN). AR (11 kDa) and ER (5.4 kDa) were also expressed
from E. coli, and HB-EGF (9.5 kDa) was expressed from Sf21 insect cell
cultures using a baculovirus expression system. These three ligands were not
subjected to further purification. Each ligand was dialyzed against 10 mM
HEPES, 100 mM NaCl at pH 7.4. All other reagents purchased were of the
highest quality commercially available. All the protein samples had a final
concentration of ;1 mg/mL.
The solubilized ligand was then spread onto a ZnSe ATR crystal from
Thermo Electron (Madison,WI) to obtain a uniform protein film. The sample
was dried overnight with a flow of dry air. Spectral acquisition was done
using a Mattson Infinity Series FT-IR spectrophotometer equipped with a
mercury cadmium telluride detector (Thermo Electron) under continuous dry
air purge conditions. Typically, 64 scans were coadded and apodized with a
triangular function to yield a resolution of 2 cm�1. Before H/D exchange, a
time 0 spectrum was acquired; this spectrum is characteristic of the un-
exchanged ligand. For EGF, spectra were acquired every 41 s for;5 h of the
experiment, for a total of 129 spectra collected. For TGF-a, subsequent
spectra were acquired every minute for the first 20 min of the exchange
followed by every 15 min. In the case of EGF and TGF-a, longer spectral
acquisitions were also carried out without change in the longer timeframes.
For both AR and ER, subsequent spectra were acquired every 45 s the first 10
min and every 10 min after that for 7 h. For HB-EGF, spectra were acquired
every 45 s the first 10 min and every 10 min after that for 14 h of the ex-
periment to monitor the exchange. Finally, a spectrumwas collected that was
characteristic of the fully deuterated ligand 24 h after the first spectrum was
acquired.
Spectral data analysis
No data were manipulated except for baseline correction. As a separate
analysis, Fourier self-deconvolution was performed to determine the exis-
tence of minor contributing peaks. The deconvolution parameters used for
TABLE 1 Summary of the kinetics of exchange for five of the EGFR ligands: EGF, TGF-a, AR, HB-EGF, and ER
EGFR
ligand
Oligomeric
state
Percent secondary
structureExtent of
exchange Tyr min�1
Arg
min�1
b-turn
min�1
b-sheets
min�1
310-helix
min�1310 b b-turn rc Method
EGF monomer/dimer — 26.4 11.3 62.3 NMR 40% 0.20 0.09 0.09 1.88 3 10�3 1.88 3 10�3
2.9 28.5 4.7 63.8 IR
TGF-a monomer 6.0 20.0 8.0 66.0 NMR 65% 0.91 0.27 0.27 1.41 3 10�4 1.41 3 10�4
6.3 18.8 17.8 57.1 IR
AR monomer — — — — None 55% 0.47 0.04 1.00 3 10�4 1.00 3 10�4 1.00 3 10�4
2.5 25.2 6.3 66.0 IR
HB-EGF monomer/dimer 3.8 7.6 5.1 83.5 x-ray 65% 0.89 0.14 1.00 3 10�3 1.00 3 10�3 0.89/1.00 3 10�3
1.5 30.6 2.4 65.5 IR
ER monomer 6.5 21.7 8.0 63.8 NMR 98% 0.16 0.03 1.00 3 10�4 1.00 3 10�4 1.00 3 10�4
3.6 24.0 8.0 64.4 IR
FIGURE 4 Overlaid difference spectra of the EGFR ligands. (A) EGF, (B)TGF-a, (C) AR, (D) HB- EGF, and (E) ER within the spectral region 1725–
1400 cm�1. The difference spectra were generated by subtraction of the first
spectrum from all subsequent spectra.
4044 Iloro et al.
Biophysical Journal 94(10) 4041–4055
this analysis were full width at half height of 18 cm�1, and a resolution (k)
was set as 2.
Assuming individual exchangeable protons, including amide protons and
side-chain exchangeable protons, behave as first order kinetics,
HðtÞ ¼ +N
i¼1
expð�kitÞ; (1)
where N is the number of amino acids,H is hydrogen, ki is the individual rate
constant for each proton, and t is time.
In a protein, these exchangeable protons are treated by class of amide
group (310-helix, b-sheets, b-turns or loops, as per assignments) or ex-
changeable protons within side chains that are infrared (IR) active (Arg and
Tyr, as per assignments). The intensity for each conformational subband and
side-chain contribution within the amide I and II bands are plotted as a
function of time and termed ‘‘single frequency kinetics’’. These data are then
used to determine a multiexponential decay of the amide I and II bands upon
exchange:
HðtÞ ¼ +M
J¼1
Aj expð�kjtÞ; (2)
whereM is the number of protons within a class, Aj is the class of proton, and
kj is the rate constant for the class of protons.
The single frequency kinetics versus time and the H(t) versus time plots
are used to define and assign the slow, intermediate, and fast kinetics of
exchange. The kinetics program for MATLAB (MathWorks, Natick, MA)
was developed and generously provided by Dr. Erik Goormaghtigh from the
Free University of Brussels, Belgium, for spectral analysis.
RESULTS AND DISCUSSION
Although these ligands were of commercial origin, time of
flight (TOF) matrix assisted laser desorption ionization
(MALDI)-electrospray (ES) 1 MS for EGF and TGF-a and
MALDI MS analyses were carried out for AR, HB-EGF, and
ER to verify purity, oligomeric state, and molecular weight of
each ligand sample (Fig. 2). For EGF (Fig. 2 A), a peak
corresponding to the monomer form at 6,360.0 mass/charge
ratio (m/z) along with a dimer at 12,720.0 m/z of this ligand is
commonly observed for the recombinant form of this protein.
In the case of TGF-a (Fig. 2 B), a prominent peak at 5,545.0
m/z along with a minor peak at 2,772.0 m/z for the double
protonated species agreed well with the calculated molecular
weight of TGF-a. For AR (Fig. 2 C), a major peak observed
at 11,297.0 m/z agrees well with the expected molecular
weight and a shoulder at 10,956.0 m/z, which would account
for the loss of the first three amino acids in the sequence (Ser,
Val, and Arg). A second peak was observed at 5,651.4 m/z
and a shoulder at 5,481.4 m/z, which would account for the
double protonated species. A third peak is observed for AR at
8,206.0 m/z with two minor shoulders at 8,333.6 m/z and
8,078.7 m/z of the single protonated species, possibly due
to proteolytic cleavage from the Lys-N protease (based
on results obtain from the Expasy peptide cutter subroutine
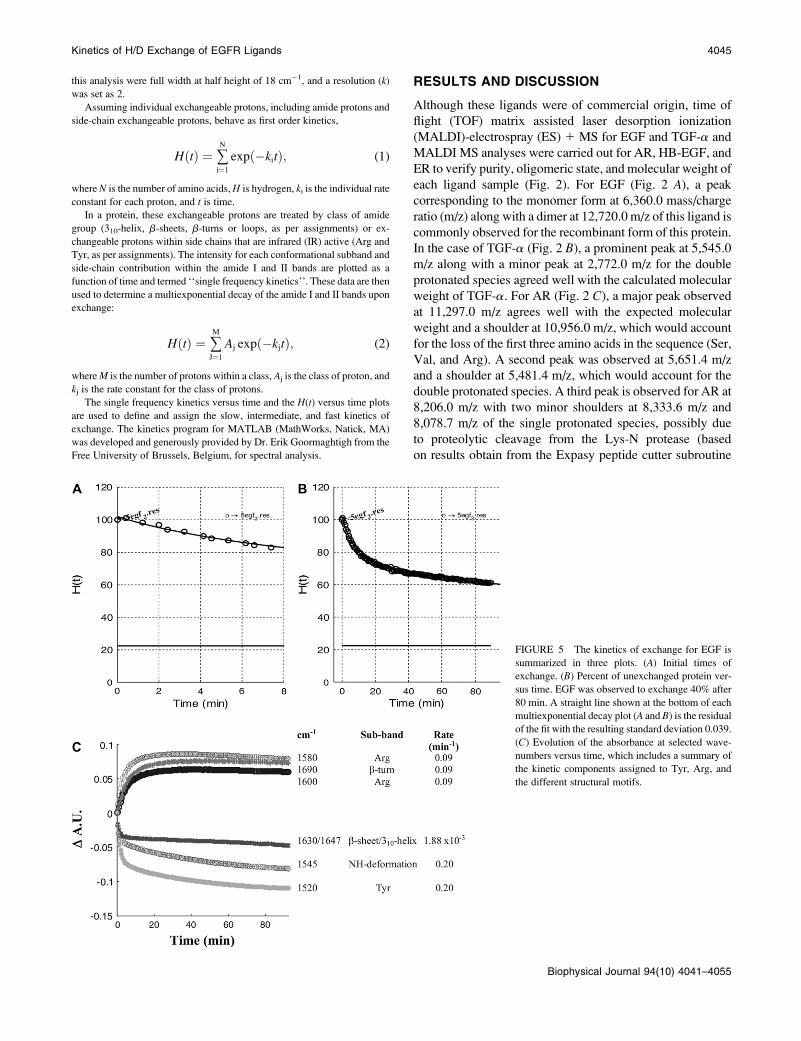
FIGURE 5 The kinetics of exchange for EGF is
summarized in three plots. (A) Initial times of
exchange. (B) Percent of unexchanged protein ver-
sus time. EGF was observed to exchange 40% after
80 min. A straight line shown at the bottom of each
multiexponential decay plot (A and B) is the residual
of the fit with the resulting standard deviation 0.039.
(C) Evolution of the absorbance at selected wave-
numbers versus time, which includes a summary of
the kinetic components assigned to Tyr, Arg, and
the different structural motifs.
Kinetics of H/D Exchange of EGFR Ligands 4045
Biophysical Journal 94(10) 4041–4055

(59))—in this case, accounting for the loss of the first 25
residues within the sequence and consequently the loss of the
random coil portion found at the N-terminal end of this li-
gand, thus allowing the conformational analysis AR.
For HB-EGF (Fig. 2 D), the parent peak at 9,721.3 m/z, a
second peak at 10,088 m/z with a series of shoulders at
10,263, 10,453, 10,629, 10,813, 10,995, 11,184, and 11,358
m/z are due to heterogeneous O-glycosylation. Third and
fourth peaks, observed for HB-EGF at 8,040.7 m/z with
shoulders at 7,601.3, 7,529.7, and 7,345.5 m/z are possibly
due to proteolysis. Specifically, the peak at 8,040.7 m/z
would be due to a proteolytic cleavage of the first four resi-
dues including Ser4 in the O-glycosylated state, followed by
7,601.3 m/z due to an additional loss of four residues (Ser5–
Gln8), whereas 7,529.7 and 7,345.5 m/z are due to the further
loss of one to three residues (Ala9 and Leu10-Ala11), re-
spectively. A fifth peak at 5,047.3, with shoulders at 5,135.2,
5,230.0, 5316.1, 5,374.4, and 5,595.4 m/z, are the double
protonated species of HB-EGF O-glycosylated ligand. For
ER (Fig. 2 E) the MALDI showed two peaks, a major peak
was observed at 5,401.8 m/z with three shoulders at 5,270.0,
5,547.5, and 5,585.9 m/z corresponding to the single pro-
tonated species along with nonspecific proteolytic cleavage
products of ER, respectively. The second minor peak, ob-
served at 10,815 m/z, was assigned to the dimer form of ER.
Assuming monomer and dimer forms ionize at the same rate,
the dimer contribution for ER is small. The MS analysis of
these ligands corresponds to the calculated protein masses
(EGF, TGF-a, AR, and ER), their proteolytic cleavage pro-
ducts (AR, HB-EGF, and ER), their posttranslational modi-
fication (HB-EGF), and their dimer forms (EGF and ER).
Otherwise, these ligands were pure protein products.
FT-IR spectroscopy
Typical ATR-FT-IR spectra for a D2O hydrated uniform
protein film in the spectral region of 3600–1400 cm�1 for
EGF, TGF-a, AR, HB-EGF, and ER (Fig. 3, A–E, respec-tively) are composed of the amide A band (;3200 cm�1), the
amide I9 band (;1650 cm�1), the amide II band (;1540
cm�1), and the amide II9 band (;1450 cm�1). We closely
monitored the spectral changes in the spectral region 1700–
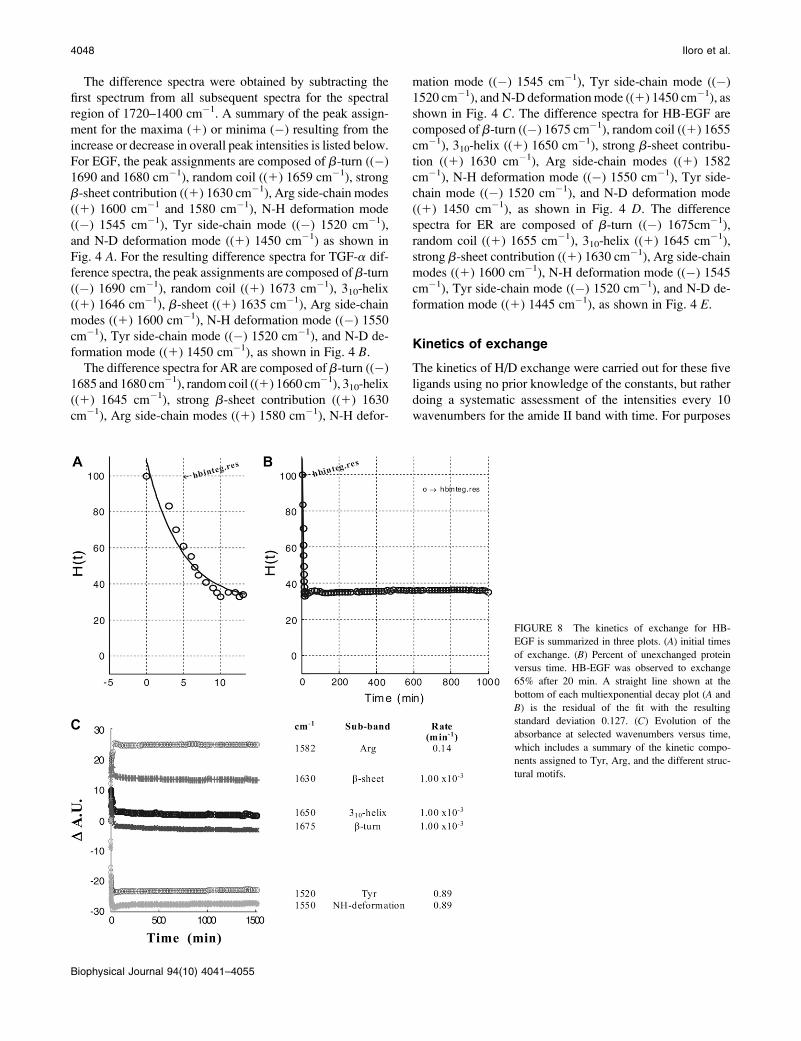
FIGURE 6 The kinetics of H/D exchange for
TGF-a is summarized in three plots. (A) Initial
times of exchange. (B) Percent of unexchanged
protein versus time. TGF-a was observed to ex-
change 65% after 15 min. A straight line shown at
the bottom of each multiexponential decay plot (Aand B) is the residual of the fit with the resulting
standard deviation 0.071. (C) Evolution of the
absorbance at selected wavenumbers versus time,
which includes the kinetics assigned for Tyr, Arg,
and the different structural motifs.
4046 Iloro et al.
Biophysical Journal 94(10) 4041–4055

1400 cm�1 during H/D exchange to include the observed
shift of the amide I9 band form accompanied by an increase in
bandwidth. In addition, a decrease in intensity of the amide II
band at ;1540 cm�1 along with a concomitant increase of
the amide II9 band at ;1450 cm�1 were observed. These
spectral changes were studied in detail by curve fitting
analysis, difference spectroscopy, 2DCOS analysis, and H/D
exchange kinetics.
Curve-fitting analysis (spectral data not shown) was per-
formed for the determination of percent secondary structure for
each ligand, as summarized in Table 1. Except for AR, these
results were compared with the available high-resolution
structural data. For EGF the percent secondary structure con-
tributions were 2.9% 310-helix, 28.5% b-sheet, 4.7% b-turn,and 63.8% random coil. The EGF results for the b-sheet andrandom coil contributions are in good agreement with NMR
results (PDB:1EPJ) (20–25) at pH 6.6, although our experi-
mental conditions were different, and the pH 7.4 and the
presence of dimer species may account for the small contri-
bution of 310 helix and the lower 4.7%b-turn contribution—as
for TGF-a, 6.3% 310-helix, 18.8% b-sheet, 17.8% b-turn,and 57.1% random coil contribution. The TGF-a results for
the 310-helix and b-sheet contribution are in good agreement
with NMR results (PDB:1YUG) (25,31,32). Furthermore, the
first structural analysis forAR resulted in 2.5%310-helix, 25.2%
b-sheet, 6.3% b-turn, and 66.0% random coil contribution.
HB-EGF is composed of 1.5% 310-helix, 30.6% b-sheet,2.4% b-turn, and 65.5% random coil contribution. This result
accounts for the only available percent secondary structure
for the HB-EGF in its unbound state. However, the results
presented above for HB-EGF are not in agreement with the
bound ligand in complex with diphtheria toxin (PDB:1XDT)
(11), suggesting that the ligand changes its secondary structure
when bound. A second important factor for the disagreement
is that the x-ray structure of recombinant diphtheria toxin/
HB-EGF complex was obtained using E. coli as host; so, HB-EGF in this structure is not glycosylated, whereas our results
are for Sf21 host recombinant HB-EGF in the O-glycosylated
state, potentially also accounting for the different secondary
structure contributions. Finally, ER’s secondary structure is
composed of 3.6% 310-helix, 24.0% b-sheet, 8.0% b-turn, and64.4% random coil contribution, which is in reasonably good
agreement with the available NMR structural information
(PDB:1K37) (14).
FIGURE 7 The kinetics of exchange for AR is
summarized in three plots. (A) Initial times of
exchange. (B) Percent of unexchanged protein ver-
sus time. AR was observed to exchange 55% after
80 min. A straight line shown at the bottom of each
multiexponential decay plot (A and B) is the residual
of the fit with the resulting standard deviation 0.083.
(C) Evolution of the absorbance at selected wave-
numbers versus time, which includes a summary of
the kinetic components assigned to Tyr, Arg, and
the different structural motifs.
Kinetics of H/D Exchange of EGFR Ligands 4047
Biophysical Journal 94(10) 4041–4055
The difference spectra were obtained by subtracting the
first spectrum from all subsequent spectra for the spectral
region of 1720–1400 cm�1. A summary of the peak assign-
ment for the maxima (1) or minima (�) resulting from the
increase or decrease in overall peak intensities is listed below.
For EGF, the peak assignments are composed of b-turn ((�)
1690 and 1680 cm�1), random coil ((1) 1659 cm�1), strong
b-sheet contribution ((1) 1630 cm�1), Arg side-chain modes
((1) 1600 cm�1 and 1580 cm�1), N-H deformation mode
((�) 1545 cm�1), Tyr side-chain mode ((�) 1520 cm�1),
and N-D deformation mode ((1) 1450 cm�1) as shown in
Fig. 4 A. For the resulting difference spectra for TGF-a dif-
ference spectra, the peak assignments are composed of b-turn((�) 1690 cm�1), random coil ((1) 1673 cm�1), 310-helix
((1) 1646 cm�1), b-sheet ((1) 1635 cm�1), Arg side-chain
modes ((1) 1600 cm�1), N-H deformation mode ((�) 1550
cm�1), Tyr side-chain mode ((�) 1520 cm�1), and N-D de-
formation mode ((1) 1450 cm�1), as shown in Fig. 4 B.The difference spectra for AR are composed of b-turn ((�)
1685 and 1680 cm�1), random coil ((1) 1660 cm�1), 310-helix
((1) 1645 cm�1), strong b-sheet contribution ((1) 1630
cm�1), Arg side-chain modes ((1) 1580 cm�1), N-H defor-
mation mode ((�) 1545 cm�1), Tyr side-chain mode ((�)
1520 cm�1), and N-D deformationmode ((1) 1450 cm�1), as
shown in Fig. 4 C. The difference spectra for HB-EGF are
composed of b-turn ((�) 1675 cm�1), random coil ((1) 1655
cm�1), 310-helix ((1) 1650 cm�1), strong b-sheet contribu-tion ((1) 1630 cm�1), Arg side-chain modes ((1) 1582
cm�1), N-H deformation mode ((�) 1550 cm�1), Tyr side-
chain mode ((�) 1520 cm�1), and N-D deformation mode
((1) 1450 cm�1), as shown in Fig. 4 D. The difference
spectra for ER are composed of b-turn ((�) 1675cm�1),
random coil ((1) 1655 cm�1), 310-helix ((1) 1645 cm�1),
strong b-sheet contribution ((1) 1630 cm�1), Arg side-chain
modes ((1) 1600 cm�1), N-H deformation mode ((�) 1545
cm�1), Tyr side-chain mode ((�) 1520 cm�1), and N-D de-
formation mode ((1) 1445 cm�1), as shown in Fig. 4 E.
Kinetics of exchange
The kinetics of H/D exchange were carried out for these five
ligands using no prior knowledge of the constants, but rather
doing a systematic assessment of the intensities every 10
wavenumbers for the amide II band with time. For purposes
FIGURE 8 The kinetics of exchange for HB-
EGF is summarized in three plots. (A) initial times
of exchange. (B) Percent of unexchanged protein
versus time. HB-EGF was observed to exchange
65% after 20 min. A straight line shown at the
bottom of each multiexponential decay plot (A and
B) is the residual of the fit with the resulting
standard deviation 0.127. (C) Evolution of the
absorbance at selected wavenumbers versus time,
which includes a summary of the kinetic compo-
nents assigned to Tyr, Arg, and the different struc-
tural motifs.
4048 Iloro et al.
Biophysical Journal 94(10) 4041–4055

of clarity, only the intensities associated with known as-
signments were plotted as the evolution of the absorbance at
selected wavenumber versus time. The intensity at ;1550
cm�1 was normalized using the intensity of the isobestic
point of the amide I9 band to generate a plot of the percent ofunexchanged protein versus time. The amide I band isobestic
points were 1673, 1687, 1673, 1671, and 1695 cm�1 for
EGF, TGF-a, AR, HB-EGF, and ER, respectively. The dif-
ference in isobestic point could be due to the different con-
tributions of small 310-helical domains and b-turns.The overall extent of exchange for each ligand is shown in
Figs. 5, A and B, to 9, A and B, and is summarized in Table 1.
In general, the extent of exchange agreed with the overall
hydrophobic residue content for each ligand (as analyzed by
the Kyte-Doolittle hydropathy sequence analysis (60)),
oligomeric state, and glycosylation. The exception was AR,
suggesting that the polar residues may be buried, whereas the
hydrophobic residues mainly located within C-terminal end
are exposed. The fastest initial exchange was observed for
TGF-a: within the first 5 min of the exchange process, 50%
of the ligand had exchanged. The next fastest initial exchange
was HB-EGF: within the first 5 min, 40% had exchanged,
probably due to the glycosylation. Although ER had the
slowest initial exchange, it was also this ligand that under-
went complete exchange, suggesting that the dimer species is
present in small quantities and that this protein is almost
completely exposed to its aqueous environment. The extent
of H/D exchange for these ligands, with EGF having the
lowest extent of exchange, suggests the dimer form con-
tributed to the loss of exposure to its aqueous environment
with only 40%; in contrast, epiregulin had almost complete
exchange (98%). HB-EGF had a greater extent of exchange,
i.e., 65%, suggesting the glycosylation affected hydration of
the ligand, whereas TGF-a and AR had extents of exchange
of 65% and 55%, respectively.
The kinetics of exchange can be used to study the dynamic
factors that affect hydrogen-bonding interactions which are
dependent on the secondary structure of the protein, in the
case of the amide protons, and the local environment ob-
served for the side chains, thus affecting protein stability.
FIGURE 9 The kinetics of exchange for ER is
summarized in three plots. (A) Initial times of
exchange. (B) Percent of unexchanged protein ver-
sus time. ER was observed to exchange 98% after
150 min. A straight line shown at the bottom of each
multiexponential decay plot (A and B) is the residual
of the fit with the resulting standard deviation 0.650.
(C) Evolution of the absorbance at selected wave-
numbers versus time, which includes a summary of
the kinetic components assigned to Tyr, Arg, and
the different structural motifs.
Kinetics of H/D Exchange of EGFR Ligands 4049
Biophysical Journal 94(10) 4041–4055

These results were determined for several secondary struc-
tural motifs—arginine and tyrosine residues (Figs. 5 C to 9
C)—and summarized in Table 1. HB-EGF and TGF-a have
the same exchange rates for Tyr, suggesting these residues
are in similar environments. Also for AR, HB-EGF, and ER,
the rates for Arg and Tyr were faster than the backbone ex-
change rates. HB-EGF had two different exchange rates for
the 310-helices, suggesting two different environments. EGF
and HB-EGF had similar exchange rates for the b-sheets,whereas TGF-a, ER, and AR were 10 orders of magnitude
slower. Finally, for AR the secondary structure motifs had the
same exchange rate in this case; the order of events ascer-
tained from 2DCOS proved valuable because it helped es-
tablish the differences in H/D exchange for these domains. In
general, the order of events ascertained from the 2DCOS
agreed with the kinetic analysis, with few exceptions, due to
the extremely fast exchange process of certain components,
such as exposed Tyr and the random coils.
2D-COS
To enhance the spectral resolution and extract correlation
and temporal information of the spectral changes, a two-
dimensional correlation analysis was performed on each data
set, within the spectral region of 1800–1400 cm�1. The syn-
chronous plots, which reflect in-phase transitions, are shown
in Figs. 10,A andC, and 11,A,C, andE; and the asynchronousplots, which reflect out-of-phase transitions, are shown in
Figs. 10, B andD, and 11, B,D, and F, for EGF, TGF-a, AR,HB-EGF, and ER, respectively. The auto peaks are diagonal
peaks, which reflect intensity variations, whereas crosspeaks
are off-diagonal peaks, reflecting correlations. These assign-
ments are summarized in Table 2. At times, there can be small
contributions that are difficult to localize due to band over-
lapping. To confirm the presence of small overlapped peaks,
the spectral data were deconvolved (data not shown).
Synchronous plots
Several differences in the peak pattern between the three li-
gands (EGF, TGF-a, AR, HB-EGF, and ER) are observed. Thesynchronous plots are shown in Fig. 10, A and C, for EGF and
TGF-a and in Fig. 11, A, C, and E, for AR, HB-EGF and ER,
respectively. The auto peak and crosspeak assignments are
summarized in Table 2. The largest intensity changes for the
auto peaks were the N-H and N-D deformation modes (;1550
cm�1 and ;1450 cm�1, respectively) associated primarily
with backbone amides. In general, the backbone and side-
chain (Arg, Tyr) vibrational modes correlated with the N-H
FIGURE 10 2DCOS obtained from the baseline-
corrected spectra corresponding to EGF and TGF-a
(A and C) synchronous and (B and D) asynchronous
plots, respectively.
4050 Iloro et al.
Biophysical Journal 94(10) 4041–4055

and N-D deformation modes. The b-turns in EGF were ob-
served to be in two different environments, suggesting that the
backbone dynamics were different.
Synchronous plots for each ligand are shown in Fig. 10, Aand C. For EGF the b-sheets (1630 cm�1) and b-turns cor-relate with the Arg (1600 and 1580 cm�1) and Tyr modes
(1520 cm�1). For TGF-a, the 310-helix (1646 cm�1) correlates
withArgmode (1600 cm�1), whereas theb-turns (1690 cm�1)
correlate with the b-sheets (1635 cm�1) and Tyr (1520 cm�1)
vibrational mode. Of all the ligands in this study, the highest
degree of complexity in the 2DCOS plots was observed for AR
(Fig. 11A). The similarity in these patterns will be discussed in
terms of the position of the auto peaks; and their assignments at
1680, 1685 cm�1 (b-turns), 1630 cm�1 (b-sheet), and Arg
(1580 cm�1) resembles those of AR (Fig. 11 A). The b-sheets(1630 cm�1) and helical (1645 cm�1) motifs govern the ex-
change process in AR. The b-sheets (1630 cm�1) are corre-
lated well with the Arg (1580 cm�1), the Tyr (1520 cm�1), and
the b-turn (1680 cm�1). Finally, for AR the b-turns (1685
cm�1) also correlate with the Tyr mode (1520 cm�1). HB-EGF
(Fig. 11 C) resulted in its b-turns (1675 cm�1) and Tyr (1520
cm�1) governing the exchange process.
These peaks also correlated with each other, suggesting
they are exposed to the aqueous environment. In addition,
FIGURE 11 2DCOS corresponding to AR, HB-
EGF, and ER obtained from the baseline corrected
spectra (A, C, and E) synchronous plots and (B, D,and F) asynchronous plots, respectively.
Kinetics of H/D Exchange of EGFR Ligands 4051
Biophysical Journal 94(10) 4041–4055

HB-EGF’s 310-helical peak (1650 cm�1) correlates with the
Tyr (1520 cm�1), suggesting they are also in a similar en-
vironment. Meanwhile, the exchange process in ER is
governed by the Arg (1600 cm�1) and b-sheets (1630
cm�1), although the strongest exchange perturbation was
the Arg (1600 cm�1). This effect is demonstrated more
strongly by the similarity in phase and position of the cor-
responding crosspeaks. However, for ER, there is an ab-
sence of several auto peaks—1675 cm�1 (b-turn) and 1645
cm�1 (310-helix) auto peaks (Fig. 11 E)—suggesting that
these motifs are less exposed to their aqueous environment,
unlike EGF, TGF-a, AR, and HB-EGF.
Asynchronous plots
TGF-a and EGF asynchronous plots are also quite different
from the asynchronous plots shown for AR, HB-EGF, and
ER, suggesting differences in the dynamics of exchange
(Figs. 10, B and D, and 11, B, D, and F, respectively). Thecolor of these crosspeaks and their counterparts in the syn-
chronous plots allows the determination of the order of events
summarized in Tables 3 and 4. However, for TGF-a, spectraldeconvolution was also performed to enhance the resolution
of asynchronous plots (data not shown). The apparent ab-
sence of the 1690 cm�1 crosspeak shown in Fig. 10 D, as-sociated with the b-turns present in TGF-a, was due to small
intensity changes. Otherwise, equal crosspeak intensity dis-
tributions were observed for EGF and TGF-a (Fig. 10, B and
D). In the case of EGF, the side chains correlated well with
each other: Arg (1580 cm�1) and Tyr (1510 cm�1). Also
observed were the b-sheets (1628 cm�1), which correlated
with the b-turns (1680, 1690 cm�1).
For TGF-a, the 310-helix (1648 cm�1) correlates with the
b-sheets (1635 cm�1), whereas the Tyr (1514 cm�1) cross-
peak correlated well with the Arg (1600 cm�1) and the b-turn(1690 cm�1). The crosspeaks observed with largest intensity
changes in AR, the b-sheet (1632 cm�1) and 310-helix (1645
cm�1) correlates with Arg (1582 cm�1), whereas the b-turns(1680, 1682 cm�1) correlated with the b-sheet (1632 cm�1)
(Fig. 11 B). Also, the b-sheet (1632 cm�1) and b-turns (1680cm�1) correlate with the Tyr (1520 cm�1). For HB-EGF, it is
interesting to note that the b-turn (1670 cm�1) correlates
inversely with the Tyr (1516 cm�1) and Arg (1582 cm�1)
crosspeaks (Fig. 11 D). ER, the Arg peak (1597 cm�1),
correlates with both the b-sheets (1632 cm�1) and 310-helix
(1646 cm�1); and the 310-helix (1646 cm�1) exchanges be-
fore the b-sheets (1632 cm�1).
The order of events for each ligand is as follows: for
EGF the Tyr residues exchange first, followed by Arg, then
the b-turn, and finally b-sheets and the 310-helix motif;
whereas for TGF-a it was the Tyr, followed by the Arg, then
the 310-helix and b-sheets, and finally the b-turn. In the caseof AR, the Tyr residues exchanged first, followed by Arg;
then the b-sheets exchange is followed by the 310-helix
and finally the b-turns. For HB-EGF, the order of exchangeis Tyr, followed by Arg, then the b-sheets, followed by
310-helix and b-turns. For ER, the Tyr exchanges first,
followed by the b-turns, then Arg, the 310-helix, and finally
TABLE 3 Order of events during the H/D exchange process
for EGF and TGF-a
Event Order of Events*
EGF
1 Tyr (1520 cm�1) before Arg (1580 cm�1)
2 b-turns (1680, 1690 cm�1) occur before b-sheet (1628 cm�1)
3 Tyr (1510 cm�1) before b-sheet (1628 cm�1)
4 b-sheet (1628 cm�1) before 310-helix (1648 cm�1)
5 Arg (1580 cm�1) before b-turns (1680, 1690 cm�1)
6 Tyr (1510 cm�1) occur prior b-turns (1680, 1690 cm�1)
TGF-a
1 Tyr (1514 cm�1) before 310-helix (1648 cm�1)
2 Tyr (1514 cm�1) before b-sheet (1635 cm�1)
3 310-helix (1648 cm�1) before b-sheet (1635 cm�1)
4 Arg (1600 cm�1) before 310-helix (1648 cm�1)
5 Tyr (1514 cm�1) before Arg (1600 cm�1)
6 b-sheet (1635 cm�1) before b-turns (1690 cm�1)
7 Arg (1600 cm�1) occurs before b-turns (1690 cm�1)
*Peak assignment and crosspeak positions are used to describe each event.
TABLE 2 Summary of 2DCOS peak assignments for the EGFR ligands EGF, TGF-a, AR, HB-EGF, and ER synchronous
autopeaks and asynchronous crosspeaks
EGF TGF-a AR HB-EGF ER
Assignment
S*
autopeaks
(cm�1)
Ay
crosspeaks
(cm�1)
S
autopeaks
(cm�1)
A
crosspeaks
(cm�1)
S
autopeaks
(cm�1)
A
crosspeaks
(cm�1)
S
autopeaks
(cm�1)
A
crosspeaks
(cm�1)
S
autopeaks
(cm�1)
A
crosspeaks
(cm�1)
b-sheet 1630 1628 1635 1635 1630 1632 1630 1634 1630 1632
b -turn 1690, 1680 1690, 1680 1690 1690 1680, 1685 1680, 1685 1675 1680 1675 1675
310-helix 1647 1648 1646 1648 1645 1645 1650 1648 1645 1646
Arg side chain 1600, 1580 1600, 1580 1600 1600, 1585 1580 1582 1582 1582 1600 1597
N-H deformation 1545 1545 1550 1545 1545 1550 1550 1548 1545 1551
Tyr side chain 1520 1510 1520 1514 1520 1520 1520 1516 1520 1519
N-D deformation 1450 1450 1440 1450 1450 1450 1445 1451 1445 1449
*Synchronous plot.yAsynchronous plot.
4052 Iloro et al.
Biophysical Journal 94(10) 4041–4055

the b-sheet. The random coil crosspeak was never observed,
due to the extremely fast kinetics of exchange occurring for
our experimental setup (43). Therefore, the dynamics of
exchange are different for these ligands. More importantly,
these results correlate well with the kinetics of exchange
presented above and were used to determine when the rates
of exchange were the same.
CONCLUSION
Differences in secondary structure, conformational fluctua-
tions, and exposure of the protein to its aqueous environment
are factors that affect the dynamic nature of hydrogen-
bonding interactions. By correlating the amide protons found
in the backbone to the side chains, we were able to explore
these factors and relate them to the oligomeric state and
posttranslational modification of the protein. We chose a
family of ligands that interacts with the same target protein
(receptor) and has similar sequence, size, and secondary
structure—thus allowing a comparative analysis.
These ligands were characterized by MS analysis and FT-
IR spectroscopy. MS analysis is the technique of choice to
determine the integrity and oligomeric state of a protein and
as such was found to be crucial to understand the differences
in the extent of exchange observed. The FT-IR spectroscopic
analysis presented here for these ligands is in relatively good
agreement with the available structural information (12,22–
24,29–32,59). We determined the secondary structure com-
position for AR and HB-EGF in their unbound state. These
ligands share common motifs defined by three disulfide
bridges that generate three loops, two-stranded antiparallel
b-sheets, and random coil regions in the amino and carboxyl
termini. These structural similarities cannot explain their
roles in regulating the EGFR. Differences in the extent of
exchange were not due to the differences in molecular
weight, but rather the residue content affecting solvent ac-
cessibility, dimerization, and/or posttranslational modifica-
tion observed for HB-EGF (glycosylation).
The fastest components to exchange were the side chains
(Arg or Tyr), showing that these side chains were highly ex-
posed to their aqueous environment, whereas the b-sheetswithin EGF and HB-EGF were determined to be one order of
magnitude faster than TGF-a, ER, and AR. The b-turns werealso observed to exchange faster for TGF-a, followed by EGF;whereas HB-EGF, ER, and AR were up to 100 orders of mag-
nitude slower. At times, the kinetics was not sensitive enough to
distinguish the rates of exchange for several secondary struc-
tural motifs within the same ligand. 2DCOS proved valuable in
the establishment of the order of events in which these structural
domains were exchanged with respect to one another, allowing
further confidence. Therefore the combined analysis kinetics
of H/D exchange and 2DCOS can be used to establish the order
of events in the H/D exchange process.
H/D exchange studies monitored by FT-IR spectroscopy
have been proven useful in the analysis of solvent accessi-
bility at the structural motif level; but more importantly,
hydrogen-bonding interaction was studied by determining
the H/D exchange rates. The differences in exchange rates
observed for these five ligands, within their side chains and
secondary structural motifs, may be critical for receptor
regulation. The next logical step in this work is to study the
interaction between these ligands and the EGFR using 13C-
labeled ligands to allow the simultaneous study of both
proteins within the complex.
We thank Michael W. Holmes for the mass spectral analysis used to verify
EGF and TGF-a’s purity at the Mayo Proteomics Research Center at Mayo
Clinic and Foundation (Rochester, MN). We also thank Kaye Speicher and
Nicole DiFlorio at the Wistar Proteomics Facility (Philadelphia, PA) for the
mass spectral analysis of AR, HB-EGF, and ER. The authors also thank
Dr. James V. Staros for his discussions on receptor ligand binding. Finally,
we greatly appreciate Dr. Eric Goormaghtigh’s generous gift of the kinetics
program and his helpful discussions.
This project was supported by National Institutes of Health COBRE grant
P20 RR16439-01 (B.P.R. and E.C.), National Institutes of Health SCORE
grant 5-S06GM08103 (B.P.R.), and the University of Puerto Rico.
REFERENCES
1. Riese, D. J., and D. F. Stern. 1998. Specificity within the EGF family/ErbB receptor family signaling network. Bioessays. 20:41–48.
2. Klein, P., D. Mattoon, M. A. Lemmon, and J. Schlessinger. 2004. Astructure-based model for ligand binding and dimerization of EGFreceptors. Proc. Natl. Acad. Sci. USA. 101:929–934.
3. Garrett, T. P., N. M. Mckern, M. Lou, T. C. Elleman, T. E. Adams,G. O. Lovrecz, H. J. Zhu, F. Walker, M. J. Frenkel, P. A. Hoyne, R. N.Jorissen, E. C. Nice, A. W. Burgess, and C. W. Ward. 2002. Crystalstructure of a truncated epidermal growth factor receptor extracellulardomain bound to transforming growth factor a. Cell. 110:763–773.
TABLE 4 Order of events during the H/D exchange process
for AR, HB-EGF, and ER
Event Order of events*
Amphiregulin
1 Tyr (1520 cm�1) before Arg (1582 cm�1)
2 Arg (1582 cm�1) before b-sheet (1632 cm�1)
3 b-sheet (1632 cm�1) before b-turns (1680/1682 cm�1)
4 b-sheet (1632 cm�1) before 310-helix (1645 cm�1)
5 310-helix (1645 cm�1) before b-turns (1680/1682 cm�1)
HB-EGF
1 Arg (1582 cm�1) before b-sheet (1632 cm�1) and
b-turns (1670 cm�1)
2 Arg (1582 cm�1) before 310-helix (1650 cm�1)
3 310-helix (1650 cm�1) before b-turns (1670 cm�1)
4 b-sheet (1632 cm�1) before 310-helix (1650 cm�1)
Epiregulin
1 Tyr (1520 cm�1) before 310-helix (1646 cm�1) and b-sheet
(1632 cm�1)
2 Tyr (1520 cm�1) before Arg (1597 cm�1)
3 Arg (1597 cm�1) before b-sheet (1632 cm�1)
4 310-helix (1646 cm�1) before b-sheet (1632 cm�1)
5 b-turn (1675 cm�1) before Arg (1597 cm�1) and 310-helix
(1646 cm�1)
*Peak assignment and crosspeak positions are used to describe each event.
Kinetics of H/D Exchange of EGFR Ligands 4053
Biophysical Journal 94(10) 4041–4055
4. Ogiso, H., R. Ishitani, O. Nureki, S. Fukai, M. Yamanaka, J. H. Kim,K. Saito, A. Sakamoto, M. Inoue, M. Shirouzu, and S. Yokoyama.2002. Crystal structure of the complex of human epidermal growthfactor and receptor extracellular domains. Cell. 110:775–787.
5. Burgess, A. W., H. S. Cho, C. Eigenbrot, K. M. Ferguson, T. P.Garrett, D. J. Leahy, M. A. Lemmon, M. X. Sliwkowski, C. W. Ward,and S. Yokoyama. 2003. An open-and-shut case? Recent insights intothe activation of EGF/ErbB receptors. Mol. Cell. 12:541–552.
6. Lenferink, A. E., E. J. van Zoelen, M. J. van Vugt, S. Grothe, W. vanRotterdam, M. L. van De Poll, and M. D. O’Connor-McCourt. 2000.Superagonist activation of ErbB-1 by EGF-related growth factors withenhanced association and dissociation rate constants. J. Biol. Chem.275:26748–26753.
7. Davis-Fleischer, K. M., and G. E. Besner. 1998. Structure and functionof heparin-binding EGF-like growth factor (HB-EGF). Front. Biosci.3:d288–d299.
8. Freimann, S., I. Ben-Ami, A. Dantes, R. Ron-El, and A. Amsterdam.2004. EGF-like factor epiregulin and amphiregulin expression isregulated by gonadotropins/cAMP in human ovarian follicular cells.Biochem. Biophys. Res. Commun. 324:829–834.
9. Higashiyama, S., K. Lau, G. E. Besner, J. A. Abraham, and M.Klagsbrun. 1992. Structure of heparin-binding EGF-like growth factor.Multiple forms, primary structure, and glycosylation of the matureprotein. J. Biol. Chem. 267:6205–6212.
10. Shoyab, M., G. D. Plowman, V. L. McDonald, J. G. Bradley, and G. J.Todaro. 1989. Structure and function of human amphiregulin: amember of the epidermal growth factor family. Science. 243:1074–1076.
11. Louie, G. V., W. Yang, M. E. Bowman, and S. Choe. 1997. Crystalstructure of the complex of diphtheria toxin with an extracellularfragment of its receptor. Mol. Cell. 1:67–78.
12. Montelione, G. T., K. Wuthrich, A. W. Burgess, E. C. Nice, G.Wagner, K. D. Gibson, and H. A. Scheraga. 1992. Solution structure ofmurine epidermal growth-factor determined by NMR-spectroscopy andrefined by energy minimization with restraints. Biochemistry. 31:236–249.
13. Thorne, B. A., and G. D. Plowman. 1994. The heparin-binding domainof amphiregulin necessitates the precursor pro-region for growth factorsecretion. Mol. Cell. 1:67–78.
14. Sato, K., T. Nakamura, M. Mizuguchi, K. Miura, M. Tada, T. Aizawa,T. Gomi, K. Miyamoto, and K. Kawano. 2003. Solution structure ofepiregulin and the effect of its C-terminal domain for receptor bindingaffinity. FEBS Lett. 553:232–238.
15. Baba, I., S. Shirasawa, R. Iwamoto, K. Okumura, T. Tsunoda, M.Nishioka, K. Fukuyama, K. Yamamoto, E. Mekada, and T. Sasazuki.2000. Involvement of deregulated epiregulin expression in tumorigen-esis in vivo through activated Ki-Ras signaling pathway in humancolon cancer cells. Cancer Res. 60:6886–6889.
16. Torring, N., F. D. Hansen, B. S. Sorensen, T. F. Orntoft, and E. Nexo.2005. Increase in amphiregulin and epiregulin in prostate cancerxenograft after androgen deprivation-impact of specific HER1 inhibi-tion. Prostate. 64:1–8.
17. Jones, J. T., R. W. Akita, and M. X. Sliwkowski. 1999. Binding spec-ificities and affinities of egf domains for ErbB receptors. FEBS Lett.447:227–231.
18. Derynck, R. R., M. E. Winkler, E. Y. Chen, and D. V. Goeddel. 2005.Human transforming growth factor-a: precursor structure and expres-sion in E. coli. Cell. 38:287–297.
19. Alwan, H. A., E. J. van Zoelen, and J. E.M. van Leeuwen. 2003. Ligand-induced lysosomal epidermal growth factor receptor (EGFR) degrada-tion is preceded by proteosome-dependent EGFR de-ubiquitination.J. Biol. Chem. 278:35781–35790.
20. Groenen, L. C., E. C. Nice, and A. W. Burgess. 1994. Structure-function relationships for the EGF/TGF-a family of mitogens. GrowthFactors. 11:235–257.
21. Carpenter, G., and S. Cohen. 1990. Epidermal growth-factor. J. Biol.Chem. 265:7709–7712.
22. Kohda, D., N. Go, K. Hayashi, and F. Inagaki. 1988. Tertiary structureof mouse epidermal growth factor determined by two-dimensional 1HNMR. J. Biochem. (Tokyo). 103:741–743.
23. Kohda, D., C. Kodama, R. Kase, H. Nomoto, K. Hayashi, and F.Inagaki. 1988. A comparative 1H NMR study of mouse a (1–53) and b(2–53) epidermal growth factors. Biochem. Int. 16:647–654.
24. Kohda, D., and F. Inagaki. 1988. Complete sequence specific 1H NMRresonance assignments for mouse epidermal growth factor. J. Biochem.(Tokyo). 103:554–571.
25. Montelione, G. T., M. E. Winkler, L. E. Burton, E. Rinderknecht, M. B.Sporn, and G. Wagner. 1989. Sequence-specific 1H-NMR assignmentsand identification of two small antiparallel b-sheets in the solution struc-ture of recombinant human transforming growth factor a. Proc. Natl.Acad. Sci. USA. 86:1519–1523.
26. Kline, T. P., F. K. Brown, S. C. Brown, P. W. Jeffs, K. D. Kopple,and L. Mueller. 1990. Solution structures of human transforminggrowth factor-a derived from H-1-NMR data. Biochemistry. 29:7805–7813.
27. Harvey, T. S., A. J. Wilkinson, M. J. Tappin, R. M. Cooke, and I. D.Campbell. 1991. The solution structure of human transforming growthfactor-a. Eur. J. Biochem. 198:555–562.
28. Kohda, D., T. Sawada, and F. Inagaki. 1991. Characterization of pHtitration shifts for all the nonlabile proton resonances in a protein bytwo-dimensional NMR: the case of mouse epidermal growth factor.Biochemistry. 30:4896–4900.
29. Kohda, D., and F. Inagaki. 1992. 3-Dimensional nuclear-magnetic-resonance structures of mouse epidermal growth-factor in acidic andphysiological pH solutions. Biochemistry. 31:11928–11939.
30. Moy, F. J., Y. C. Li, P. Rauenbuehler, M. E. Winkler, H. A. Scheraga,and G. T. Montelione. 1993. Solution structure of human type-a trans-forming growth-factor determined by heteronuclear NMR-spectroscopyand refined by energy minimization with restraints. Biochemistry. 32:7334–7353.
31. Li, Y. C., and G. T. Montelione. 1995. Human type-a transforminggrowth-factor undergoes slow conformational exchange between mul-tiple backbone conformations as characterized by N-15 relaxationmeasurements. Biochemistry. 34:2408–2423.
32. Fadel, A. R., D. Q. Jin, G. T. Montelione, and R. M. Levy. 1995.Crankshaft motions of the polypeptide backbone in molecular dynam-ics simulations of human type a transforming growth factor. J. Biomol.NMR. 6:221–226.
33. Stein, R. A., and J. V. Staros. 2000. Evolutionary analysis of the ErbBreceptor and ligand families. J. Mol. Evol. 50:397–412.
34. Kabsch, W., and C. Sanders. 1983. Dictionary of protein secondarystructure: pattern recognition of hydrogen-bonded and geometrical fea-tures. Biopolymers. 22:2577–2637.
35. Chang, J.-Y., and L. Li. 2002. The disulfide structure of denaturedepidermal growth factor: preparation of scrambled disulfide isomers.J. Protein Chem. 21:203–213.
36. DeWitt, A., T. Iida, H. Y. Lam, V. Hill, H. S. Wiley, and D. A.Lauffenburger. 2002. Affinity regulates spatial range of EGF receptorautocrine ligand binding. Dev. Biol. 250:305–316.
37. Neelam, B., A. Richter, S. G. Chamberlin, S. M. Puddicombe, L.Wood, M. B. Murrray, K. Nandagopal, S. K. Niyogi, and D.Davies. 1998. Structure-function studies of ligand-induced epider-mal growth factor receptor dimerization. Biochemistry. 37:4884–4891.
38. Wigens, M., T. Wama, H. van Ingen, C. Stortelers, J. E. M. vanLeeuwen, E. J. van Zoelen, and G. W. Vuister. 2003. Structuralanalysis of an epidermal growth factor/transforming growth factor-achimera with unique ErbB binding specificity. J. Biol. Chem. 278:39114–39123.
39. Holladay, L. A., C. R. Savage, S. Cohen, and D. Puett. 1976. Con-formation and unfolding thermodynamics of epidermal growth andderivatives. Biochemistry. 15:2624–2633.
40. Acha, V., J. M. Ruysschaert, and E. Goormaghtigh. 2001. Stacks ofclose to 100 phospholipid bilayers fully accessible to proteins—an
4054 Iloro et al.
Biophysical Journal 94(10) 4041–4055

ATR-FTIR-based chemometric analysis on hydrated phospholipidfilms. Anal. Chim. Acta. 435:215–226.
41. Goormaghtigh, E., H. H. J. deJongh, and J. M. Ruysschaert. 1996.Relevance of protein thin films prepared for attenuated total reflectionFourier transform infrared spectroscopy: significance of the pH. Appl.Spectrosc. 50:1519–1527.
42. Ortiz, M., Z. Sanoguet, H. Hu, W. J. Chazin, C. McMurray, J. L.Salisbury, and B. Pastrana-Rios. 2005. Dynamics of hydrogen-deuterium exchange in Chlamydomonas centrin. Biochemistry. 44:2409–2418.
43. Raussens, V., J. M. Ruysschaert, and E. Goormaghtigh. 2004. Analysisof 1H/2H exchange kinetics using model infrared spectra. Appl. Spectrosc.58:68–82.
44. Vigano, C., M. Smeyers, V. Raussens, F. Scheirlinckx, J. M.Ruysschaert, and E. Goormaghtigh. 2004. Hydrogen-deuterium ex-change in membrane proteins monitored by IR spectroscopy: anew tool to resolve protein structure and dynamics. Biopolymers.74:19–26.
45. Arrondo, J. L. R., A. Muga, J. Castresana, and F. M. Goni. 1993.Quantitative studies of the structure of proteins in solution byFourier-transform infrared spectroscopy. Prog. Biophys. Mol. Biol.59:23–56.
46. Goormaghtigh, E., V. Raussens, and J. M. Ruysschaert. 1999. Atten-uated total reflection infrared spectroscopy of proteins and lipids inbiological membranes. Biochim. Biophys. Acta. 1422:105–185.
47. Nabet, A., and M. Pezolet. 1997. Two-dimensional FT-IR spectros-copy: a powerful method to study the secondary structure of proteinsusing H-D exchange. Appl. Spectrosc. 51:466–469.
48. Graff, D. K., B. Pastrana-Rios, S. Y. Venyaminov, and F. G.Prendergast. 1997. The effects of chain length and thermal denaturationon helix-forming peptides: a mode-specific analysis using 2D FT-IR.J. Am. Chem. Soc. 119:11282–11294.
49. Krimm, S., and J. Bandekar. 1986. Vibrational spectroscopy and con-formation of peptides, polypeptides, and proteins. Adv. Protein Chem.38:181–364.
50. Arrondo, J. L., and F. M. Goni. 1999. Structure and dynamics ofmembrane proteins as studied by infrared spectroscopy. Prog. Biophys.Mol. Biol. 72:367–405.
51. Pastrana-Rios, B. 2001. Mechanism of unfolding of a model helicalpeptide. Biochemistry. 40:9074–9081.
52. Pastrana-Rios, B., W. Ocana, M. Rios, G. L. Vargas, G. Ysa, G. Poynter,J. Tapia, and J. L. Salisbury. 2002. Centrin: its secondary structure in thepresence and absence of cations. Biochemistry. 41:6911–6919.
53. Chirgadze, Y. N., O. V. Fedorov, and N. P. Trushina. 1975. Estimationof amino acid residue side-chain absorption in the infrared spectra ofprotein solutions in heavy water. Biopolymers. 14:679–694.
54. Venyaminov, S. Y., and N. N. Kalnin. 1990. Quantitative IR spectro-photometry of peptide compounds in water (H2O) solutions. 1. Spectralparameters of amino-acid residue absorption-bands. Biopolymers. 30:1243–1257.
55. Venyaminov, S. Y., and N. N. Kalnin. 1990. Quantitative IR spectro-photometry of peptide compounds in water (H2O) solutions. 2. Amideabsorption-bands of polypeptides and fibrous proteins in a-coil, b-coil,and random coil conformations. Biopolymers. 30:1259–1271.
56. Meskers, S., J. M. Ruysschaert, and E. Goormaghtigh. 1999. Hydrogen-deuterium exchange of streptavidin and its complex with biotin studiedby 2D-attenuated total reflection Fourier transform infrared spectros-copy. J. Am. Chem. Soc. 121:5115–5122.
57. Noda, I., A. E. Dowrey, C. Marcott, G. M. Story, and Y. Ozaki. 2000.Generalized two-dimensional correlation spectroscopy. Appl. Spec-trosc. 54:236A–248A.
58. Ferguson, K. M., M. B. Berger, J. M. Mendrola, C. Hyun-Soo, D. J.Leahy, and M. A. Lemmon. 2003. EGF activates its receptor byremoving interactions that autoinhibit ectodomain dimerization. Mol.Cell. 11:507–517.
59. ExPASy - UniProt Knowledgebase. 2007. Swiss-Prot and TrEMBL.http://expasy.org/sprot/.
60. Kyte, J., and R. Doolittle. 1982. A simple method for displaying thehydropathic character of a protein. J. Mol. Biol. 157:105–132.
Kinetics of H/D Exchange of EGFR Ligands 4055
Biophysical Journal 94(10) 4041–4055