Spatial distribution of Oxygen18 and Deuterium in precipitation in Morocco
12
Hydrol. Earth Syst. Sci., 19, 1577–1588, 2015 www.hydrol-earth-syst-sci.net/19/1577/2015/ doi:10.5194/hess-19-1577-2015 © Author(s) 2015. CC Attribution 3.0 License. Spatial distribution of oxygen-18 and deuterium in stream waters across the Japanese archipelago M. Katsuyama 1,2 , T. Yoshioka 3 , and E. Konohira 4 1 Center for the Promotion of Interdisciplinary Education and Research, Kyoto Univ., Kyoto University Higashi Ichijokan, 1 Yoshida Nakaadachi, Sakyo, Kyoto 606-8306, Japan 2 Graduate School of Agriculture, Kyoto Univ., Kitashirakawa Oiwake, Sakyo, Kyoto 606-8502, Japan 3 Field Science Education and Research Center, Kyoto Univ., Kitashirakawa Oiwake, Sakyo, Kyoto 606-8502, Japan 4 DLD Inc., Ina, 2435 Kami Yamada, Takatoh, Ina, Nagano 396-0217, Japan Correspondence to: M. Katsuyama ([email protected]) Received: 30 August 2014 – Published in Hydrol. Earth Syst. Sci. Discuss.: 30 September 2014 Revised: 12 March 2015 – Accepted: 13 March 2015 – Published: 31 March 2015 Abstract. The spatial distribution of oxygen and hydrogen isotopic composition (δ 18 O and δ 2 H) of stream waters across Japan was clarified with a data set by compiling sample data obtained from 1278 forest catchments during the summer of 2003. Both δ 18 O and δ 2 H values showed positive correla- tions with the mean annual air temperature and annual evap- otranspiration, and negative correlations with latitude and el- evation. Deuterium excess (d-excess) values in stream waters were higher on the Sea of Japan side, and lower on the Pa- cific Ocean side, of the Japanese archipelago. The d-excess in precipitation was generally higher in winter and lower in summer in Japan. The Sea of Japan side experiences a great deal of snowfall, and seasonal changes in monthly precipita- tion are rather small. In contrast, the Pacific Ocean side ex- periences a large amount of rainfall during summer with low levels of precipitation during the winter. Therefore, the lower d-excess in stream waters on the Pacific Ocean side reflects summer precipitation, and the higher values on the Sea of Japan side are affected by delayed recharge from snowmelt. The isoscapes of stream water connote not only spatially in- tegrated but also temporally integrated isotope signals of pre- cipitation and provide a framework for addressing applied hydrological, ecological, or meteorological research ques- tions at regional scales, such as the effects of climate change. 1 Introduction The importance of isoscapes, that is, the mapping of large- scale spatiotemporal distributions of stable isotope compo- sitions in various environments (West et al., 2010), is be- ing recognized as providing a framework for fundamental and applied research questions in a wide range of fields at large scales. The Global Network for Isotopes in Precipita- tion (GNIP) database has been applied, for example, to mon- itor climate-change impacts on the character and intensity of precipitation (Aggarwal et al., 2012) and to build glob- ally predictive GIS-based models for precipitation isoscapes (e.g., www.waterisotopes.org). Wassenaar et al. (2009) pointed out, however, that the GNIP stations are often spatially deficient for many regions that are of interest to hydrologists as well as ecologists. For example, Wassenaar et al. (2009) mentioned that Mexico has only two GNIP stations. Moreover, Japan had also only two stations and, unfortunately, both stations in Japan were al- ready closed. In addition, long-term monitoring of precipi- tation is also required. Consequently, the ground validation data for these global models are insufficient to compare at regional or country-wide scales. Under the circumstances, Wassenaar et al. (2009) hypothesized that the stable iso- topic composition of surface water or groundwater, which integrates longer-term precipitation inputs (Clark and Fritz, 1997), can be a proxy for precipitation infiltration input. In- deed, some research has been undertaken regarding nation- wide surface-water and groundwater isoscapes and uses them Published by Copernicus Publications on behalf of the European Geosciences Union.
-
Upload
independent -
Category
Documents
-
view
5 -
download
0
Transcript of Spatial distribution of Oxygen18 and Deuterium in precipitation in Morocco

Hydrol. Earth Syst. Sci., 19, 1577–1588, 2015
www.hydrol-earth-syst-sci.net/19/1577/2015/
doi:10.5194/hess-19-1577-2015
© Author(s) 2015. CC Attribution 3.0 License.
Spatial distribution of oxygen-18 and deuterium in stream waters
across the Japanese archipelago
M. Katsuyama1,2, T. Yoshioka3, and E. Konohira4
1Center for the Promotion of Interdisciplinary Education and Research, Kyoto Univ., Kyoto University Higashi Ichijokan, 1
Yoshida Nakaadachi, Sakyo, Kyoto 606-8306, Japan2Graduate School of Agriculture, Kyoto Univ., Kitashirakawa Oiwake, Sakyo, Kyoto 606-8502, Japan3Field Science Education and Research Center, Kyoto Univ., Kitashirakawa Oiwake, Sakyo, Kyoto 606-8502, Japan4DLD Inc., Ina, 2435 Kami Yamada, Takatoh, Ina, Nagano 396-0217, Japan
Correspondence to: M. Katsuyama ([email protected])
Received: 30 August 2014 – Published in Hydrol. Earth Syst. Sci. Discuss.: 30 September 2014
Revised: 12 March 2015 – Accepted: 13 March 2015 – Published: 31 March 2015
Abstract. The spatial distribution of oxygen and hydrogen
isotopic composition (δ18O and δ2H) of stream waters across
Japan was clarified with a data set by compiling sample data
obtained from 1278 forest catchments during the summer of
2003. Both δ18O and δ2H values showed positive correla-
tions with the mean annual air temperature and annual evap-
otranspiration, and negative correlations with latitude and el-
evation. Deuterium excess (d-excess) values in stream waters
were higher on the Sea of Japan side, and lower on the Pa-
cific Ocean side, of the Japanese archipelago. The d-excess
in precipitation was generally higher in winter and lower in
summer in Japan. The Sea of Japan side experiences a great
deal of snowfall, and seasonal changes in monthly precipita-
tion are rather small. In contrast, the Pacific Ocean side ex-
periences a large amount of rainfall during summer with low
levels of precipitation during the winter. Therefore, the lower
d-excess in stream waters on the Pacific Ocean side reflects
summer precipitation, and the higher values on the Sea of
Japan side are affected by delayed recharge from snowmelt.
The isoscapes of stream water connote not only spatially in-
tegrated but also temporally integrated isotope signals of pre-
cipitation and provide a framework for addressing applied
hydrological, ecological, or meteorological research ques-
tions at regional scales, such as the effects of climate change.
1 Introduction
The importance of isoscapes, that is, the mapping of large-
scale spatiotemporal distributions of stable isotope compo-
sitions in various environments (West et al., 2010), is be-
ing recognized as providing a framework for fundamental
and applied research questions in a wide range of fields at
large scales. The Global Network for Isotopes in Precipita-
tion (GNIP) database has been applied, for example, to mon-
itor climate-change impacts on the character and intensity
of precipitation (Aggarwal et al., 2012) and to build glob-
ally predictive GIS-based models for precipitation isoscapes
(e.g., www.waterisotopes.org).
Wassenaar et al. (2009) pointed out, however, that the
GNIP stations are often spatially deficient for many regions
that are of interest to hydrologists as well as ecologists. For
example, Wassenaar et al. (2009) mentioned that Mexico has
only two GNIP stations. Moreover, Japan had also only two
stations and, unfortunately, both stations in Japan were al-
ready closed. In addition, long-term monitoring of precipi-
tation is also required. Consequently, the ground validation
data for these global models are insufficient to compare at
regional or country-wide scales. Under the circumstances,
Wassenaar et al. (2009) hypothesized that the stable iso-
topic composition of surface water or groundwater, which
integrates longer-term precipitation inputs (Clark and Fritz,
1997), can be a proxy for precipitation infiltration input. In-
deed, some research has been undertaken regarding nation-
wide surface-water and groundwater isoscapes and uses them
Published by Copernicus Publications on behalf of the European Geosciences Union.
1578 M. Katsuyama et al.: Spatial distribution of oxygen-18 and deuterium in stream waters
as an indicator of the precipitation isoscape (e.g., the British
Isles: Darling et al., 2003; the United States: Kendall and
Coplen, 2001; Finland: Kortelainen and Karhu, 2004; Mex-
ico: Wassenaar et al., 2009). Although Mizota and Kusak-
abe (1994) have already presented the spatial distribution of
stable isotope compositions of surface water in Japan, they
do not discuss the mechanisms underlying the distribution.
In other words, it is insufficient to test the hypothesis re-
garding the isotope signals of precipitation input being spa-
tially and temporally integrated in the stream water output.
Global warming will dramatically change the hydrological
responses of watersheds. These changes of the hydrological
responses are driven by temperature and precipitation pat-
terns that will affect the temporal and spatial distributions of
river source water over time (Marshall and Randhir, 2008).
Therefore, the linkage between the precipitation and surface
water at each point in time should be clarified because sur-
face water is the most important water resource. At finer
scales, the temporal variation in the stable isotope signals of
precipitation and stream water have been used to estimate
the mean residence time of stream water within catchments
(McGuire and McDonnell, 2006; Dunn et al., 2008; Tetzlaff
et al., 2011); however, few studies have been conducted in
Japan (e.g., Katsuyama et al., 2010). The results of these es-
timates may change due to future changes in the hydrological
responses of the watershed. Therefore, the establishment of
a nation-wide and spatially dense stream water isotope net-
work for Japan, which has a wide range of climatic and ge-
ographical conditions over a small area, may provide spatial
isotope information fundamental for the application of iso-
topes in hydrological studies.
Here we present the stream water δ18O and δ2H isoscapes
of the Japanese archipelago and provide multivariate regres-
sion analyses using key environmental and geographical pa-
rameters to determine which variables are the key drivers of
stream water isotopic patterns. The identification of key pa-
rameters is essential in evaluating the vulnerability of hy-
drological responses in the watershed to climate change.
Moreover, by comparing the data with existing precipitation-
isotope data, we consider the advantage of using stream wa-
ter isoscapes as an integrated indicator of precipitation for
future isotopic hydrology studies.
2 Methods
2.1 Stream water sampling and measurement
The sampling campaign Japan-Wide Stream Monitoring
(JWSM) 2003 (Konohira et al., 2006) was conducted during
the summer, from 1 July to 11 October of 2003, by 11 re-
searchers. All samples were collected from forested headwa-
ter streams to avoid the influence of anthropogenic impacts
such as agriculture or urban effects. We selected the potential
sampling points where the whole catchment was covered by
forest on the road map before the sampling, and verified the
inexistence of artificial pollution source such as dams, houses
and/or farmlands, and properly changed the points in the field
to avoid the effects of them. There were no lakes, swaps, hot
springs or other water bodies which could affect the isotope
values in each catchment. The sampling points covered 45
prefectures; only two prefectures, Chiba and Okinawa, were
excluded from the campaign. Samples were collected from
approximately 30 catchments in each prefecture and, finally,
1278 forested headwater catchments were selected (Fig. 1).
The catchment areas ranged from 0.05 to 136.8 km2 and were
5.3 km2 on average. In total, 95.3 % of the catchments were
smaller than 15 km2. The sampling procedures were unified
between all 11 researchers prior to sampling. During the
campaign, grab samples of stream water were collected once
in each catchment. As the values can be affected by precipita-
tion, we collected the samples during baseflow condition and
avoided to sample during and just after the precipitation to
unify the collection conditions as much as possible between
sites. The collected samples were immediately filtered and
preserved by freezing in polycarbonate bottles at −10◦ until
analyzed in 2008.
The stream water samples were analyzed for both δ18O
and δ2H by the Colorado Plateau Stable Isotope Laboratory
using an Off-Axis Integrated Cavity Output Spectroscopy
liquid water isotope analyzer (Los Gatos Model 908-0008).
The measurement precision (standard deviation) was±0.2 %
and ±0.8 % for δ18O and δ2H, respectively.
2.2 Isotope data on precipitation and climate
conditions
We collected isotope data on precipitation from the published
literature and unpublished data kindly offered by many re-
searchers, in addition to our original data. The policy for col-
lecting data was that both δ18O and δ2H were to be mea-
sured monthly or more frequently for over 1 year to calcu-
late the mean annual weighted value of the successive pre-
cipitation inputs. The data were collected from 14 prefec-
tures (Fig. 1 and Table 1). In three of these prefectures, Shiga
(no. 6 in Fig. 1), Nara (8), and Tottori (9), the precipitation
sampling has been continuous. In Shiga, the monitoring be-
gan in 1997 at the Kiryu Experimental Watershed (Kabeya et
al., 2007; Katsuyama et al., 2010). Sampling began in 2004 at
the Mt. Gomadan Experimental Forest in Nara (Katsuyama
et al., 2008; Fukushima and Tokuchi, 2009), and in 2011 at
the Hiruzen Experimental Forest of Tottori University (Haga
and Katsuyama, unpublished data). The Hiruzen Forest is lo-
cated on the Okayama side of the Okayama–Tottori prefec-
tural border and the samples were collected from the moun-
tain peak. Therefore, we term this station Tottori to clearly
distinguish it from Okayama (10). At these three stations, the
corresponding stream water sampling has also been contin-
uous at the outlet of each catchment. The catchment area is
5.99 ha for Shiga, 3.15 ha for Nara, and 5.9 ha for Tottori.
Hydrol. Earth Syst. Sci., 19, 1577–1588, 2015 www.hydrol-earth-syst-sci.net/19/1577/2015/
M. Katsuyama et al.: Spatial distribution of oxygen-18 and deuterium in stream waters 1579
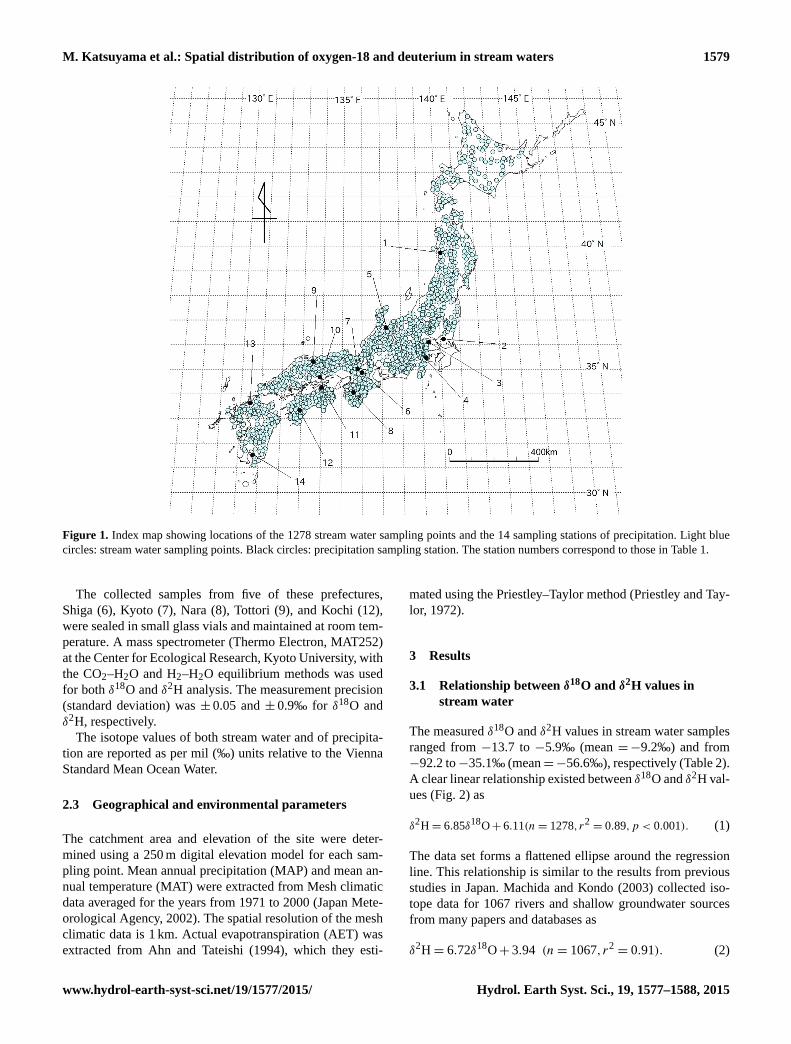
Figure 1. Index map showing locations of the 1278 stream water sampling points and the 14 sampling stations of precipitation. Light blue
circles: stream water sampling points. Black circles: precipitation sampling station. The station numbers correspond to those in Table 1.
The collected samples from five of these prefectures,
Shiga (6), Kyoto (7), Nara (8), Tottori (9), and Kochi (12),
were sealed in small glass vials and maintained at room tem-
perature. A mass spectrometer (Thermo Electron, MAT252)
at the Center for Ecological Research, Kyoto University, with
the CO2–H2O and H2–H2O equilibrium methods was used
for both δ18O and δ2H analysis. The measurement precision
(standard deviation) was ± 0.05 and ± 0.9‰ for δ18O and
δ2H, respectively.
The isotope values of both stream water and of precipita-
tion are reported as per mil (‰) units relative to the Vienna
Standard Mean Ocean Water.
2.3 Geographical and environmental parameters
The catchment area and elevation of the site were deter-
mined using a 250 m digital elevation model for each sam-
pling point. Mean annual precipitation (MAP) and mean an-
nual temperature (MAT) were extracted from Mesh climatic
data averaged for the years from 1971 to 2000 (Japan Mete-
orological Agency, 2002). The spatial resolution of the mesh
climatic data is 1 km. Actual evapotranspiration (AET) was
extracted from Ahn and Tateishi (1994), which they esti-
mated using the Priestley–Taylor method (Priestley and Tay-
lor, 1972).
3 Results
3.1 Relationship between δ18O and δ2H values in
stream water
The measured δ18O and δ2H values in stream water samples
ranged from −13.7 to −5.9‰ (mean =−9.2‰) and from
−92.2 to−35.1‰ (mean=−56.6‰), respectively (Table 2).
A clear linear relationship existed between δ18O and δ2H val-
ues (Fig. 2) as
δ2H= 6.85δ18O+ 6.11(n= 1278, r2= 0.89,p < 0.001). (1)
The data set forms a flattened ellipse around the regression
line. This relationship is similar to the results from previous
studies in Japan. Machida and Kondo (2003) collected iso-
tope data for 1067 rivers and shallow groundwater sources
from many papers and databases as
δ2H= 6.72δ18O+ 3.94 (n= 1067, r2= 0.91). (2)
www.hydrol-earth-syst-sci.net/19/1577/2015/ Hydrol. Earth Syst. Sci., 19, 1577–1588, 2015

1580 M. Katsuyama et al.: Spatial distribution of oxygen-18 and deuterium in stream waters
Tab
le1.C
om
pariso
no
fd
-excess
valu
esb
etween
precip
itation
and
streamw
ater.
Statio
nP
refecture
Sam
plin
glo
cation
d-ex
cess(‰
)b
Data
source
of
Referen
ceof
Rem
arks
of
precip
itation
aprecip
itation
d-ex
cesssite
descrip
tion
No.
Sid
eS
iteM
AT
Latitu
de
NL
ongitu
de
EP
recipitatio
nS
treamw
ater
1A
kita
JA
kita
Univ.
11.7
39.7
140.1
17.0
20.3
Kaw
araya
etal.
(2005)
c,d
2Ib
araki
PM
t.T
sukuba
9.7
36.2
140.1
12.0
13.6
Yab
usak
iet
al.(2
008)
3S
aitama
PR
issho
Univ.
15.0
36.1
139.4
13.6
12.9
Yab
usak
i(2
010)
c
4K
anag
awa
PO
obora
watersh
eds,
Tan
zawa
Mountain
s15.1
35.5
139.2
13.3
14.0
Oda
(unpub.)
Oda
etal.
(2013)
5T
oyam
aJ
Toyam
aC
ity14.1
36.7
137.2
15.4
19.6
Satak
eet
al.(1
984)
c,d
6S
hig
aJ
Kiry
uE
xp.W
atershed
13.5
34.9
136.0
13.8
20.3
Katsu
yam
a(u
npub.)
Katsu
yam
aet
al.(2
010)
7K
yoto
JK
yoto
Univ.
15.1
35.0
135.8
12.7
18.5
Katsu
yam
a(u
npub.)
8N
araP
Mt.
Gom
adan
Exp.F
orest
8.9
34.1
135.6
13.9
13.7
Katsu
yam
a(u
npub.)
Fukush
ima
and
Tokuch
i(2
009)
9T
otto
riJ
Hiru
zenE
xp.F
orest,
Totto
riU
niv.
10.5
35.3
133.6
18.7
21.7
Hag
aan
dK
atsuyam
a(u
npub.)
San
oet
al.(2
014)
10
Okay
ama
JO
kay
ama
Univ.
16.2
34.7
133.9
11.8
17.6
Yam
amoto
etal.
(1993)
c
11
Kag
awa
PT
akam
atsuC
ity16.3
34.3
134.0
11.3
12.3
Tase
etal.
(1997)
c
12
Koch
iP
Mt.
Tak
atori
13.1
33.3
133.0
13.7
13.8
Shin
om
iya
and
Sak
ai(u
npub.)
Shin
om
iya
and
Yosh
inag
a(2
008)
13
Fukuoka
JO
chozu
Experim
ental
Watersh
ed16.2
33.6
130.5
12.9
13.7
Asan
oan
dC
hiw
a(u
npub.)
Ide
etal.
(2009)
14
Kag
osh
ima
PT
akak
um
aE
xp.F
orest,
Kag
osh
ima
Univ.
14.6
31.5
130.8
14.6
14.5
Asan
oan
dT
ateno
(unpub.)
Jitouso
no
etal.
(2010)
aJ
and
Pm
eanS
eaof
Japan
side
and
Pacifi
cO
ceansid
e,resp
ectively,
and
MA
Tm
eans
mean
annual
temperatu
re.b
The
d-ex
cessvalu
esfo
rprecip
itation
arean
nual
weig
hted
mean
sw
ithth
eam
ount
of
precip
itation
for
1year,
and
the
valu
esfo
rstream
water
areth
earith
metic
mean
sof
alldata
ineach
prefectu
re.c
Meteo
rolo
gical
data
arefro
mth
enearest
observ
ation
station
by
the
Japan
Meteo
rolo
gical
Agen
cy(A
MeD
AS
).d
The
d-ex
cessof
precip
itation
areex
tractedby
us
from
the
orig
inal
pap
ers.
-100
-90
-80
-70
-60
-50
-40
-30
count
400350300250200150100500
δ18
O(‰)
Figure 2. Relationship between δ18O and δ2H values and their fre-
quency distributions in stream water.
Moreover, they recalculated the data for surface water
and shallow groundwater presented by Mizota and Kusak-
abe (1994) as
δ2H= 7.03δ18O+ 7.91 (n= 298, r2= 0.93). (3)
Both the slope and the intercept of Eq. (1) are intermedi-
ate compared to those of Eqs. (2) and (3). The numbers of
sampling points in this study exceeded those in Mizota and
Kusakabe (1994) and Machida and Kondo (2003). However,
the data presented in these previous studies were collected
from samples in different years and seasons. On the other
hand, the data we present here was systematically collected
within a few months of the same year. Generally, surface
waters show very limited isotopic seasonality compared to
precipitation, due to leveling during infiltration and water
movement processes within catchments. Therefore, Eq. (1)
will produce a more reliable general relationship between the
δ18O and δ2H of stream water in Japan.
The data are grouped into 10 regions and the linear re-
gressions are applied to each region (Table 2). The regional
division used followed that of the Japanese Meteorological
Agency used for weather forecasts (see Fig. 3 for the loca-
tions of each region). The regressions for individual regions
had a range of slopes and intercepts. For example, Kinki (F)
– and Chugoku (G) regions had small slopes and intercepts,
although the r2 values were low. The data from these two
regions, especially from Chugoku, had a relatively narrow
range of δ values and were plotted on the upper region of
the data ellipse (Fig. 2). The regression lines vary strongly
even within each prefecture in the Kinki and Chugoku re-
Hydrol. Earth Syst. Sci., 19, 1577–1588, 2015 www.hydrol-earth-syst-sci.net/19/1577/2015/

M. Katsuyama et al.: Spatial distribution of oxygen-18 and deuterium in stream waters 1581
Table 2. Range of δ18O and δ2H values in stream water samples and liner regressions for each region.
Region∗ n δ18O δ2H Slope Intercept r2
max. min. max. min.
A Hokkaido 94 −9.0 −13.7 −54.7 −92.2 6.94 6.79 0.87
B Tohoku 167 −7.6 −12.7 −47.9 −79.9 6.27 1.73 0.84
C Kanto-Koshin 226 −7.1 −13.1 −46.1 −89.2 7.07 4.50 0.93
D Hokuriku 124 −7.8 −13.2 −43.7 −87.9 7.76 19.38 0.90
E Toukai 105 −6.8 −12.4 −38.6 −80.1 6.57 3.20 0.96
F Kinki 175 −6.3 −9.9 −37.7 −62.0 5.15 −6.96 0.62
G Chugoku 117 −7.5 −10.1 −44.6 −56.1 2.96 −25.59 0.40
H Shikoku 111 −6.1 −9.8 −35.1 −63.2 8.02 13.91 0.93
I Northern Kyushu 119 −5.9 −9.0 −38.0 −56.7 6.27 0.31 0.87
J Southern Kyushu 40 −6.4 −8.6 −38.3 −56.3 6.80 4.84 0.73
National 1278 −5.9 −13.7 −35.1 −92.2 6.85 6.11 0.89
∗ Regional division is shown in Fig. 3.
Figure 3. Topography of the Japanese archipelago and index of regional division. Note the regional division is shown in Table 2. The base
map is from: http://en.wikipedia.org/wiki/File:Japan_topo_en.jpg.
gions (not shown). The slopes of these lines were relatively
smaller at the prefectures of the Sea of Japan side – e.g.,
Shiga (1.9), Kyoto (4.5), Hyogo (3.5), Tottori (5.2), Shi-
mane (2.3) – compared to the prefectures of the Pacific Ocean
side, e.g., Nara (6.5) and Wakayama (6.8). These facts may
imply that there are plural potential regression lines within
the data ellipse at each region as results of the contribution
from different moisture sources. To find the final solution of
www.hydrol-earth-syst-sci.net/19/1577/2015/ Hydrol. Earth Syst. Sci., 19, 1577–1588, 2015
1582 M. Katsuyama et al.: Spatial distribution of oxygen-18 and deuterium in stream waters
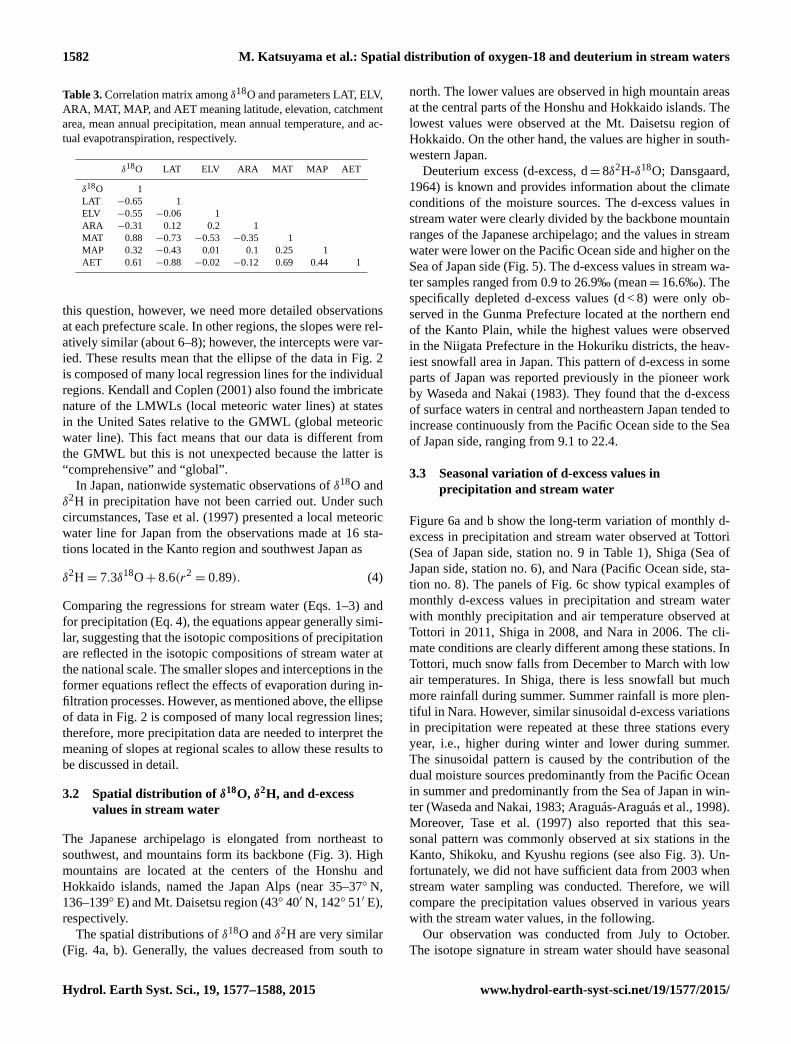
Table 3. Correlation matrix among δ18O and parameters LAT, ELV,
ARA, MAT, MAP, and AET meaning latitude, elevation, catchment
area, mean annual precipitation, mean annual temperature, and ac-
tual evapotranspiration, respectively.
δ18O LAT ELV ARA MAT MAP AET
δ18O 1
LAT −0.65 1
ELV −0.55 −0.06 1
ARA −0.31 0.12 0.2 1
MAT 0.88 −0.73 −0.53 −0.35 1
MAP 0.32 −0.43 0.01 0.1 0.25 1
AET 0.61 −0.88 −0.02 −0.12 0.69 0.44 1
this question, however, we need more detailed observations
at each prefecture scale. In other regions, the slopes were rel-
atively similar (about 6–8); however, the intercepts were var-
ied. These results mean that the ellipse of the data in Fig. 2
is composed of many local regression lines for the individual
regions. Kendall and Coplen (2001) also found the imbricate
nature of the LMWLs (local meteoric water lines) at states
in the United Sates relative to the GMWL (global meteoric
water line). This fact means that our data is different from
the GMWL but this is not unexpected because the latter is
“comprehensive” and “global”.
In Japan, nationwide systematic observations of δ18O and
δ2H in precipitation have not been carried out. Under such
circumstances, Tase et al. (1997) presented a local meteoric
water line for Japan from the observations made at 16 sta-
tions located in the Kanto region and southwest Japan as
δ2H= 7.3δ18O+ 8.6(r2= 0.89). (4)
Comparing the regressions for stream water (Eqs. 1–3) and
for precipitation (Eq. 4), the equations appear generally simi-
lar, suggesting that the isotopic compositions of precipitation
are reflected in the isotopic compositions of stream water at
the national scale. The smaller slopes and interceptions in the
former equations reflect the effects of evaporation during in-
filtration processes. However, as mentioned above, the ellipse
of data in Fig. 2 is composed of many local regression lines;
therefore, more precipitation data are needed to interpret the
meaning of slopes at regional scales to allow these results to
be discussed in detail.
3.2 Spatial distribution of δ18O, δ2H, and d-excess
values in stream water
The Japanese archipelago is elongated from northeast to
southwest, and mountains form its backbone (Fig. 3). High
mountains are located at the centers of the Honshu and
Hokkaido islands, named the Japan Alps (near 35–37◦ N,
136–139◦ E) and Mt. Daisetsu region (43◦ 40′ N, 142◦ 51′ E),
respectively.
The spatial distributions of δ18O and δ2H are very similar
(Fig. 4a, b). Generally, the values decreased from south to
north. The lower values are observed in high mountain areas
at the central parts of the Honshu and Hokkaido islands. The
lowest values were observed at the Mt. Daisetsu region of
Hokkaido. On the other hand, the values are higher in south-
western Japan.
Deuterium excess (d-excess, d= 8δ2H-δ18O; Dansgaard,
1964) is known and provides information about the climate
conditions of the moisture sources. The d-excess values in
stream water were clearly divided by the backbone mountain
ranges of the Japanese archipelago; and the values in stream
water were lower on the Pacific Ocean side and higher on the
Sea of Japan side (Fig. 5). The d-excess values in stream wa-
ter samples ranged from 0.9 to 26.9‰ (mean= 16.6‰). The
specifically depleted d-excess values (d < 8) were only ob-
served in the Gunma Prefecture located at the northern end
of the Kanto Plain, while the highest values were observed
in the Niigata Prefecture in the Hokuriku districts, the heav-
iest snowfall area in Japan. This pattern of d-excess in some
parts of Japan was reported previously in the pioneer work
by Waseda and Nakai (1983). They found that the d-excess
of surface waters in central and northeastern Japan tended to
increase continuously from the Pacific Ocean side to the Sea
of Japan side, ranging from 9.1 to 22.4.
3.3 Seasonal variation of d-excess values in
precipitation and stream water
Figure 6a and b show the long-term variation of monthly d-
excess in precipitation and stream water observed at Tottori
(Sea of Japan side, station no. 9 in Table 1), Shiga (Sea of
Japan side, station no. 6), and Nara (Pacific Ocean side, sta-
tion no. 8). The panels of Fig. 6c show typical examples of
monthly d-excess values in precipitation and stream water
with monthly precipitation and air temperature observed at
Tottori in 2011, Shiga in 2008, and Nara in 2006. The cli-
mate conditions are clearly different among these stations. In
Tottori, much snow falls from December to March with low
air temperatures. In Shiga, there is less snowfall but much
more rainfall during summer. Summer rainfall is more plen-
tiful in Nara. However, similar sinusoidal d-excess variations
in precipitation were repeated at these three stations every
year, i.e., higher during winter and lower during summer.
The sinusoidal pattern is caused by the contribution of the
dual moisture sources predominantly from the Pacific Ocean
in summer and predominantly from the Sea of Japan in win-
ter (Waseda and Nakai, 1983; Araguás-Araguás et al., 1998).
Moreover, Tase et al. (1997) also reported that this sea-
sonal pattern was commonly observed at six stations in the
Kanto, Shikoku, and Kyushu regions (see also Fig. 3). Un-
fortunately, we did not have sufficient data from 2003 when
stream water sampling was conducted. Therefore, we will
compare the precipitation values observed in various years
with the stream water values, in the following.
Our observation was conducted from July to October.
The isotope signature in stream water should have seasonal
Hydrol. Earth Syst. Sci., 19, 1577–1588, 2015 www.hydrol-earth-syst-sci.net/19/1577/2015/

M. Katsuyama et al.: Spatial distribution of oxygen-18 and deuterium in stream waters 1583
Figure 4. Spatial distribution of (a) δ18O (left panel) and (b) δ2H (right panel) values in stream water.
Figure 5. Spatial distribution of d-excess values in stream water.
variation and the samples may be biased depending on the
date they were taken to some extent. However, as shown in
Fig. 6b, the seasonality in stream water is clearly dampened
compared to that in precipitation (Fig. 6a) in all stations. The
coefficient of variation (CV) calculated with the 1-year data
(Fig. 6c) for precipitation and stream water in each site were
compared. The CV for precipitation and stream water were
0.50 and 0.09 in Tottori, 0.43 and 0.07 in Shiga, and 0.62
1 2 3 4 5 6 7 8 9 101112-5
0
5
10
15
20
25
30
Air T
em
p. (℃
)
0
10
20
30
40
50
d-e
xce
ss(‰
)
1 2 3 4 5 6 7 8 9 101112
Month
0
10
20
30
40
50Shiga Nara Tottori
Shiga (2008)
Nara(2006)
0
10
20
30
40
5020092006 20082003 20112005 2007 2010 20122004
Precipitation
Streamwater
Air Temperature○Precipitationstream water d-excess
◆Precipitation d-excess
(a)
(b)
Pre
cipita
tio
n (
mm
/mo
nth
)
1 2 3 4 5 6 7 8 9 1011120
100
200
300
400
500
600Tottori(2011)
(c)
Figure 6. Seasonal variations of d-excess values in precipitation and
stream water. (a) Long-term variation of monthly d-excess in pre-
cipitation. (b) Long-term variation of monthly d-excess in precipita-
tion. (c) Typical examples of monthly d-excess values with monthly
precipitation and air temperature.
and 0.14 in Nara. The CVs calculated with the data from July
to October for precipitation and stream water were 0.16 and
0.07 in Tottori, 0.27 and 0.03 in Shiga, and 0.48 and 0.07 in
Nara. Certainly, we cannot consider the seasonality in stream
water for all of our sampling; however, these values imply
that the samples are less biased depending on the date they
were taken compared to the seasonality in precipitation.
The damping of the seasonality in stream water is a result
of the hydrological processes within the catchment. The sea-
sonality of d-excess values is sometimes used to estimate the
water residence (and transit) times (Kabeya et al., 2007; Lee
www.hydrol-earth-syst-sci.net/19/1577/2015/ Hydrol. Earth Syst. Sci., 19, 1577–1588, 2015
1584 M. Katsuyama et al.: Spatial distribution of oxygen-18 and deuterium in stream waters
0 500 1000 1500 2000
Elevation (m)
δ18O = -0.0028ELV -8.0
r2 = 0.30, p<0.001
-15
-13
-11
-9
-7
-5
0 20 40 60 80 100 120 140
(e) (f)
Catchment Area (km2)
δ18O = -0.067ARA - 8.8
r2 = 0.10, p<0.001
-15
-13
-11
-9
-7
-5
0 2 4 6 8 10 12 14 16
Mean Annual Air Temp. (deg.C)
(a)
δ18O = 0.44MAT - 13.5
r2 = 0.77, p<0.001
0 1000 2000 3000 4000 5000
Mean Annual Prep. (mm)
(b)
δ18O = 0.0008MAP-10.8
r2 = 0.10, p<0.001-15
-13
-11
-9
-7
-5
0 300 600 900 1200 1500
AET (mm)
(c)
δ18O = 0.0067AET -14.8
r2 = 0.37, p<0.001
-15
-13
-11
-9
-7
-5
30 32 34 36 38 40 42 44 46
Latitude
(d) δ18O = -0.35LAT + 3.4
r2 = 0.43, p<0.001
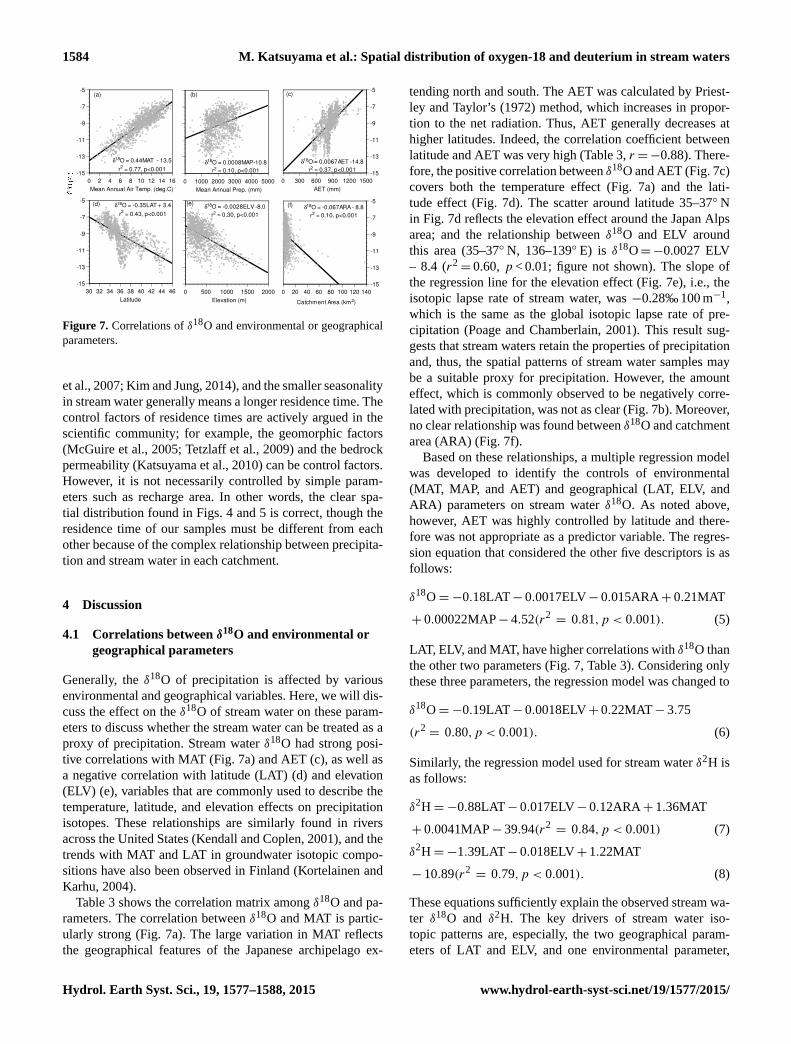
Figure 7. Correlations of δ18O and environmental or geographical
parameters.
et al., 2007; Kim and Jung, 2014), and the smaller seasonality
in stream water generally means a longer residence time. The
control factors of residence times are actively argued in the
scientific community; for example, the geomorphic factors
(McGuire et al., 2005; Tetzlaff et al., 2009) and the bedrock
permeability (Katsuyama et al., 2010) can be control factors.
However, it is not necessarily controlled by simple param-
eters such as recharge area. In other words, the clear spa-
tial distribution found in Figs. 4 and 5 is correct, though the
residence time of our samples must be different from each
other because of the complex relationship between precipita-
tion and stream water in each catchment.
4 Discussion
4.1 Correlations between δ18O and environmental or
geographical parameters
Generally, the δ18O of precipitation is affected by various
environmental and geographical variables. Here, we will dis-
cuss the effect on the δ18O of stream water on these param-
eters to discuss whether the stream water can be treated as a
proxy of precipitation. Stream water δ18O had strong posi-
tive correlations with MAT (Fig. 7a) and AET (c), as well as
a negative correlation with latitude (LAT) (d) and elevation
(ELV) (e), variables that are commonly used to describe the
temperature, latitude, and elevation effects on precipitation
isotopes. These relationships are similarly found in rivers
across the United States (Kendall and Coplen, 2001), and the
trends with MAT and LAT in groundwater isotopic compo-
sitions have also been observed in Finland (Kortelainen and
Karhu, 2004).
Table 3 shows the correlation matrix among δ18O and pa-
rameters. The correlation between δ18O and MAT is partic-
ularly strong (Fig. 7a). The large variation in MAT reflects
the geographical features of the Japanese archipelago ex-
tending north and south. The AET was calculated by Priest-
ley and Taylor’s (1972) method, which increases in propor-
tion to the net radiation. Thus, AET generally decreases at
higher latitudes. Indeed, the correlation coefficient between
latitude and AET was very high (Table 3, r =−0.88). There-
fore, the positive correlation between δ18O and AET (Fig. 7c)
covers both the temperature effect (Fig. 7a) and the lati-
tude effect (Fig. 7d). The scatter around latitude 35–37◦ N
in Fig. 7d reflects the elevation effect around the Japan Alps
area; and the relationship between δ18O and ELV around
this area (35–37◦ N, 136–139◦ E) is δ18O=−0.0027 ELV
– 8.4 (r2= 0.60, p < 0.01; figure not shown). The slope of
the regression line for the elevation effect (Fig. 7e), i.e., the
isotopic lapse rate of stream water, was −0.28‰ 100 m−1,
which is the same as the global isotopic lapse rate of pre-
cipitation (Poage and Chamberlain, 2001). This result sug-
gests that stream waters retain the properties of precipitation
and, thus, the spatial patterns of stream water samples may
be a suitable proxy for precipitation. However, the amount
effect, which is commonly observed to be negatively corre-
lated with precipitation, was not as clear (Fig. 7b). Moreover,
no clear relationship was found between δ18O and catchment
area (ARA) (Fig. 7f).
Based on these relationships, a multiple regression model
was developed to identify the controls of environmental
(MAT, MAP, and AET) and geographical (LAT, ELV, and
ARA) parameters on stream water δ18O. As noted above,
however, AET was highly controlled by latitude and there-
fore was not appropriate as a predictor variable. The regres-
sion equation that considered the other five descriptors is as
follows:
δ18O=−0.18LAT− 0.0017ELV− 0.015ARA+ 0.21MAT
+ 0.00022MAP− 4.52(r2= 0.81,p < 0.001). (5)
LAT, ELV, and MAT, have higher correlations with δ18O than
the other two parameters (Fig. 7, Table 3). Considering only
these three parameters, the regression model was changed to
δ18O=−0.19LAT− 0.0018ELV+ 0.22MAT− 3.75
(r2= 0.80,p < 0.001). (6)
Similarly, the regression model used for stream water δ2H is
as follows:
δ2H=−0.88LAT− 0.017ELV− 0.12ARA+ 1.36MAT
+ 0.0041MAP− 39.94(r2= 0.84,p < 0.001) (7)
δ2H=−1.39LAT− 0.018ELV+ 1.22MAT
− 10.89(r2= 0.79,p < 0.001). (8)
These equations sufficiently explain the observed stream wa-
ter δ18O and δ2H. The key drivers of stream water iso-
topic patterns are, especially, the two geographical param-
eters of LAT and ELV, and one environmental parameter,
Hydrol. Earth Syst. Sci., 19, 1577–1588, 2015 www.hydrol-earth-syst-sci.net/19/1577/2015/
M. Katsuyama et al.: Spatial distribution of oxygen-18 and deuterium in stream waters 1585
MAT. Wassenaar et al. (2009) mentioned that the regression
model approach is suitable for other countries and regions in
which GNIP stations are lacking. The observed and predicted
data can be linked to other investigations, such as of eco-
logical and forensic isotope applications (Wassenaar et al.,
2009; Bowen et al., 2009, 2011). Therefore, the stream water
isotopic compositions in Japan predicted by these equations
are applicable to other disciplines in addition to hydrological
studies.
4.2 Comparison of d-excess values in rainwater and
stream water
A comparison of isotopic composition with precipitation on
a regional scale showed the connection between the source
water of the stream and the meteoric input signal (Clark and
Fritz, 1997; Dutton et al., 2005). Table 1 shows the compari-
son of d-excess values between precipitation and stream wa-
ter. On the Pacific Ocean side, the d-excess values of precipi-
tation and stream water were nearly equal: the difference was
less than 1‰. On the Kanto Plain (stations 2, 3, and 4), the
values were very close. On the Sea of Japan side, however,
the values of stream water were clearly higher than those of
precipitation, with a difference of more than 3‰, except in
the Fukuoka Prefecture. These results mean that seasonal bi-
ases exist to recharge on the Sea of Japan side. Compared
to the Pacific Ocean side, the Sea of Japan side experiences
a great deal of snowfall, and the d-excess of meteoric input
was higher in winter (Fig. 6a, c). Thus, the water recharge
from late snowmelt may have affected summer stream water,
even though our stream water sampling was conducted dur-
ing the summer (from July to October). Fukuoka Prefecture,
an exception, is located on Kyushu Island and has a warm
climate with less snowfall. Thus, the d-excess of the precipi-
tation and of the stream water was similar. Therefore, in par-
ticular on the Sea of Japan side, we must take into account
the winter snowpack and spring snowmelt when considering
the recharge processes of the stream. The highest d-excess
of precipitation was observed in the Tottori Prefecture facing
the Sea of Japan. The precipitation samples were collected at
the border of the Tottori and Okayama prefectures (Haga and
Katsuyama, unpublished data), and snowmelt recharges the
stream water in both prefectures. Therefore, as Yamamoto et
al. (1993) pointed out, the d-excess of the stream water in the
Okayama Prefecture was relatively high (Table 1).
Evaporation during the infiltration processes also affect the
d-excess value. The d-excess value will be depleted when
the effects of evaporation are larger. Evaporation from a for-
est consists of canopy interception loss and evapotranspira-
tion from the forest floor. In our result (Fig. 5), the d-excess
value is higher at the Sea of Japan side. Kondo et al. (1992)
showed that the canopy interception was larger at the Sea of
Japan side compared to the Pacific Ocean side because the
canopy interception was positively correlated with the num-
ber of precipitation days in both coniferous and broadleaf for-
est (Kondo et al., 1992; Komatsu et al., 2008), and the num-
ber was larger at the Sea of Japan side (Kondo et al., 1992).
Thus, the canopy interception can make the d-excess values
lower at the Sea of Japan side. On the other hand, the evapo-
ration from forest floor estimated in Japan is generally small
and negligible. For example, Tsujimura and Tanaka (1998)
estimated the value as 2 % of annual precipitation in cen-
tral Japan. Kubota and Tsuboyama (2004) showed the values
were below 10 % of annual throughfall in both mature and
young forests in Kanto region. These effects of evaporation
may be reflected in the smaller slopes and interceptions in the
regression for stream water (Eq. 1) than in the regression for
precipitation (Eq. 4). However, even the effects of the evapo-
ration, especially of the canopy interception, are considered,
the difference of d-excess values at the Sea of Japan side and
at the Pacific Ocean side is clear. This fact also supports that
the difference is highly controlled by the recharge process in
each region.
The comparison of d-excess values in precipitation with
stream water demonstrates that although meteoric water
has relatively spatially homogeneous isotopic compositions
(Tase et al., 1997), the recharged stream water does not nec-
essarily reflect the pattern of the meteoric water. The de-
layed contribution of snowmelt controlled the isotopic com-
positions of stream water in snowy regions. As there is no
clear relationship between the catchment areas or elevation
with d-excess values (figures not shown), the difference in
the elevation of the actual stream water recharge area cannot
be the case of differences in d-excess signatures. Moreover,
the mean residence time of stream water is not controlled by
catchment size (e.g., Tetzlaff et al., 2009; Katsuyama et al.,
2010); therefore, the delayed contribution of snowmelt is not
controlled by geographical parameters. To discuss this more
directly, we need a nationwide systematic data set of isotopic
compositions in precipitation. Tase et al. (1997) reported the
only example of such observation. However, unfortunately,
their stations were mainly located on the Pacific Ocean side,
and no stations existed in the northern part of Japan, i.e.,
the snowy regions of Tohoku and Hokkaido. The precipi-
tation isoscapes of the world (e.g., Bowen and Revenaugh,
2003; van der Veer et al., 2009) exactly cover the Japanese
archipelago and we can compare our data with their inter-
polated data product. However, these studies by Bowen and
Revenaugh (2003) and van der Veer et al. (2009) are based
on the GNIP data. As Wassenaar et al. (2009) pointed out, the
GNIP stations are often spatially deficient. There were only
2 stations in Japan, and both stations were already closed.
Therefore, the GNIP data is insufficient at the small country
scale such as for Japan, even if the interpolation method is
perfect. Our results may fill the spatial gaps in previous stud-
ies. In other words, although comprising only one episode of
sampling, our nationwide systematic data set of stream water
with higher spatial density (Figs. 1, 4, 5) reveals not only spa-
tially integrated but also temporally integrated isotope sig-
nals of precipitation, and the stream water d-excess values
www.hydrol-earth-syst-sci.net/19/1577/2015/ Hydrol. Earth Syst. Sci., 19, 1577–1588, 2015
1586 M. Katsuyama et al.: Spatial distribution of oxygen-18 and deuterium in stream waters
reflect the dampening of precipitation input, i.e., the differ-
ences in rainfall–runoff dynamics among the catchments.
4.3 Vulnerability of water resources to global Warming
As discussed above, winter snowfall recharges summer
stream water at the Sea of Japan side, which experiences a
great deal of snowfall. This result means that the summer
water supply in this region is highly dependent on winter
snowfall. Brooks et al. (2012) clarified that the water sources
during summer depend on winter snow accumulated in the
mountains in western Oregon and pointed out the vulnera-
bility of the system to the influences of a warming climate,
as snowpack volume is predicted to decline in the future. A
decrease in snowfall caused by global warming, and the con-
sequent vulnerability of water resources, are also predicted
to occur in Japan (Kazama et al., 2008). Moreover, mean
air temperature is an important environmental parameter in
determining the δ18O and δ2H values of stream water, as
shown in Eqs. (6) and (8). Global warming can also change
vegetation cover and evapotranspiration rates in the water-
shed, and the resulting amount of annual runoff (Gedney et
al., 2006). This implies that the importance of evapotran-
spiration rates as a control parameter will change over the
long term. Needless to say, transit times differ among stream
waters. Therefore, the isotopic signature of stream water re-
flects the history of precipitation in the catchment. In other
words, the isoscapes of stream water represent an integrated
reflection of the contribution of these environmental factors,
and of the past and present climatic conditions. Therefore,
this kind of research should be conducted continuously ev-
ery few decades because the effects of climate change will
be reflected in these isoscapes over time and can provide
information regarding changes in regional hydrological and
water-resource conditions.
5 Conclusions
The δ18O and δ2H isoscapes of stream water in Japan showed
clear spatial distributions which were effectively explained
by three parameters: latitude, elevation, and mean annual
temperature. These parameters are commonly known as con-
trol factors of the isotopes of precipitation. Therefore, our
data set is applicable, to some extent, as a proxy for the iso-
topic composition of precipitation in Japan. This result re-
flects the advantage and importance of isotope contents in
stream water at a national scale, because stream water is more
easily collectable than is precipitation. However, the compar-
ison of d-excess proved that the stream water d-excess val-
ues were biased toward the values of winter precipitation in
snowy regions, although our sampling campaign was con-
ducted during the summer. These results do not merely sig-
nify the importance of continuously observing precipitation
in snowy regions, but also warn us to discreetly use the tem-
poral variations in isotopic signals when estimating, for ex-
ample, rainfall–runoff processes and/or the mean residence
time of stream water. Isoscapes of stream water reflect the
recharge processes from source water and the distribution
of water resources. Therefore, this technique will provide
a valuable method for hydrological and ecological research,
and for predicting the impacts of climate change and estimat-
ing the vulnerability of water resources at the regional scale.
In particular, these results from Japan, a country with a wide
range of climatic and geographical conditions across a small
land area, represent a case study that will facilitate similar
studies in other regions.
The Supplement related to this article is available online
at doi:10.5194/hess-19-1577-2015-supplement.
Acknowledgements. We would like to thank all of the cooperators
of the JWSM 2003 program for their intensive field sampling, labo-
ratory work, and database creation. We also gratefully acknowledge
the many researchers who kindly offered unpublished precipitation
data. This work was conducted as part of a Research Project at
the Research Institute for Humanity and Nature (Environmental
Valuation Project), and partly supported by a Joint Usage/Research
Grant of the Center for Ecological Research, Kyoto University and
by JSPS KAKENHI grant number 25702020.
Edited by: C. Stumpp
References
Aggarwal, P. K., Alduchov, O. A., Froehlich, K. O., Araguas-
Araguas, L. J., Sturchio, N. C., and Kurita, N.: Stable isotopes
in global precipitation: A unified interpretation based on at-
mospheric moisture residence time, Geophys. Res. Lett., 39,
L11705, doi:10.1029/2012GL051937, 2012.
Ahn, C. and Tateishi, R.: Development of global 30-minute grid po-
tential evapotramspiration data set, J. Jpn. Soc. Photogr. Remote
Sens., 33, 12–21, 1994.
Araguás-Araguás, L., Froehlich, K., and Rozanski, K.: Stable iso-
tope composition of precipitation over southeast Asia, J. Geo-
phys. Res., 103, 28721–28742, 1998.
Bowen, G. J. and Revenaugh, J.: Interpolating the isotopic compo-
sition of modern meteoric precipitation, Water Resour. Res., 39,
1299, doi:10.1029/2003WR002086, 2003.
Bowen, G. J., West, J. B., Vaughn, B. H., Dawson, T. E., Ehleringer,
J. R., Fogel, M. I., Hobson, K., Hoogewerff, J., Kendall, C., Lai,
C.-T. Miller, C. C., Noone, D., Schwarcz, H., and Still, C. J.:
Isoscapes to Address Large-Scale Earth Science Challenges, Eos
Trans., 90, 109–116, 2009.
Bowen, G. J., Kennedy, C. D., Liu, Z., and Stalker, J.: Water bal-
ance model for mean annual hydrogen and oxygen isotope dis-
tributions in surface waters of the contiguous United States, J.
Geophys. Res., 116, G04011, doi:10.1029/2010JG001581, 2011.
Hydrol. Earth Syst. Sci., 19, 1577–1588, 2015 www.hydrol-earth-syst-sci.net/19/1577/2015/

M. Katsuyama et al.: Spatial distribution of oxygen-18 and deuterium in stream waters 1587
Brooks, J. R., Wigington, Jr., P. J., Phillips, D. L., Comeleo, R., and
Coulombe, R.: Willamette River Basin surface water isoscape
(δ18O and δ2H): temporal changes of source water within the
river, Ecosphere, 3, 1–21, 2012.
Clark, I. and Fritz, P.: Environmental Isotopes in Hydrogeology,
CRC Press, New York, 328 pp., 1997.
Dansgaard, W.: Stable isotopes in precipitation, Tellus, 16, 436–
468, 1964.
Darling, W. G., Bath, A. H., and Talbot, J. C.: The O and H stable
isotope composition of freshwaters in the British Isles. 2. Surface
waters and groundwater, Hydrol. Earth Syst. Sci., 7, 183–195,
doi:10.5194/hess-7-183-2003, 2003.
Dunn, S. M., Bacon, J. R., Soulsby, C., Tetzlaff, D., Stutter, M. I.,
Waldron, S., and Malcolm, I. A.: Interpretation of homogeneity
in δ18O signatures of stream water in a nested sub-catchment
system in north-east Scotland, Hydrol. Process., 22, 4767–4782,
2008.
Dutton, A., Wilkinson, B. H., Welker, J. M., Bowen, G. J., and
Lohmann, K. C.: Spatial distribution and seasonal variation in18O/16O of modern precipitation and river water across the con-
terminous USA, Hydrol. Process., 19, 4121–4146, 2005.
Fukushima, K. and Tokuchi, N.: Factors controlling the acid-
neutralizing capacity of Japanese cedar forest watersheds in
stands of various ages and topographic characteristics, Hydrol.
Process., 23, 259–271, doi:10.1002/hyp.7137, 2009.
Gedney, N., Cox, P. M., Betts, R. A., Boucher, O., Huntingford, C.,
and Stott, P. A.: Detection of a direct carbon dioxide effect in
continental river runoff records, Nature, 439, 835–838, 2006.
Ide, J., Kume, T., Wakiyama, Y., Higashi, N., Chiwa, M., and Ot-
suki, K.: Estimation of annual suspended sediment yield from
a Japanese cypress (Chamaecyparis obtusa) plantation consider-
ing antecedent rainfall, Forest Ecol. Manage., 257, 1955–1965,
doi:10.1016/j.foreco.2009.02.011, 2009.
Japan Meteorological Agency, Mesh Climatic Data 2000 (CD-
ROM), 2002.
Jitousono, T., Shimokawa, E., Teramoto, Y., Umata, H., and
Inokura, Y.: Temporal variation of flow regime during 25 years
in the forested catchment in the Takakuma Experimental Forest
of Kagoshima University, Research bulletin of the Kagoshima
University forests, 37, 115–127, (in Japanese with English sum-
mary), 2010.
Kabeya, N., Katsuyama, M., Kawasaki, M., Ohte, N., and Sugi-
moto, A.: Estimation of mean residence times of subsurface wa-
ters using seasonal variation in deuterium excess in a small head-
water catchment in Japan, Hydrol. Process., 21, 308–322, 2007.
Katsuyama, M., Fukushima, K., and Tokuchi, N.: Comparison of
rainfall-runoff characteristics in forested catchments underlain
by granitic and sedimentary rock with various forest age, Hydrol.
Res. Lett., 2, 14–17, 2008.
Katsuyama, M., Tani, M., and Nishimoto, S.: Connection be-
tween streamwater mean residence time and bedrock ground-
water recharge/discharge dynamics in weathered granite catch-
ments, Hydrol. Process., 24, 2287–2299, doi:10.1002/hyp.7741,
2010.
Kawaraya, H., Matsuda, H., and Matsubaya, O.: Identification of
discharge components by means of oxygen and hydrogen iso-
topic ratios and chloride and sulfate ion concentrations in a river
source region -A case study of Taihei river, Akita, Japan-, J. Jpn.
Soc. Hydrol. Water Resour., 18, 370–381, (in Japanese with En-
glish summary), 2005.
Kazama, S., Izumi, H., Sarukkalige, P. R., Nasu, T., and Sawamoto,
M.: Estimating snow distribution over a large area and its ap-
plication for water resources, Hydrol. Process., 22, 2315–2324,
2008.
Kendall, C. and Coplen, T. B.: Distribution of oxygen-18 and deu-
terium in river waters across the United States, Hydrol. Process.,
15, 1363–1393, doi:10.1002/hyp.217, 2001.
Kim, S. and Jung, S.: Estimation of mean water transit time on
a steep hillslope in South Korea using soil moisture measure-
ments and deuterium excess, Hydrol. Process., 28, 1844–1857,
doi:10.1002/hyp.9722, 2014.
Komatsu, H., Shinohara, Y., Kume, T., and Otsuki, K.: Relationship
between annual rainfall and interception ratio for forests across
Japan, Forest Ecol. Manage., 256, 1189–1197, 2008.
Kondo, J., Nakazono, M., and Watanabe, T.: Hydrological climate
in Japan (2) : Forest rainfall interception, J. Jpn. Soc. Hydrol.
Water Resour., 5, 29–36, 1992 (in Japanese with English sum-
mary).
Konohira, E., Shindo, J., Yoshioka, T., and Toda, T.: Stream water
chemistry in Japan, J. Jan. Assoc. Hydrol. Sci., 36, 146–149, (in
Japanese with English Summary), 2006.
Kortelainen, N. M. and Karhu, J. A.: Regional and seasonal trends in
the oxygen and hydrogen isotope ratios of Finnish groundwaters:
a key for mean annual precipitation, J. Hydrol., 285, 143–157,
doi:10.1016/j.jhydrol.2003.08.014, 2004.
Kubota, T. and Tsuboyama, Y.: Estimation of evaporation rate from
forest floor using oxygen-18 and deuterium compositions of
throughfall and stream water during a non-storm runoff periods,
J. For. Res., 9, 51–59, 2004.
Lee, K., Kim, J., Lee, D., Kim, Y., and Lee, D.: Analysis of water
movement through an unsaturated soil zone in Jeju Island, Korea
using stable oxygen and hydrogen isotopes, J. Hydrol., 345, 199–
211, doi:10.1016/j.jhydrol.2007.08.006, 2007.
Machida, I. and Kondoh, A.: Stable Isotope Ratios of Natural Wa-
ter in Japan – The Analysis by Using Environmental Isotopes
Database, J. Jpn. Soc. Hydrol. Water Resour., 16, 556–569, (in
Japanese with English Summary), 2003.
Marshall, E. and Randhir, T.: Effect of climate change on watershed
system: a regional analysis, Clim. Change, 89, 263–280, 2008.
McGuire, K. J. and McDonnell, J. J.: A review and evaluation of
catchment transit time modeling, J. Hydrol., 330, 543–563, 2006.
McGuire, K. J., McDonnell, J. J., Weiler, M., Kendall, C., McGlynn,
B. L., Welker, J. M., and Seibert, J.: The role of topography on
catchment-scale water residence time, Water Resour. Res., 41,
W05002, doi:10.1029/2004WR003657, 2005.
Mizota, C. and Kusakabe, M.: Spatial distribution of δD-δ18O val-
ues of surface and shallow groundwaters from Japan, south Ko-
rea and east China, Geochem. J., 28, 387–410, 1994.
Oda, T., Suzuki, M., Egusa, T., and Uchiyama, Y.: Effect of bedrock
flow on catchment rainfall-runoff characteristics and the water
balance in forested catchments in Tanzawa Mountains, Japan,
Hydrol. Process., 27, 3864–3872, doi:10.1002/hyp.9497, 2013.
Poage, M. A. and Chamberlain, C. P.: Empirical relationships be-
tween elevation and the stable isotope composition of precipita-
tion and surface waters: considerations for studies of paleoeleva-
tion change, Am. J. Sci., 301, 1–15, 2001.
www.hydrol-earth-syst-sci.net/19/1577/2015/ Hydrol. Earth Syst. Sci., 19, 1577–1588, 2015

1588 M. Katsuyama et al.: Spatial distribution of oxygen-18 and deuterium in stream waters
Priestley, C. H. B. and Taylor, R. J.: On the assessment of surface
heat flux and evaporation using large-scale parameters, Mon.
Weather Rev., 100, 81–92, 1972.
Sano, T., Endo, Y., Hayashi, A., and Haga, H.: Characteristics of
stream water nutrient concentrations during snowmelt period in a
headwater catchment in the Central Chugoku Mountains: A com-
parison between no-snow period and snowmelt period based on
weekly sampling for one year, J. Jpn. Soc. Water Environ., 37,
119–128, (in Japanese with English summary), 2014.
Satake, H., Mukai, T., and Mizutani, Y.: Environmental isotope hy-
drology of precipitations and river waters in the Hokuriku dis-
trict, Japan., Annual report of Tritium Research Center, Toyama
University, Japan, 3, 45–56, (in Japanese with English summary),
1984.
Shinomiya, Y., and Yoshinaga, S.: Behavior of water during large
scale rainfall events on the slope of natural forest in a mountain-
ous headwater catchment in the Shimanto river basin, J. Jpn. Soc.
Hydrol. Water Resour., 21, 126–139, 2008 (in Japanese with En-
glish summary).
Tase, N., Shimano, Y., Kono, T., Mori, K., Shinmi, O., Yokoyama,
S., Miyazawa, T., Kodama, Y., Matsumoto, E., Fushiwaki, Y., Ya-
suike, S., Iijima, T., Kobayashi, M., Yamanaka, T., and Shimada,
J.: Isotopic variations in precipitation of Japan, Proceedings of
International Workshop on Global Change and Terrestrial Envi-
ronment in Monsoon Asia, 140–143, 1997.
Tetzlaff, D., Seibert, J., McGuire, K. J., Laudon, H., Burns, D.
A., Dunn, S. M., and Soulsby, C.: How does landscape struc-
ture influence catchment transit time across different geomorphic
provinces?, Hydrol. Process., 23, 945–953, 2009.
Tetzlaff, D., Soulsby, C., Hrachowitz, M., and Speed, M.: Relative
influence of upland and lowland headwaters on the isotope hy-
drology and transit times of larger catchments, J. Hydrol., 400,
438–447, 2011.
Tsujimura, M. and Tanaka, T.: Evaluation of evaporation rate from
forested soil surface using stable isotopic composition of soil wa-
ter in a headwater basin, Hydrol. Process., 12, 2093–2103, 1998.
van der Veer, G., Voerkelius, S., Lorentz, G., Heiss, G., and
Hoogewerff, J. A.: Spatial interpolation of the deuterium and
oxygen-18 composition of global precipitation using tempera-
ture as ancillary variable, J. Geochem. Explor., 101, 175–184,
doi:10.1016/j.gexplo.2008.06.008, 2009.
Waseda, A. and Nakai, N.: Isotopic compositions of meteoric and
surface waters in Central and Northeast Japan, Chikyukagaku
(Geochemistry), 17, 83–91, (in Japanese with English Sum-
mary), 1983.
Wassenaar, L. I., Van Wilgenburg, S. L., Larson, K., and Hobson, K.
A.: A groundwater isoscape (δD, δ18O) for Mexico, J. Geochem.
Explor., 102, 123–136, doi:10.1016/j.gexplo.2009.01.001, 2009.
West, J. B., Bowen, G. J., Dawson, T. E., and Tu, K. P. (Eds.):
Isoscapes. Understanding movement, pattern, and process on
Earth through isotope mapping, Springer, Dordrecht, the Nether-
lands, 487 pp., doi:10.1007/978-90-481-3354-3, 2010.
Yabusaki, S.: Characteristics of stable isotopes in precipitation
at Kumagaya city, Saitama prefecture, Bulletin of Faculty of
Geo-environmental Science, Rissho University, 12, 121–125, (in
Japanese), 2010.
Yabusaki, S., Tase, N., Tsujimura, M., and Hayashi, Y.: Character-
istics of Stable Isotopes in Precipitation at South Slope of Mt.
Tsukuba, Bull. of the Terrestrial Environment Research Center,
University of Tsukuba, 9, 15–23. (in Japanese with English Sum-
mary), 2008.
Yamamoto, M., Kitamura, T., Akagi, H., Furukawa, T., and Kusak-
abe, M.: Hydrogen and Oxygen isotope ratios of meteoric waters
in Okayama prefecture, Japan, J. Groundwater Hydrol., 35, 107–
112, (in Japanese with English Summary), 1993.
Hydrol. Earth Syst. Sci., 19, 1577–1588, 2015 www.hydrol-earth-syst-sci.net/19/1577/2015/