Metallurgical characterization of Pd electrodes employed in calorimetric experiments under...
7
1 Castagna, E., et al. Metallurgical characterization of Pd electrodes employed in calorimetric experiments under electrochemical deuterium loading. in ICCF-14 International Conference on Condensed Matter Nuclear Science. 2008. Washington, DC. Metallurgical characterization of Pd electrodes employed in calorimetric experiments under electrochemical deuterium loading E. Castagna 1 , M. Sansovini 1 , S. Lecci 1 , A. Rufoloni 1 , F. Sarto 1 , V. Violante 1 , D. L. Knies 2 , K. S. Grabowski 2 , and G. K. Hubler 2 , M. McKubre 3 and F. Tanzella 3 1 ENEA Frascati Research Center Frascati (Rome) 00044 Italy 2 Naval Research Laboratory Washington, DC 20375 USA 3 SRI International Menlo Park CA USA Abstract A systematic approach has been followed in the production and characterization of Pd foils to be used in excess heat production experiments [1][ 2] [3] . Starting with a metal foil as supplied, palladium samples have been fabricated and characterized in a step by step process, and then subjected to electrolysis deuterium loading. The characterized metallurgical properties include the main grain size, the grain boundary, the material Vickers hardness, and the crystal grain orientation. Electrochemical properties that are recorded include the D/Pd loading ratio and the D/Pd low current loading ratio. A suitable correlation parameter has been defined and correlations have been found between excess heat production and individual properties; i.e. the mean grain size, grain boundary, material hardness, crystal grain orientation, deuterium loading and low-current deuterium loading level. Introduction A great deal of experimental evidence indicates that the reproducibility of excess heat production is strongly controlled by the cathode’s material properties. To achieve deeper understanding of the phenomenon, a systematic characterization of the metallurgical properties and loading behaviour of Pd cathodes used in excess heat experiments at different laboratories (ENEA, SRI, Energetics Technology), has been performed. A central role in the improvement of the study is the development of a tool for experimental data organization and storage; i.e. a database including all the information collected for each sample. The data is rigorously organized and easily retrieved and compared. Data analysis aimed to look for correlations with excess heat production. A statistical approach has been followed, as the role played by each material-related issue is not known yet, and an exhaustive theoretical explanation has not been devised.
-
Upload
independent -
Category
Documents
-
view
0 -
download
0
Transcript of Metallurgical characterization of Pd electrodes employed in calorimetric experiments under...

1
Castagna, E., et al. Metallurgical characterization of Pd electrodes employed in calorimetric experiments underelectrochemical deuterium loading. in ICCF-14 International Conference on Condensed Matter Nuclear Science.2008. Washington, DC.
Metallurgical characterization of Pd electrodes employed incalorimetric experiments under electrochemical deuterium
loading
E. Castagna 1, M. Sansovini 1, S. Lecci 1, A. Rufoloni 1, F. Sarto 1, V. Violante 1, D. L. Knies 2, K.S. Grabowski 2, and G. K. Hubler 2, M. McKubre 3 and F. Tanzella 3
1 ENEA Frascati Research CenterFrascati (Rome) 00044 Italy
2 Naval Research LaboratoryWashington, DC 20375 USA
3 SRI InternationalMenlo Park CA USA
AbstractA systematic approach has been followed in the production and characterizationof Pd foils to be used in excess heat production experiments [1][ 2] [3]. Starting witha metal foil as supplied, palladium samples have been fabricated andcharacterized in a step by step process, and then subjected to electrolysisdeuterium loading. The characterized metallurgical properties include the maingrain size, the grain boundary, the material Vickers hardness, and the crystal grainorientation. Electrochemical properties that are recorded include the D/Pd loadingratio and the D/Pd low current loading ratio. A suitable correlation parameter hasbeen defined and correlations have been found between excess heat productionand individual properties; i.e. the mean grain size, grain boundary, materialhardness, crystal grain orientation, deuterium loading and low-current deuteriumloading level.
IntroductionA great deal of experimental evidence indicates that the reproducibility of excess heat
production is strongly controlled by the cathode’s material properties. To achieve deeperunderstanding of the phenomenon, a systematic characterization of the metallurgical propertiesand loading behaviour of Pd cathodes used in excess heat experiments at different laboratories(ENEA, SRI, Energetics Technology), has been performed. A central role in the improvement ofthe study is the development of a tool for experimental data organization and storage; i.e. adatabase including all the information collected for each sample. The data is rigorouslyorganized and easily retrieved and compared.
Data analysis aimed to look for correlations with excess heat production. A statistical approachhas been followed, as the role played by each material-related issue is not known yet, and anexhaustive theoretical explanation has not been devised.

2
ExperimentalStarting with the metal foil from the supplier, palladium samples have been produced and
characterized in a step by step process before being subjected to an electrolysis deuteriumloading experiment.
Cathode ManufacturingCold rolling and annealing create an optimized metallurgical structure of the material, which
increases deuterium loading. The raw starting material was palladium foil 1 mm thick able toreach a loading ratio of about 0.75 - 0.8 hydrogen/palladium atomic ratio.
The initial treatment was done in two steps:
(1) Cold rolling of the raw material produces Pd foils 50 microm thick.(2) Annealing at temperatures ranging from 800 to 900°C for about 1 hr.
The resulting foils are rectangular, about 20 mm long and 10 mm wide, with a thickness ofabout 50 m. These strips are cut into 40 mm long pieces, to make cathodes with appropriatedimensions. Then the samples are chemically etched using nitric acid and aqua regia. This isdone to clean impurities from the surface which can contaminate it during the cold rolling andannealing, and also to activate the surface, making it easier for hydrogen to diffuse into the metallattice. From a metallurgical point of view such treatment reveals material surface morphology,allowing the SEM observation of the grain dimension distribution in the sample. Surfacechemical etching is also one of the suitable methods to obtain the required surface roughness.
Cathode CharacterizationBecause the origin and preparation of the cathode is crucial to the outcome of the experiment,
each step in the process should be recorded for each sample. We do this with a protocol for thesample designation. For example, the cathode designated L54(189-227)RAEF indicates thefollowing: L54 is the rolling run; (189-227) indicates the sample position inside the originalrolled stripe; R stands for “rolling performed”; A for “annealing performed”; E for “etchingperformed”; and F is the deuterium loading specification (i.e. in which electrochemical cell thesample was placed).
Metallurgical properties that have been characterized include the most common grain sizefound in the sample, the grain boundary, Vickers hardness, and the crystal grain orientation.Because the samples in this study are polycrystalline, the chemical behaviour of the surface isnot homogeneous, and strictly dependent on the grain crystallographic orientation.

3
Figure 2.1. Grain orientation distribution as revealedby EBDS on L46 Pd sample
Figure 2.2. Grain orientation distribution as revealedby EBDS on L47 Pd sample
Excess heat experimentsAfter the Pd samples are fabricated and characterized from a metallurgical point of view, they
are used as cathodes in electrochemical cells, which are placed inside a calorimeter. The metallattice is loaded with deuterium to see if excess heat production occurs.
All the samples used in this study gave a D/Pd loading ratio with values ranging from 0.9 up toabout 1.
The calorimetric study allowed us to understand that not only loading but also intrinsicproperties of the material controlled the reproducibility of excess power. This evidence promptedus to establish a database of material properties.
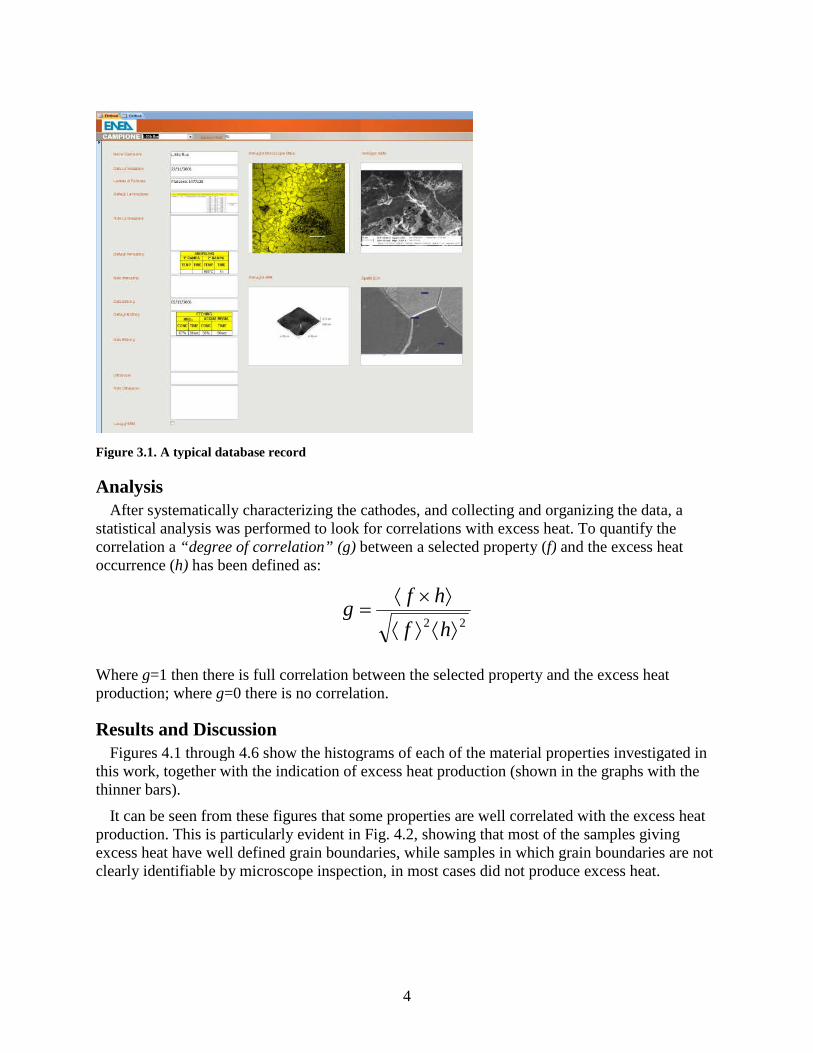
DatabaseThe custom- developed database includes all relevant characterization parameters. A typical
record is shown in Fig. 3.1. It includes the sample name and its manufacturing specifications,and also the results of materials measurements, together with SEM and AFM images.
Selected phaseis Palladium
L47
Selected phaseis Palladium
L46
4
Figure 3.1. A typical database record
AnalysisAfter systematically characterizing the cathodes, and collecting and organizing the data, a
statistical analysis was performed to look for correlations with excess heat. To quantify thecorrelation a “degree of correlation” (g) between a selected property (f) and the excess heatoccurrence (h) has been defined as:
22
hf
hfg
Where g=1 then there is full correlation between the selected property and the excess heatproduction; where g=0 there is no correlation.
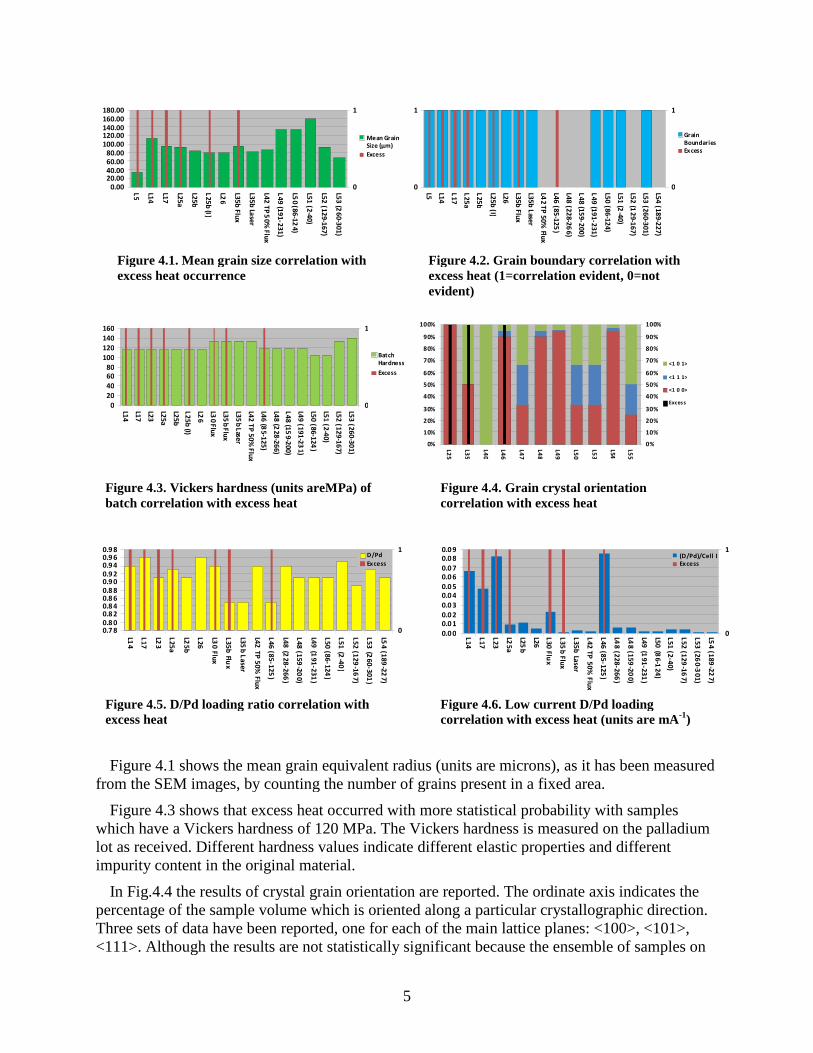
Results and DiscussionFigures 4.1 through 4.6 show the histograms of each of the material properties investigated in
this work, together with the indication of excess heat production (shown in the graphs with thethinner bars).
It can be seen from these figures that some properties are well correlated with the excess heatproduction. This is particularly evident in Fig. 4.2, showing that most of the samples givingexcess heat have well defined grain boundaries, while samples in which grain boundaries are notclearly identifiable by microscope inspection, in most cases did not produce excess heat.
5
Figure 4.1 shows the mean grain equivalent radiusfrom the SEM images, by counting the number of gra
Figure 4.3 shows that excess heat occurred with mwhich have a Vickers hardness of 120 MPa. The Viclot as received. Different hardness values indicate difimpurity content in the original material.
In Fig.4.4 the results of crystal grain orientation arpercentage of the sample volume which is oriented aThree sets of data have been reported, one for each o<111>. Although the results are not statistically signi
Figure 4.2. Grain boundary correlation withexcess heat (1=correlation evident, 0=notevident)
batch correlation with excess heat
excess heat
excess heat occurrence
0.0020.0040.0060.0080.00
100.00120.00140.00160.00180.00
L5
L14
L17
L25a
L25b
L25
b(I)
L26
L35bFlux
L35bLa
ser
L42TP
50%
Flux
L49
(191-2
31)
L50
(86-12
4)
L51(2-40)
L52(12
9-167)
L53(2
60-3
01)
0
1
Mean GrainSize (µm)
Excess
0
1
L5 L14
L17
L25
a
L25
b
L25b(I)
L26
L35bFlux
L35bLaser
L42
TP50%
Flux
L46(85
-125
)
L48(22
8-26
6)
L48
(159-2
00)
L49
(191-2
31)
L50(86
-124)
L51(2
-40)
L52(1
29-1
67)
L53(26
0-301)
L54(18
9-227)
0
1
GrainBoundariesEx cess
0
20
40
6080
100
120
140
160
L14
L17
L23
L25a
L25b
L25b
(I)
L26
L30
Flux
L35
bFlu
x
L35
bLaser
L42
TP
50%
Flux
L46
(85-125
)
L48
(228
-266)
L48
(159-2
00)
L49
(191-23
1)
L50
(86-124)
L51
(2-40)
L52
(129-16
7)
L53
(260-30
1)
0
1
BatchHardness
Excess
0%
10%
20%
30%
40%
50%
60%
70%
80%
90%
100%
L25
L35
L40
L46
L47
L48
L49
L50
L53
L54
L55
0%
10%
20%
30%
40%
50%
60%
70%
80%
90%
100%
<1 0 1>
<1 1 1>
<1 0 0>
Exces s
0.7 80.8 00.8 20.8 40.8 60.8 80.9 00.9 20.9 40.9 60.9 8
L14
L17
L23
L25a
L25
b
L26
L30
Flux
L35b
Flux
L35b
Laser
L42TP
50%
Flux
L46(8
5-125)
L48(2
28-26
6)
L48(1
59-20
0)
L49(1
91-23
1)
L50(8
6-124)
L51(2
-40
)
L52(1
29-16
7)
L53(2
60-30
1)
L54
(189
-227)
0
1D/Pd
Excess
Figure 4.4. Grain crystal orientation
Figure 4.3. Vickers hardness (units areMPa) of correlation with excess heat0.0 0
0.0 10.0 2
0.0 3
0.0 40.0 5
0.0 60.0 7
0.0 80.0 9
L14
L17
L23
L25
a
L25b
L26
L30Flu
x
L35b
Flux
L35b
Laser
L42TP
50%
Flux
L46(8
5-125)
L48
(228
-266
)
L48
(159
-200)
L49(1
91-23
1)
L50(8
6-124
)
L51(2
-40)
L52(1
29-16
7)
L53(2
60
-30
1)
L54
(189
-227)
0
1(D/Pd)/Cell IExcess
Figure 4.6. Low current D/Pd loading
Figure 4.5. D/Pd loading ratio correlation withFigure 4.1. Mean grain size correlation with
(units are microns), as it has been measuredins present in a fixed area.
ore statistical probability with sampleskers hardness is measured on the palladiumferent elastic properties and different
e reported. The ordinate axis indicates thelong a particular crystallographic direction.f the main lattice planes: <100>, <101>,ficant because the ensemble of samples on
correlation with excess heat (units are mA-1)
6
which crystallographic data have been available is limited, the graph shows that only sampleshaving more than 50% <100> orientation gave excess heat, suggesting that <100> orientation isa necessary condition for excess heat to occur.
The last two figures (Fig. 4.5 and 4.6) show data on deuterium loading. In Fig. 4.5 the ordinateaxis indicates the values of the D/Pd atomic ratio determined with four point probe resistivitymeasurements and the Baranowskii – McKubre curve. This is measured during electrolysis. Theresults confirms what has already been described in literature, that a D/Pd ratio higher than 0.85is a necessary condition to obtain excess heat. It should be noted, however, that all the samplesconsidered have a D/Pd ratio higher than 0.85; the correlation parameter g value would be muchhigher if samples below the loading threshold had been considered.
Fig. 4.6 gives insight into a more unexplored result. The histogram shows the ratio betweenD/Pd atomic ratio (also referred as the “maximum loading”) and the electric current that wasflowing through the cell when that loading was obtained. McKubre identified two types ofexcess power production: Type A, excess begins after several days of electrolysis and dependson the current density; and Type B, excess begins soon and does not always depend the currentdensity. [4] The figure shows that when excess heat is produced, a high level of deuteriumloading was generally obtained at low electric current (see samples L14, L17, L23, L46);exceptions are samples L25a and L30Flux, which both gave excess heat of type B, while allother samples gave excess heat of type A.
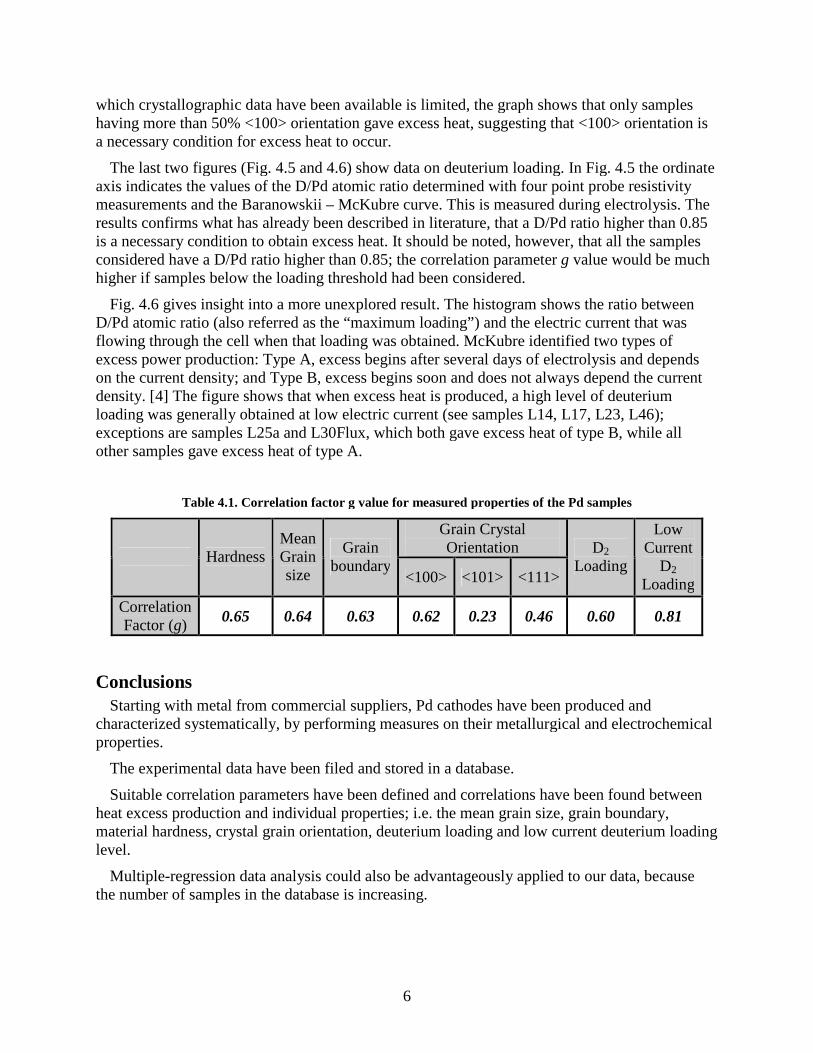
Table 4.1. Correlation factor g value for measured properties of the Pd samples
Grain CrystalOrientation
HardnessMeanGrainsize
Grainboundary
<100> <101> <111>
D2
Loading
LowCurrent
D2
Loading
CorrelationFactor (g)
0.65 0.64 0.63 0.62 0.23 0.46 0.60 0.81
ConclusionsStarting with metal from commercial suppliers, Pd cathodes have been produced and
characterized systematically, by performing measures on their metallurgical and electrochemicalproperties.
The experimental data have been filed and stored in a database.
Suitable correlation parameters have been defined and correlations have been found betweenheat excess production and individual properties; i.e. the mean grain size, grain boundary,material hardness, crystal grain orientation, deuterium loading and low current deuterium loadinglevel.
Multiple-regression data analysis could also be advantageously applied to our data, becausethe number of samples in the database is increasing.

7
References1. V. Violante, F. Sarto, E.Castagna, C. Sibilia, M.Bertolotti, R. Li Voti, G.Leahou, M.
McKubre, F. Tanzella,G. Hubler, D. Knies, T. Zilov and I. Dardik, Calorimetric Results ofENEA Cooperative Experiments, in the 13th International Conference on Condensed MatterNuclear Science, Sochi, 2007
2. F. Sarto, E. Castagna, M. Sansovini, S. Lecci, V. Violante RdA, D.L. Knies, K.S. Grabowski,G.K. Hubler, "Electrode Surface Morphology Characterization by Atomic ForceMicroscopy"
3. G.K. Hubler, Anomalous effects in hydrogen-charged palladium - a review, Surface &Coatings Technology (2007), doi: 10.1016/j.surfcoat.2006.03.062
4. V. Violante, F. Sarto, E. Castagna, M. Sansovini, S. Lecci, D.L. Knies, K.S. Grabowski,G.K. Hubler, “Material Science on Pd-D System to Study the Occurrence of Excess ofPower”, in these proceedings