Interaction of aristololactam-β- D-glucoside and daunomycin with poly(A): Spectroscopic and...
11
This article appeared in a journal published by Elsevier. The attached copy is furnished to the author for internal non-commercial research and education use, including for instruction at the authors institution and sharing with colleagues. Other uses, including reproduction and distribution, or selling or licensing copies, or posting to personal, institutional or third party websites are prohibited. In most cases authors are permitted to post their version of the article (e.g. in Word or Tex form) to their personal website or institutional repository. Authors requiring further information regarding Elsevier’s archiving and manuscript policies are encouraged to visit: http://www.elsevier.com/copyright
Transcript of Interaction of aristololactam-β- D-glucoside and daunomycin with poly(A): Spectroscopic and...

This article appeared in a journal published by Elsevier. The attachedcopy is furnished to the author for internal non-commercial researchand education use, including for instruction at the authors institution
and sharing with colleagues.
Other uses, including reproduction and distribution, or selling orlicensing copies, or posting to personal, institutional or third party
websites are prohibited.
In most cases authors are permitted to post their version of thearticle (e.g. in Word or Tex form) to their personal website orinstitutional repository. Authors requiring further information
regarding Elsevier’s archiving and manuscript policies areencouraged to visit:
http://www.elsevier.com/copyright
Author's personal copy
Interaction of aristololactam-β-D-glucoside and daunomycin with poly(A): Spectroscopicand calorimetric studies
Abhi Das a,1, Kakali Bhadra a,1,2, Basudeb Achari b, Prarthana Chakraborty b, Gopinatha Suresh Kumar a,⁎a Biophysical Chemistry Laboratory, Indian Institute of Chemical Biology, CSIR, Kolkata 700 032, Indiab Chemistry Division, Indian Institute of Chemical Biology, CSIR, Kolkata 700 032, India
a b s t r a c ta r t i c l e i n f o
Article history:Received 8 December 2010Received in revised form 11 January 2011Accepted 30 January 2011Available online 16 February 2011
Keywords:Aristololactam- β-D-glucosideDaunomycinPoly(A) bindingIsothermal titration calorimetryThermodynamic parameters
The binding of two sugar containing antibiotics viz. aristololactam-β-D-glucoside and daunomycin with single anddouble stranded poly(A) was investigated by spectroscopic and calorimetric studies. The binding affinity ofdaunomycin to ss poly(A) was of the order of 106 M−1 and that to ds poly(A) was of the order of 105 M−1.Aristololactam-β-D-glucoside showed a relativelyweaker bindingwith an affinity of the order of 104 M−1with boththe conformations of poly(A). Fluorescence studies showed maximum quenching for daunomycin-ss poly(A)complexes. The binding constants calculated from fluorescence spectroscopy were in good agreement with thatobtained from UV spectroscopy. Moderate perturbation of circular dichroic spectra of both the conformations ofpoly(A) in presence of these molecules with concomitant formation of prominent extrinsic CD bands in the300–450 nm region further revealed the association. Isothermal titration calorimetry results showed an overallentropy driven binding in all the four systems though the entropy changewasmaximum in daunomycin-ss poly(A)binding. The binding affinitywas alsomaximum for daunomycin-ss poly(A) and varied as daunomycin-ds poly(A)Naristololactam-β-D-glucoside-ds poly(A)Naristololactam-β-D-glucoside-ss poly(A). A 1:1 binding stoichiometrywasobserved in all the cases, as confirmed by Job plot analysis, indicating the interaction to consist of a single bindingmode. Ferrocyanide quenching studies showedgood stacking interaction in all cases butwas best for daunomycin-sspoly(A) interaction.No self-structure formationwas observed in poly(A)with both daunomycin and aristololactam-β-D-glucoside suggesting the hindrance of the sugar moiety for such structural organization.
© 2011 Elsevier B.V. All rights reserved.
1. Introduction
New roles played by RNA in various crucial cellular processes isnow getting unraveled and a new ‘world of RNA’ has emerged sincethe discovery of several new RNAs like mirco RNA, siRNA, ds RNA andmany others in the cell with myriad structures and functions [1–6].More importantly, the crucial new roles of many RNAmolecules in theprogression of parasites and viruses have resulted in their recognitionas prime targets for therapeutic intervention. Consequently, in the lastfew years, there has been a paradigm shift to study and understandthe fundamentals of small molecule interactions with various RNAstructures in order to develop RNA targeted antibiotics for therapeuticuse [7–9]. Rational design of RNA targeted drugs needs a detailedknowledge of the mode, mechanism, base specificity and structuralselectivity data. DNA binding studies were pursued in a number of
laboratories spanning the last 50 years and currently we have a robustunderstanding of the mode, mechanism, specificity, and energetics ofbinding [10–15]. However, such data in respect of RNA is virtuallynonexistent except for some studies with aminoglycosides andalkaloids [8,16–21]. Since RNA, unlike DNA, folds to complex anddiverse structures, generation of such fundamental data, bothexperimental and theoretical, needs extensive and painstakingstudy with each RNA structure. DNA binding molecules are goodmodels to begin with for elucidating RNA binding aspects. Some RNAbinding molecules like aminoglycosides have been investigated, butdue to the high toxicity, their usage in RNA therapeutics is limited[22]. Our laboratory has studied the interaction of a number of naturalalkaloid molecules and has provided new data on the mode,mechanism and energetics of their interaction with single and dsRNAs [23–28]. Poly(A) has been the focus of increasing attention forits importance in mRNA functioning [29,30]. All eukaryotic mRNAshave a long poly(A) tail at the 3′-end that is an important determinantin its maturation and stability and in the initiation of translation.Molecules that could bind to the polyadenylate tail were thought toinhibit mRNA and protein production in the cell. Post-transcriptionalpolyadenylation step in mRNA is catalyzed by the enzyme poly Apolymerase (PAP). Many recent studies have implicated that neo PAP,a human PAP, was significantly over expressed in human cancer cells
Biophysical Chemistry 155 (2011) 10–19
⁎ Corresponding author at: Biophysical Chemistry Laboratory, Indian Institute ofChemical Biology, CSIR, 4, Raja S.C. Mullick Road, Kolkata 700 032, India. Tel.: +91 332499 5723/2472 4049; fax: +91 33 2473 5197/2472 3967.
E-mail addresses: [email protected], [email protected] (G.S. Kumar).1 A.D. and K.B. contributed equally to this work.2 Current address: Department of Zoology, University of Kalyani, Kalyani, West
Bengal 741 741 235, India.
0301-4622/$ – see front matter © 2011 Elsevier B.V. All rights reserved.doi:10.1016/j.bpc.2011.01.011
Contents lists available at ScienceDirect
Biophysical Chemistry
j ourna l homepage: ht tp : / /www.e lsev ie r.com/ locate /b iophyschem
Author's personal copy
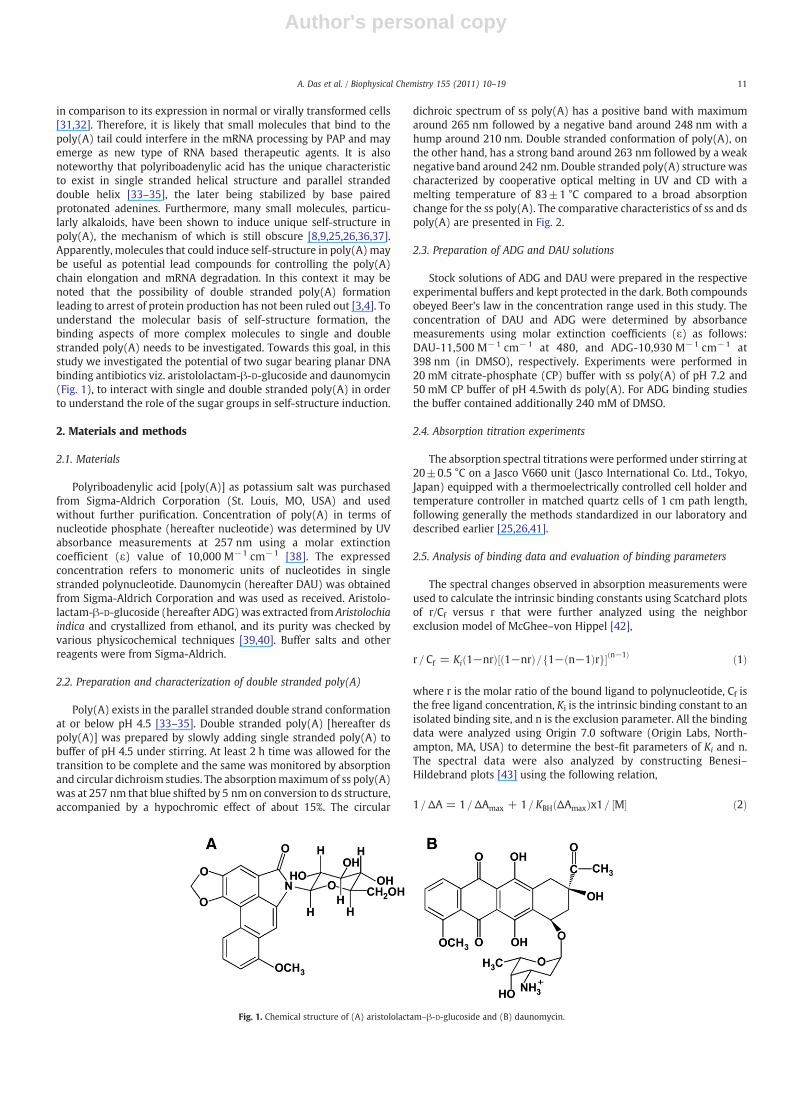
in comparison to its expression in normal or virally transformed cells[31,32]. Therefore, it is likely that small molecules that bind to thepoly(A) tail could interfere in the mRNA processing by PAP and mayemerge as new type of RNA based therapeutic agents. It is alsonoteworthy that polyriboadenylic acid has the unique characteristicto exist in single stranded helical structure and parallel strandeddouble helix [33–35], the later being stabilized by base pairedprotonated adenines. Furthermore, many small molecules, particu-larly alkaloids, have been shown to induce unique self-structure inpoly(A), the mechanism of which is still obscure [8,9,25,26,36,37].Apparently, molecules that could induce self-structure in poly(A)maybe useful as potential lead compounds for controlling the poly(A)chain elongation and mRNA degradation. In this context it may benoted that the possibility of double stranded poly(A) formationleading to arrest of protein production has not been ruled out [3,4]. Tounderstand the molecular basis of self-structure formation, thebinding aspects of more complex molecules to single and doublestranded poly(A) needs to be investigated. Towards this goal, in thisstudy we investigated the potential of two sugar bearing planar DNAbinding antibiotics viz. aristololactam-β-D-glucoside and daunomycin(Fig. 1), to interact with single and double stranded poly(A) in orderto understand the role of the sugar groups in self-structure induction.
2. Materials and methods
2.1. Materials
Polyriboadenylic acid [poly(A)] as potassium salt was purchasedfrom Sigma-Aldrich Corporation (St. Louis, MO, USA) and usedwithout further purification. Concentration of poly(A) in terms ofnucleotide phosphate (hereafter nucleotide) was determined by UVabsorbance measurements at 257 nm using a molar extinctioncoefficient (ε) value of 10,000 M−1 cm−1 [38]. The expressedconcentration refers to monomeric units of nucleotides in singlestranded polynucleotide. Daunomycin (hereafter DAU) was obtainedfrom Sigma-Aldrich Corporation and was used as received. Aristolo-lactam-β-D-glucoside (hereafter ADG)was extracted from Aristolochiaindica and crystallized from ethanol, and its purity was checked byvarious physicochemical techniques [39,40]. Buffer salts and otherreagents were from Sigma-Aldrich.
2.2. Preparation and characterization of double stranded poly(A)
Poly(A) exists in the parallel stranded double strand conformationat or below pH 4.5 [33–35]. Double stranded poly(A) [hereafter dspoly(A)] was prepared by slowly adding single stranded poly(A) tobuffer of pH 4.5 under stirring. At least 2 h time was allowed for thetransition to be complete and the same was monitored by absorptionand circular dichroism studies. The absorptionmaximumof ss poly(A)was at 257 nm that blue shifted by 5 nm on conversion to ds structure,accompanied by a hypochromic effect of about 15%. The circular
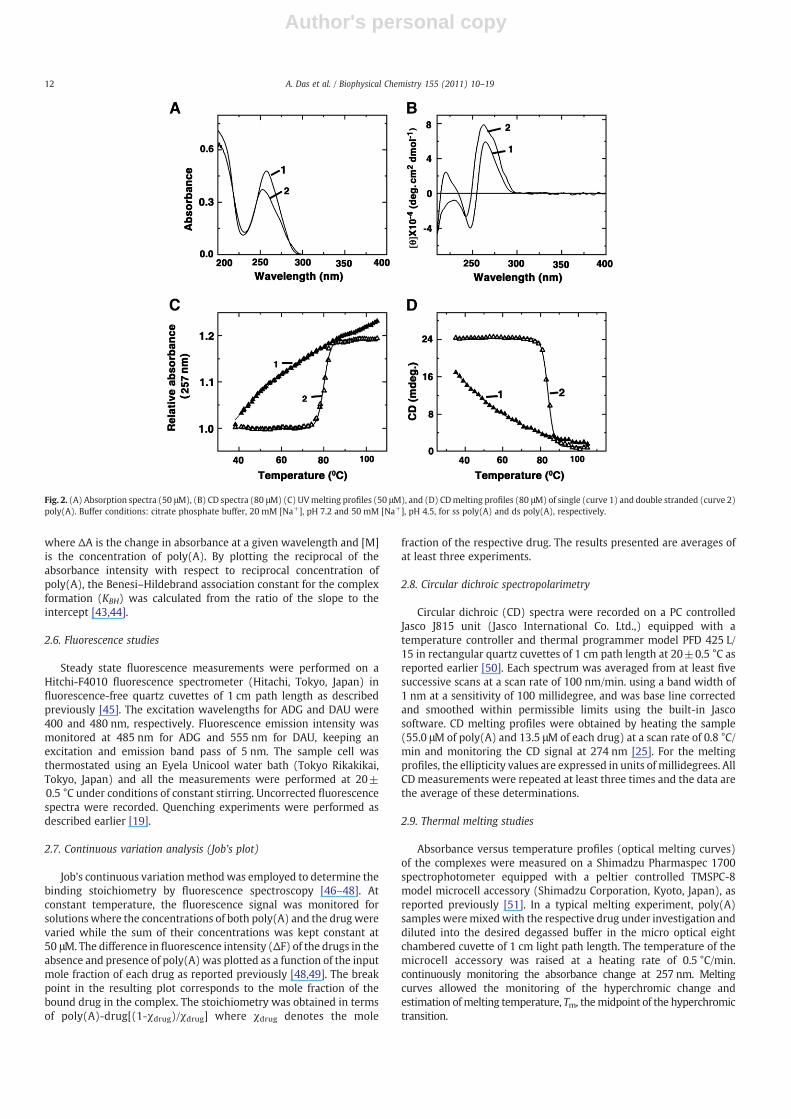
dichroic spectrum of ss poly(A) has a positive band with maximumaround 265 nm followed by a negative band around 248 nm with ahump around 210 nm. Double stranded conformation of poly(A), onthe other hand, has a strong band around 263 nm followed by a weaknegative band around 242 nm. Double stranded poly(A) structure wascharacterized by cooperative optical melting in UV and CD with amelting temperature of 83±1 °C compared to a broad absorptionchange for the ss poly(A). The comparative characteristics of ss and dspoly(A) are presented in Fig. 2.
2.3. Preparation of ADG and DAU solutions
Stock solutions of ADG and DAU were prepared in the respectiveexperimental buffers and kept protected in the dark. Both compoundsobeyed Beer's law in the concentration range used in this study. Theconcentration of DAU and ADG were determined by absorbancemeasurements using molar extinction coefficients (ε) as follows:DAU-11,500 M−1 cm−1 at 480, and ADG-10,930 M−1 cm−1 at398 nm (in DMSO), respectively. Experiments were performed in20 mM citrate-phosphate (CP) buffer with ss poly(A) of pH 7.2 and50 mM CP buffer of pH 4.5with ds poly(A). For ADG binding studiesthe buffer contained additionally 240 mM of DMSO.
2.4. Absorption titration experiments
The absorption spectral titrationswere performed under stirring at20±0.5 °C on a Jasco V660 unit (Jasco International Co. Ltd., Tokyo,Japan) equipped with a thermoelectrically controlled cell holder andtemperature controller in matched quartz cells of 1 cm path length,following generally the methods standardized in our laboratory anddescribed earlier [25,26,41].
2.5. Analysis of binding data and evaluation of binding parameters
The spectral changes observed in absorption measurements wereused to calculate the intrinsic binding constants using Scatchard plotsof r/Cf versus r that were further analyzed using the neighborexclusion model of McGhee–von Hippel [42],
r= Cf = Ki 1−nrð Þ 1−nrð Þ= 1− n−1ð Þrf g½ � n−1ð Þ ð1Þ
where r is the molar ratio of the bound ligand to polynucleotide, Cf isthe free ligand concentration, Ki is the intrinsic binding constant to anisolated binding site, and n is the exclusion parameter. All the bindingdata were analyzed using Origin 7.0 software (Origin Labs, North-ampton, MA, USA) to determine the best-fit parameters of Ki and n.The spectral data were also analyzed by constructing Benesi–Hildebrand plots [43] using the following relation,
1=ΔA = 1 =ΔAmax + 1= KBH ΔAmaxð Þx1= M½ � ð2Þ
Fig. 1. Chemical structure of (A) aristololactam–β-D-glucoside and (B) daunomycin.
11A. Das et al. / Biophysical Chemistry 155 (2011) 10–19
Author's personal copy
where ΔA is the change in absorbance at a given wavelength and [M]is the concentration of poly(A). By plotting the reciprocal of theabsorbance intensity with respect to reciprocal concentration ofpoly(A), the Benesi–Hildebrand association constant for the complexformation (KBH) was calculated from the ratio of the slope to theintercept [43,44].
2.6. Fluorescence studies
Steady state fluorescence measurements were performed on aHitchi-F4010 fluorescence spectrometer (Hitachi, Tokyo, Japan) influorescence-free quartz cuvettes of 1 cm path length as describedpreviously [45]. The excitation wavelengths for ADG and DAU were400 and 480 nm, respectively. Fluorescence emission intensity wasmonitored at 485 nm for ADG and 555 nm for DAU, keeping anexcitation and emission band pass of 5 nm. The sample cell wasthermostated using an Eyela Unicool water bath (Tokyo Rikakikai,Tokyo, Japan) and all the measurements were performed at 20±0.5 °C under conditions of constant stirring. Uncorrected fluorescencespectra were recorded. Quenching experiments were performed asdescribed earlier [19].
2.7. Continuous variation analysis (Job's plot)
Job's continuous variationmethodwas employed to determine thebinding stoichiometry by fluorescence spectroscopy [46–48]. Atconstant temperature, the fluorescence signal was monitored forsolutions where the concentrations of both poly(A) and the drugwerevaried while the sum of their concentrations was kept constant at50 μM. The difference in fluorescence intensity (ΔF) of the drugs in theabsence and presence of poly(A) was plotted as a function of the inputmole fraction of each drug as reported previously [48,49]. The breakpoint in the resulting plot corresponds to the mole fraction of thebound drug in the complex. The stoichiometry was obtained in termsof poly(A)-drug[(1-χdrug)/χdrug] where χdrug denotes the mole
fraction of the respective drug. The results presented are averages ofat least three experiments.
2.8. Circular dichroic spectropolarimetry
Circular dichroic (CD) spectra were recorded on a PC controlledJasco J815 unit (Jasco International Co. Ltd.,) equipped with atemperature controller and thermal programmer model PFD 425 L/15 in rectangular quartz cuvettes of 1 cm path length at 20±0.5 °C asreported earlier [50]. Each spectrum was averaged from at least fivesuccessive scans at a scan rate of 100 nm/min. using a band width of1 nm at a sensitivity of 100 millidegree, and was base line correctedand smoothed within permissible limits using the built-in Jascosoftware. CD melting profiles were obtained by heating the sample(55.0 μM of poly(A) and 13.5 μM of each drug) at a scan rate of 0.8 °C/min and monitoring the CD signal at 274 nm [25]. For the meltingprofiles, the ellipticity values are expressed in units of millidegrees. AllCD measurements were repeated at least three times and the data arethe average of these determinations.
2.9. Thermal melting studies
Absorbance versus temperature profiles (optical melting curves)of the complexes were measured on a Shimadzu Pharmaspec 1700spectrophotometer equipped with a peltier controlled TMSPC-8model microcell accessory (Shimadzu Corporation, Kyoto, Japan), asreported previously [51]. In a typical melting experiment, poly(A)samples weremixedwith the respective drug under investigation anddiluted into the desired degassed buffer in the micro optical eightchambered cuvette of 1 cm light path length. The temperature of themicrocell accessory was raised at a heating rate of 0.5 °C/min.continuously monitoring the absorbance change at 257 nm. Meltingcurves allowed the monitoring of the hyperchromic change andestimation ofmelting temperature, Tm, themidpoint of the hyperchromictransition.
Fig. 2. (A) Absorption spectra (50 μM), (B) CD spectra (80 μM) (C) UVmelting profiles (50 μM), and (D) CDmelting profiles (80 μM) of single (curve 1) and double stranded (curve 2)poly(A). Buffer conditions: citrate phosphate buffer, 20 mM [Na+], pH 7.2 and 50 mM [Na+], pH 4.5, for ss poly(A) and ds poly(A), respectively.
12 A. Das et al. / Biophysical Chemistry 155 (2011) 10–19
Author's personal copy
2.10. Isothermal titration calorimetry
All isothermal titration calorimetry experiments were performedusing a MicroCal VP-ITC unit (MicroCal, Inc., Northampton, MA, USA) at20 °Cas reportedpreviously [49,50].Aliquots of degassedpoly(A) solutionwere injected from a rotating syringe (290 rpm) into the isothermalsample chamber containing each of the drug solutions [1.4235 mL, 50 μMDAUand200 μMADG, respectively, for ss poly(A) and250 μMofADGandDAU for ds poly(A)]. Corresponding control experiments to determine theheat of dilution of poly(A)were performed by injecting identical volumesof the same concentration of poly(A) into the buffer. The duration of eachinjection was 10 s and the delay time between each injection was 240 s.The initial delay before the first injection was 60 s. Each injectiongenerated a heat burst curve (microcalories per second versus time). Thearea under eachheat burst curvewas determinedby integration using theOrigin 7.0 software (MicroCal) to give themeasure of the heat associatedwith that injection. The heat associated with each poly(A)-buffer mixingwas subtracted from the corresponding heat associated with the poly(A)injection to the drug to give the heat of drug binding to poly(A). The heatof dilution of injecting the buffer into each of the drug solution wasobserved to be negligible. The resulting corrected injection heats wereplotted as a function of the D/P [drug]/nucleotide phosphate molar ratio,fit with amodel for one set of binding sites, and analyzed using Origin 7.0software to estimate the binding affinity (K), the binding stoichiometry(N) and the enthalpy of binding (ΔH). The Gibbs energies (ΔG) werecalculated using the standard relationship
ΔG = −RT ln Kð Þ ð3Þ
where R is the gas constant (1.987 cal K−1 mol−1) and T is thetemperature in Kelvin (293 K).
The binding free energy coupled with the binding enthalpyderived from the ITC data allowed the calculation of the entropiccontribution to the binding (TΔS), where ΔS is the calculated bindingentropy using the standard relationship.
TΔS = ΔH−ΔG ð4Þ
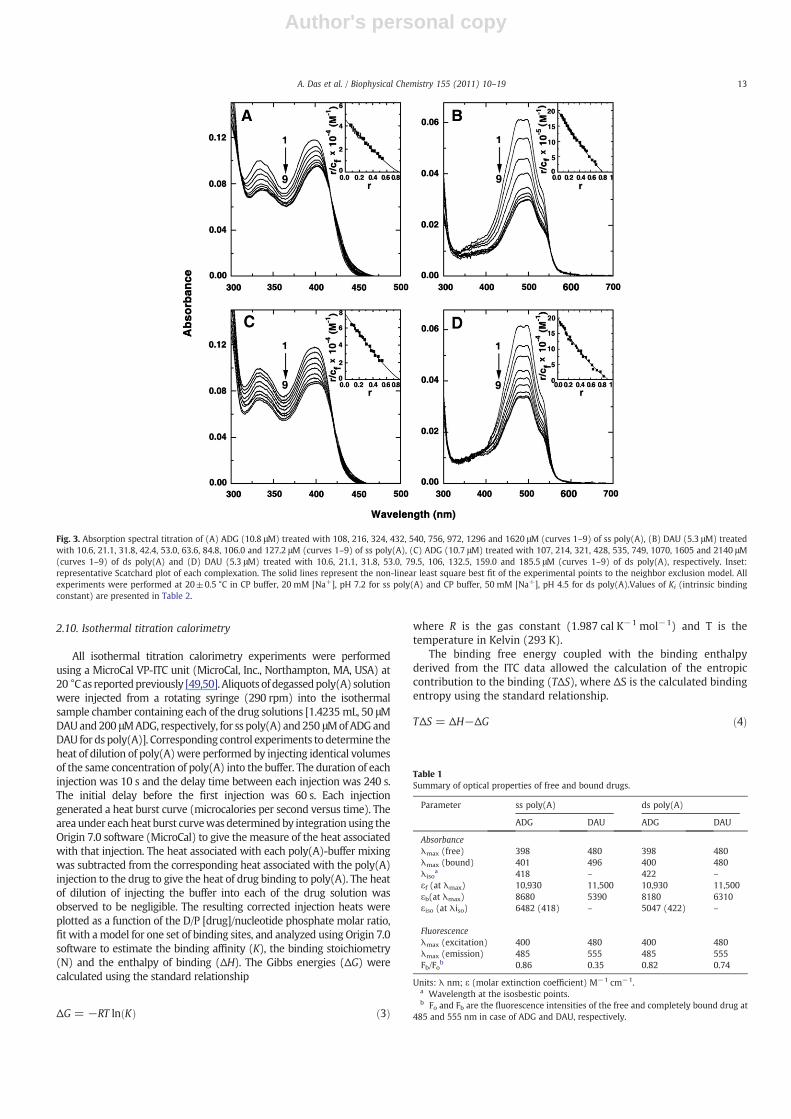
Fig. 3. Absorption spectral titration of (A) ADG (10.8 μM) treated with 108, 216, 324, 432, 540, 756, 972, 1296 and 1620 μM (curves 1–9) of ss poly(A), (B) DAU (5.3 μM) treatedwith 10.6, 21.1, 31.8, 42.4, 53.0, 63.6, 84.8, 106.0 and 127.2 μM (curves 1–9) of ss poly(A), (C) ADG (10.7 μM) treated with 107, 214, 321, 428, 535, 749, 1070, 1605 and 2140 μM(curves 1–9) of ds poly(A) and (D) DAU (5.3 μM) treated with 10.6, 21.1, 31.8, 53.0, 79.5, 106, 132.5, 159.0 and 185.5 μM (curves 1–9) of ds poly(A), respectively. Inset:representative Scatchard plot of each complexation. The solid lines represent the non-linear least square best fit of the experimental points to the neighbor exclusion model. Allexperiments were performed at 20±0.5 °C in CP buffer, 20 mM [Na+], pH 7.2 for ss poly(A) and CP buffer, 50 mM [Na+], pH 4.5 for ds poly(A).Values of Ki (intrinsic bindingconstant) are presented in Table 2.
Table 1Summary of optical properties of free and bound drugs.
Parameter ss poly(A) ds poly(A)
ADG DAU ADG DAU
Absorbanceλmax (free) 398 480 398 480λmax (bound) 401 496 400 480λiso
a 418 – 422 –
εf (at λmax) 10,930 11,500 10,930 11,500εb(at λmax) 8680 5390 8180 6310εiso (at λiso) 6482 (418) – 5047 (422) –
Fluorescenceλmax (excitation) 400 480 400 480λmax (emission) 485 555 485 555Fb/Fob 0.86 0.35 0.82 0.74
Units: λ nm; ε (molar extinction coefficient) M−1 cm−1.a Wavelength at the isosbestic points.b Fo and Fb are the fluorescence intensities of the free and completely bound drug at
485 and 555 nm in case of ADG and DAU, respectively.
13A. Das et al. / Biophysical Chemistry 155 (2011) 10–19
Author's personal copy
3. Results and discussion
3.1. Spectrophotometric results and evaluation of binding affinity
In the absorption region 300–600 nm, both ADG and DAU havecharacteristic absorption spectra. The changes in the absorptionspectra may be conveniently used to monitor the interaction withpoly(A). In Fig. 3A–D, absorption spectral changes in ADG and DAU ontitration with increasing concentration of single and double strandedpoly(A) are presented. The spectrum marked ‘1’ is the absorptionspectrum of the free drug molecule in each case. All the absorptionspectral titrations showed hypochromic and bathochromic effects.Titration of ss poly(A) with ADG (Fig. 3A) showed gradualhypochromic change at 398 nm with increasing P/D (nucleotidephosphate/drug molar ratio) and a slight bathochromic shift of 2–3 nmwith an isosbestic point at 418 nm. At saturating P/D, the change inhypochromicity was about 21%. On the other hand, DAU-ss poly(A)showed large hypochromic effect at 480 nmwith a bathochromic effect of
about 15 nm (Fig. 3B). The hypochromicity change at saturation wasabout 53% in this case. Absorption spectral titration of the binding of ADGand DAU with ds poly(A) is presented in Fig. 3C and D. In both cases,hypochromic effects were observed at the respective wavelengthmaximum with bathochromic shifts. The hypochromic change wasmore pronounced in case of ADG-ds poly(A) complexation compared toss poly(A), while ss poly(A) titration registered more changes comparedto thedspoly(A) forDAU.Hypochromic changeswithbathochromic shiftsgenerally occur due to stacking/intercalative interaction of the ligandmolecules with the base/base pairs of the nucleic acid. The opticalproperties of free and poly(A) bound ADG and DAU molecules arepresented in Table 1.
The results of the spectrophotometric titration data wereexpressed as Scatchard plots and analyzed further by the McGhee–von Hippel methodology [42] for non cooperative binding forevaluation of the binding constants The Scatchard plots are depictedin the inset of Fig. 3. The binding affinity of ADG and DAU to ss poly(A)wereevaluatedas4.50×104 M−1and1.99×106 M−1, respectively. Fords
Table 2Binding constant from spectroscopic data.
Spectrophotometry Spectrofluorimerty (ferrocyanide quenching)
Poly(A) conformation Scatchard analysis BH plot ADG DAU
ADG DAU ADG DAU Ksv L mol−1
Ki×10−4 (M−1) Ki×10−5 (M−1) KBH×10−5 (M−1) KBH×10−6 (M−1) Free Bound Free Bound
Single strand 4.50 19.9 4.58 2.08 61.2 53.8 117.6 78.7Double strand 7.54 1.98 6.13 0.11 61.2 57.8 117.6 83.1
Average of four determinations at 20±0.5 °C in CP buffer of 20 mM [Na+], pH 7.2 for ss poly(A) and 50 mM [Na+], pH 4.5 for ds poly(A). Binding constants (Ki) refer to valuesobtained from Scatchard plots through McGhee–von Hippel analysis.
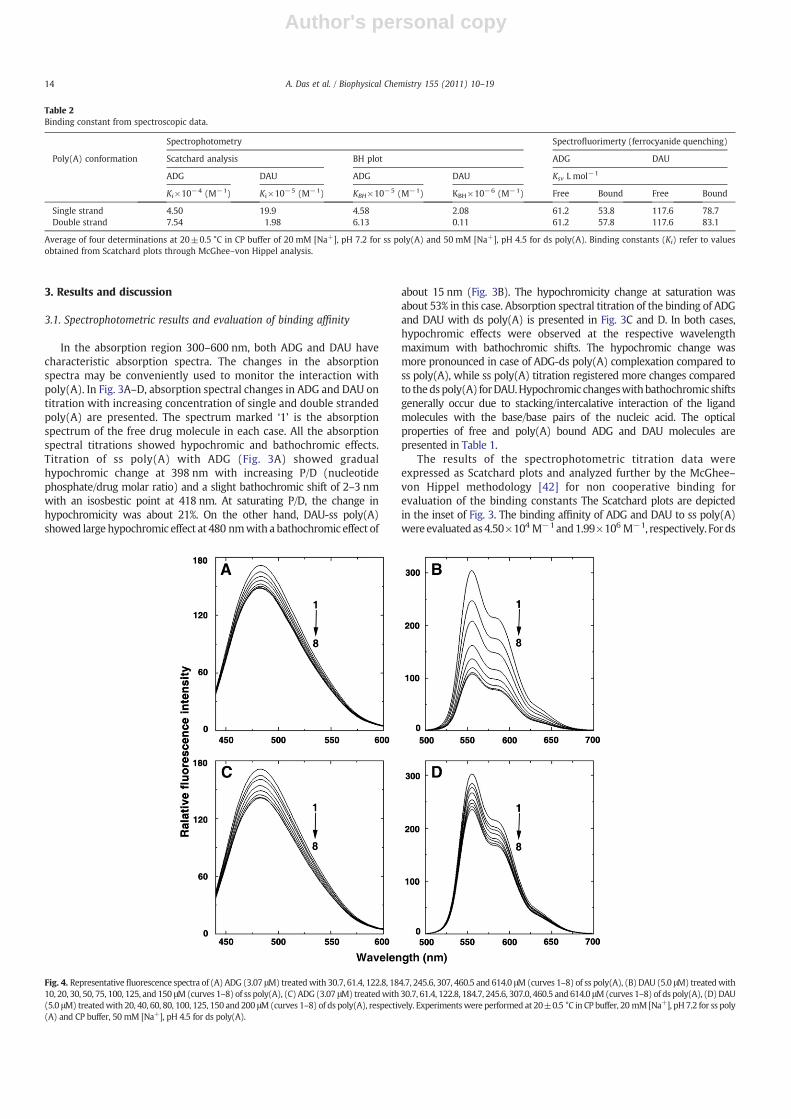
Fig. 4. Representative fluorescence spectra of (A) ADG (3.07 μM) treatedwith 30.7, 61.4, 122.8, 184.7, 245.6, 307, 460.5 and 614.0 μM(curves 1–8) of ss poly(A), (B) DAU (5.0 μM) treatedwith10, 20, 30, 50, 75, 100, 125, and 150 μM(curves 1–8) of ss poly(A), (C) ADG (3.07 μM) treatedwith 30.7, 61.4, 122.8, 184.7, 245.6, 307.0, 460.5 and 614.0 μM(curves 1–8) of ds poly(A), (D)DAU(5.0 μM) treatedwith 20, 40, 60, 80, 100, 125, 150 and 200 μM(curves 1–8) of ds poly(A), respectively. Experimentswere performed at 20±0.5 °C in CP buffer, 20 mM [Na+], pH7.2 for ss poly(A) and CP buffer, 50 mM [Na+], pH 4.5 for ds poly(A).
14 A. Das et al. / Biophysical Chemistry 155 (2011) 10–19
Author's personal copy
poly(A), the affinity values of ADG and DAU were 7.54×10⁴ M−1 and1.98×105 M−1, respectively. The number of binding sites obtained were1.25 and 1.24 for ADG and 1.19 and 1.09 for DAU-ss and ds poly(A)complexation. We also analyzed the spectral change data by the Benesi–Hildebrand protocol [43,44]. The ratio of the intercept to the slope gaveKBH, the apparent binding constant. From this analysis, it was found thatthe binding affinity values of ADG and DAU to ss poly(A) were4.58×104 M−1 and 2.08×10⁶ M−1, respectively, and that to ds poly(A)were 6.13×10⁴ M−1 and 1.10×10⁵ M−1. These values are presented inTable 2. The values of the affinity obtained from this analysis were inexcellent agreement with each other. The binding affinity of DAU to sspoly (A)was the highest, of the order of 106 M−1, and the binding affinityvalues of ADG to both ss and ds poly(A) were weaker compared to thosewith DAU. It is worth noting that DAU has a perfectly intercalatinganthaquinone chromophore and additional H-bonding anchor and aphosphate/groove binding daunosamine moiety while ADG has only anintercalating chromophorewith a neutral sugarmolecule. The differencesin the functional domains of the twomoleculesmaybe responsible for thelarge differences in the binding affinity.
3.2. Fluorescence spectroscopic studies
ADGandDAUare strongfluorescentmolecules. Their emission spectraare in the 440–600 and 500–700 nm regions, respectively, with maximaaround 485 and 555 nm when excited around 400 and 480 nm,respectively. Complex formation was monitored by titration studieskeeping a constant concentration of the drug and increasing theconcentration of poly(A). With increasing concentration of both singleand double stranded poly(A), progressive quenching of the fluorescencewas observed for both ADG and DAU eventually reaching the saturationpoint without any shift in the wavelengthmaximum (Fig. 4A–D). But the
extent of quenching was significantly different in each case. Maximumfluorescence quenching (65%) was observed with DAU-ss poly(A)(Fig. 4B) indicating possibly a strong association of the DAU molecule tothe ss poly(A) where as quenching of ADG with ss poly(A) (Fig. 4A) wascomparatively lower at about 15%. The percentage of quenching of ADGand DAU interaction (Fig. 4C,D) with ds poly(A) was about 18 and 26%,respectively. Thus, the fluorescence titration studies indicated thatmaximum quenching was observed for DAU-ss poly(A) and in othercases it followed as DAU-dsNADG-dsNADG-ss poly(A). This trend issimilar to the binding affinity revealed from the absorption spectral study(Fig. 3 and Table 2).
The stoichiometry of the association was determined independentlyby continuous variation analysis (Job's plot) in fluorescence [46,47]. Theplot of the difference in fluorescence intensity (ΔF) at 485 nm and555 nm for ADG and DAU, respectively, versus their mole fractions(Fig. 1, ESI) revealed a single binding mode for both ligands on both ssand ds poly(A). From the inflection point, XADG-ss poly(A)=0.45(n=1.20 np), XDAU-ss poly(A)=0.45 (n=1.20 np), XADG-ds poly(A)=0.44(n=1.24 np) and XDAU-ds poly(A)=0.48 (n=1.08 np) were estimated.
3.3. Circular dichroic studies
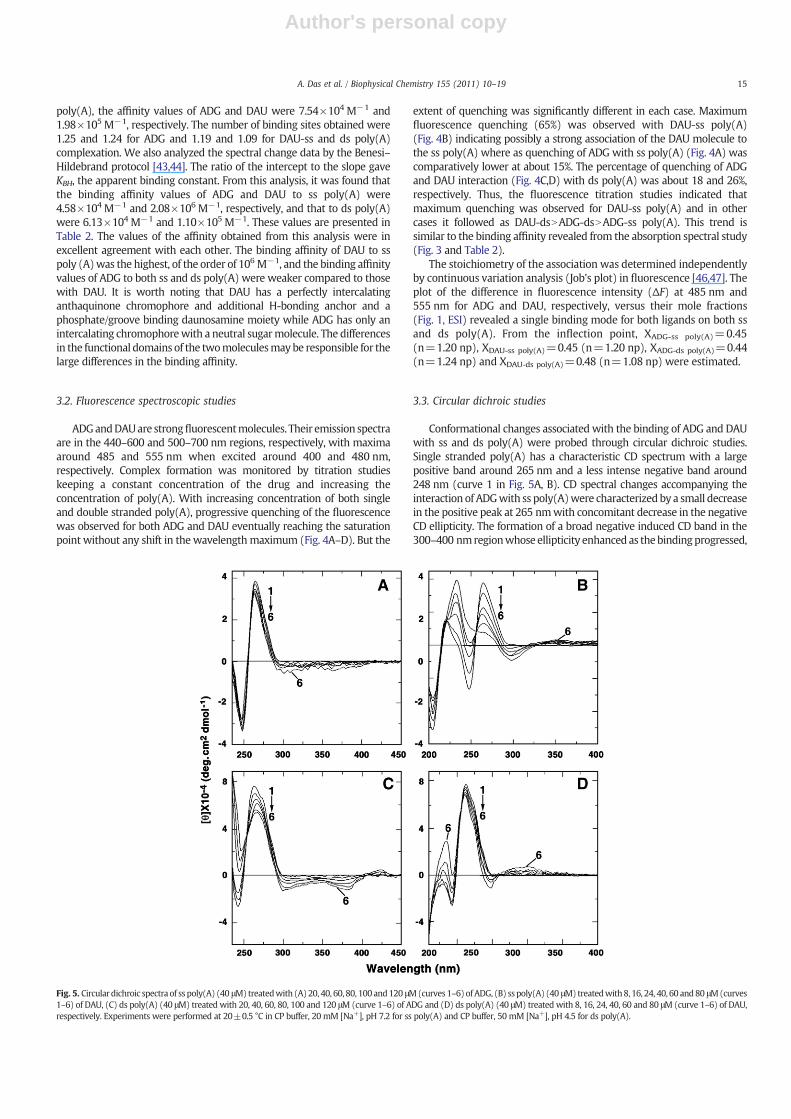
Conformational changes associated with the binding of ADG and DAUwith ss and ds poly(A) were probed through circular dichroic studies.Single stranded poly(A) has a characteristic CD spectrum with a largepositive band around 265 nm and a less intense negative band around248 nm (curve 1 in Fig. 5A, B). CD spectral changes accompanying theinteraction of ADGwith ss poly(A)were characterized by a small decreasein the positive peak at 265 nmwith concomitant decrease in the negativeCD ellipticity. The formation of a broad negative induced CD band in the300–400 nmregionwhose ellipticity enhanced as thebindingprogressed,
Fig. 5. Circular dichroic spectra of ss poly(A) (40 μM) treatedwith (A)20, 40, 60, 80, 100and120 μM(curves 1–6)ofADG, (B) ss poly(A) (40 μM) treatedwith8, 16, 24, 40, 60 and80 μM(curves1–6) of DAU, (C) ds poly(A) (40 μM) treated with 20, 40, 60, 80, 100 and 120 μM (curve 1–6) of ADG and (D) ds poly(A) (40 μM) treated with 8, 16, 24, 40, 60 and 80 μM (curve 1–6) of DAU,respectively. Experiments were performed at 20±0.5 °C in CP buffer, 20 mM [Na+], pH 7.2 for ss poly(A) and CP buffer, 50 mM [Na+], pH 4.5 for ds poly(A).
15A. Das et al. / Biophysical Chemistry 155 (2011) 10–19
Author's personal copy
is also visible (Fig. 5A–D). Interaction of DAUwith ss poly(A) also showeddecrease in thepositivepeakat265 nmand thenegative250 nmbandbutthe change inellipticitywasmuchmorepronounced; thenegativebandat250 nm showed reduction in ellipticity, crossing over to the positive sideat the saturation. Concomitant with the intrinsic CD changes, theformation of a weak and broad positive extrinsic CD band in the 300–400 nmregionwas evident. The decrease in ellipticity of the 265 nmbandfor ds poly(A) complexation with ADG was more pronounced with thenegative 250 nmCDbandcrossingover to thepositive side. The formationof a negative induced CD band in the 300–400 nm region was seen. ThebindingofADGto the sspoly(A) showedsmall decrease inellipticity of thelong wavelength band. Thus, the CD changes revealed that ss and ds poly(A) bind differently with the two drugs depending on their functionalgroups. These resultsmaybeused to establish amethod for distinguishingamong the binding modes.
3.4. Fluorescence quenching studies
Fluorescence quenching experiments provide an effective methodfor investigating the binding of small molecules to nucleic acidstructure [52]. In the complex, molecules that are free or bound on thesurface of the poly(A)may be readily available to an anionic quencher,while those bound inside may be shielded. The electrostatic barrierdue to the negative charges on the phosphate groups at the helixsurface limits the penetration of an anionic quencher into the helix.Hence, very little or no quenching may be observed in the presence ofan anionic quencher, if the binding involves stacking interactions.Consequently themagnitude of the Stern–Volmer quenching constant(Ksv) of the ligands that are bound inside will be lower than that of thefreemolecules. It has been revealed that binding to poly(A) resulted insomewhat decreased quenching of the fluorescence intensity of ADGand DAU (Fig. 2, ESI). Ksv values (Table 2) for free ADG and itscomplexes with the ss poly(A) and ds poly(A) were 61.2, 53.8 and57.8 L/mol, respectively, while the same for DAUwere 117.6, 78.0 and83.0 L/mol. This indicated that the binding of DAU to both ss and dspoly(A) hindered to some extent the accessibility of the quencher tothe bound ligand molecules suggesting deep stacking of DAU to thepolynucleotide, or in other words bound ligand molecules areconsiderably protected and sequestered away from the solventsuggesting strong binding with poly(A).
3.5. Isothermal titration calorimetry
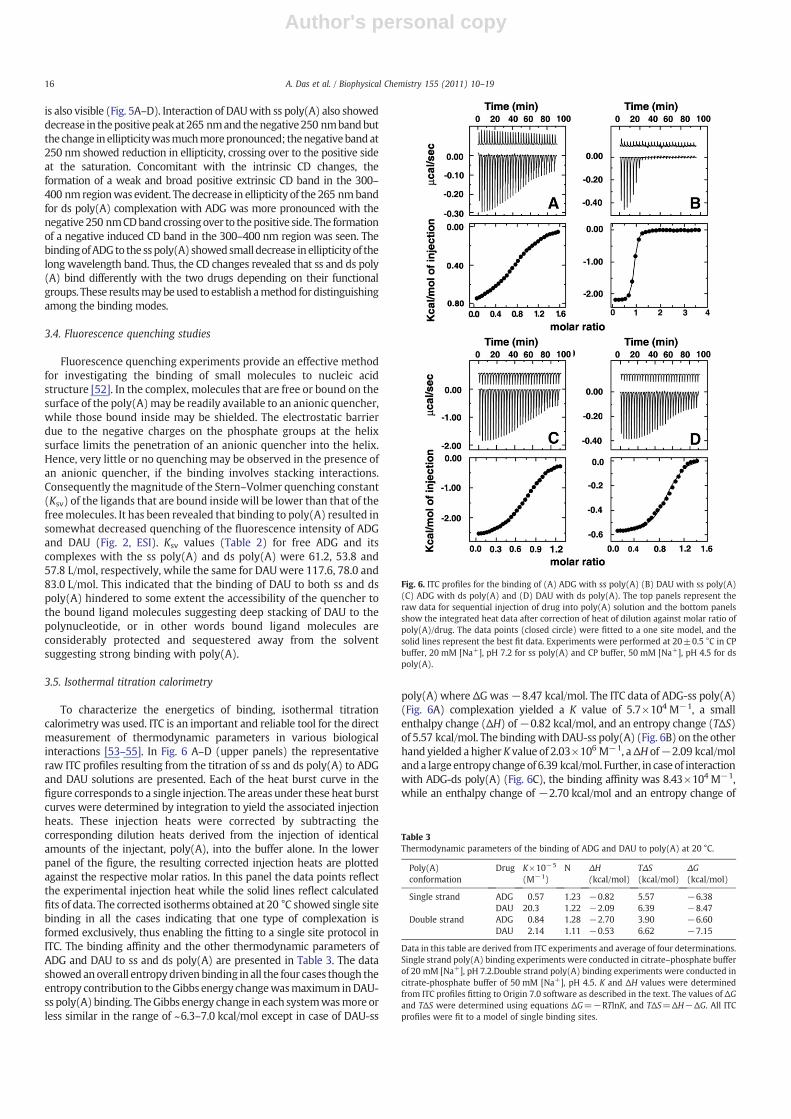
To characterize the energetics of binding, isothermal titrationcalorimetry was used. ITC is an important and reliable tool for the directmeasurement of thermodynamic parameters in various biologicalinteractions [53–55]. In Fig. 6 A–D (upper panels) the representativeraw ITC profiles resulting from the titration of ss and ds poly(A) to ADGand DAU solutions are presented. Each of the heat burst curve in thefigure corresponds to a single injection. The areas under these heat burstcurves were determined by integration to yield the associated injectionheats. These injection heats were corrected by subtracting thecorresponding dilution heats derived from the injection of identicalamounts of the injectant, poly(A), into the buffer alone. In the lowerpanel of the figure, the resulting corrected injection heats are plottedagainst the respective molar ratios. In this panel the data points reflectthe experimental injection heat while the solid lines reflect calculatedfits of data. The corrected isotherms obtained at 20 °C showed single sitebinding in all the cases indicating that one type of complexation isformed exclusively, thus enabling the fitting to a single site protocol inITC. The binding affinity and the other thermodynamic parameters ofADG and DAU to ss and ds poly(A) are presented in Table 3. The datashowedanoverall entropydrivenbinding in all the four cases though theentropy contribution to theGibbs energy changewasmaximum inDAU-ss poly(A) binding. TheGibbs energy change in each systemwasmore orless similar in the range of ~6.3–7.0 kcal/mol except in case of DAU-ss
poly(A) where ΔGwas−8.47 kcal/mol. The ITC data of ADG-ss poly(A)(Fig. 6A) complexation yielded a K value of 5.7×10⁴ M−1, a smallenthalpy change (ΔH) of−0.82 kcal/mol, and an entropy change (TΔS)of 5.57 kcal/mol. The bindingwith DAU-ss poly(A) (Fig. 6B) on the otherhand yielded a higher K value of 2.03×10⁶ M−1, aΔH of−2.09 kcal/molanda large entropy changeof 6.39 kcal/mol. Further, in case of interactionwith ADG-ds poly(A) (Fig. 6C), the binding affinity was 8.43×10⁴ M−1,while an enthalpy change of −2.70 kcal/mol and an entropy change of
Fig. 6. ITC profiles for the binding of (A) ADG with ss poly(A) (B) DAU with ss poly(A)(C) ADG with ds poly(A) and (D) DAU with ds poly(A). The top panels represent theraw data for sequential injection of drug into poly(A) solution and the bottom panelsshow the integrated heat data after correction of heat of dilution against molar ratio ofpoly(A)/drug. The data points (closed circle) were fitted to a one site model, and thesolid lines represent the best fit data. Experiments were performed at 20±0.5 °C in CPbuffer, 20 mM [Na+], pH 7.2 for ss poly(A) and CP buffer, 50 mM [Na+], pH 4.5 for dspoly(A).
Table 3Thermodynamic parameters of the binding of ADG and DAU to poly(A) at 20 °C.
Poly(A)conformation
Drug K×10−5
(M−1)N ΔH
(kcal/mol)TΔS(kcal/mol)
ΔG(kcal/mol)
Single strand ADG 0.57 1.23 −0.82 5.57 −6.38DAU 20.3 1.22 −2.09 6.39 −8.47
Double strand ADG 0.84 1.28 −2.70 3.90 −6.60DAU 2.14 1.11 −0.53 6.62 −7.15
Data in this table are derived from ITC experiments and average of four determinations.Single strand poly(A) binding experiments were conducted in citrate–phosphate bufferof 20 mM [Na+], pH 7.2.Double strand poly(A) binding experiments were conducted incitrate-phosphate buffer of 50 mM [Na+], pH 4.5. K and ΔH values were determinedfrom ITC profiles fitting to Origin 7.0 software as described in the text. The values of ΔGand TΔS were determined using equations ΔG=−RTlnK, and TΔS=ΔH−ΔG. All ITCprofiles were fit to a model of single binding sites.
16 A. Das et al. / Biophysical Chemistry 155 (2011) 10–19
Author's personal copy
3.90 kcal/mol were obtained. Binding of DAU-ds poly(A) on the otherhand showed (Fig. 6D) a binding affinity of 2.14×10⁵ M−1, an enthalpychange of −0.53 kcal/mol and an entropy change of 6.62 kcal/mol. Thebinding affinity values at 20 °Cevaluated fromthe ITCdata (Table 3) are ingood agreement with those evaluated from the spectroscopic data(Table 2). The binding was exothermic and the stoichiometry was foundto be 1 mol of ligand binding per mol of poly(A) in all the cases. Thesevalues are in good agreement with the values obtained from Scatchardand Jobplot analysis. Itmaybenoted thatDAU-sspoly(A) complexhas thehighest binding affinity in agreement with that revealed from spectro-scopic experiments.
3.6. Salt dependent ITC studies: role of electrostatic interaction
DAU has a positive charge on its daunosamine sugar moiety [56].ADG is apparently uncharged, but in presence of nucleic acids theformation of a weak positive charge at the N6 position has beenproposed [57]. An ion pair formation between the quaternary N6 ofADG and phosphate oxygen of nucleic acids appears to be the drivingforce in its interaction. To understand the role of electrostaticinteraction in the binding process, salt dependence of the binding ofADG and DAUwith ss poly(A) at four [Na+] concentrations viz, 10, 20,30 and 50 mM was studied by ITC experiments. The results arepresented in Table 4. The binding constant moderately decreased asthe salt concentration increased and the plot of ln K versus ln [Na+]gave straight lines in both cases (Fig. 3, ESI) with slopes of−0.36 and−0.62 equivalent to the number of sodium ions released. The numberof ions released in case of DAU is in agreement with its single positivecharge and the result of ADG study reveals the presence of a weakpositive charge in the molecule. For double stranded DNA, it has beenreported that ADG releases about 0.49 units of monovalent ions [57].At all salt concentrations studied the bindingwas exothermic showingsingle mode of binding for both compounds.
The thermodynamic parameters elucidated from the ITC analysisare presented in Table 4. The binding affinity decreased only by 40% inADGwhile there was a drop of about 65% in the case of DAU indicatinga stronger role of the electrostatic interaction for the complexation ofthe latter. For both ADG and DAU, the enthalpy contribution to theGibbs energy of the binding decreased and the entropy contributionincreased; the change was much larger for ADG compared to DAU(Table 4). The parsing of the contribution to the Gibbs energy in termsof polyelectrolyte and non-polyelectrolyte forces indicated that thepolyelectrolyte contribution to the binding free energy was signifi-cantly smaller in both cases but the same was higher for DAUcompared to ADG (Fig. 4, ESI). In both cases the non-polyelectrolyticcontribution remained invariant with the salt concentration. Thus, themajor contribution to the binding free energy comes from forces otherthan the electrostatic interactions. This is in agreement with previousreports [58–60].
3.7. Temperature dependent ITC studies: heat capacity changes
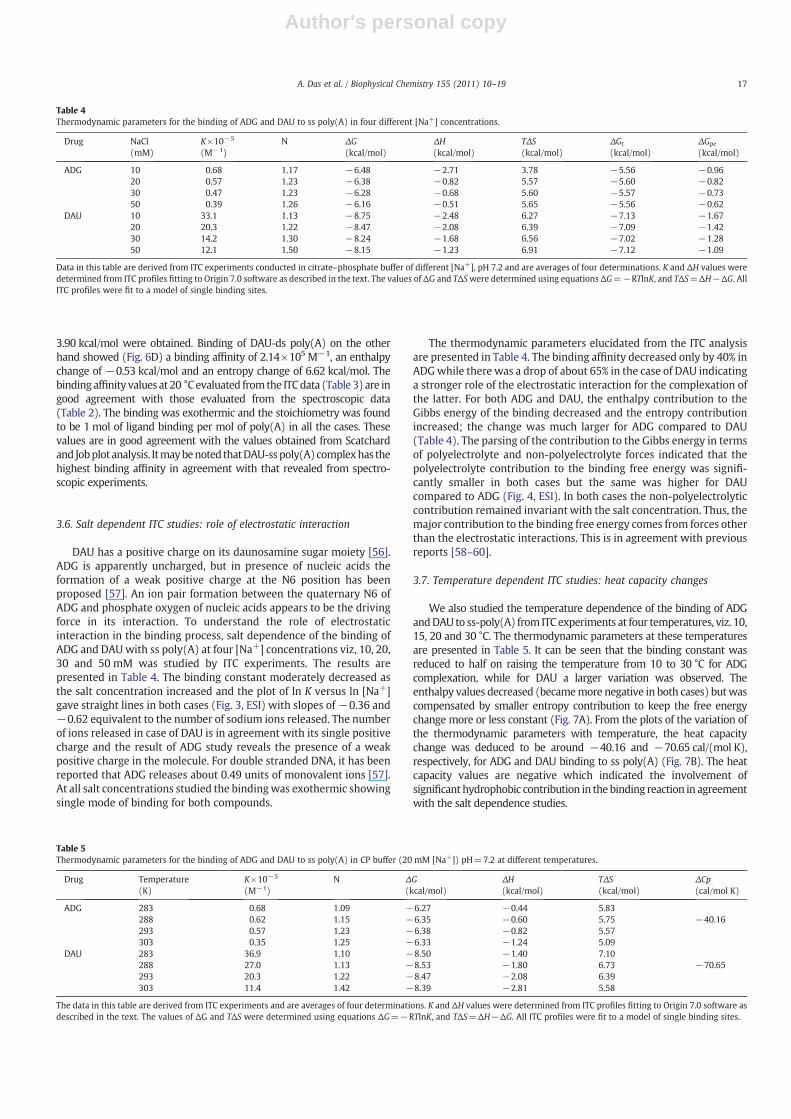
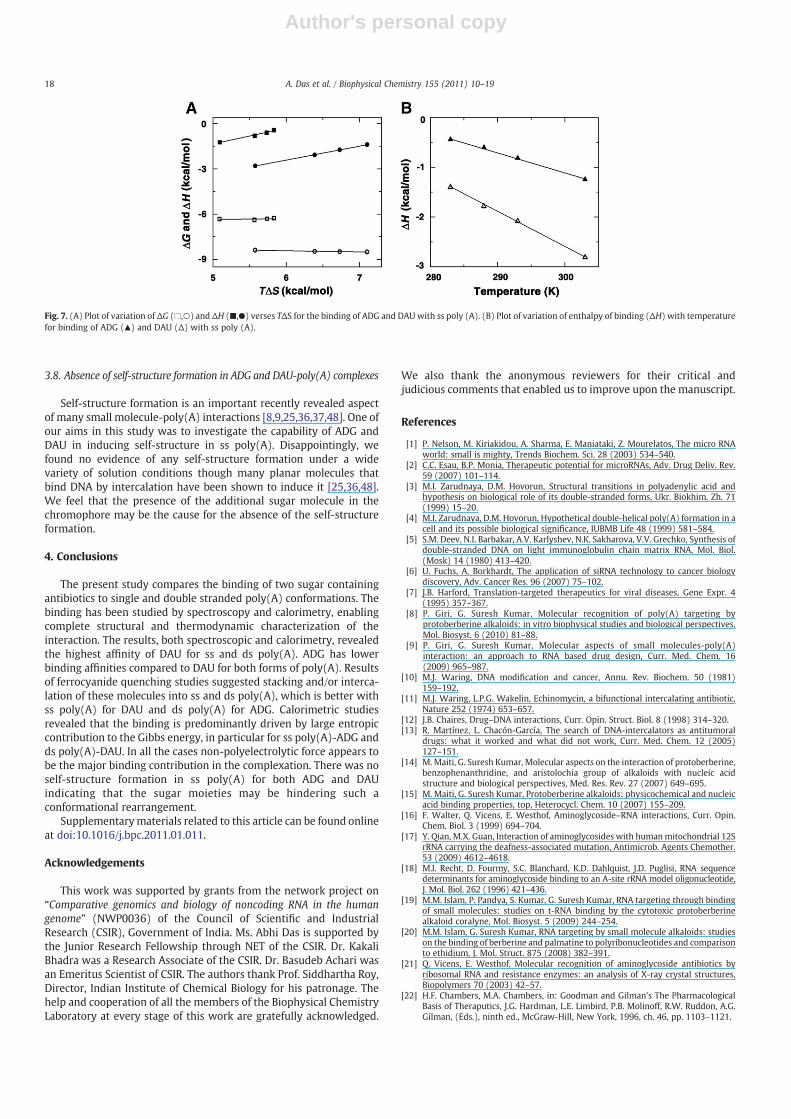
We also studied the temperature dependence of the binding of ADGandDAU to ss-poly(A) from ITC experiments at four temperatures, viz. 10,15, 20 and 30 °C. The thermodynamic parameters at these temperaturesare presented in Table 5. It can be seen that the binding constant wasreduced to half on raising the temperature from 10 to 30 °C for ADGcomplexation, while for DAU a larger variation was observed. Theenthalpy values decreased (becamemore negative in both cases) butwascompensated by smaller entropy contribution to keep the free energychange more or less constant (Fig. 7A). From the plots of the variation ofthe thermodynamic parameters with temperature, the heat capacitychange was deduced to be around −40.16 and −70.65 cal/(mol K),respectively, for ADG and DAU binding to ss poly(A) (Fig. 7B). The heatcapacity values are negative which indicated the involvement ofsignificant hydrophobic contribution in the binding reaction in agreementwith the salt dependence studies.
Table 4Thermodynamic parameters for the binding of ADG and DAU to ss poly(A) in four different [Na+] concentrations.
Drug NaCl(mM)
K×10−5
(M−1)N ΔG
(kcal/mol)ΔH(kcal/mol)
TΔS(kcal/mol)
ΔGt
(kcal/mol)ΔGpe
(kcal/mol)
ADG 10 0.68 1.17 −6.48 −2.71 3.78 −5.56 −0.9620 0.57 1.23 −6.38 −0.82 5.57 −5.60 −0.8230 0.47 1.23 −6.28 −0.68 5.60 −5.57 −0.7350 0.39 1.26 −6.16 −0.51 5.65 −5.56 −0.62
DAU 10 33.1 1.13 −8.75 −2.48 6.27 −7.13 −1.6720 20.3 1.22 −8.47 −2.08 6.39 −7.09 −1.4230 14.2 1.30 −8.24 −1.68 6.56 −7.02 −1.2850 12.1 1.50 −8.15 −1.23 6.91 −7.12 −1.09
Data in this table are derived from ITC experiments conducted in citrate–phosphate buffer of different [Na+], pH 7.2 and are averages of four determinations. K and ΔH values weredetermined from ITC profiles fitting to Origin 7.0 software as described in the text. The values ofΔG and TΔSwere determined using equations ΔG=−RTlnK, and TΔS=ΔH−ΔG. AllITC profiles were fit to a model of single binding sites.
Table 5Thermodynamic parameters for the binding of ADG and DAU to ss poly(A) in CP buffer (20 mM [Na+]) pH=7.2 at different temperatures.
Drug Temperature(K)
K×10−5
(M−1)N ΔG
(kcal/mol)ΔH(kcal/mol)
TΔS(kcal/mol)
ΔCp(cal/mol K)
ADG 283 0.68 1.09 −6.27 −0.44 5.83288 0.62 1.15 −6.35 −0.60 5.75 −40.16293 0.57 1.23 −6.38 −0.82 5.57303 0.35 1.25 −6.33 −1.24 5.09
DAU 283 36.9 1.10 −8.50 −1.40 7.10288 27.0 1.13 −8.53 −1.80 6.73 −70.65293 20.3 1.22 −8.47 −2.08 6.39303 11.4 1.42 −8.39 −2.81 5.58
The data in this table are derived from ITC experiments and are averages of four determinations. K and ΔH values were determined from ITC profiles fitting to Origin 7.0 software asdescribed in the text. The values of ΔG and TΔS were determined using equations ΔG=−RTlnK, and TΔS=ΔH−ΔG. All ITC profiles were fit to a model of single binding sites.
17A. Das et al. / Biophysical Chemistry 155 (2011) 10–19
Author's personal copy
3.8. Absence of self-structure formation in ADG and DAU-poly(A) complexes
Self-structure formation is an important recently revealed aspectof many small molecule-poly(A) interactions [8,9,25,36,37,48]. One ofour aims in this study was to investigate the capability of ADG andDAU in inducing self-structure in ss poly(A). Disappointingly, wefound no evidence of any self-structure formation under a widevariety of solution conditions though many planar molecules thatbind DNA by intercalation have been shown to induce it [25,36,48].We feel that the presence of the additional sugar molecule in thechromophore may be the cause for the absence of the self-structureformation.
4. Conclusions
The present study compares the binding of two sugar containingantibiotics to single and double stranded poly(A) conformations. Thebinding has been studied by spectroscopy and calorimetry, enablingcomplete structural and thermodynamic characterization of theinteraction. The results, both spectroscopic and calorimetry, revealedthe highest affinity of DAU for ss and ds poly(A). ADG has lowerbinding affinities compared to DAU for both forms of poly(A). Resultsof ferrocyanide quenching studies suggested stacking and/or interca-lation of these molecules into ss and ds poly(A), which is better withss poly(A) for DAU and ds poly(A) for ADG. Calorimetric studiesrevealed that the binding is predominantly driven by large entropiccontribution to the Gibbs energy, in particular for ss poly(A)-ADG andds poly(A)-DAU. In all the cases non-polyelectrolytic force appears tobe the major binding contribution in the complexation. There was noself-structure formation in ss poly(A) for both ADG and DAUindicating that the sugar moieties may be hindering such aconformational rearrangement.
Supplementarymaterials related to this article can be found onlineat doi:10.1016/j.bpc.2011.01.011.
Acknowledgements
This work was supported by grants from the network project on“Comparative genomics and biology of noncoding RNA in the humangenome” (NWP0036) of the Council of Scientific and IndustrialResearch (CSIR), Government of India. Ms. Abhi Das is supported bythe Junior Research Fellowship through NET of the CSIR. Dr. KakaliBhadra was a Research Associate of the CSIR. Dr. Basudeb Achari wasan Emeritus Scientist of CSIR. The authors thank Prof. Siddhartha Roy,Director, Indian Institute of Chemical Biology for his patronage. Thehelp and cooperation of all the members of the Biophysical ChemistryLaboratory at every stage of this work are gratefully acknowledged.
We also thank the anonymous reviewers for their critical andjudicious comments that enabled us to improve upon the manuscript.
References
[1] P. Nelson, M. Kiriakidou, A. Sharma, E. Maniataki, Z. Mourelatos, The micro RNAworld: small is mighty, Trends Biochem. Sci. 28 (2003) 534–540.
[2] C.C. Esau, B.P. Monia, Therapeutic potential for microRNAs, Adv. Drug Deliv. Rev.59 (2007) 101–114.
[3] M.I. Zarudnaya, D.M. Hovorun, Structural transitions in polyadenylic acid andhypothesis on biological role of its double-stranded forms, Ukr. Biokhim. Zh. 71(1999) 15–20.
[4] M.I. Zarudnaya, D.M. Hovorun, Hypothetical double-helical poly(A) formation in acell and its possible biological significance, IUBMB Life 48 (1999) 581–584.
[5] S.M. Deev, N.I. Barbakar, A.V. Karlyshev, N.K. Sakharova, V.V. Grechko, Synthesis ofdouble-stranded DNA on light immunoglobulin chain matrix RNA, Mol. Biol.(Mosk) 14 (1980) 413–420.
[6] U. Fuchs, A. Borkhardt, The application of siRNA technology to cancer biologydiscovery, Adv. Cancer Res. 96 (2007) 75–102.
[7] J.B. Harford, Translation-targeted therapeutics for viral diseases, Gene Expr. 4(1995) 357–367.
[8] P. Giri, G. Suresh Kumar, Molecular recognition of poly(A) targeting byprotoberberine alkaloids: in vitro biophysical studies and biological perspectives,Mol. Biosyst. 6 (2010) 81–88.
[9] P. Giri, G. Suresh Kumar, Molecular aspects of small molecules-poly(A)interaction: an approach to RNA based drug design, Curr. Med. Chem. 16(2009) 965–987.
[10] M.J. Waring, DNA modification and cancer, Annu. Rev. Biochem. 50 (1981)159–192.
[11] M.J. Waring, L.P.G. Wakelin, Echinomycin, a bifunctional intercalating antibiotic,Nature 252 (1974) 653–657.
[12] J.B. Chaires, Drug–DNA interactions, Curr. Opin. Struct. Biol. 8 (1998) 314–320.[13] R. Martínez, L. Chacón-García, The search of DNA-intercalators as antitumoral
drugs: what it worked and what did not work, Curr. Med. Chem. 12 (2005)127–151.
[14] M.Maiti, G. Suresh Kumar, Molecular aspects on the interaction of protoberberine,benzophenanthridine, and aristolochia group of alkaloids with nucleic acidstructure and biological perspectives, Med. Res. Rev. 27 (2007) 649–695.
[15] M. Maiti, G. Suresh Kumar, Protoberberine alkaloids: physicochemical and nucleicacid binding properties, top, Heterocycl. Chem. 10 (2007) 155–209.
[16] F. Walter, Q. Vicens, E. Westhof, Aminoglycoside–RNA interactions, Curr. Opin.Chem. Biol. 3 (1999) 694–704.
[17] Y. Qian, M.X. Guan, Interaction of aminoglycosides with humanmitochondrial 12SrRNA carrying the deafness-associated mutation, Antimicrob. Agents Chemother.53 (2009) 4612–4618.
[18] M.I. Recht, D. Fourmy, S.C. Blanchard, K.D. Dahlquist, J.D. Puglisi, RNA sequencedeterminants for aminoglycoside binding to an A-site rRNA model oligonucleotide,J. Mol. Biol. 262 (1996) 421–436.
[19] M.M. Islam, P. Pandya, S. Kumar, G. Suresh Kumar, RNA targeting through bindingof small molecules: studies on t-RNA binding by the cytotoxic protoberberinealkaloid coralyne, Mol. Biosyst. 5 (2009) 244–254.
[20] M.M. Islam, G. Suresh Kumar, RNA targeting by small molecule alkaloids: studieson the binding of berberine and palmatine to polyribonucleotides and comparisonto ethidium, J. Mol. Struct. 875 (2008) 382–391.
[21] Q. Vicens, E. Westhof, Molecular recognition of aminoglycoside antibiotics byribosomal RNA and resistance enzymes: an analysis of X-ray crystal structures,Biopolymers 70 (2003) 42–57.
[22] H.F. Chambers, M.A. Chambers, in: Goodman and Gilman's The PharmacologicalBasis of Theraputics, J.G. Hardman, L.E. Limbird, P.B. Molinoff, R.W. Ruddon, A.G.Gilman, (Eds.), ninth ed., McGraw-Hill, New York, 1996, ch. 46, pp. 1103–1121.
Fig. 7. (A) Plot of variation of ΔG (□,○) and ΔH (■,●) verses TΔS for the binding of ADG and DAUwith ss poly (A). (B) Plot of variation of enthalpy of binding (ΔH) with temperaturefor binding of ADG (▲) and DAU (Δ) with ss poly (A).
18 A. Das et al. / Biophysical Chemistry 155 (2011) 10–19

Author's personal copy
[23] P. Giri, M. Hossain, G. Suresh Kumar, Molecular aspects on the specific interaction ofcytotoxic plant alkaloids palmatine to poly(A), Int. J. Biol. Macromol. 39 (2006)210–221.
[24] P. Giri, M. Hossain, G. Suresh Kumar, RNA specific molecules: cytotoxic plant alkaloidpalmatine binds strongly to poly(A), Bioorg. Med. Chem. Lett. 16 (2006) 2364–2368.
[25] P. Giri, G. Suresh Kumar, Self-structure induction in single stranded poly(A) bysmall molecules: studies on DNA intercalators, partial intercalators and groovebinding molecules, Arch. Biochem. Biophys. 474 (2008) 183–192.
[26] P. Giri, G. Suresh Kumar, Binding of protoberberine alkaloid coralyne with doublestranded poly(A): a biophysical study, Mol. Biosyst. 4 (2008) 341–348.
[27] R.C. Yadav, G. Suresh Kumar, K. Bhadra, P. Giri, R. Sinha, S. Pal, M. Maiti, Berberine,a strong polyriboadenylic acid binding plant alkaloid: spectroscopic, viscometric,and thermodynamic study, Bioorg. Med. Chem. 13 (2005) 165–174.
[28] P. Giri, G. Suresh Kumar, Spectroscopic and calorimetric studies on the binding ofthe phototoxic and cytotoxic plant alkaloid sanguinarine with double helical poly(A), J. Photochem. Photobiol. A Chem. 194 (2008) 111–121.
[29] M. Wickens, P. Anderson, R.J. Jackson, Life and death in the cytoplasma: messagesfrom the 3′ end, Curr. Opin. Genet. Dev. 7 (1997) 220–232.
[30] K.Dower,N.Kuperwasser,H.Merrikh,M.Rosbash, A synthetic tail rescues yeastnuclearaccumulation of ribozyme-terminated transcript, RNA 10 (2004) 1888–1899.
[31] S.L. Topalian, S. Kaneko,M.I. Gonzales, G.L. Bond, Y.Ward, J.L.Manley, Identification andfunctional characterization of neo-Poly(A) polymerase, an RNA processing enzymeoverexpressed in human tumors, Mol. Cell. Biol. 21 (2001) 5614–5623.
[32] S.L. Topalian, M.I. Gonzales, Y. Ward, X. Wang, R.F. Wang, Revelation of a crypticmajor histocompatibility complex class II-restricted tumor epitope in a novel RNAprocessing enzyme, Cancer Res. 62 (2002) 5505–5509.
[33] W. Saenger, Principles of Nucleic Acid Structure, Springer-Verlag, New York, 1984.[34] A.G. Petrovic, P.L. Polavarapu, Structural transitions in polyriboadenylic acid
induced by the changes in pH and temperature: vibrational circular dichroismstudy in solution and film states, J. Phys. Chem. B 109 (2005) 23698–23705.
[35] W.M. Scovell, Structural and conformational studies of polyriboadenylic acid inneutral and acid solution, Biopolymers 17 (1978) 969–984.
[36] F. Xing, G. Song, J. Ren, J.B. Chaires, X. Qu, Molecular recognition of nucleic acids:coralyne binds strongly to poly(A), FEBS Lett. 579 (2005) 5035–5039.
[37] H. Xi, D. Grey, S. Kumar, D.P. Arya, Molecular recognition of single stranded RNA:neomycin binding to poly(A), FEBS Lett. 583 (2009) 2269–2275.
[38] C. Ciatto, M.L. D'Amico, G. Natile, F. Secco, M. Venturini, Intercalation of proflavineand a platinum derivative of proflavine into double-helical Poly(A), Biophys. J. 77(1999) 2717–2724.
[39] S.C. Pakrashi, P. Ghosh-Dastidar, S. Basu, B. Achari, New phenanthrene derivativesfrom Aristolochia indica, Phytochemical 16 (1977) 1103–1104.
[40] B. Achari, S. Bandyopadhyay, A.K. Chakraborty, S.C. Pakrashi, Carbon-13 NMRspectra of some phenanthrene derivatives from Aristolochia indica and theiranalogues, Org. Mag. Reson. 22 (1984) 741–746.
[41] K. Bhadra, G. Suresh Kumar, S. Das, M.M. Islam, M. Maiti, Protonated structures ofnaturally occurring deoxyribonucleic acids and their interaction with berberine,Bioorg. Med. Chem. 13 (2005) 4851–4863.
[42] J.D. McGhee, P.H. von Hippel, Theoretical aspects of DNA–protein interactions:cooperative and noncooperative binding of large ligands to a one dimensionalhomogeneous lattice, J. Mol. Biol. 86 (1974) 469–489.
[43] H.A. Benesi, J.H. Hildebrand, A spectrophotometric investigation of the interaction ofiodine with aromatic hydrocarbons, J. Am. Chem. Soc. 71 (1949) 2703–2707.
[44] S.M. Hoenigman, C.E. Evans, Improved accuracy and precision in the determination ofassociation constants, Anal. Chem. 68 (1996) 3274–3276.
[45] R. Sinha, M.M. Islam, K. Bhadra, G. Suresh Kumar, A. Banerjee, M. Maiti, Thebinding of DNA intercalating and non-intercalating compounds to A-form andprotonated form of poly(rC).poly(rG): spectroscopic and viscometric study,Bioorg. Med. Chem. 14 (2006) 800–814.
[46] P. Job, Formation and stability of inorganic complexes in solution, Ann. Chim. 9(1928) 113–203.
[47] C.Y. Huang, in: S.P. Colowick, N.O. Kaplan (Eds.), Determination of BindingStoichiometry by the Continuous Variation Method: The Job Plot, MethodsEnzymol., 87, Academic Press, 1982, pp. 509–525.
[48] P. Giri, G. Suresh Kumar, Specific binding and self-structure induction to poly(A)by the cytotoxic plant alkaloid sanguinarine, Biochim. Biophys. Acta 1770 (2007)1419–1426.
[49] M.M. Islam, R. Sinha, G. Suresh Kumar, RNA binding small molecules: studies on t-RNAbinding by cytotoxic plant alkaloids berberine, palmatine and the comparison toethidium, Biophys. Chem. 125 (2007) 508–520.
[50] K. Bhadra, M. Maiti, G. Suresh Kumar, Molecular recognition of DNA by smallmolecules: AT base pair specific intercalative binding of cytotoxic plant alkaloidpalmatine, Biochim. Biophys. Acta 1770 (2007) 1071–1080.
[51] S. Das, G. Suresh Kumar, Molecular aspects on the interaction of phenosafranine todeoxyribonucleic acid: model for intercalative drug–DNA binding, J. Mol. Struct.872 (2008) 56–63.
[52] J.R. Lakowicz, Principles of Fluorescence Spectroscopy, first ed.Plenum Press, NewYork, 1983.
[53] N.J. Buurma, I. Haq, Advance in the analysis of isothermal titration calorimetrydata for ligand–DNA interactions, Methods 42 (2007) 162–172.
[54] A.L. Faig, Applications of isothermal titration calorimetry in RNA biochemistry andbiophysics, Biopolymers 87 (2007) 293–301.
[55] K. Bhadra, G. Suresh Kumar, Isoquinoline alkaloids and their binding with DNA:calorimetry and thermal analysis applications, Mini Rev. Med. Chem. 10 (2010)1235–1247.
[56] J.B. Chaires, Biophysical chemistry of the daunomycin–DNA interaction, Biophys.Chem. 35 (1990) 191–202.
[57] S. Chakraborty, R. Nandi, M. Maiti, Thermodynamics of the interaction ofaristololactam-β-D-glucosidewithDNA, Biochem. Pharmacol. 39 (1990) 1181–1186.
[58] J.B. Chaires, Energetics of drug–DNA interactions, Biopolymers 44 (1997) 201–215.[59] J. Ren, T.C. Jenkins, J.B. Chaires, Energetics of DNA intercalation reactions,
Biochemistry 39 (2000) 8439–8447.[60] P.H. Lin, Y.H. Kao, Y. Chang, Y.C. Cheng, C.C. Chien, W.Y. Chen, Daunomycin
interaction with DNA: microcalorimetric studies of the thermodynamics andbinding mechanism, Biotechnol. J. 5 (2010) 1069–1077.
19A. Das et al. / Biophysical Chemistry 155 (2011) 10–19