Effect of metallurgical factors on the bulk magnetic properties of non-oriented electrical steels
10
Effect of metallurgical factors on the bulk magnetic properties of non-oriented electrical steels Pampa Ghosh a,n , Richard R. Chromik a,n , Andrew M. Knight b , Shekhar G. Wakade c a Department of Mining and Materials Engineering, McGill University, 3610 University Street, Montreal, Que., Canada H3A 0C5 b Department of Electrical and Computer Engineering, University of Alberta, Edmonton, Alta., Canada T6G 2V4 c GM Powertrain, General Motors Company, 823 Joslyn Avenue, Building B, 4AJ35, Pontiac, MI 48340-2920, USA article info Article history: Received 27 August 2013 Received in revised form 13 December 2013 Available online 30 December 2013 Keywords: Non-oriented electrical steel Si-content Grain size Crystallographic texture Magnetic property abstract Non-oriented electrical steel (NOES) is one of the most common material used in electrical motors. Core loss and permeability are the most important properties that the motor manufacturers look for. Both these properties are structure sensitive and depend on several metallurgical factors; such as chemistry, grain size, crystallographic texture, cleanliness and stress states in non-oriented electrical steels. It has been observed in this course of the study that the grain size and Si content of NOES are the primary controlling factors to core loss, especially at higher frequencies. On the contrary, crystallographic texture plays an important role at lower frequencies. At higher frequency, core loss increases with increasing grain size and decreasing Si content of the steels. Small difference in grain size ( 50 μm) at lower frequency range has little influence on the magnetic properties but has significant adverse effect as frequency reaches high enough. & 2013 Elsevier B.V. All rights reserved. 1. Introduction Electrical steels play an important role in the generation, transmission and distribution of electrical power and are among the most important magnetic materials produced today. These steels are essentially Fe–Si alloys with varying Si percentage (normally 1–3.5%) and possess certain magnetic properties which allow them to be employed as the flux carrying core of the electrical machines; such as transformers, electrical motors, etc. Depending on the requirement of magnetic properties, electrical steels can be classified into two broad categories; Grain oriented electrical steel (GOES) and non-grain oriented electrical steel (NOES) [1]. Grain oriented electrical steels are mainly used in the core materials of transformers and are designed in such a way that they have highly improved magnetic properties (e.g. high perme- ability, low core loss) along one direction (normally along rolling direction (RD)). On the contrary, non-oriented electrical steels are used in electric motors where the magnetization vector changes its direction continuously with time. This application thus demands uniform magnetic properties along the strip surface, not in a specific direction like GO electrical steels. This enables the magnetic NOES rotor core (as in the case of motors) to achieve a low average core loss value [2,3]. The non-oriented electrical steels share 80% of the world 0 s total electrical steels production [4]. Electric motors and drives become increasingly popular in various modes of transport, whether it is road, aircraft, marine or rail. The hybrid electric car gives fuel economy advantage over the conventional ones whereas the replacement of hydraulic and mechanical systems with electrical alternatives in aircrafts increases the efficiency of the pumping system and reduce the overall mass of the aircrafts. The most rail systems worldwide are now electrically driven with induction motors drives whereas in marine transports, ships engine now drives a generator which in turn feeds the propeller. According to US Department of Energy, electric motors consume over half of all electricity generated. The relatively high efficiency of electrical motors along with their environment friendliness makes them one of the most desirable choices for these applications [5,6]. A new proposed efficiency class in Europe (IE4) [IEC 60034-30] requires significant improvements in efficiency over existing equipment, e.g. for a 75 kW motor, losses must be reduced by more than 50%. As a result, it is important for motor manufacturers to have an improved understanding of the relationship between microstructure, manufacturing processes and macro-magnetic properties of electrical steels. Typical magnetic properties of interests for a motor manufac- turer are the core loss and the permeability [7,8]. Both these properties are structure sensitive and depend on several metal- lurgical factors; such as chemistry, grain size, crystallographic texture, cleanliness and stress states in non-oriented electrical Contents lists available at ScienceDirect journal homepage: www.elsevier.com/locate/jmmm Journal of Magnetism and Magnetic Materials 0304-8853/$ - see front matter & 2013 Elsevier B.V. All rights reserved. http://dx.doi.org/10.1016/j.jmmm.2013.12.052 n Corresponding authors. E-mail addresses: [email protected] (P. Ghosh), [email protected] (R.R. Chromik). Journal of Magnetism and Magnetic Materials 356 (2014) 42–51
-
Upload
independent -
Category
Documents
-
view
2 -
download
0
Transcript of Effect of metallurgical factors on the bulk magnetic properties of non-oriented electrical steels
Effect of metallurgical factors on the bulk magnetic propertiesof non-oriented electrical steels
Pampa Ghosh a,n, Richard R. Chromik a,n, Andrew M. Knight b, Shekhar G. Wakade c
a Department of Mining and Materials Engineering, McGill University, 3610 University Street, Montreal, Que., Canada H3A 0C5b Department of Electrical and Computer Engineering, University of Alberta, Edmonton, Alta., Canada T6G 2V4c GM Powertrain, General Motors Company, 823 Joslyn Avenue, Building B, 4AJ35, Pontiac, MI 48340-2920, USA
a r t i c l e i n f o
Article history:Received 27 August 2013Received in revised form13 December 2013Available online 30 December 2013
Keywords:Non-oriented electrical steelSi-contentGrain sizeCrystallographic textureMagnetic property
a b s t r a c t
Non-oriented electrical steel (NOES) is one of the most common material used in electrical motors. Coreloss and permeability are the most important properties that the motor manufacturers look for. Boththese properties are structure sensitive and depend on several metallurgical factors; such as chemistry,grain size, crystallographic texture, cleanliness and stress states in non-oriented electrical steels. It hasbeen observed in this course of the study that the grain size and Si content of NOES are the primarycontrolling factors to core loss, especially at higher frequencies. On the contrary, crystallographic textureplays an important role at lower frequencies. At higher frequency, core loss increases with increasinggrain size and decreasing Si content of the steels. Small difference in grain size (�50 μm) at lowerfrequency range has little influence on the magnetic properties but has significant adverse effect asfrequency reaches high enough.
& 2013 Elsevier B.V. All rights reserved.
1. Introduction
Electrical steels play an important role in the generation,transmission and distribution of electrical power and are amongthe most important magnetic materials produced today. Thesesteels are essentially Fe–Si alloys with varying Si percentage(normally 1–3.5%) and possess certain magnetic properties whichallow them to be employed as the flux carrying core of theelectrical machines; such as transformers, electrical motors, etc.Depending on the requirement of magnetic properties, electricalsteels can be classified into two broad categories; Grain orientedelectrical steel (GOES) and non-grain oriented electrical steel(NOES) [1]. Grain oriented electrical steels are mainly used in thecore materials of transformers and are designed in such a way thatthey have highly improved magnetic properties (e.g. high perme-ability, low core loss) along one direction (normally along rollingdirection (RD)). On the contrary, non-oriented electrical steels areused in electric motors where the magnetization vector changesits direction continuously with time. This application thusdemands uniform magnetic properties along the strip surface,not in a specific direction like GO electrical steels. This enables themagnetic NOES rotor core (as in the case of motors) to achieve a
low average core loss value [2,3]. The non-oriented electrical steelsshare 80% of the world0s total electrical steels production [4].
Electric motors and drives become increasingly popular invarious modes of transport, whether it is road, aircraft, marineor rail. The hybrid electric car gives fuel economy advantage overthe conventional ones whereas the replacement of hydraulic andmechanical systems with electrical alternatives in aircraftsincreases the efficiency of the pumping system and reduce theoverall mass of the aircrafts. The most rail systems worldwide arenow electrically driven with induction motors drives whereas inmarine transports, ships engine now drives a generator which inturn feeds the propeller. According to US Department of Energy,electric motors consume over half of all electricity generated. Therelatively high efficiency of electrical motors along with theirenvironment friendliness makes them one of the most desirablechoices for these applications [5,6].
A new proposed efficiency class in Europe (IE4) [IEC 60034-30]requires significant improvements in efficiency over existingequipment, e.g. for a 75 kW motor, losses must be reduced bymore than 50%. As a result, it is important for motor manufacturersto have an improved understanding of the relationship betweenmicrostructure, manufacturing processes and macro-magneticproperties of electrical steels.
Typical magnetic properties of interests for a motor manufac-turer are the core loss and the permeability [7,8]. Both theseproperties are structure sensitive and depend on several metal-lurgical factors; such as chemistry, grain size, crystallographictexture, cleanliness and stress states in non-oriented electrical
Contents lists available at ScienceDirect
journal homepage: www.elsevier.com/locate/jmmm
Journal of Magnetism and Magnetic Materials
0304-8853/$ - see front matter & 2013 Elsevier B.V. All rights reserved.http://dx.doi.org/10.1016/j.jmmm.2013.12.052
n Corresponding authors.E-mail addresses: [email protected] (P. Ghosh),
[email protected] (R.R. Chromik).
Journal of Magnetism and Magnetic Materials 356 (2014) 42–51
steels [7–9]. Traditionally, core loss (or iron loss/watt loss) isdivided into two components; hysteresis loss and eddy currentloss. However, effect of metallurgical factors on these two compo-nents does not always follow similar trends and very often anoptimum value of these metallurgical variables (e.g. grain size) isrequired to achieve best magnetic properties in NOES.
Chemistry is a primary factor that affects magnetic properties.While low carbon content (C%o0.01 wt%) is essential for NOES, itis the Si percentage that primarily dictates the core loss.Si decreases magneto-crystalline constant which is directly pro-portional to hysteresis loss and increases resistivity which isinversely proportional to the eddy current loss. The net result isa decrease in core loss with increasing Si content. However, Sireduces the saturation magnetization which in turn decreasespermeability [2,10]. Thus depending on the requirements, Sipercentage can be optimized in NOES. Aluminum has similareffect to Si [10,11], but to a lesser degree. Al is believed to influencethe core loss by grain coarsening, texture [12] and/or by changingthe amount and distribution of the impurities [12–14]. Phosphorusand Mn are reported to decrease the core loss by reducing theeddy current component of the loss [7]. Interstitial elements insteel like C, S, O and N, are considered to cause lattice distortionand this way decrease permeability. Apart from that, they can formsmall particles along with other elements (such as Fe, Mn, Al, etc.)and affect the magnetization process by pinning domain move-ment [15]. However, few researchers [13,16] have observed thathigher content of O, N and even S results in a better core loss (i.e.low) which is attributed to formation of coarse precipitates/inclusions and their sparse distribution in the matrix.
Grain size has opposite effects on hysteresis and eddy currentcomponents of the core loss; while hysteresis loss decreases withincreasing grain size, eddy current loss increases. As a result ofthese, the core loss reaches a minimum at some optimum grainsize. However, the optimal grain size varies with chemistry andtexture in these steels [1,2].
Crystallographic texture is another important variable to con-trol magnetic properties in NOES. The (200) planes show thelowest core loss while (211) and (111) planes show the highest loss[2]. This is a well-known fact that ⟨100⟩ directions are the easy axisof magnetization while ⟨111⟩ is the hardest [17]. Crystal planeswith (100) and (110) orientations posses two and one ⟨100⟩direction, respectively while (111) and (211) planes contain none.Moreover, (211) planes contain ⟨111⟩ direction, the hard directionof magnetization. This is why (100) planes have the lowest coreloss followed by (110) and (111) planes for a constant fieldintensity value. The loss is the highest in case of (211) orientedplanes as these planes not only contain any ⟨100⟩ easy magnetiza-tion direction but also contain ⟨111⟩ direction, the hard direction ofmagnetization. In rotating applications the flux lines are more orless distributed in the laminated sheets. Thus in rotating applica-tions such as motors, the useful texture to be developed is thecube fiber texture, in which the {001} planes are parallel to therolling plane. This configuration gives rise to low average core lossin NOES.
The cleanliness is determined by the presence of second phaseparticles in the iron matrix; lower their fraction, the cleaner arethe steels. These particles are essentially formed by the chemicalreactions taking place between the elements present in steels. Theelements are sometimes intentionally added as alloying elements(such as Si in this case) or may be present simply as impurities(such as N in steels). These second phase particles act as pinningsites to the movement of domain walls in electrical steels andresults in higher core loss and lower permeability. They can alsoaffect grain size and texture of these steels. The effect of thesesecond phase particles on the magnetic properties is dictated bytheir size, shape, type and distribution. It is observed that the
particles with size distribution from 0.1 mm to 1 mm in diameterare the most harmful [7].
Residual stress influences the magnetization process by inter-acting with magnetic domain walls and in this way affect the coreloss and the permeability of the NOES. Depending on the nature ofthe stress present, the magnetic properties can be either improvedor become worse. For example, presence of tensile stress generallydecreases core loss while compressive stress increases it [2].
Research is being carried out to predict magnetization behaviorof NOES materials by quantitatively modeling the hysteresis loops.Very often this involves metallurgical variables as inputs. In orderto build a sound and consistent model, effect of each individualparameters on magnetic properties (such as core loss and perme-ability in this case) has to be known. Unfortunately, the sole effectof single variable on magnetic properties is often missing in thepublished literature. This is because of the mutual effect ofvariables on each other and their synergistic influence on mag-netic properties. For example, Shiozaki and Kurosaki [18] pointedout the difficulty to derive grain size effect on magnetic properties.In their case, employing different processing conditions to obtainvariable grain size not only altered grain size but at the same timemodified texture. This is also responsible for change of optimumgrain diameter with Si percentage to obtain minimum core loss.There was hardly any report on the consequence of these variableson the magnetic behavior at higher frequency for NOES. The othergray area is the representation of texture to realize its true effecton NOES properties. Thus the aim of the present study is tocompare steels with variation in single parameter while thedifferences in rest of the variables are negligibly small. To facilitatethis, an in-depth characterization of a series of as-received steels,both metallurgical and magnetic, are conducted followed by anattempt to explain the magnetic behaviors with respect to theirmetallurgical variables using magnetic domain concepts.
2. Experimental methodology
Four grades of as-received steels are considered for the currentwork. The steels are selected such a way that the effect ofcomposition, grain size and texture on magnetic properties canbe understood in a best possible way. However, the effect ofresidual stress cannot be evaluated in this study due to absence ofany significant residual stress in the as received steels; both non-stress relieve annealed (Non-SRA) and stress relieve annealed(SRA). The following section will summarize the experimentalresults obtained in the present study.
2.1. Chemistry and grain size
The as-received steels were first subjected to ICP-AES and thecombustion technique to determine their chemical compositions.Prior to testing, the surface coatings from both sides of thesamples were completely removed by grinding followed by clean-ing with acetone. The ASTM standards (E1479 and E1019) [19,20]were followed to determine the chemical compositions. Grain sizemeasurements were carried out on the top surface of theas-received samples and mounting them in epoxy. Like chemicalcomposition, here also the surface coating was completelyremoved by coarse grinding followed by fine grinding in 400,600, 800 and 1200 grit SiC papers and polishing in 3 mm and 1 mmdiamond paste to obtain a mirror-like finish. Subsequently, thesamples were etched in a 2% Nital solution to reveal the grainstructure. Images were captured at 50� magnification using aNikon Epiphot 200 optical microscope equipped with ClemexImage Analysis software. The grain size measurements wereperformed according to ASTM E112-12 using the Heyn Lineal
P. Ghosh et al. / Journal of Magnetism and Magnetic Materials 356 (2014) 42–51 43
Intercept procedure [21]. In each case, approximately 1000 grainswere considered for grain size measurement. The chemical com-positions together with their grain size data are listed in Table 1.
2.2. Texture
Texture was measured by a Bruker0s X-Ray Diffraction Goni-ometer operated at 35 kV and 45 mA. An area of 6�6 mm2 wasscanned to capture diffraction data from each sample. Dependingon the grain size of the steels, a total of 900–1100 grains weresubjected to X-ray diffraction. Three incomplete Pole Figures[(110), (200) and (211)] were measured and Orientation Distribu-tion Function (ODF) was calculated from these measured PoleFigures (PF) using TexTools software [22]. The volume fractions ofdifferent texture components were also calculated from the ODFs.
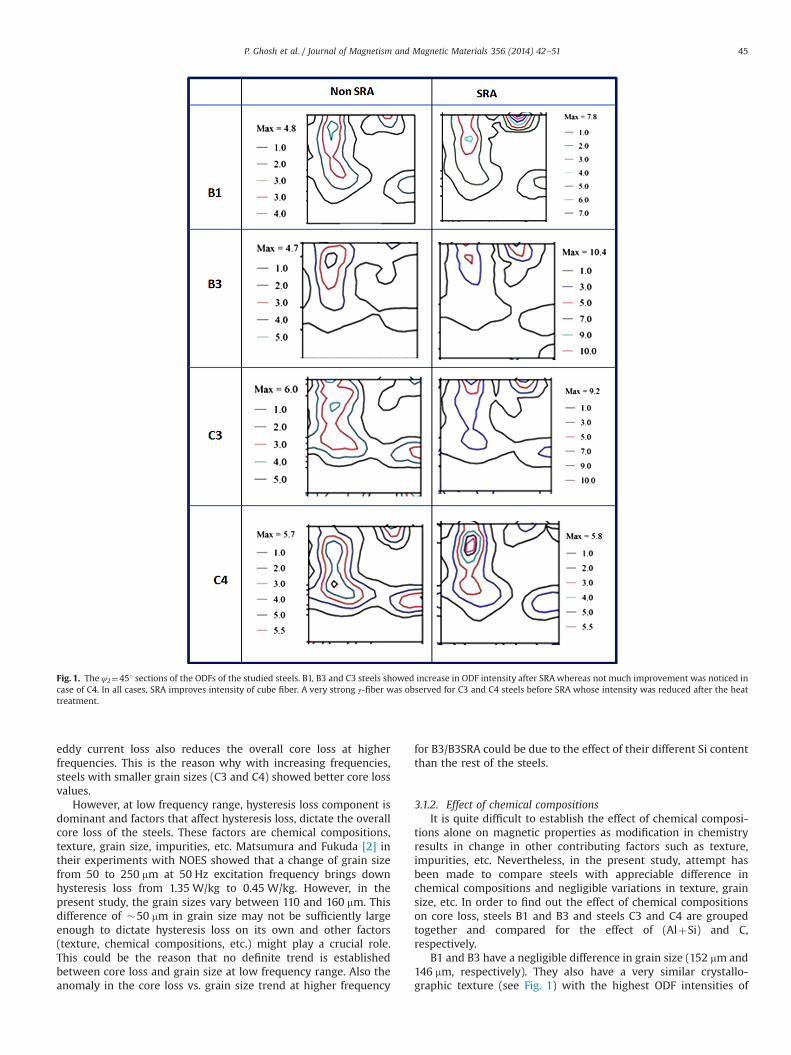
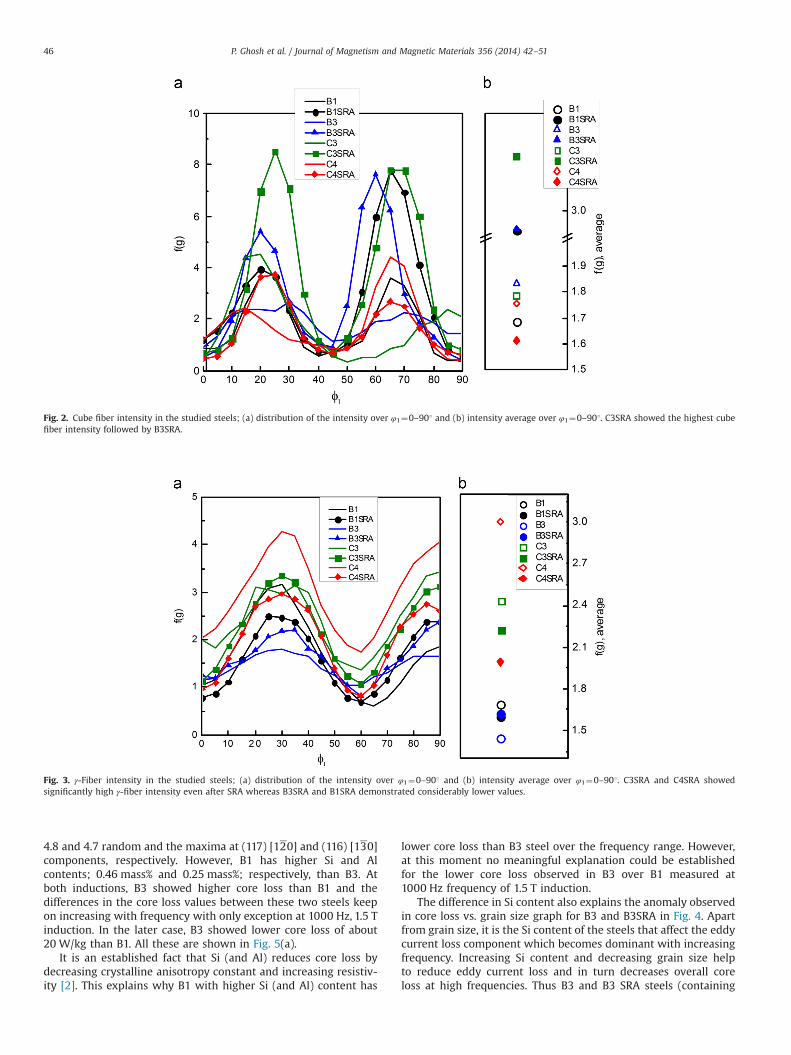
Fig. 1 shows the φ2¼451 sections of the ODFs. It is clear fromthe figures that after stress relieve annealing (SRA) treatment, theODF intensity went up for B1, B3 and C3 steels. However, not muchchange was observed for C4 steel. B1 and B3 steels in non-SRAcondition showed two weak fiber components, one along gammafiber and the other 221 away and parallel to α-fiber (RDO[110]).However, SRA treatment not only improved the overall ODFintensity in these cases but also improved the cube fiber intensity(φ¼01; NDO[100]) by double or more. Also cube fiber becamemore perfect after SRA treatment. On the contrary, gamma fiberturned out to be discontinuous and slight reductions of itsintensities were noticed. This was more visible in Figs. 2 and 3where these two fibers are plotted for both the steels. Themaximum intensity of the ODFs was higher for B3SRA thanB1SRA, 10.4 and 7.8, respectively and stayed at (001) [1 –3 0]component whereas for B1 and B3, the maximum intensity (�4.7)was observed 12–181 away from the perfect cube fiber. Themaxima for B1 and B3 were at (117) [1–20] and (116) [1 –3 0]components, respectively.
C3 and C4 steels, at their non-SRA condition showed presenceof strong gamma fiber, especially for C4 steel where the maxima(�5.7) of the ODF was present on (223) [2 –3 1] component. Apartfrom that, C4 also contained intensity of 4 times random at (001)[1 –2 0] component. In case of C3, the overall intensity of ODFincreased almost by double (just like B1 and B3) but for C4 nosignificance enhancement of ODF intensity was observed afterSRA. SRA resulted in an improvement in the cube fiber intensityfor C3 and two maxima were observed at (001) [�1 –2 0] and(001) [�1 –3 0] components. However, gamma fiber intensity didnot get affected by SRA for C3. On the contrary, SRA decreasedgamma fiber intensity in C4 and made it more discontinuous. Themaximum now shifted towards cube fiber and now rested on (116)[1 –2 0] component, but (001) [1 –2 0] component which werepresent before SRA treatment got reduced. The figures clearlyshow that the average intensity of the cube fibers increased afterSRA for all the steel grades except C4.
2.3. Magnetic properties
Magnetic properties were experimentally measured using a700 turn 25 cm Epstein frame following ASTM standards. Testingto determine DC magnetization and permeability was carried outin accordance with ASTM A773M [23]. Evaluation of AC perme-ability and core loss under AC excitation at power frequencies wascarried out in accordance with ASTM A 343M [24]. Core loss hasbeen evaluated at two magnetic inductions, 1.0 T and 1.5 T at arange of frequencies from 50 Hz up to 1000 Hz.
3. Results and discussion
Core loss and permeability are the two most important proper-ties of non-oriented electrical steels used to manufacture highefficiency motors. At this stage, let us introduce the concepts ofcore loss and permeability. A ferromagnetic material when sub-jected to an alternating magnetic flux drops part of the energythrough generation of heat. This energy loss is termed as ‘coreloss’. Permeability, on the other hand, is the measure of ease withwhich a material can be magnetized. At a specified induction,permeability is defined as B/H while the area enclosed by a B–Hloop gives the energy dissipated during one transition of the loop,and is the measure of core loss. B is magnetic flux density and H ismagnetic field intensity [8,9].
Both core loss and permeability are influenced by metallurgicalparameters such as grain size, alloying contents, impurities,texture, etc. The following sections will discuss these magneticproperties of the studied steels in light of the above mentionedmetallurgical factors.
3.1. Core loss
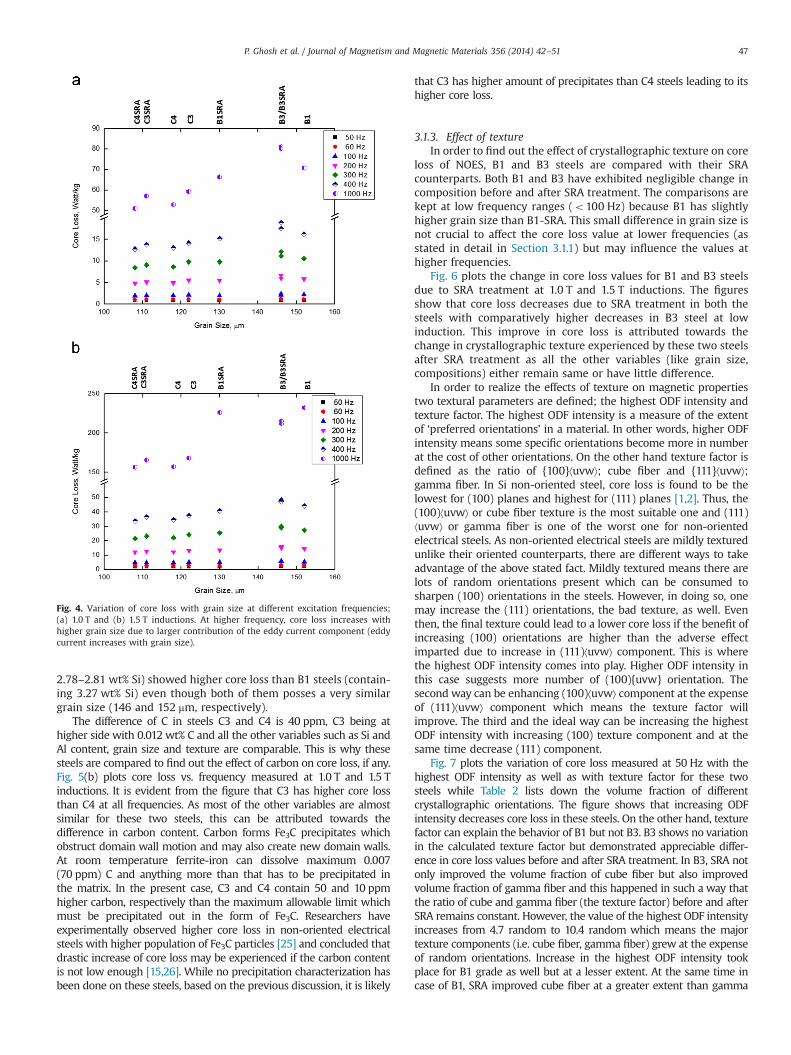
3.1.1. Effect of grain sizeFig. 4 plots core loss with grain size at different excitation
frequencies measured at 1.0 and 1.5 T magnetic inductions. At lowfrequencies (�50–60 Hz), no distinct trend could be found withgrain size and core loss. However, with increasing frequency, coreloss increases with increase in grain size (4100 Hz). This is bestdepicted in core loss vs. grain size curve for 1000 Hz. The onlyexception in this trend is steels B3 and B3SRAwith 146 mm averagegrain size each. They show higher core loss at high frequencyranges than the steel with slightly higher grain size.
As stated earlier, grain size affects two components of the coreloss; namely hysteresis and eddy current; differently. This can beexplained with the help of the magnetic domain behavior underapplied magnetic fields. Magnetic domain size increases withincreasing grain size [16]. One source of hysteresis loss is thenucleation and annihilation of domains. Thus, hysteresis lossincreases with decreasing domain size, in turn with grain size.Also, smaller grain means, higher percentage of grain boundaryarea and larger barrier to domain wall motion. This attributestowards hysteresis loss as well. On the contrary, eddy current lossis proportional to the domain wall velocity square. So, higherdomain size (i.e. higher grain size) means fewer domain walls andhigher wall velocity. In other word, higher the grain size, higher isthe eddy current component of the core loss. Matsumura andFukuda [2] showed this behavior experimentally in one such non-oriented electrical steel.
Eddy current loss is greatly affected by excitation frequency ofthe applied magnetic field and can be approximated as increasingproportionately with (frequency)2 while the hysteresis componentis proportional to frequency [1]. As a result, the eddy currentcomponent becomes dominant in the overall core loss at higherfrequencies. This means smaller grain size responsible for reducing
Table 1Chemical composition of the studied steels (mass%).
Steel C Al Si O Other elements(Mn, P, N, S, Cr, Co, etc.)
Balance Grainsize(lm)
B1 0.007 0.54 3.27 0.007 o0.3 �Fe 152B1SRA 0.006 0.53 3.26 0.006 130B3 0.007 0.26 2.81 0.006 146B3SRA 0.007 0.25 2.78 0.018 146C3 0.012 0.58 3.19 0.026 122C3SRA 0.011 0.62 3.51 0.015 111C4 0.008 0.60 3.24 0.018 118C4SRA 0.008 0.57 3.61 0.014 108
P. Ghosh et al. / Journal of Magnetism and Magnetic Materials 356 (2014) 42–5144
eddy current loss also reduces the overall core loss at higherfrequencies. This is the reason why with increasing frequencies,steels with smaller grain sizes (C3 and C4) showed better core lossvalues.
However, at low frequency range, hysteresis loss component isdominant and factors that affect hysteresis loss, dictate the overallcore loss of the steels. These factors are chemical compositions,texture, grain size, impurities, etc. Matsumura and Fukuda [2] intheir experiments with NOES showed that a change of grain sizefrom 50 to 250 mm at 50 Hz excitation frequency brings downhysteresis loss from 1.35 W/kg to 0.45 W/kg. However, in thepresent study, the grain sizes vary between 110 and 160 mm. Thisdifference of �50 mm in grain size may not be sufficiently largeenough to dictate hysteresis loss on its own and other factors(texture, chemical compositions, etc.) might play a crucial role.This could be the reason that no definite trend is establishedbetween core loss and grain size at low frequency range. Also theanomaly in the core loss vs. grain size trend at higher frequency
for B3/B3SRA could be due to the effect of their different Si contentthan the rest of the steels.
3.1.2. Effect of chemical compositionsIt is quite difficult to establish the effect of chemical composi-
tions alone on magnetic properties as modification in chemistryresults in change in other contributing factors such as texture,impurities, etc. Nevertheless, in the present study, attempt hasbeen made to compare steels with appreciable difference inchemical compositions and negligible variations in texture, grainsize, etc. In order to find out the effect of chemical compositionson core loss, steels B1 and B3 and steels C3 and C4 are groupedtogether and compared for the effect of (AlþSi) and C,respectively.
B1 and B3 have a negligible difference in grain size (152 mm and146 mm, respectively). They also have a very similar crystallo-graphic texture (see Fig. 1) with the highest ODF intensities of
Fig. 1. The φ2¼451 sections of the ODFs of the studied steels. B1, B3 and C3 steels showed increase in ODF intensity after SRAwhereas not much improvement was noticed incase of C4. In all cases, SRA improves intensity of cube fiber. A very strong γ-fiber was observed for C3 and C4 steels before SRA whose intensity was reduced after the heattreatment.
P. Ghosh et al. / Journal of Magnetism and Magnetic Materials 356 (2014) 42–51 45
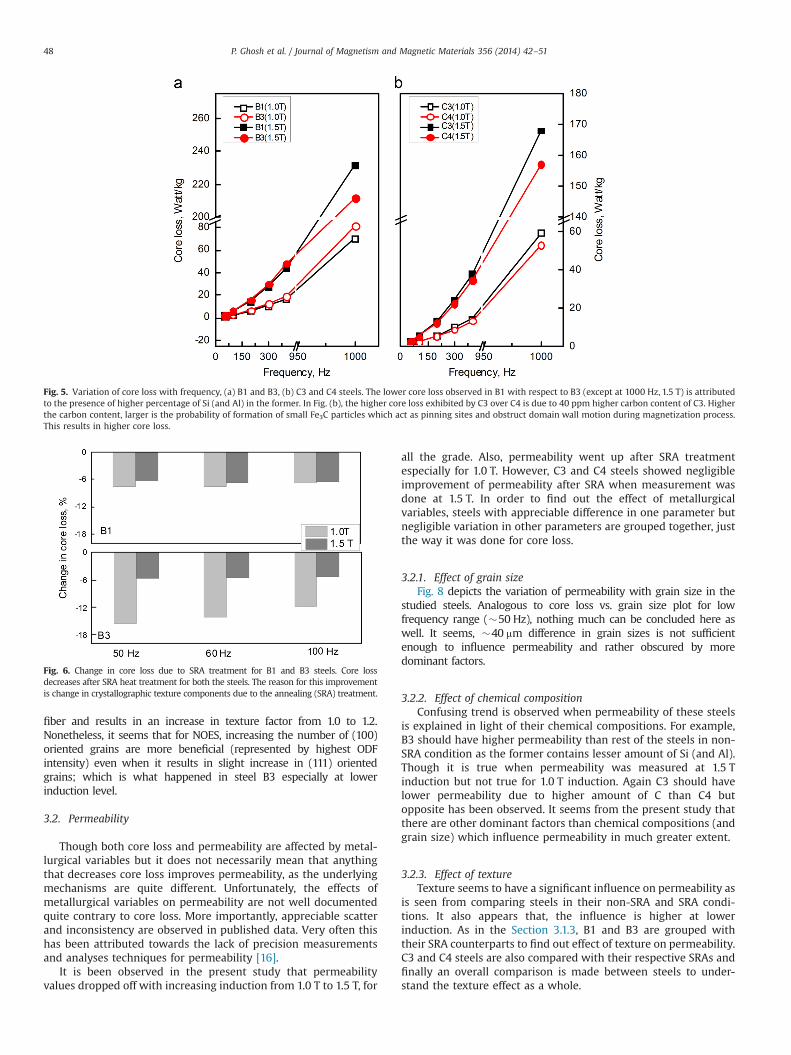
4.8 and 4.7 random and the maxima at (117) [120] and (116) [130]components, respectively. However, B1 has higher Si and Alcontents; 0.46 mass% and 0.25 mass%; respectively, than B3. Atboth inductions, B3 showed higher core loss than B1 and thedifferences in the core loss values between these two steels keepon increasing with frequency with only exception at 1000 Hz, 1.5 Tinduction. In the later case, B3 showed lower core loss of about20 W/kg than B1. All these are shown in Fig. 5(a).
It is an established fact that Si (and Al) reduces core loss bydecreasing crystalline anisotropy constant and increasing resistiv-ity [2]. This explains why B1 with higher Si (and Al) content has
lower core loss than B3 steel over the frequency range. However,at this moment no meaningful explanation could be establishedfor the lower core loss observed in B3 over B1 measured at1000 Hz frequency of 1.5 T induction.
The difference in Si content also explains the anomaly observedin core loss vs. grain size graph for B3 and B3SRA in Fig. 4. Apartfrom grain size, it is the Si content of the steels that affect the eddycurrent loss component which becomes dominant with increasingfrequency. Increasing Si content and decreasing grain size helpto reduce eddy current loss and in turn decreases overall coreloss at high frequencies. Thus B3 and B3 SRA steels (containing
Fig. 2. Cube fiber intensity in the studied steels; (a) distribution of the intensity over φ1¼0–901 and (b) intensity average over φ1¼0–901. C3SRA showed the highest cubefiber intensity followed by B3SRA.
Fig. 3. γ-Fiber intensity in the studied steels; (a) distribution of the intensity over φ1¼0–901 and (b) intensity average over φ1¼0–901. C3SRA and C4SRA showedsignificantly high γ-fiber intensity even after SRA whereas B3SRA and B1SRA demonstrated considerably lower values.
P. Ghosh et al. / Journal of Magnetism and Magnetic Materials 356 (2014) 42–5146
2.78–2.81 wt% Si) showed higher core loss than B1 steels (contain-ing 3.27 wt% Si) even though both of them posses a very similargrain size (146 and 152 mm, respectively).
The difference of C in steels C3 and C4 is 40 ppm, C3 being athigher side with 0.012 wt% C and all the other variables such as Si andAl content, grain size and texture are comparable. This is why thesesteels are compared to find out the effect of carbon on core loss, if any.Fig. 5(b) plots core loss vs. frequency measured at 1.0 T and 1.5 Tinductions. It is evident from the figure that C3 has higher core lossthan C4 at all frequencies. As most of the other variables are almostsimilar for these two steels, this can be attributed towards thedifference in carbon content. Carbon forms Fe3C precipitates whichobstruct domain wall motion and may also create new domain walls.At room temperature ferrite-iron can dissolve maximum 0.007(70 ppm) C and anything more than that has to be precipitated inthe matrix. In the present case, C3 and C4 contain 50 and 10 ppmhigher carbon, respectively than the maximum allowable limit whichmust be precipitated out in the form of Fe3C. Researchers haveexperimentally observed higher core loss in non-oriented electricalsteels with higher population of Fe3C particles [25] and concluded thatdrastic increase of core loss may be experienced if the carbon contentis not low enough [15,26]. While no precipitation characterization hasbeen done on these steels, based on the previous discussion, it is likely
that C3 has higher amount of precipitates than C4 steels leading to itshigher core loss.
3.1.3. Effect of textureIn order to find out the effect of crystallographic texture on core
loss of NOES, B1 and B3 steels are compared with their SRAcounterparts. Both B1 and B3 have exhibited negligible change incomposition before and after SRA treatment. The comparisons arekept at low frequency ranges (o100 Hz) because B1 has slightlyhigher grain size than B1-SRA. This small difference in grain size isnot crucial to affect the core loss value at lower frequencies (asstated in detail in Section 3.1.1) but may influence the values athigher frequencies.
Fig. 6 plots the change in core loss values for B1 and B3 steelsdue to SRA treatment at 1.0 T and 1.5 T inductions. The figuresshow that core loss decreases due to SRA treatment in both thesteels with comparatively higher decreases in B3 steel at lowinduction. This improve in core loss is attributed towards thechange in crystallographic texture experienced by these two steelsafter SRA treatment as all the other variables (like grain size,compositions) either remain same or have little difference.
In order to realize the effects of texture on magnetic propertiestwo textural parameters are defined; the highest ODF intensity andtexture factor. The highest ODF intensity is a measure of the extentof ‘preferred orientations’ in a material. In other words, higher ODFintensity means some specific orientations become more in numberat the cost of other orientations. On the other hand texture factor isdefined as the ratio of {100}⟨uvw⟩; cube fiber and {111}⟨uvw⟩;gamma fiber. In Si non-oriented steel, core loss is found to be thelowest for (100) planes and highest for (111) planes [1,2]. Thus, the(100)⟨uvw⟩ or cube fiber texture is the most suitable one and (111)⟨uvw⟩ or gamma fiber is one of the worst one for non-orientedelectrical steels. As non-oriented electrical steels are mildly texturedunlike their oriented counterparts, there are different ways to takeadvantage of the above stated fact. Mildly textured means there arelots of random orientations present which can be consumed tosharpen (100) orientations in the steels. However, in doing so, onemay increase the (111) orientations, the bad texture, as well. Eventhen, the final texture could lead to a lower core loss if the benefit ofincreasing (100) orientations are higher than the adverse effectimparted due to increase in (111)⟨uvw⟩ component. This is wherethe highest ODF intensity comes into play. Higher ODF intensity inthis case suggests more number of (100){uvw} orientation. Thesecond way can be enhancing (100)⟨uvw⟩ component at the expenseof (111)⟨uvw⟩ component which means the texture factor willimprove. The third and the ideal way can be increasing the highestODF intensity with increasing (100) texture component and at thesame time decrease (111) component.
Fig. 7 plots the variation of core loss measured at 50 Hz with thehighest ODF intensity as well as with texture factor for these twosteels while Table 2 lists down the volume fraction of differentcrystallographic orientations. The figure shows that increasing ODFintensity decreases core loss in these steels. On the other hand, texturefactor can explain the behavior of B1 but not B3. B3 shows no variationin the calculated texture factor but demonstrated appreciable differ-ence in core loss values before and after SRA treatment. In B3, SRA notonly improved the volume fraction of cube fiber but also improvedvolume fraction of gamma fiber and this happened in such a way thatthe ratio of cube and gamma fiber (the texture factor) before and afterSRA remains constant. However, the value of the highest ODF intensityincreases from 4.7 random to 10.4 random which means the majortexture components (i.e. cube fiber, gamma fiber) grew at the expenseof random orientations. Increase in the highest ODF intensity tookplace for B1 grade as well but at a lesser extent. At the same time incase of B1, SRA improved cube fiber at a greater extent than gamma
Fig. 4. Variation of core loss with grain size at different excitation frequencies;(a) 1.0 T and (b) 1.5 T inductions. At higher frequency, core loss increases withhigher grain size due to larger contribution of the eddy current component (eddycurrent increases with grain size).
P. Ghosh et al. / Journal of Magnetism and Magnetic Materials 356 (2014) 42–51 47
fiber and results in an increase in texture factor from 1.0 to 1.2.Nonetheless, it seems that for NOES, increasing the number of (100)oriented grains are more beneficial (represented by highest ODFintensity) even when it results in slight increase in (111) orientedgrains; which is what happened in steel B3 especially at lowerinduction level.
3.2. Permeability
Though both core loss and permeability are affected by metal-lurgical variables but it does not necessarily mean that anythingthat decreases core loss improves permeability, as the underlyingmechanisms are quite different. Unfortunately, the effects ofmetallurgical variables on permeability are not well documentedquite contrary to core loss. More importantly, appreciable scatterand inconsistency are observed in published data. Very often thishas been attributed towards the lack of precision measurementsand analyses techniques for permeability [16].
It is been observed in the present study that permeabilityvalues dropped off with increasing induction from 1.0 T to 1.5 T, for
all the grade. Also, permeability went up after SRA treatmentespecially for 1.0 T. However, C3 and C4 steels showed negligibleimprovement of permeability after SRA when measurement wasdone at 1.5 T. In order to find out the effect of metallurgicalvariables, steels with appreciable difference in one parameter butnegligible variation in other parameters are grouped together, justthe way it was done for core loss.
3.2.1. Effect of grain sizeFig. 8 depicts the variation of permeability with grain size in the
studied steels. Analogous to core loss vs. grain size plot for lowfrequency range (�50 Hz), nothing much can be concluded here aswell. It seems, �40 mm difference in grain sizes is not sufficientenough to influence permeability and rather obscured by moredominant factors.
3.2.2. Effect of chemical compositionConfusing trend is observed when permeability of these steels
is explained in light of their chemical compositions. For example,B3 should have higher permeability than rest of the steels in non-SRA condition as the former contains lesser amount of Si (and Al).Though it is true when permeability was measured at 1.5 Tinduction but not true for 1.0 T induction. Again C3 should havelower permeability due to higher amount of C than C4 butopposite has been observed. It seems from the present study thatthere are other dominant factors than chemical compositions (andgrain size) which influence permeability in much greater extent.
3.2.3. Effect of textureTexture seems to have a significant influence on permeability as
is seen from comparing steels in their non-SRA and SRA condi-tions. It also appears that, the influence is higher at lowerinduction. As in the Section 3.1.3, B1 and B3 are grouped withtheir SRA counterparts to find out effect of texture on permeability.C3 and C4 steels are also compared with their respective SRAs andfinally an overall comparison is made between steels to under-stand the texture effect as a whole.
Fig. 5. Variation of core loss with frequency, (a) B1 and B3, (b) C3 and C4 steels. The lower core loss observed in B1 with respect to B3 (except at 1000 Hz, 1.5 T) is attributedto the presence of higher percentage of Si (and Al) in the former. In Fig. (b), the higher core loss exhibited by C3 over C4 is due to 40 ppm higher carbon content of C3. Higherthe carbon content, larger is the probability of formation of small Fe3C particles which act as pinning sites and obstruct domain wall motion during magnetization process.This results in higher core loss.
Fig. 6. Change in core loss due to SRA treatment for B1 and B3 steels. Core lossdecreases after SRA heat treatment for both the steels. The reason for this improvementis change in crystallographic texture components due to the annealing (SRA) treatment.
P. Ghosh et al. / Journal of Magnetism and Magnetic Materials 356 (2014) 42–5148
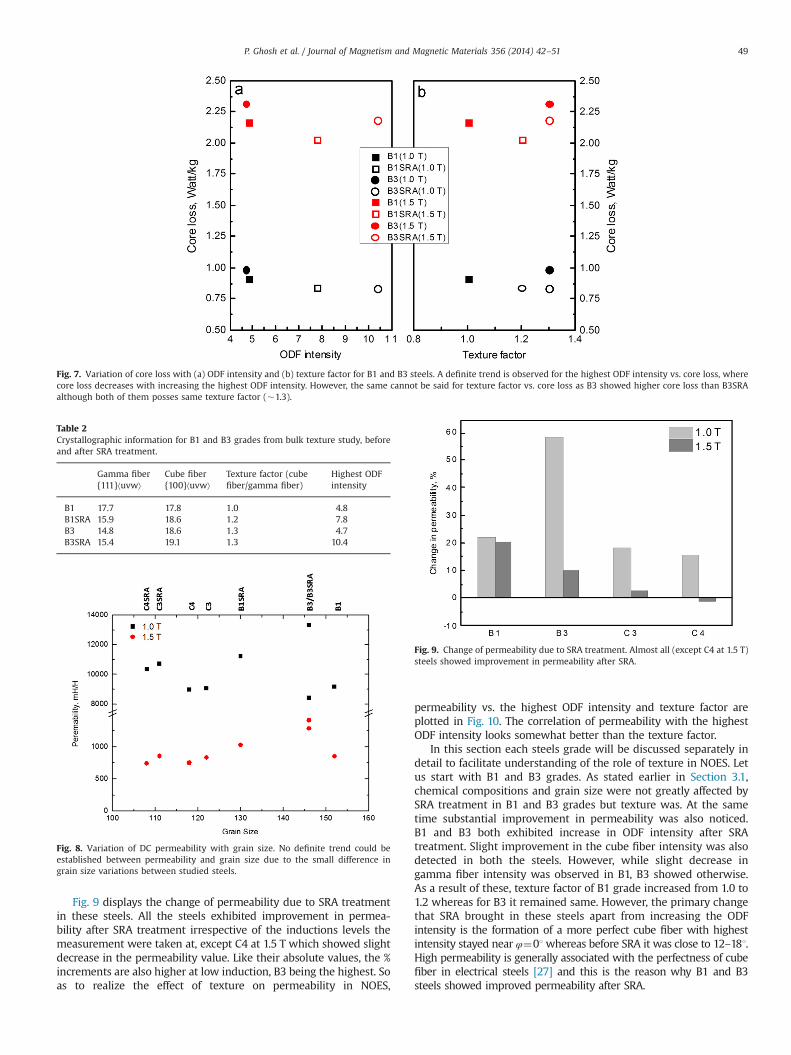
Fig. 9 displays the change of permeability due to SRA treatmentin these steels. All the steels exhibited improvement in permea-bility after SRA treatment irrespective of the inductions levels themeasurement were taken at, except C4 at 1.5 T which showed slightdecrease in the permeability value. Like their absolute values, the %increments are also higher at low induction, B3 being the highest. Soas to realize the effect of texture on permeability in NOES,
permeability vs. the highest ODF intensity and texture factor areplotted in Fig. 10. The correlation of permeability with the highestODF intensity looks somewhat better than the texture factor.
In this section each steels grade will be discussed separately indetail to facilitate understanding of the role of texture in NOES. Letus start with B1 and B3 grades. As stated earlier in Section 3.1,chemical compositions and grain size were not greatly affected bySRA treatment in B1 and B3 grades but texture was. At the sametime substantial improvement in permeability was also noticed.B1 and B3 both exhibited increase in ODF intensity after SRAtreatment. Slight improvement in the cube fiber intensity was alsodetected in both the steels. However, while slight decrease ingamma fiber intensity was observed in B1, B3 showed otherwise.As a result of these, texture factor of B1 grade increased from 1.0 to1.2 whereas for B3 it remained same. However, the primary changethat SRA brought in these steels apart from increasing the ODFintensity is the formation of a more perfect cube fiber with highestintensity stayed near φ¼01whereas before SRA it was close to 12–181.High permeability is generally associated with the perfectness of cubefiber in electrical steels [27] and this is the reason why B1 and B3steels showed improved permeability after SRA.
Fig. 7. Variation of core loss with (a) ODF intensity and (b) texture factor for B1 and B3 steels. A definite trend is observed for the highest ODF intensity vs. core loss, wherecore loss decreases with increasing the highest ODF intensity. However, the same cannot be said for texture factor vs. core loss as B3 showed higher core loss than B3SRAalthough both of them posses same texture factor (�1.3).
Table 2Crystallographic information for B1 and B3 grades from bulk texture study, beforeand after SRA treatment.
Gamma fiber{111}⟨uvw⟩
Cube fiber{100}⟨uvw⟩
Texture factor (cubefiber/gamma fiber)
Highest ODFintensity
B1 17.7 17.8 1.0 4.8B1SRA 15.9 18.6 1.2 7.8B3 14.8 18.6 1.3 4.7B3SRA 15.4 19.1 1.3 10.4
Fig. 8. Variation of DC permeability with grain size. No definite trend could beestablished between permeability and grain size due to the small difference ingrain size variations between studied steels.
Fig. 9. Change of permeability due to SRA treatment. Almost all (except C4 at 1.5 T)steels showed improvement in permeability after SRA.
P. Ghosh et al. / Journal of Magnetism and Magnetic Materials 356 (2014) 42–51 49
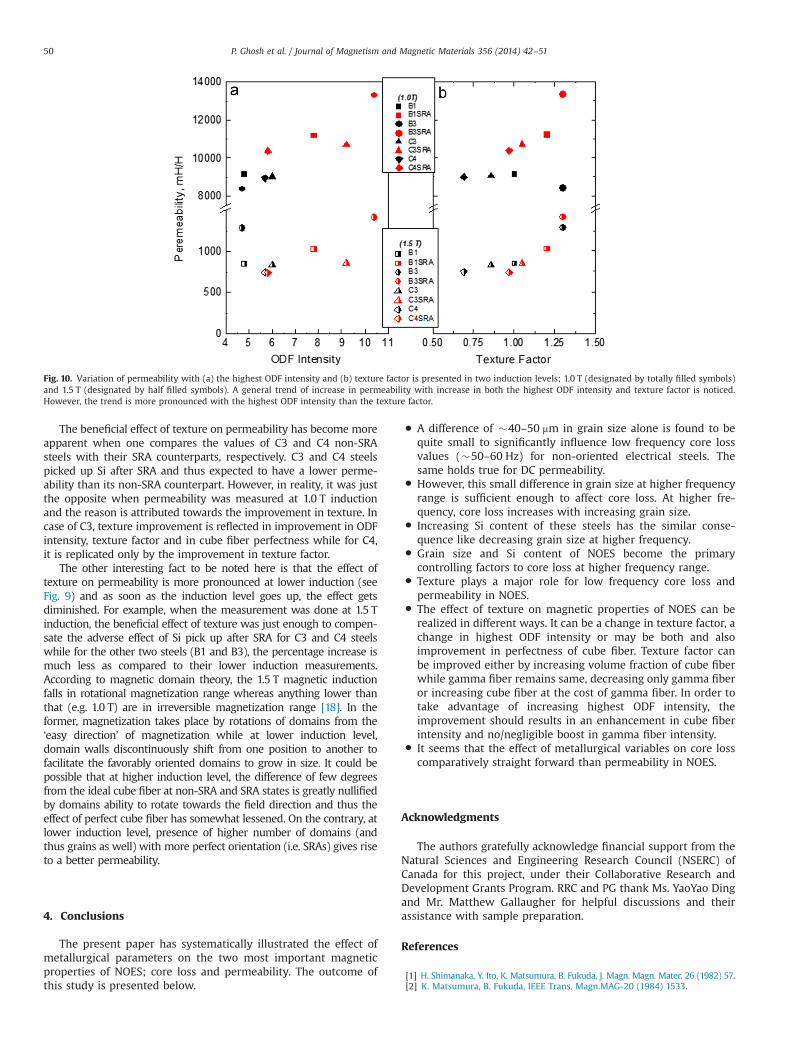
The beneficial effect of texture on permeability has become moreapparent when one compares the values of C3 and C4 non-SRAsteels with their SRA counterparts, respectively. C3 and C4 steelspicked up Si after SRA and thus expected to have a lower perme-ability than its non-SRA counterpart. However, in reality, it was justthe opposite when permeability was measured at 1.0 T inductionand the reason is attributed towards the improvement in texture. Incase of C3, texture improvement is reflected in improvement in ODFintensity, texture factor and in cube fiber perfectness while for C4,it is replicated only by the improvement in texture factor.
The other interesting fact to be noted here is that the effect oftexture on permeability is more pronounced at lower induction (seeFig. 9) and as soon as the induction level goes up, the effect getsdiminished. For example, when the measurement was done at 1.5 Tinduction, the beneficial effect of texture was just enough to compen-sate the adverse effect of Si pick up after SRA for C3 and C4 steelswhile for the other two steels (B1 and B3), the percentage increase ismuch less as compared to their lower induction measurements.According to magnetic domain theory, the 1.5 T magnetic inductionfalls in rotational magnetization range whereas anything lower thanthat (e.g. 1.0 T) are in irreversible magnetization range [18]. In theformer, magnetization takes place by rotations of domains from the‘easy direction’ of magnetization while at lower induction level,domain walls discontinuously shift from one position to another tofacilitate the favorably oriented domains to grow in size. It could bepossible that at higher induction level, the difference of few degreesfrom the ideal cube fiber at non-SRA and SRA states is greatly nullifiedby domains ability to rotate towards the field direction and thus theeffect of perfect cube fiber has somewhat lessened. On the contrary, atlower induction level, presence of higher number of domains (andthus grains as well) with more perfect orientation (i.e. SRAs) gives riseto a better permeability.
4. Conclusions
The present paper has systematically illustrated the effect ofmetallurgical parameters on the two most important magneticproperties of NOES; core loss and permeability. The outcome ofthis study is presented below.
� A difference of �40–50 mm in grain size alone is found to bequite small to significantly influence low frequency core lossvalues (�50–60 Hz) for non-oriented electrical steels. Thesame holds true for DC permeability.
� However, this small difference in grain size at higher frequencyrange is sufficient enough to affect core loss. At higher fre-quency, core loss increases with increasing grain size.
� Increasing Si content of these steels has the similar conse-quence like decreasing grain size at higher frequency.
� Grain size and Si content of NOES become the primarycontrolling factors to core loss at higher frequency range.
� Texture plays a major role for low frequency core loss andpermeability in NOES.
� The effect of texture on magnetic properties of NOES can berealized in different ways. It can be a change in texture factor, achange in highest ODF intensity or may be both and alsoimprovement in perfectness of cube fiber. Texture factor canbe improved either by increasing volume fraction of cube fiberwhile gamma fiber remains same, decreasing only gamma fiberor increasing cube fiber at the cost of gamma fiber. In order totake advantage of increasing highest ODF intensity, theimprovement should results in an enhancement in cube fiberintensity and no/negligible boost in gamma fiber intensity.
� It seems that the effect of metallurgical variables on core losscomparatively straight forward than permeability in NOES.
Acknowledgments
The authors gratefully acknowledge financial support from theNatural Sciences and Engineering Research Council (NSERC) ofCanada for this project, under their Collaborative Research andDevelopment Grants Program. RRC and PG thank Ms. YaoYao Dingand Mr. Matthew Gallaugher for helpful discussions and theirassistance with sample preparation.
References
[1] H. Shimanaka, Y. Ito, K. Matsumura, B. Fukuda, J. Magn. Magn. Mater. 26 (1982) 57.[2] K. Matsumura, B. Fukuda, IEEE Trans. Magn.MAG-20 (1984) 1533.
Fig. 10. Variation of permeability with (a) the highest ODF intensity and (b) texture factor is presented in two induction levels; 1.0 T (designated by totally filled symbols)and 1.5 T (designated by half filled symbols). A general trend of increase in permeability with increase in both the highest ODF intensity and texture factor is noticed.However, the trend is more pronounced with the highest ODF intensity than the texture factor.
P. Ghosh et al. / Journal of Magnetism and Magnetic Materials 356 (2014) 42–5150
[3] M. Frommert, C. Zobrist, L. Lahn, A. Böttcher, D. Raabe, S. Zaefferer, J. Magn.Magn. Mater. 320 (2008) 657.
[4] C.D. Wupperman, H.J. Wieland, S. Geisler; WMM Proceedings, GhentUniversity, Belgium, 2010.
[5] S.S. Williamson, S.M. Likic, A. Emadi, IEEE Trans. Power Electron. 21 (3) (2006) 730.[6] A.T. Almeida, F.J.T.E. Ferreira, D. Both, IEEE Trans. Ind. Appl. 41 (1) (2005) 188.[7] A.J. Moses, IEEE Proc. 137 (Pt. A, No. 5) (1990) 233.[8] G. Lyudkovsky, P.K. Rastogi, M. Bala, J. Met. 22 (1986) 18.[9] A. Chaudhurya, R. Khatirkar, N.N. Viswanathan, V. Singal, A. Ingle, S. Joshi,
I. Samajdar, J. Magn. Magn. Mater. 313 (2007) 21.[10] J. Barros, T. Ros-Yañez, L. Vandenbossche, L. Dupré, J. Melkebeek, Y. Houbaert, J.
Magn. Magn. Mater. 290-291 (Part II) (2005) 1457.[11] C.K. Hou, C.T. Hu, S. Lee, IEEE Trans. Magn. 27 (1991) 4305.[12] P. Brissonneau, J. Magn. Magn. Mater. 19 (1980) 52.[13] P. Arato, I. Boc, T. Grof, J. Magn. Magn. Mater. 41 (1984) 53–55.[14] T. Nakayama, N. Honjou, J. Magn. Magn. Mater. 213 (2000) 87–94.[15] M.F. Littmann, IEEE Trans. Magn. Mag-7 (No. 1) (1971) 48–60.[16] E.T. Stephenson, IEEE Trans. Magn. MAG-22 (No. 2) (1986) 101–106.[17] L. Kestens, S. Jacobs, Texture, Stress, and Microstructure 2008 (2008) 1–9
http://dx.doi.org/10.1155/2008/173083.[18] M. Shiozaki, Y. Kurosaki, J. Mater. Eng. 11 (1989) 37–43.[19] ASTM Standard E 1479, Standard Practice for Describing and Specifying Inductively-
Coupled Plasma Atomic Emission Spectrometers, ASTM International, 100 BarrHarbor Dr., PO box C-700 West Conshohocken, Pennsylvania 19428-2959, UnitedStates.
[20] ASTM Standard E 1019, Standard Test Methods for Determination of Carbon,Sulfur, Nitrogen, and Oxygen in Steel, Iron, Nickel, and Cobalt Alloys byVarious Combustion and Fusion Techniques, ASTM International, 100 BarrHarbor Dr., PO box C-700 West Conshohocken, Pennsylvania 19428-2959,United States.
[21] ASTM Standard E 112-12, Standard Test Methods for Determining AverageGrain Size, ASTM International, 100 Barr Harbor Dr., PO box C-700 WestConshohocken, Pennsylvania 19428-2959, United States.
[22] ⟨http://www.resmat.com/⟩.[23] ASTM Standard A 773-M, Standard Test Method for dc Magnetic Properties of
Materials Using Ring and Permeameter Procedures with dc Electronic Hyster-esigraphs, ASTM International, 100 Barr Harbor Dr., PO box C-700 WestConshohocken, Pennsylvania 19428-2959, United States.
[24] ASTM Standard A 343-M, Standard Test Method for Alternating-CurrentMagnetic Properties of Materials at Power Frequencies Using Wattmeter-Ammeter-Voltmeter Method and 25-cm Epstein Test Frame, ASTM Interna-tional, 100 Barr Harbor Dr., PO box C-700 West Conshohocken, Pennsylvania19428-2959, United States.
[25] D.S. Petrovic, M. Godec, B. Markoli, M. Ceh, J. Magn. Magn. Mater. 322 (2010)3041–3048.
[26] W.C. Leslie, D.W. Stevens, Trans. ASM 57 (1964) 261.[27] M. Matsuo, ISIJ Int. 29 (1999) 809–827.
P. Ghosh et al. / Journal of Magnetism and Magnetic Materials 356 (2014) 42–51 51