The 2dF Galaxy Redshift Survey: Luminosity dependence of galaxy clustering
Upload
independentCategory
view
6download
0
arX
iv:a
stro
-ph/
0203
122v
1 7
Mar
200
2
VERSION: 07 March 2002; Accepted to ApJ
The Luminosity and Mass Function of the Trapezium Cluster:From B Stars to the Deuterium Burning Limit.
August A. Muench and Elizabeth A. Lada
Department of Astronomy, University of Florida, Gainesville, FL 32611
[email protected], [email protected]
Charles J. Lada1
Harvard-Smithsonian Center for Astrophysics, Cambridge, MA 02138
and
João Alves1
European Southern Observatory, Karl-Schwartzschild-Strasse 2, 85748 Garching Germany
ABSTRACT
We use the results of a new, multi-epoch, multi-wavelength,near-infrared census ofthe Trapezium Cluster in Orion to construct and to analyze the structure of its infrared(K band) luminosity function. Specifically, we employ an improved set of modelluminosity functions to derive this cluster’s underlying Initial Mass Function (IMF)across the entire range of mass from OB stars to sub-stellar objects down to near thedeuterium burning limit. We derive an IMF for the Trapezium Cluster that rises withdecreasing mass, having a Salpeter-like IMF slope until near ∼ 0.6M⊙ where theIMF flattens and forms a broad peak extending to the hydrogen burning limit, belowwhich the IMF declines into the sub-stellar regime. Independent of the details, wefind that sub-stellar objects account for no more than∼ 22% of the total number oflikely cluster members. Further, the sub-stellar Trapezium IMF breaks from a steady
1Visiting Astronomer, European Southern Observatory

– 2 –
power-law decline and forms a significant secondary peak at the lowest masses (10-20times the mass of Jupiter). This secondary peak may contain as many as∼ 30% of thesub-stellar objects in the cluster. Below this sub-stellarIMF peak, our KLF modelingrequires a subsequent sharp decline toward the planetary mass regime. Lastly, weinvestigate the robustness of pre-main sequence luminosity evolution as predicted bycurrent evolutionary models, and we discuss possible origins for the IMF of browndwarfs.
Subject headings: infrared: stars — open clusters and associations: individual (Trapez-ium Cluster) — stars: luminosity function, mass function — stars: low-mass, browndwarfs — stars: pre-main sequence
1. Introduction
Little is known about the similarities or differences between the star formation process thatcreated the first generation of stars in the universe and the process that is forming stars in nearbystellar nurseries today. One important diagnostic for studying any evolution of the star formationprocess is the statistical distribution of stellar masses at birth, or the stellar initial mass function(IMF). Comparisons of the mass functions of stars in globular clusters, in the field, in intermediateage open clusters such as the Pleiades and in extremely youngclusters embedded in nearby molec-ular clouds might reveal similarities or differences that would test the notion of a universal massfunction (or a dominant star formation process) or that could bring about a better understandingof its stochastic nature (see for example, Kroupa 2001; Gilmore 2001, for recent discussions).Because the initial mass function is an intrinsically statistical quantity, such comparisons requirenumerous measurements of the IMF in a variety of environments, in turn, requiring tools that canprobe the IMF over a large volume of space and time.
Very young embedded clusters are particularly valuable forIMF studies. A simple photomet-ric census of the members of a young embedded cluster yields astatistically significant populationof stars sharing a common heritage (e.g., age and metallicity). Further such a census is relativelycomplete because young clusters have not lost significant numbers of members to either dynam-ical or stellar evolution; hence, the observed mass function is the cluster’sinitial mass function.Because very young clusters are still embedded within theirparental molecular cloud, an infraredphotometric census is often necessary to identify a complete cluster population. One direct productof such an IR census is the young cluster’s stellar infrared luminosity function, which can be usedas a tool for studying a cluster’s IMF. This may be a particularly effective tool for studying the lowmass end of a cluster’s IMF because infrared luminosities are relatively easy to derive for browndwarf cluster members since such intrinsically red sub-stellar sources are at brighter luminosities

– 3 –
than at any subsequent point in their evolution. Further, modern infrared cameras on modest sizedtelescopes can efficiently survey numerous young clusters,deriving infrared luminosities for com-plete populations, and, thus, potentially sampling the IMFof the current epoch over a relativelylarge volume of the local galaxy.
In our initial work, Muench, Lada & Lada (2000, hereafter MLL2000), we performed aseries of numerical experiments aimed at testing the usefulness of infrared luminosity functionsfor deriving cluster IMFs. By varying the different fundamental physical properties of a veryyoung cluster, e.g., the cluster’s underlying initial massfunction (IMF), the cluster’s star forminghistory (SFH) and the appropriate (fixed metallicity) mass-luminosity relation (M-L relation) forcluster members, we showed that a cluster’s luminosity function is considerably more sensitive tothe form of the underlying initial mass function than to any other parameter. In particular, we foundthat differences between various theoretical pre-main sequence evolutionary calculations producedonly negligible differences in the resulting model luminosity functions and that these differenceswould not likely be observable. As we show here, this is the result of the fact that canonical PMSluminosity evolution is a relatively robust prediction of current PMS models.
In MLL2000, we applied these results to the infrared (K band)luminosity function (KLF) ofthe famous Trapezium Cluster in Orion. It is the richest young cluster within the local kiloparsec(Hillenbrand 1997); therefore, it provides a nearby statistically significant sample of sources forwhich infrared luminosities can be derived, including eventhe faintest planetary mass members.This is an ideal laboratory for applying and for testing our model luminosity function method.Using the cluster’s mean age and age spread taken from spectroscopic observations of opticallyvisible cluster members, we used our method to derive the Trapezium Cluster IMF from its KLF.In MLL2000, we found the cluster’s IMF rose steeply in numberwith decreasing mass until justless than one solar mass where the IMF then flattened and peaked near the hydrogen burning limitbefore falling throughout the sub-stellar regime with a brown dwarf IMF slope2 of ∼ +1. We alsofound good agreement between the form of the Trapezium IMF derived from its KLF and thatIMF derived by Hillenbrand (1997) for this cluster using a spectroscopic analysis of the opticallyvisible members. Further, luminosity function modeling enabled the derivation of the sub-stellarIMF, which was not possible from the optical/spectroscopicanalysis.
In addition to the three fundamental quantities (age, IMF, M-L relation) that govern the struc-ture of a young cluster’s luminosity function, there are a number of observational characteristicsthat may affect the conversion of a cluster’s infrared luminosity function into the cluster’s IMF.
2In all cases we will refer to the mass function not the mass spectrum of stars. The mass function is the number ofstars per unit volume per unitlog mass The Salpeter (1955) mass function would be a power-lawξ( log(m⋆) ) = mΓ
with an indexΓ = −1.35 in this definition.
– 4 –
In particular, very young stars are reddened due to extinction from the parental molecular cloudand from excess infrared emission arising from a circumstellar disk. Cluster membership is oftenpoorly known, requiring a statistical estimate of the interloping field star population. We did notinclude these observational effects into our MLL2000 derivation of the Trapezium IMF becausewe had access to only a monochromatic KLF taken from the literature with no color or complete-ness information. In this current paper, we account for these observational effects by employinga new multi-wavelength near-infrared census of the Trapezium Cluster that we have constructedover a three year period of observations. Using these deeper, more complete observations, westudy the contribution of background field stars to the Trapezium Cluster’s near-infrared luminos-ity function, expand our model luminosity function effortsto account for source reddening, andexplore the Trapezium KLF at fainter magnitudes than was possible in MLL2000. We re-derivethe Trapezium Cluster IMF from its luminosity function, providing a detailed range of possibleIMF parameters. We discuss the relative degeneracy of the theoretical mass-luminosity relationsderived from different sets of evolutionary models, and we compare the results of several publishedderivations of the Trapezium IMF that rely upon infrared photometry. Lastly, we discuss possibleorigins for a derived feature in the Trapezium sub-stellar IMF near the planetary mass regime.
2. The Trapezium Cluster K band Luminosity Function
2.1. The Near-Infrared Census
To derive a complete multi-wavelength census of the sourcesin the Trapezium Cluster, weperformed infrared observations during 1997 December, 1998 November and 2000 March usingtwo telescopes: the 1.2m telescope at the Fred Lawrence Whipple Observatory (FLWO) at Mt.Hopkins, Arizona (USA) and the ESO 3.5m New Technology Telescope (NTT) in La Silla, Chile.These observations yielded the multi-epoch, multi-wavelength FLWO-NTT infrared catalog thatcontains∼ 1000 sources (see Appendix A for catalog details). Subsets of this catalog have beenpreviously used in the Lada et al., (2000) and Muench et al., (2001) studies of the frequency ofcircumstellar disks around stars and brown dwarfs in the Trapezium Cluster.
We restrict our subsequent analysis of the cluster’s luminosity and mass function to the areasurveyed by our deeper NTT observations. We display a JHKs color composite image of the5′ × 5′ NTT region in figure 1. Our observations detected 749 sourceswithin this region. Thecompleteness of this sample at the faintest magnitudes is difficult to quantify because of the spa-tially variable nebular background. The formal 10σ detection limits of our NTT images are 19.75at J, 18.75 at H and 18.10 at Ks based upon the pixel to pixel noise in non-nebulous off-clusterobservations that were taken adjacent in time to the on-cluster images. To estimate our actual com-

– 5 –
pleteness limits, we performed artificial star experimentsby constructing a stellar PSF for each ofour images and using the IRAF ADDSTAR routine to place synthetic stars in both the off-clusterand the nebulous on-cluster images. A small number of synthetic stars (30-70) with a range of inputmagnitudes were randomly added across each image and were then recovered using the DAOFINDroutine. This was repeated a large number of times (40-200) to achieve sufficient signal to noisefor these tests. In off-cluster images, the derived 90% completeness limits agreed well with theestimated 10σ detection limits. In the on-cluster images, the completeness limits were reduced to90% completeness limits of J∼ 18.15, H ∼ 17.8, and Ks ∼ 17.5 with slightly brighter limitsin the dense central core (0.5′ radius fromθ1C Orionis). We also carefully compared our sourcelist to those published by other recent surveys for the NTT region. To our resolution limit, wedetected all the sources found by the Hillenbrand & Carpenter (2000, hereafter, HC2000) Kecksurvey except for one, all but two sources from the Luhman et al., (2000) NICMOS survey, butwe could not identify nine sources listed in Lucas & Roche (2000, hereafter, LR2000) UKIRTsurvey. Further, it is our finding of 58 new sources within ourNTT region and unreported by priorcatalogs that adds support to the deep and very sensitive nature of our census.
2.2. Constructing Infrared Luminosity Function(s)
The FLWO and NTT observations overlap considerably in dynamic range with 504 stars hav-ing multi-epoch photometry. For our analysis, we preferentially adopt infrared luminosities fromthe NTT photometry because it has higher angular resolutionand it is an essentially simultane-ous set of near-infrared data. For 123 stars that are saturated in one or more bands on the NTTimages, the FLWO photometry was used. This transition from NTT to FLWO photometry is atapproximately J = 11.5, H = 11.0, and K = 11.0. For the brightest 5 OB stars, saturated on allour images, we used JHK photometry from the Hillenbrand et al., (1998) catalog. Photometricdifferences between the FLWO and NTT datasets are small (seeAppendix A) and will not affectour construction of the Trapezium Cluster infrared luminosity function(s).
In Figure 2, we present the raw infrared Trapezium Luminosity Functions (LFs). We use rel-atively wide bins (0.5 magnitudes) that are much larger thanthe photometric errors (see AppendixA.2). In Figure 2(a), we compare the J and H band LFs for stars in this region. In the Figure 2(b),we compare the K band LF of the NTT region to that K band LF constructed in MLL2000. As wasobserved in previous studies of the Trapezium Cluster, the cluster’s infrared luminosity function (J,H, or K) rises steeply toward fainter magnitudes, before flattening and forming a broad peak. TheLF steadily declines in number below this peak but then rapidly tails off a full magnitude aboveour completeness limits.
For our current derivation of the Trapezium IMF, we use the Trapezium K band Luminosity

– 6 –
Function, rather than the J or H LFs. We do so in order to minimize the effects of extinction onthe luminosities of cluster members (see section 3.1.1), tomaximize our sensitivity to intrinsicallyred, low luminosity brown dwarf members of this cluster, andto make detailed comparisons toour work in MLL2000. For example, the new FLWO-NTT TrapeziumKLF contains significantlymore stars at faint (K> 14) magnitudes than the KLF used in MLL2000. Interestingly,a secondarypeak near K = 15 seen in the MLL2000 KLF (originally McCaughrean et al., 1995) is much moresignificant and peaks at K=15.5 in the new FLWO-NTT KLF. Similar peaks are not apparent in theJ or H band LFs constructed here, though Lucas & Roche (2000) report a strong secondary peak intheir Trapezium JLF. Such secondary peaks in young cluster luminosity functions have often beenevidence of a background field star population contributingto the source counts (e.g., Luhman etal., 1998; Luhman & Rieke 1999).
To account for the possible field star contamination, we systematically obtained images ofcontrol fields away from the cluster and off of the Orion Molecular Cloud. The FLWO off-cluster field(s) were centered at approximately R.A. = 05h26m; DEC. =−06◦00′ (J2000) and wereroughly twice the area of the NTT off-fields. The NTT off-cluster region was centered at R.A. =05h37m43.s7; DEC.=−01◦55′42.′′7 (J2000). Figure 3(a) displays the two off-field KLFs (scaled tothe same area) from these observations and in the inset, their (H - K) distributions. The relativelynarrow (H - K) distributions indicate that the two off-fieldssample similar populations and thatthey are un-reddened. We constructed an observed field star KLF by averaging these luminosityfunctions, weighting (by area) toward the FLWO off-fields for K brighter than 16th magnitude, thecompleteness limit of that dataset, and toward the more sensitive NTT off-fields for fainter than K= 16. In Figure 3(b), we compare the resulting field star KLF tothe Trapezium KLF of the NTTregion. It is plainly apparent from the raw control field observations that while field stars maycontribute to the Trapezium Cluster IR luminosity functionover a range of magnitudes, their num-bers peak at magnitudes fainter than the secondary peak of the on-cluster KLF and do not appearsufficient in number to explain it.
2.3. Defining a Complete Cluster KLF
We determine the completeness of our FLWO-NTT Trapezium Cluster KLF by constructingand by analyzing the cluster’s infrared (H - K) versus K color-magnitude diagram. For the purposesof our analysis, we adopt the same cluster parameters as we used in MLL2000, e.g., a cluster meanage of 0.8 Myrs (Hillenbrand 1997) and a cluster distance of 400pc. As seen in figure 4(a), theluminosities of the Trapezium sources form a continuously populated sequence from the bright OBmembers (K∼ 5) through sources detected below our completeness limits.
To interpret this diagram, we compare the locations of the FLWO-NTT sources in color-
– 7 –
magnitude space to the cluster’s mean age isochrone as derived from theoretical pre-main sequence(PMS) calculations. Because the D’Antona & Mazzitelli (1997, hereafter, DM97) models includemasses and ages representative of the Trapezium Cluster andinorder to provide continuity with ourwork in MLL2000, we will use these tracks to define a complete cluster sample from figure 4(a).Differences among pre-main sequence tracks should not havesignificant effect upon our analysisof the color-magnitude diagram (see section 4.3). It is clear from this diagram that the clustersources are reddened away from the theoretical 0.8 Myr isochrone, which forms a satisfactory lefthand boundary to the sources in this color-magnitude space.This isochrone, however, does notspan the full luminosity range of the observations and a number (∼ 40) sources lie below the faintend of the DM97 isochrone. As a result, our subsequent analysis that makes use of the DM97models will be restricted to considering only those sourceswhose luminosities, after correctionfor extinction, would correspond to masses greater than themass limit of the DM97 tracks, i.e.,0.017 M⊙ or roughly 17 times the mass of Jupiter (MJup). Despite the lower mass limit imposed bythese PMS tracks, our infrared census spans nearly three orders of magnitude in mass, illustratingthe utility of studying the mass function of such rich young clusters.
Extinction acts to redden and to dim sources of a given mass toa brightness below our de-tection limits. To determine our ability to detect extincted stars as a function of mass, we drawa reddening vector from the luminosity (and color) of a particular mass star on the mean ageisochrone until it intersects the 10σ sensitivity limit of our census. We can detect the 1 Myr oldSun seen through AV ∼ 60 magnitudes of extinction or a PMS star at the hydrogen burning limitseen through∼ 35 magnitudes. For very young brown dwarfs at our lower mass limit (17 MJup),we probe the cloud to AV = 17 magnitudes. We use this latter reddening vector as a boundary towhich we are complete in mass, and we draw a mass and extinction (M − AV ) limited subset ofsources bounded by the mean age isochrone and the AV = 17 reddening vector and mark these asfilled circles in figure 4(a). Our M− AV limits probe the vast majority of the cluster population,including 81% of the sources the color-magnitude diagram.
In figure 4(b) we present the M−AV limited KLF, containing 583 sources. Thirty-two sources,detected only at K band (representing only 4% of our catalog), were also excluded from our furtheranalysis. The median K magnitude of these sources is K = 15, and we expect that these arelikely heavily reddened objects. We compare the M− AV limited KLF to the unfiltered TrapeziumKLF. Clearly, heavily reddened sources contributed to the cluster KLF at all magnitudes and theirremoval results in a narrower cluster KLF. However, the structure (e.g., peak, slope, inflections,etc.) of the KLF remains largely unchanged. The secondary peak of the cluster KLF betweenK ∼ 14 − 17 seems to be real since it is present in both the raw and the M− AV limited KLFs,though we have not yet corrected for background field stars.
There are at least three possible sources of incompletenessin our mass/extinction limited

– 8 –
sample. The first arises because sources that are formally within our mass and extinction limitsmay be additionally reddened by infrared excess from circumstellar disks and, hence, be left out ofour analysis. However, this bias will affect sources of all masses equally because infrared excessappears to be a property of the young Trapezium sources over the entire luminosity range (Muenchet al., 2001). Second, the Trapezium Cluster is not fully coeval and our use of the cluster’s meanage to draw the M− AV sample means that cluster members at our lower mass limit (17MJup) butolder than the cluster’s mean age (τ > 0.8Myrs) will be fainter than the lower boundary and leftout of our sample. Further, sources younger than the mean agebut below 17MJup will be includedinto the sample. This “age bias” will affect the lowest mass sources, i.e.,< 20MJup. Third,because of the strong nebular background, our true completeness limit (see section 2.1) is brighterthan our formal 10σ sensitivity for approximately 60% of the area surveyed. Theresulting sampleincompleteness only affects our sensitivity to sources less than 30MJup and with AV > 10. We donot correct the Trapezium KLF to account for these effects orbiases.
2.4. Field Star Contamination to the KLF
The lack of specific membership criteria for the embedded sources in the Trapezium Clusterrequires an estimate of the number of interloping non-cluster field stars in our sample. Some pub-lished studies, for example LR2000 and Luhman et al., (2000), assume that the parental molecularcloud acts as a shield to background field stars; whereas HC2000 suggests that the backgroundcontribution is non-negligible. HC2000 estimates the fieldstar contribution using an empiricalmodel of the infrared field star population and convolving this model with a local extinction mapderived from a molecular line map of the region. This approach may suffer from its dependenceupon a field star model that is not calibrated to these faint magnitudes and that does not includevery low mass field stars. As we show, there are also considerable uncertainties in the conversionof a molecular line map to an extinction map. For our current study, we use our observed K bandfield star luminosity function (see figure 3) to test these prior methodologies and to correct for thefield star contamination. We point out that no such estimate can account for contamination due toyoung, low mass members of the foreground Orion OB1 association.
We compare in figure 5 the effects of six different extinctionmodels upon our observed fieldstar KLF. In panels A and B, we tested simple Gaussian distributions of extinction centered respec-tively at AV = 10 and 25 magnitudes withσ = 5 magnitudes. In both cases, the reddened field starKLF contains significant counts above our completeness limit and “background extinction shields”such as these do not prevent the infiltration of field stars into our counts. In the second pair of red-dened off-fields (panels C and D), we followed the HC2000 prescription for estimating backgroundfield stars by convolving our observed field star KLF with the C18O map from Goldsmith, Bergin

– 9 –
& Lis (1997) converted from column density to dust extinction. We note that there is substantialuncertainty in the conversion from C18O column density to dust extinction. There is at least afactor of 2 variation in this conversion value in the literature, where Frerking, Langer & Wilson(1982) derived a range from 0.7 − 2.4 (in units of 1014 cm2 mag−1) and Goldsmith, Bergin & Lis(1997) estimated a range of values from 1.7 − 3. Either the result of measurement uncertainty orthe product of different environmental conditions, this variation produces a factor of 2 uncertaintyin the extinction estimates from the C18O map. In short, we find that a C18O → AV ratio of 3.0(panel C) results in twice as many interloping background field stars as would a value of 1.7 (panelD; equivalent to that used by HC2000).
In panels E and F of figure 5 we derive the same reddened off-field KLFs as in the prior pair,but they have been filtered to estimate the actual contribution of field-stars to our M− AV limitedsample. These filters, which were based upon on the K brightness of the lower mass limit of ourPMS models and on the derived extinction limit of the M− AV sample, were applied during theconvolution of the field star KLF with the cloud extinction model such that only reddened fieldstars that would have AV < 20 and unreddened K magnitudes< 16 would be counted into filteredreddened off-field KLF. The extinction limit was expanded from 17 to 20 magnitudes to account forthe dispersion of the H-K distribution of un-reddened field-stars (∼ 0.2). A factor of 2 uncertaintyremains. Alves, Lada & Lada (1999) derive a more consistent estimate of the C18O → AV ratiofrom near-infrared extinction mapping of dark clouds, suggesting a median ratio of 2.1. AdoptingC18O → AV = 2.1, we estimate there are∼ 20 ± 10 field stars in our M− AV limited KLF. Fromthese experiments, we find, however, that both the raw and reddened off-field KLFs always peakat fainter magnitudes than the secondary peak of the Trapezium KLF, and that the subtraction ofthese field-star corrections from the Trapezium KLF do not remove this secondary peak. Thesefindings suggest that the secondary KLF peak is a real featurein the Trapezium Cluster’s infraredluminosity function.
3. The Trapezium Cluster Initial Mass Function
We analyze the Trapezium Cluster’s K band luminosity function constructed in section 2 us-ing our model luminosity function algorithm first describedin MLL2000. Following our workin MLL2000, our goal is to derive the underlying mass function or set of mass functions whosemodel luminosity functions best fit the Trapezium Cluster KLF. We have improved our modelingalgorithm by including statistical distributions of the reddening properties of the cluster. We havealso improved our analysis by applying the background field star correction from section 2.4 andby employing improved fitting techniques for deriving IMF parameters and confidence intervals.Before deriving the cluster IMF, we use the extensive color information available from the FLWO-
– 10 –
NTT catalog to explore the reddening (extinction and infrared excess) properties of the Trapeziumsources. In section 3.1, we use this information to create recipes for deriving the probability distri-butions functions of extinction and excess which can be folded back into our modeling algorithmduring our derivation of the Trapezium IMF. We present the new model luminosity functions andfitting techniques in section 3.2 and summarize the derived IMF in section 3.3.
3.1. Deriving Distributions of Reddening
3.1.1. Extinction Probability Distribution Function
We use the extensive color information provided by our FLWO-NTT catalog to construct aprobability distribution function of the intra-cluster extinctions (hereafter referred to as the Ex-tinction Probability Distribution Function or EPDF) basedupon the color excesses of individualTrapezium sources. Because the stellar photospheric (H - K)color has a very narrow distribution ofintrinsic photospheric values it should be the ideal color from which to derive line of sight extinc-tion estimates, as shown, for example, in the Alves et al., (1998) study of the structure of molecularclouds. In figure 6(a) we show the histogram of observed (H - K)color for all our Trapezium Clus-ter sources. This histogram peaks at (H - K) = 0.5 and is quite broad especially when comparedto the narrow unreddened photospheric (field-star) (H - K) distributions seen in figure 3(a). Thisbroad distribution may be in part the result of extinction; however, as recently shown in Lada etal., (2000) and Muench et al., (2001), approximately 50% of the these Trapezium Cluster sources,independent of luminosity, display infrared excess indicative of emission from circumstellar disks.This is illustrated in figure 6(b) where it is clear that thereare both heavily reddened sources(AV ∼ 35) and sources with large infrared excesses (falling to theright of the reddening band formain sequence objects). If the (H - K) color excess were assumed to be produced by extinctionalone without accounting for disk emission, the resulting extinction estimates would be too large.
Meyer, Calvet & Hillenbrand (1997) showed that the intrinsic infrared colors of star withdisks are confined to a locus (the classical T-Tauri star locus or CTTS locus) in the (H - K)/(J - H)color-color diagram. We derive individual AV estimates for sources in the (H - K)/(J - H) color-color diagram by dereddening these stars back to this CTTS locus along a reddening vector definedby the Cohen et al., (1981) reddening law. Sources without J comprise∼ 20% of the catalog andas shown in figure 6, their (H - K) colors appear to sample a moreheavily embedded population,implying extinctions as high as AV ∼ 60. AV estimates are derived for these sources by assigninga typical star-disk (H - K) color = 0.5 magnitudes, and de-reddening that source. Sources nearto but below the CTTS locus are assigned an AV = 0. The individual extinctions are binned intoan extinction probability distribution function (EPDF) asshown in figure 7(a). Also shown are
– 11 –
the effects of changing the typical star-disk (H - K) color assumed for those stars without J band.Little change is seen. Compared to the cloud extinction distribution function, which was integratedover area from the C18O map, the cluster EPDF is very non-gaussian and peaks at relatively lowextinctions, AV = 2.5, having a median AV = 4.75 and a mean AV = 9.2. Further, the cluster EPDFis not well separated from the reddening distribution provided by the molecular cloud. Rather thecluster population significantly extends to extinctions ashigh as AV = 10− 25, near and beyond thepeak of the cloud extinction function. Ancillary evidence of this significant population of heavilyreddened stars is seen in the color-color diagram (figure 6b)which clearly illustrates the extensionof the cluster to regions of the molecular cloud with AV > 10. Lastly, it is clear that the deepnature of our survey has allowed us to sample both the majority of the embedded cluster, and thecloud over the full range of density.
In our revised model luminosity function algorithm, we randomly sample the cluster’s EPDFto assign an AV to each artificial star in the model LF. The effect of the EPDF on the model lumi-nosity function is wavelength and reddening law (Cohen et al., 1981, in this case) dependent. Infigure 8 we construct model I, J, H, and K luminosity functions, reddening each by the TrapeziumCluster EPDF. The effect of the EPDF on the intrinsic I and J band LFs is profound, rendering thereddened I band LF almost unrecognizable. Yet at longer wavelengths, specifically at K band, theeffects of extinction are minimized. We note that the overall form of the reddened model K bandluminosity function has not been changed by the Trapezium EPDF in a significant way, e.g., thepeak of the model KLF is not significantly blurred and the faint slope of the KLF has not beenchanged from falling to flat. This suggests that our modelingof the Trapezium KLF in MLL2000,which did not account for reddening due to extinction, is generally correct. However, we likelyderived too low of a turnover mass for the Trapezium IMF because reddening shifted the intrinsicLF to fainter magnitudes.
3.1.2. Infrared Excess Probability Distribution Function
Because we wish to use the Trapezium K band LF to minimize the effects of extinction, wemust also account for the effects of circumstellar disk emission at K band. The frequency distribu-tion of the resulting excess infrared flux is not a well known quantity, and when previously derived,it has depended significantly upon additional information derived from the spectral classificationof cluster members (Hillenbrand & Carpenter 2000; Hillenbrand et al., 1998). One of the goals ofthis present work is to construct a recipe for deriving the K band excess distribution directly fromthe infrared colors of the cluster members.
To derive a first-order infrared excess probability distribution function (IXPDF) for the Trapez-ium Cluster sources, we simply assume that any excess (H - K) color (above the photosphere, after

– 12 –
removing the effects of extinction) reflectsan excess at K band alone, realizing this may underesti-mate the infrared excess of individual sources. We only use the sources having JHK measurementsand lying above the CTTS locus in the color-color diagram. Weremove the effects of extinctionfrom each source’s observed (H - K) color using the same method described above, i.e., dered-dening back to the CTTS locus. However, the photospheric (H -K) color for each star cannot bediscreetly removed from this data alone. The photospheric infrared colors of pre-main sequencestars appear to be mostly dwarf-like (Luhman 1999), and therefore, we used the observed fieldstar (H - K) distribution shown in figure 3(a) as a probabilitydistribution of photospheric values.We derive the IXPDF by binning the de-reddened (H - K) colors into a probability function andthen subtracting the distribution of photospheric colors using a Monte Carlo integration.
The Trapezium Cluster IXPDF is shown in figure 7(b). The IXPDFpeaks near 0.2 magnitudeswith a mean = 0.37, a median = 0.31, and a maximum excess of∼ 2.0 magnitudes. Probabilitiesof negative excesses were ignored. The IXPDF is similar to the (H - K) excess distribution shownin HC2000 and derived in Hillenbrand et al., (1998) yet extends to somewhat larger excess values.Each artificial star in our models is randomly assigned a K band excess (in magnitudes) drawnfrom the IXPDF.
3.2. Modeling the Trapezium Cluster KLF
To model the Trapezium Cluster KLF, we apply the appropriatefield star correction derived insection 2.4 to the M− AV limited KLF constructed in section 2.3. We fix the Trapezium Cluster’sstar forming history and distance to be identical to that used in MLL2000. Specifically, these are adistance of 400pc (m-M=8.0) and a star forming history characterized by constant star formationfrom 1.4 to 0.2 Myrs ago, yielding a cluster mean age of 0.8 Myrs (Hillenbrand 1997) and anage spread of 1.2 Myrs. We adopt our standard set of merged theoretical pre-main sequence tracksfrom MLL20003. Our merged standard set of tracks span a mass range from 60 to0.017 M⊙,allowing us to construct a continuous IMF within this range.We incorporated the cluster’s redden-ing distributions derived in section 3.1 into our modeling algorithm and chose a functional formof the cluster IMF similar to that used in MLL2000; specifically, an IMF constructed of power-law segments,Γi connected at break masses,m j. As in MLL2000, we found that an underlying 3power-law IMF produced model KLFs that fit the observations over most of the luminosity range,
3Our standard set of theoretical tracks are described in Appendix B of MLL2000: they are a merger of evolutionarycalculations including a theoretical Zero Age Main Sequence (ZAMS) from Schaller et al., (1992), a set of interme-diate mass (1-5 M⊙) “accretion-scenario” PMS tracks from Bernasconi (1996),and the low mass standard deuteriumabundance PMS models from D’Antona & Mazzitelli (1997) for masses from 1 to 0.017 M⊙

– 13 –
corresponding to masses from 5 to 0.03 M⊙. In section 3.2.1, we utilize ourχ2 minimization rou-tine to identify those 3 power-law IMFs that best fit the observed KLF within this mass range, andwe estimate confidence intervals for these IMF parameters insection 3.2.2. We find that the faintTrapezium brown dwarf KLF, corresponding to masses less than 0.03 M⊙, contains structure anda secondary peak that are not well fit by the 3 power-law IMF models. In section 3.2.3 we modelthis secondary KLF peak using a corresponding break and secondary feature in the cluster browndwarf IMF between 0.03 and 0.01 M⊙.
3.2.1. Results of χ2 Fitting: Best Fit Three Power-Law IMFs
Our χ2 minimization procedure calculates the reducedχ2 statistic and probability for a par-ticular model KLF fit to the Trapezium KLF over a range of magnitude bins. Parameters for theunderlying three power-law IMF are taken from the best fit model KLFs, and we fit both reddenedand unreddened model KLFs. The 3 power-law IMF derived from these fits is summarized in table1. We found that the results of our model fits were dependent upon the dynamic range of K mag-nitude bins over which the models were minimized. Specifically, we find that our results are verysensitive to the formation of a secondary peak in the Trapezium KLF at K = 15.5, which remainsdespite the subtraction of the field star KLF.
We derive good model KLF fits (χ2 prob ∼ 1) when fitting between the K = 7.5 bin and theK = 14.5 bin (see figure 9a), the same luminosity range we modeled in MLL2000. Within thethis fit range we find an optimal Trapezium IMF nearly identical to that found in MLL2000 evenafter accounting for reddening. The derived IMF rises steeply from the most massive stars withΓ1 = −1.3 before breaking to a shallower IMF slope ofΓ2 = −0.2 at 0.6M⊙ (log m1 ∼ −0.2). Thederived IMF peaks near the hydrogen burning limit (0.10− 0.08 M⊙ or logm2 = −1.0− 1.1) andthen breaks and falls steeply throughout the brown dwarf regime with Γ3 ∼ +1.0. We also derivegood fits to K=15 (just before the secondary peak in the cluster KLF), with the resulting IMFpeaking at slightly higher masses (0.13 − 0.10M⊙) and falling with a slightly shallower slope,Γ3 ∼ +0.7 to 0.8. The unreddened luminosities of this fit range correspond to a mass range from5.0 to 0.03 M⊙.
However, we cannot produce models KLFs based upon a three power-law IMF that adequatelyfit the secondary peak in the Trapezium KLF. For example, our best fit to the secondary peak infigure 9(b) is inconsistent with the overall form of the faintKLF, being unable to replicate both thefalling KLF at K = 14.5 nor the secondary peak at K = 15.5. Such structure in the faint TrapeziumKLF implies similar non-power law structure in the underlying IMF, while our current modelsbased upon a three power-law IMF essentially assign a singlepower-law IMF slope for the entirebrown dwarf regime. We will explore this structure in the faint brown dwarf KLF and IMF in

– 14 –
section 3.2.3, but first we examine the confidence intervals for the derived 3 power-law IMFs.
3.2.2. Results of χ2 Fitting: Range of Permitted Three Power-Law IMFs
Our χ2 fitting routine also allows us to investigate the range of permitted cluster IMFs frommodeling the cluster KLF. We illustrate the range of IMFs andthe effects of source reddeningon our fits in figure 10 and summarize the corresponding constraints on the IMF parameters intable 1. In each panel, we plot the contours ofχ2 probability for two of the 5 dependent IMFparameters while restricting the other three parameters toa best fit model. In each panel we alsodisplay contours for fits with (solid) and without (dashed) source reddening, and we examine thedependence of these parameters for models fit to the K=14.5 and K=15.0 bins.
In all our fitting experiments (here and MLL2000), the high mass slope of the cluster IMF,Γ1,was well constrained with slopes measured between -1.0 and -1.3. Based on this result, we fixΓ1
to equal -1.3. Panels (a) - (c) in figure 10 display the ranges of the other 4 IMF parameters whenfitting to a K limit = 14.5. Panel (a) plots the dependence of the two break masses,m1andm2.The fits for these parameters are well behaved with 90% contours have a typical width of 0.1-0.2 dex in units of log mass. Source reddening has two clear effects upon our fit results. Whensource reddening is included, the high mass break,m1, decreases and the low mass break,m2,increases. The second effect is that the size of the 90% confidence contour increases when sourcereddening is included into the model fits. Panel (b) displaysthe dependence of the low massbreak,m2, on the middle power-law slope,Γ2. Γ2 is fairly well constrained to be slightly risingto lower masses, and the permitted range ofm2 is again roughly 0.1 - 0.2 dex, centered near 0.1M⊙ (logm ∼ −1). Accounting for source reddening again shifts the low-mass break to slightlyhigher masses, increases the size of the 90% contour, and in this case, flattens the central power-law.
Panel (c) displays the dependence ofΓ3 upon the second break mass,m2. Thoughm2 is fairlywell constrained to have values between 0.13 and 0.08 M⊙, the low mass power-law slope,Γ3, hasa large range of possible slopes from 0.50 to 1.50 within the 90% χ2 contour for models withsource reddening. Panel (d) plots the same parameters as panel (c) but for fits to the K limit = 15.These fits give somewhat flatterΓ3 slopes and somewhat higher massm2 breaks, but are actuallyslightly better constrained. As discussed in the previous section, our model KLFs employing a 3power-law IMF do not provide good fits to the secondary peak inthe KLF. As the fit range shifts tofainter magnitudes,Γ3 flattens, but the totalχ2 confidence depreciates due to the secondary peak.We explore the IMF parameters necessary to fit this secondarypeak in the next section.
– 15 –
3.2.3. Fitting the Secondary Peak in the Trapezium Cluster KLF
In contrast to our expectations in MLL2000, the departure from a power-law decline and theformation of a secondary peak at the faint end of the Trapezium KLF remains after correcting forreddened background field stars. When we attempt to fit the faint KLF using an underlying threepower-law IMF, we find that our model KLFs, while producing excellent fits over the majorityof the Trapezium KLF, could not simultaneously reproduce the formation of the secondary peak.Since there is no known corresponding feature in the mass-luminosity relation (see section 4.2),we hypothesize that the KLF’s break from a single continuousdeclining slope at K> 14.5 (M <
30MJup) and the formation of a secondary KLF peak directly imply a similar break and feature inthe cluster IMF. Further, the rapid tailing off of the cluster KLF below this secondary peak alsodirectly implies a similar rapid decline or truncation in the underlying IMF, as was also discussedin LR2000.
We modeled the secondary KLF peak by adding a fourth, truncated, power-law segment,Γ4,to the three power-law IMFs derived in section 3.2.1. The truncation of the fourth power-lawsegment enabled us to model the rapid tailing off of the cluster KLF below the secondary peak,but was also dictated by the artificial low mass cut off present in the adopted merged PMS tracks,which for the sub-stellar regime come from DM97. As such, thetruncation mass of the modelIMF was arbitrarily set to 0.017 M⊙. We found that this 4 power-law truncated IMF producedgoodχ2 model KLF fits to the secondary KLF peak. The best fit model KLF shown in figure11(a) has an underlying brown dwarf IMF that breaks from a steady decline atm3 = 0.025M⊙and then rises steeply withΓ4 ∼ −5 before truncating at the lower mass limit. Examination of theconfidence intervals for them3 andΓ4 parameters showed that higher mass breaks (m3 ∼ 0.035)required flatterΓ4 slopes, but they had worseχ2 and peaked before the observed peak at K=15.5.This suggests that were the slope of the mass-luminosity relation continuous (and constant) towardlower masses, the exact location of the secondary IMF peak would shift to somewhat lower massesthan we can derive using the truncated PMS tracks.
3.3. Derived Trapezium Cluster IMF
3.3.1. The Overall Cluster IMF
Figure 11(b) shows our overall best fit Trapezium IMF and graphically displays the range ofcluster IMFs permitted by our modeling of the Trapezium KLF using our standard set of mergedPMS tracks. We adopt the following four power-law function with a truncation at the lowest massesfor the underlying IMF of the Trapezium:

– 16 –
d Nd logm
=
MΓ
⋆ ; Γ =
−1.21 : M⋆ > 0.600 M⊙−0.15 : 0.600 M⊙ > M⋆ > 0.120 M⊙+0.73 : 0.120 M⊙ > M⋆ > 0.025 M⊙−5.00 : 0.025 M⊙ > M⋆ > 0.017 M⊙
0 ; M⋆ = 0.017 M⊙
(1)
We find that despite the use of deeper, more complete observations, the application of detailedmass and extinction limits to the cluster sample, the inclusion of source reddening into the modelluminosity function algorithm and the correction of our infrared census for reddened field stars, ourderived Trapezium IMF is not a significant revision over thatfound in MLL2000. We find that theinclusion of source reddening into our modeling algorithm,while providing a more accurate repre-sentation of the cluster properties, results in cluster IMFs that have very similar power-law slopesand break masses as fits without source reddening, especially when fit to the same luminosityrange. Source reddening does indeed blur the precision of the IMFs we can derive. For exam-ple, our MLL2000 IMF derived without accounting for source reddening is somewhat broader andpeaks to slightly lower mass than the IMF derived here with source reddening. Though the over-all derived IMF has not significantly changed from our findings in MLL2000, our more completeinfrared census and improved understanding of the field-star population do allow us to explorethe Trapezium IMF at lower masses than MLL2000. We find that the secondary peak of the ob-served Trapezium KLF is not the result of background field stars, and we derive a correspondingsecondary peak in the low mass brown dwarf IMF between 10 and 30 MJup. However, becauseof the restriction imposed by the low mass limit of the PMS tracks, both the precise location andamplitude of the secondary peak and the precise form of the IMF below 17MJup are somewhatuncertain.
3.3.2. The Sub-Stellar IMF, A Closer Look
To better define the secondary peak in the Trapezium IMF, we consider only the sub-stellarregime of the Trapezium KLF (K≥ 13), where we can employ a different set of PMS tracks thatcover the corresponding brown dwarf regime but also extend to masses less than the limit of ourstandard merged PMS tracks. The Burrows et al., (1997, hereafter, B97) PMS models are availablefrom 0.12 to 0.001 M⊙ (1 MJup), and for the relevant age range of the Trapezium. While the mass toK luminosity relation is relatively robust between different sets of PMS tracks, the B97 PMS mod-els do display a somewhat flatter mass-luminosity relation for sub-stellar objects than do DM97.We rederived the cluster’s M− AV limited, background corrected Trapezium KLF following ourprescription in section 2.3 but using the B97 isochrone. Since the nebular background decreases
– 17 –
our survey’s completeness to heavily reddened (AV > 10), very low mass (M< 0.03M⊙) browndwarfs, we draw this M−AV sample to our completeness limit rather than our 10σ sensitivity limitto ensure the precision of the sub-stellar IMF. The resulting M−AV limited KLF from the extendedB97 isochrone samples the cluster population to a predictedmass limit of 0.01M⊙ and an AV = 9.
New model KLF fits (see figure 12a) that employ the B97 tracks and use a three power-lawunderlying sub-stellar IMF yield a power-law brown dwarf IMF falling with a similar but somewhatsteeper slope than our standard tracks (see summarized IMF parameters in table 2)4. Similar toDM97, the B97 tracks require the presence of a significant secondary peak that departs from thepower-law function atm3 ∼ 0.02M⊙ and rises very steeply withΓ4 = −5 as shown in figure12b. Further, the extended mass range of the B97 tracks allows us to resolve the location of thesecondary peak: our fits require a peak near the deuterium burning limit, i.e., 13−14MJup, followedby a rapidly declining IMF with a slope ofΓ5 = +5 down to 10MJup. The sharp decline in the sub-stellar IMF below this peak isnot the result of the application of the off-field correction. Fitsto Trapezium sub-stellar KLF without correcting for background field stars yeild nearly identicalcluster IMFs (see figure 12a and table 2). Further, the sharp decline in our derived sub-stellarIMF below the deuterium burning limit and independent of thebackground correction confirmsa similar, straightforward interpretation of the observedrapid turn down in the cluster KLF anddearth of sources in the (H - K)/K color magnitude diagram nearly a full magnitude above ourcompleteness limits (see figure 4).
Lastly, this feature in the IMF appears to be a statisticallysignificant departure from thepower-law decline of the brown dwarf IMF as was implied by ourχ2 fitting in section 3.2.1. Weran a Monte Carlo simulation of the derived Trapezium sub-stellar IMF for a population of 150brown dwarfs. In figure 13 we show the resulting histogram form of the average simulated clusterIMF. Using equally sized bins in log mass units, we calculated the statistical variation in an IMFbin as a function of 50 drawn samples. From these plotted 1σ error bars, it is clear that the derivedsecondary peak is a significant statistical result. In addition, these results imply that a statisticallysignificant identification of such a feature at the tail of theIMF requires the examination of a richsub-stellar population such as that provided by the Trapezium Cluster.
4Fiting the sub-stellar sample drawn to an AV < 17 with model LFs using B97 tracks yielded a power-law declinecloser to that derived from our standard merged models
– 18 –
4. Discussion
4.1. The Structure of the Trapezium KLF and IMF
4.1.1. The Stellar Regime
From our careful construction and improved modeling of the Trapezium Cluster KLF, we areable to derive the underlying Trapezium Cluster IMF, spanning the entire mass range from OB starsto sub-stellar objects near the deuterium burning limit. Wefind that the stellar Trapezium IMF firstrises steeply with a Salpeter-like power-law slope from high mass stars to near 0.6 M⊙ where theIMF flattens and forms a broad peak extending to the hydrogen burning limit. There the IMF turnsover and declines into the brown dwarf regime. From our modeling experiments in MLL2000,we knew that where an underlying IMF has a power-law form, theyoung cluster’s model KLFalso has a power-law form. Further we found that peaks in the model KLFs can arise both due topeaks in the underlying IMF and from features in the M-L relation. From our current modelingof the Trapezium KLF, we find that these conclusions about therelationship between the structureof the KLF and IMF are unchanged by the presence of source reddening. The power-law slopeof the bright end (K< 11.5) of the cluster KLF reflects the power-law slope of the derived IMF.The formation of the primary KLF peak is also similar to the structure of the underlying IMF wederive. The broad main peak of the Trapezium KLF is formed by acombination of a peak in theunderlying stellar IMF and a feature in the theoretical mass-luminosity relation due to deuteriumburning. Moreover, we find that our KLF modeling has allowed us to disentangle these two effects.The main KLF peak at K = 11− 11.5 corresponds to PMS stars between 0.4 and 0.2 M⊙, whichaccording to the DM97 PMS models are undergoing deuterium burning at the mean age of thiscluster, while the derived IMF has a broad peak at somewhat lower masses (0.2-0.08 M⊙) thanthe KLF peak would to first order imply. Lastly, our detailed KLF modeling has determined thatthe turn-over and decline in the cluster KLF does reflect a similar turn-over and decline of theTrapezium IMF across the hydrogen burning limit and is not solely a product of the deuteriumburning spike (e.g., Zinnecker, McCaughrean & Wilking 1993).
4.1.2. The Sub-Stellar Regime
As in our work in MLL2000, our KLF modeling technique has permitted us to derive theTrapezium sub-stellar IMF, while the improved depth of our IR census has allowed us to extendthis derivation from 0.03M⊙ down to near the deuterium burning limit. Our KLF modeling thatnow includes source reddening confirms that the steady decline of the cluster KLF between K = 12and K = 15 reflects a steady power-law decline in the sub-stellar IMF. Independent of our modeling

– 19 –
results, however, no more than 22+4−2% of the sources are sub-stellar objects5.
The secondary peak in the brown dwarf regime of the cluster KLF at K=15.5 and the subse-quent rapid decline of the cluster KLF, however, do not correspond to any known features in thetheoretical mass-luminosity relations we have examined (see section 4.2 and figure 14). Moreover,detailed KLF modeling using two different sets of PMS tracksrequire both the presence of a breakfrom a single power-law decline of the Trapezium brown dwarfIMF around 0.02−0.03M⊙ and theformation of a significant, secondary IMF peak. Using the Burrows et al., (1997) tracks, this IMFpeak is located near the deuterium burning limit, 13-14 MJup, and is followed by a rapid declineto lower masses. Although both sets of PMS tracks suggest thepresence of a secondary peak, theprecise details (e.g., location and amplitude) may be trackdependent. For example, in the Trapez-ium sub-stellar IMF found using the B97 tracks, 36% of the brown dwarfs in the cluster are foundin the secondary IMF peak while 64% have their mass distribution governed by the power-lawregime. For the IMF found using our standard merged tracks, these number are 15 and 85%, re-spectively, however the truncation of the tracks at the lowest masses will slightly skew these latterpercentages.
One proviso to the derivation of a significant IMF peak at the deuterium burning limit is thecontamination of our IR census by non-cluster members. Though, we have accounted for thebackground field stars contribution to the cluster KLF, we have also shown that there is reasonableuncertainty in the cloud extinction properties. Additionally, the large beamsize of the C18O mapmay mask low extinction holes in the molecular cloud. Since there are∼ 75 sources in the sec-ondary peak of the M− AV limited KLF before background subtraction, our current backgroundfield star estimate would have to be off more than a factor of two to remove any feature from theIMF at these low masses; it would have to be off by a factor of 4,however, to account for all ofthe brown dwarf members. Alternately, our IR census may be contaminated by the presence oflow mass members from the intervening but only slightly older Orion OB1c association. Thoughspectroscopic follow up of a few of these faint sources wouldseparate out background stars (andprovide a good test of the C18O → AV conversion), members of the foreground OB1 associationwould be difficult to spectroscopically separate from actual Trapezium cluster members. However,as we have shown, the derived turn down in the “sub-brown dwarf” IMF below the deuteriumburning limit appears independent of background correction.
We conclude, therefore, that if the mass-luminosity relation for low mass brown dwarfs isreasonably robust and does not contain a previously unidentified feature, and our estimate of thecontamination of our infrared census by non-cluster members is accurate, then the existing struc-ture of the faint cluster KLF can only be created by a break from a single declining power-law
5Error based upon the uncertainty in the hydrogen burning limit due to distance and to cluster mean age.
– 20 –
brown dwarf IMF, the formation of a corresponding peak in theunderlying Trapezium IMF nearthe deuterium burning limit, and a rapid decline of the IMF into the planetary mass regime.
4.2. Sensitivity of Results to Theoretical PMS Models
The accuracy of an IMF derived for a young stellar cluster is intrinsically dependent uponthe robustness of the conversion from observables to a mass function (or individual masses) pro-vided by the theoretical evolutionary models. In MLL2000, we came to the somewhat surprisingconclusion that model KLFs were fairly insensitive to differences in the evolutionary PMS modelsfrom which the mass-luminosity relations were drawn. This was despite that fact that the detailedphysics (e.g., opacities, model atmospheres, internal convection theory, and initial conditions) in-volved with calculating the theoretical PMS evolutionary models are poorly constrained and thatchanges in the assumed physics of these models have been shown to produce significant differencesin the locations of evolutionary tracks and isochrones on the theoretical HR diagram (D’Antona &Mazzitelli 1994, 1997; Baraffe et al., 1998; D’Antona 1998;Siess, Dufour & Forestini 2000;Baraffe et al., 2002). Our findings in MLL2000 would also appear to disagree with recent sum-maries of the IMF in young clusters which concluded, based upon the track variations in the HRdiagram, that the accuracy of current PMS models are the primary uncertainty to the form of thederived IMF (Meyer et al., 2000). Therefore, we explore in more detail the dependence of thetheoretical mass-luminosity relation relevant for luminosity function modeling upon the differentPMS tracks.
In figure 14 we compare the theoretical mass-infrared luminosity (K magnitude) relationsconverted from six sets of theoretical PMS models for a progressive series of young cluster meanages. In table 3 we summarize the different input physics andparameters used by various PMSmodels. The sets of theoretical PMS models were taken from literature sources and converted toobservables using a single set of bolometric corrections (see MLL2000). Remarkably, the theo-retical mass-K magnitude relations are fairly degenerate between the different PMS models, andthose differences that do exist are the largest at very youngages (τ < 1 Myrs), agreeing with therecent analysis of (Baraffe et al., 2002). Consequently, this implies that for the Trapezium Clusterthere will be some uncertainty in our derived mass function due to the PMS tracks. On the otherhand, while the models of Burrows et al., (1997) and Siess, Dufour & Forestini (2000) display themost significant variations in their predicted M-L relations, we have shown in section 3.3.2 that thesub-stellar Trapezium IMF derived from KLF modeling using the B97 tracks is not significantlydifferent than that found using the DM97 tracks. As we concluded in MLL2000, most differencesin the mass-luminosity relations due to differences in input physics are much smaller than wecould ever observe and will not impact our modeling results.This result may be understood by

– 21 –
considering the fact that the luminosity of a PMS star is determined by very basic physics, simplythe conversion of gravitational potential energy to radiant luminosity during the Kevin-Helmholtzcontraction. And this primarily depends on the general physical conditions in the stellar interior(e.g., whether the interior is radiative or partially to fully convective). The luminosity evolutionat the youngest ages (< 1 Myrs) will depend, however, on the initial conditions of the contractingPMS star as it leaves its proto-stellar stage, though these differences are quickly erased (Baraffe etal., 2002).
This is significantly different than the situation for mass functions derived by placing the starson the theoretical HR diagram using spectroscopic and photometric observations. Because mostyoung stars have late type K-M spectral types, they are on nearly vertical Hayashi contractiontracks in the HR diagram. As a result a star’s mass derived from the HR diagram is primarilya function of its assigned effective temperature, i.e., itsobserved spectral type. We illustrate thisdependence in figure 15(a) where we plot the predicted effective temperatures as a function of massfor stars in a 1 Myr old cluster. In contrast to the quite similar mass-luminosity relations, a star’smass derived based upon its spectral type is uncertain due todifferences in the PMS models byfactors of 3 (or more). The conversion from spectral type to mass is made worse by the uncertainconversion of spectral type to effective temperatures for late type sources, resulting from their sub-giant gravities (Luhman 1999). Such uncertainties will undoubtedly result in spectroscopicallyderived IMFs that vary substantially as a function of PMS tracks used (compare, for example,the Luhman et al., 2000, derivation of the Trapezium IMF fromDM97 and BCAH98 tracks).Further, these track differences, while decreasing with time, are not resolved by 5 Myrs as shownin figure 15(b). In summary, the uncertainties in the PMS models primarily manifest themselvesin variations in the predicted effective temperatures of the young stars rather than the predictedluminosities.
We do not surmise that luminosity function modeling, which employs mass-luminosity rela-tions, is free from systematic dependencies. As concluded in MLL2000, a cluster’s mean age mustbe known in order to derive a cluster’s initial mass functionfrom its luminosity function; this canonly be derived from placing the stars on the theoretical HR diagram. In general, however, age isa function of luminosity for low mass stars on the HR diagram and will be more or less similarwhen derived from these PMS models. The exception again occurs at the youngest ages, where thedefinition of a star’s age may differ if the models include theproto-stellar lifetimes. Even in thecase of the Palla & Stahler (1999, hereafter, PS99) models, which begin as protostars accretingalong an initial mass-radius relationship or birthline in the HR diagram (Stahler 1983), the mass-luminosity relations are not substantially divergent fromcanonical theoretical models except at thevery youngest ages.
– 22 –
4.3. Comparison of Trapezium IMFs Based on Infrared Observations
In addition to our initial modeling in MLL2000 and our present study, a number of otherauthors have recently derived Trapezium IMFs based upon deep infrared observations. While all ofthese derivations make use of the same set of theoretical pre-main sequence models for convertingobservations to mass (functions), they use somewhat different cluster parameters and employ avariety of different methodologies. Systematic uncertainties might arise due to varying of clusterparameters such as distance, due to different assumptions about the cluster population such asfield star contamination or from simple observational effects such as survey area or the wavelengthregime analyzed. Further, it is not understood how closely different methods can arrive at the sameIMF.
In figure 16 we compare the IMFs derived by MLL2000, LR2000, HC2000 and Luhman et al.,(2000). Globally, these IMFs are remarkably similar. They all have Salpeter-like high mass slopes,all reach a broad peak at sub-solar masses and all decline in frequency with decreasing mass belowthe hydrogen burning limit with brown dwarf IMF slopes between +1 and +0.5. After inspectingthe different methods and cluster parameters used by these authors, which we summarize in table4, this result should be in part expected. When different methods use the same PMS tracks (in thiscase DM97; M< 1M⊙) and essentially the same star forming histories, the resulting IMFs shouldbasically agree.
The cluster parameters used by these workers are not exactlyhomogeneous. Further, thereare slight variations between these IMFs that might be due inpart to observational effects. Forexample, the truncation or turn down in the high mass end of the LR2000 and HC2000 IMFsis due to bright source saturation in these surveys, not to a real IMF feature. At the low massend, the IMF derivations appear to diverge below 30 MJup (-1.5 in log solar mass units) with a“spike” in the LR2000 IMF but no feature in the Luhman et al study. Because LR2000 surveys thelargest area while the Luhman et al., (2000) study surveys the smallest area, one might suspectthat this difference is due to an increase in field star contamination or, perhaps, counting statisticsfor the smaller study. The latter is the most likely explanation since both our study and that ofHC2000 survey similar large areas and apply field star corrections while finding sub-stellar IMFsthat contain either a secondary peak or a plateau at the lowest masses.
Lastly, the methodologies employed range from a purely statistical approach (e.g., the LFmodeling of MLL2000 and this paper) to the derivation of individual masses of the stars via ahybrid combination of spectroscopy and infrared colors (e.g., Luhman et al.). It is unclear howto make detailed comparisons of these methods, however, in general, the LR2000, HC2000 andMLL2000 primarily depend upon the theoretical mass-luminosity relation extracted from the PMStracks. The stellar portion of the Luhman et al IMF depends upon the theoretical HR diagram,while the sub-stellar depends upon the predicted infrared colors and magnitudes. One apparent
– 23 –
difference between the resulting IMFs that might be relatedto the different methods is the exactlocation of the IMF’s “peak,” or what is sometimes termed the“characteristic” mass. This “peak”mass varies between IMF derivations by 0.7 dex in log solar mass units. It is not immediatelyapparent that internal uncertainties in the IMF derivations could cause this scatter. For example,the “peak” of the MLL2000 IMF is revised only 0.1 dex by the inclusions of source reddening.For methods that depend upon mass-luminosity relations, the resulting IMF will be dependentupon the assumed cluster distance and age; modest changes inthese parameters should result inslightly different M-L relations and slightly different IMFs. However, there is no strict correlationbetween “peak” mass and the cluster age or distance used. Hence, we conclude that specific IMFdetails such as the exact location of “peak” mass cannot be securely identified by these methods;although, we can conclude that the Trapezium IMF peaks at sub-solar masses somewhere between0.3 M⊙ and the hydrogen burning limit.
4.4. The Trapezium and the Global IMF
From our current work and by comparison of our work to that of other authors, the generalform of the Trapezium IMF is readily apparent: a continuous IMF that rises with a relatively steepslope toward sub-solar masses, flattens and forms a broad peak between 0.3 M⊙ and the hydrogenburning limit before turning over and declining into the brown dwarf regime. This IMF structureis roughly half-gaussian, though, not exactly log-normal (see figure 11b ), and it is quite consistentwith current derivations of other star cluster IMFs. Open cluster IMFs such as the Pleiades (Bouvieret al., 1998) and M35 (Barrado y Navascués et al., 2001) rise with similar power-law slopes andform broad peaks at sub-solar masses before apparently rolling over and declining into the browndwarf regime. The color-magnitude diagrams of the very luminous clusters NGC 2362 (Moitinhoet al. 2001), NGC 3603 (Brandl et al., 1999), and NGC 6231 (Baume, Vázquez & Feinstein 1999)all display evidence of IMFs that peak at sub-solar masses, though more complete discussion awaitsdetailed derivations of their sub-solar and sub-stellar IMFs. Further, this apparent general form ofthe IMF has also been found for the IMFs of globular clusters (Paresce & De Marchi 1999) andfor the field star IMF (Miller & Scalo 1979; Kroupa, Tout & Gilmore 1993; Scalo 1998; Kroupa2001), though again, the sub-stellar IMFs are not yet robustly known. The continuity of the IMFacross so many environments suggests that a single star formation process may be responsiblefor producing the majority of the mass spectrum. Indeed, evidence that starsand brown dwarfsform with similar initial frequencies of circumstellar disks (Muench et al., 2001) and similar diskproperties (Natta & Testi 2001) suggests that even sub-stellar objects form via the same mechanismas stars. While various physical processes might influence the fine details (the IMF’s “peak” mass,for example) of the IMF’s final form ( e.g., Adams & Fatuzzo 1996), the original fragmentationdistribution function of a turbulent molecular cloud probably dominates the final form of the stellar

– 24 –
IMF (Klessen 2001).
It is not clear, however, the extent to which this documentedcontinuity between the Trapez-ium, open cluster and field star IMFs extends across the entire brown dwarf regime. Very youngstellar clusters appear to have consistent low mass IMFs, i.e., IMFs that decline across the hydrogenburning limit (Najita, Tiede, & Carr 2000; Luhman et al., 2000). As we have already discussed,LR2000 and our work here find that there is reasonable evidence in the Trapezium luminosityfunction(s) that the brown dwarf Trapezium IMF departs at the lowest masses (e.g.,< 30MJup;see section 4.3) from a single power-law decline for the brown dwarf regime and forms a strongsecondary peak in the IMF near the deuterium burning limit. While a similar IMF feature has yet tobe identified in the sub-stellar regime of the well studied IC348 young cluster (see Najita, Tiede,& Carr 2000), the recent work of Béjar et al., (2001) suggestsa mass function for the youngσ Orionis cluster (Walter et al., 1997) that is slowly fallingthroughout the brown dwarf regimebut may rise toward the deuterium burning limit.
Were a secondary peak in the IMF of the lowest mass brown dwarfs confirmed, then it mayprovide evidence for a secondary, competing formation mechanism for these low mass objects.Indeed, the transition in the sub-stellar IMF at 30MJup from a steady power-law decline to thesecondary peak at the deuterium burning limit may representthe transition from the formation ofbrown dwarfs as individual fragments of the molecular cloudto their formation, for example, astruncated stellar embryos that were dynamically ejected from hierarchical proto-stellar systemsbefore they had a chance to accrete into higher mass objects (Reipurth & Clarke 2001). Yetthe subsequent rapid decline in the IMF below the deuterium burning limit constrains the massrange over which this secondary mechanism is operating. Thefrequency and characteristics ofcircumstellar disks around these very low mass brown dwarfsand planetary mass objects mayprovide an essential test of their formation from individual pre-sub-stellar cores or via some anentirely different mechanism.
5. Conclusions
Using a new and very complete near-infrared census of the Trapezium Cluster, we have per-formed a detailed analysis of the Trapezium Cluster’s K bandluminosity function and its underly-ing mass function. Following our earlier work in Muench, Lada & Lada (2000), we expanded ourluminosity function modeling to include the effects of source reddening, and we studied in detailthe field star contribution to the cluster KLF. We applied ournew models to the Trapezium KLF toexplore its structure and to derive the cluster’s initial mass function. From this analysis we drawthe following conclusion(s):

– 25 –
1. The Trapezium Cluster IMF rises in number with decreasingmass and forms a broad peak atsub-solar masses between 0.3 M⊙ and the hydrogen burning limit before declining into the browndwarf regime. Independent of modeling details, no more than∼ 22% of the young sources fallbelow the hydrogen burning limit, placing a strict limit on the brown dwarf population in thiscluster.
2. The Trapezium Cluster sub-stellar IMF breaks from a single declining power-law slope be-tween 0.02 - 0.03 M⊙ and forms a significant secondary peak near the deuterium burning limit(∼ 13MJup). We derive these results through detailed analysis of the likely field star contami-nation and from our modeling of the cluster’s faint KLF usingtwo different sets of theoreticalmass-luminosity relations, although the precise details of this peak do depend upon the PMS mod-els. Regardless, this peak may contain between 15 and 36% of all the sub-stellar objects in thiscluster. Below this peak the sub-stellar IMF declines rapidly toward lower masses suggesting thatthe yield of freely floating, planetary mass objects during the formation of the Trapezium Clusterwas extremely low.
3. We find that source reddening (due to infrared excess and extinction) has only modest effectsupon our modeling of the Trapezium cluster’s luminosity function. Source reddening tends tobroaden the IMFs derived and blur the precision with which wecan derive IMF parameters. How-ever, the Trapezium IMF we derive here after accounting for source reddening and field stars is nota substantial revision over that Trapezium IMF we derived inMLL2000.
4. Pre-main sequence luminosity evolution and the resulting age dependent mass-luminosity re-lations are relatively robust results of most modern PMS evolutionary models, except at the veryyoungest ages where the models are affected by initial conditions. Conversely, the predicted ef-fective temperatures, hence predicted spectral types, areconsiderably less robust. This suggeststhat modeling a cluster’s K band luminosity function is likely to produce a faithful representationof the true IMF of the cluster. Further, we find that the different published methodologies usedfor deriving the Trapezium IMF from near-infrared photometry produce nearly identical results,although the precise location of a “peak” or characteristicmass for the Trapezium cannot be se-curely identified.
5. The globally consistent form of the stellar IMF suggests asingle physical mechanism may dom-inate the star formation process in galactic clusters. If the secondary peak in the Trapezium ClusterKLF and the corresponding strong secondary peak in the sub-stellar IMF near the deuterium burn-ing limit were proven to be real cluster characteristics, then this implies that a secondary physicalmechanism may be responsible for the formation of very low mass brown dwarfs. Whether thissecondary mechanism could be the ejection of very low mass (10-20 MJup) brown dwarfs from hi-erarchical proto-stellar systems, (e.g., Reipurth & Clarke), or some other process remains unclear.
– 26 –
We would particularly like to thank Alyssa Goodman, Kevin Luhman and John Stauffer forhelpful discussions, and Pavel Kroupa for especially productive suggestions regarding the model-ing algorithms. We acknowledge Ted Bergin for providing theC18O and dust continuim maps ofthe Trapezium Region and thank the anonymous referee for making a number of suggestions thatimproved the results of the paper. AAM was supported by a Smithsonian Predoctoral Fellowshipand by the NASA Graduate Student Research Program (grant NTG5-50233). EAL and AAM ac-knowledge support from a Research Corporation Innovation Award and Presidential Early CareerAward for Scientists and Engineers (NSF AST 9733367) to the University of Florida. This publi-cation makes use of data products from the Two Micron All Sky Survey, which is a joint project ofthe University of Massachusetts and the Infrared Processing and Analysis Center/California Insti-tute of Technology, funded by the National Aeronautics and Space Administration and the NationalScience Foundation.
A. FLWO-NTT Near-Infrared Catalog of the Trapezium Cluster
We summarize in table 5 the characteristics of the three observing runs used to obtain the in-frared photometry that comprise the FLWO-NTT Near-Infrared Catalog of the Trapezium Cluster.We compare the area(s) covered by the FLWO-NTT catalog to those of other recent IR surveys infigure 17. The reduction and analysis of the 1997-1998 FLWO observations are fully summarizedin Lada et al., (2000), and we do not discuss these further here. Preliminary analysis of the NTTobservations was presented in Muench et al., (2001), and we detail these observations and theirreduction below.
A.1. NTT 3.5m JHKs observations
Our NTT images of the Trapezium Cluster were obtained under conditions of superb seeing(∼ 0.5′′ FWHM) on 14 March 2000 using the SOFI infrared spectrograph and imaging camera.The NTT telescope uses an active optics platform to achieve ambient seeing and high image quality,and the SOFI camera employs a large format 1024× 1024 pixel Hawaii HgCdTe array. To obtaina single wide field image of the Trapezium Cluster, we configured SOFI to have a 4.′95 × 4.′95field of view with a plate scale of 0.′′29 /pixel. Each exposure consisted of 9 separate dithers eachrandomly falling within 20′′ of the observation center. Each individual dither was the co-averageof eight 1.2 second exposures, yielding an total effective integration time of 86.4 seconds for eachcombined image.
We observed the Trapezium Cluster with identical sequential pairs of on and off-cluster
– 27 –
dithered images. During one hour on 14 March 2000, we obtained four image pairs of the Trapez-ium Cluster and off-cluster positions. These were, in temporal order, at Ks(2.162µm), H (1.65µm),J (1.25 µm) and again at Ks, and the on-cluster images had FWHM estimates of 0.53′′, 0.55′′,0.61′′and 0.78′′. Seeing estimates of stars in the paired non-nebulous off-cluster image(s) yieldedsimilar if not marginally higher resolution point spread functions. Observations were taken neartransit with a very small range of airmass ( 1.138 < sec(z) < 1.185).
Data reduction of the NTT images was performed using routines in the Image Reductionand Analysis Facility (IRAF) and Interactive Data Language(IDL). Our standard data reductionalgorithm was described in Lada et al., (2000) for the FLWO images, and it was subsequentlyused for the NTT images. Simply, individual dithered frameswere reduced using sky and flat fieldimages derived from the non-nebulous off-cluster ditheredimages which were interspersed withthe on-cluster images. Each set of reduced dithered frames were then combined using a standard“shift-and- add” technique. While all the FLWO data was linearized after dark-subtraction using asystem supplied linearity correction, linearization coefficients were not obtained for the NTT data.“Sky” flat-fields constructed from the NTT images were compared to system flat-fields which areregularly taken and monitored by the NTT staff. While the NTTsystem flat-fields were found tovary by only 2-3% over long periods of time, when we compared our sky flat-fields to the systemflat-fields, significant small scale variations (5-10%) wererevealed across the array. We concludedthis was due to our relatively short NTT integration times which results in poor sampling of theintrinsically non-flat SOFI array. Therefore, we substituted the system supplied flat-fields into ourreduction procedure. The high resolution of our NTT images results in moderate under-samplingof the point spread functions; we tested to see if sub-pixel linear reconstruction (drizzling) of ourimages would improve our data quality. Since our images haveonly a few dithers (9), the drizzlealgorithm did not improve our result over standard integer “shift-and-add.”
The 2000 NTT images had FWHM estimates ranging between 1.8 and 2.1 pixels, and theseimages are therefore marginally under-sampled and not easily suitable for PSF photometry. Fur-ther, the SOFI field of view suffers from coma-like geometricdistortions on the northern 10- 15%of the array. For these two reasons, we decided to perform only aperture photometry on the NTTimages. Multi-aperture photometry was performed on sources detected in the NTT image usingannuli with radii from 2 to 10 pixels. The sky was measured from the mode of the distributionof pixel values in an annuli from 10 to 20 pixels. From inspection of the curves of growth ofboth isolated and nebulous sources, we chose a 3 pixel radius(1.8′′ beam) for most of our NTTsources. Additionally, the choice of small apertures allowed us to minimize the effects of nebularcontamination and crowding on the stellar PSF. For faint sources in very confused or highly neb-ulous regions, we repeated the photometry with a 2 pixel aperture and a sky annulus from 7 to 12pixels. The change in sky annulus does not significantly affect our photometry because the fractionof the stellar PSF beyond 7 pixels contains less than 5% of theflux, and the errors resulting from
– 28 –
including this flux in the sky estimate are smaller than the errors introduced from using too distanta sky annulus on the nebulous background.
Aperture corrections were derived for our data by choosing∼ 15 relatively bright stars asfree of nebular contamination as possible. We performed multi-aperture photometry on them andusing the IRAF MKAPFILE routine to visually inspect the stellar curves of growth and calculatecorrections. Since small apertures were used to minimize the effects of the bright nebular back-ground, the resulting corrections which constituted a somewhat substantial fraction of the stellarflux. Aperture corrections were carefully checked by comparing the corrections derived for on(nebulous) and off-cluster positions, which are interspersed in time with the on-cluster frames, andfound to agree or to correlate with changes in seeing. The typical 3 pixel aperture correction was-0.14 magnitudes and for those stars photometered using a 2 pixel aperture, a correction of -0.34was used.
A.2. Photometric Comparisons of Datasets
We report in the electronically published catalog all the photometry from the FLWO and NTTobservations. We explored any photometric differences between the FLWO and NTT observations.These differences include the filter systems, the methods and effective beamsizes of the photometryand the epochs of the observations. We tested if any color terms were present due to differingphotometric (filter) systems, we compared the magnitudes and colors of 504 sources common toboth the NTT and FLWO photometry.We compared the (J - H) and (H- K) colors of the NTTphotometry to the FLWO photometry and fit these comparisons with linear relations. The (J-H)colors were well fit by a linear relation (slope∼ 1); however, we found an offset,∆(J −H) ≃ 0.10magnitudes between the two systems. A similar comparison tothe photometry of sources in the2MASS catalog6 indicated this offset was at J band and was restricted to the FLWO sources.Comparison of 2MASS photometry to the NTT photometry revealed no systematic offsets. Acomparison of the FLWO and NTT (H - K) colors was also well fit bya linear relation (slope∼0.97) though this slope suggests that for the reddest sources, the NTT (H - Ks) color is bluer thanthe FLWO (H - K) color.
Further, it was evident from these comparisons that while the global filter systems are quitesimilar, the difference in the NTT and FLWO photometry of individual sources was larger than ex-pected fromformal photometric errors7. From our fake star experiments and from the photometry
6A current un-restricted search of the 2MASS First and SecondIncremental Point Source and Extended SourceCatalogs currently returns only 171 sources.
7the quadratic sum of uncertainties from aperture corrections, zeropoint and airmass corrections, flat fielding error
– 29 –
of sources in overlap regions on mosaicked frames, we determined ourmeasured photometric er-ror is 5% for the majority of our sources increasing up to 15% for the sources at our completenesslimit. However, when comparing sources common to both the FLWO and NTT data (well aboveour completeness limit), we derived 1σ standard deviations of∼ 0.22 for magnitudes and∼ 0.18for colors. Very similar dispersions were derived when comparing our FLWO photometry to theHillenbrand et al., (1998) or 2MASS catalogs or when comparing our NTT data to the Hillenbrand& Carpenter (2000) H and K band dataset. We attribute a portion of this additional photometricnoise between the different datasets to the intrinsic infrared variability of these pre-main sequencesources which has been found for stars in this cloud to have anaverage of 0.2 magnitudes at in-frared wavelengths (Carpenter, Hillenbrand & Strutskie 2001). We note that the difference in thebeamsize used for the FLWO and NTT photometry and by the various other published data setswill also contribute a degree of added photometric noise dueto the presence of the strong nebularbackground, thus making the NTT photometry preferable to the FLWO data for its higher angularresolution.
A.3. Astrometry and the Electronic Catalog
Astrometry with reasonably high precision was performed bymatching the XY pixel locationsof a large number (> 50) of the observed sources to the equatorial positions of these sources listedon the 2MASS world coordinate system and deriving full platesolutions using the IRAF CCMAProutine. Mosaic positions of the 1997 and 1998 observationswere shifted to fall onto a commonXY pixel grid defined by the K band FLWO 1997 mosaic images. To create the common K bandXY grid, sources in the overlap regions between mosaic positions were matched and global offsetscalculated. The two camera arrays of the FLWO STELIRcam instrument are not centered preciselyon the sky and the J and H band coordinates were transformed using the IRAF GEOMAP routineinto the K band XY coordinate grid. The NTT positions were aligned to the NTT J band image.For the FLWO plate solution, 161 2MASS sources were matched to the FLWO XY coordinatesyielding a plate scale of 0.596 ”/pixel and an astrometric solution with rms errors of∼ 0.10′′. Anindependent solution of 82 NTT sources matched to the 2MASS database yielded a plate scale of0.288 ”/pixel and an astrometric solution having rms errors∼ 0.07′′.
We construct the electronic version of the FLWO-NTT catalogbased upon all the sources de-tected by our FLWO and NTT observations, and we compliment our electronic catalog by includingsources identified in other catalogs and falling within our survey area, but that were saturated, un-detected or unresolved by our observations. Since our final catalog covers a substantially different
and sky noise
– 30 –
area than comparable deep infrared surveys and includes numerous new sources, we chose to as-sign new source designations for our final catalog. These arebased upon the IAU standard formatthat includes a catalog acronym, a source sequence, and source specifier. For the catalog acronym,we chose the MLLA, based upon the initials of the last names ofthe authors. This acronym iscurrently unused in the Dictionary of Celestial Nomenclature. We chose to sequence the catalogusing a running number incremented from 00001 to 01010. We use a specifier only where nec-essary to distinguish unresolved sources, typically employing the designations (A), (B), etc. NTTastrometry is preferentially used in the final catalog. For undetected or unresolved sources, wemade every effort to include astrometry from the source’s identifying catalog if the original catalogcould be globally aligned to the FLWO-NTT catalog. We list cross-references based on the mostcomprehensive or deep surveys; these include the Hillenbrand (1997), HC2000, Luhman et al.,(2000) designations and McCaughrean & Stauffer (1994). Forsources lacking cross-references inthese catalogs, we list their 2MASS designations (circa the2nd Incremental 2MASS Point SouceCatalog) where possible. The LR2000 designations are basedon their derived equatorial coordi-nates and due to significant astrometric errors do not correspond to the positions we derive in theFLWO-NTT catalog. For example, we find off-sets of−0.42′′ in RA and 0.44′′ in DEC betweenour positions and those of LR2000. After removing these offsets, we still find medain residuals of0.44′′ between our coordinates and those of LR2000 with errors as large as 1′′; this is in contrast tothe rms residuals of 0.1′′ between our catalog and the 2MASS and HC2000 positions. Hence wedo not list the LR2000 position-dependent designations except where necessary to identify sourcesundetected by our catalog.
– 31 –
REFERENCES
Adams, F.C., & Fatuzzo, M. 1996, ApJ, 464, 256
Alexander, D.R., Augason, G.C., & Johnson, H.R. 1989, ApJ, 345, 1014
Alexander, D.R., & Ferguson, 1994, ApJ, 437, 879
Alves, J., Lada, C.J., Lada, E.A., Kenyon, S.J., & Phelps, R.1998, ApJ, 506, 292
Alves, J., Lada, C.J., & Lada, E.A. 1999, ApJ, 515, 265
Barrado y Navascués, D., Stauffer, J.R., Bouvier, J., & Martín, E.L. 2001, ApJ, 546, 1006
Baume, G., Vázquez, R.A., & Feinstein, A. 1999, A&AS, 137, 233
Baraffe, I., Chabrier, G., Allard, F., & Hauschildt, P.H. 1998, A&A, 337, 403 (BCAH98)
Baraffe, I., Chabrier, G., Allard, F., & Hauschildt, P.H. 2002, A&A, in press (BCAH02)
Béjar, V.J.S., Martín, E.L., Zapatero Osorio, M.R., Rebolo, R., Barrado y Navascués, D., Bailer-Jones, C.A.L., Mundt, R., Baraffe, I., Chabrier, C., & Allard, F. 2001, ApJ, 556, 830
Bernasconi, P.A. 1996, A&AS, 120, 57
Bessell, M. S. 1995, Proceedings of the ESO Workshop: The Bottom of the Main Sequence - andBeyond, ed C. G. Tinney, (Heidelberg: Springer), 123
Bouvier, J., Stauffer, J.R., Martín, E.L., Barrado y Navascués, D., Wallace, B., & Bejar, V.J.S.1998, A&A, 336, 490
Brandl, B., Brandner, W., Eisenhauer, F., Moffat, A.F.J., Palla, F., & Zinnecker, H. 1999, A&A,352, 69
Burrows, A., Marley, M., Hubbard, W.B., Lunine, J.I., Guillot, T., Saumon, D., Freedman, R.,Sudarsky, D., & Sharp, C. 1997, ApJ, 491, 856 (B97)
Canuto, V.M., & Mazzitelli, I. 1991, ApJ, 370, 295
Canuto, V.M., & Mazzitelli, I. 1992, ApJ, 389, 724
Canuto, V.M., Goldman, I., & Mazzitelli, I. 1996, ApJ, 473, 550
Carpenter, J.M., Hillenbrand, L.A., & Strutskie, M.F. 2001, AJ, 121, 3160
Cohen, J.G., Persson, S.E., Elias, J.H., & Frogel, J.A. 1981, ApJ, 249, 481

– 32 –
D’Antona, F., & Mazzitelli, I. 1994, ApJS, 41, 467
D’Antona, F., & Mazzitelli, I. 1997, Cool Stars in Clusters and Associations, ed G. Micela and R.Pallavicini, (Mem. S.A.It.), 68, 807
D’Antona, F. 1998, 38th Herstmonceux Conference: The Stellar Initial Mass Function, ed G.Gilmore & D. Howell, (San Francisco: A.S.P), 142, 157
Frerking, M.A., Langer, W.D., & Wilson, R.W. 1982, ApJ, 262,590
Gilmore, G. 2001, Starbursts: Near and Far, eds. L.J. Tacconi & D. Lutz, in press
Goldsmith, P.F., Bergin, E.A., & Lis, D.C. 1997, ApJ, 491, 615
Hauschildt, P.H., Allard, F., & Baron, E. 1999, ApJ, 512, 377
Hillenbrand, L.A. 1997, AJ, 113, 1733
Hillenbrand, L.A., Strom, S.E., Calvet, N., Merrill, K.M.,Gatley, I., Makidon, R., Meyer, M.R., &Skrutskie, M.F. 1998, AJ, 116, 1816
Hillenbrand, L.A., & Carpenter, J.M. 2000, ApJ, 540, 236 (HC2000)
Iglesias, C.A., & Rogers, F.J. 1996, ApJ, 464, 943
Kenyon, S.J., & Hartmann, L.W. 1995, ApJS, 101, 117
Klessen, R.S. 2001, ApJ, 556, 837
Kroupa, P., Tout, C.A., & Gilmore, G. 1993, MNRAS, 262, 545
Kroupa, P. 2001, MNRAS, 322, 231
Lada, C.J., Muench, A.A., Haisch, K.J., Lada, E.A., Alves, J., Tollestrup, E.V., & Willner, S.P.2000, AJ, 120, 3162
Lucas, P.W., & Roche, P.F. 2000, MNRAS, 314, 858 (LR2000)
Luhman, K.L., Rieke, G.H., Lada, C.J., & Lada, E.A. 1998, ApJ, 508, 347
Luhman, K.L., & Rieke, G.H. 1999, ApJ, 525, 440
Luhman, K.L. 1999, ApJ, 525, 466
Luhman, K.L., Reike, G.H., Young, E.T., Cotera, A.S., Chen,H., Rieke, M.J., Schneider, G., &Thompson, R.I. 2000, AJ, 540, 1016
– 33 –
McCaughrean, M.J., & Stauffer, J.R. 1994, AJ, 108, 1382
McCaughrean, M., Zinnecker, H., Rayner, J., & Stauffer, J. 1995, Proceedings of the ESO Work-shop: The Bottom of the Main Sequence - and Beyond, ed C. G. Tinney, Springer: Heidel-berg, 207
Meyer, M.R., Calvet, N., & Hillenbrand, L.A. 1997, AJ, 114, 233
Meyer, M.R., Adams, F.C., Hillenbrand, L.A., Carpenter, J.M., & Larson, R.B. 2000, Protostarsand Planets IV, ed V. Mannings, A.P. Boss, and S.S. Russell, (Tucson: Univer. of Arizona),121
Mihalas, D., Däppen, W., & Hummer, D.G. 1988, ApJ, 331, 815 (MHD)
Miller, G.E., & Scalo, J.M. 1979, ApJS, 41, 513
Moitinho, A., Alves, J., Huélamo, N., & Lada, C.J. 2001, ApJ,563, 73
Muench, A.A., Lada, E.A., & Lada, C.J. 2000, ApJ, 533, 358 (MLL2000)
Muench, A.A., Alves, J., Lada, C.J., & Lada, E.A. 2001, ApJ, 558, 51
Najita, J., Tiede, G., & Carr, J. 2000, ApJ, 541, 977
Natta, A., & Testi, L. 2001, A&A, 376, 22
Palla, F., & Stahler, S.W. 1999, AJ, 525, 772 (PS99)
Paresce, F., & De Marchi, G. 1999, ApJ, 534 870
Pols, O.R., Tout, C.A., Eggleton, P.P., & Han, Z. 1995, MNRAS, 274, 964 (PTEH)
Reipurth, B., & Clarke, C. 2001, AJ, 122, 432
Rogers, F.J., & Iglesias, C.A. 1992, ApJ, 401, 361 (OPAL92)
Rogers, F.J., Swenson, F.J, & Iglesias, C.A. 1996, ApJ, 456,902 (OPAL96)
Salpeter, E.E. 1955, ApJ, 121, 161
Saumon, D., & Chabrier, G. 1991, Phys. Rev. A, 44, 5122 (SC)
Saumon, D., & Chabrier, G. 1992, Phys. Rev. A, 46, 2084 (SC)
Saumon, D., Chabrier, G., & VanHorn, H.M. 1995, ApJS, 99, 713(SCVH)

– 34 –
Scalo, J. 1998, 38th Herstmonceux Conference: The Stellar Initial Mass Function, ed G. Gilmoreand D. Howell, (San Francisco: A.S.P), 201
Schaller, G., Schaerer, D., Meynet, G., & Maeder, A 1992, A&AS, 96, 269
Siess, L., Dufour, E., & Forestini, M. 2000, A&A, 358, 593 (SDF)
Stahler, S.W. 1983, ApJ, 274, 822
Walter, F.M, Wolk, S.J., Freyberg, M., & Schmitt, J.H.M.M. 1997 Memorie della Societa Astro-nomica Italiana, 68, 1081
Wilking, B.A., Greene, T.P., & Meyer, M.R. 1999, AJ, 117, 469
Zinnecker, H., McCaughrean, M. & Wilking, B. A. 1993, Protostars and Planets III, ed H. Levyand J.I. Lunine, (Tucson: Univer. of Arizona), 429
This preprint was prepared with the AAS LATEX macros v5.0.

– 35 –
Table 1. Three Power-Law IMF Parameters and Fits(a)
Parameter(b) Range of Fits Best Fit(c) (±) Best Fit(d) (±)
Model fit to K = 14.5; χ2 ∼ 1 (e)
Γ1 −1.0 ←→ −2.0 -1.16 0.16 -1.24 0.20
log m1 +0.1 ←→ −1.1 -0.17 0.10 -0.19 0.13
Γ2 −0.4 ←→ +0.4 -0.24 0.07 -0.16 0.15
log m2 +0.1 ←→ −1.4 -1.05 0.05 -1.00 0.13
Γ3 −0.4 ←→ +2.0 1.10 0.25 1.08 0.38
Model Fit to K = 15.0; χ2 ∼ 1
Γ1 -1.13 0.16 -1.21 0.18
log m1 -0.19 0.11 -0.22 0.11
Γ2 -0.24 0.15 -0.15 0.17
log m2 -1.00 0.10 -0.92 0.13
Γ3 0.82 0.15 0.73 0.20
Model Fit to K = 15.5; χ2 ∼ 0.3
log m2 -0.89 —- -0.77 —-
Γ3 0.30 —- 0.30 —-
Model Fit to K = 16.5; χ2 ∼ 0.3
log m2 —– —- -0.72 —-
Γ3 —– —- 0.23 —-
(a)All tabulated fits derived using our standard set of PMS tracks (primar-ily from DM97).
(b)The parametersΓi are the power-law indices of the IMF which here isdefined as the number of stars per unit log(M
M⊙). The parametersm j are the
break masses in the power-law IMF and are in units of log(MM⊙
).
(c)Model fits without Source Reddening.
(d)Model fits accounting for Source Reddening.
(e)χ
2 given for fits with Source Reddening.

– 36 –
Table 2. Three Power-Law Trapezium Sub-Stellar IMF(a)
IMF Parameter Fit to K=16.0 Fit to K=16.5(ϕ) < ϕ > 1σ median(ϕ) < ϕ > 1σ median(ϕ)
Fits to M− AV KLF w/o Off-field Correction(b)
Γ1 +1.39 0.22 +1,30 +1.36 0.18 +1.30
m1 0.0214 0.0022 0.020 0.0220 0.0025 0.020
Γ2 -4.87 1.52 -5.00 -5.50 2.01 -5.00
m2 0.0125 0.0012 0.012 0.0137 0.0005 0.014
Γ3 +3.70 2.60 +4.00 +5.70 1.59 +6.00
Fits to M− AV , Off-field Corrected KLF(b)
Γ1 +1.53 0.13 +1,60 +1.51 0.14 +1.60
m1 0.0217 0.0024 0.020 0.0228 0.0025 0.025
Γ2 -5.43 1.95 -6.00 -5.04 2.00 -4.00
m2 0.0130 0.0008 0.013 0.0137 0.0008 0.014
Γ3 +3.87 2.47 +4.00 +5.61 2.25 +6.00
(a)Fits to Sub-Stellar Trapezium KLF using B97 tracks.
(b)M − AV KLF has limits of AV ≤ 9 and M≥ 0.01M⊙
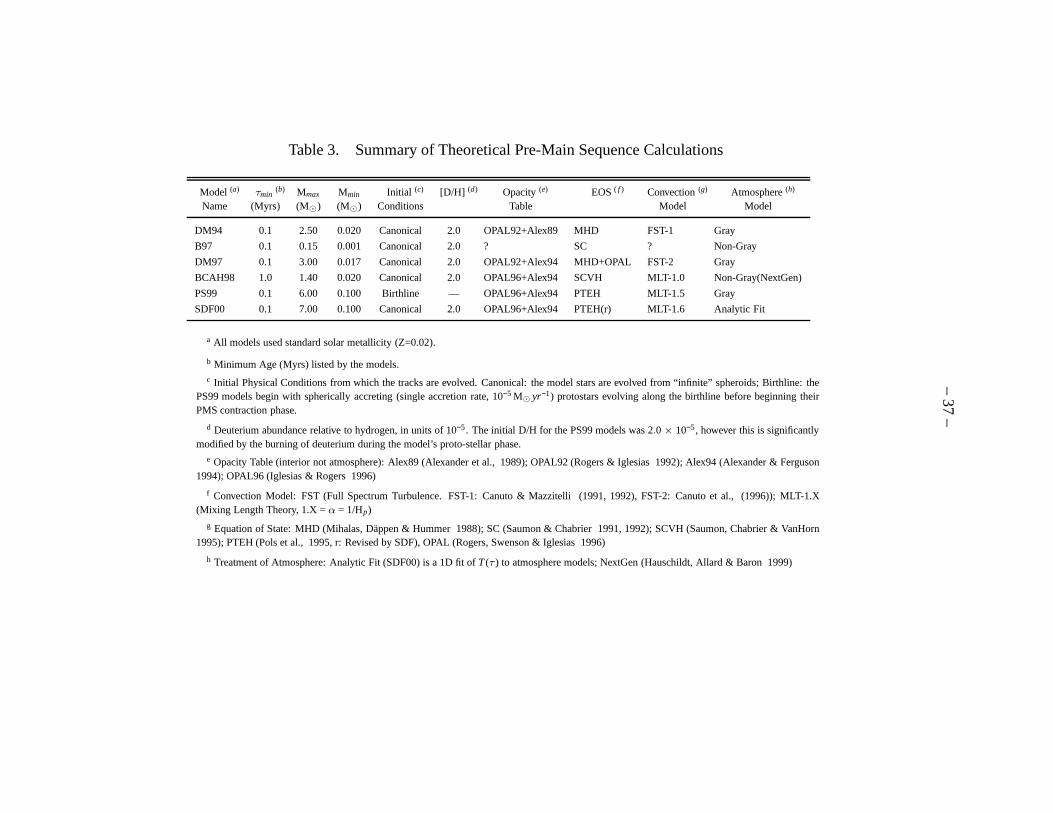
–3
7–
Table 3. Summary of Theoretical Pre-Main Sequence Calculations
Model (a)τmin
(b) Mmax Mmin Initial (c) [D/H] (d) Opacity(e) EOS( f ) Convection(g) Atmosphere(h)
Name (Myrs) (M⊙) (M⊙) Conditions Table Model Model
DM94 0.1 2.50 0.020 Canonical 2.0 OPAL92+Alex89 MHD FST-1 Gray
B97 0.1 0.15 0.001 Canonical 2.0 ? SC ? Non-Gray
DM97 0.1 3.00 0.017 Canonical 2.0 OPAL92+Alex94 MHD+OPAL FST-2 Gray
BCAH98 1.0 1.40 0.020 Canonical 2.0 OPAL96+Alex94 SCVH MLT-1.0 Non-Gray(NextGen)
PS99 0.1 6.00 0.100 Birthline — OPAL96+Alex94 PTEH MLT-1.5 Gray
SDF00 0.1 7.00 0.100 Canonical 2.0 OPAL96+Alex94 PTEH(r) MLT-1.6 Analytic Fit
a All models used standard solar metallicity (Z=0.02).
b Minimum Age (Myrs) listed by the models.c Initial Physical Conditions from which the tracks are evolved. Canonical: the model stars are evolved from “infinite” spheroids; Birthline: the
PS99 models begin with spherically accreting (single accretion rate, 10−5 M⊙ yr−1) protostars evolving along the birthline before beginningtheirPMS contraction phase.
d Deuterium abundance relative to hydrogen, in units of 10−5. The initial D/H for the PS99 models was 2.0× 10⁻⁵, however this is significantlymodified by the burning of deuterium during the model’s proto-stellar phase.
e Opacity Table (interior not atmosphere): Alex89 (Alexander et al., 1989); OPAL92 (Rogers & Iglesias 1992); Alex94 (Alexander & Ferguson1994); OPAL96 (Iglesias & Rogers 1996)
f Convection Model: FST (Full Spectrum Turbulence. FST-1: Canuto & Mazzitelli (1991, 1992), FST-2: Canuto et al., (1996)); MLT-1.X(Mixing Length Theory, 1.X =α = 1/Hp)
g Equation of State: MHD (Mihalas, Däppen & Hummer 1988); SC (Saumon & Chabrier 1991, 1992); SCVH (Saumon, Chabrier & VanHorn1995); PTEH (Pols et al., 1995, r: Revised by SDF), OPAL (Rogers, Swenson & Iglesias 1996)
h Treatment of Atmosphere: Analytic Fit (SDF00) is a 1D fit ofT (τ ) to atmosphere models; NextGen (Hauschildt, Allard & Baron1999)

–3
8–
Table 4. Comparison of published Trapezium IMFs(a).
Work IMF Distance τ ,∆τ(b) Extinction?(c) IR Excess?(c) Field Star(c) AV Limit? IMF Peak Area(d) Comments(e)
Name Method (pc), (m-M) (Myr) Correction? (MM⊙) (⊓⊔pc)
MLL2000 Model KLF 400, 8.00 0.8, 1.2 Not Not Not None 0.08 0.34 LiteratureFit Included Included Included K only
HC2000 (H-K)/K 480, 8.40 0.4, 1.0 Derived Empirical Reddened AV < 2.5,10, 0.15 0.35 KeckGalaxy Model no limit H, K
LR2000 MJ →M⊙ 440, 8.22 1.0, 0.0 Derived Assumed Assumed (J-H)< 1.5 0.40 0.50 UKIRTNone None I, J, H
Luhmen IR Spectra 450, 8.27 0.4,∼ 1 Derived Assumed Assumed AH < 1.4 0.25 0.073 NICMOSet al + Colors None None F110, F160
This work Model KLF 400, 8.00 0.8, 1.2 EPDF IXPDF Reddened AV < 17 0.10 0.34 FLWO + NTTFit Derived Derived Obs. KLF (0.57) J, H, K
(a)All IMF derivations used the D’Antona & Mazzitelli (1997) pre-main sequence models for masses less than 1 M⊙.
(b)Cluster mean age and age spread used by authors. For Luhman etal., (2000), an empirical star forming history was used by the authors and those tabulated hereare approximate characterizations.
(c)Listed if and how these quantities: extinction, excess and the contribution of background field stars, were included into that work’s IMF derivation.
(d)Size (area) of surveys in⊓⊔parsec assuming D = 400pc. The two values for this work are forthe NTT/FLWO overlap region and the larger FLWO region.
(e)Comments include location of observation(s) and broadbandfilters used.
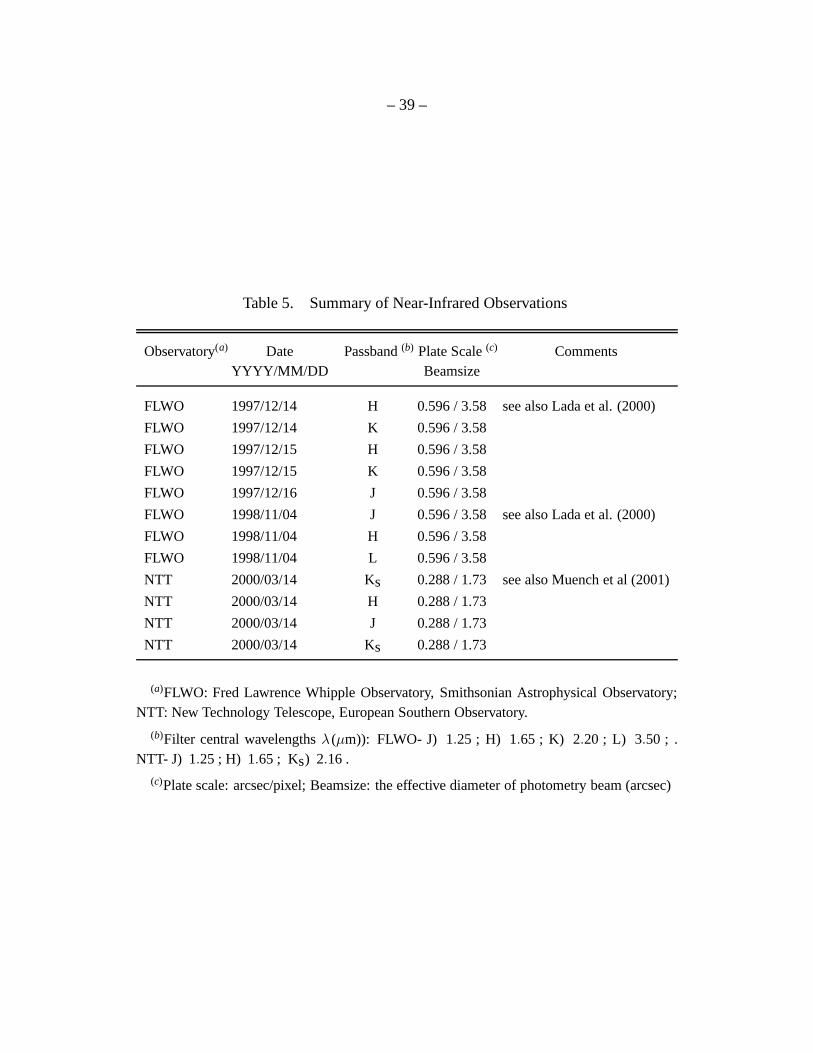
– 39 –
Table 5. Summary of Near-Infrared Observations
Observatory(a) Date Passband(b) Plate Scale(c) CommentsYYYY/MM/DD Beamsize
FLWO 1997/12/14 H 0.596 / 3.58 see also Lada et al. (2000)
FLWO 1997/12/14 K 0.596 / 3.58
FLWO 1997/12/15 H 0.596 / 3.58
FLWO 1997/12/15 K 0.596 / 3.58
FLWO 1997/12/16 J 0.596 / 3.58
FLWO 1998/11/04 J 0.596 / 3.58 see also Lada et al. (2000)
FLWO 1998/11/04 H 0.596 / 3.58
FLWO 1998/11/04 L 0.596 / 3.58
NTT 2000/03/14 Ks 0.288 / 1.73 see also Muench et al (2001)
NTT 2000/03/14 H 0.288 / 1.73
NTT 2000/03/14 J 0.288 / 1.73
NTT 2000/03/14 Ks 0.288 / 1.73
(a)FLWO: Fred Lawrence Whipple Observatory, Smithsonian Astrophysical Observatory;NTT: New Technology Telescope, European Southern Observatory.
(b)Filter central wavelengthsλ (µm)): FLWO- J) 1.25 ; H) 1.65 ; K) 2.20 ; L) 3.50 ; .NTT- J) 1.25 ; H) 1.65 ; Ks) 2.16 .
(c)Plate scale: arcsec/pixel; Beamsize: the effective diameter of photometry beam (arcsec)
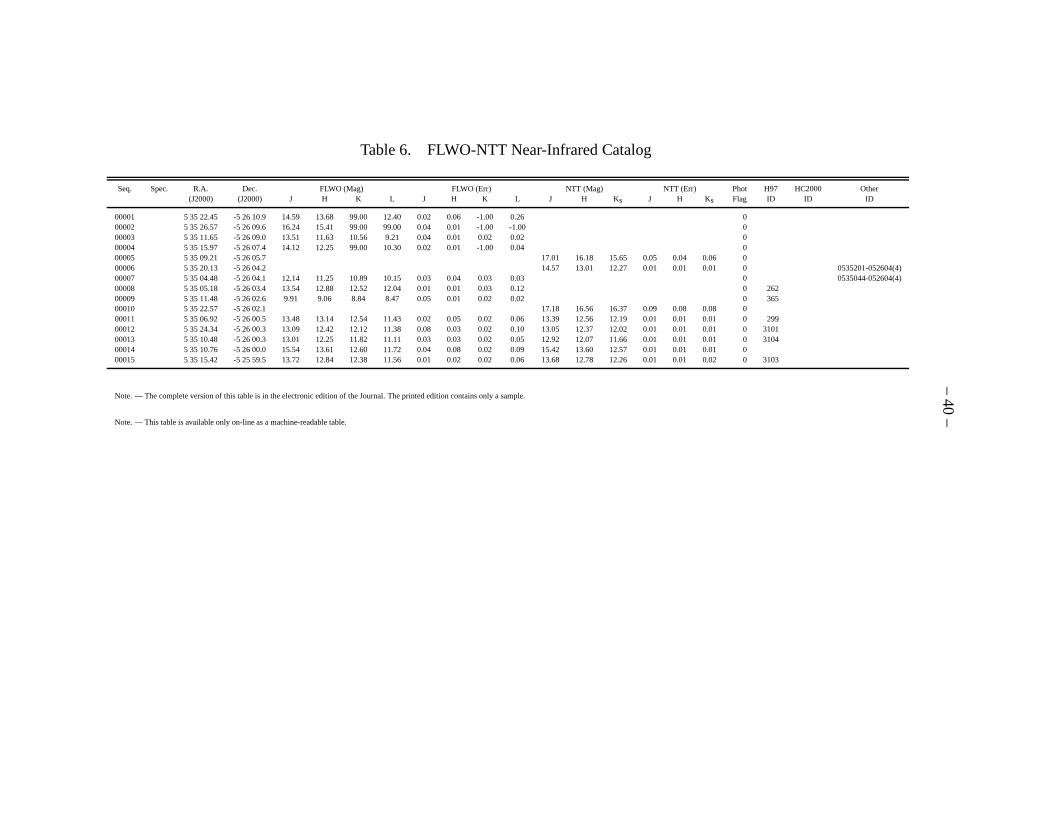
–4
0–
Table 6. FLWO-NTT Near-Infrared Catalog
Seq. Spec. R.A. Dec. FLWO (Mag) FLWO (Err) NTT (Mag) NTT (Err) Phot H97 HC2000 Other(J2000) (J2000) J H K L J H K L J H Ks J H Ks Flag ID ID ID
00001 5 35 22.45 -5 26 10.9 14.59 13.68 99.00 12.40 0.02 0.06 -1.00 0.26 000002 5 35 26.57 -5 26 09.6 16.24 15.41 99.00 99.00 0.04 0.01 -1.00 -1.00 000003 5 35 11.65 -5 26 09.0 13.51 11.63 10.56 9.21 0.04 0.01 0.02 0.02 000004 5 35 15.97 -5 26 07.4 14.12 12.25 99.00 10.30 0.02 0.01 -1.00 0.04 000005 5 35 09.21 -5 26 05.7 17.01 16.18 15.65 0.05 0.04 0.06 000006 5 35 20.13 -5 26 04.2 14.57 13.01 12.27 0.01 0.01 0.01 0 0535201-052604(4)00007 5 35 04.48 -5 26 04.1 12.14 11.25 10.89 10.15 0.03 0.04 0.03 0.03 0 0535044-052604(4)00008 5 35 05.18 -5 26 03.4 13.54 12.88 12.52 12.04 0.01 0.01 0.03 0.12 0 26200009 5 35 11.48 -5 26 02.6 9.91 9.06 8.84 8.47 0.05 0.01 0.02 0.02 0 36500010 5 35 22.57 -5 26 02.1 17.18 16.56 16.37 0.09 0.08 0.08 000011 5 35 06.92 -5 26 00.5 13.48 13.14 12.54 11.43 0.02 0.05 0.02 0.06 13.39 12.56 12.19 0.01 0.01 0.01 0 29900012 5 35 24.34 -5 26 00.3 13.09 12.42 12.12 11.38 0.08 0.03 0.02 0.10 13.05 12.37 12.02 0.01 0.01 0.01 0 310100013 5 35 10.48 -5 26 00.3 13.01 12.25 11.82 11.11 0.03 0.03 0.02 0.05 12.92 12.07 11.66 0.01 0.01 0.01 0 310400014 5 35 10.76 -5 26 00.0 15.54 13.61 12.60 11.72 0.04 0.08 0.02 0.09 15.42 13.60 12.57 0.01 0.01 0.01 000015 5 35 15.42 -5 25 59.5 13.72 12.84 12.38 11.56 0.01 0.02 0.02 0.06 13.68 12.78 12.26 0.01 0.01 0.02 0 3103
Note. — The complete version of this table is in the electronic edition of the Journal. The printed edition contains only asample.
Note. — This table is available only on-line as a machine-readable table.
– 41 –
Fig. 1.— Color composite near-infrared (JHKs) NTT image of the Trapezium Cluster. Taken withSOFI at the ESO NTT telescope, La Silla, Chile, March 2000. North is up and east is left and thefield of view is 5′ × 5′. Note the very red objects which trace the location of the parental molecularcloud and lie in an arcing ridge from southwest of the namesake Trapezium stars through theOrion South and the BN/KL regions and then directly north theTrapezium stars. The NTT regionis compared to that of other deep near-IR surveys in figure 17.
Fig. 2.— Raw near-infrared infrared luminosity functions.a) Trapezium Cluster J and H bandLuminosity Functions. The Trapezium HLF is the open histogram and the Trapezium JLF is theshaded histogram. Completeness (90%) limits are marked by asolid vertical line at 18.15 (J)and a broken vertical line at 17.8 (H). b) Trapezium Cluster Kband Luminosity Function. TheTrapezium KLF constructed from the FLWO-NTT catalog is compared to the KLF constructed inMLL2000. The K=17.5 90% completeness limit is demarked by a vertical broken line.
Fig. 3.— Observed control field KLF for the Trapezium Cluster. a) The two histograms arethe off-field KLFs obtained as part of the FLWO and NTT observations. The NTT off-fields areaproximately 2 magnitudes deeper than the FLWO off-fields, but the FLWO off-fields coveredtwice the area of the NTT off-fields. Both are scaled to the size of the Trapezium NTT region. Theinset diagram shows the distribution of H-K colors for thesetwo off-fields. Their similar narrowwidths indicate they are free of interstellar extinction; b) The weighted average of the FLWO andNTT field stars KLFs is compared to the Trapezium Cluster KLF constructed in figure 2(b).
Fig. 4.— Deriving cluster KLF M− AV Completeness limits. a) Trapezium Cluster (H - K) / Kcolor-magnitude diagram. Only stars falling within the Trapezium NTT region are shown. Starsselected to fall into our mass-limited, extinction-limited sample are indicated by filled circles. Thedistribution of sources in this color-magnitude space is compared to the location of the pre-mainsequence 0.2 and 0.8 Myrs isochrones from DM97. Reddening vectors representing 17 magnitudesof visual extinction are shown for 2.50, 0.08 and 0.02 M⊙ stars at the mean age assumed for thiscluster (0.8 Myrs). The zero-age main sequence (Kenyon & Hartmann 1995; Bessell 1995) isshown for 03-M6.5 stars at a distance of 400pc. b) Effects of mass/extinction limits on the clusterKLF. Comparison of the M− AV limited KLF derived from (a) to the raw Trapezium KLF (seefigure 2b). Sensitivity (K = 18.1) and completeness (K = 17.5)limits are shown as vertical brokenlines.
Fig. 5.— Testing the contribution of reddened field stars to the Trapezium Cluster KLF. Panels A& B: The first pair of panels displays the observed off-field KLF (figure 3b ) reddened by “back-ground shields” of extinction in the form of gaussian distributions (of AV ) centered at 10 (panel A)and 25 (panel B) magnitudes; Panels C & D: The second two panels are the observed off-field KLFreddened by an extinction map converted from a C18O map. The two panels represent the variation
– 42 –
in the predicted field star contamination as a function of theuncertainty in the C18O to AV conver-sion; Panels E & F: The final panels are of the same experiment as performed in C & D, but theyhave been filtered to reflect the actual contribution due to the M− AV limits.
Fig. 6.— Infrared color distributions for the FLWO-NTT Trapezium observations. a) Histogramof the observed (H - K) color for the FLWO-NTT Trapezium sources. The subset of these sourceswhich lack J band measurements are indicated by the shaded histogram; b) Trapezium Cluster (H -K) vs (J - H) color-color diagram for the NTT region. Symbols indicate if the source’s colors weretaken from the FLWO catalog (filled circles, JHK) or the NTT catalog (open circles, JHKs).
Fig. 7.— Probability distributions of source reddening forthe Trapezium Clusters sources. a)Extinction Probability Distribution Function (EPDF) for the Trapezium Cluster sources. Plottedare three variations in the EPDF under different assumptions of the typical (H-K)(star-disk)colorfor the 20% of the stars lacking J band measurements. See section 3.1.1 for derivation. It iscompared to the extinction probability distribution function integrated from the C18O → AV map.Note that they are not well separated distributions. A broken vertical line indicates the AV = 17,M − AV limit; b) Infrared Excess Probability Distribution Function (IXPDF) for the TrapeziumCluster. The derived H-Ks color excess distribution function is assumed to reflect a magnitudeexcess at K band alone. See section 3.1.2 for derivation.
Fig. 8.— Effect of the Trapezium Cluster EPDF on cluster luminosity functions. A model luminos-ity function of the Trapezium (using the Trapezium IMF derived in MLL2000) is convolved withthe Trapezium Cluster EPDF at four different wavelengths. Reddening effects are most significantat I and J bands and are minimized at K band.
Fig. 9.— Best fitting model KLFs and corresponding cluster IMFs. Top panels show theM − AV limited, background subtracted Trapezium KLF (histogram)and best fit reddened modelKLFs (unconnected filled circles). Bottom panels display the resulting underlying IMFs and corre-sponding chi-sq probabilities. Panel (a) shows models fit between K=7.5 and 14.5, the same rangefit in MLL2000. Panel (b) shows three power-law IMF fits to the secondary peak in the clusterKLF at K=15.5, which correspond to lowχ2 probability due to the presence of structure and thesecondary KLF peak.
Fig. 10.— Contours ofχ2 probability for the 5 parameters of the underlying three power-law IMF.Two parameters are compared in each panel while fixing the other three to a best fit value. Solidcontours are best fit ranges from models that include source reddening. Dashed contours are frombest fit models without source reddening. Contour levels areshown at intervals 95, 90, 70, 50 and30% confidence. Panels (a) to (c) are shown for fits to K=14.5 and panel (d) is shown for fits toK=15.

– 43 –
Fig. 11.— Overall Trapezium IMF. a) Trapezium M−AV limited KLF fit over the entire luminosityrange by employing a four power-law IMF that truncates at thelower mass limit our standardmerged PMS tracks (∼ 17MJup). The brown dwarf IMF breaks from a steady decline (Γ3 = 0.73)between 0.03 and 0.02 M⊙ and rises to the mass limit of the PMS tracks. The rapid tailing off of thecluster KLF does imply that the sub-stellar Trapezium IMF ischaracterized by a truncation near17 MJup (see section 4.1.2). Above them3 mass break the IMF is that described in table 1 for fitsto K = 15. b) Best fit Trapezium IMF and range of Trapezium IMFs derived from KLF modeling.Hatched areas are derived from the range of 90% confidence contours for KLF fits. Solid line isthe best fit Trapezium IMF listed in eq. 1. The Trapezium IMF isalso compared to the log-normalMiller & Scalo (1979) field star IMF.
Fig. 12.— The Trapezium Sub-Stellar IMF. a) Best fit Model KLFs based on multi-power lawIMFs are compared to the M− AV Trapezium KLF. The Trapezium Sub-Stellar M− AV KLFis shown with (solid histogram) and without (dashed histogram) correction for background fieldstars. Error bars are from counting statistics and the vertical dotted line demarks the K=17.5completeness limit. Model KLFs best fit to the M− AV KLF with (filled circles) and without(open circles) background correction are also shown, having error bars that corresponding to the1σ variation of that KLF bin for 50 iterations of the model. b) Derived Sub-Stellar TrapeziumIMF using the B97 PMS tracks. Similar to the sub-stellar IMF derived using our standard PMSmodels (figure 11b), the derived Trapezium brown dwarf IMF steadily declines, breaks and formsa significant secondary peak at 0.014 - 0.013 M⊙ before sharply declining below the deuteriumburning limit. Our sample completeness limit (0.01M⊙) is displayed as a vertical dotted line. TheIMF fit range allowed by the KLF modeling is graphically displayed and are best fit 3 power-lawIMFs from fits with and without background correction are shown (see table 2).
Fig. 13.— A Monte Carlo simulation of the Trapezium Sub-Stellar IMF. Fifty (50) samples of 150brown dwarfs were drawn from the best fit Trapezium Sub-Stellar IMF derived from B97 tracks,and each was binned into histogram form using equal sized logmass bins. The plotted histogramrepresents the average of that bin for the iterations, and the error bars represent the derived 1σ
standard deviation of that IMF bin from the Monte Carlo simulation.
Fig. 14.— Comparison of theoretical mass-luminosity (infrared K magnitude) relations. The-oretical pre-main sequence mass-luminosity relations were extracted from six different sets ofevolutionary models (see table 3). In all cases the intrinsic model quantities (luminosity, effectivetemperature) were converted to K magnitudes using a single Te f f -bolometric correction relation-ship. Shown for 6 sets of cluster mean ages: 0.1 (a); 0.5 (b); 1(c); 2 (d); 3 (e), and 5 (f) Myrs.Baraffe et al., (1998) models do not include models for ages less than 1 Myrs.
Fig. 15.— Comparison of theoretical mass-Te f f /spectral type relations (figure adopted from
– 44 –
D’Antona 1998). The spectral type - effective temperature -mass relationships were taken di-rectly from the 6 sets of PMS models at 1 (a) and 5 (b) Myrs. Alsoshown is the gravity (dwarf vssub-giant) dependence of the spectral type to effective temperature calibration for late type PMSstars. Because very young sub-solar mass stars and brown dwarfs are primarily on vertical Hayashicontraction tracks in the HR diagram, there is theoretically a close correspondence between effec-tive temperature and mass. The effective temperature to spectral type scale (right hand y-axis) is acool dwarf scale ( summed from Kenyon & Hartmann 1995; Bessell 1995; Wilking et al. 1999).The inset spectral sequence is the hotter sub-giant temperature-spectral scale tuned by Luhman(1999).
Fig. 16.— Comparison of five published Trapezium IMFs derived from IR photometry. All deriva-tions used the DM97 PMS tracks for masses less than 1 M⊙. Table 4 summarizes differencesamong the derivation methods. The HC2000 Trapezium IMF corresponds to their AV < 10 lim-ited sample. The MLL2000 IMF is fit (g) from their table 2.
Fig. 17.— Comparison of the survey areas of recent deep infrared studies of the Trapezium Cluster.The two shaded regions represent the 6.′5× 6.′5 FLWO survey and the 5′× 5′ NTT survey presentedin this work. Also shown are the NICMOS survey (Luhman et al.,2000, solid black border), theKeck survey (Hillenbrand & Carpenter 2000, solid white border),and the UKIRT survey (Lucas& Roche 2000, broken black border). The locations of luminous cluster members, spectral typesB3 and earlier, are shown as white stars.

Figure 1 1
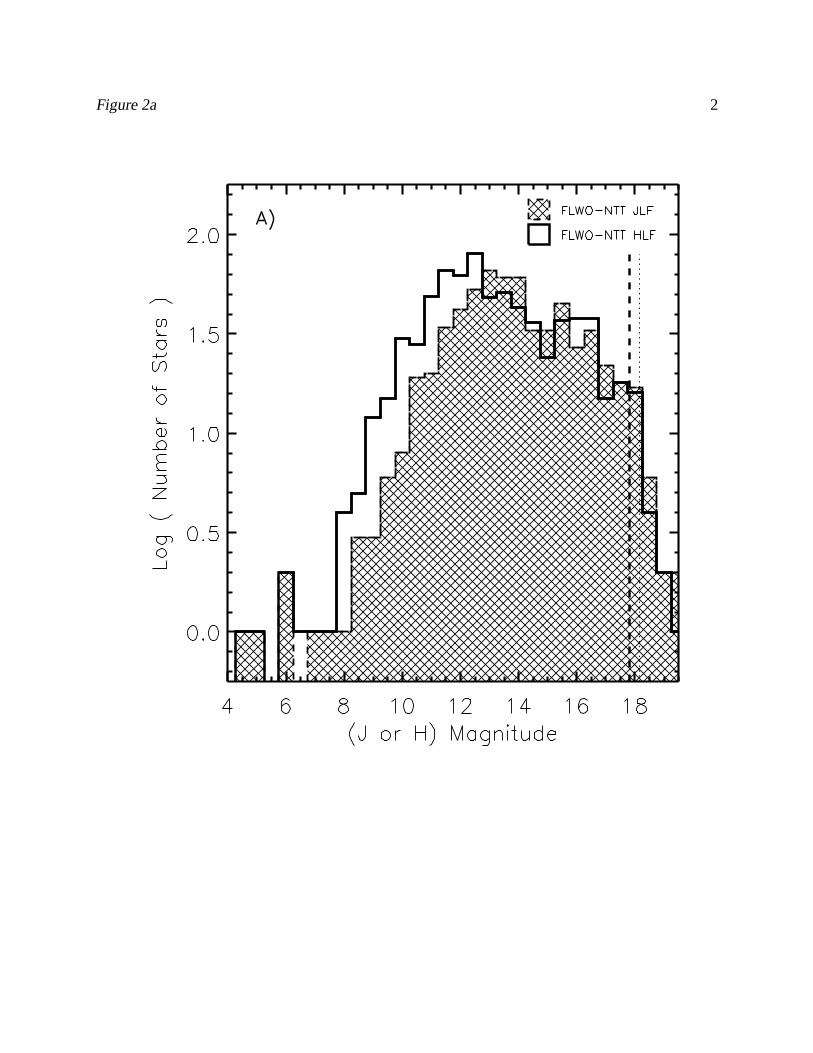
Figure 2a 2
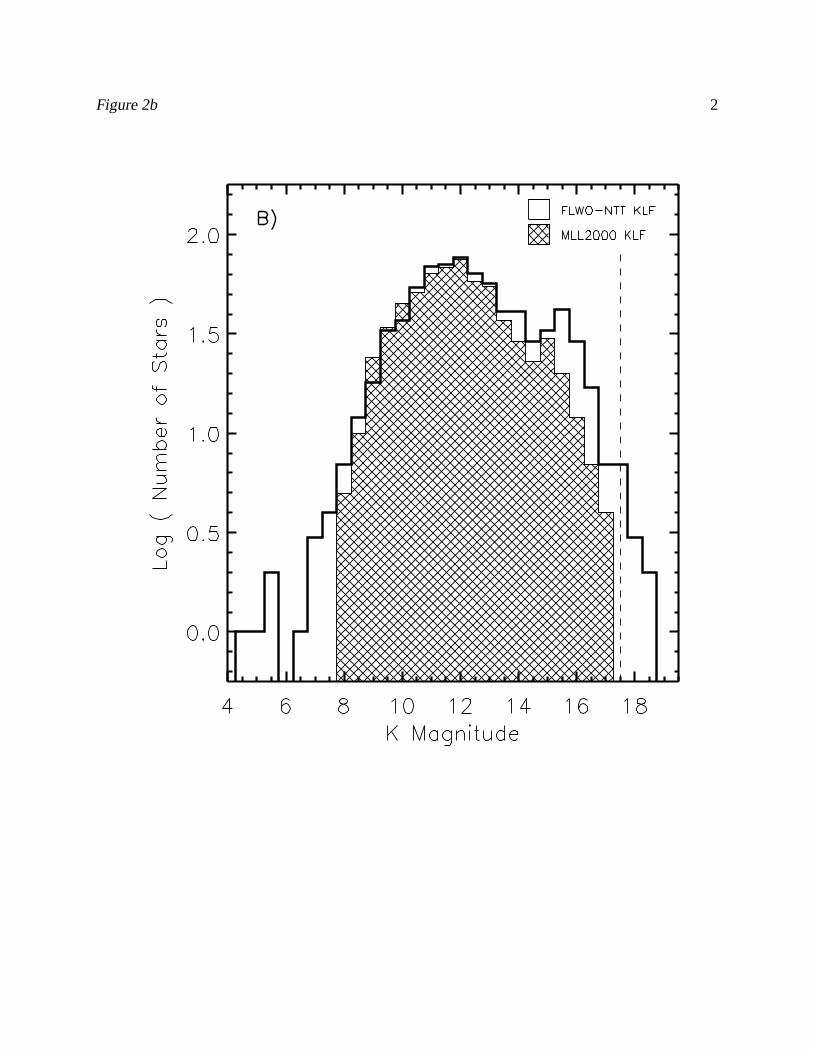
Figure 2b 2

Figure 3a 3
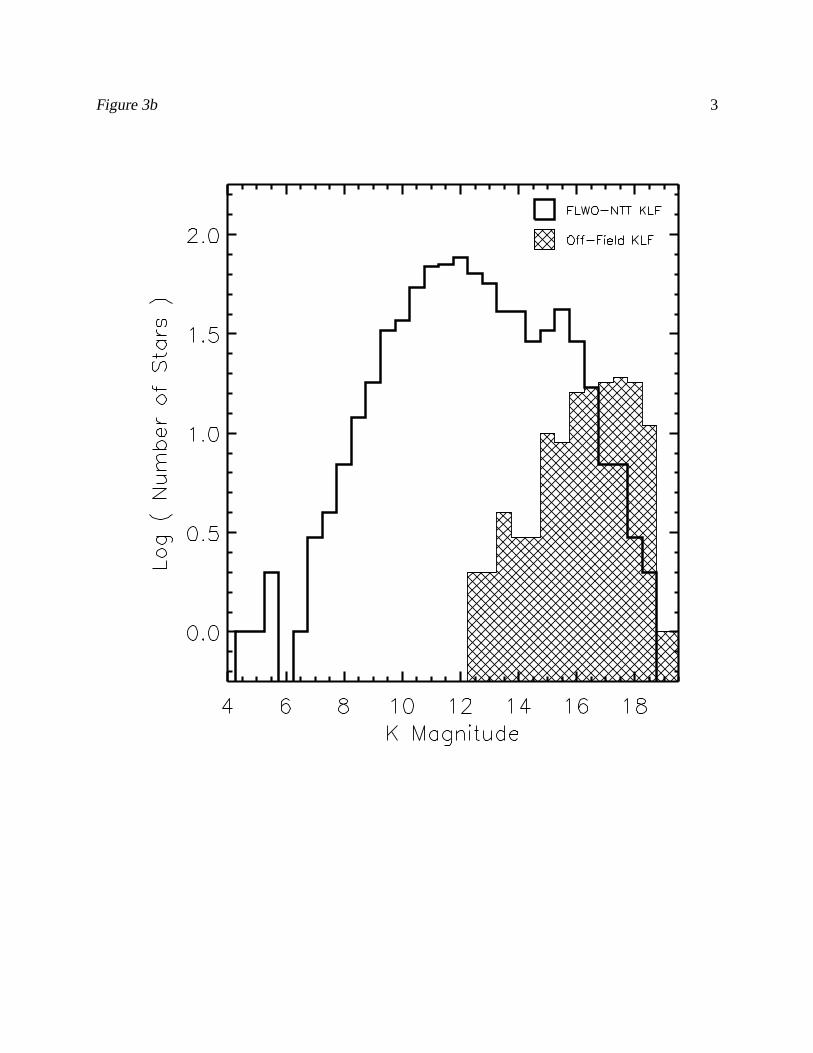
Figure 3b 3
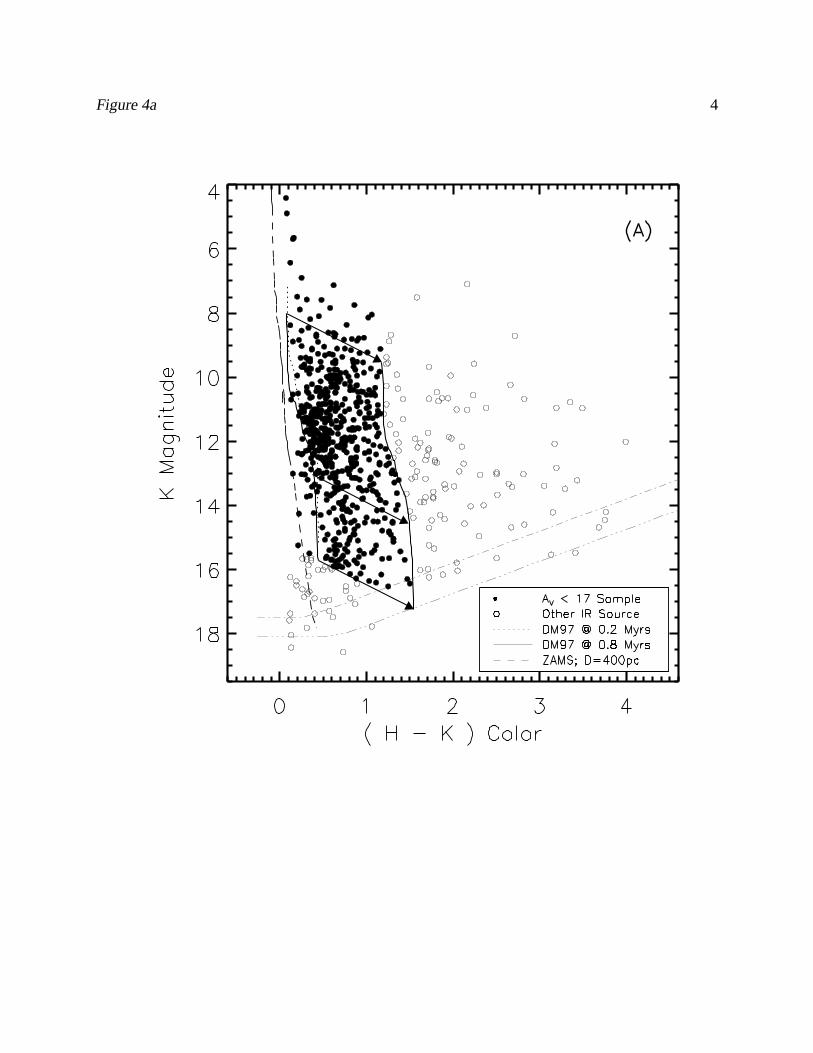
Figure 4a 4
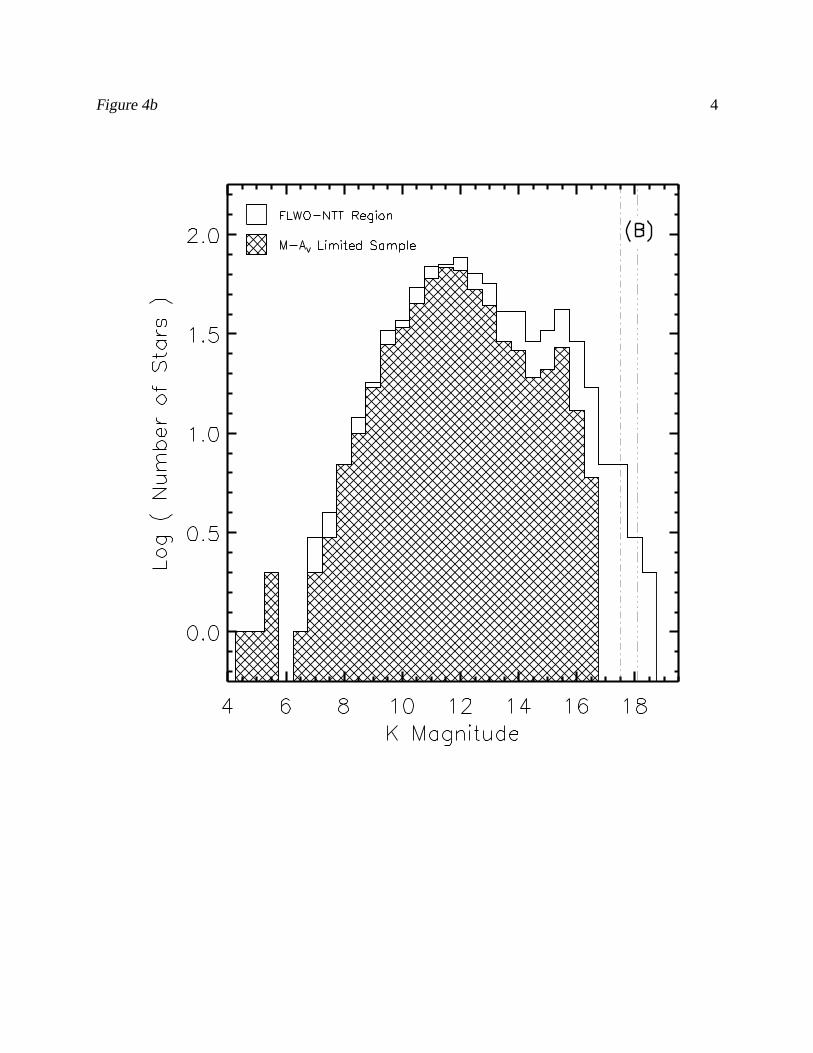
Figure 4b 4
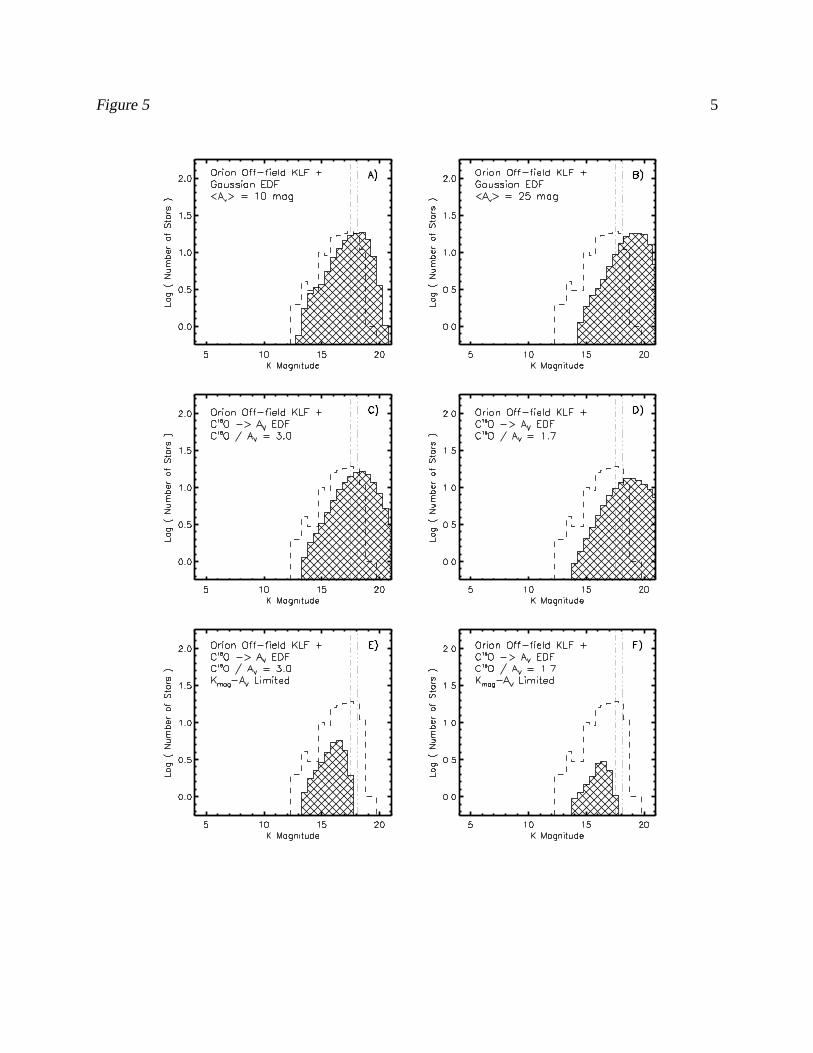
Figure 5 5

Figure 6a 6
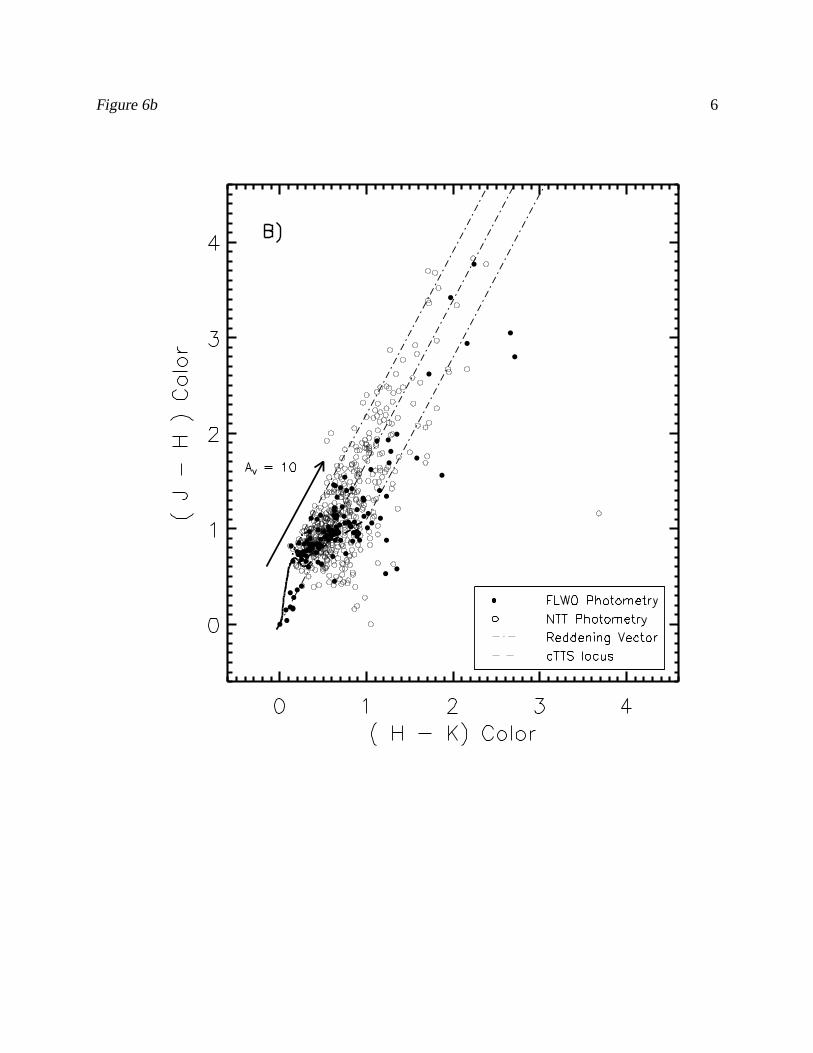
Figure 6b 6

Figure 7a 7
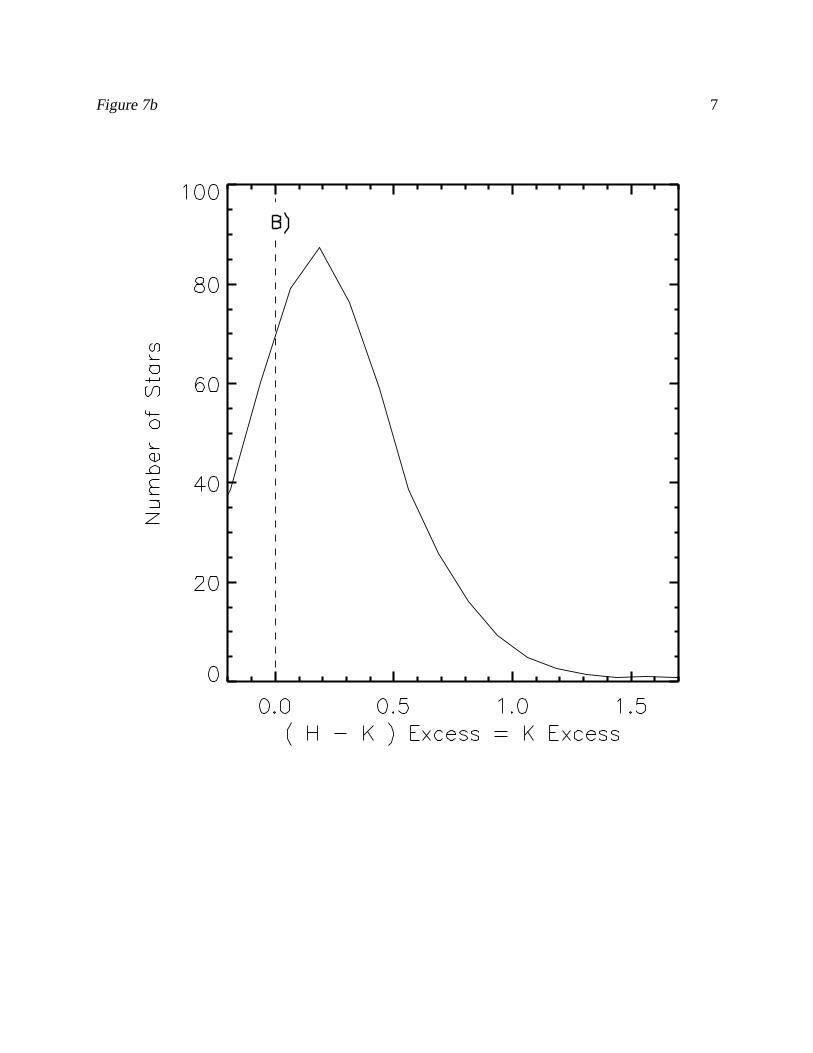
Figure 7b 7

Figure 8 8
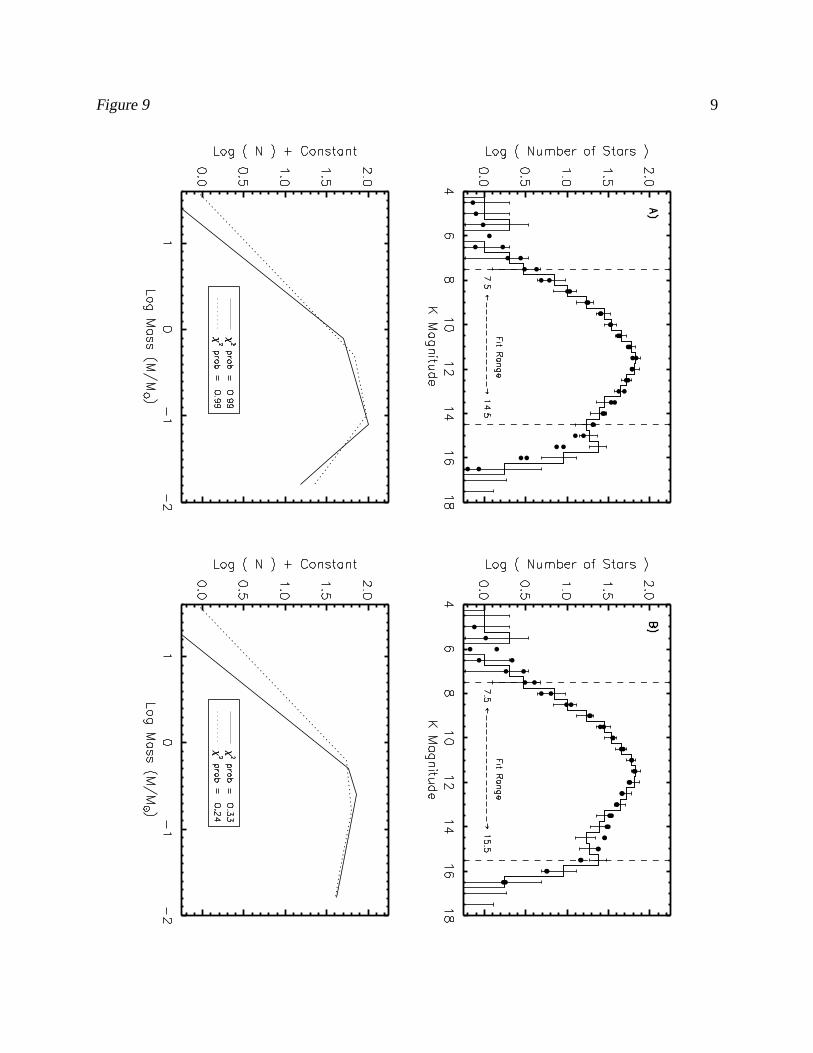
Figure 9 9
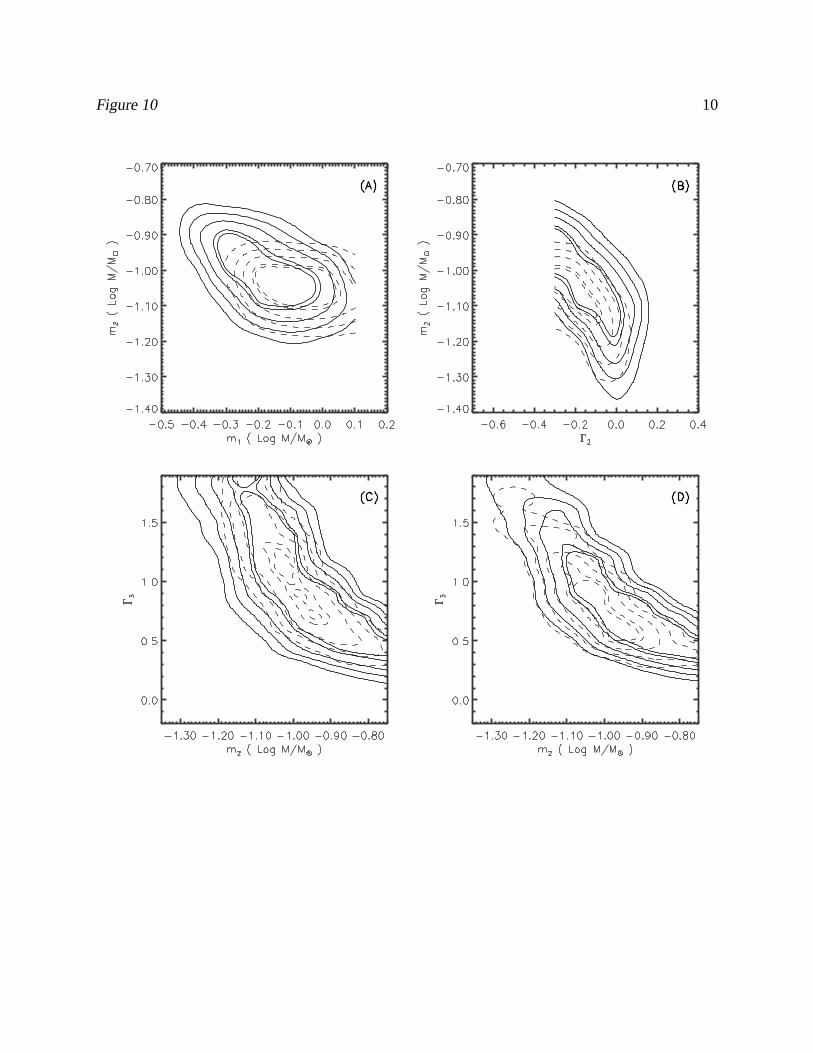
Figure 10 10
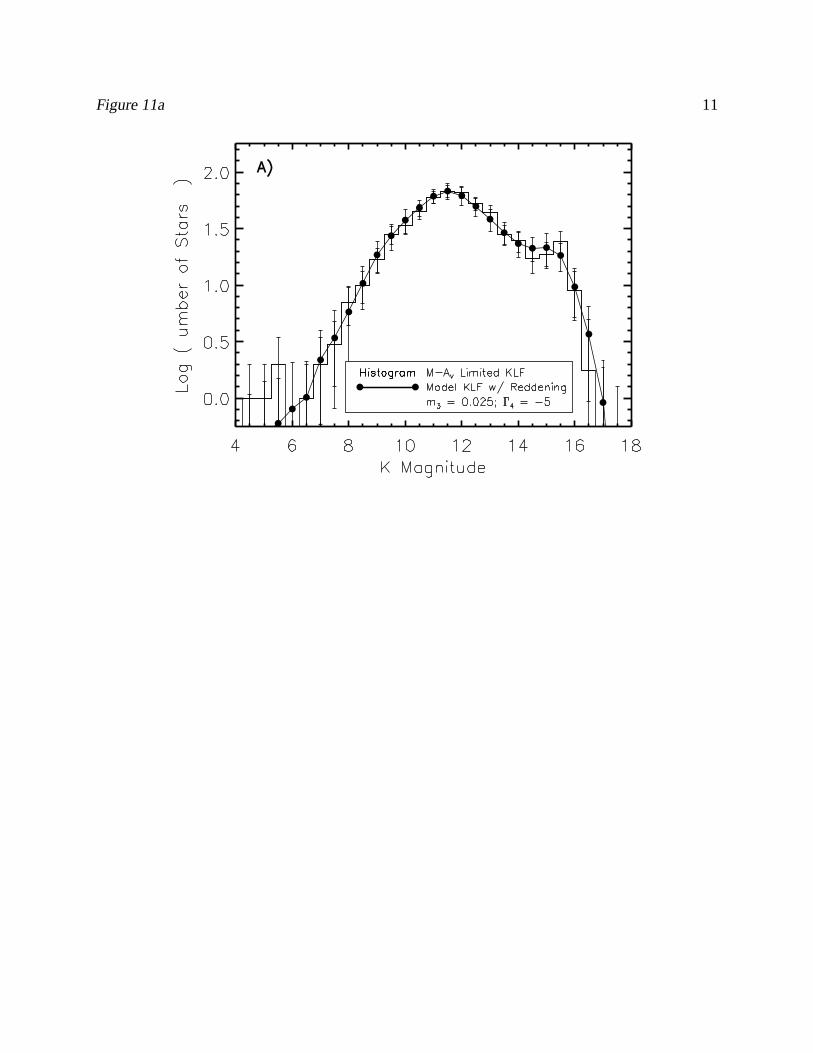
Figure 11a 11
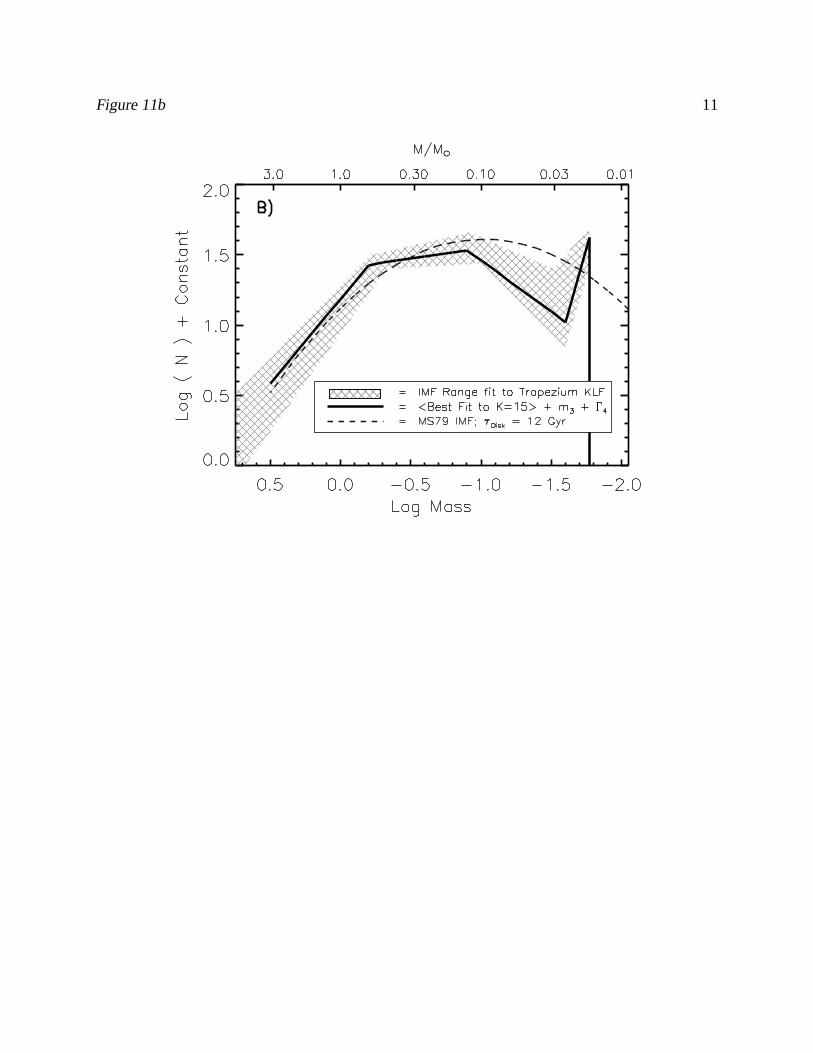
Figure 11b 11
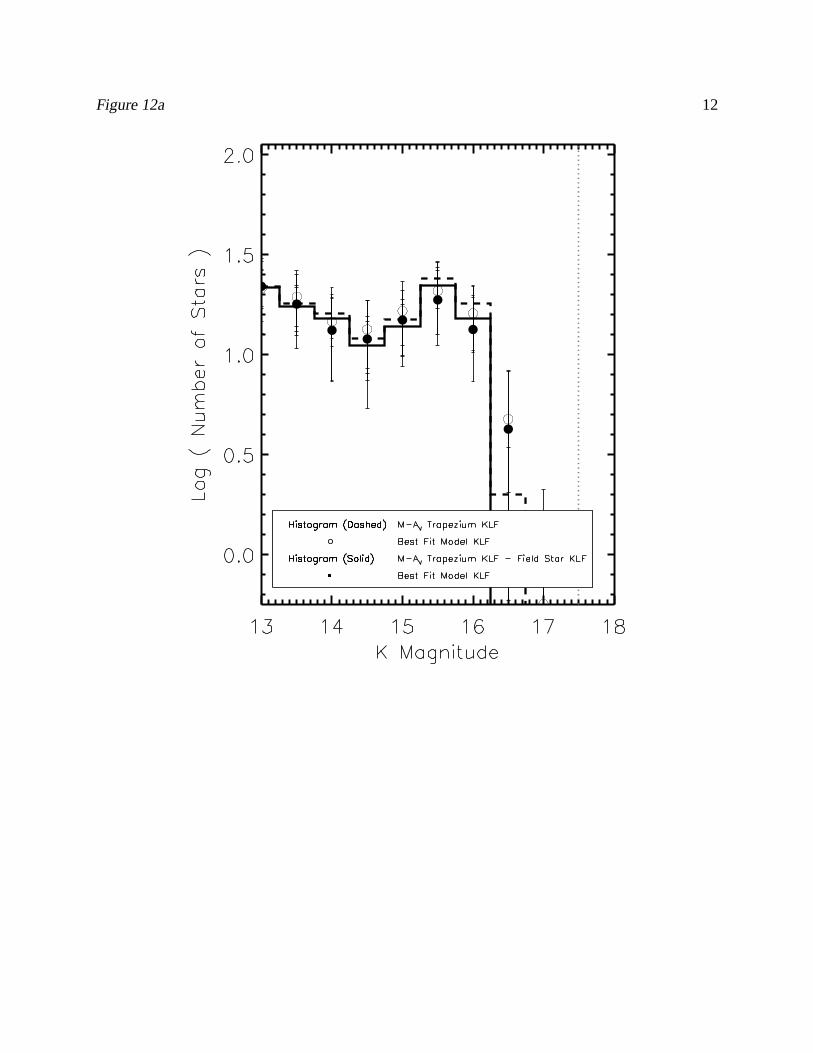
Figure 12a 12
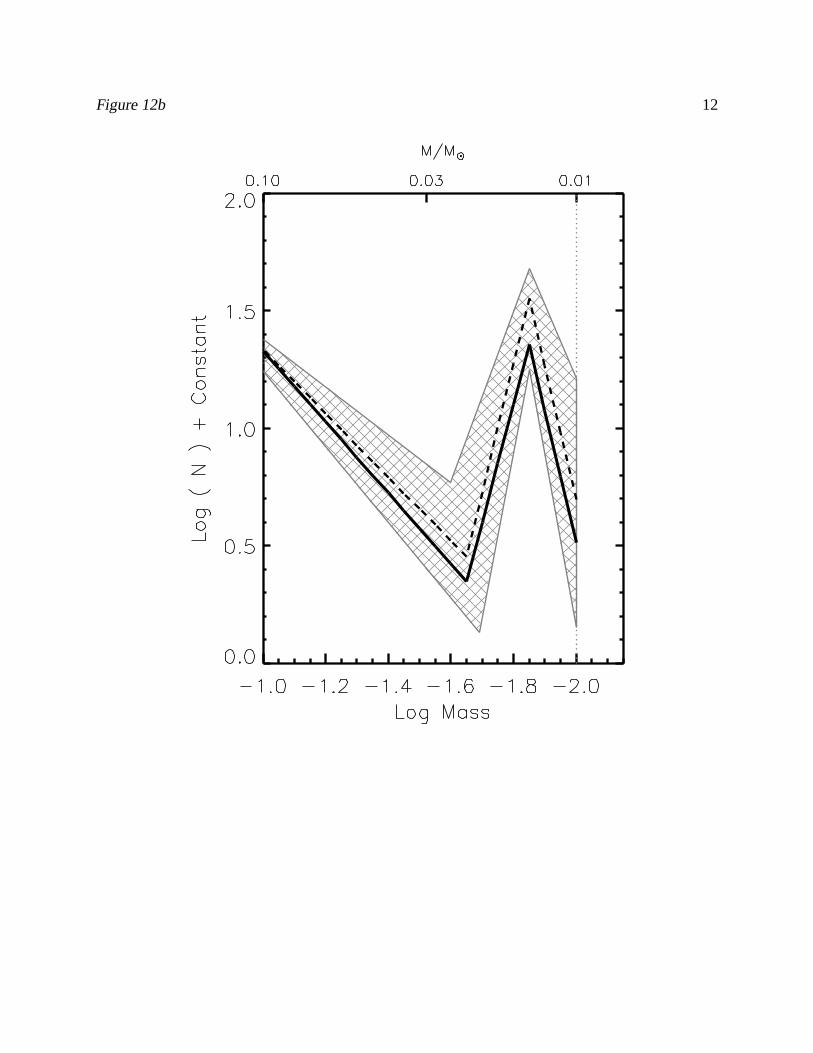
Figure 12b 12
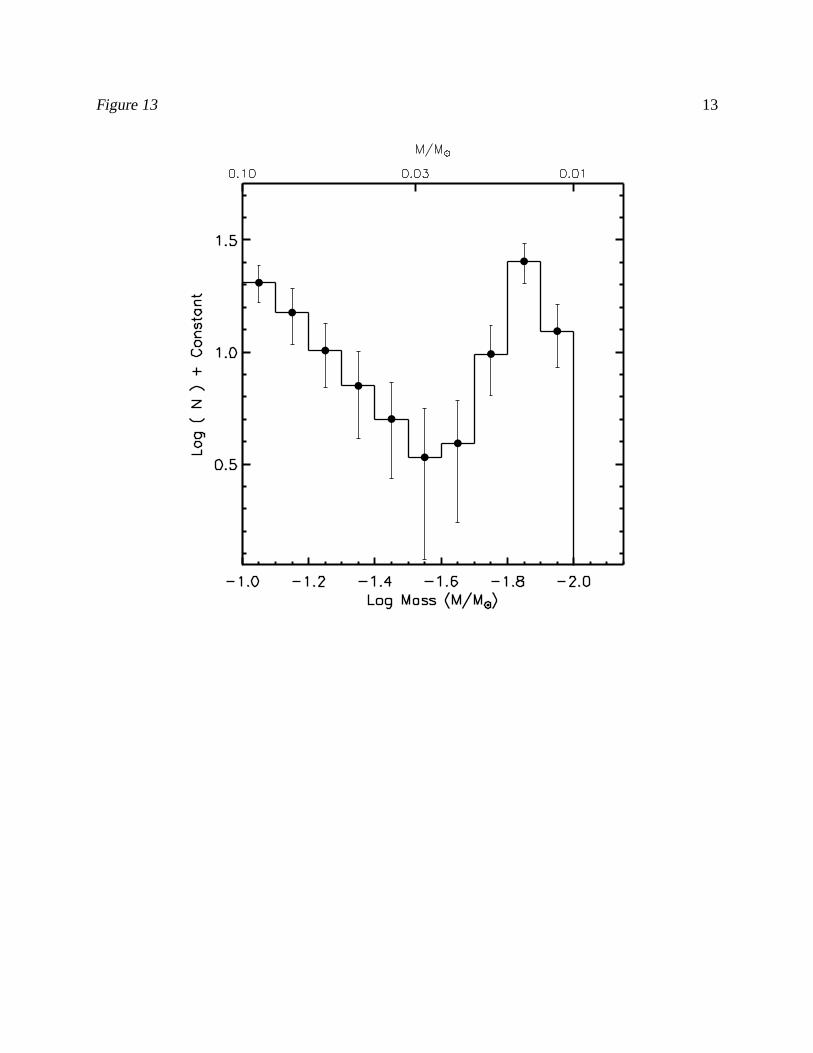
Figure 13 13
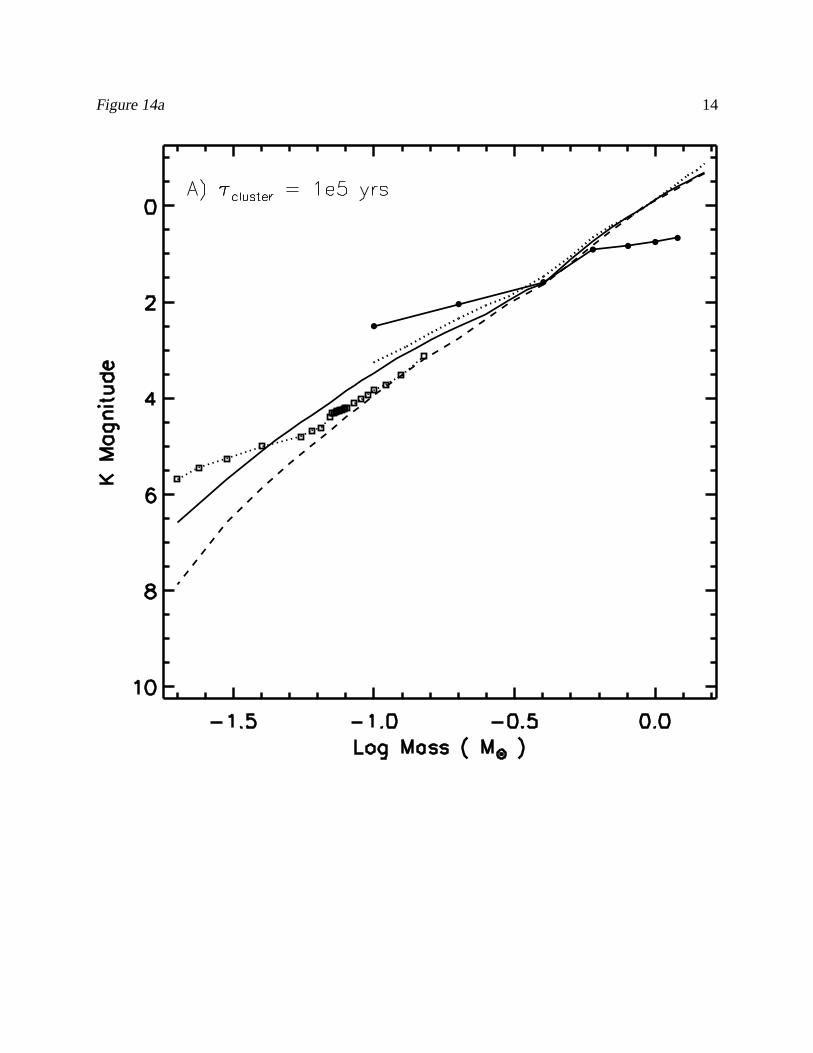
Figure 14a 14
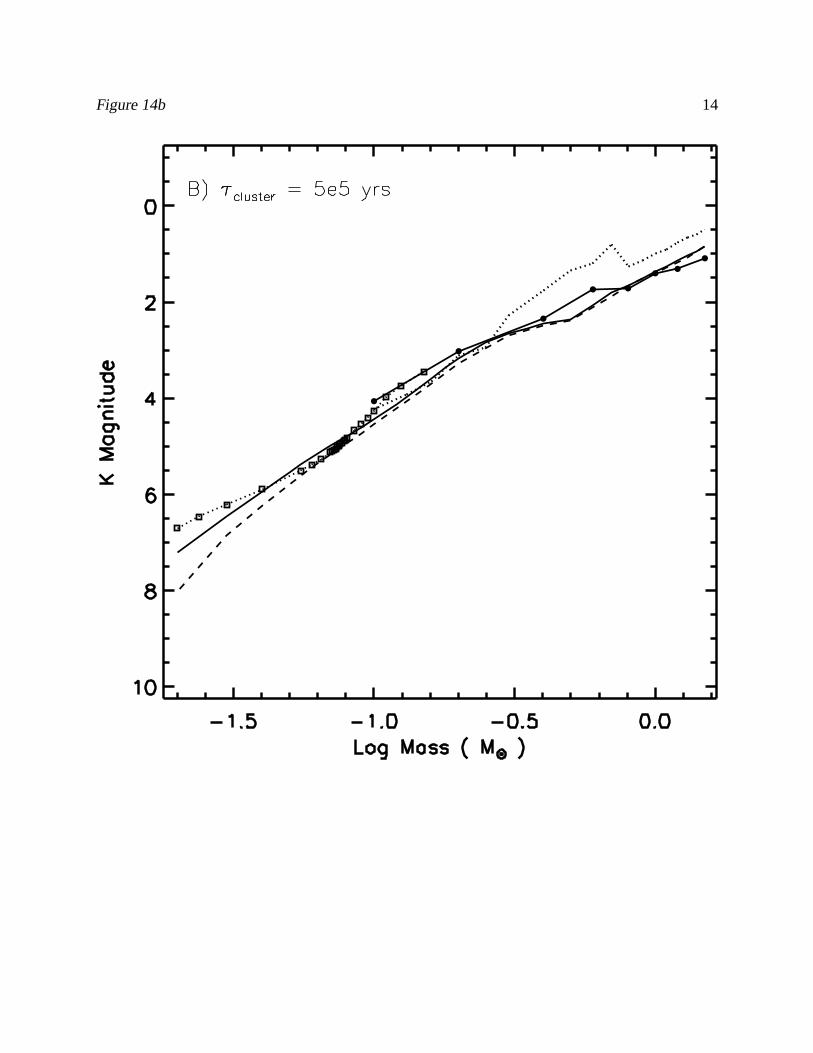
Figure 14b 14
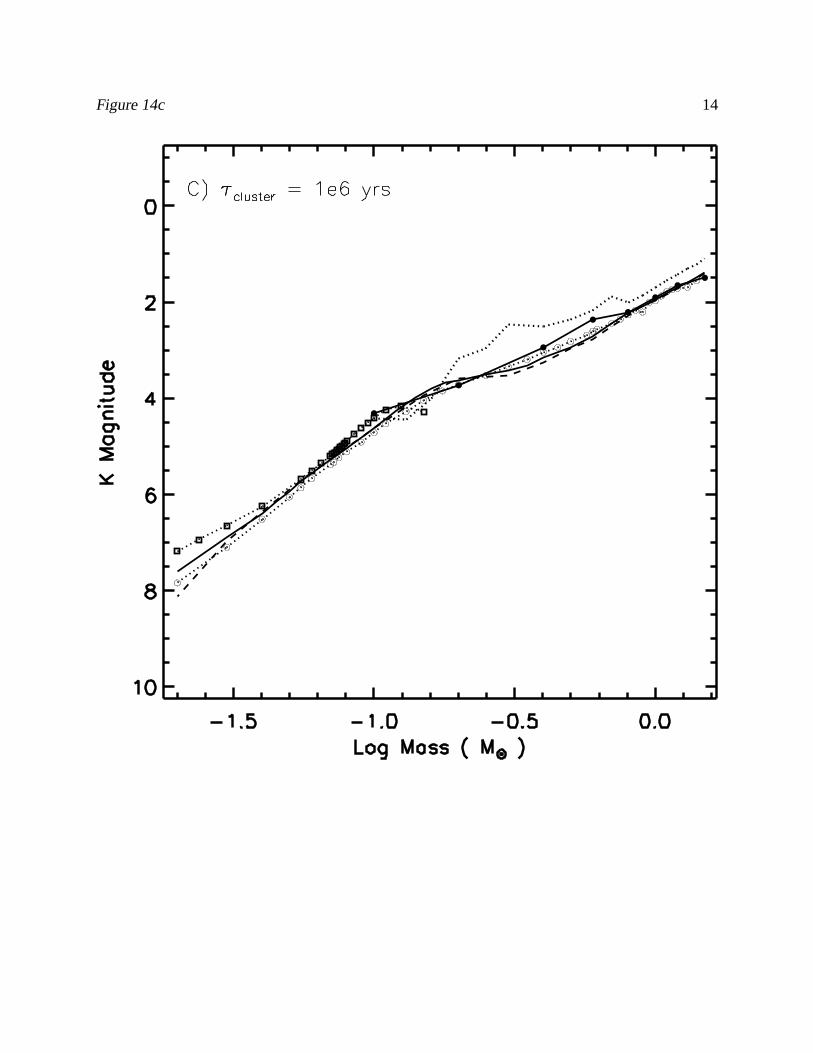
Figure 14c 14

Figure 14d 14

Figure 14e 14
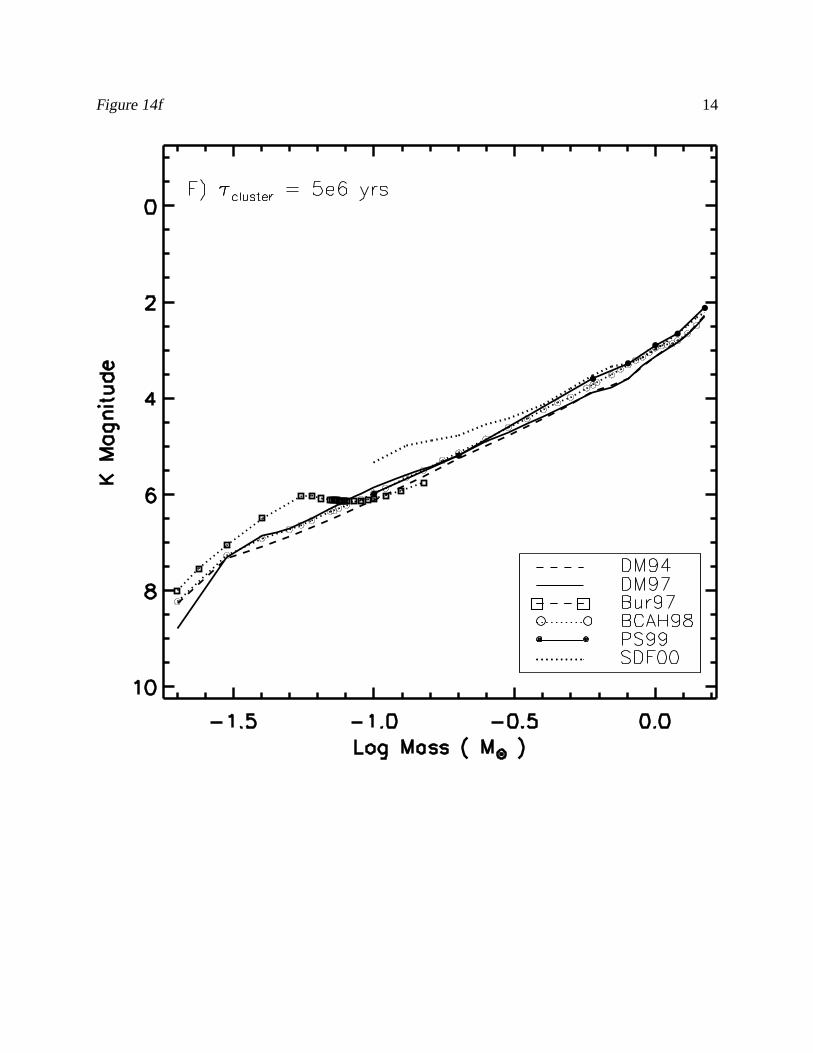
Figure 14f 14
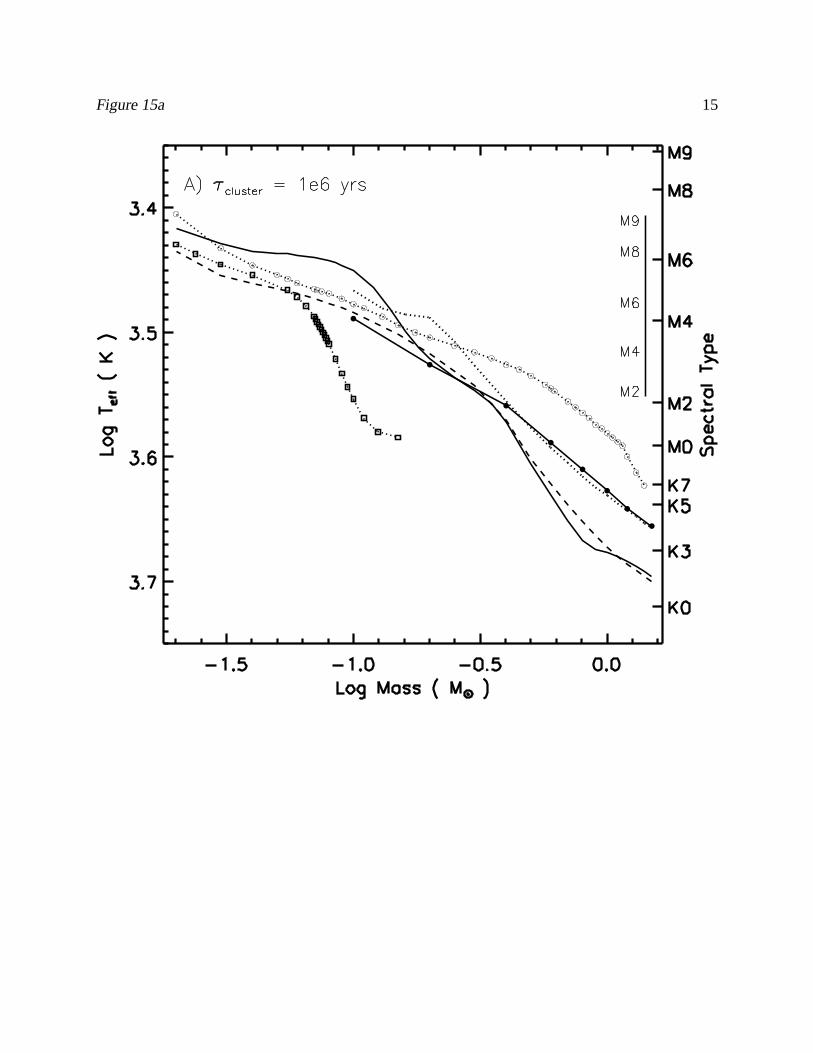
Figure 15a 15

Figure 15b 15

Figure 16 16

Figure A-1 17

This figure "figure01.jpg" is available in "jpg" format from:
http://arxiv.org/ps/astro-ph/0203122v1
Copyright © 2022 FDOKUMEN