PICASSO Rayleigh wave tomography of the western Mediterranean
21
Finite-frequency Rayleigh wave tomography of the western Mediterranean : Mapping its lithospheric structure I. Palomeras, S. Thurner, A. Levander, and K. Liu Department of Earth of Earth Science (MS126), Rice University, 6100 Main St., Houston, Texas 77005, USA ([email protected]) A. Villasenor and R. Carbonell Department of Earth’s Structure and Dynamics, Institute of Earth Sciences ‘‘Jaume Almera,’’ Barcelona, Spain M. Harnafi Department of Earth Sciences, Universit e Mohammed V, Rabat, Morocco [1] We present a 3-D shear wave velocity model for the crust and upper mantle of the western Mediterranean from Rayleigh wave tomography. We analyzed the fundamental mode in the 20–167 s period band (6.0–50.0 mHz) from earthquakes recorded by a number of temporary and permanent seismograph arrays. Using the two-plane wave method, we obtained phase velocity dispersion curves that were inverted for an isotropic Vs model that extends from the southern Iberian Massif, across the Gibraltar Arc and the Atlas mountains to the Saharan Craton. The area of the western Mediterranean that we have studied has been the site of complex subduction, slab rollback, and simultaneous compression and extension during African-European convergence since the Oligocene. The shear velocity model shows high velocities beneath the Rif from 65 km depth and beneath the Granada Basin from 70 km depth that extend beneath the Alboran Domain to more than 250 km depth, which we interpret as a near-vertical slab dangling from beneath the western Alboran Sea. The slab appears to be attached to the crust beneath the Rif and possibly beneath the Granada Basin and Sierra Nevada where low shear velocities (3.8 km/s) are mapped to >55 km depth. The attached slab is pulling down the Gibraltar Arc crust, thickening it, and removing the continental margin lithospheric mantle beneath both Iberia and Morocco as it descends into the deeper mantle. Thin lithosphere is indicated by very low upper mantle velocities beneath the Alboran Sea, above and east of the dangling slab and beneath the Cenozoic volcanics. Components : 11,497 words, 13 figures. Keywords : western Mediterranean ; Rayleigh wave tomography ; subduction. Index Terms: 7218 Lithosphere: Seismology; 7240 Subduction zones: Seismology; 7255 Surface waves and free oscilla- tions: Seismology; 7270 Tomography: Seismology; 1207 Transient deformation: Geodesy and Gravity; 1219 Gravity anomalies and Earth structure: Geodesy and Gravity; 1236 Rheology of the lithosphere and mantle: Geodesy and Gravity; 1240 Satellite geodesy: results: Geodesy and Gravity ; 6982 Tomography and imaging: Radio Science; 8180 Tomography: Tectonophysics. Received 28 May 2013 ; Revised 9 December 2013 ; Accepted 12 December 2013 ; Published 00 Month 2014. Palomeras, I., S. Thurner, A. Levander, K. Liu, A. Villasenor, R. Carbonell, and M. Harnafi (2014), Finite-frequency Ray- leigh wave tomography of the western Mediterranean: Mapping its lithospheric structure, Geochem. Geophys. Geosyst., 15, doi :10.1002/2013GC004861. © 2013. American Geophysical Union. All Rights Reserved. 1 Article Volume 15, Number 00 00 Month 2014 doi : 10.1002/2013GC004861 ISSN : 1525-2027
-
Upload
independent -
Category
Documents
-
view
0 -
download
0
Transcript of PICASSO Rayleigh wave tomography of the western Mediterranean
Finite-frequency Rayleigh wave tomography of thewestern Mediterranean: Mapping its lithosphericstructure
I. Palomeras, S. Thurner, A. Levander, and K. LiuDepartment of Earth of Earth Science (MS126), Rice University, 6100 Main St., Houston, Texas 77005, USA([email protected])
A. Villasenor and R. CarbonellDepartment of Earth’s Structure and Dynamics, Institute of Earth Sciences ‘‘Jaume Almera,’’ Barcelona, Spain
M. HarnafiDepartment of Earth Sciences, Universit�e Mohammed V, Rabat, Morocco
[1] We present a 3-D shear wave velocity model for the crust and upper mantle of the westernMediterranean from Rayleigh wave tomography. We analyzed the fundamental mode in the 20–167 speriod band (6.0–50.0 mHz) from earthquakes recorded by a number of temporary and permanentseismograph arrays. Using the two-plane wave method, we obtained phase velocity dispersion curves thatwere inverted for an isotropic Vs model that extends from the southern Iberian Massif, across the GibraltarArc and the Atlas mountains to the Saharan Craton. The area of the western Mediterranean that we havestudied has been the site of complex subduction, slab rollback, and simultaneous compression and extensionduring African-European convergence since the Oligocene. The shear velocity model shows high velocitiesbeneath the Rif from 65 km depth and beneath the Granada Basin from �70 km depth that extend beneaththe Alboran Domain to more than 250 km depth, which we interpret as a near-vertical slab dangling frombeneath the western Alboran Sea. The slab appears to be attached to the crust beneath the Rif and possiblybeneath the Granada Basin and Sierra Nevada where low shear velocities (3.8 km/s) are mapped to >55 kmdepth. The attached slab is pulling down the Gibraltar Arc crust, thickening it, and removing the continentalmargin lithospheric mantle beneath both Iberia and Morocco as it descends into the deeper mantle. Thinlithosphere is indicated by very low upper mantle velocities beneath the Alboran Sea, above and east of thedangling slab and beneath the Cenozoic volcanics.
Components: 11,497 words, 13 figures.
Keywords: western Mediterranean; Rayleigh wave tomography; subduction.
Index Terms: 7218 Lithosphere: Seismology; 7240 Subduction zones: Seismology; 7255 Surface waves and free oscilla-tions: Seismology; 7270 Tomography: Seismology; 1207 Transient deformation: Geodesy and Gravity; 1219 Gravity anomaliesand Earth structure: Geodesy and Gravity; 1236 Rheology of the lithosphere and mantle: Geodesy and Gravity; 1240 Satellitegeodesy: results: Geodesy and Gravity; 6982 Tomography and imaging: Radio Science; 8180 Tomography: Tectonophysics.
Received 28 May 2013; Revised 9 December 2013; Accepted 12 December 2013; Published 00 Month 2014.
Palomeras, I., S. Thurner, A. Levander, K. Liu, A. Villasenor, R. Carbonell, and M. Harnafi (2014), Finite-frequency Ray-leigh wave tomography of the western Mediterranean: Mapping its lithospheric structure, Geochem. Geophys. Geosyst., 15,doi:10.1002/2013GC004861.
© 2013. American Geophysical Union. All Rights Reserved. 1
Article
Volume 15, Number 00
00 Month 2014
doi: 10.1002/2013GC004861
ISSN: 1525-2027

1. Introduction
[2] The Mediterranean has been affected by slowoblique compression due to African-European con-vergence since the Cretaceous, with the Tethyanoceanic lithosphere being recycled into the mantlebeneath Europe [e.g., Royden, 1993]. The westernMediterranean now comprises a convergent diffuseplate boundary between the African and the Eura-sian plates with deformation extending from theBetic Mountains in southern Spain, to as far southas the High Atlas in Morocco (Figure 1a). Althoughthe region is a convergent margin, parts of it have
experienced extension since Oligocene times whenthe convergence speed between Africa and Eurasiadecreased and widespread slab rollback startedthroughout the Mediterranean [Malinverno andRyan, 1986; Royden, 1993; Wortel and Spakman,2000; Faccenna et al., 2004]. Slab retreat formedthe modern Mediterranean basins including theAegean, Tyrrhenian, Ligurian, and Alboran Sea aswell as the Valencia Trough [e.g., Durand et al.,1999]. Current African movement with respect toEurasia is to the northwest at 3–4 mm/yr in NorthAfrica, rotating to a more westerly direction inthe Gibraltar Strait [Koulali et al., 2011].
41° 41°
350°
-10°
351°
-9°
352°
-8°
353°
-7°
354°
-6°
355°
-5°
356°
-4°
357°
-3°
358°
-2°
359°
-1°
0°
0°
1°
1°
29° 29°
30° 30°
31° 31°
32° 32°
33° 33°
34° 34°
35° 35°
36° 36°
37° 37°
38° 38°
39° 39°
40° 40°
EB IB
IRER
GB
RB
IM
HA
MA
ASAB
GCIWTASZ
-4000
m-3000 -2000 -1000 0 1000 2000 3000 4000
a)
SPAIN
MOROCCO
41° 41°
350°
-10°
351°
-9°
352°
-8°
353°
-7°
354°
-6°
355°
-5°
356°
-4°
357°
-3°
358°
-2°
359°
-1°
0°
0°
1°
1°
29° 29°
30° 30°
31° 31°
32° 32°
33° 33°
34° 34°
35° 35°
36° 36°
37° 37°
38° 38°
39° 39°
40° 40°
PICASSO BBIberArray BBES NetGE NetIG NetIU NetPM NetWM NetMM NetGM Net
b)
Figure 1. (a) Elevation map of the western Mediterranean with the principal tectonic units and (b) the sta-tions used in this study. (Figure 1a) The main tectonic unit of the Iberian Peninsula is the Iberian Massif (IM)in the north and west of the study area. In the southwest of Spain are the Betic Mountains, composed of theInternal Betics (IB) and External Betics (EB). The Guadalquivir Basin (GB) is the Betic foreland basin. Theequivalent to the Betics in Morocco are the Rif Mountains consisting of the Internal Rif (IR) and the ExternalRif (ER). The associated foreland basin is the Rharb Basin (RB). The Internal Betics (IB), Internal Rif (IR),and Alboran Sea (AS) constitute the Alboran Domain, while the Betics and Rif combined form the GibraltarArc. The white shadow area represents the Flysch Domain. West of the Gibraltar Strait is the Gulf of CadizImbricate Wedge (GCIW). In the south of the study area are the Middle Atlas (MA) and High Atlas (HA)Mountains. Blue triangle and circle indicate the position of Sierra Nevada and the Granada Basin, respec-tively. The Cenozoic volcanic fields are represented by orange triangles. (Figure 1b) The broadband stationsand the different networks used for this study.
PALOMERAS ET AL. : RAYLEIGH WAVE VS MODEL IN WM 10.1002/2013GC004861
2

[3] Different, but not exclusive models have beenproposed to explain the geology of the AlboranSea and Gibraltar Arc regions and reconstruct theirtectonic evolution. The models can be grouped intwo major themes: slab rollback scenarios andmantle lithosphere instabilities with or withoutcontinental lithosphere delamination. A largenumber of contributions describe variations onthese two main themes, based on geologic, geody-namic, seismologic, and other evidence [e.g., Plattand Vissers, 1989; Royden, 1993; Calvert et al.,2000; Gutscher et al., 2002, 2012, and referencestherein].
[4] The Atlas Mountains are an intercontinentalbelt in northwest Africa. This range reaches eleva-tions higher than 2000 m with relatively minorshortening [Beauchamp et al., 1999; Teixell et al.,2003; Arboleya et al., 2004]. The cause of thehigh elevations and the relation of the uplift of thismountain belt to contemporaneous subduction andslab retreat in the Mediterranean are unclear.
[5] A variety of seismic images made largely withpermanent seismic stations in Spain and Moroccoand small deployments of portable instrumentshave displayed different aspects of the upper man-tle structure in the western Mediterranean. Theseimages, of varying quality, have been made withray and finite-frequency teleseismic P wave traveltime tomography [Blanco and Spakman, 1993;Calvert et al., 2000; Wortel and Spakman, 2000;Piromallo and Morelli, 2003; Spakman and Wor-tel, 2004], surface wave tomography [Peter et al.,2008; Schivardi and Morelli, 2009], and adjointtomography [Zhu et al., 2012]. To better resolvethe complex structures in this region, severalloosely affiliated projects were started between2007 and 2009, including the Spanish IberArrayand SIBERIA broadband seismic arrays [D�ıazet al., 2009], and the PICASSO (Program to Inves-tigate Convective Alboran Sea System Overturn)project, which includes researchers from a varietyof institutions in the U.S., Ireland, Spain, andMorocco. Subsequently, groups from German andEnglish institutions have deployed broadband seis-mographs in the area, expanding the seismic foot-print. The PICASSO seismology program includesan 85 element broadband seismic array deployedin a roughly north-south line from the IberianMassif in central Spain, across the Betics, theGibraltar Strait, the Rif Mountains, the MiddleAtlas, and the High Atlas and ending on the SaharaPlatform (Figure 1). Part of the PICASSO stationswere also deployed in aerial arrays around theAlboran Sea in the Betic and Rif Mountains to
increase the density of the more regionally distrib-uted IberArray and SIBERIA arrays. The IberAr-ray and SIBERIA are dense areal traveling seismicnetworks (interstation spacing< 60 km), whichwill gradually cover Spain and northern Morocco,respectively (http://iberarray.ictja.csic.es/).PICASSO, the Spanish arrays, and the existingpermanent network total almost 240 broadbandseismographs in our study area (Figure 1b).
[6] In this paper, we describe the analysis andinterpretation of fundamental mode Rayleighwaves across the western Mediterranean. We havedeveloped a 3-D shear velocity model from thecentral Iberian Peninsula in the north, to theSaharan Platform in the south. The 3-D shearvelocity model integrated with other geologicaland geophysical data provides constraints on thedifferent tectonic scenarios of the region. In partic-ular, our results show evidence of an attached slabbeneath the Rif and the Gibraltar Strait extendinginto the asthenosphere beneath the AlboranDomain. The surface wave image complementsthe slab imaged in the upper mantle extending intothe transition zone in recent body wave tomogra-phy results [Bezada et al., 2013]. Lithosphericmantle is thin or absent beneath regions of Ceno-zoic volcanism, and beneath the eastern High andthe Middle Atlas Mountains, supporting the mod-els developed for this region [Teixell et al., 2005;Zeyen et al., 2005].
2. Geological and Geophysical Setting
[7] The northern part of the study area belongs tothe stable Iberian Massif (Figure 1a). It is thesouthernmost exposed element of the EuropeanVariscan Belt, a Late Paleozoic orogen resultingfrom the collision between Gondwana and Laura-sia that formed the Pangaean supercontinent[Matte, 1986, 2001]. The Moho depth, well con-strained by active seismic profiles, is almost con-stant at 30–32 km depth [Surinach and Vegas,1988; Simancas et al., 2003; Palomeras et al.,2009; Mart�ınez Poyatos et al., 2012]. Modelsderived from geopotential fields provide an esti-mate of the lithosphere-asthenosphere boundary at�100 km depth in western Iberia [Fern�andezet al., 2004; Fullea et al., 2010; Palomeras et al.,2011] deepening to �120 km toward the Gulf ofCadiz.
[8] The central part of the sampled area comprisesthe westernmost segment of the Alpine-Mediterranean belt represented by the Betics in
PALOMERAS ET AL. : RAYLEIGH WAVE VS MODEL IN WM 10.1002/2013GC004861
3

southern and southeastern Iberia and the RifMountains in northern Morocco (Figure 1a). TheBetics and Rif Mountains together comprise theGibraltar Arc, an arcuate belt that partiallyencircles the Alboran Sea. The Guadalquivir andRharb basins are the associated foreland basins inSpain and Morocco, respectively. Three differentgeologic domains can be distinguished in the Beticand Rif Mountains (Figure 1a): the Flysch Domain,the Internal Zone, and the External Zone. Activesource seismic studies in the Betic Mountains [Car-bonell et al., 1998] show a Moho depth of �30 km,shallowing beneath the coast to 23–25 km depth. Adeeper Moho, �38 km depth, is observed beneaththe Sierra Nevada mountains, where the highestpeak, the Mulhacen, reaches 3479 m [D�ıaz andGallart, 2009, and references therein]. A recentrefraction/reflection experiment in the Rif Moun-tains [Gallart et al., 2012] reveals a thick crust(Moho at �55 km depth) beneath the western Rifand thinning eastward to 25 km depth. The sameresults are observed by a receiver functions studythat suggests a �55 km depth Moho beneath theGibraltar Arc [Thurner et al., in press].
[9] The Internal Zones, jointly with the AlboranSea crust, are termed the Alboran Domain, anallochthonous unit that separated from the easternIberian margin and drifted to its current positionduring Cenozoic subduction rollback [e.g., Rose-nbaum et al., 2002]. The Alboran Sea is underlainby extended continental crust, with a thicknessranging from 15 to 20 km [D�ıaz and Gallart,2009].
[10] Moderate, shallow to intermediate (0–150km) depth seismicity is observed in and around theGibraltar Arc [Grimison and Chen, 1986; Bufornet al., 1991]. There is a gap with no seismicity atdepths between �150 and 600 km, with someevents at depths greater than 600 km (620–660km) almost directly beneath Granada, Spain[Buforn et al., 1991]. Seismic tomography images[Gutscher et al., 2002; Spakman and Wortel,2004; Bezada et al., 2013] show a high velocityanomaly descending from W to E, nearly verti-cally beneath the Alboran Sea and reaching themantle transition zone beneath southernmostSpain. The images also show a low velocity anom-aly beneath the western Alboran Sea between 50and 100 km [Seber et al., 1996a; Morales et al.,1999] suggesting that this high velocity anomalyis not connected to the surface. The origin of thishigh-velocity body has been differently interpretedas east dipping subduction [Lonergan and White,1997; Gutscher et al., 2002; Spakman and Wortel,
2004], lithospheric delamination [Seber et al.,1996a; Calvert et al., 2000], and convectiveremoval of thickened lithosphere [Platt and Viss-ers, 1989]. Several studies have been done to testthese hypotheses, such as SKS splitting analysisalong the Gibraltar Arc [Buontempo et al., 2008;D�ıaz et al., 2010] and body wave dispersion analy-sis under Gibraltar [Bokelmann et al., 2011]. Therotation along the arc of the fast polarization direc-tion and the observed dispersion of the arrivalscoming from the east in the Gibraltar area suggestthat fast slab rollback is the best model to explainthe geodynamics of the Alboran region, ruling outany mantle lithosphere instability model.
[11] South of the Rif Mountains there are the Mid-dle and the High Atlas belts (Figure 1a) which arethe highest mountains in Morocco. This belt,formed on a Mesozoic rift that closed during theCenozoic Alpine orogeny [Jacobshagen et al.,1988; Laville et al., 2004], has a mean altitude of2000 m, reaches elevations higher than 4000 m,but has experienced relatively little (<25%) short-ening [Beauchamp et al., 1999; Teixell et al.,2003; Arboleya et al., 2004]. The average crustalthickness is 35 km on the Western High Atlas[Timoulali and Meghraoui, 2011]. Same thicknessis observed on the High and the Middle Atlas withno significant crustal root beneath the High Atlas[Ayarza et al., n.d. ; Schwarz and Wigger, 1988;Wigger et al., 1992]. The minor tectonic thicken-ing observed in this mountain belt cannot explainthe observed elevation, indicating that this belt isisostatically uncompensated by crustal thickness.Modeling studies using Bouguer gravity, geoidelevation, surface heat flow, and topography sug-gest a lithosphere thinned to <70 km depthbeneath the High Atlas in order to support theobserved elevation [Teixell et al., 2005; Zeyenet al., 2005; Missenard et al., 2006; Fullea et al.,2010; Jim�enez-Munt et al., 2011].
[12] Volcanic activity has been widespread in theAtlas. The oldest extrusives, found in the HighAtlas, are basalts associated with Mesozoic rifting.Paleogene to Quaternary alkaline basalts eruptedin the Middle Atlas and along the southern borderof the Western High Atlas. Middle and Late Mio-cene, Pliocene, and Quaternary volcanic units arealso found in the Alboran basin, Southern Iberia,and North Africa. The composition of these unitschanges in time and space from calc-alkaline insouthern Spain and the Alboran Sea during theMiocene, to alkali basalts in North Africa duringthe Pliocene and Quaternary [Duggen et al.,2004]. In the Iberian Massif of central Spain, Late
PALOMERAS ET AL. : RAYLEIGH WAVE VS MODEL IN WM 10.1002/2013GC004861
4

Miocene-Quaternary volcanics created the Cala-trava Volcanic Province (Ciudad Real), intraconti-nental volcanism that has been related toextensional tectonics [L�opez-Ruiz et al., 1993].
3. Data and Methodology
[13] The data used in this paper was recorded by228 stations belonging to different projects andinstitutions, including the US PICASSO projectand the Spanish TopoIberia project (http://iberar-ray.ictja.csic.es/) (Figure 1b). We have analyzed168 teleseismic events with magnitude greater
than 6.0 and epicentral distances from the studyarea between 30� and 120�, recorded betweenApril 2009 and 2011. The good azimuthal distribu-tion of events and the number and distribution ofstations provide a dense ray coverage (Figure 2a)allowing for good resolution of lateral fluctuationsin phase velocity measurements. We processed thevertical component of these seismograms to isolatethe Rayleigh wave signal. First, the seismogramswere corrected for instrument response and filteredwith Butterworth band-pass filters with 10 mHzbandwidth at 18 center periods (frequencies) from20 to 167 s (6.0–50.0 mHz). After rejecting traceswith a low signal-to-noise ratio, the surface waves
a)
-10° -9° -8° -7° -6° -5° -4° -3° -2° -1° 0°29°
30°
31°
32°
33°
34°
35°
36°
37°
38°
39°
40°
41°
Ray coverage T=50s
c)
2600 2800 3000 3200 3400 3600 3800 4000240022002000Time (sec)
2600 2800 3000 3200 3400 3600 3800 4000240022002000
20s
22s
25s
27s
30s
34s
40s
45s
50s
59s
67s
77s
87s
100s
111s
125s
143s
167s
X 1
0+2 XB.PM33 BHZ
AUG 16 (228), 201003:25:52.000-5
0
5b)
120
125
130
135
140
145
150
155
160
165
170
20 22 25 27 30 34 40 45 50 59 67 77 87 100 111 125 143 167
# Events
Period (s)
0
2000
4000
6000
8000
10000
12000
# Raypaths
# E
vent
s
# Raypaths
d)
Figure 2. (a) Azimuthal distribution of earthquakes (red dots) used in this study. The concentric circles arein 30� increments centered on the study area. (b) Example of fundamental model Rayleigh waveform. (top)Vertical component of the raw data of an earthquake on 16 August 2010 (magnitude 6.3; depth 9.8 km)recorded at station XB.PM33 (epicentral distance: 82.95�). Beneath it there are the 18 different filtered fre-quency bands. (c) Ray coverage (red lines) in the study area for 50 s period. Open triangles are the stationsused in this study. (d) Number of events and raypath used per period.
PALOMERAS ET AL. : RAYLEIGH WAVE VS MODEL IN WM 10.1002/2013GC004861
5
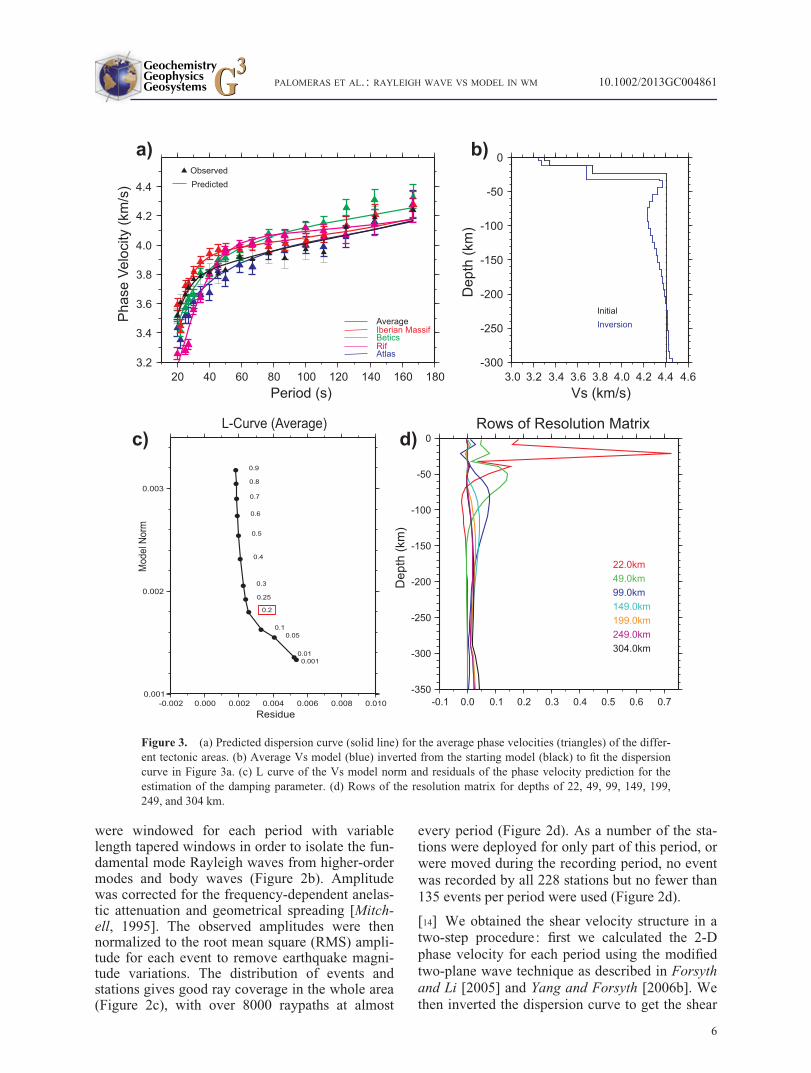
were windowed for each period with variablelength tapered windows in order to isolate the fun-damental mode Rayleigh waves from higher-ordermodes and body waves (Figure 2b). Amplitudewas corrected for the frequency-dependent anelas-tic attenuation and geometrical spreading [Mitch-ell, 1995]. The observed amplitudes were thennormalized to the root mean square (RMS) ampli-tude for each event to remove earthquake magni-tude variations. The distribution of events andstations gives good ray coverage in the whole area(Figure 2c), with over 8000 raypaths at almost
every period (Figure 2d). As a number of the sta-tions were deployed for only part of this period, orwere moved during the recording period, no eventwas recorded by all 228 stations but no fewer than135 events per period were used (Figure 2d).
[14] We obtained the shear velocity structure in atwo-step procedure: first we calculated the 2-Dphase velocity for each period using the modifiedtwo-plane wave technique as described in Forsythand Li [2005] and Yang and Forsyth [2006b]. Wethen inverted the dispersion curve to get the shear
0.001
0.002
0.003
Mod
el N
orm
-0.002 0.000 0.002 0.004 0.006 0.008 0.010Residue
L-Curve (Average)
0.0010.01
0.050.1
0.2
0.25
0.3
0.4
0.5
0.6
0.7
0.8
0.9
a)
-300
-250
-200
-150
-100
-50
0
Dep
th (k
m)
3.0 3.2 3.4 3.6 3.8 4.0 4.2 4.4 4.6Vs (km/s)
Initial Inversion
-350
-300
-250
-200
-150
-100
-50
0
Dep
th (k
m)
-0.1 0.0 0.1 0.2 0.3 0.4 0.5 0.6 0.7
Rows of Resolution Matrix
22.0km 49.0km 99.0km 149.0km 199.0km 249.0km 304.0km
b)
d)c)
3.2
3.4
3.6
3.8
4.0
4.2
4.4
Pha
se V
eloc
ity (k
m/s
)
20 40 60 80 100 120 140 160 180Period (s)
Observed Predicted
Average
AtlasRifBeticsIberian Massif
Figure 3. (a) Predicted dispersion curve (solid line) for the average phase velocities (triangles) of the differ-ent tectonic areas. (b) Average Vs model (blue) inverted from the starting model (black) to fit the dispersioncurve in Figure 3a. (c) L curve of the Vs model norm and residuals of the phase velocity prediction for theestimation of the damping parameter. (d) Rows of the resolution matrix for depths of 22, 49, 99, 149, 199,249, and 304 km.
PALOMERAS ET AL. : RAYLEIGH WAVE VS MODEL IN WM 10.1002/2013GC004861
6
velocities. This technique has been successfullyapplied to obtain the phase velocity and azimuthalstructures in other regions [e.g., Yang and Forsyth,2006a; Miller et al., 2009; Wagner et al., 2010;Liu et al., 2011]. The two-plane waves techniqueallows the use of complex waveforms associatedwith the multipathed arrival of energy and withRayleigh waves arriving off the great circle pathdue to scattering between the source and receiveroutside of the study area. For each period, theobserved waveforms are modeled as the sum oftwo distinct plane waves of unknown amplitude,initial phase, and propagation direction, with thesesix parameters describing the incoming primaryand scattered wavefield. The area is parameterizedby 841 nodes on an evenly distributed 0.5� 3 0.5�
grid exceeding the receiver-covered region by1.5�. These peripheral grid nodes have larger a pri-ori standard deviation to absorb traveltime resid-uals of the wave not well resolved by the two-plane waves representation. The amplitude andphase variations resulting from the interference ofthese two-plane waves are first inverted using asimulated annealing method to establish the bestfitting parameters for the two-plane waves. In asecond step, the six parameters at each grid nodeare calculated simultaneously in a generalized lin-ear inversion [Tarantola and Valette, 1982] todetermine 2-D phase velocities across the studyarea. In this step, both the phase delay and ampli-tude effects of local structure are calculated usingfinite-frequency kernels [Yang and Forsyth,2006b] to increase lateral resolution. In order tosmooth the sensitivity kernels, a Gaussianweighted function is used with a characteristiclength (L) of 65 km. This parameter controls thetrade-off between model resolution and model var-iance. In our inversion, we choose L 5 65 km fol-lowing Liu et al. [2011] because of similar stationspacing in both studies. To test the resolution oflateral phase velocity variations we generated syn-thetic Rayleigh wave data with the real data geom-etry from a checkerboard model (see supportinginformation1). The checkerboard pattern is wellrecovered in most of the investigated area coveredby the stations in almost all periods. Nonetheless,the pattern fades at longer periods.
[16] The resulting phase velocity dispersion curves(Figure 3a) are inverted using the nonlinear least
squares DISPER80 code [Saito, 1988] to obtain a1-D shear velocity-depth function at every pointon a uniform 0.25� grid. As an initial model forthe inversion, we used a single upper mantle layerwith Vs 5 4.4 km/s, and a three layer crust withVs chosen to be consistent with the Vp structuredetermined from active source experiment in theBetics, Atlas, and Iberian Massif (Figure 3b). Thedensity and the Vp/Vs ratio are kept fixed in eachlayer. The initial crustal thickness is constrainedby the results from [Fullea et al., 2010]. Theinversion was run with a suite of damping parame-ters, the overall best damping was 0.2 based on anL test comparing model energy versus RMS error(Figure 3c). The 3-D Vs model is the collection ofthe 1-D Vs-depth functions.
[17] To evaluate the resolution of the shear wavevelocity model, we examine the rows of the 1-Dreference model resolution matrix at differentlayers calculated from the inversion matrix (Figure3d). At shallow depths the peak of the rows of theresolution matrix are well localized in depth (e.g.,22 and 50 km). The peaks of the resolution matrixfor greater depths gradually become broader anddecrease in value, indicating that the number ofadjacent layers needed to recover one entire pieceof independent information of the model increaseswith depth. In our analysis, the pick can still berecognized at �250 km indicating that the shearvelocity model is well resolved to this depth.
4. Phase Velocity Maps
[18] The resulting phase velocity maps (Figure 4)show strong lateral variations at the shorter periods(�45 s) that correlate well with geological struc-tures. At periods less than 45 s, the lowest phasevelocities are found in the Gibraltar Strait and sur-rounding area, with variation from the meangreater than 10%. Low phase velocities are alsoobserved beneath the Betics and Rif at periodsbetween 20 to 30 s, indicating a thicker crust thanthe surrounding areas. Other areas with low phasevelocities at short periods (T< 40 s) are the Highand Middle Atlas but in these areas the low phasevelocities persist up to periods of 100 s, suggestiveof a thin lithosphere. Higher-phase velocities areobserved beneath the Iberian Massif, the AlboranSea, and Moroccan Meseta.
5. 3-D Shear Velocity Model
[19] The shear velocity model (Figure 5) showsrelatively rapid variations in shear velocity
1Additional supporting information may be found in the onlineversion of this article.
PALOMERAS ET AL. : RAYLEIGH WAVE VS MODEL IN WM 10.1002/2013GC004861
7

between the difference tectonic provinces to �150km depth, and significant differences between theAlboran Sea region and its surroundings persistingto 230 km. Although having 20 s as the shortestperiod in the inversion allows little control on theshallow to midcrustal velocities, we still observelarge differences in the bulk crustal shear velocitywhich vary laterally with geologic structures(Figure 5).
5.1. Iberian Massif
[20] The Iberian Massif has quite homogenouscrustal shear velocity (Figures 5 and 6a). Onaverage, the velocity is �3.6 km/s in the middle
and lower crust. Around 33 km depth velocityincreases to 4.3 km/s. No remarkable crustaldifferences are observed between the tectonicprovinces forming the Massif. In the uppermostmantle, velocity increases progressively withdepth up to �4.5 km/s at �70 km depth. At�80 km depth, velocity starts to decrease. Thispattern is observed in all of the Iberian Massifexcept in the Calatrava volcanic field, a smallarea at 4�W and 38.75�N (Figures 5, 6e, 7 andsection 3) where low shear velocities (�4.3 km/s) are observed as shallower as �65 km. Weinterpret these shallow low upper mantle veloc-ities as the source region of the late Miocene-late Pliocene volcanism.
30° 30°
32° 32°
34° 34°
36° 36°
38° 38°
40° 40°
T=77 s
-10°-10° -8° -6° -4° -2°
0°
0°
T=59 s
-10° -8° -6° -4° -2° 0°
30°
32°
34°
36°
38°
40°
T=45 s
T=20 s
-10° -8° -6° -4° -2° 0°
30°
32°
34°
36°
38°
40°
30°
32°
34°
36°
38°
40°
T=25 s
-10° -8° -6° -4° -2° 0°
-8°
40°
30°
32°
34°
36°
38°
40°
T=30 s
-10° -8° -6° -4° -2° 0°
-10° -8° -6° -4° -2° 0°
30° 30°
32° 32°
34° 34°
36° 36°
38° 38°
40° 40°
T=167 s
-10° -8° -6° -4° -2° 0°
34°
36°
38°
-10° -8° -6° -4° -2°
0°
0°
30°
32°
34°
36°
38°
40°
T=50 s
32°
-10° -8° -6° -4° -2° 0°
T=143 s
-10° -8° -6° -4° -2° 0°
30°
32°
34°
36°
38°
40°
-10° -8° -6° -4° -2° 0°
T=100 s
30°
-10° -8° -6° -4° -2° 0°
30°
32°
34°
36°
38°
40°
-10° -8° -6° -4° -2° 0°
30°
32°
34°
36°
38°
40°
T=87 s
-10° -8° -6° -4° -2° 0°
-6° -4° -2° 0°
30°
32°
34°
36°
38°
40°
T=40 s
-10° -8° -6° -4° -2° 0°
30°
32°
34°
36°
38°
40°
Phase velocity anomaly (%)-10 -8 -6 -4 -2 0 2 4 6 8 10
Figure 4. Rayleigh wave phase velocity anomaly maps. The plotted phase velocity anomaly is referred tothe average phase velocity at each period. Open triangles represent the stations used. Tectonic boundaries areshown as black lines.
PALOMERAS ET AL. : RAYLEIGH WAVE VS MODEL IN WM 10.1002/2013GC004861
8

Depth = 25 km-9° -8° -7° -6° -5° -4° -3° -2° -1° 0°
30°
31°
32°
33°
34°
35°
36°
37°
38°
39°
40°
3.0
3.2
3.4
3.6
3.8
4.0
4.2
4.4
Vs (km/s)
Depth = 35 km-9° -8° -7° -6° -5° -4° -3° -2° -1° 0°
30°
31°
32°
33°
34°
35°
36°
37°
38°
39°
40°
3.4
3.6
3.8
4.0
4.2
4.4
Vs (km/s)
3.8 4.0 4.2 4.4 4.6Vs (km/s)
-9° -8° -7° -6° -5° -4° -3° -2° -1° 0°
30°
31°
32°
33°
34°
35°
36°
37°
38°
39°
40°
Depth = 50 km Depth = 60 km
-9° -8° -7° -6° -5° -4° -3° -2° -1° 0°
30°
31°
32°
33°
34°
35°
36°
37°
38°
39°
40°
-9° -8° -7° -6° -5° -4° -3° -2° -1° 0°
30°
31°
32°
33°
34°
35°
36°
37°
38°
39°
40°
Depth = 65 km
Depth = 150 km-9° -8° -7° -6° -5° -4° -3° -2° -1° 0°
30°
31°
32°
33°
34°
35°
36°
37°
38°
39°
40°
-9° -8° -7° -6° -5° -4° -3° -2° -1° 0°
30°
31°
32°
33°
34°
35°
36°
37°
38°
39°
40°
Depth = 100 kmDepth = 75 km
-9° -8° -7° -6° -5° -4° -3° -2° -1° 0°
30°
31°
32°
33°
34°
35°
36°
37°
38°
39°
40°
Depth = 175 km-9° -8° -7° -6° -5° -4° -3° -2° -1° 0°
30°
31°
32°
33°
34°
35°
36°
37°
38°
39°
40°
Depth = 200 km-9° -8° -7° -6° -5° -4° -3° -2° -1° 0°
30°
31°
32°
33°
34°
35°
36°
37°
38°
39°
40°
Depth = 230 km-9° -8° -7° -6° -5° -4° -3° -2° -1° 0°
30°
31°
32°
33°
34°
35°
36°
37°
38°
39°
40°
Depth = 15 km-9° -8° -7° -6° -5° -4° -3° -2° -1° 0°
30°
31°
32°
33°
34°
35°
36°
37°
38°
39°
2.8
3.0
3.2
3.4
3.6
3.8
4.0
Vs (km/s)
EB IB
IRER
GB
RB
IM
HA
MA
ASAB
GCIW
Figure 5. Maps of absolute shear velocity at different depths. Gray triangle represents the Sierra NevadaMountains and the gray dot the Granada Basin. Tectonic boundaries are shown as black lines. (top) Differentcolor scale is used for each crustal depth. A common color scale is used for upper mantle depths.
PALOMERAS ET AL. : RAYLEIGH WAVE VS MODEL IN WM 10.1002/2013GC004861
9

5.2. Gibraltar Arc and Alboran Sea
[21] The Gibraltar Arc is built of the Betic and RifMountains. Even though they are part of the samemountain system with similar litho-tectonic units,the two ranges show different crustal shear veloc-ities (Figures 5 and 6). The middle and lowercrustal shear velocities obtained in the Rif areslightly lower than in the Betics. In the Betics at15 km depth the average velocity is 3.3 km/s whilein the Rif at the same depth is 3.2 km/s. In theBetics velocity increases to 3.8 km/s from 25 to33–35 km depth where velocity jumps to 4.2 km/s(Figure 6b). Velocity increases gradually to 4.4km/s at �80 km depth, then remains almost con-stant with depth. This pattern is observed through-out the internal Betics, with the notable exceptionof the Granada Basin and the Sierra NevadaMountains. There at 25 km depth the shear veloc-ity is 3.9 km/s increasing to 4.0 km/s at 35 km
depth, with the jump to velocities over 4.2 km/s at55 km depth (Figure 6b). Velocity then increaseswith depth to �4.6 km/s at �75 km, remainingalmost up to 100 km depth. There is a 4% velocityreversal centered at �150 km depth with velocitiesagain reaching 4.5 km/s at 250 km depth.
[22] In the Rif Mountains, similar pattern thanbeneath the Granada Basin is observed. From 25km depth, velocity increases with depth from 3.6to 4.1 km/s at 55 km (Figure 6c), the depth of theMoho estimated from recent seismic refractionmeasurements [Gallart et al., 2012]. From thisdepth, velocity increases rapidly to almost 4.6 km/s by �65 km depth. Below 95 km, velocitydecreases to 4.3 km/s at 150 km depth (Figure 6c).The same low velocity (3.6 km/s) is observed inthe Strait of Gibraltar, to �60 km depth, with anincrease to 4.4 km/s to �75 km depth where itincreases again to 4.6 km/s.
Iberian Massif
-250
-200
-150
-100
-50
0
Dep
th (k
m)
3.0
Vs (km/s)3.2 3.4 3.6 3.8 4.0 4.2 4.4 4.6
Moho
Morrocan Meseta
Moho
LAB LAB
-250
-200
-150
-100
-50
0
Dep
th (k
m)
West Alboran Sea
3.0
Vs (km/s)3.2 3.4 3.6 3.8 4.0 4.2 4.4 4.6
Moho
East Alboran Sea
Moho
Slab
Slab
a)
d)
Western Atlas -250
-200
-150
-100
-50
0
Dep
th (k
m)
Middle Atlas
3.0
Vs (km/s)3.2 3.4 3.6 3.8 4.0 4.2 4.4 4.6
Moho
Eastern Atlas
Moho LAB LAB
f)
LAB
Moho
Eastern RifEastern Betics
Calatrava
-250
-200
-150
-100
-50
0
Dep
th (k
m)
3.0
Vs (km/s)
East Moroccan Meseta
3.2 3.4 3.6 3.8 4.0 4.2 4.4 4.6
Moho LAB
e)
LABLAB LAB
VOLCANIC FIELDS
-250
-200
-150
-100
-50
0
Dep
th (k
m)
Rif
3.0
Vs (km/s)3.2 3.4 3.6 3.8 4.0 4.2 4.4 4.6
Moho
Slab
c)
-250
-200
-150
-100
-50
0
Dep
th (k
m)
3.0
Vs (km/s)3.2 3.4 3.6 3.8 4.0 4.2 4.4 4.6
Internal Betics
Moho
Slab
b)
Granada Basin
Moho
Slab
Figure 6. 1-D average shear velocity for the different regions of the area. Moho depth is represented by adashed line. The estimated LAB depth shown in Figure 10 and the high Vs interpreted as the western Mediter-ranean Slab are indicated.
PALOMERAS ET AL. : RAYLEIGH WAVE VS MODEL IN WM 10.1002/2013GC004861
10
[23] The upper mantle velocity structure of theeastern and western Alboran Sea is remarkablydifferent. In both, the Alboran Sea crustal veloc-ities are low (<3.2 km/s) to almost 20 km depth.In the east Alboran Sea, velocity sharply increasesto >4.1 km/s increasing steadily with depth to>4.5 km/s at 90 km depth (Figure 6d). In the west-ernmost Alboran Sea at �20 km depth, velocityincreases to �4.0 km/s, then reverses to �3.9 km/sat 40 km depth. It then rapidly increases withdepth to 4.6 km/s at 75 km and remains almostconstant with depth (Figure 6d).
5.3. Moroccan Meseta
[24] The shear velocity model for the MoroccanMeseta is similar to the one obtained for the Ibe-rian Massif (Figure 6a). On average at 15 kmdepth the velocity is 3.5 km/s. This velocityremains constant down to �32 km depth where itincreases steeply to 4.3 km/s. Then velocityincreases with depth to >4.4 km/s centered at 55–
75 km depth. A mild velocity reversal, to 4.3 km/s, is centered at 110–120 km depth. From herevelocity again increases with depth up to 4.4 km/sat 250 km depth. Between the Rharb Basin and theMiddle Atlas under the eastern Moroccan Meseta,mantle shear velocities are lower than in the over-all Moroccan Meseta (Figure 6e). Velocity isaround 4.1 km/s at 45 km depth and slightlyincreases to 4.2 km/s at 130 km depth. These lowvelocities appear beneath a middle Miocene-latePliocene basaltic volcanic field. The low uppermantle velocities are likely the source region forthese basalts.
5.4. Atlas Mountains
[25] The shear velocity model shows differencesbetween the High and Middle Atlas, and the west-ern Atlas (Figure 6f). At 15 km depth, shear veloc-ity beneath the High and Middle Atlas is �3.4 km/s (Figures 5 and 6) increasing to 3.7 km/s at �25km. In both, the Middle and High Atlas, the
-300
-250
-200
-150
-100
-50
0
010002000
010002000
(-5.5,40.) (-5.5,30.5)
31323334353637383940
Latitude (degree)
IM AtlasMMGB EREB Flysch
SG
Slab
1
LAB
LAB
010002000
010002000(-5.0,40.) (-5.0,30.5)
0
-300
-250
-200
-150
-100
-50
31323334353637383940
Latitude (degree)
IM HAMMIB EREB AS IR MA
Slab
2
LABLAB
-10000
10002000
-1000010002000(-4.0,40.) (-4.0,31.5)
-300
-250
-200
-150
-100
-50
0
323334353637383940
Latitude (degree)
IM HAMMEREB ASIB
Slab
Calatrava Volcanic
Field
3
LAB LAB
-300
-250
-200
-150
-100
-50
0
-10000
10002000
-1000010002000
(-2.35,40.0) (-6.75,30.0)
IM EB AtlasIB AS IR ER
Slab
5
LAB LAB
-10000
1000
-100001000
(-3.5,40.) (-3.5,32.5)
-50
0
3334353637383940
Latitude (degree)
IM EB ERIB AS
Slab
-300
-250
-200
-150
-100
4
LAB LAB
Depth = 75 km-9° -8° -7° -6° -5° -4° -3° -2° -1° 0°
30°
31°
32°
33°
34°
35°
36°
37°
38°
39°
40° 21 3 4 5
3.9Vs (km/s)
4.0 4.1 4.2 4.3 4.4 4.5 4.6
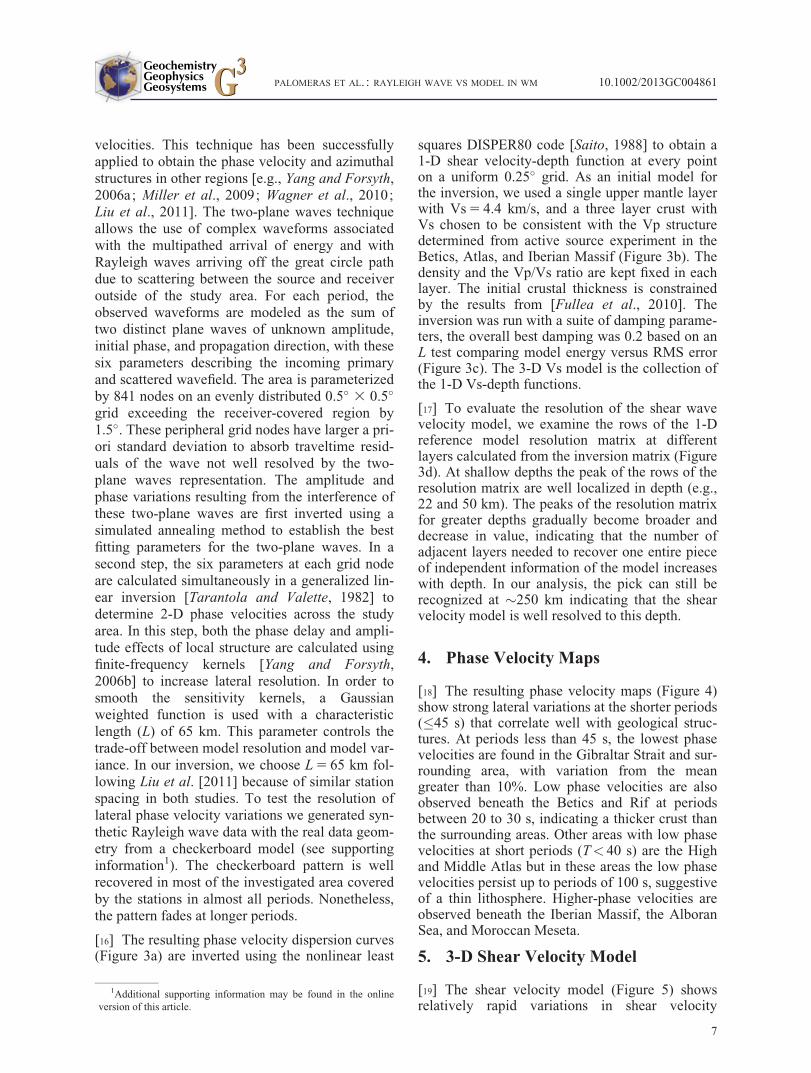
Figure 7. NS absolute Vs cross sections crossing the Iberian Massif, the Gibraltar Arc, and the Atlas Moun-tains indicated on the velocity map at 75 km depth. The crustal velocity is set to a constant 3.9 km/s toenhance mantle anomalies. Tectonic provinces are indicated (IM: Iberian Massif; EB: External Betics; IB:Internal Betics; AS: Alboran Sea; ER: External Rif; IR: Internal Rif; MM: Moroccan Meseta; MA: MiddleAtlas; HA: High Atlas; GC: Gulf of Cadiz; SG: Strait of Gibraltar). Black cones represent the position ofCenozoic volcanic eruptions. White dots show the depth of the estimated LAB (see text and Figure 10). Blackdashed ellipses indicate where the western Mediterranean Slab is still attached to the lower crust.
PALOMERAS ET AL. : RAYLEIGH WAVE VS MODEL IN WM 10.1002/2013GC004861
11

velocity of the mantle just below the Moho (�35km depth) increases to �4.3 km/s, forming a thinmantle lid to about 45 km depth where velocityreverses, decreasing to �4.1 km/s. Beneath thelow-velocity zone, the velocity gradually increaseswith depth being >4.4 km/s at �250 km depth.
[26] Slightly lower velocities are observed in thecrust of the western Atlas at 15 km depth (3.3 km/s) than in the High Atlas. Then velocity increasesfrom 3.3 km/s at 25 km depth to �4.3 km/s at �35km depth. From here velocity increases to almost4.5 km/s at 65 km depth. There is a >3%decreases in velocity centered at 140 km depth.
5.5. LAB Depth Estimation
[27] The LAB is usually a second-order disconti-nuity that separates the conductive, rigid, dry, andchemically depleted lithosphere from the convec-tive, mechanically weak, often hydrated, fertile,and possibly partially molten asthenosphere[Fischer et al., 2010]. In seismology the LAB isusually associated with a shear velocity reversalbelow the upper mantle lid. We have estimated the
LAB depth as the depth of the maximum negativeshear velocity gradient lying below the fast lid.We calculated the vertical Vs gradient from thevelocity model and mapped the maximum nega-tive gradient as the LAB (Figures 6–10).
[28] The resulting map (Figure 10) shows stronglateral changes in LAB topography, with depths asshallow as �40 km to deeper than 110 km. In gen-eral, our LAB map presents shallower estimates ofthe LAB depth than previous estimates made fromgeopotential field modeling [Fern�andez et al.,2004; Teixell et al., 2005; Zeyen et al., 2005; Mis-senard et al., 2006; Fullea et al., 2010; Palomeraset al., 2011]. Our results place the lithosphere-asthenosphere boundary beneath the Iberian Mas-sif at �85 km depth, shallowing to �50 km towardthe northeast. A similar LAB depth is obtainedbeneath the eastern External Betics. Beneath thewesternmost Alboran Domain where the westernMediterranean high velocity anomaly starts itsdescent from the crust to the transition zone, thereis no LAB in the sense defined above. We wouldnot identify the lithosphere as being 6001 kmdeep, but instead note that seismology does not
3.9Vs (km/s)
4.0 4.1 4.2 4.3 4.4 4.5 4.6
GC IBGB EB0
-2000-1000
010002000
-2000-1000010002000(-9.5,37.0) (0.0,37.0)
-300
-250
-200
-150
-100
-50
-9 -8 -7 -6 -5 -4 -3 -2 -1 0
Longitude (degree)
Slab
1-300
-250
-200
-150
-100
-50
0
-9 -8 -7 -6 -5 -4 -3 -2 -1 0
Longitude (degree)
Slab
-4000-3000-2000-1000
0
-4000-3000-2000-10000(-9.5,36.0) (0.0,36.0)
GC SG ASTASZ
2
-300
-250
-200
-150
-100
-50
0
-9 -8 -7 -6 -5 -4 -3 -2 -1 0
Longitude (degree)
Slab
-4000-3000-2000-1000
01000
-4000-3000-2000-100001000(-9.5,35.0) (0.0,35.0)
Atlantic OceanTASZ
ER
3
LABLAB
LAB
LAB
LABLAB
Depth = 75 km-9° -8° -7° -6° -5° -4° -3° -2° -1° 0°
30°
31°
32°
33°
34°
35°
36°
37°
38°
39°
40°
123
Figure 8. EW absolute Vs cross sections along the Gibraltar Arc indicated on velocity map at 75 km depthmap. Velocities less than 3.9 km/s are set to a constant 3.9 km/s to enhance mantle anomalies. Tectonic prov-inces are indicated (EB: External Betics; IB: Internal Betics; AS: Alboran Sea; ER: External Rif; GC: Gulfof Cadiz; SG: Strait of Gibraltar). Black arrow indicates where the sections cross the Trans Alboran ShearZone (TASZ). Black cones represent the position of Cenozoic volcanics. White dots indicate the depth of theestimated LAB (see text and Figure 10). Black dashed ellipses indicate where the slab is attached to the lowercrust.
PALOMERAS ET AL. : RAYLEIGH WAVE VS MODEL IN WM 10.1002/2013GC004861
12

provide a useful observation for estimating litho-sphere depth at the location of pronounced litho-spheric downwellings.
[29] A shallow LAB is also mapped beneath theeastern Moroccan Meseta, and parts of the Middleand High Atlas, with the lithosphere in placesbeing only 45–50 km thick. The LAB deepens to85–90 km under the western Atlas and the westernMoroccan Meseta. It is worth noting that under theintraplate Cenozoic Calatrava volcanic field theestimated depth of the LAB is as shallow as 60km, and beneath the Cenozoic volcanic fields inMorocco it is at 45–50 km. The estimate of theLAB depth in the western Mediterranean is animportant constraint to the geodynamic evolutionof the region.
6. Discussion
[30] Shear velocity models have been previouslyobtained for the crust and upper mantle of Europe
and the Mediterranean region by body wavetomography [e.g., Schmid et al., 2008], surfacewave tomography [e.g., Peter et al., 2008; Boschiet al., 2009; Schivardi and Morelli, 2009], adjointinversion applied to surface waves, and body wavedata [Legendre et al., 2012; Zhu et al., 2012] aswell as surface waves and gravity data [Tondiet al., 2012]. As these models cover large areasand use relatively widely spaced seismograph sta-tions, they have low lateral resolution. In contrast,the relatively dense broadband array (Dx� 60 km)available in this study and the finite-frequency ker-nels used for estimating phase velocities provide alaterally well-resolved model.
6.1. Western Mediterranean High VelocityAnomaly Beneath the Alboran Domain
[31] As described above, a number of differentscenarios have been proposed to explain the evolu-tion of the Mediterranean basin and in particularthe western Mediterranean. Some models arebased on slab rollback [Lonergan and White,
C’C
-300
-250
-200
-150
-100
-50
0
10002000
10002000
(-9.5,30.5) (-2.0,33.5)
B’B0
-300
-250
-200
-150
-100
-50
100020003000
100020003000
(-7.0,31.0) (-3.0,34.5)
10002000
10002000(-5.45,35.91) (-3.97,31.0)
A A’
-300
-250
-200
-150
-100
-50
0
LABLAB
LAB
Depth = 75 km-9° -8° -7° -6° -5° -4° -3° -2° -1° 0°
30°
31°
32°
33°
34°
35°
36°
37°
38°
39°
40°
A
A’B
B’C’
C
3.9Vs (km/s)
4.0 4.1 4.2 4.3 4.4 4.5 4.6
Figure 9. Cross sections through the Atlas Mountains indicated on the Vs map at 75 km depth. The crustalvelocities less than 3.9 km/s are is to a constant 3.9 km/s for display. Horizontal segments represent the tec-tonic zones (ER: External Rif; MM: Moroccan Meseta; MA: Middle Atlas; HA: High Atlas). Black conesrepresent the position of Cenozoic volcanics. White dots indicate the depth of the estimated LAB (see textand Figure 10).
PALOMERAS ET AL. : RAYLEIGH WAVE VS MODEL IN WM 10.1002/2013GC004861
13

1997; Gutscher et al., 2002; Rosenbaum et al.,2002] and others on mantle lithospheric instability[Platt and Vissers, 1989; Seber et al., 1996a; Cal-vert et al., 2000]. P wave tomography studiesshow a high velocity east dipping anomalybeneath the Alboran Sea [Gutscher et al., 2002;Spakman and Wortel, 2004; Bezada et al., 2013],extending from shallow depths to the transitionzone. This anomaly is interpreted as the subduct-ing westernmost Mediterranean oceanic litho-sphere. SKS splitting [D�ıaz et al., 2010] anddispersion of body waves measurements [Bokel-mann and Maufroy, 2007; Bokelmann et al., 2011]support the subduction rollback model. Our resultsalso show high velocities (�4.6 km/s) beneath theRif from �65 to �110 km depth dipping to thenorth (Figures 7 and 11) and from this depth dip-ping to the east (Figures 8 and 11). A smallerhigh-velocity area is also mapped beneath theGranada Basin, at 4�W and 37�N, dipping south
from �70 km depth. At �110 km depth, bothhigh-velocity areas merge into a larger anomalythat extends beneath the Rif, western Alboran Seaand internal Betics (Figures 5 and 11). Recent Pwave tomography [Bezada et al., 2013] also showstwo branches of the slab in the upper most mantlewith essentially the same geometry described.This high-velocity body descends almost verticallyto depths greater than 250 km in the surface waveimage. Combined with the P wave tomographyimage [Bezada et al., 2013] the feature can beseen to Transition Zone depths beneath theAlboran Sea. We interpret this high-velocity con-tinuous body as the slab of the Tethys’ oceaniclithosphere subducted beneath Eurasia.
[32] In contrast to this high-velocity feature cen-tered under the Gibraltar Arc and western AlboranSea, low upper mantle shear velocities are mappedboth surrounding it and overlying much of itbeneath the Alboran Sea. Low velocities in theupper mantle are typically interpreted as resultingfrom higher temperatures, possible partial melt ororiented seismic anisotropy, or any combination ofthese factors. The average heat flow in the AlboranSea increases from west to east from values of�69 to �124 mWm22 [Polyak et al., 1996], indic-ative of high temperatures in the eastern Alboranwhere continental crust has been thinned to lessthan 20 km. The presence of Miocene magmatismon the Alboran seafloor indicates the presence ofpartial melt. Geochemical studies of Alboran Mio-cene volcanics suggest they are due to back-arcextension associated with slab rollback [Duggenet al., 2004; Gill et al., 2004]. This suggests thatthe low velocities beneath the Alboran Sea arerelated to the induced corner flow in the astheno-spheric mantle wedge produced above the slab.
6.2. Attached Slab and LithosphereRemoval
[33] One important question that bears on evolu-tionary models of the Gibraltar Arc orogeny iswhether or not the slab currently forms part of anactive subduction zone. Body wave tomographydoes not have resolution at depths shallower than150–200 km therefore it cannot resolve whetherthe slab is attached or not [e.g., Calvert et al.,2000]. The shear velocity model shows low veloc-ities (�3.8 km/s) in the Gibraltar Strait and vicin-ity (Figures 5, 7, and 8), down to �55 km depth,overlying the high mantle velocities that we inter-pret as the slab. Velocities of 3.8 km/s are typicalof crustal lithologies, despite there being no
30 40 50 60 70 80 90 100 110 120 130
Depth (km)
LAB depth
-9°
351°
-8°
352°
-7°
353°
-6°
354°
-5°
355°
-4°
356°
-3°
357°
-2°
358°
-1°
359°
0°
0°
30° 30°
31° 31°
32° 32°
33° 33°
34° 34°
35° 35°
36° 36°
37° 37°
38° 38°
39° 39°
40° 40°
Volcanic fields
EB IB
IRER
GB
RB
IM
HA
MA
ASGCIW
Figure 10. LAB depth estimates calculated from the great-est negative vertical velocity gradient (see text). Gray areaindicates the limits of high velocities (>4.5 km/s) at 100 kmdepth. Black triangles are the position of the volcanics fields.
PALOMERAS ET AL. : RAYLEIGH WAVE VS MODEL IN WM 10.1002/2013GC004861
14
topographic suggestion of such a thick crust. Thebase of these low velocities have been mapped asthe Moho from PmP reflections in a recent wide-angle experiment in the Rif [Gallart et al., 2012],and correspond to a strong positive arrival in Psreceiver functions [Mancilla et al., 2012; Thurneret al., in press]. As the base of the mapped lowcrustal velocities is coincident with the top of thehigh velocities, we propose that the slab is locallyattached to the crust of the Alboran Domainbeneath the Rif. The observed thick crust could bethe consequence of the sinking slab depressing thecontinental crust in this region. We note that arecent study of Global Positioning System (GPS)velocities in the southern Iberia and northernMorocco conclude that the slab must still beattached to the base of the Rif in this same area[Perouse et al., 2010; Vernant et al., 2010].
[34] Beneath the Betics at �4�W and 37�N (Fig-ures 7 and 8) crustal velocities are also observed
down to >50 km depth. At this location a secondbranch of high velocities emanating from the mainbody is observed at depths as shallow as 65–70km. This is either still attached to the crust, is cur-rently detaching from the crust, or has recentlyseparated from the bottom of the crust. We alsonote that the shallow to intermediate depth seis-micity under the Betics is found near the top ofthis feature (Figure 5), presenting the intriguingpossibility that the slab is in the process of detach-ing. The seismicity and the uplift of the SierraNevada, as opposed to the relatively modest eleva-tions in the Rif, cause us to favor the latter twohypotheses, that the slab is either still detaching orhas recently detached.
[35] Beneath the Strait of Gibraltar, we observealso a thick crust (>55 km), but here the top of thehigh velocities appears �15 km deeper than thebottom of the crust. Therefore, we conclude thatthe slab was attached in the recent past, pulling
3469
-2000
0
2000
Elev (m)
-5257
-4000
4.2
4.6
4
3.9
4.4Vs
High velocity body
High velocity body
Low velocity
Thickenedcrust IB
ERIA
AFRICA
IBERIA
AFRICA
IBERIA
AFRICA
IBERIAAFRICA
Atlas Rif
Betics
Rif GranadaBasin
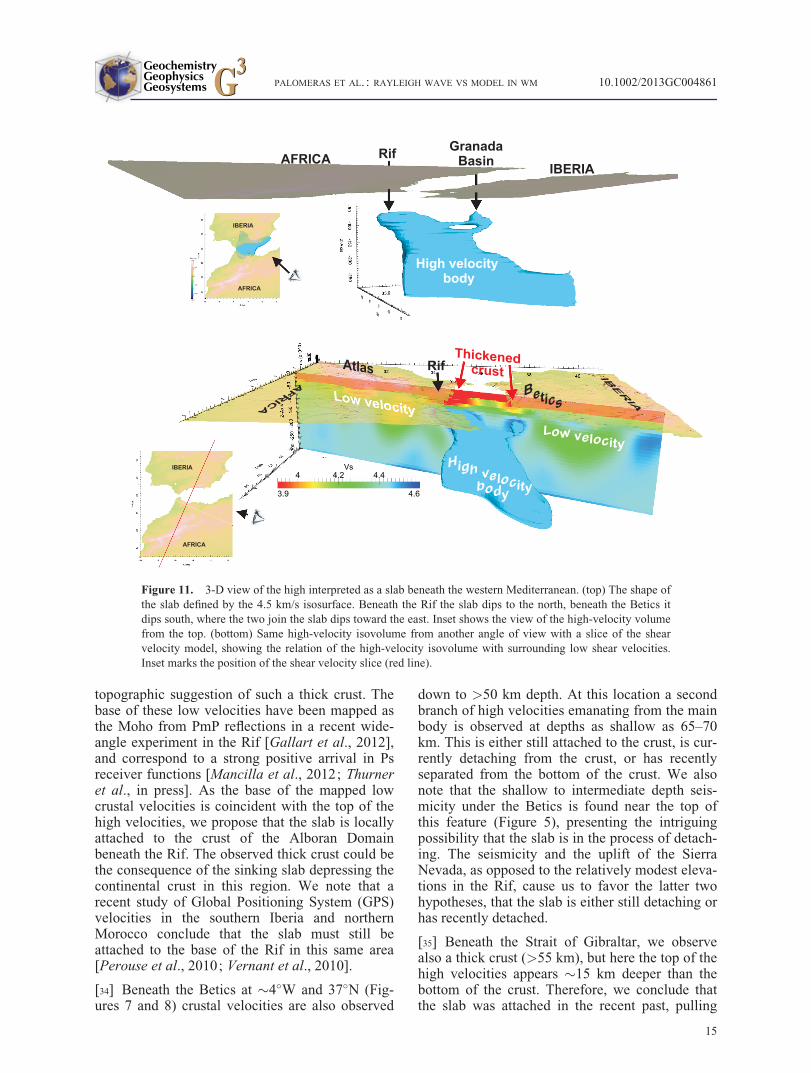
Figure 11. 3-D view of the high interpreted as a slab beneath the western Mediterranean. (top) The shape ofthe slab defined by the 4.5 km/s isosurface. Beneath the Rif the slab dips to the north, beneath the Betics itdips south, where the two join the slab dips toward the east. Inset shows the view of the high-velocity volumefrom the top. (bottom) Same high-velocity isovolume from another angle of view with a slice of the shearvelocity model, showing the relation of the high-velocity isovolume with surrounding low shear velocities.Inset marks the position of the shear velocity slice (red line).
PALOMERAS ET AL. : RAYLEIGH WAVE VS MODEL IN WM 10.1002/2013GC004861
15

down the crust in the same way that it is doing atpresent in the Rif.
[36] The geodynamic model that we propose forthe western Mediterranean based on the shearvelocity model is summarized in Figure 12. To usthe observations that the descending slab is stillattached to the crust beneath the Rif, and wasrecently attached to the crust of the Betics beneaththe Granada Basin suggest a more complex sub-duction scenario than simple slab rollback.Gutscher et al. [2012] proposed a similar scenariowhere the slab detachment began �5 Ma. In addi-tion to including the mantle formerly beneath theAlboran Domain and any oceanic lithosphere lyingbetween the Alboran Domain and the currentGibraltar Arc, the slab is also removing the litho-spheric mantle of the continental margins beneathboth Iberia and Morocco. This lithosphericremoval is associated with thickening of the crustup to 55 km depth in the places where the slab isstill attached (Rif) or recently detached (SierraNevada and Strait of Gibraltar). The lithosphericremoval appears to control the development oftopography along both continental margins, asseen in the recent rapid uplift of the Sierra Nevadaas well as the active extension in the GranadaBasin. We also think, as other authors have pro-posed [e.g., Duggen et al., 2005; Bezada et al.,2013], that the slab has removed the lithospherefrom beneath the Alboran Sea during rollback.The lithosphere has subsequently been replaced byasthenospheric material as is inferred by the low
shear velocities observed. The shear velocitymodel also correlates well with the evolution ofthe magmas in the Betics and Rif that evolve fromarc volcanism during the Middle to Late Miocene,to alkaline volcanism during Late Miocene toQuaternary [Duggen et al., 2004].
6.3. The Atlas
[37] Beneath the eastern High and Middle Atlaswe observe low shear velocities in the upper man-tle (Figures 7 and 9) with the LAB at very shallowdepths (�50 km), in contrast to the western Atlas,where the LAB is �80 km (Figure 10). These shal-low low velocities lie in a corridor between 6�Wand 5�W and extend to the north into the easternMoroccan Meseta, beneath Cenozoic volcanicfields (Figures 1, 7, and 9). Shear velocities are aslow as 4.0 km/s at 60 km depth and 4.2 km/s at140 km depth. Regional P wave tomography bySeber et al. [1996b] also indicates low velocitiesin the upper most mantle in this area. Several stud-ies modeling geopotential fields and heat flow sug-gest a thin lithosphere beneath the Middle andHigh Atlas [Zeyen et al., 2005; Missenard et al.,2006; Fullea et al., 2010] to explain the relativelylow Bouguer gravity anomaly (2120 mGal) and ahigh geoid anomaly (16 m) in this mountain range.This interpretation is consistent with our results,suggesting that at least part of the Middle andHigh Atlas is underlain by an asthenosphere atshallow (�50 km) depths (Figure 10) with mantlebuoyancy helping to support the topography notrelated to shortening.
6.4. Cenozoic volcanism
[38] Cenozoic volcanism occurred across thisregion. The geochemical composition of these vol-canic rocks appears to be related to subduction inthe Alboran Sea [e.g., Gill et al., 2004] and to Si-poor intraplate magmatism in SW-Iberia [e.g.,Cebri�a and L�opez-Ruiz, 1995] and Morocco [e.g.,Duggen et al., 2005]. Pronounced low shear veloc-ities in the upper mantle are well correlated withmany of the intraplate basaltic volcanic fields. Inthese regions shear velocities decrease by morethan 7% relative to the surrounding mantle. Thisreduction in Vs could be caused by a 1% melt frac-tion according to Hammond and Humphreys[2000] or by a 2% melt fraction according to Takei[2000]. This reduction in Vs could also be causedby an increase in temperature of 300–400�K[Karato, 1993; Cammarano et al., 2003].
0100200300400500600
0100200300400500600
Figure 12. Simplified 3-D geometry of the western Mediter-ranean high-velocity slab based on the surface wave tomogra-phy study, modified from Perouse et al. [2010]. In the model,the sinking slab is still attached to the crust beneath the RifMountains (red dashed ellipse) and is currently detachingbeneath the Granada Basin (blue dashed ellipse), removingthe continental lithospheric mantle under southern Spain(C.L., brown domain); O.L.: oceanic lithosphere (whitedomain). Black arrow is the pull of the oceanic part of theslab (O.L.) at depth.
PALOMERAS ET AL. : RAYLEIGH WAVE VS MODEL IN WM 10.1002/2013GC004861
16

Consequently, we believe that the low velocitiesindicate the presence of high temperatures and/orpartial melt that was the source for some of thesemagmas.
[39] Back-arc magmatism is concentrated in theAlboran Domain. Uppermost mantle velocities inthis region are also low (4.2 km/s) above �70 kmdepth, above a rapid increase that marks the top of
Attached Lithosphere
Sinking Lithosphere
Thin Lithosphere
“Normal” Lithosphere
Boundary of well resolved lithosphere thickness
Lithospheric Structure
-9°
351°
-8°
352°
-7°
353°
-6°
354°
-5°
355°
-4°
356°
-3°
357°
-2°
358°
-1°
359°
0°
0°
30° 30°
31° 31°
32° 32°
33° 33°
34° 34°
35° 35°
36° 36°
37° 37°
38° 38°
39° 39°
40° 40°
Thickened crust
Volcanic fieldsSierra NevadaGranada Basin
Figure 13. Lithospheric structure for the western Mediterranean inferred from this surface wave tomogra-phy study.
PALOMERAS ET AL. : RAYLEIGH WAVE VS MODEL IN WM 10.1002/2013GC004861
17
the slab. We attribute these low velocities abovethe slab as asthenospheric flow produced in themantle wedge during slab retreat.
[40] Beneath the Neogene Calatrava volcanic field(Spain) the overall average Iberian LAB (�85 kmdepth) shallows to �65 km depth (Figure 10) withvelocities we identify as asthenosphere (4.2 km/s)at �70 km depth, shallower than elsewhere underthe Iberian Massif (Figure 7). This shallow lowvelocity may be the remnant source of the magma-tism, since geochemical studies suggest it meltedat depths shallower than 100 km [Humphreyset al., 2010].
[41] In the Atlas and Moroccan Meseta we alsoobserved low (4.1 km/s) uppermost mantle veloc-ities beneath relatively large Miocene basalt flows(Figures 7 and 9). In this area the low velocitiesare seen throughout the whole mantle beneath theMoho. The estimated LAB depth is as shallow as45 km beneath these volcanics.
7. Conclusions
[42] The finite-frequency Rayleigh wave tomogra-phy results, obtained from dense station coverage(�240 stations from a variety of different perma-nent and temporary networks) provides a detailed3-D shear velocity model for the western Mediter-ranean to �250 km depth. The model shows dra-matic vertical and lateral velocity differences thatwe can relate to outcrop geology at shallowdepths, and to larger, mantle-scale geodynamicfeatures at greater depths.
[43] We have observed significant differences inthe lithospheric structure of the Iberian Massif, theAlboran Domain, and Atlas Mountains that aresummarized in Figure 13. The most important fea-ture is the high-velocity (>4.5 km/s) western Med-iterranean slab extending from �75 km depthbeneath the Alboran Domain, which is stillattached to the crust under the Rif Mountains tothe south and is still attached or has recentlydetached from the Betic Mountains to the northand northeast (Figures 11 and 12). Evidence forthis are the low velocities (<3.8 km/s) mappeddown to 60 km depth beneath the Rif, just abovethe high shear velocity slab anomaly, supported byevidence from dense regional Ps receiver functions[Thurner et al., in press], refraction/wide-angleseismology in the Rif [Gallart et al., 2012], andrecent interpretations of geodetic data [Perouseet al., 2010]. We suggest that the slab that has
rolled back beneath the Alboran Domain alsoremoves some or all of the continental marginmantle lithosphere from the adjacent continents asit descends into the mantle, controlling topographyalong both the Iberian and Moroccan continentalmargins (Figure 12).
[44] The velocity model has unusually low uppermantle shear velocities directly beneath the Atlas,giving rise to a very shallow LAB. A low-densityupper mantle provides support for the high eleva-tions of the Atlas. We also have identified rela-tively shallow low upper mantle shear velocitiesas the sources of different types of Cenozoic vol-canism under this region.
Acknowledgments
[45] This research was funded by the U.S. National ScienceFoundation EAR-0808939. The deployment of the IberArraybroadband seismic network is part of the CONSOLIDERCSD2006-00041 (Geosciences in Iberia: Integrated studies onTopography and 4-D Evolution) grant from the Spanish Min-istry of Science and Innovation. Additional funding was pro-vided by the Spanish ministry under grants CGL2010-17280and by Generalitat de Catalunya under grant 2009 SGR 6. Wethank the IRIS data management center, the Instituto Geogra-fico Nacional (Spain), the Instituto de Meteorologia (Portu-gal), the Centro de Geofisica da Universidade de Lisboa(Portugal), the Universidad Complutense de Madrid (Spain),and the University of Muenster (Germany) for contributingdata to this study. Thanks to the Seismology and Tectonics atRice (STAR) group for valuable discussions.
References
Arboleya, M. L., A. Teixell, M. Charroud, and M. Julivert(2004), A structural transect through the High and MiddleAtlas of Morocco, J. Afr. Earth Sci., 39(3–5), 319–327, doi:10.1016/j.jafrearsci.2004.07.036.
Ayarza, P., et al. submitted, Crustal thickness and velocitystructure across the Moroccan Atlas from long offset wide-angle reflection seismic data: The SIMA experiment, Geo-chem. Geophys. Geosyst.
Beauchamp, W., R. W. Allmendinger, M. Barazangi, A.Demnati, M. El Alji, and M. Dahmani (1999), Inversion tec-tonics and the evolution of the High Atlas Mountains,Morocco, based on a geological-geophysical transect, Tec-tonics, 18(2), 163–184.
Bezada, M. J., E. D. Humphreys, D. R. Toomey, M. Harnafi,and J. M. Davila (2013), Evidence for slab rollback in west-ernmost Mediterranean from improved upper mantle imag-ing, Earth Planet. Sci. Lett., 368, 51–60.
Blanco, M. J., and W. Spakman (1993), The P-wave velocitystructure of the mantle below the Iberian Peninsula: Evi-dence for subducted lithosphere below southern Spain, Tec-tonophysics, 221, 13–34.
Bokelmann, G., and E. Maufroy (2007), Mantle structureunder Gibraltar constrained by dispersion of body waves,
PALOMERAS ET AL. : RAYLEIGH WAVE VS MODEL IN WM 10.1002/2013GC004861
18

Geophys. Res. Lett., 34, L22305, doi:10.1029/2007GL030964.
Bokelmann, G., E. Maufroy, L. Buontempo, J. Morales, andG. Barruol (2011), Testing oceanic subduction and convec-tive removal models for the Gibraltar arc: Seismologicalconstraints from dispersion and anisotropy, Tectonophysics,502(1–2), 28–37, doi :10.1016/j.tecto.2010.08.004.
Boschi, L., B. Fry, G. Ekström, and D. Giardini (2009), TheEuropean upper mantle as seen by surface waves, Surv. Geo-phys., 30(4–5), 463–501, doi:10.1007/s10712-009-9066-2.
Buforn, E., A. Udias, and R. Madariaga (1991), Intermediateand deep earthquakes in Spain, Pure Appl. Geophys., 136(4),375–393.
Buontempo, L., G. H. R. Bokelmann, G. Barruol, and J.Morales (2008), Seismic anisotropy beneath southern Iberiafrom SKS splitting, Earth Planet. Sci. Lett., 273(3–4), 237–250, doi:10.1016/j.epsl.2008.06.024.
Calvert, A., E. Sandvol, D. Seber, M. Barazangi, S. Roecker,T. Mourabit, F. Vidal, G. Alguacil, and N. Jabour (2000),Geodynamic evolution of the lithosphere and upper mantlebeneath the Alboran region of the western Mediterranean:Constraints from travel time tomography, J. Geophys. Res.,105(B5), 10,871–10,898.
Cammarano, F., S. Goes, P. Vacher, and D. Giardini (2003),Inferring upper-mantle temperatures from seismic velocities,Phys. Earth Planet. Inter., 138(3–4), 197–222, doi:10.1016/S0031-9201(03)00156-0.
Carbonell, R., V. Sallares, J. Pous, J. J. Danobeitia, P. Queralt,J. J. Ledo, and V. Garcia Duenas (1998), A multidisciplinarygeophysical study in the Betic chain (southern Iberian Penin-sula), Tectonophysics, 288(l), 137–152.
Cebri�a, J.-M., and J. L�opez-Ruiz (1995), Alkali basalts andleucitites in an extensional intracontinental plate setting:The late Cenozoic Calatrava Volcanic Province (centralSpain), Lithos, 35(1–2), 27–46, doi:10.1016/0024-4937(94)00027-Y.
D�ıaz, J., and J. Gallart (2009), Crustal structure beneath theIberian Peninsula and surrounding waters: A new compila-tion of deep seismic sounding results, Phys. Earth Planet.Inter., 173(1–2), 181–190, doi:10.1016/j.pepi.2008.11.008.
D�ıaz, J., A. Villase~nor, J. Gallart, J. Morales, A. Pazos, D.Cordoba, J. A. Pulgar, J. L. Garc�ıa Lob�on, M. Harnafi, andT. S. W. Group (2009), The IBERARRAY broadband seis-mic network: A new tool to investigate the deep structurebeneath Iberia, Orfeus Newsl., 8(2), 1–6.
D�ıaz, J., J. Gallart, A. Villase~nor, F. de L. Mancilla, A. Pazos,D. C�ordoba, J. A. Pulgar, P. Ibarra, and M. Harnafi (2010),Mantle dynamics beneath the Gibraltar Arc (western Medi-terranean) from shear-wave splitting measurements on adense seismic array, Geophys. Res. Lett., 37, L18304, doi:10.1029/2010GL044201.
Duggen, S., K. Hoernle, P. van den Bogaard, and C. Harris(2004), Magmatic evolution of the Alboran region: The roleof subduction in forming the western Mediterranean and caus-ing the Messinian Salinity Crisis, Earth Planet. Sci. Lett.,218(1–2), 91–108, doi:10.1016/S0012-821X(03)006 32-0.
Duggen, S., K. Hoernle, P. van den Bogaard, and D. Garbe-Schonberg (2005), Post-collisional transition from subduc-tion- to intraplate-type magmatism in the westernmost Medi-terranean: Evidence for continental-edge delamination ofsubcontinental lithosphere, J. Petrol., 46(6), 1155–1201,doi:10.1093/petrology/egi013.
Durand, B., L. Jolivet, F. Horvath, and M. Seranne (Eds.)(1999), The Mediterranean Basins: Tertiary Extensionwithin the Alpine Orogen, Geol. Soc., London.
Faccenna, C., C. Piromallo, A. Crespo-Blanc, L. Jolivet, andF. Rossetti (2004), Lateral slab deformation and the origin ofthe western Mediterranean arcs, Tectonics, 23, TC1012, doi:10.1029/2002TC001488.
Fern�andez, M., I. Marz�an, and M. Torne (2004), Lithospherictransition from the Variscan Iberian Massif to the Jurassicoceanic crust of the Central Atlantic, Tectonophysics,386(1–2), 97–115, doi:10.1016/j.tecto.2004.05.005.
Fischer, K. M., H. A. Ford, D. L. Abt, and C. A. Rychert(2010), The lithosphere-asthenosphere boundary, Ann. Rev.Earth Planet. Sci., 38(1), 551–575, doi:10.1146/annurev-earth-040809-152438.
Forsyth, D. W., and A. Li (2005), Array-analysis of two-dimensional variations in surface wave phase velocity andazimuthal anisotropy in the presence of multipathing inter-ference, in Seismic Earth: Array Analysis of BroadbandSeismograms, edited by A. Levander and G. Nolet, pp. 81–97, AGU, Washington, D. C.
Fullea, J., M. Fern�andez, J. C. Afonso, J. Verg�es, and H. Zeyen(2010), The structure and evolution of the lithosphere–asthenosphere boundary beneath the Atlantic–Mediterra-nean Transition Region, Lithos, 120(1–2), 74–95, doi :10.1016/j.lithos.2010.03.003.
Gallart, J., A. Gil, J. D�ıaz, M. Harnafi, A. Levander, I.Palomeras, and D. Cordoba (2012), Variations of the crustalstructure in the Rif Cordillera, N-Morocco, from wide-angleseismic data, Abstract presented at 2012 Fall Meeting, AGU,San Francisco, Calif. Abstract T32D-05.
Gill, R. C. O., A. Aparicio, M. El Azzouzi, J. Hernandez, M.F. Thirlwall, J. Bourgois, and G. F. Marriner (2004),Depleted arc volcanism in the Alboran Sea and shoshoniticvolcanism in Morocco: Geochemical and isotopic con-straints on Neogene tectonic processes, Lithos, 78(4), 363–388, doi:10.1016/j.lithos.2004.07.002.
Grimison, N. L., and W. Chen (1986), The Azores-Gibraltarplate boundary: Focal mechanisms, depths of earthquakes,and their tectonic implications, J. Geophys. Res., 91(B2),2029–2047.
Gutscher, M. A., J. Malod, J.-P. Rehault, I. Contrucci, F.Klingelhoefer, L. Mendes-Victor, and W. Spakman (2002),Evidence for active subduction beneath Gibraltar, Geology,30(12), 1071–1074, doi:10.1130/0091-7613(2002)030<1071.
Gutscher, M. A., et al. (2012), The Gibraltar subduction: Adecade of new geophysical data, Tectonophysics, 574–575,72–91, doi:10.1016/j.tecto.2012.08.038.
Hammond, W. C., and E. D. Humphreys (2000), Upper mantleseismic wave velocity: Effects of realistic partial melt geo-metries, J. Geophys. Res., 105(B5), 10,975–10,986, doi:10.1029/2000JB900041.
Humphreys, E. R., K. Bailey, C. J. Hawkesworth, F. Wall, J.Najorka, and A. H. Rankin (2010), Aragonite in olivine fromCalatrava, Spain: Evidence for mantle carbonatite meltsfrom >100 km depth, Geology, 38(10), 911–914, doi:10.1130/G31199.1.
Jacobshagen, V., K. Gorler, and P. Giese (1988), Geodynamicevolution of the Atlas System (Morocco) in post-Palaeozoictimes, in The Atlas System of Morocco: Studies on Its Geo-dynamic Evolution, Lecture Notes Earth Sci., edited by V.Jacobshagen, pp. 481–499, Springer, New York.
Jim�enez-Munt, I., M. Fern�andez, J. Verg�es, D. Garcia-Castellanos, J. Fullea, M. P�erez-Gussiny�e, and J. C. Afonso(2011), Decoupled crust-mantle accommodation of Africa-Eurasia convergence in the NW Moroccan margin, J. Geo-phys. Res., 116, B08403, doi:10.1029/2010JB008105.
PALOMERAS ET AL. : RAYLEIGH WAVE VS MODEL IN WM 10.1002/2013GC004861
19

Karato, S. (1993), Importance of anelasticity in the interpreta-tion of seismic tomography, Geophys. Res. Lett., 20(15),1623–1626.
Koulali, A., D. Ouazar, A. Tahayt, R. W. King, P. Vernant, R.E. Reilinger, S. McClusky, T. Mourabit, J. M. Davila, and N.Amraoui (2011), New GPS constraints on active deforma-tion along the Africa–Iberia plate boundary, Earth Planet.Sci. Lett., 308(1–2), 211–217, doi:10.1016/j.epsl.2011.05.048.
Laville, E., and J.-P. Petit (1984), Role of synsedimentarystrike-slip faults in the formation of Moroccan Triassicbasins, Geology, 12(7), 424–427, doi:10.1130/0091-7613(1984)12<424.
Legendre, C. P., T. Meier, S. Lebedev, W. Friederich, and L.Viereck-Götte (2012), A shear wave velocity model of theEuropean upper mantle from automated inversion of seismicshear and surface waveforms, Geophys. J. Int., 191, 282–304, doi:10.1111/j.1365-246X.2012.05613.x.
Liu, K., A. Levander, F. Niu, and M. S. Miller (2011), Imagingcrustal and upper mantle structure beneath the Colorado Pla-teau using finite frequency Rayleigh wave tomography, Geo-chem. Geophys. Geosyst., 12, Q07001, doi:10.1029/2011GC003611.
Lonergan, L., and N. White (1997), Origin of the Betic-Rifmountain belt, Tectonics, 16(3), 504–522.
L�opez-Ruiz, J., J. M. Cebria, M. Doblas, R. Oyarzun, M.Hoyso, and C. Martin (1993), Cenozoic intra-plate volca-nism related to extensional tectonics at Calatrava, centralIberia, J. Geol. Soc. London, 150, 915–922.
Malinverno, A., and W. B. F. Ryan (1986), Extension in theTyrrhenian Sea and shortening in the Apennines as result ofarc migration driven by sinking of the lithosphere, Tectonics,5(2), 227–245.
Mancilla, F. D. L., et al. (2012), Crustal thickness variations innorthern Morocco, J. Geophys. Res., 117, B02312, doi:10.1029/2011JB008608.
Mart�ınez-Mart�ınez, J. M., G. Booth-Rea, J. M. Aza~n�on, and F.Torcal (2006), Active transfer fault zone linking a seg-mented extensional system (Betics, southern Spain): Insightinto heterogeneous extension driven by edge delamination,Tectonophysics, 422(1–4), 159–173, doi:10.1016/j.tecto.2006.06.001.
Mart�ınez Poyatos, D., et al. (2012), Imaging the crustal struc-ture of the Central Iberian Zone (Variscan Belt) : TheALCUDIA deep seismic reflection transect, Tectonics, 31,TC3017, doi:10.1029/2011TC002995.
Matte, P. (1986), Tectonics and plate tectonics model for theVariscan belt of Europe, Tectonophysics, 126, 329–374.
Matte, P. (2001), The Variscan collage and orogeny (480–290Ma) and the tectonic definition of the Armorica microplate:A review, Terra Nova, 13, 122–128.
Miller, M. S., A. Levander, F. Niu, and A. Li (2009), Uppermantle structure beneath the Caribbean-South Americanplate boundary from surface wave tomography, J. Geophys.Res., 114, B01312, doi :10.1029/2007JB005507.
Missenard, Y., H. Zeyen, D. Frizon de Lamotte, P. Leturmy,C. Petit, M. S�ebrier, and O. Saddiqi (2006), Crustal versusasthenospheric origin of relief of the Atlas Mountains ofMorocco, J. Geophys. Res., 111, B03401, doi:10.1029/2005JB003708.
Mitchell, B. J. (1995), Anelastic structure and evolution of thecontinental crust and upper mantle from seismic surfacewave attenuation, Rev. Geophys., 33(4), 441–462.
Morales, J., I. Serrano, A. Jabaloy S�anchez, J. Galindo-Zald�ıvar, D. Zhao, F. Torcal, F. Vidal, and F. Gonzalez-
Lodeiro (1999), Active continental subduction beneath theBetic Cordillera and the Albor�an Sea, Geology, 27, 735–738, doi:10.1130/0091-7613(1999)027<0735.
Palomeras, I., R. Carbonell, I. Flecha, F. Simancas, P. Ayarza,J. Matas, D. Mart�ınez Poyatos, A. Azor, F. Gonz�alez-Lodeiro, and A. P�erez-Esta�un (2009), Nature of the litho-sphere across the Variscan orogen of SW Iberia: Densewide-angle seismic reflection data, J. Geophys. Res., 114,B02302, doi:10.1029/2007JB005050.
Palomeras, I., R. Carbonell, P. Ayarza, M. Fern�andez, J. F.Simancas, D. Martinez Poyatos, F. Gonz�alez Lodeiro, andA. P�erez-Esta�un (2011), Geophysical model of the litho-sphere across the Variscan Belt of SW-Iberia: Multidiscipli-nary assessment, Tectonophysics, 508(1–4), 42–51, doi:10.1016/j.tecto.2010.07.010.
Perouse, E., P. Vernant, J. Chery, R. Reilinger, and S.McClusky (2010), Active surface deformation and sub-lithospheric processes in the western Mediterranean con-strained by numerical models, Geology, 38(9), 823–826,doi :10.1130/G30963.1.
Peter, D., L. Boschi, F. Deschamps, B. Fry, G. Ekström, andD. Giardini (2008), A new finite-frequency shear-velocitymodel of the European-Mediterranean region, Geophys. Res.Lett., 35, L16315, doi:10.1029/2008GL034769.
Piromallo, C., and A. Morelli (2003), P wave tomography ofthe mantle under the Alpine-Mediterranean area, J. Geophys.Res., 108(B2), 2065, doi :10.1029/2002JB001757.
Platt, J. P., and R. L. M. Vissers (1989), Geology Extensionalcollapse of thickened continental lithosphere: A workinghypothesis for the Alboran Sea and Gibraltar arc, Geology,17, 540–543, doi:10.1130/0091-7613(1989)017<0540.
Polyak, B. G., et al. (1996), Heat flow in the Alboran Sea,western Mediterranean, Tectonophysics, 263, 191–218.
Rosenbaum, G., G. S. Lister, and C. Duboz (2002), Recon-struction of the tectonic evolution of the western Mediterra-nean since the Oligocene, J. Virtual Explor., 8, 107–130.
Royden, L. H. (1993), Evolution of retreating subductionboundaries formed during continental collision, Tectonics,12(3), 629–638.
Saito, M. (1988), DISPER80: A subroutine package for thecalculation of seismic normal-mode solutions, in Seismolog-ical Algorithms: Computational Methods and ComputerPrograms, edited by D. J. Doornbos, pp. 293–319, Aca-demic, San Diego, Calif.
Schivardi, R., and A. Morelli (2009), Surface wave tomogra-phy in the European and Mediterranean region, Geophys. J.Int., 177(3), 1050–1066, doi:10.1111/j.1365-246X.2009.04100.x.
Schmid, C., S. van der Lee, J. C. VanDecar, E. R. Engdahl,and D. Giardini (2008), Three-dimensional S velocity of themantle in the Africa-Eurasia plate boundary region fromphase arrival times and regional waveforms, J. Geophys.Res., 113, B03306, doi:10.1029/2005JB004193.
Schwarz, G., and P. J. Wigger (1988), Geophysical studies ofthe Earth’s Crust and Upper Mantle in the Atlas System ofMorocco, in The Atlas System of Morocco: Studies on itsGeodynamic Evolution, Lecture Notes Earth Sci., edited byV. Jacobshagen, pp. 339–357, Springer, New York.
Seber, D., M. Barazangi, A. Ibenbrahim, and A. Demnati(1996a), Geophysical evidence for lithospheric delaminationbeneath the Alboran Sea and Rif-Betic mountains, Nature,379, 785–790.
Seber, D., M. Barazangi, B. A. Tadili, M. Ramdani, A.Ibenbrahim, and D. Ben Sari (1996b), Three-dimensionalupper mantle structure beneath the intraplate Atlas and
PALOMERAS ET AL. : RAYLEIGH WAVE VS MODEL IN WM 10.1002/2013GC004861
20

interplate Rif mountains of Morocco, J. Geophys. Res.,101(B2), 3125–3138.
Simancas, J. F., et al. (2003), Crustal structure of the transpres-sional Variscan orogen of SW Iberia: SW Iberia deep seis-mic reflection profile (IBERSEIS), Tectonics, 22(6), 1062,doi:10.1029/2002TC001479.
Spakman, W., and R. Wortel (2004), A Tomographic View onWestern Mediterranean Geodynamics, in The TRANSMEDAtlas: The Mediterranean Region From Crust to Mantle.,edited by W. Cavazza et al., pp. 31–52, Springer, Berlin.
Surinach, E., and R. Vegas (1988), Lateral inhomogeneities ofthe Hercynian crust in central Spain, Phys. Earth Planet.Inter., 51, 226–234.
Takei, Y. (2000), Acoustic properties of partially moltenmedia studied on a simple binary system with a controllabledihedral angle, J. Geophys. Res., 105(B7), 16,665–16,682,doi:10.1029/2000JB900124.
Tarantola, A., and B. Valette (1982), Generalized nonlinearinverse problems solved using the least squares criterion,Rev. Geophys., 20(2), 219–232, doi:10.1029/RG020i002p00219.
Teixell, A., M. L. Arboleya, M. Julivert, and M. Charroud(2003), Tectonic shortening and topography in the centralHigh Atlas (Morocco), Tectonics, 22(5), 1051, doi:10.1029/2002TC001460.
Teixell, A., P. Ayarza, H. Zeyen, M. Fernandez, and M.-L.Arboleya (2005), Effects of mantle upwelling in a compres-sional setting: The Atlas Mountains of Morocco, TerraNova, 17(5), 456–461, doi:10.1111/j.1365-3121.2005.00633.x.
Thurner, S., I. Palomeras, A. Levander, and R. Carbonell (inpress), Evidence for Ongoing Lithospheric Removal in theWestern Mediterranean: Ps Receiver Functions ResultsFrom the PICASSO Project, Geochem. Geophys. Geosyst.
Timoulali, Y., and M. Meghraoui (2011), 3-D crustal structurein the Agadir region (SW High Atlas, Morocco), J. Seismol.,15(4), 625–635, doi:10.1007/s10950-011-9240-0.
Tondi, R., R. Schivardi, I. Molinari, and A. Morelli (2012),Upper mantle structure below the European continent:
Constraints from surface-wave tomography and GRACE sat-ellite gravity data, J. Geophys. Res., 117, B09401, doi:10.1029/2012JB009149.
Vernant, P., A. Fadil, T. Mourabit, D. Ouazar, A. Koulali, J.M. Davila, J. Garate, S. McClusky, and R. Reilinger (2010),Geodetic constraints on active tectonics of the Western Med-iterranean: Implications for the kinematics and dynamics ofthe Nubia-Eurasia plate boundary zone, J. Geodyn., 49(3–4),123–129, doi:10.1016/j.jog.2009.10.007.
Wagner, L., D. W. Forsyth, M. J. Fouch, and D. E. James(2010), Detailed three-dimensional shear wave velocitystructure of the northwestern United States from Rayleighwave tomography, Earth Planet. Sci. Lett., 299(3–4), 273–284, doi:10.1016/j.epsl.2010.09.005.
Wigger, P., G. Asch, P. Giese, W.-D. Heinsohn, S. O. ElAlami, and F. Ramdani (1992), Crustal structure along a tra-verse across the Middle and High Atlas mountains derivedfrom seismic refraction studies, Geol. Rundsch., 81(1), 237–248.
Wortel, M. J. R., and W. Spakman (2000), Subduction andslab detachment in the Mediterranean-Carpathian region,Science, 290(5498), 1910–1917, doi:10.1126/science.290.5498.1910.
Yang, Y., and D. W. Forsyth (2006a), Rayleigh wave phasevelocities, small-scale convection, and azimuthal anisotropybeneath southern California, J. Geophys. Res., 111, B07306,doi :10.1029/2005JB004180.
Yang, Y., and D. W. Forsyth (2006b), Regional tomographicinversion of the amplitude and phase of Rayleigh waveswith 2-D sensitivity kernels, Geophys. J. Int., 166(3), 1148–1160, doi:10.1111/j.1365-246X.2006.02972.x.
Zeyen, H., P. Ayarza, M. Fern�andez, and A. Rimi (2005),Lithospheric structure under the western African-Europeanplate boundary: A transect across the Atlas Mountains andthe Gulf of Cadiz, Tectonics, 24, TC2001, doi:10.1029/2004TC001639.
Zhu, H., E. Bozda�g, D. Peter, and J. Tromp (2012), Structureof the European upper mantle revealed by adjoint tomogra-phy, Nat. Geosci., 5, 493–498, doi:10.1038/ngeo1501.
PALOMERAS ET AL. : RAYLEIGH WAVE VS MODEL IN WM 10.1002/2013GC004861
21